Focuses on constructing and interpreting visual data displays including histograms, box plots, and dot plots. Students learn to identify the most appropriate display for different data types and describe the shape of distributions.
A comprehensive summer bridge workbook for rising 8th graders transitioning to Algebra 1. Contains review of prerequisite topics, advanced pre-algebra skills, real-world application, and an Algebra Escape Challenge.
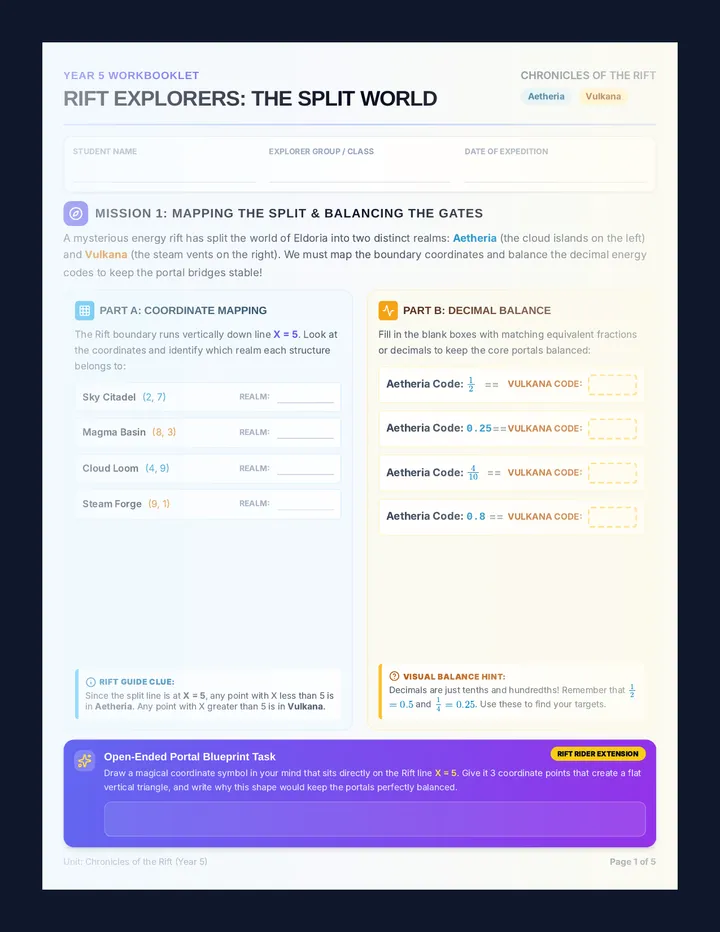
An immersive, five-part interdisciplinary workbook series where Year 5 students explore a world split in two. This booklet integrates mathematics, vocabulary, data handling, and science into a thrilling parallel-world narrative.
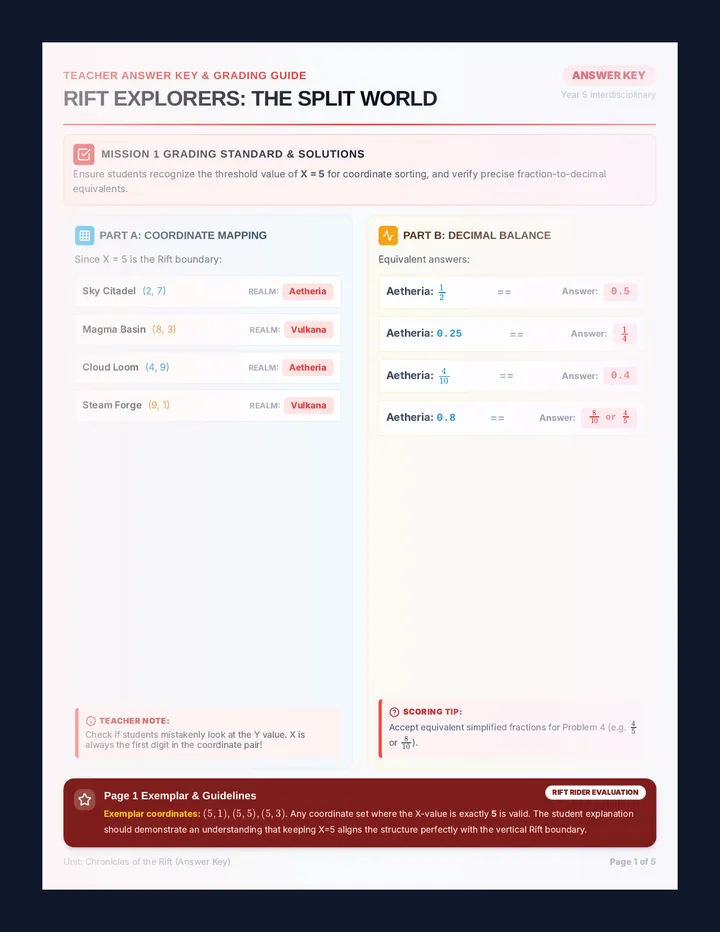
A comprehensive 5-page Teacher Answer Key matching the 'Rift Explorers Workbook'. It provides all correct mathematical solutions, completed vocabulary definitions, sorted science classifications, logical sequence keys, and exemplar student responses highlighted in clear pink/red text.
A high-intensity, 120-minute math simulation. Students act as lead consultants, completing a high-speed skill warmup before selecting a professional sector (Music, Urban Planning, Rocket Science, or Sports Analytics) to solve a series of complex work orders.
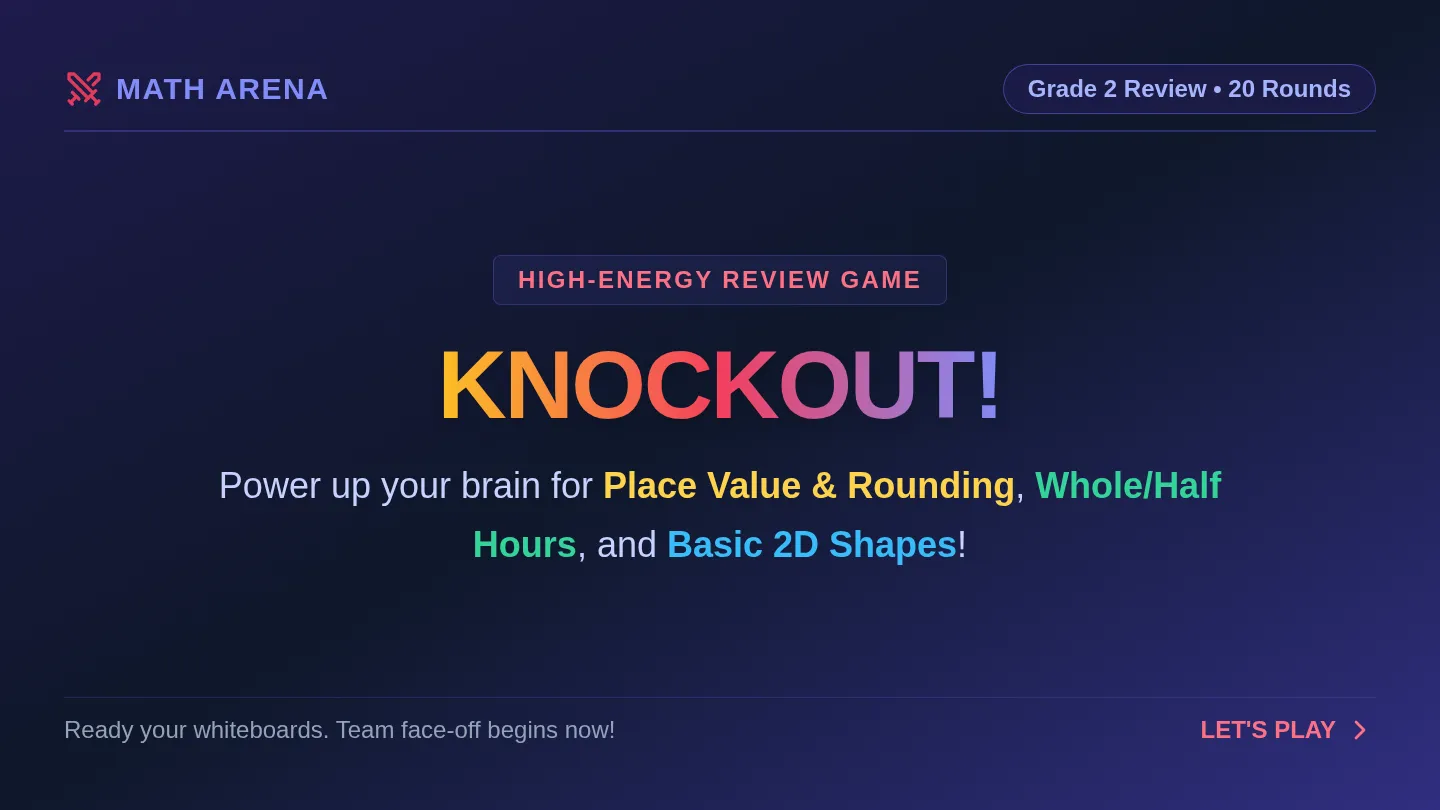
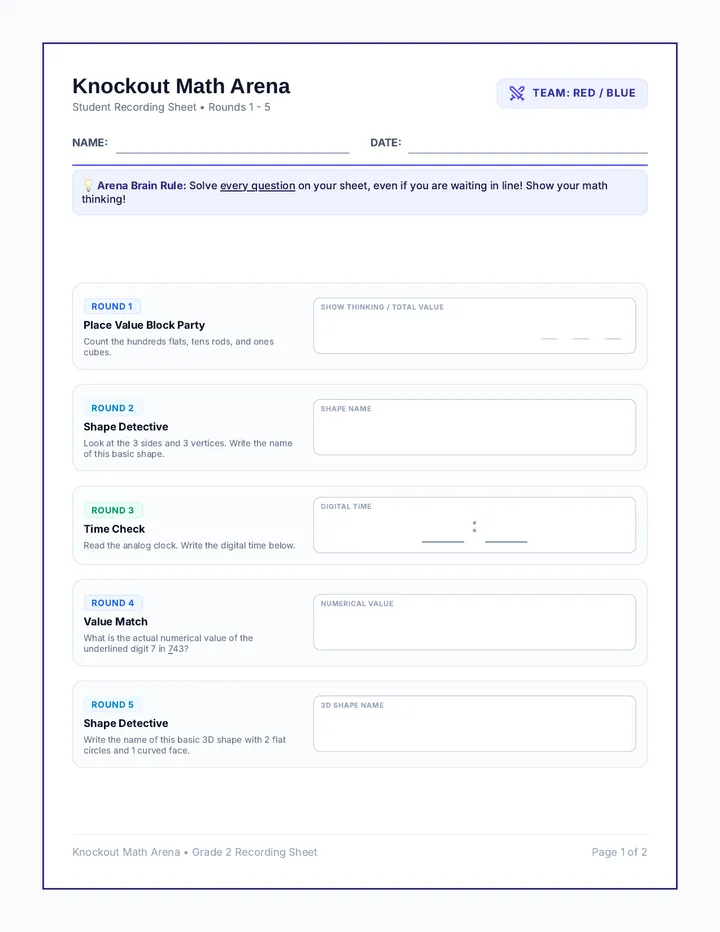
A high-energy, fast-paced review game targeting 2nd-grade place value, time, and geometric shape attributes. Includes a colorful slide deck, a comprehensive facilitation guide, and student recording sheets to keep the whole class engaged.
A comprehensive, 5-page student workbooklet for Year 5 titled 'Rift Explorers Workbook'. It features a highly engaging 'Split World' theme with dual-realm columns (Aetheria and Vulkana), structured mathematics, vocabulary, data handling, and science activities, including visual scaffolds and open-ended extension challenges on every page.
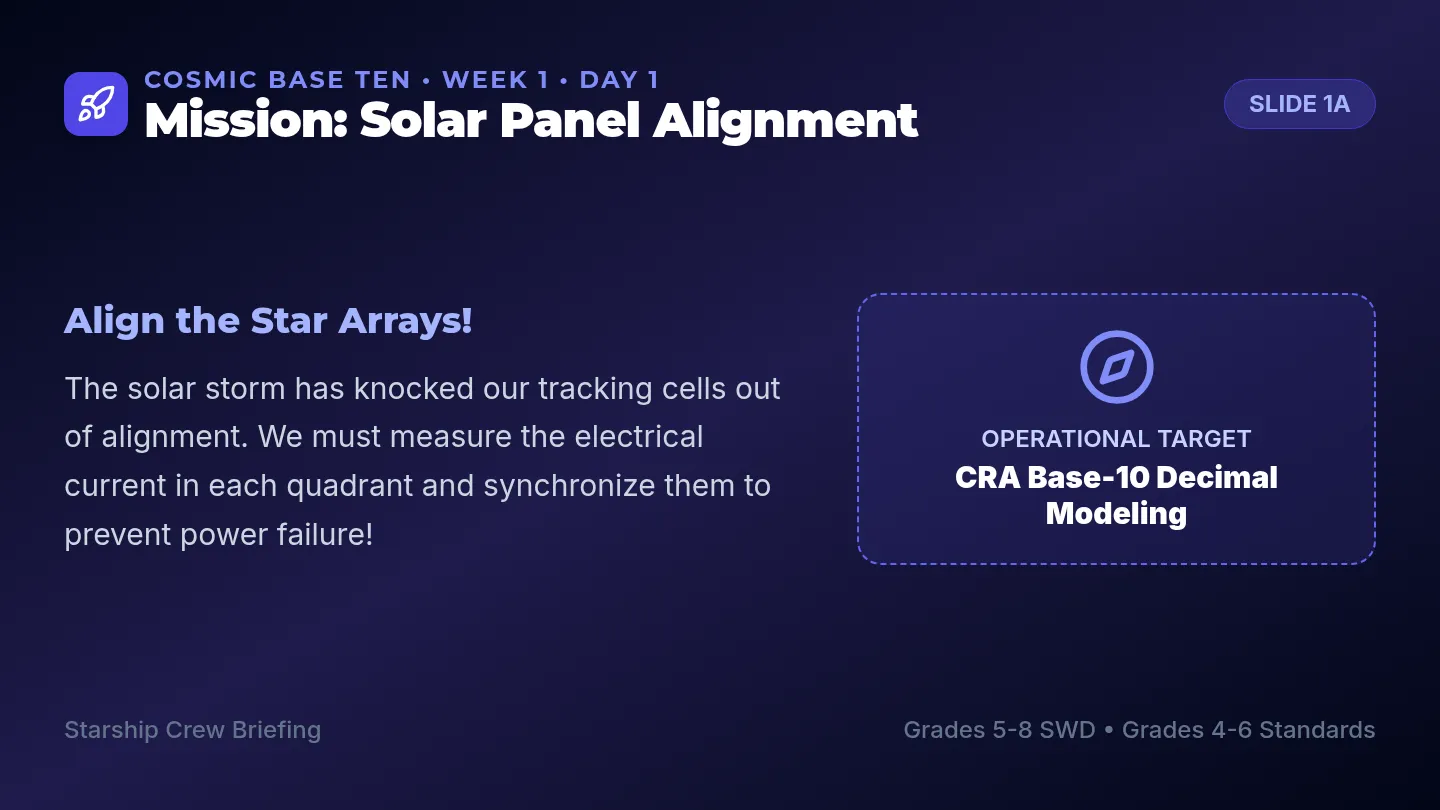
A 4-week math workbook and instructional sequence themed around outer space exploration, specifically designed for middle school students with disabilities (SWDs) working at an early 1st-grade level. Features embedded touch-points, base-ten icons, visual number paths, and age-appropriate space exploration visuals to teach single-digit operations, place value, and patterns.
The second part of the Algebra 1 Summer Bridge Packet. It covers functions & patterns, linear relationships, geometric foundations, statistics & probability, and an advanced Algebra 1 preview.
Printable student recording sheet for Knockout Math Arena. Adjusted to align with basic shapes (triangle, rectangle, cylinder) and whole/half-hour times only. Provides clean, designated workspaces with white backgrounds for handwriting answers.
A 4-week intensive math intervention program set in a space exploration universe, designed for multi-grade students with disabilities in Grades 5–8. It covers additive thinking, place value, and decimal regrouping, anchored in Grades 4–6 standards with a Grade 5 core middle ground.
The first part of the Algebra 1 Summer Bridge Packet for rising 8th graders. It covers integer operations, rational numbers, expressions, solving equations, and proportional relationships with worked examples and workspaces.
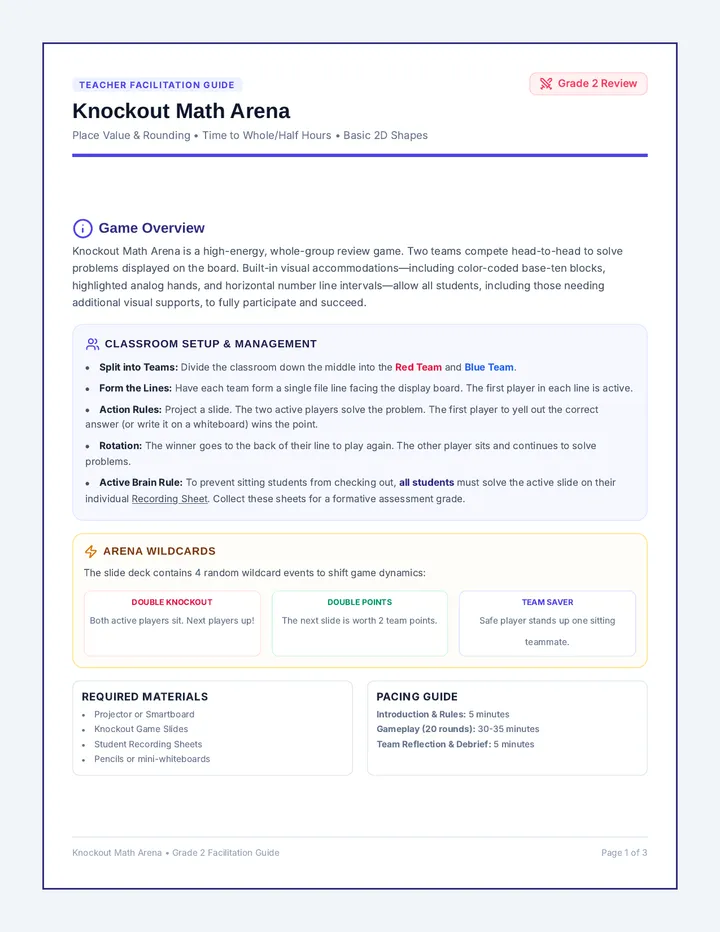
Comprehensive teacher facilitation guide for Knockout Math Arena. Includes game board setup instructions, team management strategies, pacing guidelines, scaffolding tips for visual supports, and a detailed 20-question slide-by-slide answer key with student misconception notes.