Students create bar graphs to represent their pattern data, visualizing growth as a 'staircase' and understanding the relationship between step number and quantity.
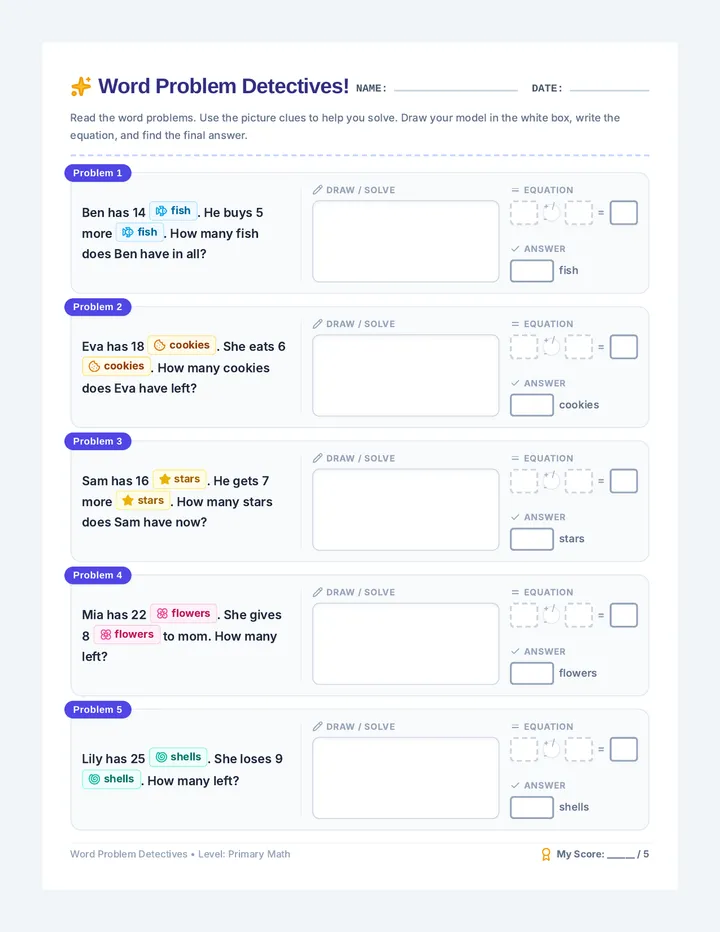
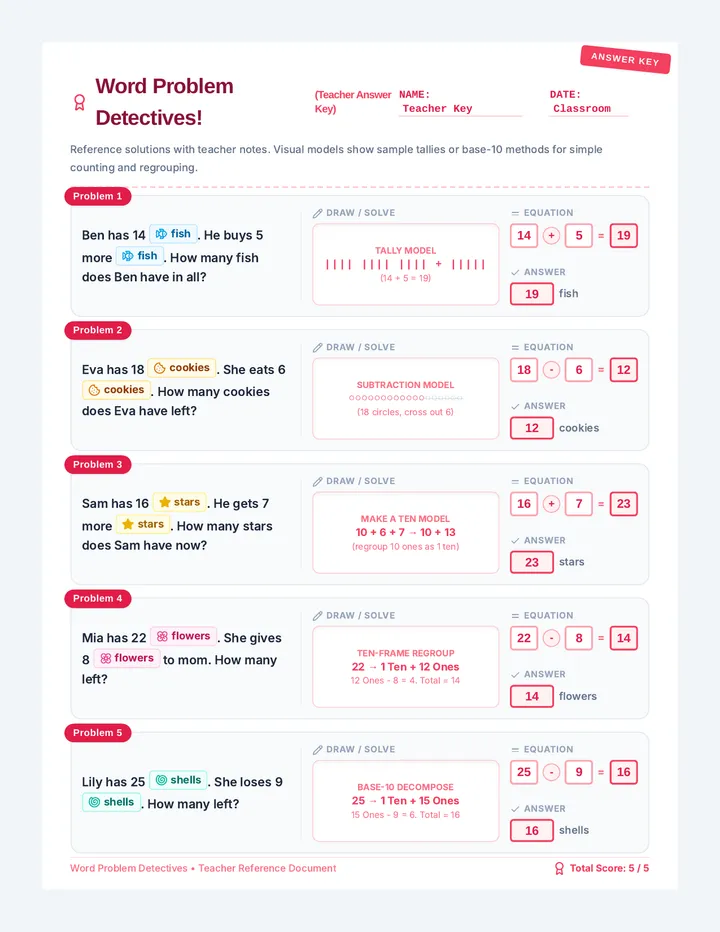
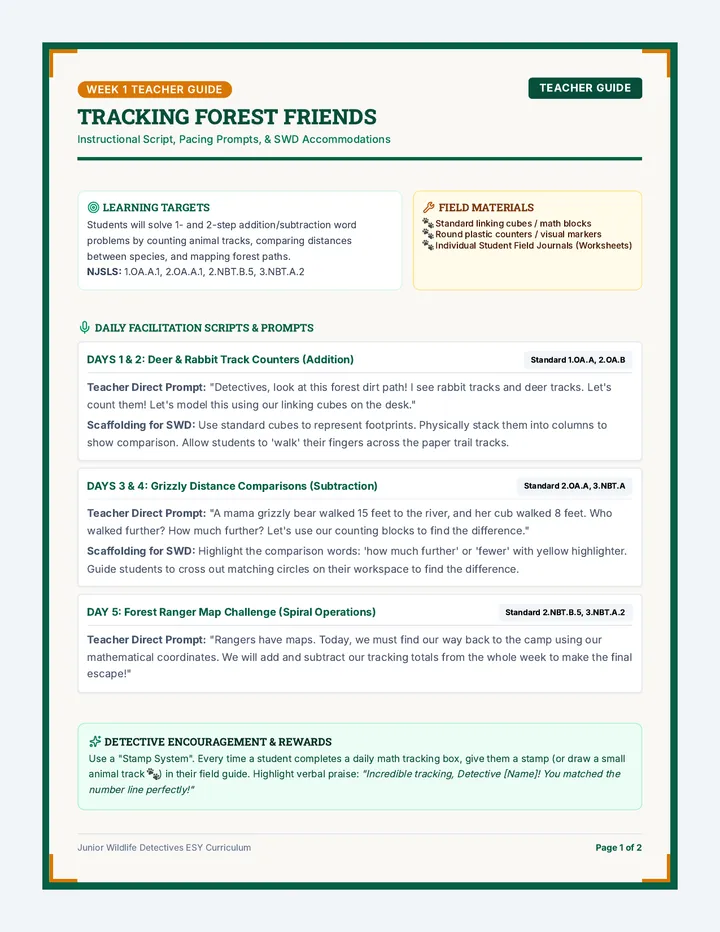
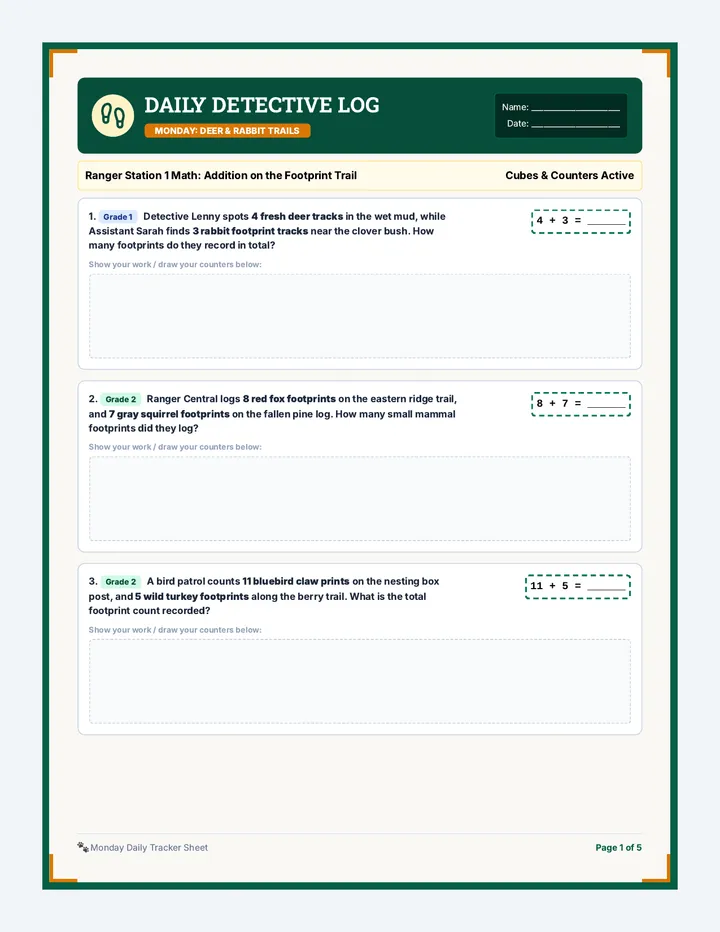
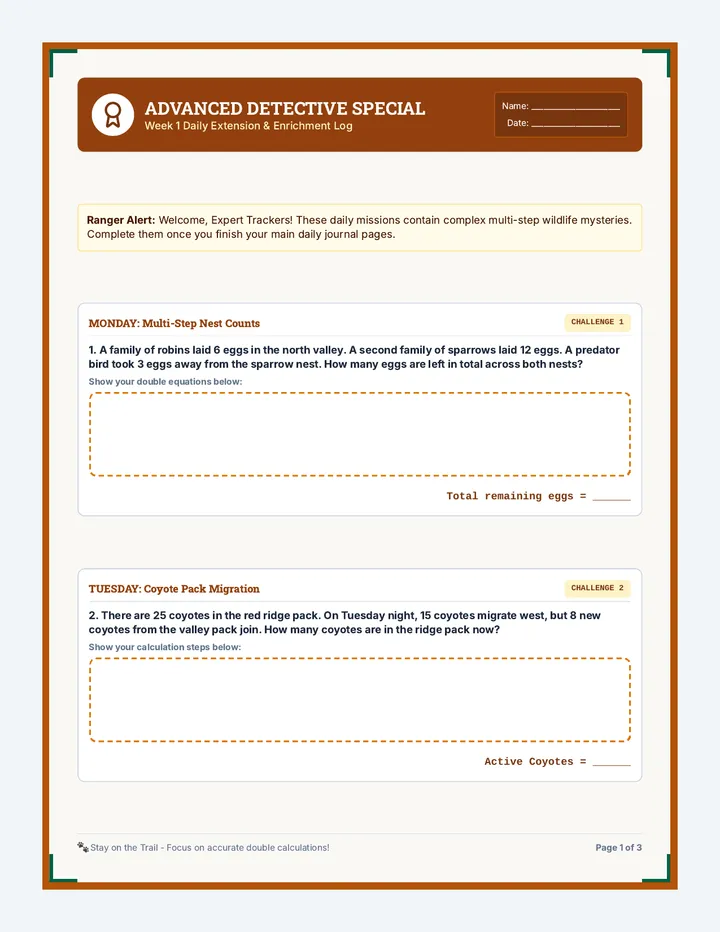
A primary math unit designed to build confidence in solving one-step addition and subtraction word problems. The sequence combines engaging visual cues, scaffolded modeling spaces, and explicit transition strategies between concrete and abstract math representation.
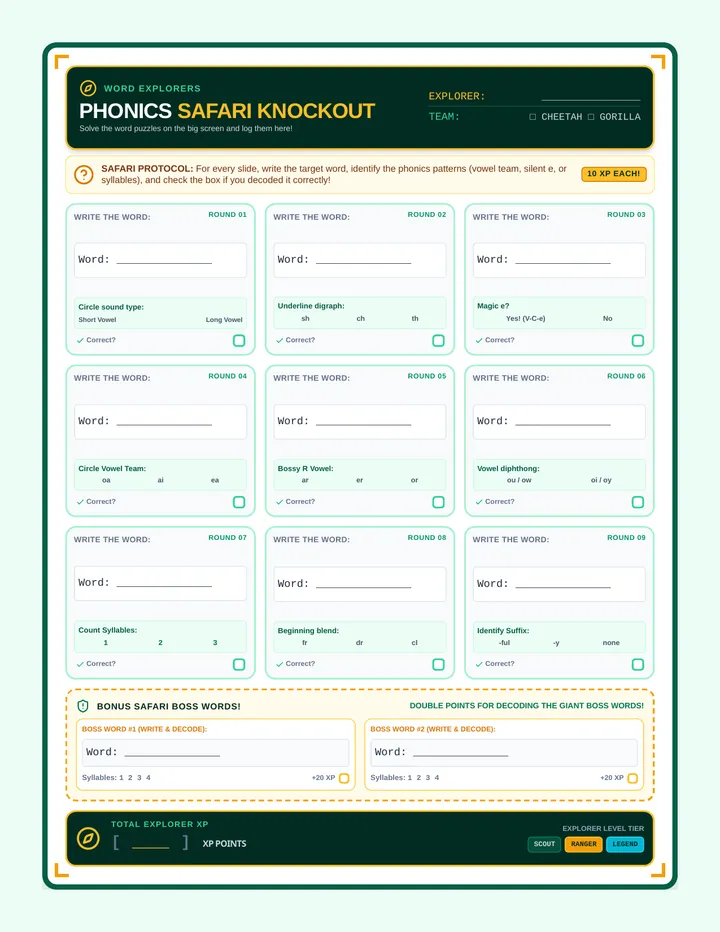
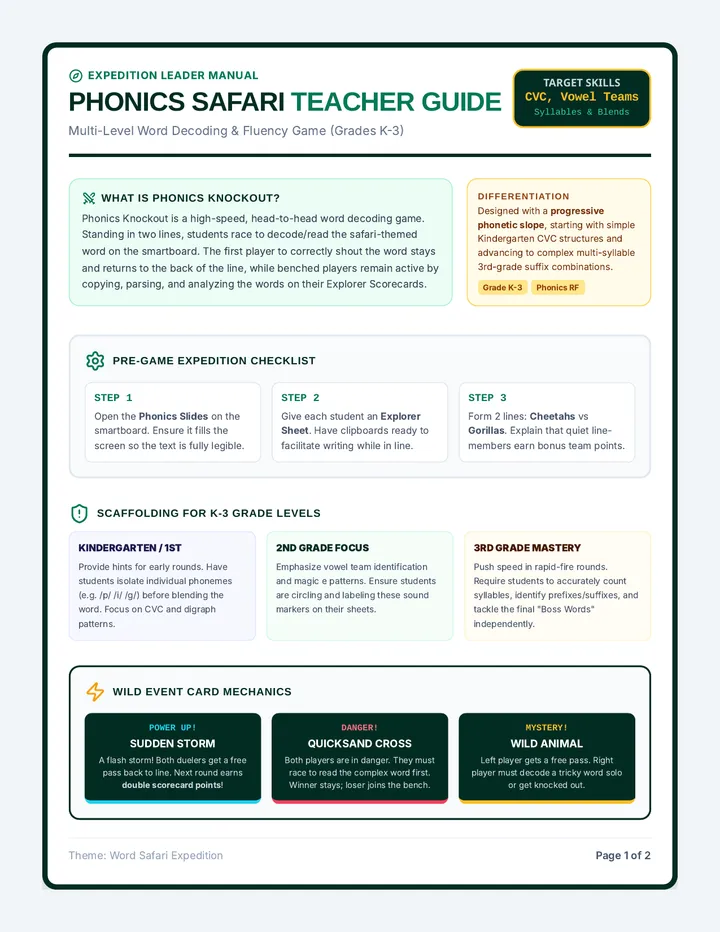
A high-energy, wild safari-themed classroom game for K-3 students focusing on key phonics skills including CVC words, silent 'e', vowel teams, and multi-syllable decoding. This lesson includes a widescreen smartboard presentation, a teacher facilitation guide with word keys, and an active-participation student tracker sheet.
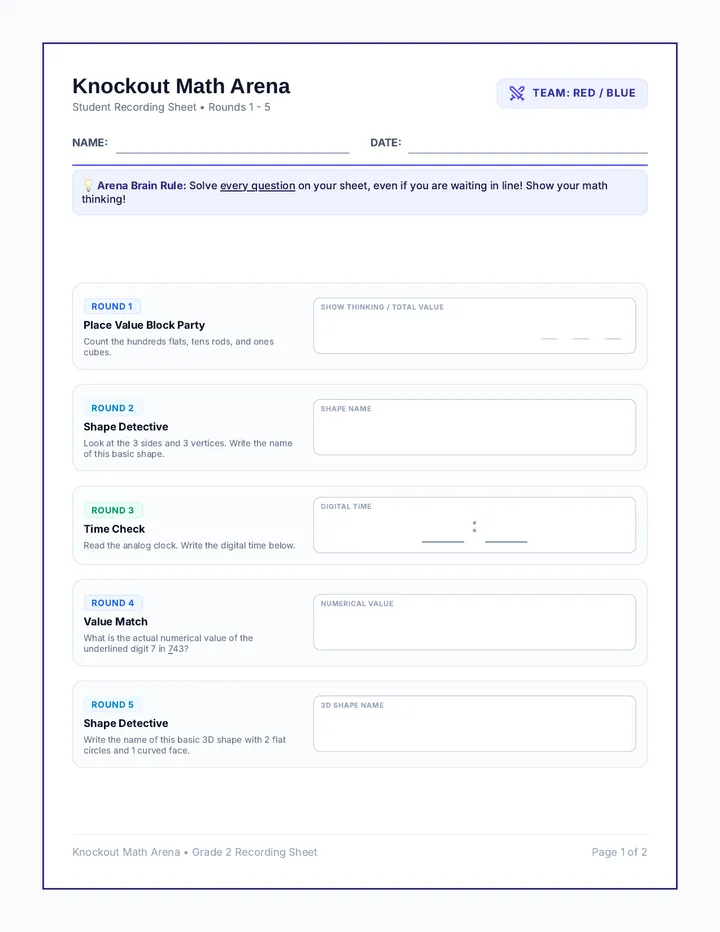
Printable student recording sheet for Knockout Math Arena. Adjusted to align with basic shapes (triangle, rectangle, cylinder) and whole/half-hour times only. Provides clean, designated workspaces with white backgrounds for handwriting answers.
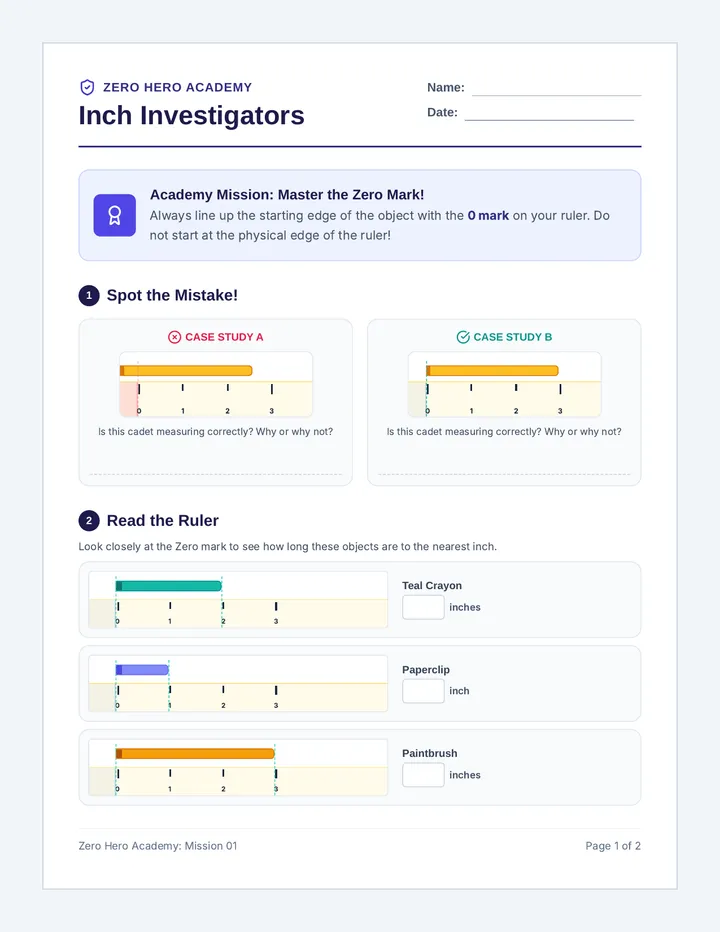
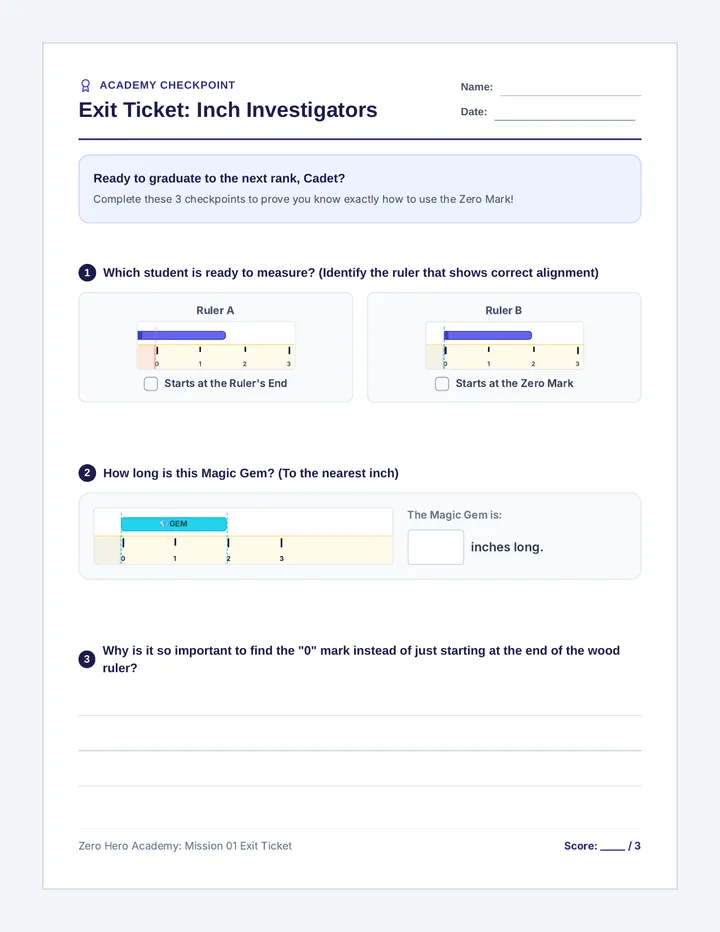
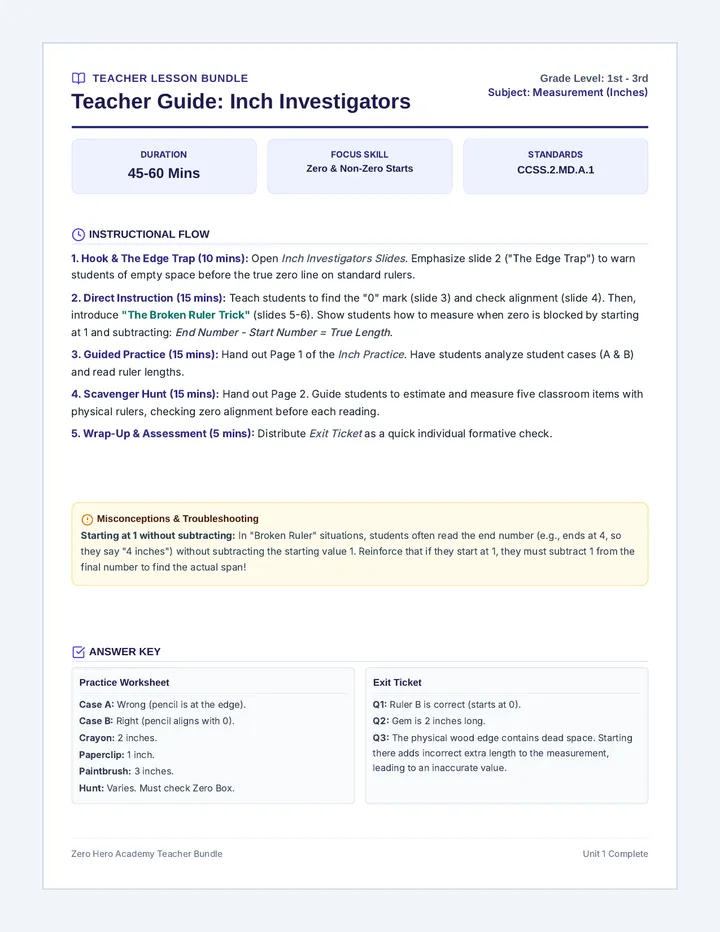
A two-part measuring adventure where students join the Zero Hero Academy to master measuring in inches and centimeters, with a strong focus on aligning the start of objects with the ruler's zero mark.
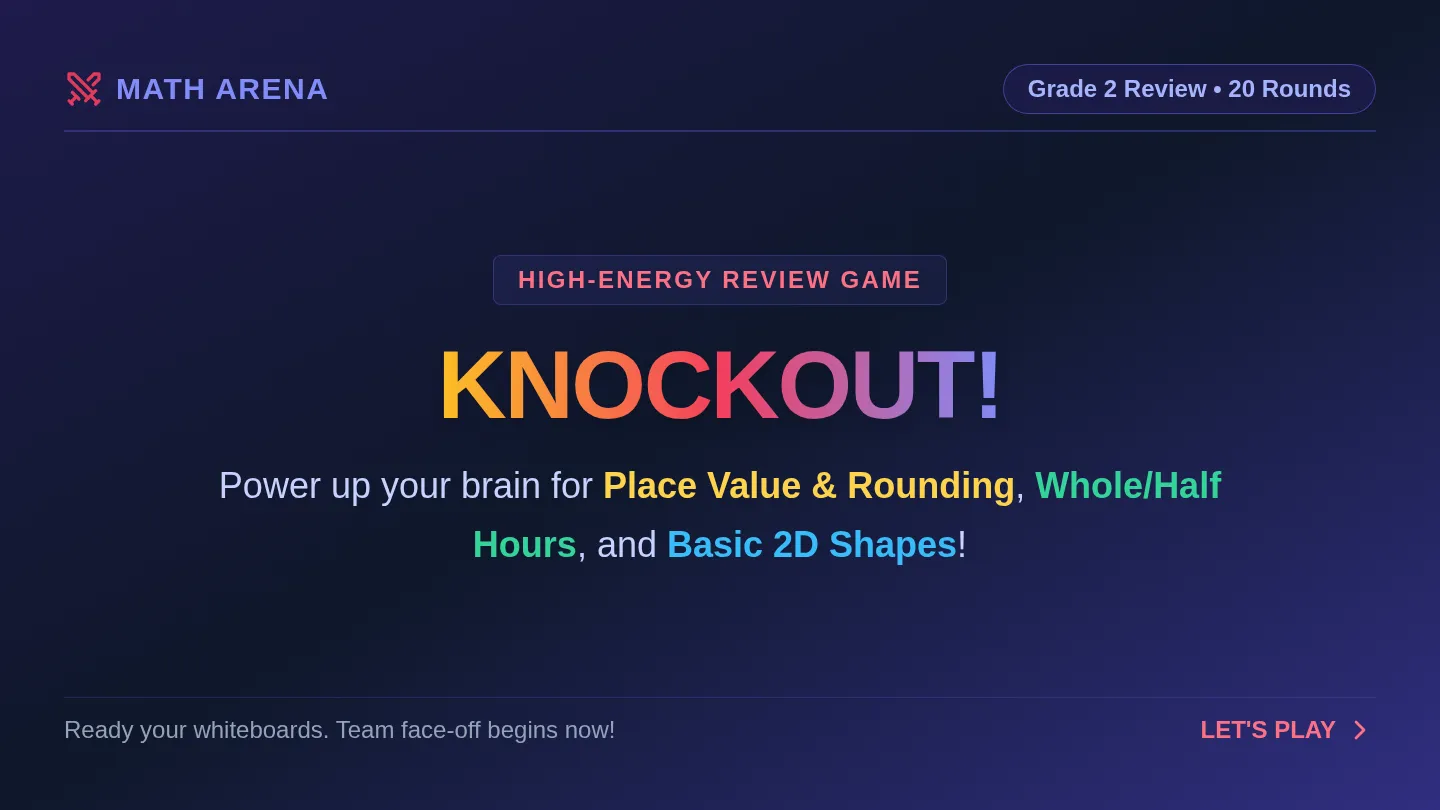
A high-energy, fast-paced review game targeting 2nd-grade place value, time, and geometric shape attributes. Includes a colorful slide deck, a comprehensive facilitation guide, and student recording sheets to keep the whole class engaged.
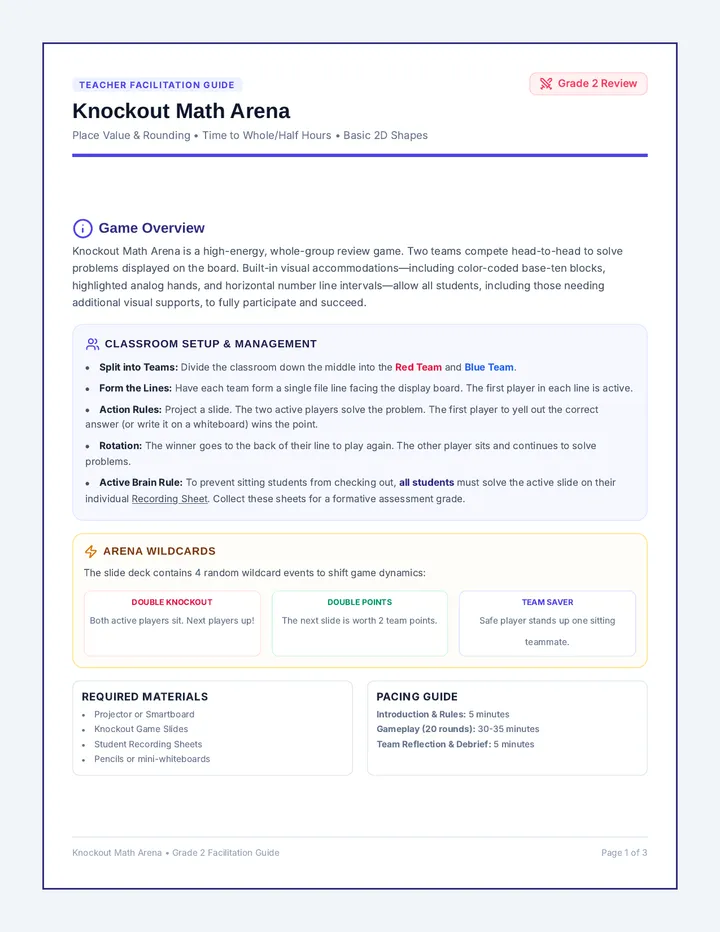
Comprehensive teacher facilitation guide for Knockout Math Arena. Includes game board setup instructions, team management strategies, pacing guidelines, scaffolding tips for visual supports, and a detailed 20-question slide-by-slide answer key with student misconception notes.
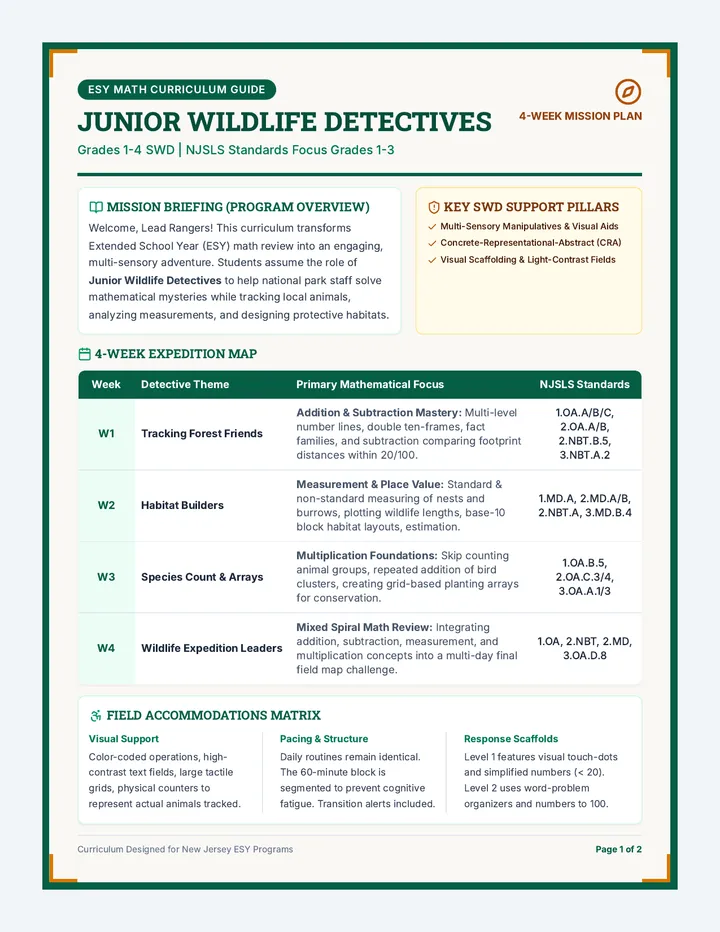
A 4-week Extended School Year (ESY) Math curriculum for Students with Disabilities (SWD) in grades 1-4. Using an engaging 'Junior Wildlife Detectives' theme, students track animals, measure habitats, and categorize species while mastering addition, subtraction, place value, and multiplication foundations aligned with NJ Student Learning Standards (NJSLS) for grades 1-3.
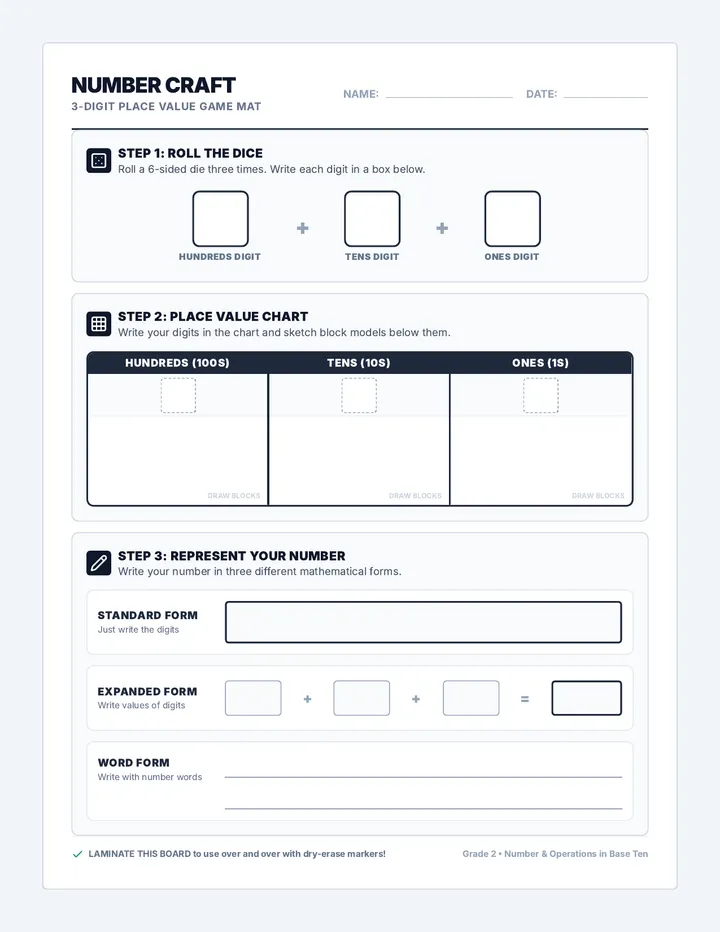
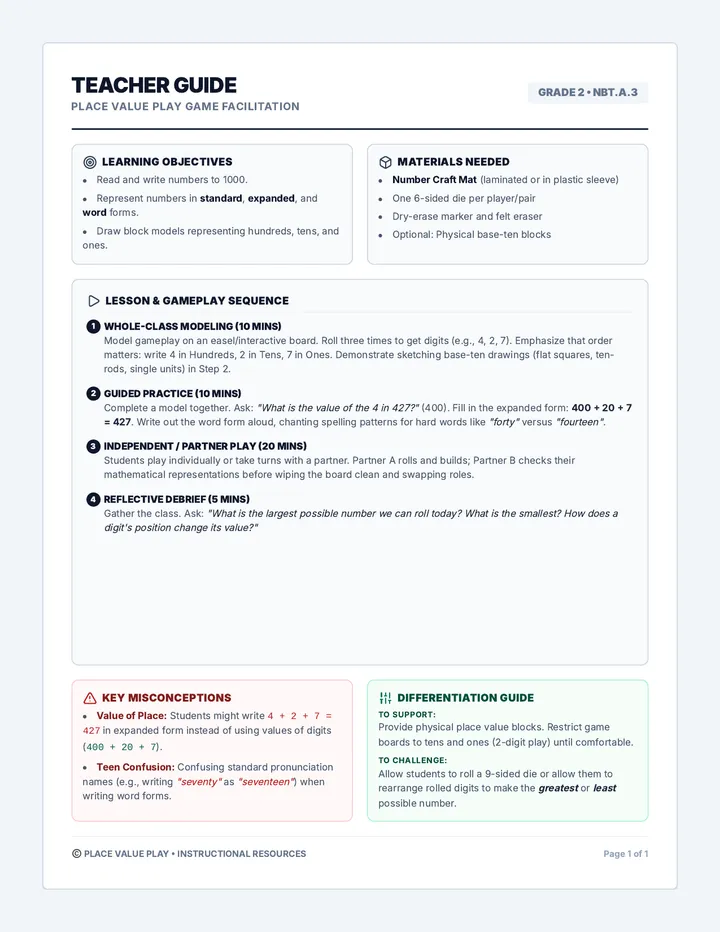
A hands-on, high-contrast lesson focusing on representing three-digit numbers. Students use dice to generate digits and practice writing numbers in standard, expanded, and word forms.
Stunning 16:9 interactive slides for the 20-question Knockout Math Arena review game, adjusted to cover place value, rounding to the nearest 10, telling time to whole/half-hours, and basic 2D shapes. Contains custom SVGs for clocks and math number lines.
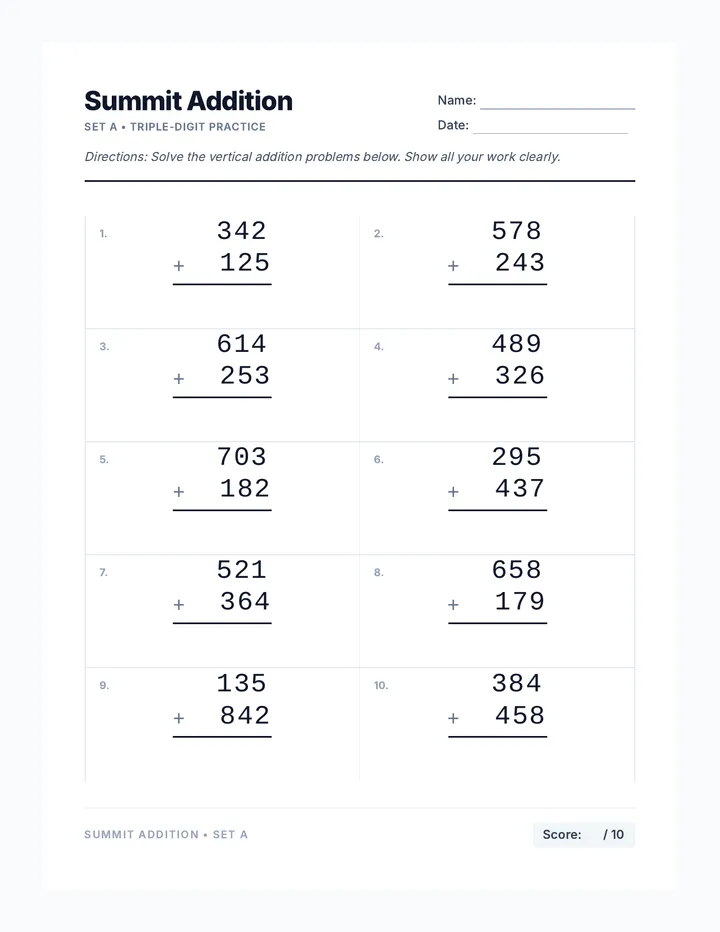
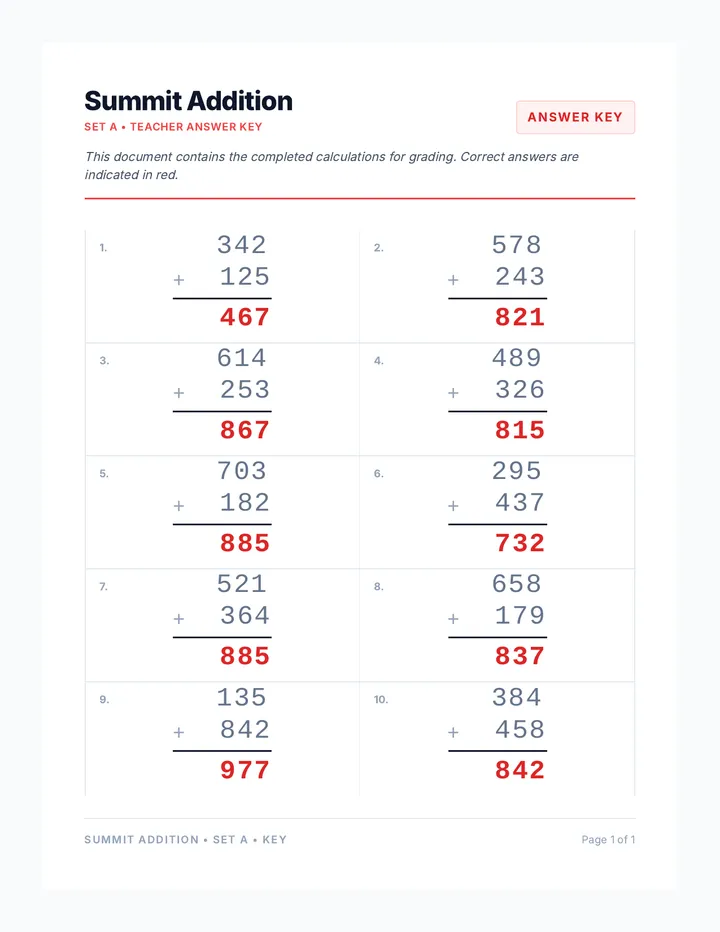
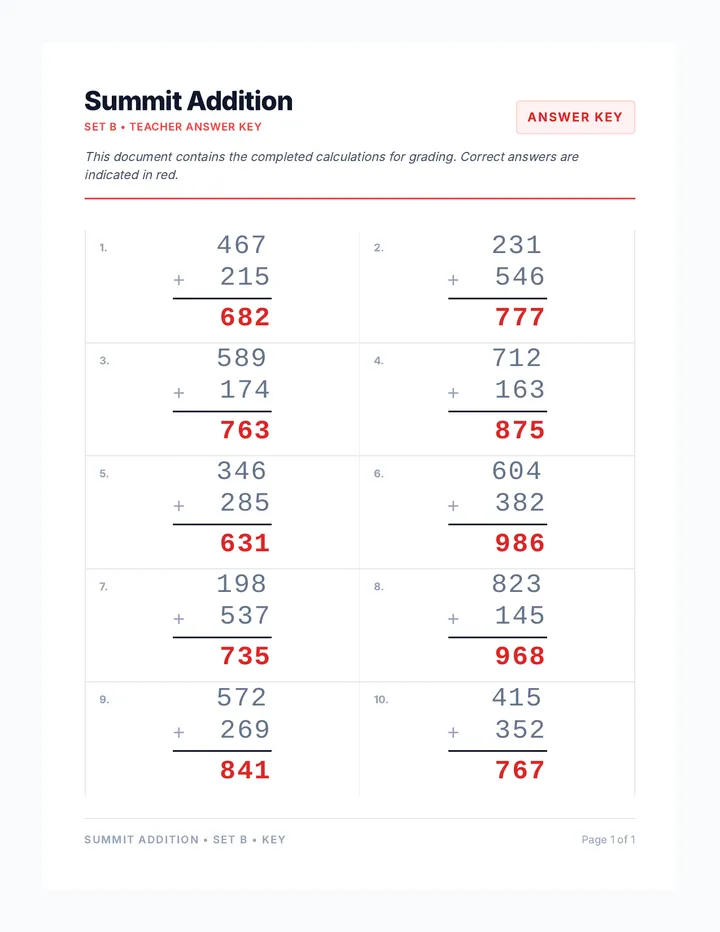
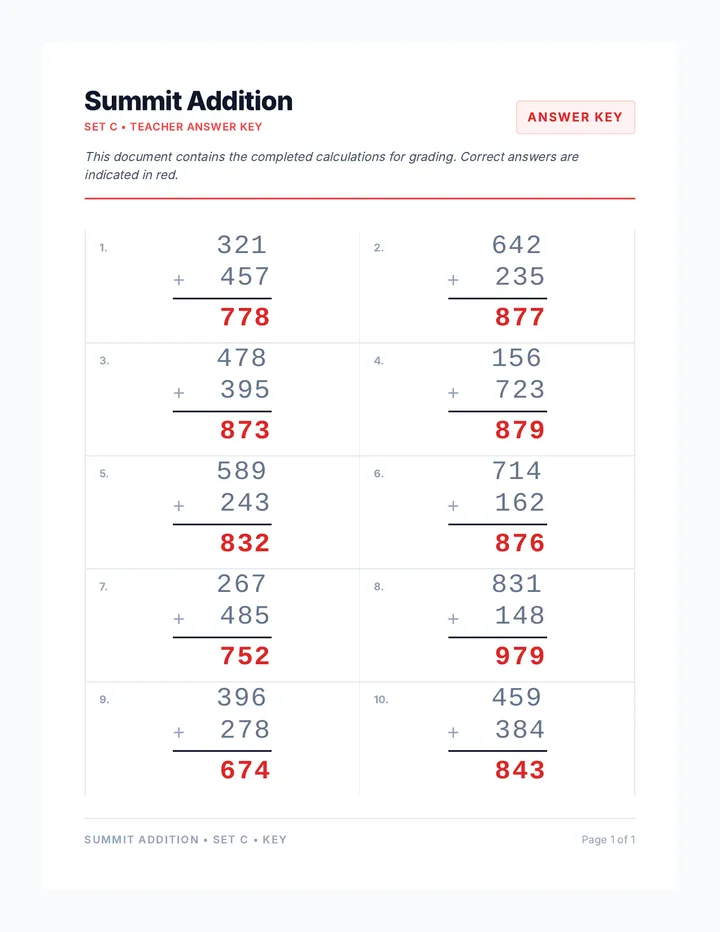
A cohesive series of distraction-free multi-digit calculation worksheets. Features addition and subtraction sets with balanced, mixed regrouping problems and corresponding answer keys.
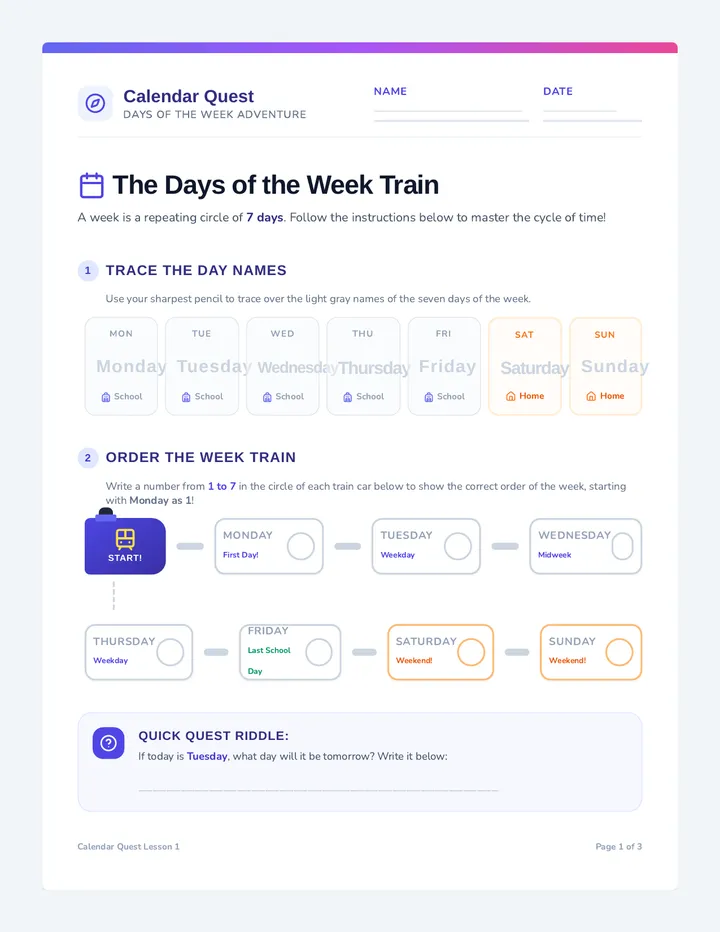
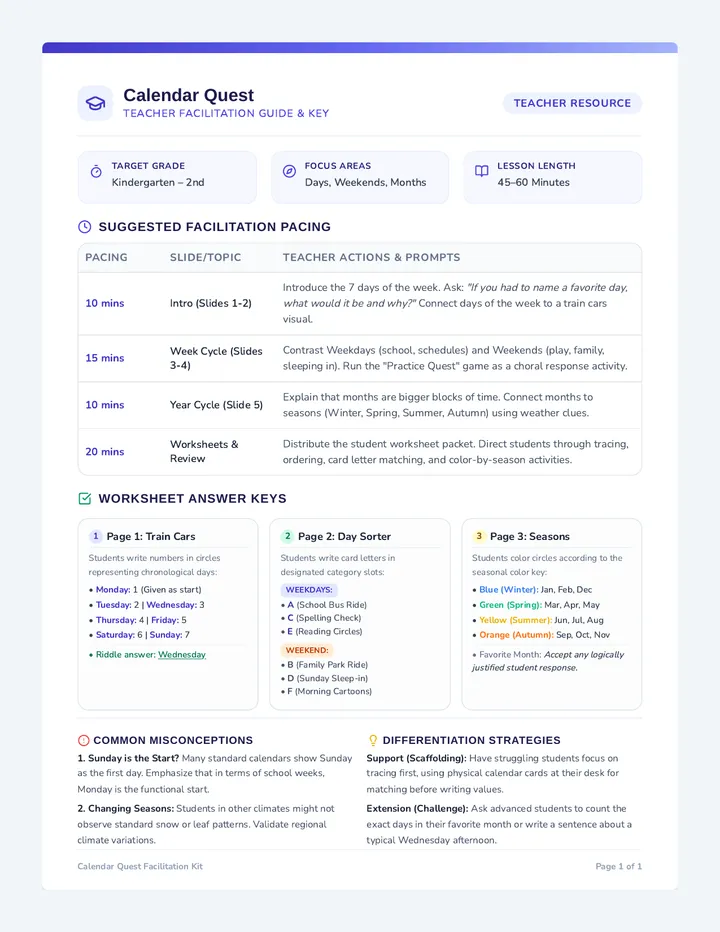
A foundational lesson introducing early elementary students to calendar concepts, including days of the week, weekdays versus weekends, and the twelve months of the year, contextualized with real-world school, home, and seasonal scenarios.
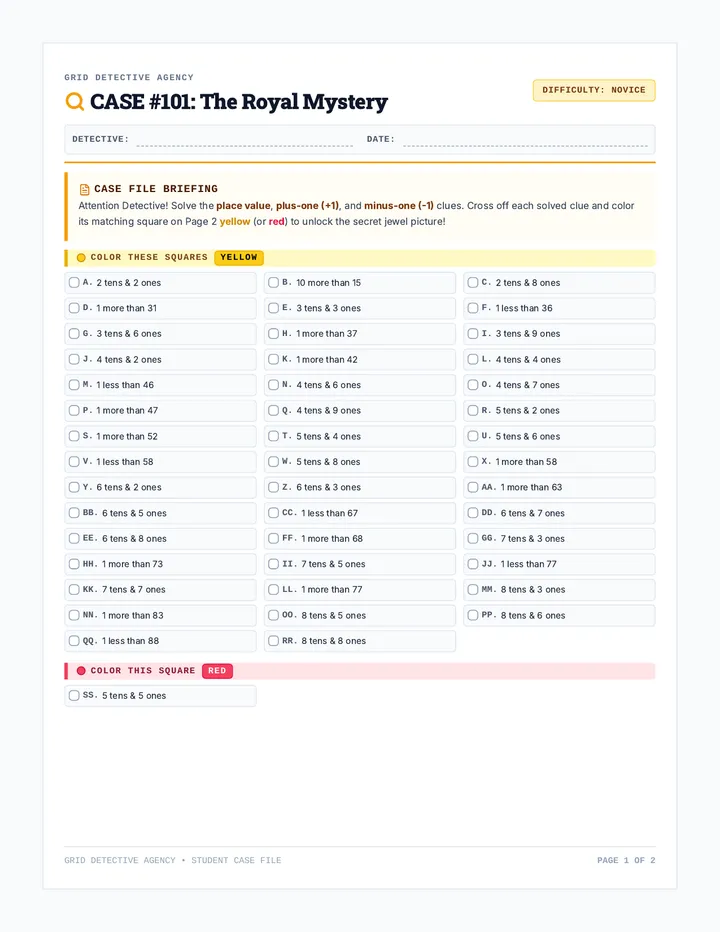
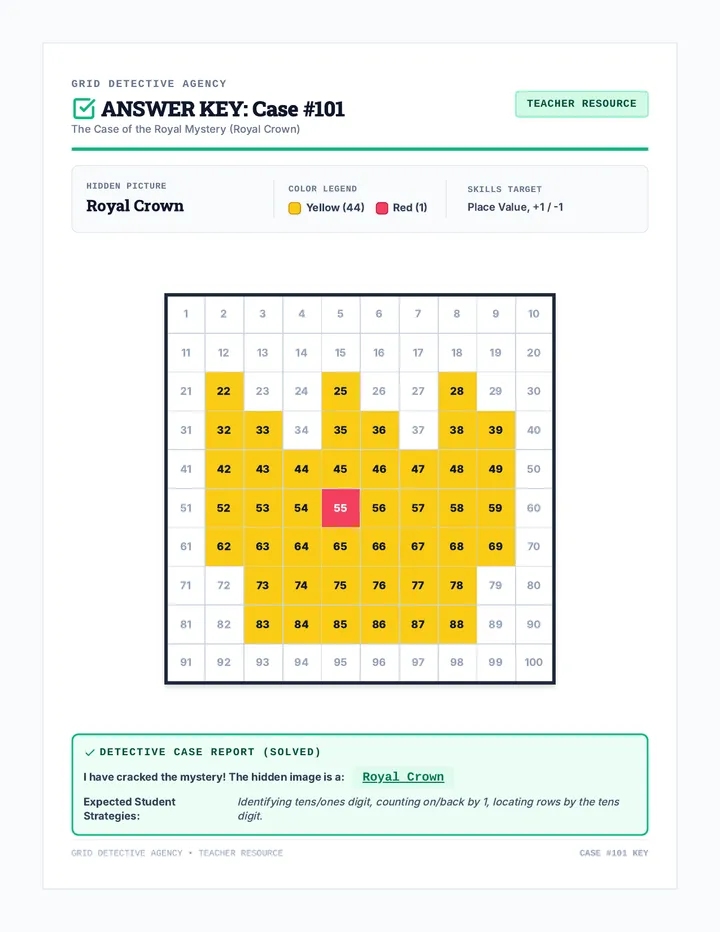
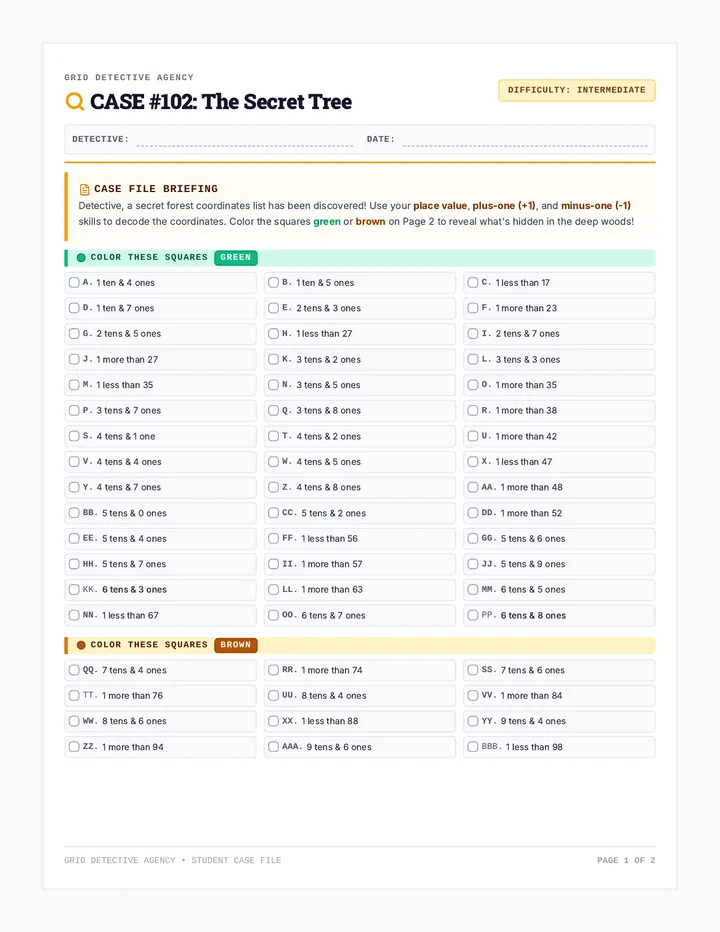
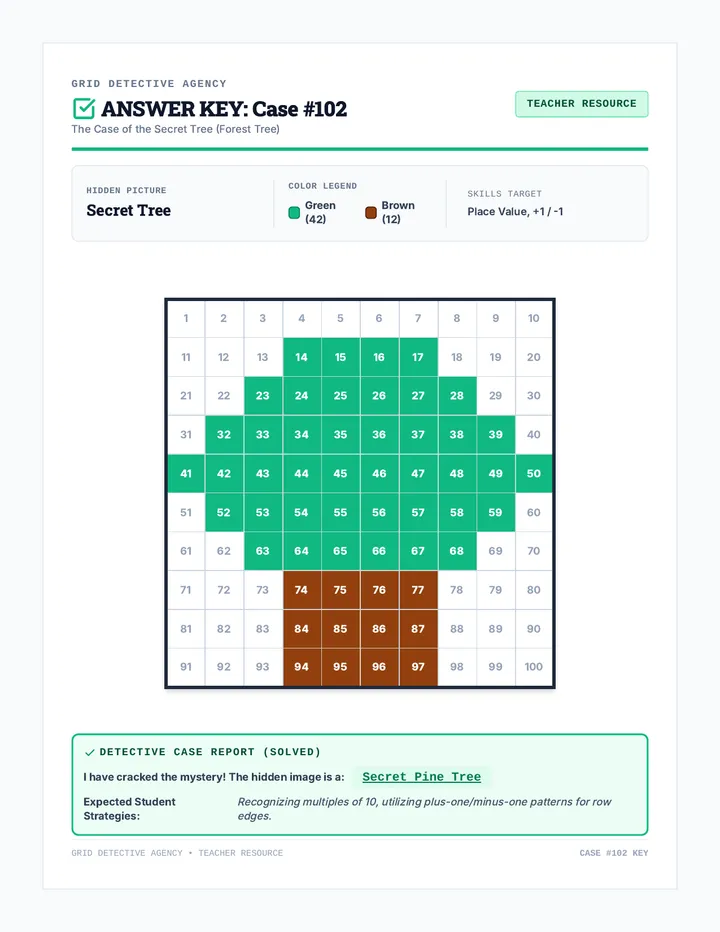
A fun, puzzle-packed math lesson where students become Grid Detectives, using place value clues (tens and ones, plus-one, minus-one) to solve 100-chart mystery pictures and unlock hidden pixel art drawings.