A Tier 2 intervention lesson focused on calculating expected payoffs for games of chance using a vintage carnival theme. Students use probability distributions to determine if carnival games are 'fair' through scaffolded, hands-on simulations.
A 15-day Texas Algebra 1 EOC test preparation program designed for non-math teachers to facilitate vocabulary mastery and high-yield readiness standard practice.
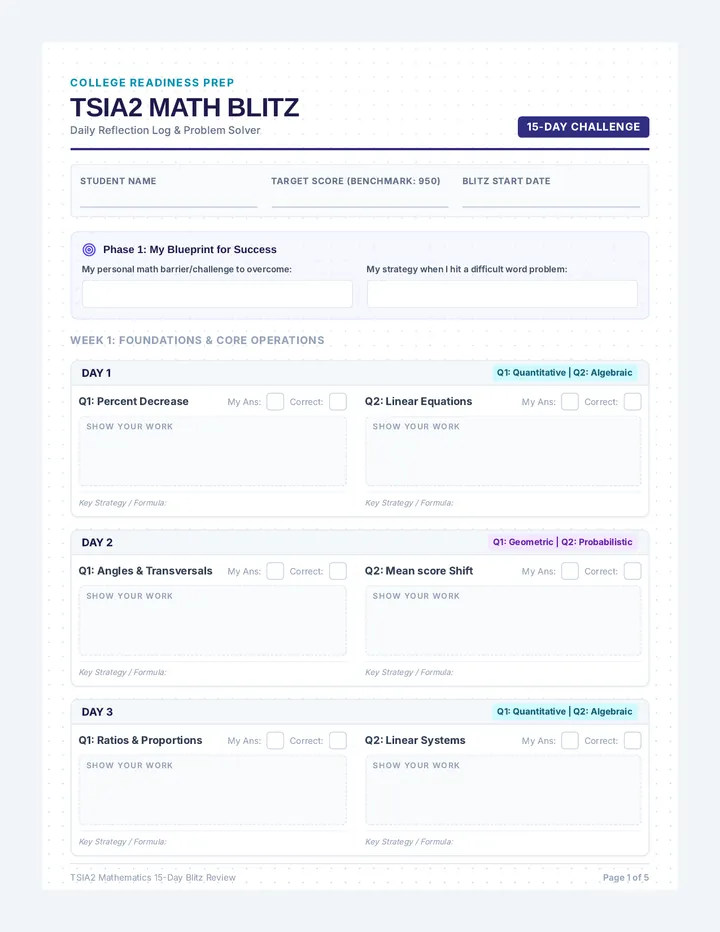
A comprehensive 15-day review program for the TSIA2 mathematics assessment, featuring daily high-yield questions covering all four core areas (Quantitative, Algebraic, Geometric, and Probabilistic reasoning) alongside a structured student tracking and reflection log.
A 32-slide presentation containing a 15-day TSIA2 Math Blitz. Each day features two high-yield exam-style questions spanning Algebraic, Quantitative, Geometric, and Probabilistic reasoning, with corresponding blueprint-style hint, key, and step-by-step solutions slides.
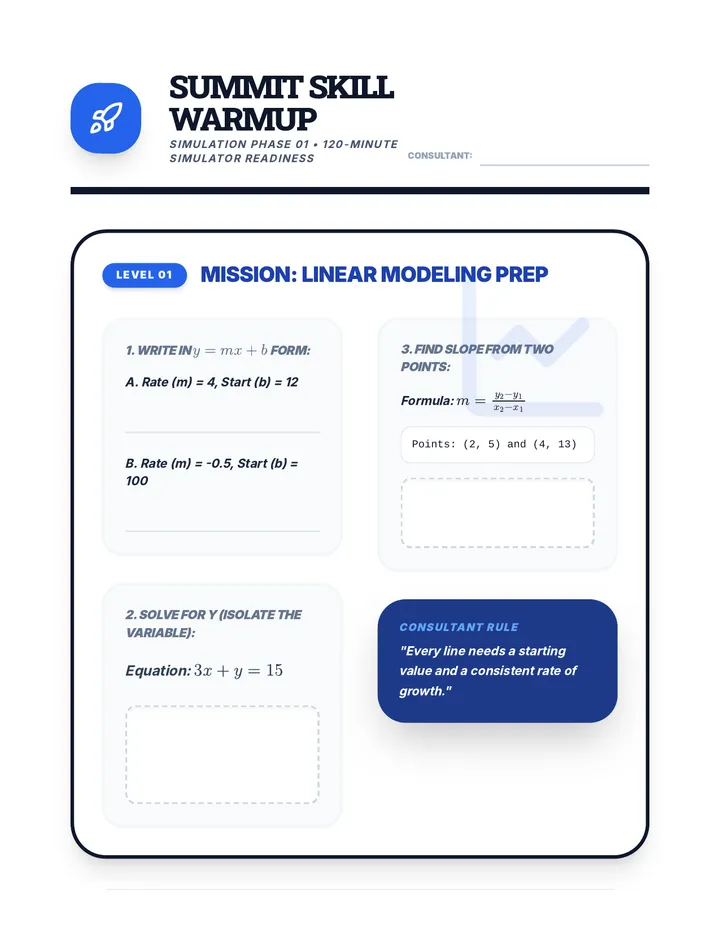
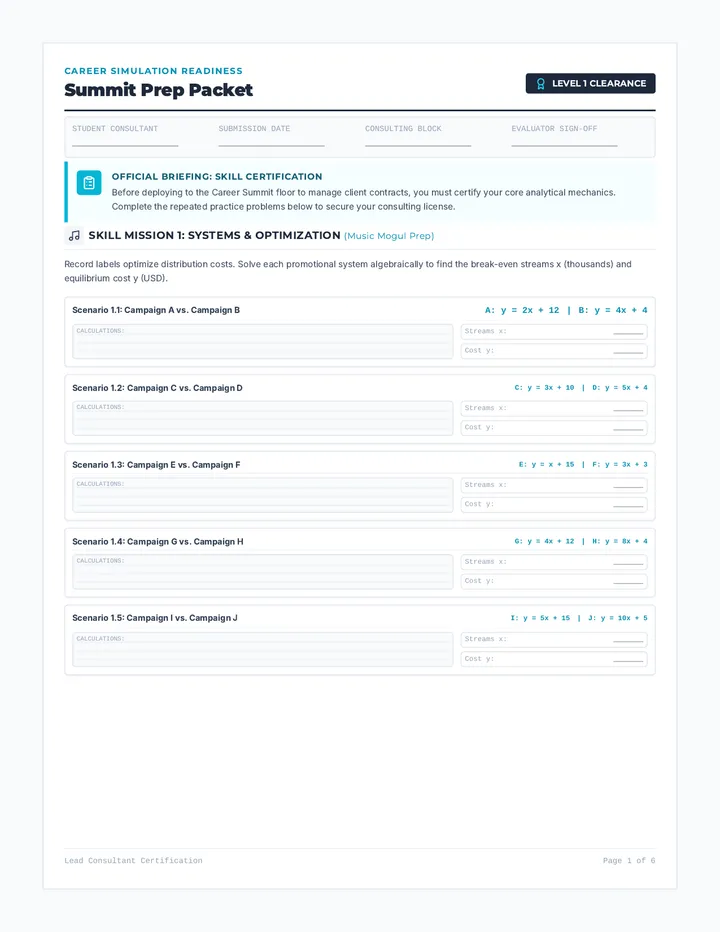
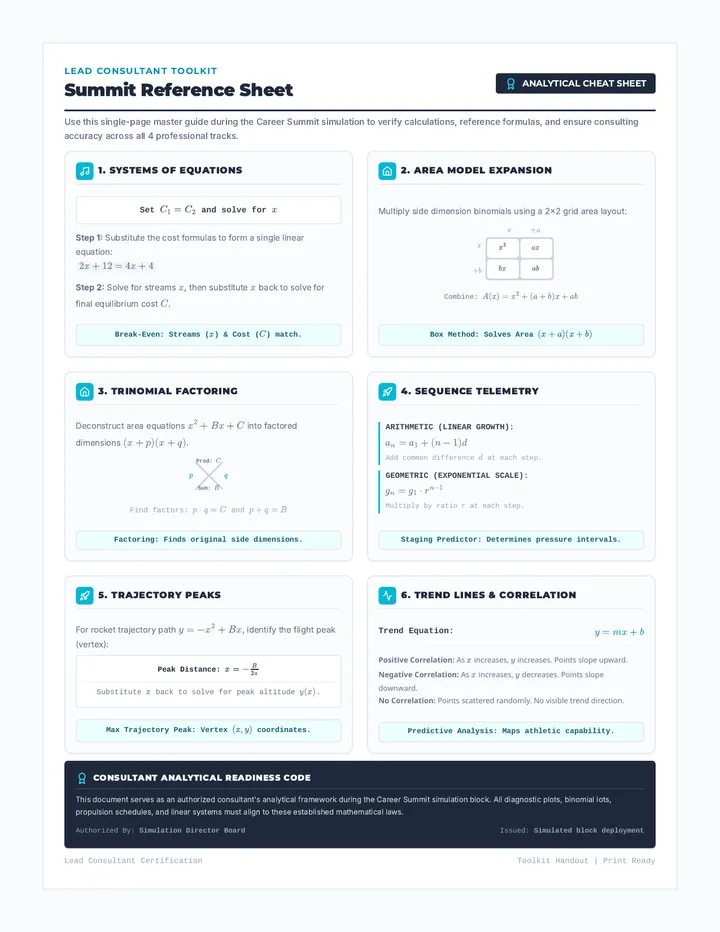
A high-intensity, 120-minute math simulation. Students act as lead consultants, completing a high-speed skill warmup before selecting a professional sector (Music, Urban Planning, Rocket Science, or Sports Analytics) to solve a series of complex work orders.
The core 15-day test prep lesson consisting of highly visual, self-contained slides, a comprehensive student work-packet, and an easy-to-use teacher facilitation guide designed for non-math specialists.
A 5-page daily student reflection and worksheet log for tracking TSIA2 mathematics questions, strategies, and progress. Features targeted entry fields for the 15-day blitz, dedicated visual workspace grids for student handwriting, personal goal-setting, and a final readiness checklist.
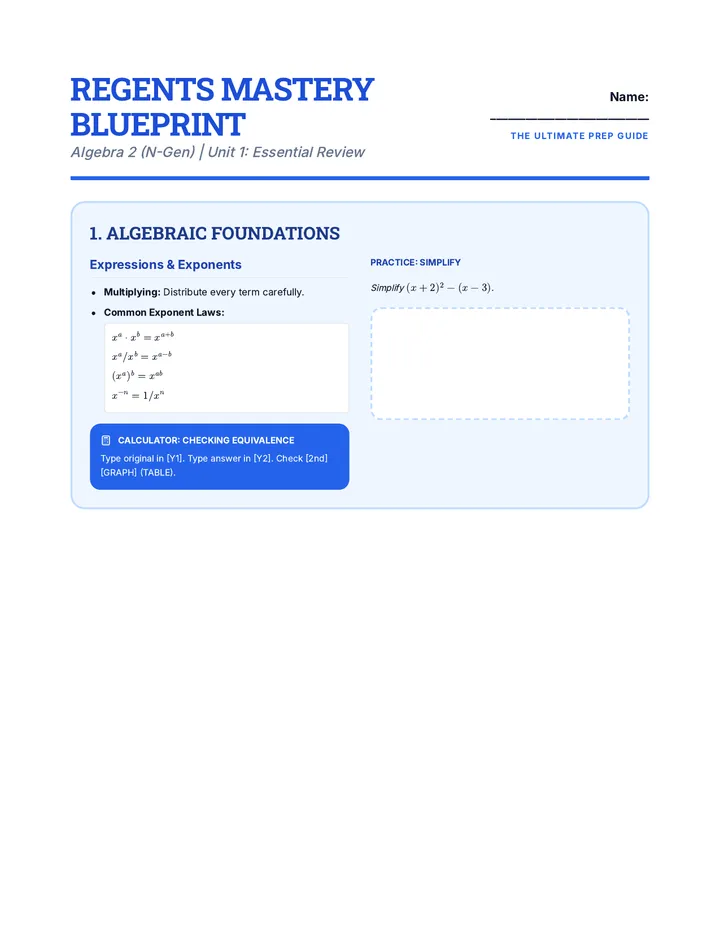
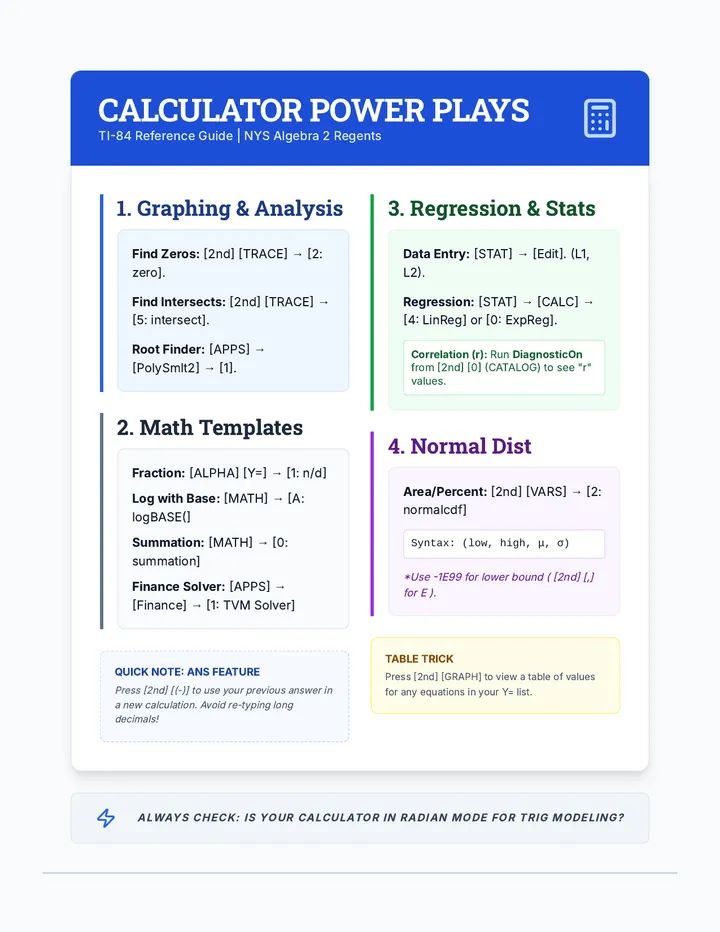
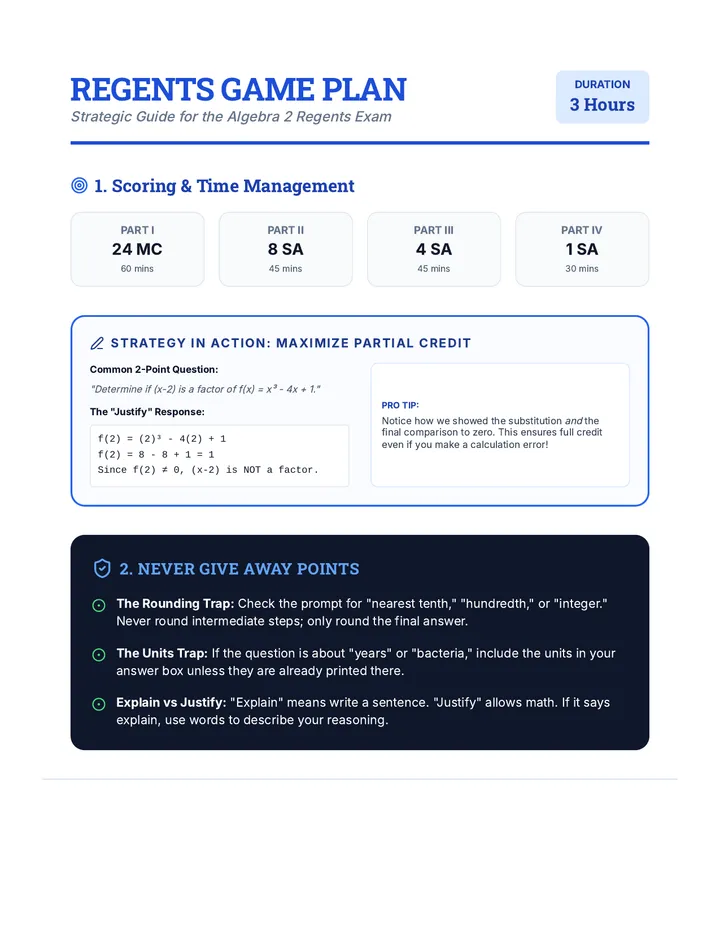
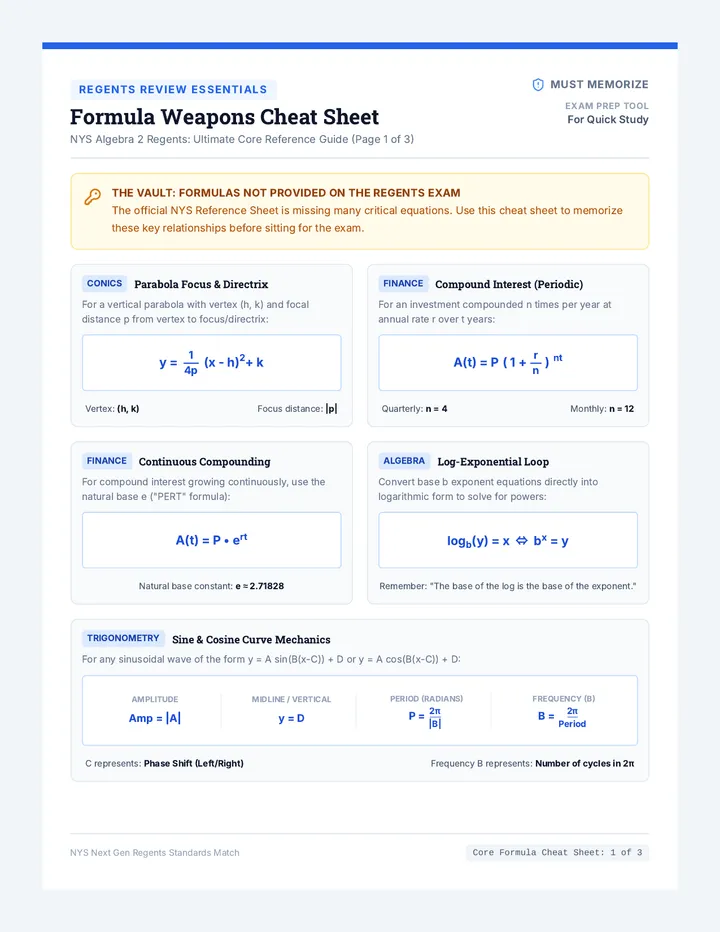
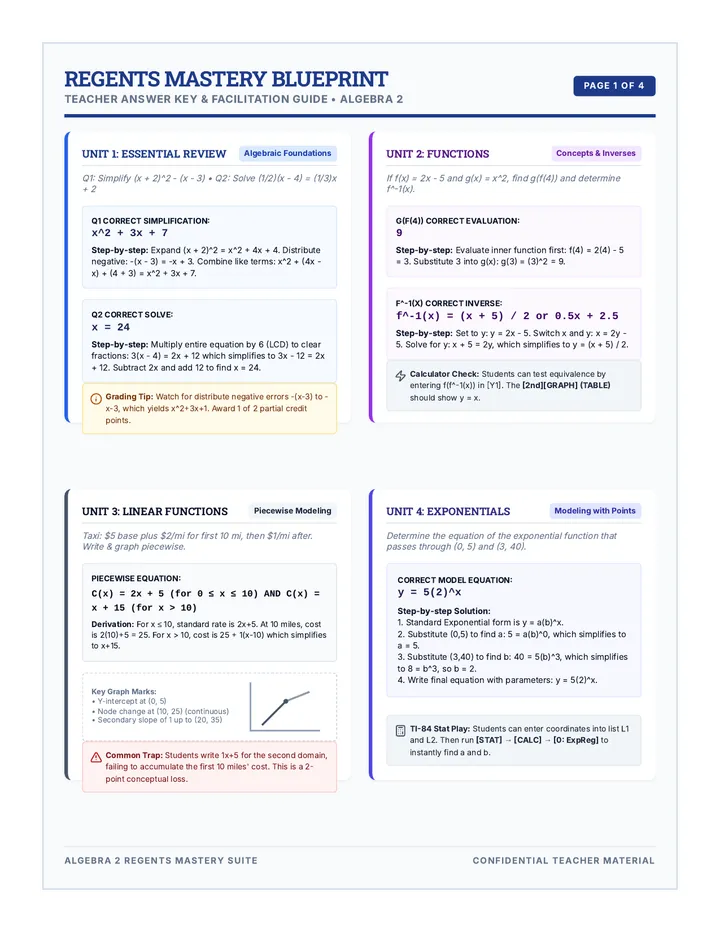
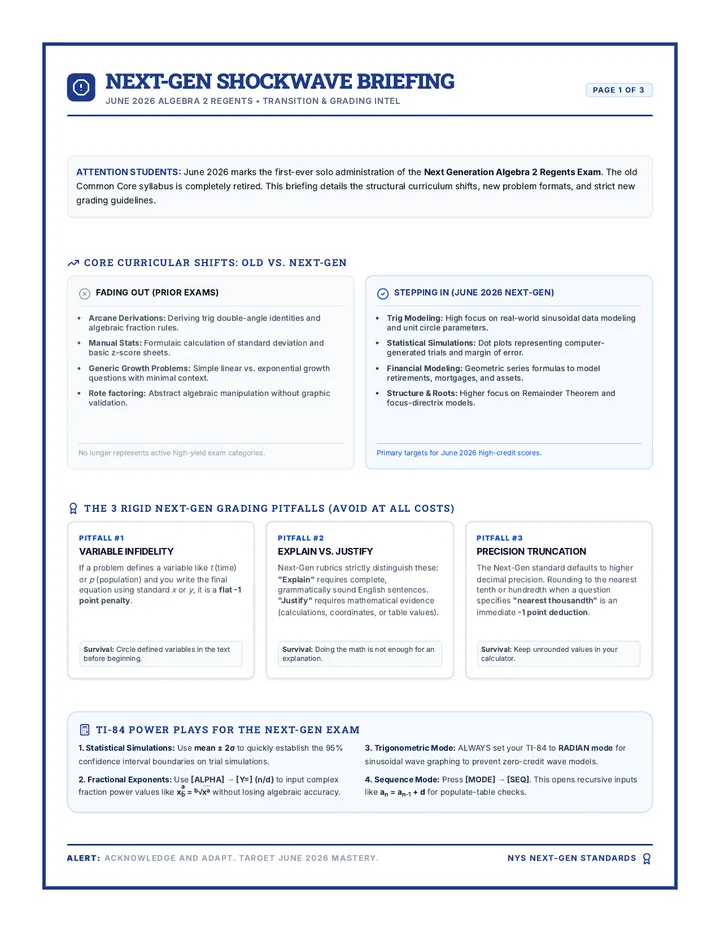
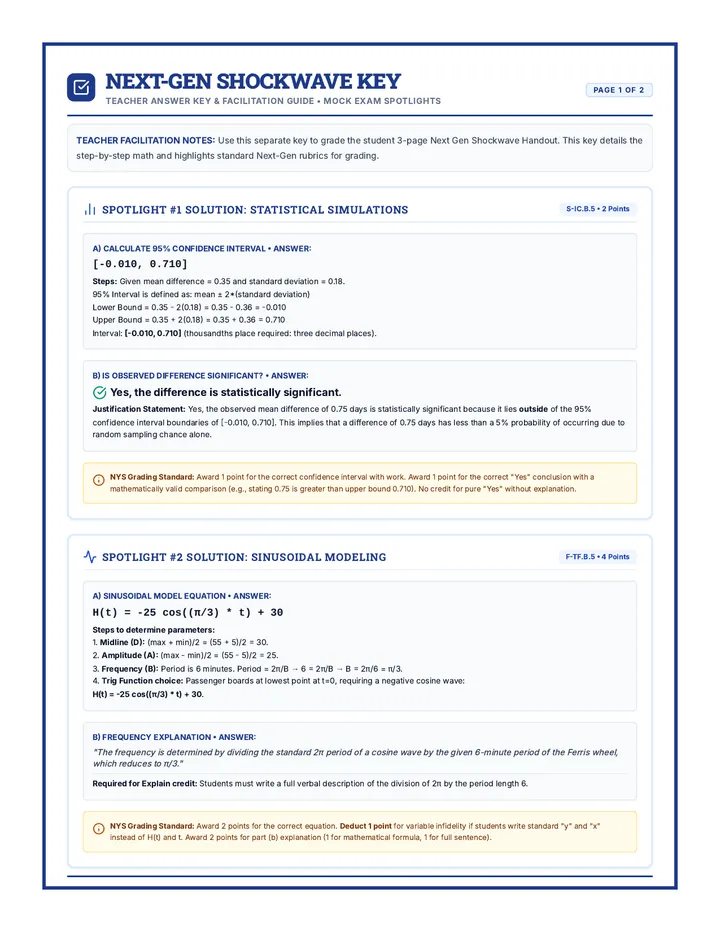
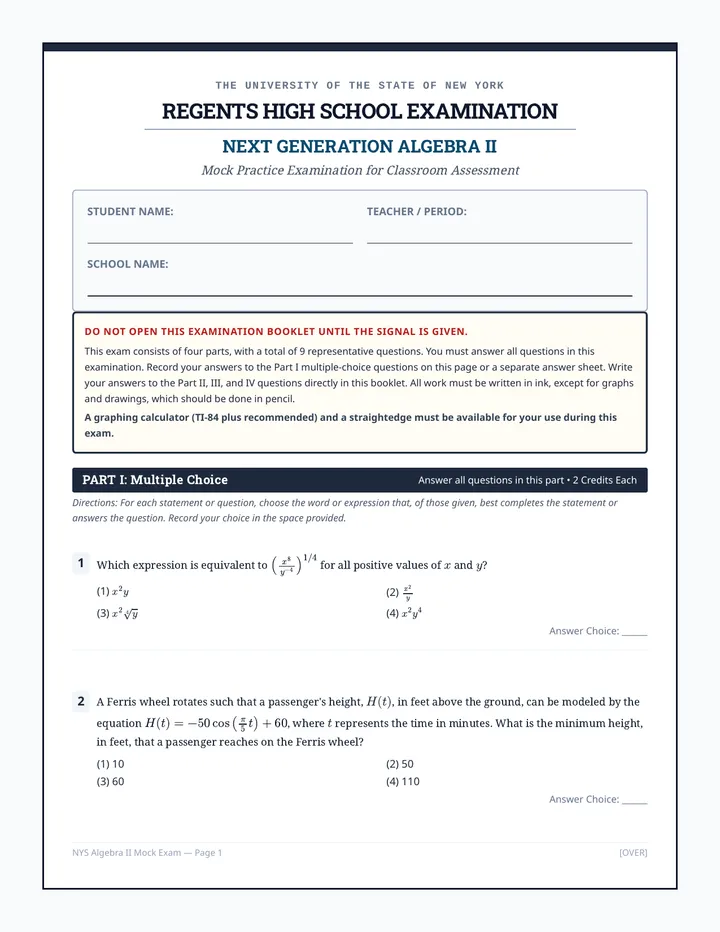
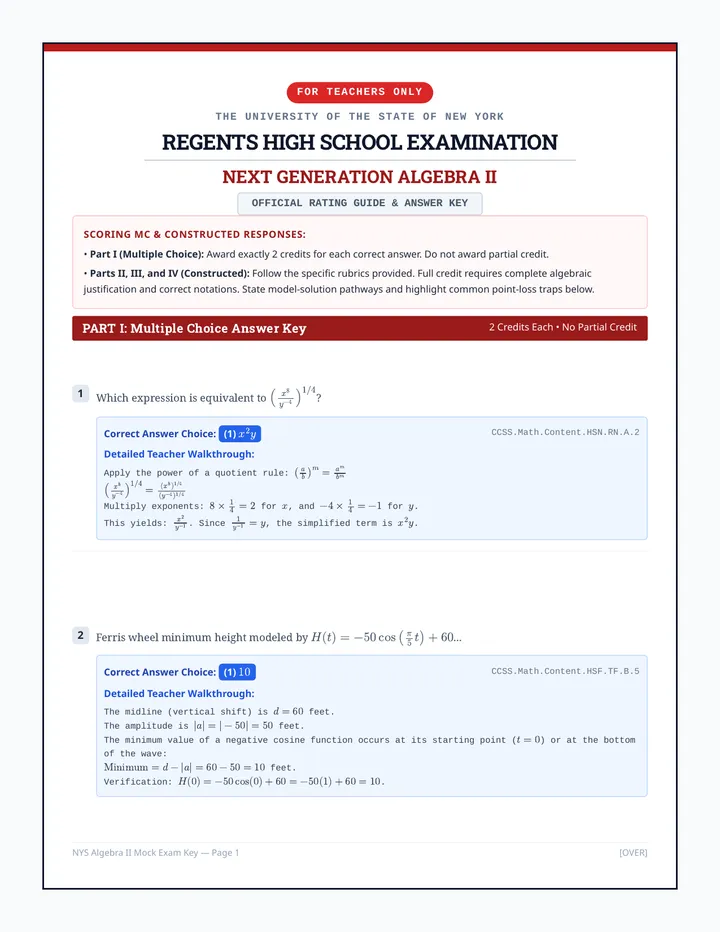
A comprehensive review suite for the New York State Mathematics Regents exams, including Algebra 1, Geometry, and Algebra 2, featuring mastery blueprints, calculator strategies, and exam-taking tips.
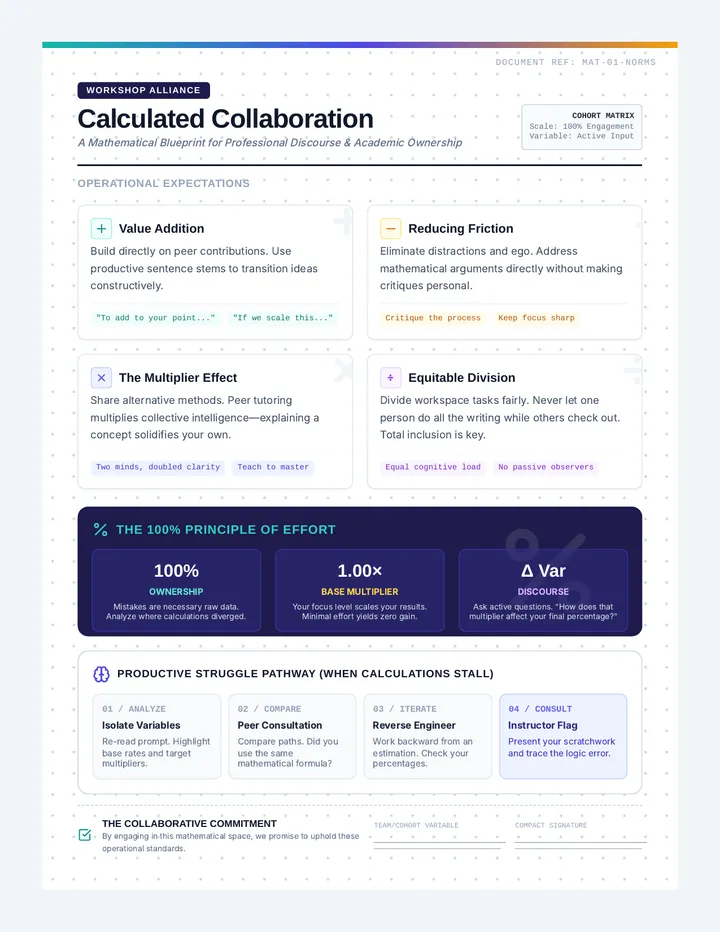
An introductory framework establishing professional collaboration, mathematical ownership, and productive struggle protocols in the high school math classroom.
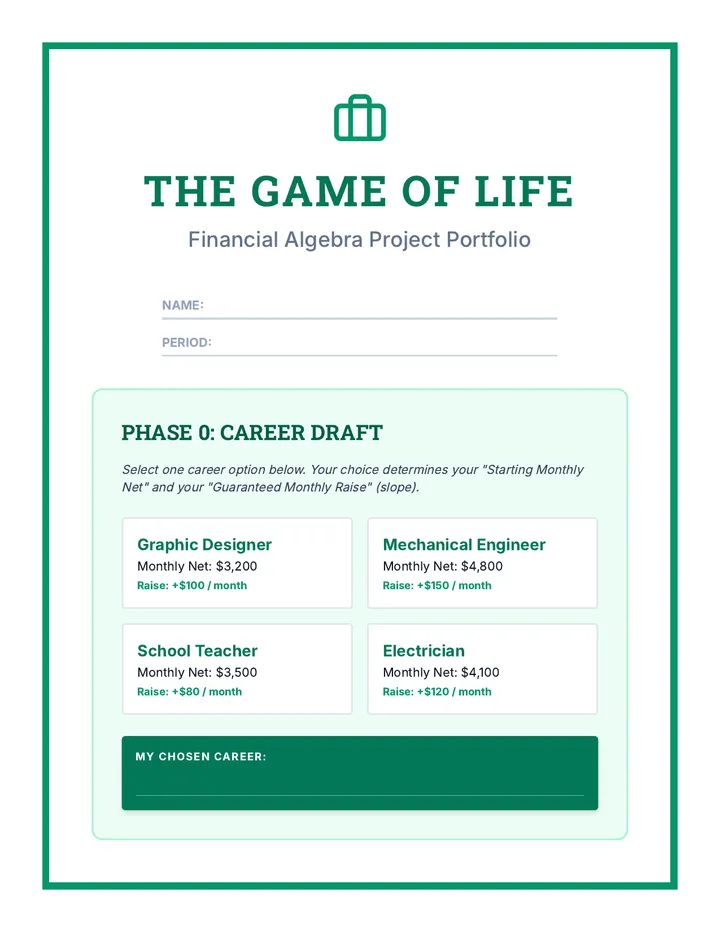
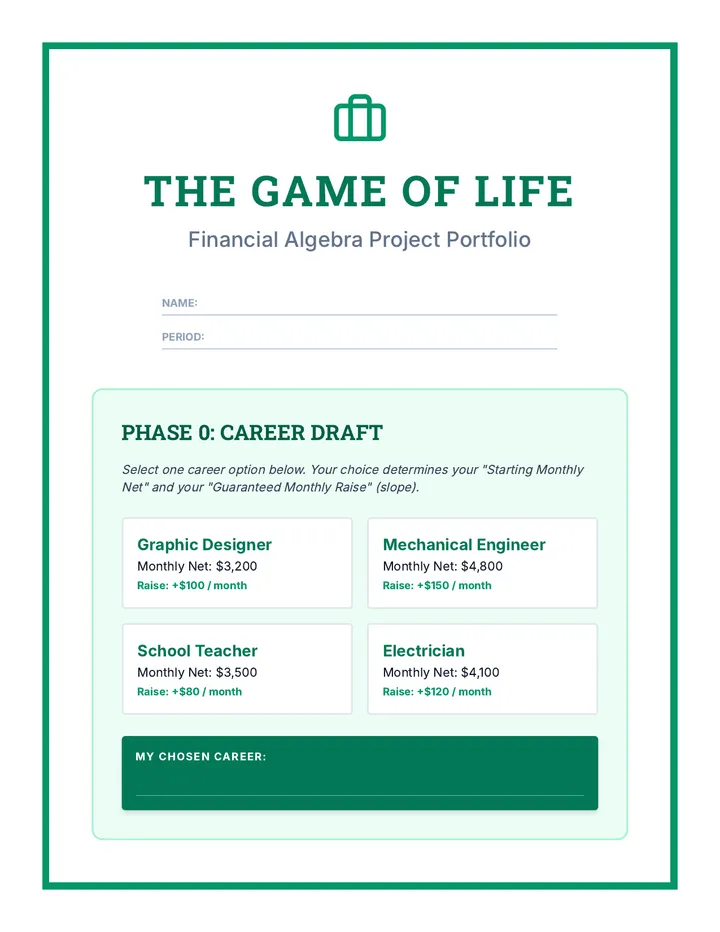
A comprehensive 8-day financial algebra project where 8th-grade students navigate adulthood, managing salaries, housing, transportation, and debt using linear and exponential models.
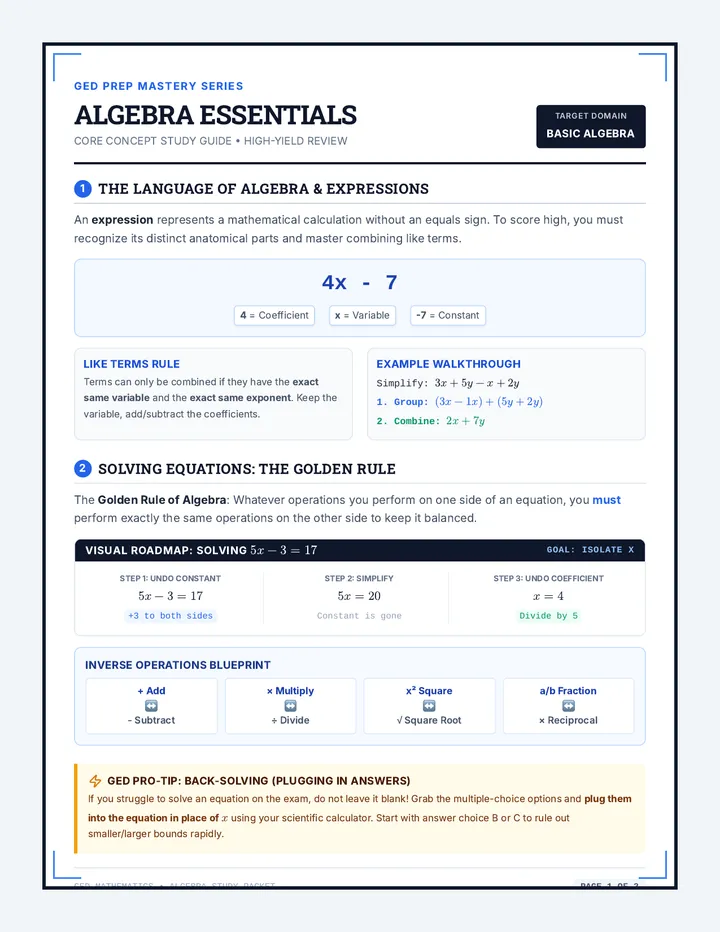
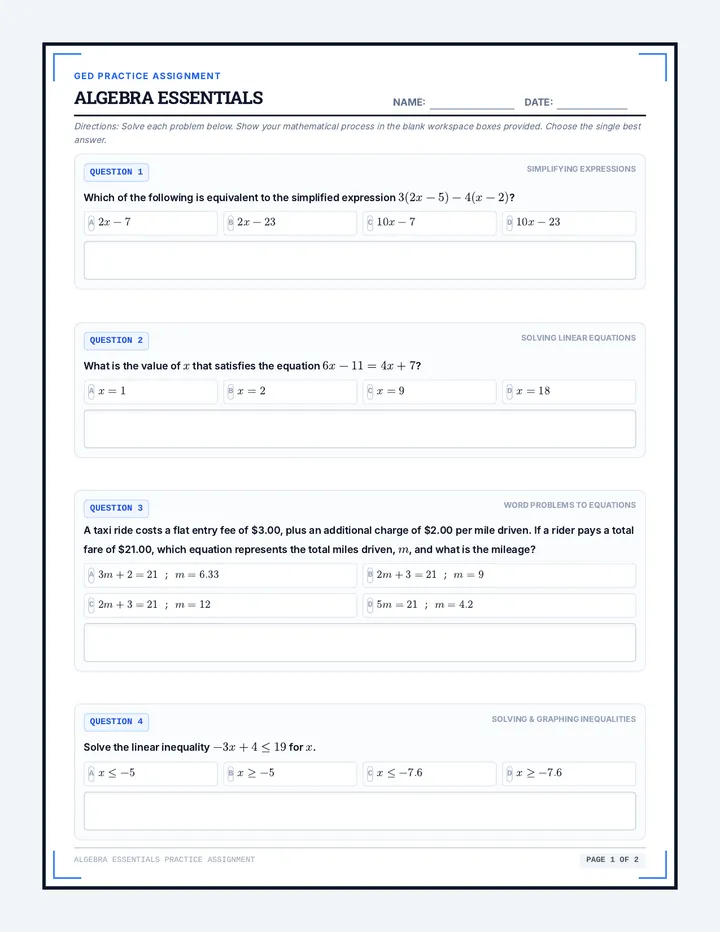
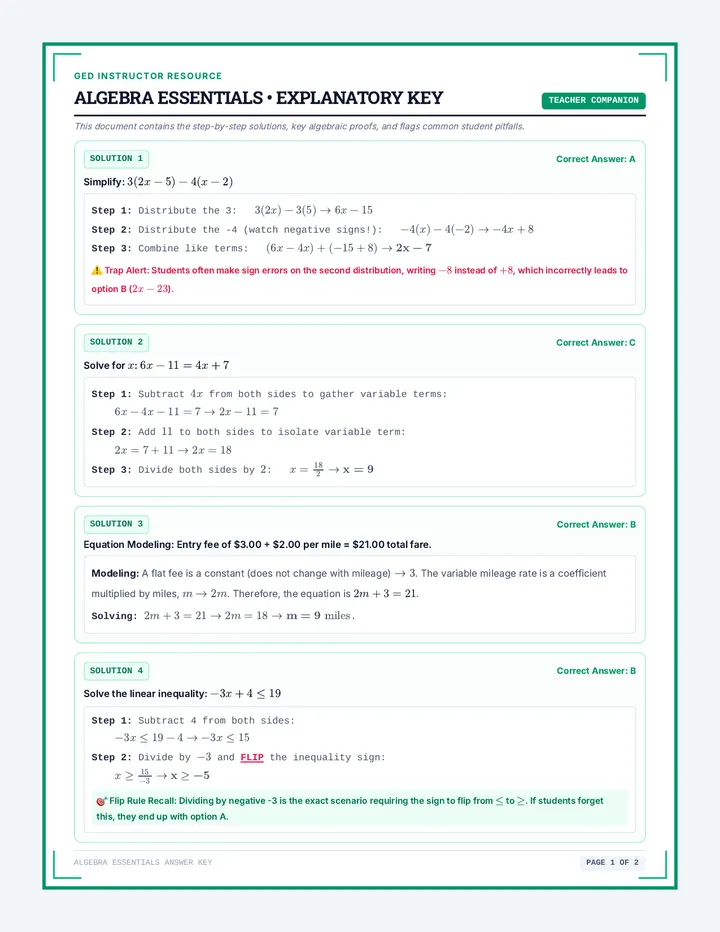
A high-yield GED prep lesson targeting core algebraic reasoning, including linear equations, inequalities, simplifying expressions, and coordinate functions. Includes a comprehensive study guide, practice worksheet, and step-by-step explanatory answer key.
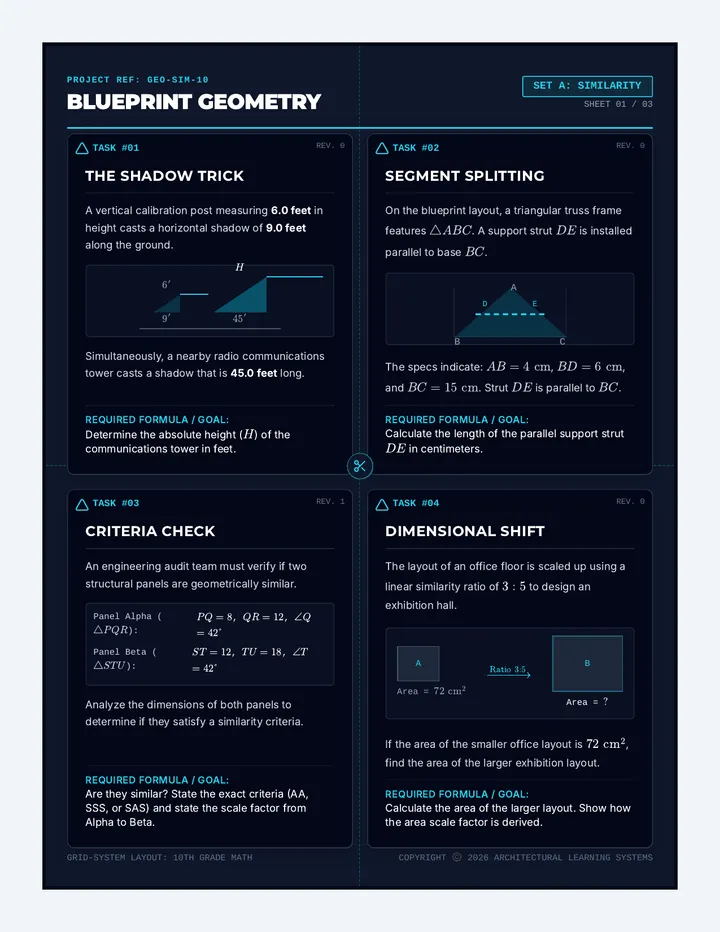
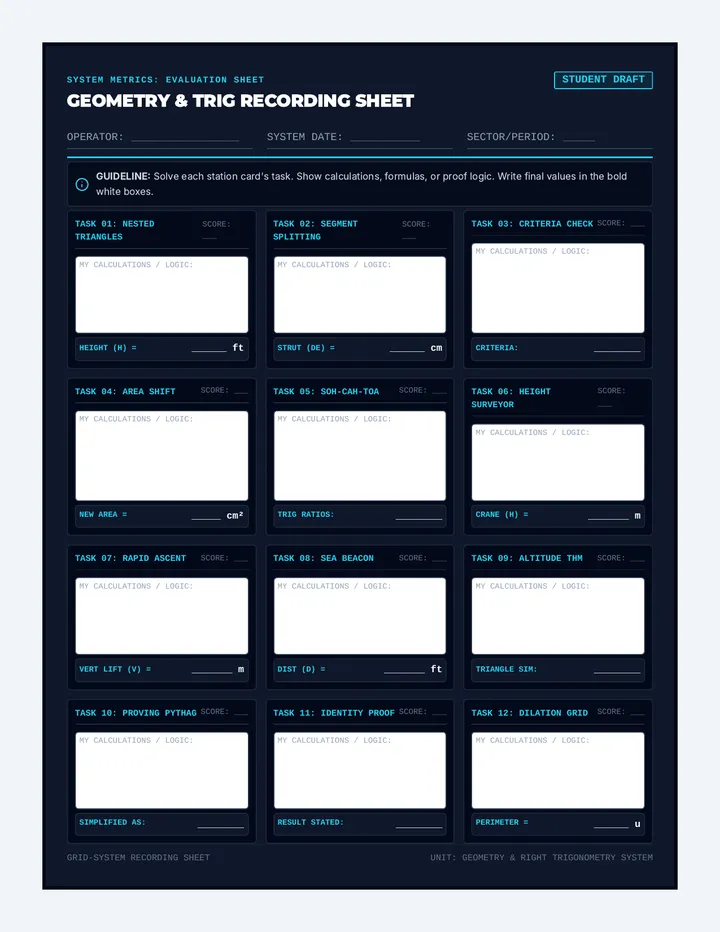
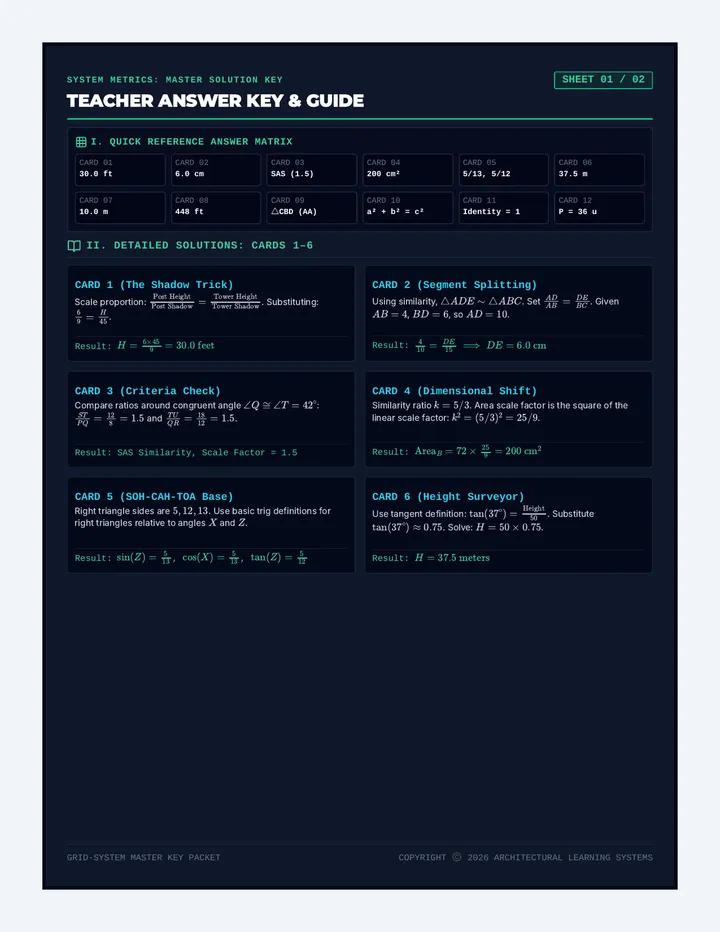
A rigorous, blueprint-themed activity set focusing on similarity, right-triangle trigonometry, and geometric proofs. Ideal for cooperative learning, stations, or structured review.
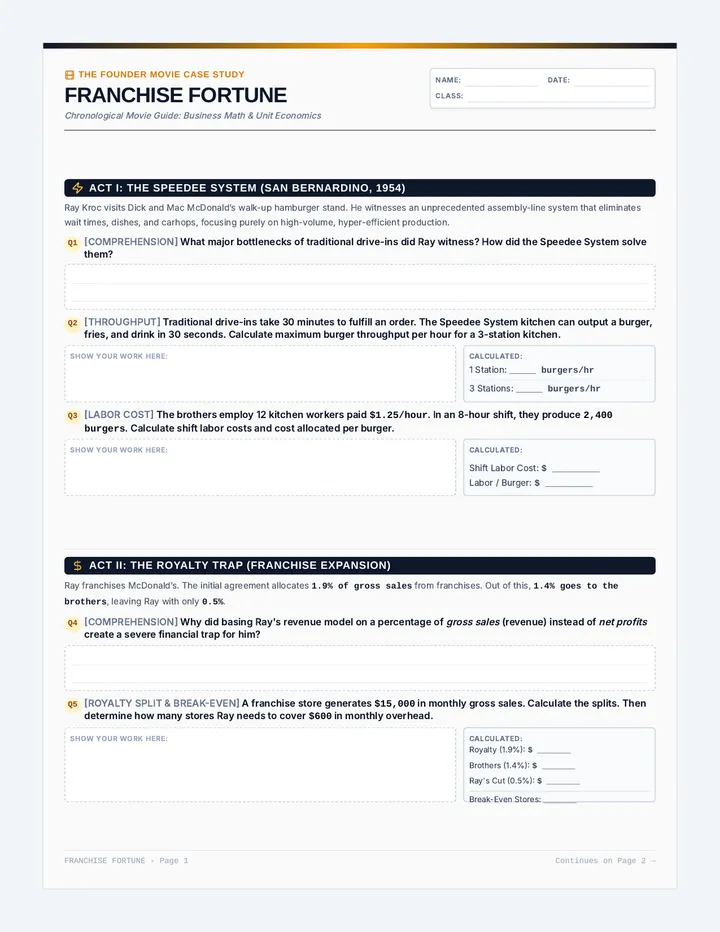
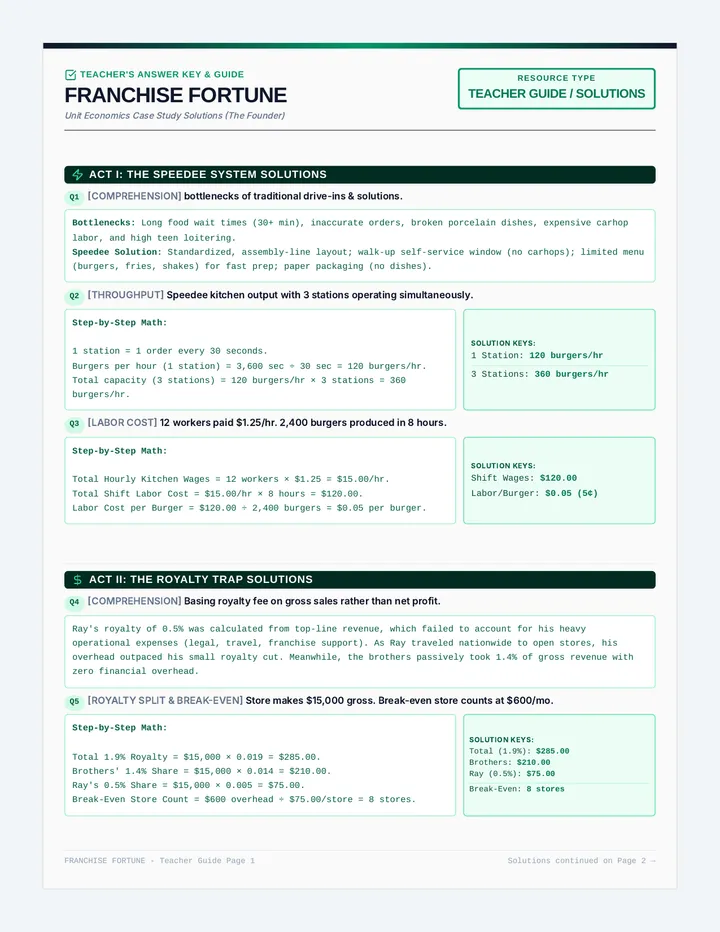
A rigorous business math and unit economics lesson centered on the movie 'The Founder'. Students analyze Ray Kroc's business decisions, calculate franchise royalties, evaluate real estate lease structures, and analyze cost-saving operational pivots like the Inst-a-Mix milkshake powder.