Lenny.com
Explore
Create
ActivitiesNewMathEnglish Language ArtsScience & EngineeringSocial StudiesGlobal LanguagesHealth & Physical EducationSpecial EducationCounseling & Life SkillsArts & CreativityESL
Lenny.com
Lenny.com
Explore
Create
ActivitiesNewMathEnglish Language ArtsScience & EngineeringSocial StudiesGlobal LanguagesHealth & Physical EducationSpecial EducationCounseling & Life SkillsArts & CreativityESL
Lenny.com
Lenny.com

Solutions

Lenny for EducatorsLenny for SchoolsLenny for Districts

Product

ExploreSign inCreateSupportAbout

Resources

Getting startedMTSS Acceleration Program

© 2026 Lenny Learning Inc.

TermsPrivacyAccessibility
LinkedInInstagramX
Lenny

Graph Equations and Inequalities

Coordinate plane representations of linear functions, systems of equations, and inequality solution sets. Builds skills in identifying intercepts, slopes, and feasible regions through visual mapping.

MathNumbers & CountingCounting ObjectsNumber NamesComparing NumbersNumber OperationsCounting SequenceNumbers 0-10Place Value Understanding and SystemAdd and Subtract Within 20Addition and Subtraction ConceptsAddition and Subtraction EquationsAddition and Subtraction ProblemsFoundations for MultiplicationMultiplication and Division PropertiesMultiply and Divide Within 100Multiplication and Division ProblemsFactors and MultiplesProperties of OperationsPatterns and RelationshipsGenerate and Analyze PatternsMulti-Digit ArithmeticPlace Value OperationsMulti-Digit and Decimal OperationsNumerical ExpressionsFour Operations and PatternsFour Operations Problem SolvingMeasurement & DataMeasurable AttributesMeasuring LengthsMeasure and Estimate Lengths in Standard UnitsRelate Addition and Subtraction to LengthClassifying and Counting ObjectsTime and MoneyArea Concepts and MeasurementPerimeter and Area MeasuresAngle Concepts and MeasurementTime, Volume, and MassMeasurement Unit ConversionsGeometryIdentifying ShapesShapes and AttributesShape Attributes and ReasoningShapes and CompositionClassifying 2D FiguresGeometric Figures and RelationshipsLines, Angles, and ShapesAngle, Area, and VolumeGeometric MeasurementVolume of 3D ShapesCoordinate Plane ApplicationsTransformations in the PlaneCongruence and SimilarityUnderstand congruence in terms of rigid motionsSimilarity and TransformationsProve Theorems Involving SimilarityPythagorean TheoremTrigonometry for General TrianglesMake Geometric ConstructionsProve Geometric TheoremsTheorems About CirclesFind Arc Lengths And Areas of Sectors of CirclesVolume FormulasRelationships Between Two-Dimensional and Three-Dimensional ObjectsProve Simple Geometric Theorems AlgebraicallyTranslate Between Geometric Description and Equation for Conic SectionApply Geometric Concepts in Modeling SituationsFractions & DecimalsFractions as NumbersBuilding FractionsFraction Equivalence and OrderingAdding and Subtracting FractionsMultiplying and Dividing FractionsDividing FractionsDecimal FractionsMulti-Digit Computation and FactorsAdd, Subtract, Multiply, and Divide Rational NumbersRational Number SystemIrrational Numbers and ApproximationsRatiosRatios and ProportionsProportional RelationshipsUnit RateAlgebraAlgebraic ExpressionsGenerate Equivalent ExpressionsQuantitative RelationshipsProportional Relationships and Linear EquationsEquations and InequalitiesEquation Solving and ReasoningLinear Equations and SystemsGraph Equations and InequalitiesSystems of EquationsReal-World Algebraic ProblemsQuantitative Reasoning with UnitsExpression StructureEquivalent Expression FormsRadicals and Integer ExponentsRational ExponentsRational and Irrational NumbersPolynomial OperationsPolynomial IdentitiesPolynomial Zeros and FactorsRational ExpressionsComplex Number OperationsComplex Numbers in PolynomialsComplex Numbers on PlaneStatistics & ProbabilityRepresent and Interpret DataData DistributionsStatistical VariabilityProbability ModelsCompound Event ProbabilitiesStatistical SamplingInterpret Categorical and Quantitative DataBivariate Data PatternsInterpret Linear ModelsComparing Two PopulationsRandom Processes in StatisticsIndependence and Conditional ProbabilityExpected ValuesProbability-Based Decision MakingStatistical Inference and ConclusionsFunctionsFunction Concepts and NotationDefine and Compare FunctionsInterpret Functions in ContextAnalyze Function RepresentationsModel Relationships with FunctionsIdentify Linear vs Exponential GrowthDistinguish Between Function TypesCompare Growth RatesInterpret Function ExpressionsBuild Functions from RelationshipsConstruct and Model FunctionsTransform and Combine FunctionsModel Comparison and SelectionSolve Exponential EquationsTrigonometryTrigonometric Ratios Involving Right TrianglesTrigonometric Functions and Unit CircleModel with Trigonometric FunctionsTrigonometric IdentitiesVectors & MatricesIntroduction to Vectors and MatricesVector QuantitiesVector OperationsMatrix OperationsCalculusLimits and ContinuityDerivative Concepts and NotationDerivative Rules and TechniquesApplications of DerivativesOptimization ProblemsRelated RatesCurve Sketching and AnalysisIntegration Concepts and NotationAntiderivatives and Indefinite IntegralsDefinite Integrals and AreaFundamental Theorem of CalculusIntegration TechniquesApplications of IntegrationDifferential EquationsSequences and SeriesParametric and Polar FunctionsVector-Valued Functions

Videos

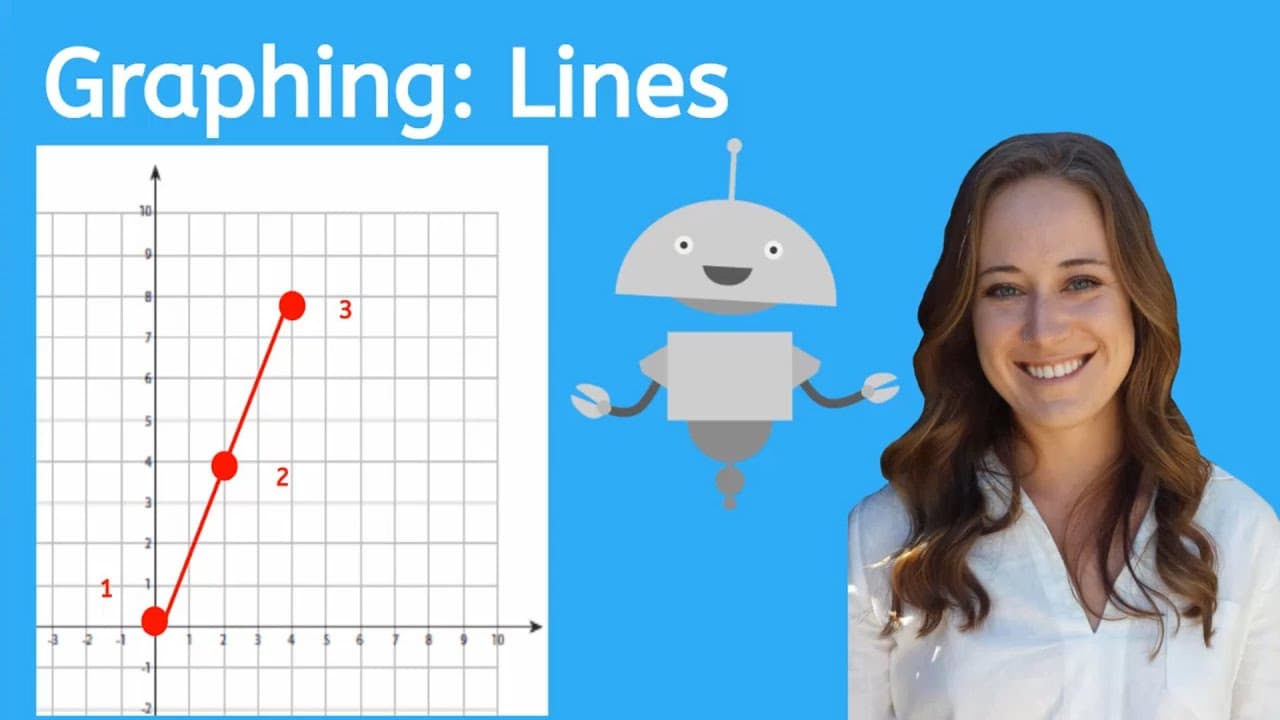
How to Graph Linear Equations Using Standard Form

How to Graph Linear Equations Using Standard Form

This instructional video guides students through the process of graphing linear equations provided in standard form (Ax + By = C). Hosted by a narrator named Justin, the lesson explores two primary strategies: finding the x and y-intercepts and rearranging the equation into slope-intercept form. The video emphasizes procedural fluency while also encouraging critical thinking about efficiency and choosing the best method for specific problems.

Miacademy & MiaPrep Learning ChannelMiacademy & MiaPrep Learning Channel

10mins 49s

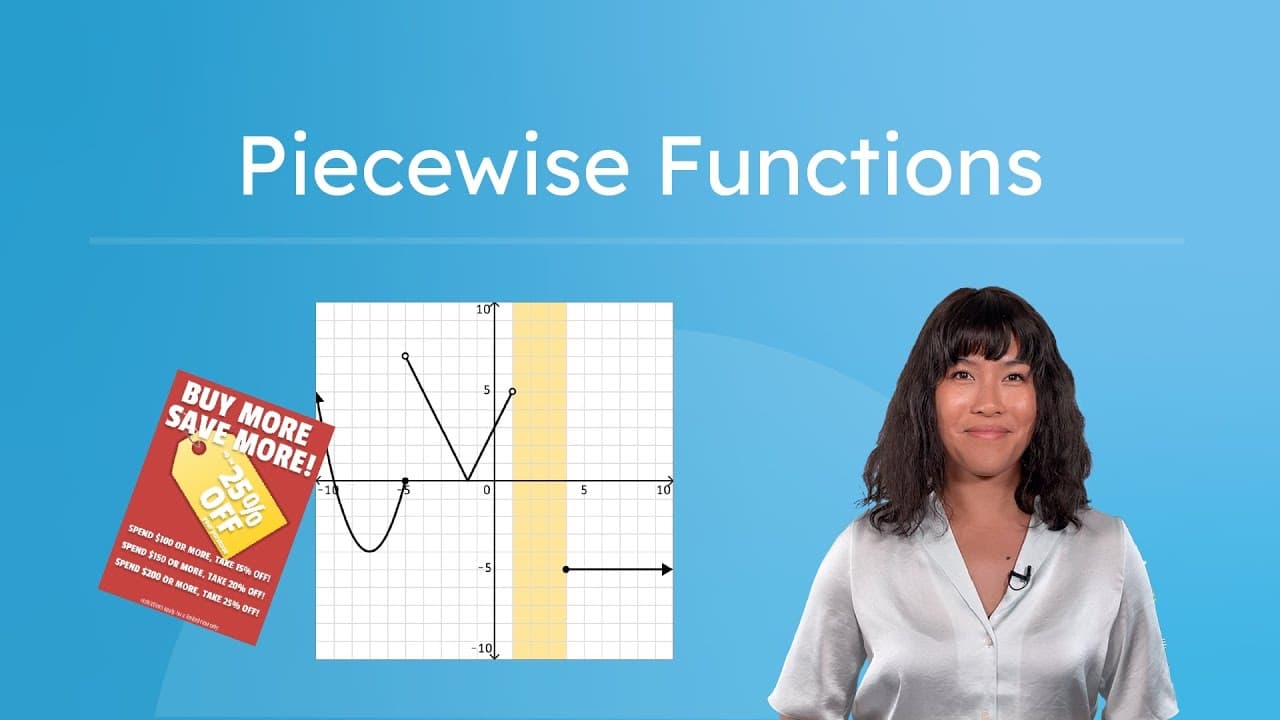
How to Graph, Evaluate, and Write Piecewise Functions

How to Graph, Evaluate, and Write Piecewise Functions

This comprehensive math tutorial demystifies piecewise functions by connecting abstract algebra concepts to real-world scenarios. The video begins with a relatable "Buy More, Save More" retail example to intuitively explain why a single function might require different rules for different input values. It progresses into formal mathematical definitions, demonstrating how to evaluate function values based on specific domain intervals and how to handle inequalities. The core of the lesson provides a step-by-step walkthrough of graphing a complex piecewise function that includes linear, absolute value, quadratic, and constant components. It pays special attention to common student stumbling blocks, such as distinguishing between open and closed circles at boundary points and handling gaps in the domain. The video also teaches students how to determine the overall range of a piecewise function by analyzing the output intervals of its individual parts. Finally, the video scaffolds the advanced skill of "reverse engineering" a function—writing the algebraic equations when given a graph. By reinforcing prior knowledge of slope-intercept form and function transformations, this resource serves as an excellent primary lesson for Algebra 2 students or a robust review for Pre-Calculus students encountering these "Frankenstein" functions.

Miacademy & MiaPrep Learning ChannelMiacademy & MiaPrep Learning Channel

11mins 43s

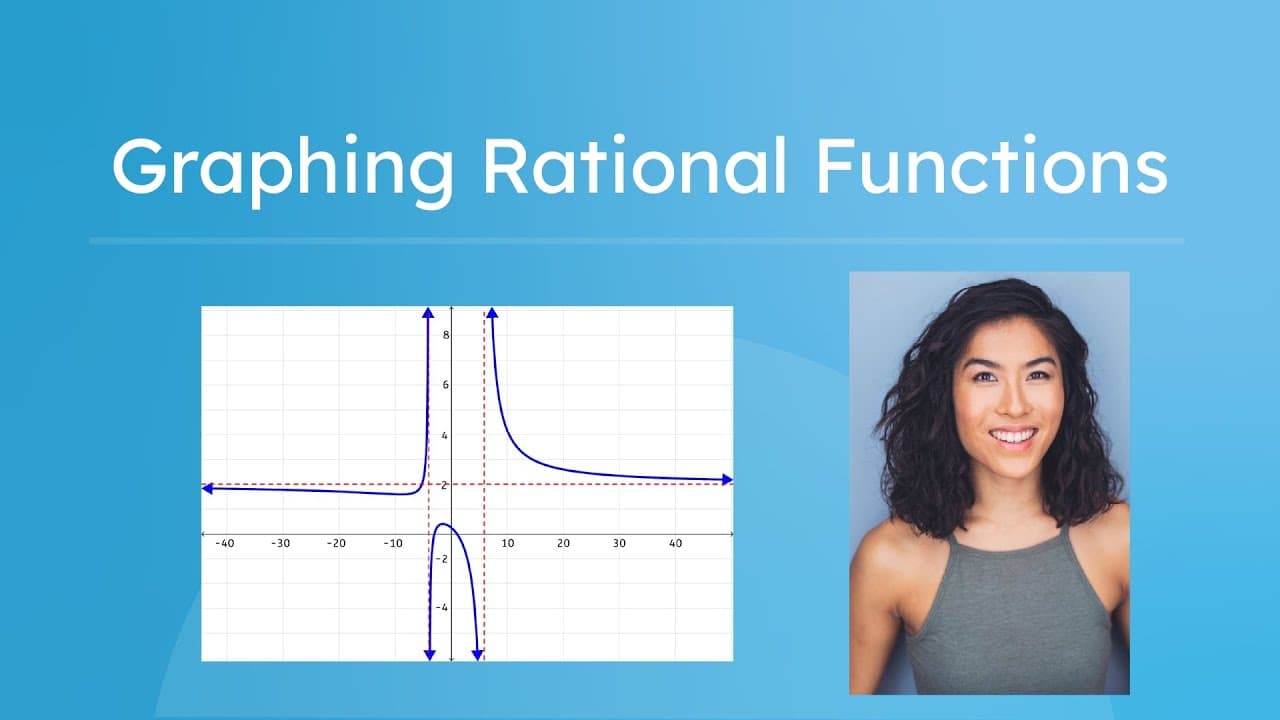
How to Graph Rational Functions Step-by-Step

How to Graph Rational Functions Step-by-Step

This comprehensive mathematics tutorial guides students through the process of graphing rational functions, bridging the gap between algebraic analysis and visual representation. Starting with the parent reciprocal function 1/x, the video systematically explores how to apply transformations, identify domain restrictions, and determine the behavior of graphs near asymptotes. It moves from simple vertical and horizontal shifts to complex functions requiring factoring to find holes (removable discontinuities), vertical asymptotes, and oblique asymptotes. The video covers key themes essential for Algebra II and Pre-Calculus students, including reciprocal functions, coordinate plane analysis, and the behavior of functions at undefined points. It introduces specific strategies for graphing without technology, such as finding intercepts using constant terms and selecting strategic test points near asymptotes to determine curve direction. The distinction between 1/x and 1/x² is analyzed to explain why certain graphs occupy specific quadrants. For educators, this resource serves as an excellent instructional core or review tool. It breaks down a complex multi-step procedure into manageable chunks, providing pause points for independent practice. The video encourages critical thinking by asking students to predict graph shapes based on algebraic features before plotting points, fostering a deeper conceptual understanding of the link between an equation's structure and its graphical form.

Miacademy & MiaPrep Learning ChannelMiacademy & MiaPrep Learning Channel

14mins 55s

Identifying Independent and Dependent Variables When Graphing

Identifying Independent and Dependent Variables When Graphing

This educational video provides a clear, step-by-step guide to understanding linear graphs, slope, and the critical distinction between dependent and independent variables. Narrated by Kaylee, the lesson begins by reviewing how to calculate slope using "rise over run" on a coordinate grid, demonstrating how a constant slope allows points to form a straight line. It then transitions into real-world applications, using examples like running speed and dog walking wages to show how linear relationships appear in everyday life.

Miacademy & MiaPrep Learning ChannelMiacademy & MiaPrep Learning Channel

13mins 41s

10 Essential Algebra Problems Explained

10 Essential Algebra Problems Explained

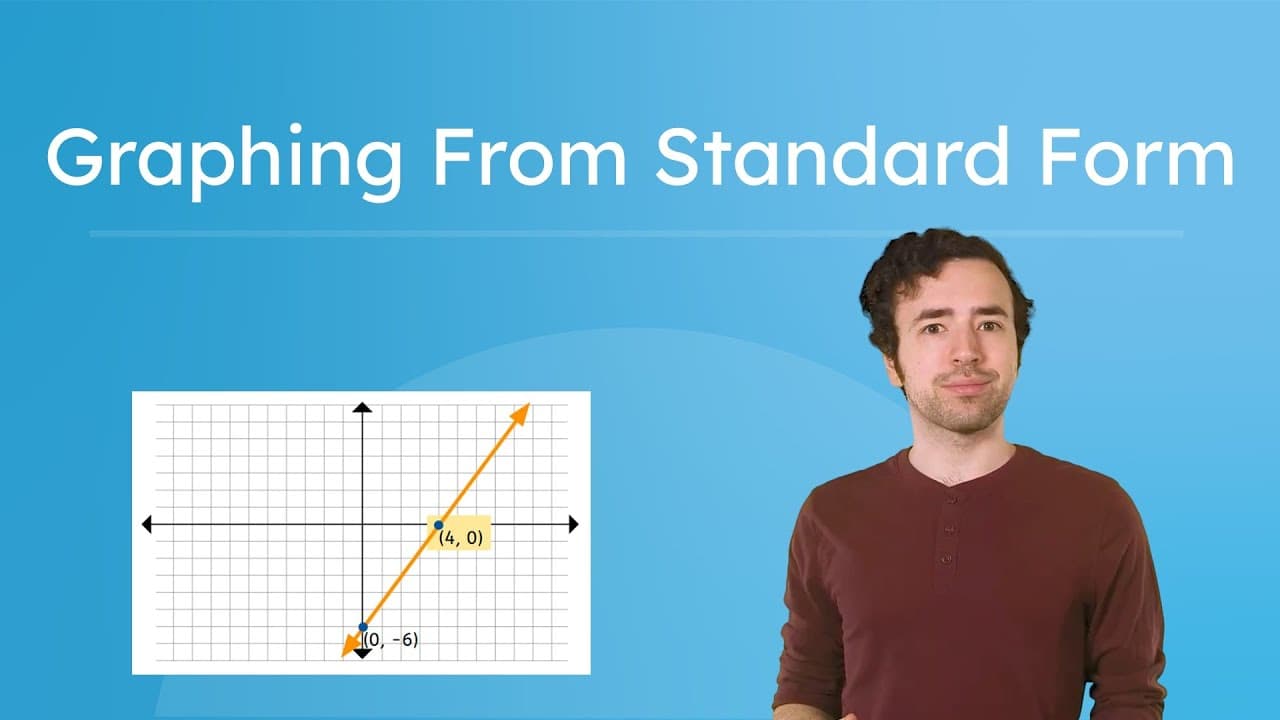
This comprehensive tutorial video walks students through ten of the most fundamental and frequently encountered problem types in a standard high school or college Algebra course. The instructor methodically demonstrates how to solve specific examples ranging from calculating slope and solving linear equations to more complex tasks like factoring trinomials, graphing parabolas, and solving systems of equations. Each problem is presented clearly on a blackboard-style interface, with the instructor breaking down the logic and steps required to reach the solution. The video explores key algebraic themes including linear functions, inequalities, quadratic equations, exponents, and systems of equations. It serves as an excellent review of the core curriculum found in Algebra I and Algebra II. The instructor emphasizes not just the 'how' but often the 'why,' discussing concepts like the axis of symmetry, properties of exponents, and different methods for solving quadratics (such as factoring versus the quadratic formula). For educators, this video is a versatile tool that can be used for end-of-unit reviews, standardized test preparation (like the SAT or ACT), or flipped classroom assignments. Teachers can assign specific segments to reinforce struggling concepts or use the entire video as a comprehensive course review. The clear, step-by-step visual working makes it ideal for students who benefit from seeing mathematical processes modeled explicitly.
The Organic Chemistry TutorThe Organic Chemistry Tutor

26mins 15s

Graphing Reciprocal Functions Using Transformations and Asymptotes

Graphing Reciprocal Functions Using Transformations and Asymptotes

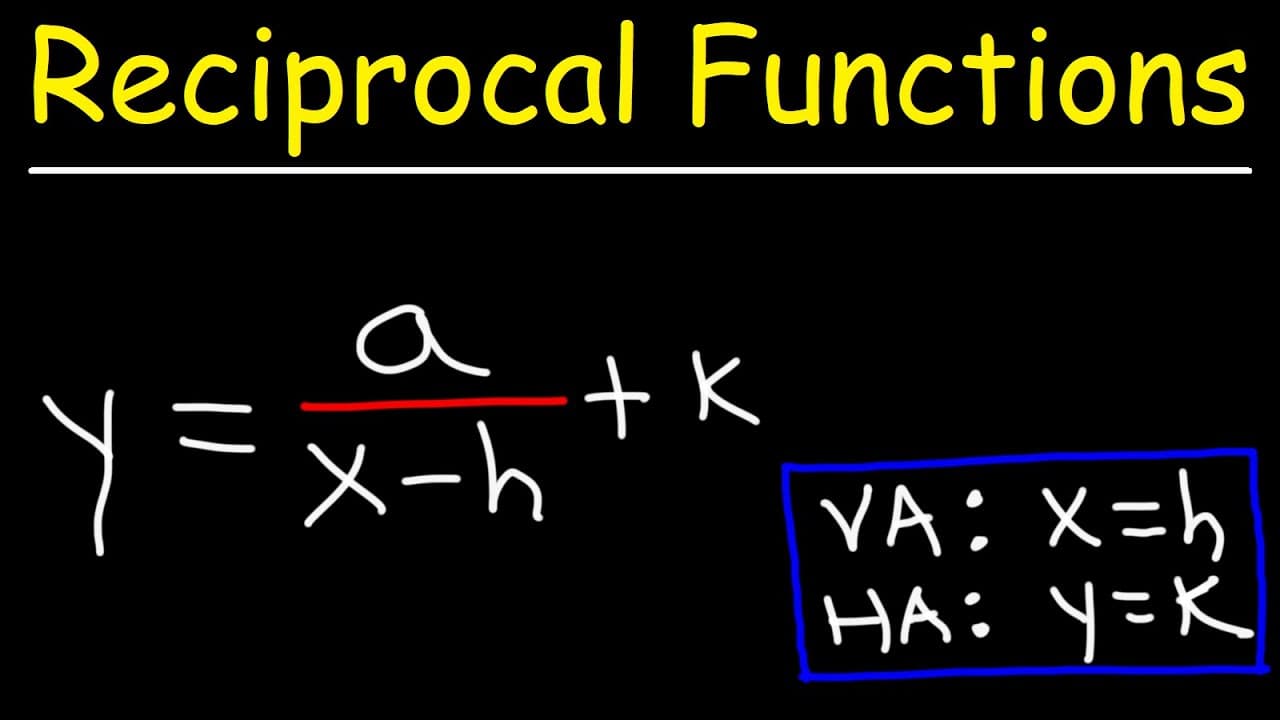
This video provides a detailed, step-by-step tutorial on how to graph reciprocal functions using the standard equation form y = a/(x-h) + k. The instructor explains the role of each variable in the equation, specifically focusing on how 'h' and 'k' determine the vertical and horizontal asymptotes, and how 'a' influences the vertical stretch, shrink, and orientation of the graph across the coordinate plane. The video explores key themes such as identifying asymptotes, understanding transformations (shifts and stretches), and the process of creating a table of values to plot accurate points. It contrasts positive and negative values of 'a', demonstrating how a negative sign reflects the graph across the horizontal asymptote, changing which quadrants the curves occupy relative to the asymptotes. For educators, this video serves as an excellent instructional tool for Algebra II or Pre-Calculus students moving beyond linear and quadratic functions. It offers a clear procedural method for graphing rational functions without a calculator, reinforcing concepts of domain, range, and asymptotic behavior. The step-by-step examples allow teachers to pause and let students practice predicting the graph's behavior before the solution is revealed.

The Organic Chemistry TutorThe Organic Chemistry Tutor

12mins 30s

Materials

Linear Graphing Starter Worksheet

Linear Graphing Starter Worksheet

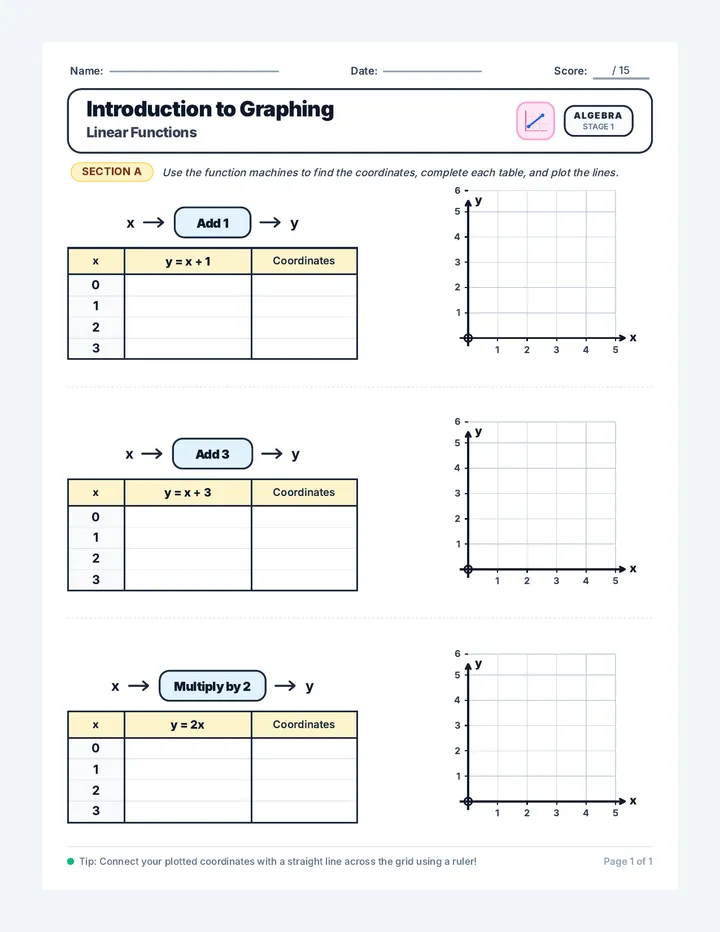
A clean, printable math worksheet introducing linear graphing with function machines, coordinate value tables, and first-quadrant coordinate planes for addition and multiplication rules.

TP

tiffany priest

Coordinate Spark Warmup

Coordinate Spark Warmup

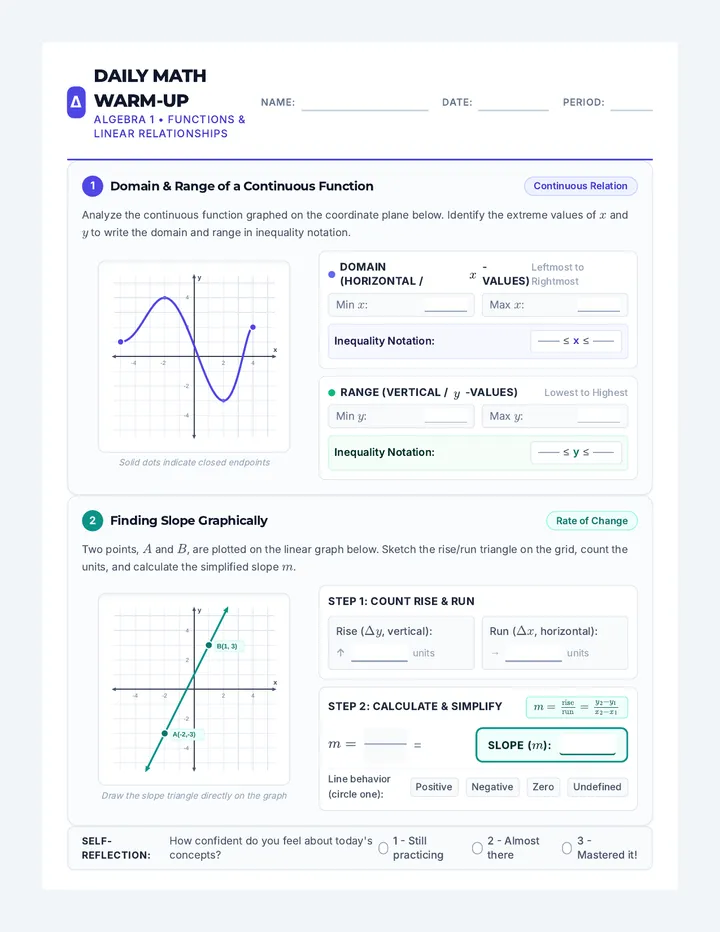
A 1-page Algebra 1 warm-up worksheet featuring two problems: determining the domain and range of a continuous function from a coordinate graph, and finding the slope graphically between two plotted points with step-by-step workspace.

KV

Karen Valenciana

Fare Finder Chart

Fare Finder Chart

A high-resolution, full-page standalone math-accurate coordinate graph showing the linear cost of an Uber ride with base fare $2.50 and $1.50 per mile, with specific points highlighted and labeled at x = 3 ($7.00) and x = 12 ($20.50). Features minor gridlines at $1 increments.

PT

Patrick Timmons

Algebra Review Test

Algebra Review Test

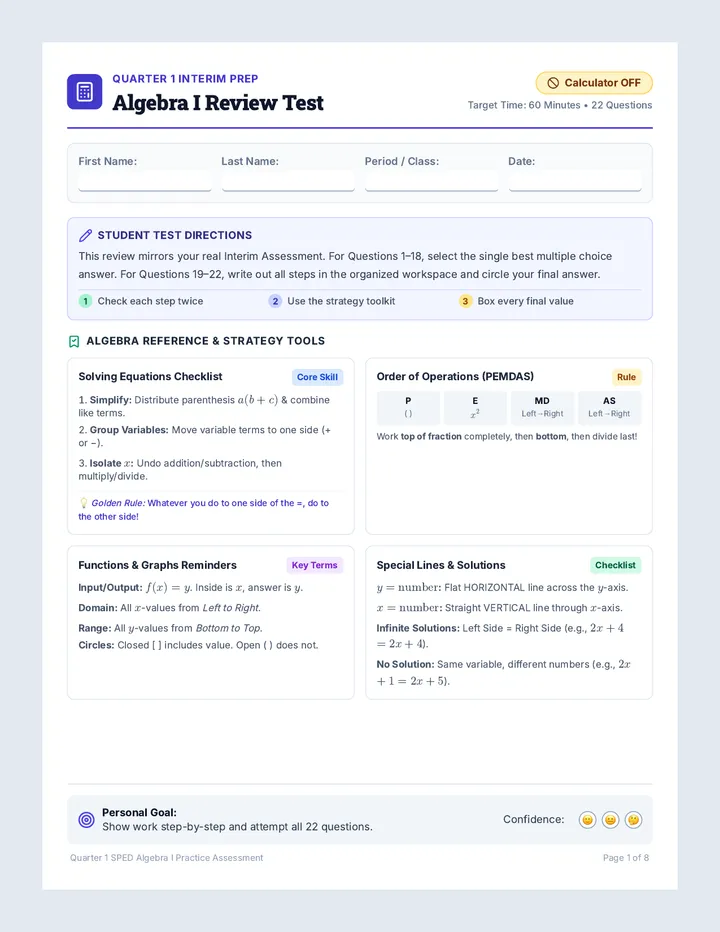
A comprehensive 8-page Quarter 1 Interim Review Assessment designed for 9th grade Special Education (SPED) Algebra 1 students, fully mirroring the 22-question assessment with built-in accommodations, reference toolkits, chunked questions, and scaffolded work spaces.

R

rubaiya.ahmed

Line Craft Worksheet

Line Craft Worksheet

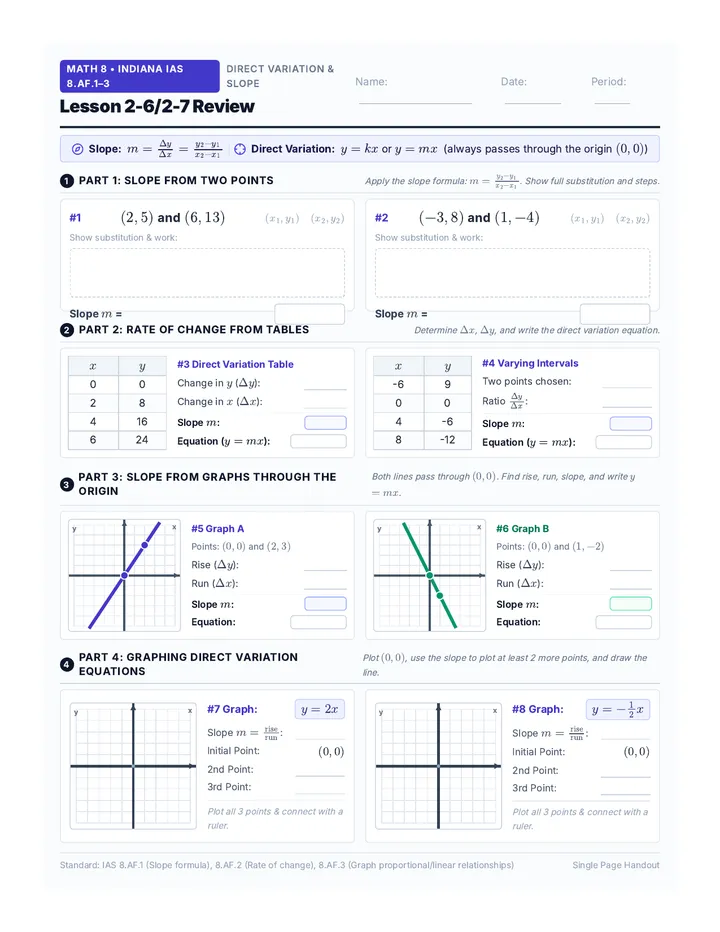
A Grade 8 review worksheet (Lessons 2-6/2-7) covering slope from ordered pairs with expanded work areas, rate of change from tables, slope from graphs through the origin, and graphing direct variation equations.

K

Kyle.Nicholson

Linear Solutions Poster

Linear Solutions Poster

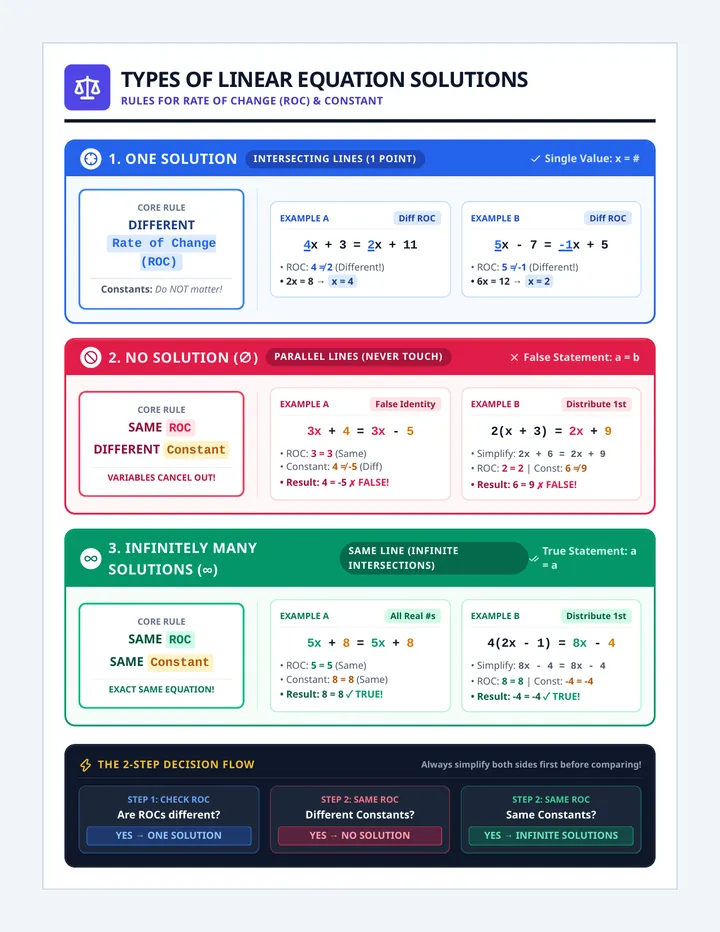
A high-contrast classroom reference poster for 8th-grade math that clearly defines the rules for determining whether a linear equation has one solution, no solution, or infinitely many solutions based on Rate of Change (ROC) and constant terms, complete with visual cues and two worked examples for each case.

CE

Clifford Ernst

Sequences

Project Mission Slides Final

Math in Motion: The 2-Hour Summit

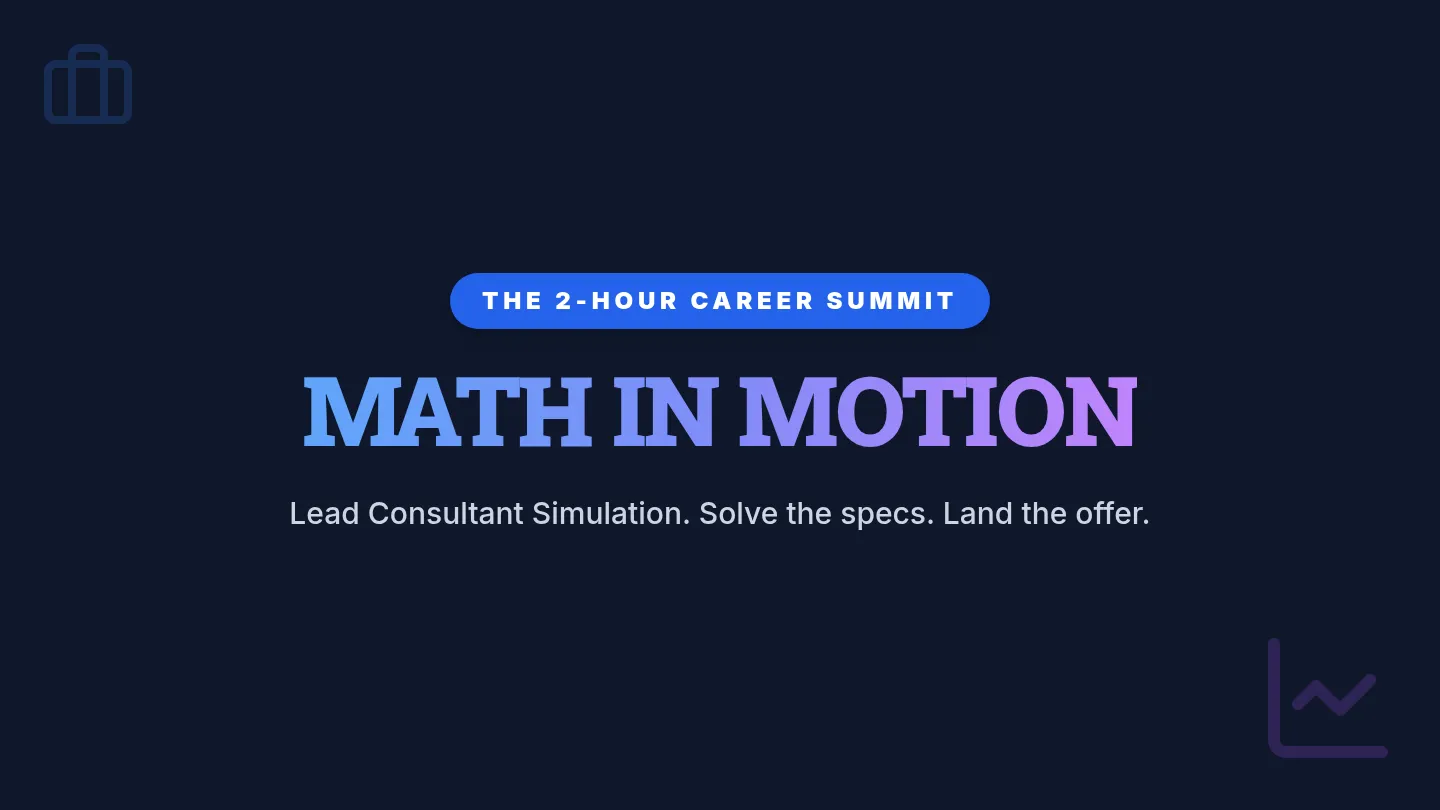
A high-intensity, 120-minute math simulation. Students act as lead consultants, completing a high-speed skill warmup before selecting a professional sector (Music, Urban Planning, Rocket Science, or Sports Analytics) to solve a series of complex work orders.

EL

Elsa LaLone

102
Trend Trackers Answer Key

Algebra Essentials Sequence

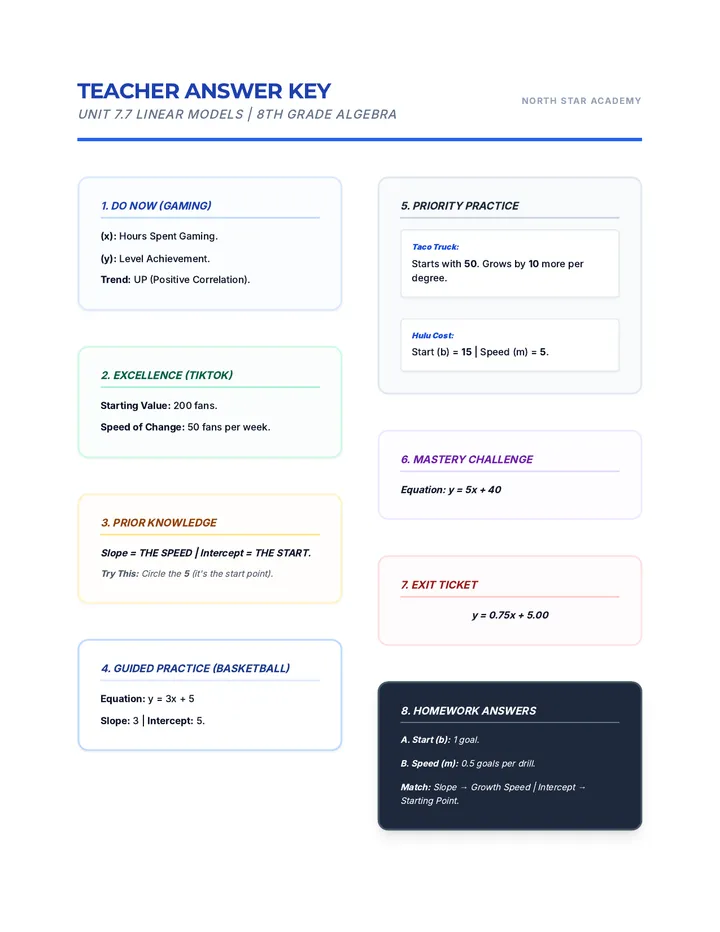
A series of 8th and 9th grade Algebra lessons focused on linear relationships and systems of equations, with a focus on SPED/IEP support.

D

deeohnny.jackson

55
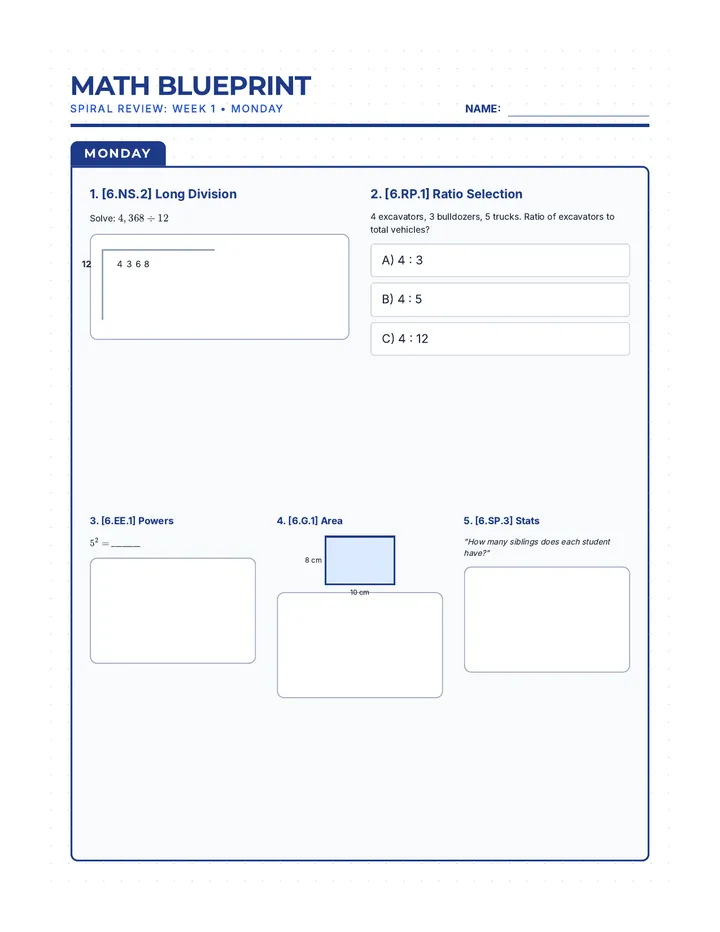
Math Blueprint Week 1 Booklet (Definitive)

Math Blueprint Spiral

A 7-week comprehensive math review sequence designed to prepare 6th-grade students for North Carolina state testing, covering Number Systems, Ratios, Expressions, Geometry, and Statistics.

MK

Michell Kisler

27
Blueprint Basics Slides

Foundational Math Builders

A foundational math sequence for special education students (grades 5-6) focusing on algebraic thinking and spatial reasoning through highly visual, themed units.

JS

Janette Sullivan

37
Inequality Blueprint Student Packet

Algebra Blueprint Series

A 5-lesson Algebra series focused on linear inequalities and systems of equations, designed for 9th-grade special education students with scaffolded instruction, visual aids, and scripted teacher guidance.

D

deeohnny.jackson

18
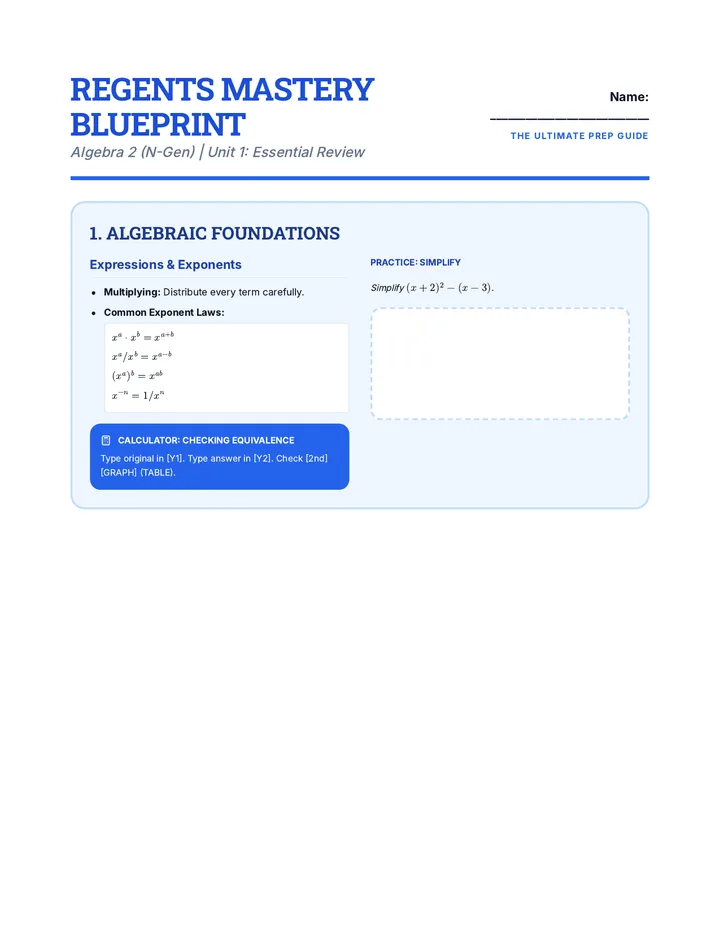
Regents Mastery Blueprint Study Guide

Regents Mastery Suite

A comprehensive review suite for the New York State Mathematics Regents exams, including Algebra 1, Geometry, and Algebra 2, featuring mastery blueprints, calculator strategies, and exam-taking tips.

KB

Kayla Borozny

15

Lessons

Version A Worksheet

Function Frontiers

This lesson covers identifying the domain and range of exponential, square root, and quadratic functions through multiple-choice practice. Students will analyze function equations to determine possible input and output values.

MR

Mahuya Roy Chowdhury

9
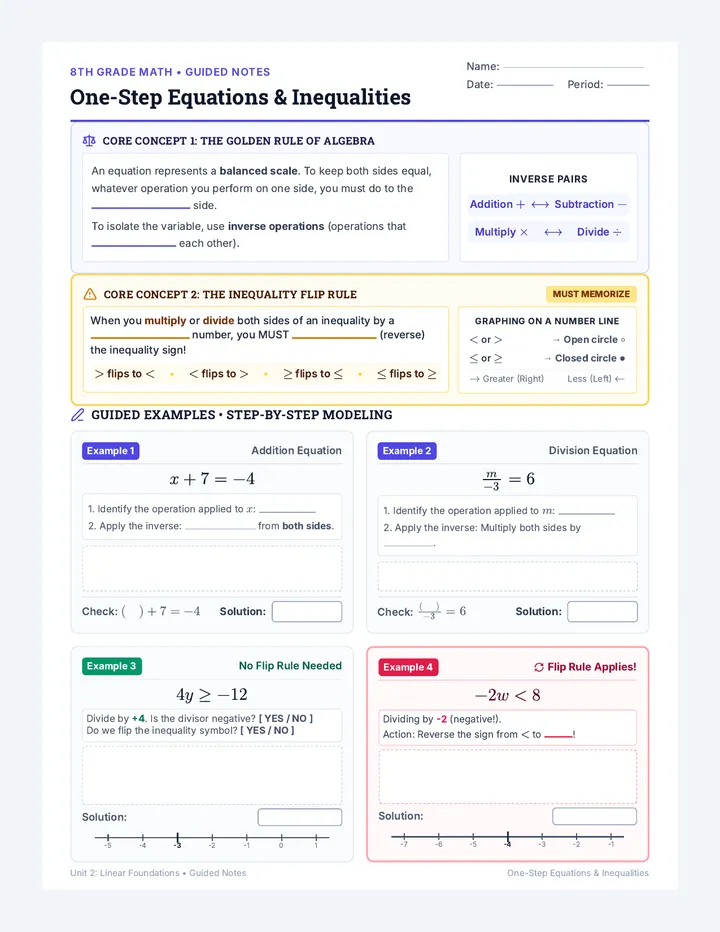
One Step Guided Notes

Balance Battles

An 8th-grade algebra unit covering foundational single-variable linear equations and inequalities, progressing from one-step operations to two-step solutions and number line graphing.

R

remenhiser

8
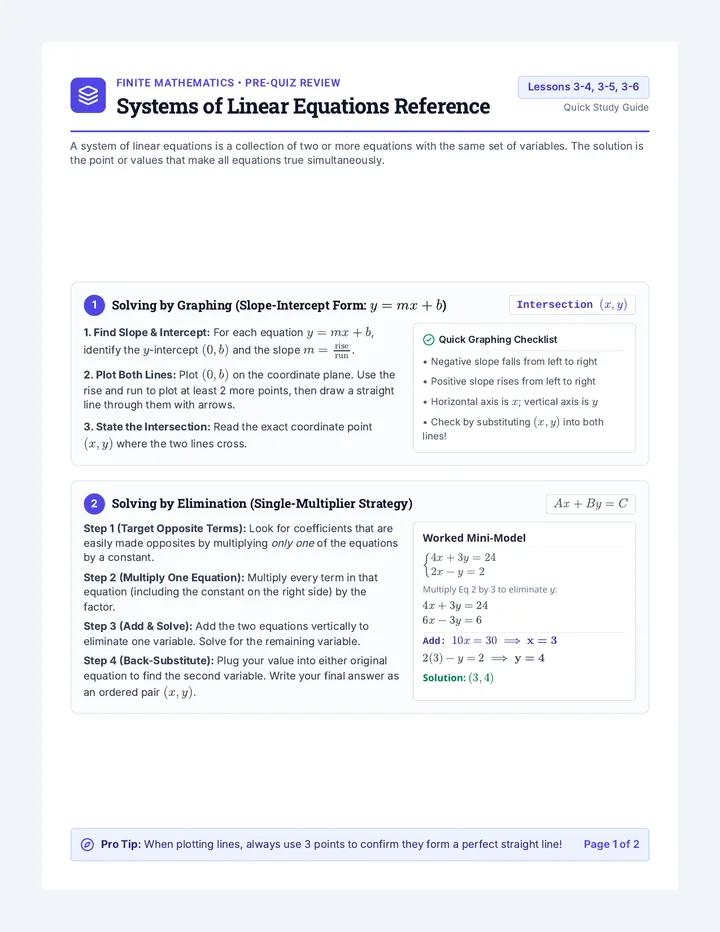
Systems Decoded Review Handout

Systems Decoded

A comprehensive finite mathematics unit covering systems of linear equations via graphing, substitution, elimination, and augmented matrices with Desmos rref calculation, including applied real-world modeling.

RB

Ronald Berg

7
Unit 2 Test Student Copy

Grid and Graph Mastery

A comprehensive 9th-grade assessment lesson covering coordinate geometry, functions, slope, and graph interpretation through review, testing, and reflection.

KC

Kris Coyne

6
SAM Podcast Parent Briefing Guide

SAM Podcast PBL Launch

A comprehensive introductory lesson set for the SAM Podcast Project-Based Learning program. This lesson incorporates critical parent communication tools alongside specialized teacher lesson plans linking core academic subjects like KSSM Mathematics to real-world digital podcast applications.

AM

Arrthy Muthamilselvan

14
Forensic Lab Lesson Plan

Is it a Function

This lesson introduces 9th-grade students to the concept of functions and relations, focusing on how to visually identify a function using the vertical line test. Students will learn a practical skill for analyzing graphical representations in mathematics, preparing them for more complex algebraic concepts.

KC

Kris Coyne

7