A targeted intervention sequence focused on compound probability, designed for small groups to master sample space construction and simulations.
A master sequence containing curriculum-aligned lessons for Malaysian secondary school students. It covers Form 5 Mathematics and Form 2 English UASA revision.
A quick and engaging 15-minute warm-up for 7th-grade students to bridge the gap between vacation and the classroom by identifying real-world math applications in their own lives.
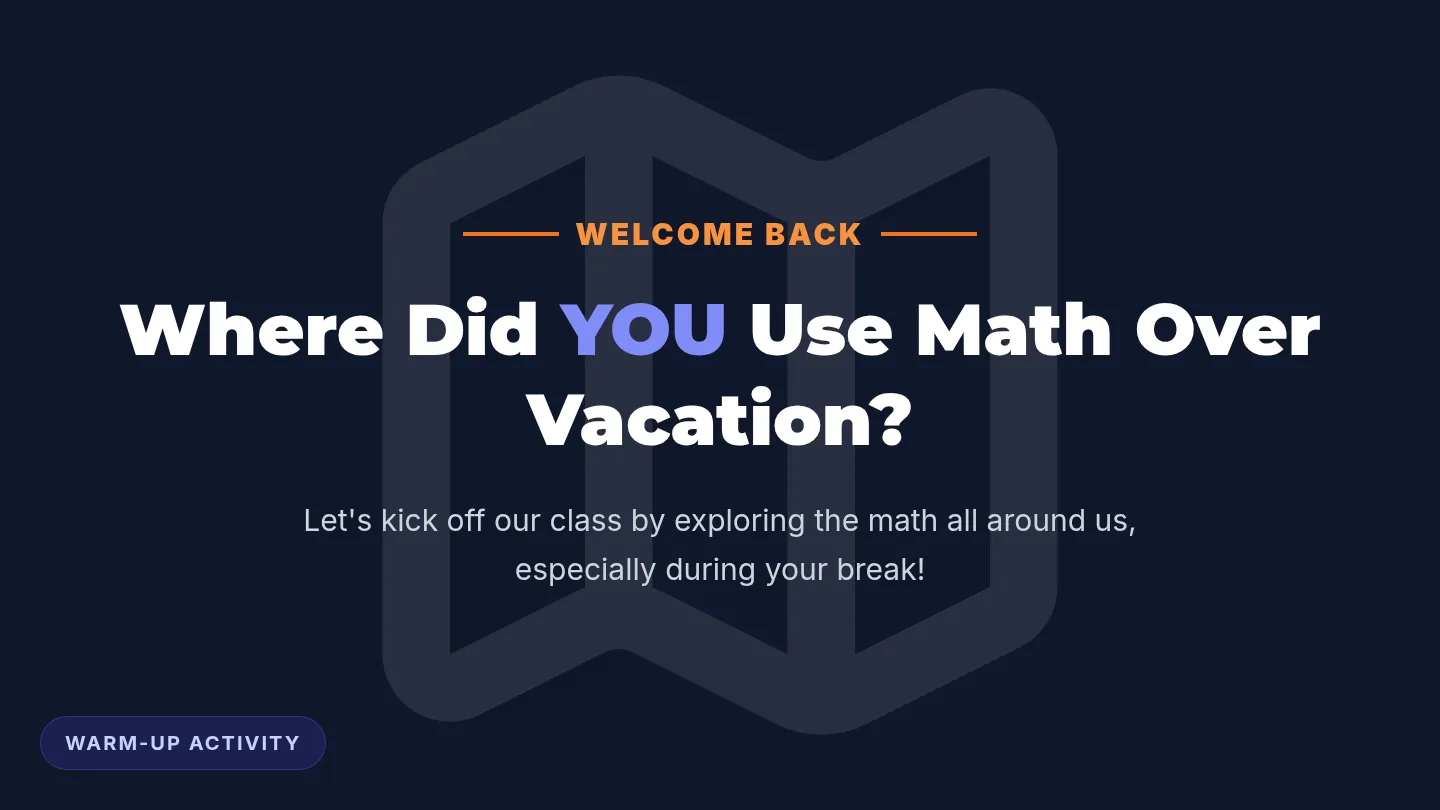
A visual presentation to guide the class through the Vacation Math Warm-Up, featuring categories, brainstorming prompts, and sharing examples.
Séquence clé en main sur le module de chimie « Comment caractériser une solution ? » du programme de Seconde Bac Pro, contextualisée dans l'univers de la marine et de l'analyse des eaux.
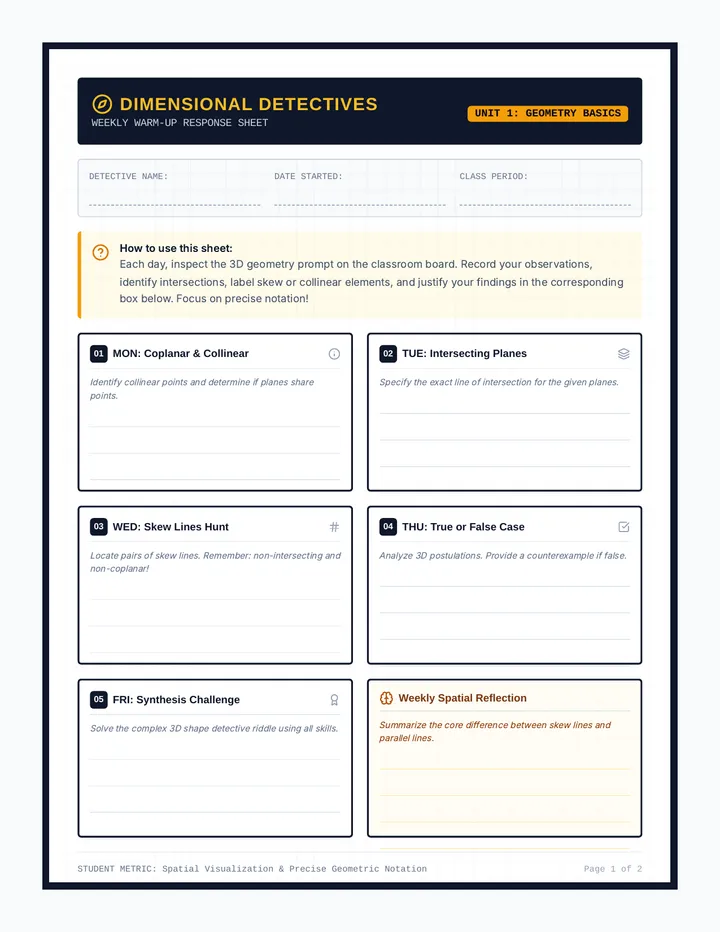
A geometry lesson focusing on visualizing 3D relationships, including intersecting planes, collinear points, coplanar lines, and skew lines in space. Includes projection-ready slide decks, task cards, and a weekly response sheet.
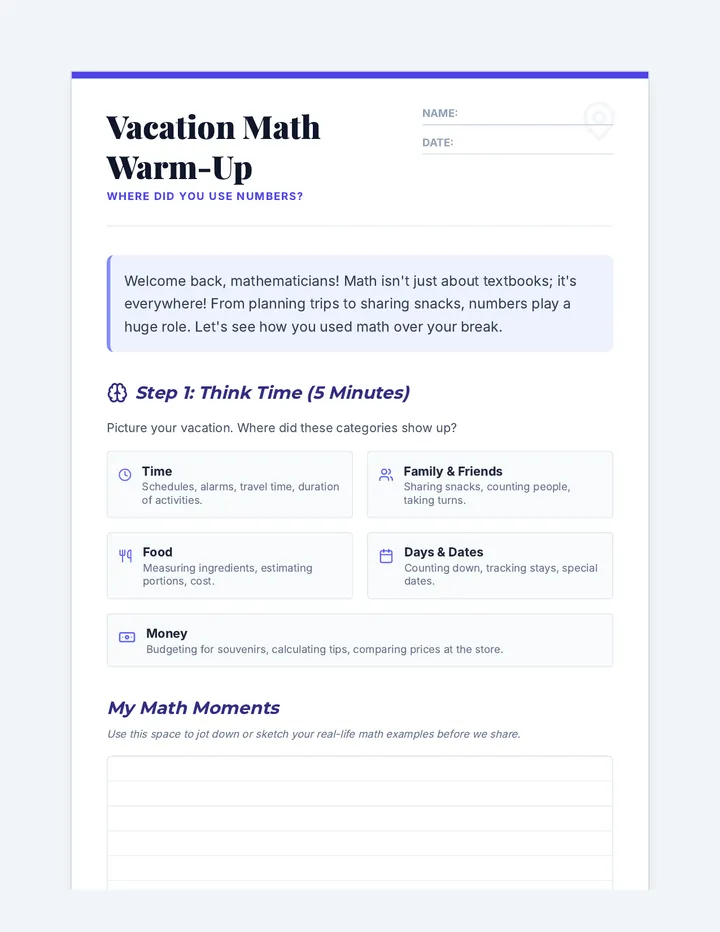
A student-facing handout designed to guide 7th graders through identifying and visualizing real-world math applications from their vacation.
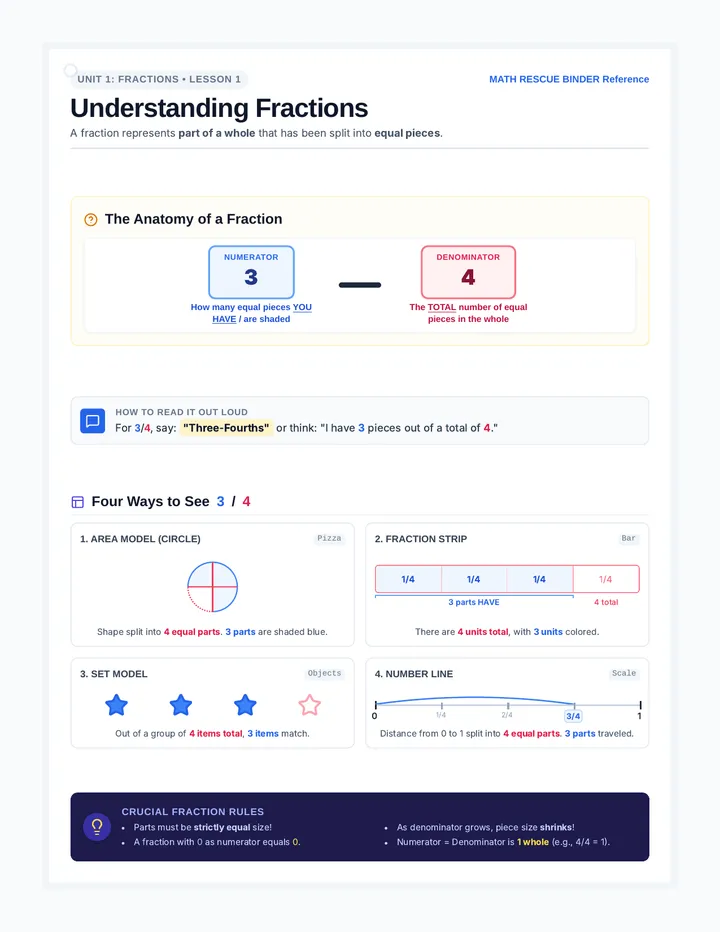
An intensive high-school math intervention binder focused on rebuilding foundational rational number operations, equivalent representations, and visual modeling for resource room or co-taught classrooms.
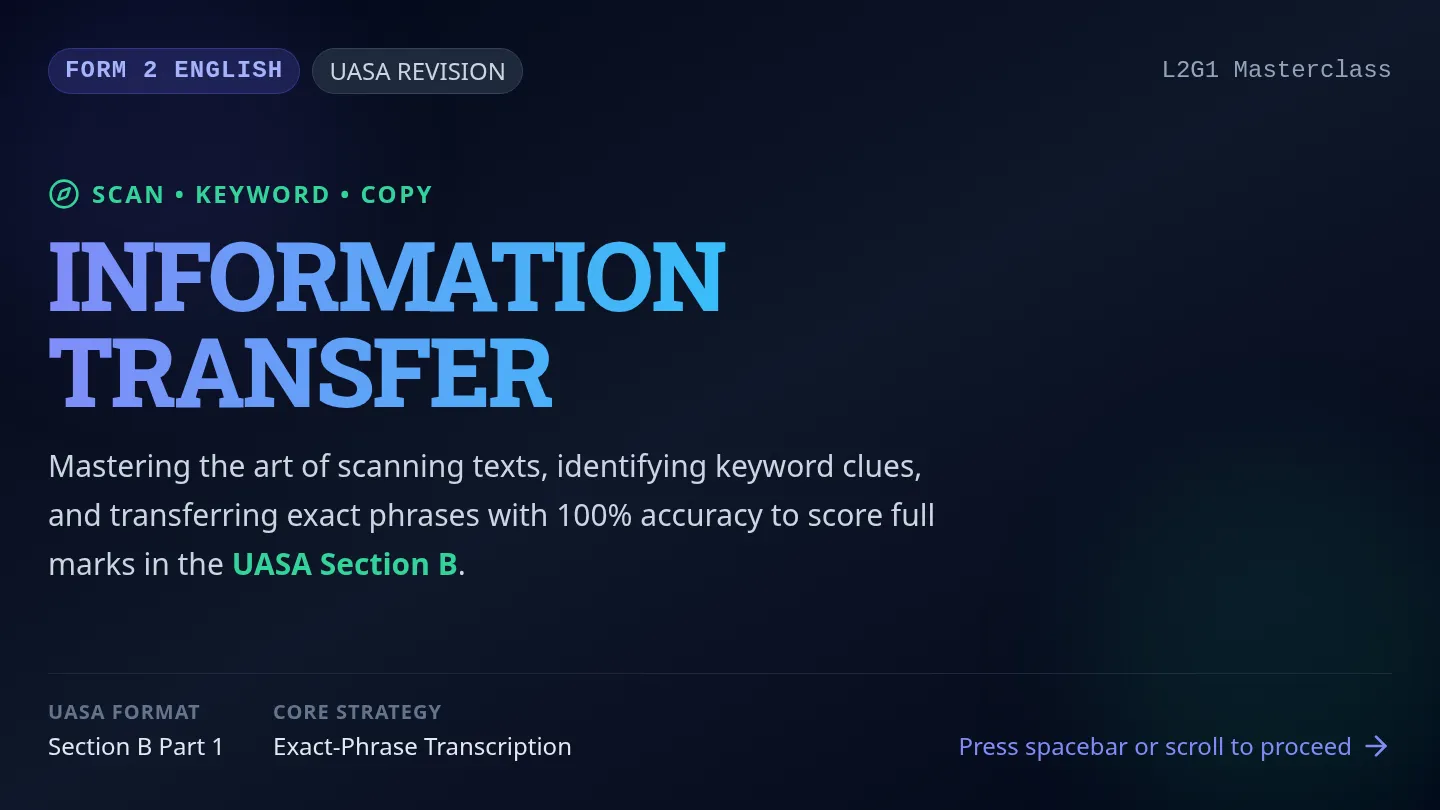
Form 2 English lesson focusing on the UASA Information Transfer format. Teaches scanning, keywording, and exact-phrase transcription strategies through real-world texts, hands-on graphic organizers, peer collaboration, and a post-lesson assessment.
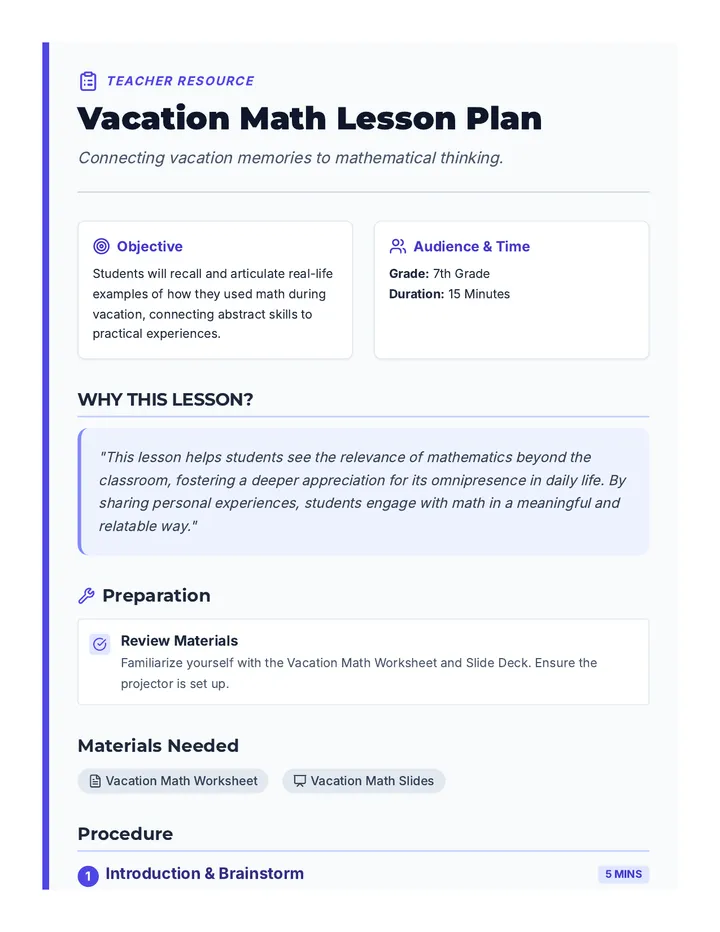
A concise lesson plan for teachers to facilitate the Vacation Math Warm-Up, including instructional steps, discussion questions, and pacing guides.
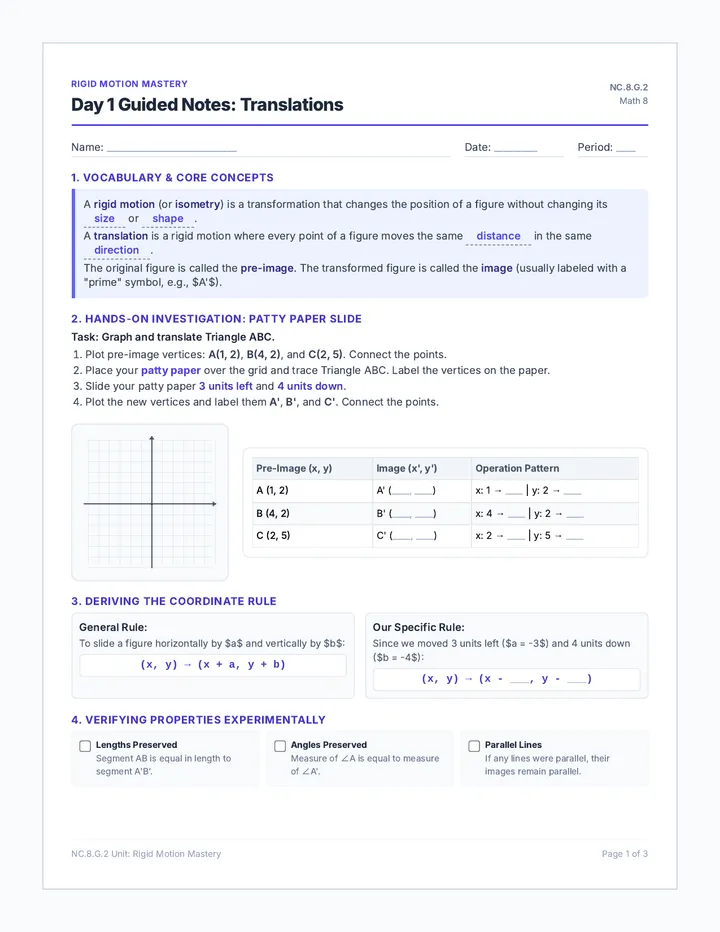
A 10-day instructional unit on rigid transformations and congruence mapping for 8th-grade mathematics, aligned with NC Math Standard 8.G.2. The sequence covers translations, reflections, and rotations, emphasizing coordinate rules, properties verification using patty paper, and composition of transformations to define and prove congruence.
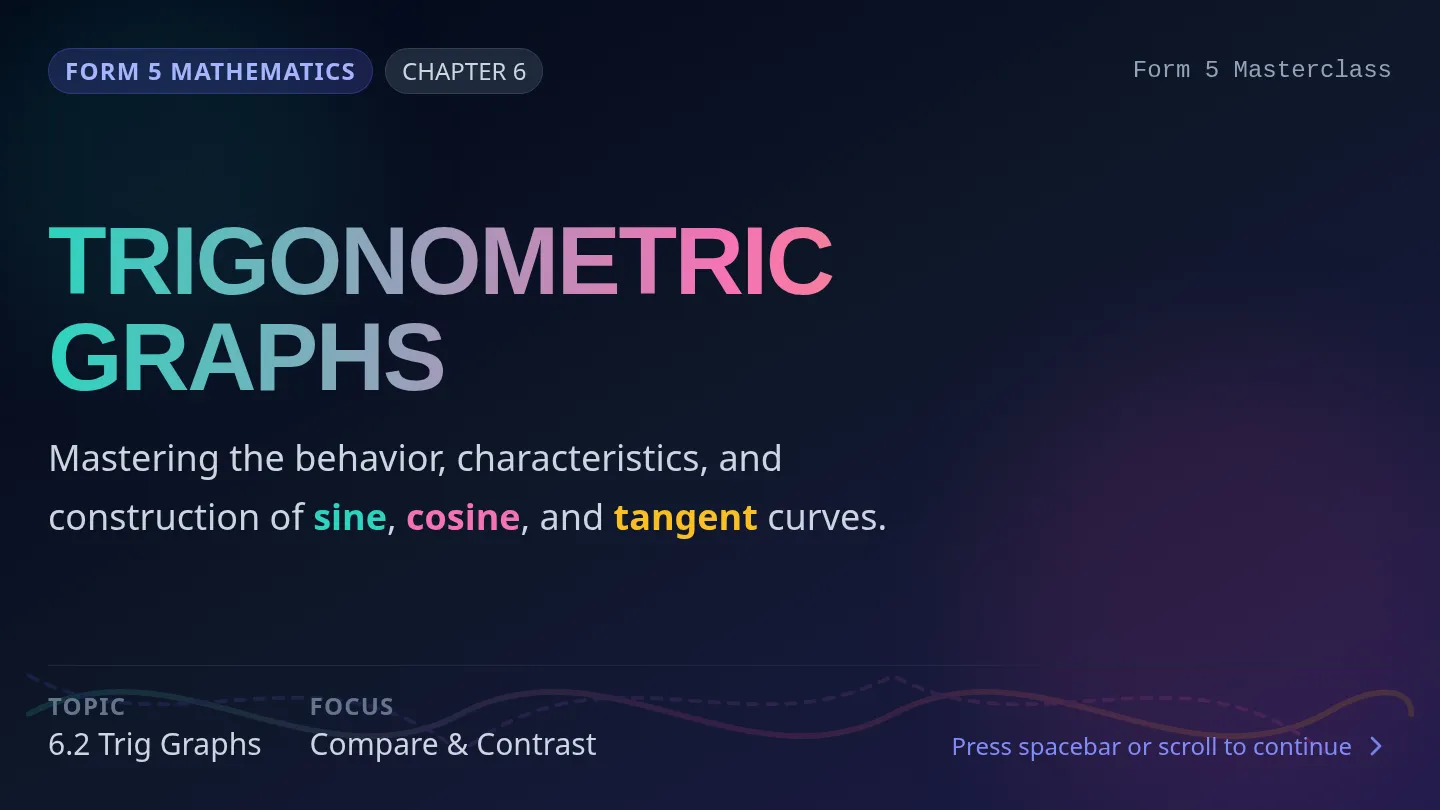
Form 5 Mathematics Lesson on trigonometric functions, covering graphing of sine, cosine, and tangent curves, exploring key features like amplitude, period, intercepts, and asymptotes. Includes assessment for learning, collaboration, and differentiated instruction.
A daily visual slide deck designed for front-of-class projection, guiding students through one-to-two high-contrast prompt slides for each day of the week, complete with beautifully scaled, large geometric 3D diagrams and strict adherence to 24px+ legibility.