A high school statistics intervention sequence focused on decision-making through expected value calculations. Students learn to construct payoff tables, assign probabilities, and compare outcomes in real-world scenarios.
A 15-day Texas Algebra 1 EOC test preparation program designed for non-math teachers to facilitate vocabulary mastery and high-yield readiness standard practice.
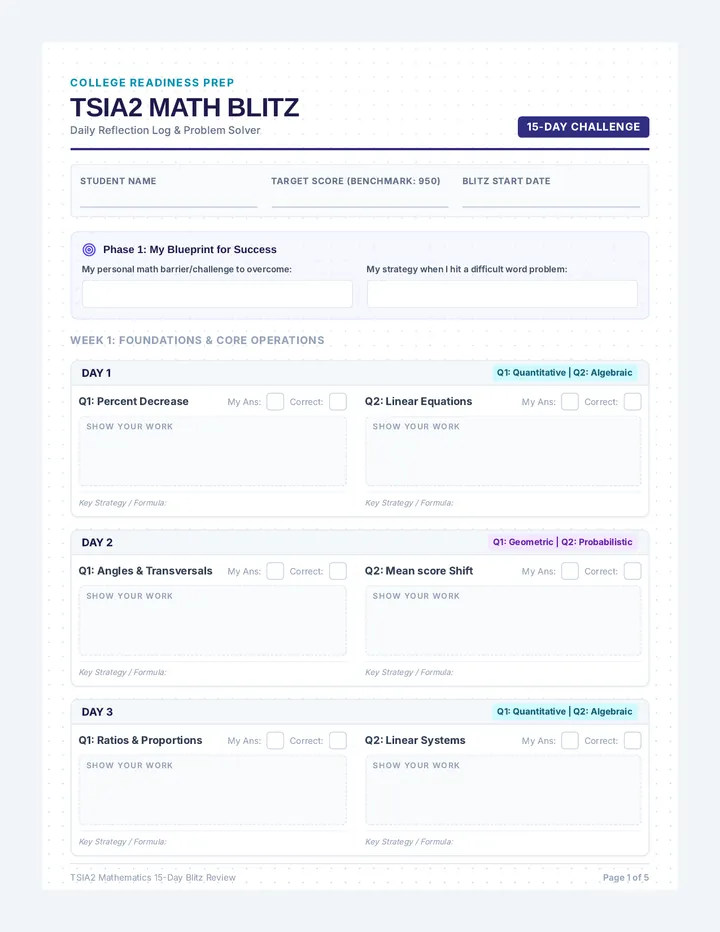
A comprehensive 15-day review program for the TSIA2 mathematics assessment, featuring daily high-yield questions covering all four core areas (Quantitative, Algebraic, Geometric, and Probabilistic reasoning) alongside a structured student tracking and reflection log.
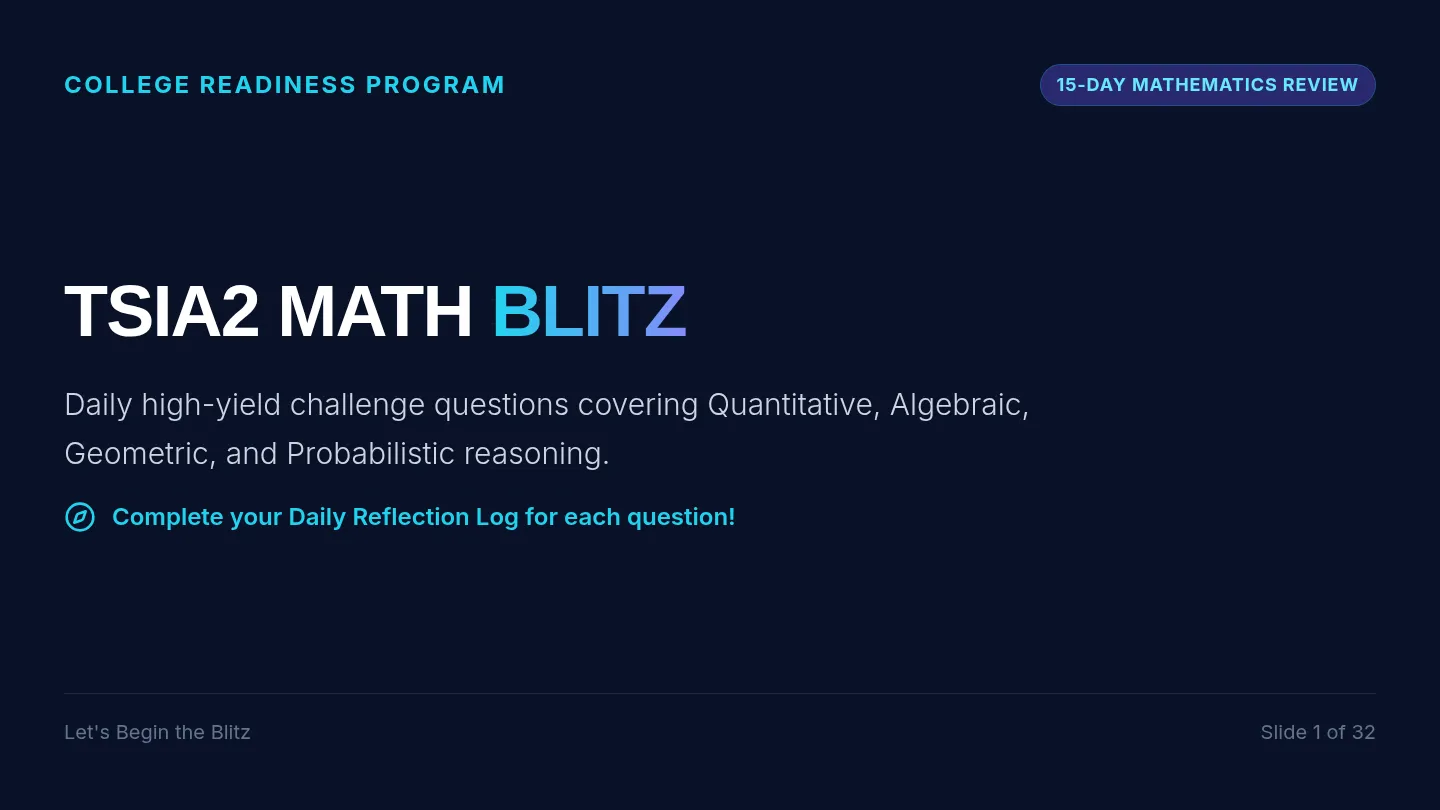
A 32-slide presentation containing a 15-day TSIA2 Math Blitz. Each day features two high-yield exam-style questions spanning Algebraic, Quantitative, Geometric, and Probabilistic reasoning, with corresponding blueprint-style hint, key, and step-by-step solutions slides.
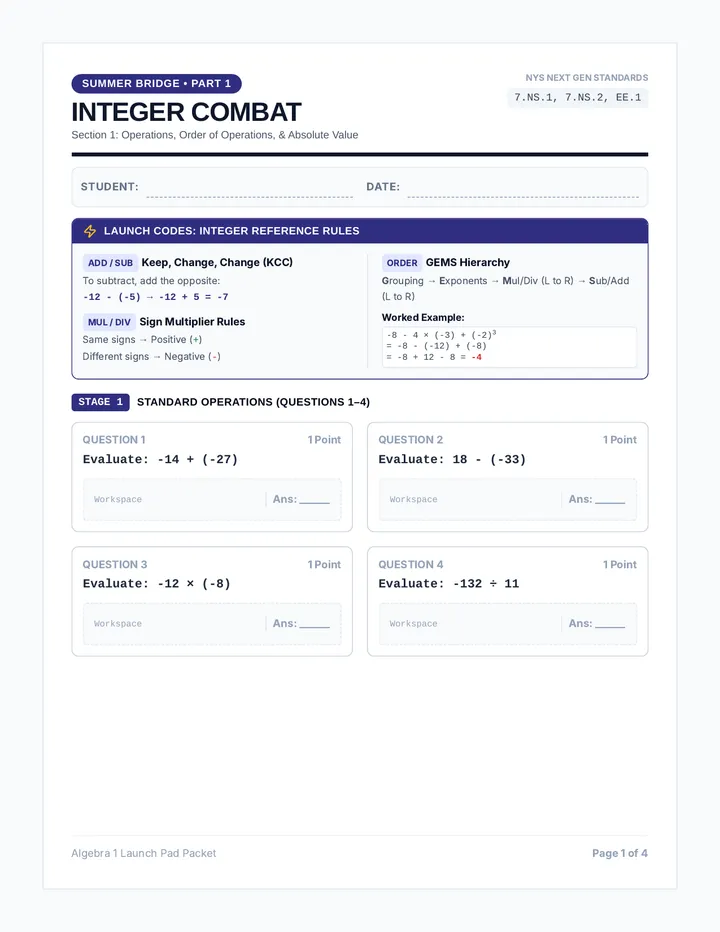
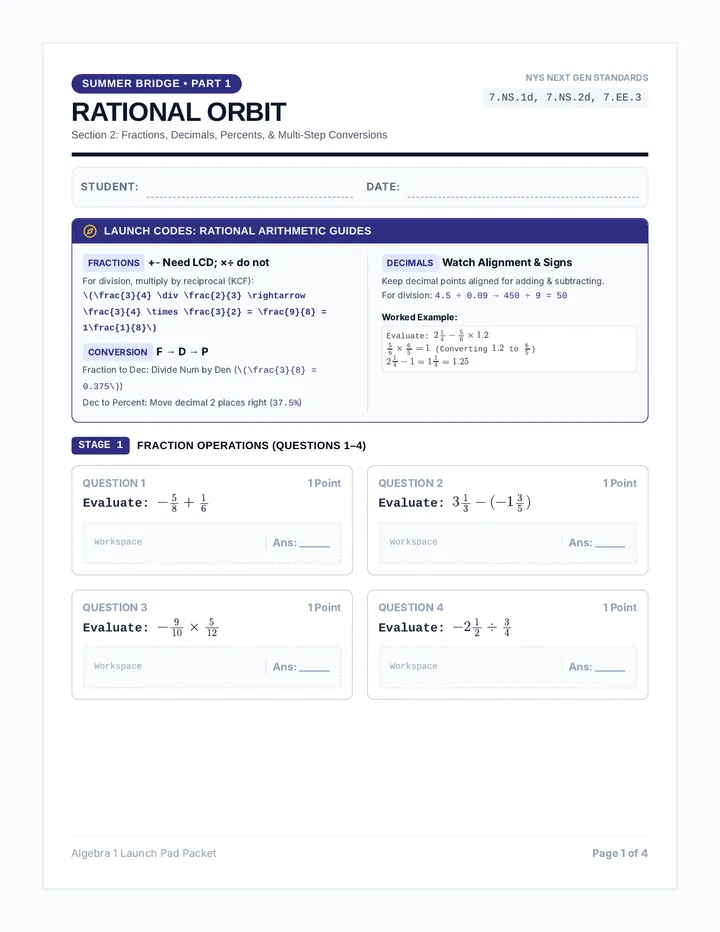
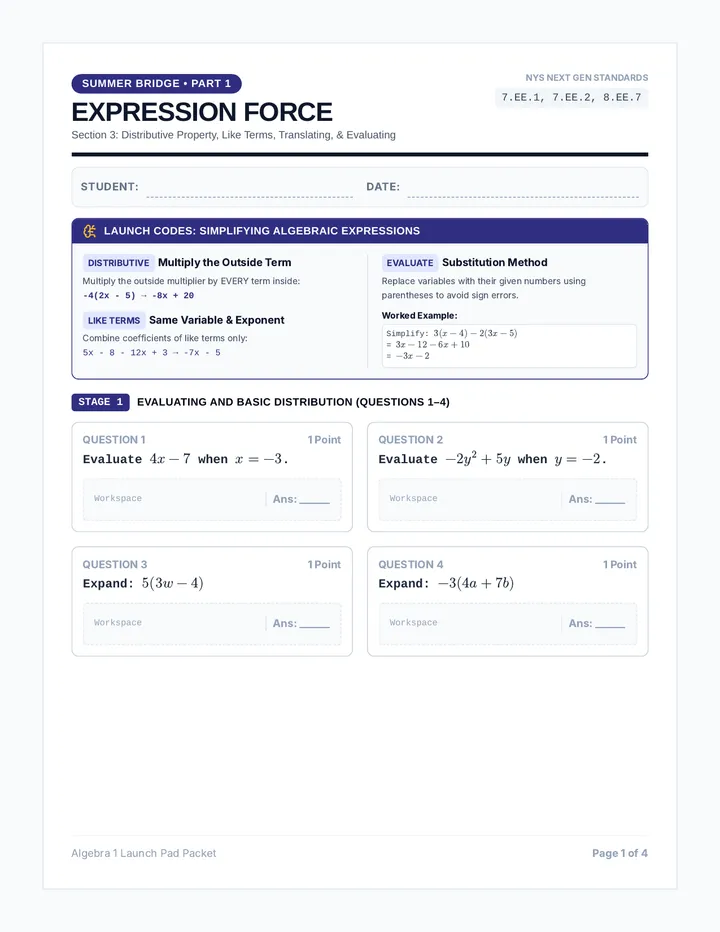
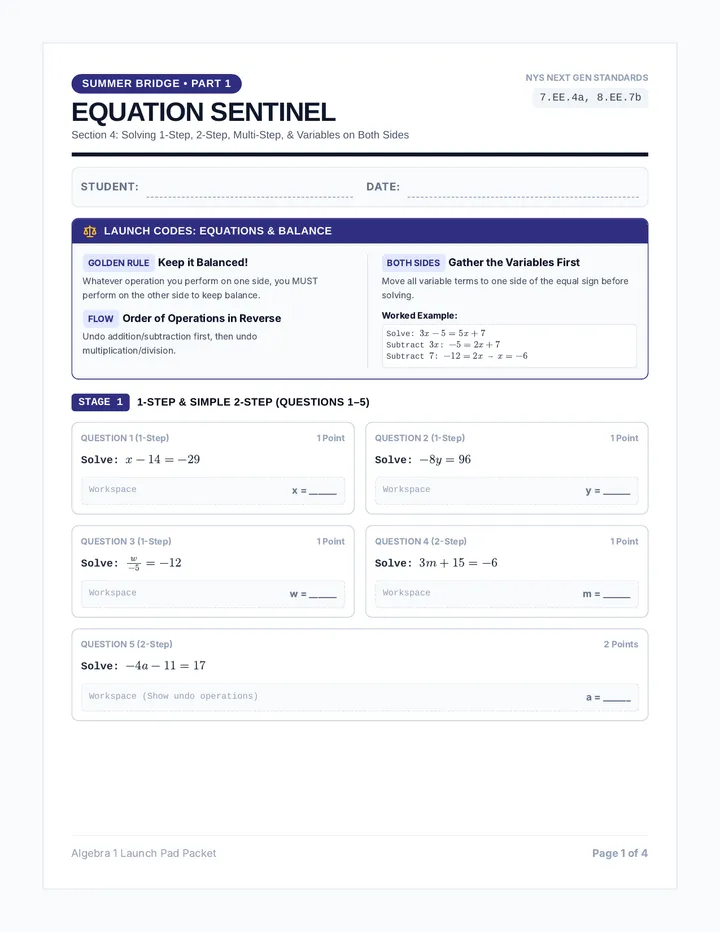
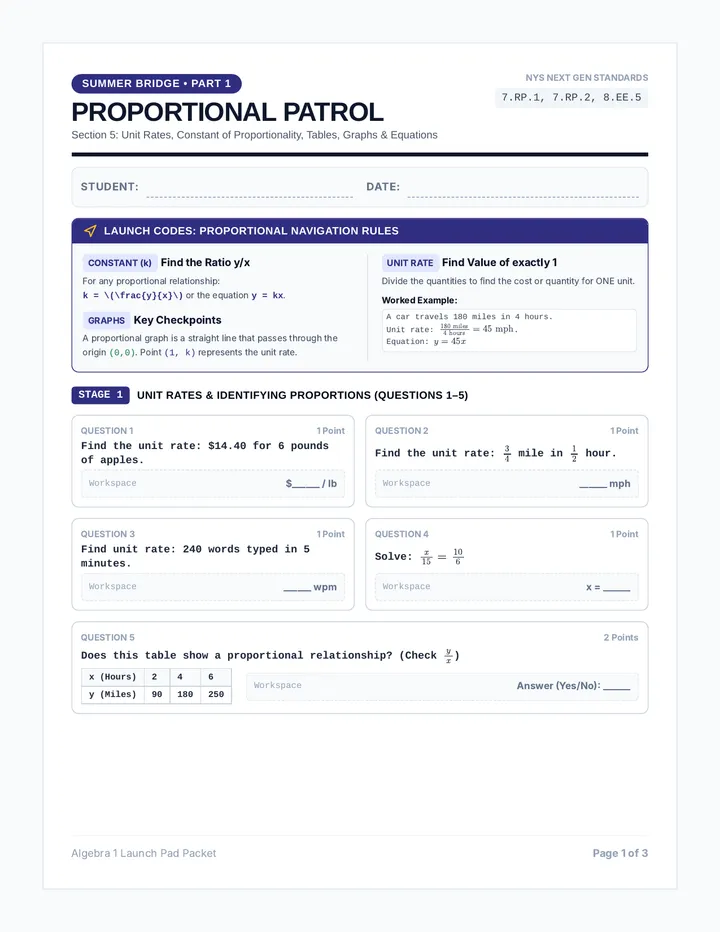
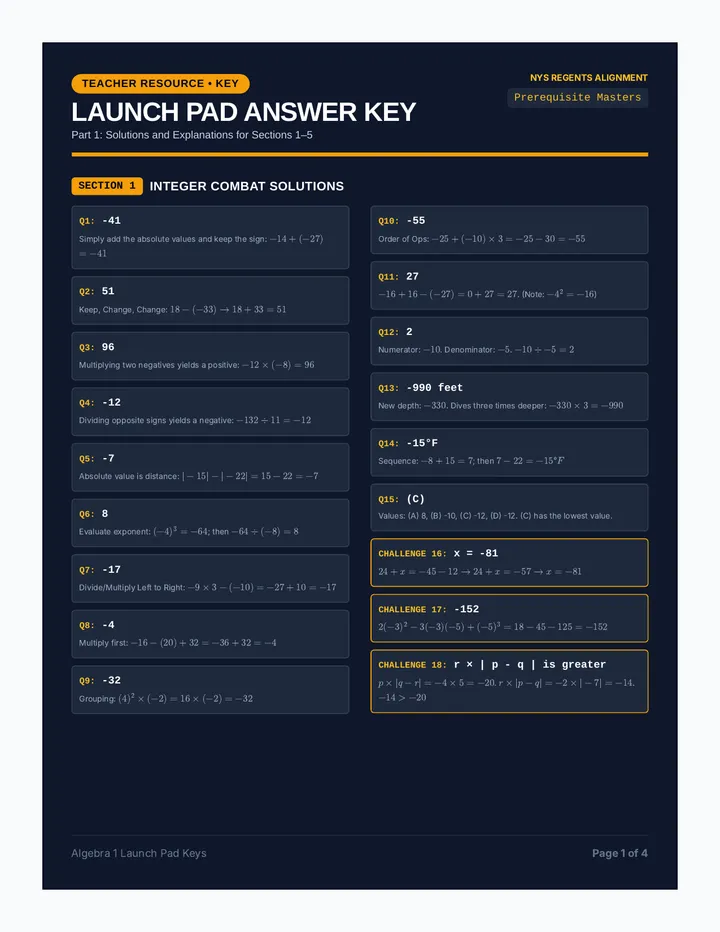
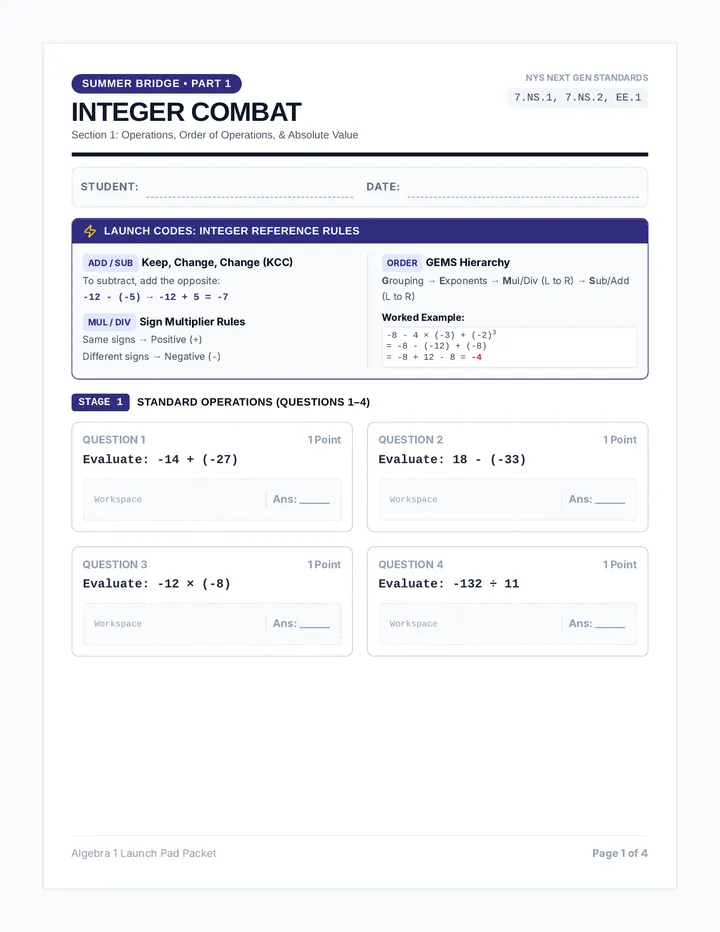
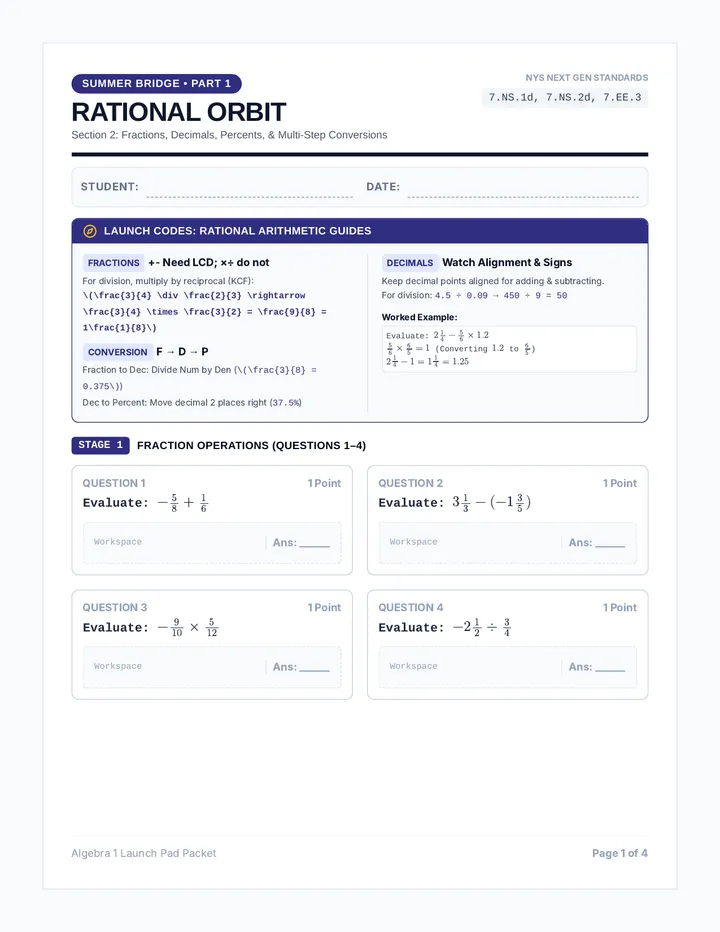
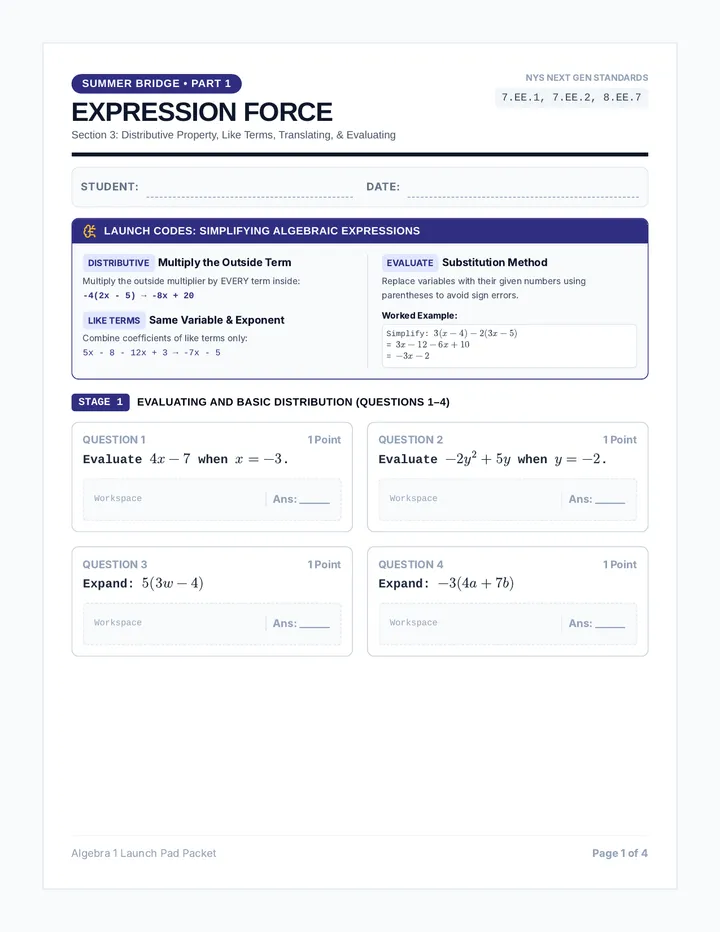
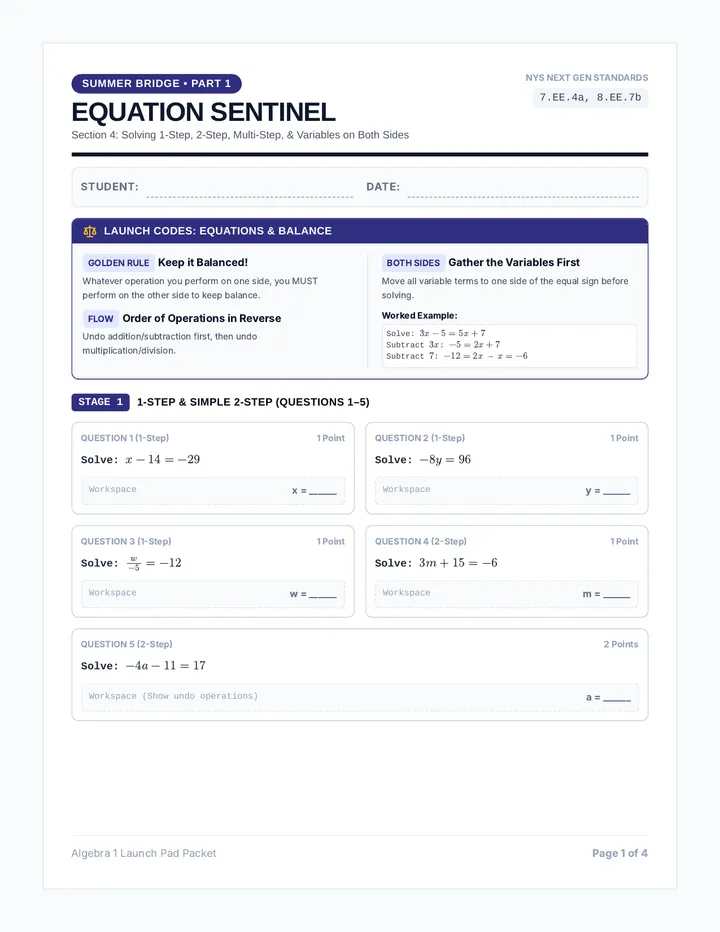
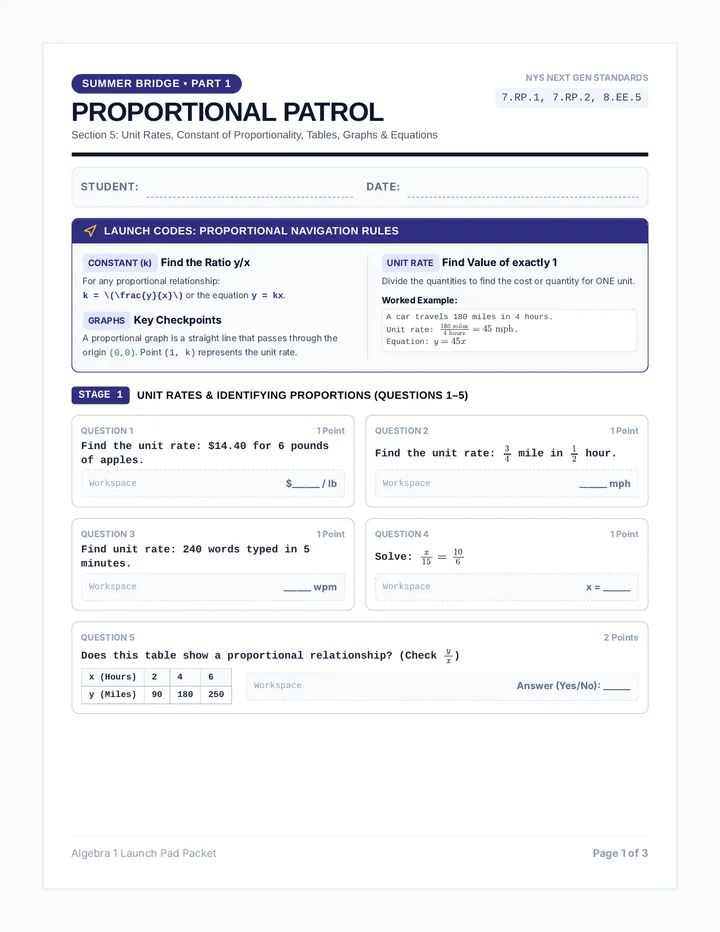
A comprehensive summer bridge workbook for rising 8th graders transitioning to Algebra 1. Contains review of prerequisite topics, advanced pre-algebra skills, real-world application, and an Algebra Escape Challenge.
The core 15-day test prep lesson consisting of highly visual, self-contained slides, a comprehensive student work-packet, and an easy-to-use teacher facilitation guide designed for non-math specialists.
A 5-page daily student reflection and worksheet log for tracking TSIA2 mathematics questions, strategies, and progress. Features targeted entry fields for the 15-day blitz, dedicated visual workspace grids for student handwriting, personal goal-setting, and a final readiness checklist.
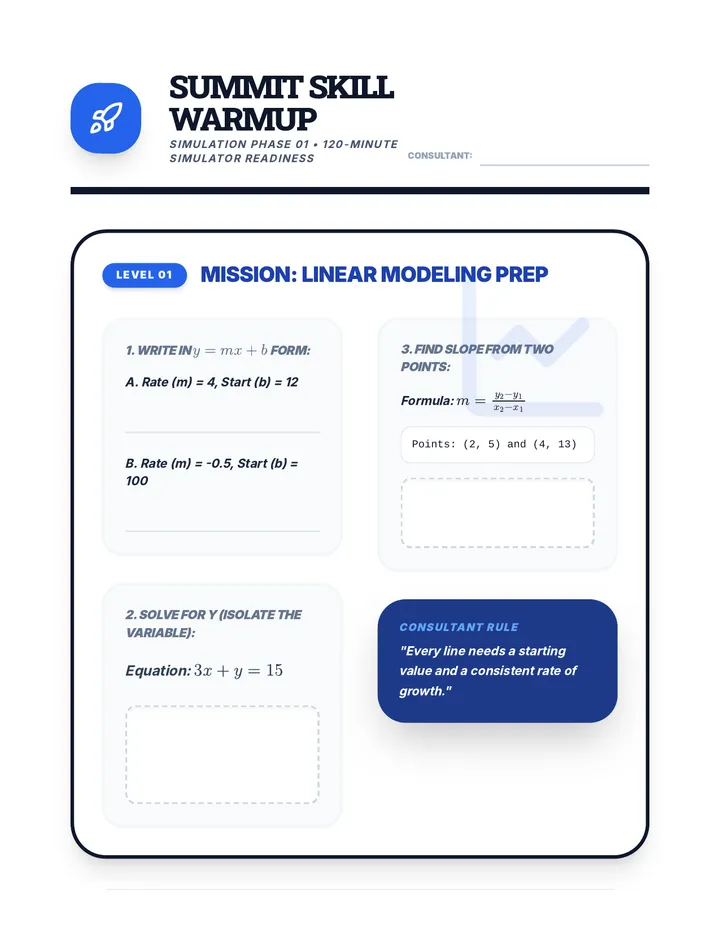
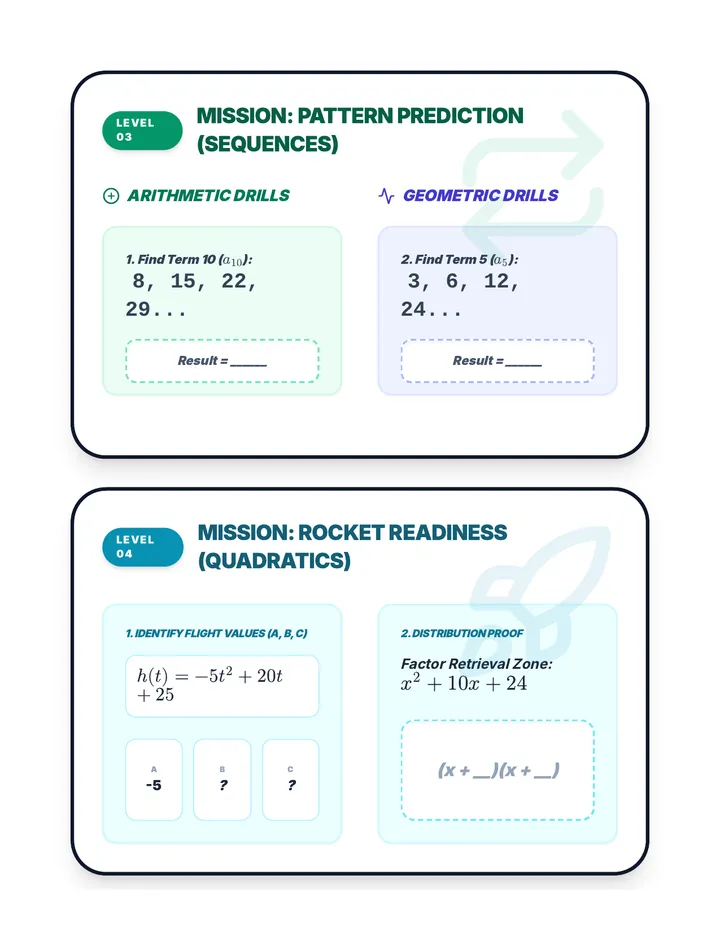
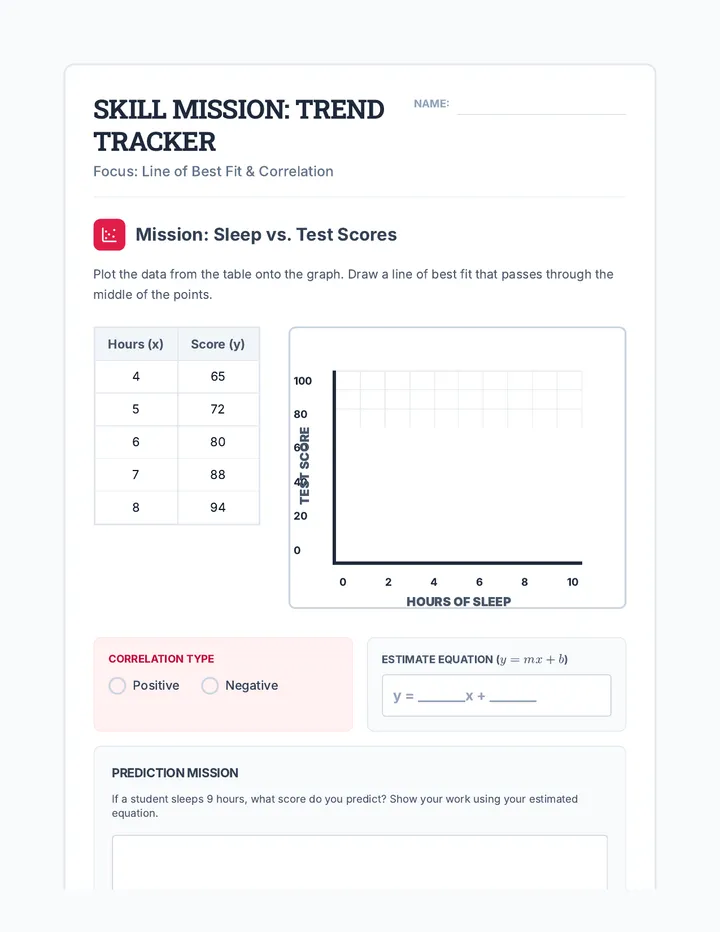
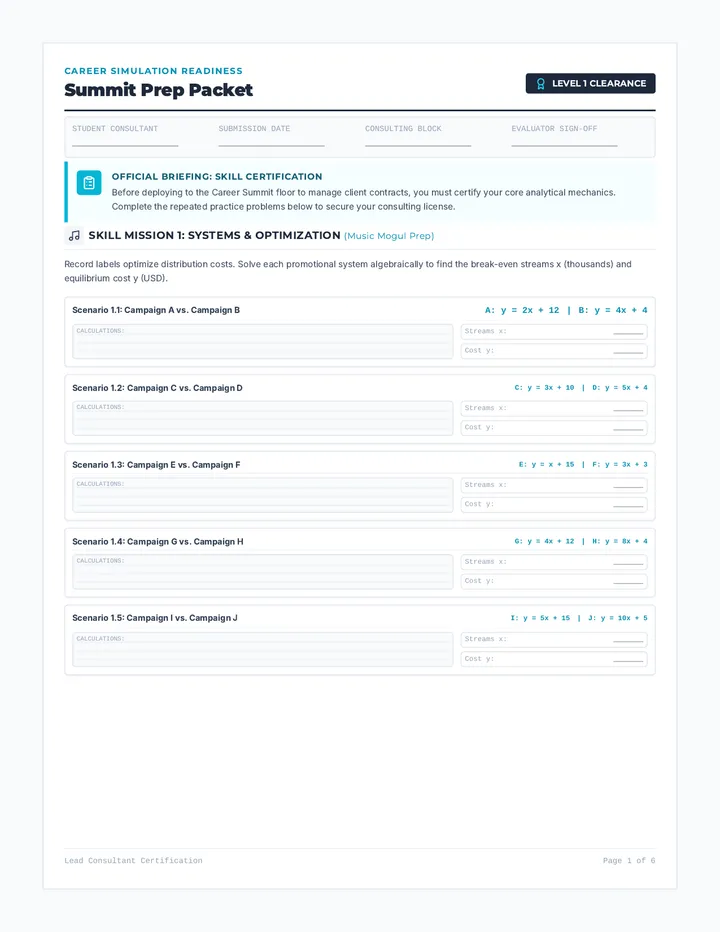
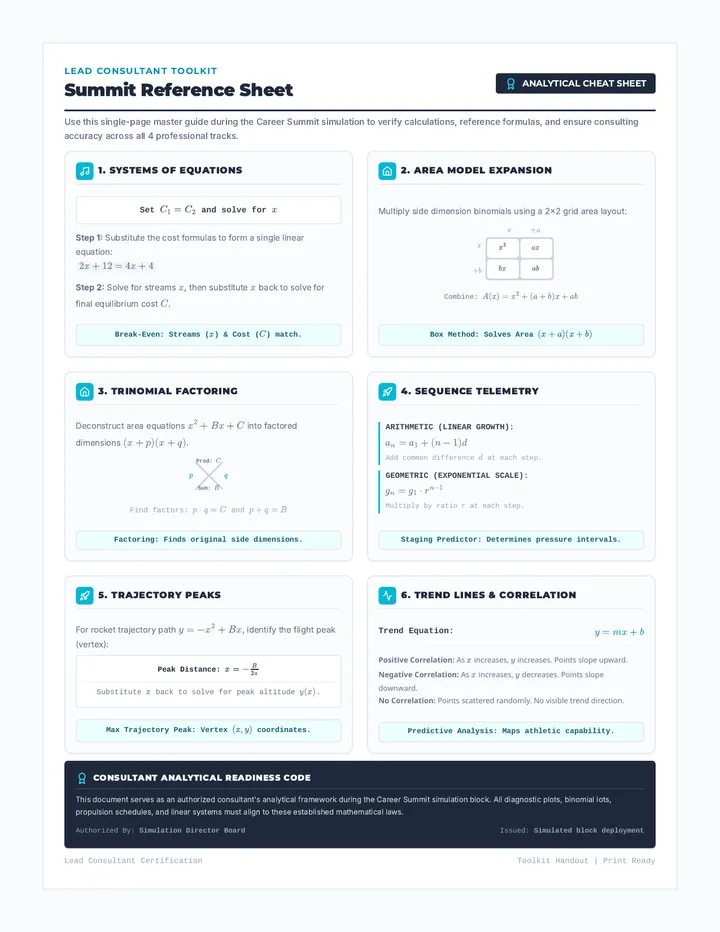
A high-intensity, 120-minute math simulation. Students act as lead consultants, completing a high-speed skill warmup before selecting a professional sector (Music, Urban Planning, Rocket Science, or Sports Analytics) to solve a series of complex work orders.
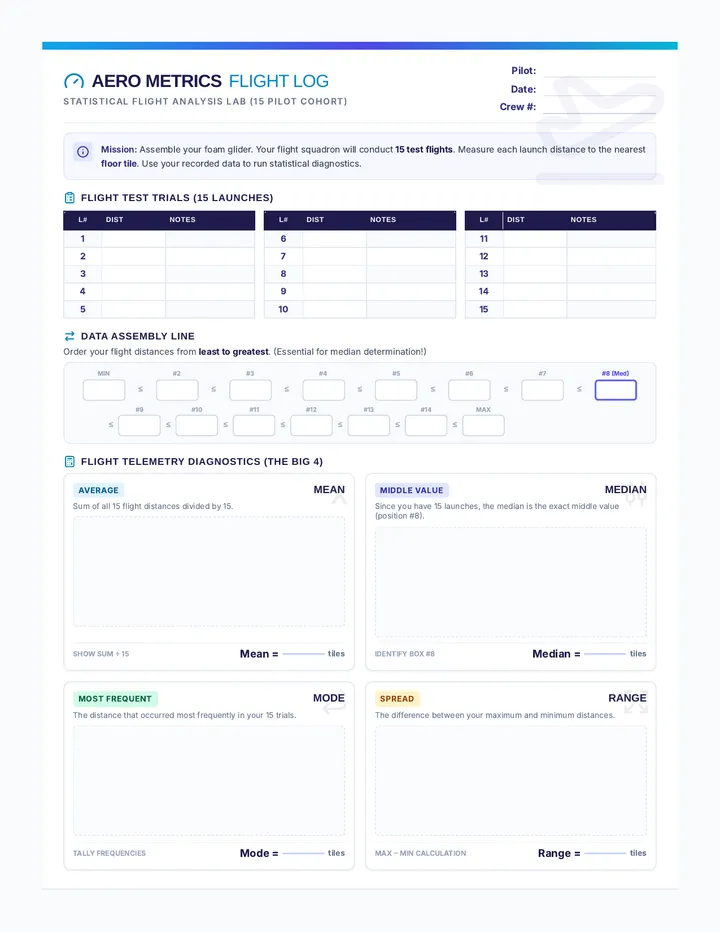
A hands-on flight science and math lesson where students construct foam gliders, conduct flight test trials measured in floor tiles, and analyze their data to calculate mean, median, mode, range, and investigate outliers.
A 31-slide comprehensive presentation deck containing a daily warm-up question, math vocabulary prompt, and detailed explanations with hints for 15 days of Texas Algebra 1 EOC prep.
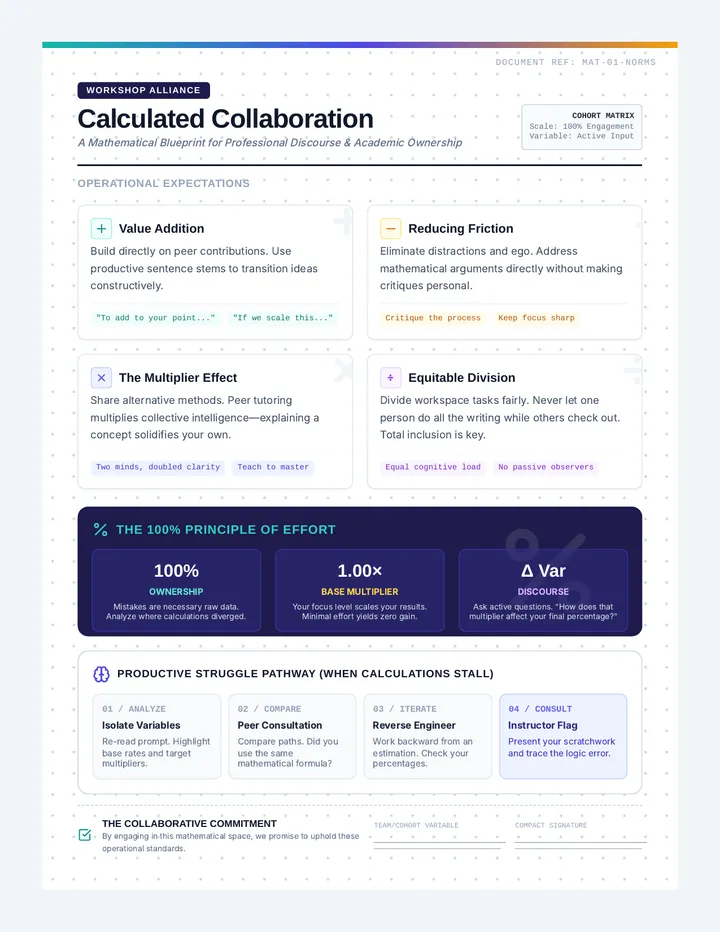
An introductory framework establishing professional collaboration, mathematical ownership, and productive struggle protocols in the high school math classroom.
A 2-page instructional guide for non-math teachers detailing class facilitation techniques, math vocabulary prompts, and a full day-by-day rapid-response answer key.