An 8-slide presentation introducing the 1/3 relationship between tapered solids and their corresponding prisms/cylinders, the formula V=1/3Bh, and the use of the Pythagorean theorem to find vertical height.
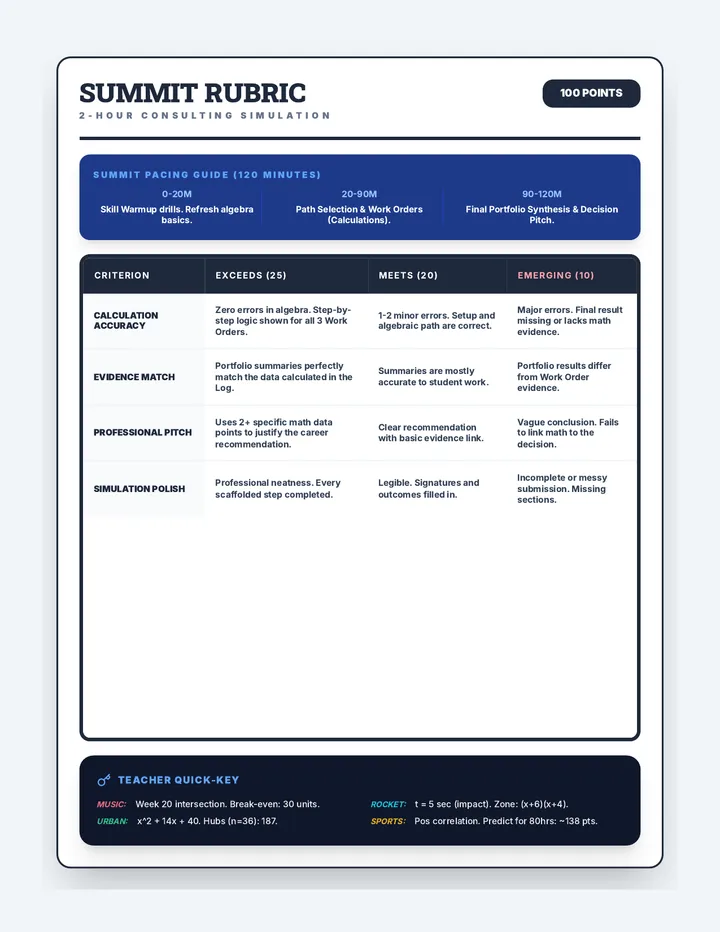
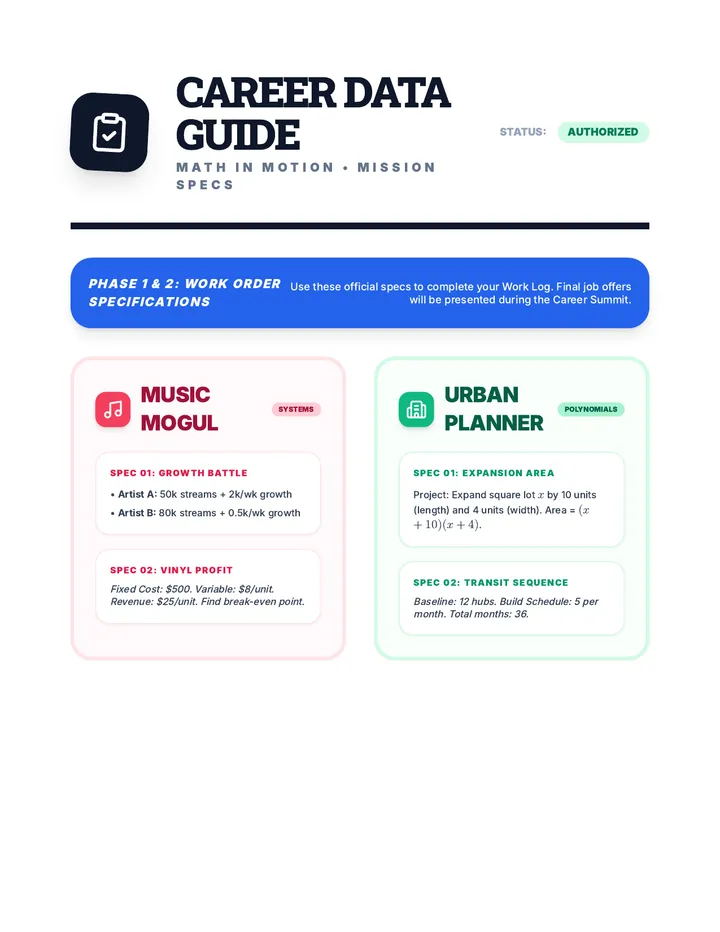
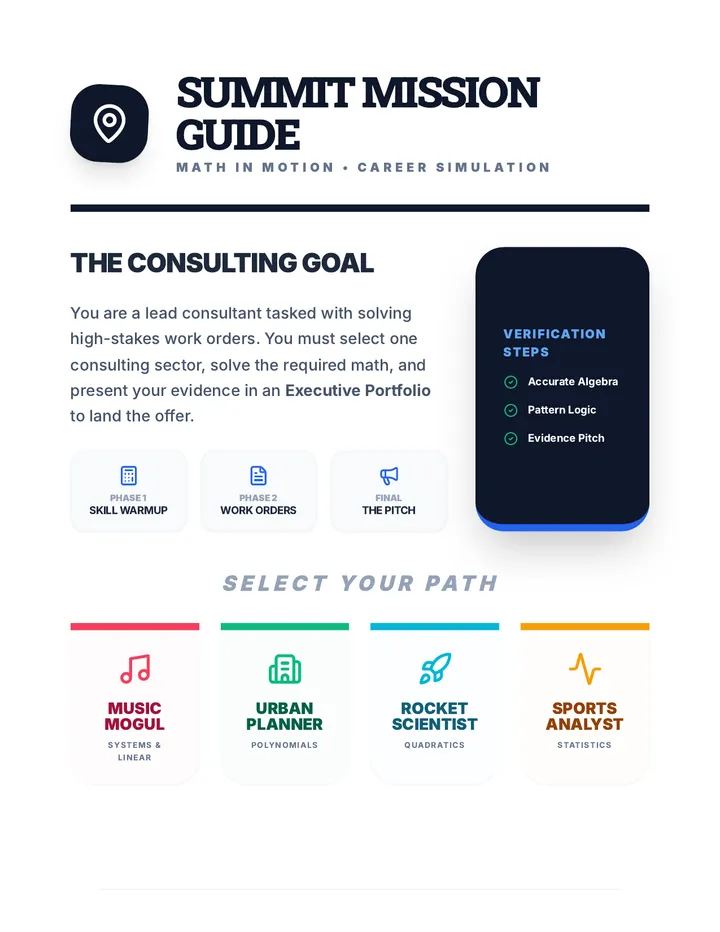
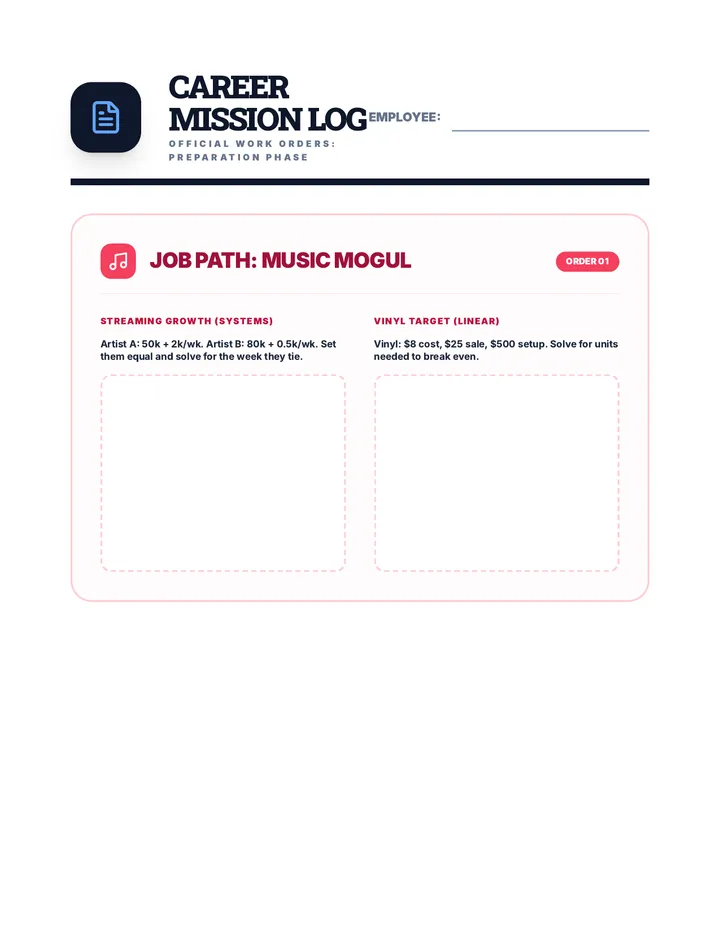
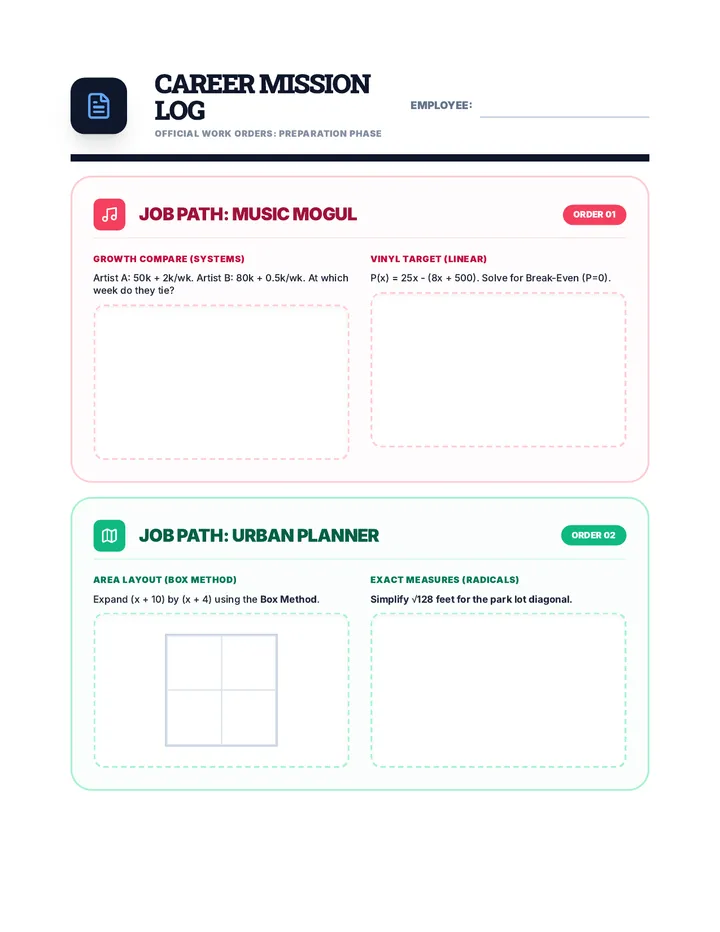
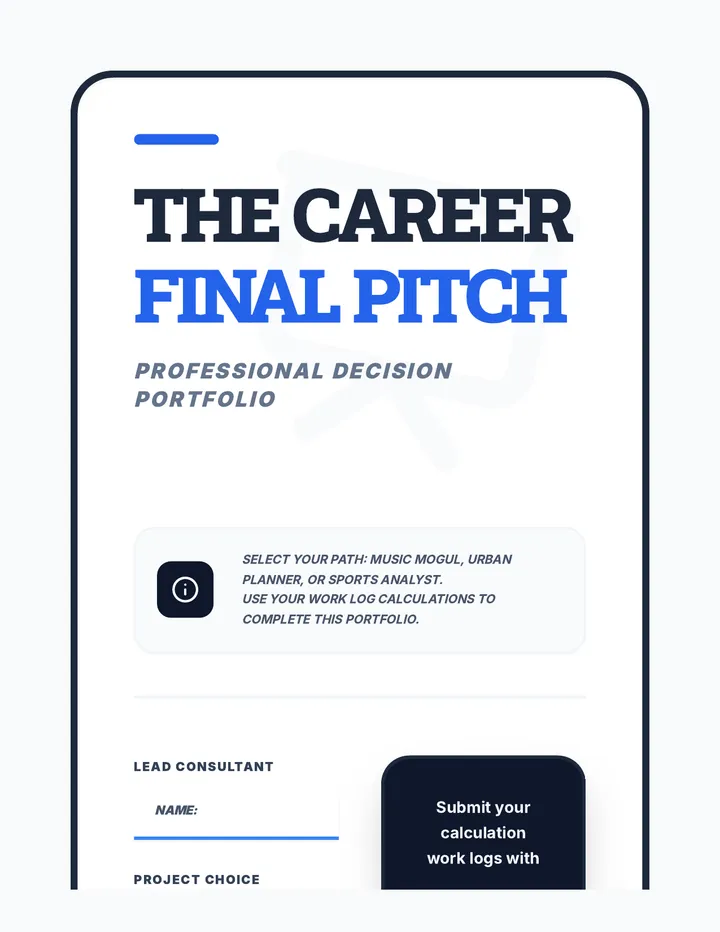
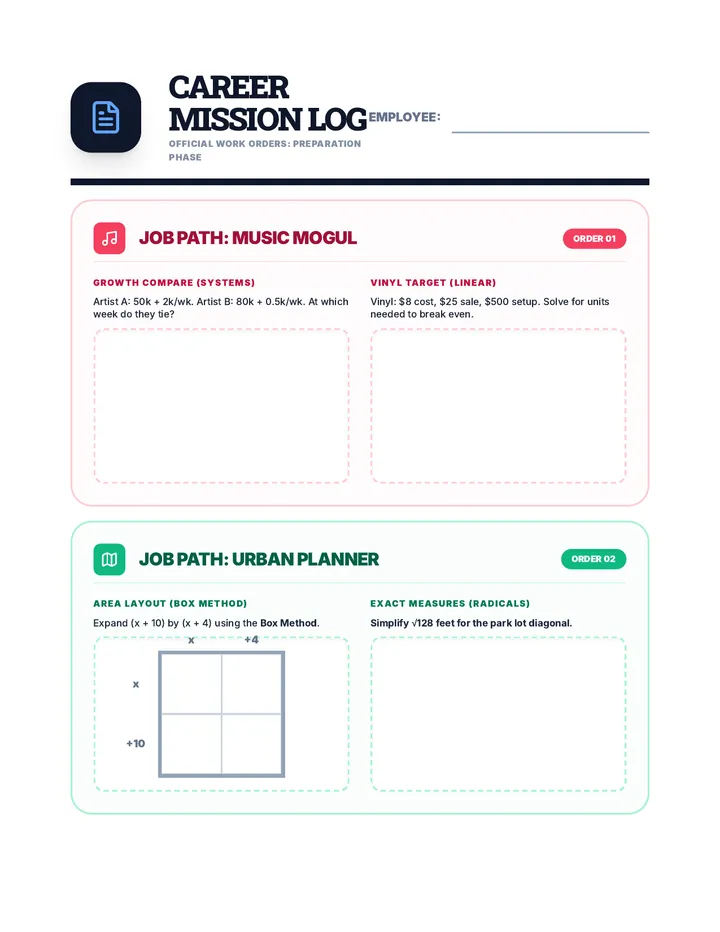
A high-intensity, 120-minute math simulation. Students act as lead consultants, completing a high-speed skill warmup before selecting a professional sector (Music, Urban Planning, Rocket Science, or Sports Analytics) to solve a series of complex work orders.
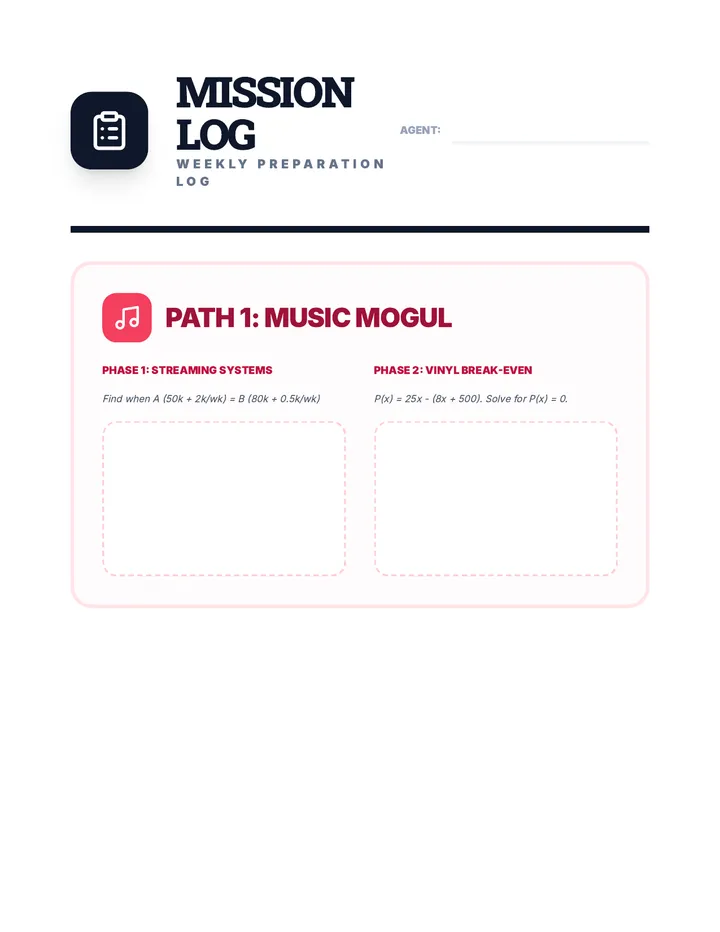
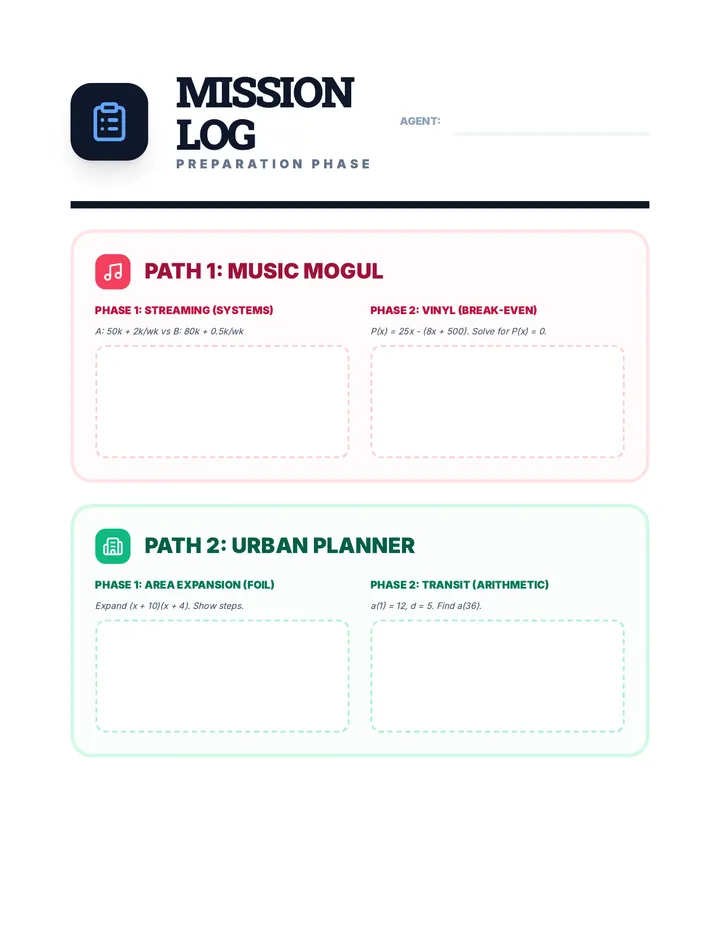
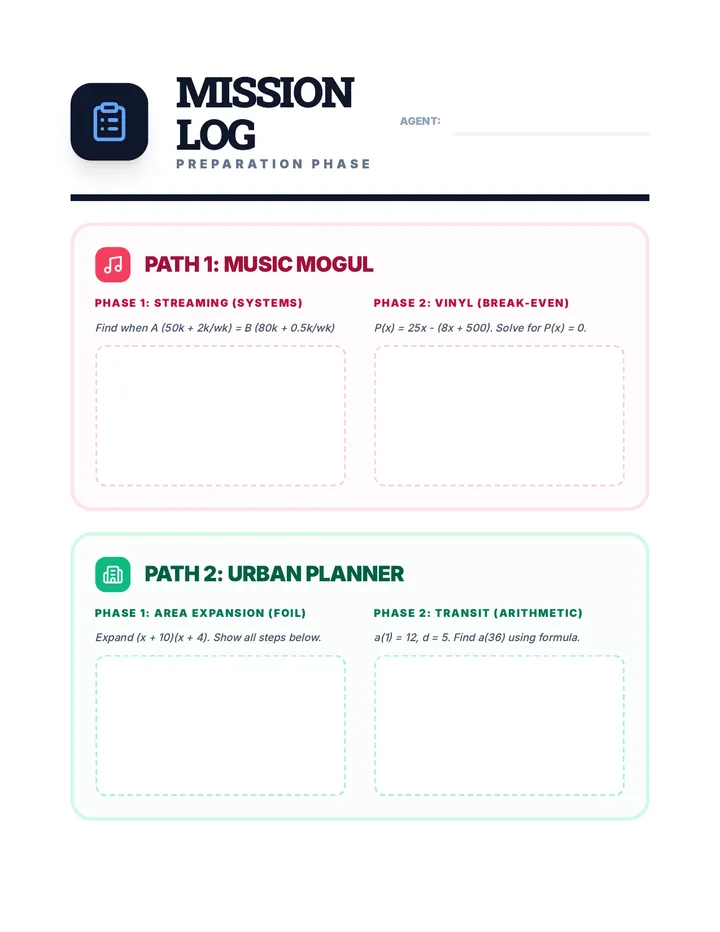
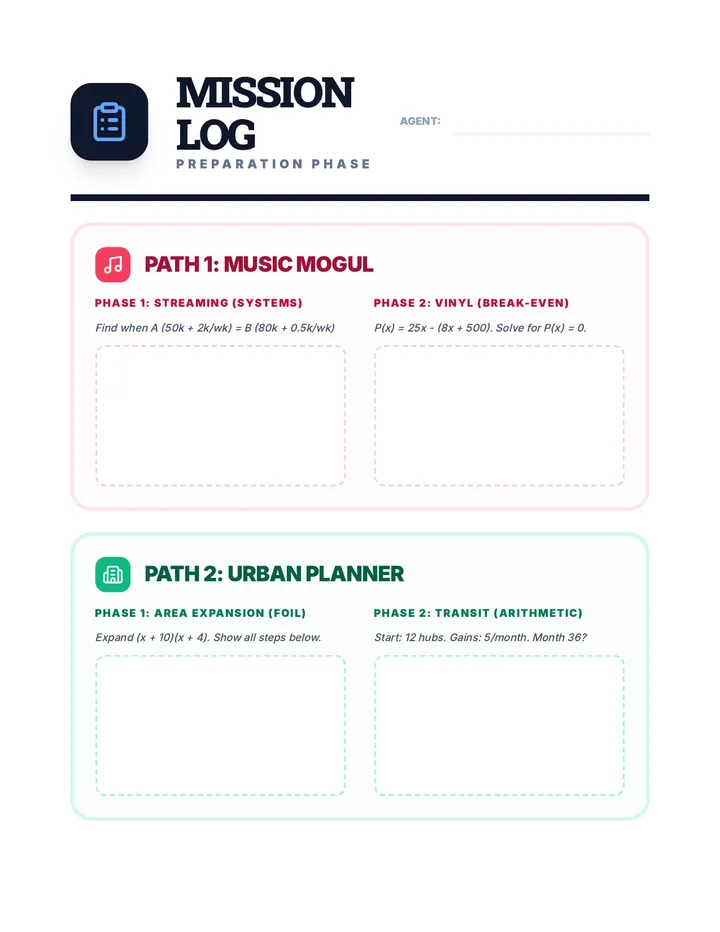
Scaffolded practice activities ('Skill Missions') that review key concepts: linear equations, systems, sequences, lines of best fit, and factoring. These activities ensure students have the foundational skills needed for their final project.
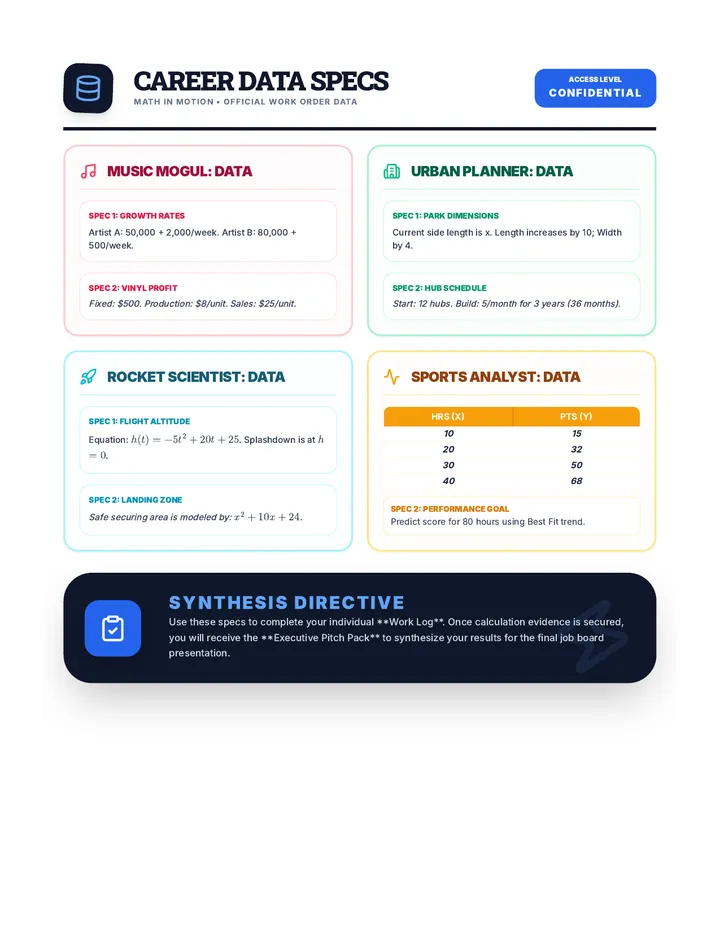
A comprehensive, high-density single-page reference guide that displays all core mathematical models (Systems, Binomial Box Method, Trinomial Factoring, Sequences, Quadratics, and Scatter plots) to support consultants during the Career Summit.
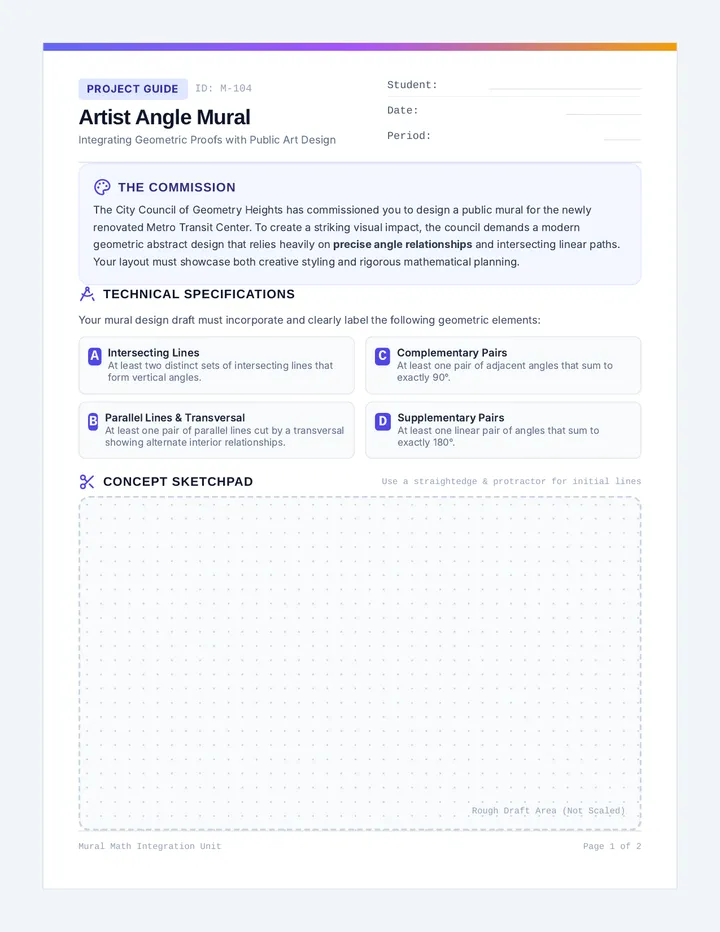
A curriculum sequence combining math, art, and drafting to explore geometric scale, spatial relationships, and coordinate systems in design.
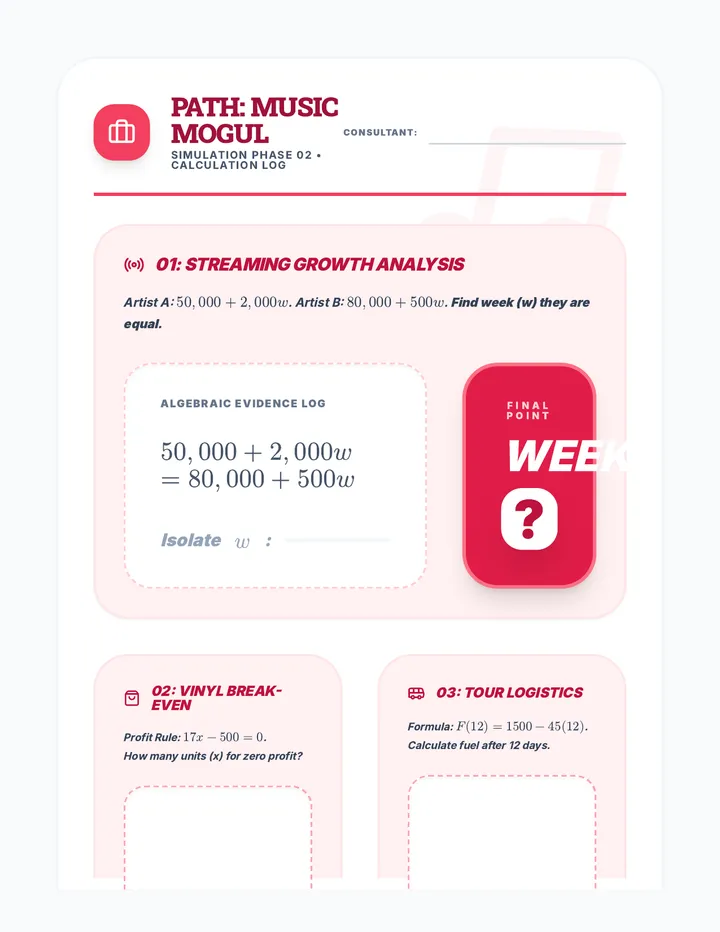
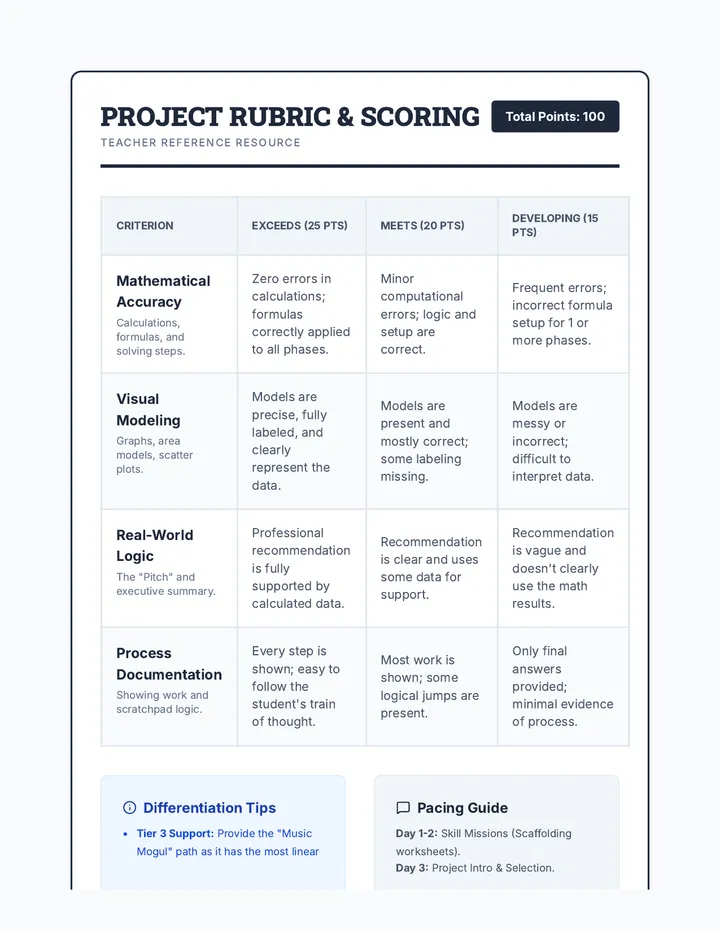
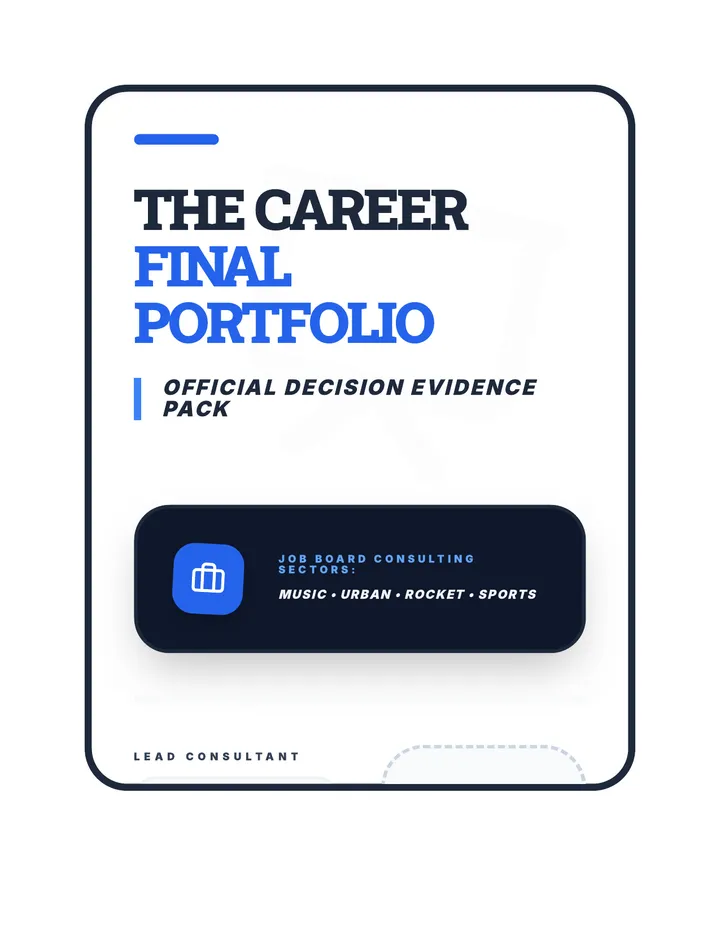
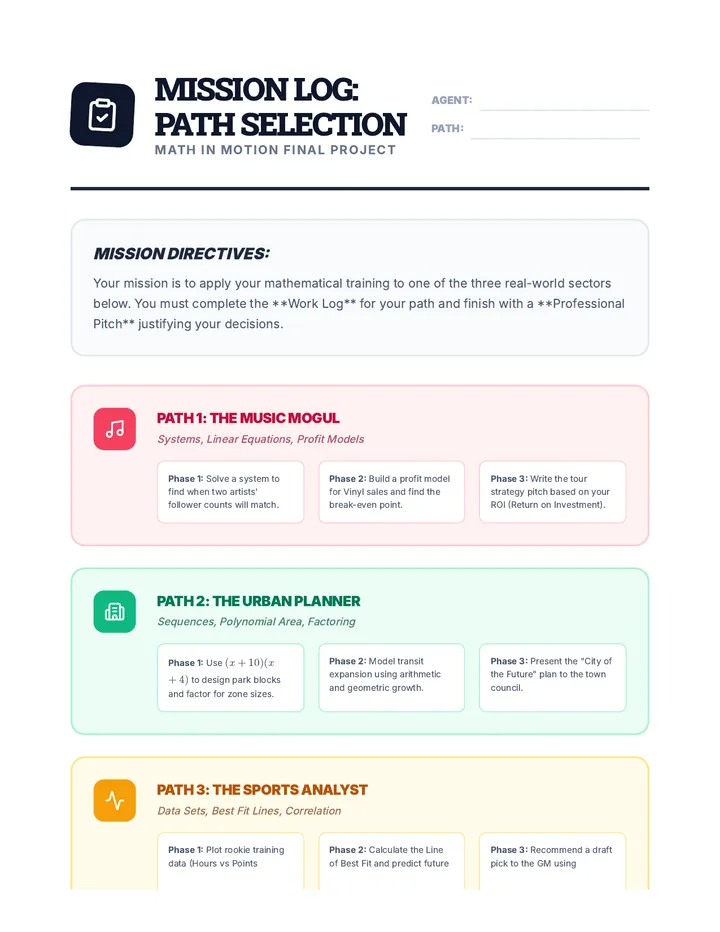
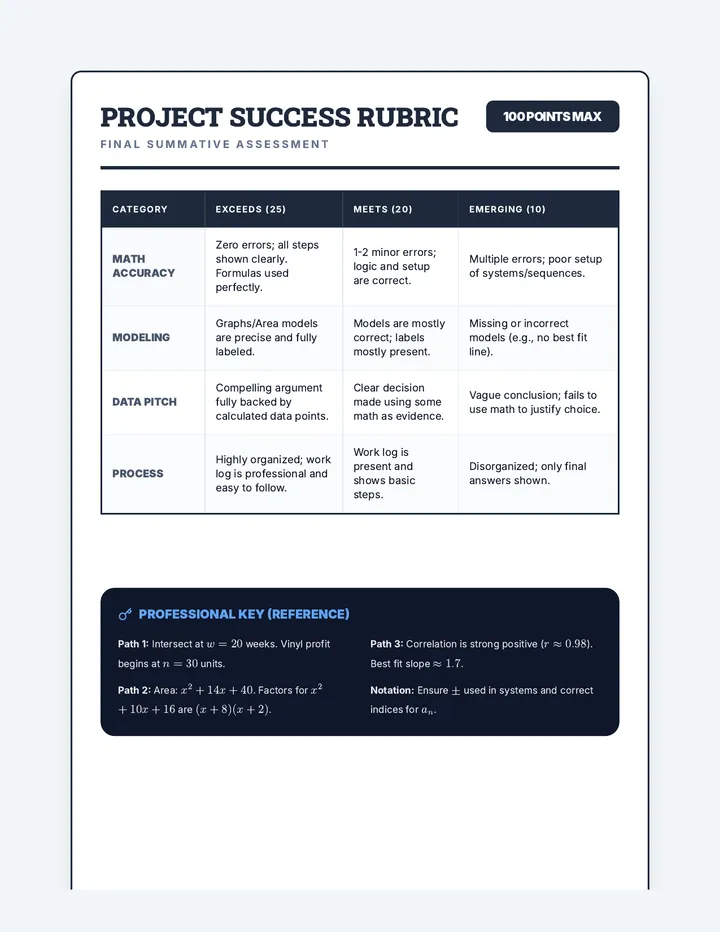
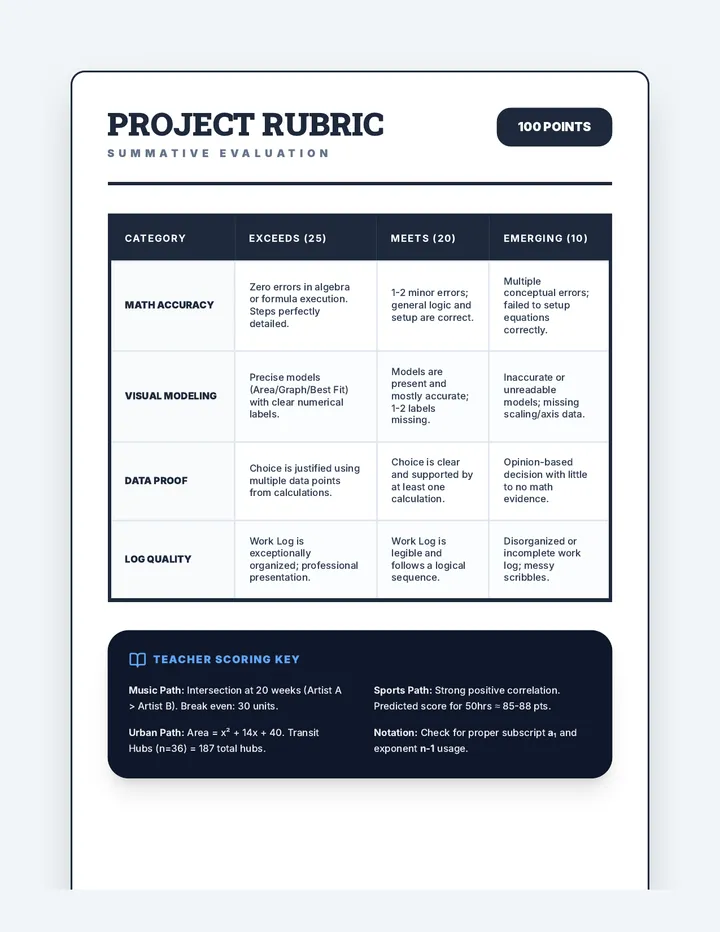
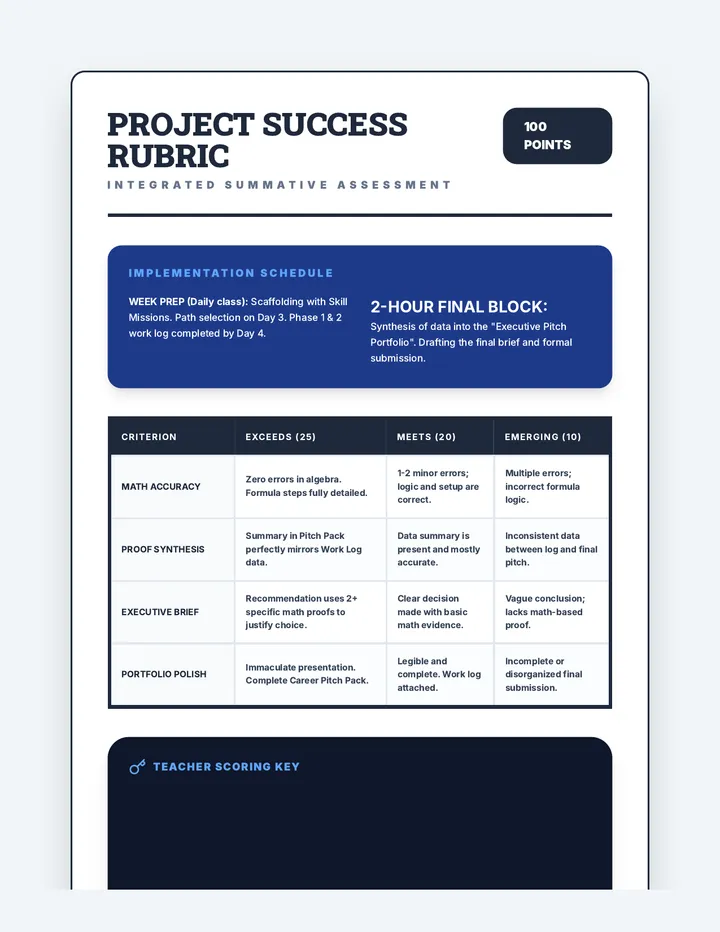
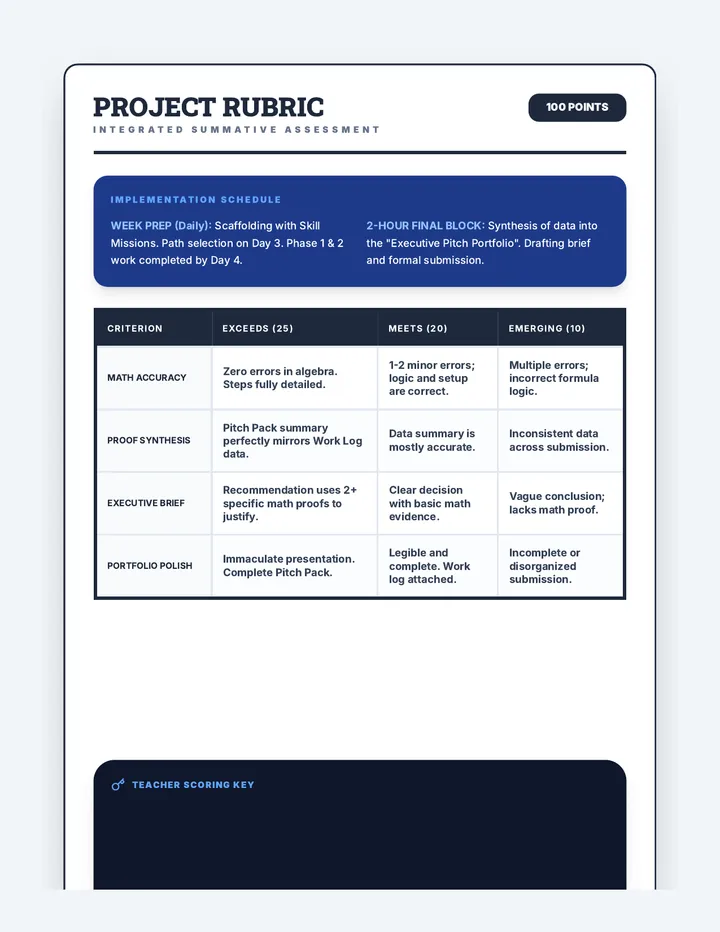
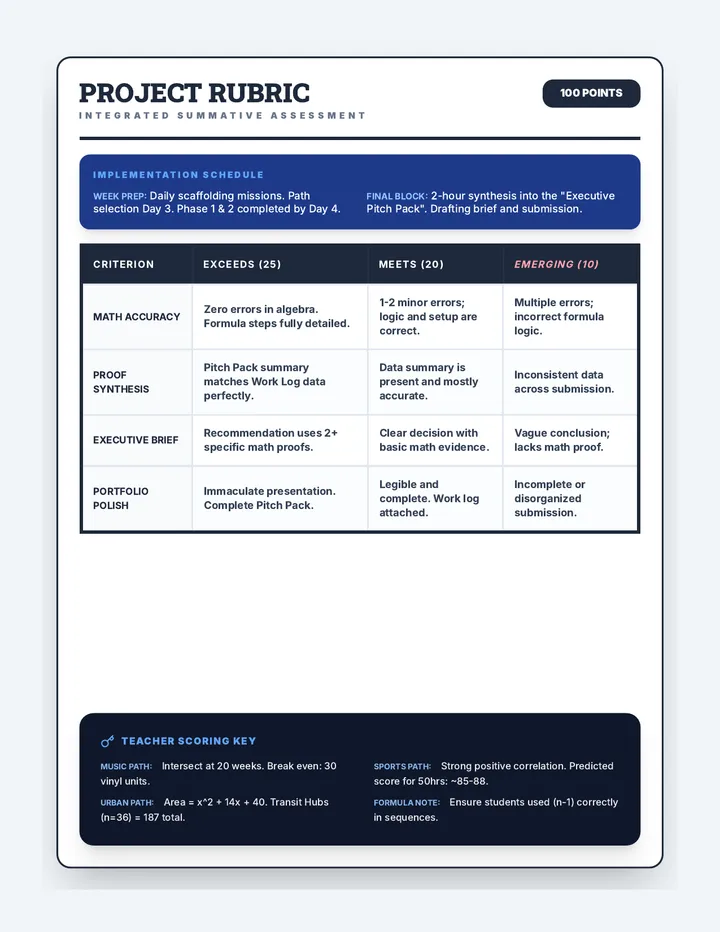
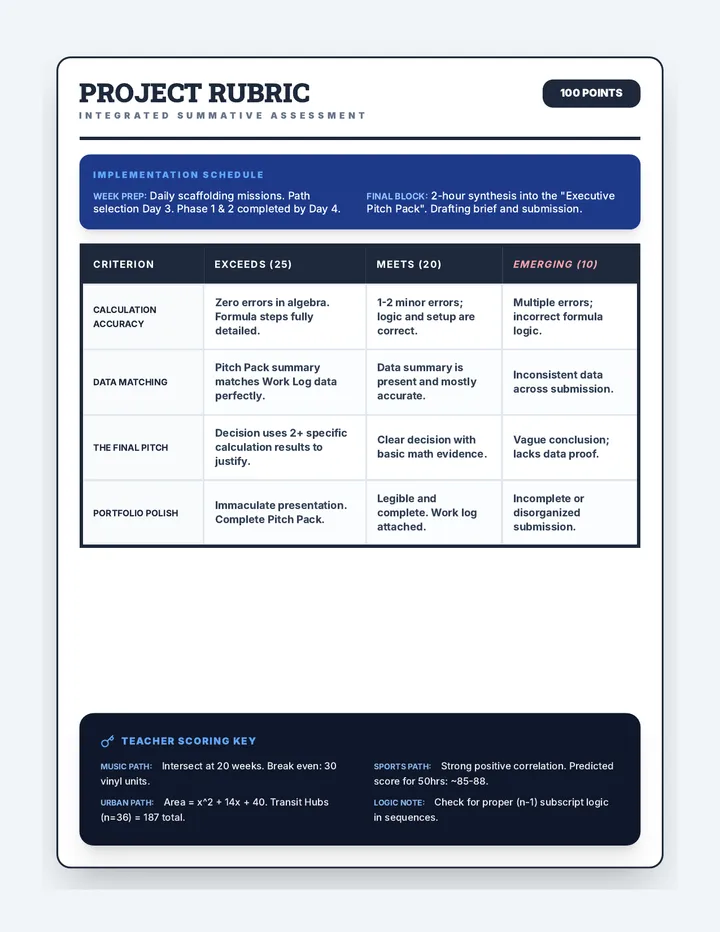
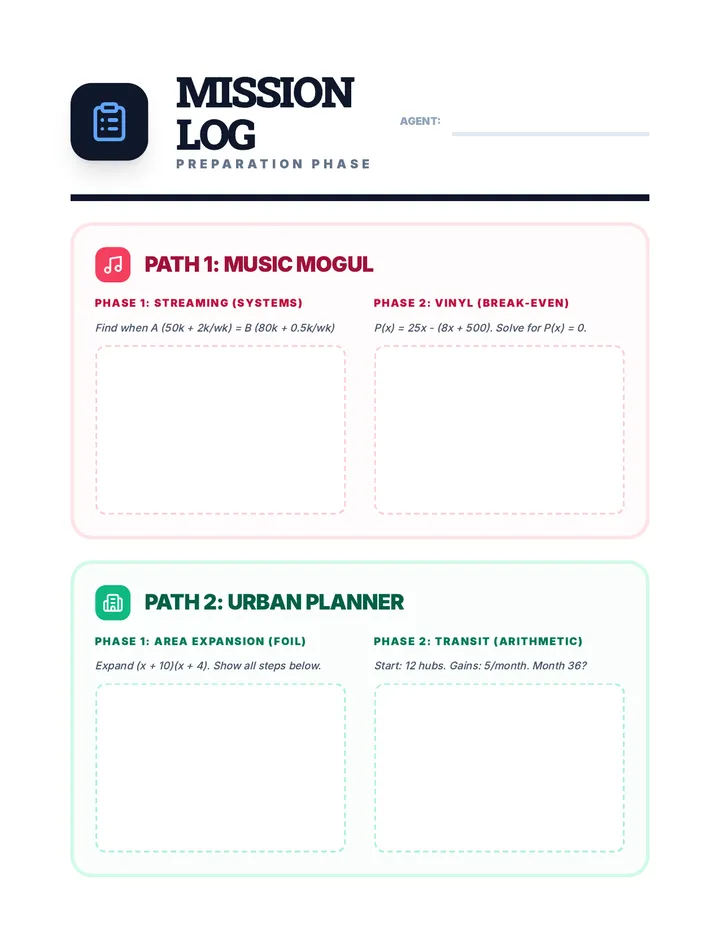
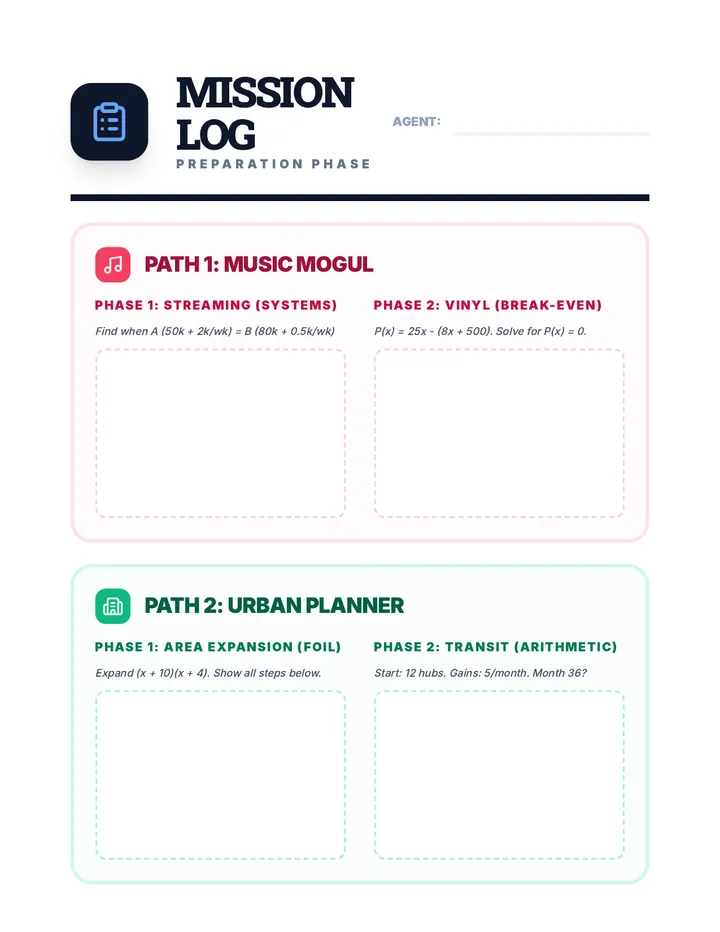
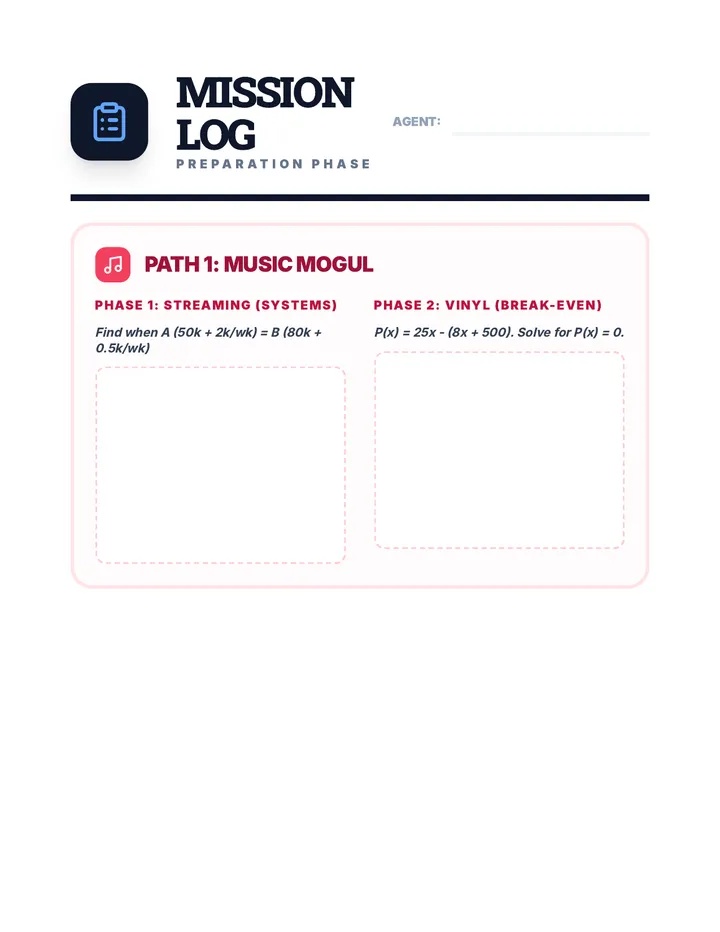
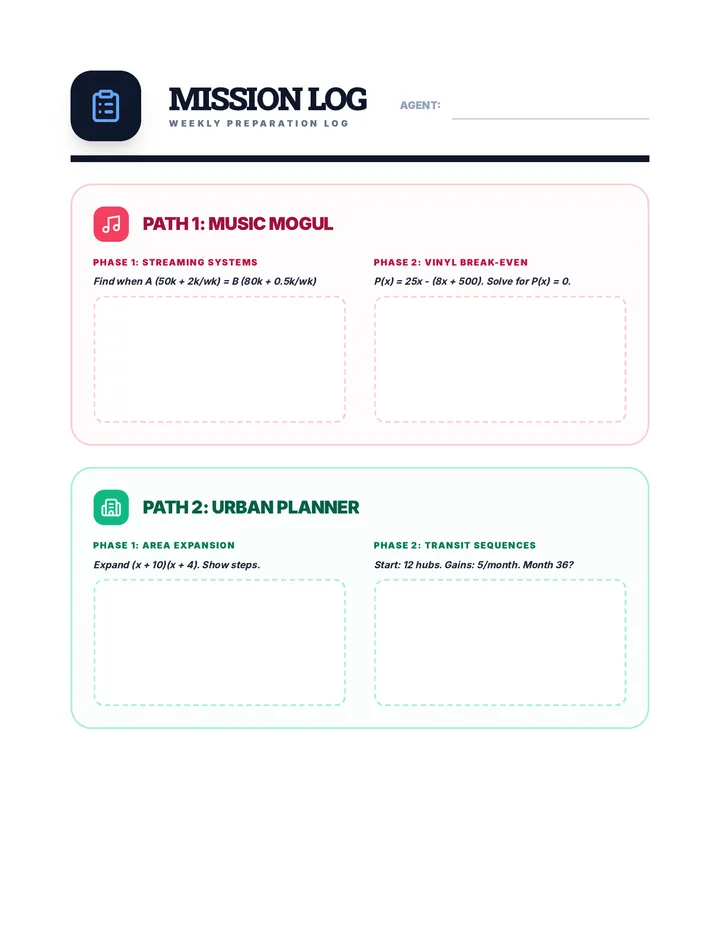
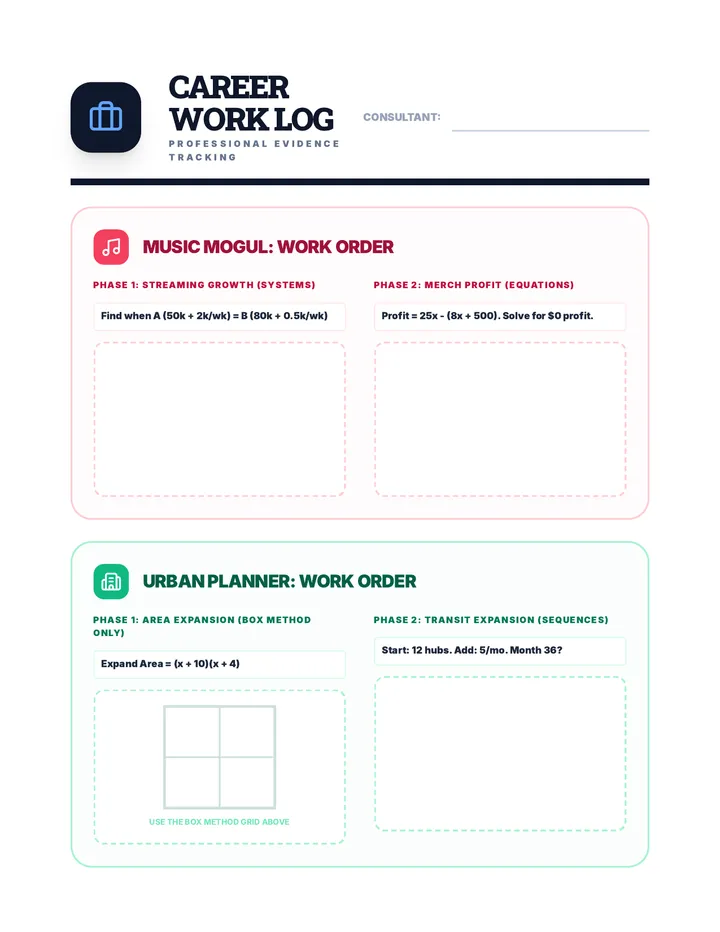
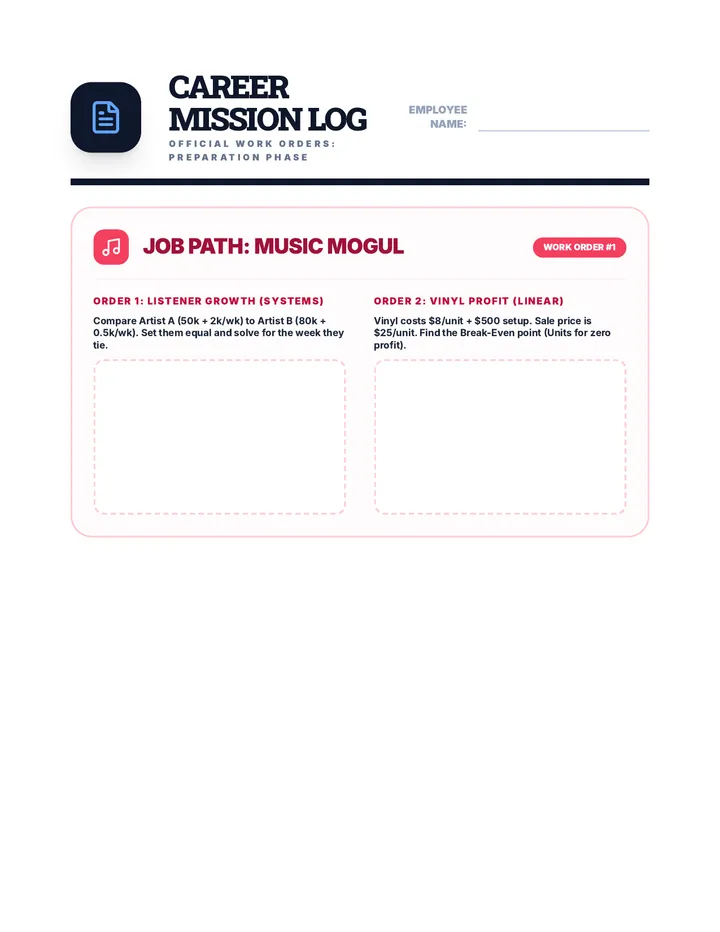
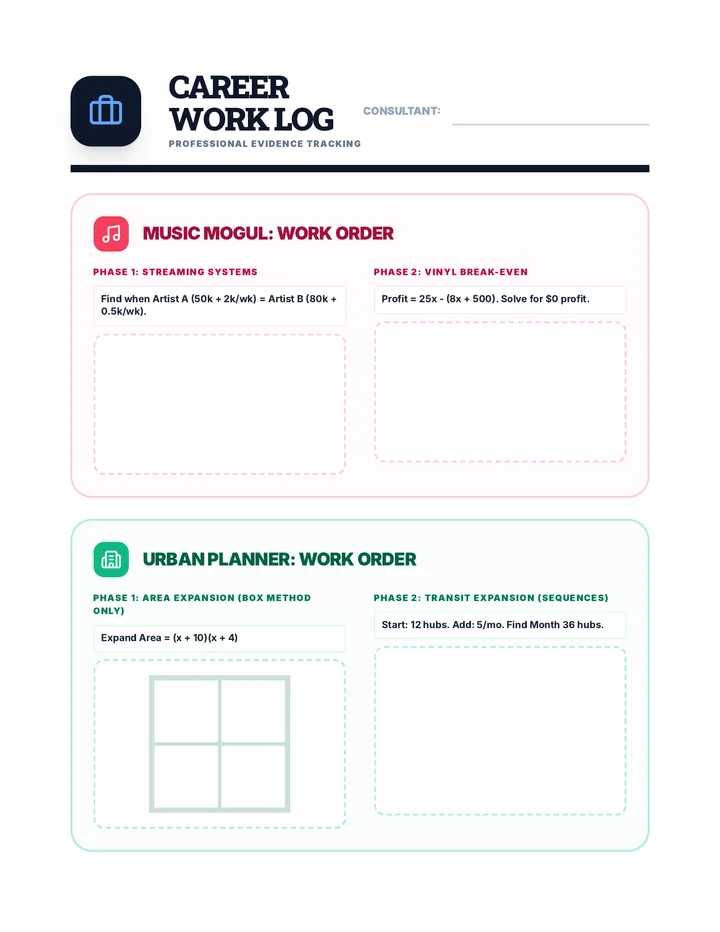
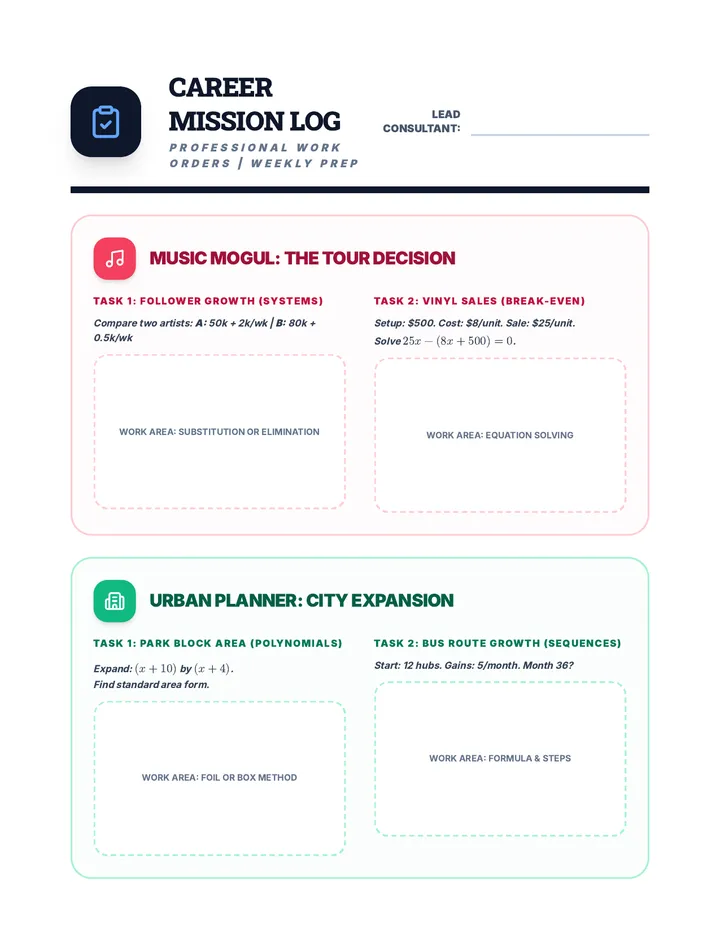
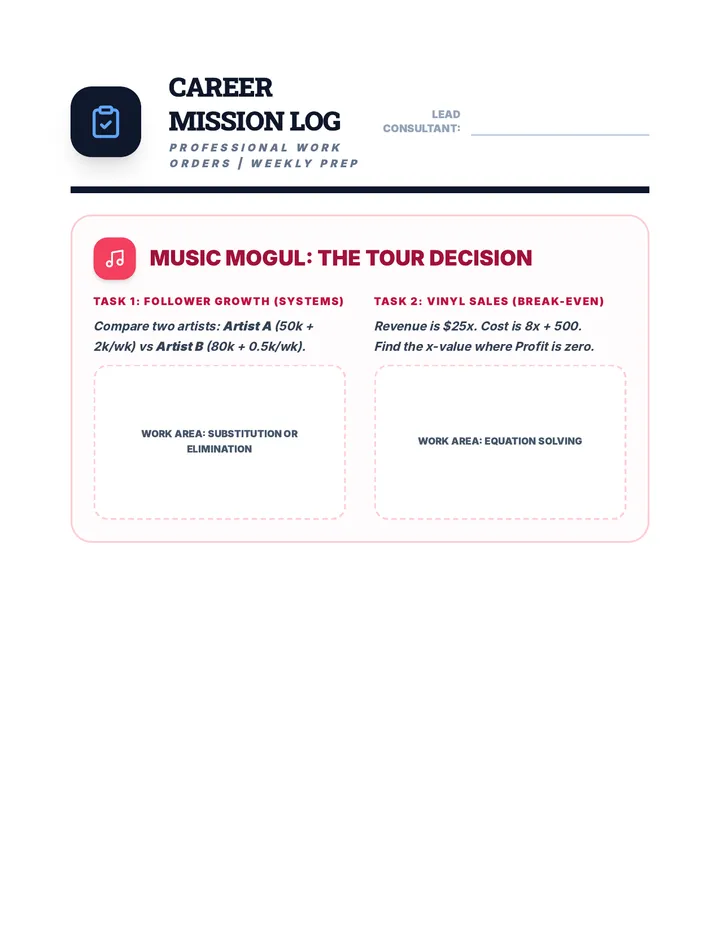
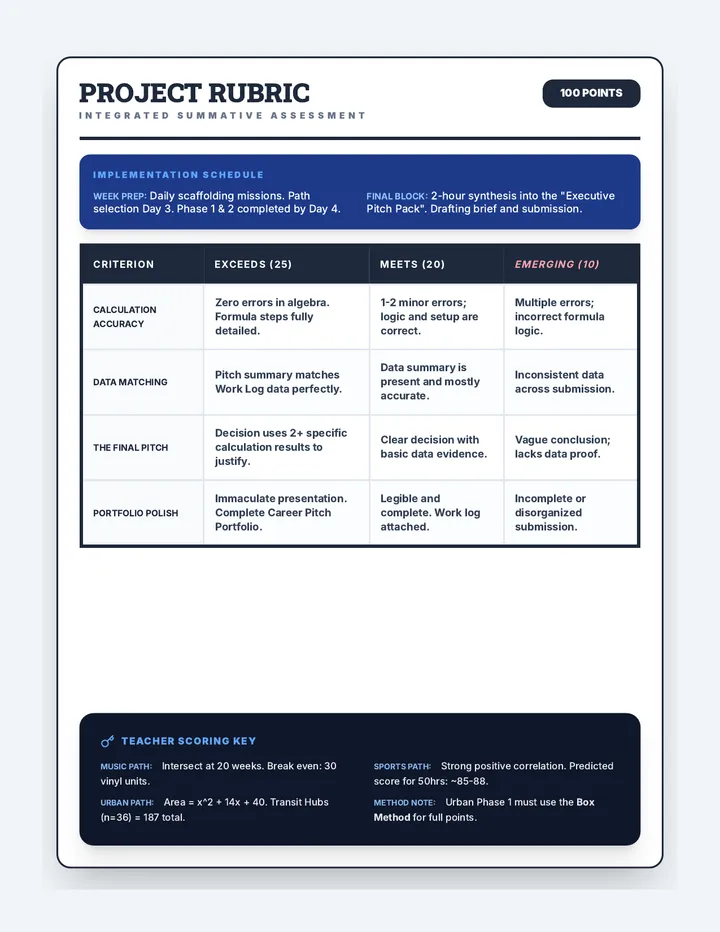
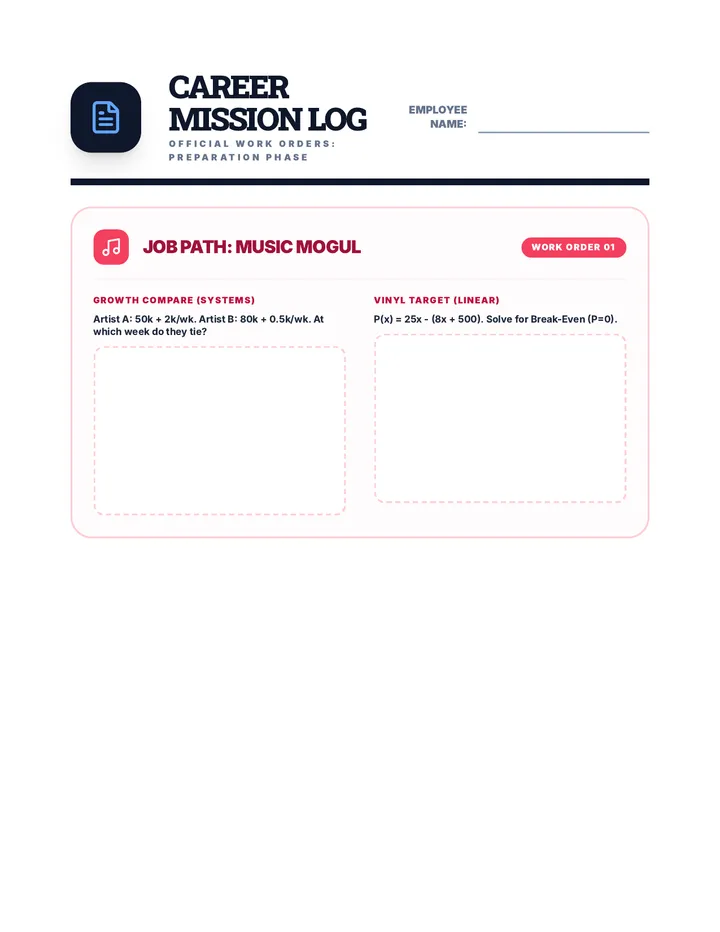
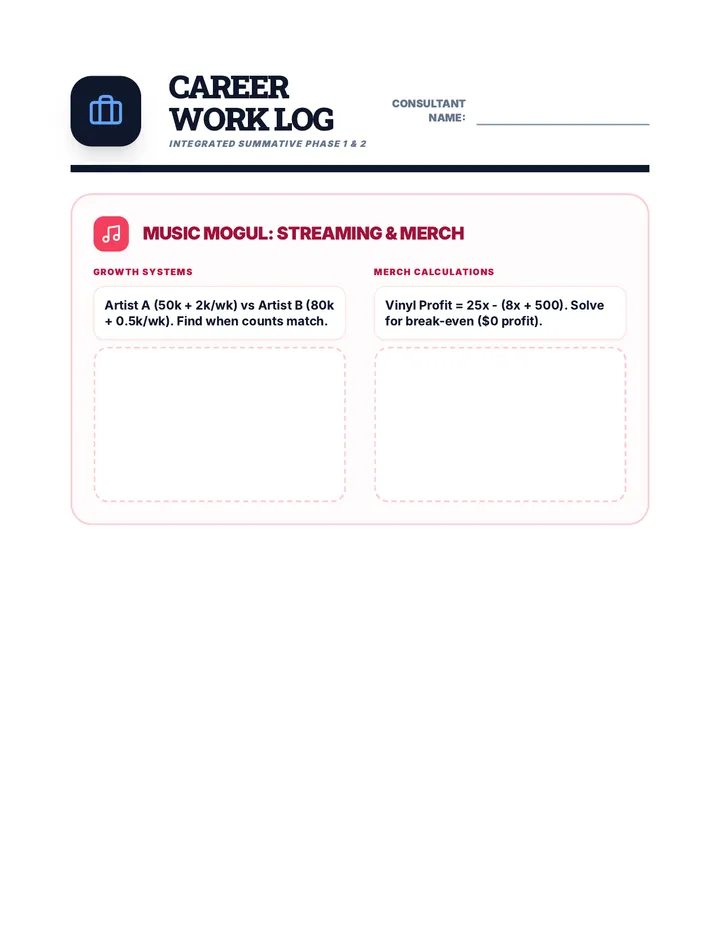
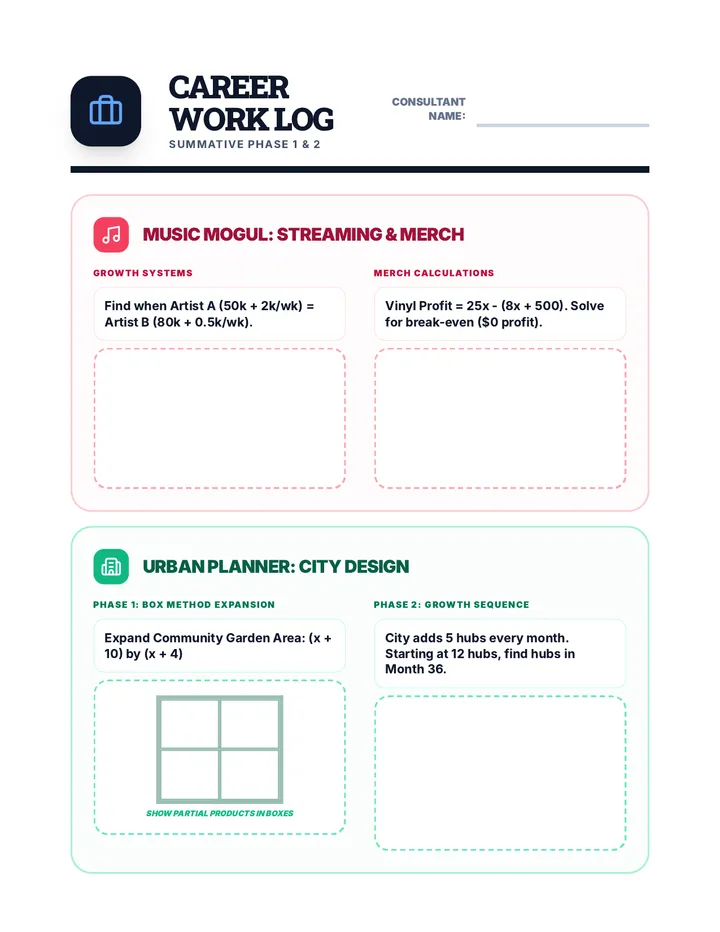
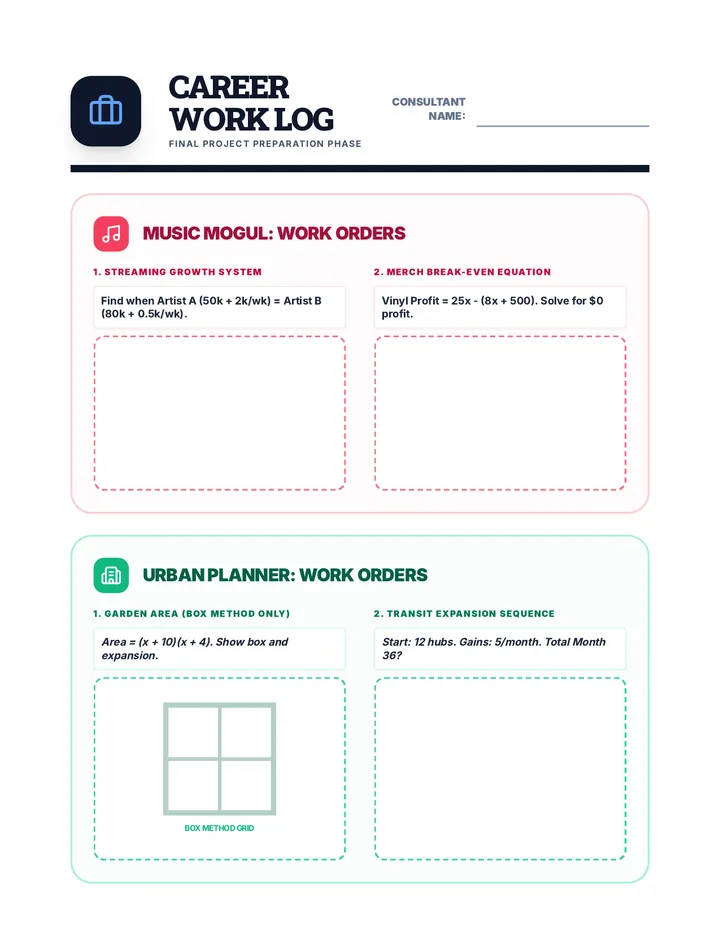
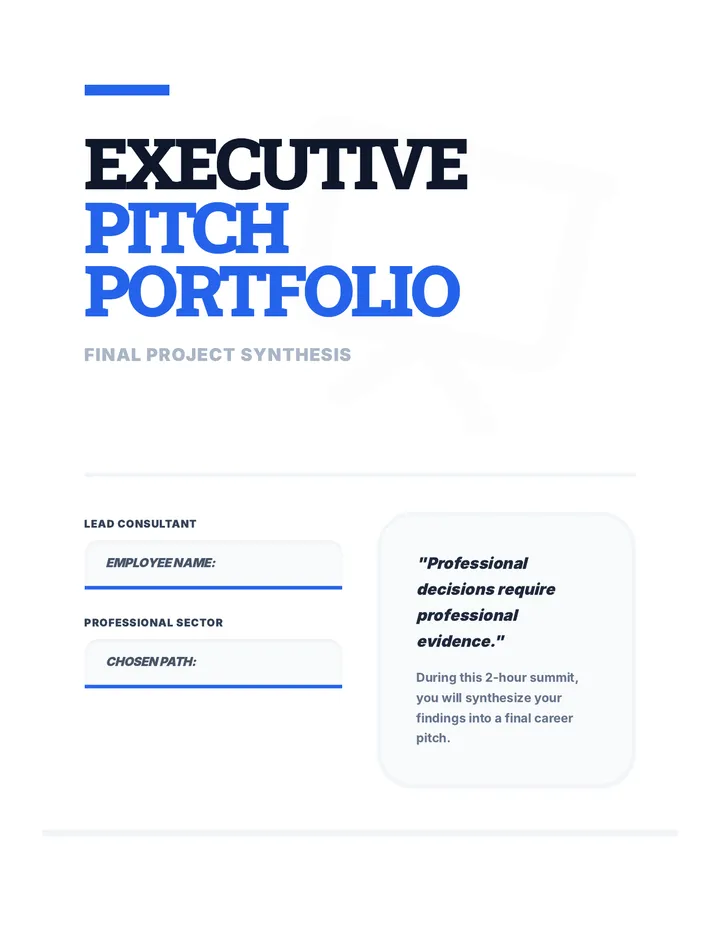
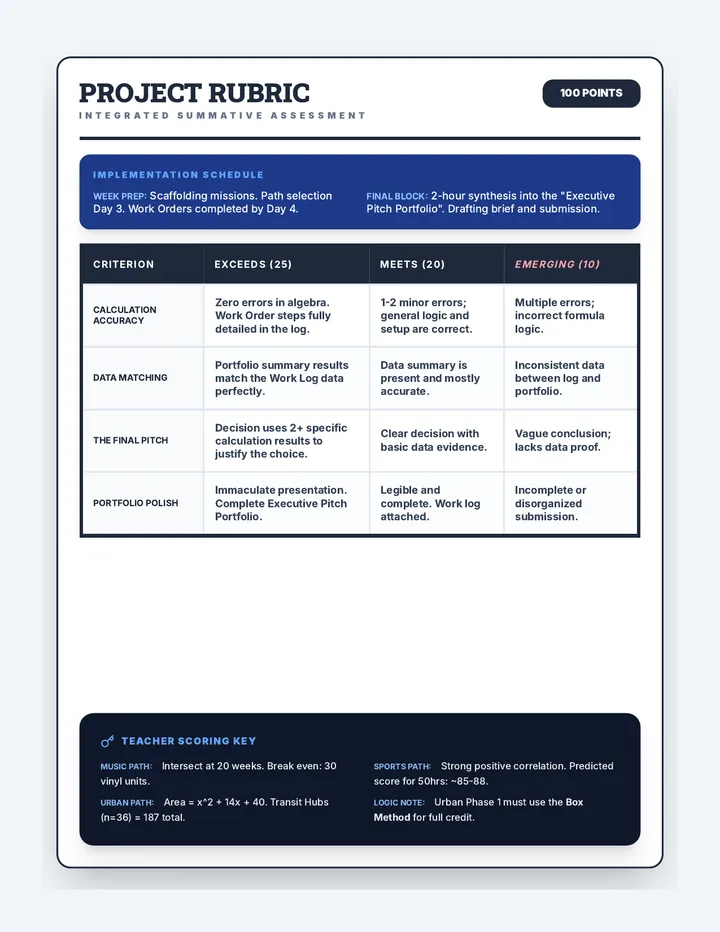
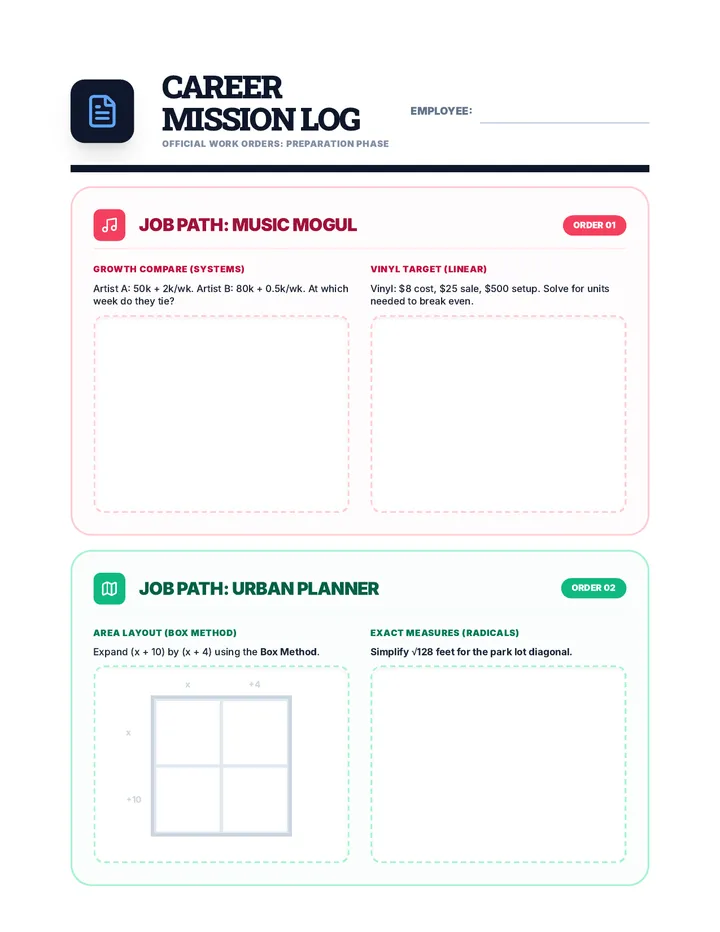
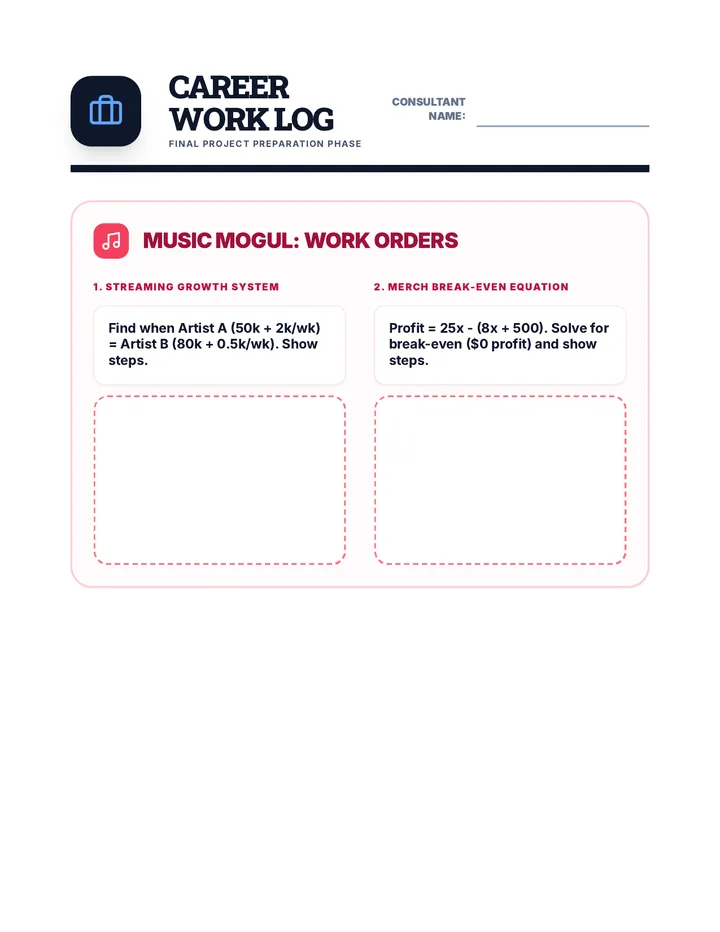
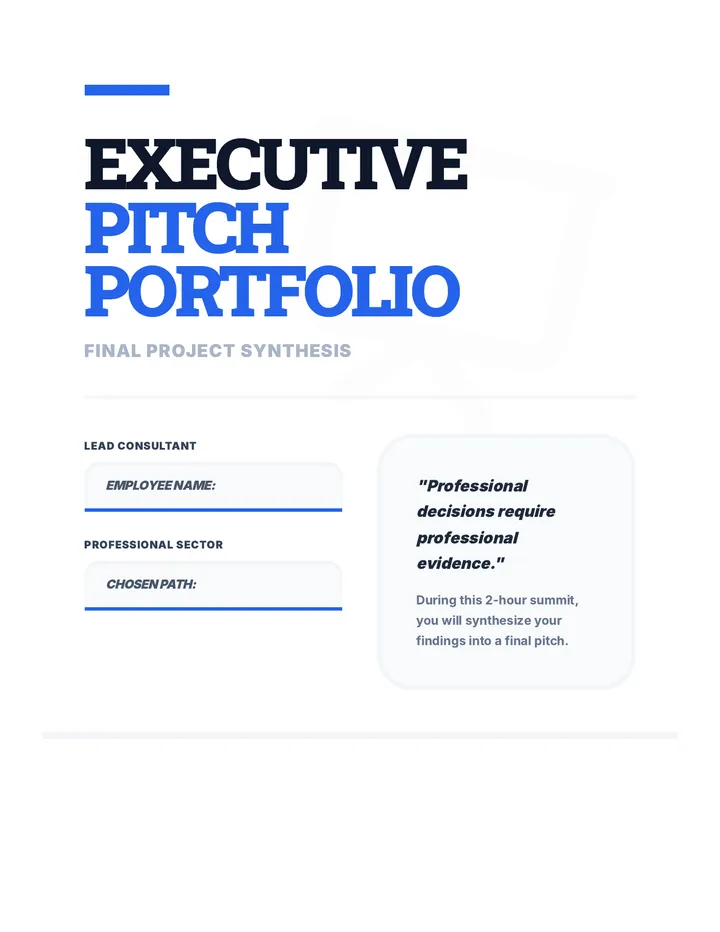
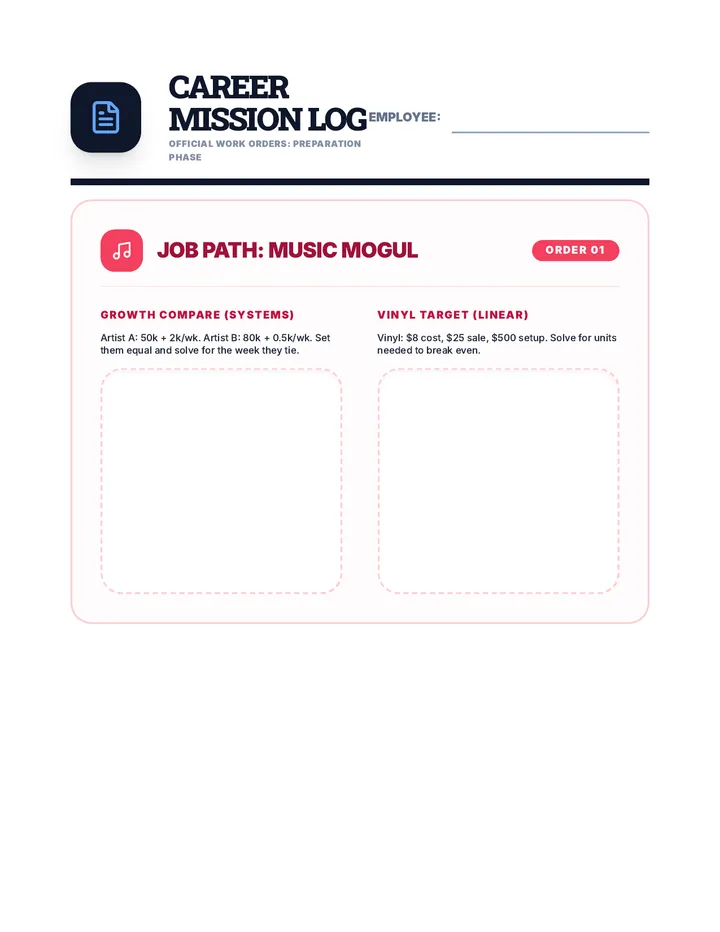
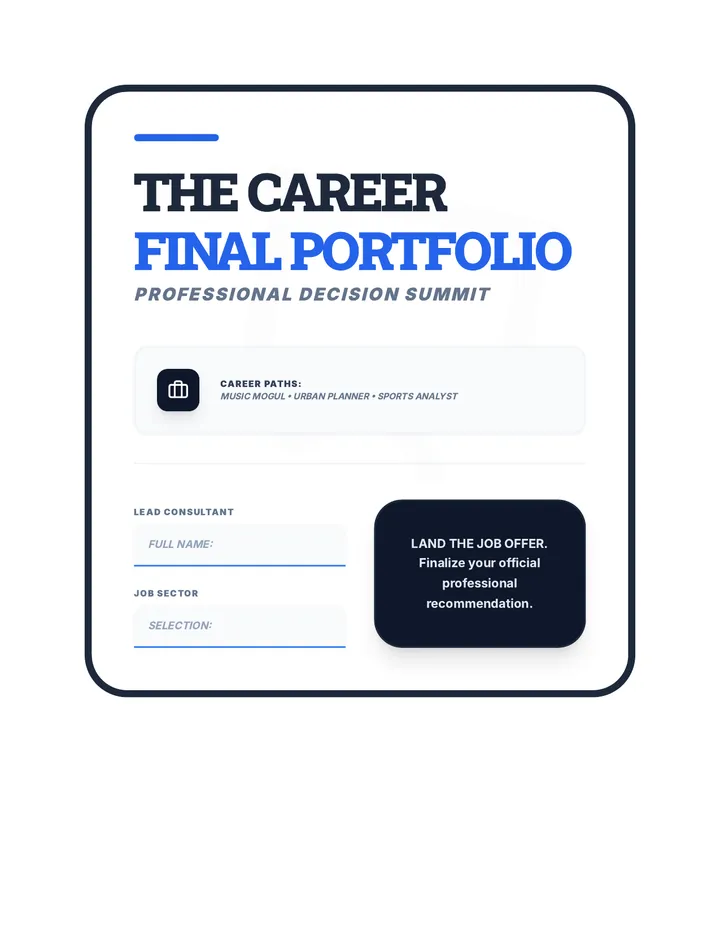
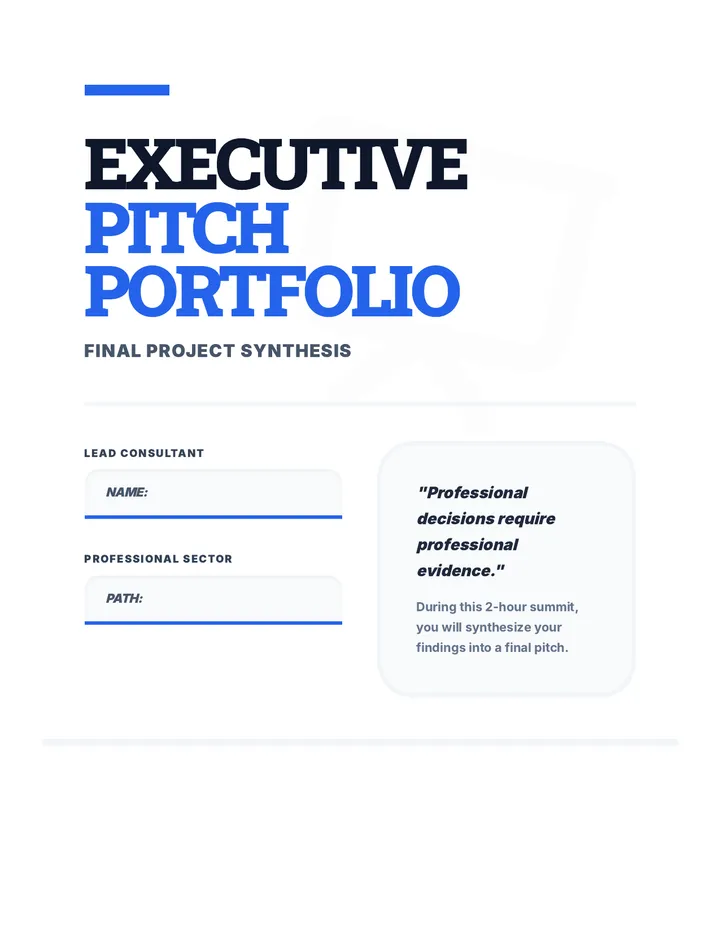
A high-intensity, 2-hour math simulation where students act as lead consultants. They complete a scaffolded Skill Warmup before choosing one of four career paths (Music, Urban, Rocket, or Sports) to solve real-world "Work Orders" and delivering an Executive Pitch.
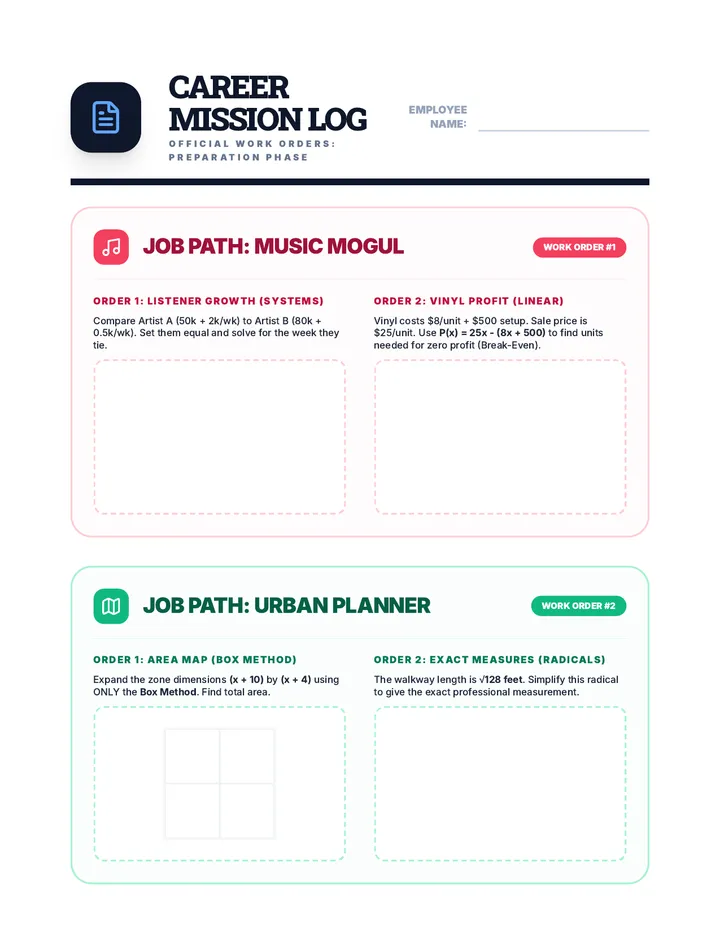
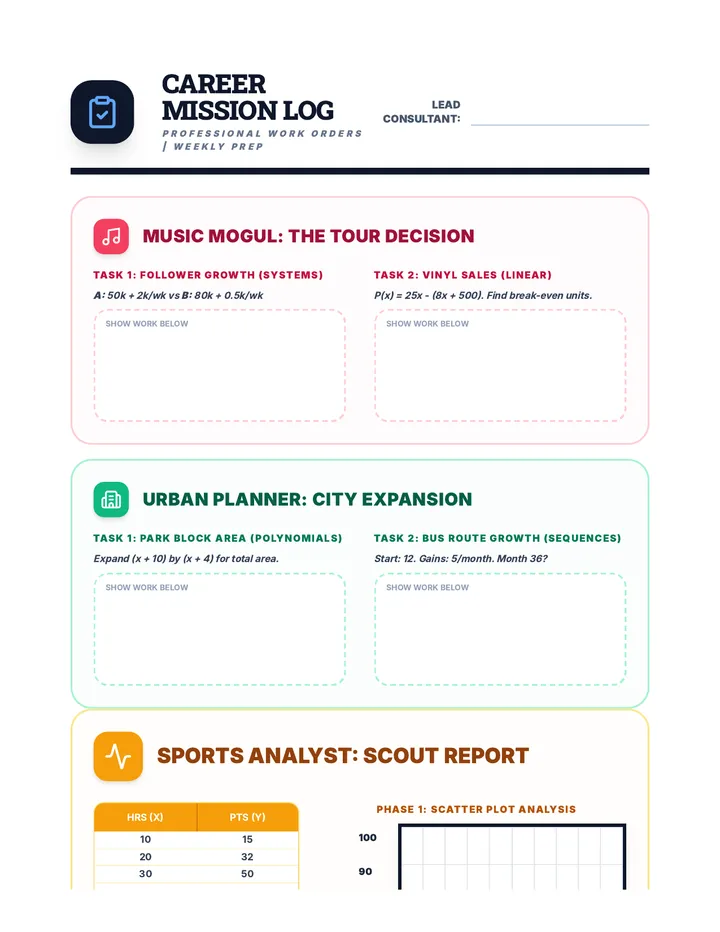
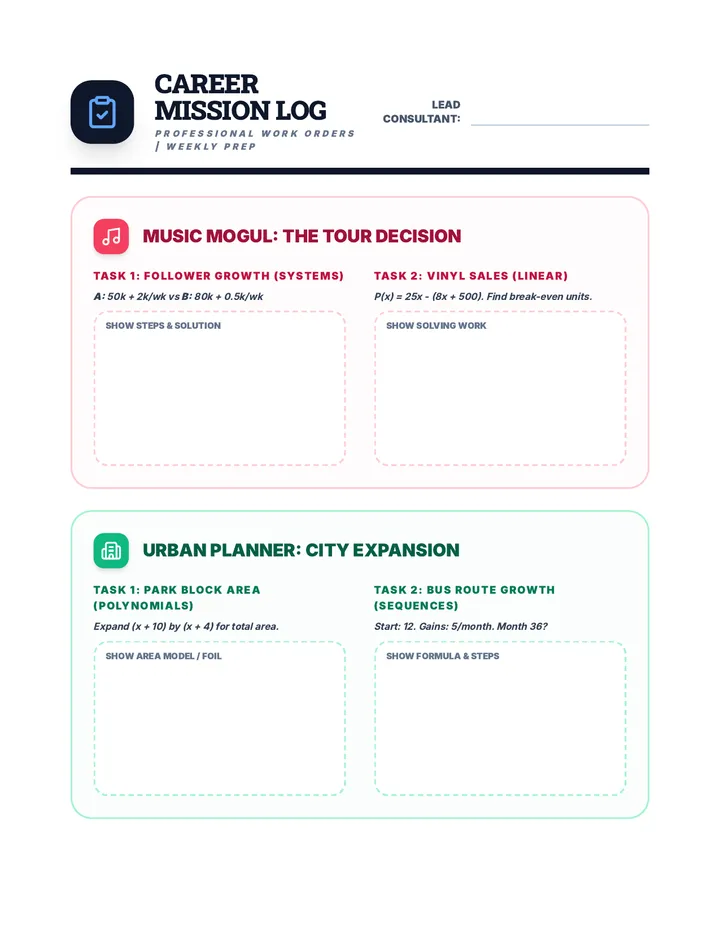
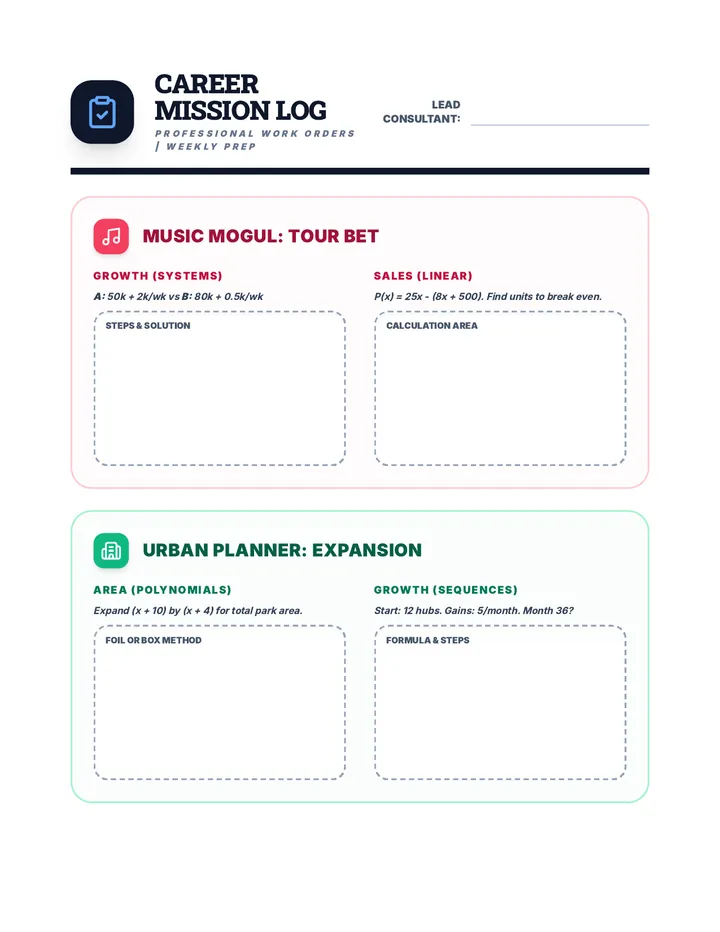
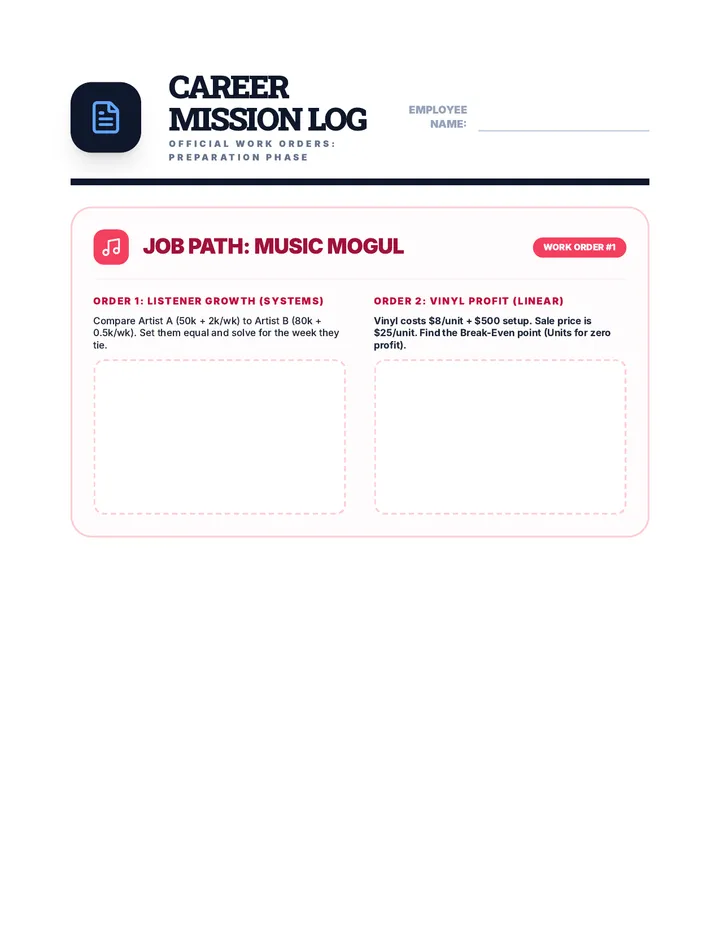
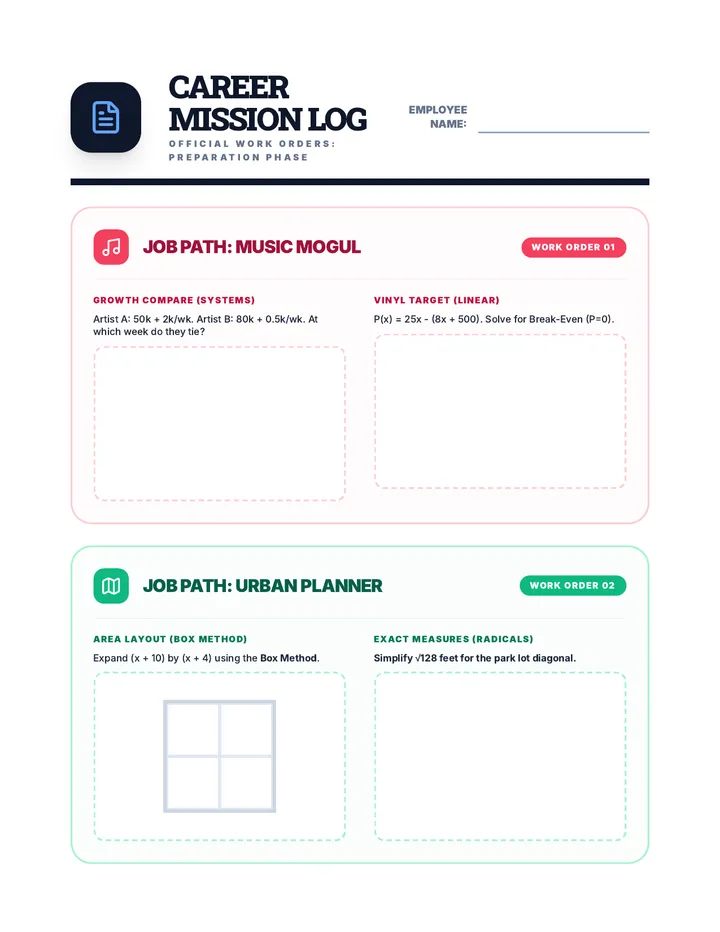
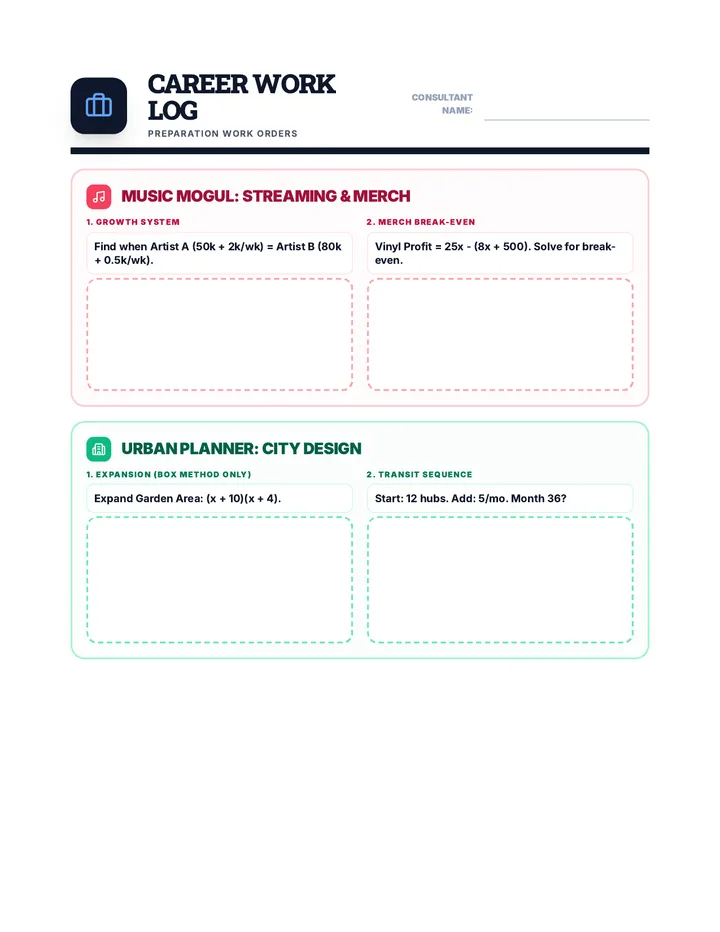
A comprehensive 6-page career simulation readiness packet covering systems of equations, polynomial multiplication (Box Method), factoring trinomials, arithmetic/geometric sequence telemetry, rocket trajectory vertices, and scatter plots. Scaffolded with clean workspaces, high-contrast visual grids, and certification sign-offs to prepare student consultants for the Career Summit.
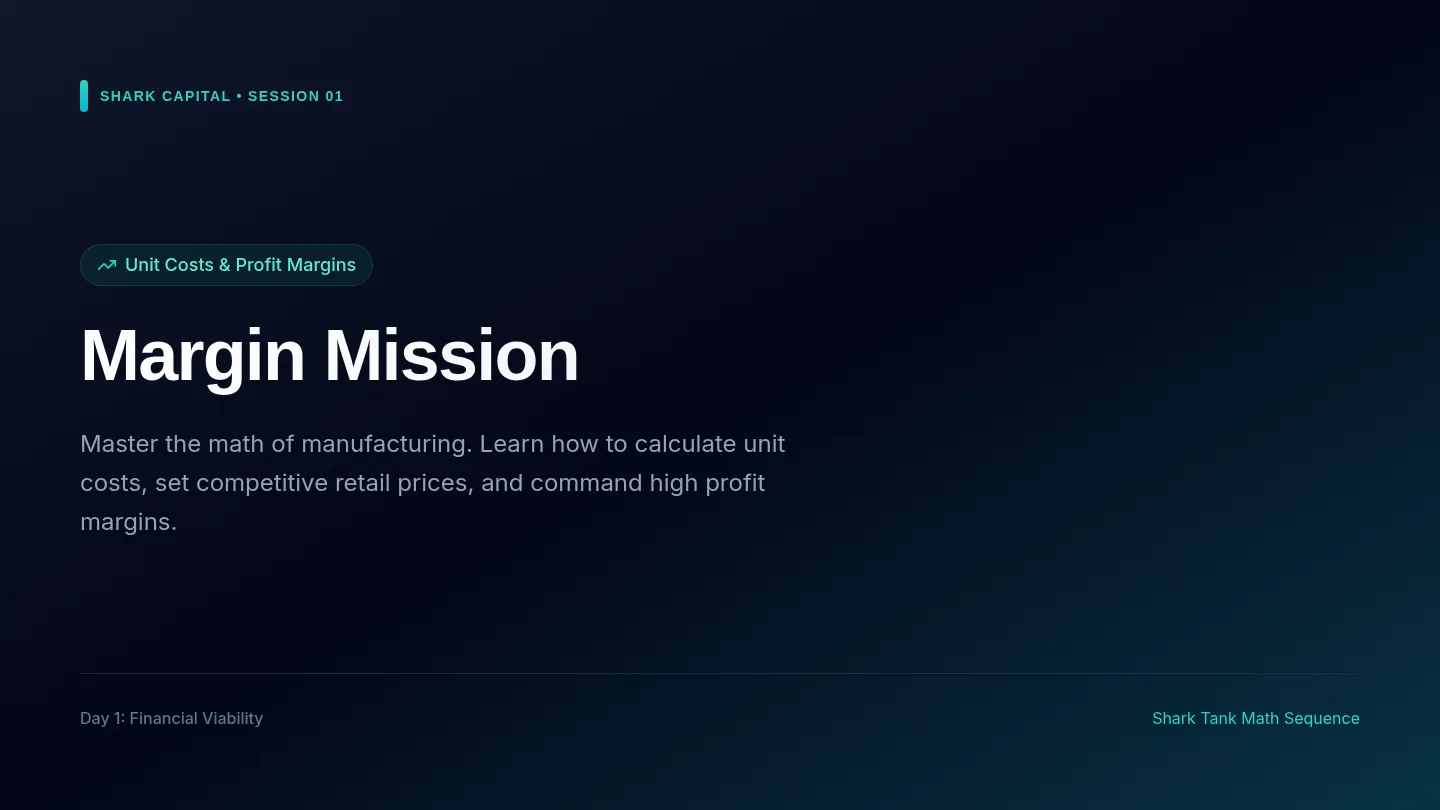
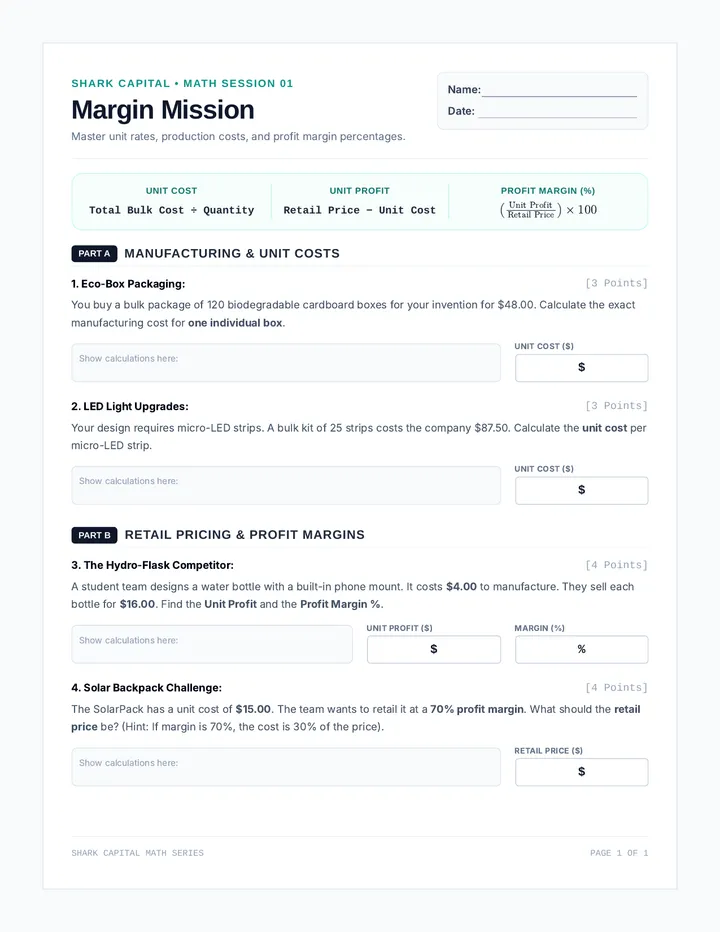
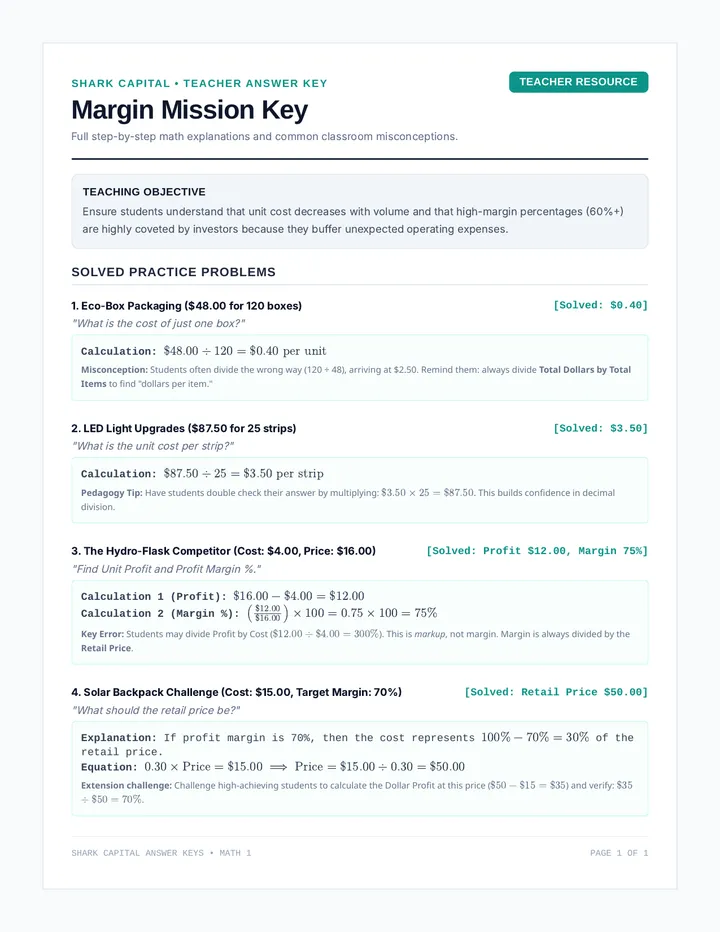
A multi-day, highly engaging math sequence that teaches students the financial mechanics of a venture capital pitch. Students learn to calculate unit profit, retail markups, margin percentages, company valuation, and equity offers to prepare their own Shark Tank-style pitches.
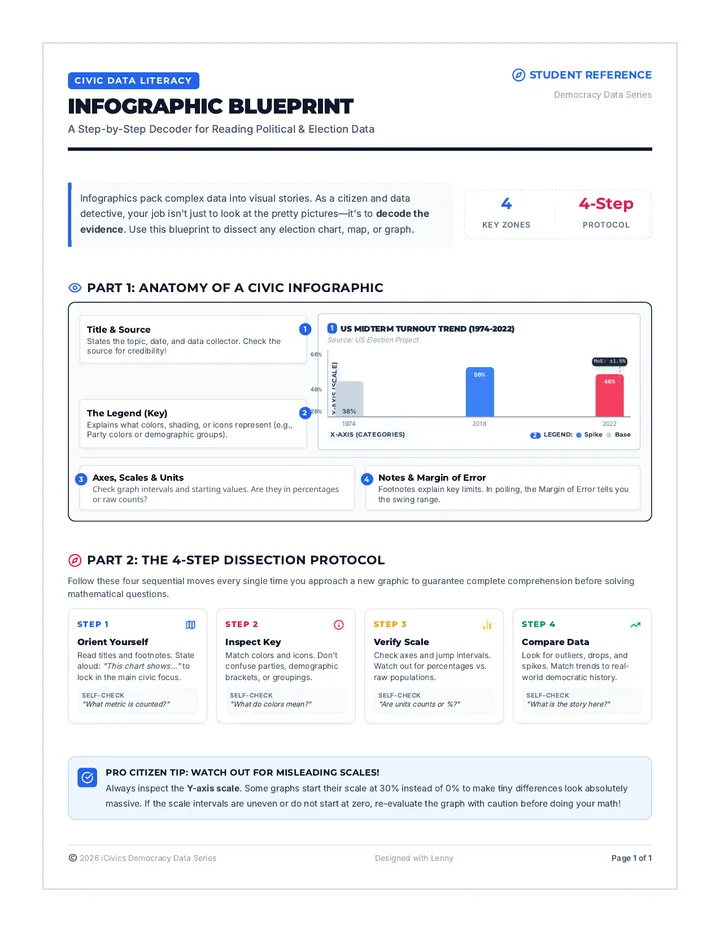
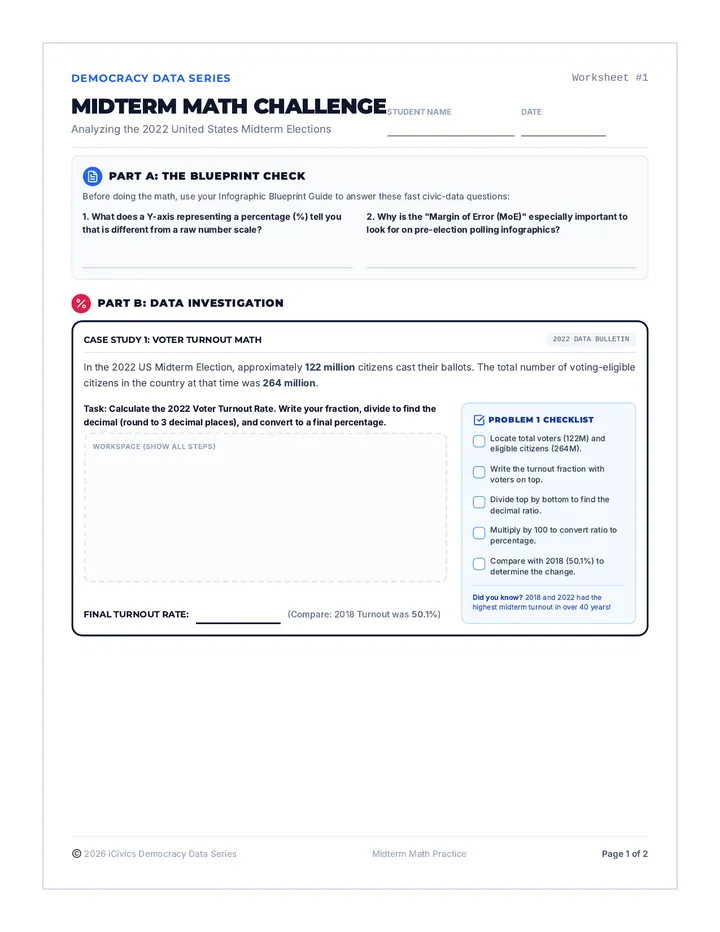
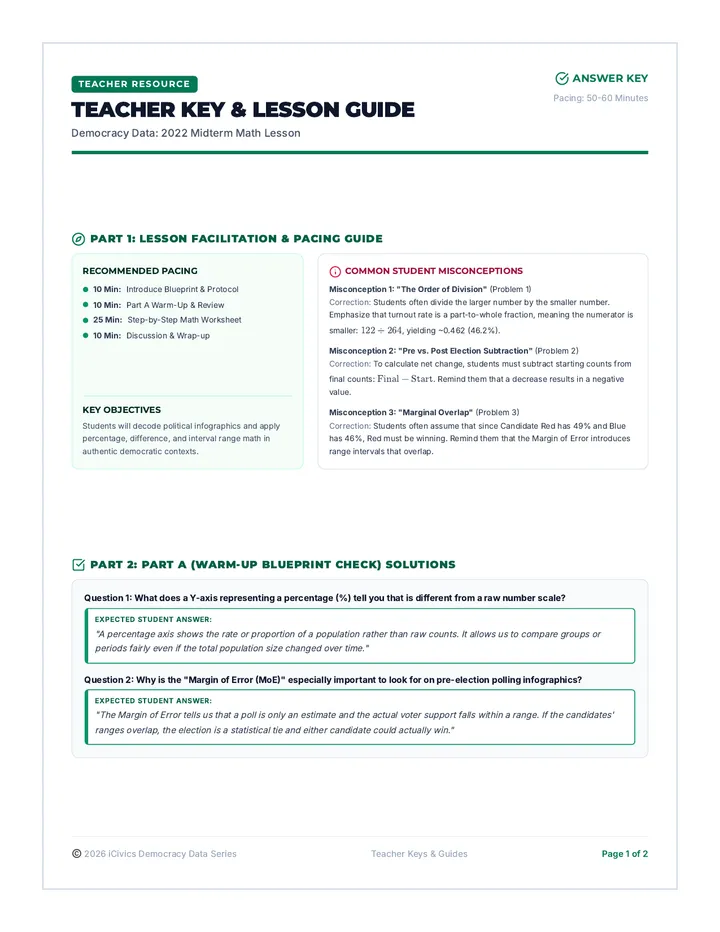
A civic-minded math lesson where students analyze real-world data from the 2022 midterm elections. Students learn to navigate complex infographics using structured reading strategies and tackle data-driven math questions with supportive step-by-step checklists.
Revised Skill Mission worksheets for Data Analysis and Polynomials. Features a functional graph with labeled axes, improved contrast, and better spatial management to prevent page overflows.
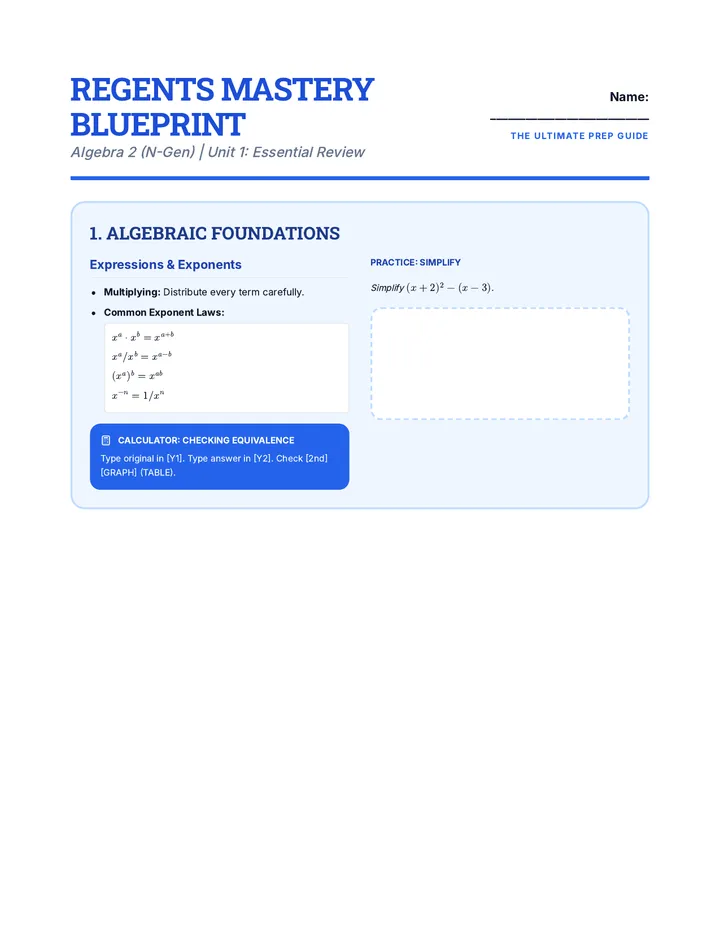
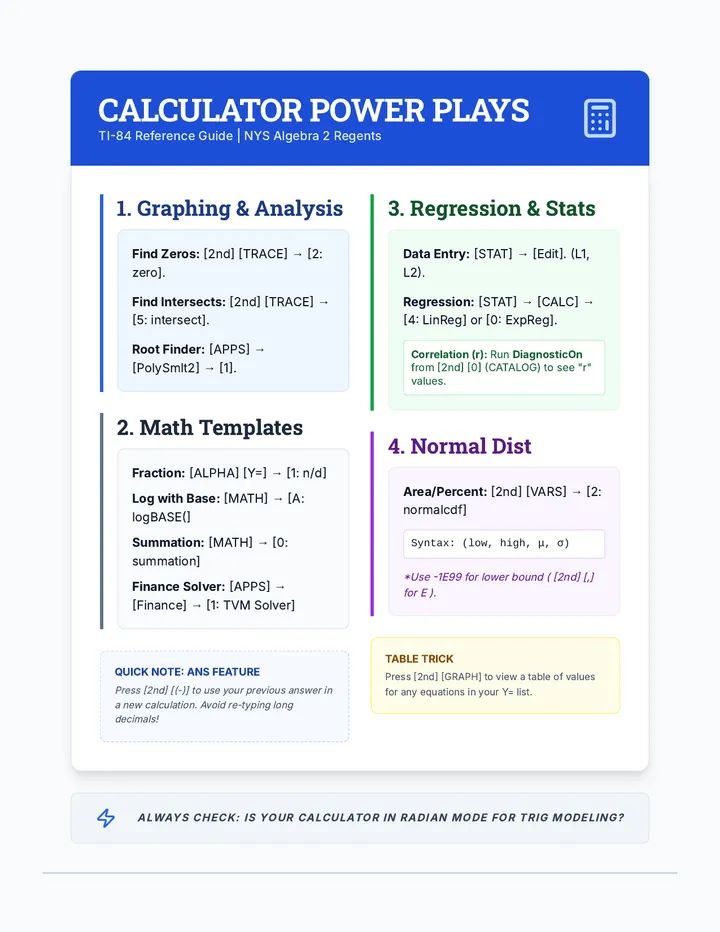
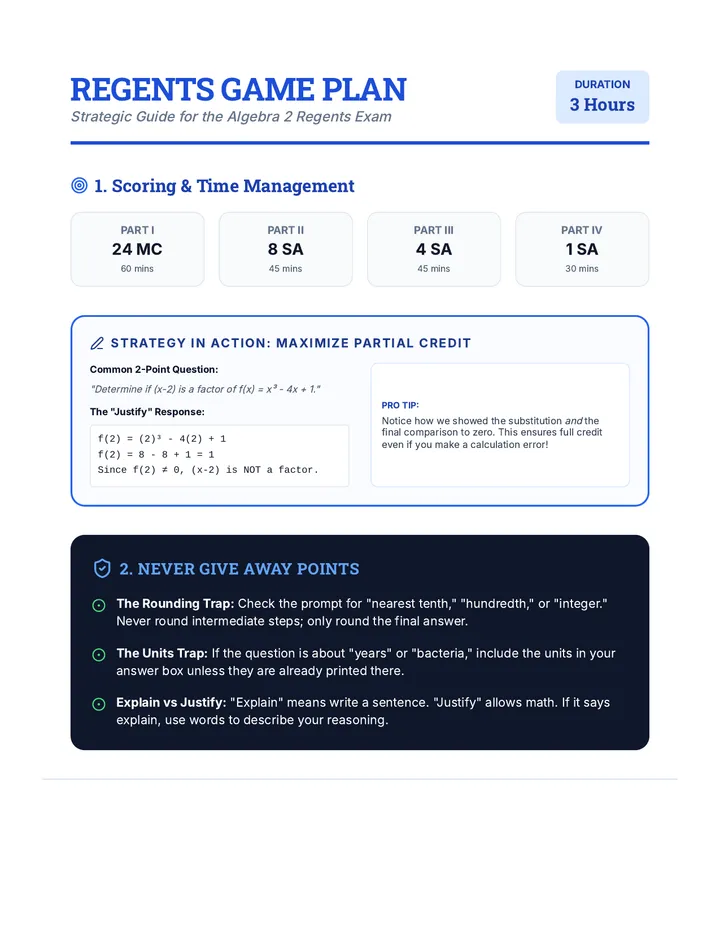
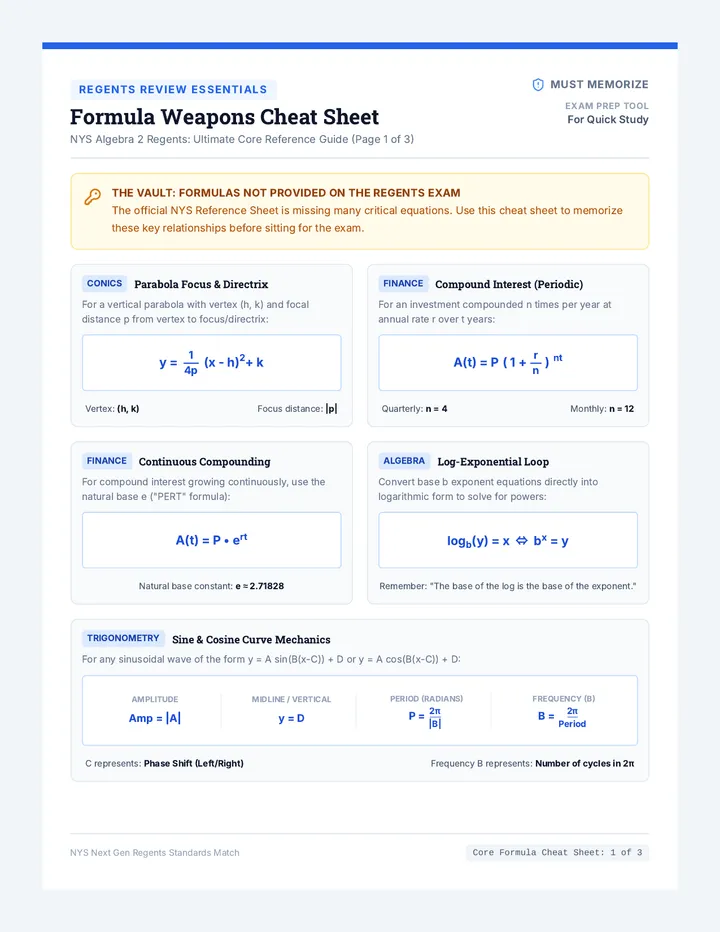
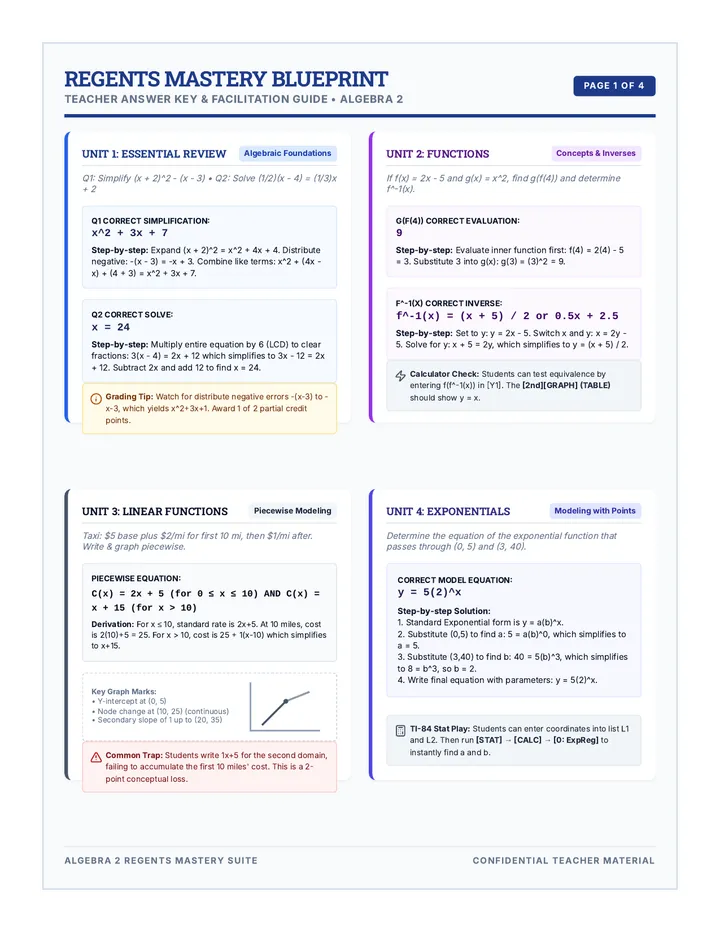
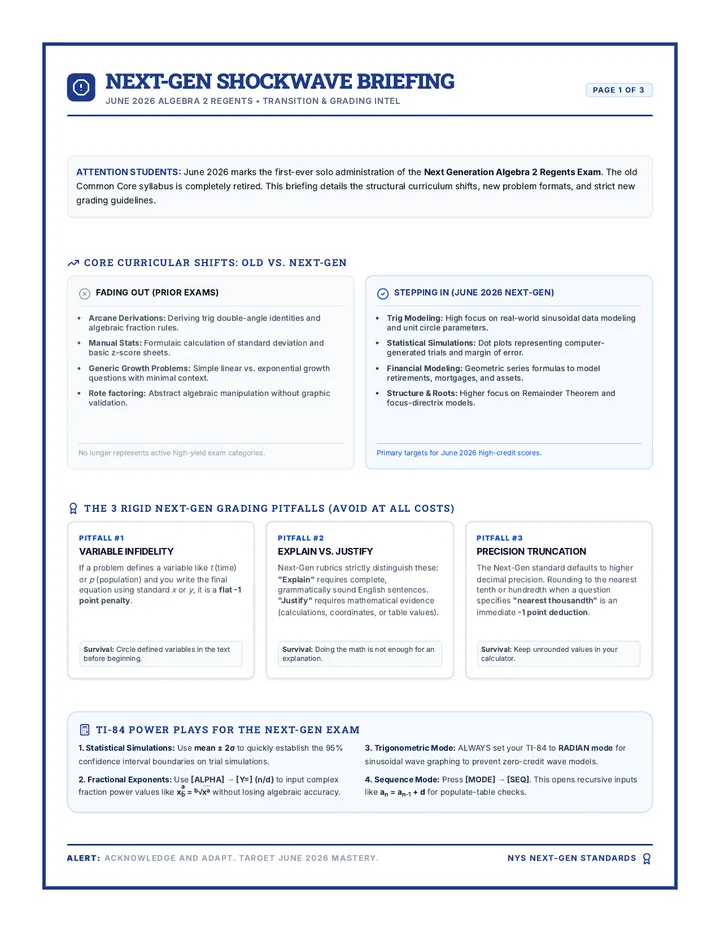
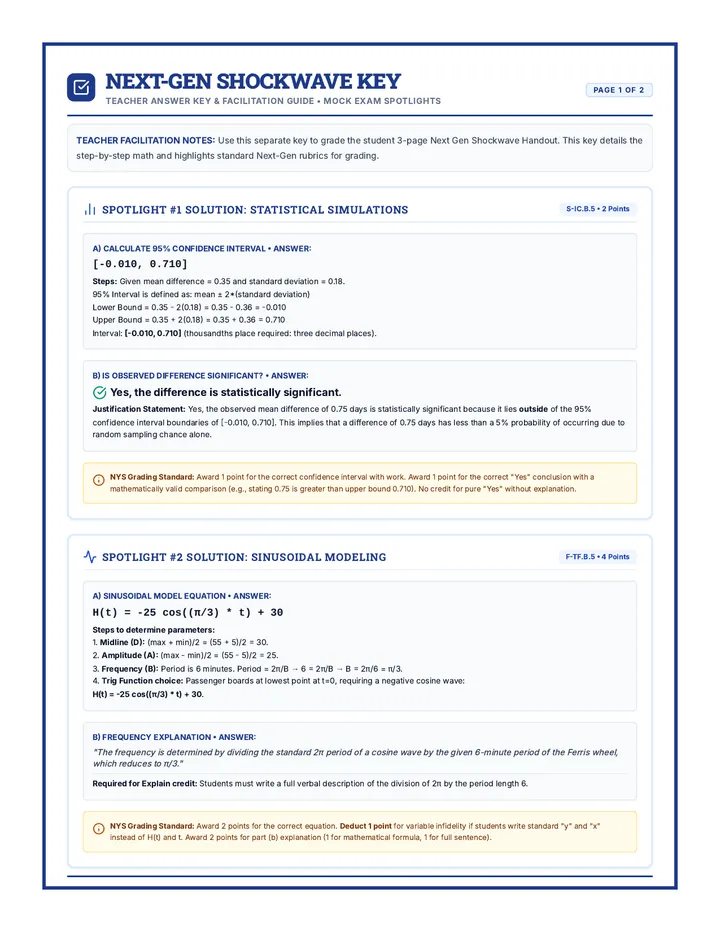
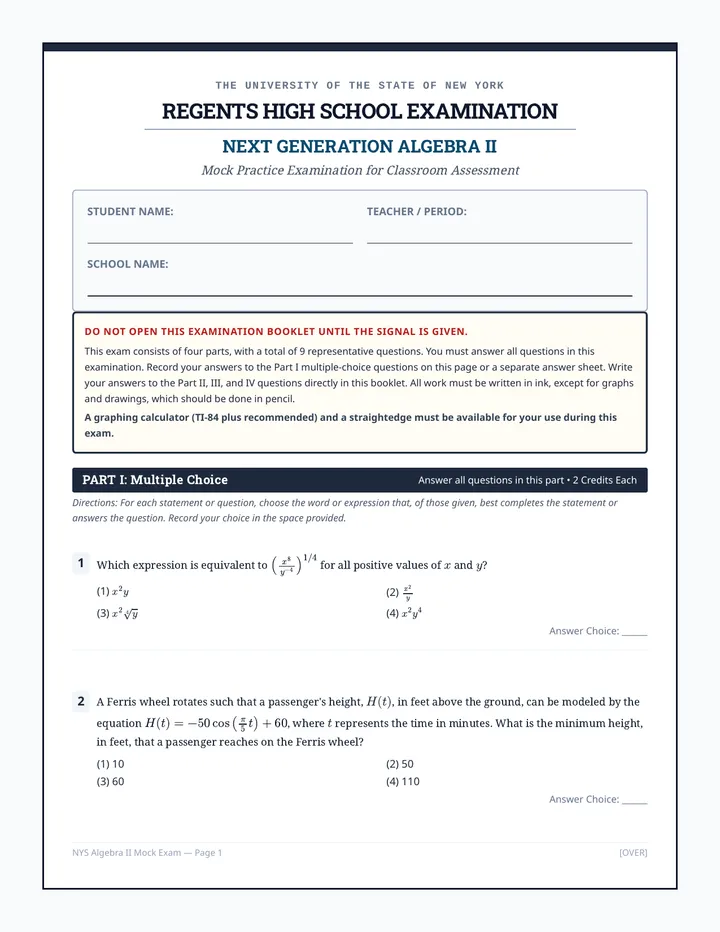
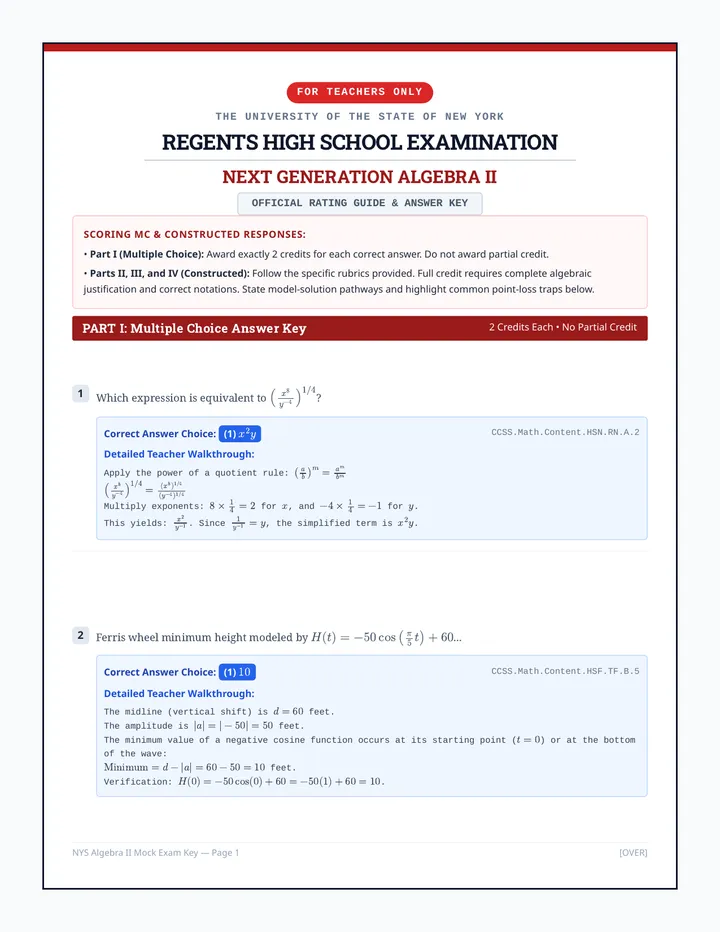
A comprehensive review suite for the New York State Mathematics Regents exams, including Algebra 1, Geometry, and Algebra 2, featuring mastery blueprints, calculator strategies, and exam-taking tips.
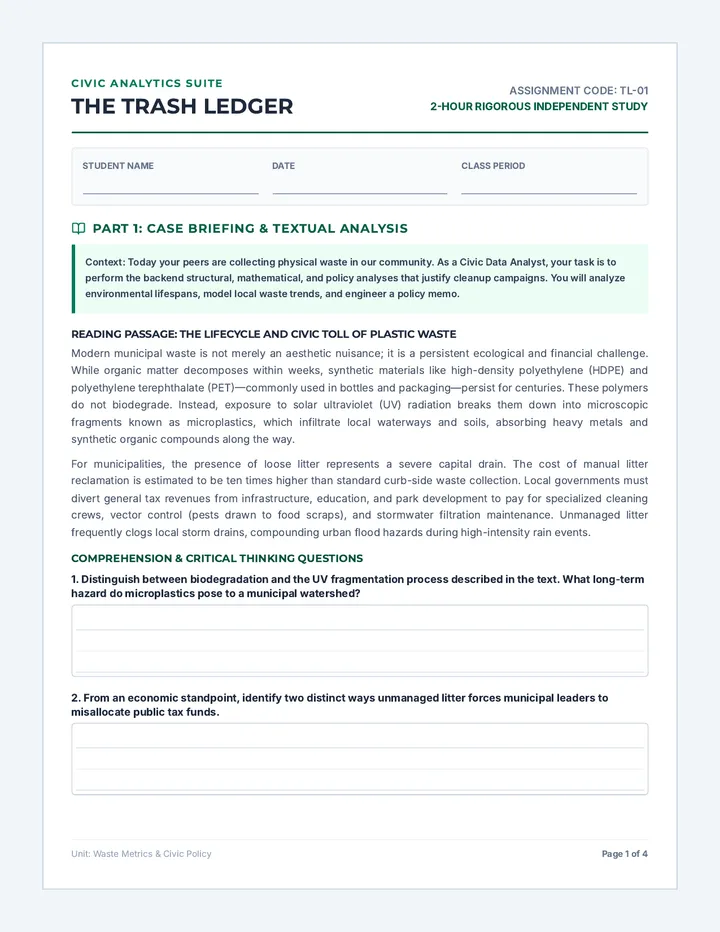
A rigorous mathematical and analytical alternative assignment for students missing the community service cleanup. Students analyze local waste data, calculate trash accumulation rates, and write a data-driven proposal to local leaders.
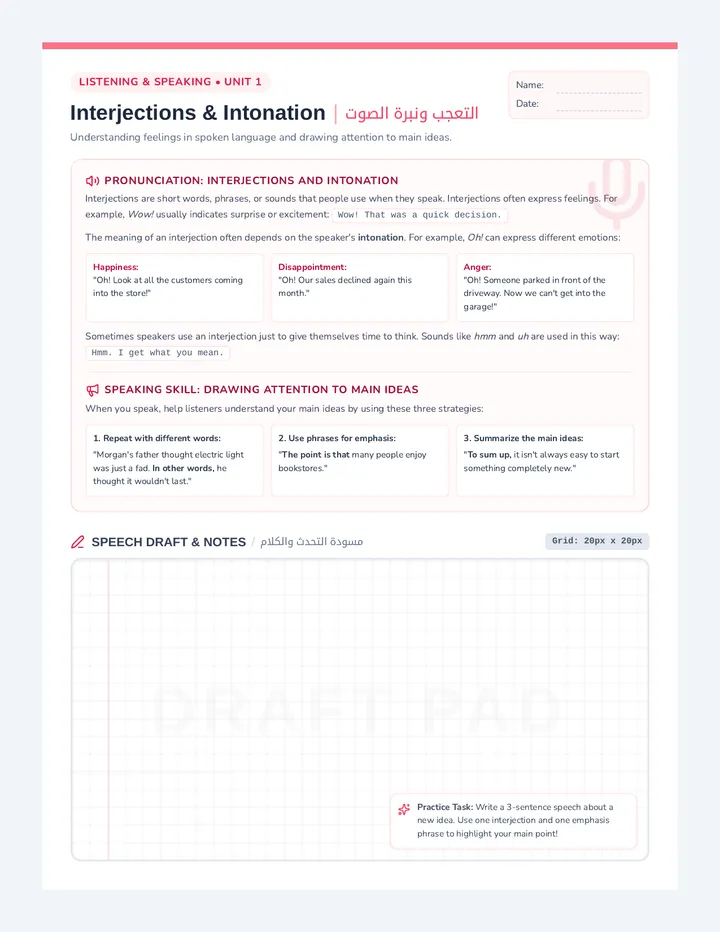
A premium, student-facing draft and rule booklet for English Listening and Speaking (L&S) across 8 core units of pronunciation and speech skills.