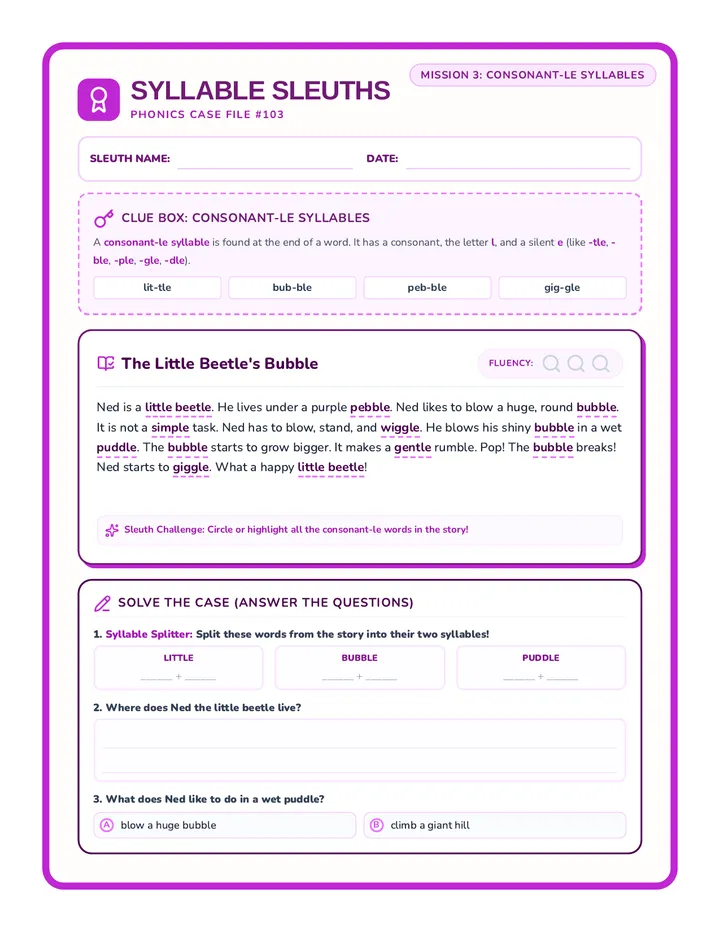
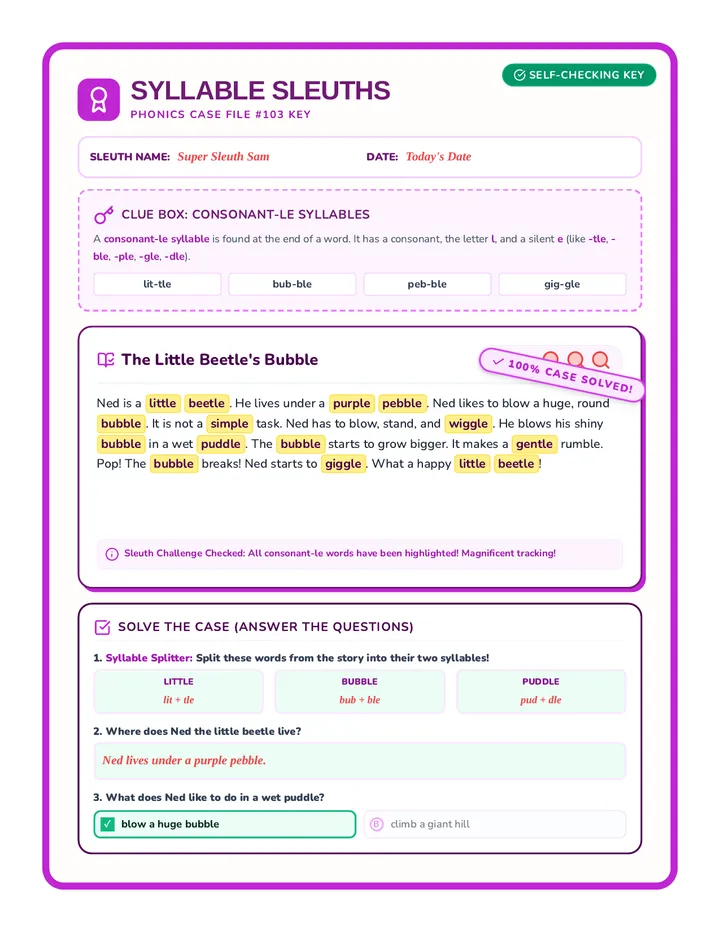
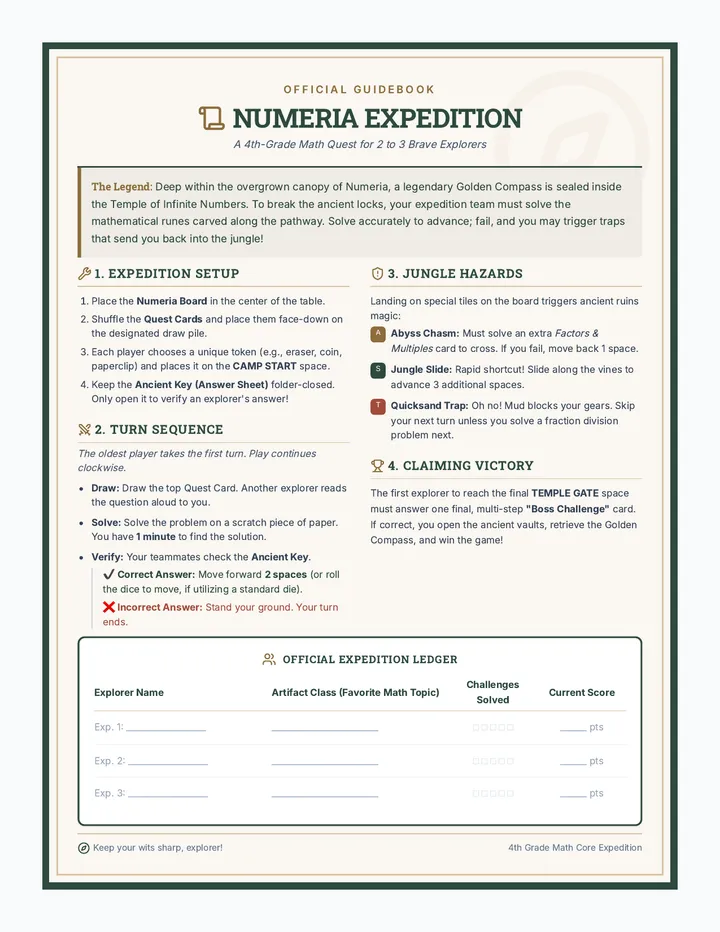
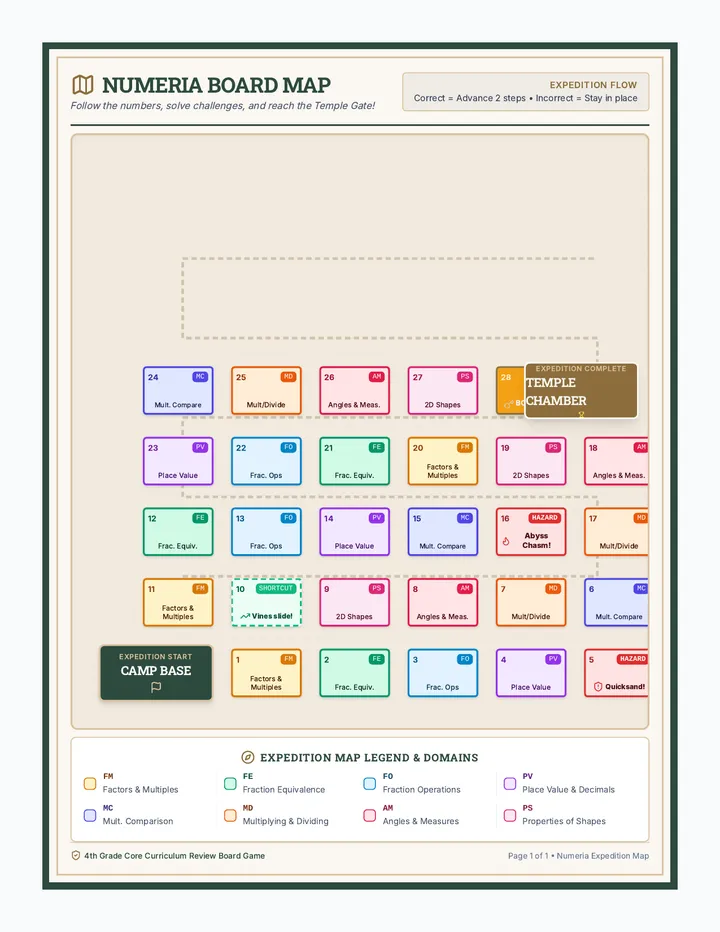
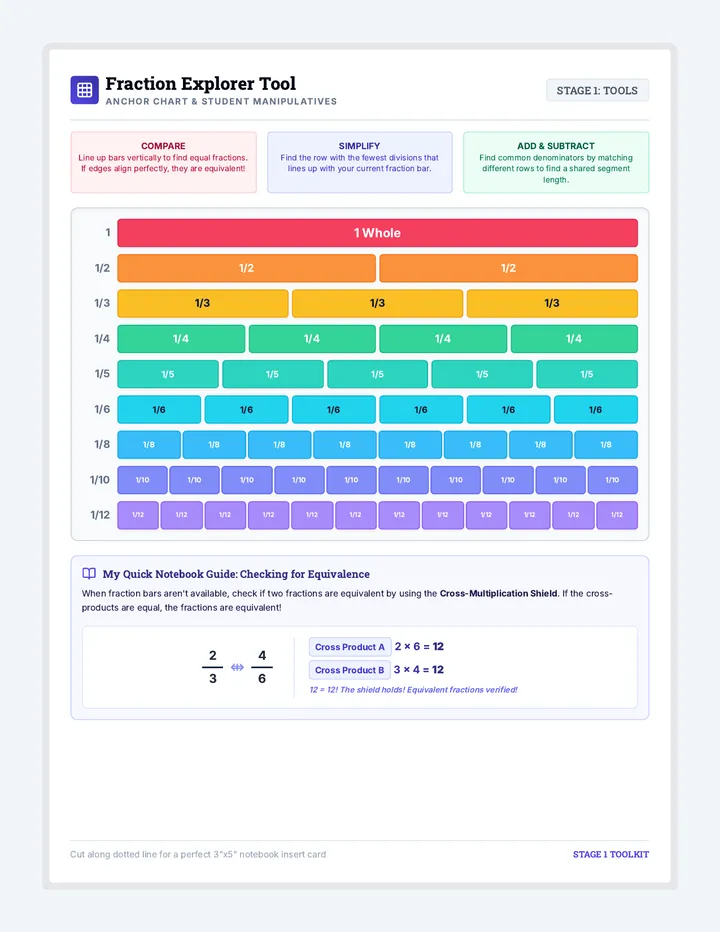
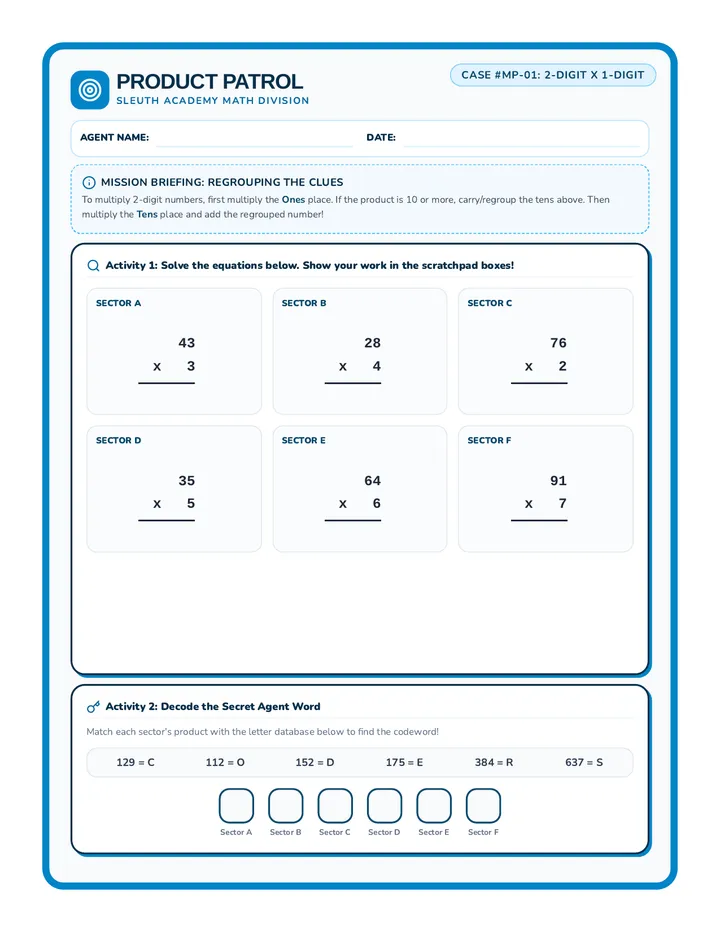
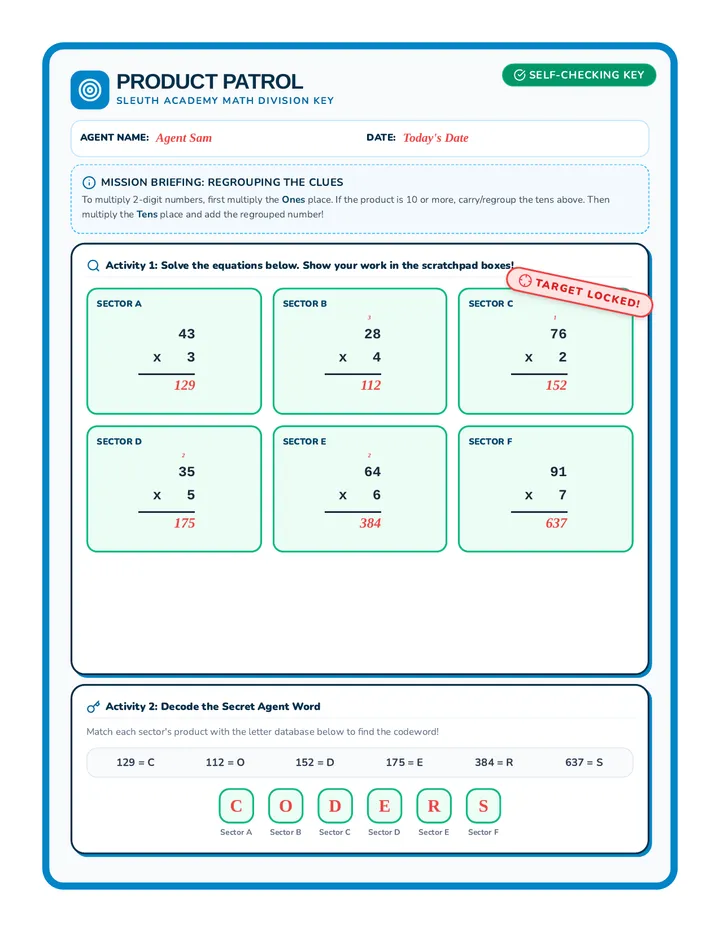
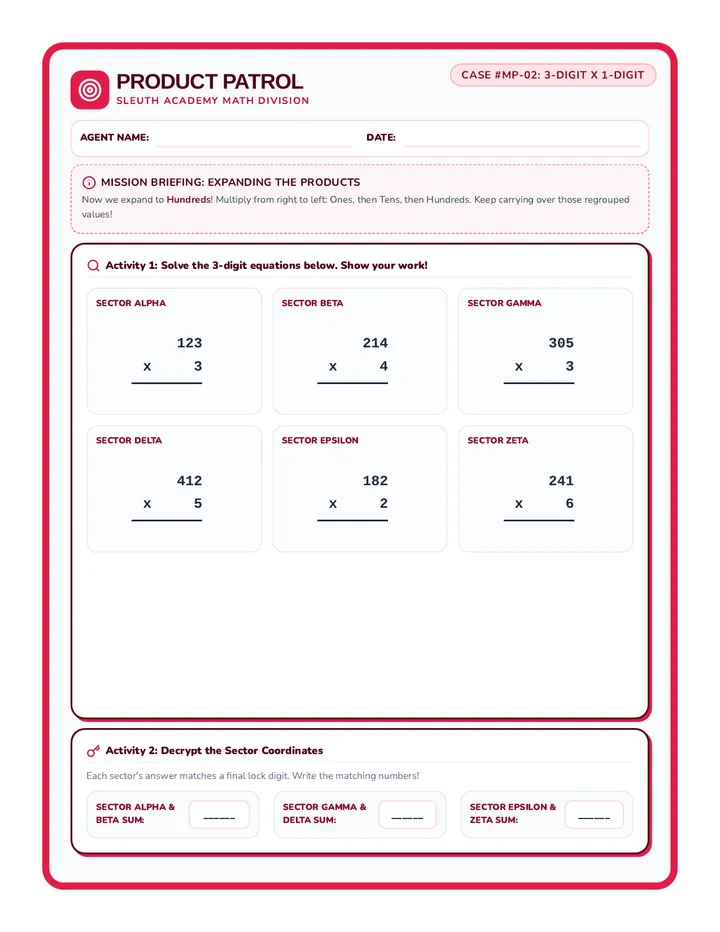
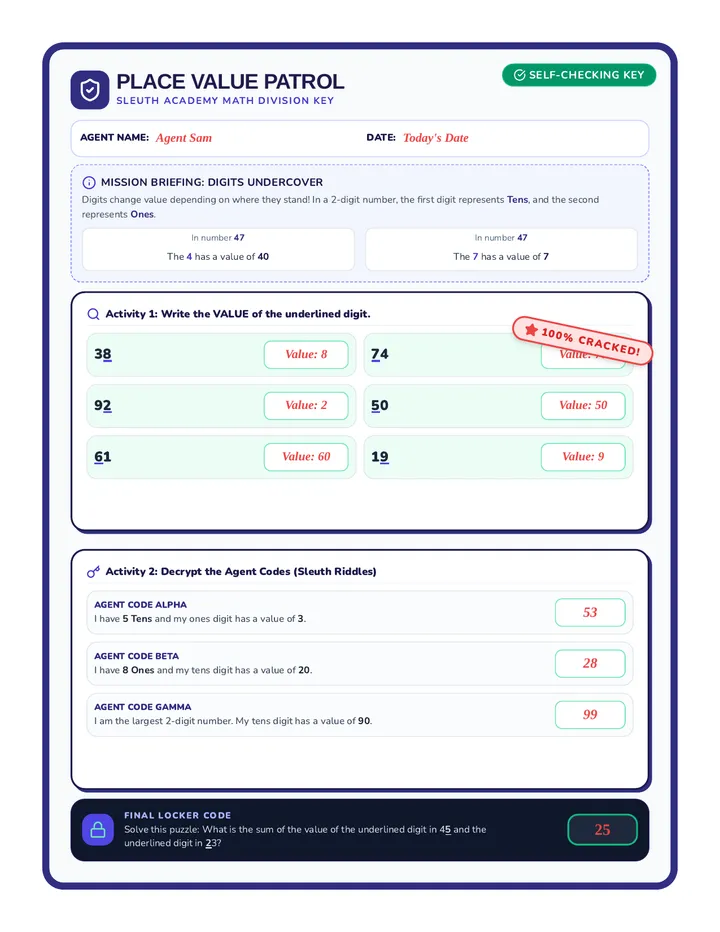
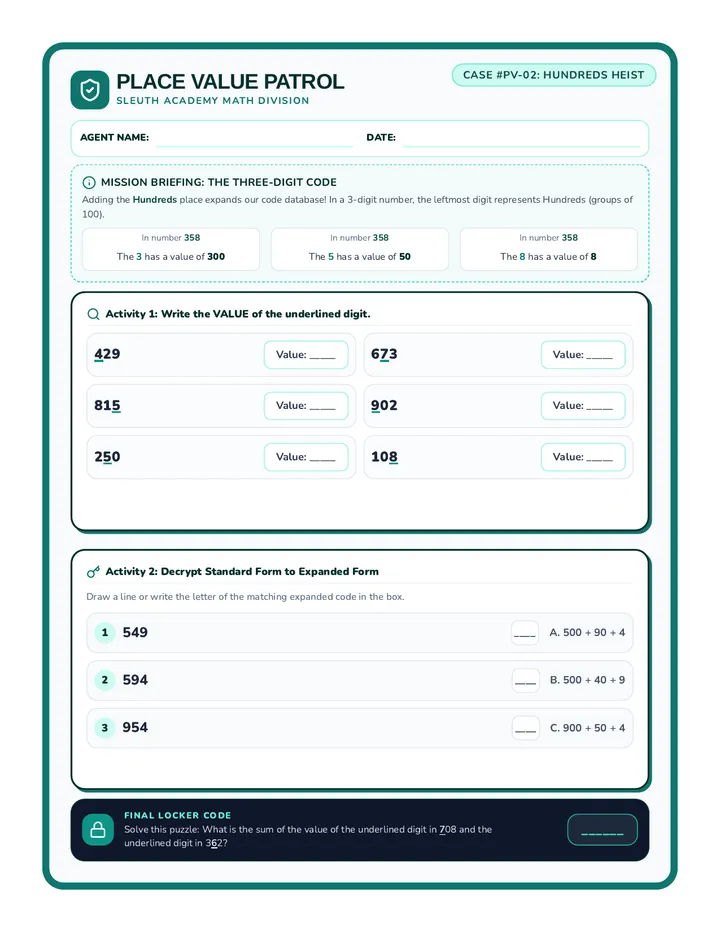
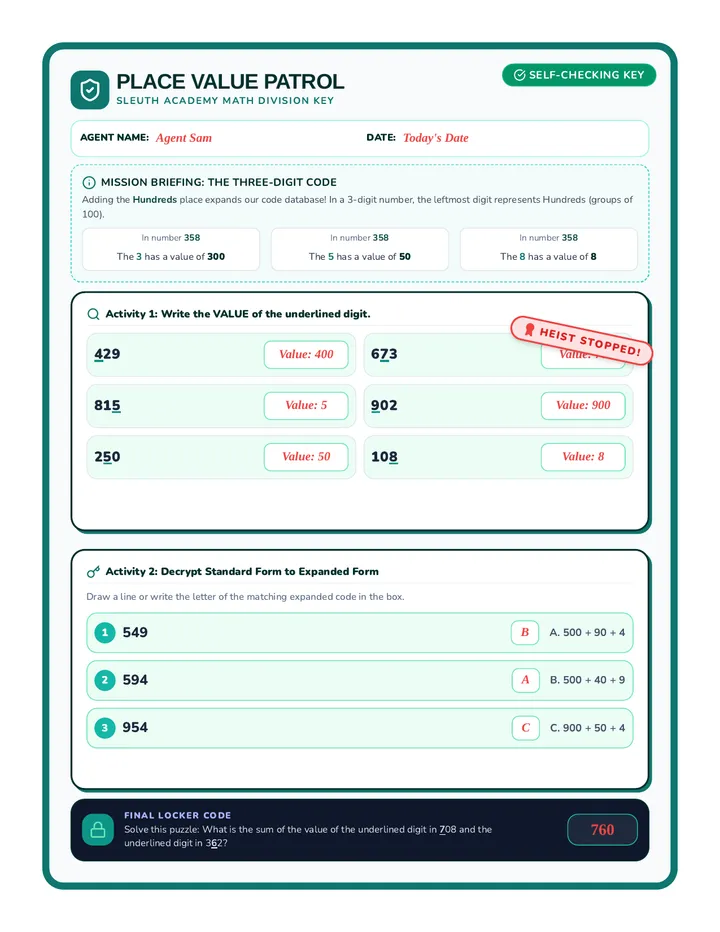
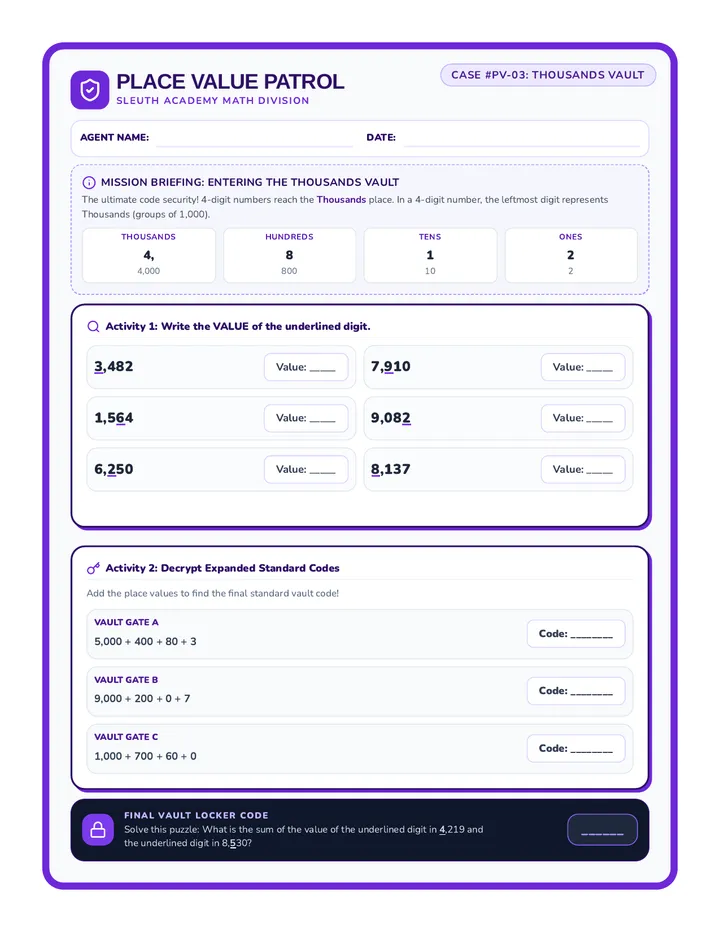
A comprehensive facilitator guide for a 50-minute professional development session, including a detailed timeline, scripts, and step-by-step instructions. Revised to ensure timeline sections stay together on printed pages.
An answer key for the Distribution Debrief Exit Ticket, providing correct answers and brief pedagogical explanations.
A brief end-of-lesson assessment checking student understanding of how outliers affect mean vs median and when to use specific statistical measures. Two tickets per page for efficient printing. Revised for layout and uniform answer choices.
A guide for the collaborative poster activity featuring specific case studies for students to analyze and 'peer review' cards for a gallery walk. Revised with larger peer review cards and better layout.
An answer key for the Case Notes handout, providing calculations for mean and median and clear explanations of why certain measures are preferred in symmetric vs skewed data. Revised for layout and clarity.
A student practice worksheet with two real-world scenarios comparing symmetric data to data with an outlier, requiring students to calculate measures and justify their selection. Layout optimized for 8.5x11 printing. Revised for single-page fit.
Visual presentation for the lesson including outlier identification, impact on mean vs median, and selection criteria for symmetric vs skewed data.
A detailed 90-minute teacher guide for a 6th grade math lesson on statistical measures and outliers, featuring a 'Data Detective' theme with a clear timeline, learning objectives, and teaching tips. Revised for better page breaks.
A set of 10 printable task cards featuring diverse binomial distribution scenarios. Perfect for station activities, group work, or extra practice bank. Includes integrated answer key. Now updated to include Expected Value (E[X]) calculations for every case.
A comprehensive answer key for the task-card edition of the Binomial Breakdown Worksheet, reformatted into individual 1/3-page cards to facilitate separate distribution or physical cutting. Each card provides detailed logic, modern BINOM.DIST syntax, and correctly rendered manual formulas. Updated for density and usability.
A 21-question practice worksheet for 12th-grade statistics, reformatted as a modular task-card bank. Designed with three horizontal cut-lines per page for easy physical division. Covers BINS criteria, spreadsheet formulas (BINOM.DIST), hand-calculation theory, and now includes questions on Expected Value (n*p). Card IDs and questions are aligned 1:1.
A visual presentation accompanying the Binomial Breakdown lesson. Covers BINS criteria, expected value (mean), spreadsheet formula syntax (BINOM.DIST), and the hand-calculation formula connection. Updated with a new slide for expected value (n*p) and improved summary visuals.
A three-page creative craft activity where students build a 'Measure Monster' and record its dimensions in inches, designed for kindergarten and supported for students with disabilities.
A set of four visual task cards for students to use during measurement activities, reinforcing the step-by-step process of using a ruler.
A structured student worksheet for measuring classroom objects with a ruler, featuring estimation boxes, actual measurement fields, and comparison prompts.
Instructional slides for measuring with a ruler, featuring step-by-step visuals for estimating, lining up at zero, and reading inch markings.
Teacher-facing lesson plan for standard measurement, including tiered support levels for students with moderate intellectual disabilities.
A printer-friendly set of 12 thematic task cards for 4th-grade math and a 2-page recording sheet. Optimized heights and spacing ensure all content fits on the page for clean printing. Includes cutting guides and clear student work areas.
A 3-page project-based learning guide for garden design. Layout updated for printer-friendliness, consistent student work area styling, and logical task instructions. Spacing optimized for physical writing.