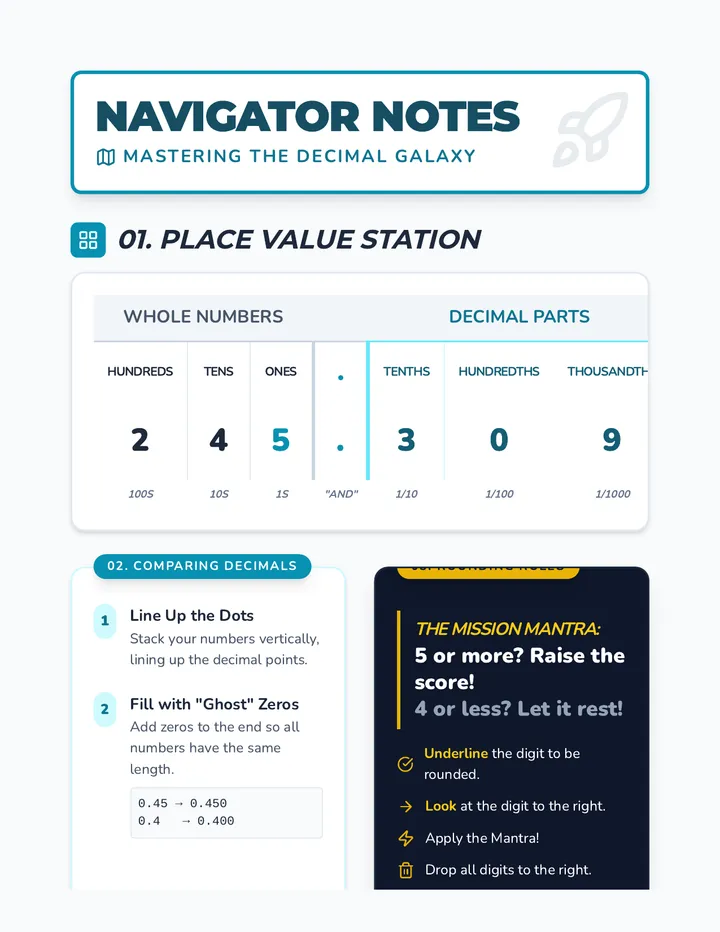
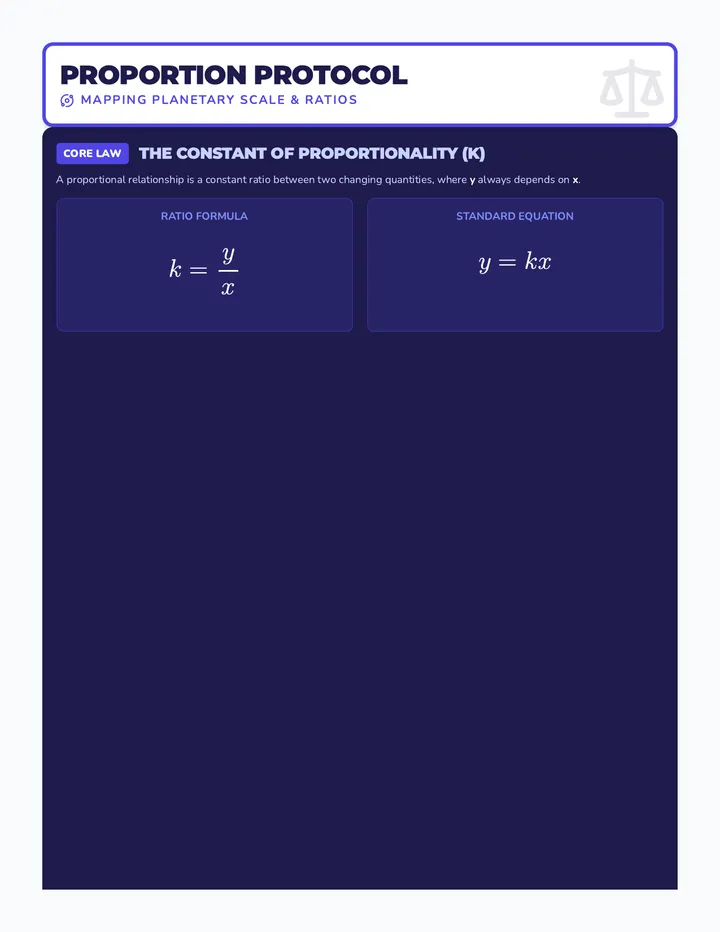
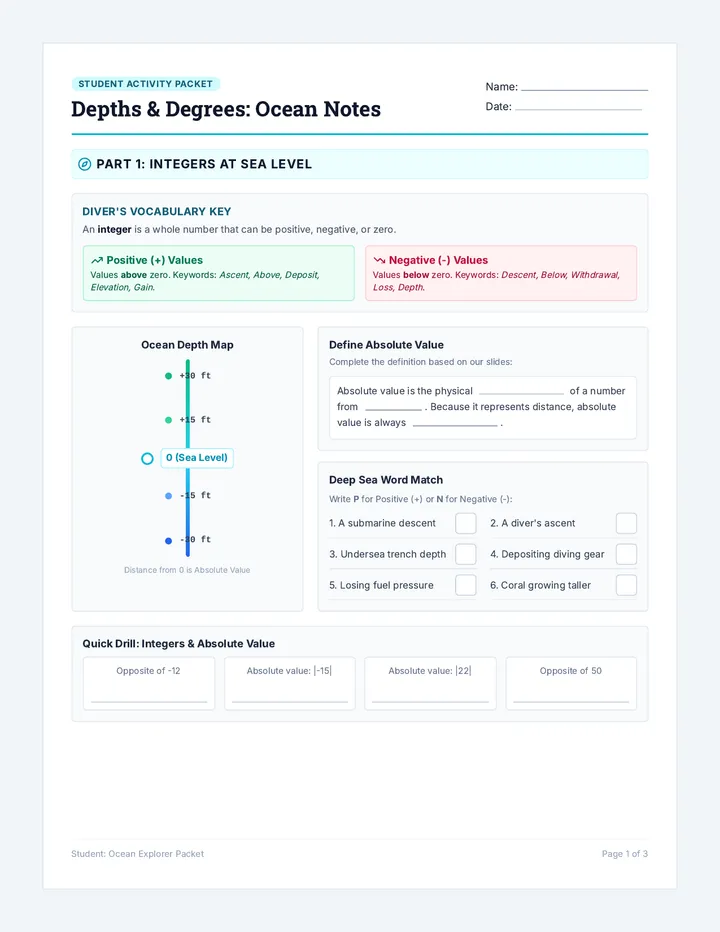
Stats Snapshot Reference
An updated one-page reference sheet now focusing on measures of variability (IQR and Range) with a brief review of mean and median. Features detailed visual diagrams for box plots and dot plots.
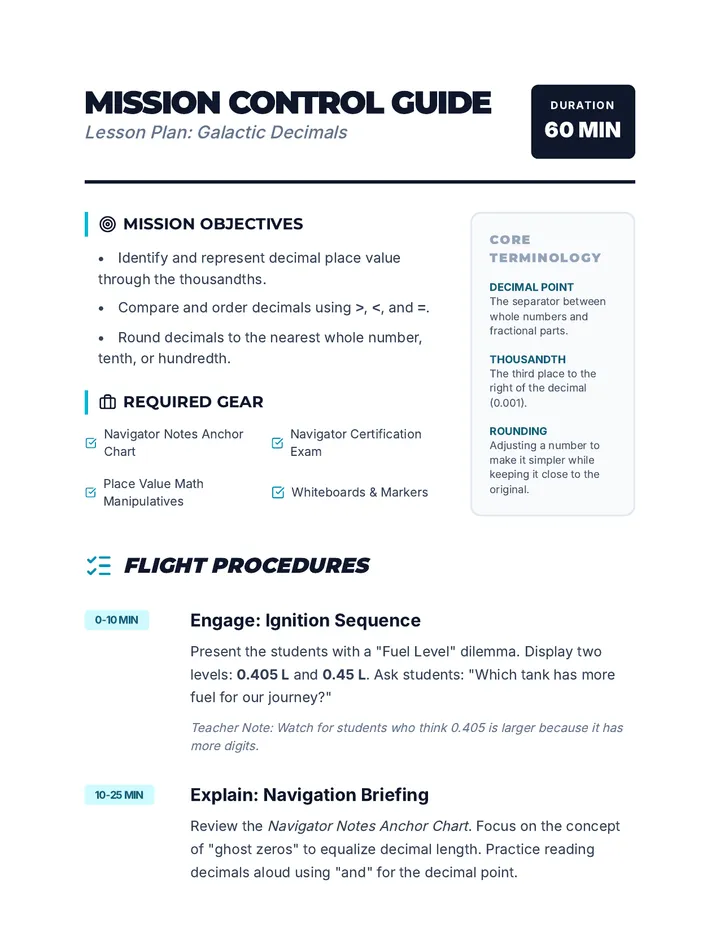
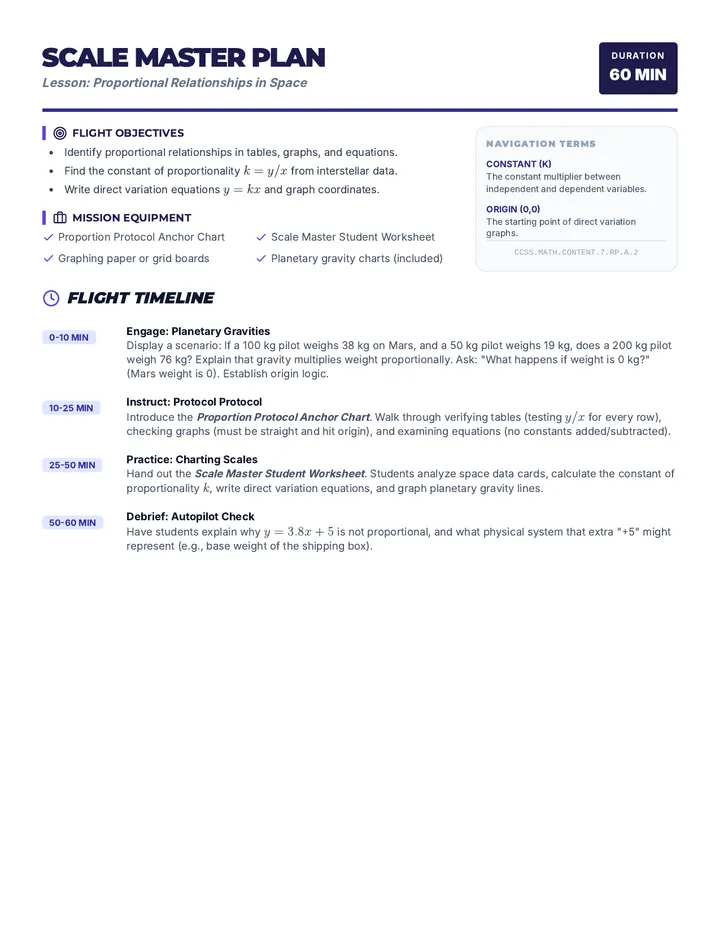
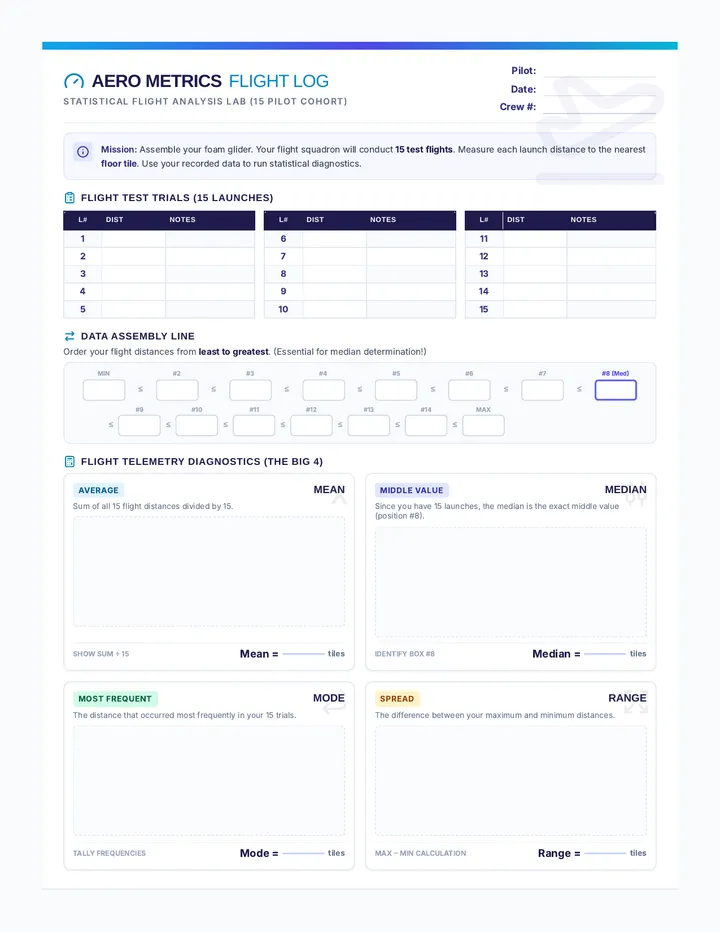
Data Detective Notes
Guided notes for students to follow along with the lesson, covering measures of center, measures of variability, and step-by-step comparisons using dot plots and box plots.
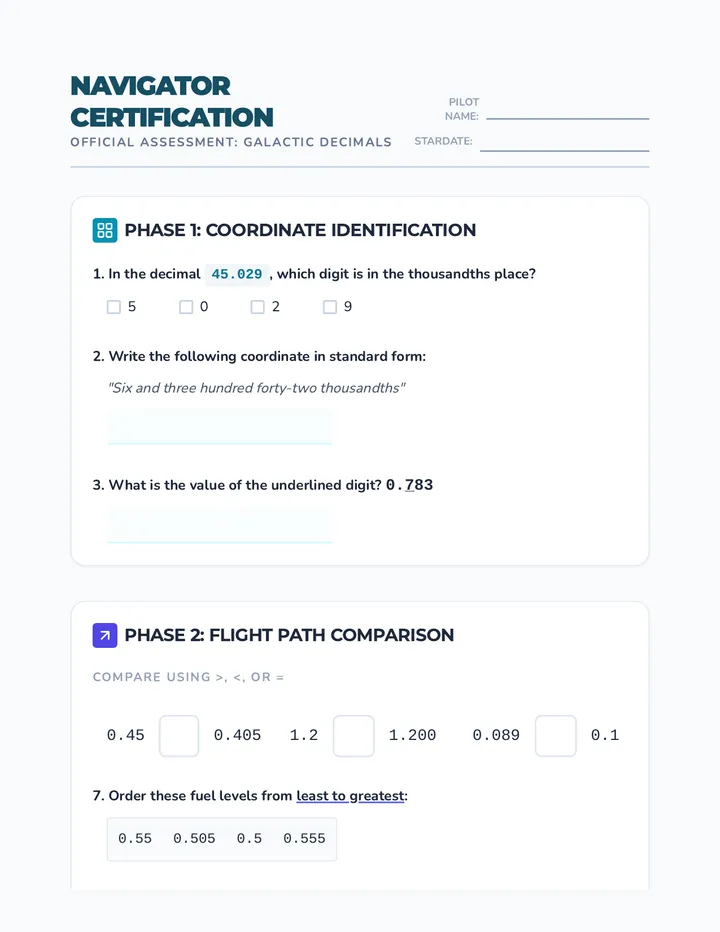
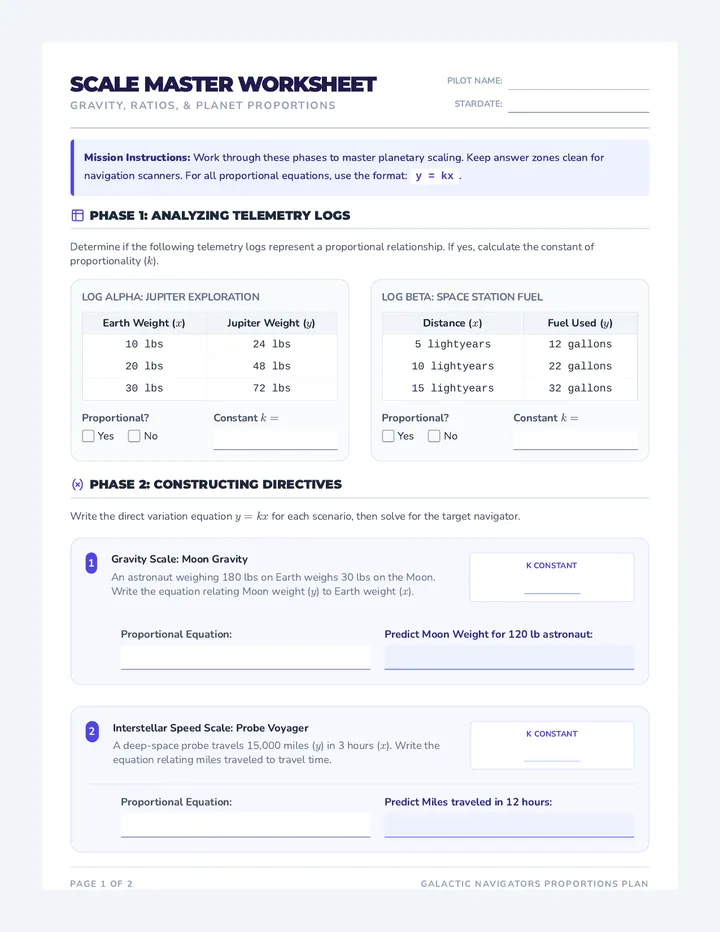
Comparison Challenge Problems
Revised practice problems focusing on measures of variability (Range and IQR) with improved visuals and legible labeling. Includes 5 challenging problems requiring students to compare consistency across dot plots, box plots, and data tables.
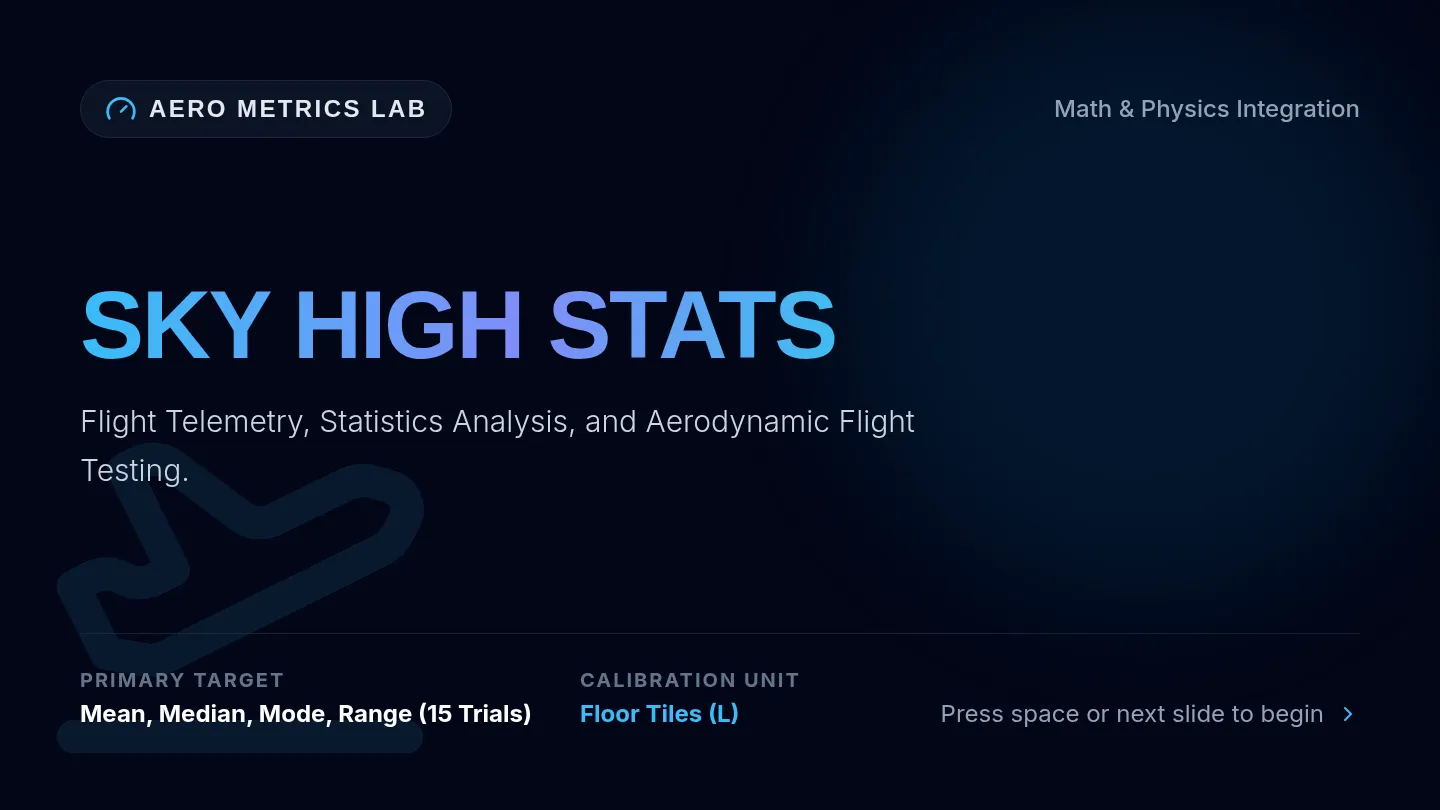
Stat Showdown Slides
A visual slide presentation for the Stat Showdown lesson, featuring high-contrast visuals, case studies, and clear explanations of mean, median, and IQR.
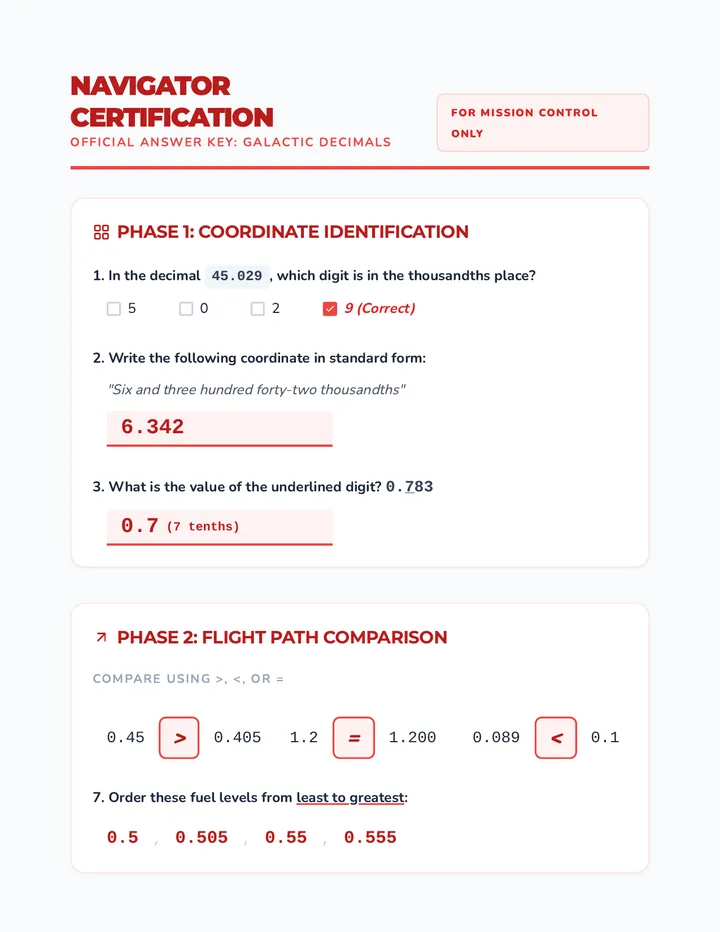
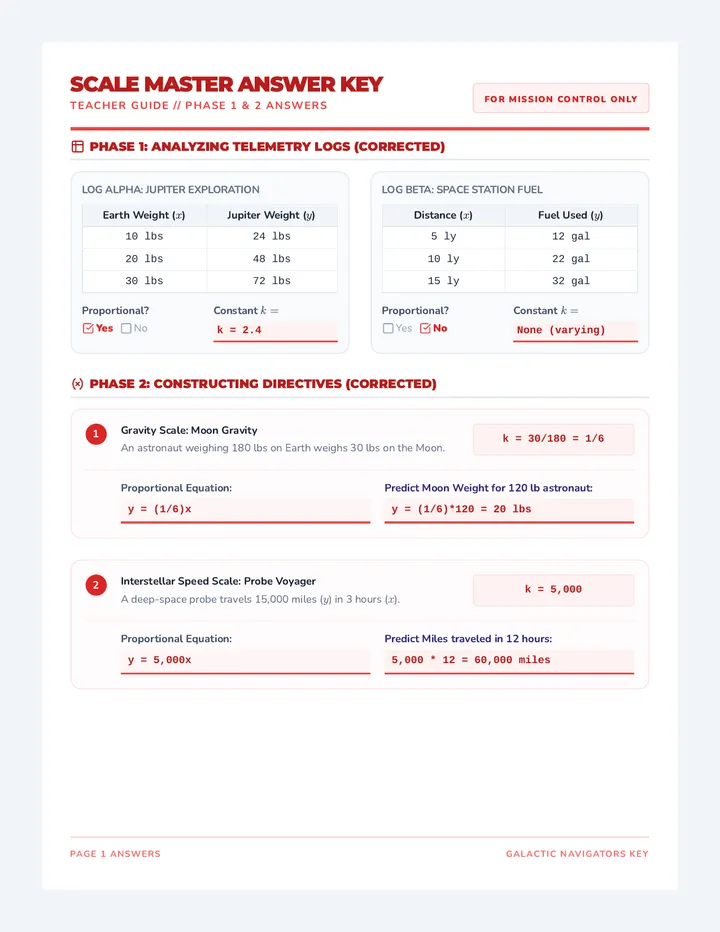
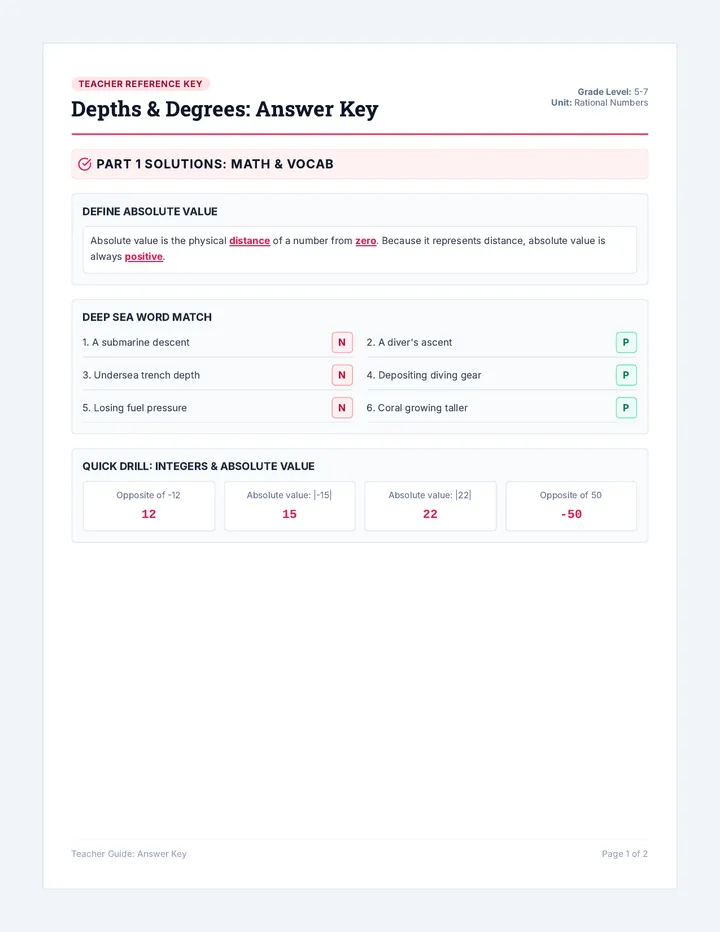
Case Closed Answer Key
The teacher's answer key for the practice problems, including detailed justifications and correct answers for all 5 challenge problems.
Stats Signal Notes
A concise guided notes worksheet defining greater/lesser center and greater/lesser variability with visual diagrams and fill-in-the-blank logic prompts.