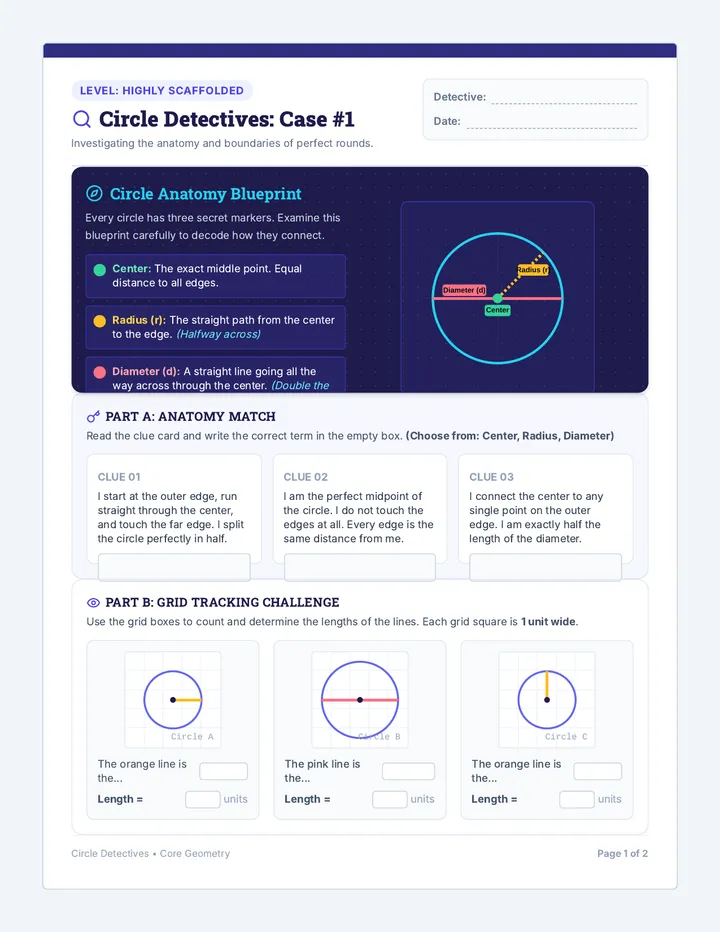
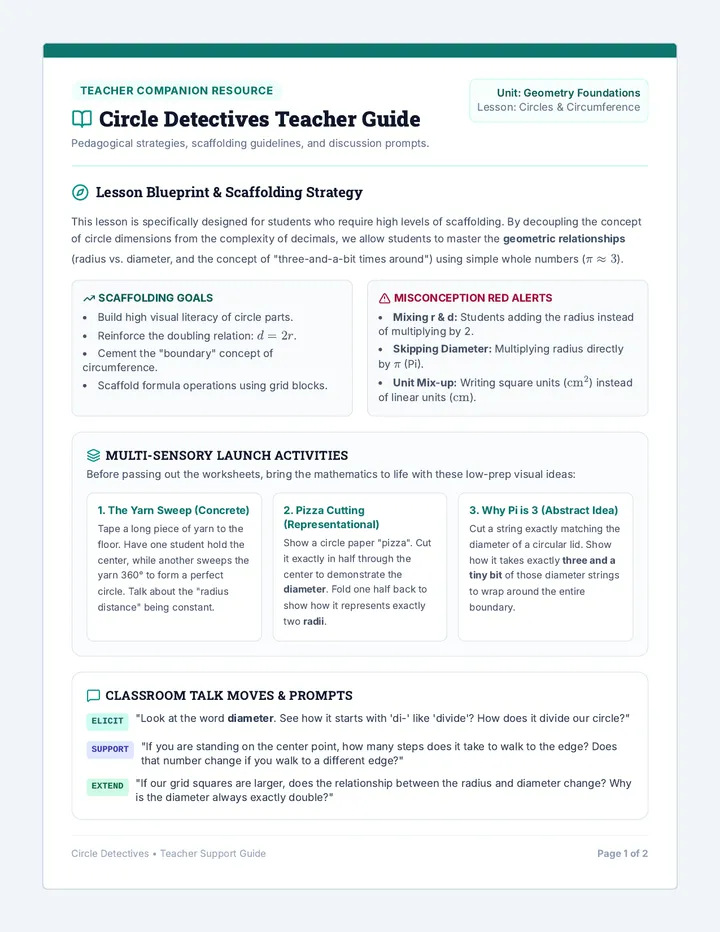
Stat Scout Slides Field Data Log
STAT SCOUT
Comparing Populations through Data
The Mission
Are you faster with your dominant hand?
1
Collect Data: Measure reaction times for your dominant vs. non-dominant hand.
2
Visualize: Create side-by-side dot plots to see the overlap.
3
Analyze: Compare the "Center" and the "Spread".
The Question
Does one population (hand type) have a significantly faster reaction time than the other?
Reaction Time Grab
How to Measure:
Partner holds a ruler vertically at the 30cm mark.
Your hand waits at the 0cm mark (ready to pinch).
Partner drops; you catch!
Record the cm where your fingers landed.
Smaller number = Faster reaction!
30 cm
0 cm
Side-by-Side Visuals
Dominant Hand
10
15
20
Non-Dominant Hand
10
15
20
Look for the Overlap. Are the clusters in different places?
The Stat Scouting Kit
Measure of Center
Where is the "typical" value?
Median The Middle Value
Mean The Average
Measure of Spread
How consistent is the data?
Range High - Low
MAD Avg. Distance from Mean
"If the centers are far apart and the spread is small, we have a clear winner!"
Drawing Inferences
The "Stat Scout" Sentence Frame:
"I infer that Population A generally has a Higher/Lower result than Population B because its Median/Mean is significantly Greater/Less."
Always use data values to support your claim!
Analyze
Compare
Infer
Stat Scout Worksheet Stat Scout: Field Report
Comparing Dominant vs. Non-Dominant Reaction Times
Agent Name:
Date Logged:
1
Data Collection
Complete 10 trials for each hand. Record the catch distance in centimeters (cm).
Dominant Hand (Pop. A)
T1
T2
T3
T4
T5
T6
T7
T8
T9
T10
Non-Dominant Hand (Pop. B)
T1
T2
T3
T4
T5
T6
T7
T8
T9
T10
2
Visual Comparison
Plot your data points on the dot plots below. Use an "X" for each value.
Dominant Hand (Pop. A)
024681012141618202224262830
Non-Dominant Hand (Pop. B)
024681012141618202224262830
3
Scouting Stats
Calculate the following measures for each population using your data.
Dominant Hand
Median:
Range:
Non-Dominant Hand
Median:
Range:
4
The Verdict
Look at your visuals and your stats. What can you say about the two populations?
Official Inference
Based on my data, the ________________________ hand is generally faster. I know this because its (measure of center) median was __________, which is __________ than the other hand's median of __________.
In terms of consistency, the ________________________ hand was more consistent because its (measure of spread) range was __________ cm, compared to __________ cm for the other hand.
Scout's Reflection
If you tested 100 people, would you expect to see a similar pattern? Why or why not?
Stat Scout Inference Scorecard Inference Scorecard
Name:
The Case: Basketball Heights
A scout is comparing the heights (in inches) of two local basketball teams: the Blue Jays and the Orange Hawks.
Blue Jays (inches)
6062646668707274767880
Median: 68 in. Range: 14 in.
Orange Hawks (inches)
6062646668707274767880
Median: 74 in. Range: 10 in.
Final Scouting Report
1. Comparative Center:
The ____________________ are generally taller. I know this because their median height is ________ inches, which is ________ inches greater than the other team's median.
2. Comparative Variability:
The ____________________ have more variation in their heights. I know this because their range of ________ inches is larger than the other team's range of ________ inches.
3. Overlap & Inference:
Looking at the clusters, there is (circle one: a lot / very little) overlap between the two teams. Because of this, I can infer that if I picked one random player from each team, the player from the ____________________ would most likely be taller.
Stat Scout Teacher Guide Coach's Playbook
Teacher Facilitation Guide: Stat Scout Showdown
7.SP.B.4
Objective
Students will use measures of center and variability to draw informal comparative inferences about two populations.
Prerequisites
Calculating Median, Range; basic understanding of dot plots as a visual representation.
Materials
30cm rulers, "Stat Scout" slides & worksheets, colored pencils (optional for plotting).
1. THE LAUNCH (5-7 MINS)
Small Group Hook:
"Scouts don't just guess who the best athlete is—they use data to prove it. Today, we are scouting the difference between your dominant and non-dominant hands."
Review the **Reaction Time Grab** procedure using the slides.
Model one trial: emphasize catching the ruler quickly and reading the bottom of the fingers.
**Scaffold:** Ask, "If my fingers land at 25cm, is that faster or slower than 5cm?" (Ensure they understand smaller = faster).
2. FIELD WORK (15-20 MINS)
Facilitation Strategy:
Support for Plotting:
Some Tier 2 students struggle with the scale. Help them count by 2s on the dot plot axis. Encourage them to use two different colors for Pop A and Pop B to visually separate the clusters.
Support for Stats:
Remind students to list their 10 numbers from least to greatest before finding the median. For the range, provide a "High - Low = Range" sticky note.
3. THE VERDICT (10 MINS)
Key Conceptual Question:
"If the median of Pop A is much lower than Pop B, and there is almost no overlap, what does that tell you about the populations?"
Tier 2 Sentence Frame Support:
"The __________ hand is generally faster because its median of ____ cm is less than the other median of ____ cm."
4. PROGRESS MONITORING
Success Criteria:
Student correctly identifies which population has a higher/lower center.
Student uses the range to describe consistency/variability.
Student uses specific numerical evidence in their final inference statement.
CO Standard 7.SP.B.4: Use measures of center and measures of variability for numerical data from random samples to draw informal comparative inferences about two populations.