Corner Proof Slides
Instructional slide deck for teaching the relationship between slope and perpendicular lines, including a warm-up prompt, video embed placeholder, key rules, and discussion questions.
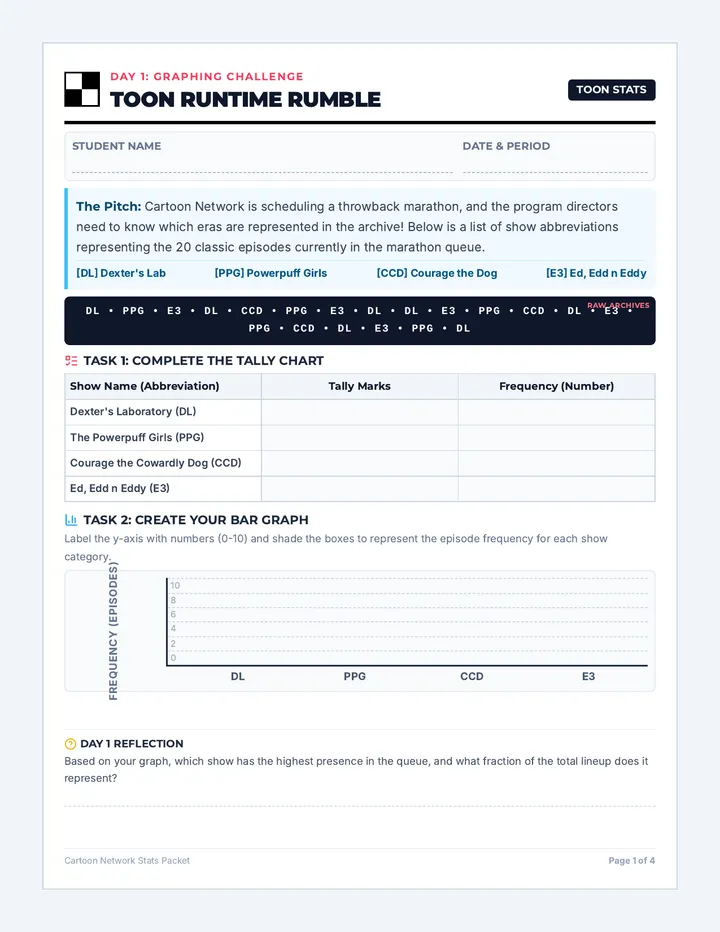
Corner Proof Worksheet
Student worksheet where students calculate slopes for two different triangles given their coordinates to prove whether they are right triangles using the negative reciprocal rule.
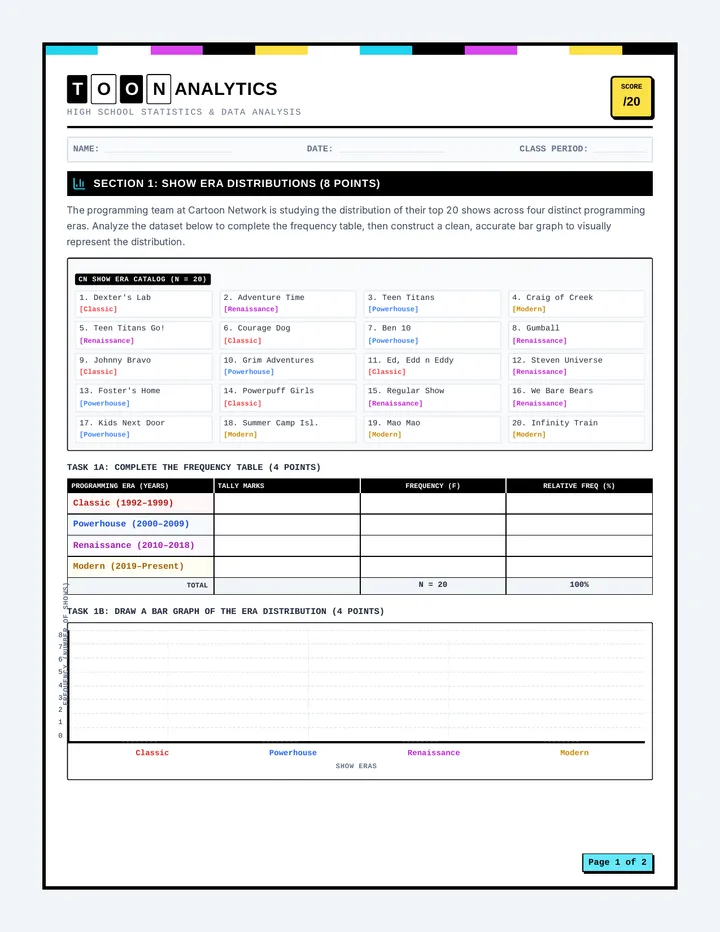
Corner Proof Graph Paper
A specialized graph paper with two coordinate planes pre-aligned for the triangle coordinate investigations in the lesson.
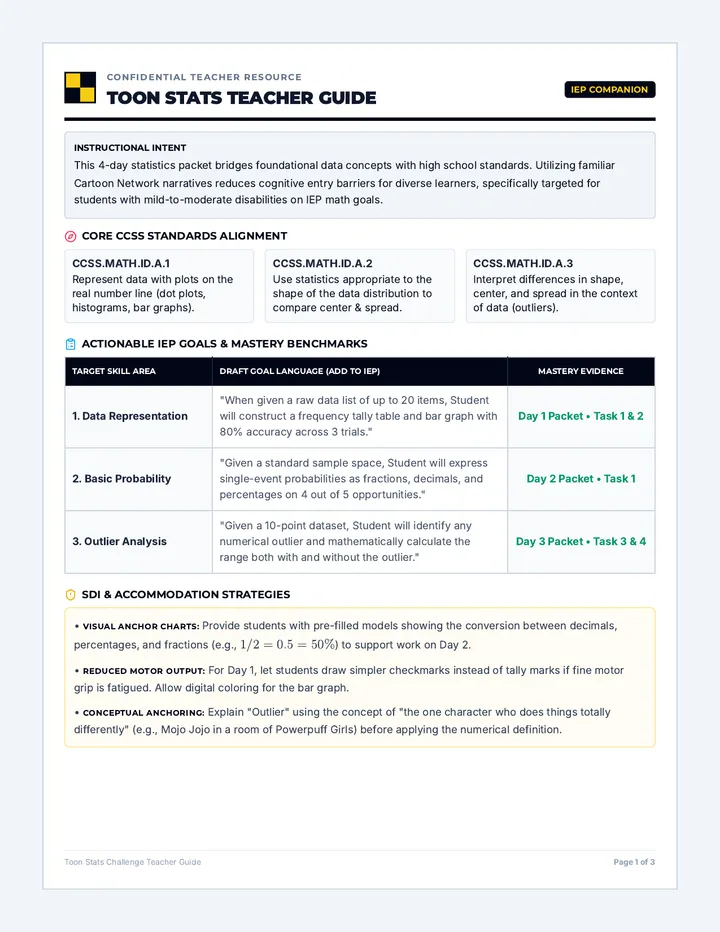
Corner Proof Teacher Guide
Teacher guide for the Corner Proofs lesson, providing pacing instructions, discussion prompts, and differentiation strategies for teaching perpendicular slopes.
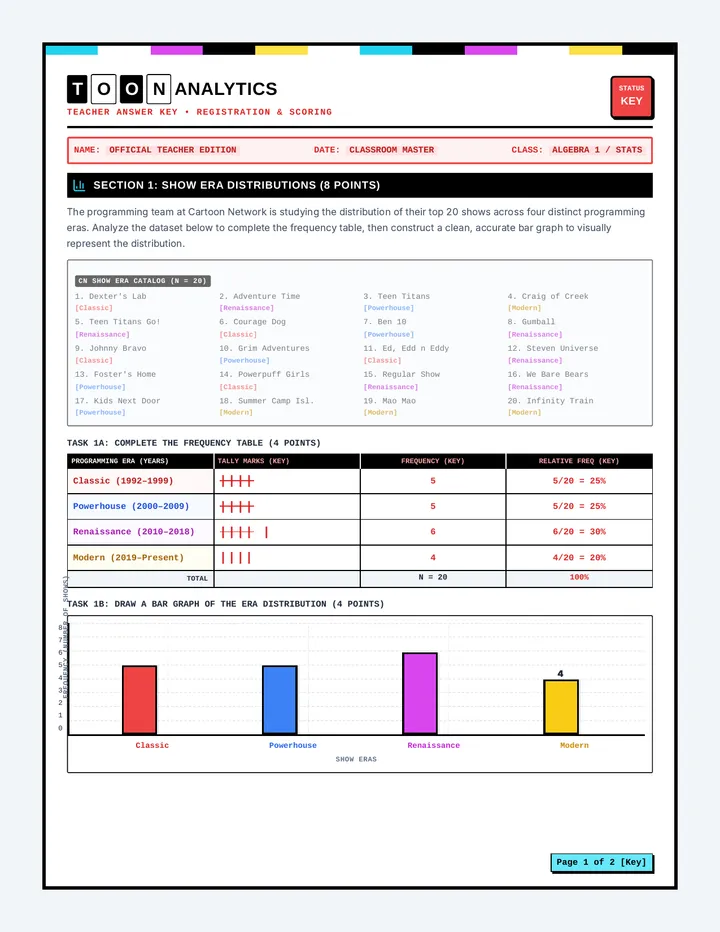
Corner Proof Answer Key
Answer key for the Corner Proof Worksheet, including step-by-step slope calculations and the final geometric verdict for each triangle.