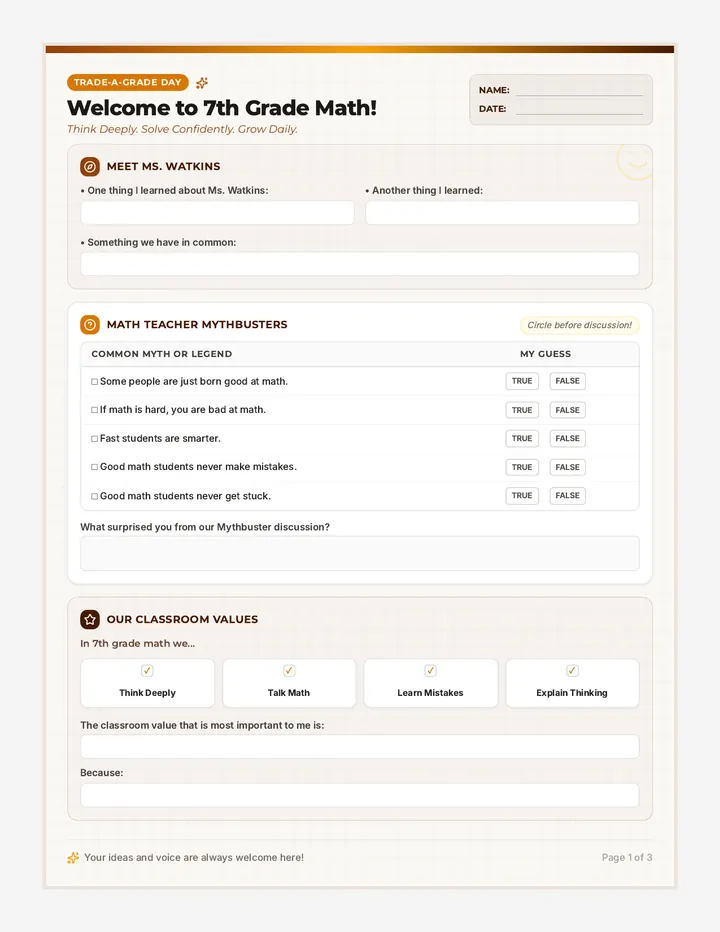
Plotting Patterns Teacher Guide
A comprehensive teacher facilitation guide for the Plotting Patterns lesson, featuring a detailed timeline, warm-up clues, video pause points, and common student misconceptions.
Plotting Patterns Slides
Engaging slide presentation for the Plotting Patterns lesson. Includes a visual warm-up, embedded YouTube video refresher, an anatomy breakdown of the coordinate plane, and clear project instructions.
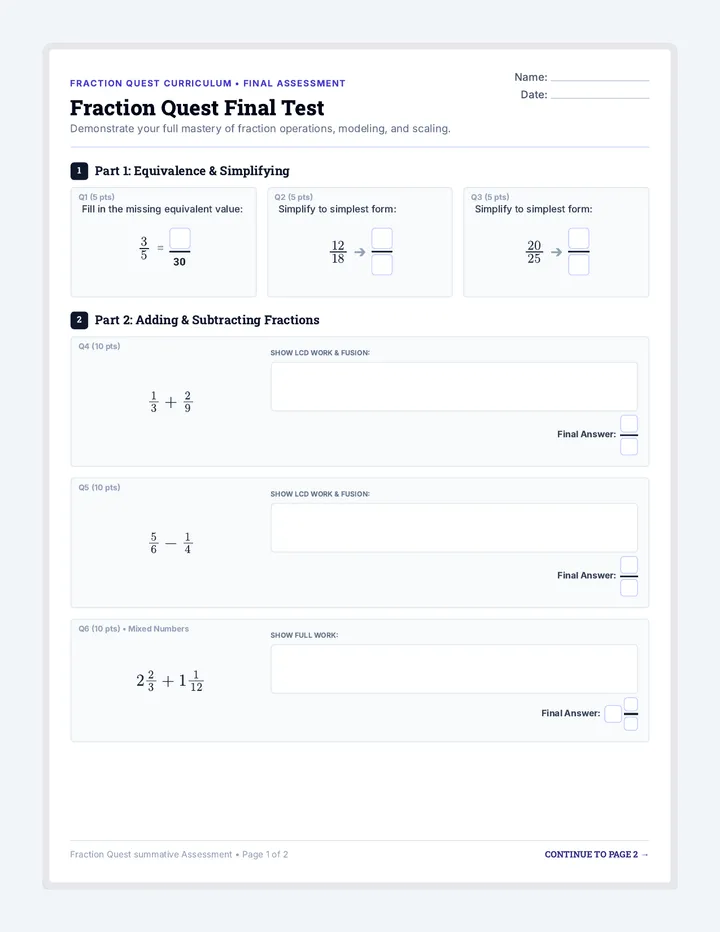
Plotting Patterns Worksheet
The student worksheet for the Plotting Patterns lesson. Features a "Mystery Robot" plot-by-number challenge, a blank grid for creative geometric art, and a structured area for students to list their own coordinates for a peer-swap activity.
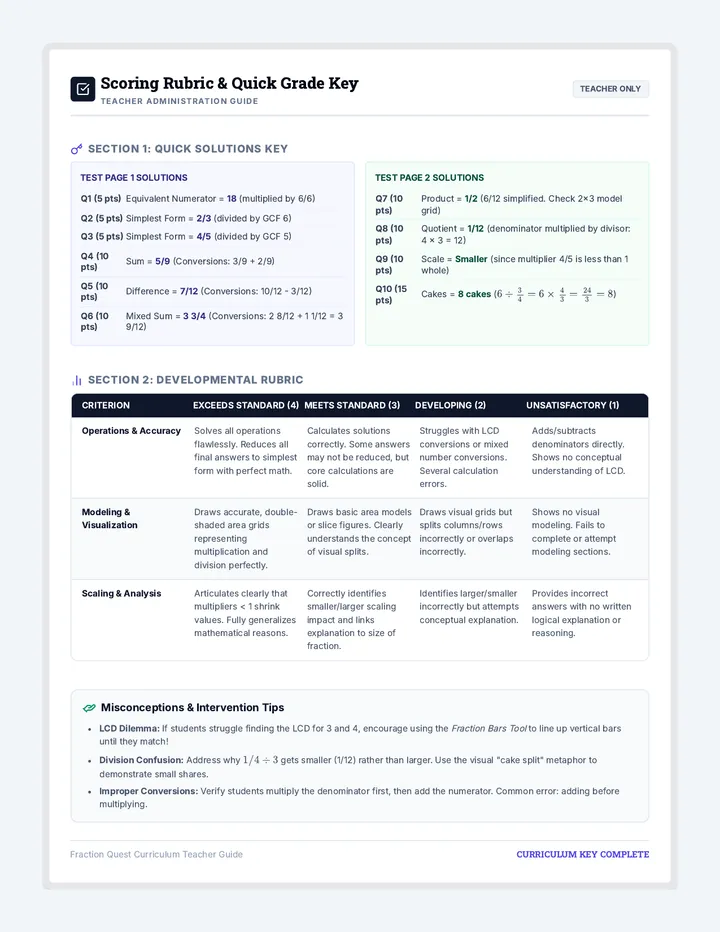
Plotting Patterns Rubric
A professional rubric for assessing student work on the Plotting Patterns project, focusing on accuracy, craftsmanship, and the ability to communicate coordinates effectively.
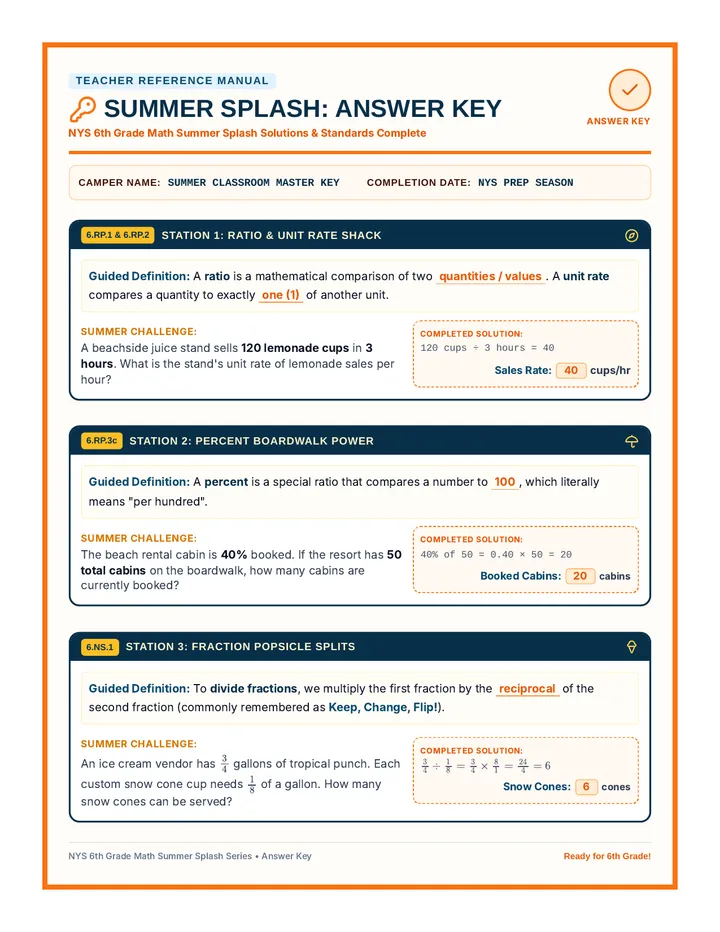
Plotting Patterns Answer Key
A comprehensive teacher's answer key for the Plotting Patterns lesson, including the solution to the mystery point warm-up and a visual representation of the mystery robot plotted on a coordinate grid.