Plotting the End Exit Ticket
A condensed exit ticket for 9th-grade math focused on interpreting distance-time graphs, featuring a matching activity and a graph-to-story translation problem, all optimized to fit a single 8.5x11 page.
Graph Storytellers Slides
A visual presentation for teaching 9th-grade students how to interpret and sketch line graphs, including vocabulary for slope, direction of movement, and step-by-step translation examples.
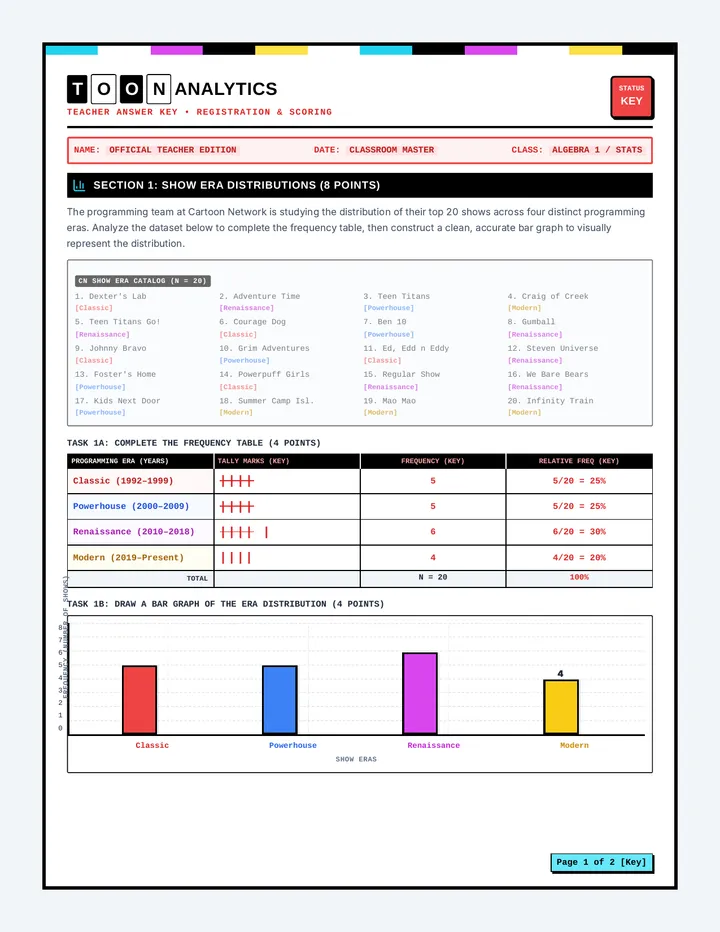
Graph Storytellers Answer Key
An answer key and teacher reference guide for the Graph Storytellers lesson, including solutions for matching activities, sketching checkpoints, and exit ticket answers. Optimized for 8.5x11 printing.
Graph Storytellers Teacher Guide
A comprehensive teacher guide for a 65-minute 9th-grade math lesson on interpreting and sketching line graphs, featuring a clear instructional arc and teacher tips. Optimized for 8.5x11 printing.
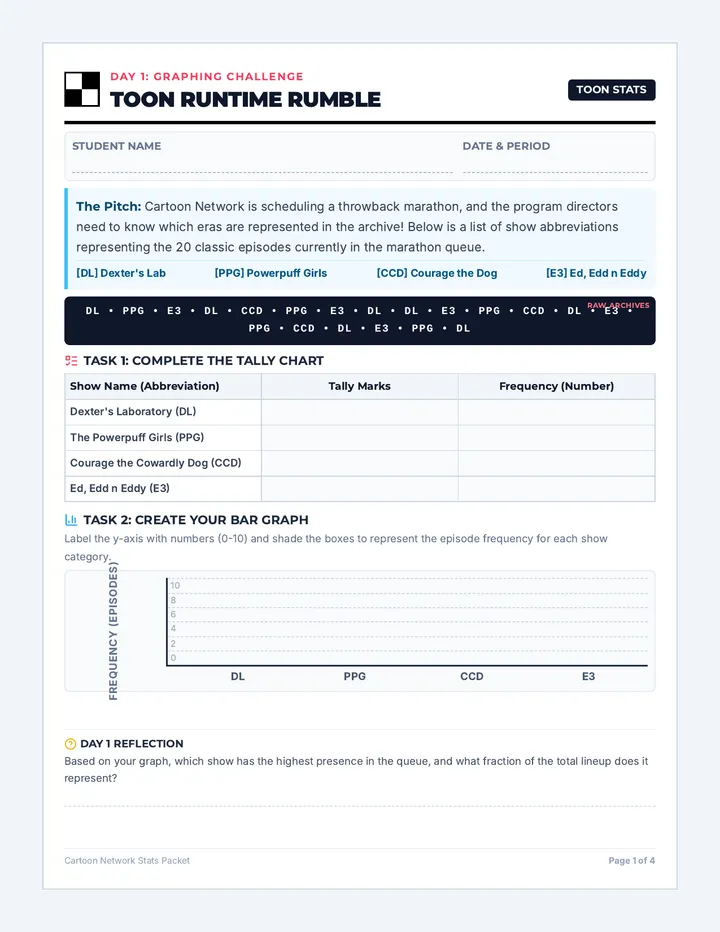
Sketch Your Story Worksheet
A student worksheet for sketching a distance-time graph based on a detailed narrative, including analysis questions about slope and key graphical features. Optimized for 8.5x11 printing with strict 1-inch margins and tightened vertical spacing.
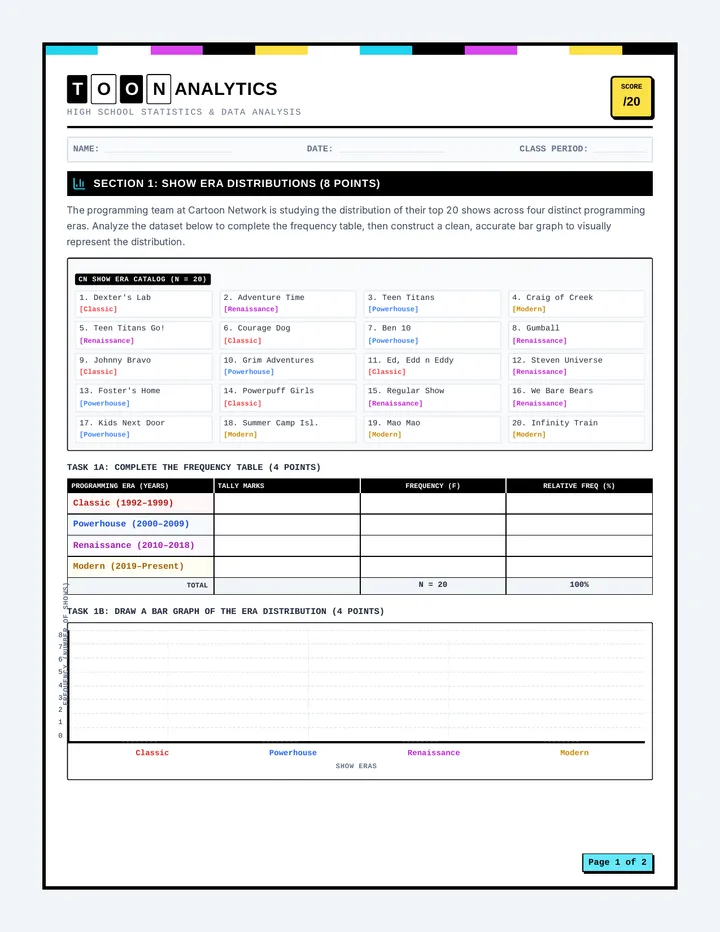
Graph Matchmaker Worksheet
A 9th-grade worksheet for matching real-world narratives to their corresponding distance-time graphs, optimized for 8.5x11 printing with strict 1-inch margins and clear, legible typography.
Sketch Your Story Worksheet
A student worksheet for sketching a distance-time graph based on a detailed narrative, including analysis questions about slope and key graphical features. Optimized for 8.5x11 printing with strict 1-inch margins and tightened vertical spacing to ensure single-page fit.