Decision Lab Slides
DECISION LAB
Analyzing Strategy with Probability
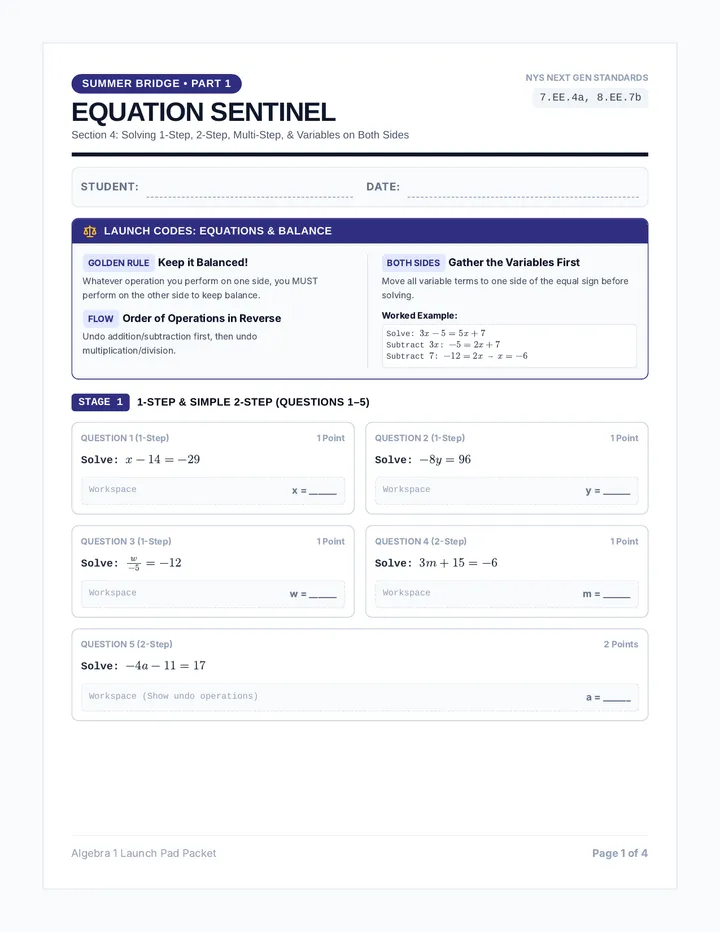
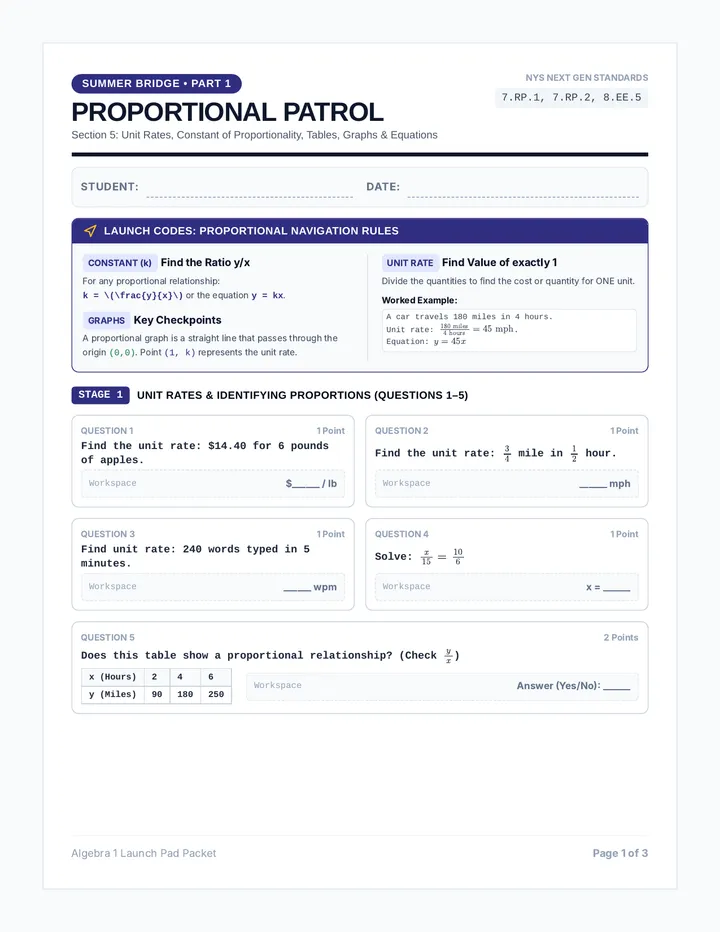
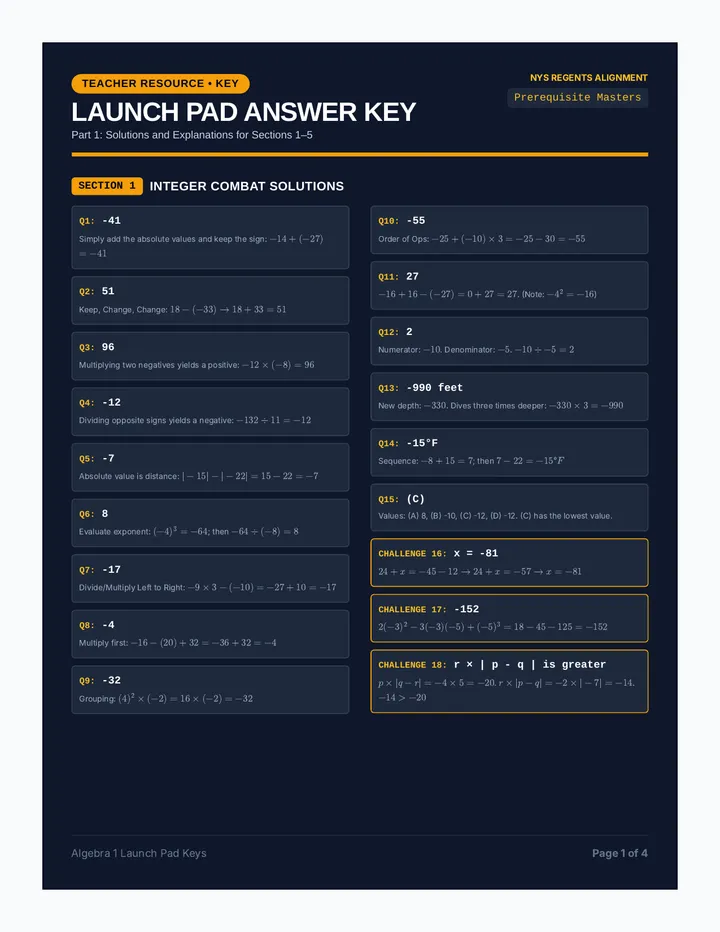
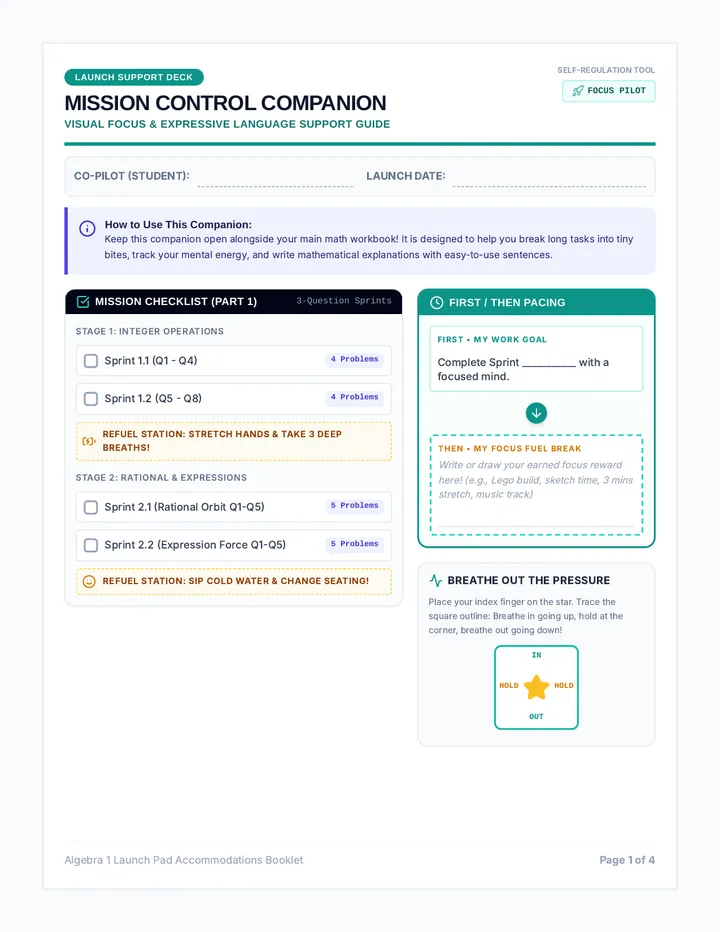
Math Standard HS.S-MD.B.7
The Big Question
How do we make the "right" choice when the outcome is uncertain?
Medical
Testing for a rare disease.
Business
Inspecting products for defects.
Sports
Pulling the goalie in hockey.
Our Tool: Expected Value (EV)
The average result we would expect if we made the same decision many times.
\( EV = \sum (P \times V) \)
P = Probability (How likely?)
V = Value (The result's "score")
1
Identify all possible outcomes.
2
Find the probability and value for each.
3
Multiply, then add them up!
Visualizing Choices
START Option A Option B 80% Success 20% Failure
Decision trees help us see every possible path before we choose.
Case Study 1: Testing
Medical Logic
The Scenario
A new screening test for "Condition X" is 95% accurate. However, if the test is positive, there is a risk of a painful, unnecessary biopsy.
The Trade-off
- Benefit: Catching disease early
- Cost: False positives / Biopsy pain
The Decision Matrix
| Result | Likelihood | Value |
|---|
| True Positive | 0.05% | +100 |
| False Positive | 4.95% | -20 |
Is the tiny chance of a "Big Win" (+100) worth the larger chance of a "Small Loss" (-20)?
Case Study 2: Sports Strategy
Pulling the Goalie
It's the final minute of a hockey game. You are down by 1 goal.
Keep Goalie In:
Very low chance of scoring. Low chance of being scored on.
Pull Goalie (6 skaters):
Higher chance of scoring (Tying the game!). High chance of empty net goal against.
30%
Chance of Tying (with Pull)
Statistically, pulling the goalie increases your Expected Value for points in the standings, even though it feels risky!
Your Turn to Decide
Analyze
Find the probabilities and values.
Calculate
Compute the Expected Value (EV).
Justify
Explain your choice using data.
Remember: A "bad" outcome doesn't always mean a "bad" decision!
Decision Lab Worksheet
DECISION LAB: CASE STUDY ANALYSIS
Small Group Intervention | HS Statistics
Name
Date
Lab Protocol: Expected Value (EV)
Expected Value is the weighted average of all possible outcomes. We calculate it by multiplying each Probability (P) by its Value (V) and adding them together.
\( EV = (P_1 \times V_1) + (P_2 \times V_2) + \dots \)
Case Study 1
The Smartphone Factory
A factory produces 1,000 smartphones a day. There is a 2% chance a phone is defective.
• If a defective phone is shipped, the factory loses $500 (refund + bad reputation).
• If a functional phone is shipped, the factory earns $200 profit.
A Map the Decisions
Fill in the missing probability and value on the decision tree branches.
Ship Phone Defective (2%) Functional (____%) V = -$500 V = +$______
B Calculate the Expected Value
C Strategic Recommendation
If the factory spends $10 per phone on a final inspection that catches all defects, what is the new Expected Value? Is it worth the cost? Justify your answer.
Case Study 2
The Empty Net Gamble
A hockey team is losing by 1 goal with 90 seconds left. They can either keep their goalie in or "pull the goalie" for an extra attacker.
Strategy 1: Keep Goalie In
- Score/Tie: 5% chance (V = 1 point)
- Lose: 95% chance (V = 0 points)
Strategy 2: Pull Goalie
- Score/Tie: 30% chance (V = 1 point)
- Opponent Scores: 70% chance (V = 0 points)
1. Calculate EV for Strategy 1 (Goalie In)
Formula: (Probability of Tie × 1) + (Probability of Loss × 0)
2. Calculate EV for Strategy 2 (Pull Goalie)
Formula: (Probability of Tie × 1) + (Probability of Loss × 0)
Strategic Justification Template
Use your calculations to complete the following argument:
The better strategy is to because its Expected Value of
is higher than the Expected Value of for the other strategy.
Even though pulling the goalie makes it more likely the opponent will score, it is a "smart"
statistical risk because it
Lab Confidence Check
Still Lost
Getting It
Expert
Decision Lab Answer Key
ANSWER KEY
Decision Lab: Case Study Analysis
Teacher Reference
Case Study 1: The Smartphone Factory
Part A: Tree Values
- Functional Percentage: 98% (100% - 2%)
- V (Functional): +$200
Part B: EV Calculation
\( EV = (0.02 \times -500) + (0.98 \times 200) \)
\( EV = (-10) + (196) \)
\( EV = \$186 \)
Part C: Strategic Recommendation
New EV with Inspection: $190 (Profit is guaranteed at $200, minus the $10 cost).
Justification: Yes, it is worth the cost. The inspection increases the expected profit per phone from $186 to $190. Over 1,000 phones a day, this saves the factory $4,000 daily.
Case Study 2: The Empty Net Gamble
1. Goalie In EV
\( (0.05 \times 1) + (0.95 \times 0) = \mathbf{0.05} \)
2. Pull Goalie EV
\( (0.30 \times 1) + (0.70 \times 0) = \mathbf{0.30} \)
Justification Key
The better strategy is to pull the goalie because its Expected Value of 0.30 is higher than the Expected Value of 0.05 for the other strategy. Even though pulling the goalie makes it more likely the opponent will score, it is a "smart" statistical risk because it triples (or significantly increases) the team's chances of actually tying the game and gaining a point in the standings.
Intervention Tips
- Common Error: Students may forget that probabilities must sum to 1 (e.g., in Case 1, Functional = 1 - 0.02).
- Concept Check: Ask: "Why is the empty net goal value 0 and not negative?" (Answer: Losing by 2 goals is the same as losing by 1 goal in terms of league points).
- Scaffolding: If students struggle with the multiplication, encourage them to think of it as "What happens to 100 phones?" (2 lose money, 98 make money).