A Tier 2 intervention lesson focusing on comparing two numerical data distributions. Students will learn to informally assess visual overlap and express the difference between centers as a multiple of variability (MAD).
A space-themed math journey where students use decimal operations and proportional relationships to chart courses, calculate planetary scales, and manage spaceship systems.
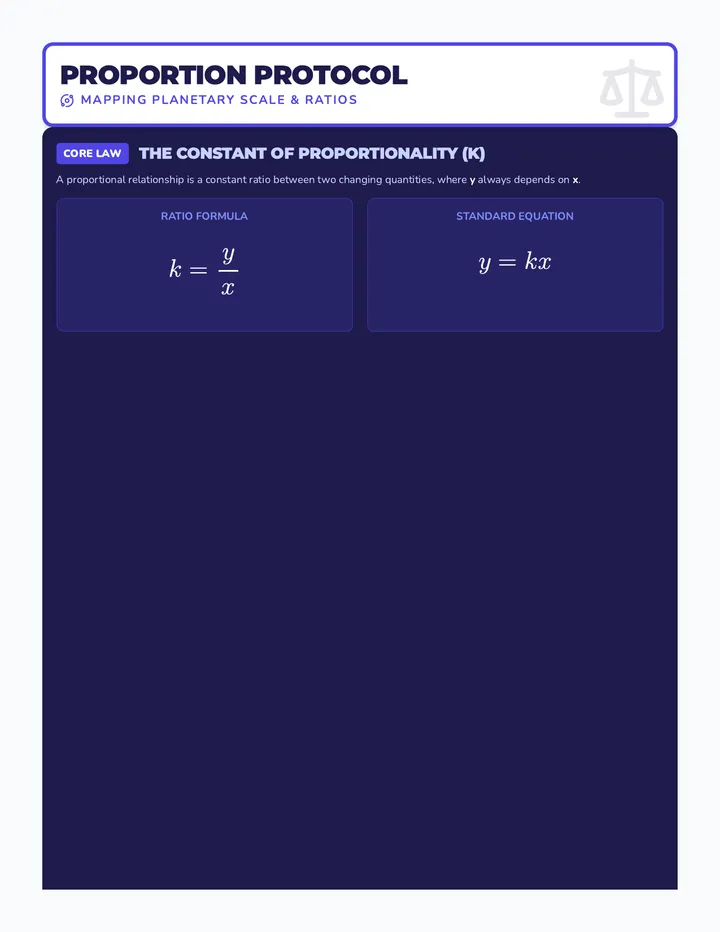
A focused lesson on finding constant of proportionality, writing equations, and graphing proportional relationships through interstellar weight and scale conversions.
A visually engaging slide deck introducing constant of proportionality, writing proportional equations, and graphing relationships with a high-tech planetary gravity theme.
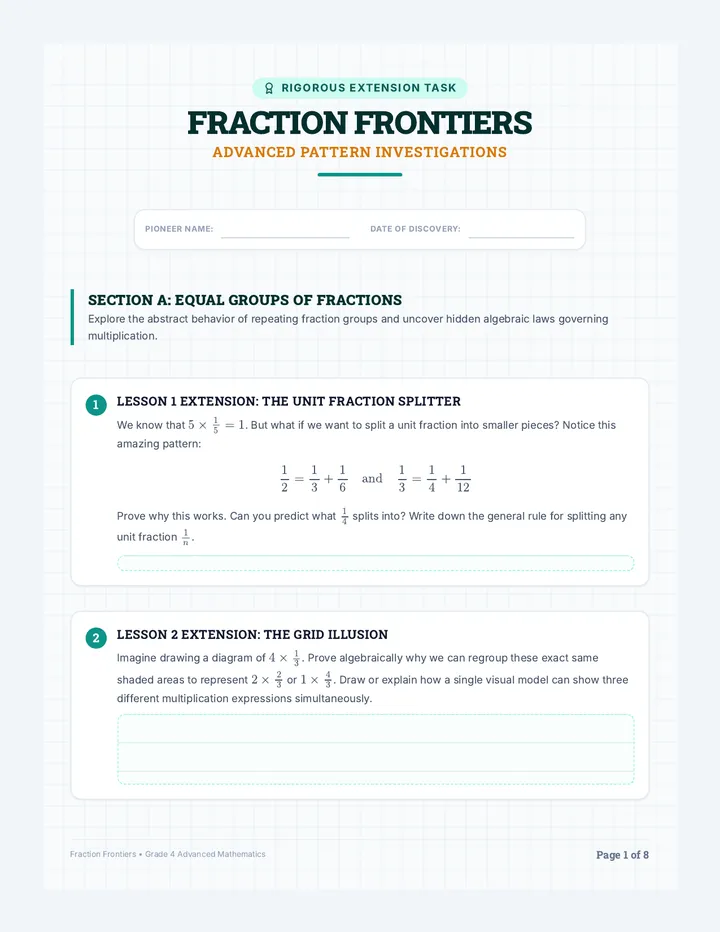
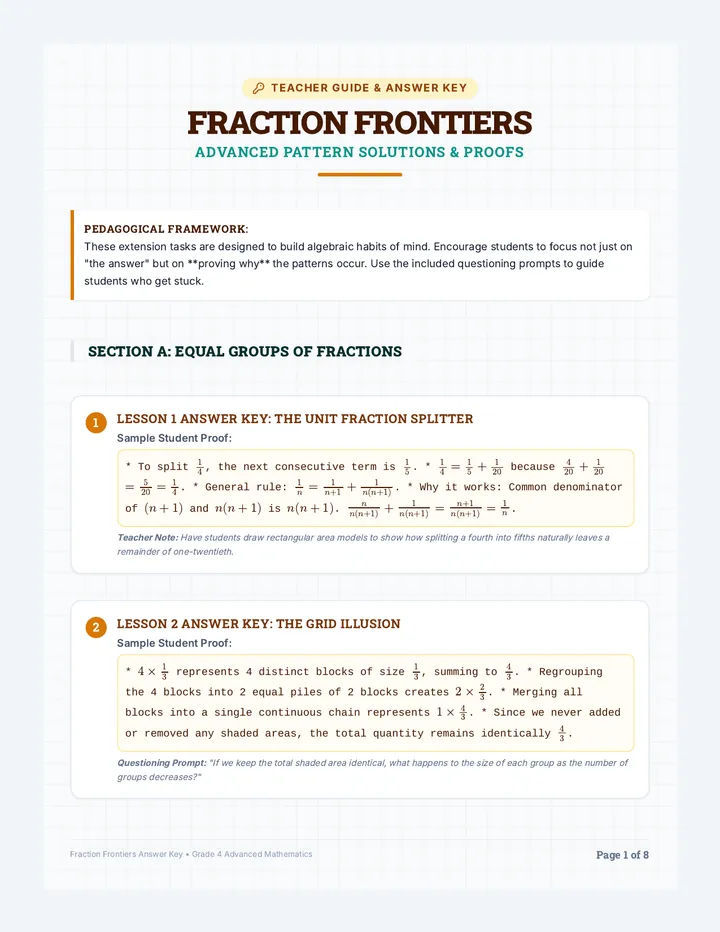
An advanced extension packet covering all 20 lessons of Unit 3, focused on abstract pattern exploration, number play, and algebraic relationships with fractions.
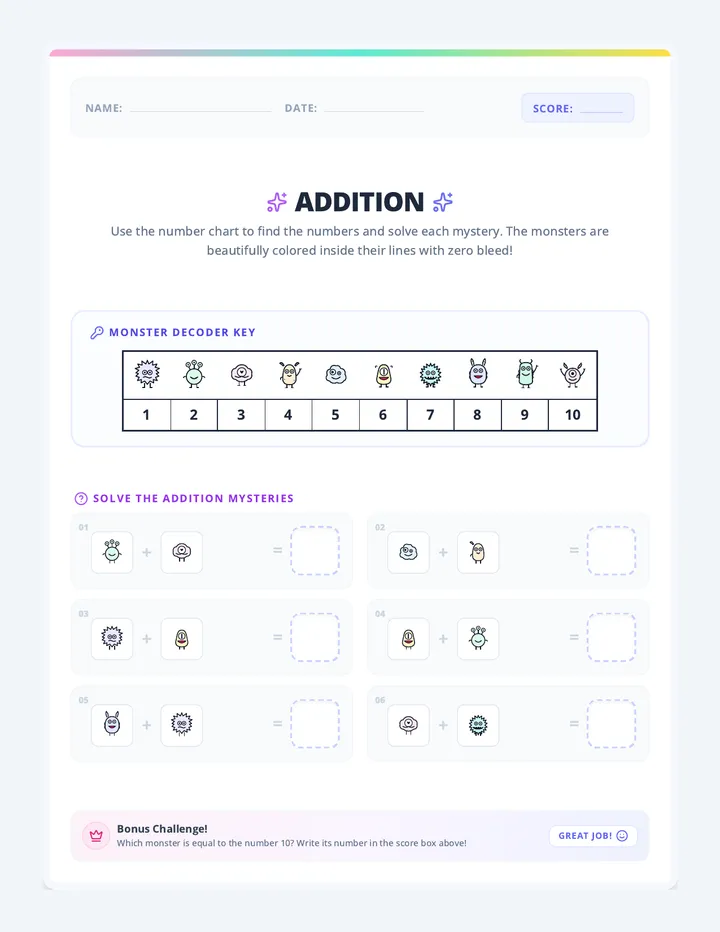
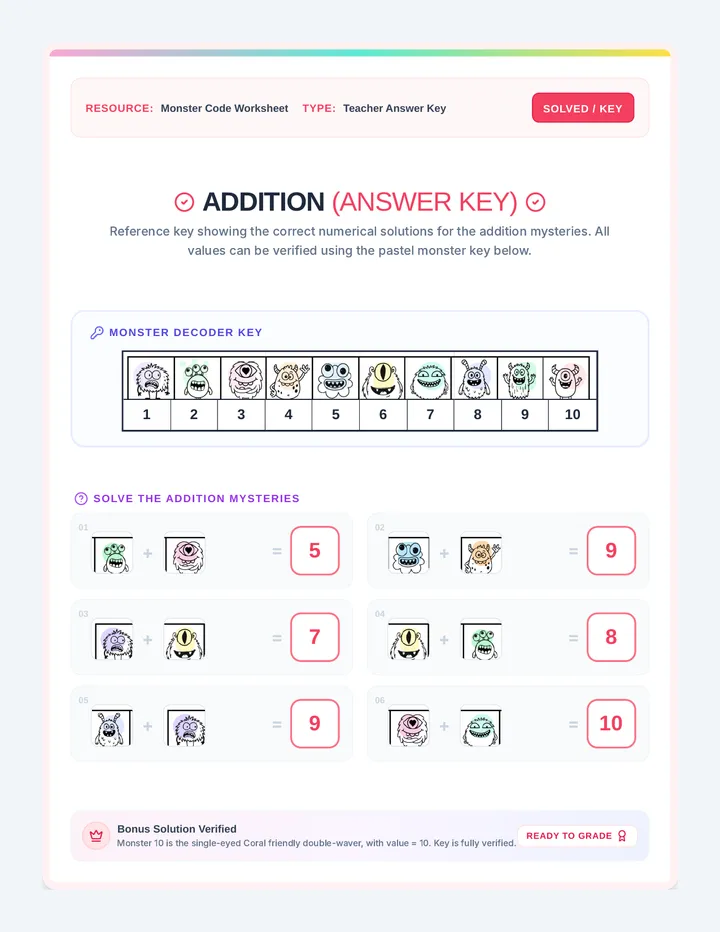
A playful elementary math lesson where students use a monster decoder chart to solve mystery addition equations. Includes a student-facing code-breaker worksheet and a corresponding teacher answer key.
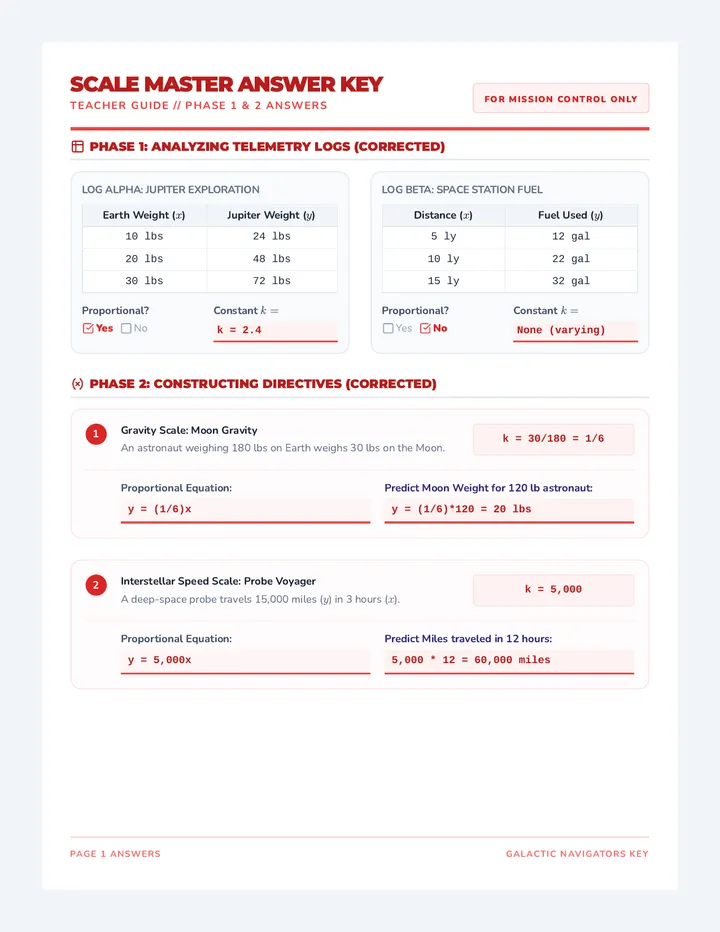
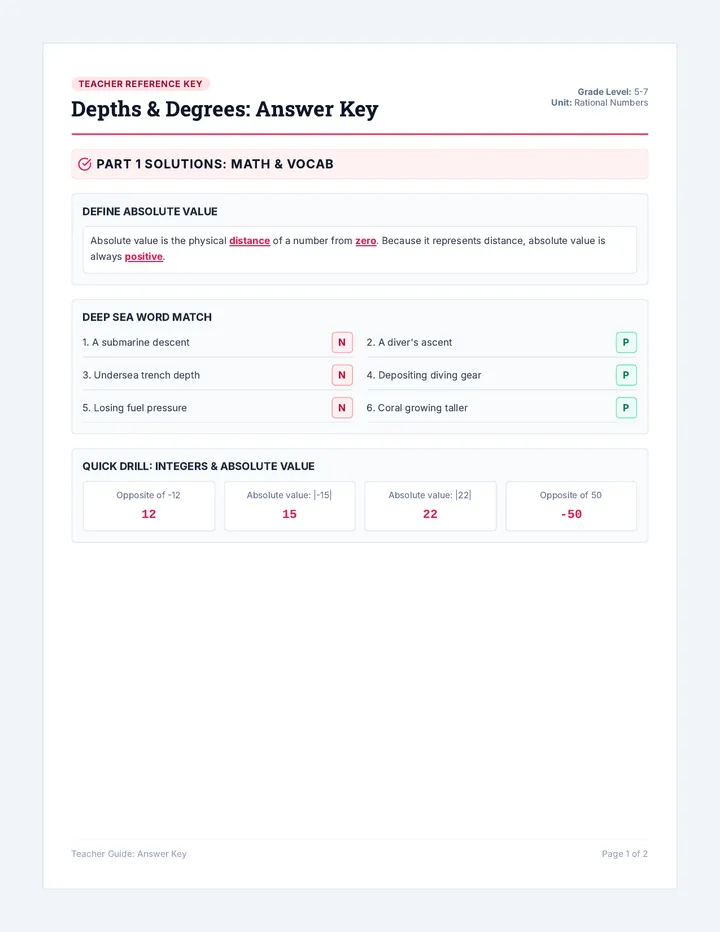
A teacher-facing 2-page answer key for the Scale Master Worksheet, indicating correct values, equations, graphs, and classifications.
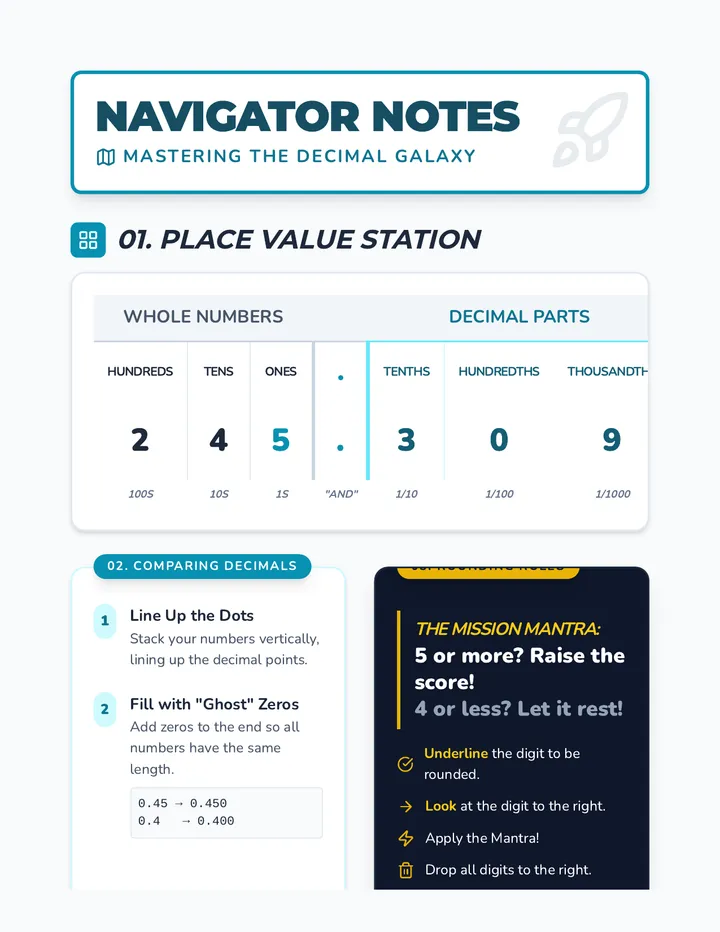
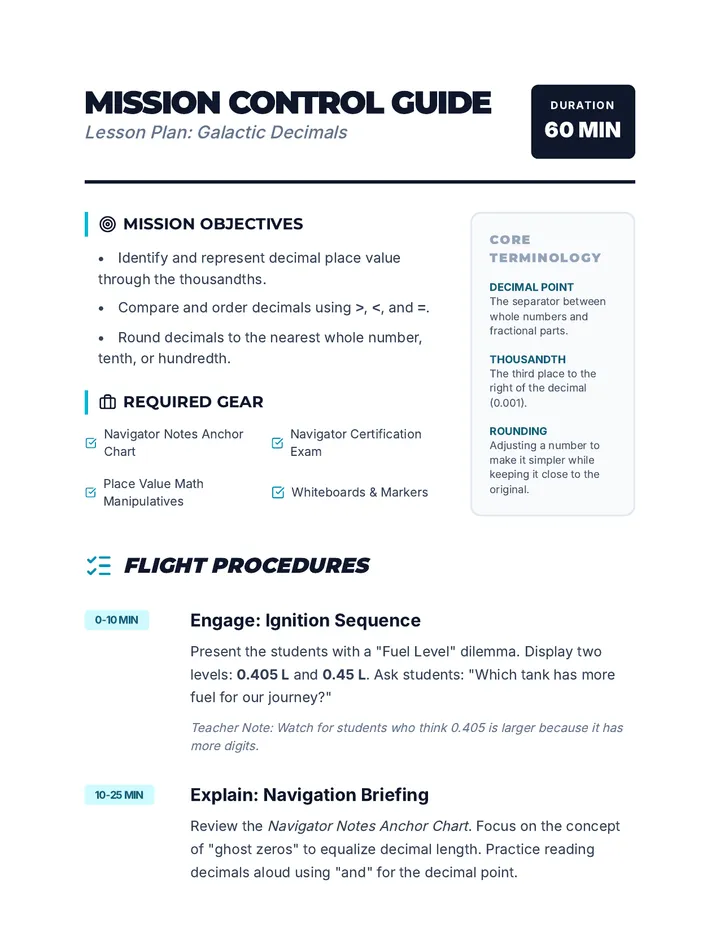
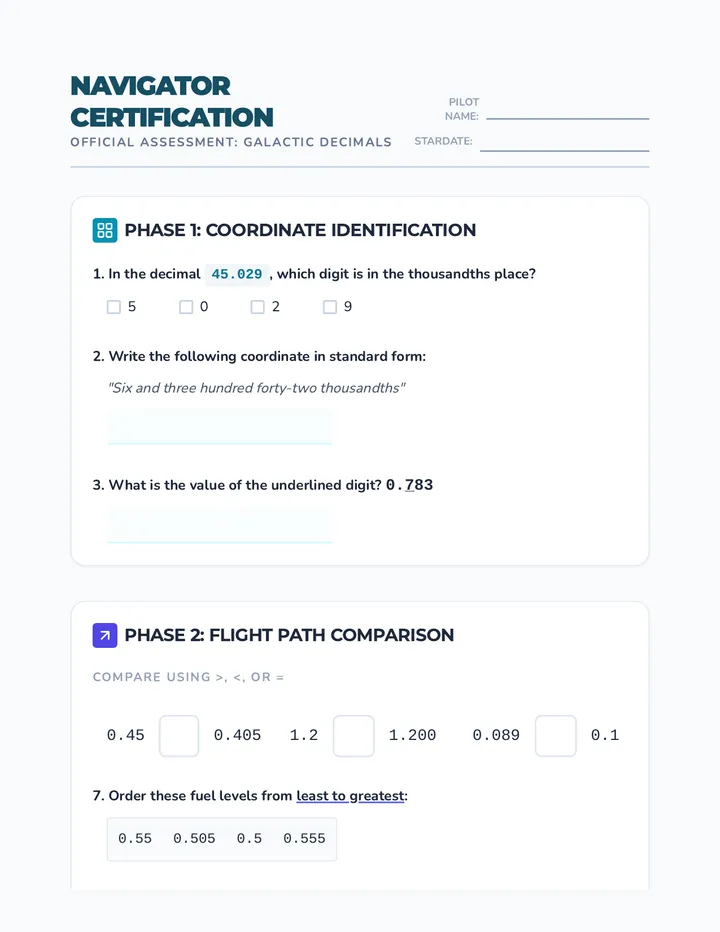
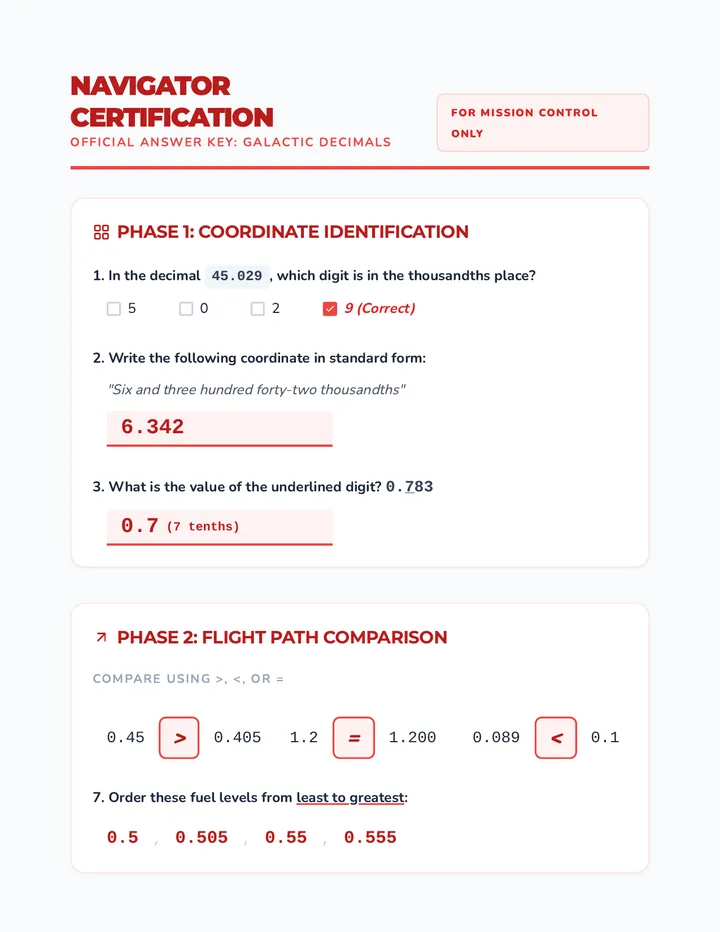
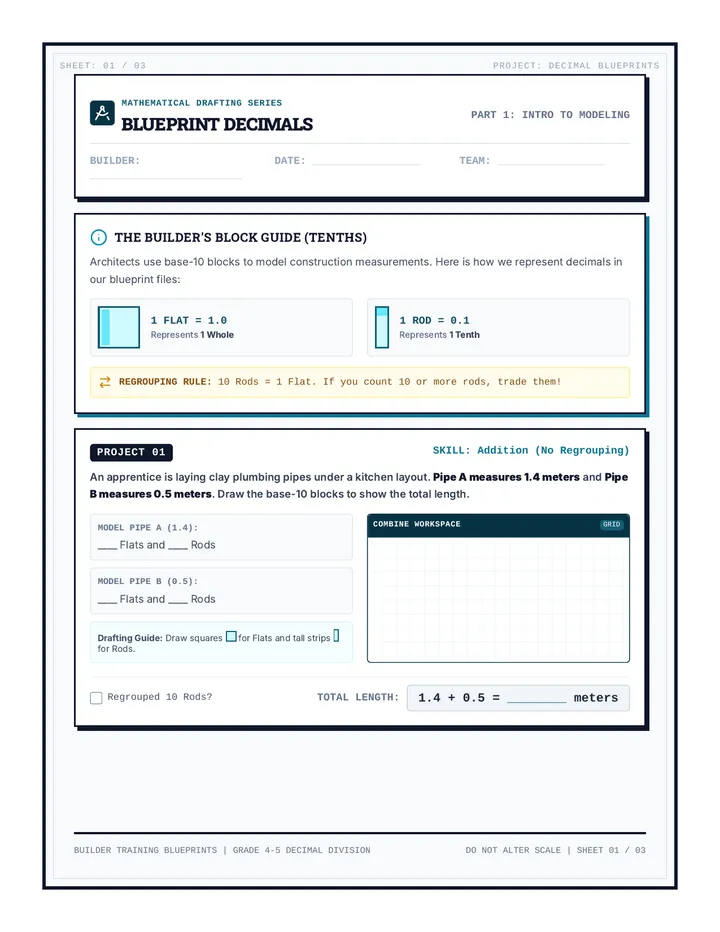
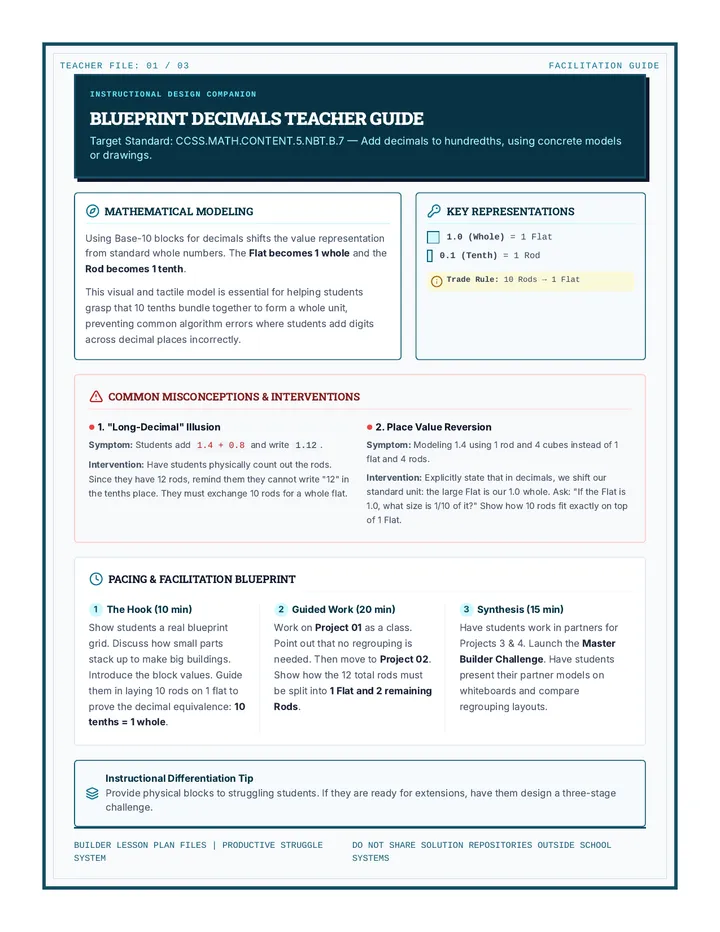
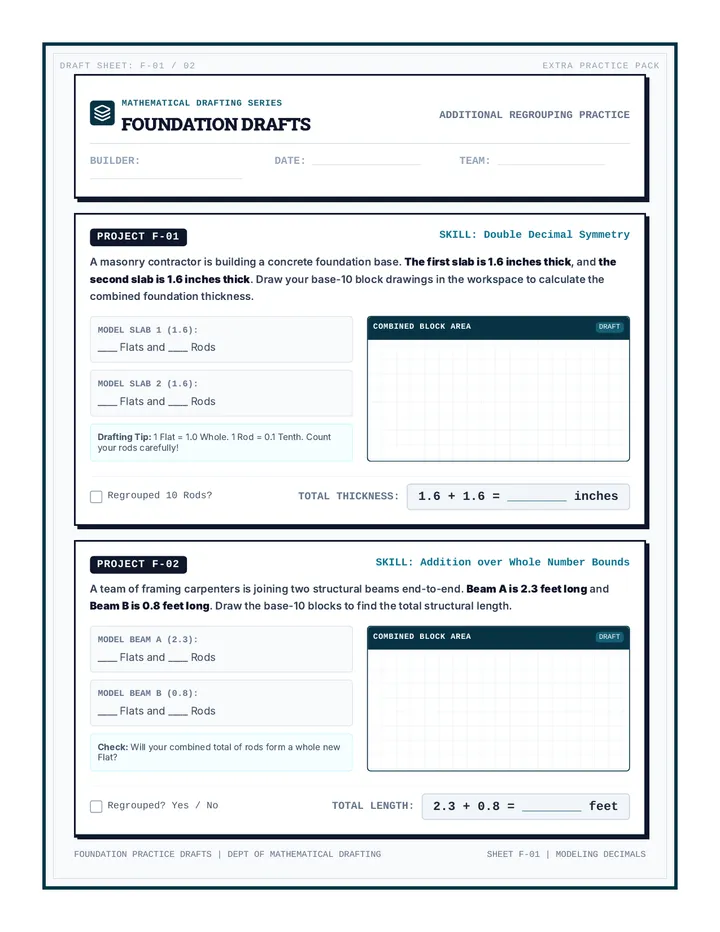
A complete sequence on decimal addition and regrouping. Students transition from modeling tenths with architectural blueprints to mastering computational algorithms through cosmic missions and space exploration calculations.
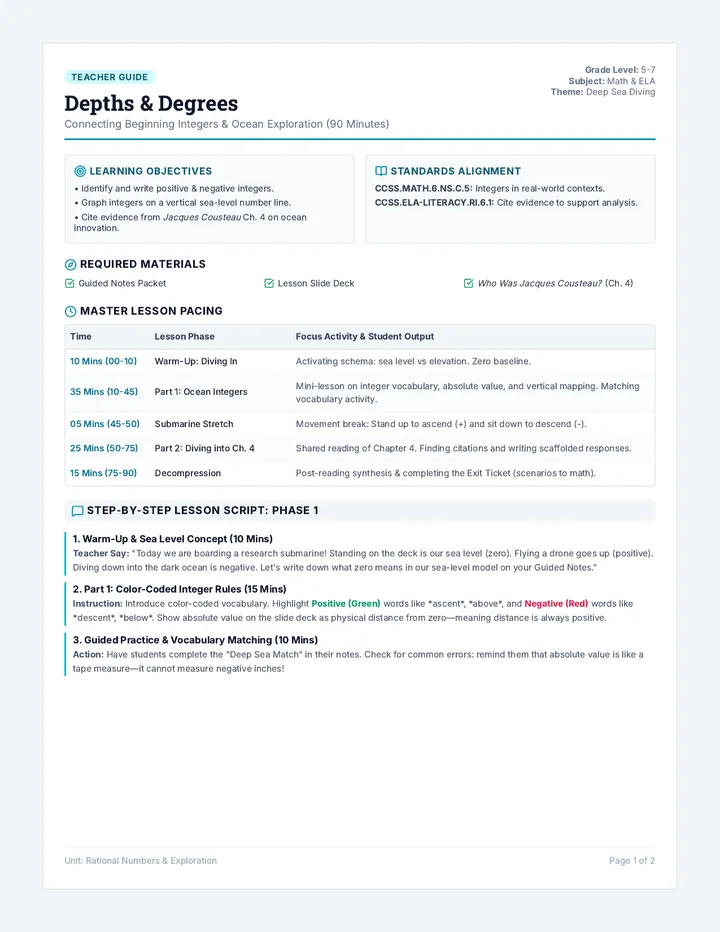
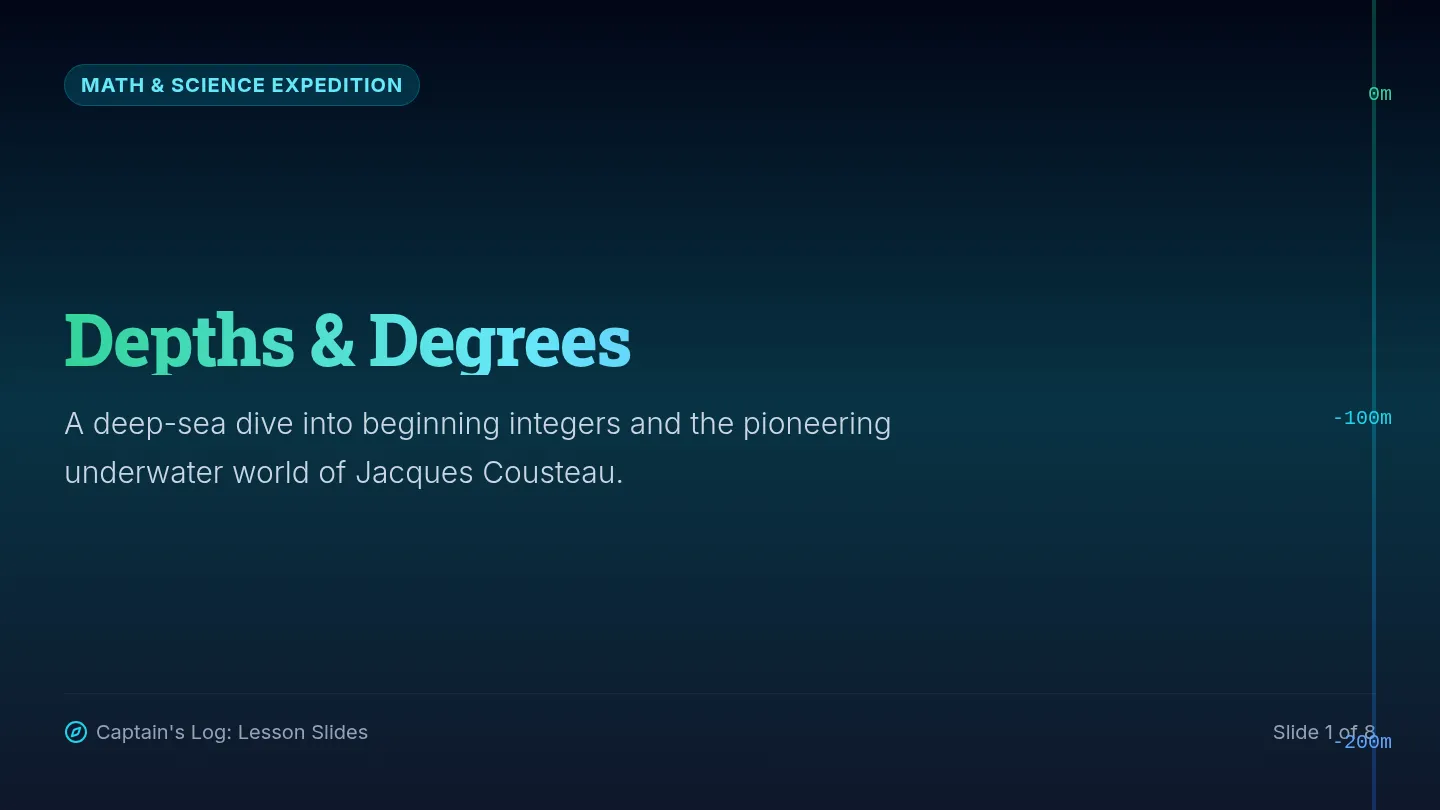
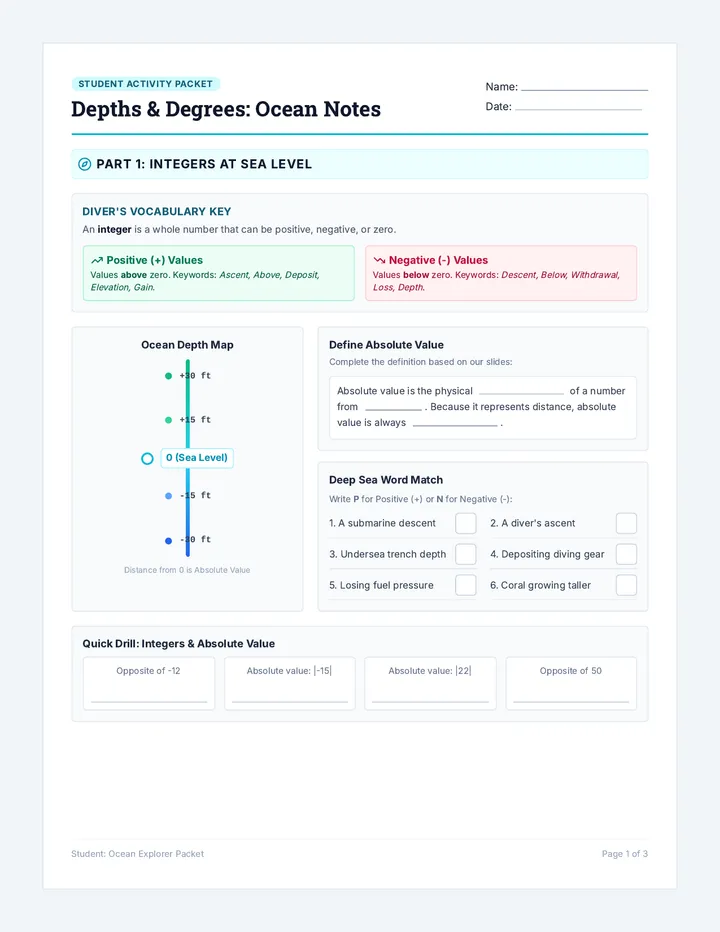
A highly visual 90-minute lesson connecting introductory integer rules with ocean exploration. Students use deep-sea diving concepts to understand negative and positive numbers, and dive into Chapter 4 of 'Who Was Jacques Cousteau?' to explore his underwater journeys with structured scaffolding.
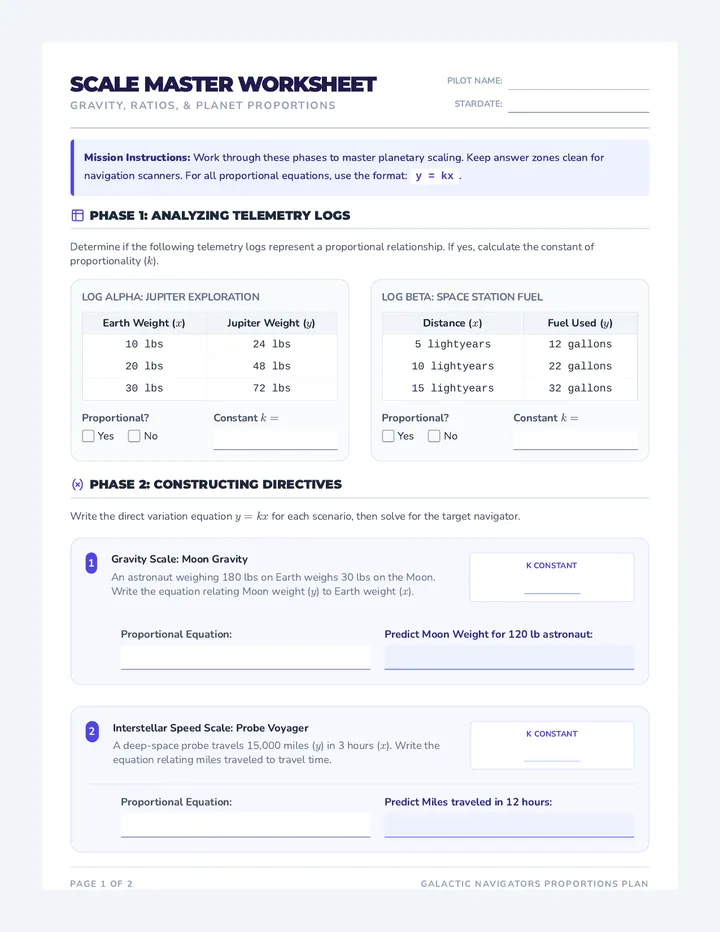
A 2-page student worksheet covering constant of proportionality, writing proportional equations, and graphing planetary relationships.
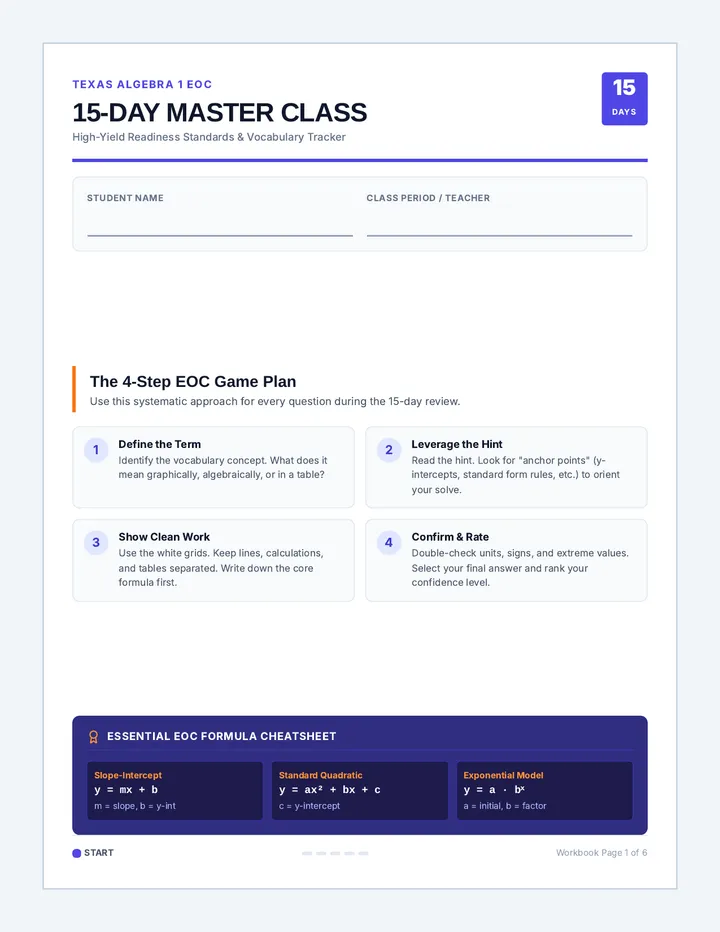
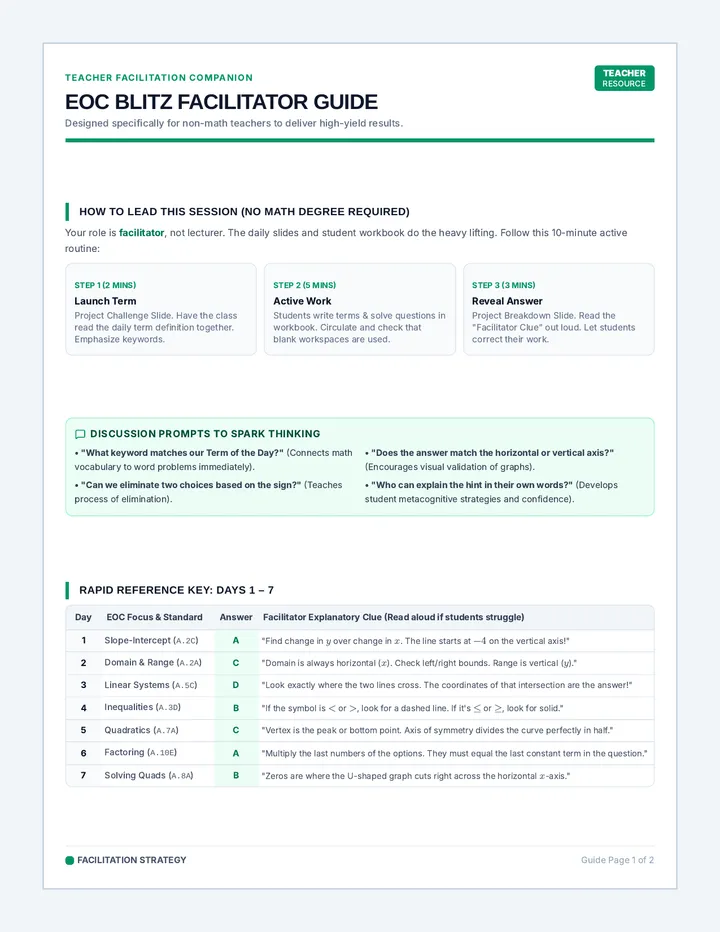
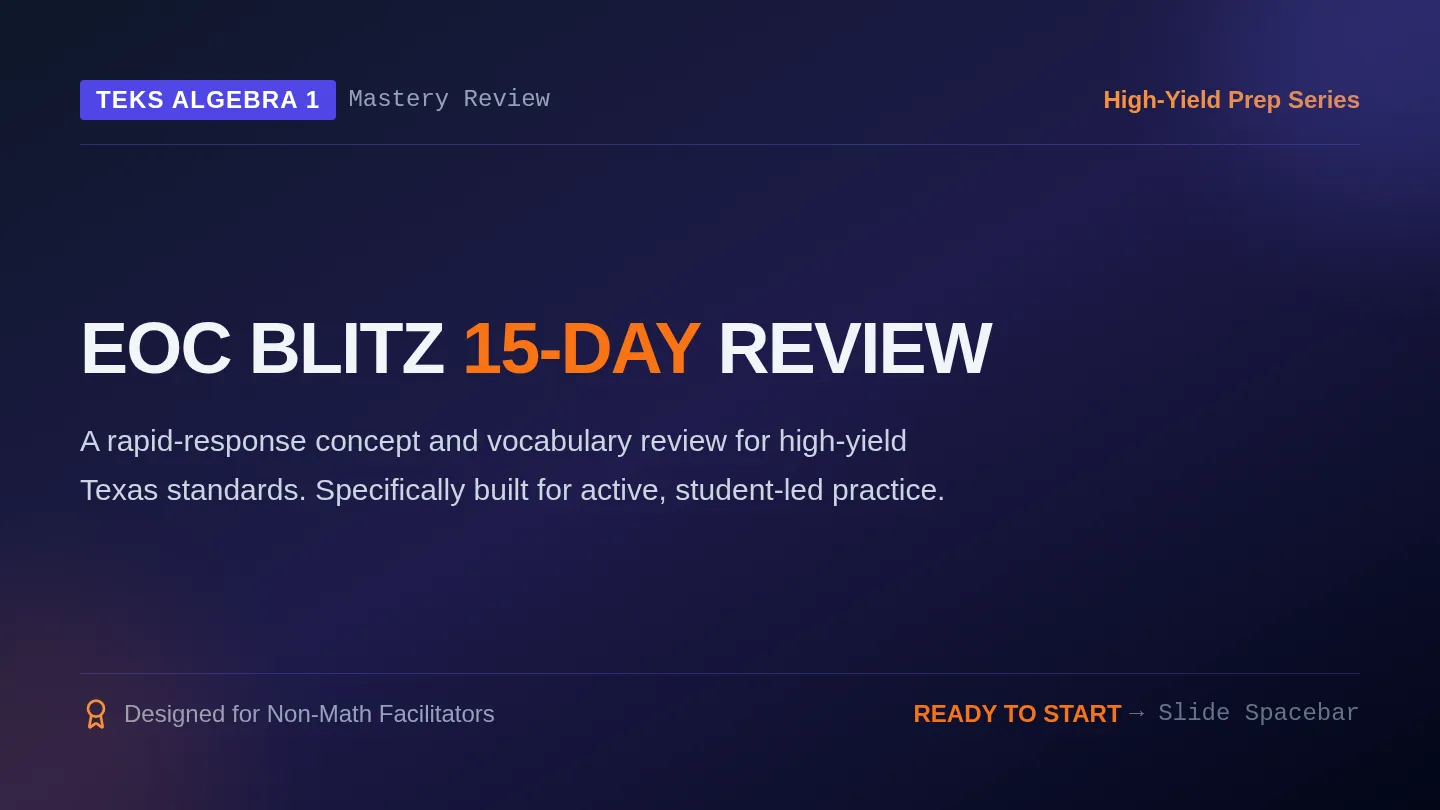
A 15-day Texas Algebra 1 EOC test preparation program designed for non-math teachers to facilitate vocabulary mastery and high-yield readiness standard practice.
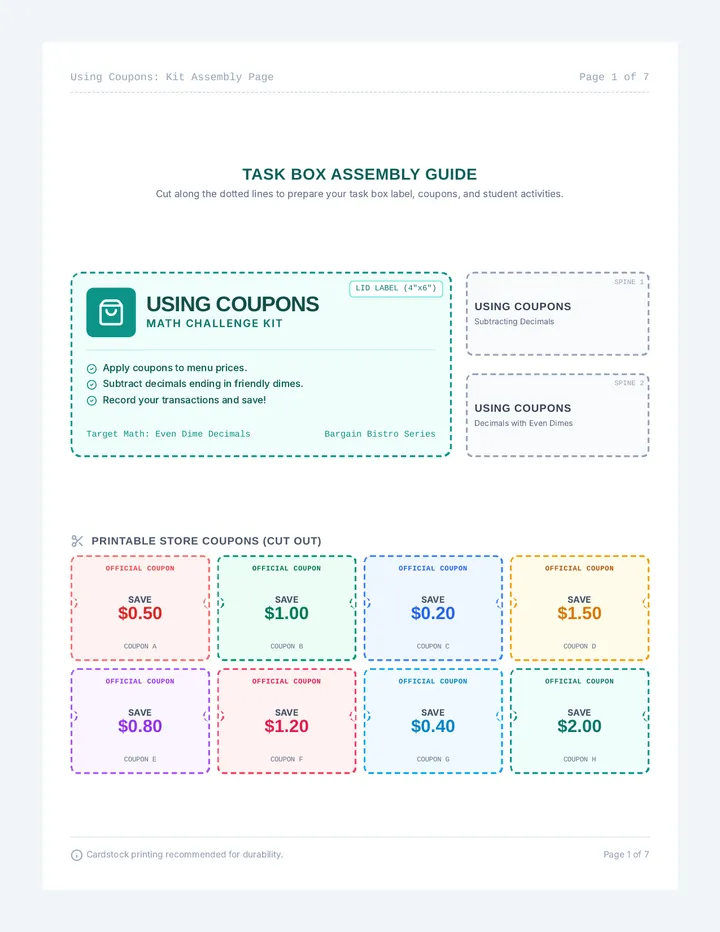
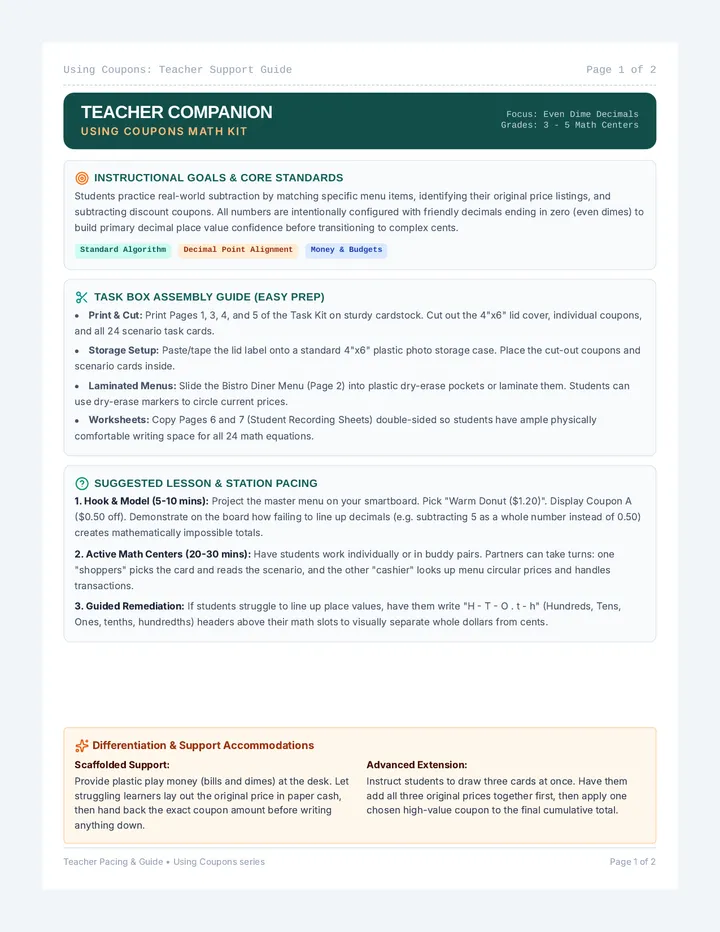
A comprehensive learning kit designed to teach real-world subtracting of decimals ending in even dimes. Students match market menu items with custom coupons to calculate final discounted prices.
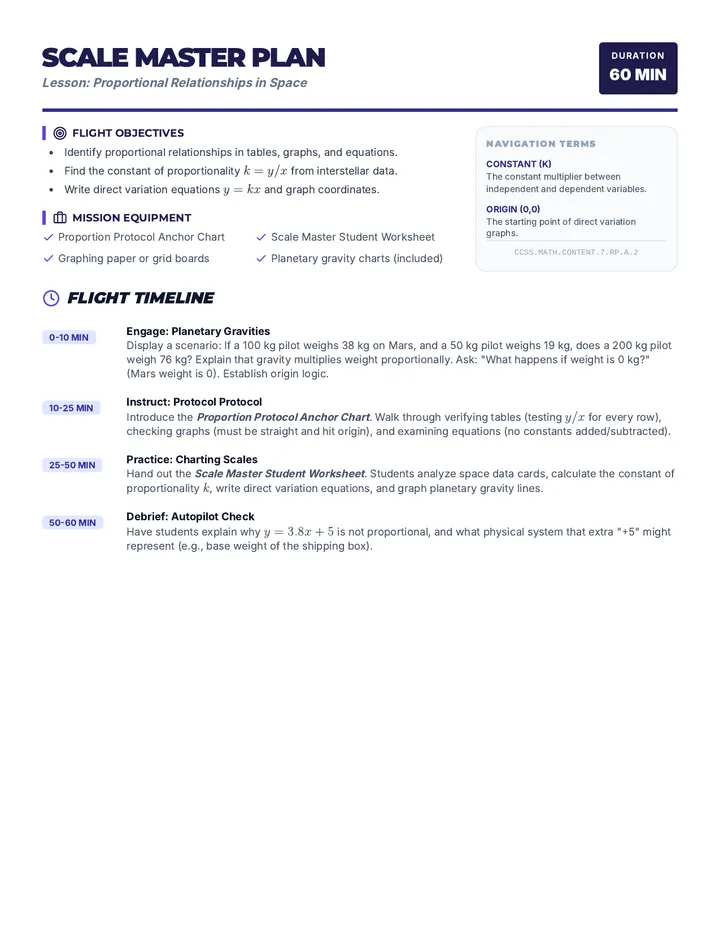
A professional 1-page lesson plan for teachers covering how to present constant of proportionality, writing proportional equations, and graphing with a spaceship navigation theme.