Students receive 'messy' battery life data for two suppliers. They clean the data and create dot plots to visually compare the spread of battery durations before performing calculations.
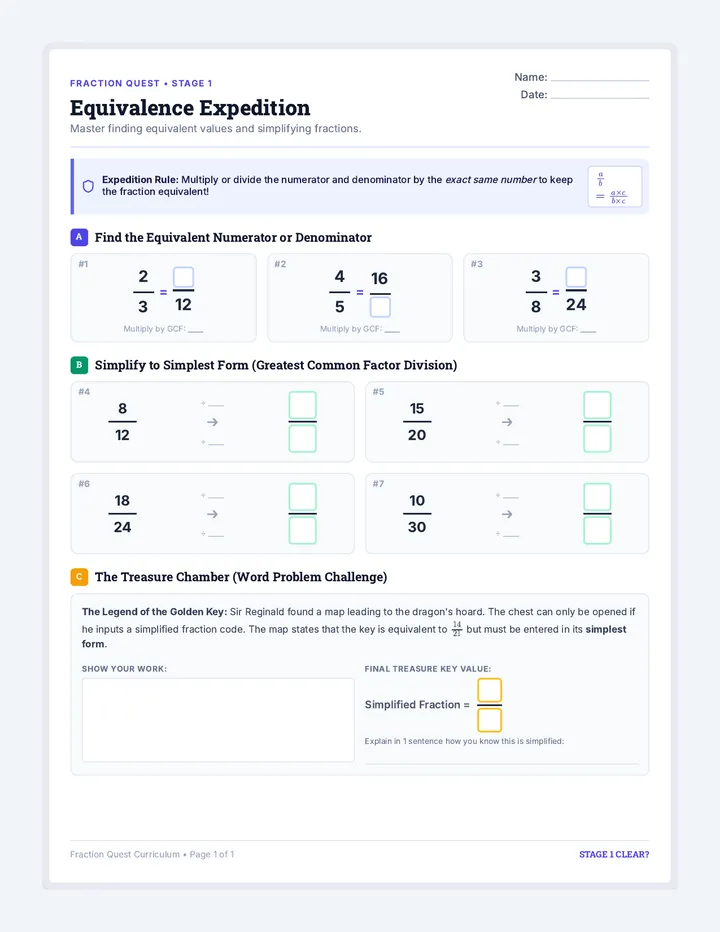
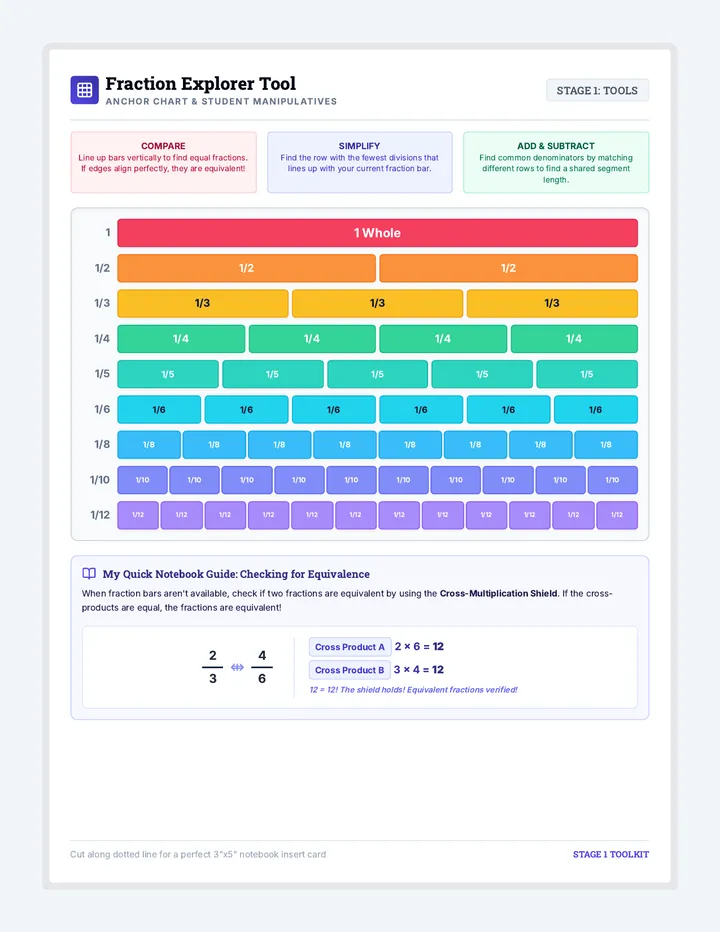
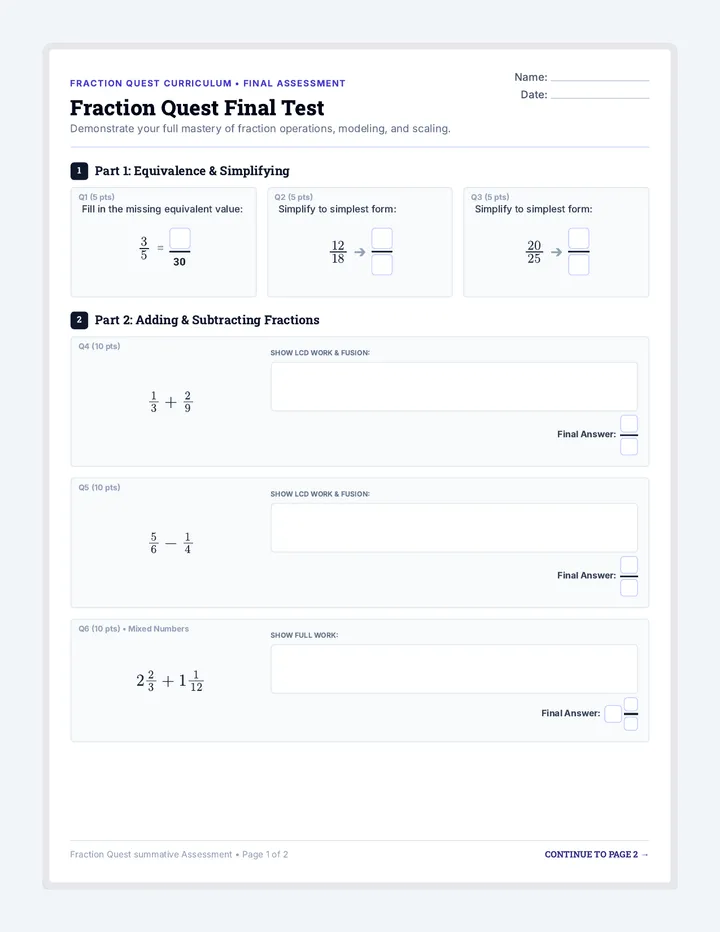
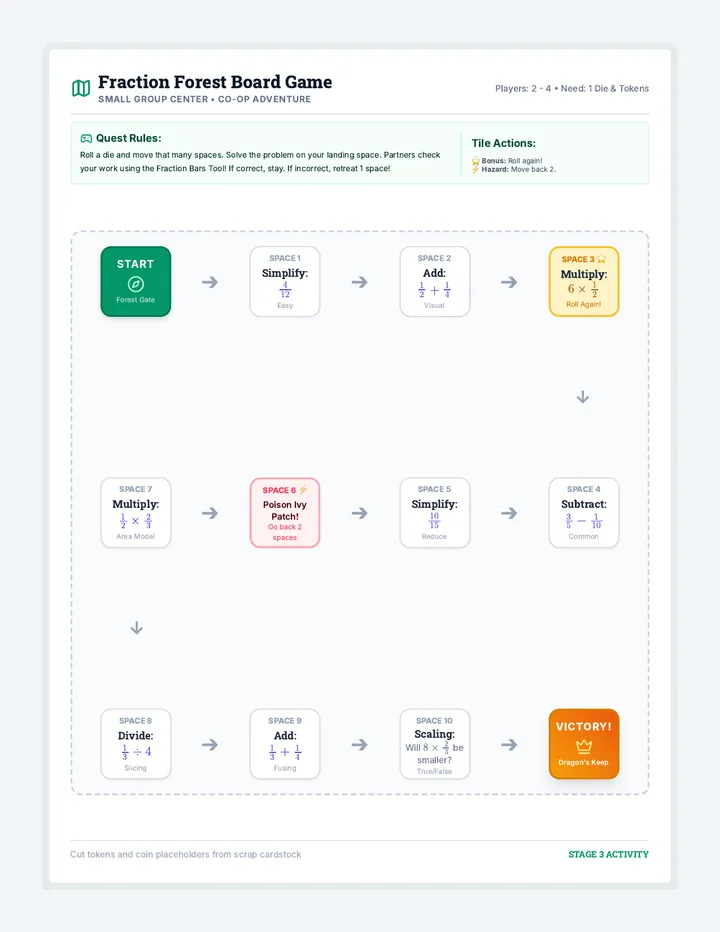
A comprehensive visual math curriculum sequence focusing on fraction equivalence, addition, subtraction, multiplication, division, and comprehensive multi-operation mastery. Includes visual lesson slides, independent practice worksheets, small-group centers, visual tools, and robust assessments.
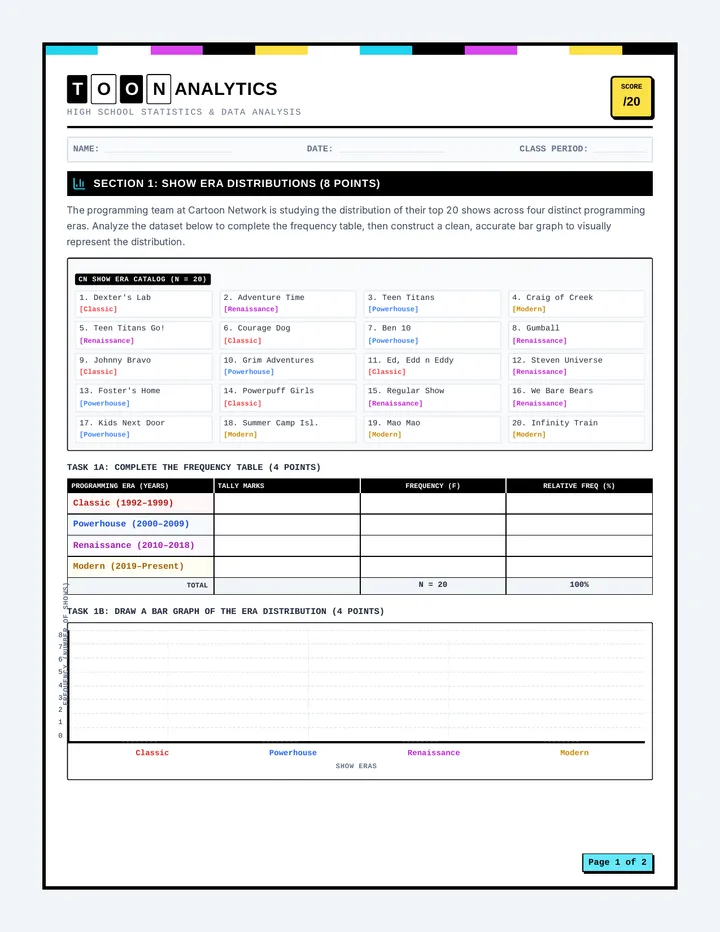
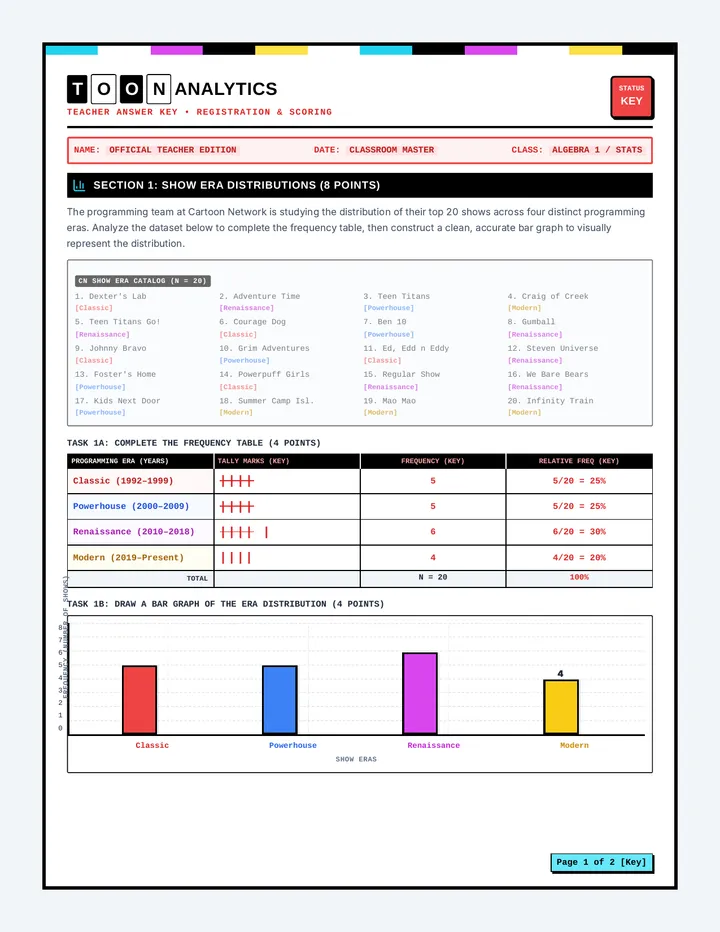
A high school statistics lesson that applies concepts of data representation, probability, and outlier analysis to Cartoon Network shows across different eras.
The corresponding 2-page teacher answer key for the Cartoon Network statistics worksheet, providing all solved values, completed tally charts, filled-in bar graphs, two-way contingency table solutions, exact probability fractions, and step-by-step IQR outlier calculations in high-contrast red font.
A comprehensive summer bridge workbook for rising 8th graders transitioning to Algebra 1. Contains review of prerequisite topics, advanced pre-algebra skills, real-world application, and an Algebra Escape Challenge.
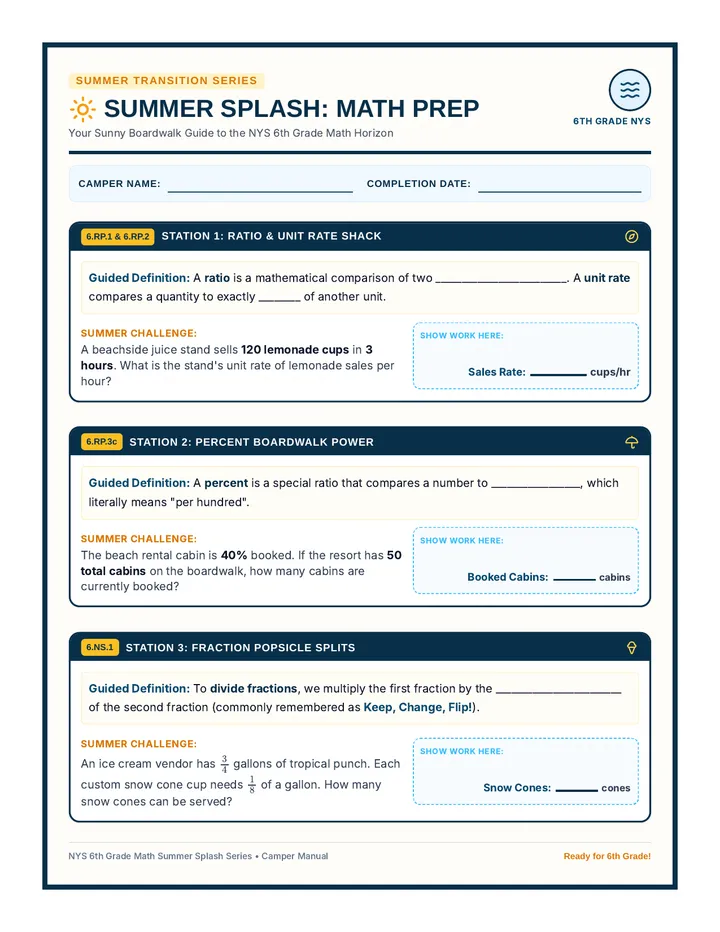
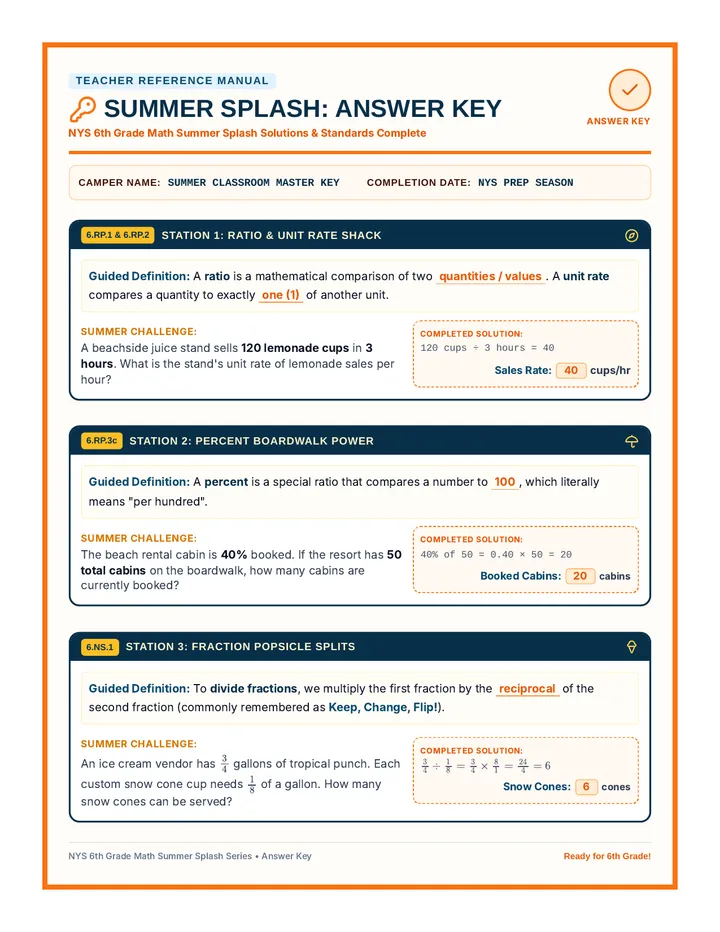
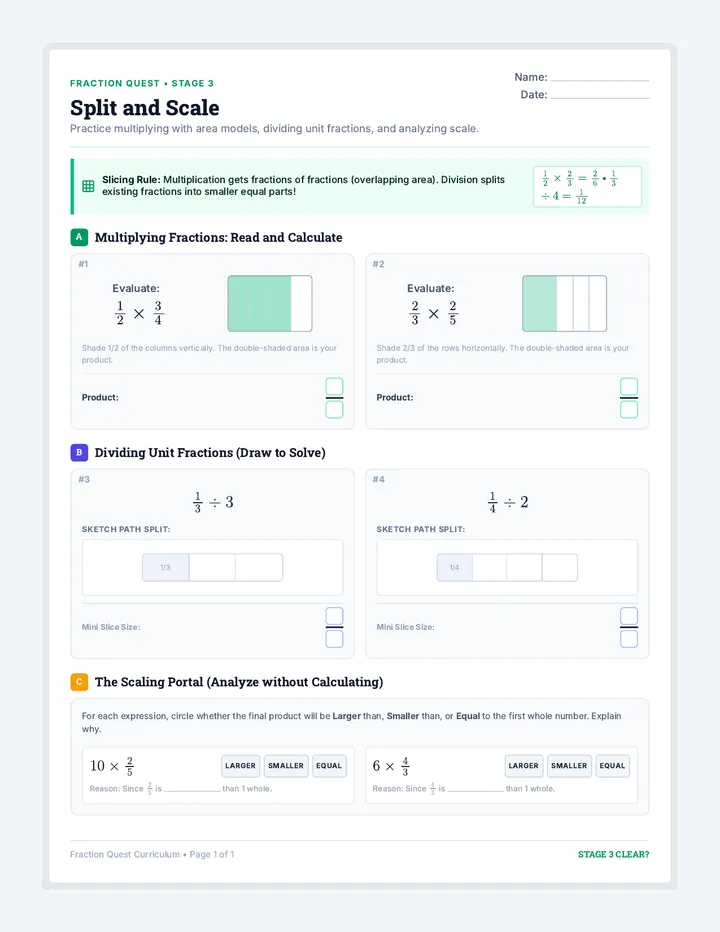
A transitional math prep lesson for rising 6th graders entering the NYS math curriculum. It introduces key concepts across all major domains including Ratios & Proportions, the Number System, Expressions & Equations, Geometry, and Statistics through structured definition spaces and scaffolded example problems.
A 2-page statistics worksheet for high school freshmen featuring a Cartoon Network theme. It covers frequency tallying and bar graphing (Page 1), and probability contingency tables and runtime outlier analysis using the 1.5 IQR rule (Page 2).
A high-intensity, 120-minute math simulation. Students act as lead consultants, completing a high-speed skill warmup before selecting a professional sector (Music, Urban Planning, Rocket Science, or Sports Analytics) to solve a series of complex work orders.
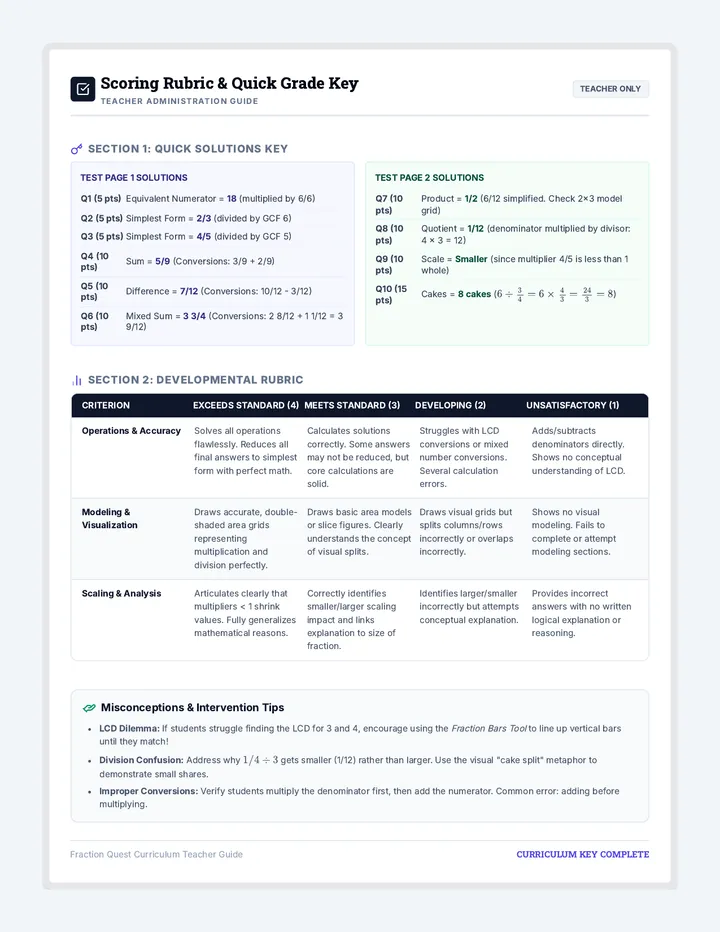
A comprehensive review and assessment of all four fraction operations. Students demonstrate their mastery through an interactive review, final unit assessment, and student reflection.
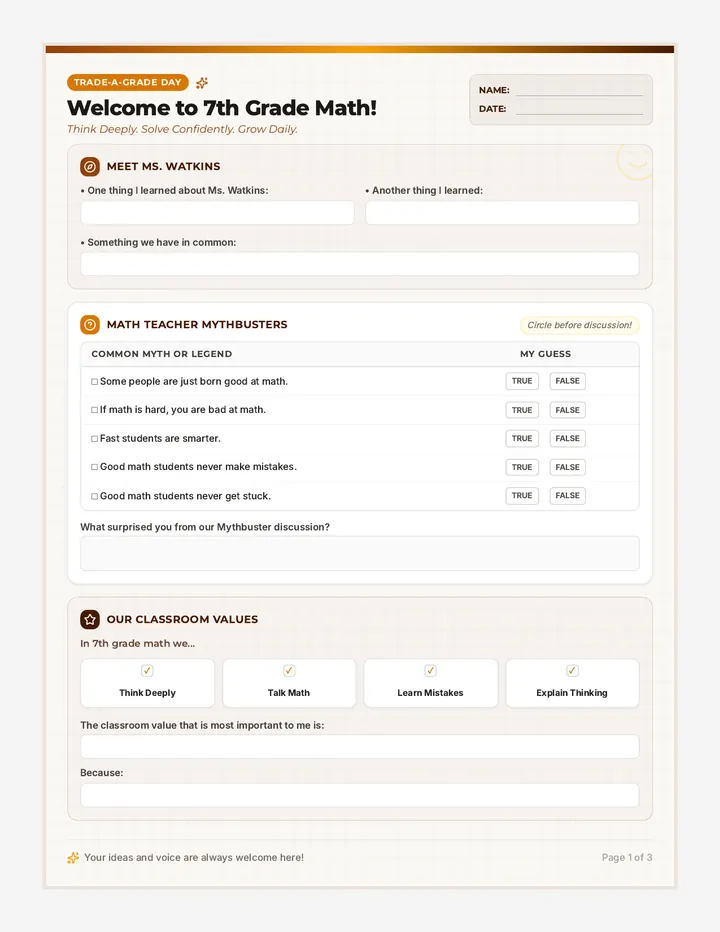
A beautifully themed 3-page transition worksheet for incoming 7th-grade math students visiting Ms. Watkins' classroom on Trade-a-Grade Day. Features a cohesive warm brown, gold, and cream palette with welcoming, interactive elements like mythbusters, classroom values, and introductory thinking prompts. Page 3 provides a customized mathematical sneak-peek on ratios, unit rates, and integers.
A 4-week math workbook and instructional sequence themed around outer space exploration, specifically designed for middle school students with disabilities (SWDs) working at an early 1st-grade level. Features embedded touch-points, base-ten icons, visual number paths, and age-appropriate space exploration visuals to teach single-digit operations, place value, and patterns.
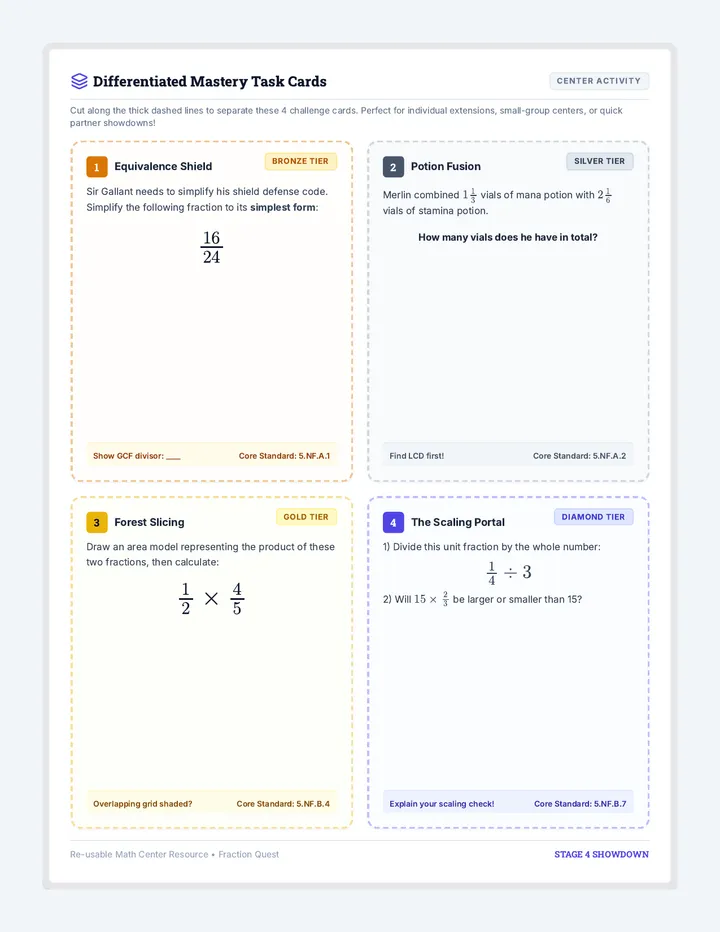
Multiplying and dividing fractions using area models, understanding scaling, and dividing unit fractions by whole numbers. Visual models help conceptualize these concepts.
A 3-page, teacher-facing answer key designed to accompany the Launchpad 6 Student Packet. It features fully completed definitions, step-by-step mathematical work, and circled answers rendered in vibrant orange for effortless scoring and instruction.