Botany Battle Worksheet
A two-page student worksheet featuring a botany-themed scenario where students graph two linear equations to compare growth trends over time. includes data tables, a coordinate plane, and analysis questions.
Botany Battle Answer Key
The answer key for the Botany Battle worksheet, providing completed data tables, solution explanations for the analysis questions, and key features of the comparison graph.
Scenario Showdown Worksheet
A two-page student worksheet featuring two real-world comparison scenarios (Streaming Apps and Phone Data) based on the provided visual layout. Includes equation writing, data tables, and coordinate planes for graphing systems of linear equations. Each scenario is isolated on its own page for maximum clarity. Improvement in layout and spacing ensures no overlap between graph labels and other content. This version fixes truncation and overlap issues by optimizing spacing and font sizes.
Scenario Showdown Answer Key
Detailed answer key for the Scenario Showdown worksheet, providing equations, completed table values, intersection points, and clear final answers for both the Streaming Apps and Phone Data scenarios. Each scenario is clearly presented on its own page to avoid layout splits and the contrast has been improved for better legibility. Includes a consistent secondary header on Page 2.
Trend Warmup Do Now
A one-page warmup (Do Now) focused on translating word problems into linear equations and performing a quick visual interpretation of a comparison graph. This version includes a scaled graph for specific intersection analysis and fits on one page. Fixes answer line contrast and legend size.
Trend Warmup Answer Key
Answer key for the Trend Starter Do Now, providing correct linear equations and visual interpretation solutions for the warmup activity. Provides consistent naming (Plan A/B) and proper spacing.
Fitness Frenzy Independent Practice
A two-page independent practice worksheet featuring a gym membership scenario. Students translate word problems into linear equations, complete data tables, graph results, and perform a comparative analysis. Consolidates content into exactly 2 pages with fixed layout, alignment, and corrected axis scaling for the analysis questions.
Fitness Frenzy Answer Key
Complete answer key for the Fitness Frenzy independent practice, featuring equations, table solutions, and detailed analysis for gym membership trends.
Botany Briefing Exit Ticket
A half-page exit ticket (duplicated on one sheet) designed for quick assessment of student ability to write equations, compare slopes/intercepts, and identify intersection points from a growth scenario. This version contains two identical functional tickets per sheet. Fixes page overflow and answer line height.
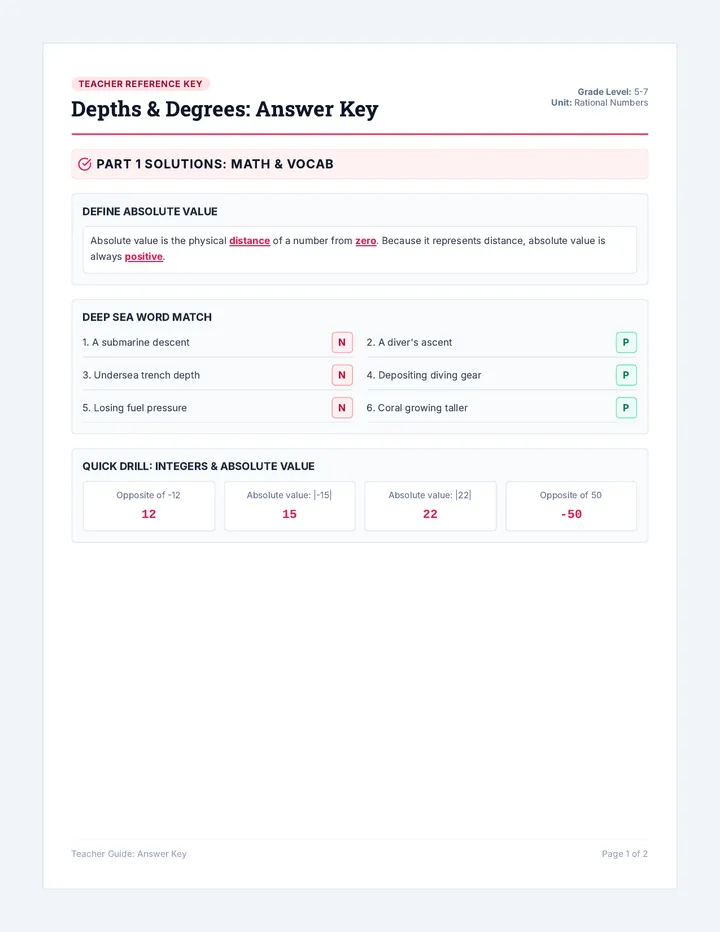
Botany Briefing Exit Answer Key
Answer key for the Botany Briefing exit ticket, providing equations, comparative logic, and a visual sketch guide for the teacher. Includes axis labels and improved contrast. Fixes SVG geometric precision and axis label clipping. Revised layout to ensure all content fits on one page. Darkened labels for better accessibility.
Pet Pal Showdown Worksheet
A two-page independent practice worksheet featuring a pet-sitting service scenario. Students translate word problems into linear equations, complete data tables, graph results, and perform a comparative analysis to make service recommendations based on usage. Consolidates content to fit exactly 2 pages with improved grid alignment and vocabulary support. Fixes layout overlaps and vertical alignment issues.
Pet Pal Showdown Answer Key
Complete answer key for the Pet Pal Showdown independent practice, providing equations, table solutions, and detailed analysis for pet-sitting service trends.
Intersection Insights Slides
A visually engaging slide deck teaching students how to identify the point of intersection between two linear graphs, explaining both the mathematical procedure and the real-world contextual meaning (break-even, tie, or overtaking point). Fixed content overflow and label clipping.
Intersection Drill Worksheet
A focused practice worksheet featuring four coordinate planes with intersecting lines. Students must practice the specific skill of identifying and writing the exact (x, y) coordinates for each point of intersection. Improved layout to avoid bisection and cleaned up Graph #1. Fixed label alignment and wrapping issues.
Intersection Drill Answer Key
The answer key for the Intersection Drill worksheet, providing the correct (x, y) coordinates for all four practice problems. Fixed page breaks and updated icons.
City Crossings Do Now
A map-themed Do Now warmup where students identify intersection coordinates for city streets on two different coordinate planes. This version fixes page breaks, SVG alignment, and contrast.
City Crossings Exit Ticket
A grid-themed exit ticket with a large graph where students must identify a specific (x, y) intersection and interpret its meaning in a real-world context. This version is 2-up for printing and fixes alignment issues. Darkened lines for better contrast.
City Crossings Homework Worksheet
An expanded two-page homework assignment with 6 graphing drill sectors and 3 advanced analysis questions. Includes a challenge question involving parallel lines and an algebraic verification task. Fixes layout, page balance, and missing axis labels. Corrected mathematical precision for Sector 4 and 5. White work areas for legibility. Questions 5-7 fit on page 2.
Ride Share Showdown Worksheet
A two-page independent practice worksheet featuring a ride-share rental scenario. Students translate word problems into linear equations, complete data tables, graph results, and perform a comparative analysis to determine the most cost-effective travel option. Corrected layout and graph alignment.
Ride Share Showdown Answer Key
Complete answer key for the Ride Share Showdown independent practice, providing equations, table solutions, a visual sketch guide, and detailed trend analysis recommendations. Corrected page breaks and contrast.
Intersection Intel Worksheet
A two-page independent practice worksheet focused on the skill of identifying and graphing points of intersection. Includes coordinate plane drills and a drone-themed graphing scenario. Consolidates content into 2 pages with widened work areas and fixed labels. Corrected axis alignment and labeling.
Intersection Intel Answer Key
Complete answer key for the Intersection Intel independent practice, providing correct coordinates, algebraic checks, and a visual plot guide for teachers. Consolidates solutions on a single page with labeled axes. Corrected mathematical plotting and grid alignment.
City Crossings Homework Answer Key
Complete answer key for the Grid Masters expanded homework assignment, providing all intersection points, algebraic proofs, and conceptual analysis samples. Corrected page breaks and updated icons. Adjusted to match revised Sector 1 (4,6) and Sector 4 (4,6) intersection coordinates. Darkened labels for contrast. Added reliable SVG checkmarks.
Trend Tracker Homework Worksheet
A two-page homework assignment focused on followers growth comparison. Students write equations, complete a data table, graph results, and perform a deep analysis of linear trends and intersections. This version fixes page breaks and improves graph grid alignment. Consolidates Page 2 to prevent overflow. Corrected axis scaling and labels.
Trend Tracker Homework Answer Key
Complete answer key for the Trend Tracker homework, providing all intersection points, algebraic proofs, and conceptual analysis samples for the viral video growth scenario. Fixed page breaks and consistent formatting. Consolidates sections for better usability. Corrected contrast and labeling.
Lawn Legends Practice Worksheet
A one-page practice worksheet comparing two lawn service price trends. Students write equations, complete a table, graph the results, and identify the point of intersection. Revised layout to fix overlap and page break issues. Corrected axis alignment.
Lawn Legends Answer Key
Answer key for the Lawn Legends practice sheet, providing equations, table solutions, and a visual plot reference. Includes detailed analysis of the breakeven point. Fixed page breaks and contrast. Standardized company naming. Corrected plotting precision.
Intersection Inspector Worksheet
A two-page independent practice worksheet focused on identifying and graphing points of intersection. Includes coordinate plane drills and a real-world scenario (Path A and B) for plotting systems of equations. Revised for better page breaks, alignment, and contrast. Corrected mathematical plotting and labels. Corrected missing '10' on X-axis and orphaned headers.
Intersection Inspector Answer Key
Answer key for the Intersection Inspector worksheet, providing coordinates for the drill graphs and a mathematically accurate visual reference for the rescue operation plot. Consolidates all solutions onto a single clear page with instructional tips. Revised for layout consistency and contrast. Corrected mathematical plotting and labels. Corrected Team Alpha's slope.
Tutor Tussle Homework Worksheet
A two-page homework assignment focused on the 'Tutor Tussle' scenario. Students write equations, complete data tables, graph results, and perform a deep analysis on the meaning of the intersection point and cost effectiveness. Fixed thematic mismatch, graph alignment, and page break issues. Corrected response box heights.
Tutor Tussle Homework Answer Key
Answer key for the Tutor Tussle homework assignment, providing full algebraic and graphical solutions. Includes detailed explanations for the break-even point and the impact of parallel trends. Fixed page breaks and contrast. Standardized labeling and math visuals. Corrected y-axis alignment and headers. Consolidates solutions onto one page. Fixed 'Initial Advantage' typo and y-axis truncation.