Students acquire the vocabulary needed to describe graphs, trends, and financial data (e.g., 'fluctuate,' 'plummet,' 'stabilize'). They practice presenting visual data verbally to an audience, ensuring clarity and professional tone.
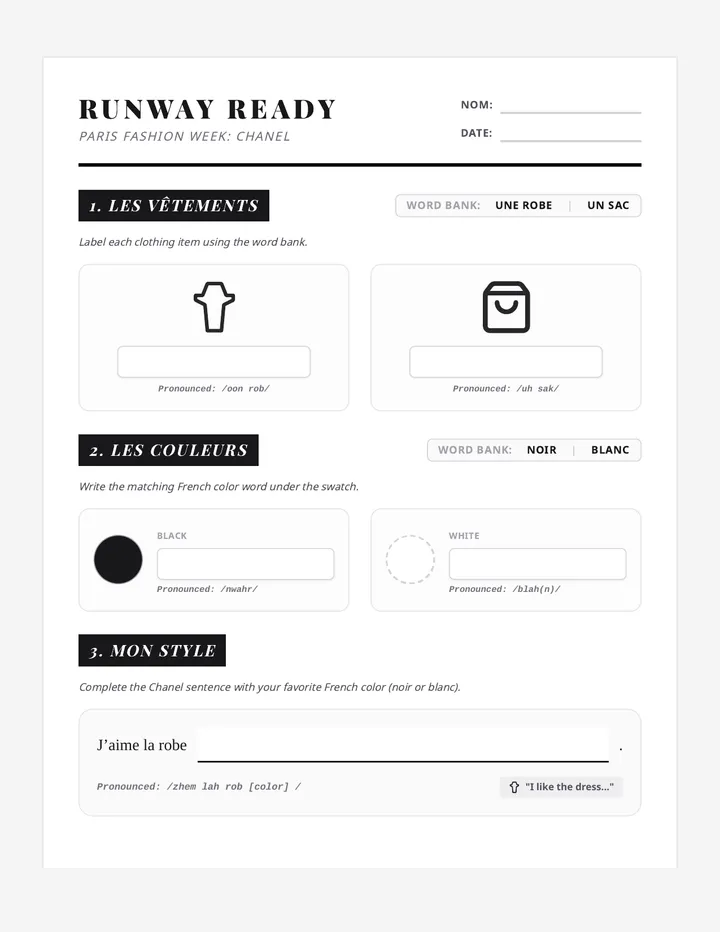
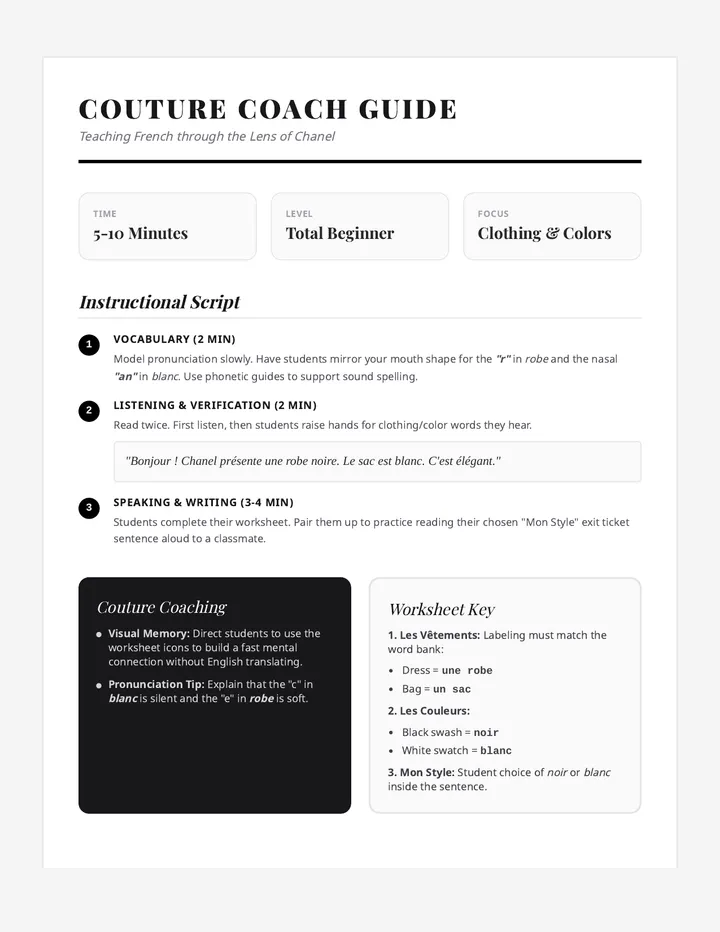
A beginner-level French sequence focusing on basic vocabulary related to fashion and colors through the lens of Paris Fashion Week and Chanel. Students learn to describe clothing and express preferences in a high-interest cultural context.
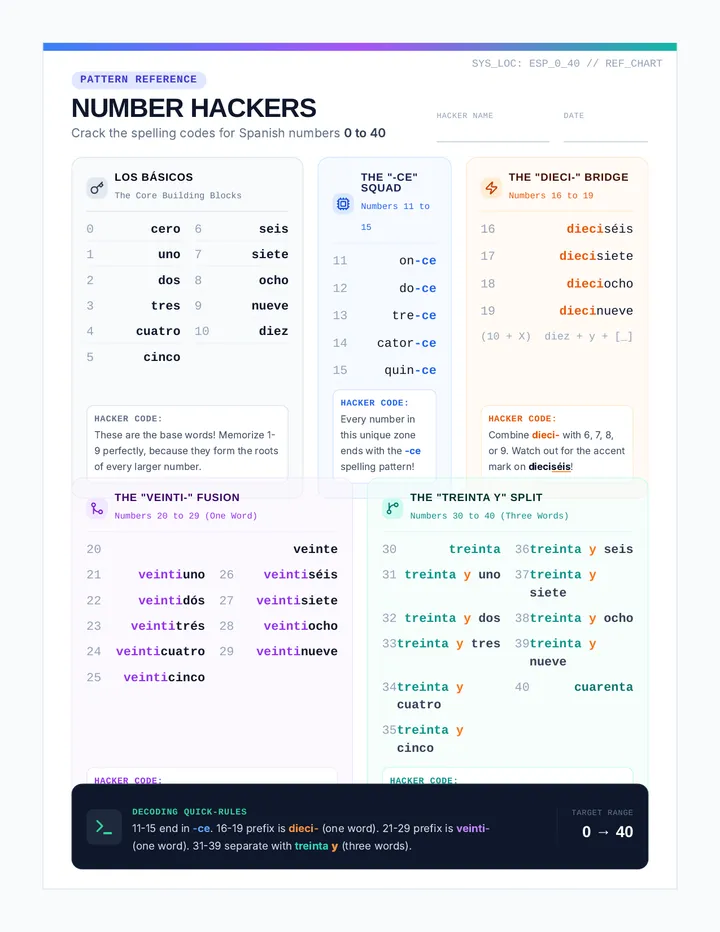
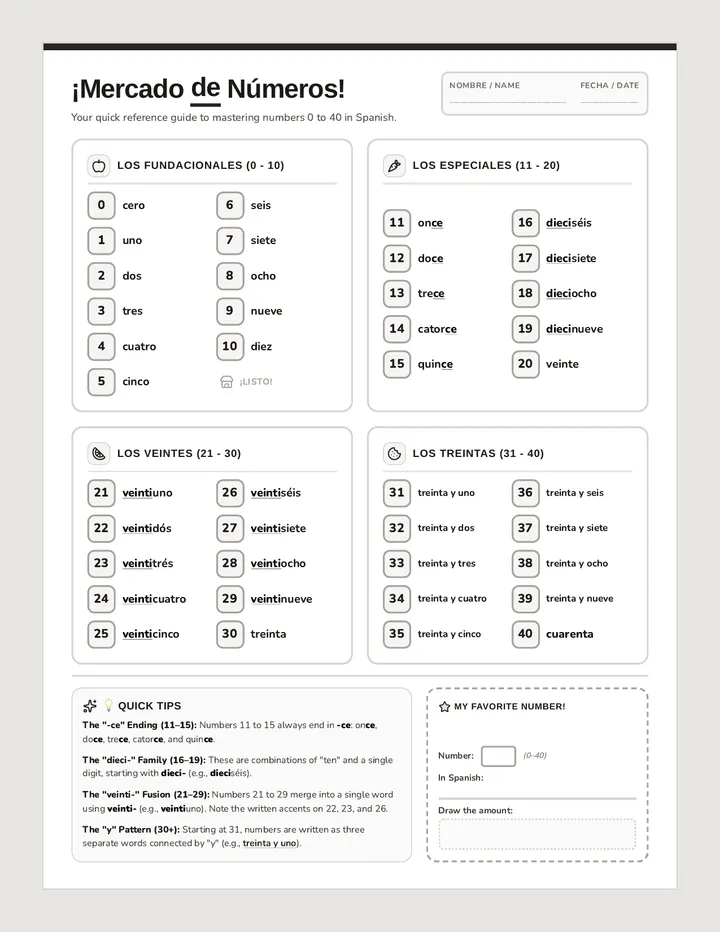
A lesson focused on mastering Spanish numbers 0-40 through pattern recognition, emphasizing key spelling transitions like -ce, dieci-, veinti-, and the conjunction 'treinta y'. Includes a highly visual pattern-coded anchor chart and a targeted spelling practice worksheet.
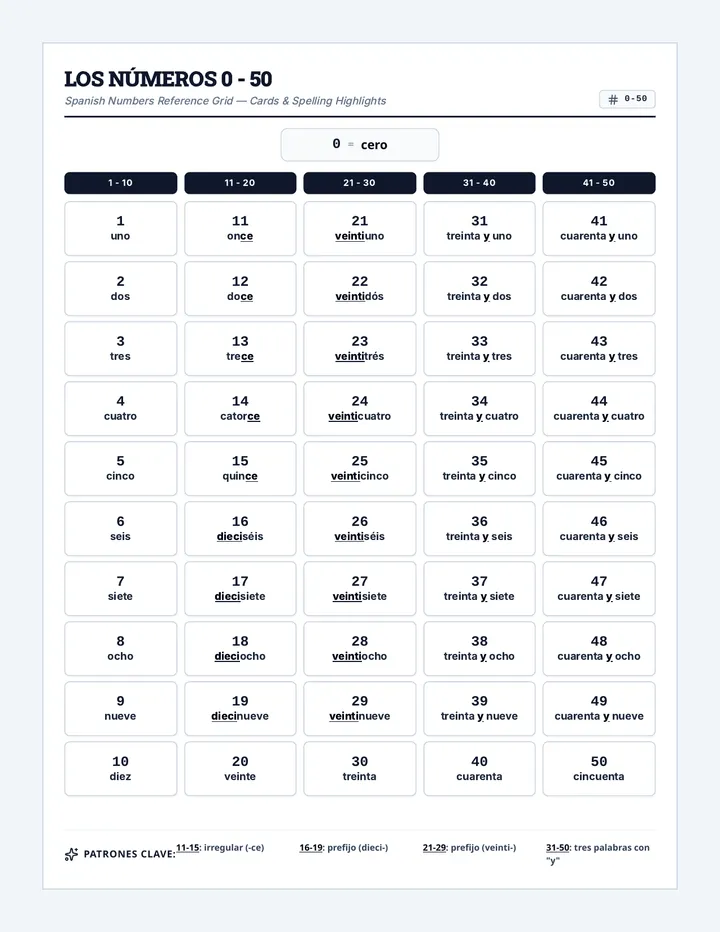
A high-contrast, black-and-white Spanish numbers 0-50 reference sheet. Optimized for sharp photocopying, it features extra-large numerals and underlined spelling rule highlights, with the header block simplified to remove student fields.
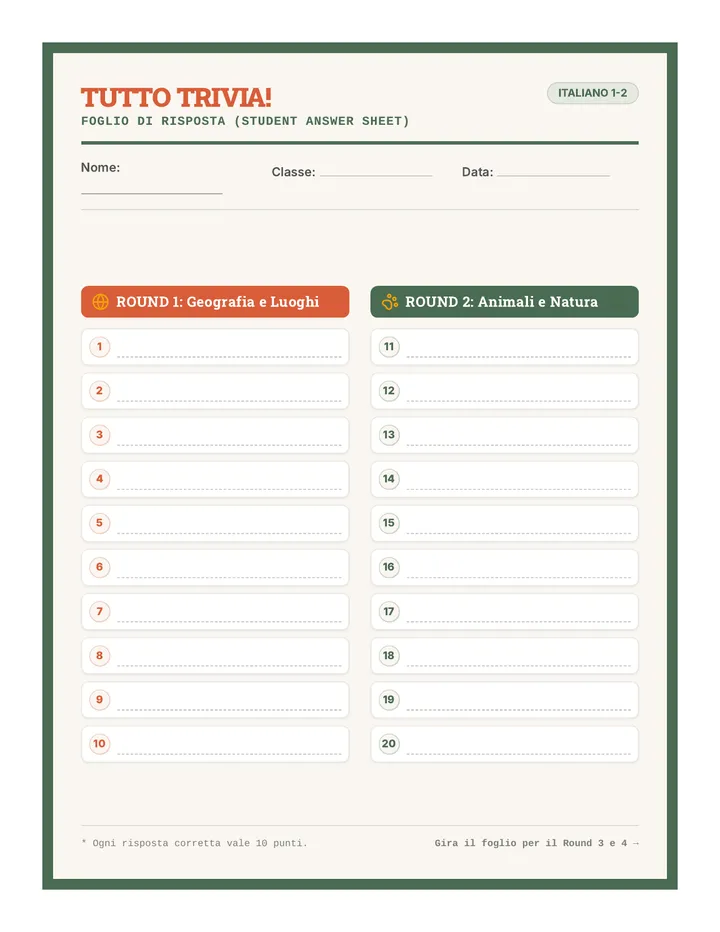
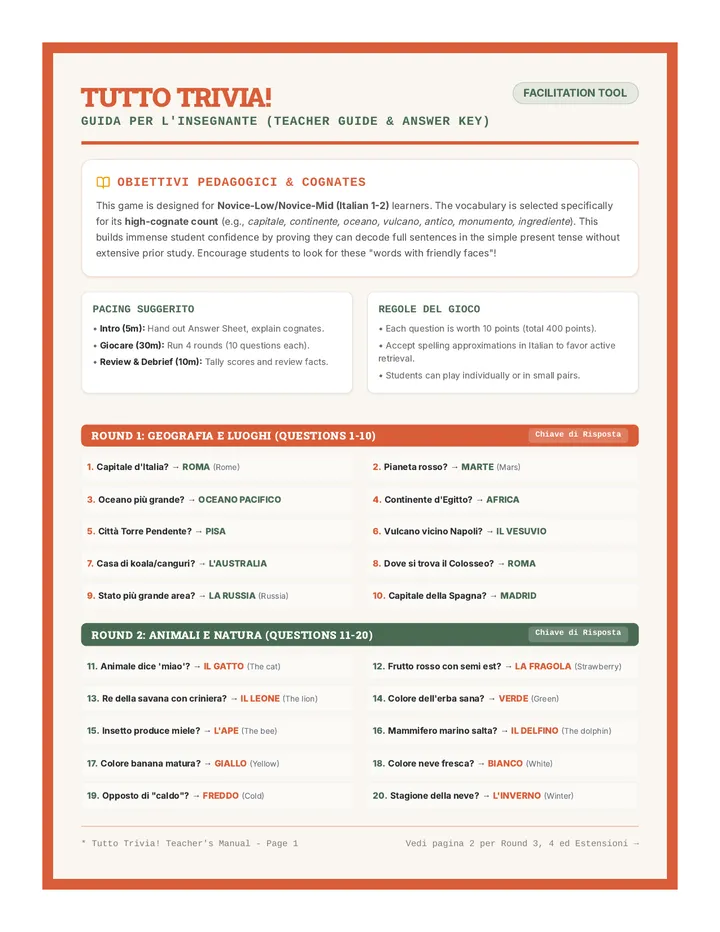
A high-engagement trivia module designed for novice Italian students (Italian 1-2) to practice vocabulary, comprehension, and general knowledge using highly cognate-rich questions and simple present tense. The unit features interactive slides, a student recording sheet, and a teacher facilitation guide.
A 5-minute introductory lesson on French fashion vocabulary and basic colors. Students practice listening, speaking, and writing simple sentences about Chanel's iconic style.
A beautifully designed, one-page Spanish numbers reference guide for numbers 0 to 40 in a high-contrast, black-and-white print layout. Features highlighted word stems (-ce, dieci-, veinti-) and English grammar/spelling notes at the bottom.
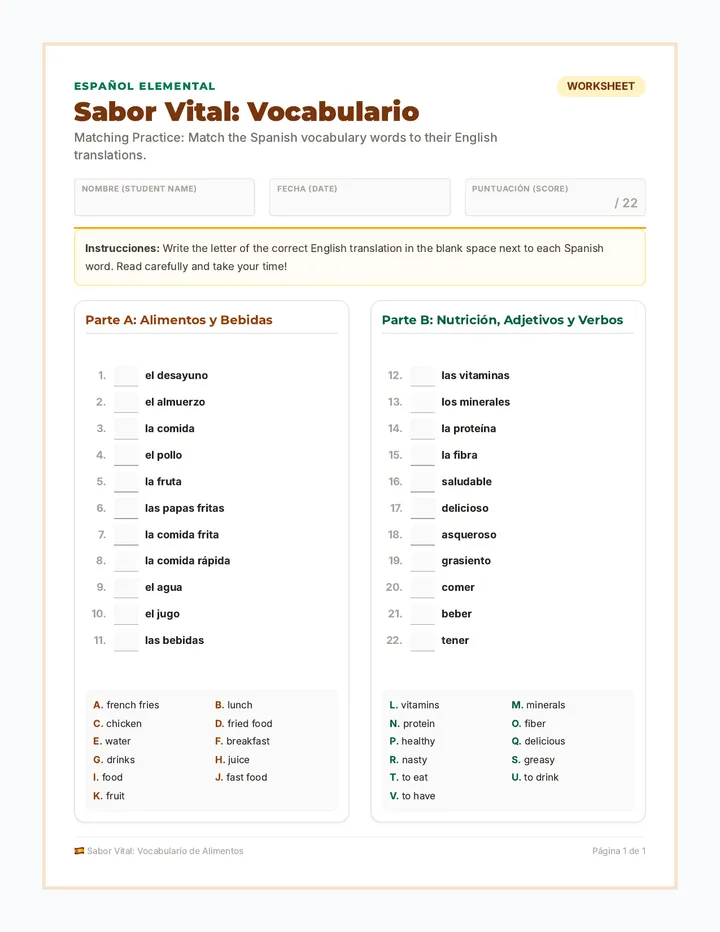
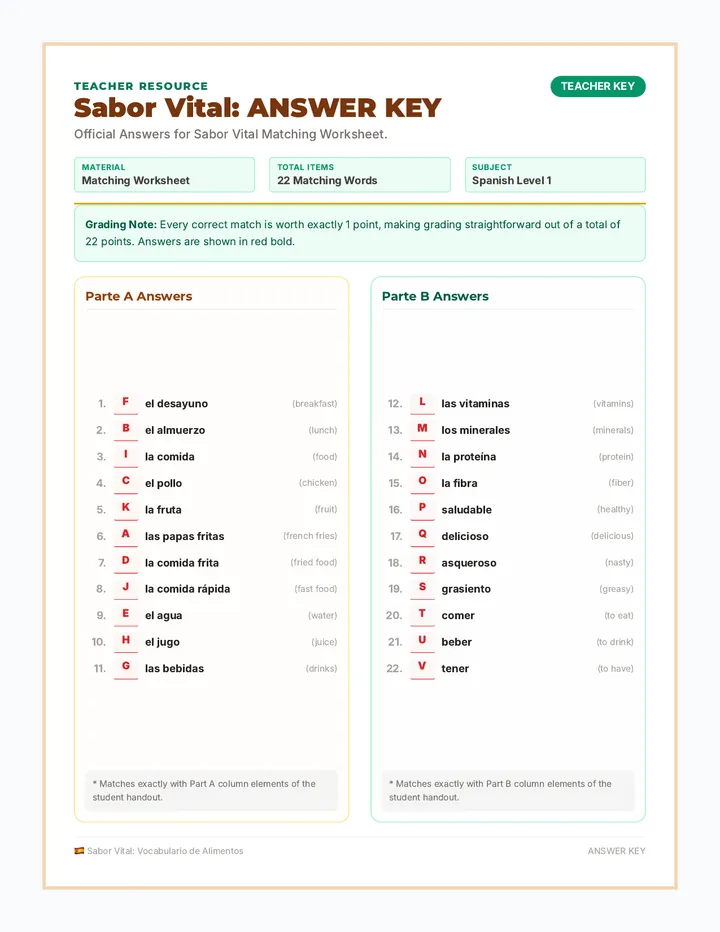
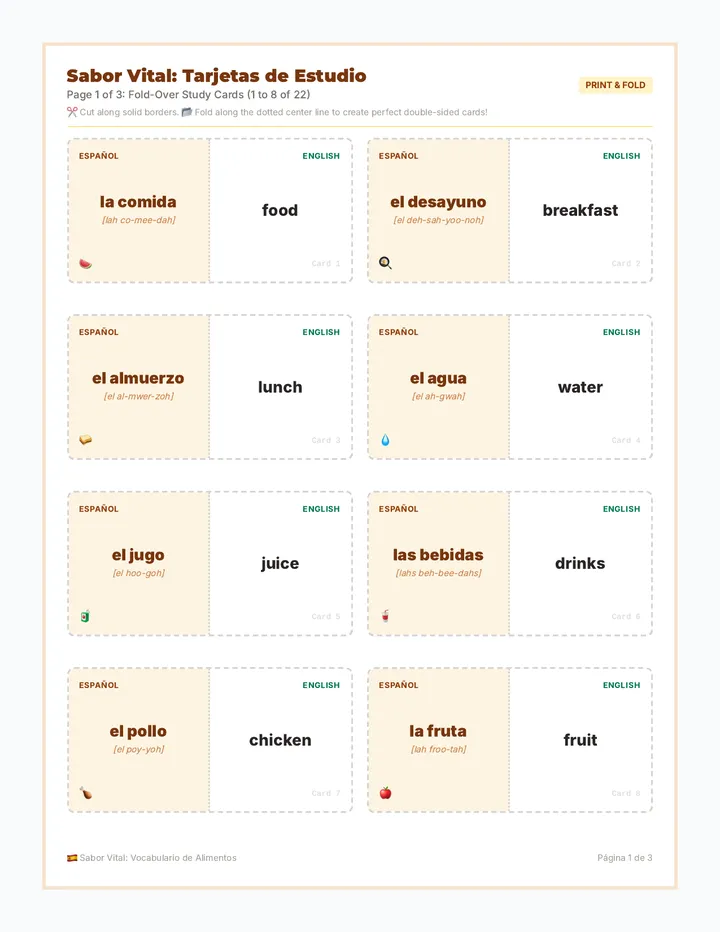
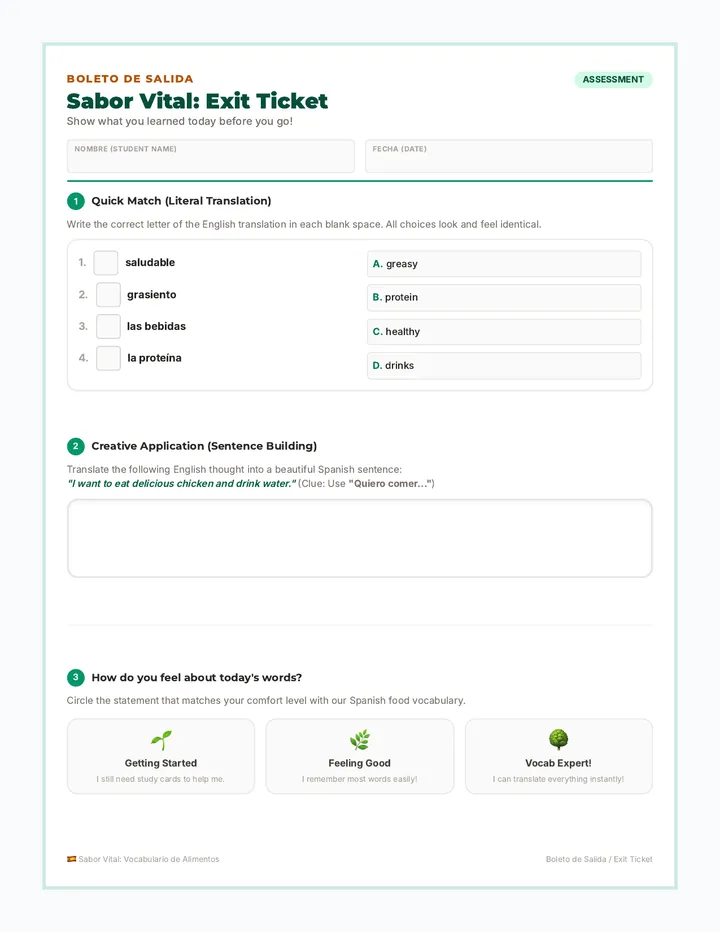
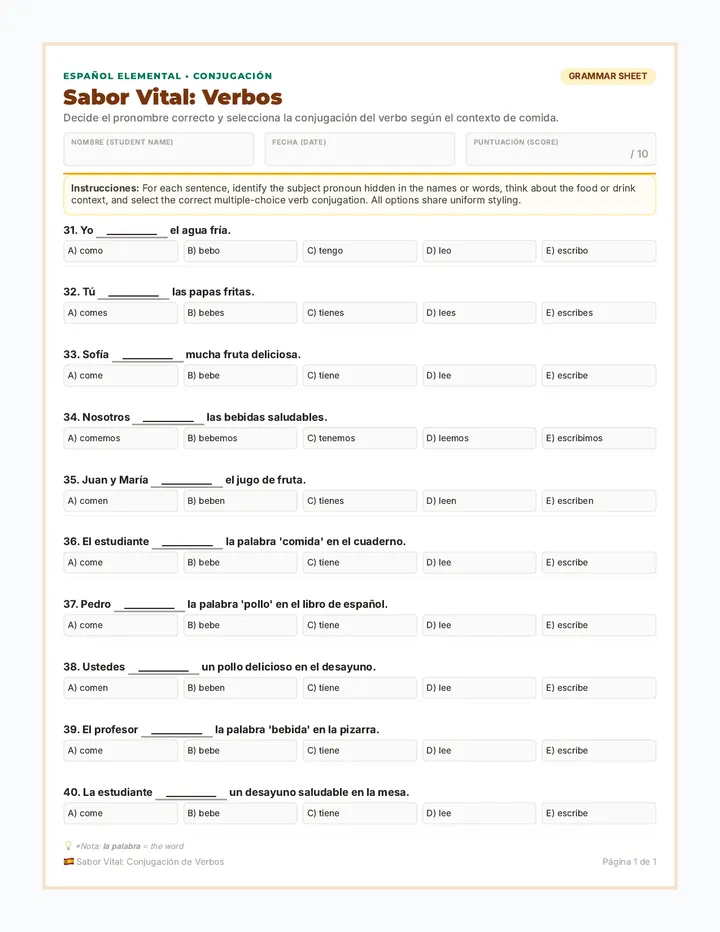
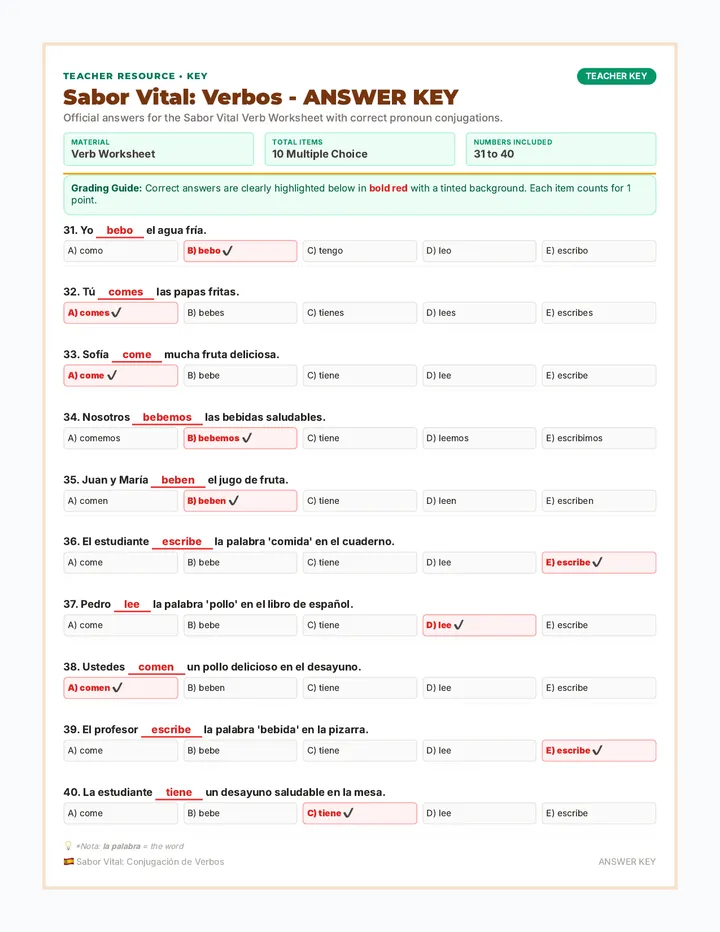
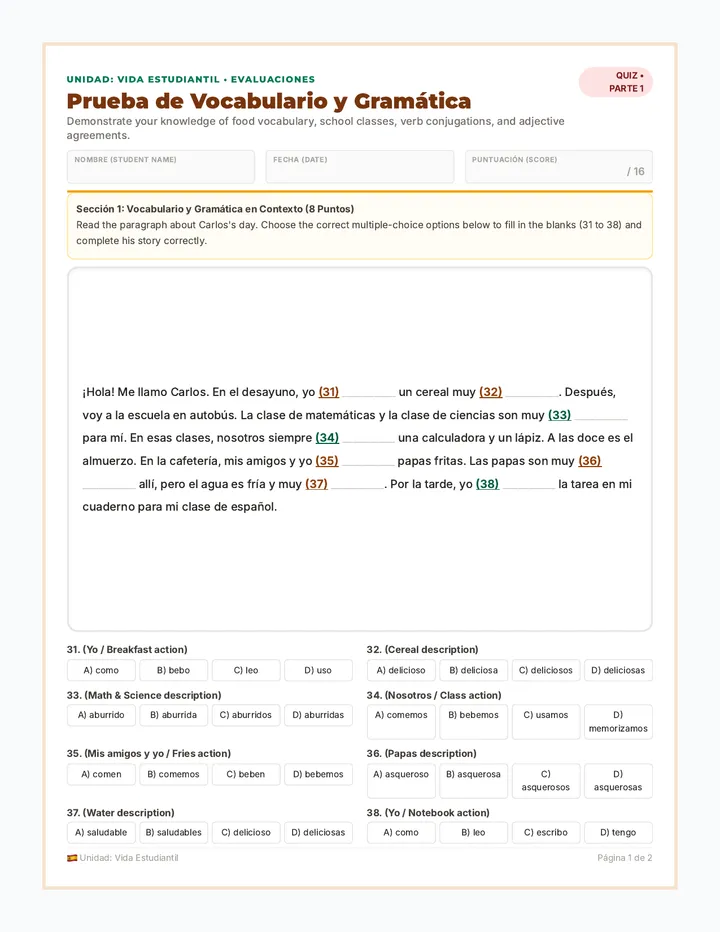
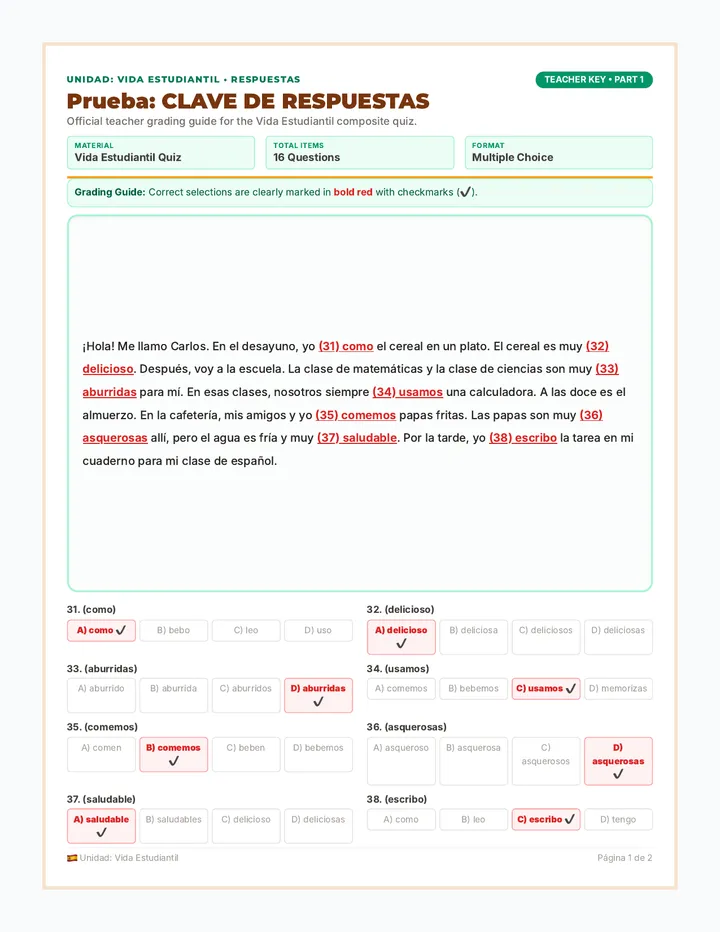
A beginner-level Spanish unit covering daily student life. It connects practical vocabulary for food and dining with descriptions of school schedules, classroom objects, and academic courses.
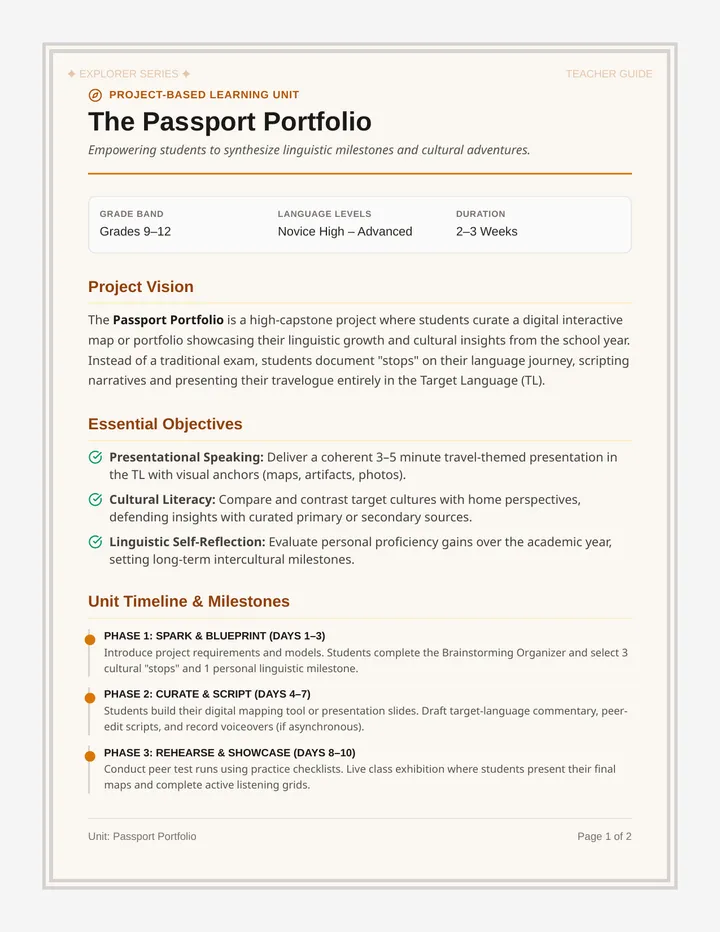
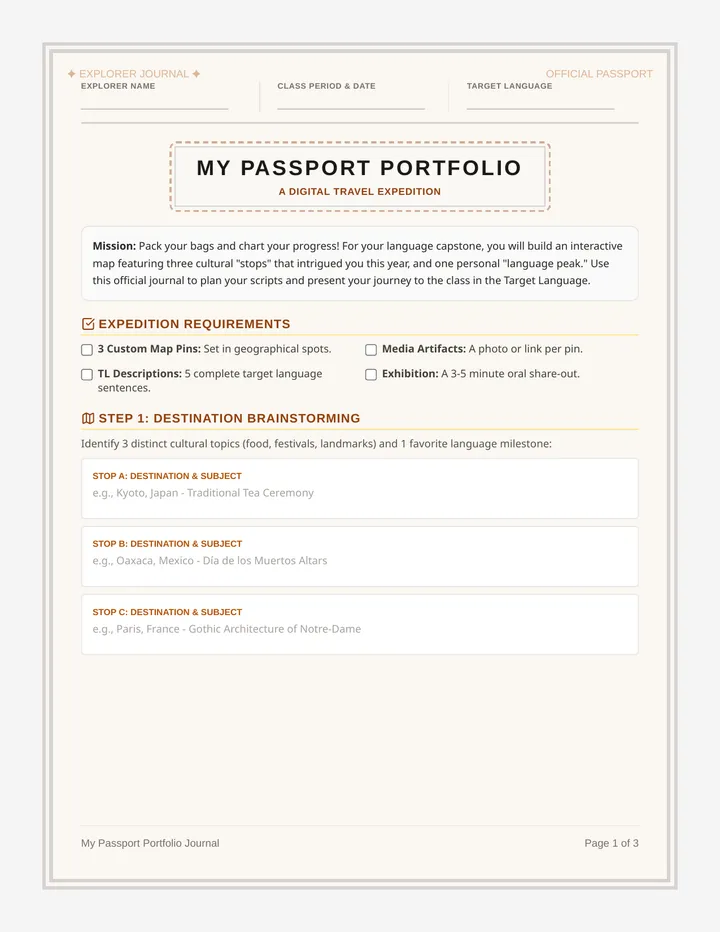
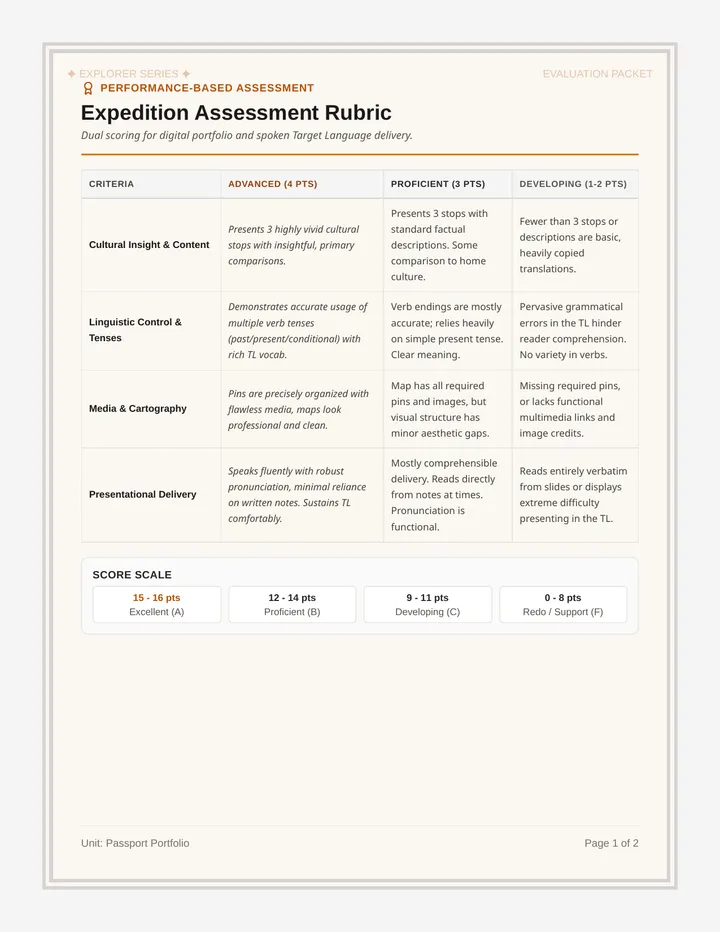
A project-based lesson where high school students design a digital travel map or portfolio of their cultural and linguistic discoveries, presenting their work in the target language.
A clean, visual Spanish numbers 0-40 student reference worksheet. It highlights key morphophonemic shifts: bolding '-ce' (11-15) and 'dieci-' (16-19), coloring 'veinti-' in purple/fuchsia, and split-coloring 'treinta y' to emphasize the conjunction pattern. Perfect for student binders or digital reference.
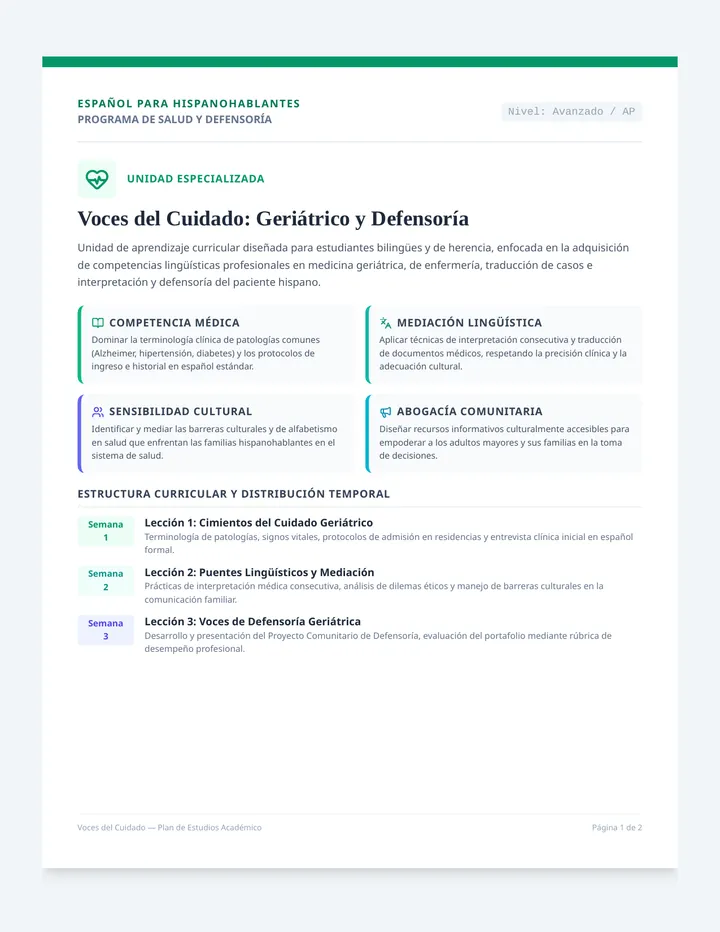
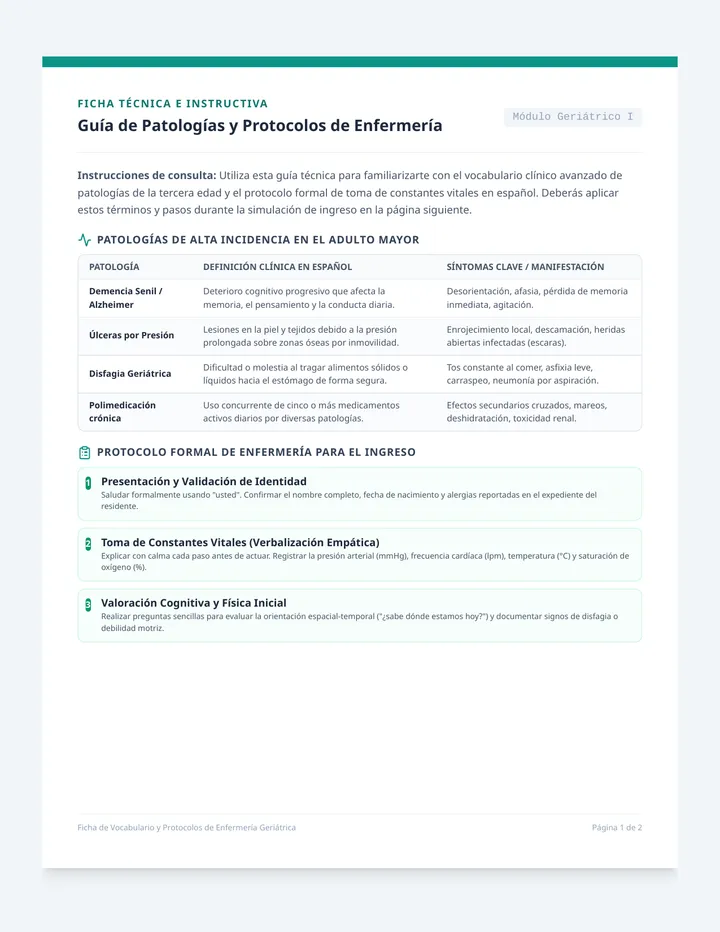
Unidad de aprendizaje especializada de español médico y defensoría para estudiantes hispanohablantes nativos y de herencia. Se centra en el cuidado geriátrico, protocolos de enfermería, traducción médica, y mediación cultural en hogares de ancianos, culminando en un proyecto de abogacía comunitaria.
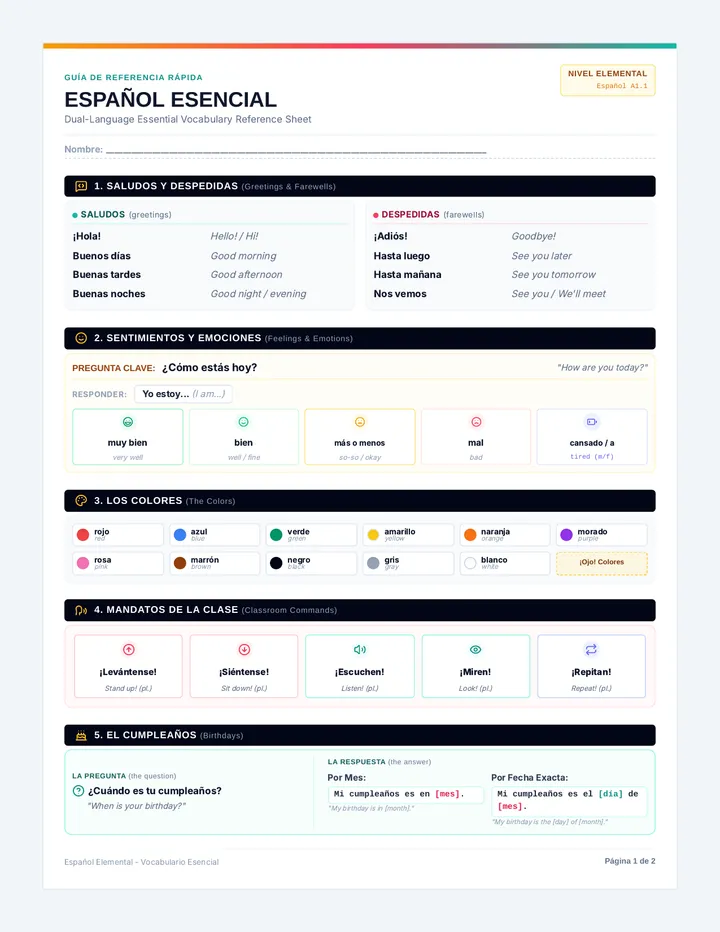
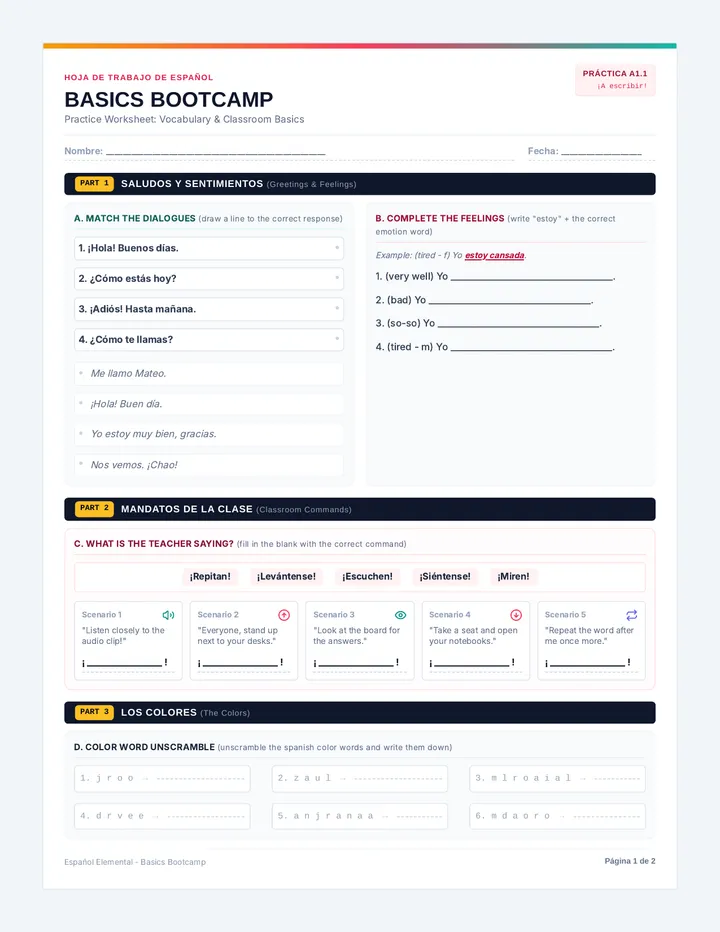
A foundational Spanish lesson covering basic conversational items: greetings, emotions, colors, numbers 0 to 40, and calendar systems (days of the week, months, and birthdays).
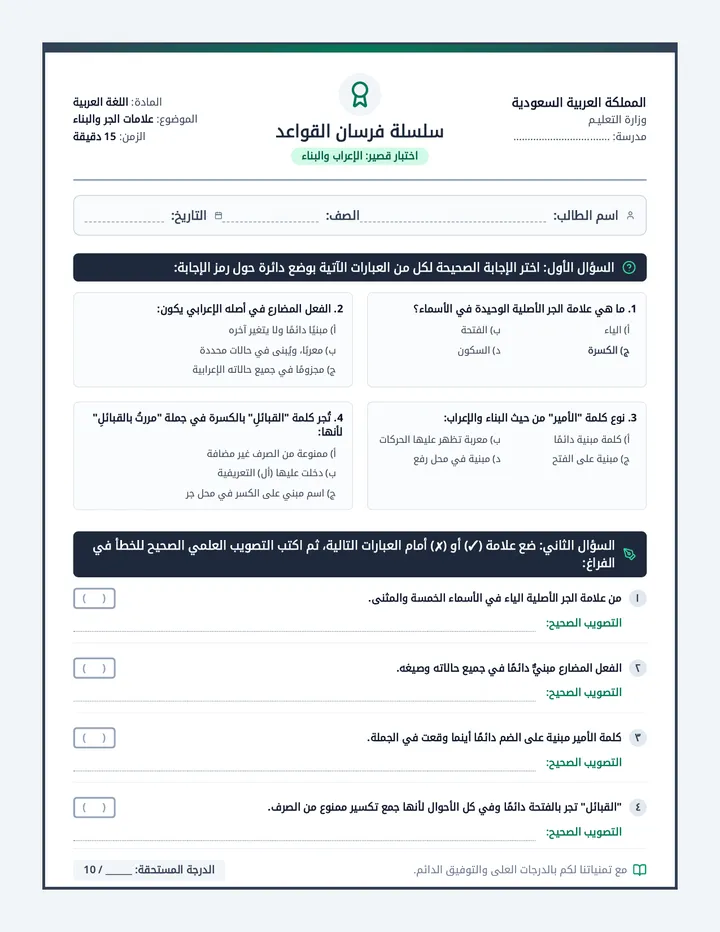
نموذج اختبار قصير ومنسق في النحو والصرف للغة العربية، يحتوي على أسئلة اختيار من متعدد وصح وخطأ مع مساحة للتصويب، مصمم للطباعة والتوزيع المباشر بدون حلول لتقييم فهم الطلاب بدقة.