Students collect data and create dot plots to visualize distributions, identifying clusters, peaks, and gaps.
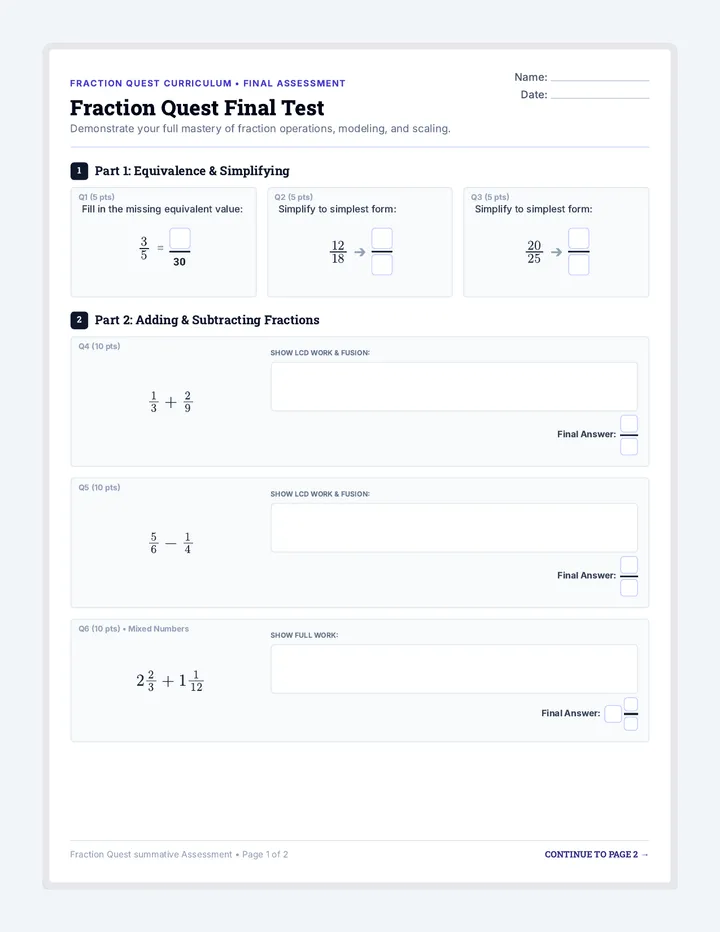
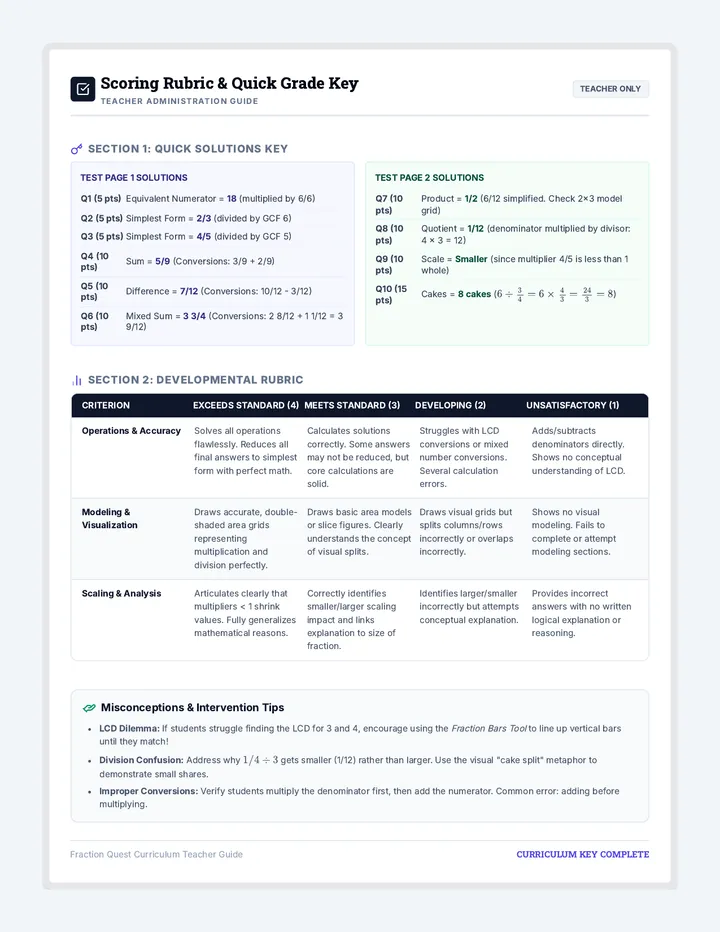
A comprehensive review and assessment of all four fraction operations. Students demonstrate their mastery through an interactive review, final unit assessment, and student reflection.
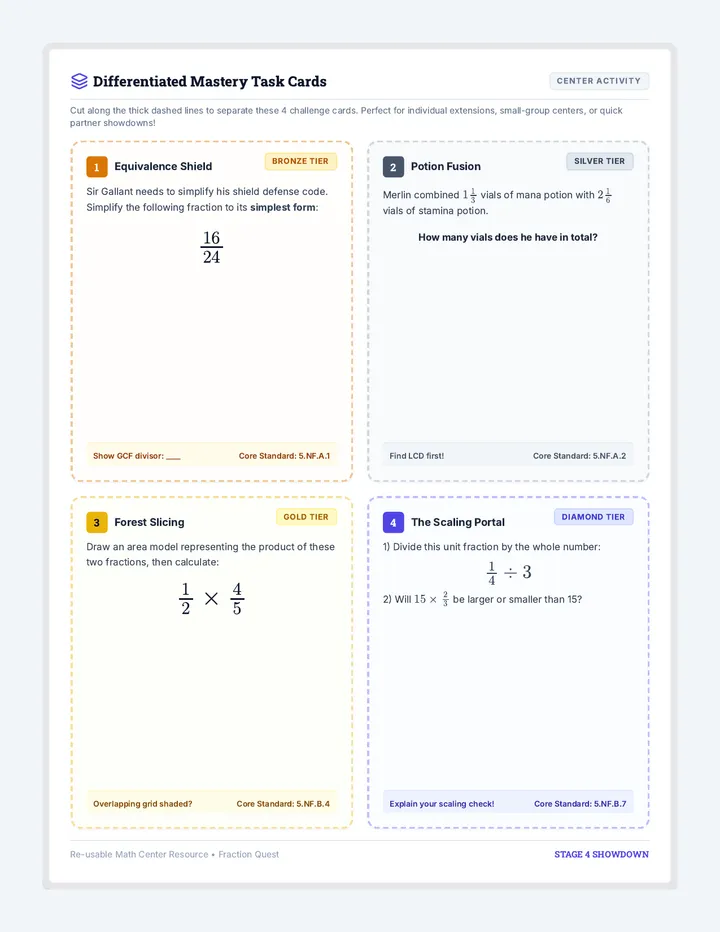
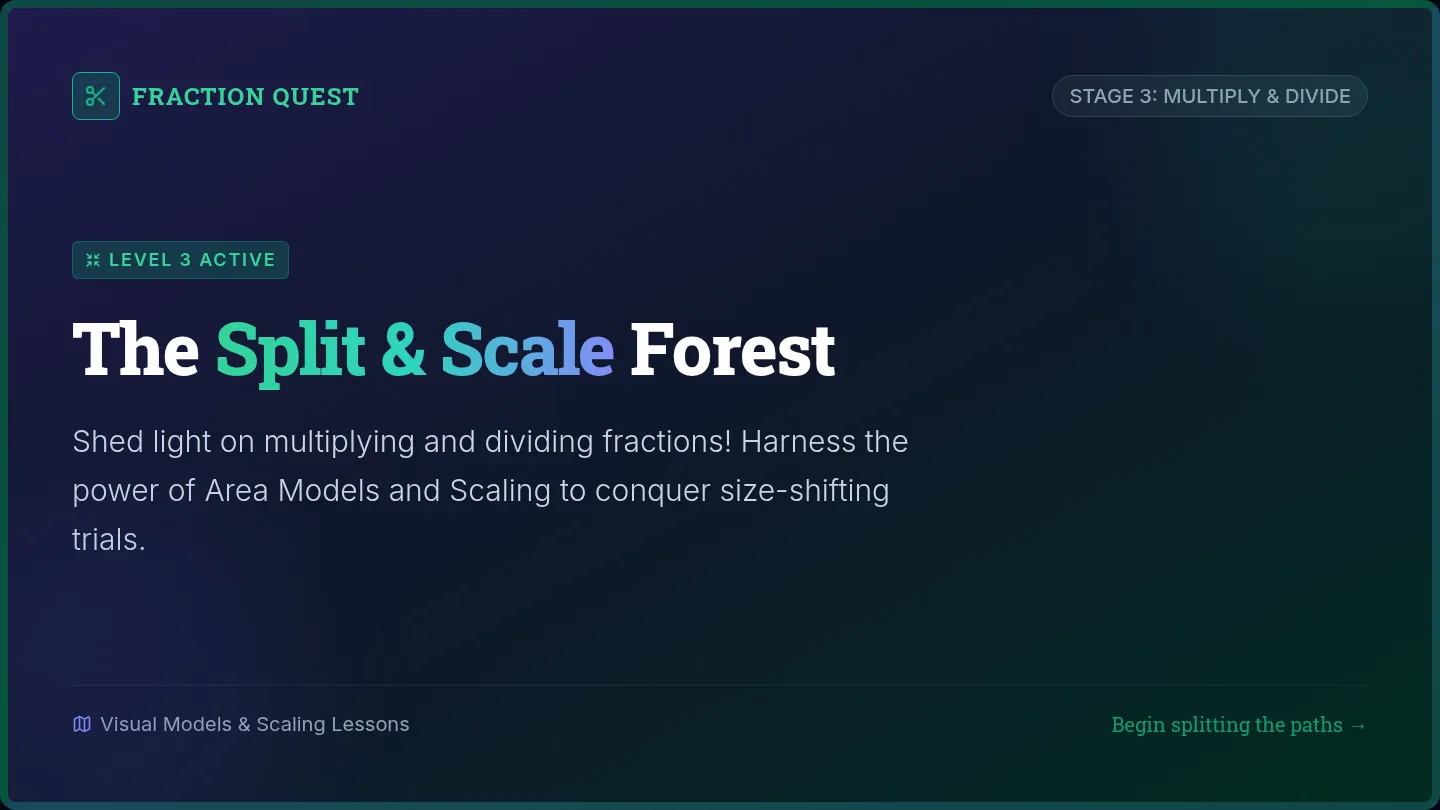
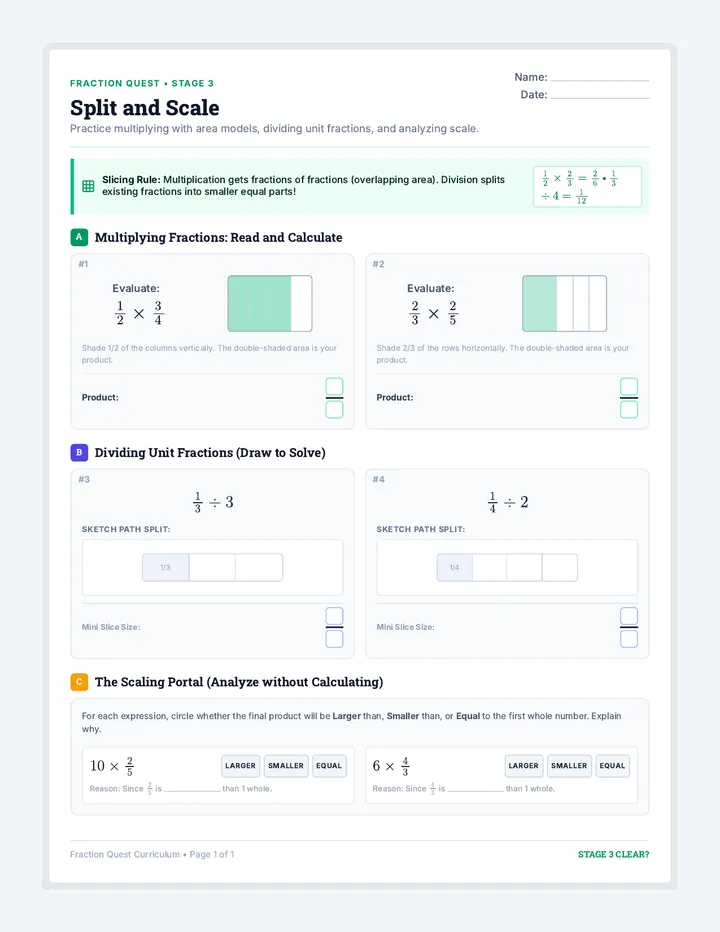
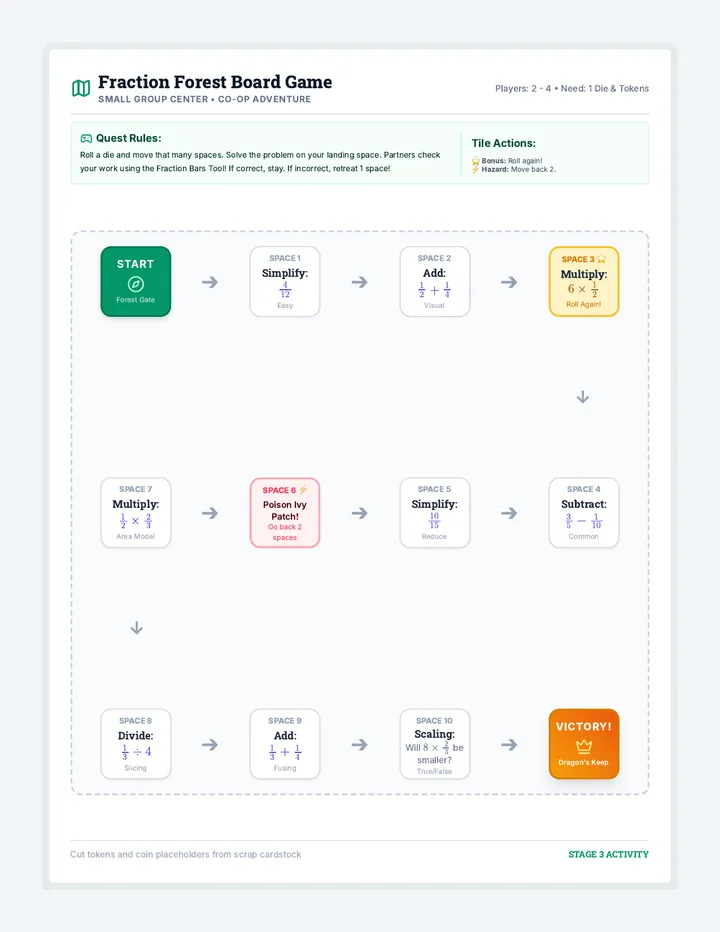
Multiplying and dividing fractions using area models, understanding scaling, and dividing unit fractions by whole numbers. Visual models help conceptualize these concepts.
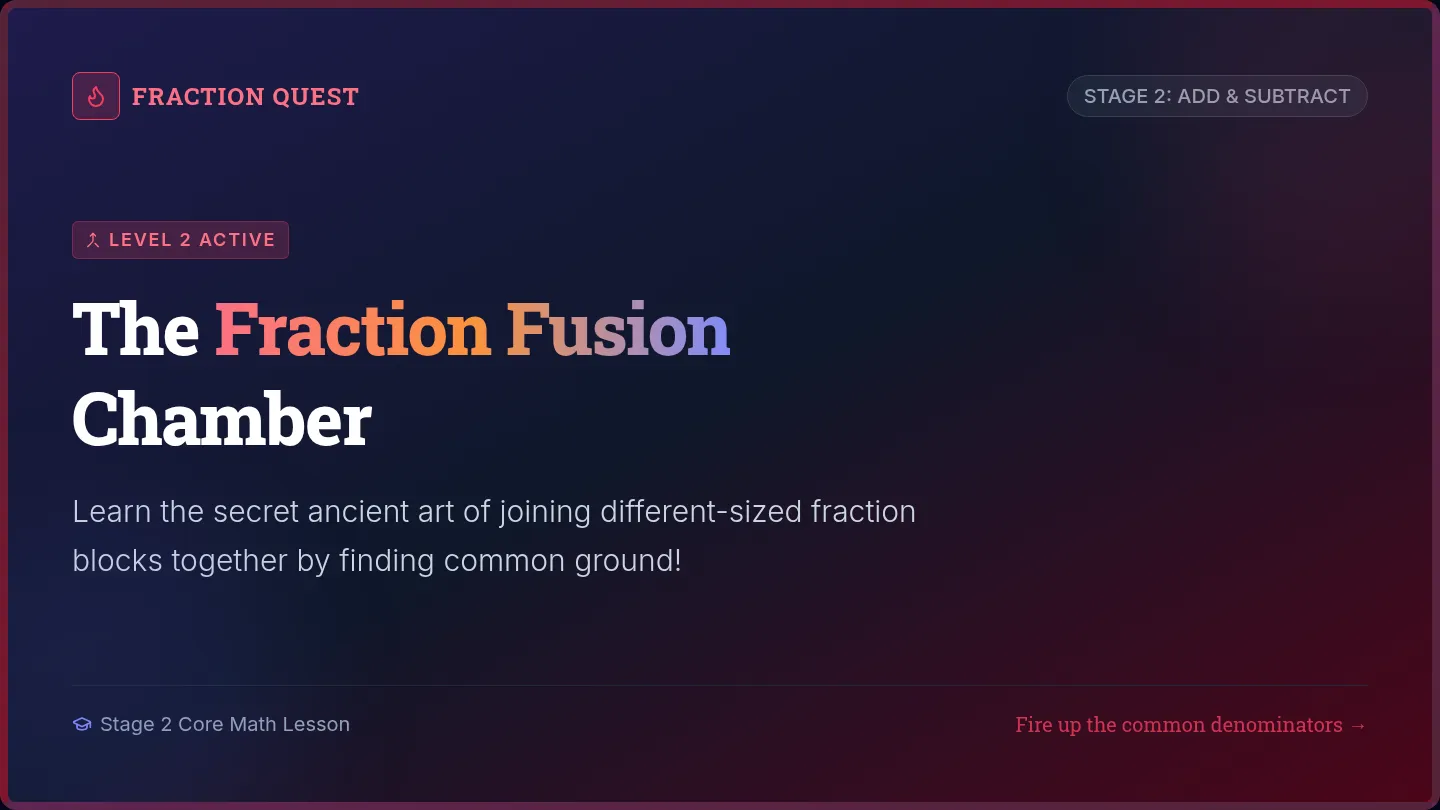
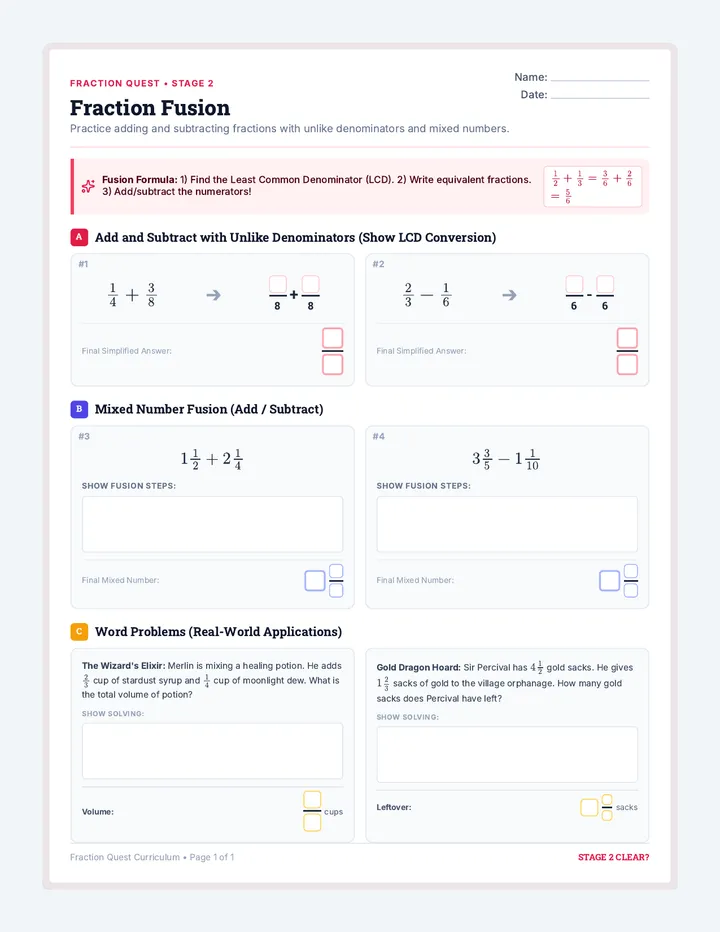
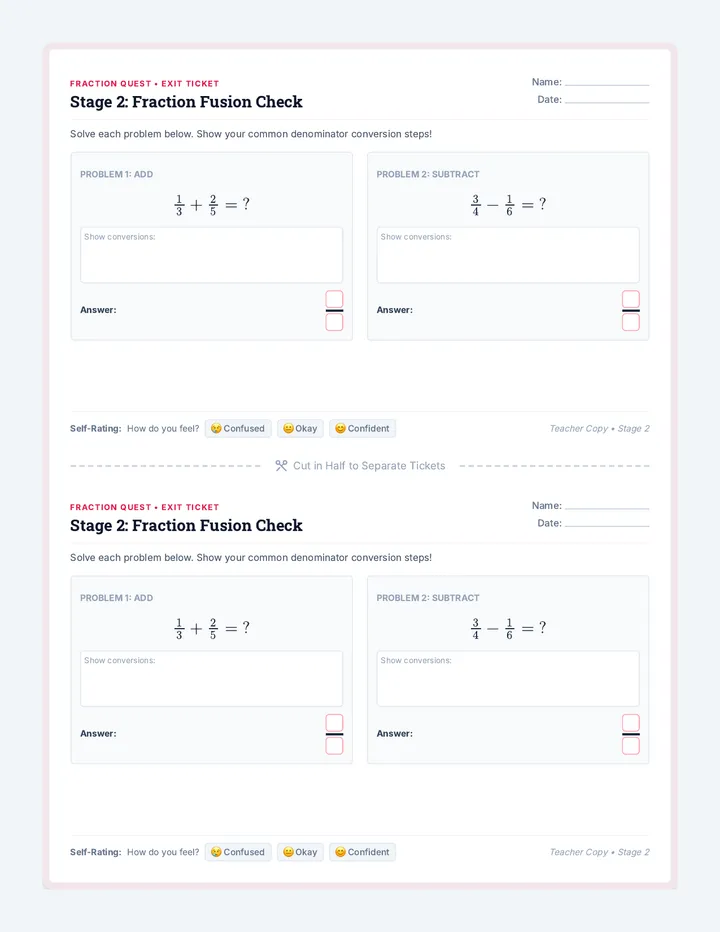
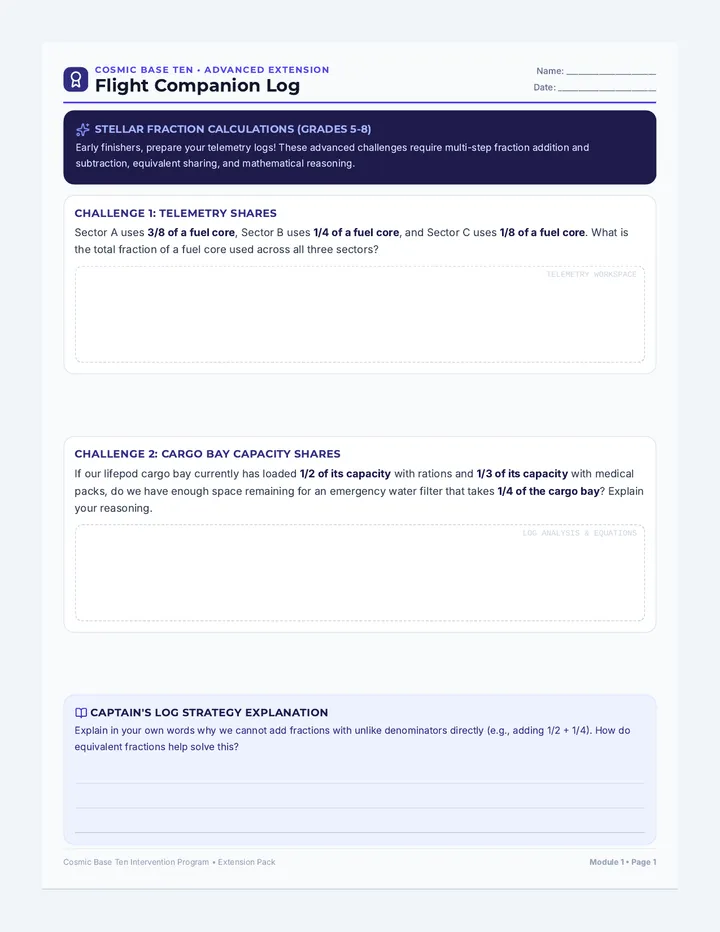
Adding and subtracting fractions with unlike denominators, including mixed numbers and standard real-world word problems. Students learn to find equivalent fractions with common denominators to add and subtract.
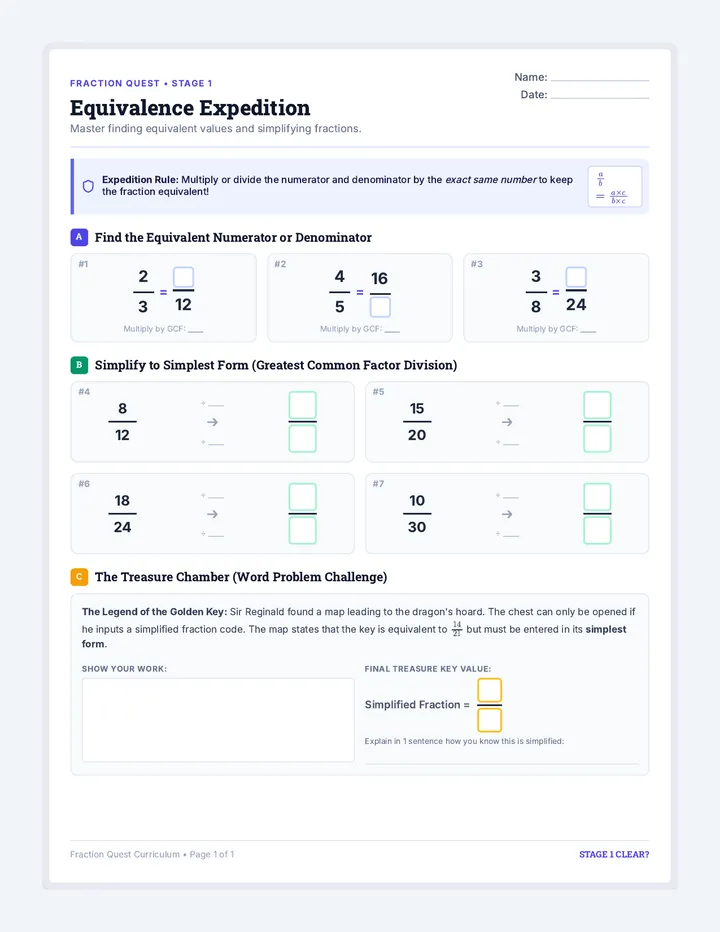
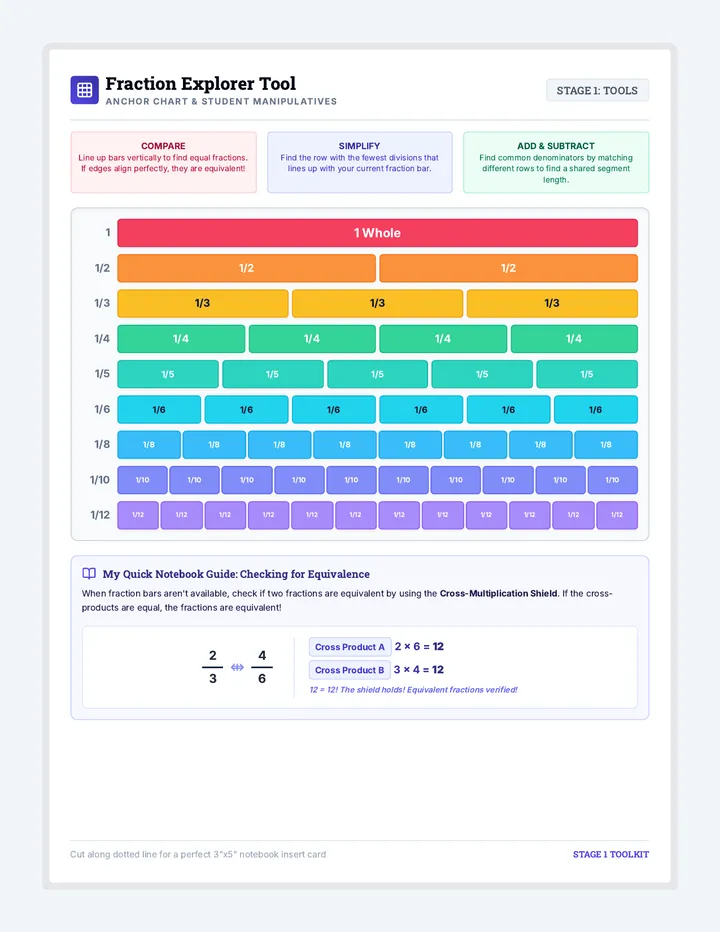
Mastering equivalent fractions and simplifying. Students discover visual equivalencies, identify common denominators, and reduce fractions to their simplest form using step-by-step mathematical reasoning.
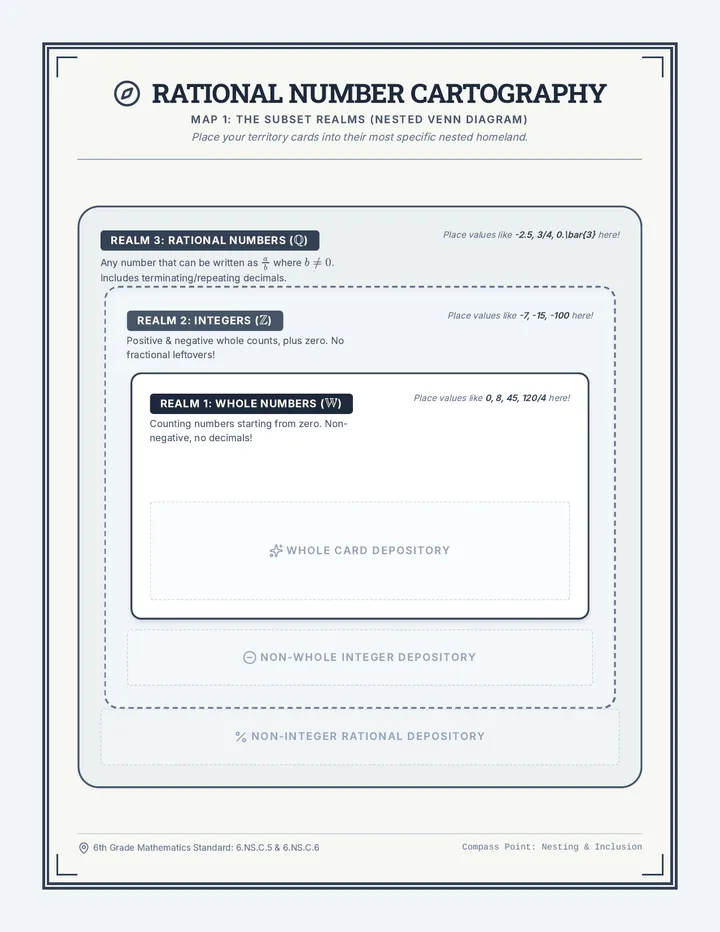
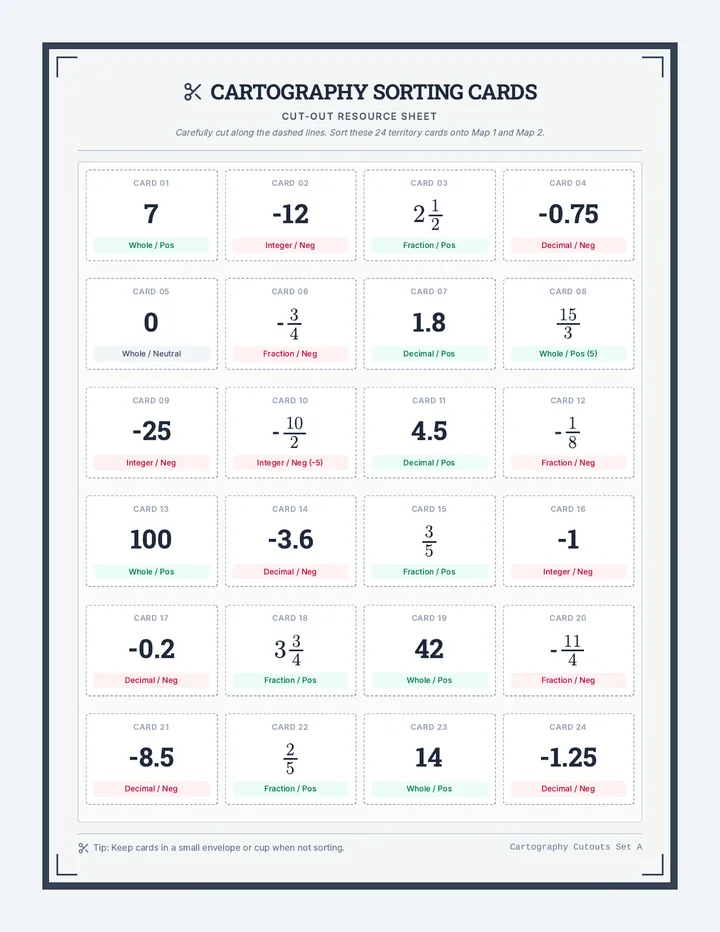
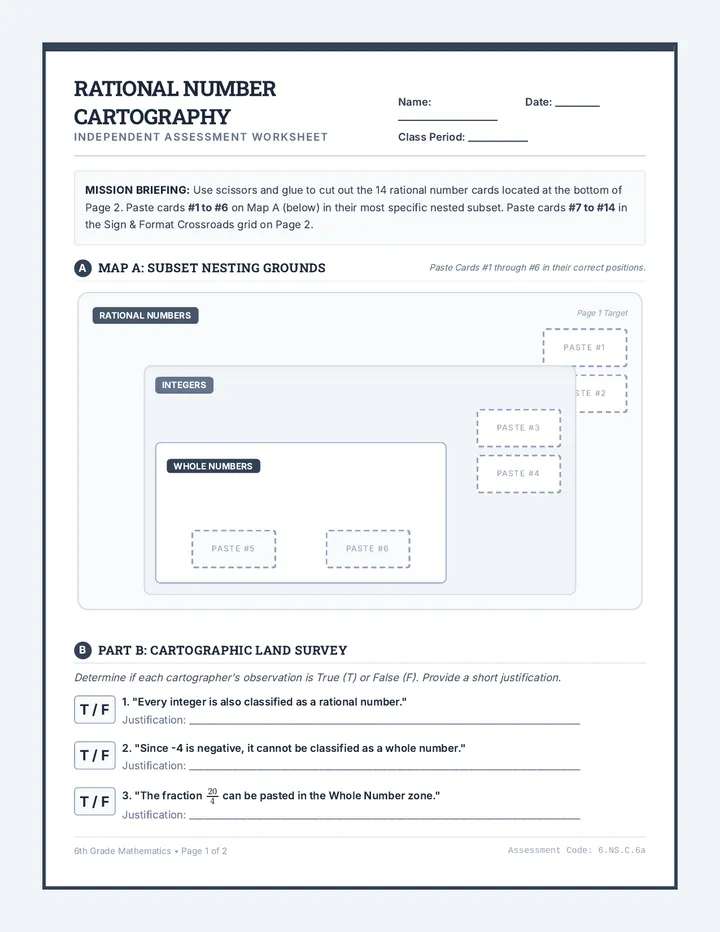
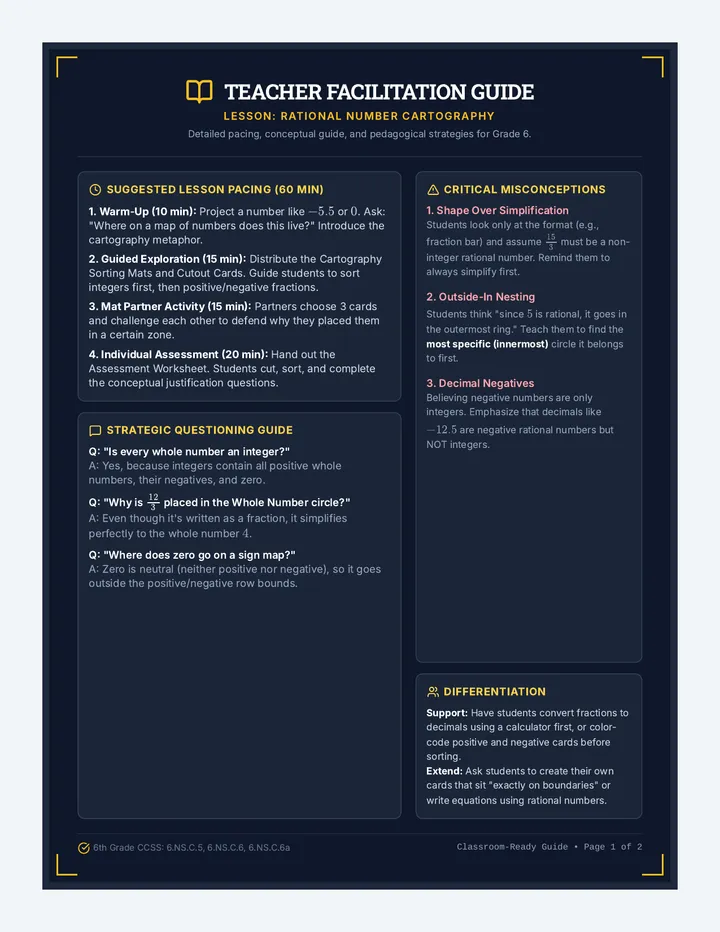
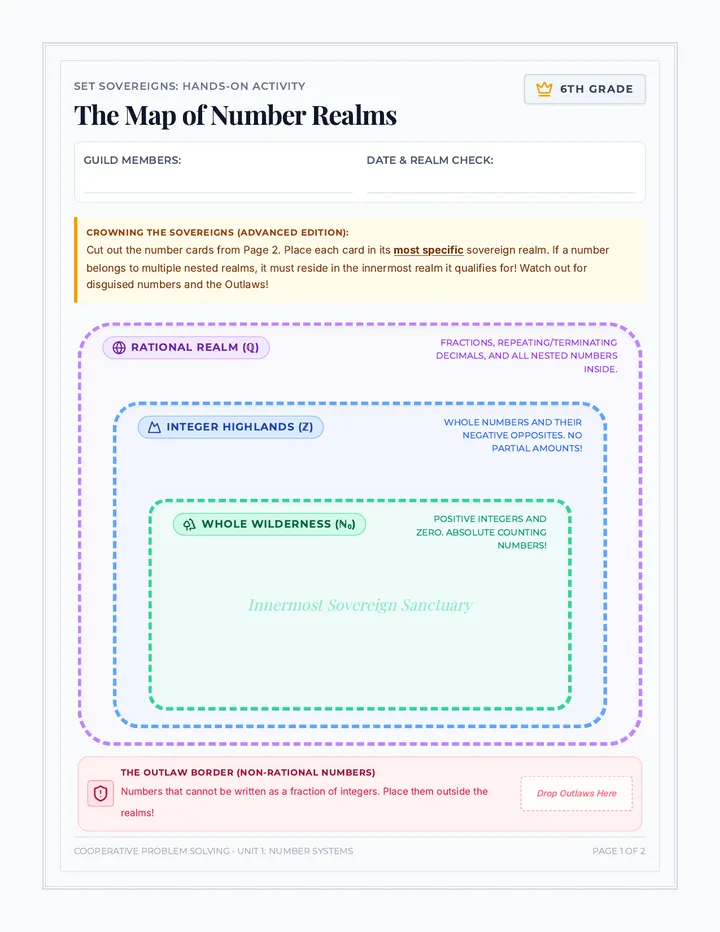
A hands-on, highly visual lesson where 6th-grade students explore the realm of rational numbers. Students use sorting mats, custom cut-out cards, and independent worksheets to classify numbers into nested subsets (Whole, Integers, Rational) and organize them by format and sign.
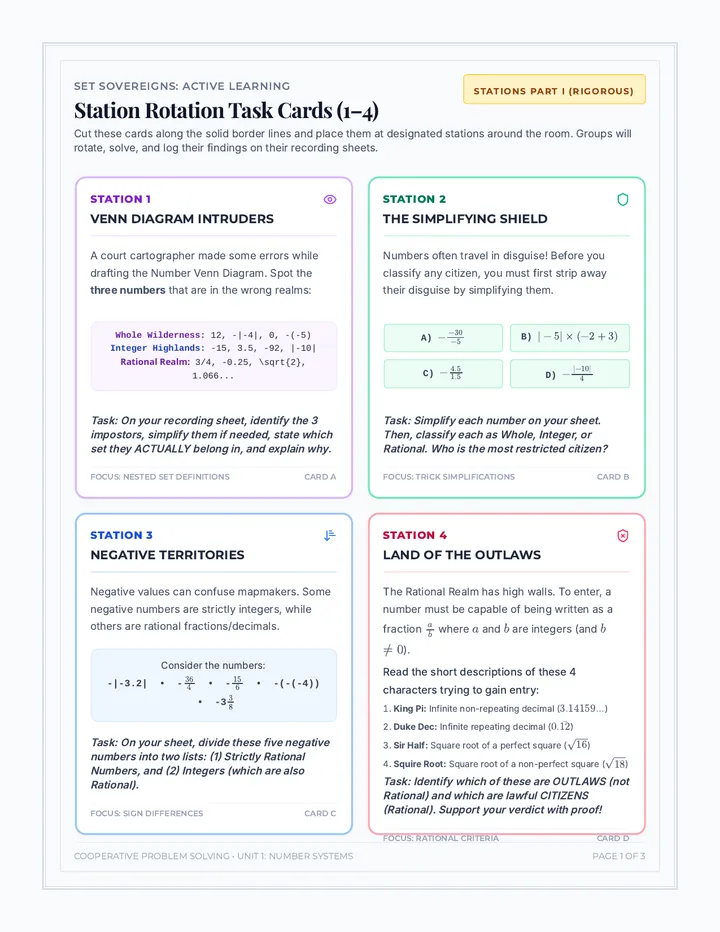
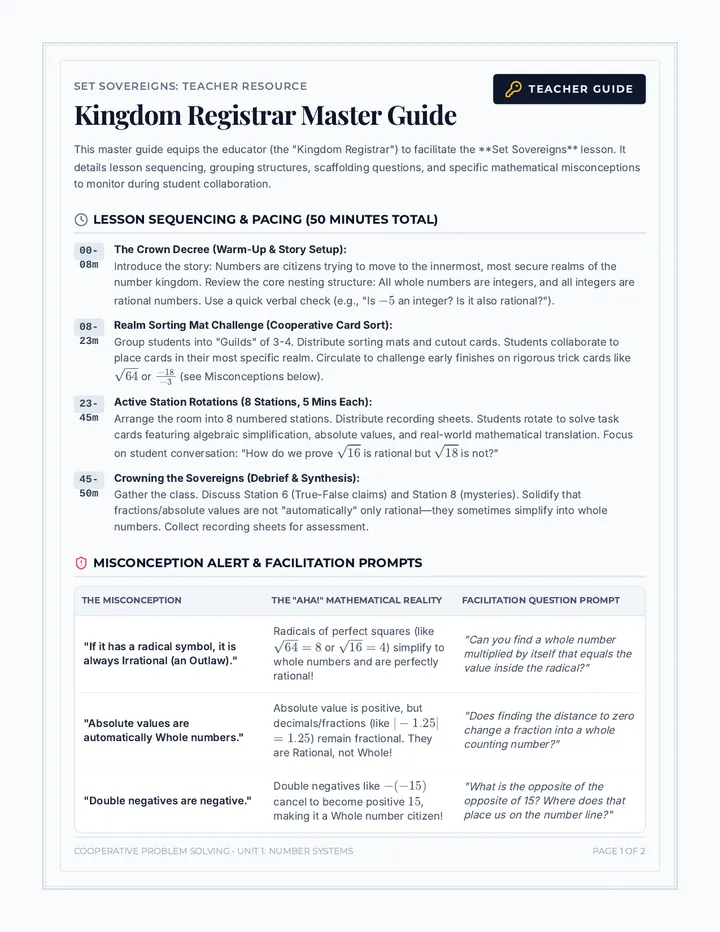
A hands-on, collaborative lesson where 6th-grade students master the nested relationships of the rational number system. Students explore whole numbers, integers, and rational numbers through an interactive card sort and active station rotation challenge.
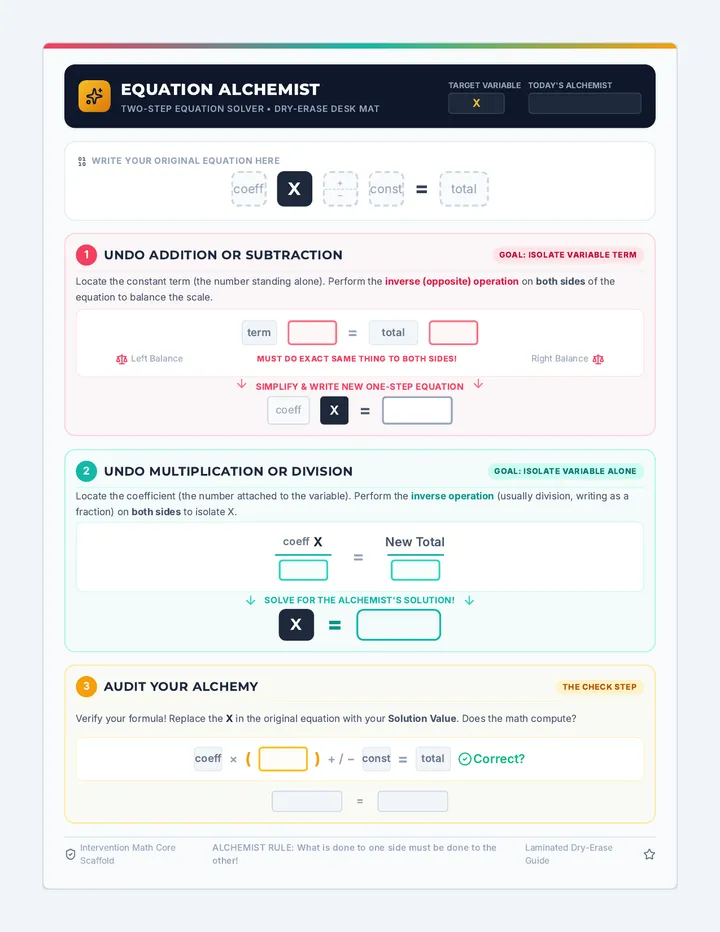
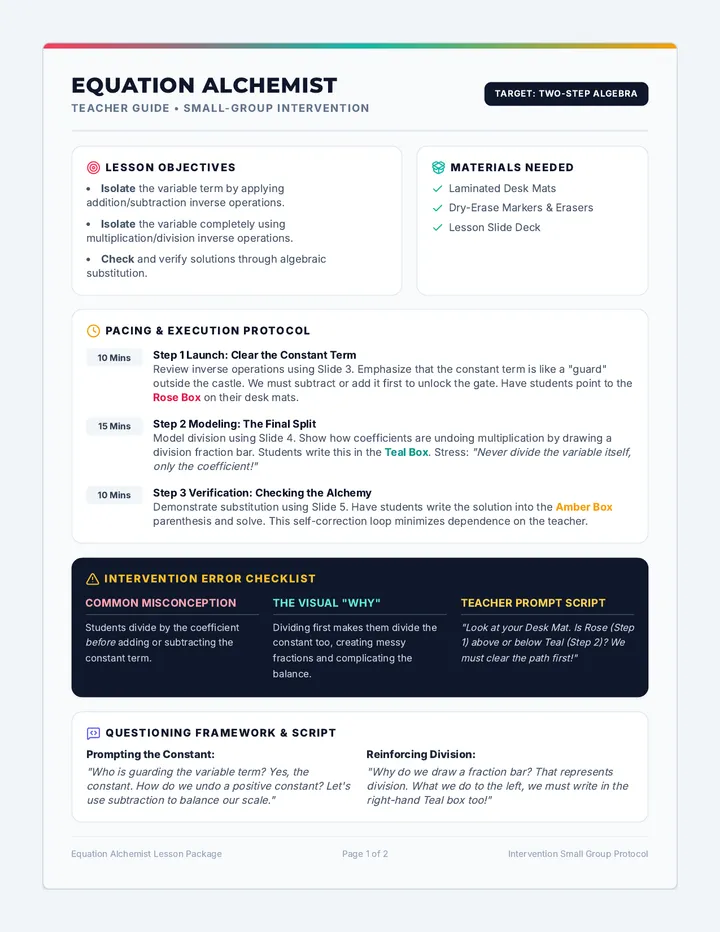
A comprehensive math intervention lesson targeting two-step algebraic equations. Features a color-coded step-by-step visual organizer that guides students through undoing addition/subtraction first, followed by multiplication/division to isolate the variable.
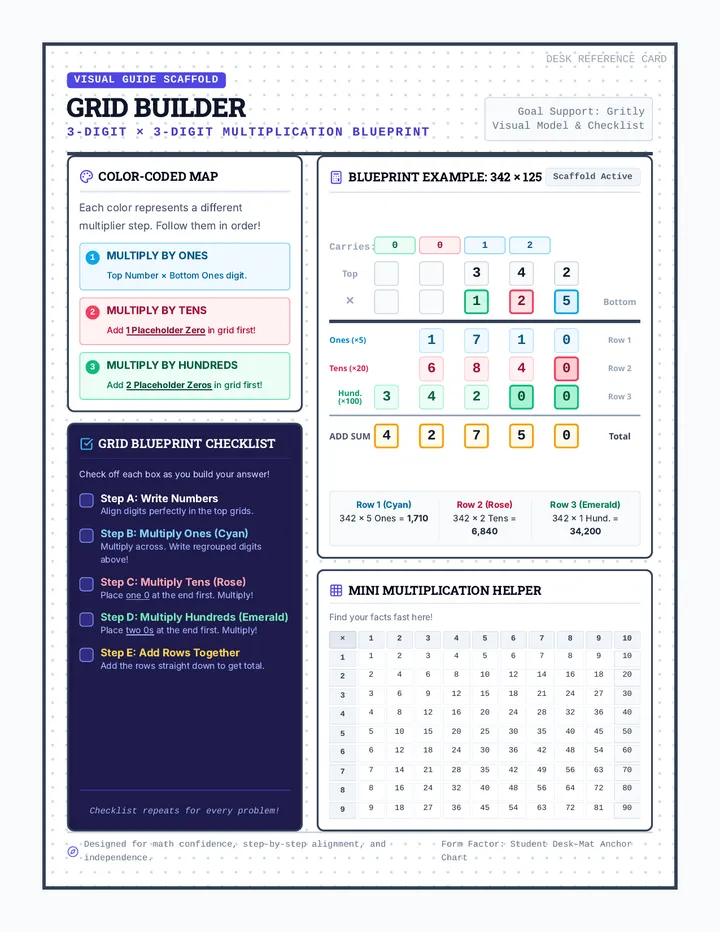
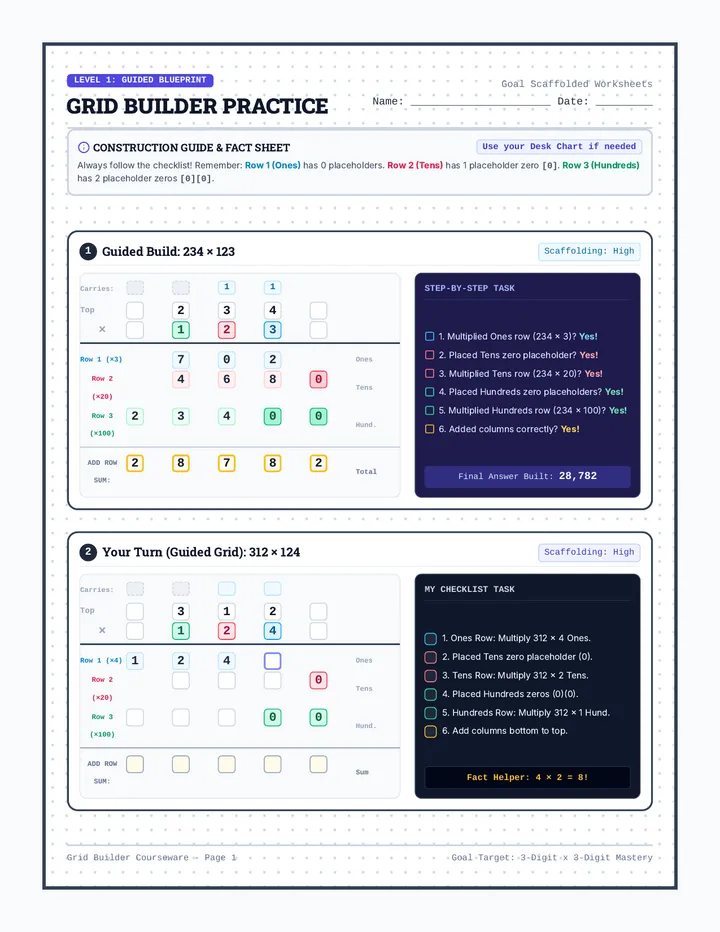
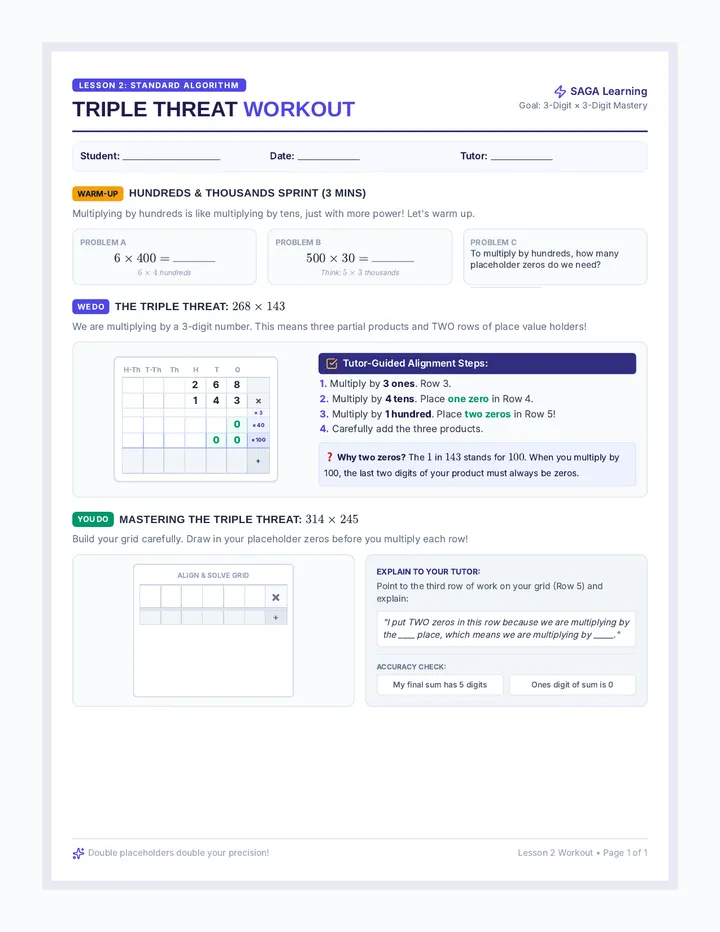
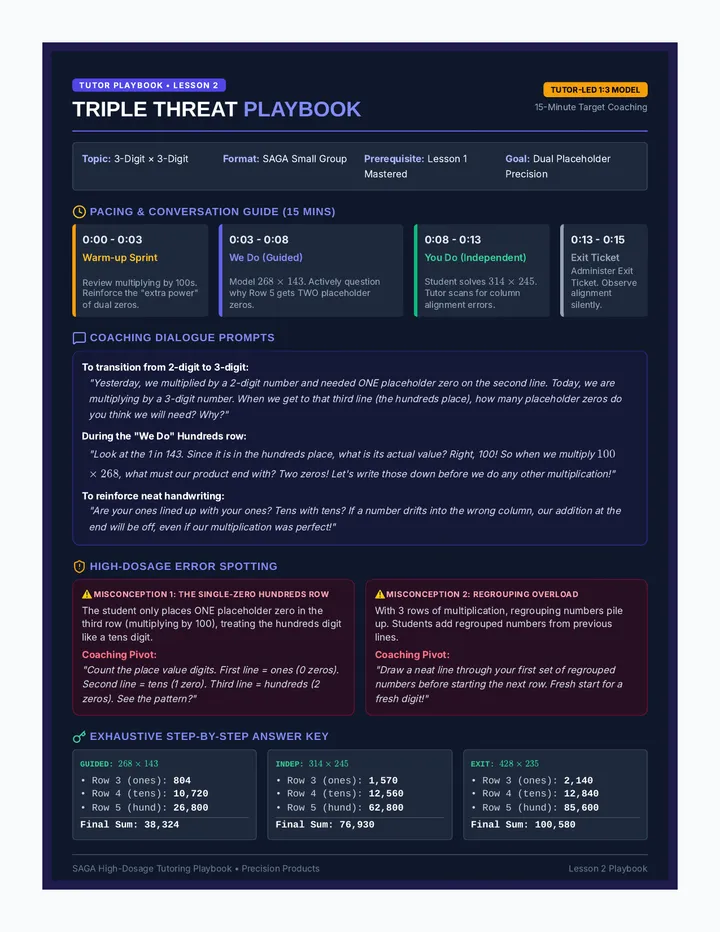
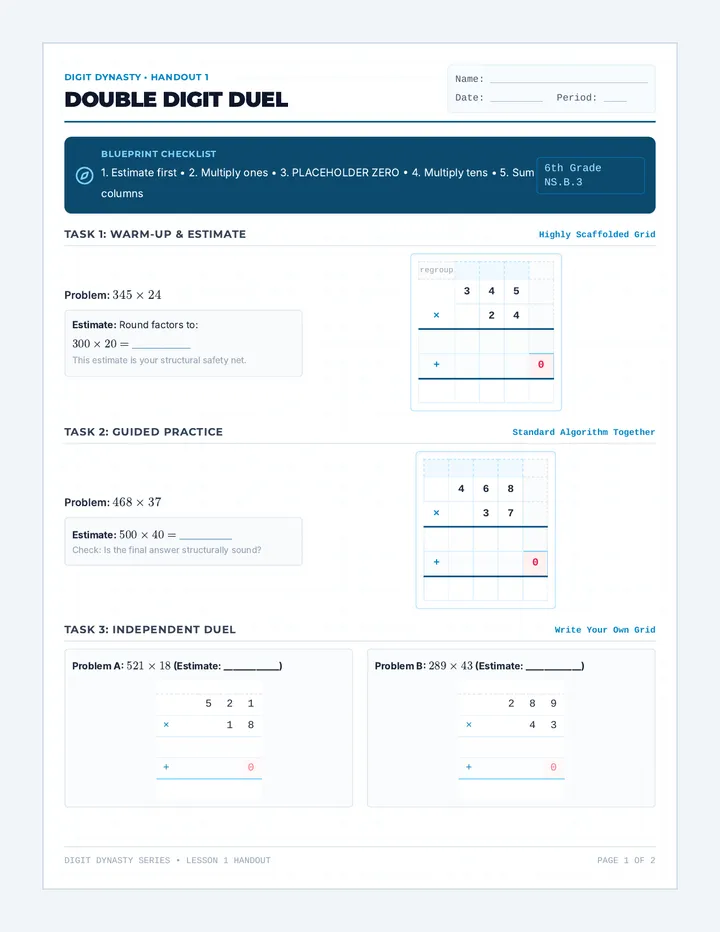
A highly structured, scaffolded lesson designed to help students master three-digit by three-digit multiplication using color-coded grids, a step-by-step task-analysis checklist, and sequential progress monitoring.
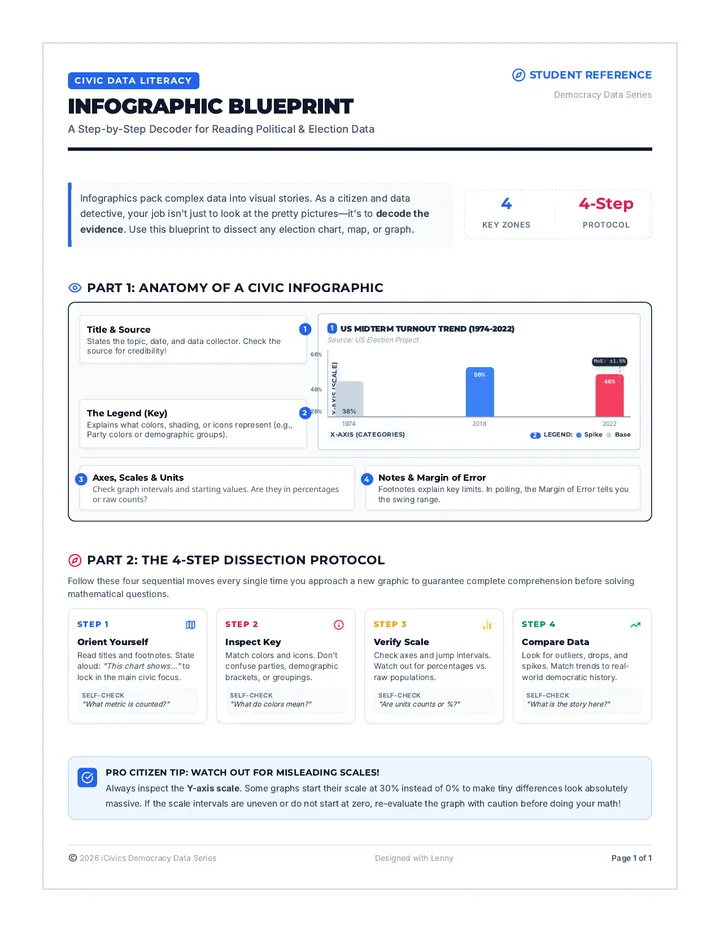
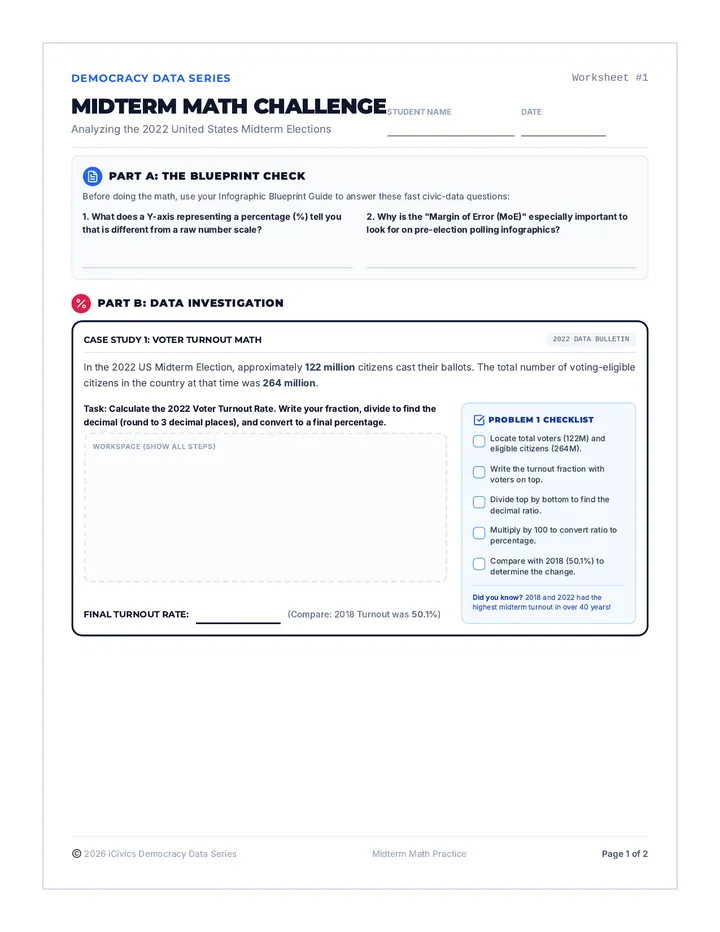
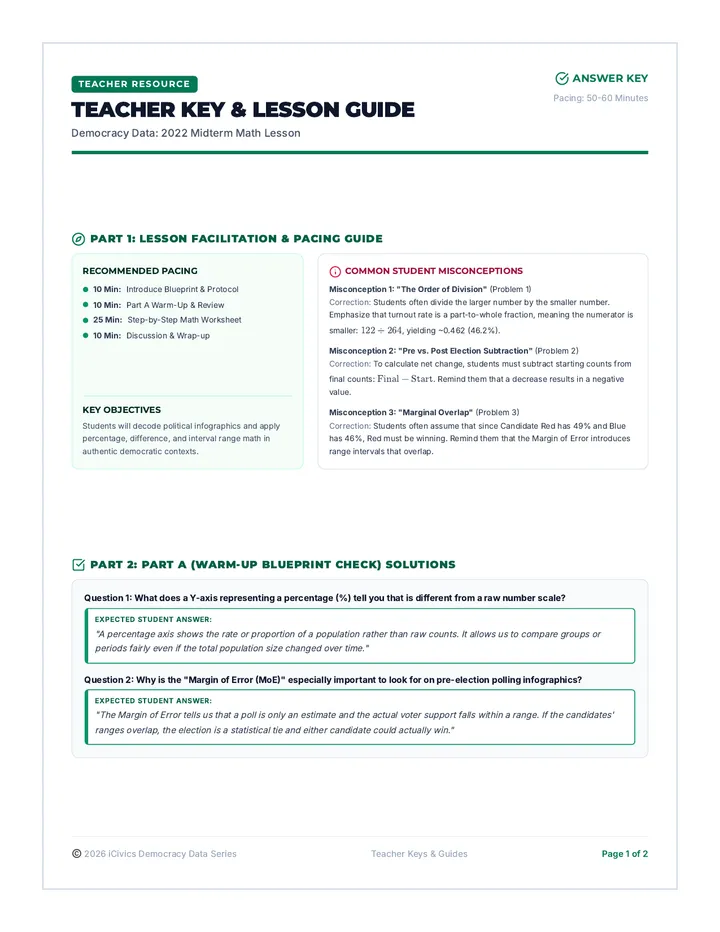
A civic-minded math lesson where students analyze real-world data from the 2022 midterm elections. Students learn to navigate complex infographics using structured reading strategies and tackle data-driven math questions with supportive step-by-step checklists.
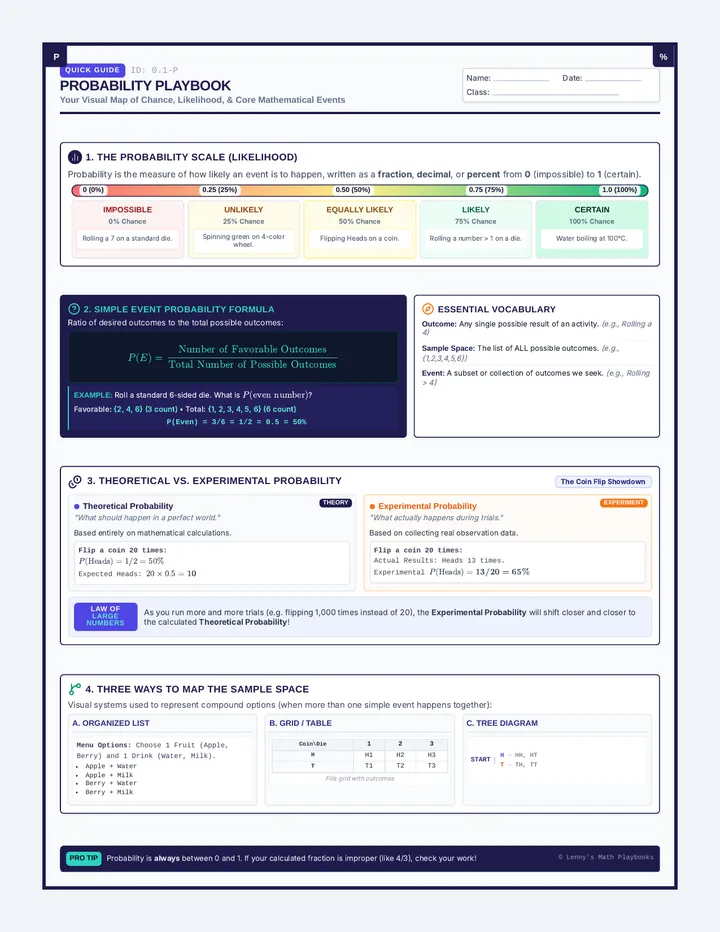
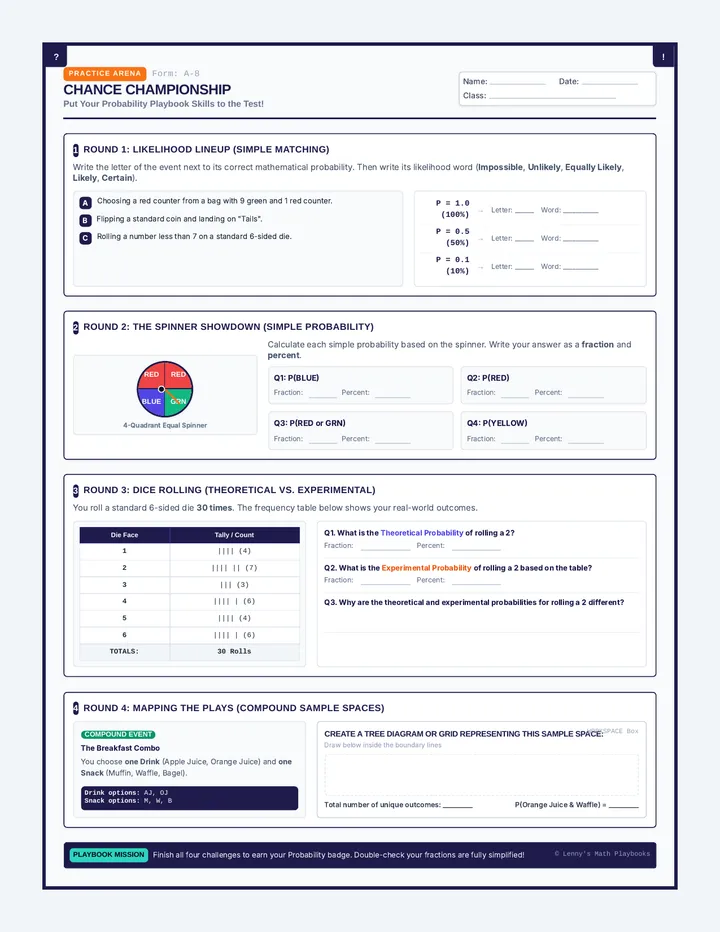
A foundational lesson block designed for middle school students to master probability concepts, covering simple events, sample spaces, likelihood, and experimental versus theoretical probability.
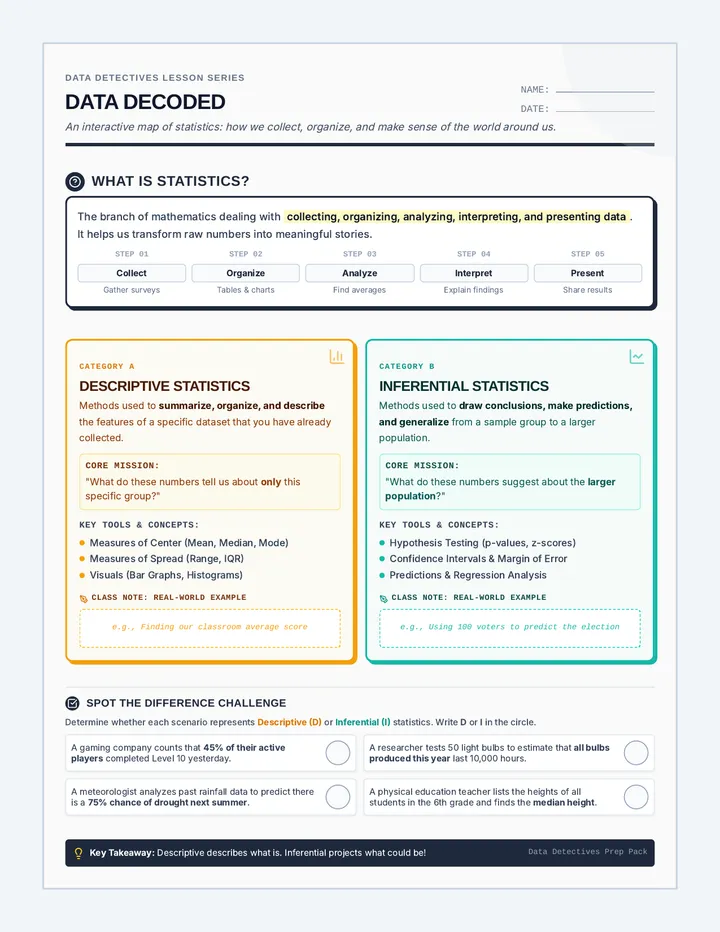
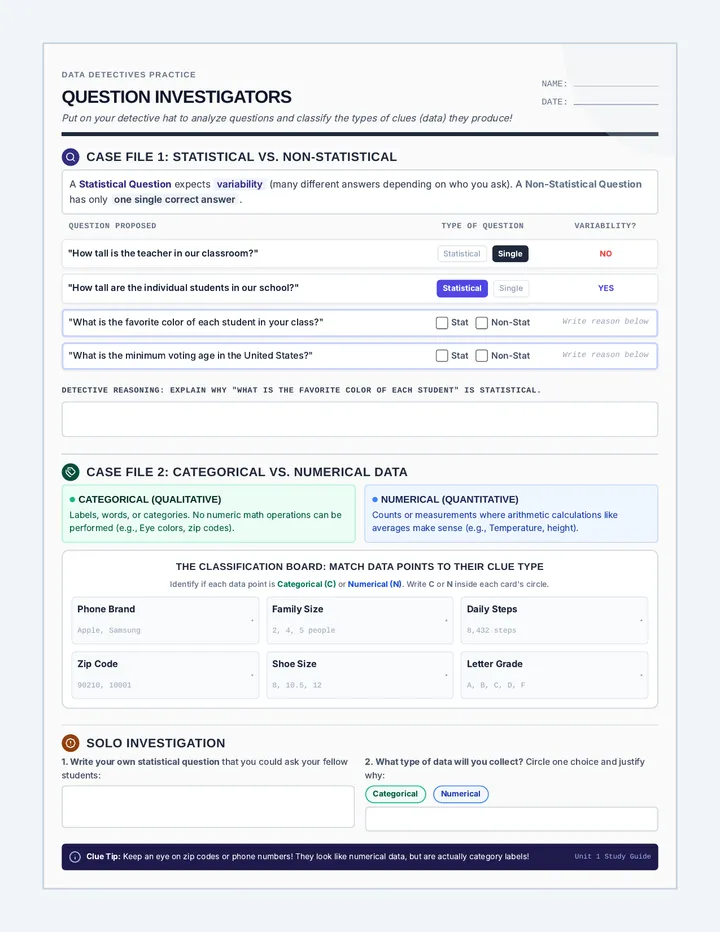
An introductory lesson to understanding what statistics is, exploring the difference between descriptive and inferential statistics, and engaging with data concepts.
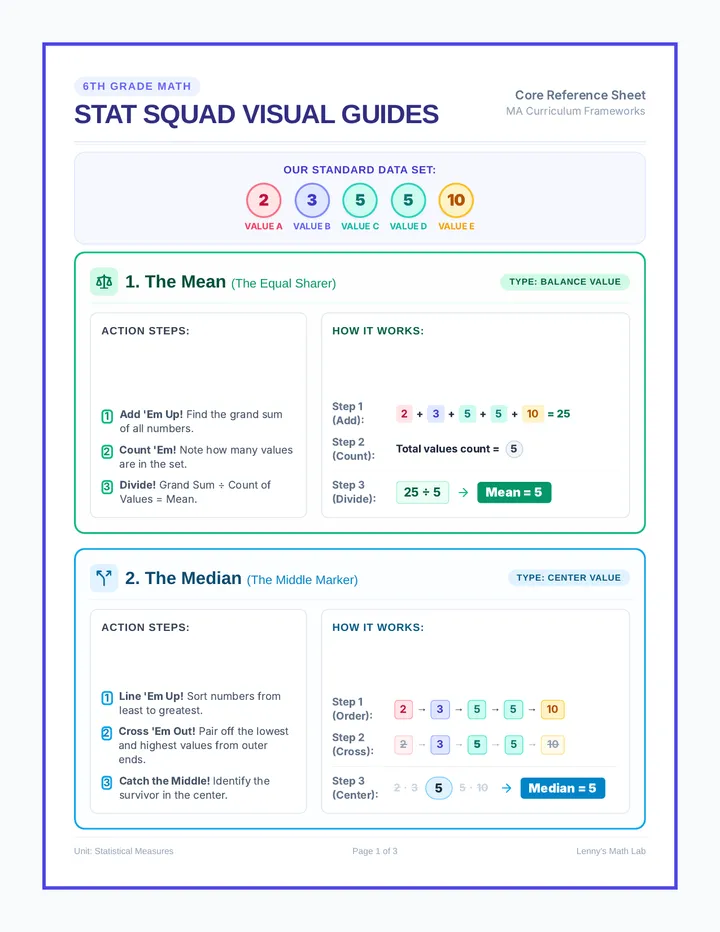
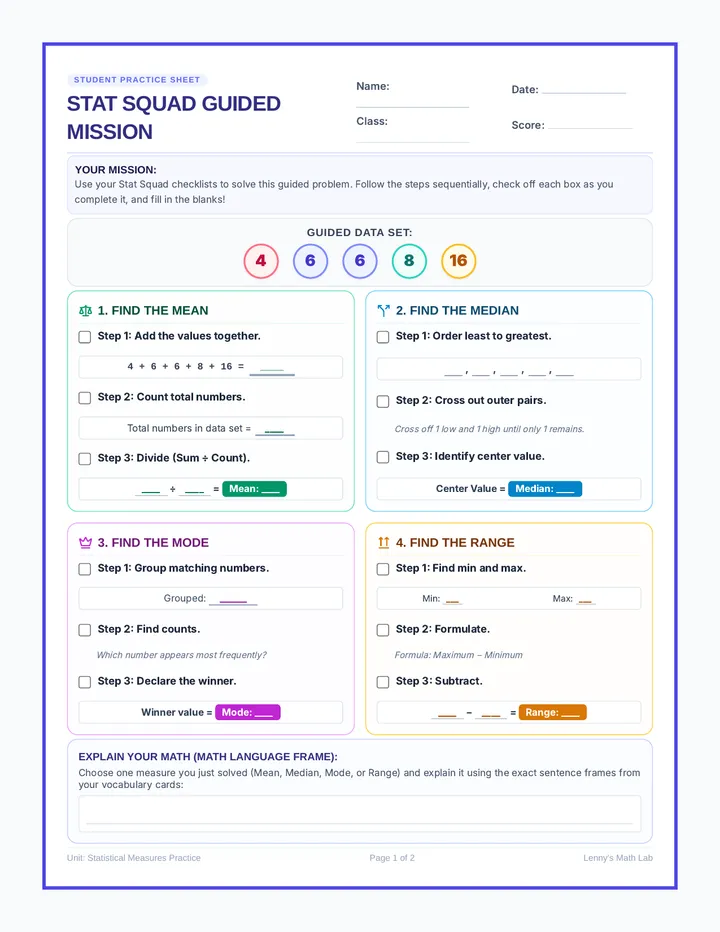
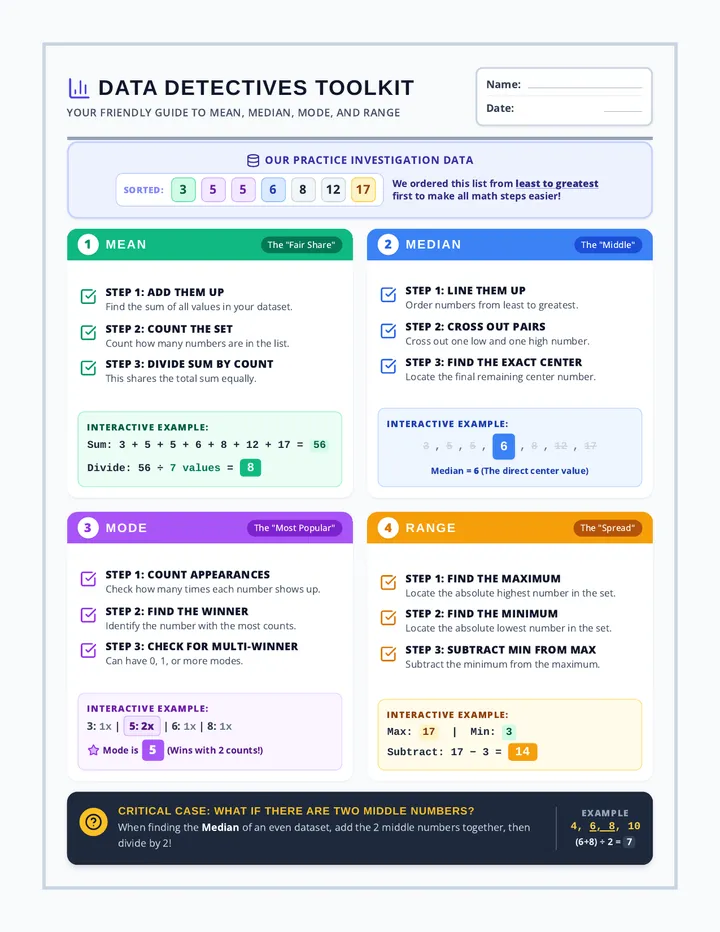
A visual, color-coded introduction to mean, median, mode, and range for 6th grade math. This lesson includes comprehensive, highly accessible anchor charts and structured practice guides with checklists and vocabulary focus cards.
A foundational lesson introducing 6th grade statistics concepts including measures of center (mean, median, mode) and variation (range) with visually accessible reference materials.
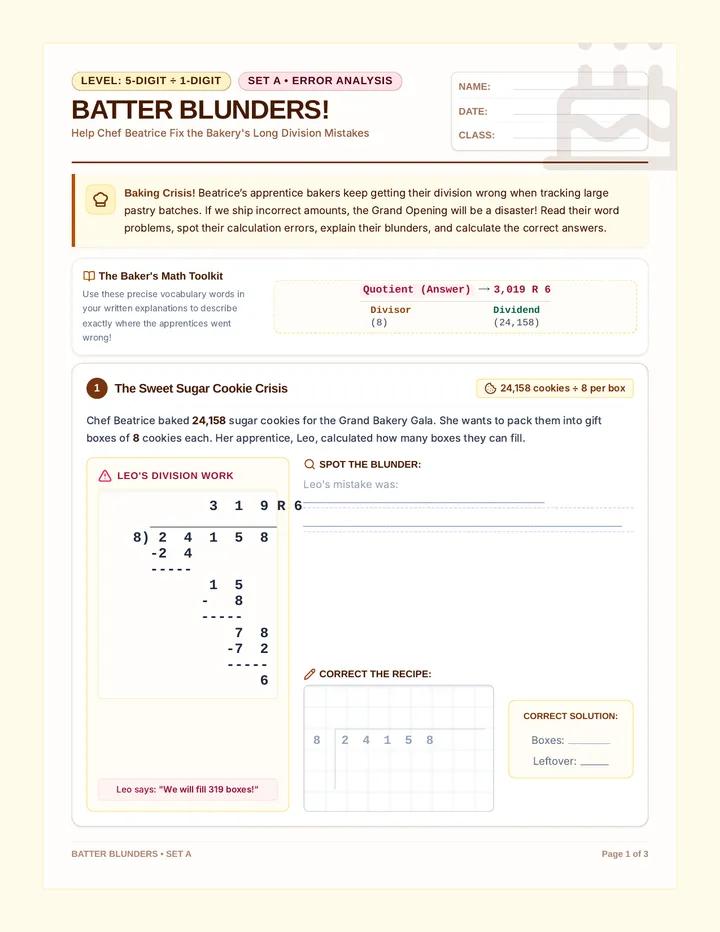
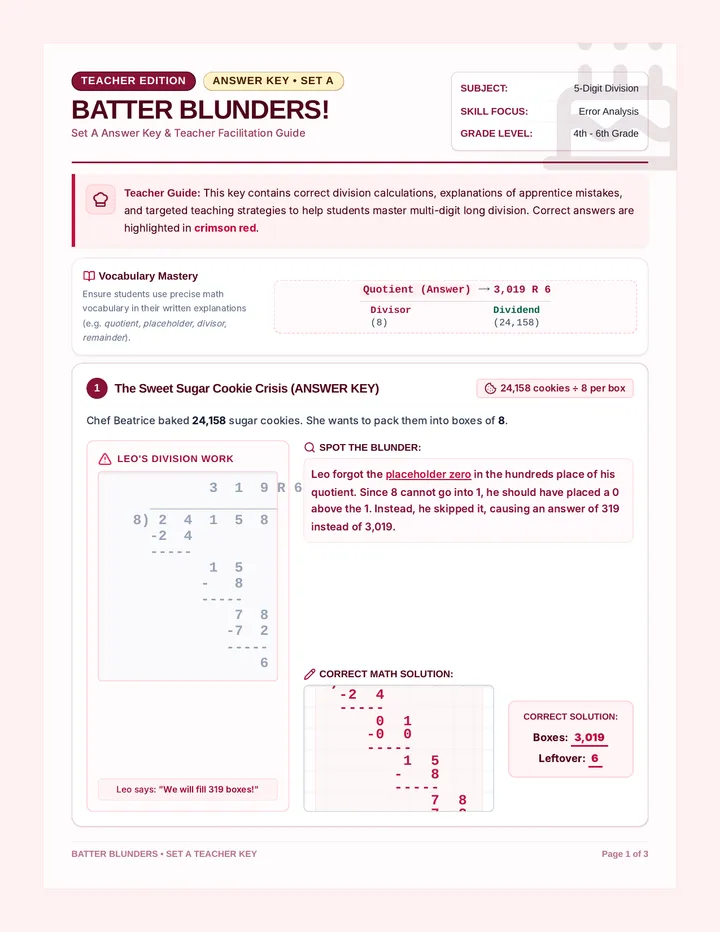
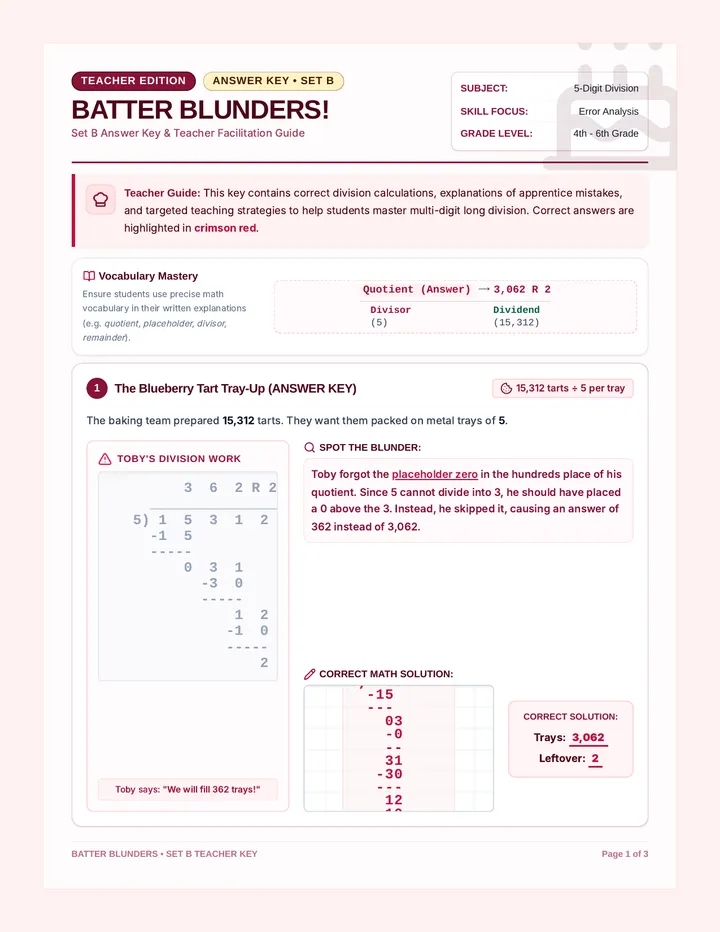
A sweet, bakery-themed math lesson where students analyze five-digit division problems to identify, explain, and correct common calculation mistakes.
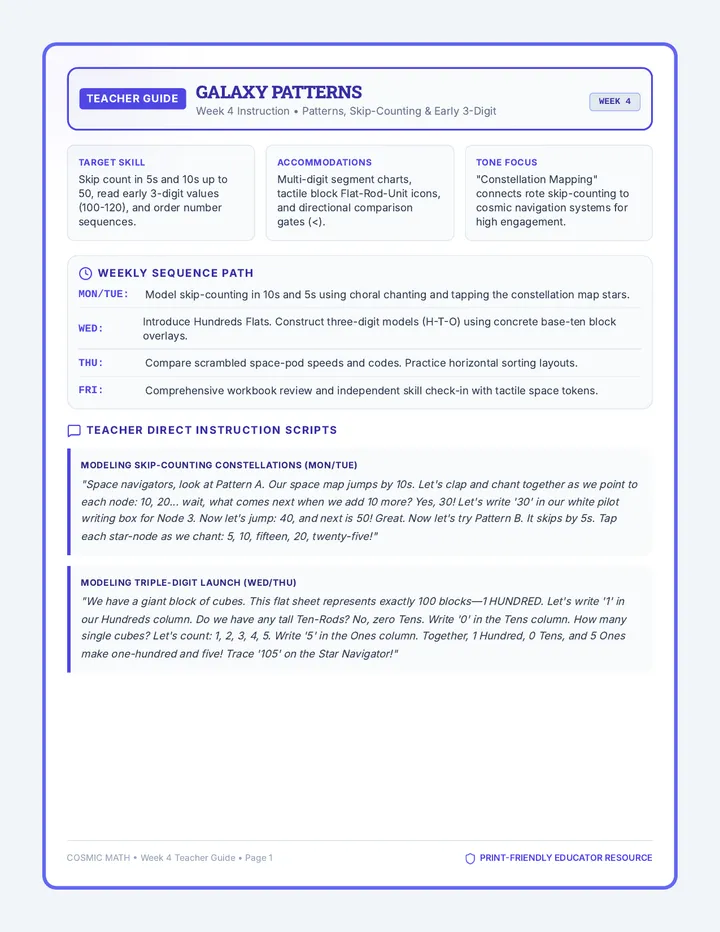
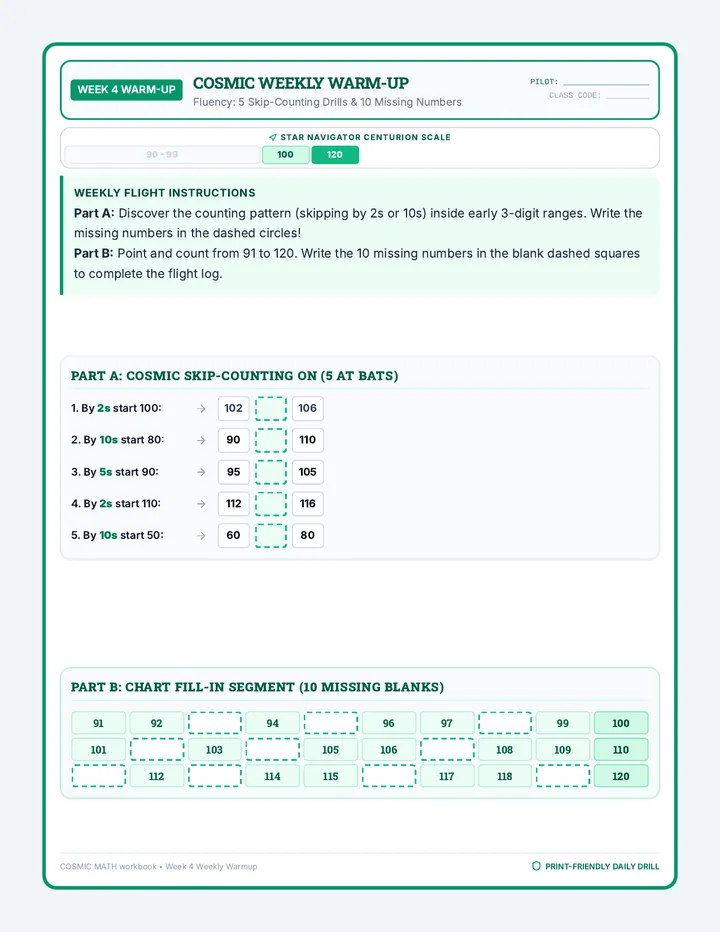
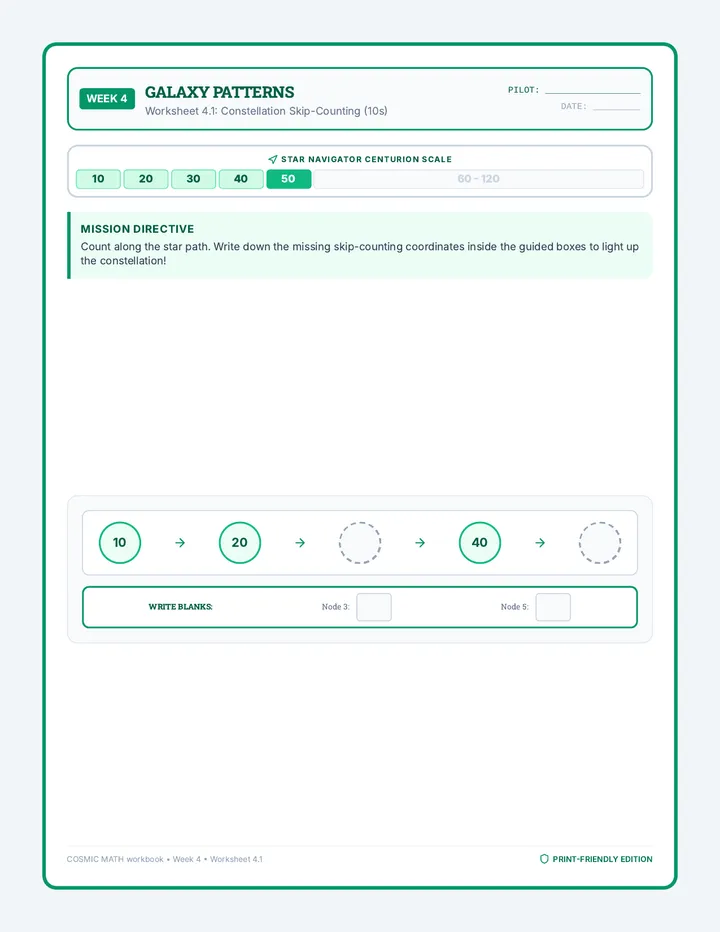
Introduces early 3-digit numbers (100-120), visual skip-counting (2s, 5s, 10s) using constellation maps, and ordering cosmic objects to build sequential logic.
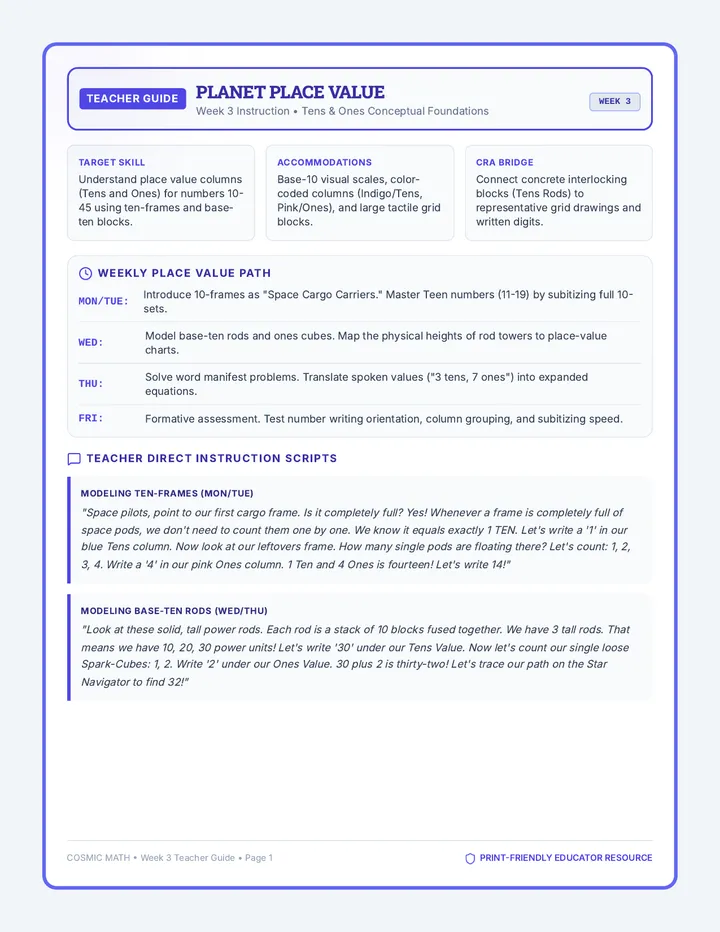
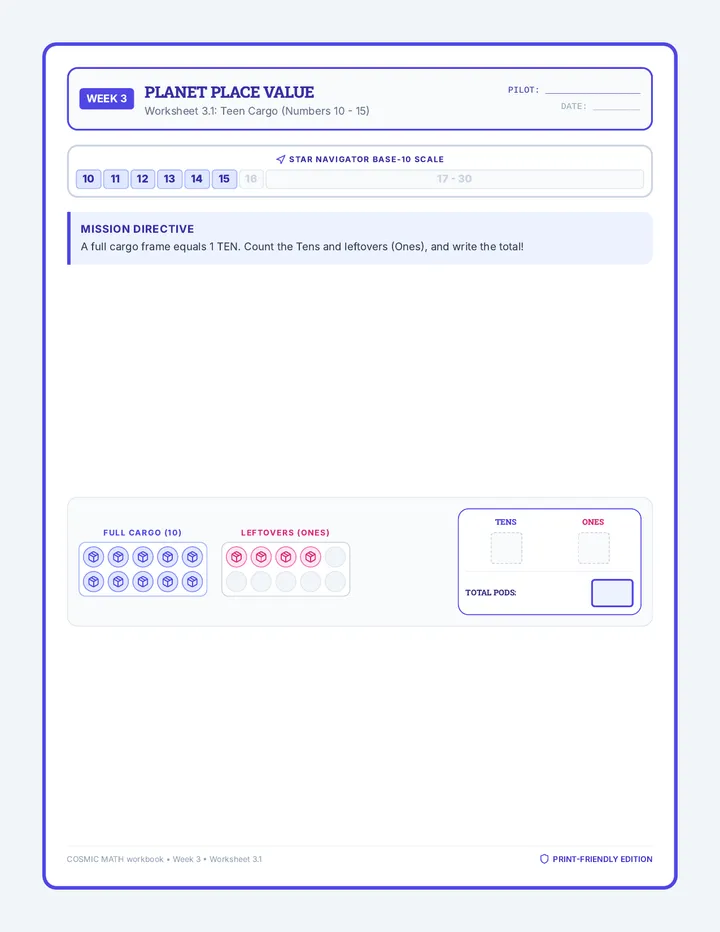
Focuses on identifying double-digit numbers (10-99), representing them using ten-frames and printable base-ten icons, and writing numbers in expanded place value charts (tens and ones) with clear physical boundaries.
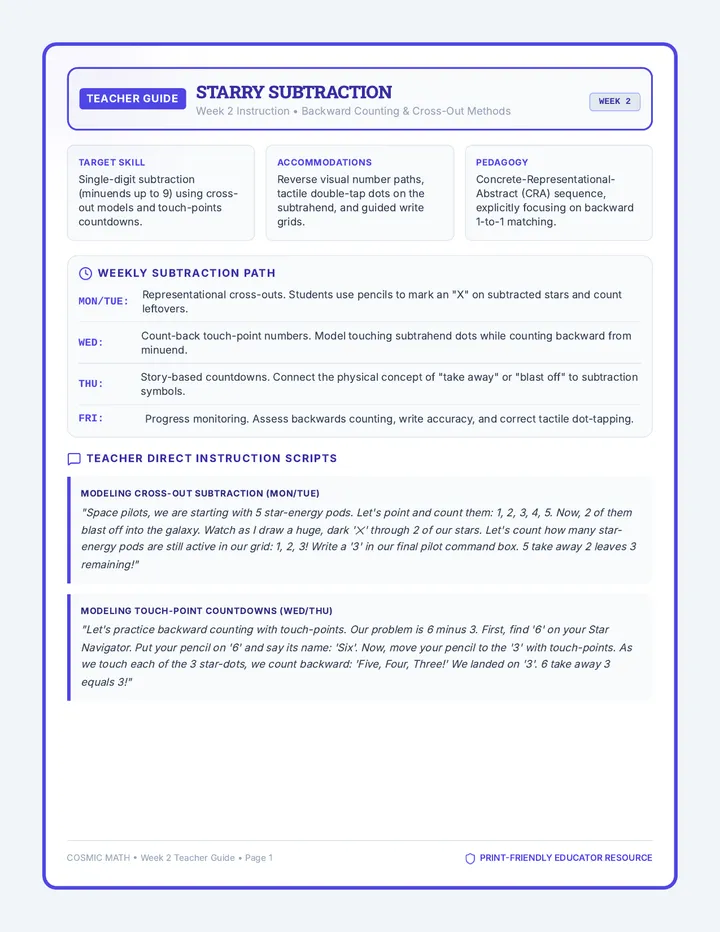
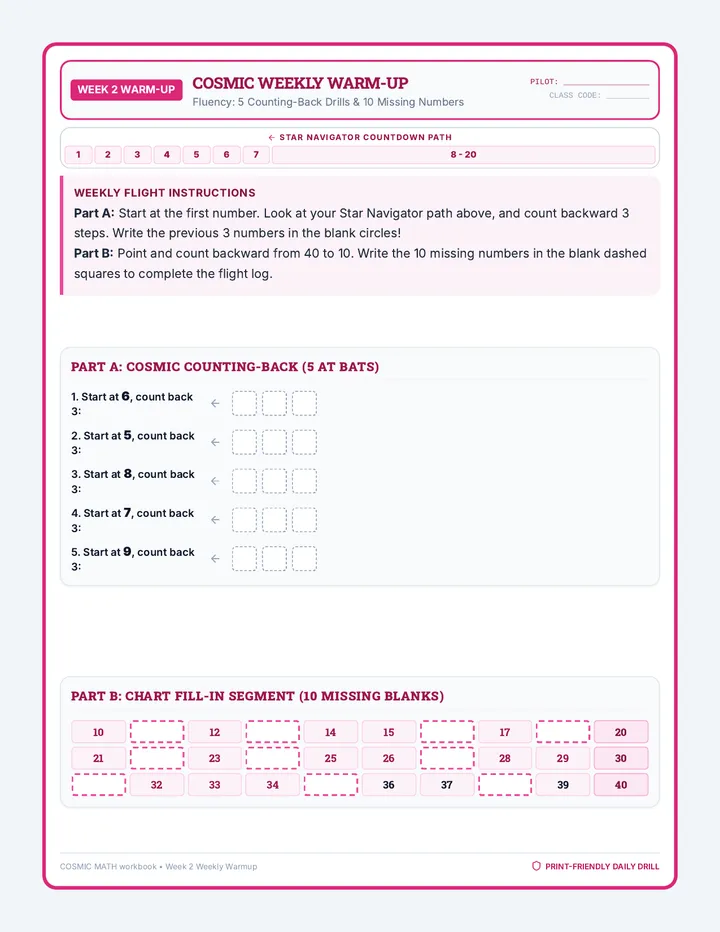
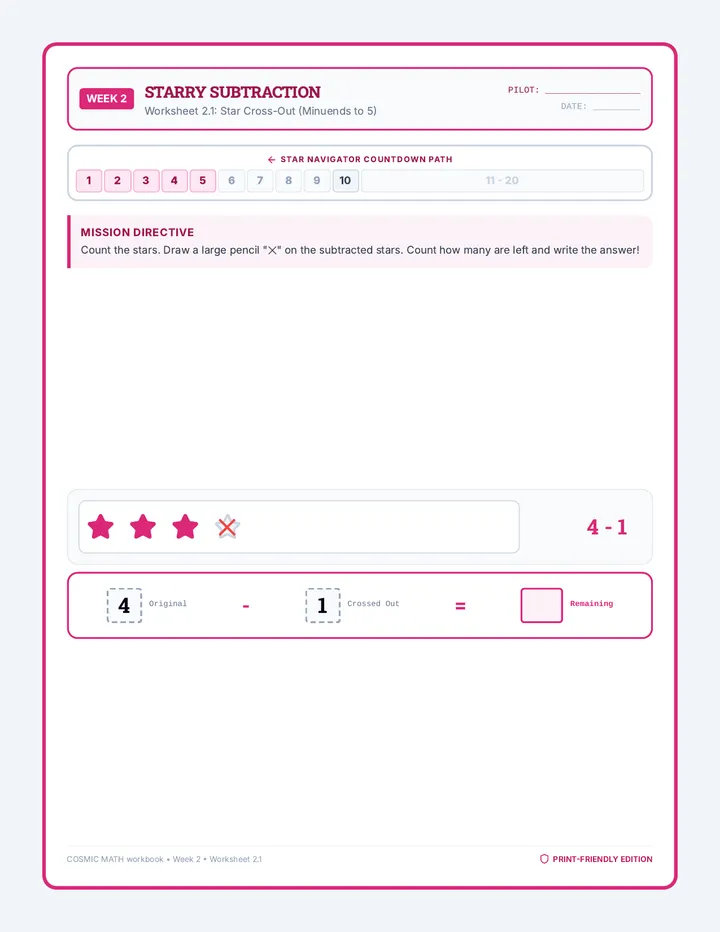
Covers single-digit subtraction (1-9) with cosmic countdowns, crossing-out stars or rocket fuel cells, embedded touch-points for backwards counting, and structured workspace templates.
Focuses on single-digit addition (1-9) using embedded touch-point numbers, pictorial representations of spaceships and stars, a persistent 1-20 number path, and large guided workspace boxes for physical alignment.
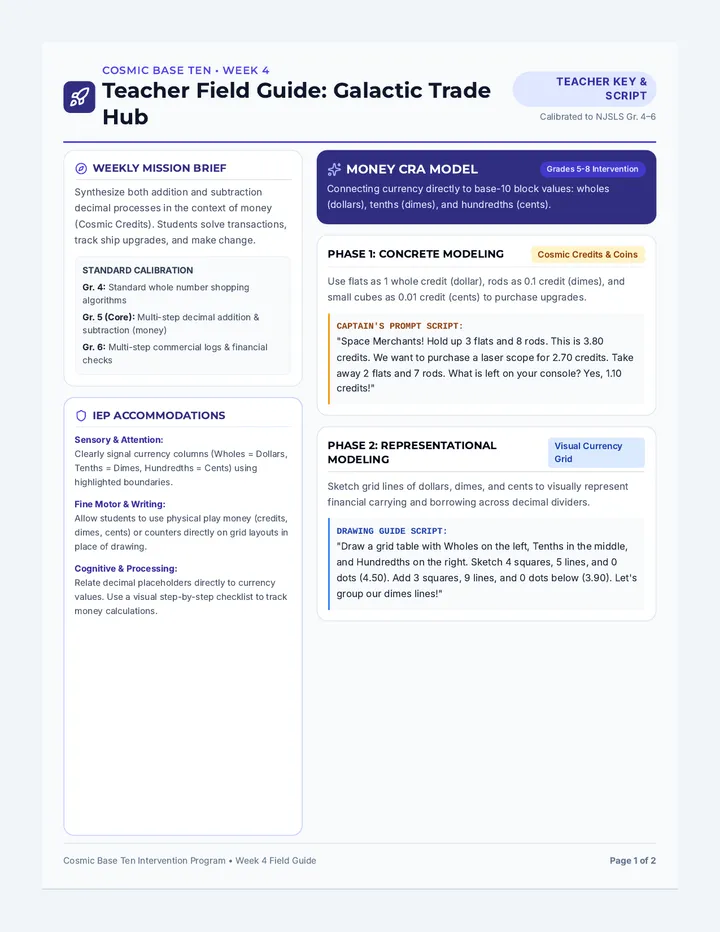
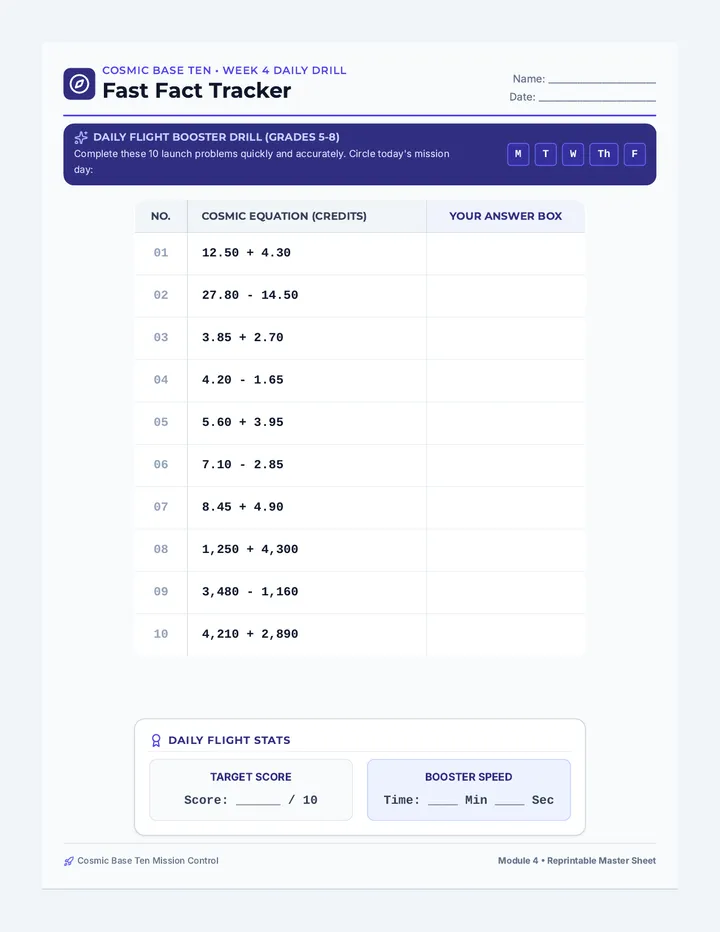
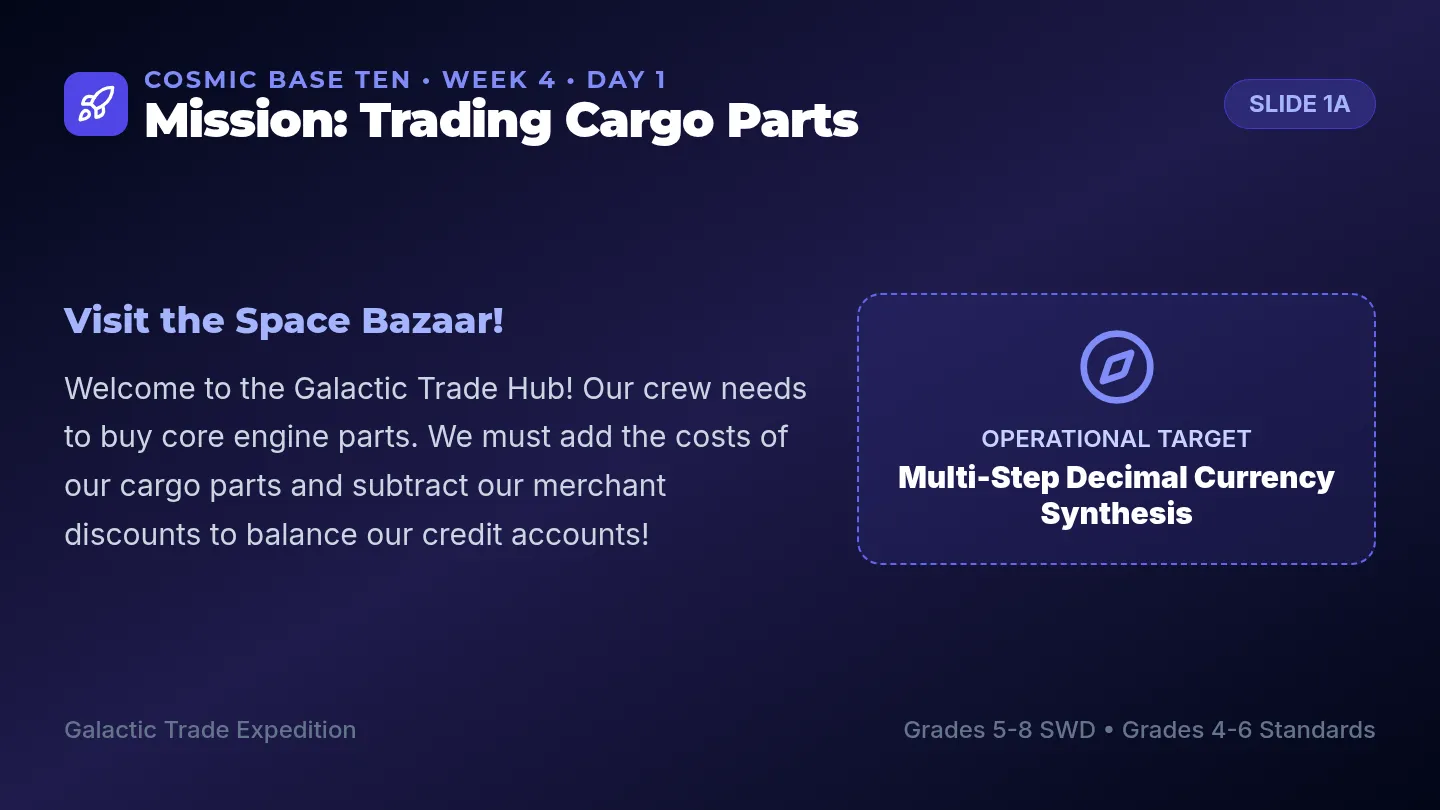
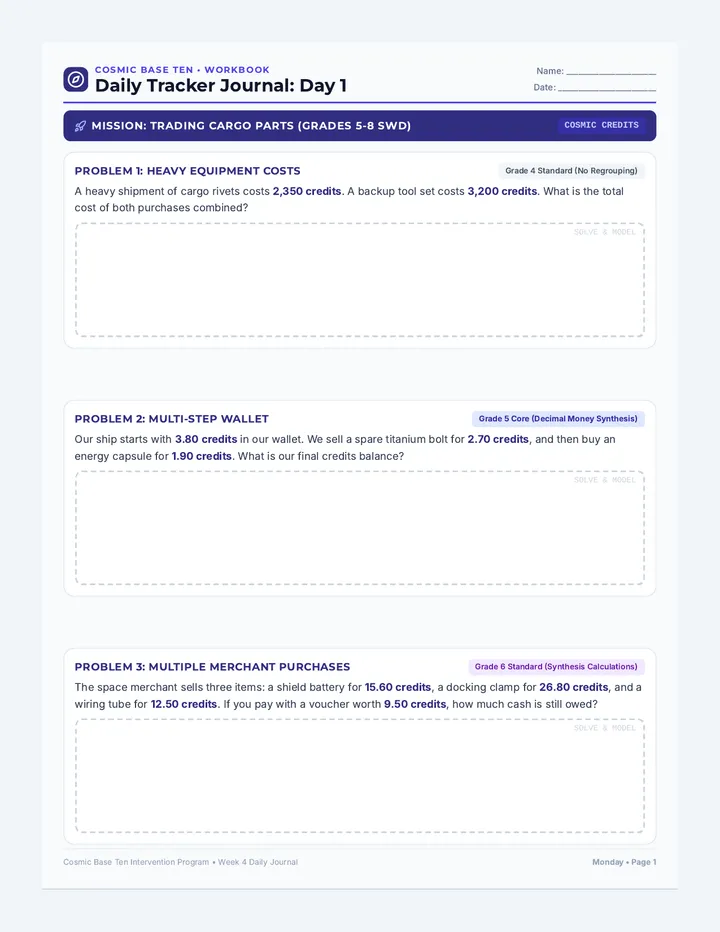
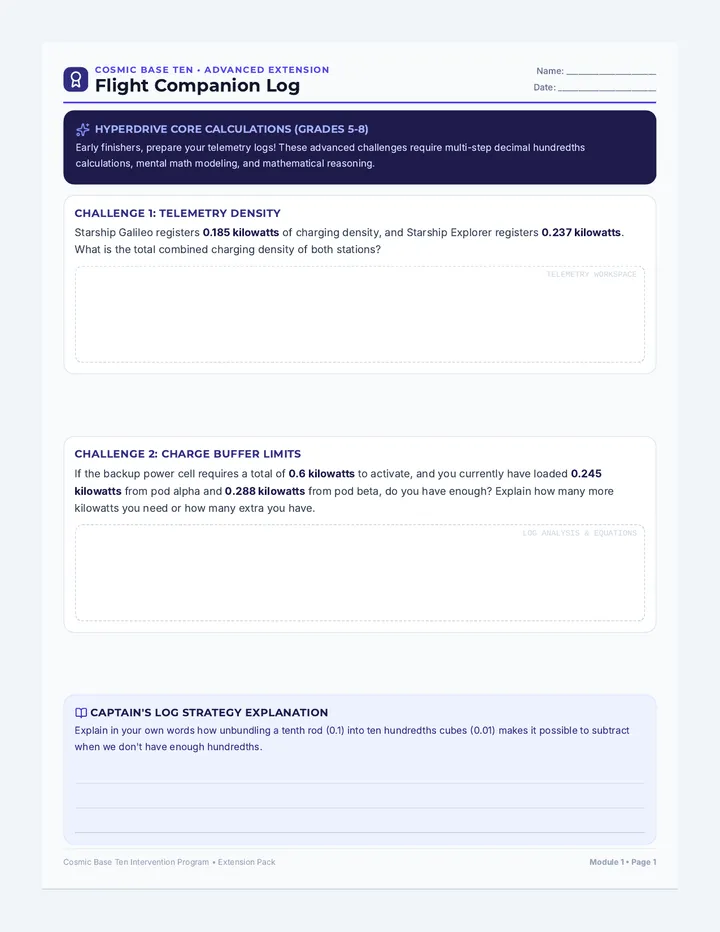
Week 4 is the capstone week where students synthesize their additive and subtractive decimal skills in the context of money. They solve multi-step commercial transactions, balance credit records, and purchase starship upgrades.
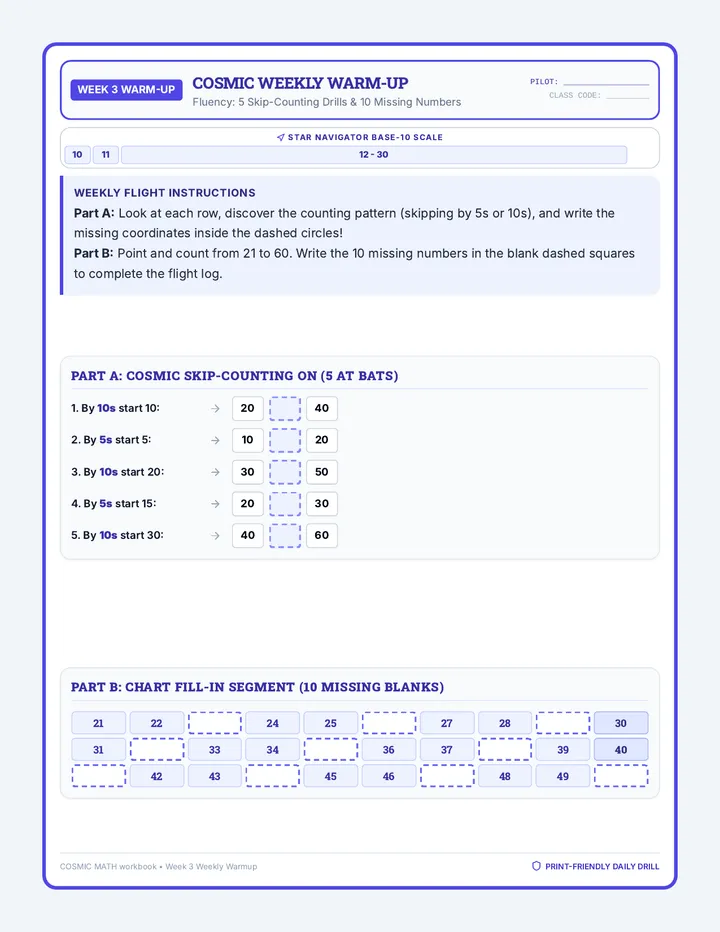
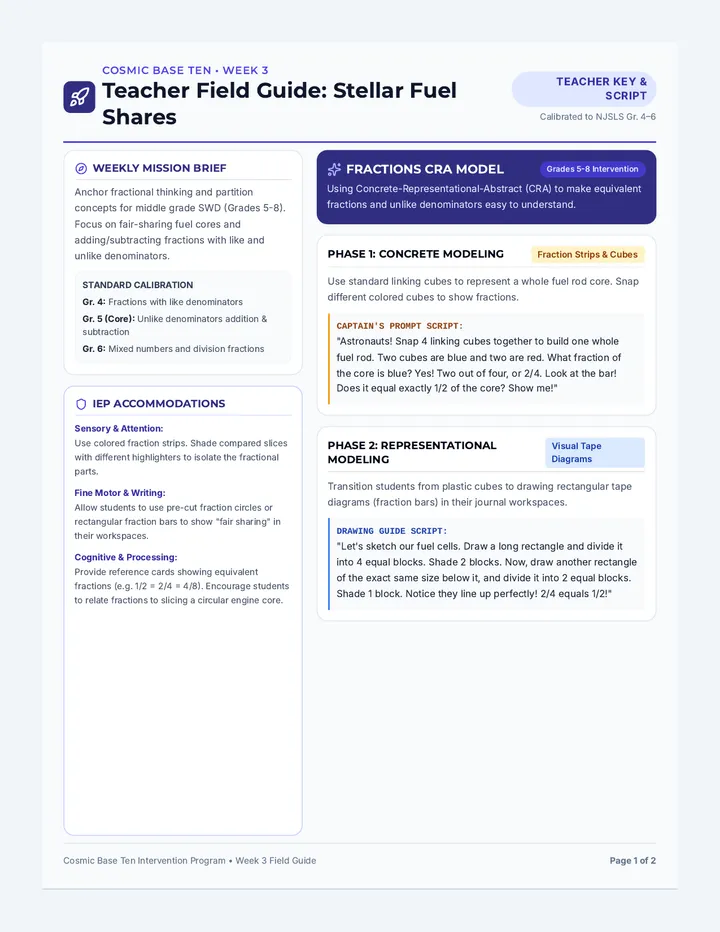
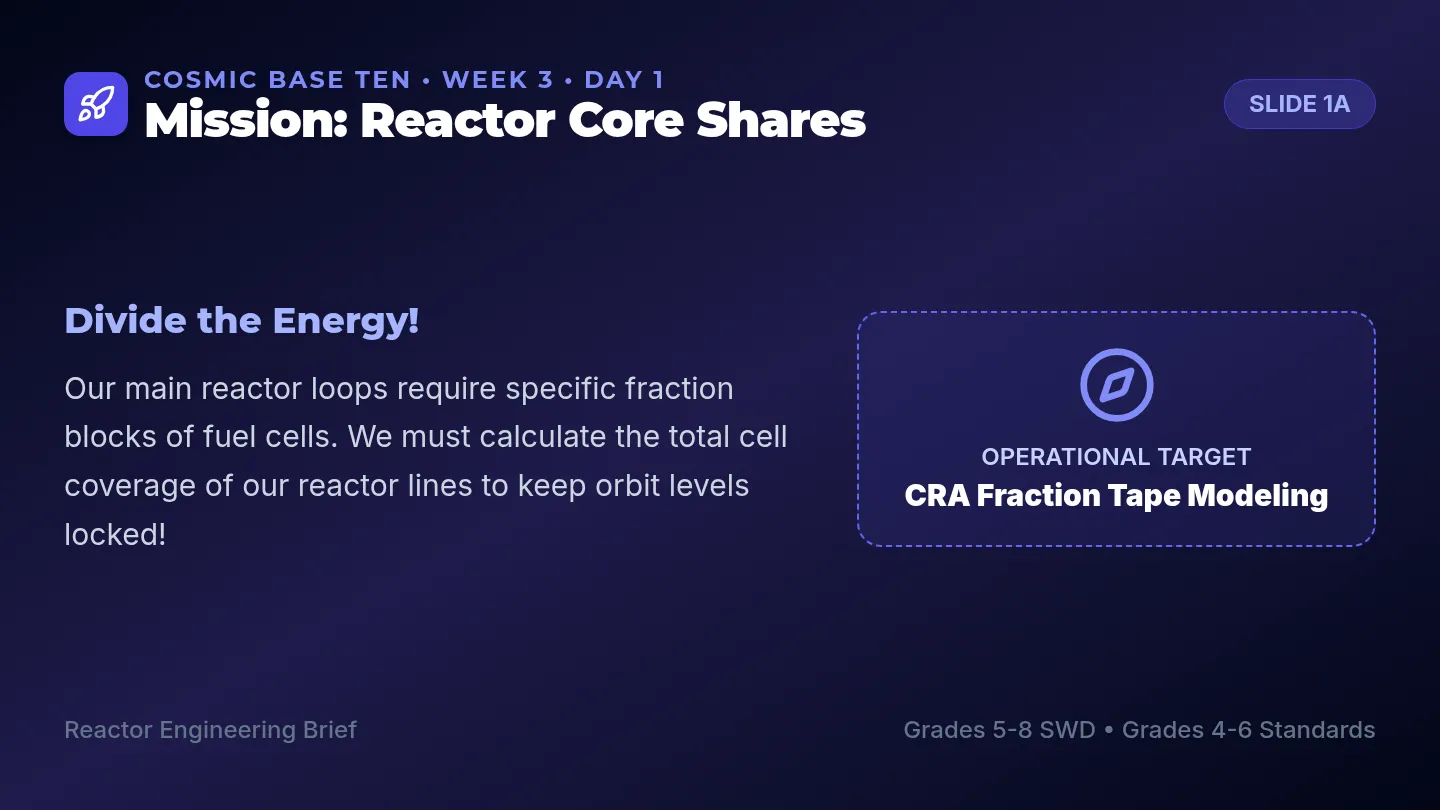
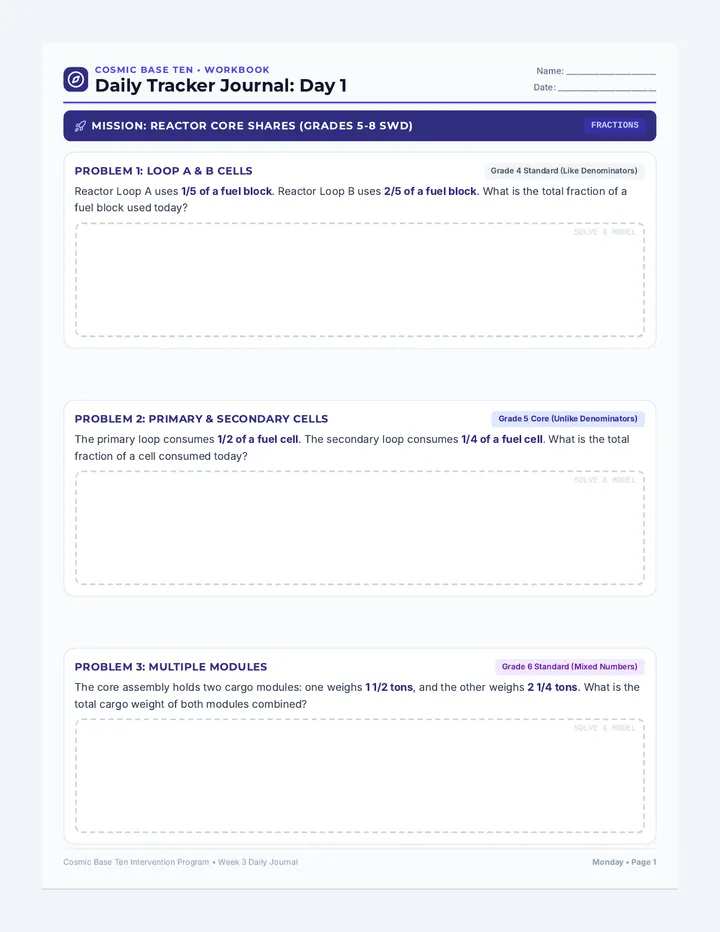
Week 3 focuses on partitioning, equivalent fractions, and adding or subtracting fractions with like and unlike denominators. Students practice fair-sharing reactor cores, dividing cargo weight, and mapping stellar orbits using fraction bars.
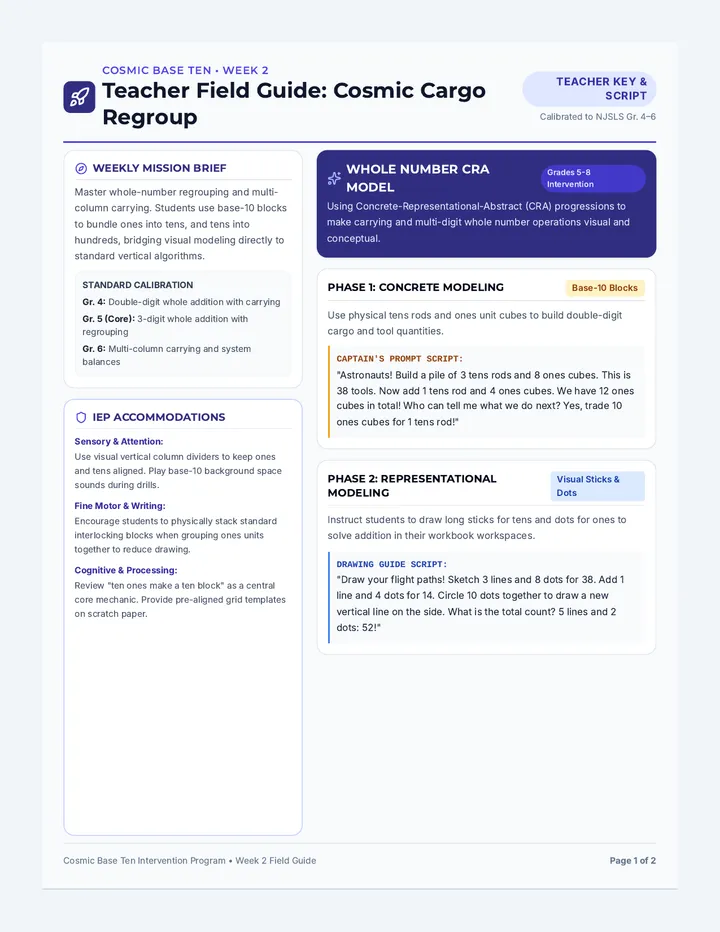
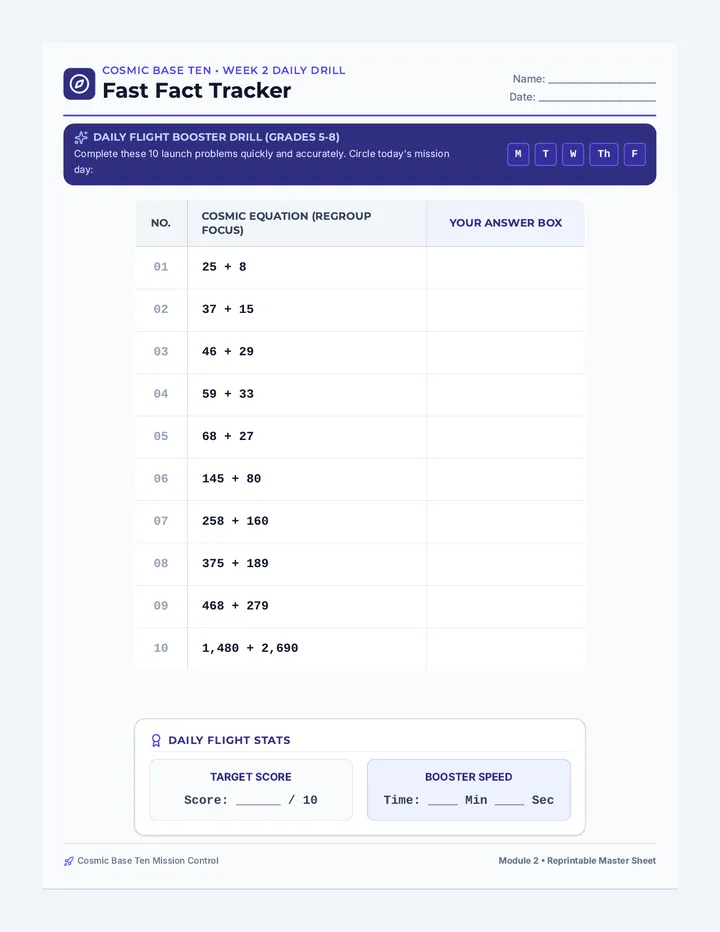
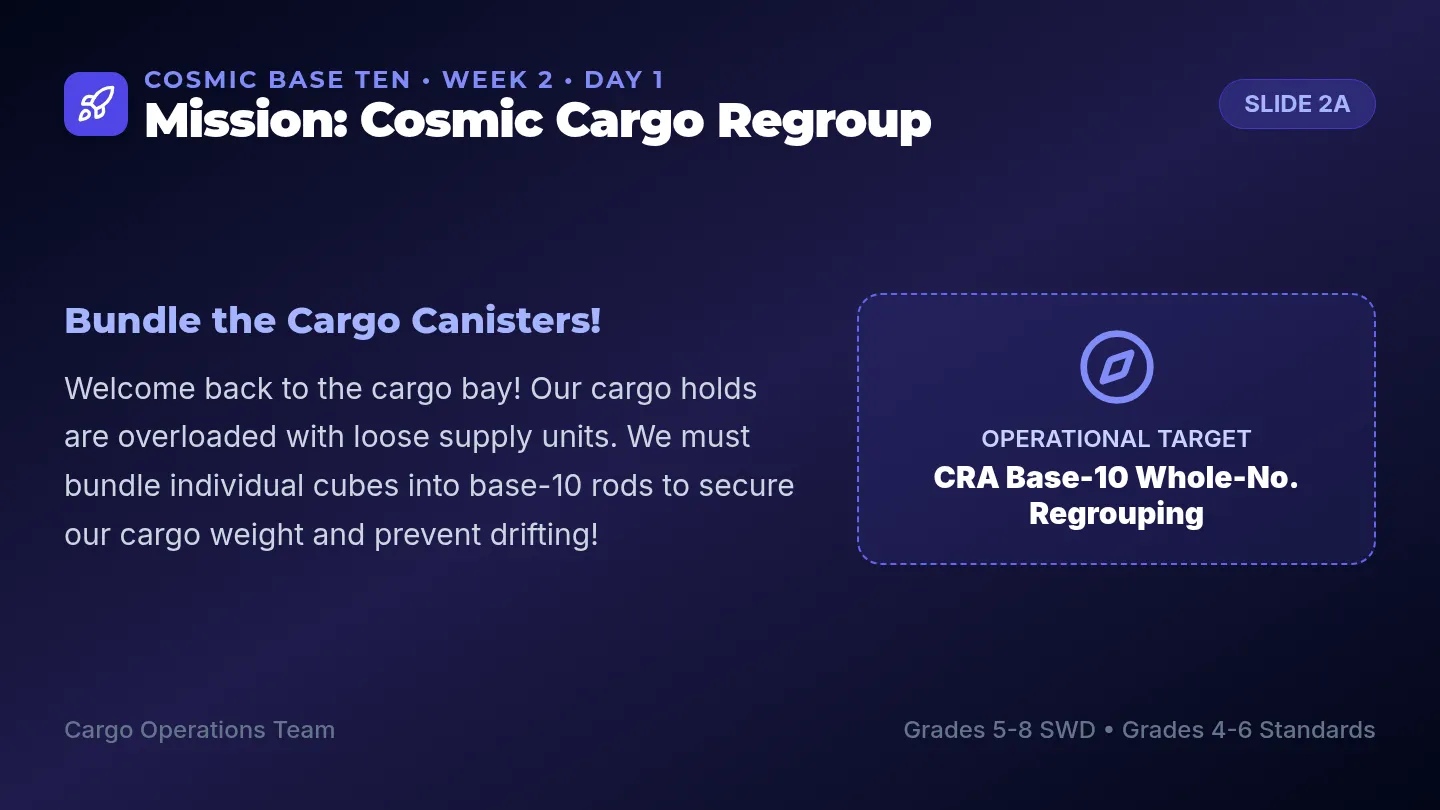
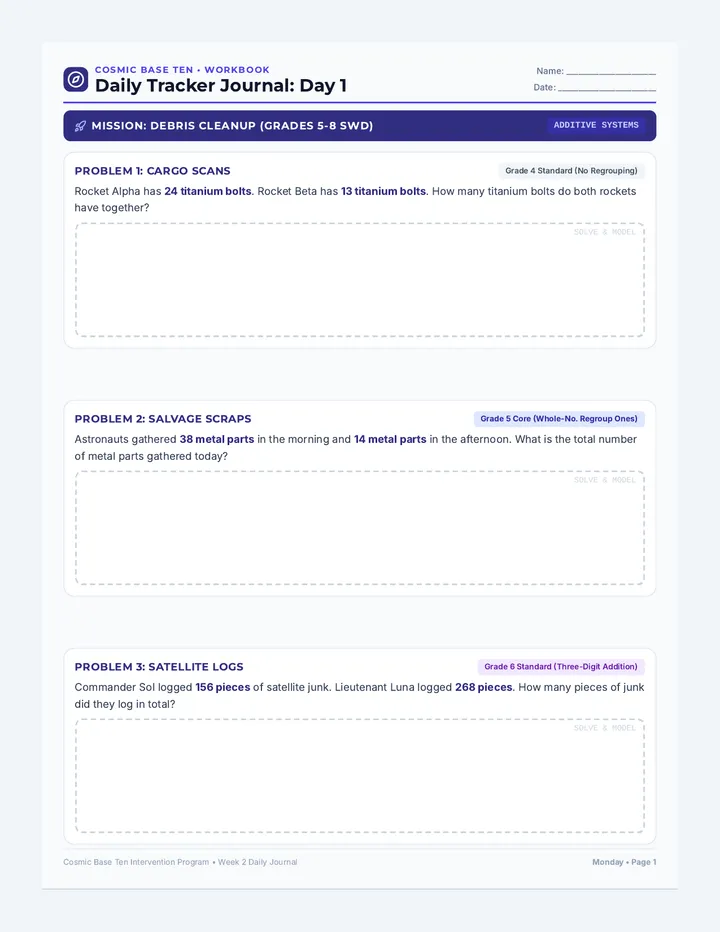
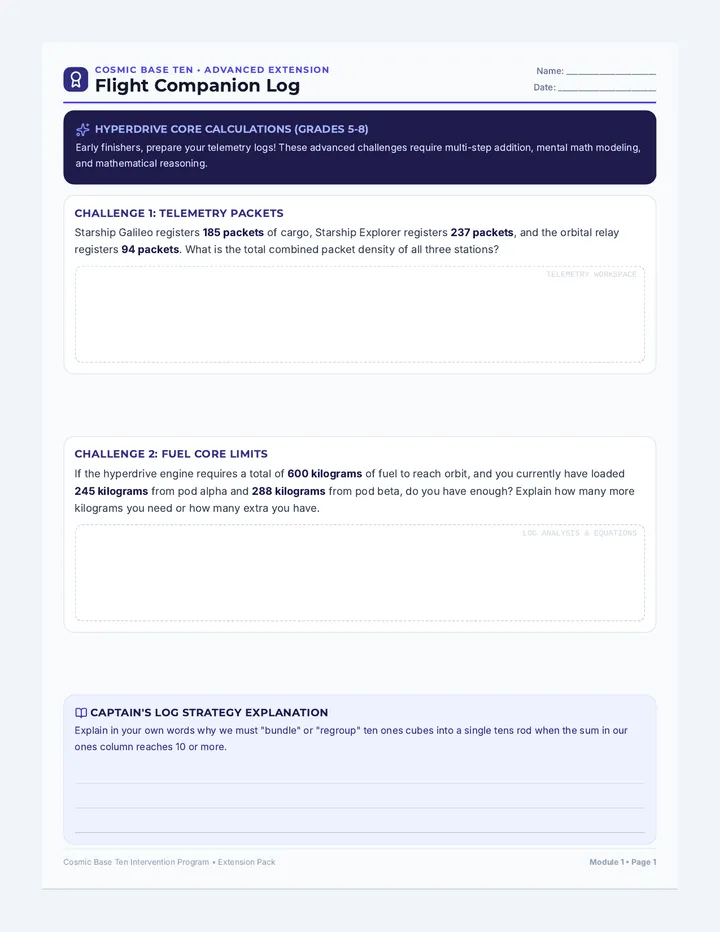
Week 2 focuses on mastering whole-number regrouping and multi-column carrying in the context of starship cargo inventories. Students use base-10 blocks to bundle ones into tens and tens into hundreds, bridging visual modeling directly to standard vertical algorithms.
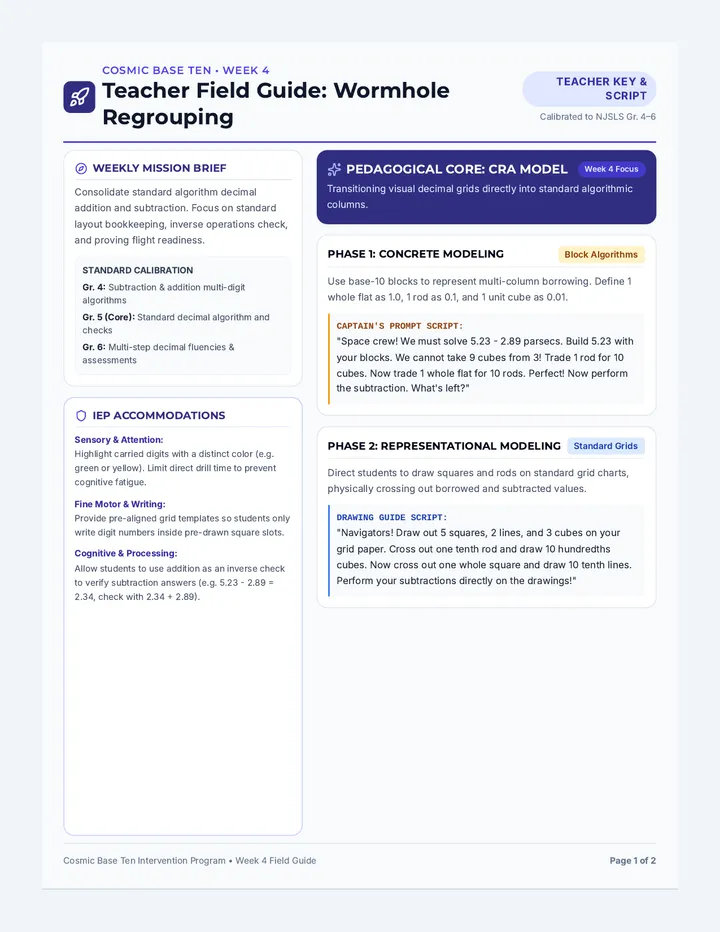
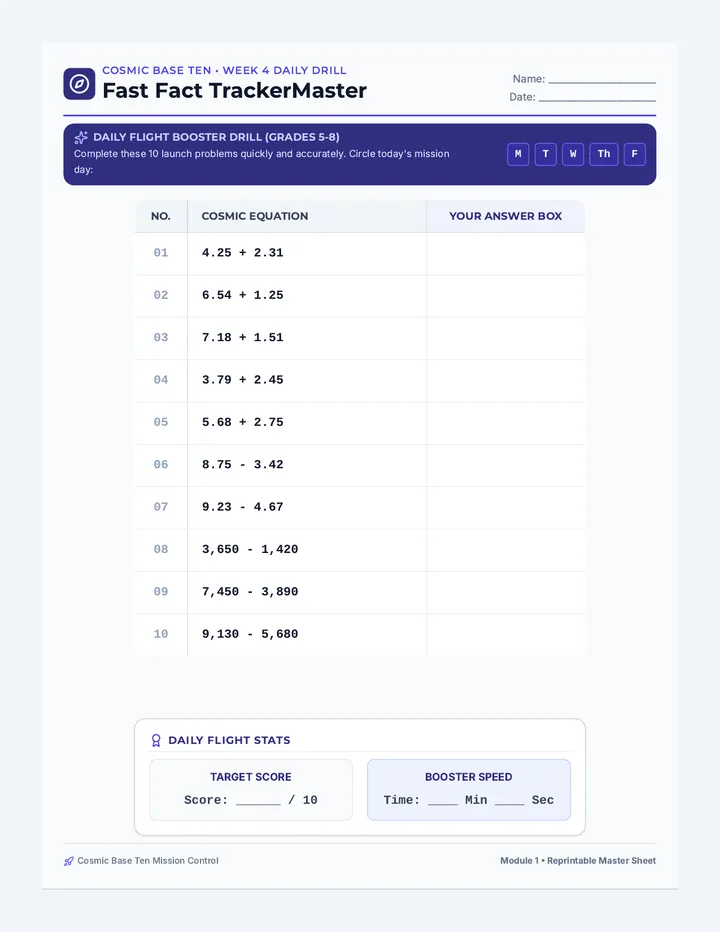
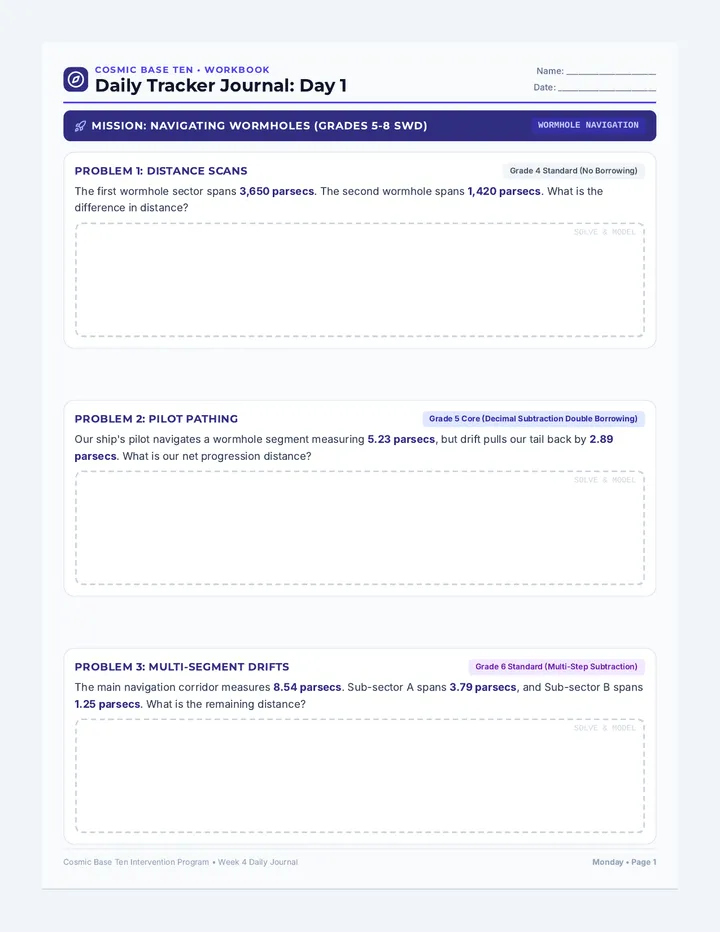
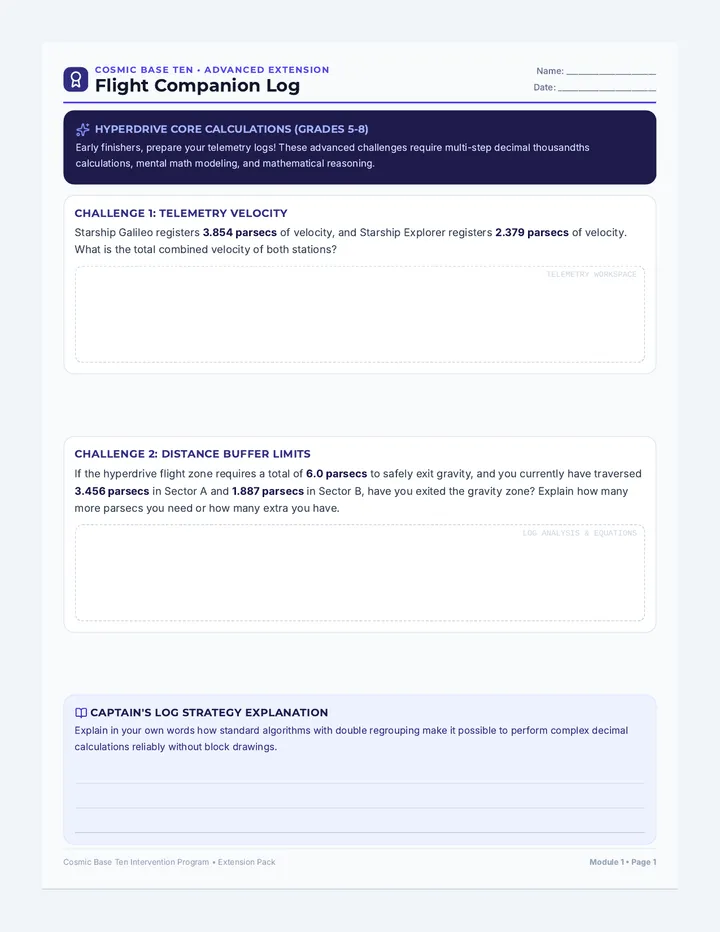
Week 4 focuses on standard algorithm decimal addition and subtraction, multi-step problem consolidation, and direct assessment of skills to confirm crew flight readiness.
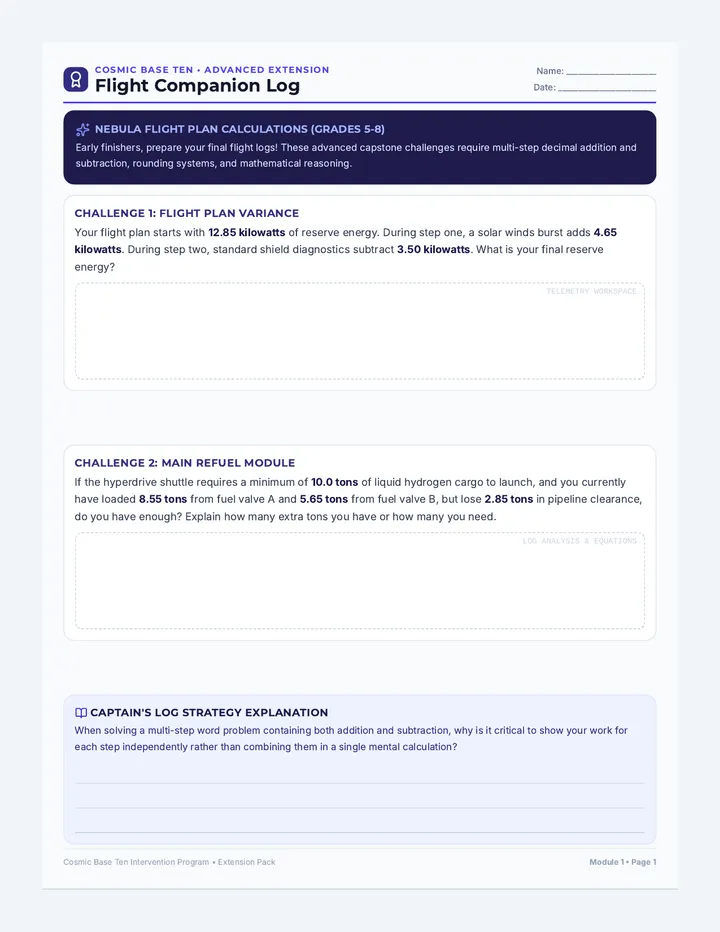
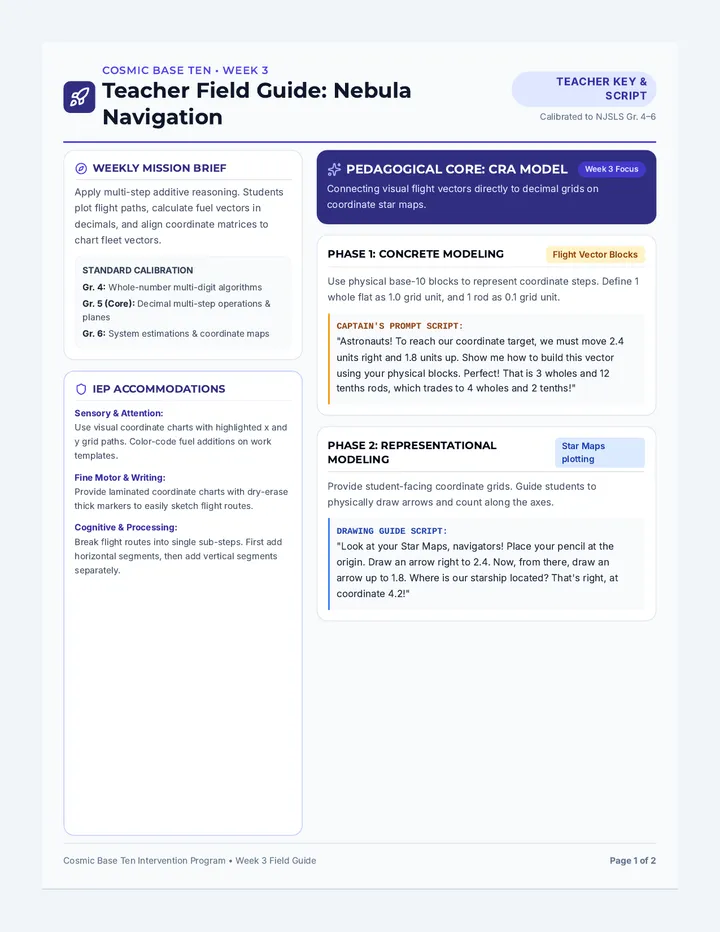
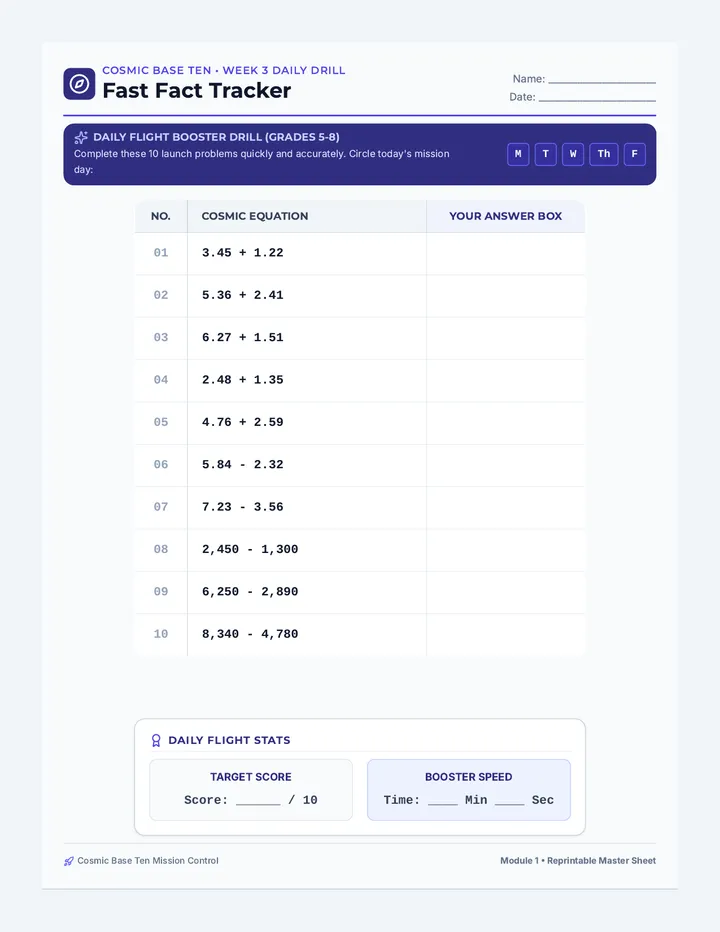
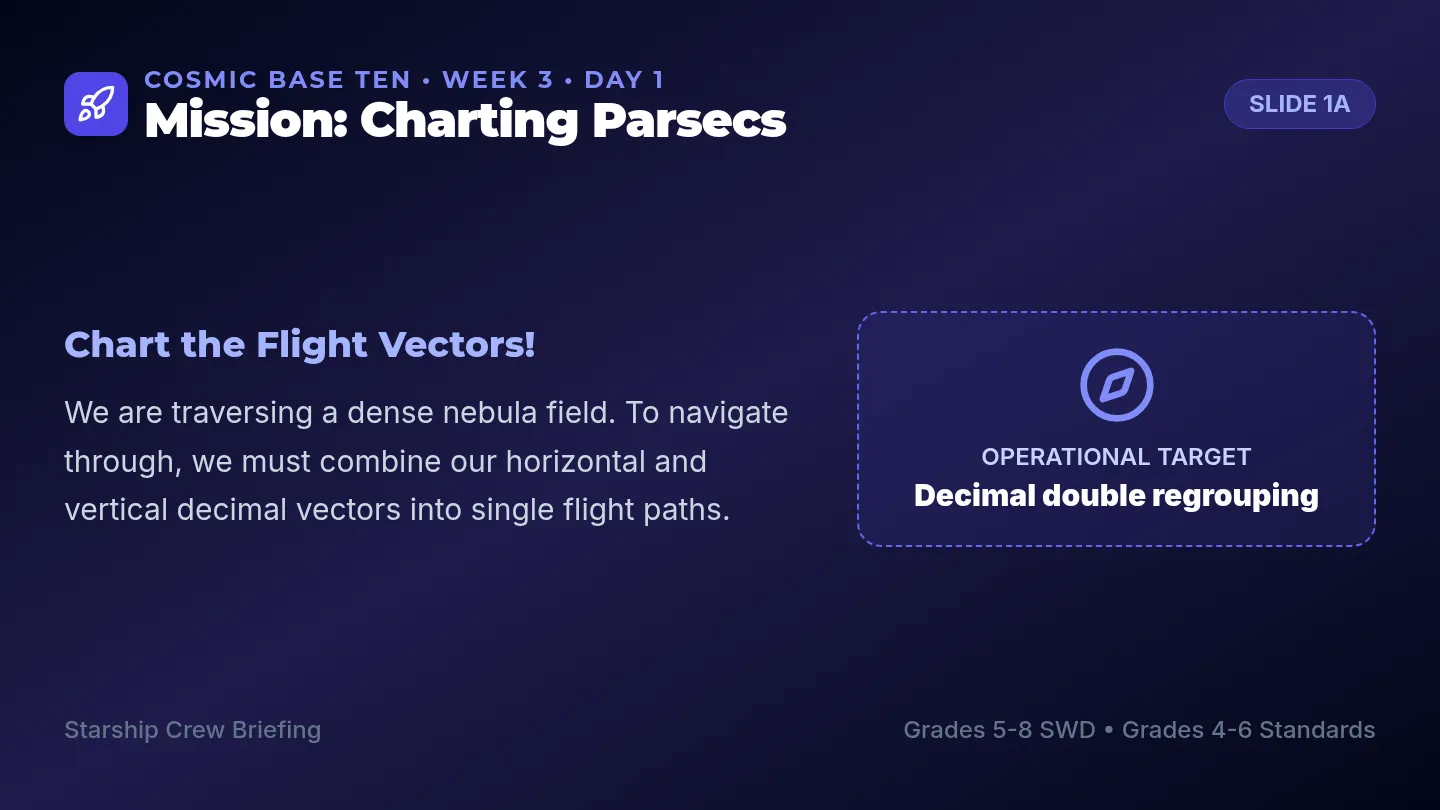
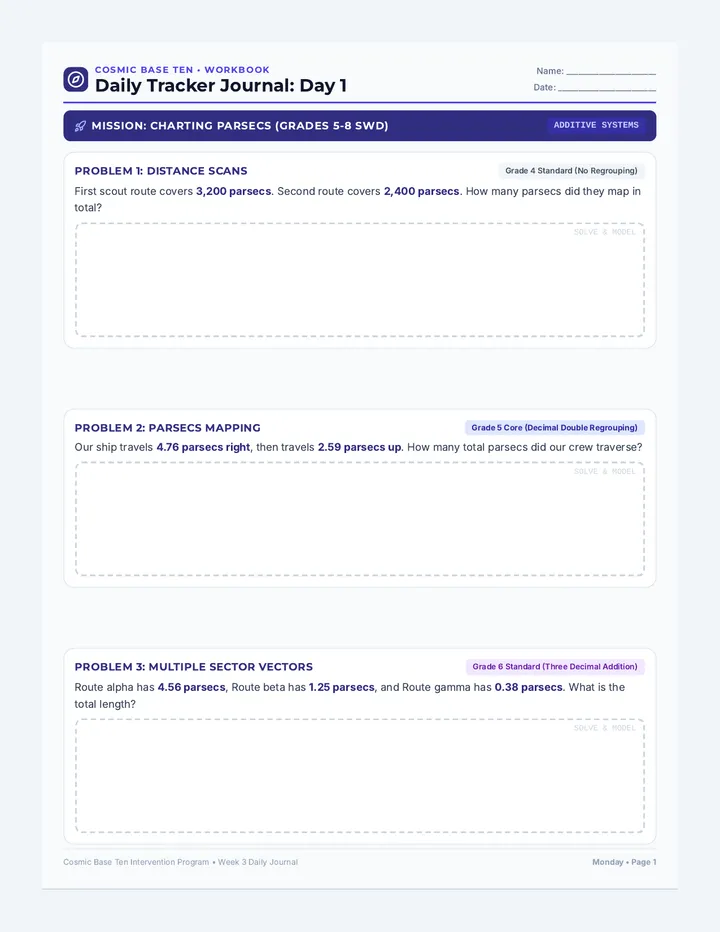
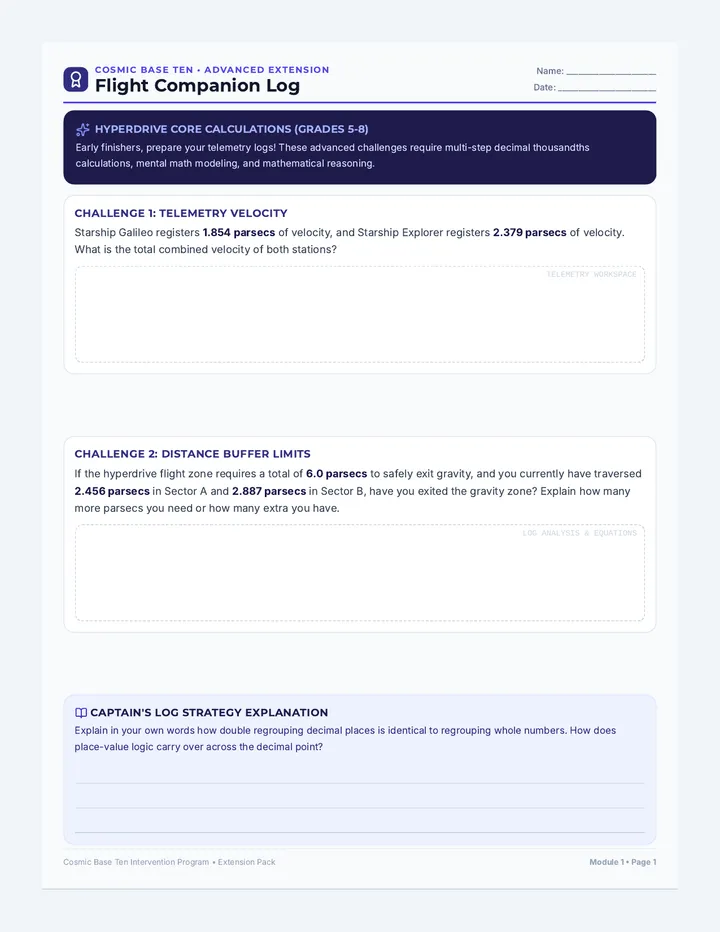
Week 3 focuses on multi-step additive reasoning, decimal subtraction, and aligning coordinates using star charts and compass tools to plan flight vectors for the fleet.
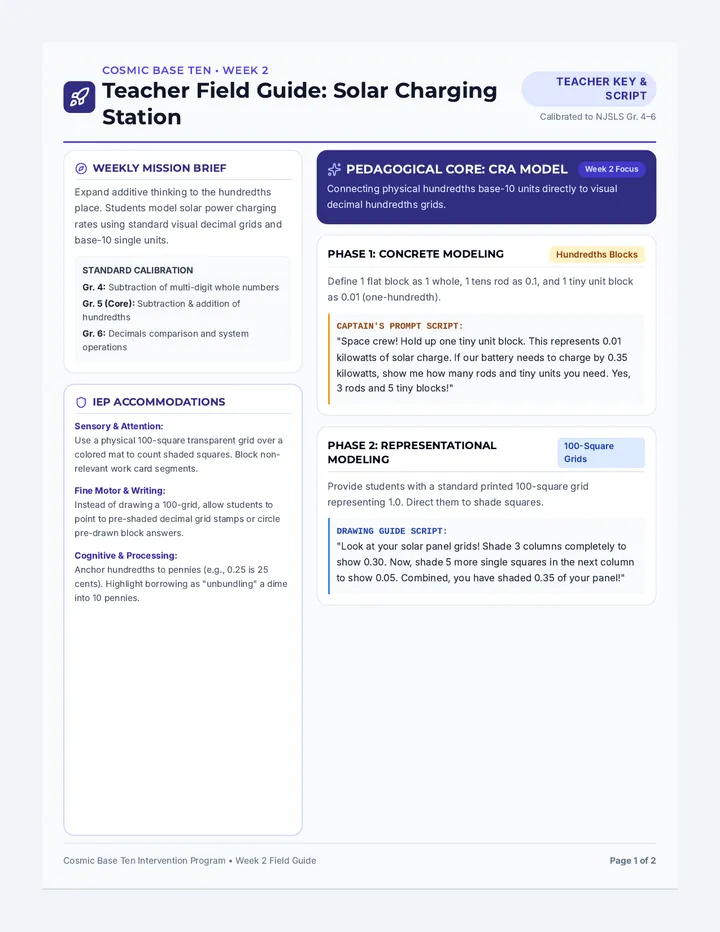
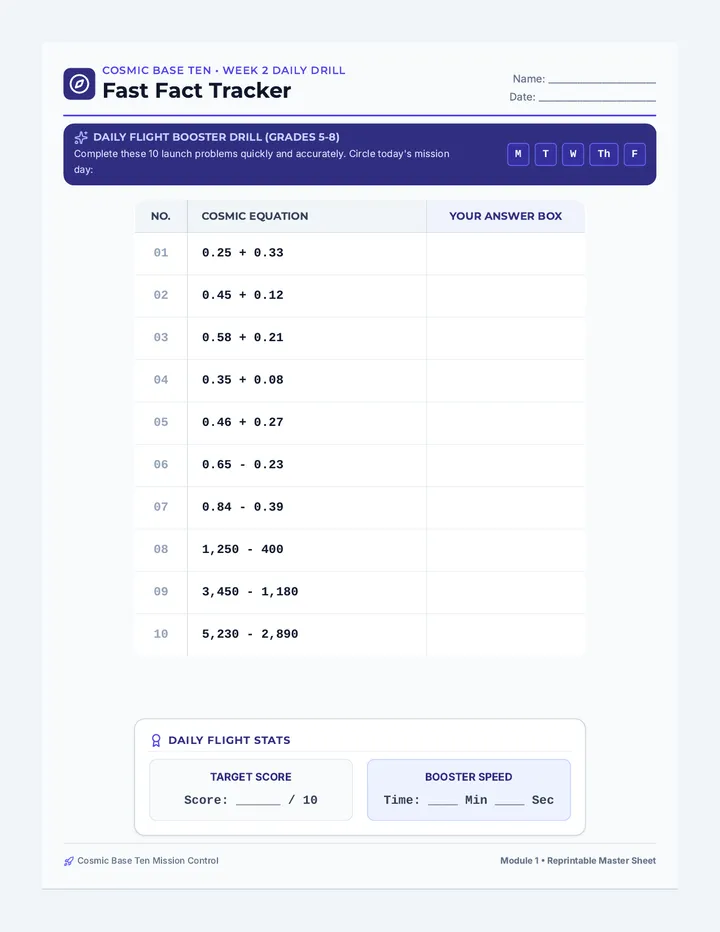
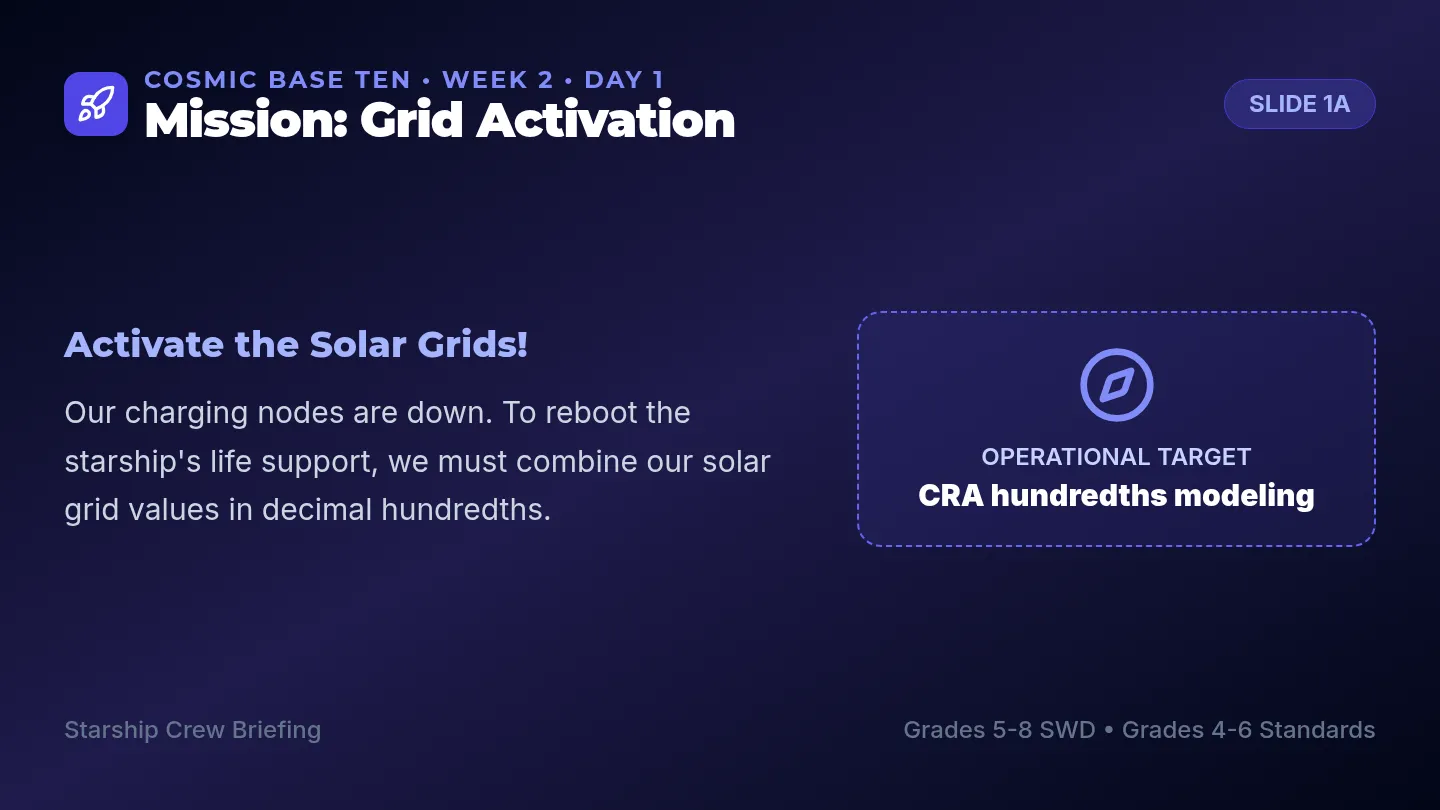
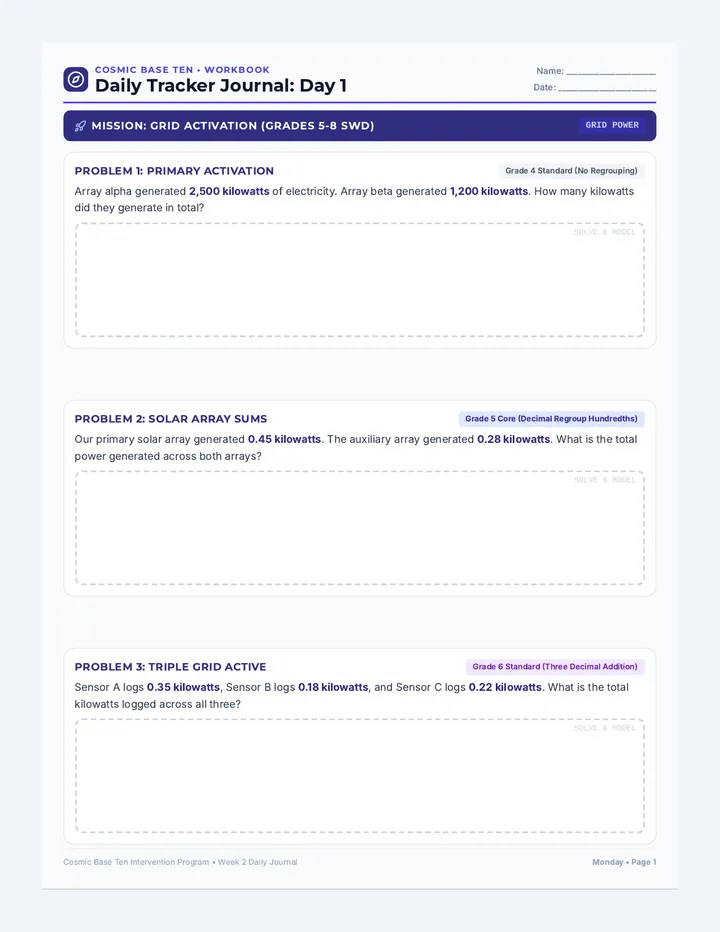
Week 2 focuses on decimal addition and subtraction with and without regrouping, using visual decimal grids and standard plastic base-10 blocks to represent tenths and hundredths in solar charging grid scenarios.
Week 1 focuses on deepening place value understanding and multi-step addition of decimals and whole numbers in space grid systems. Students practice regrouping tenths and wholes, balancing battery loads, and tracking fuel payload readings.
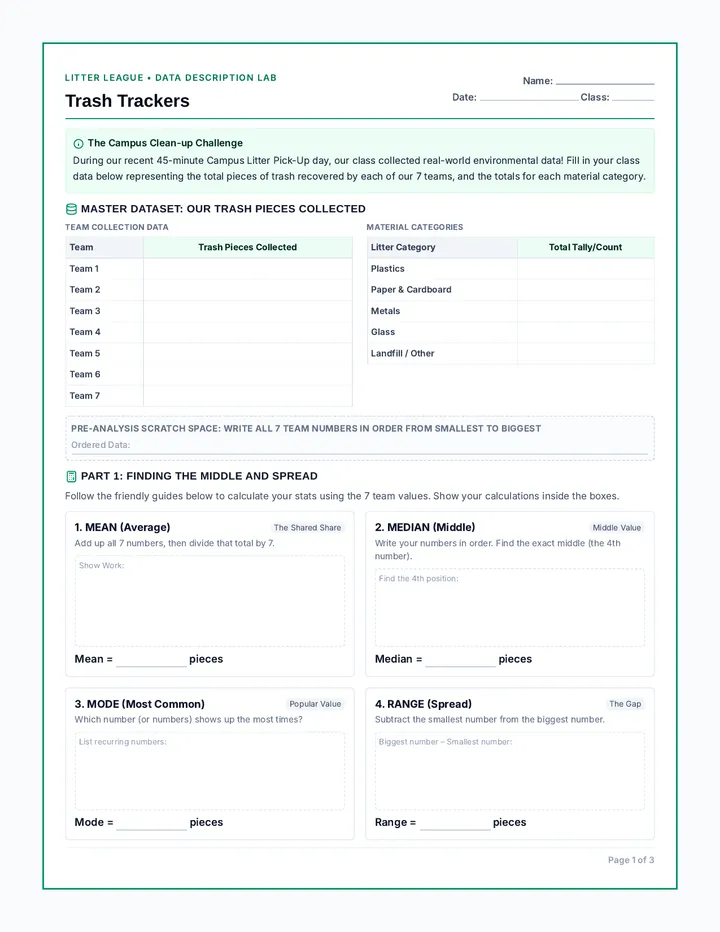
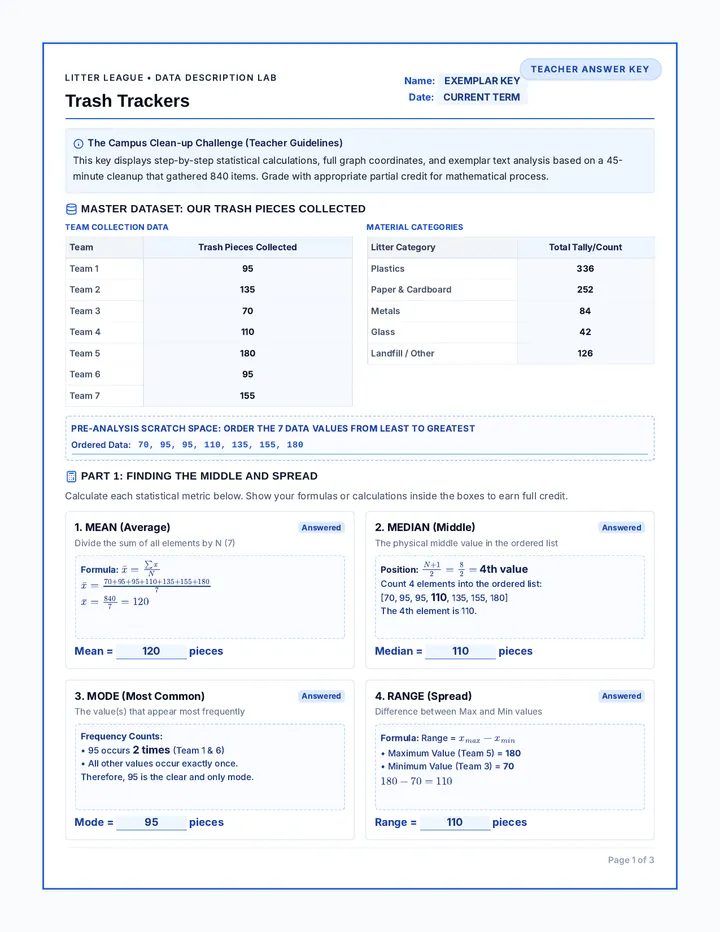
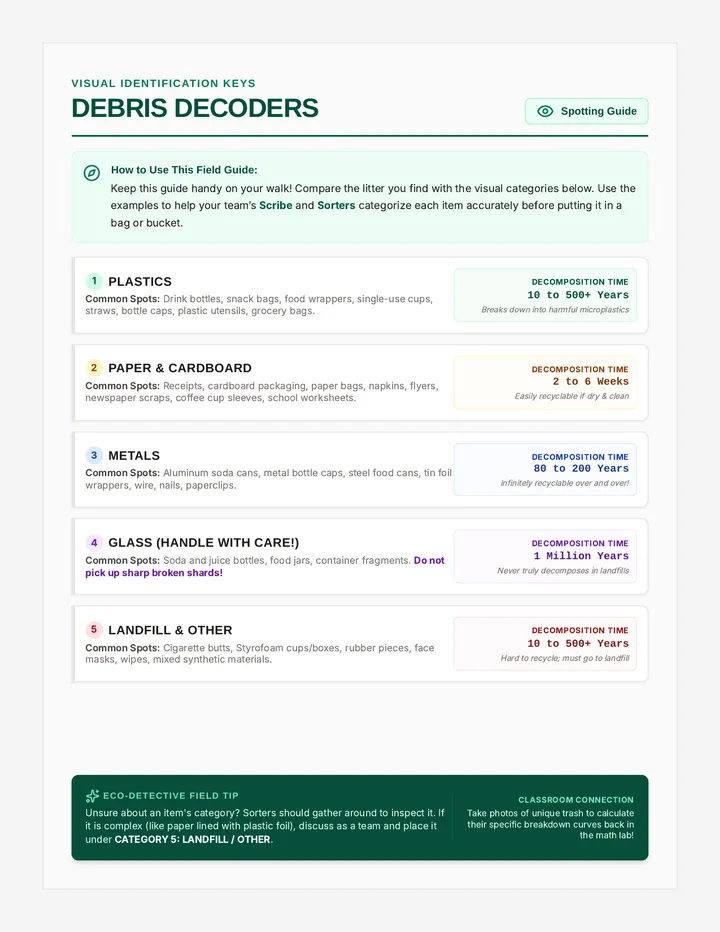
A data description and analysis lesson based on an active campus litter clean-up day. Students aggregate, analyze, and represent real-world physical clean-up data using statistical measures, dot plots, and histograms.
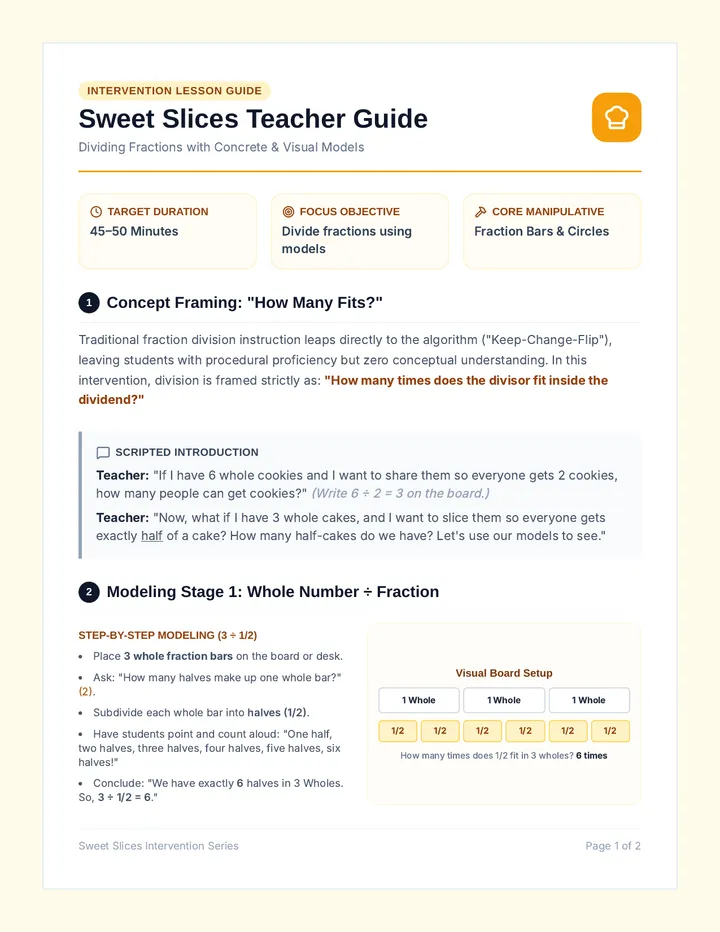
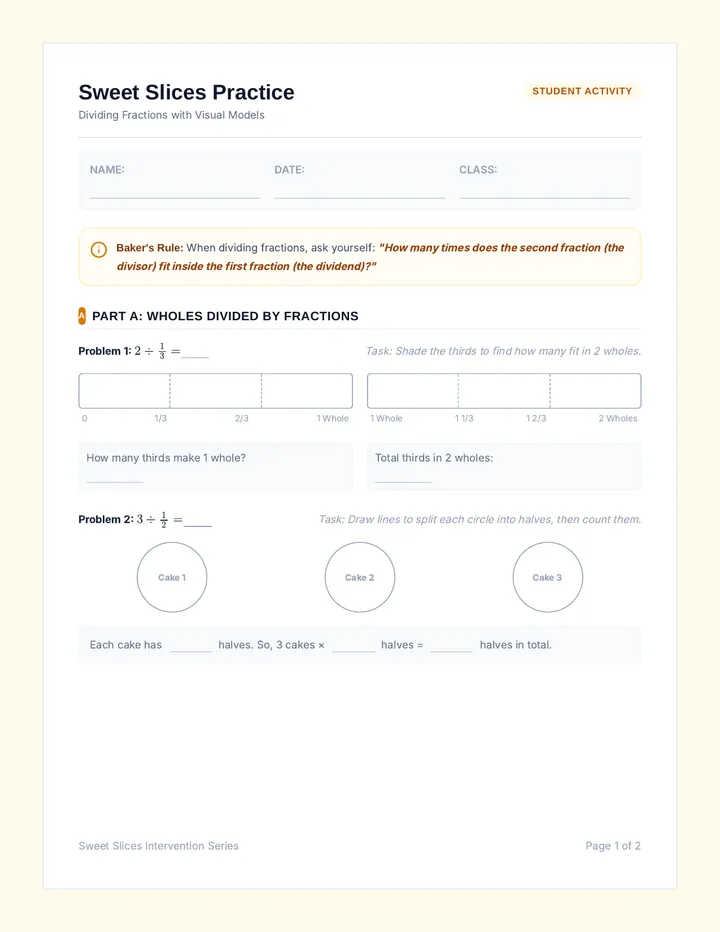
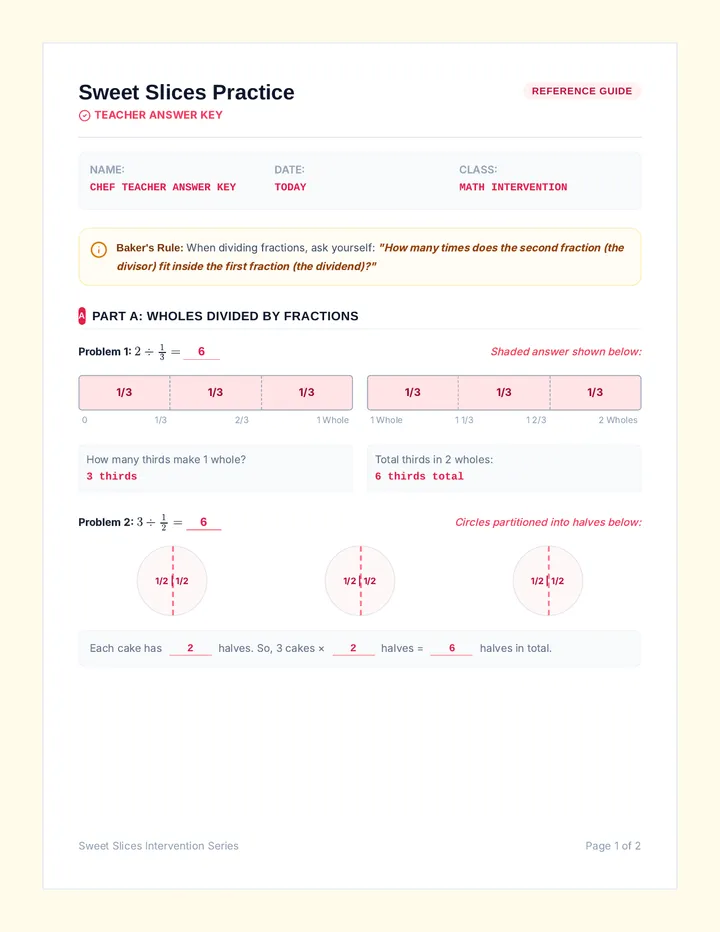
An intervention lesson on dividing fractions using concrete visual models (fraction bars and circles) to build conceptual understanding before moving to the standard algorithm.
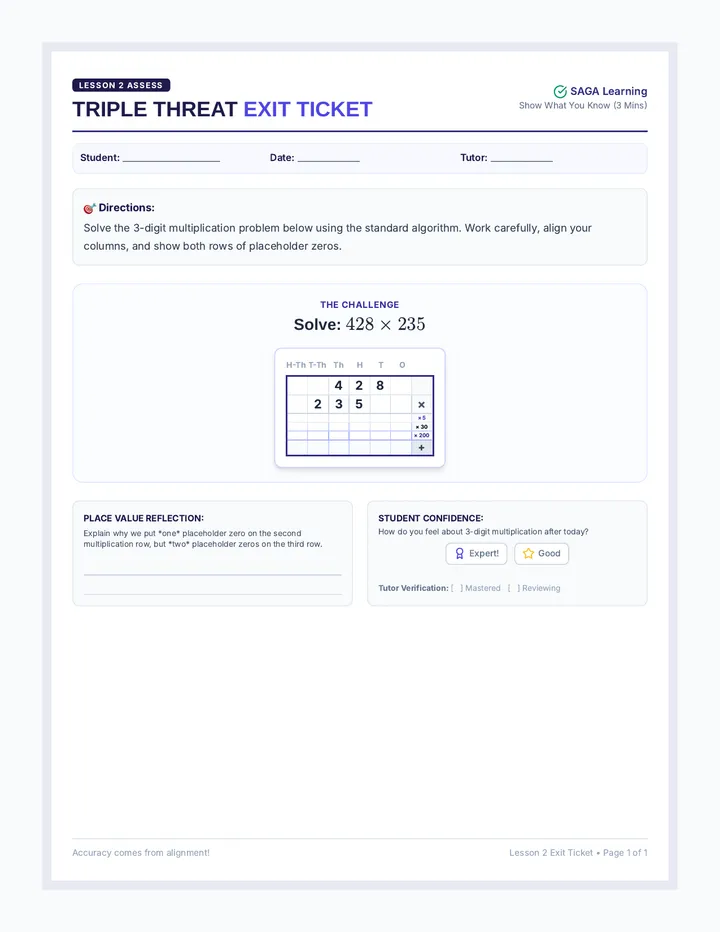
Covers multiplying a 3-digit number by a 3-digit number using the standard algorithm, adding a second layer of place value holder zeros and managing extensive regrouping.
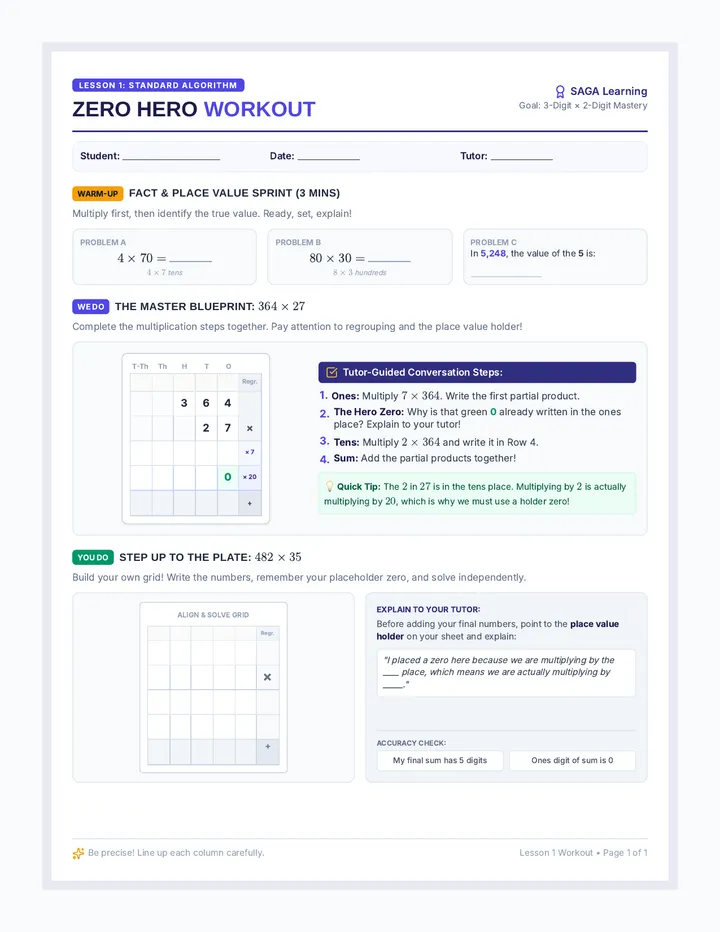
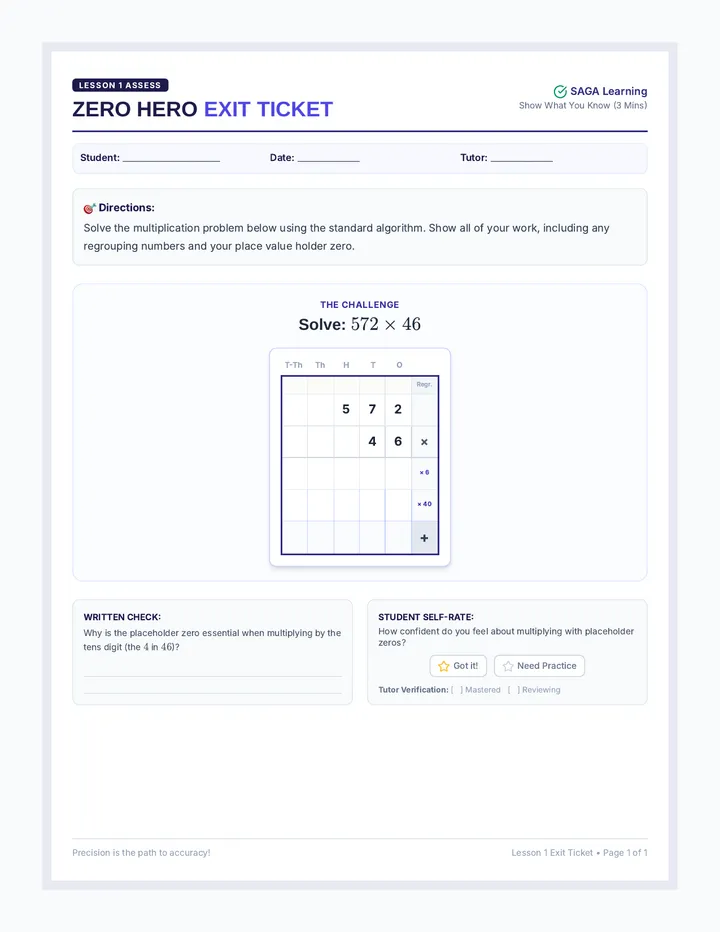
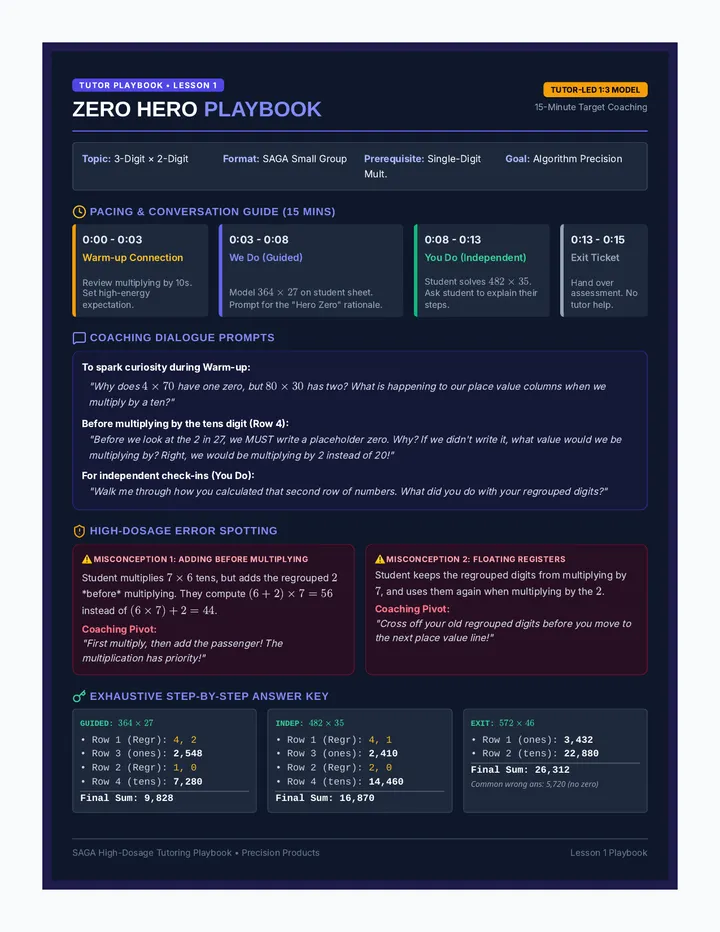
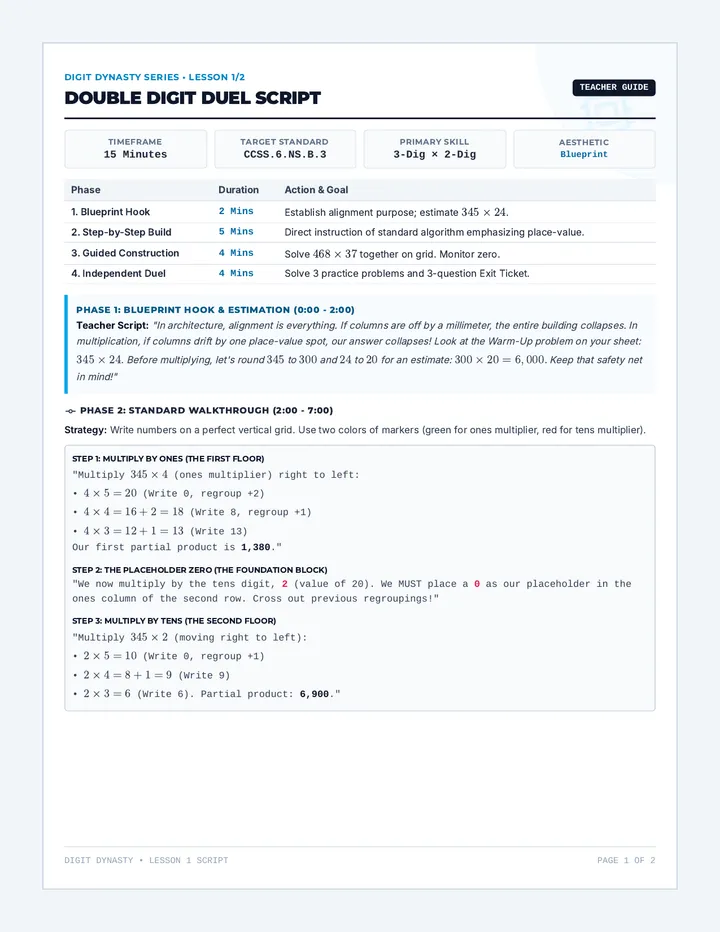
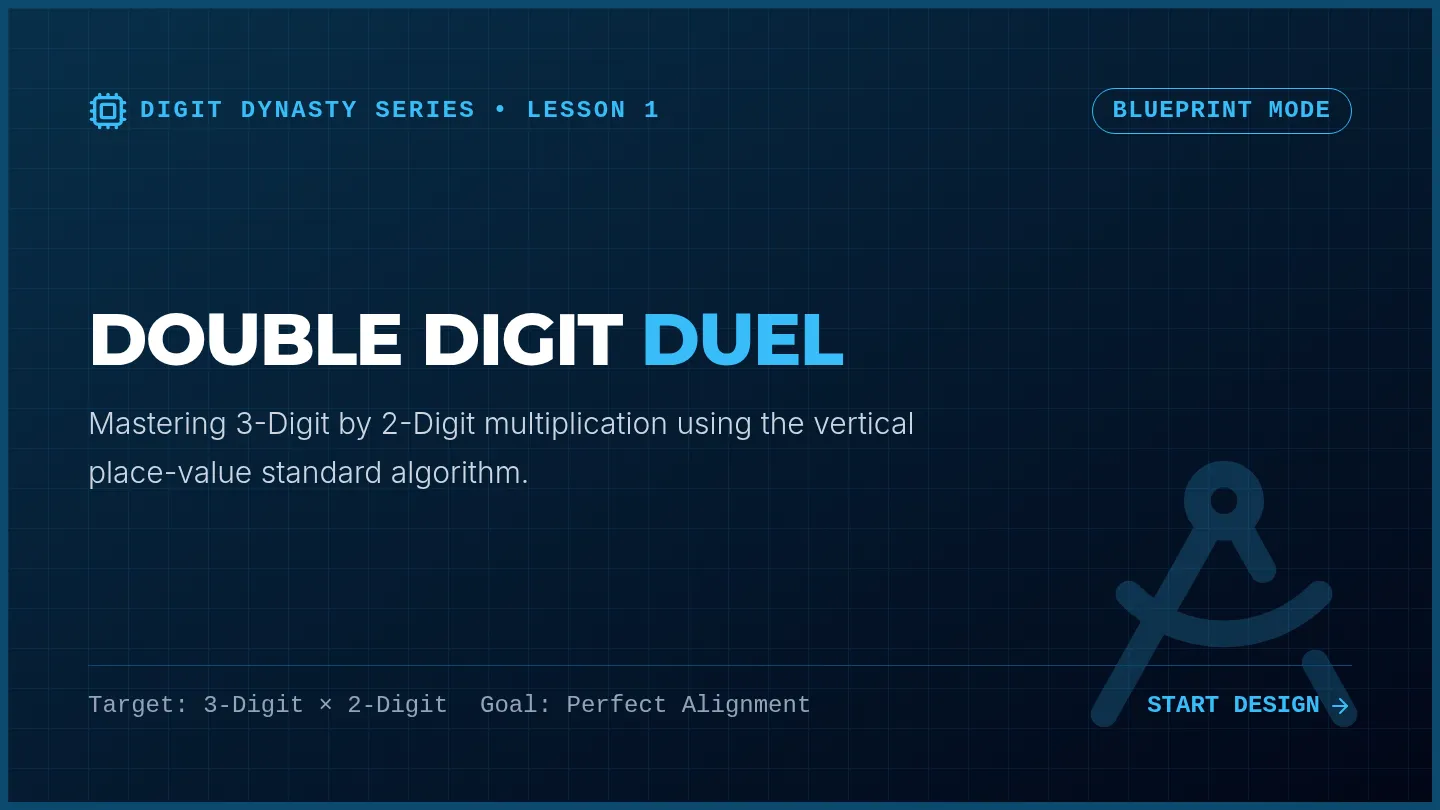
Covers multiplying a 3-digit number by a 2-digit number using the standard algorithm, highlighting the critical role of the place value holder zero.
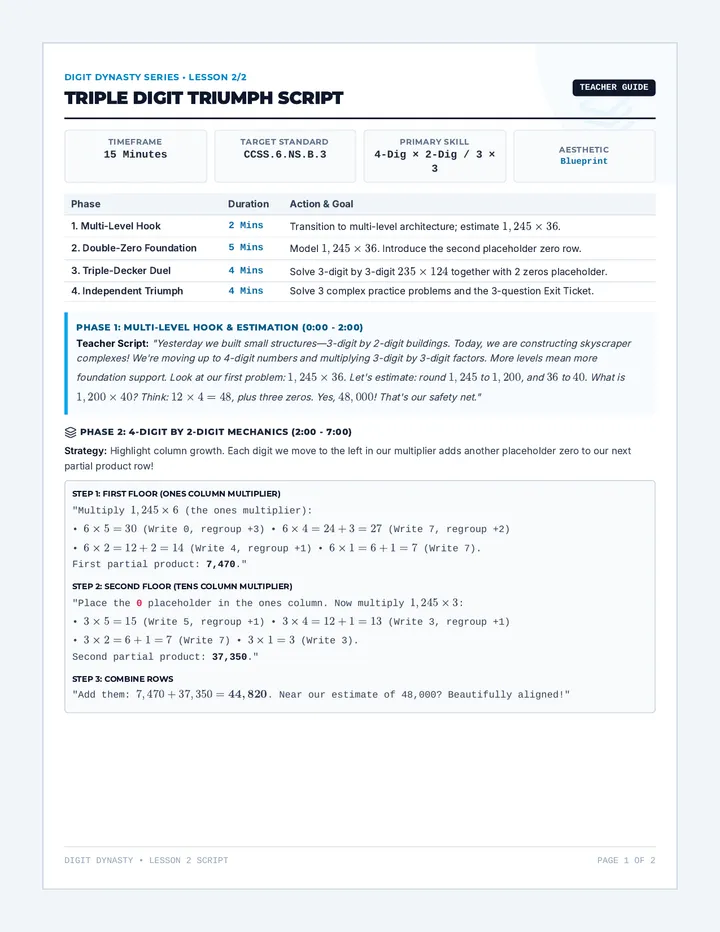
Advancing to 4-digit by 2-digit and 3-digit by 3-digit multiplication, solidifying standard algorithm mechanics and managing multiple placeholder zeros.
Mastering 3-digit by 2-digit multiplication using the standard algorithm, highlighting proper regrouping, placeholder zeros, and vertical place-value alignment.
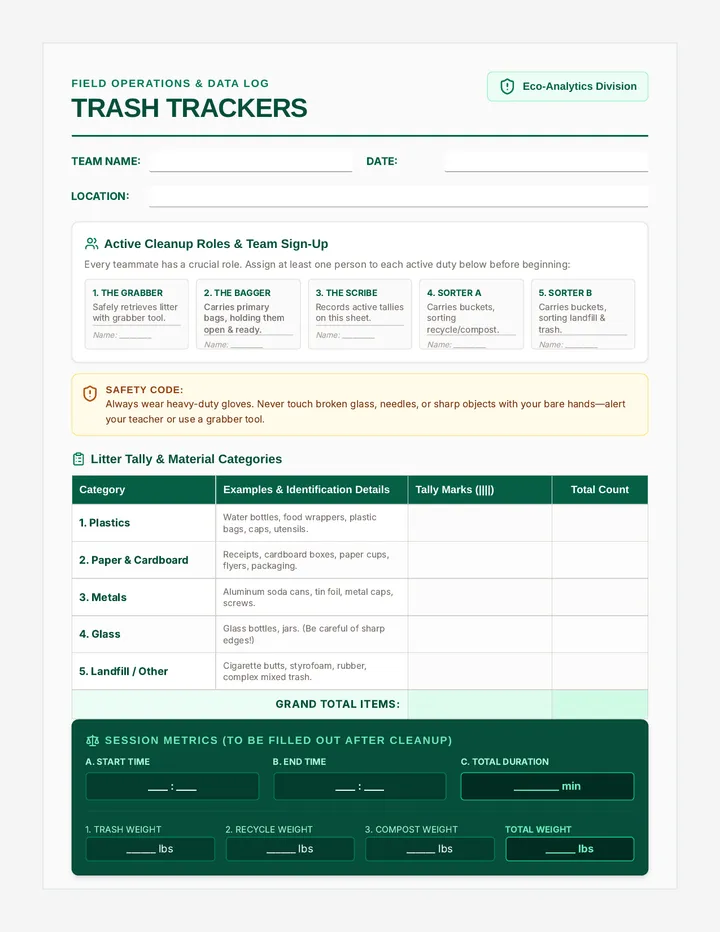
A hands-on, community-based mathematics and environmental science lesson. Students take on specific active roles during a community cleanup to collect, weigh, and analyze litter data, converting their real-world findings into rates, ratios, percentages, and visual graphs.
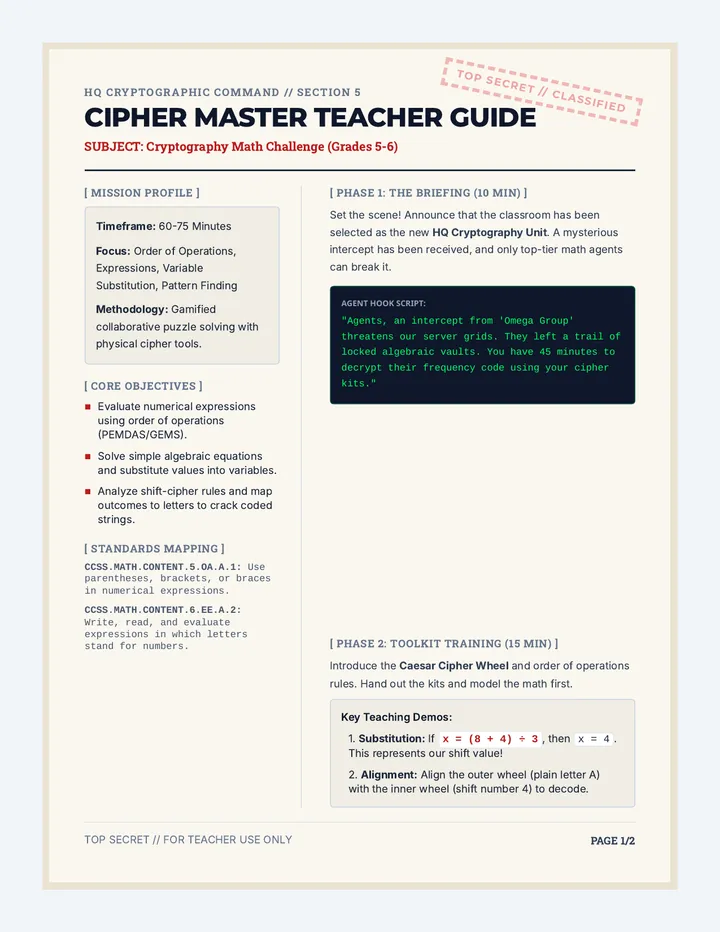
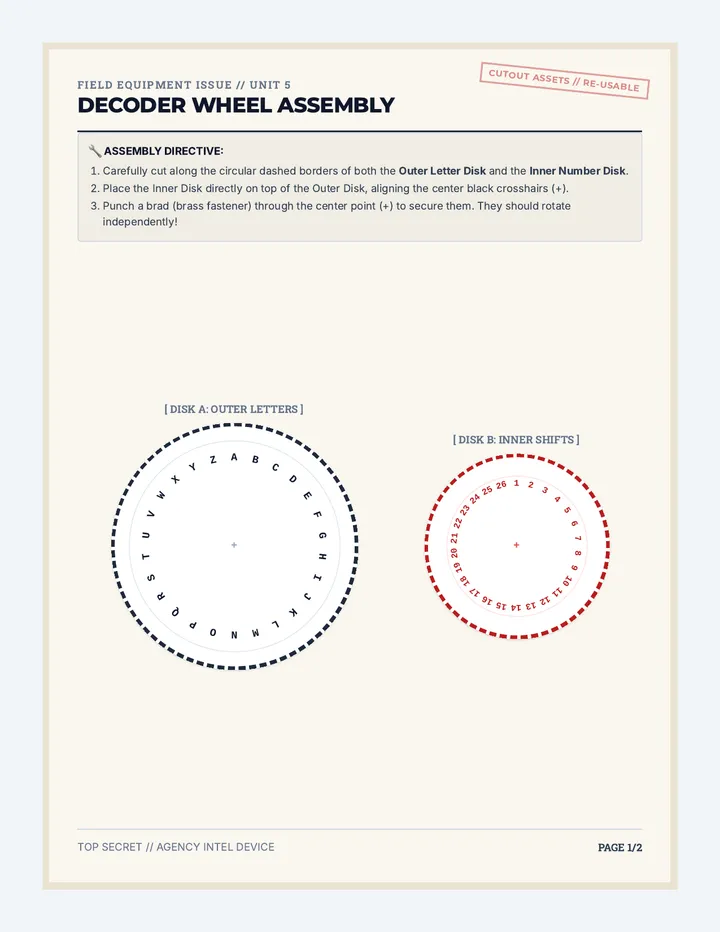
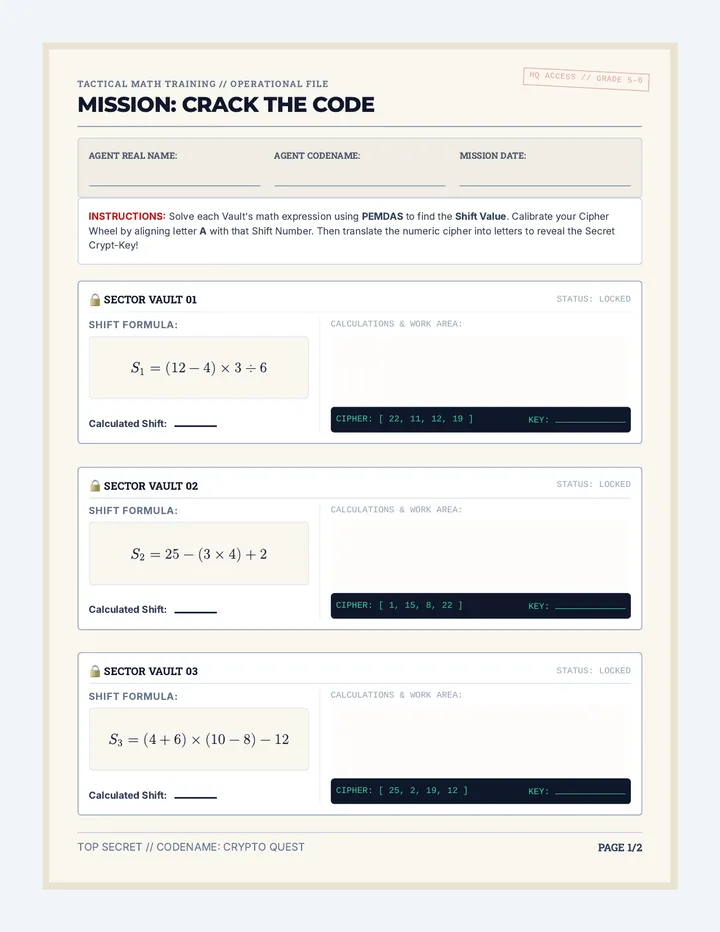
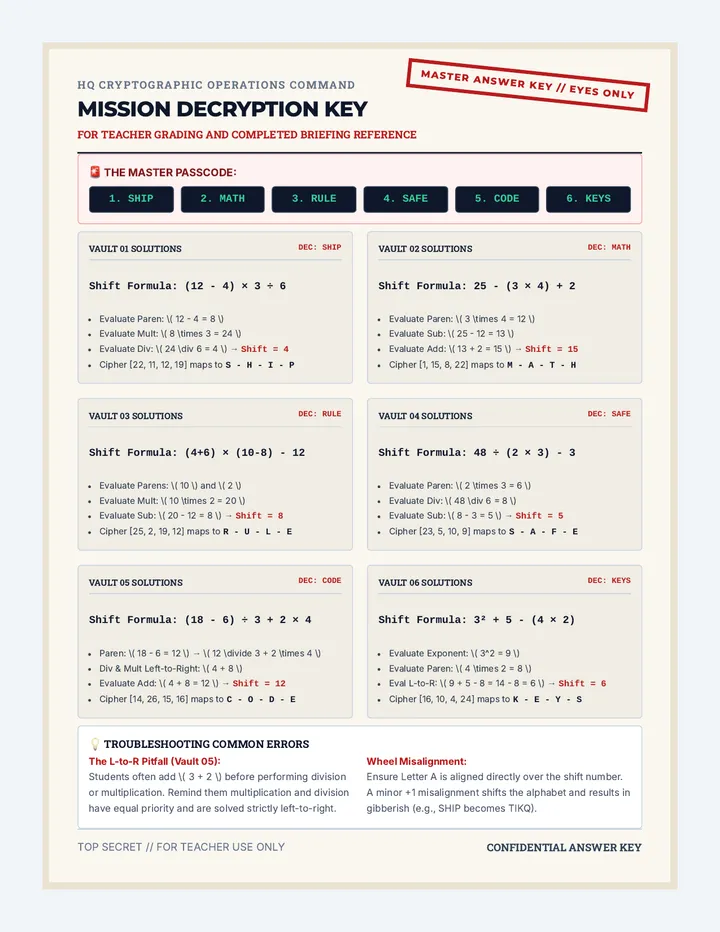
An immersive cryptography math lesson for 5th and 6th-grade students, integrating order of operations, algebraic thinking, and number patterns in a high-stakes spy briefing format.