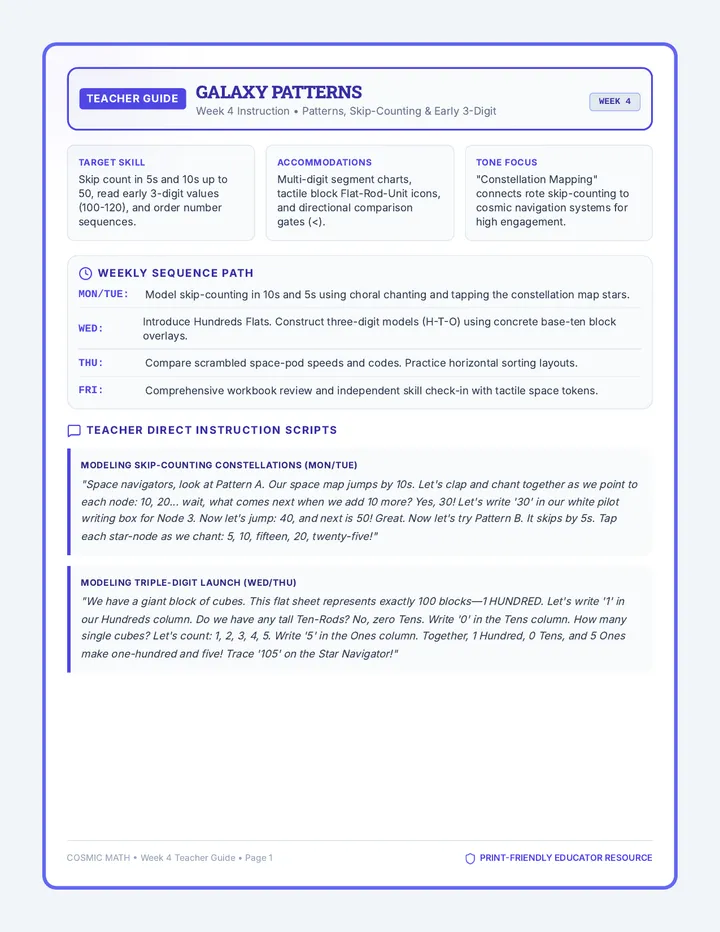
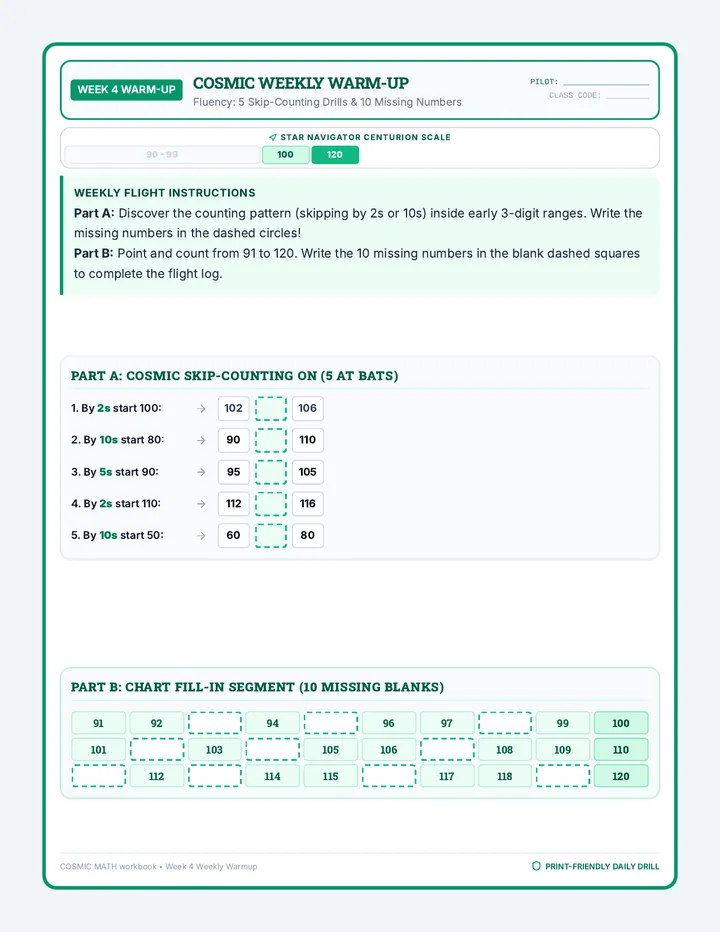
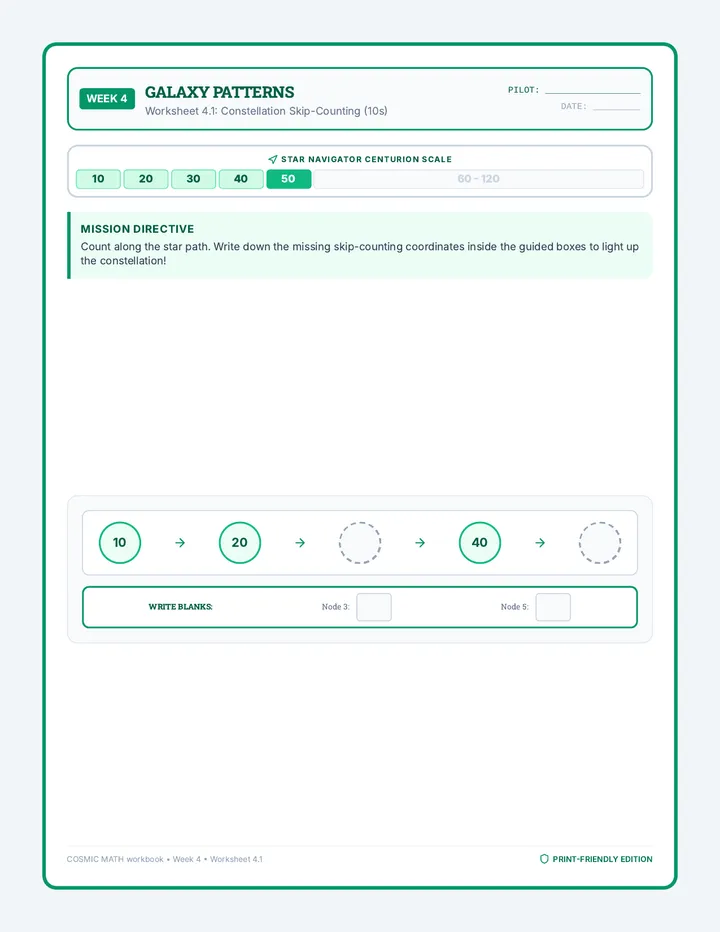
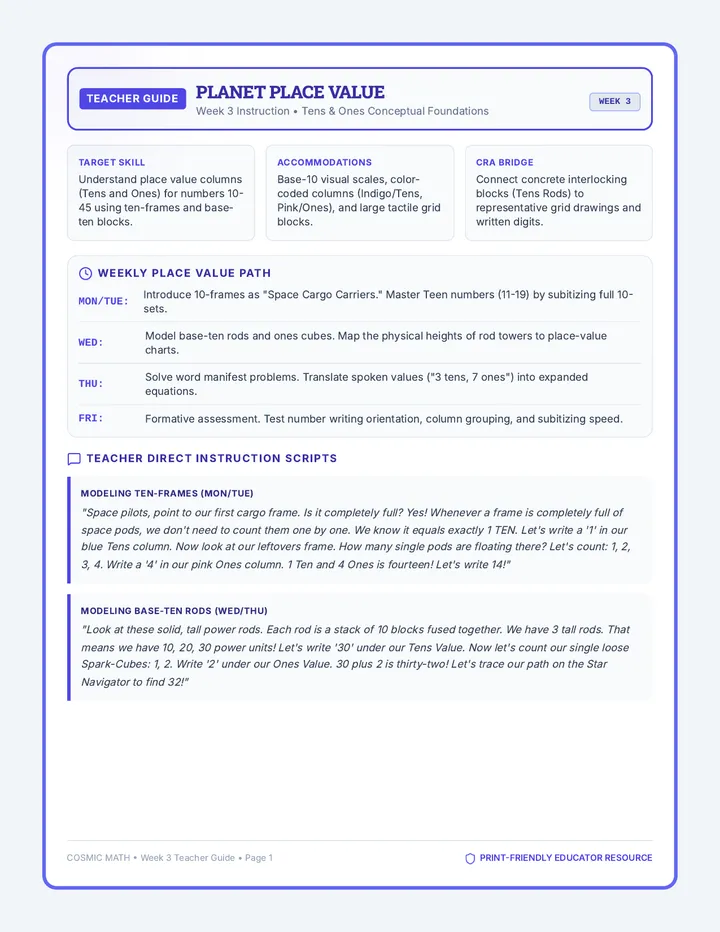
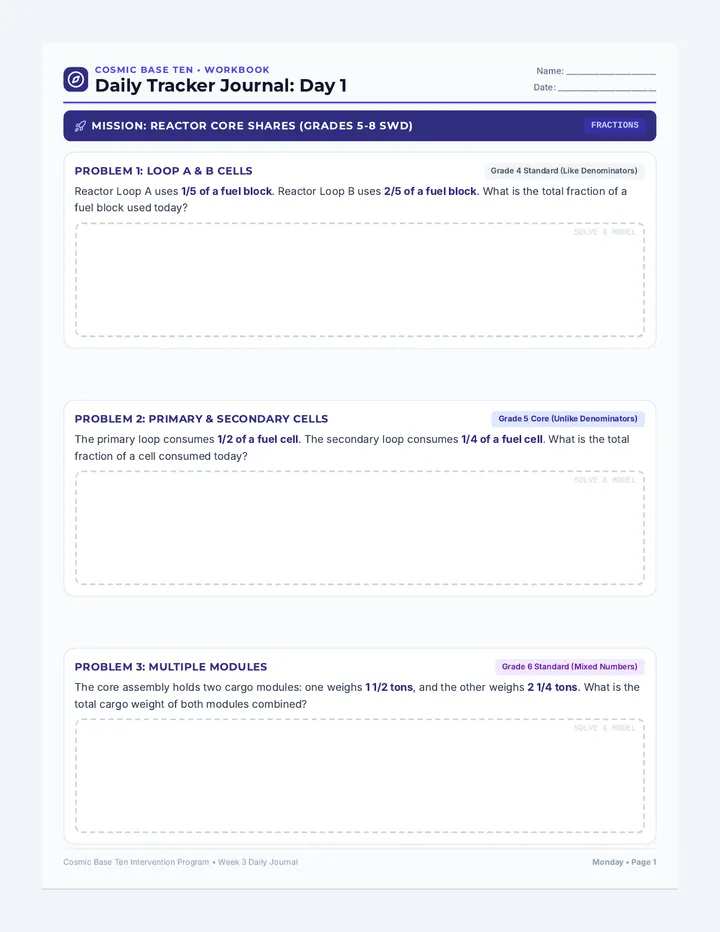
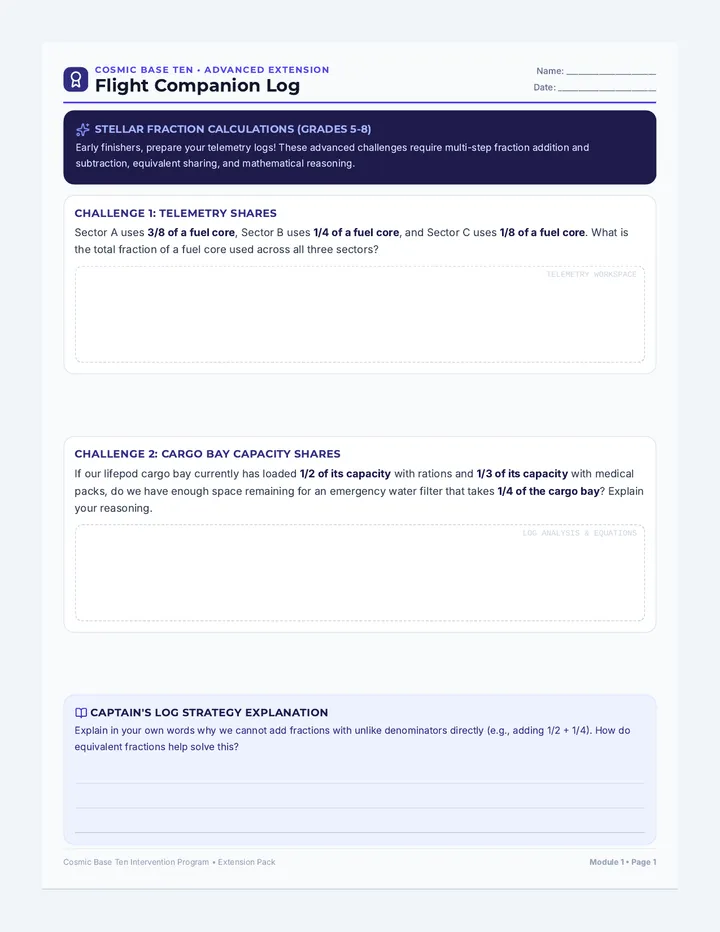
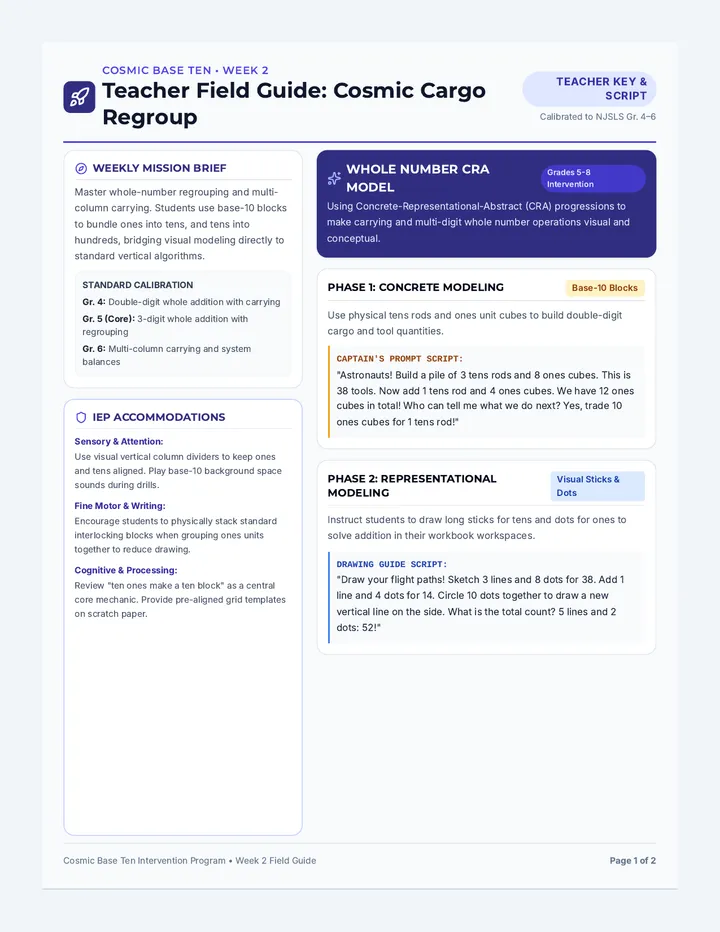
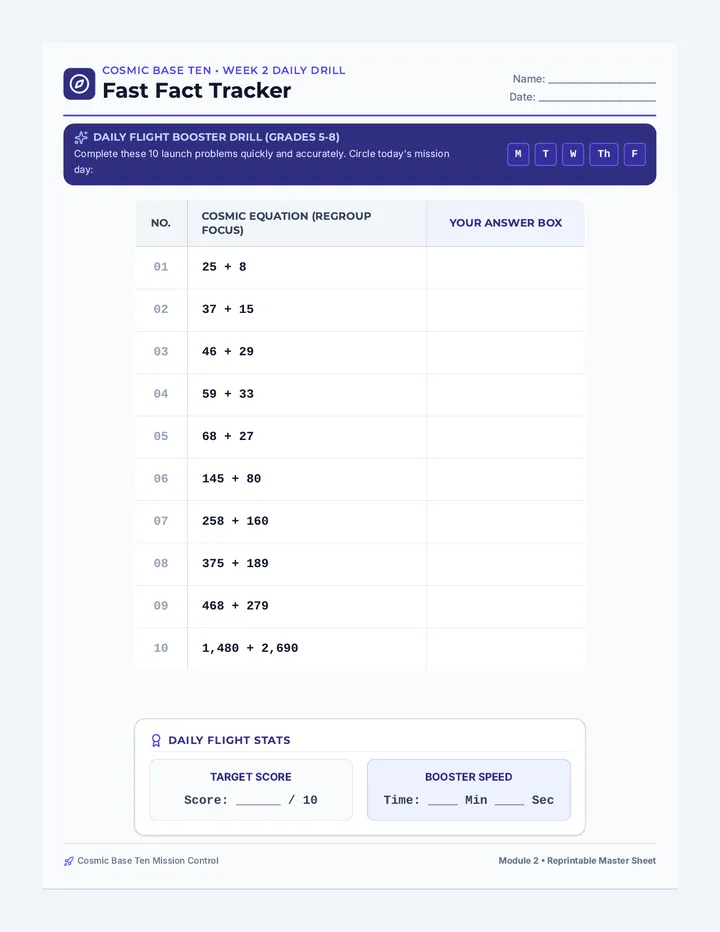
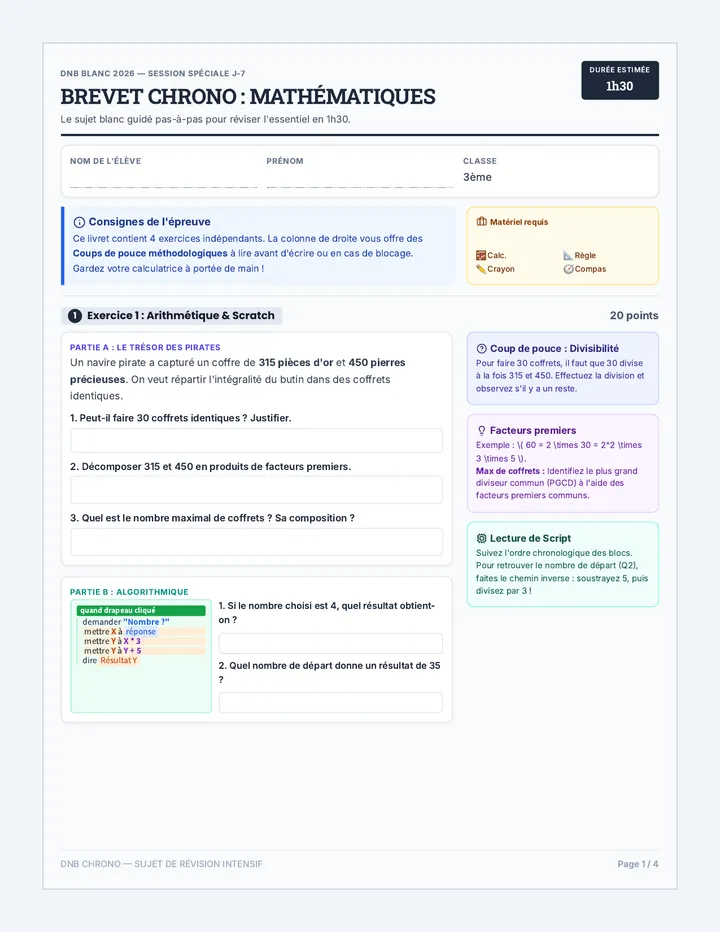
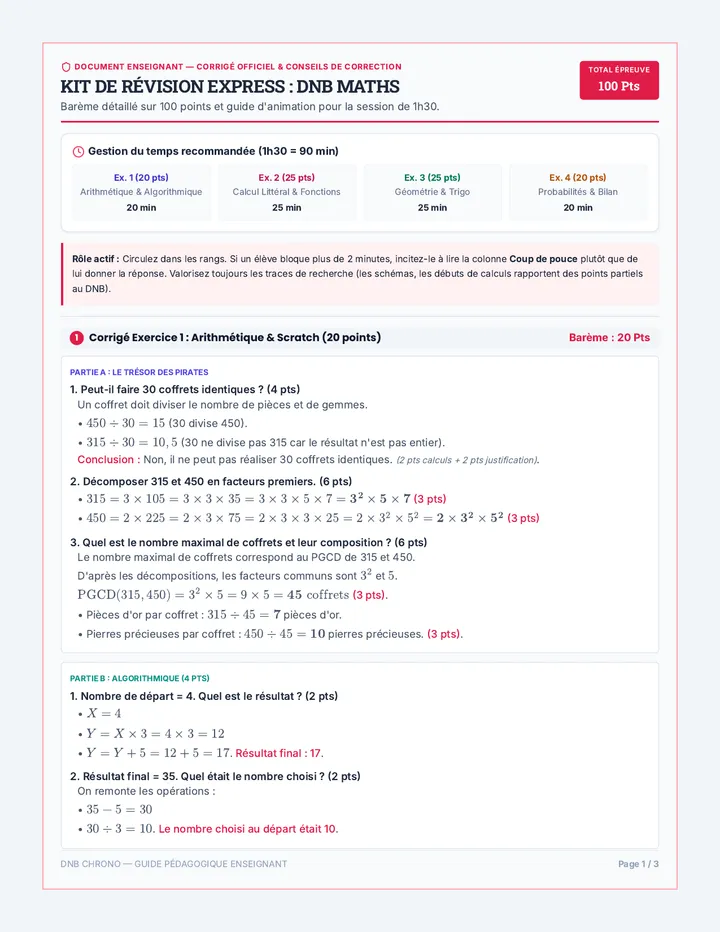
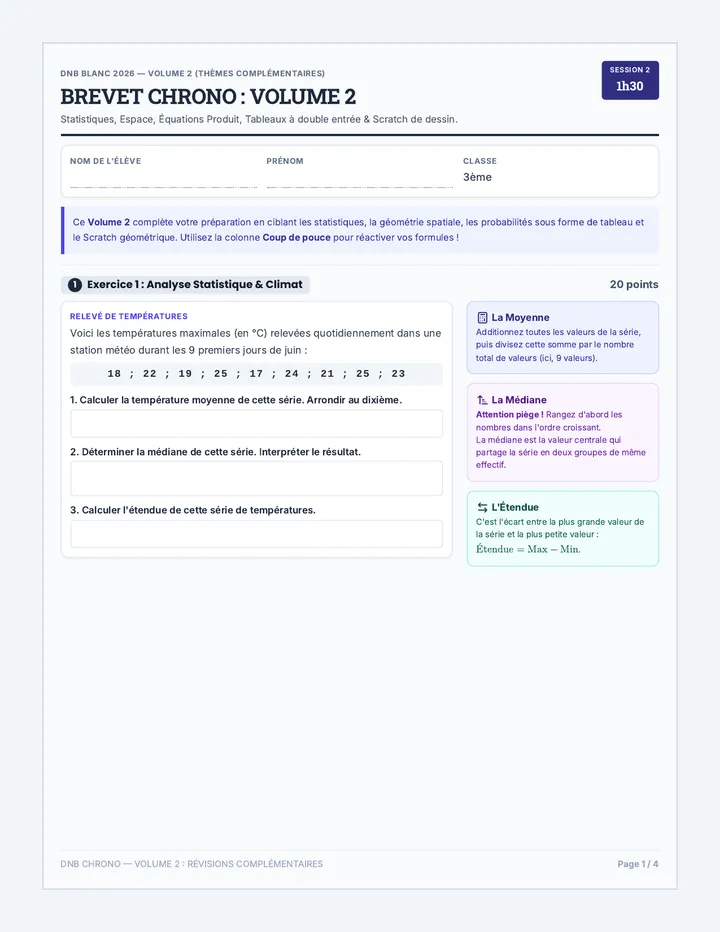
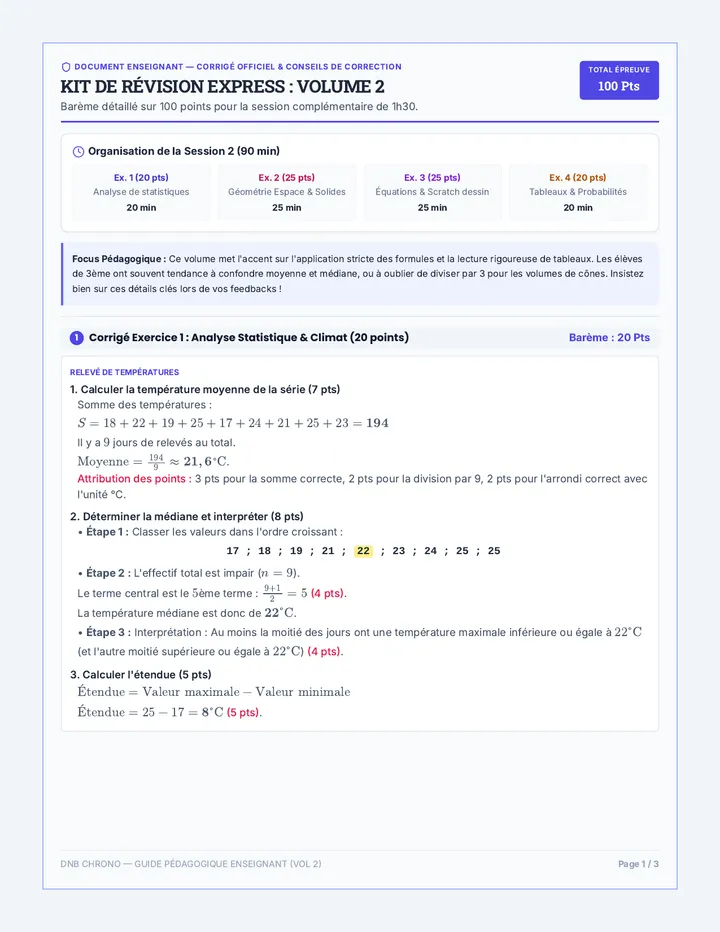
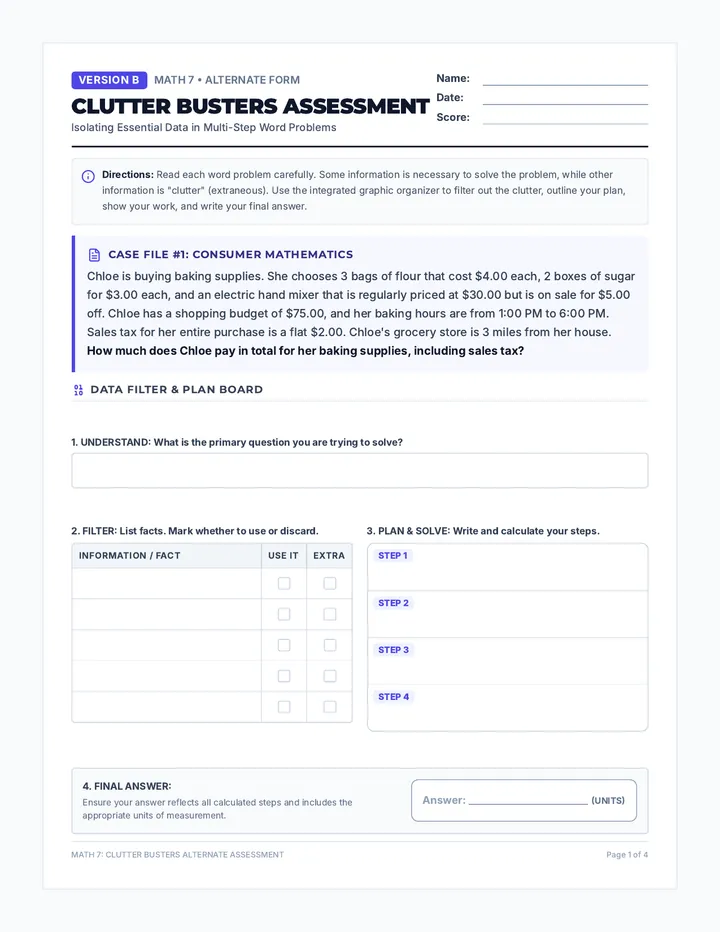
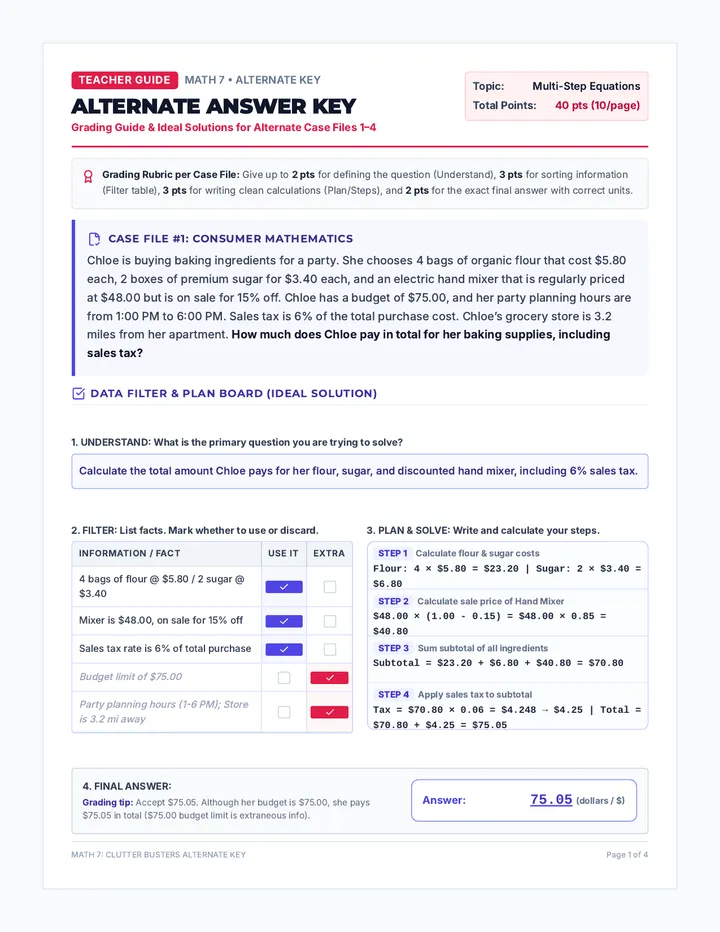
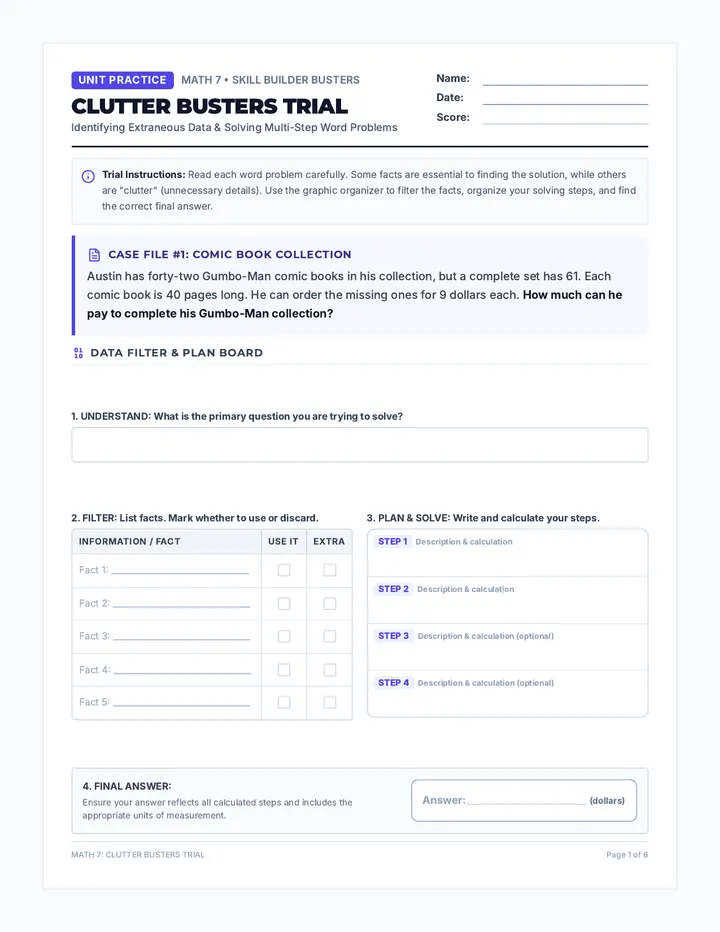
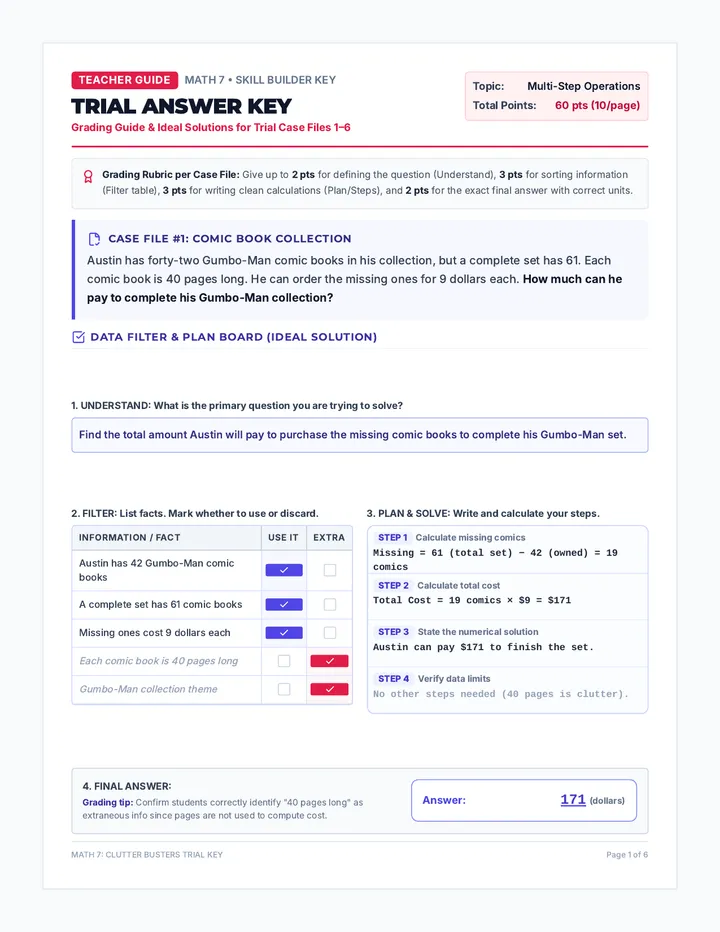
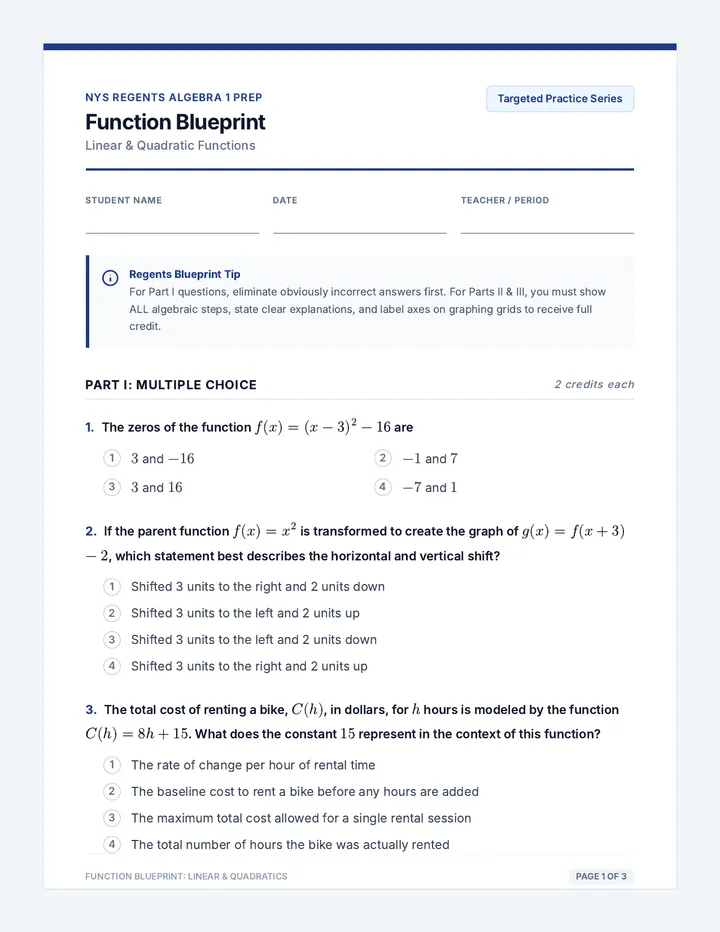
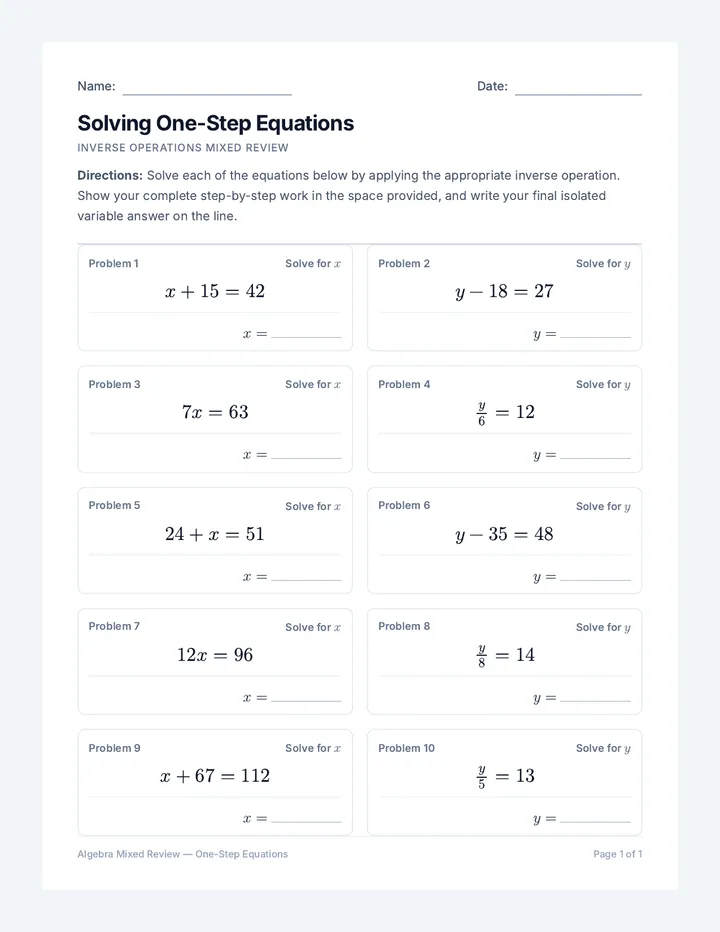
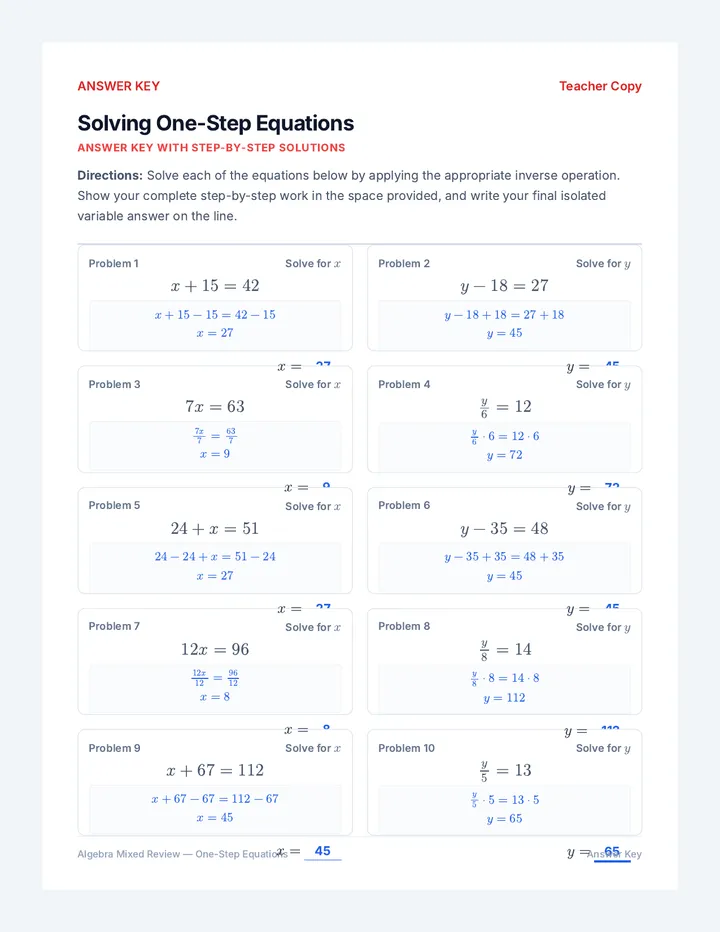
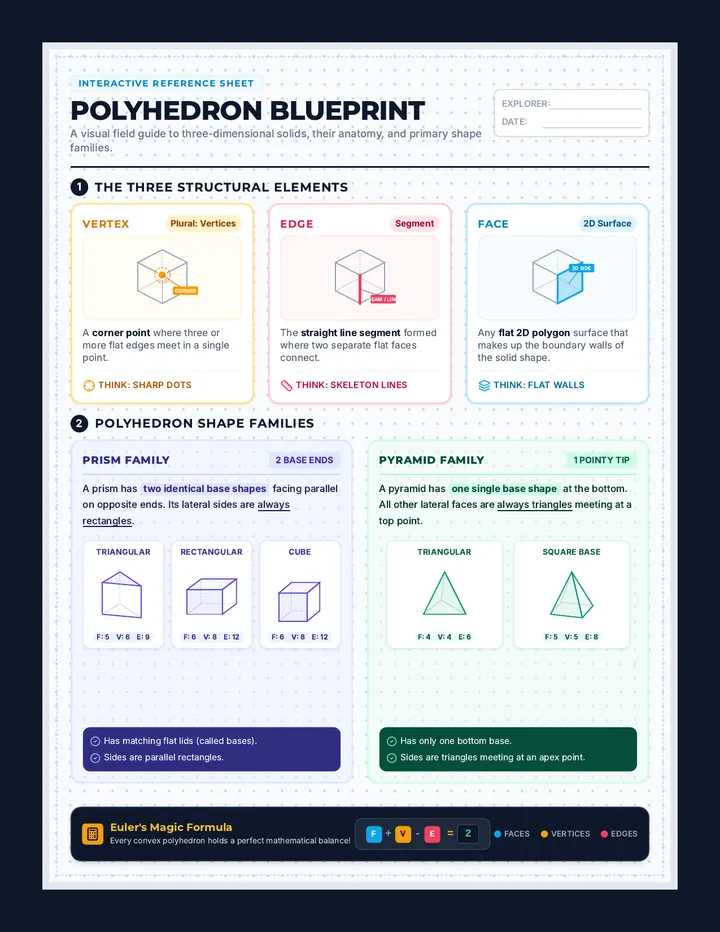
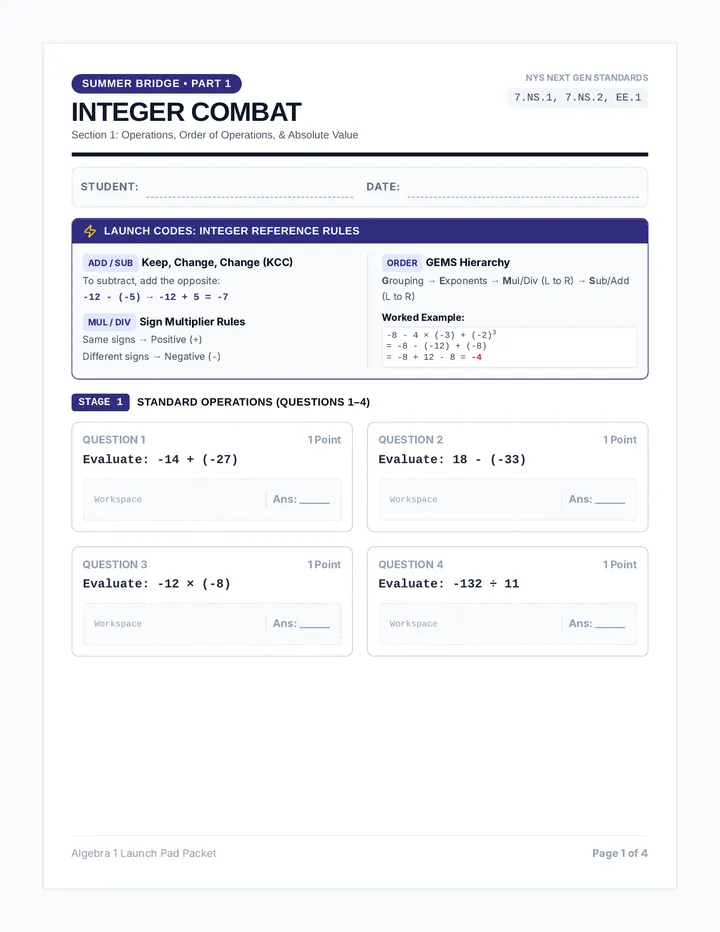
An advanced statistics lesson for 8th-grade students focused on interpreting data from line graphs, histograms, and scatter plots containing decimals and fractions. Students calculate and compare the mean, median, mode, and range of complex datasets.