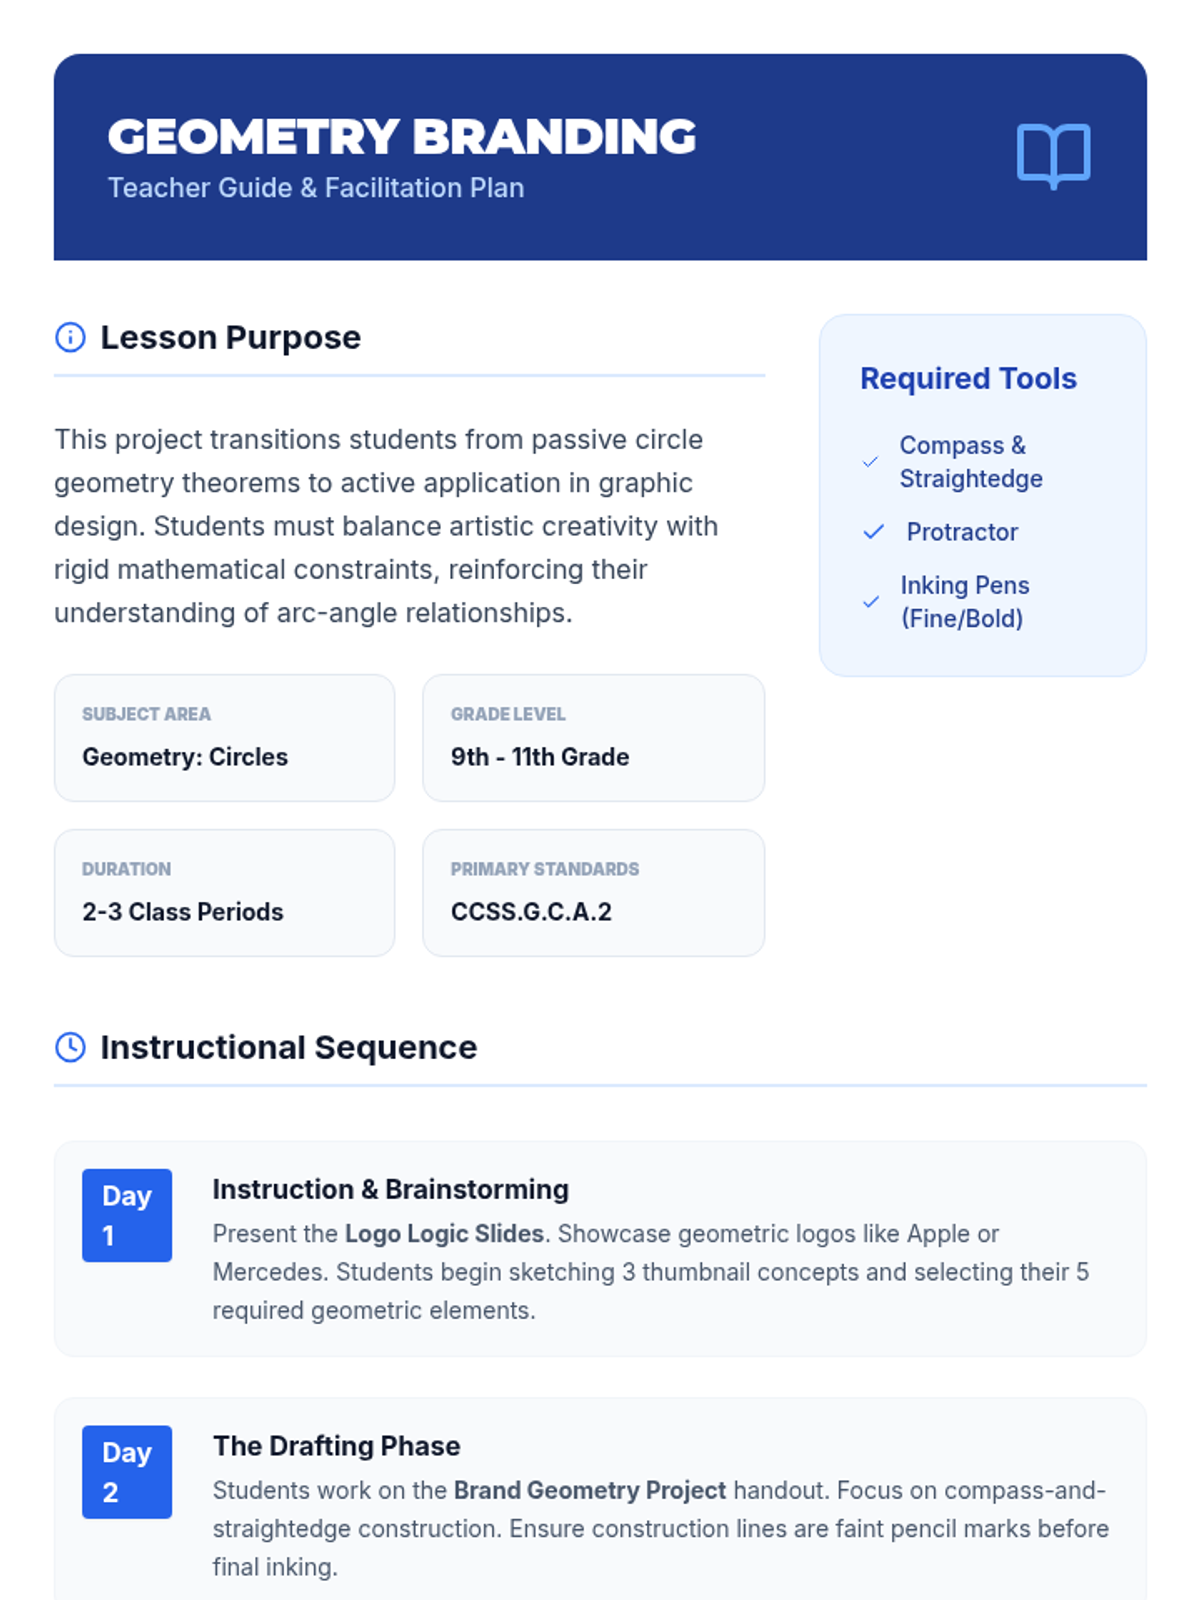
A small-group intervention lesson exploring inscribed angles, diameter relationships, and tangent-radius perpendicularity through dynamic exploration and scaffolded practice.
A high-energy 1st-grade lesson introducing pennies, nickels, and dimes through a carnival-themed market simulation. Students identify coins and practice counting mixed groups to 'buy' carnival treats.
A multi-sensory Kindergarten lesson that transforms counting into a neighborhood adventure. Students develop one-to-one correspondence and number recognition through hands-on sorting, classroom 'neighborhood' exploration, and interactive visual aids.
Students will learn the concept of a health insurance deductible, focusing on the math of reaching the deductible amount before insurance coverage begins.
A comprehensive review lesson covering all health insurance concepts, including terminology, cost calculations, and plan comparisons to prepare for assessment.
A comprehensive assessment covering health insurance basics, cost calculations, and plan comparisons for consumer math students.
A strategic masterclass for the ACT Science section, focusing on speed-reading data sets, identifying experimental variables, and decoding scientific logic. This lesson emphasizes the 'Straight to the Data' approach to maximize score in the 35-minute time limit.
An introductory exploration of calculus-adjacent concepts tested on the ACT, focusing on limits, instantaneous rates of change, and function optimization. Students will master the Limit Blueprint and apply rate-of-change logic to complex algebraic scenarios.
An intensive masterclass on advanced trigonometric identities, the unit circle, and non-right triangle laws. Students will master the Pythagorean identities, Law of Sines/Cosines, and the specific ACT-style unit circle coordinates required for top-tier scores.
A specialized deep dive into advanced geometry concepts including circle equations, 3D volume/surface area of complex shapes, and coordinate geometry involving perpendicularity and distance. Students will master completing the square for circles and visualizing 3D cross-sections.
A specialized deep dive into trigonometric functions, mastering the critical distinction between period and frequency. Students will apply the 2π/b blueprint to decode sine and cosine graphs and solve high-difficulty periodic motion problems.
A focused deep dive into imaginary and complex numbers. Students will master powers of i, arithmetic with complex conjugates, and solving quadratic equations with complex roots—all through the lens of ACT-style 'Final Ten' questions.
A comprehensive lesson focused on performing and interpreting linear regression analysis using real-world UN population and surface area data. Students will learn to identify variables, evaluate the impact of outliers, and draw conclusions based on correlation coefficients.
A comprehensive lesson focused on high-level ACT Math topics including matrices, complex functions, trigonometry, and advanced statistics. The lesson emphasizes identifying common 'traps' and applying architectural-style problem-solving strategies.
A comprehensive lesson on interpreting and analyzing complex data visualizations, including trends, correlations, and statistical distributions for high school students.
A cumulative review lesson where students apply their knowledge of inverse operations to solve mixed one-step equations involving addition, subtraction, multiplication, and division.
Expanding algebraic thinking to multiplication and division. Students will learn how to 'undo' multiplication by splitting into equal groups (division) and 'undo' division through multiplication, maintaining the balance of the scale.
A foundational introduction to basic algebra using the balance scale analogy, specifically designed for students working at a 3rd-grade level. Students will learn about variables and the concept of inverse operations to 'undo' addition and subtraction.
A Tier 2 intervention lesson for 6th grade focused on equivalent ratios using tape diagrams and visual models. Students practice through guided 'recipes' and matching activities to build conceptual understanding.
A focused lesson on solving quadratic equations and understanding quadratic functions, featuring a review presentation and a multiple-choice assessment.
A Tier 2 intervention lesson for 5th grade students focused on conceptually understanding equivalent fractions and renaming them to add fractions with unlike denominators. Students will explore the 'Identity Property of 1' through visual models to see why multiplying the numerator and denominator by the same number creates an equivalent fraction.
A comprehensive lesson covering addition, subtraction, multiplication, and division of integers using visual models and algorithmic rules.
A summative assessment evaluating mastery of the Data Decoder sequence. Students apply their skills to a final case study involving complex data analysis and interpretation.
A deep dive into distinguishing between correlation and causation. Students analyze the correlation coefficient (r) and explore how external factors can influence perceived relationships between variables.
Explores bivariate data through scatter plots, trend lines, and the basics of linear regression. Students learn to use technology or manual methods to find the line of best fit and interpret the slope and intercept.
Instruction on organizing and interpreting categorical data using two-way frequency tables. Students calculate joint, marginal, and conditional relative frequencies to find associations between variables.
Guided practice in comparing two or more datasets using visual displays and summary statistics. Students analyze differences in shape, center, and spread to draw meaningful conclusions.
Introduces measures of center (mean, median) and spread (range, interquartile range, standard deviation basics). Students learn how to calculate these values and understand what they represent in the context of a dataset.
Focuses on constructing and interpreting visual data displays including histograms, box plots, and dot plots. Students learn to identify the most appropriate display for different data types and describe the shape of distributions.
A baseline assessment designed to identify student gaps in data interpretation, display construction, and statistical reasoning. Includes a variety of item types to gauge prior knowledge of histograms, box plots, and measures of center.
A comprehensive summative assessment covering all factoring and solving methods learned throughout the intervention sequence.
Connect algebraic solutions to graphical features like x-intercepts and vertices, providing a visual justification for the different solving methods.
Use the Quadratic Formula as a universal tool for solving any quadratic equation, with a focus on calculating the discriminant to predict solution types.
Learn to complete the square using area models to solve equations and prepare for vertex form, emphasizing the geometric interpretation of the procedure.
Apply factoring skills to solve quadratic equations using the Zero Product Property, bridging the gap between expressions and equations.
Master factoring trinomials of the form x^2 + bx + c and ax^2 + bx + c using the "X-box" or diamond method for visual scaffolding.