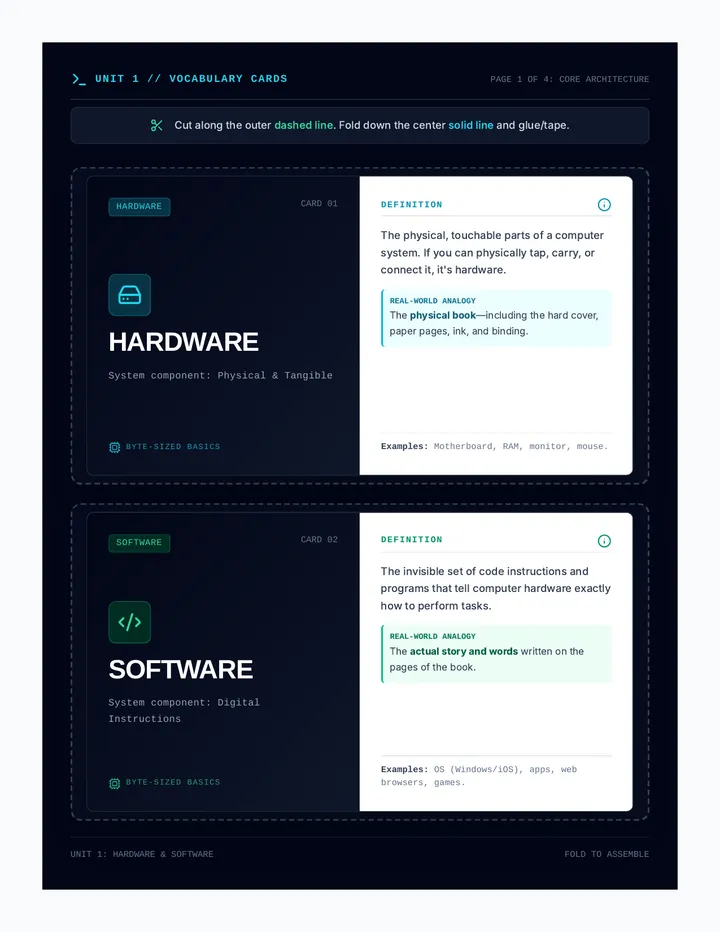
Students analyze the operational side of a business by listing the physical, intellectual, and human resources required. They distinguish between what a business 'has' versus what a business 'does'.
Une évaluation complète sur les interactions et les forces pour le niveau 4ème, incluant des diagrammes objets-interactions et des tracés de vecteurs.
A comprehensive 90-minute lesson on DNA, genes, chromosomes, and genetic crosses. Students explore the 'Blueprint of Life' through chunked instruction, Think-Pair-Share discussions, and hands-on modeling stations.
A comprehensive lesson exploring the three primary types of symbiotic relationships: mutualism, commensalism, and parasitism. Students analyze animal interactions through task cards, case studies, and visual organizers.
Teachers learn to break complex tasks into smaller, manageable steps using classroom routines and Iowa Core standards as examples.
An extra credit project challenging students to live plastic-free for two weeks while researching the impacts of bioaccumulation and exploring sustainable alternatives. Students document their journey and findings in a formal scientific lab report.
Students learn to craft compelling marketing messages by developing a Value Proposition using a specific formula and applying visual text hierarchy principles to design website 'Hero Text'.
Students finalize their Unit 3 Portfolio, checking for technical errors and exporting their report as a professional PDF for final submission.
Students synthesize their Unit 3 research by creating a professional Market Analysis Report, integrating personas and charts from previous lessons.
Students learn the fundamentals of financial forecasting, calculating revenue vs. profit, and using absolute cell referencing ($) to project business growth over time.
Students learn to transform raw spreadsheet data into impactful Pie and Bar charts to visualize market trends and customer intent.
Students learn to use sorting, filtering, and conditional formatting in Google Sheets to identify target audience trends and organize large datasets efficiently.
Students transition from data entry to data analysis by learning essential Google Sheets formulas like =SUM, =AVERAGE, and =COUNT, as well as the efficiency of the Fill Handle.
Students gain 'x-ray vision' over large datasets by learning to sort and filter information. They explore conditional formatting to visualize trends and identify specific target segments within their market research data.
Students transition from data entry to data analysis by mastering fundamental spreadsheet formulas. They learn the power of the equals sign, cell referencing, and essential functions like =SUM, =AVERAGE, and =COUNT to automate business calculations.
Students explore the efficiency of automated data collection by linking their market research forms to live spreadsheets. They learn the concept of real-time data syncing and master the 'Freezing Rows' skill to manage large datasets effectively.
Students learn the art of professional survey design to gather market intelligence. They distinguish between quantitative and qualitative data, identify biased questioning, and build a multi-format survey in Google Forms or Microsoft Forms to collect clean data from their target audience.
This lesson introduces students to the fundamental structure of spreadsheet software. They learn about cells, rows, columns, and addresses while performing basic data entry and formatting to align with their brand identity.