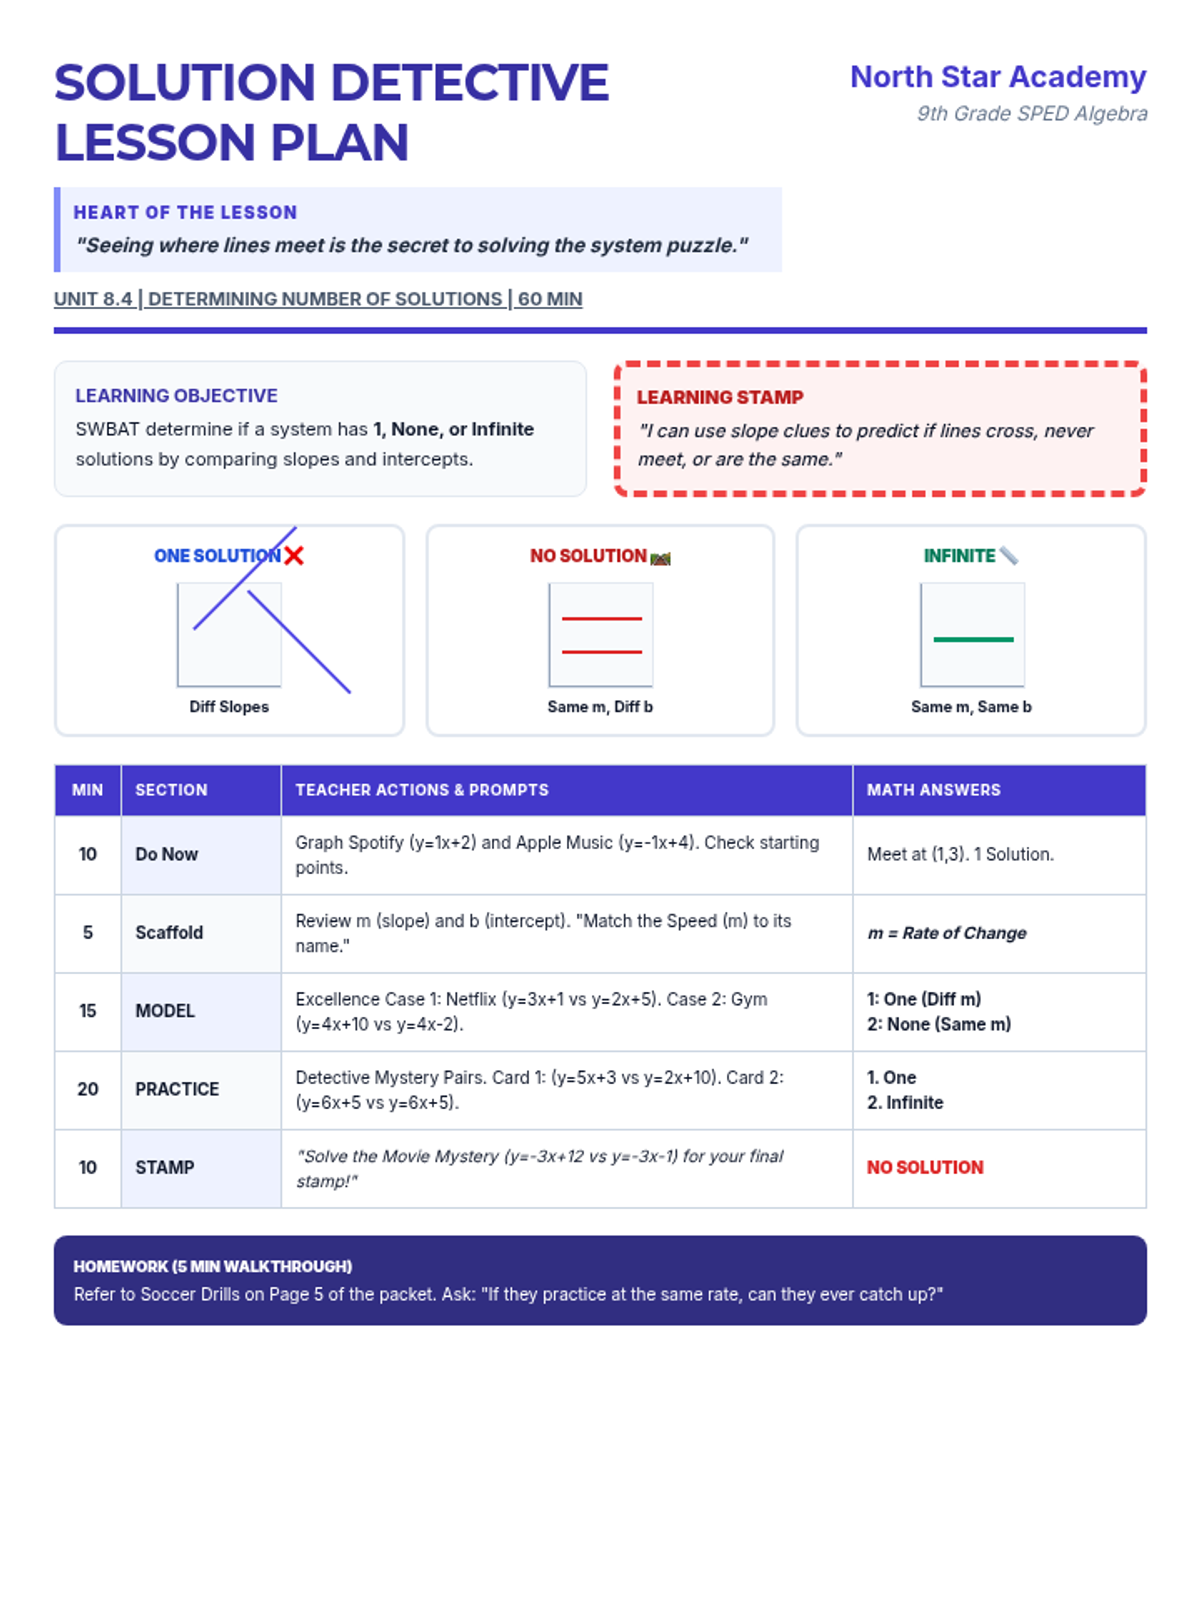
Students master ratios and proportions by scaling recipes for a community feast, applying unit rates to calculate costs and manage kitchen logistics.
A 9th grade Algebra lesson focused on identifying the number of solutions in a system of linear equations (one, none, or infinite), specifically designed for Special Education students with IEP supports.
A comprehensive introduction to graphing quadratic functions using tables of values and identifying key features like the vertex and axis of symmetry.
A focused lesson on converting rational numbers from fractions to their decimal expansions, including both terminating and repeating decimals. Students will use long division to discover patterns and represent repeating decimals using bar notation.
A lesson focused on mastering 3-digit by 1-digit long division with remainders through step-by-step practice and problem-solving.
Covers division of radicals and the essential skill of rationalizing denominators using both monomial and binomial (conjugate) methods.
Focuses on the multiplication of radical expressions, including the distributive property and FOIL with binomial radicals.
Covers the fundamentals of simplifying radical expressions and performing addition and subtraction with like radicals, including variables and higher-order roots.
A targeted practice session focusing on SAT Math's Heart of Algebra section, covering linear equations, systems, and inequalities.
An introduction to basic probability using beaker volumes and colors. Students calculate the likelihood of specific events occurring in the lab.
Students explore mode and range by analyzing the frequency of control panel button presses. This lesson focuses on identifying the most common data point and the spread of the data.
Introduction to finding the mean and median using data from Dee Dee's disruptions in the laboratory. Students learn to calculate averages and identify the middle value in a set of data.
A project-based lesson where 6th-grade students apply decimal operations and percentage calculations to plan a week-long trip along the Texas Gulf Coast while staying within a strict budget.
Students step into the roles of carnival game designers to explore data analysis and statistics. They calculate theoretical probability, conduct trials to find experimental probability, and analyze their results in a festive, hands-on environment.
Students act as urban planners using systems of linear inequalities and area optimization to design a sustainable city grid. This project-based lesson bridges algebra and real-world infrastructure planning.
Students synthesize their knowledge of central tendency and probability to complete a final laboratory assessment.
Students use station rotations to explore probability and frequency through lab beaker measurements and control panel button analysis.
Students collect data on DeeDee's disruptions to learn and calculate the mean, median, and mode of a dataset.
A comprehensive evaluation tool for 7th-grade teachers to determine student readiness for 8th-grade Algebra 1 based on MCAS and iReady data.
A quick practice session for students to master area and perimeter of simple rectangles using a drafting-themed layout.
In this lesson, students become packaging engineers for a modern logistics company. They apply 3D geometry concepts—specifically surface area and volume of rectangular prisms—to design efficient shipping containers that minimize material waste and maximize storage capacity.
A colorful, interactive introduction to basic statistics using the theme of a gumball machine. Students learn to collect data, calculate measures of central tendency, and determine probability through guided and independent practice.
Students explore dividing unit fractions by whole numbers and vice versa by portioning dough and serving individual slices.
Students apply multiplication strategies to determine ingredient amounts and calculate the area of rectangular baking sheets.
Students learn to interpret fractions as division by sharing pizzas and loaves of bread equally among friends and customers.
A comprehensive introduction to converting between exponential and logarithmic forms, aligned with Texas TEKS 2A.5.C. Students will explore the inverse relationship through guided notes, scaffolded practice, and a formal assessment.
A lesson focused on organizing data using frequency tables and calculating the probability of Tom's trap success and Jerry's escapes.
A lesson focused on visualizing data through dot plots and histograms, themed around Jerry's escape routes and Tom's pursuit durations.
A statistics packet for freshman students themed around the classic chases of Tom and Jerry, covering central tendency, data visualization, and probability.
A high-energy, low-prep Math BINGO game where students solve one-step equations to crack codes and win. Includes a slide presentation for game delivery, a student bingo sheet with answer bank, and a teacher answer key.
A lesson exploring sampling distributions, the Central Limit Theorem, and the real-world applications of random sampling as a strategic tool.
A math lesson focused on graphing ordered pairs in all four quadrants of the coordinate plane to reveal a hidden picture of a smiling sun.
In this lesson, students will learn to plot points on a coordinate plane to create geometric shapes. They will calculate side lengths and area based on the plotted vertices, focusing on polygons in all four quadrants.
A functional math lesson focused on adding two menu items using a calculator within the context of a digital fast food ordering app. Students practice selecting items from a McDonald's-themed menu and totaling their purchases.
Students explore the intersection of geometry and botany by creating 'fractal gardens' using paper and repeating patterns. They learn how simple mathematical rules of iteration generate the complex structures found in ferns, trees, and flowers.