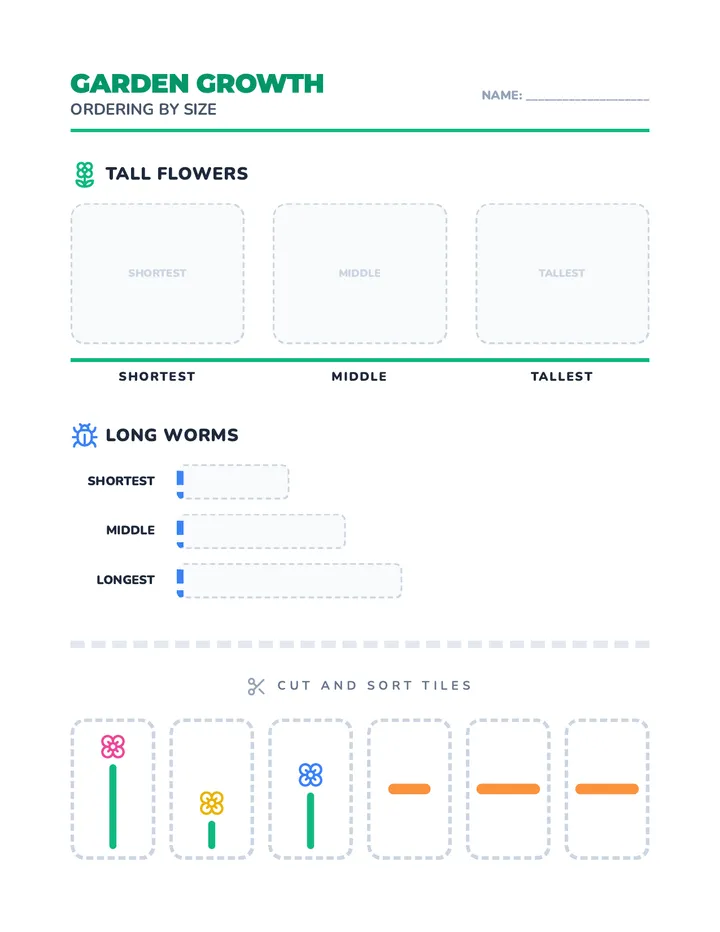
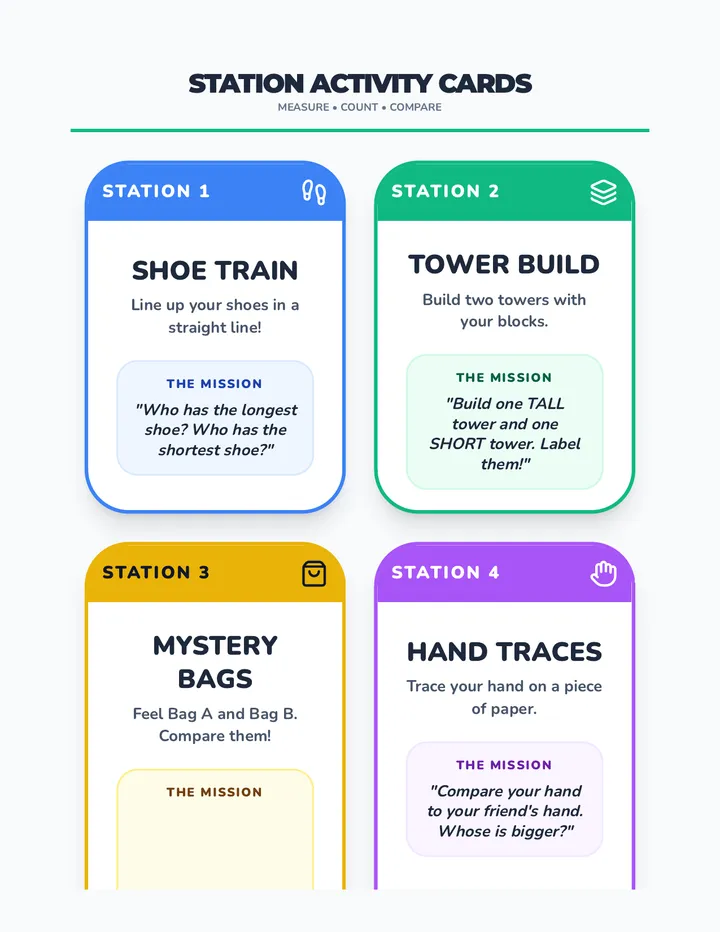
Living Graphs
A hands-on introduction to data visualization for Kindergarten students, moving from concrete physical objects and human movement to pictorial representations. Students build towers, sort shoes, and create human graphs to understand how lining things up helps us compare quantities.