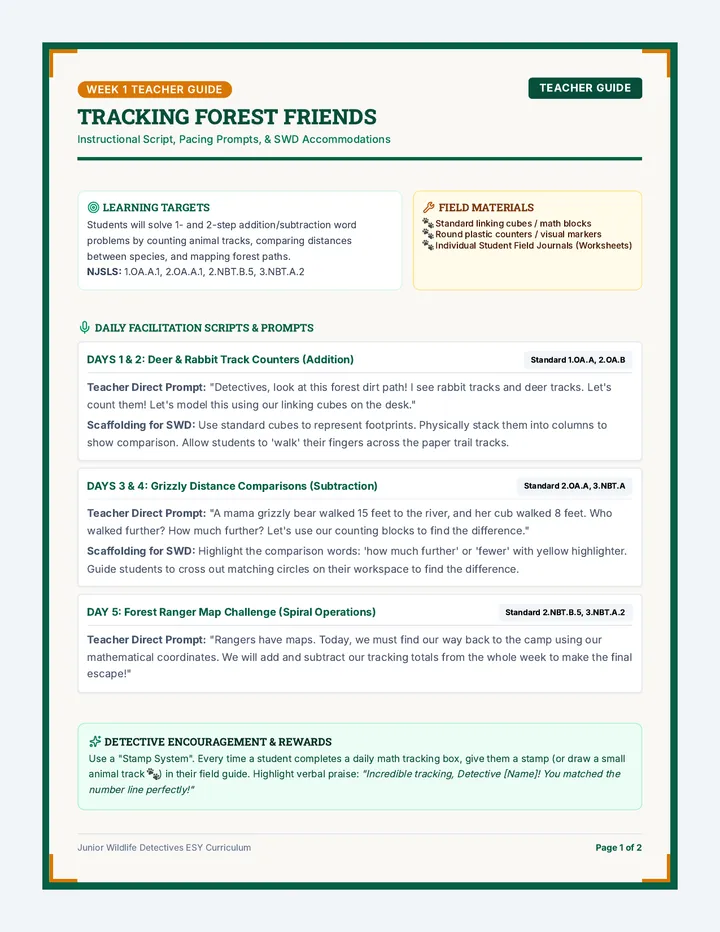
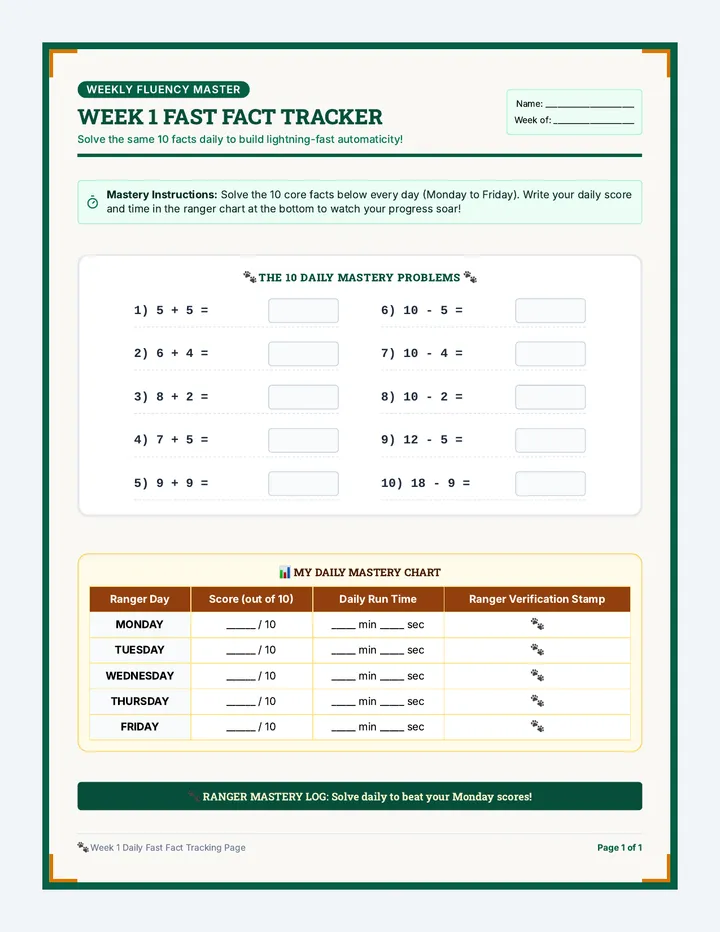
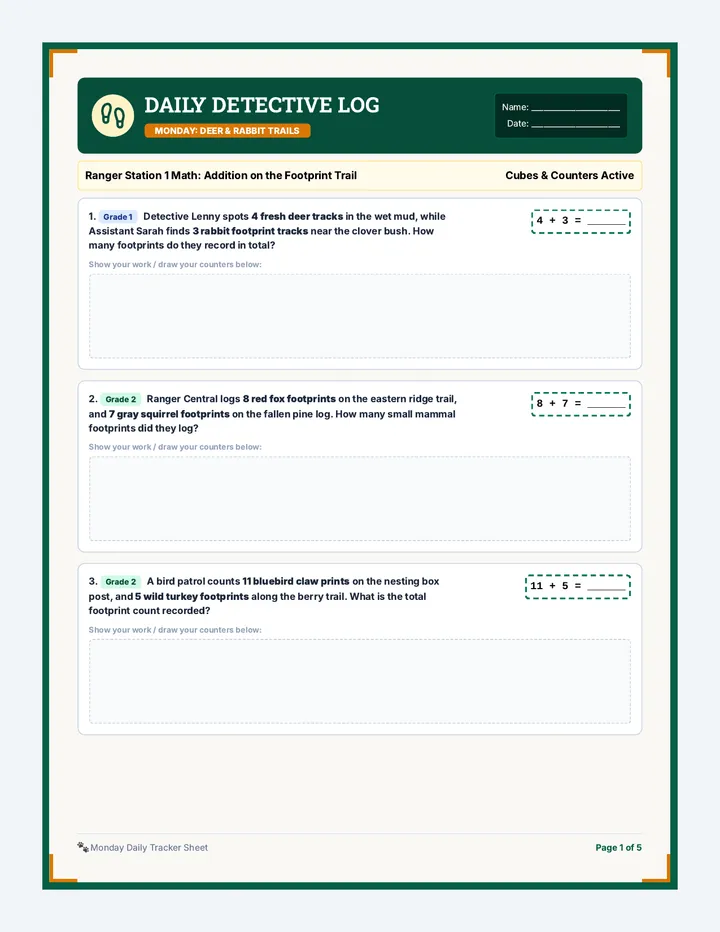
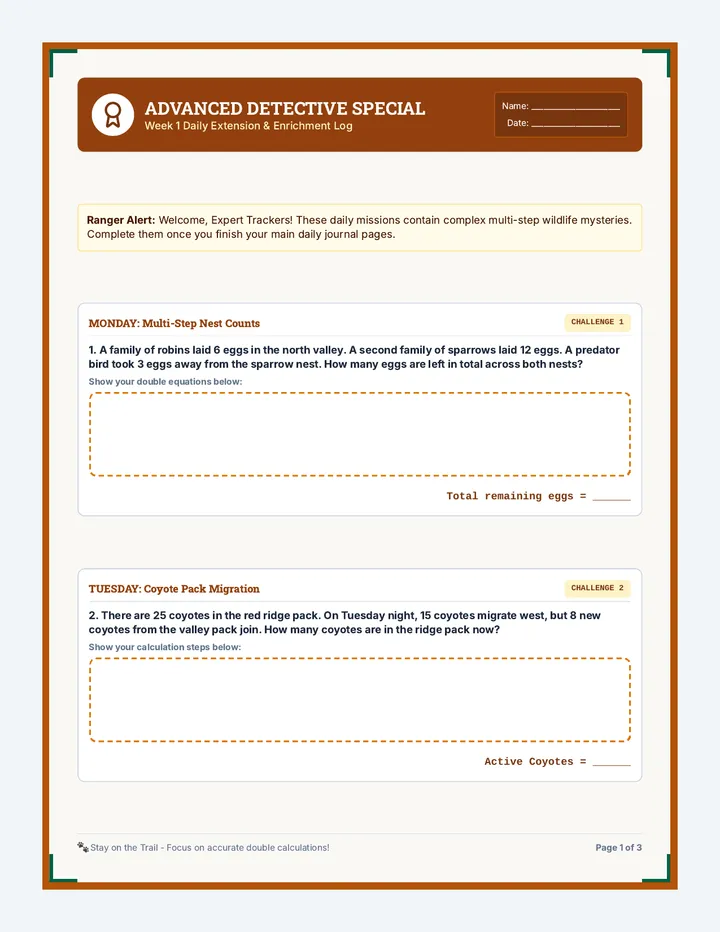
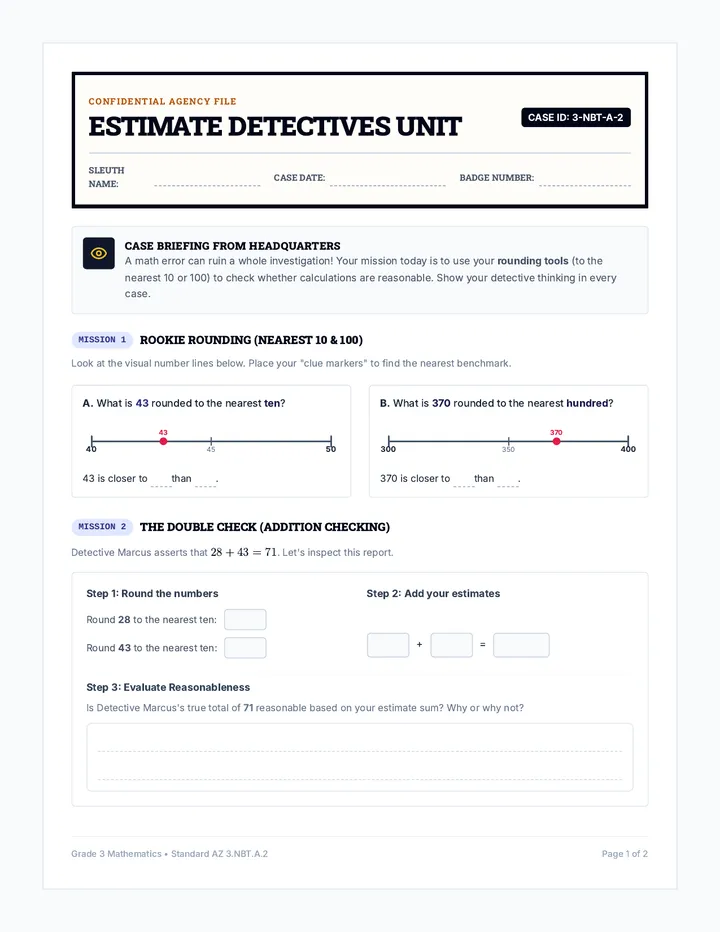
Data Detectives Comparing Data
A comprehensive 1st Grade sequence focused on interpreting and comparing data using pictographs and bar graphs. Students learn to identify extremes, calculate totals, and solve complex 'how many more/fewer' comparison problems through the lens of a 'Data Detective' mystery theme.