A Tier 2 intervention lesson focusing on using inverse trigonometric functions to solve engineering and physics problems, with a heavy emphasis on technology integration and contextual interpretation.
A comprehensive summer bridge workbook for rising 8th graders transitioning to Algebra 1. Contains review of prerequisite topics, advanced pre-algebra skills, real-world application, and an Algebra Escape Challenge.
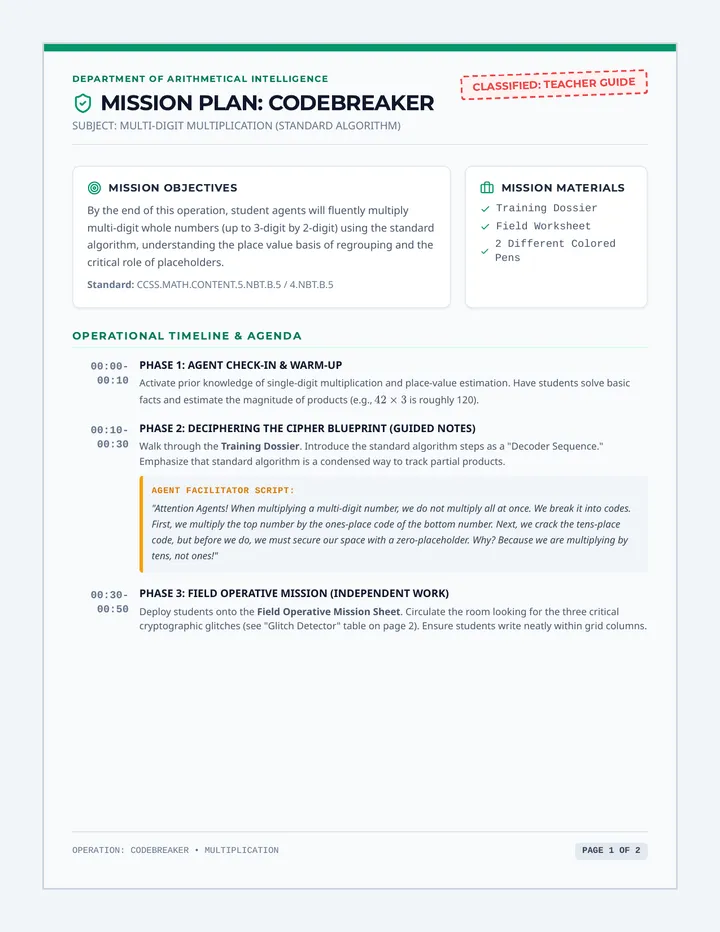
A covert-agent themed math lesson focusing on mastering the multi-digit whole number multiplication standard algorithm. Students step into the shoes of cryptography agents to learn, practice, and apply regrouping procedures.
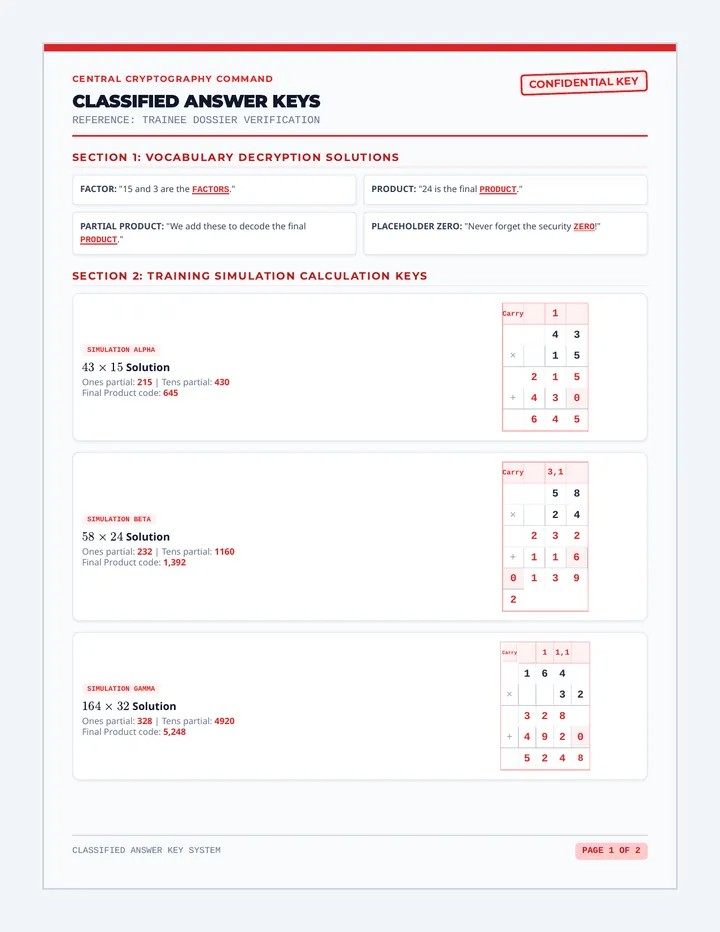
A teacher-facing 2-page answer key showing completed ciphers, filled vocabulary terms, and detailed grid calculations in high-contrast red ink for quick assessment of student dossiers and worksheets.
A high-intensity, 120-minute math simulation. Students act as lead consultants, completing a high-speed skill warmup before selecting a professional sector (Music, Urban Planning, Rocket Science, or Sports Analytics) to solve a series of complex work orders.
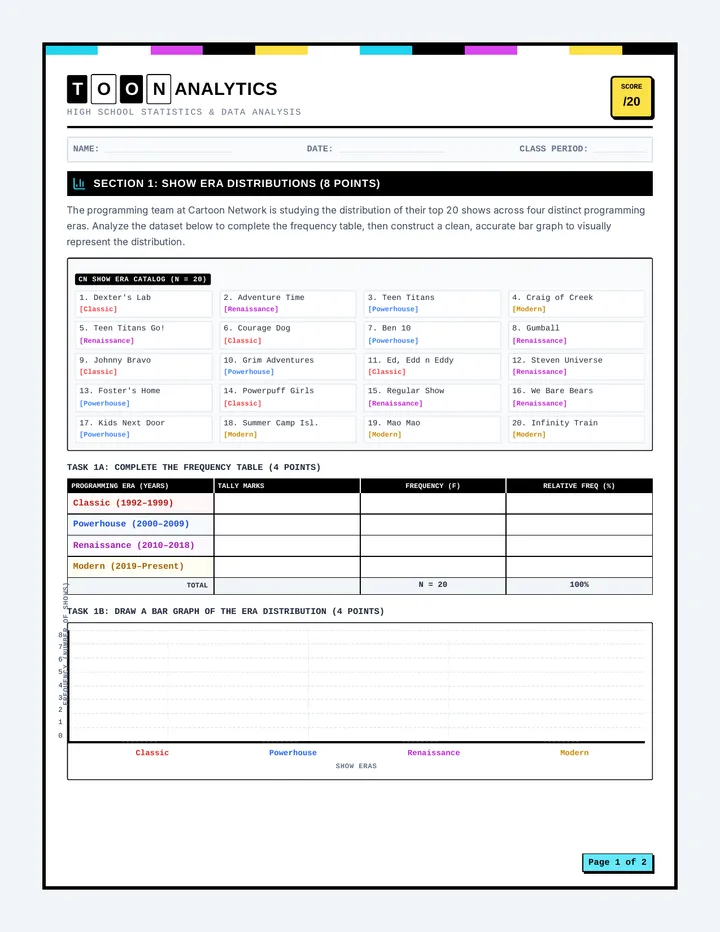
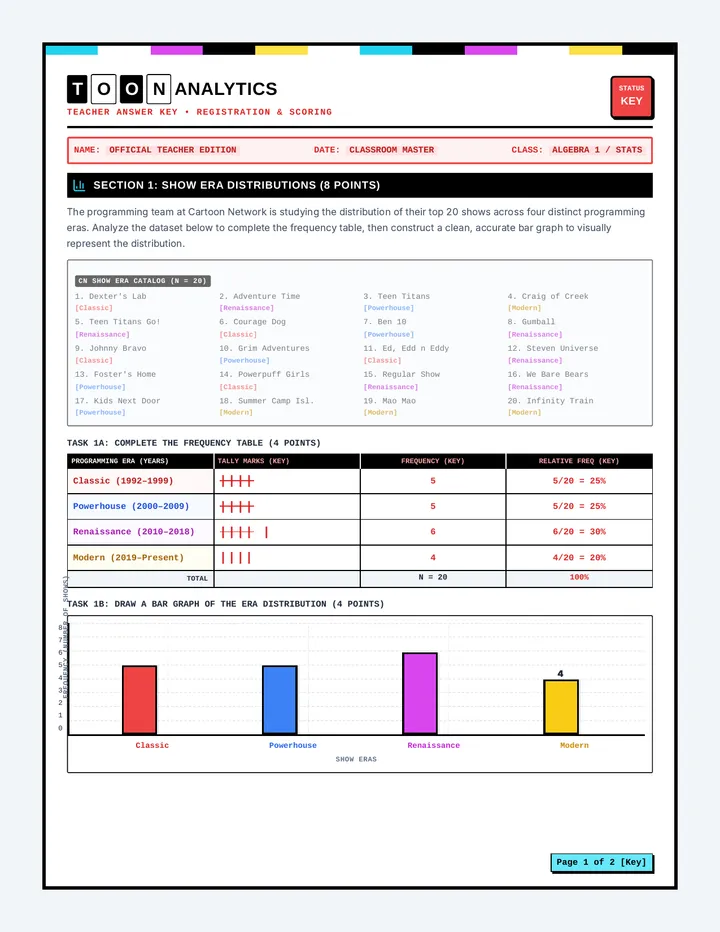
A high school statistics lesson that applies concepts of data representation, probability, and outlier analysis to Cartoon Network shows across different eras.
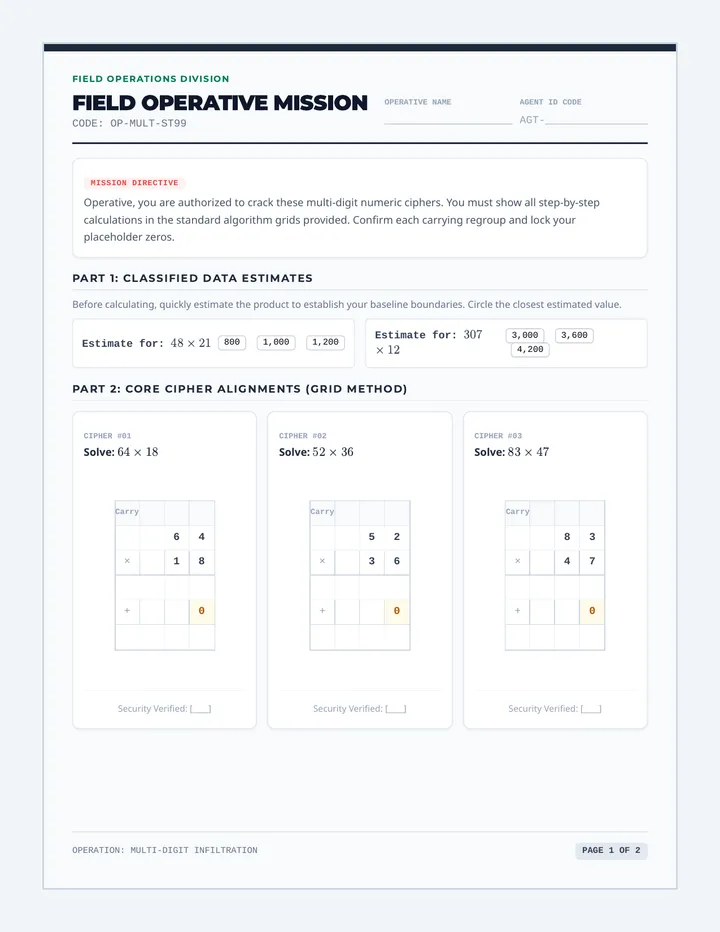
A student-facing 2-page independent practice worksheet themed as an espionage field operations sheet. Features scaffolded grid problems, real-world agent word problems, and self-reflection metrics.
A 4-week math workbook and instructional sequence themed around outer space exploration, specifically designed for middle school students with disabilities (SWDs) working at an early 1st-grade level. Features embedded touch-points, base-ten icons, visual number paths, and age-appropriate space exploration visuals to teach single-digit operations, place value, and patterns.
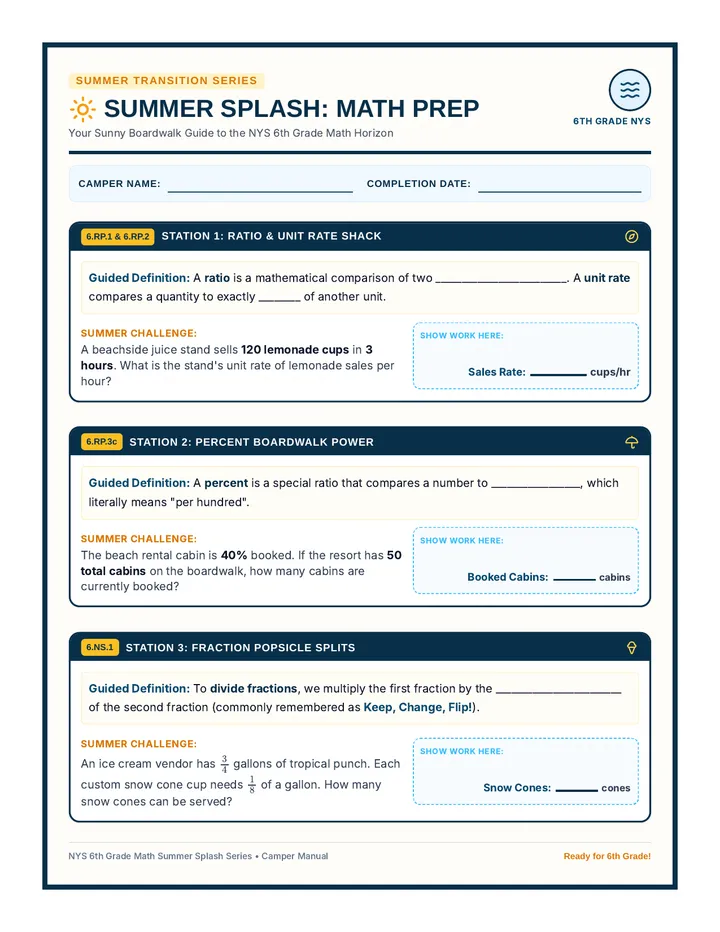
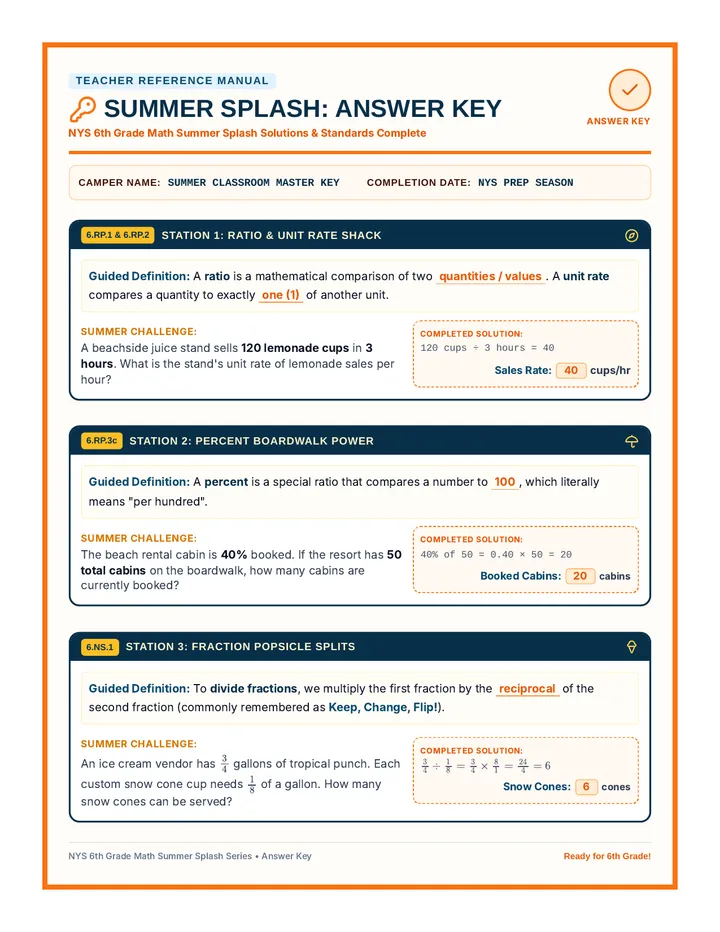
A transitional math prep lesson for rising 6th graders entering the NYS math curriculum. It introduces key concepts across all major domains including Ratios & Proportions, the Number System, Expressions & Equations, Geometry, and Statistics through structured definition spaces and scaffolded example problems.
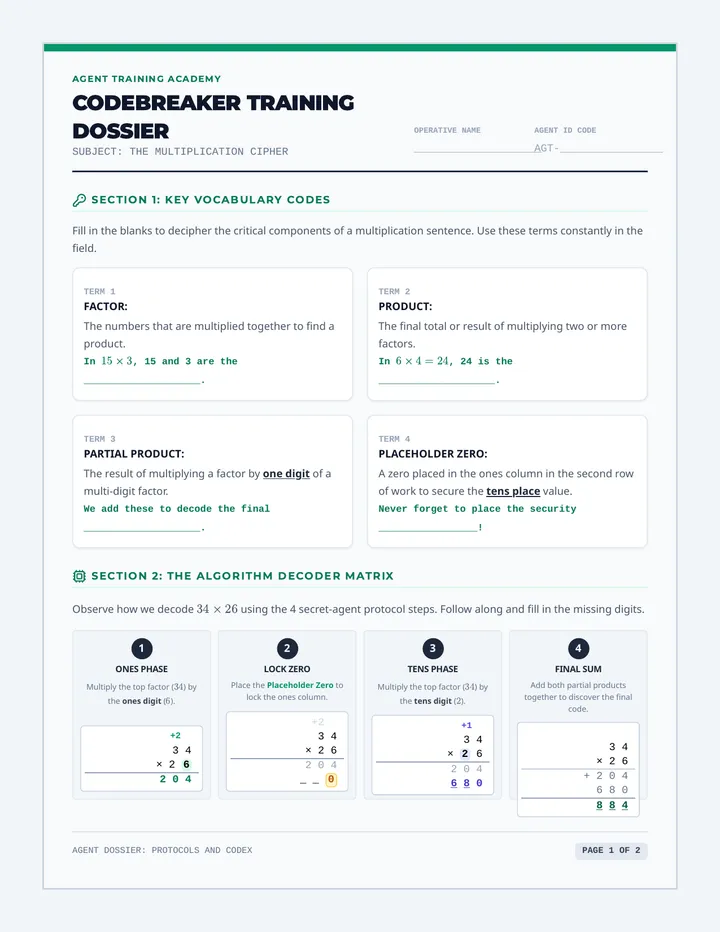
A student-facing 2-page guided notes packet modeled as an agent training dossier. Guides students through standard multiplication terms, a detailed step-by-step algorithm walkthrough using an interactive visual model, and scaffolded grid-aligned practice problems.
A 4-week intensive math intervention program set in a space exploration universe, designed for multi-grade students with disabilities in Grades 5–8. It covers additive thinking, place value, and decimal regrouping, anchored in Grades 4–6 standards with a Grade 5 core middle ground.
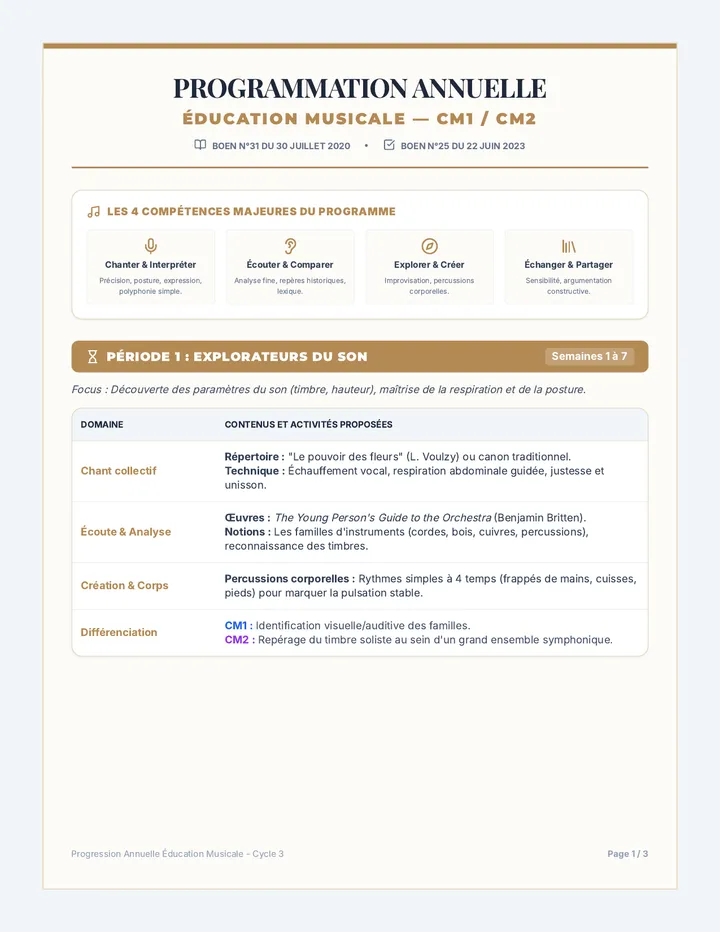
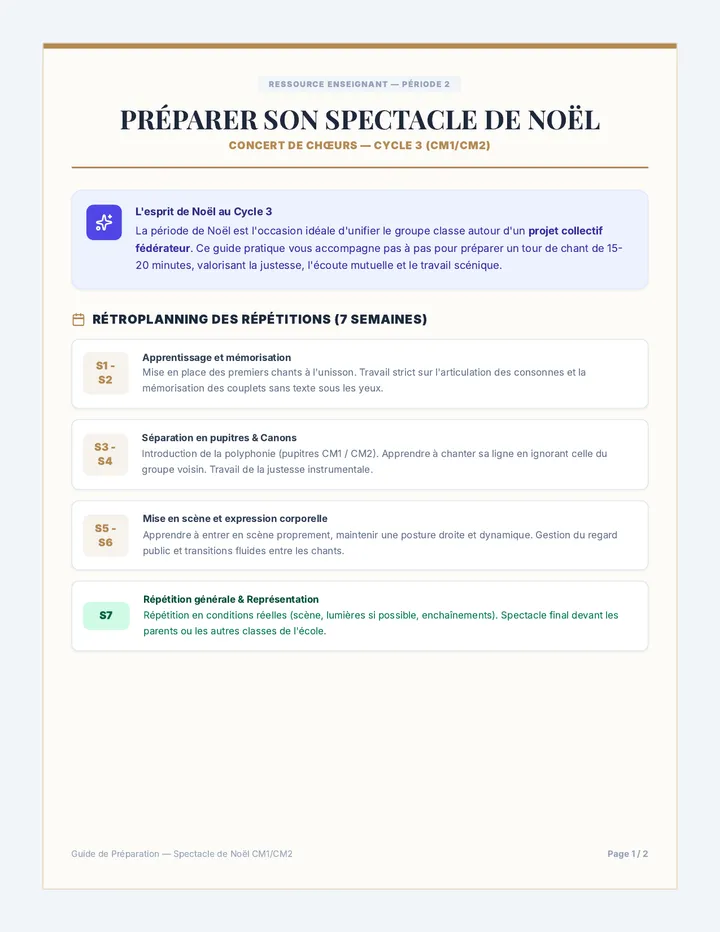
Progression annuelle d'éducation musicale pour le CM1/CM2 structurée en 5 périodes de 7 semaines, conformément aux repères ministériels.
A comprehensive 2-page lesson plan and pacing guide for teachers, designed around a secret agent theme to teach multi-digit multiplication using the standard algorithm. Includes learning objectives, structured pacing, step-by-step scripts, and differentiation tips.