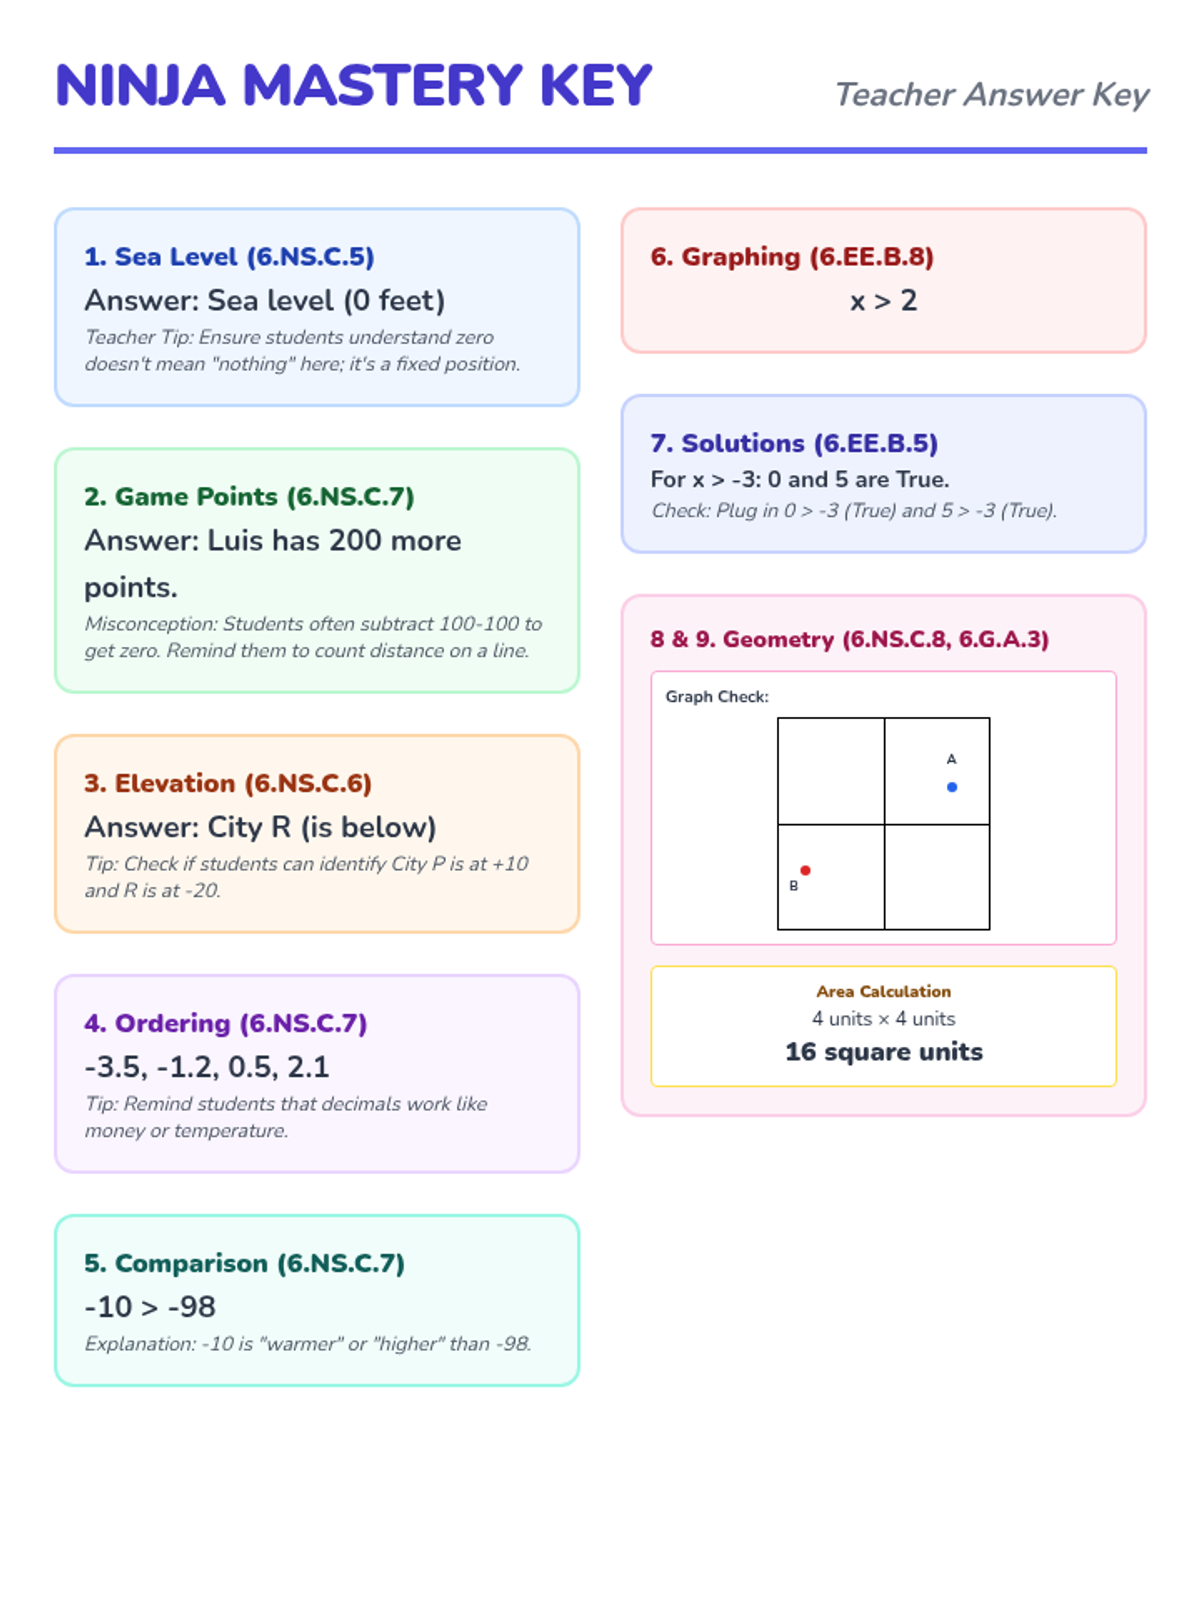
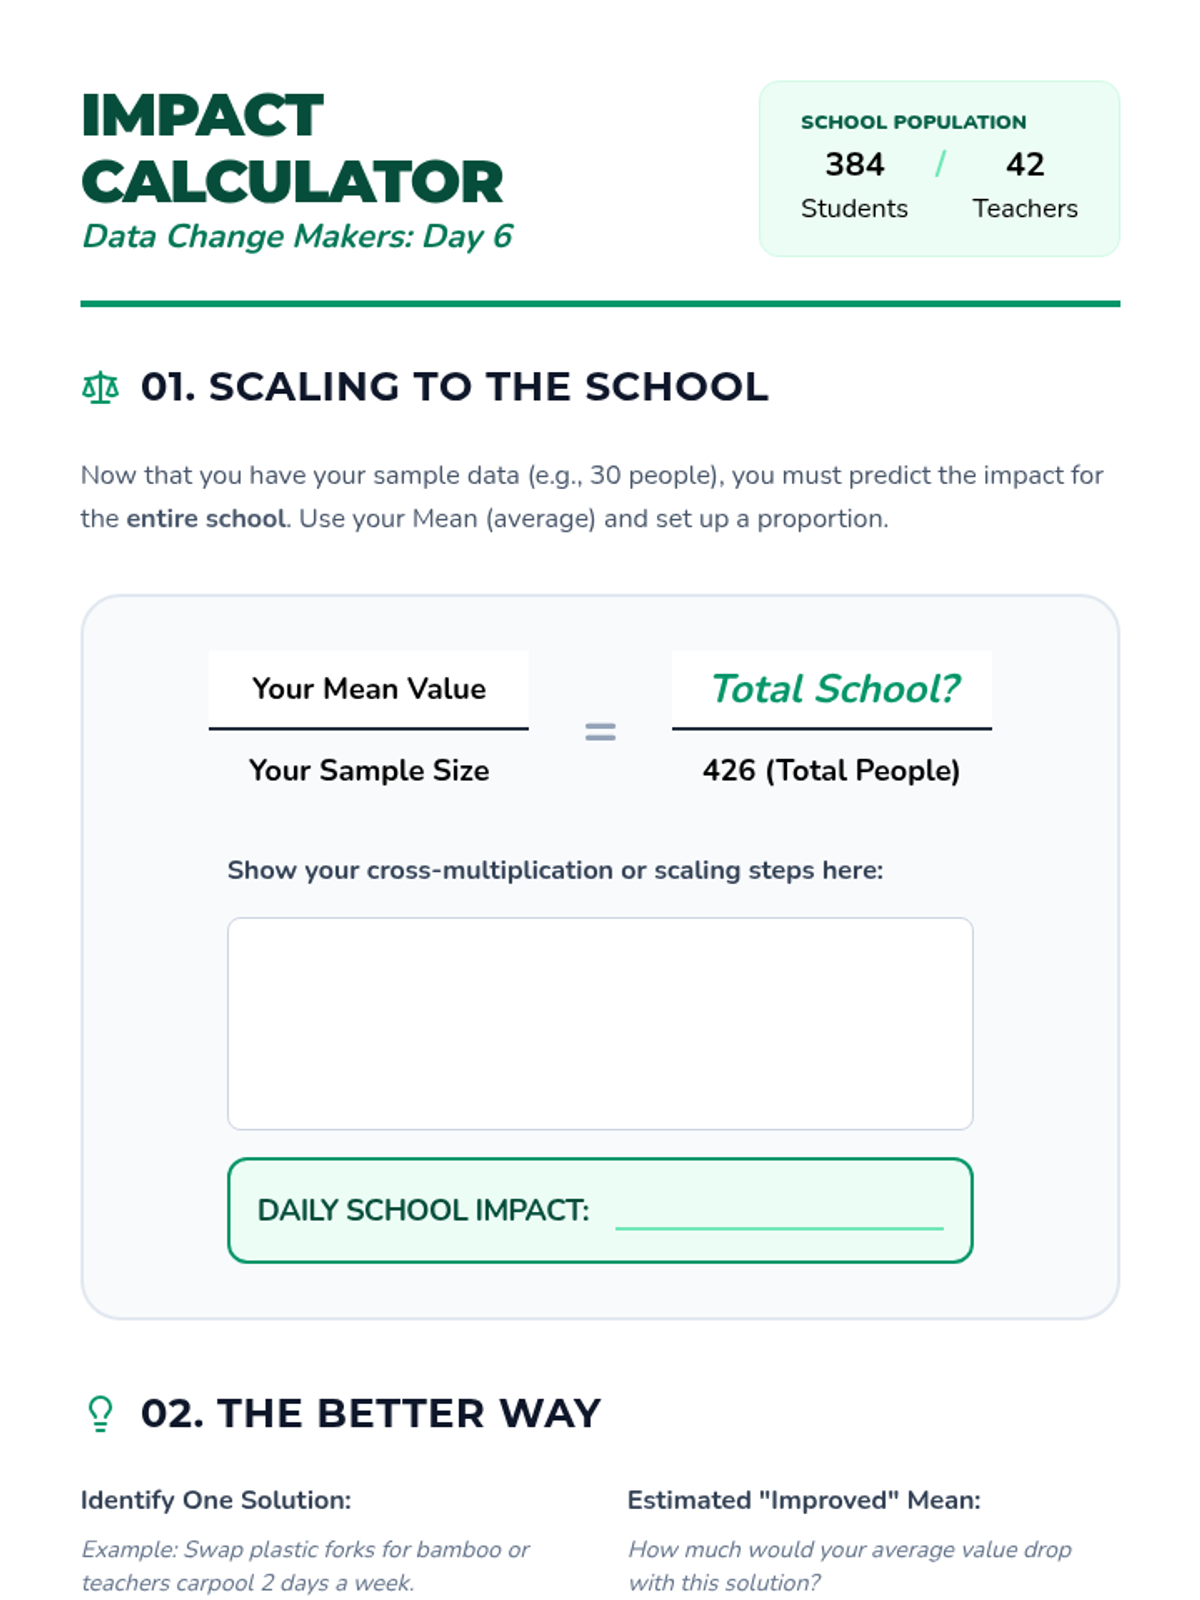
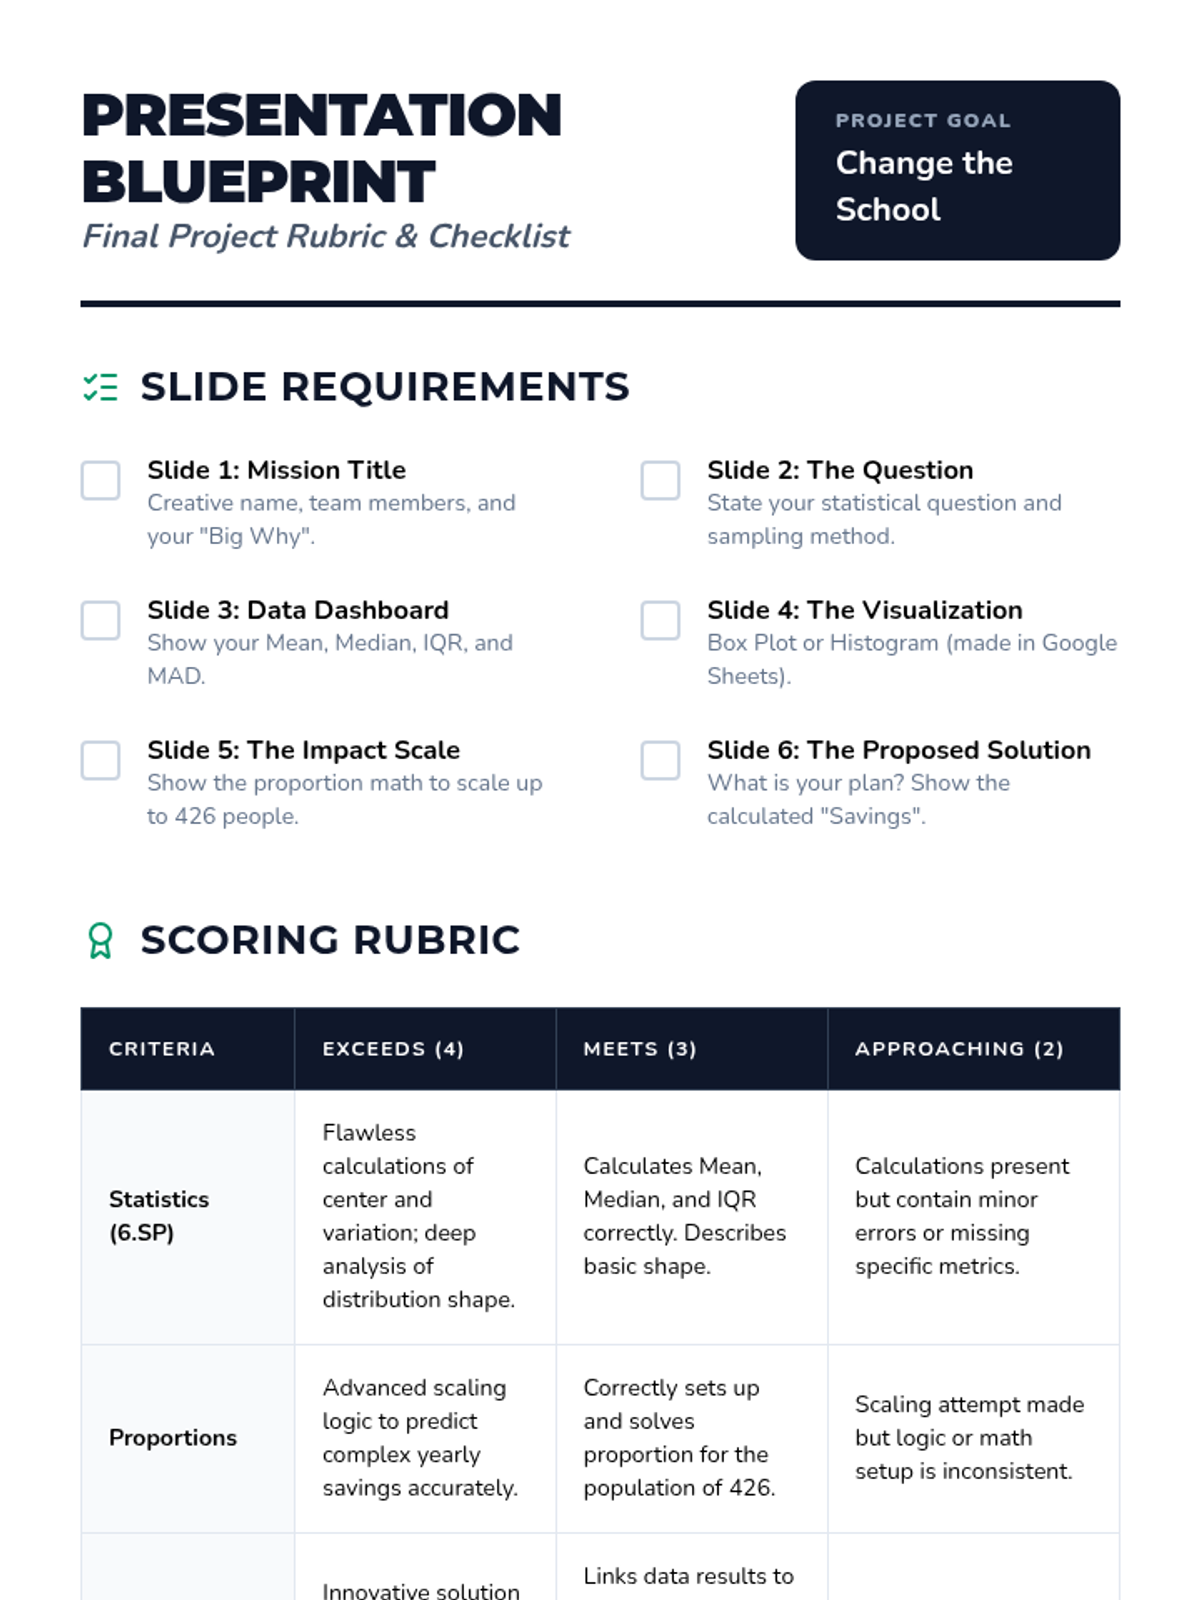
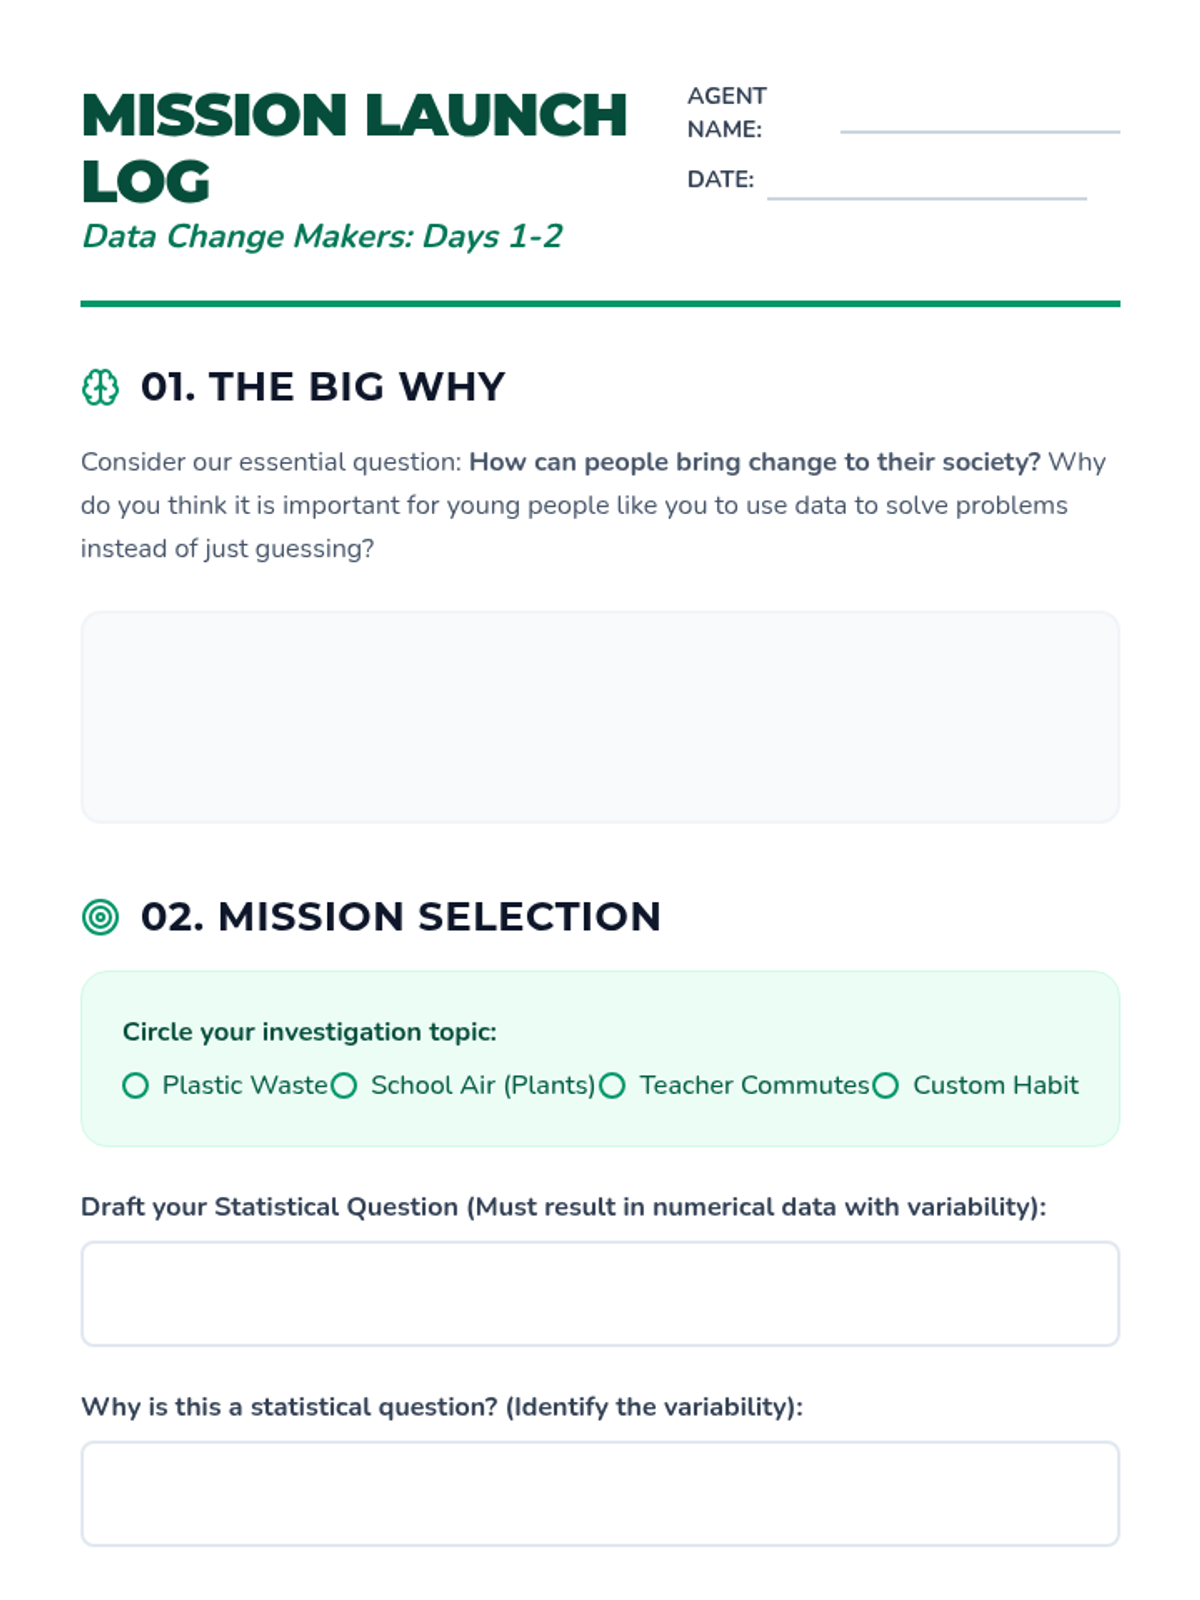
Students collect real-world data, analyze it using measures of center and variation, and create visual representations including box plots and histograms.
Students collect real-world data, analyze it using measures of center and variation, and create visual representations including box plots and histograms.