Focuses on using ratio tables to organize data and plotting those ratios as coordinates on a graph to visualize relationships.
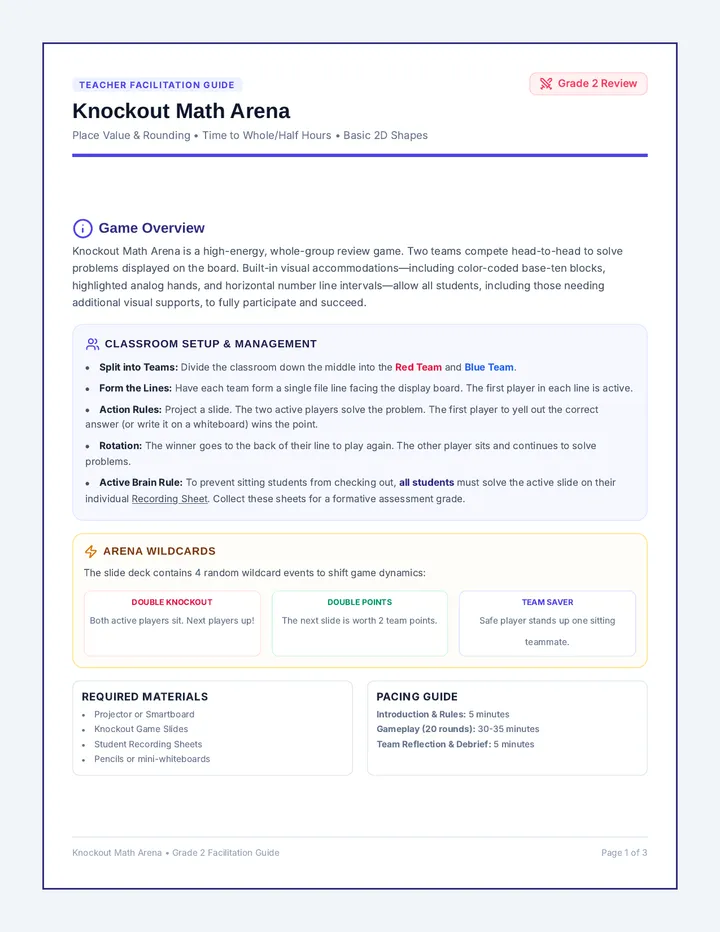
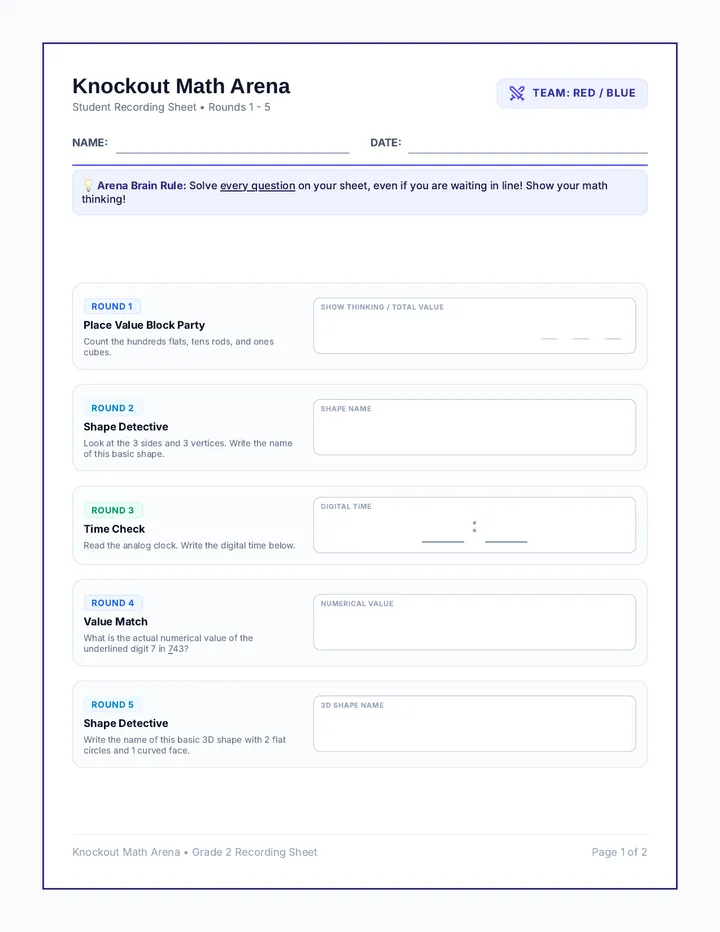
A high-energy, fast-paced review game targeting 2nd-grade place value, time, and geometric shape attributes. Includes a colorful slide deck, a comprehensive facilitation guide, and student recording sheets to keep the whole class engaged.
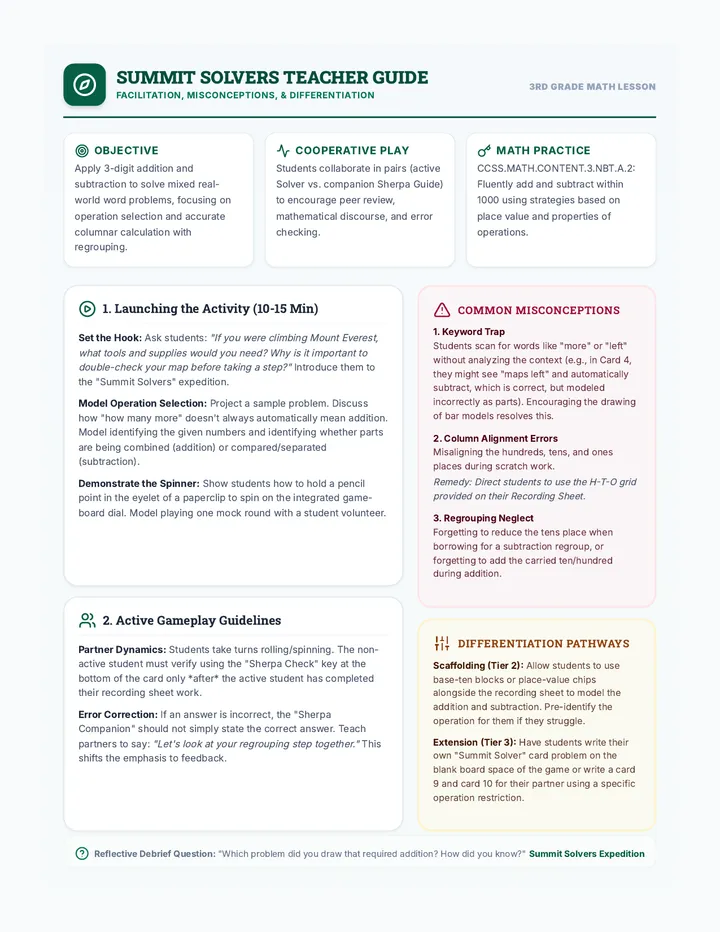
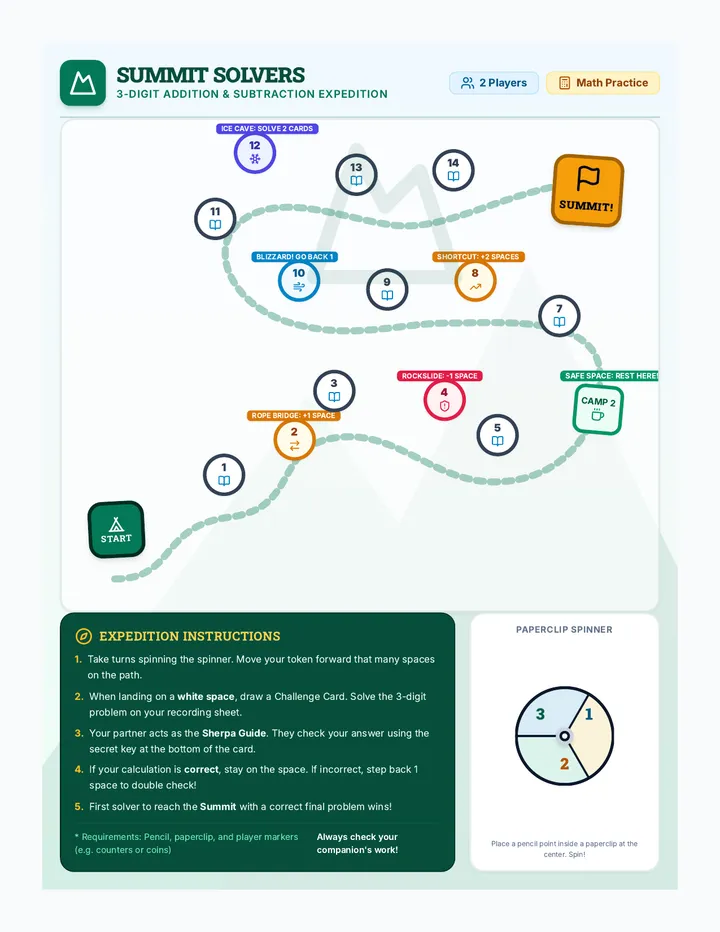
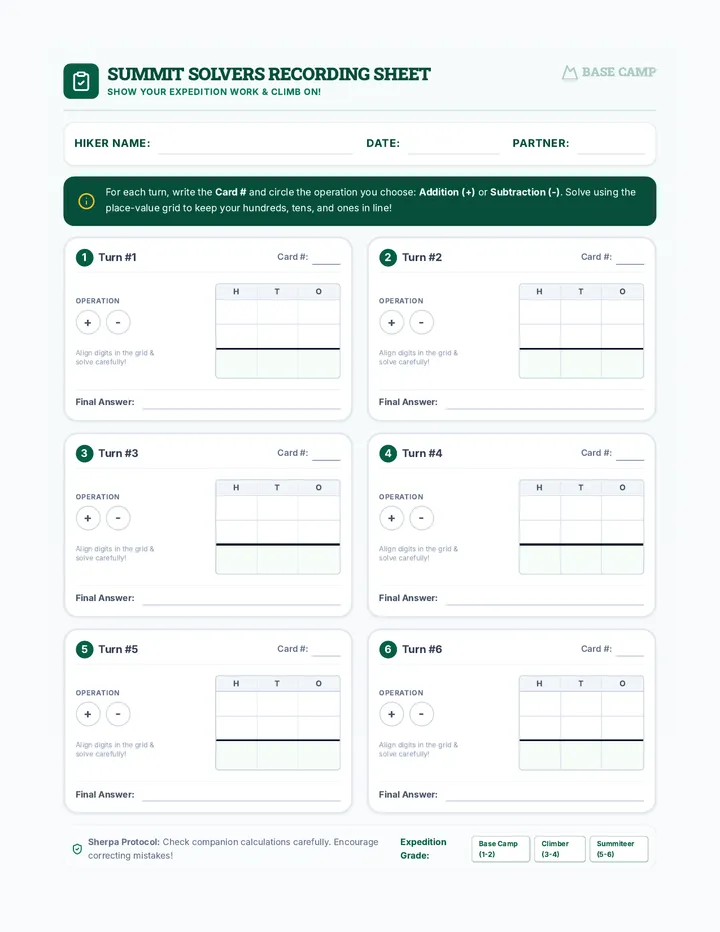
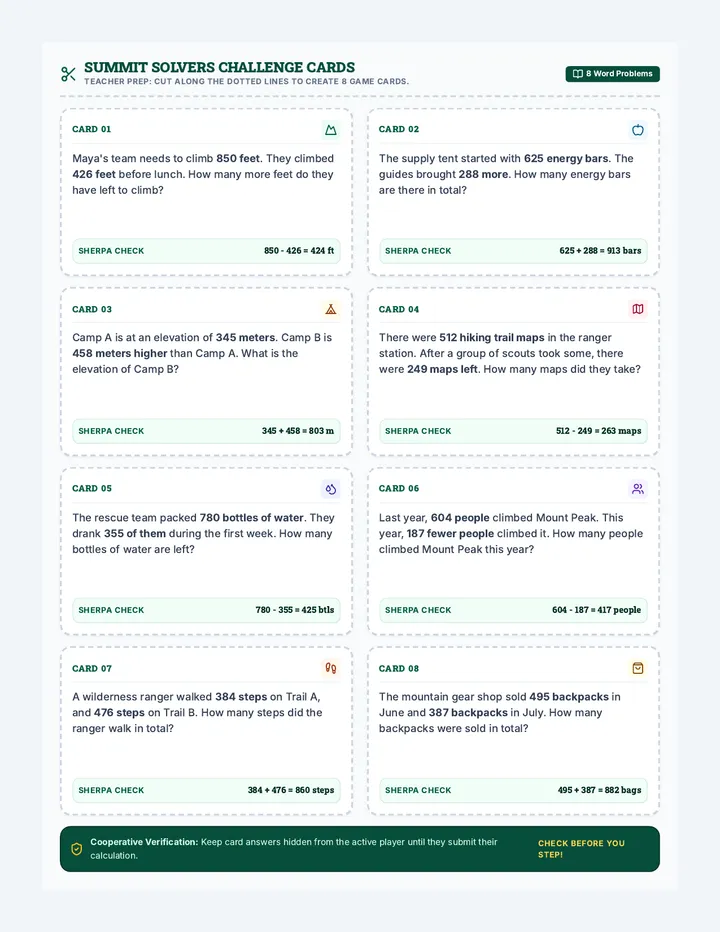
A collaborative third-grade board game focused on solving 3-digit addition and subtraction mixed word problems. Students climb a mountain by selecting correct operation, calculating precisely, and verifying answers with peer-checking challenge cards.
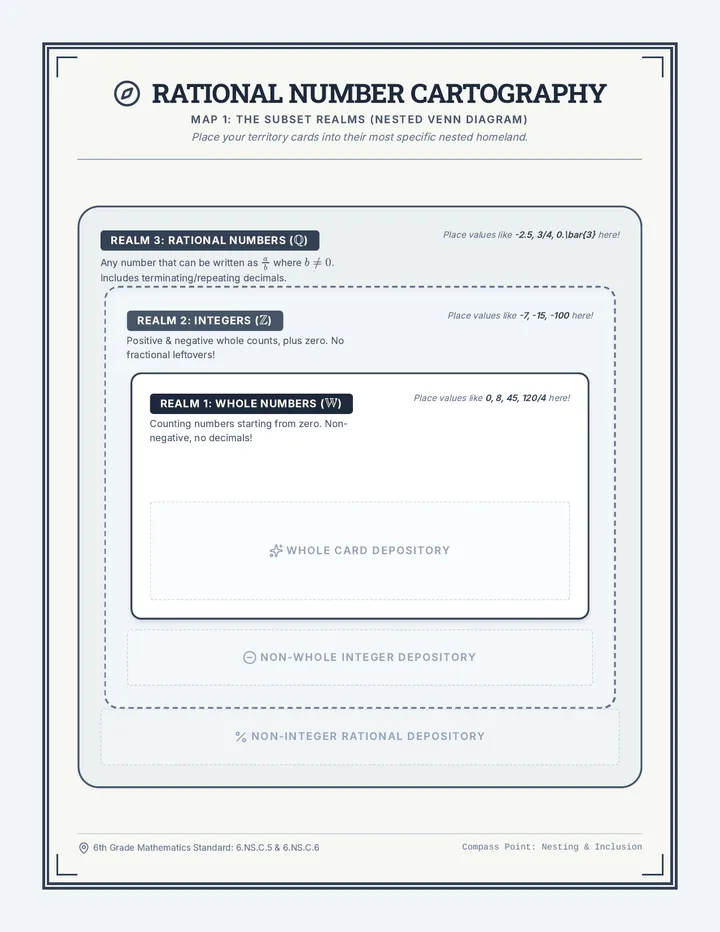
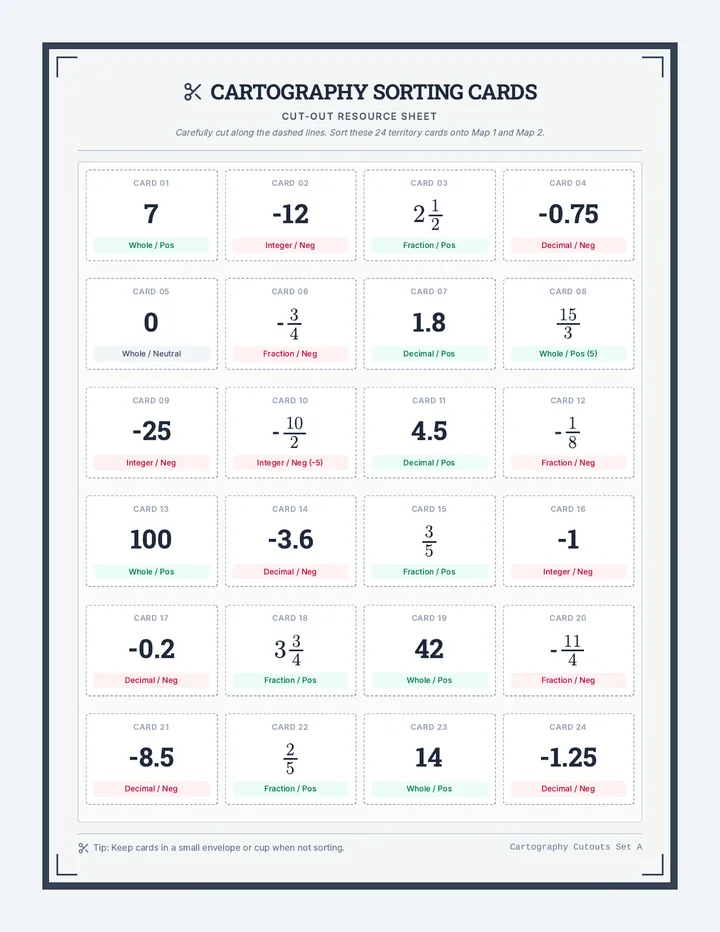
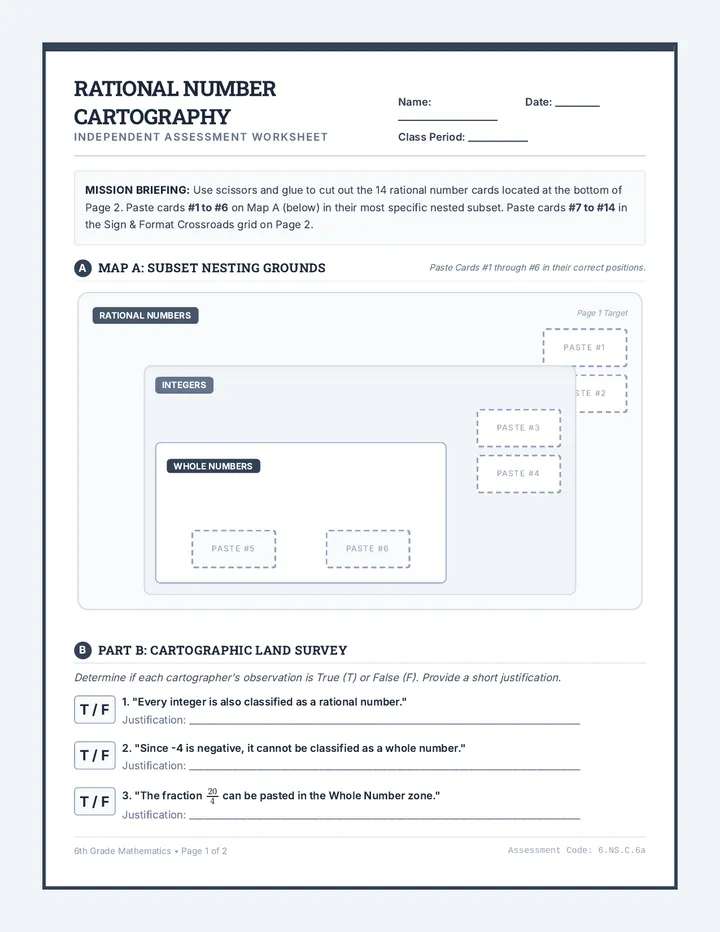
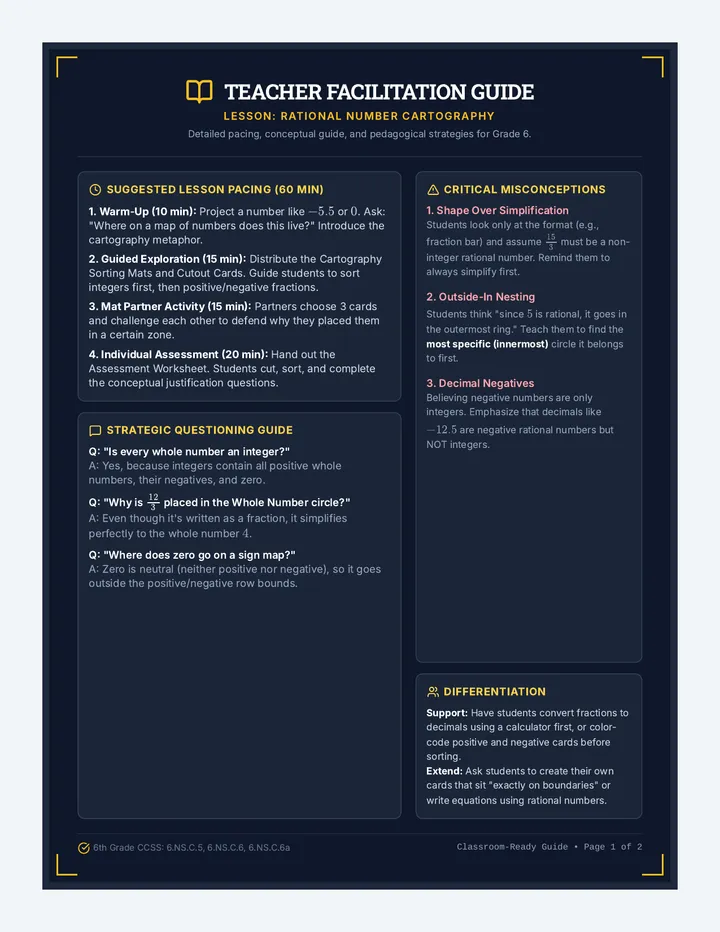
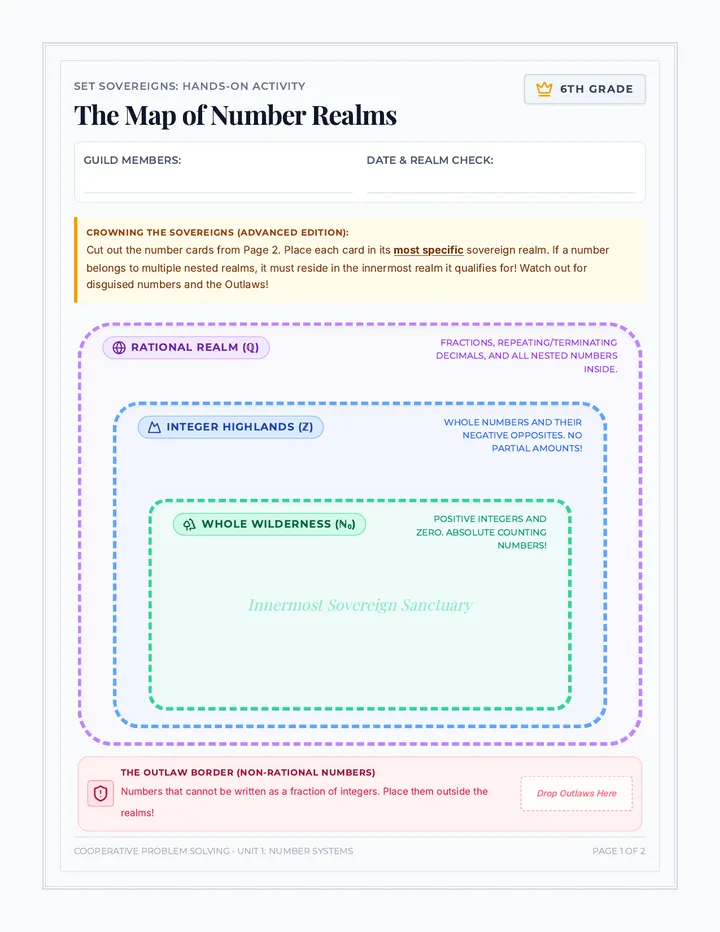
A hands-on, highly visual lesson where 6th-grade students explore the realm of rational numbers. Students use sorting mats, custom cut-out cards, and independent worksheets to classify numbers into nested subsets (Whole, Integers, Rational) and organize them by format and sign.
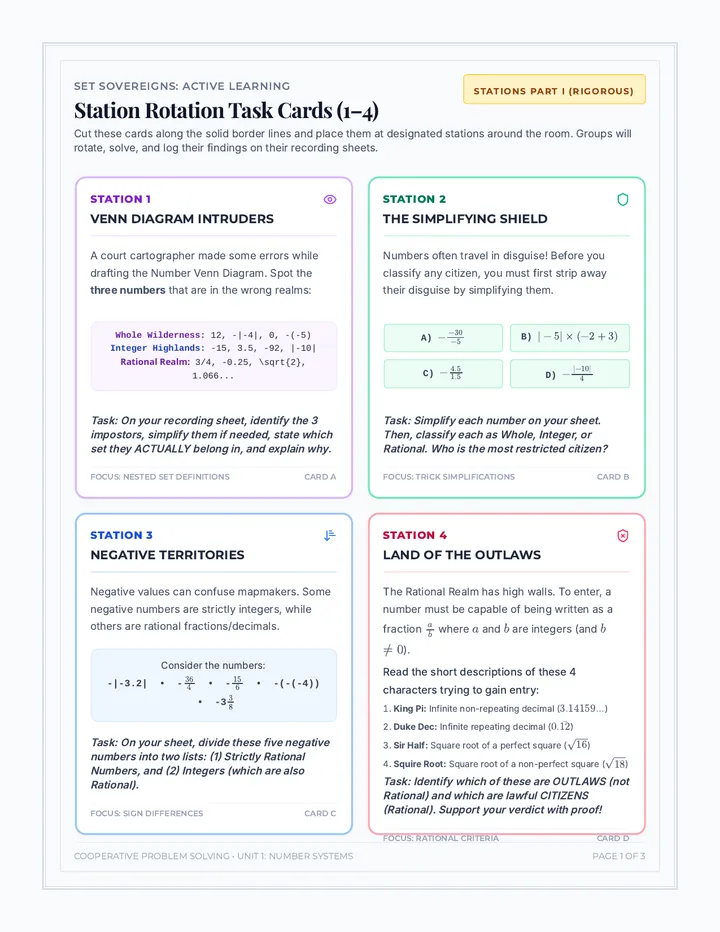
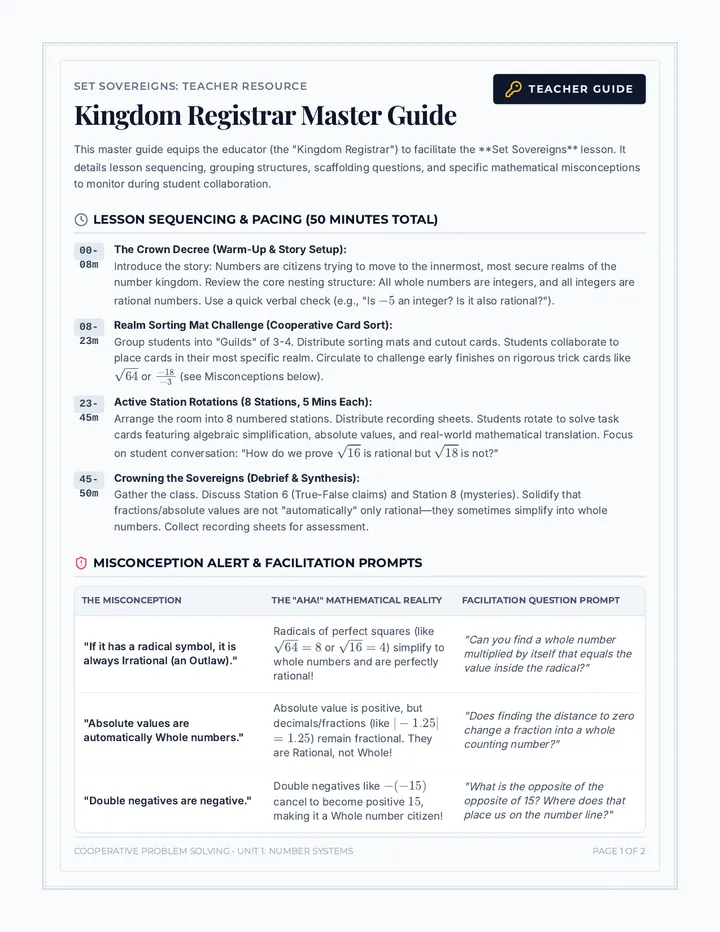
A hands-on, collaborative lesson where 6th-grade students master the nested relationships of the rational number system. Students explore whole numbers, integers, and rational numbers through an interactive card sort and active station rotation challenge.
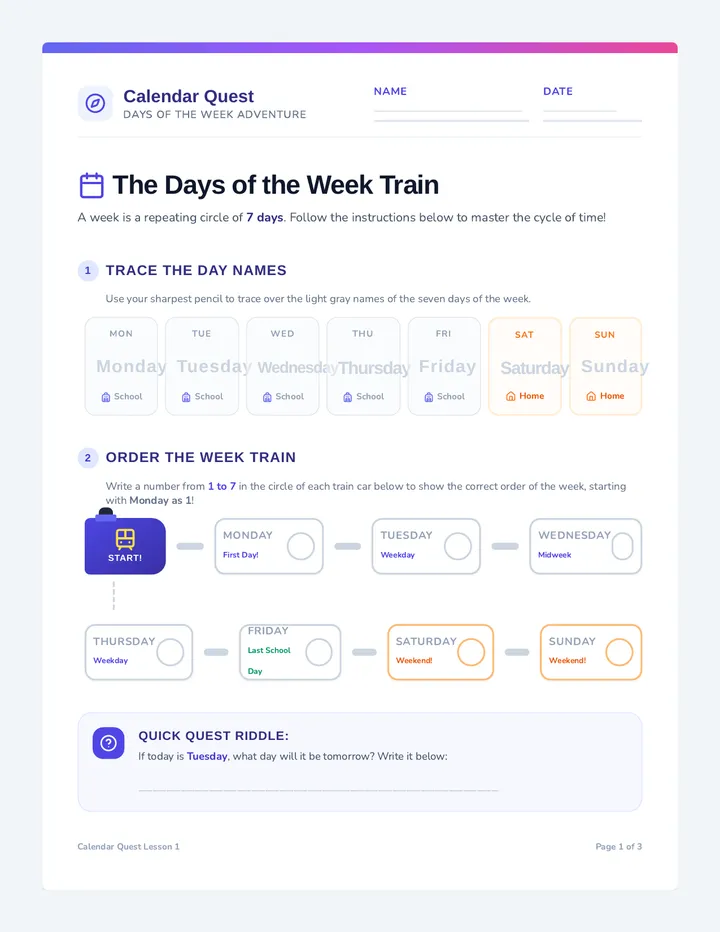
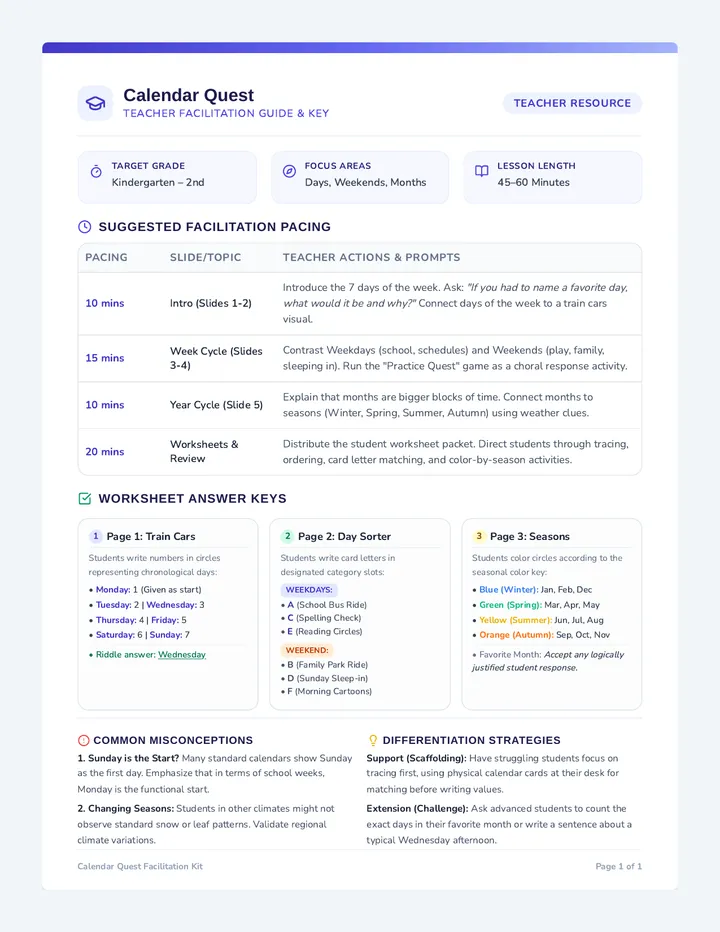
A foundational lesson introducing early elementary students to calendar concepts, including days of the week, weekdays versus weekends, and the twelve months of the year, contextualized with real-world school, home, and seasonal scenarios.
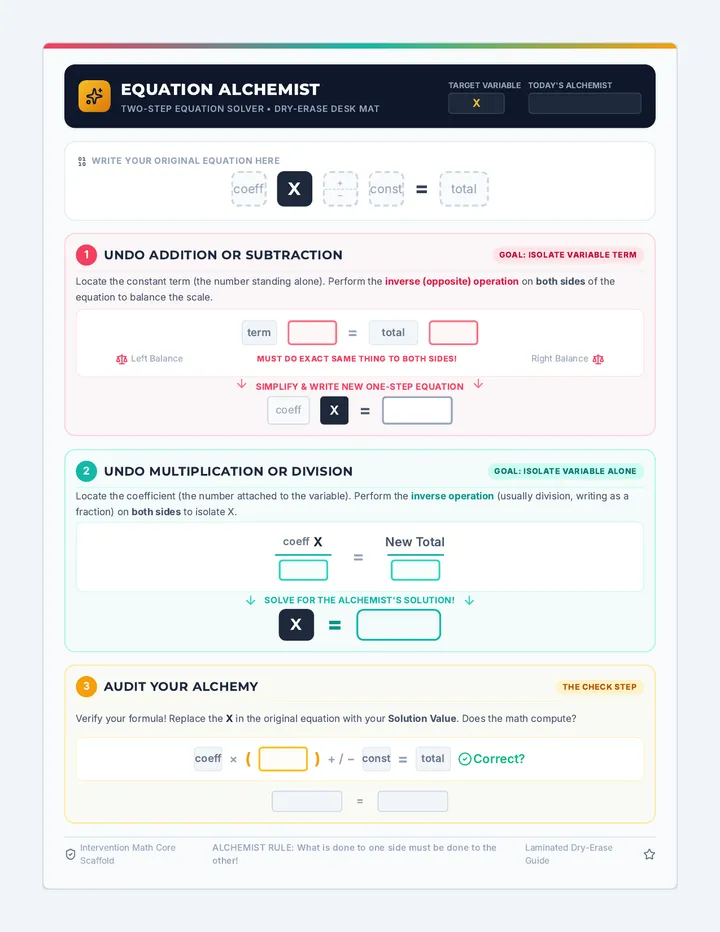
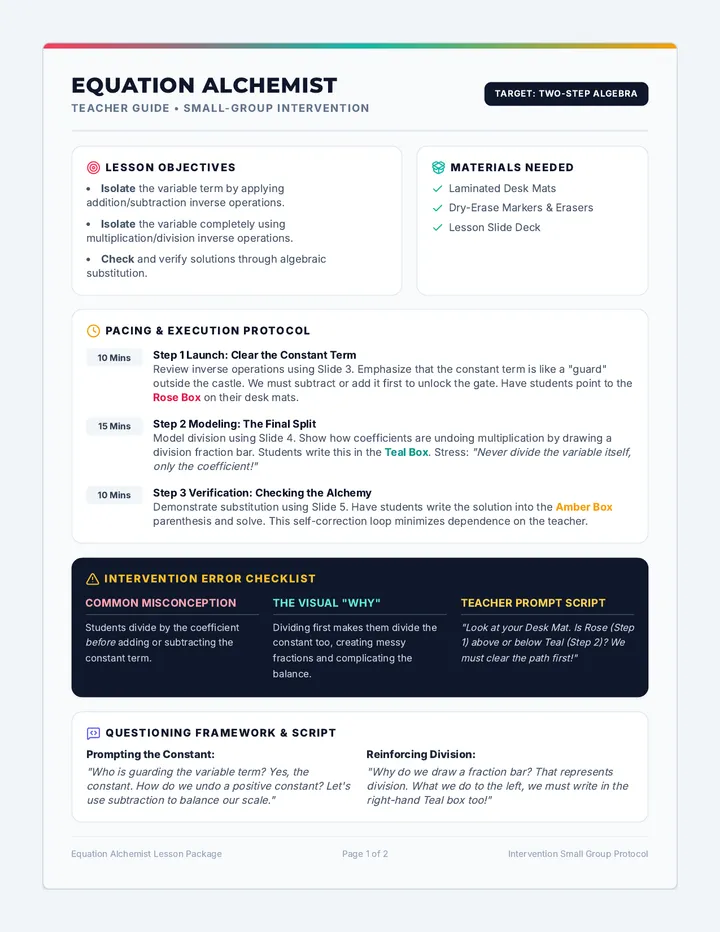
A comprehensive math intervention lesson targeting two-step algebraic equations. Features a color-coded step-by-step visual organizer that guides students through undoing addition/subtraction first, followed by multiplication/division to isolate the variable.
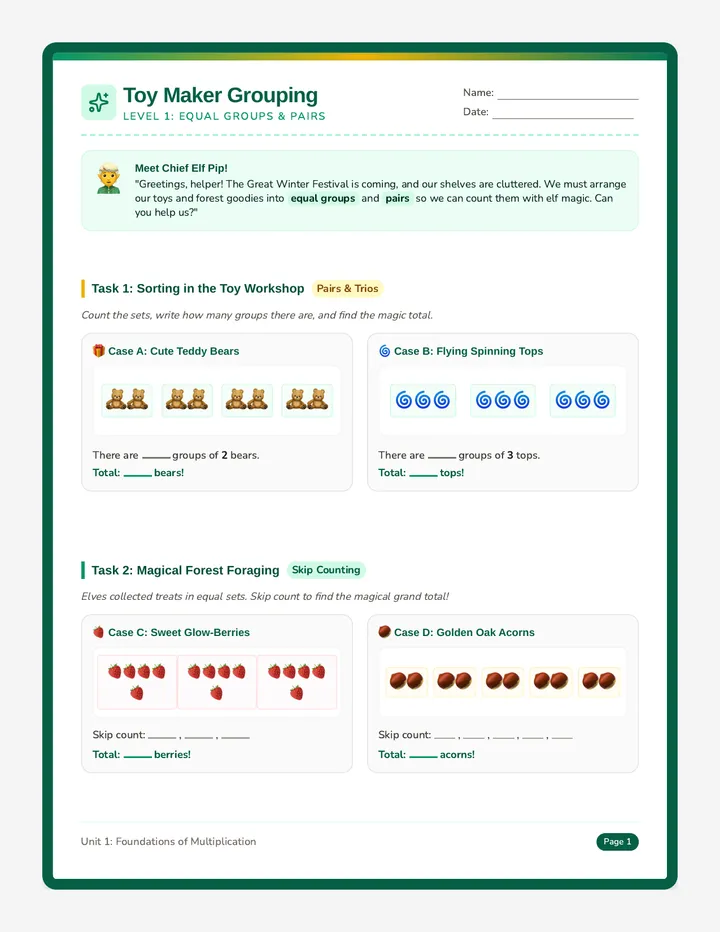
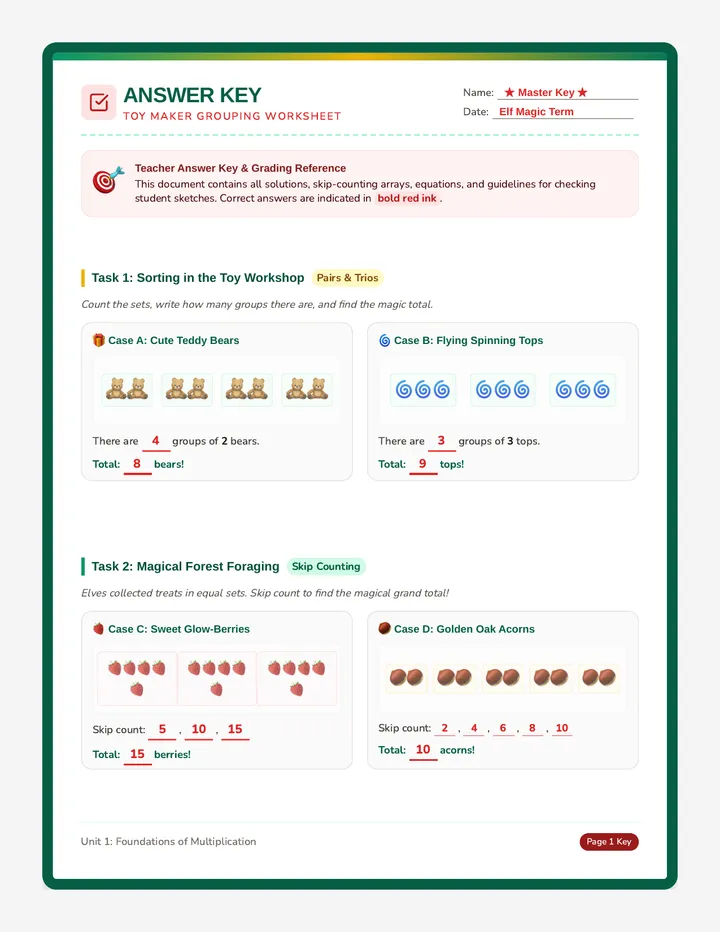
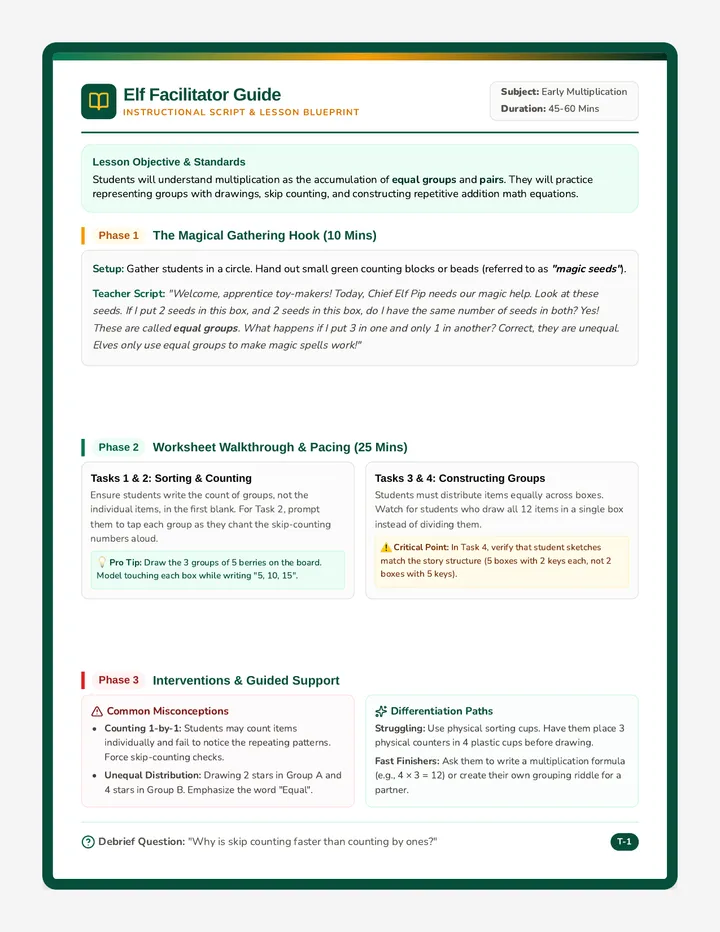
An introductory lesson on multiplication using equal groups and pairs, themed around magical elves making toys, foraging in the forest, and packing items. Students transition from concrete counting to skip counting and basic multiplication concepts.
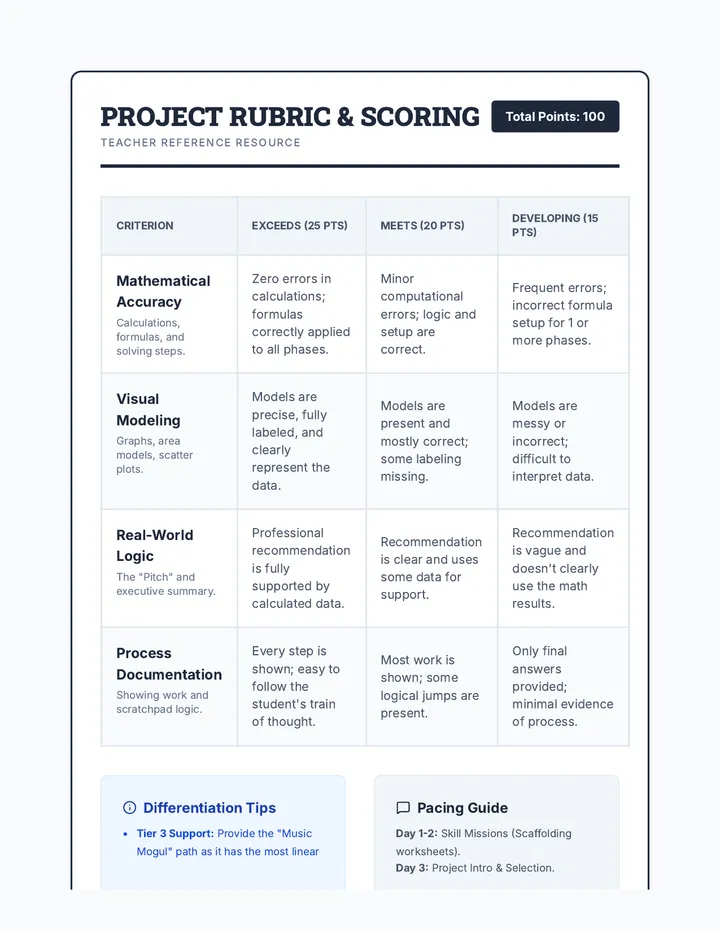
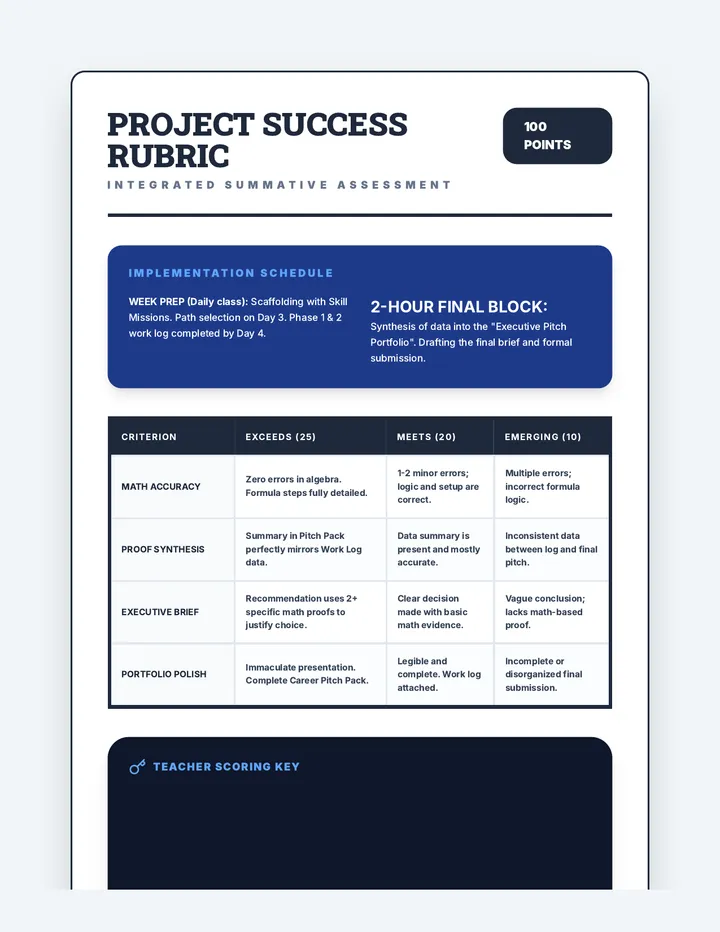
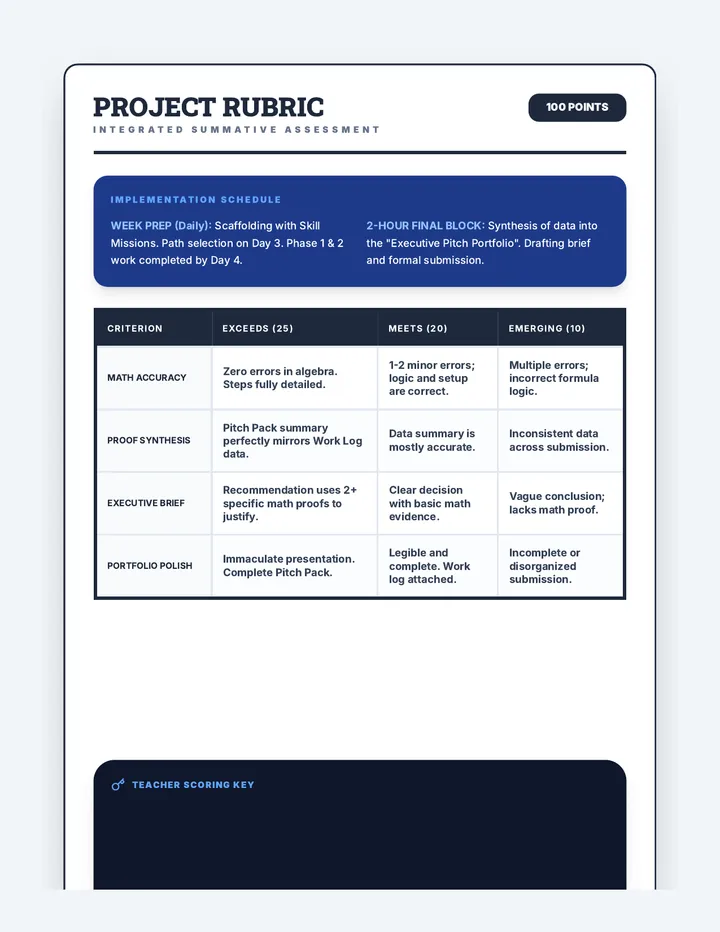
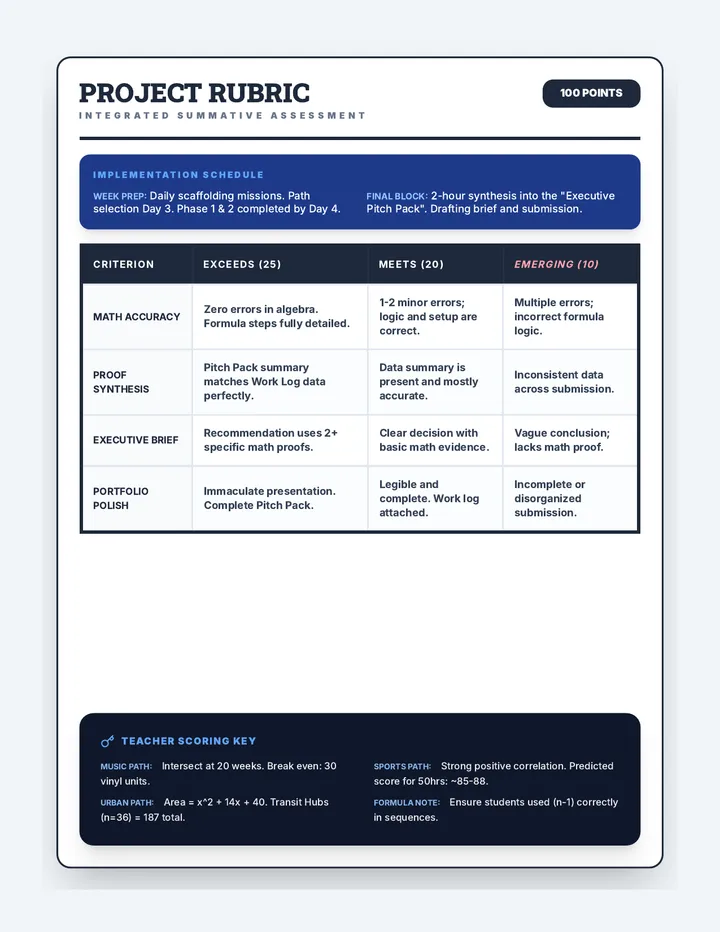
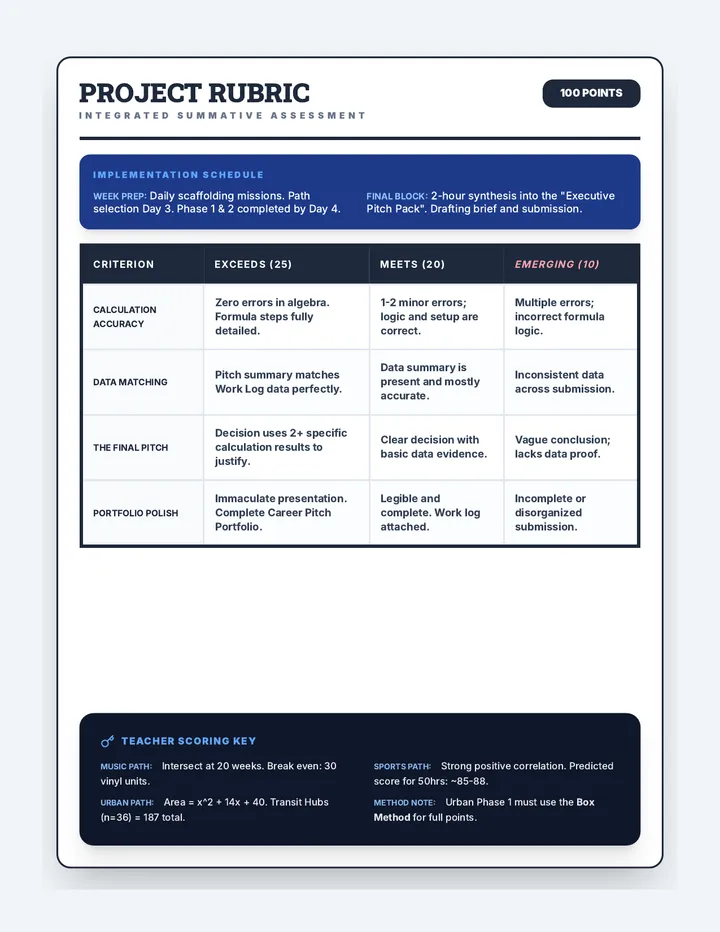
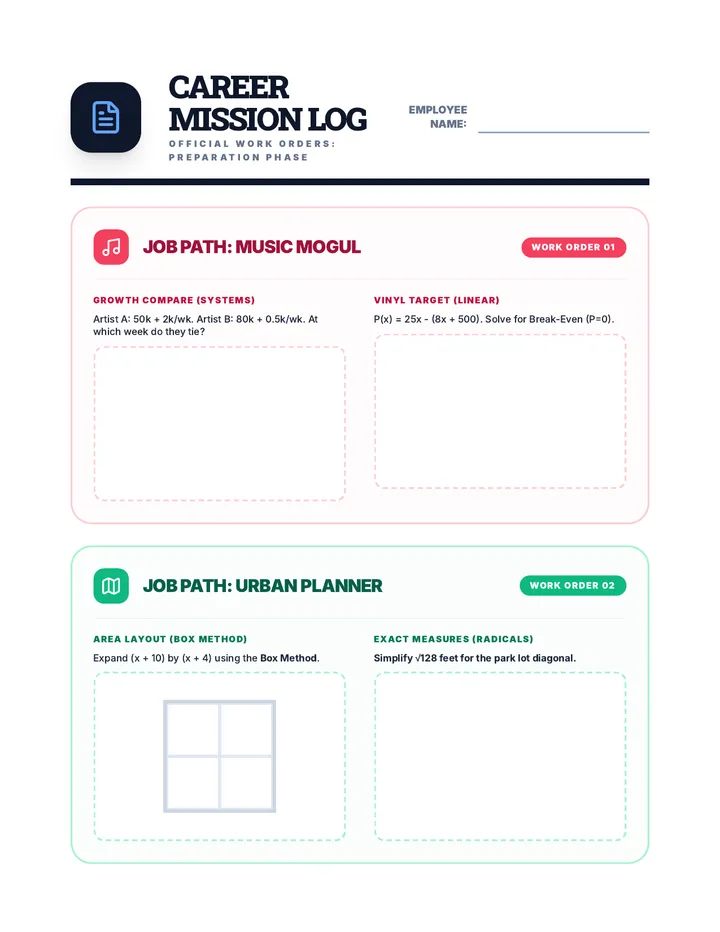
Scaffolded practice activities ('Skill Missions') that review key concepts: linear equations, systems, sequences, lines of best fit, and factoring. These activities ensure students have the foundational skills needed for their final project.
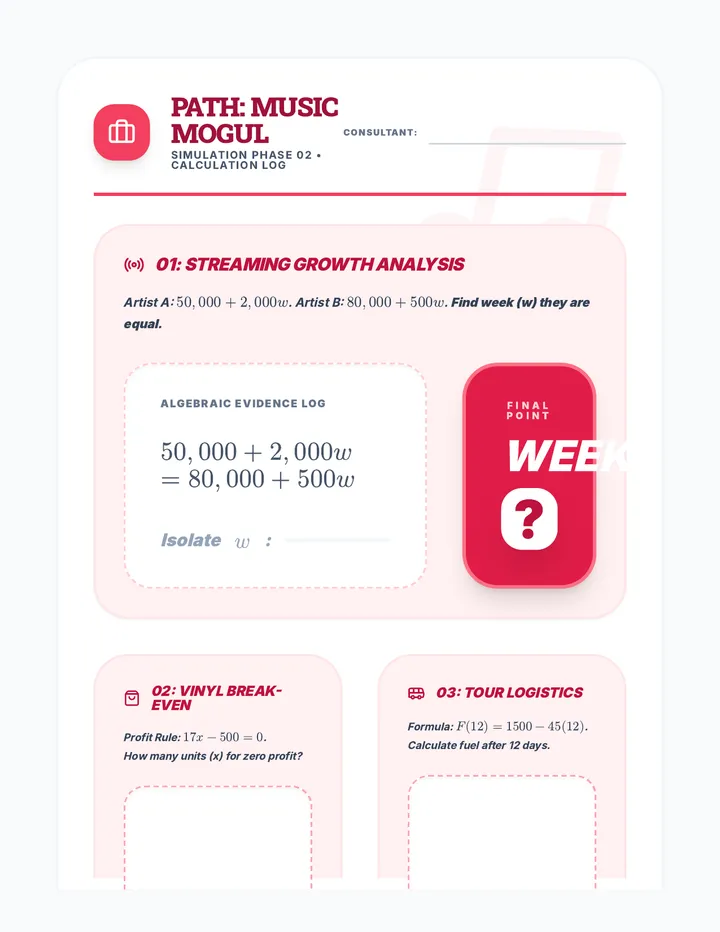
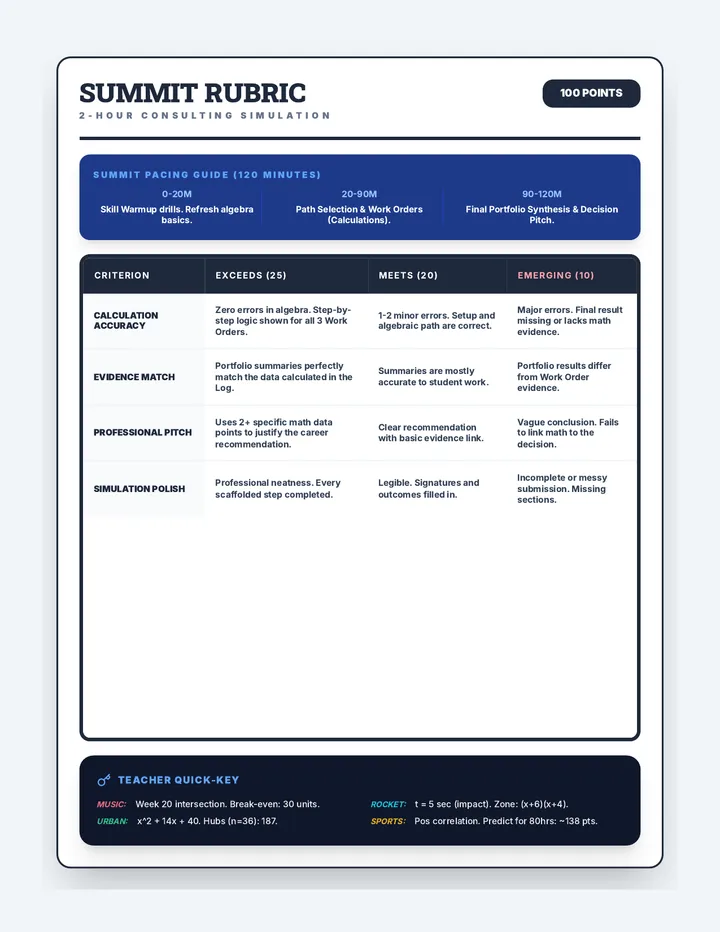
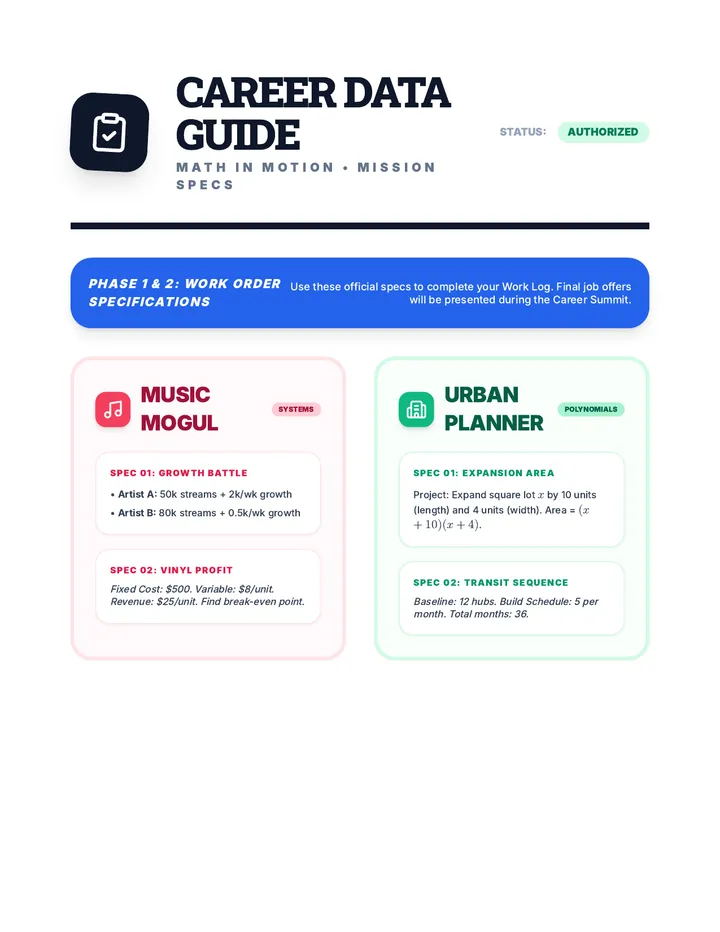
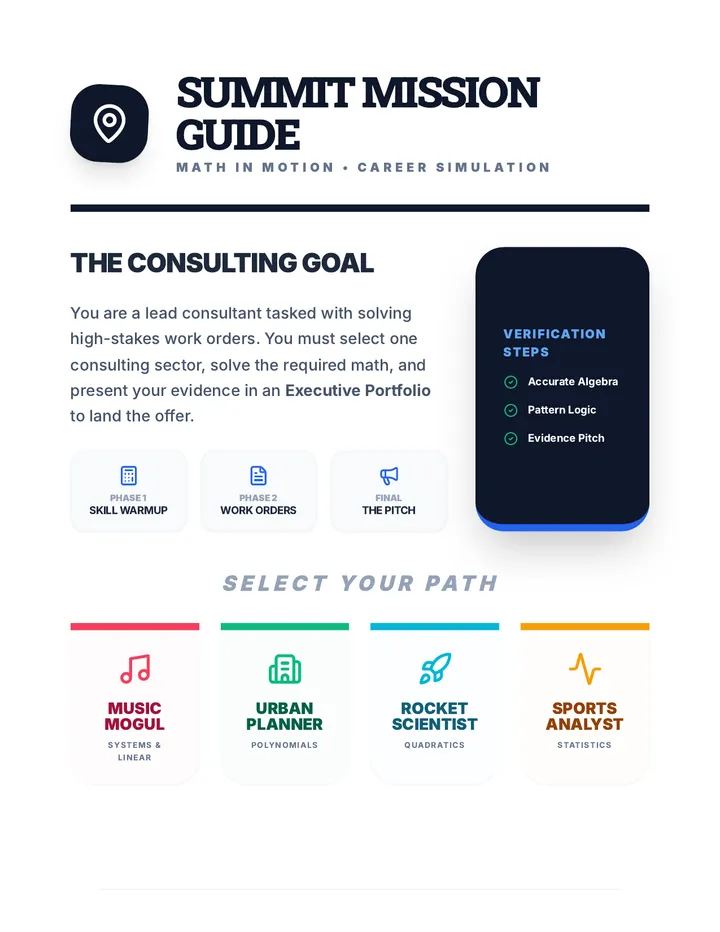
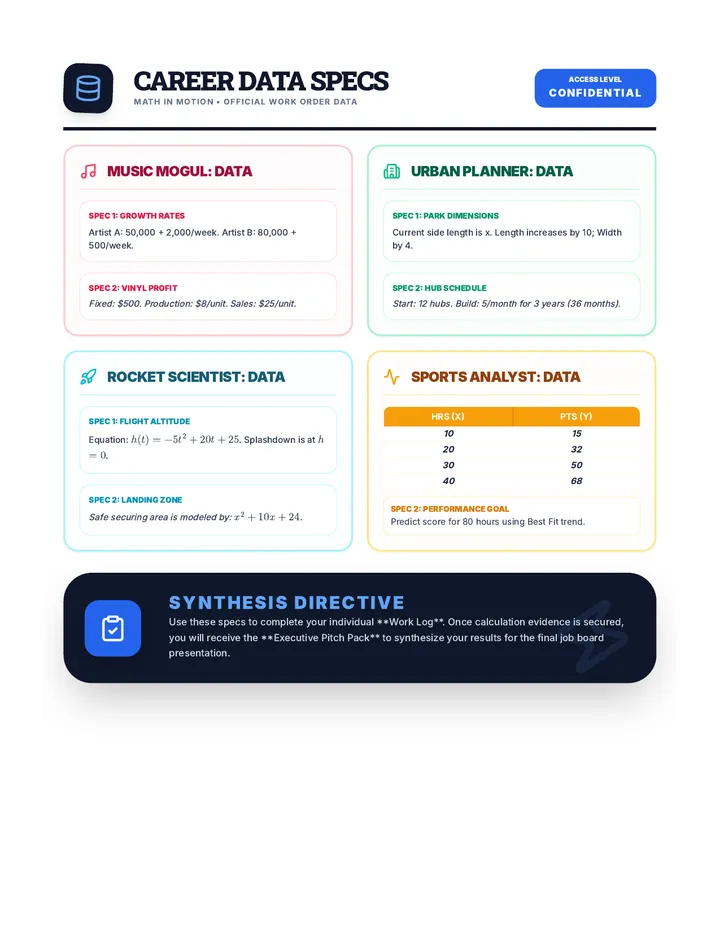
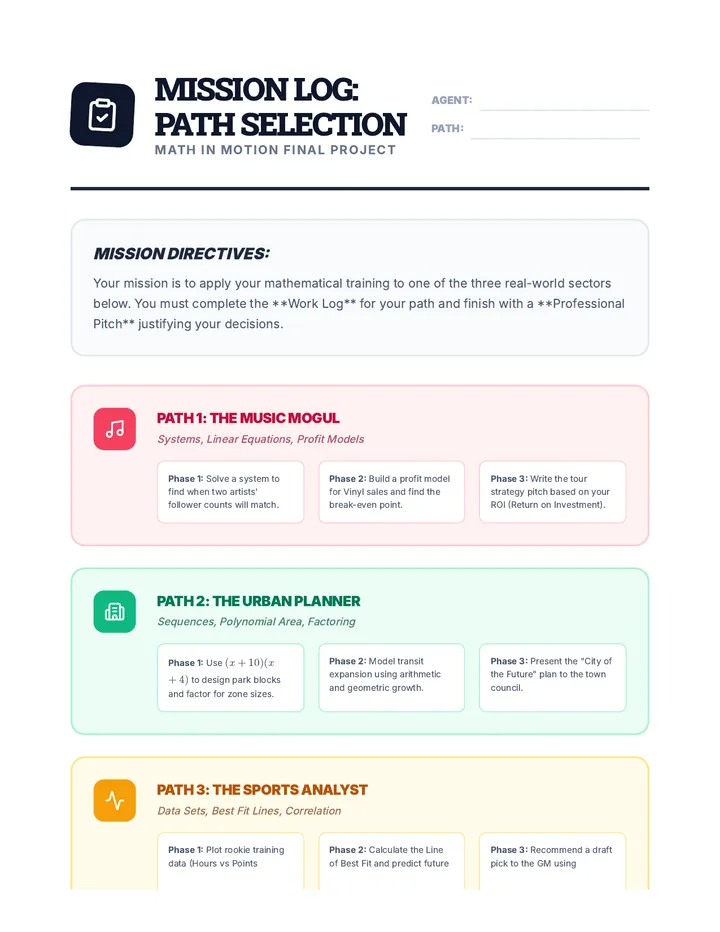
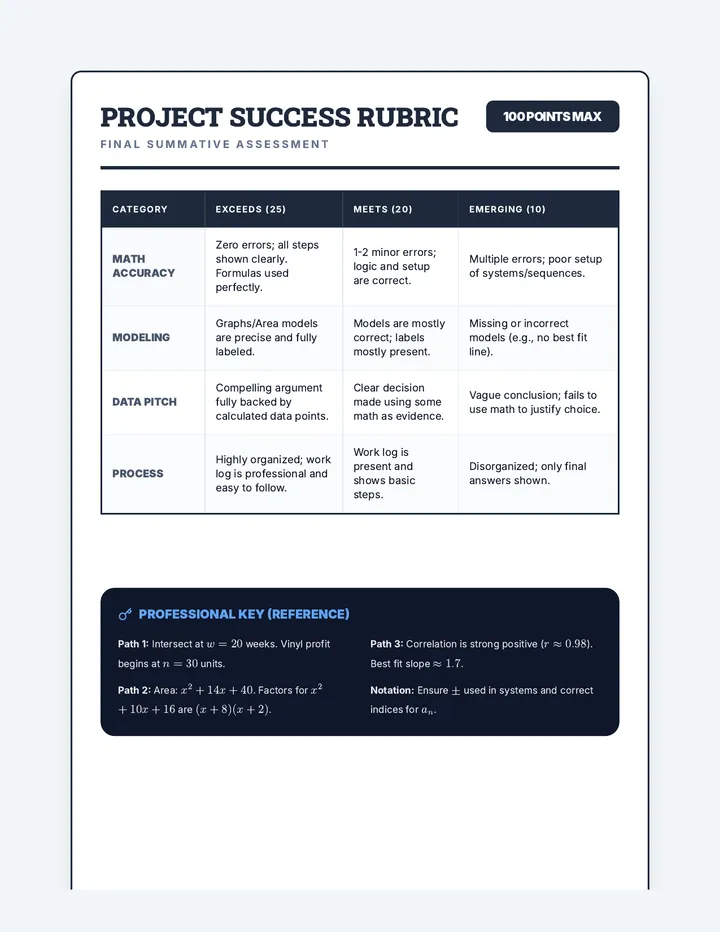
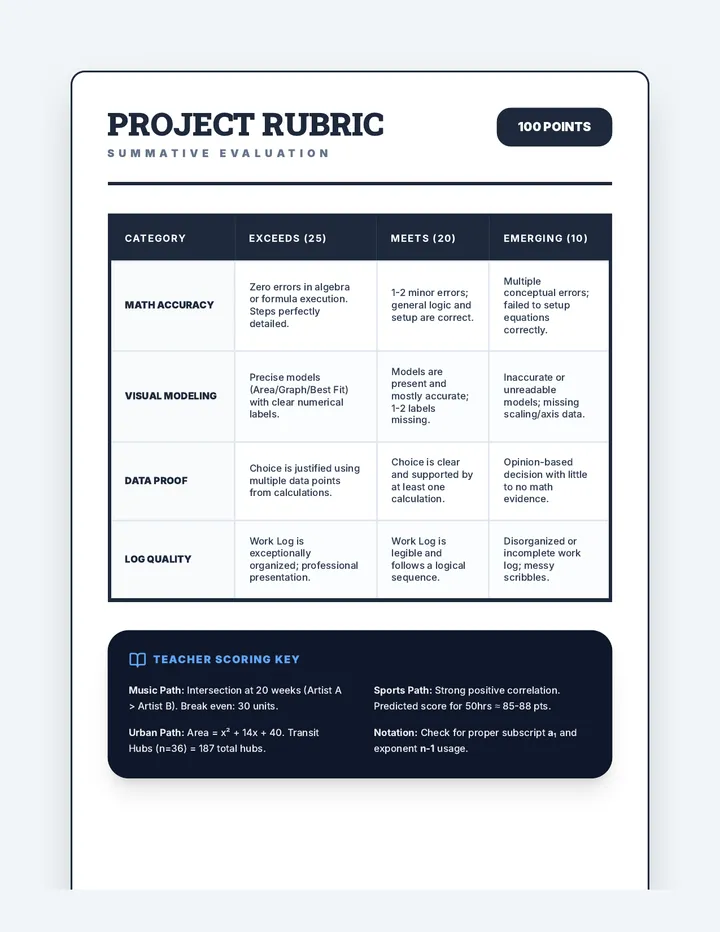
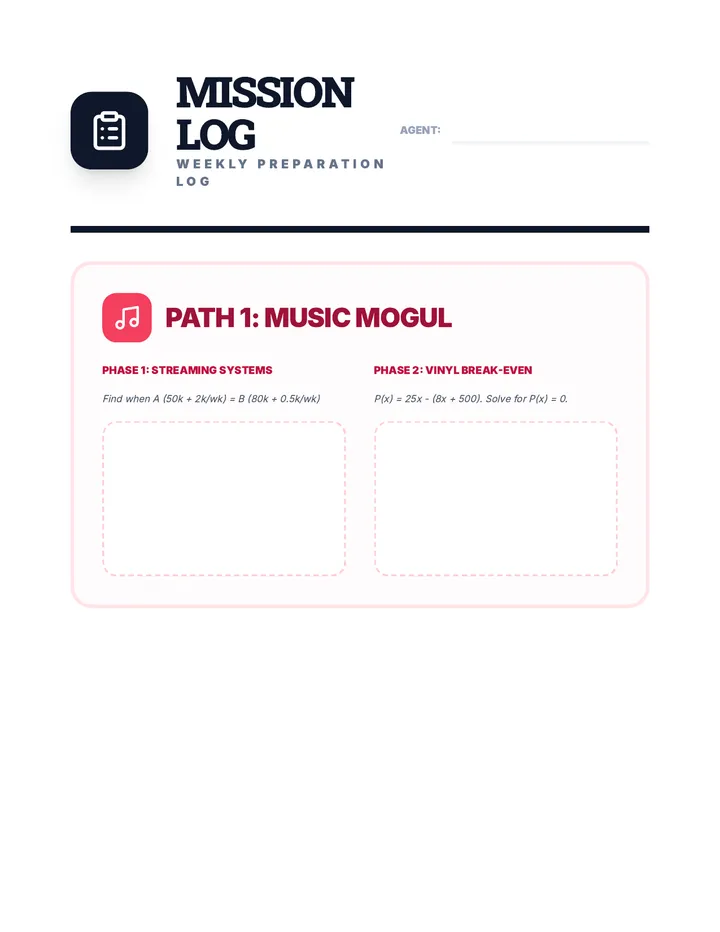
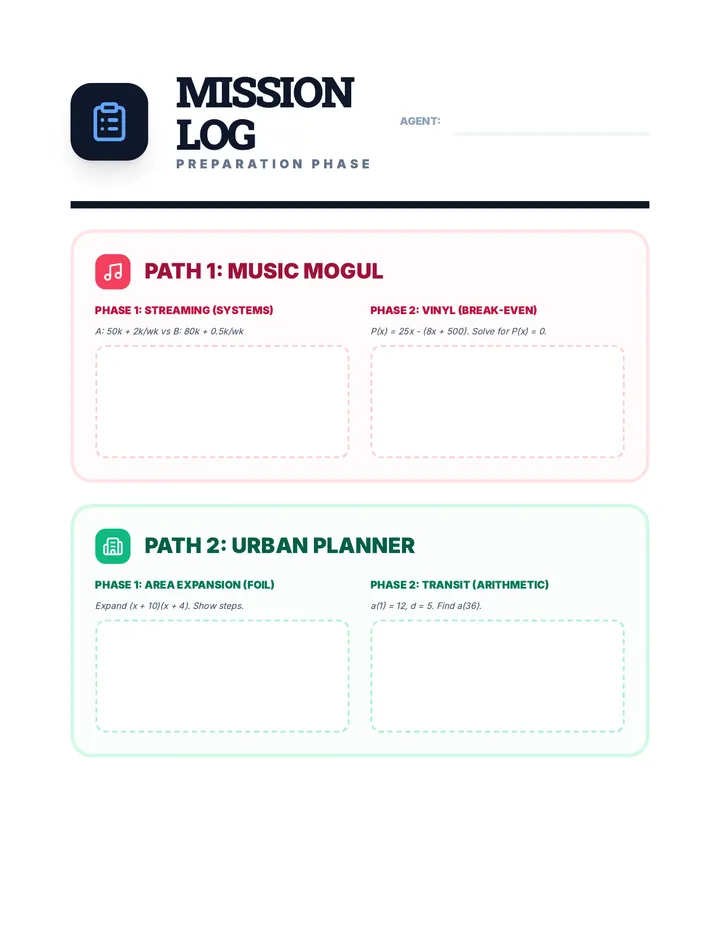
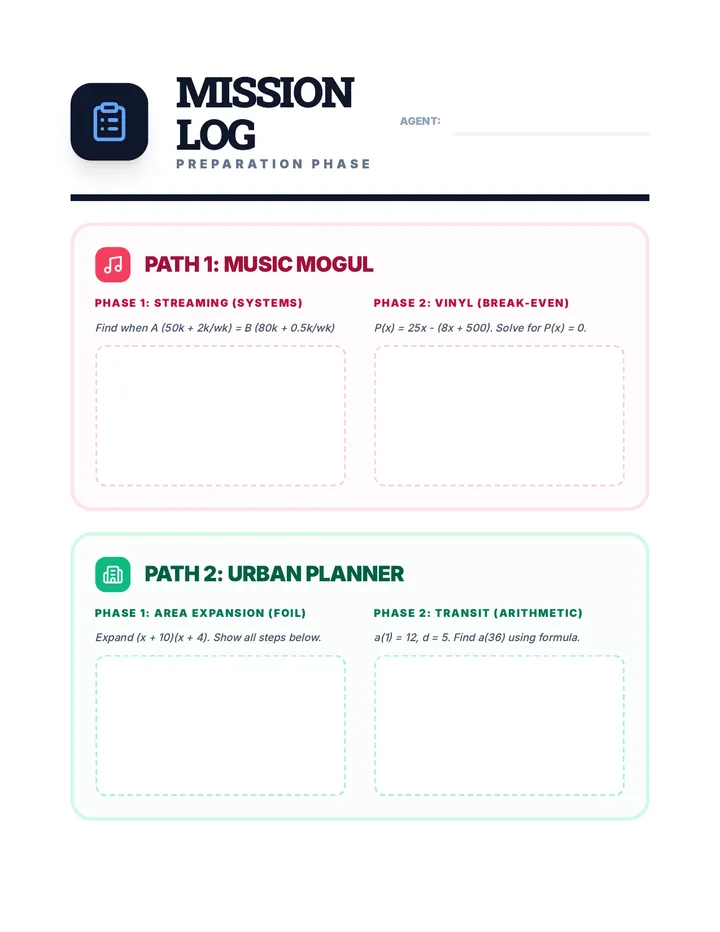
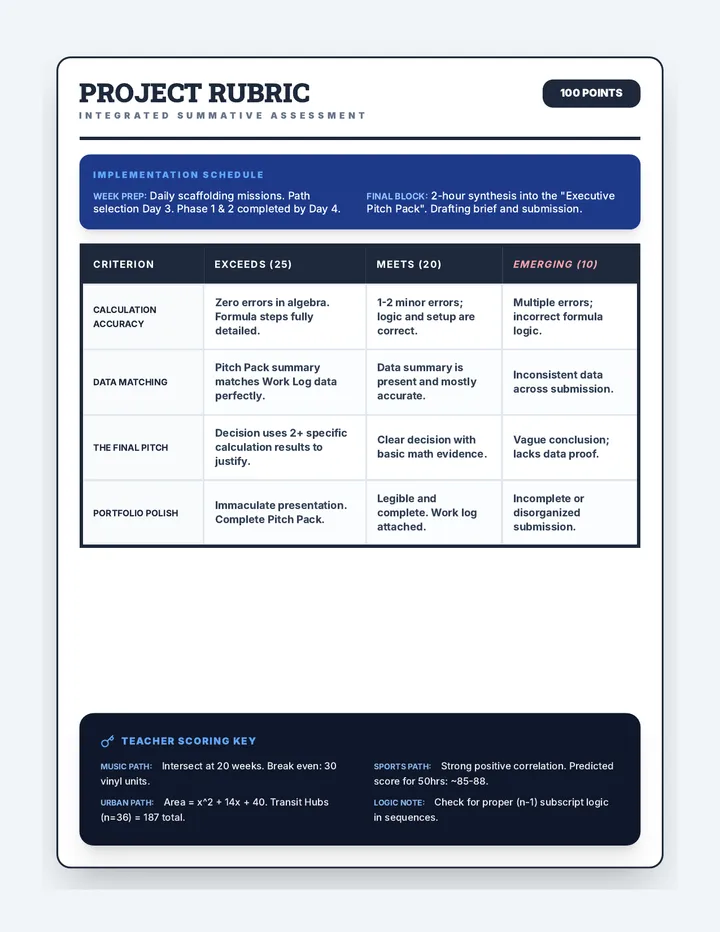
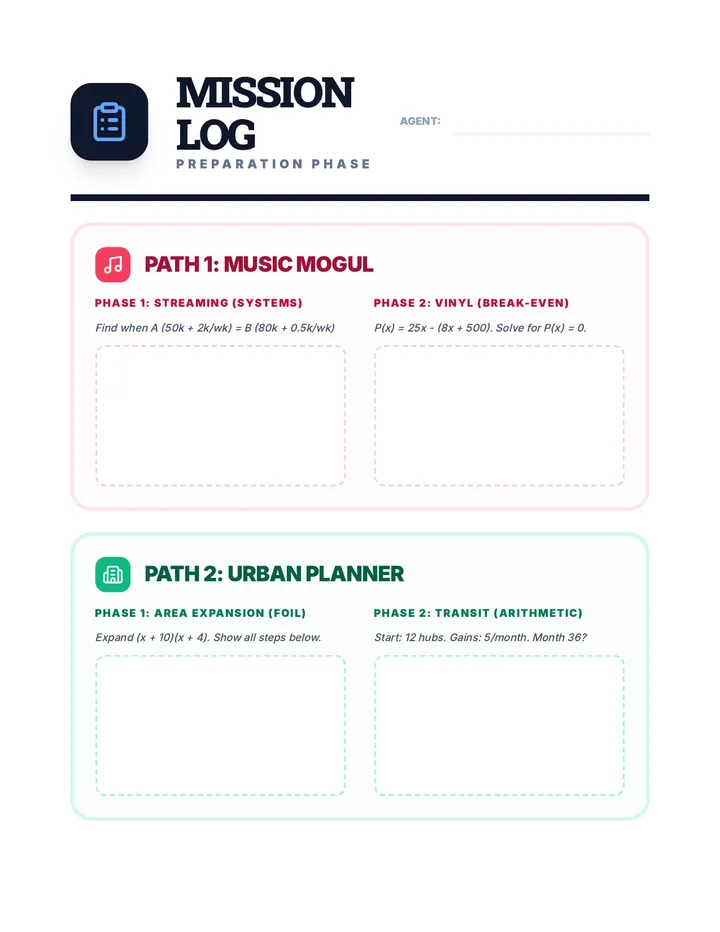
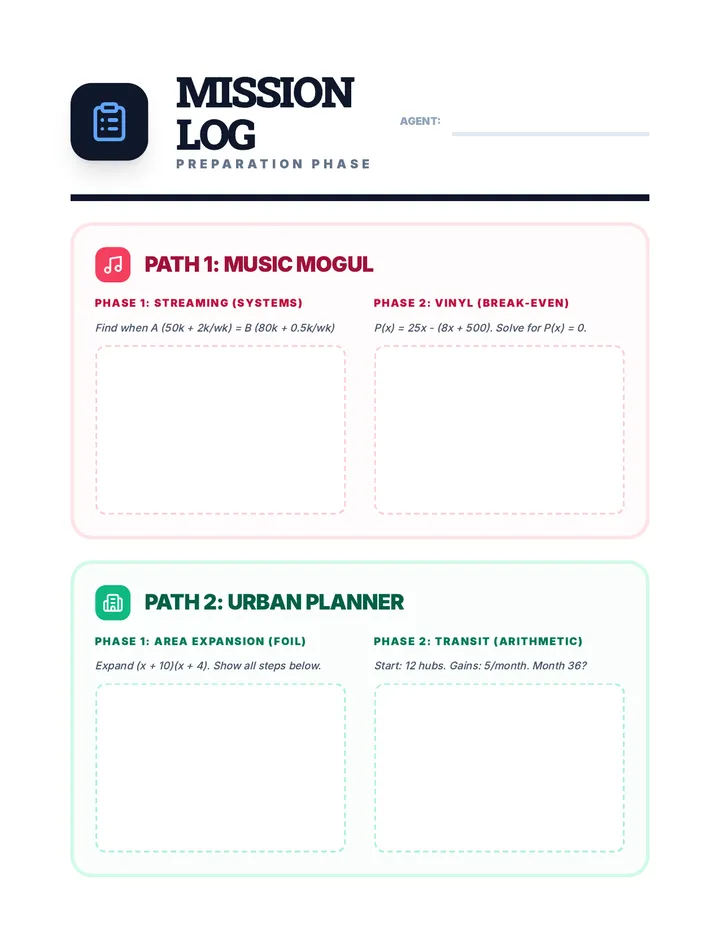
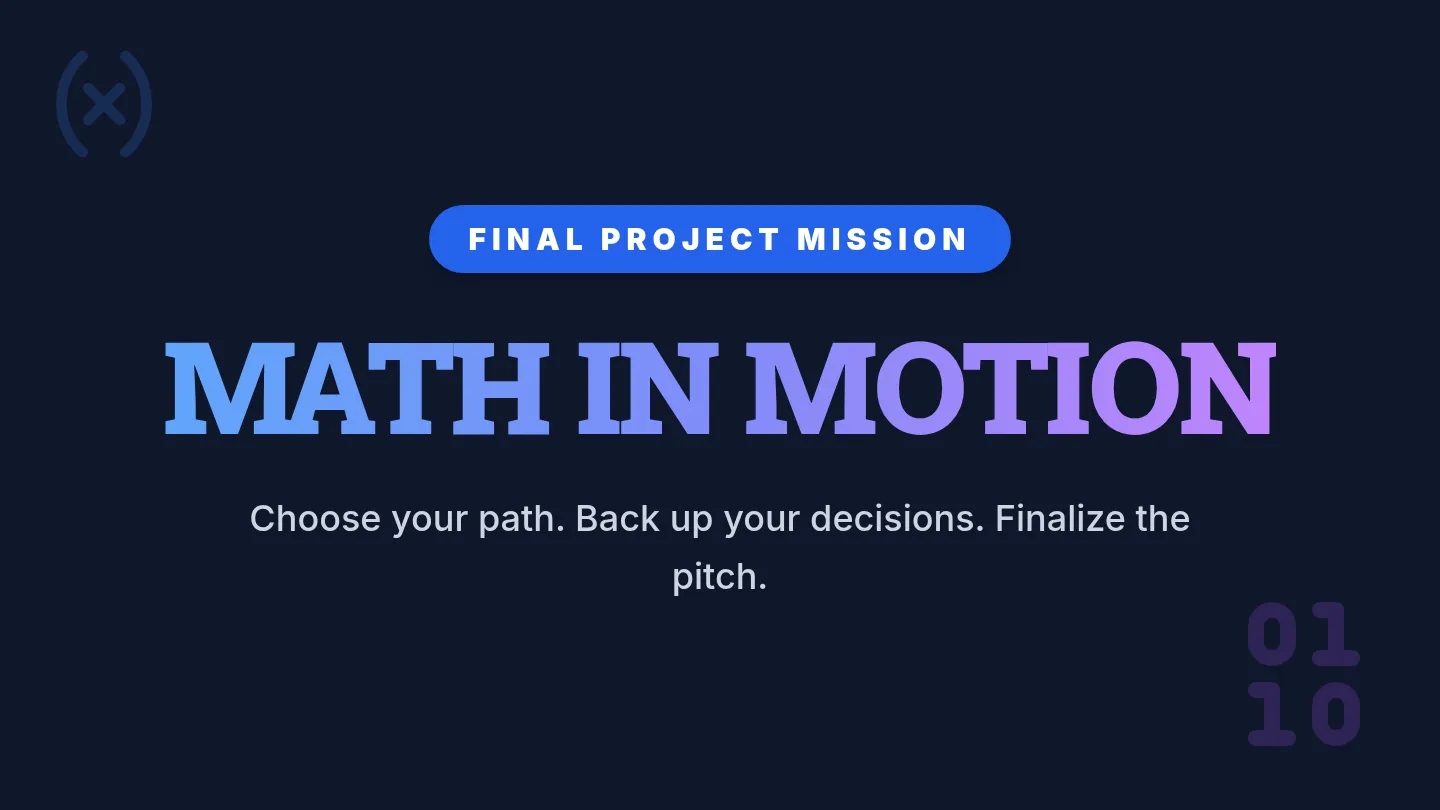
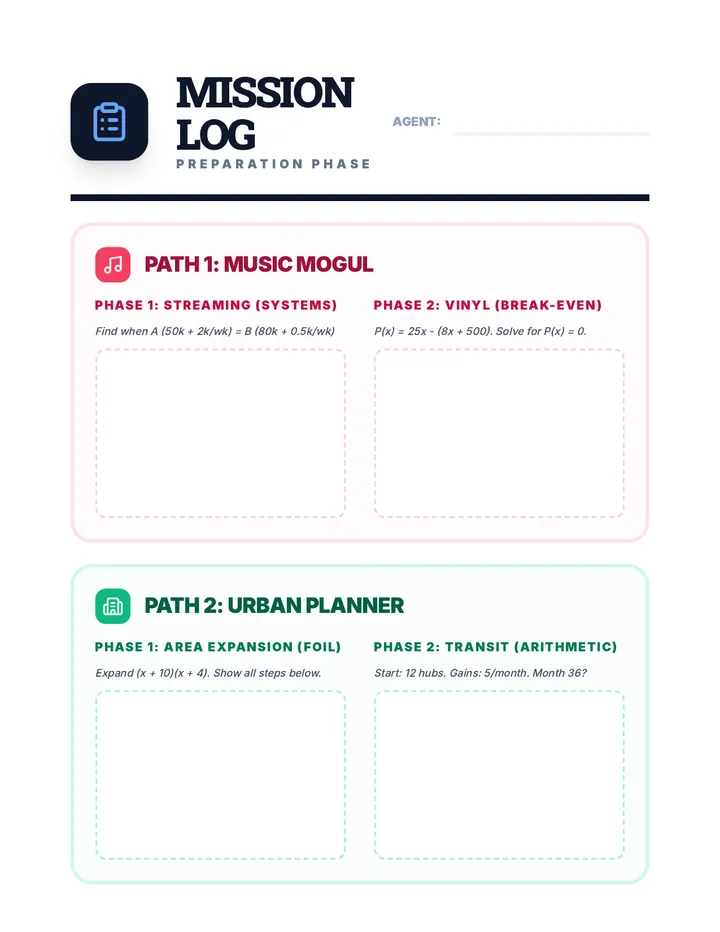
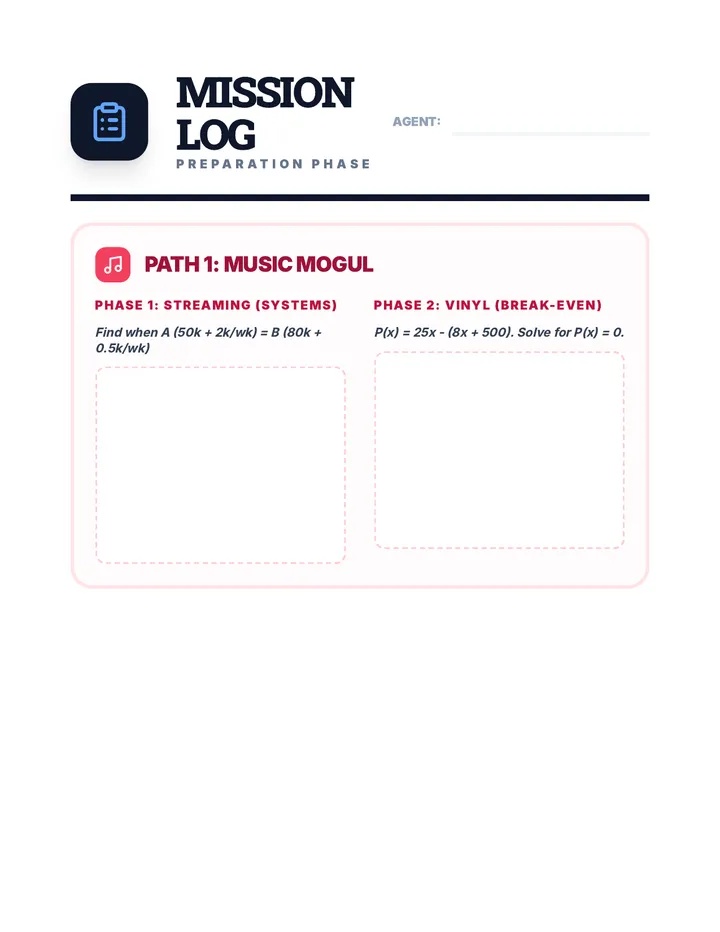
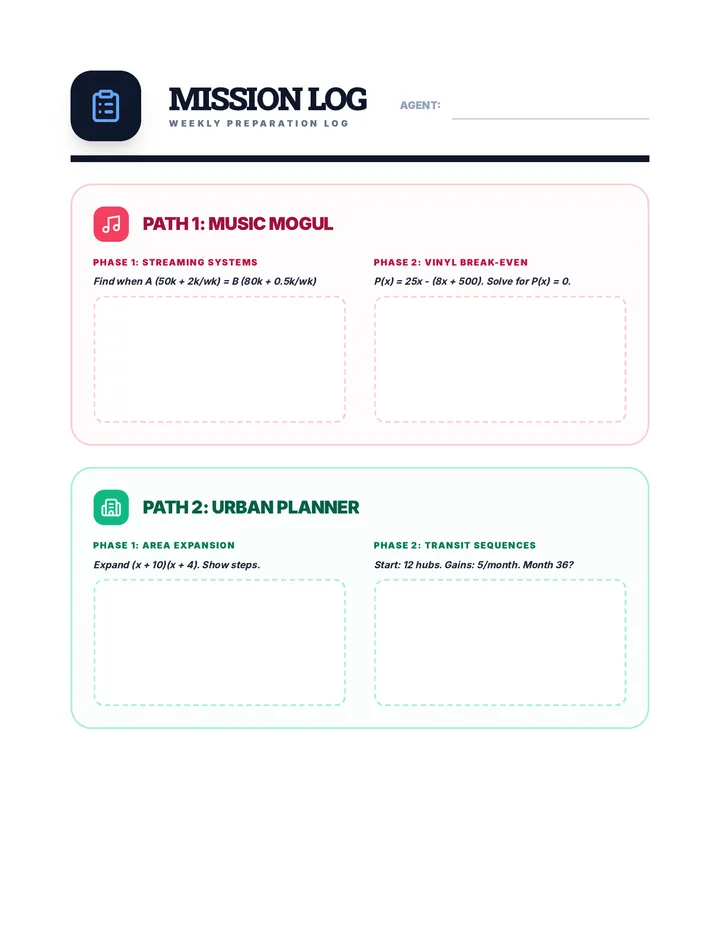
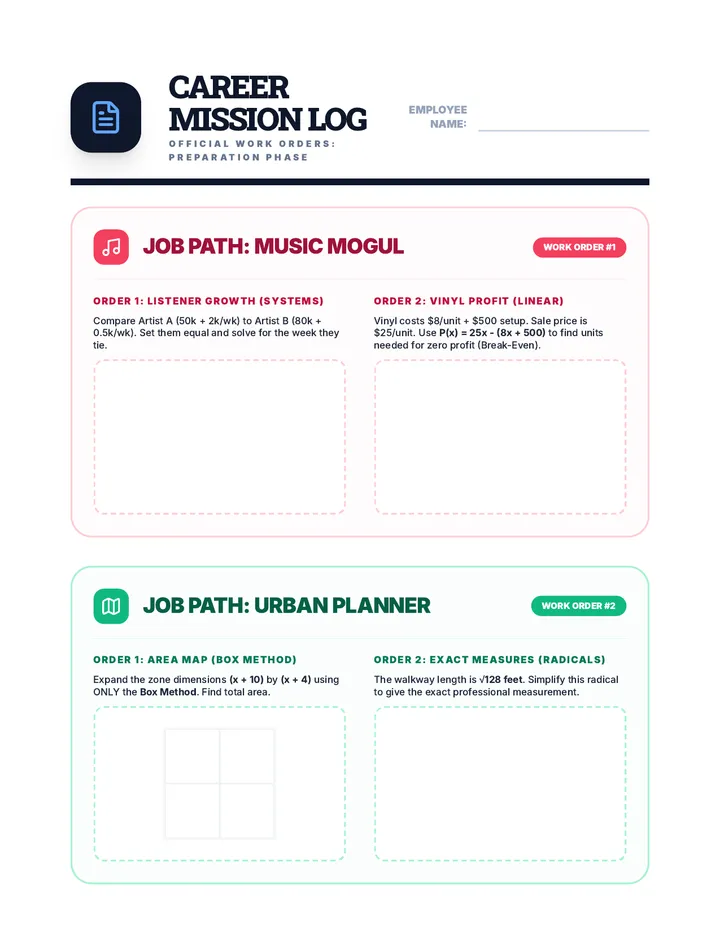
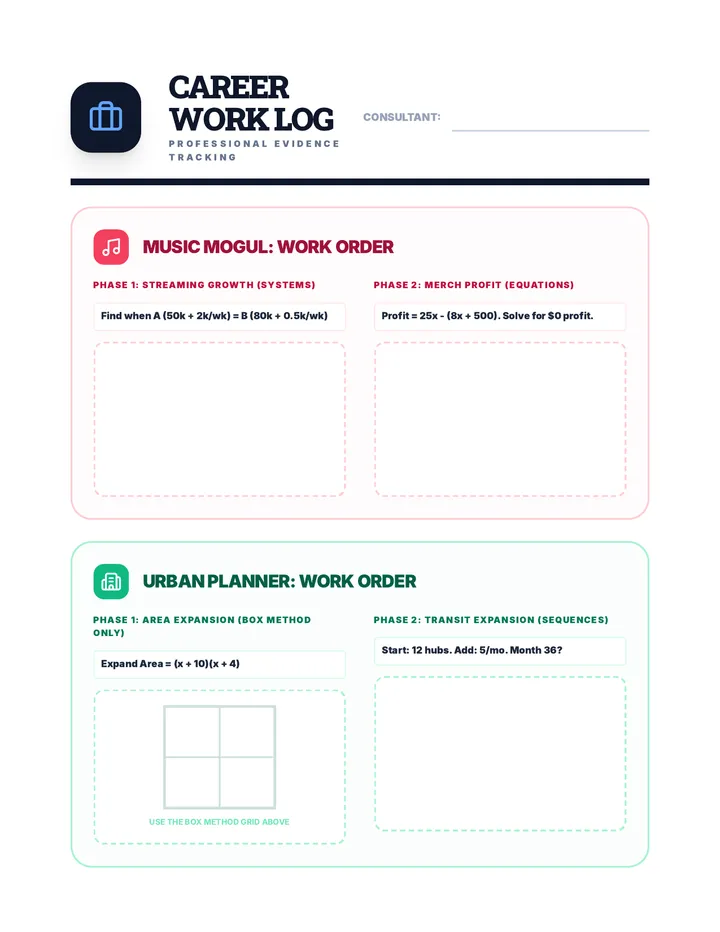
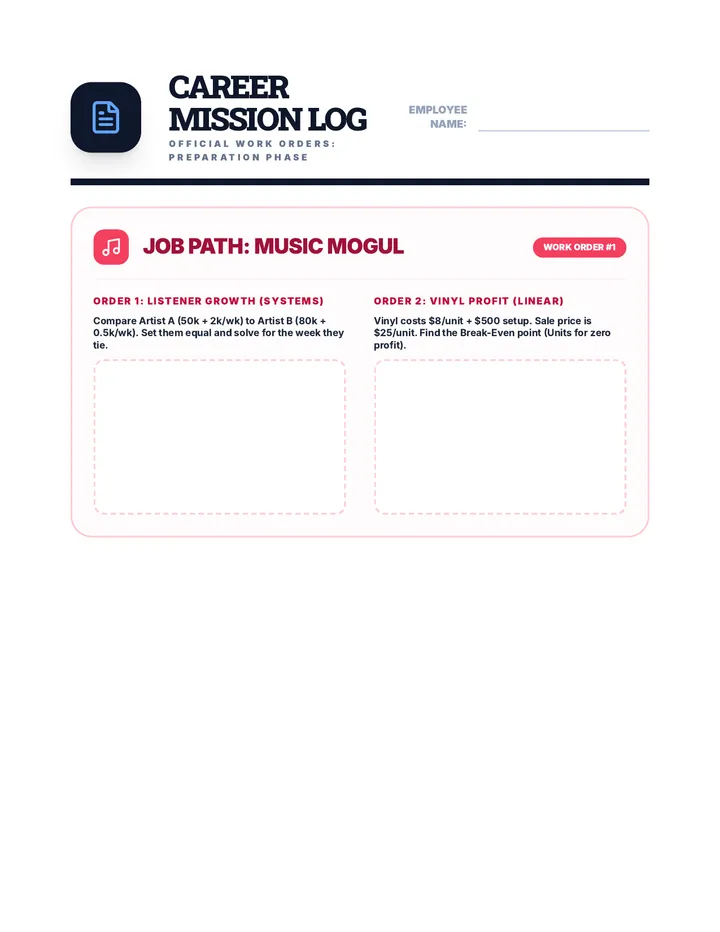
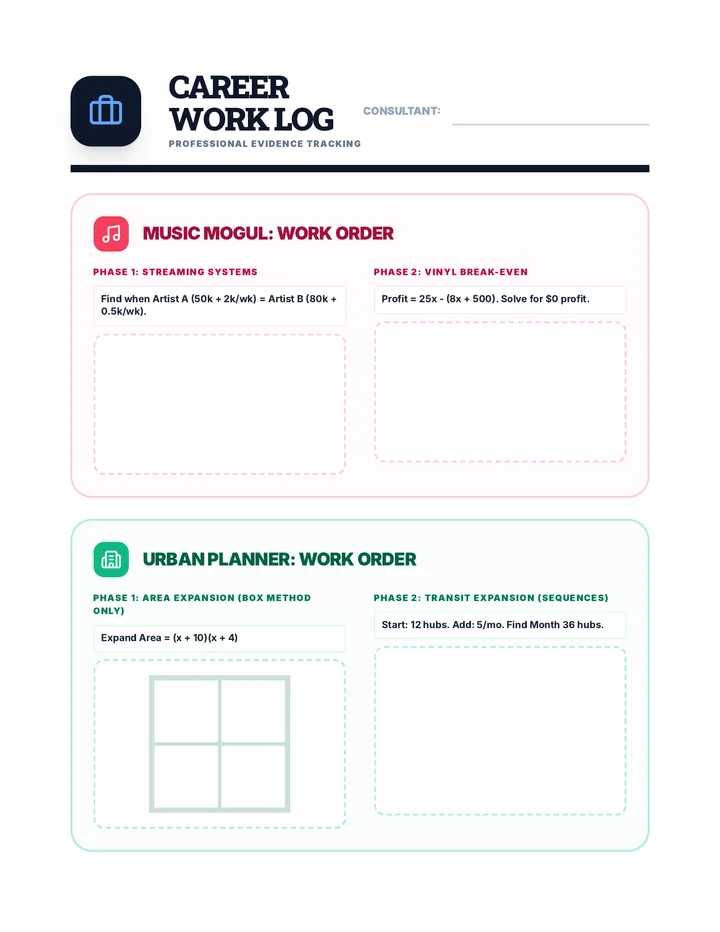
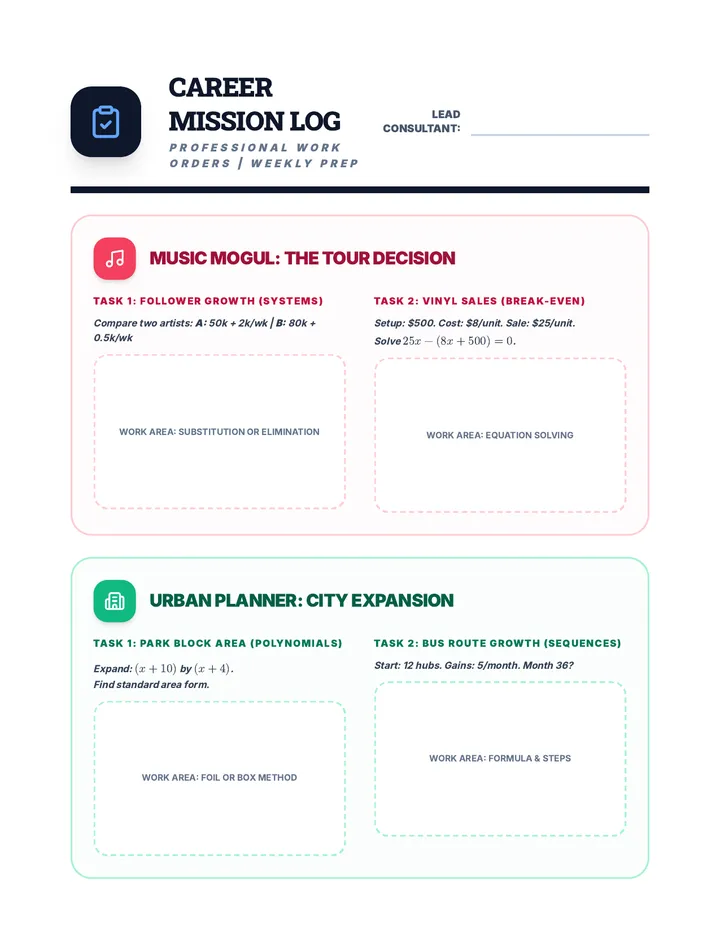
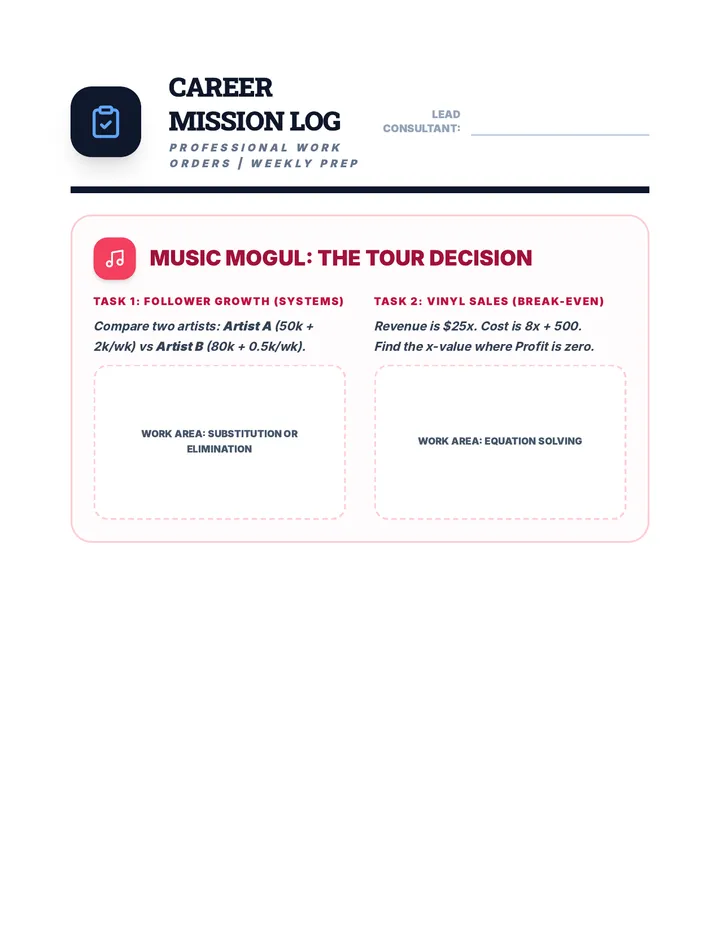
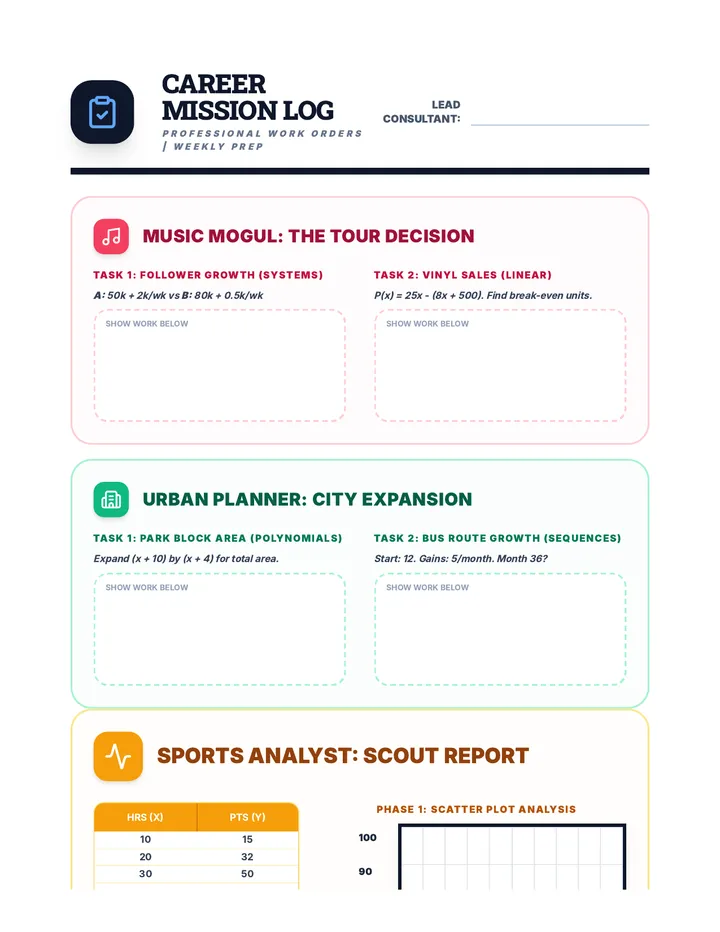
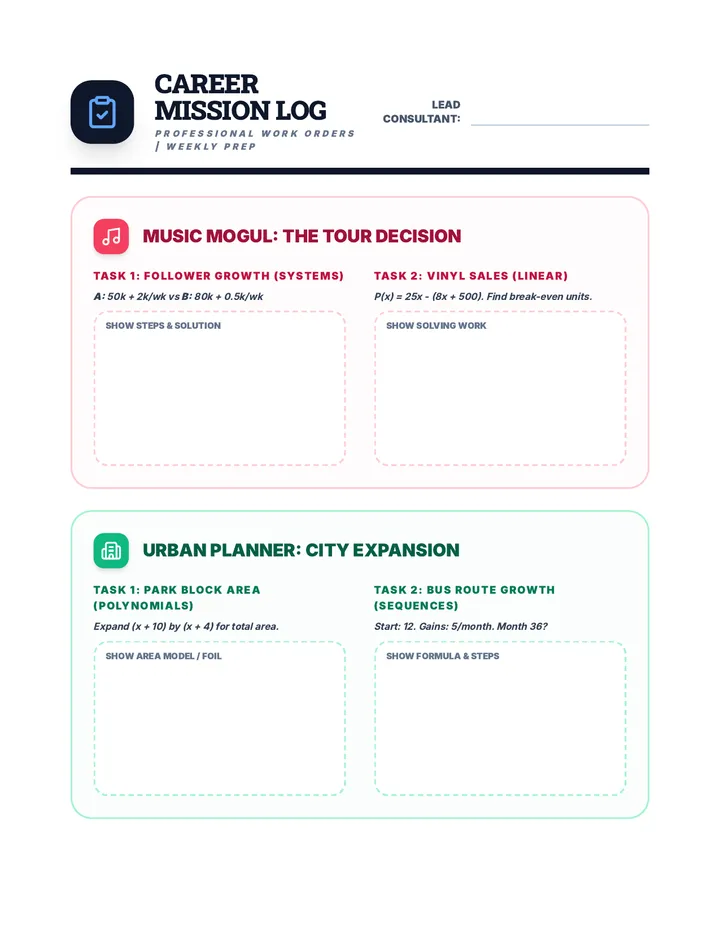
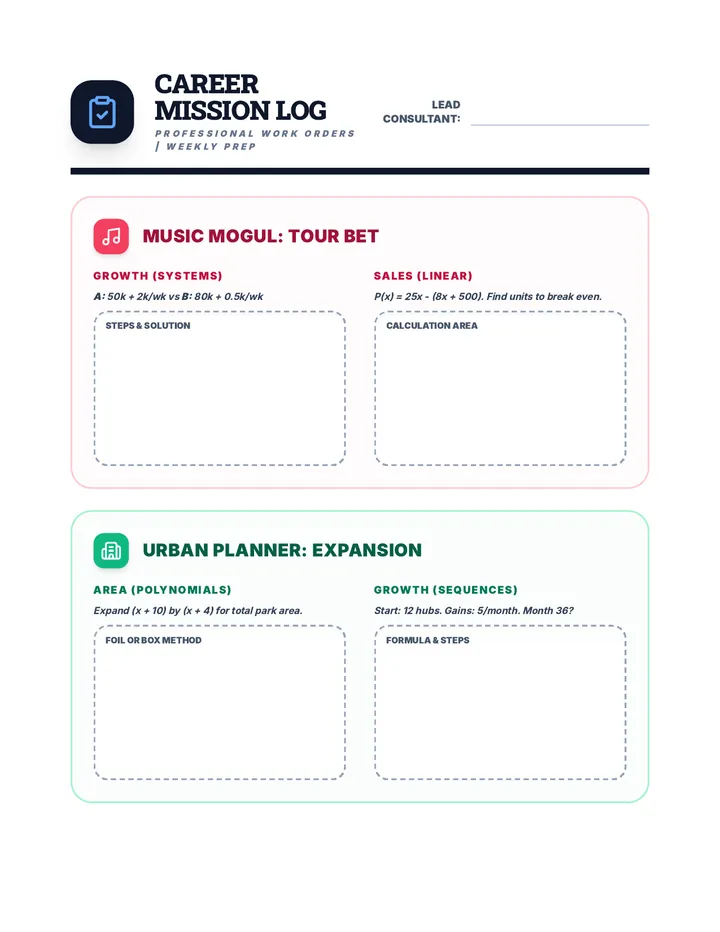
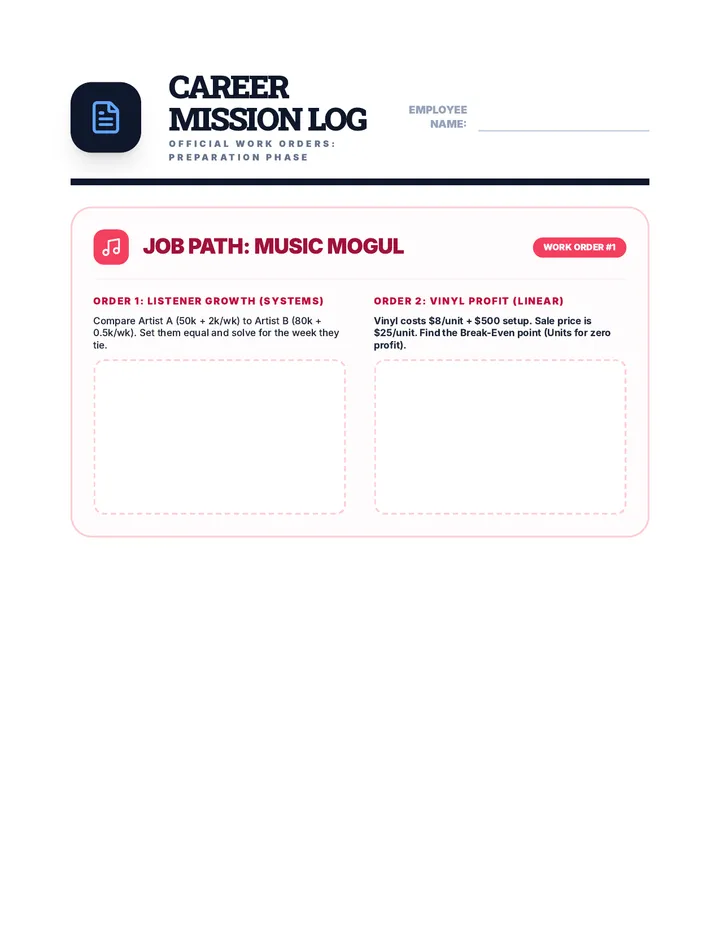
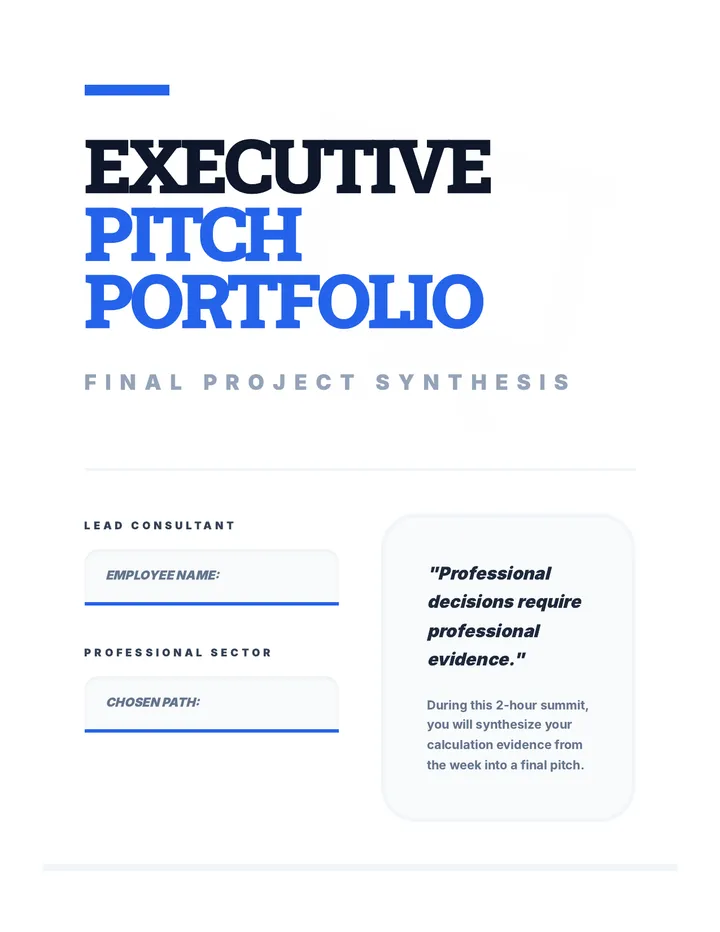
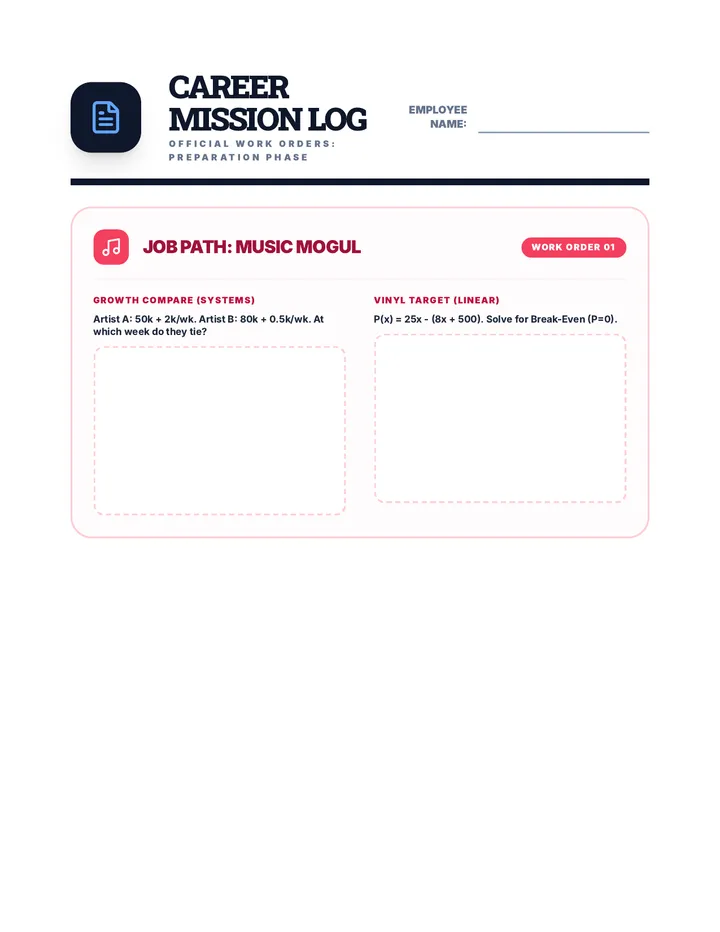
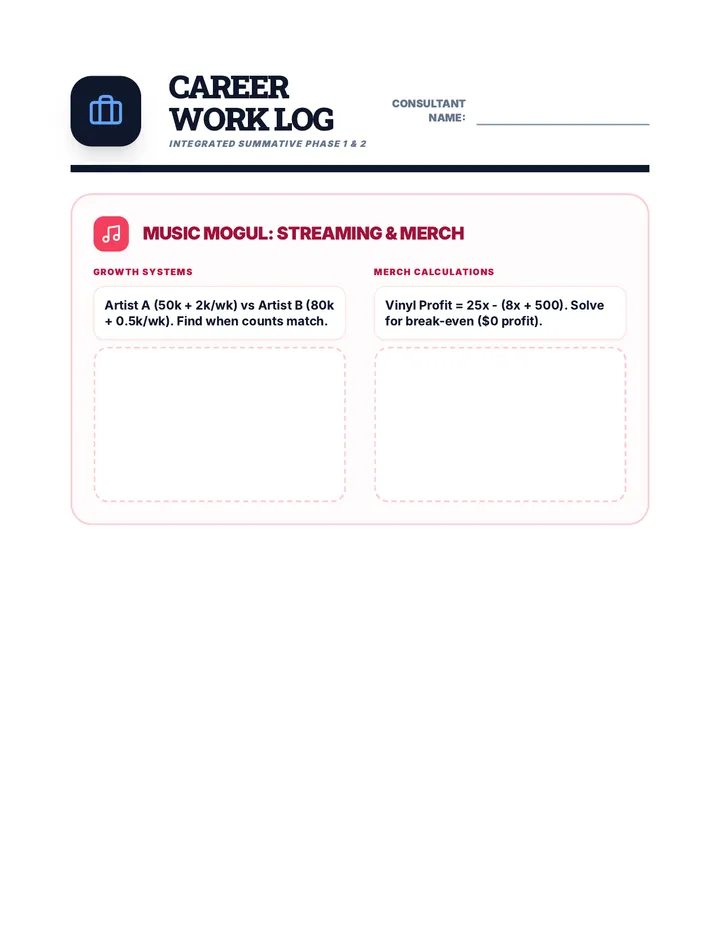
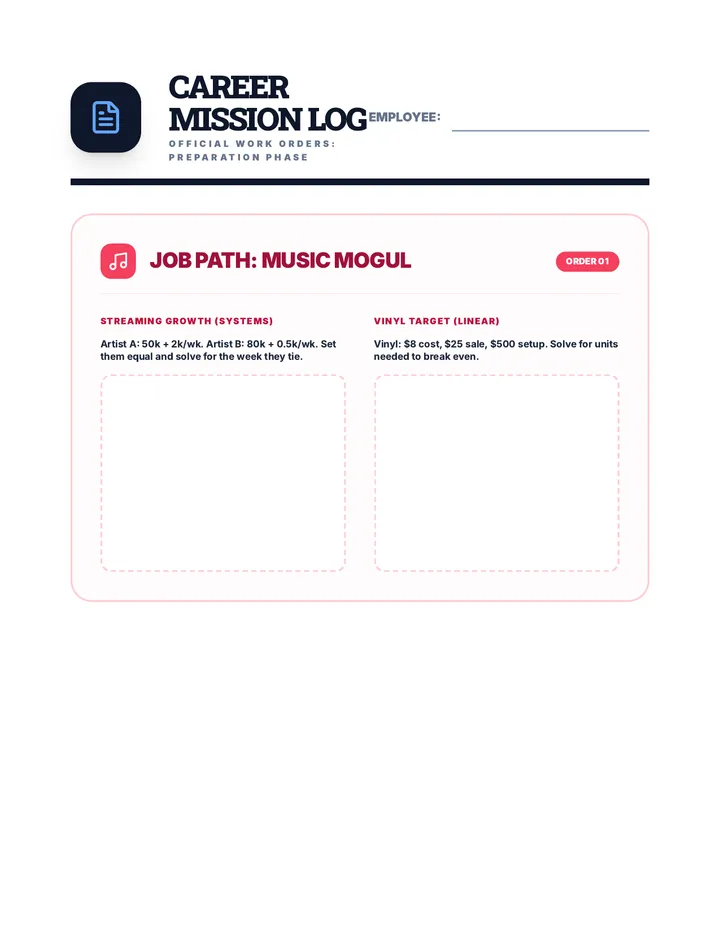
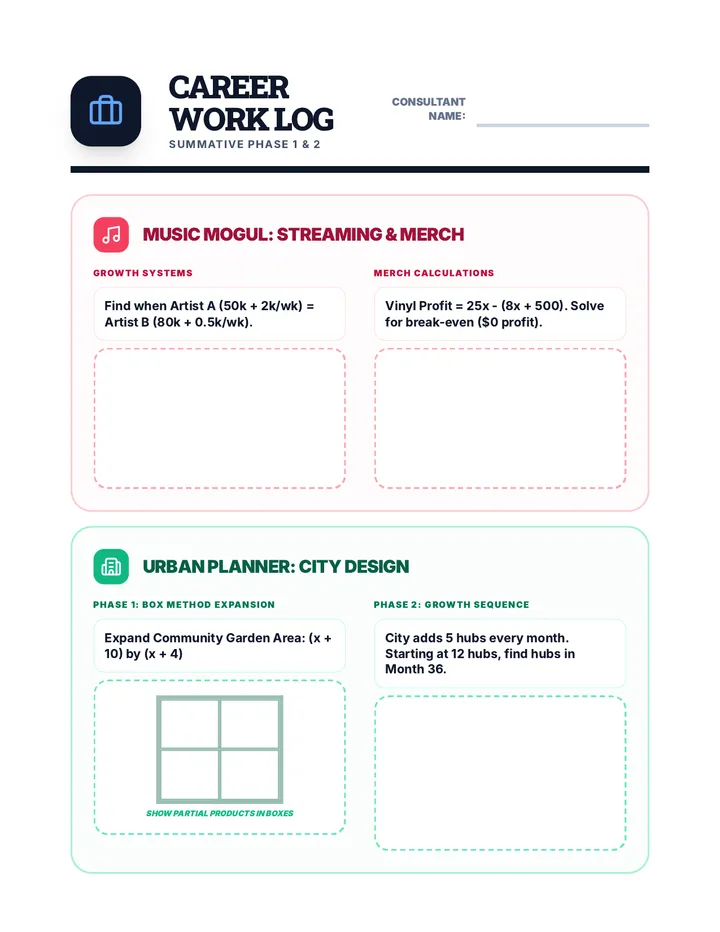
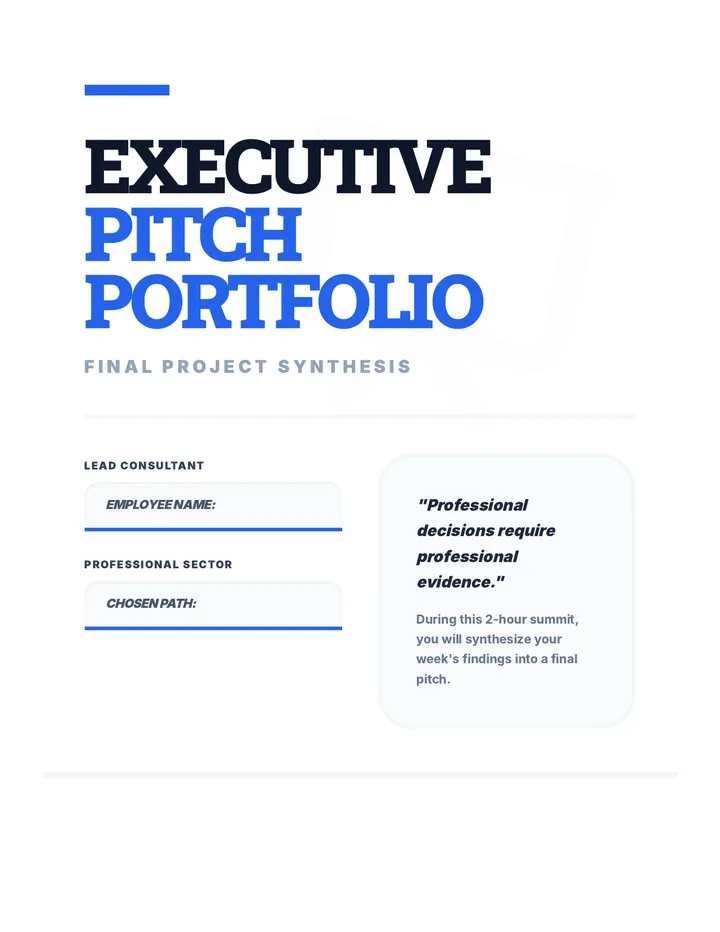
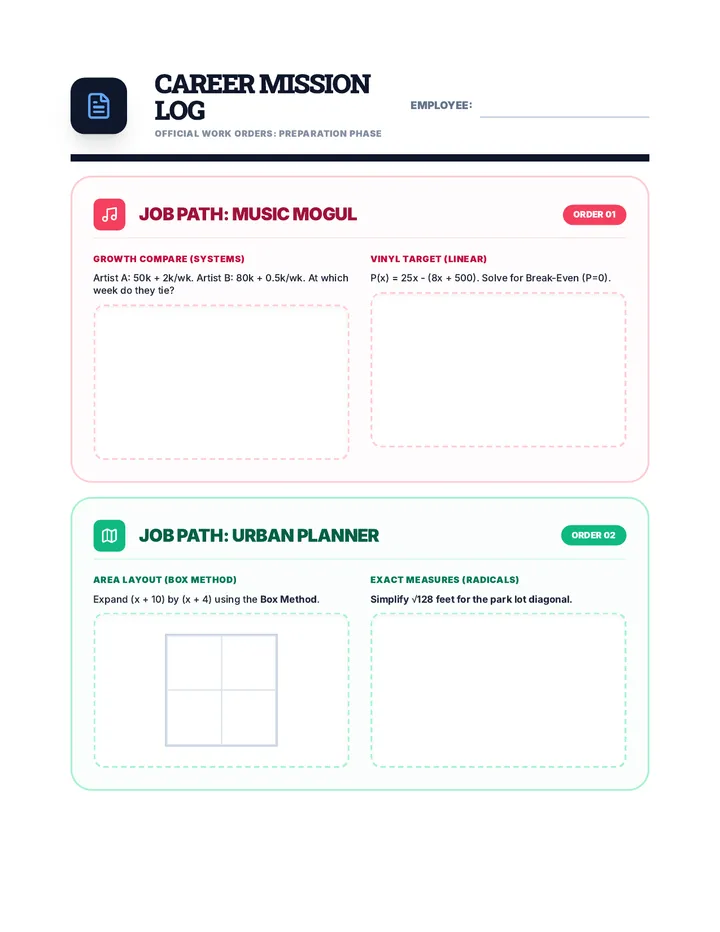
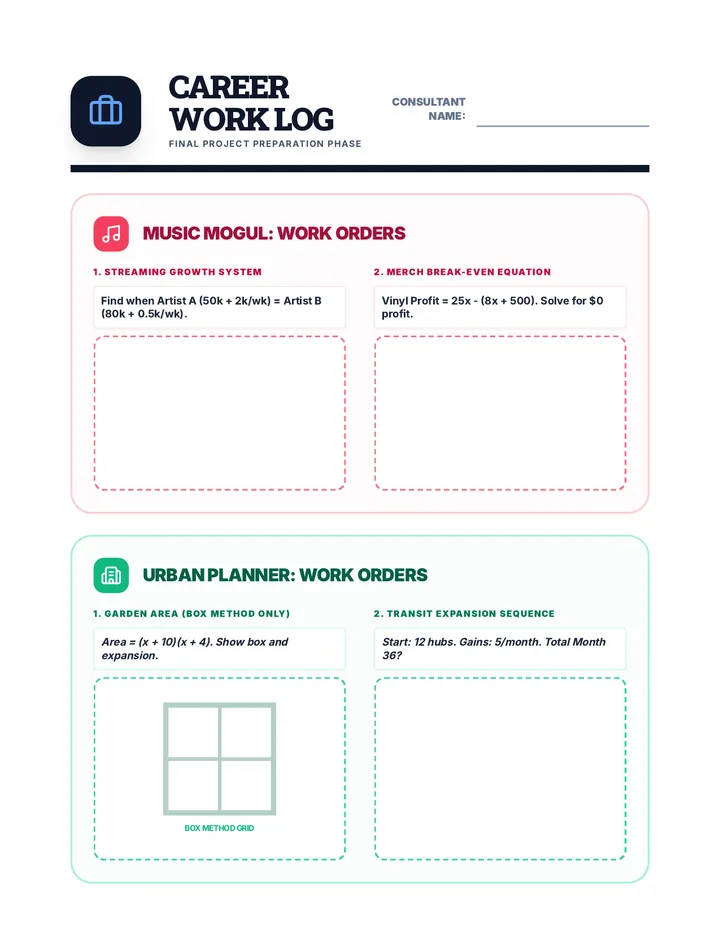
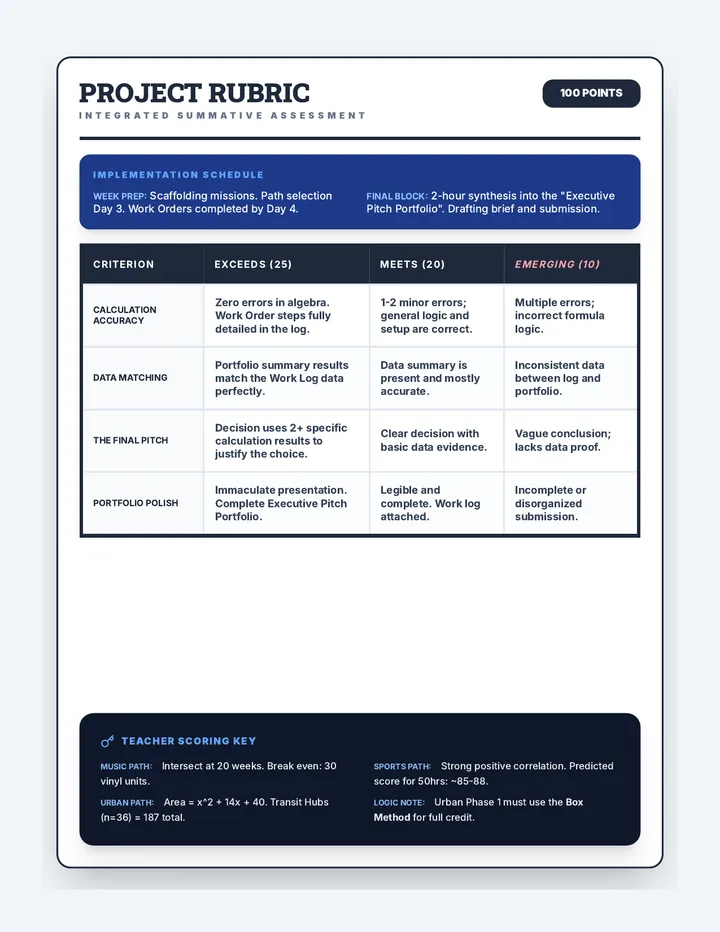
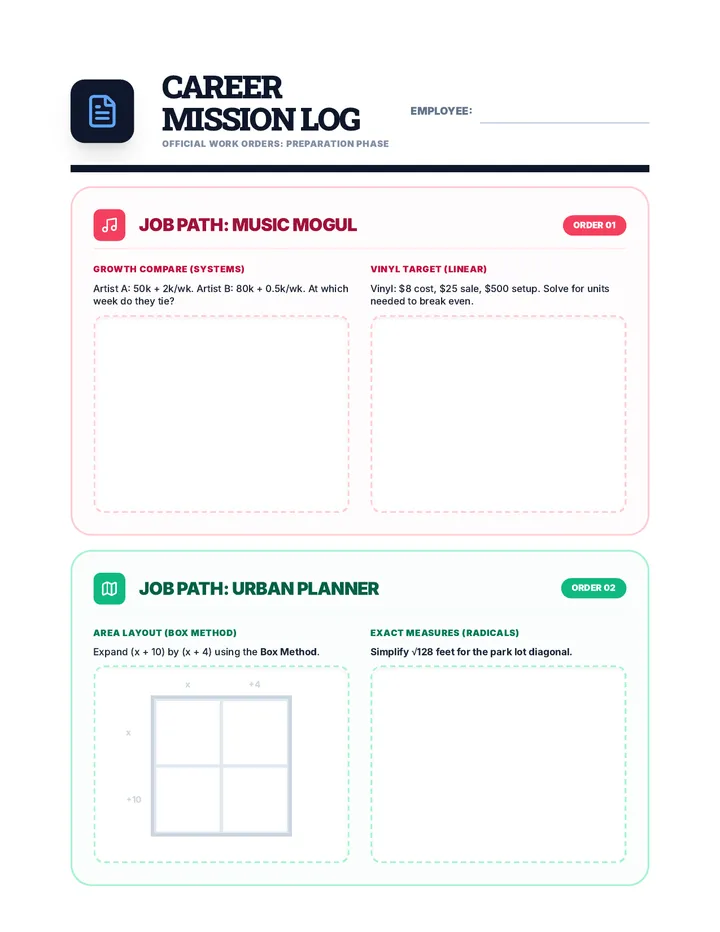
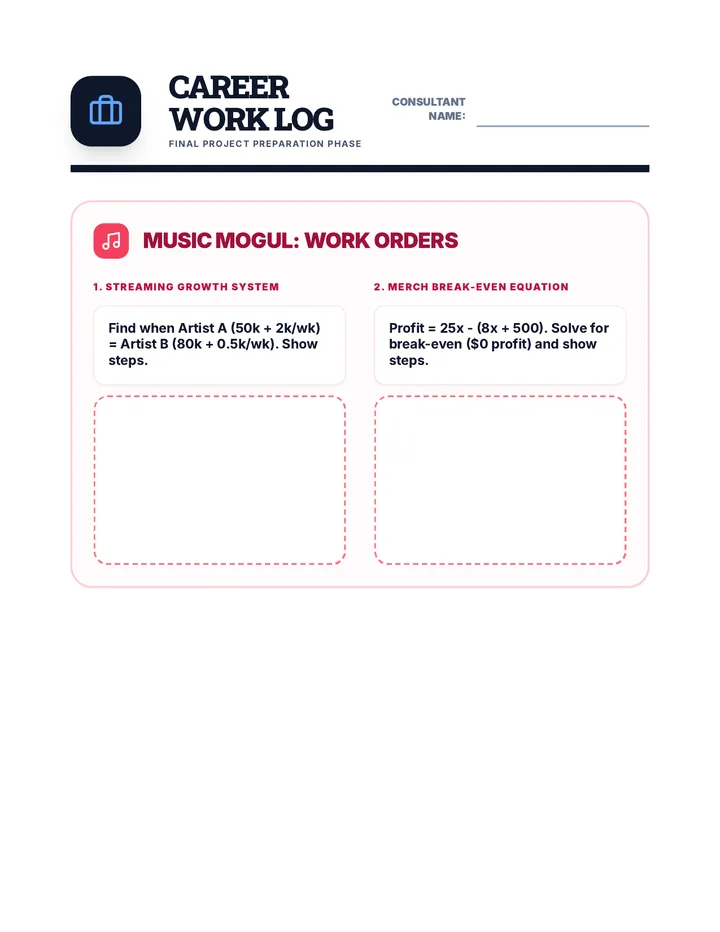
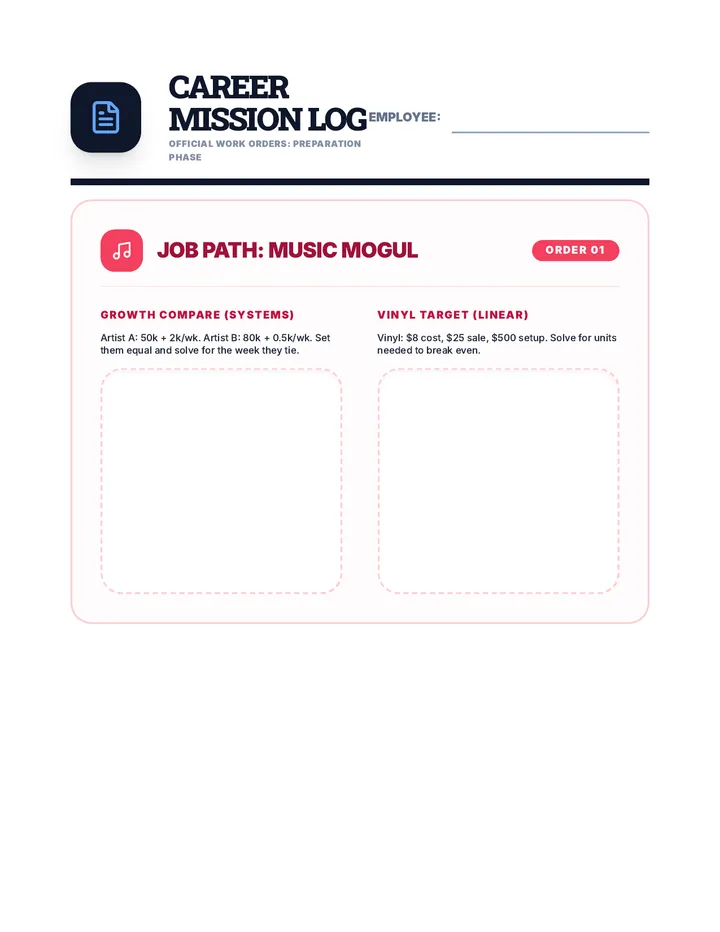
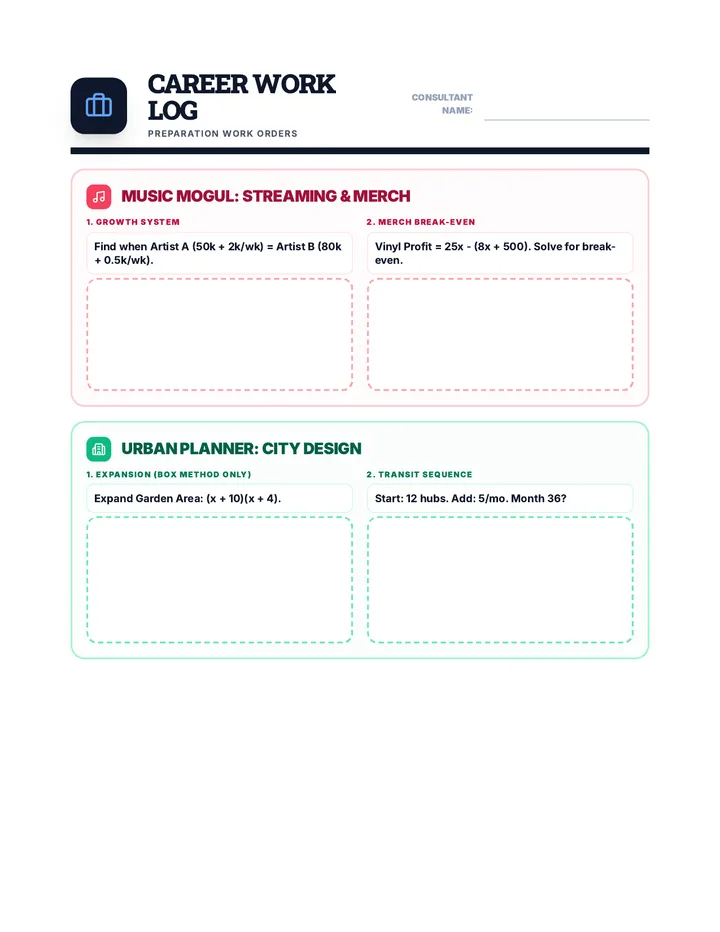
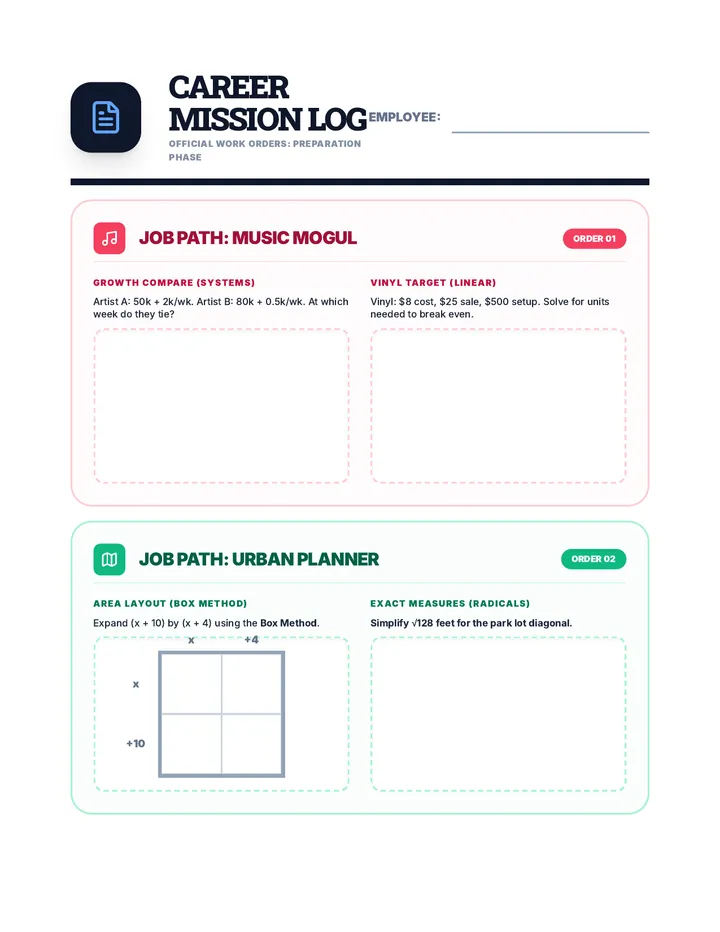
A high-intensity, 2-hour math simulation where students act as lead consultants. They complete a scaffolded Skill Warmup before choosing one of four career paths (Music, Urban, Rocket, or Sports) to solve real-world "Work Orders" and delivering an Executive Pitch.
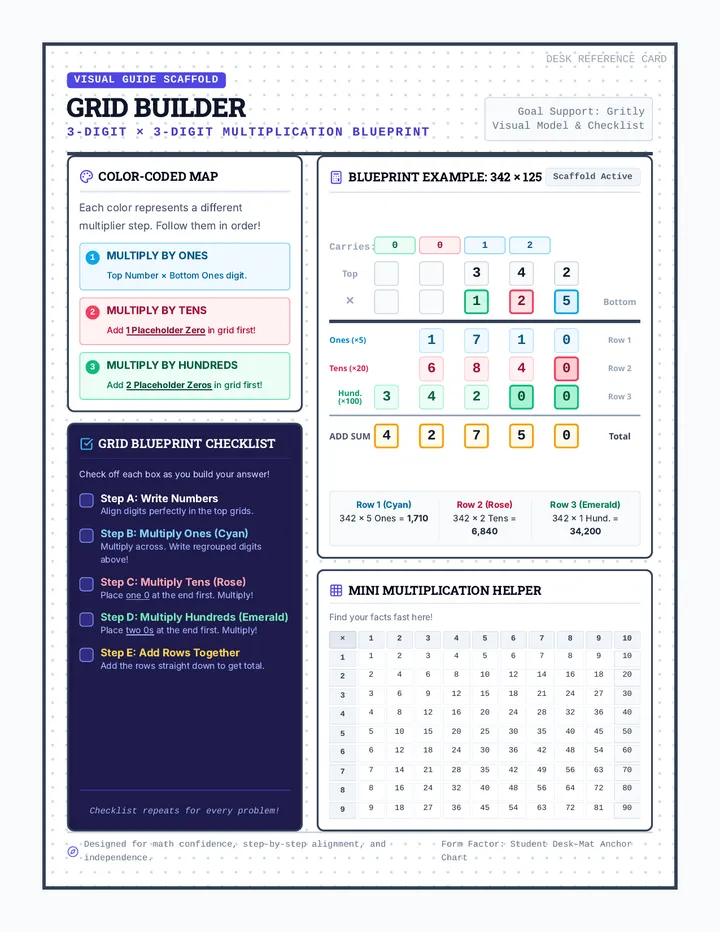
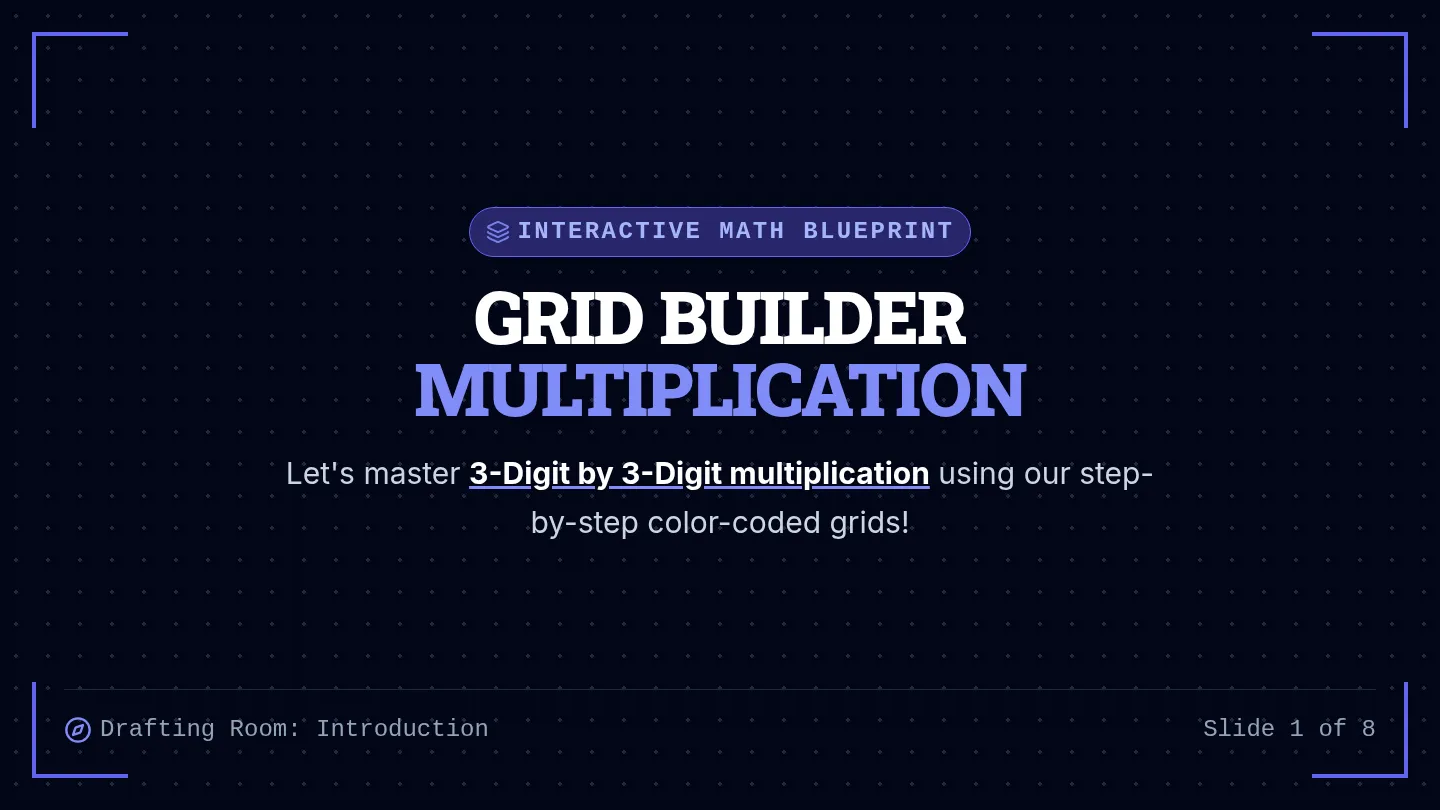
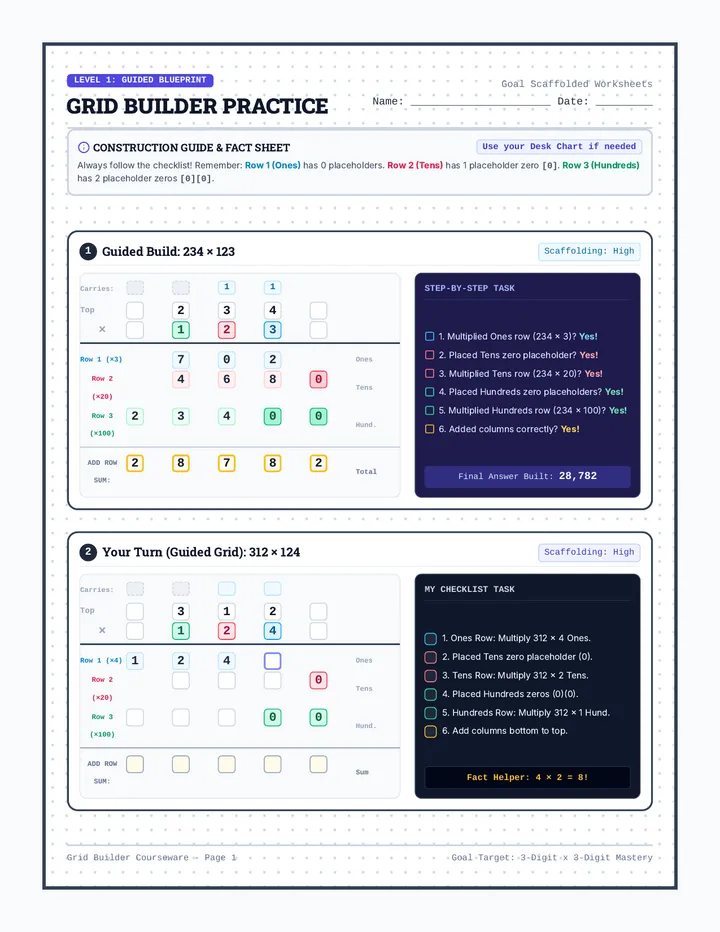
A highly structured, scaffolded lesson designed to help students master three-digit by three-digit multiplication using color-coded grids, a step-by-step task-analysis checklist, and sequential progress monitoring.
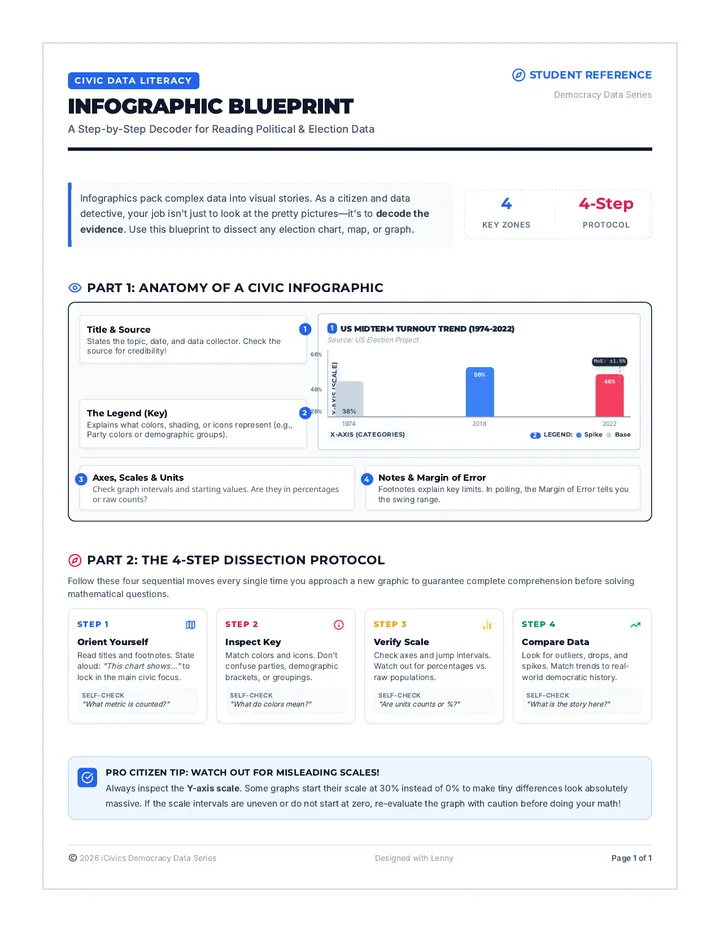
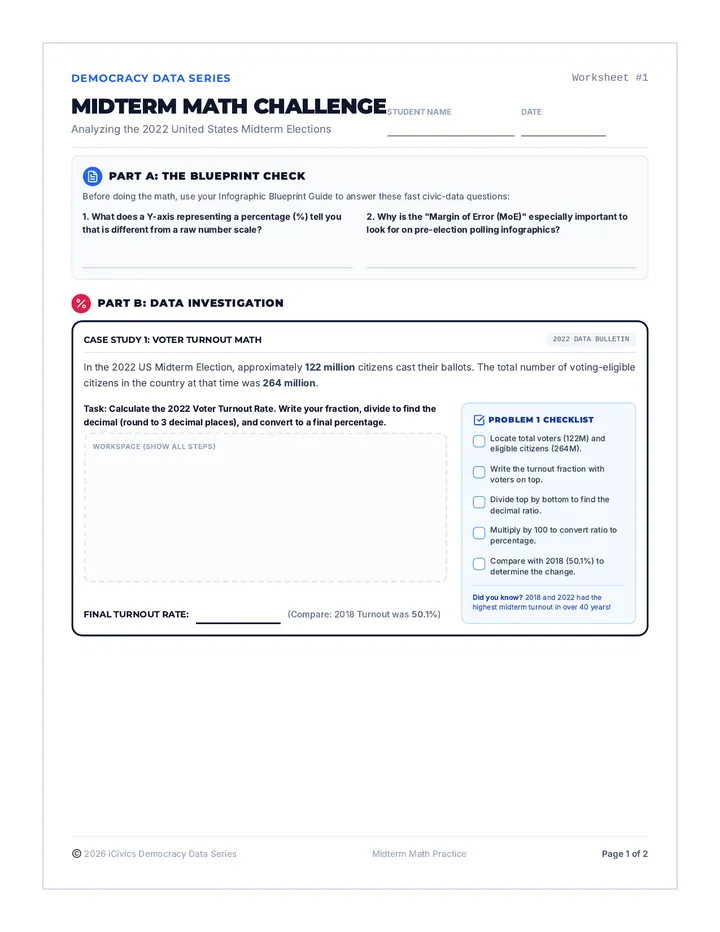
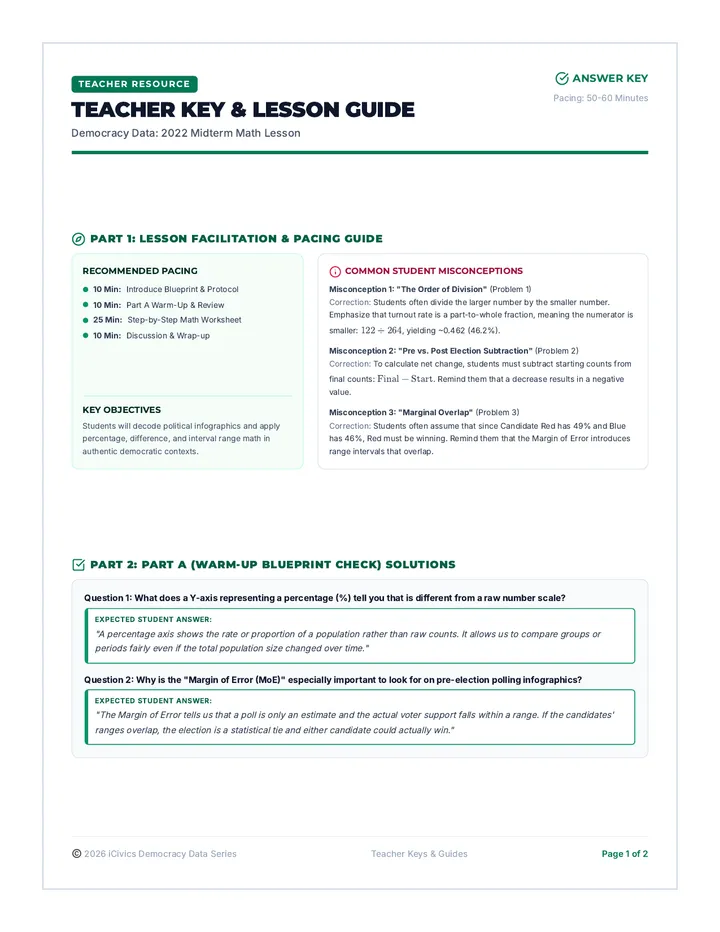
A civic-minded math lesson where students analyze real-world data from the 2022 midterm elections. Students learn to navigate complex infographics using structured reading strategies and tackle data-driven math questions with supportive step-by-step checklists.
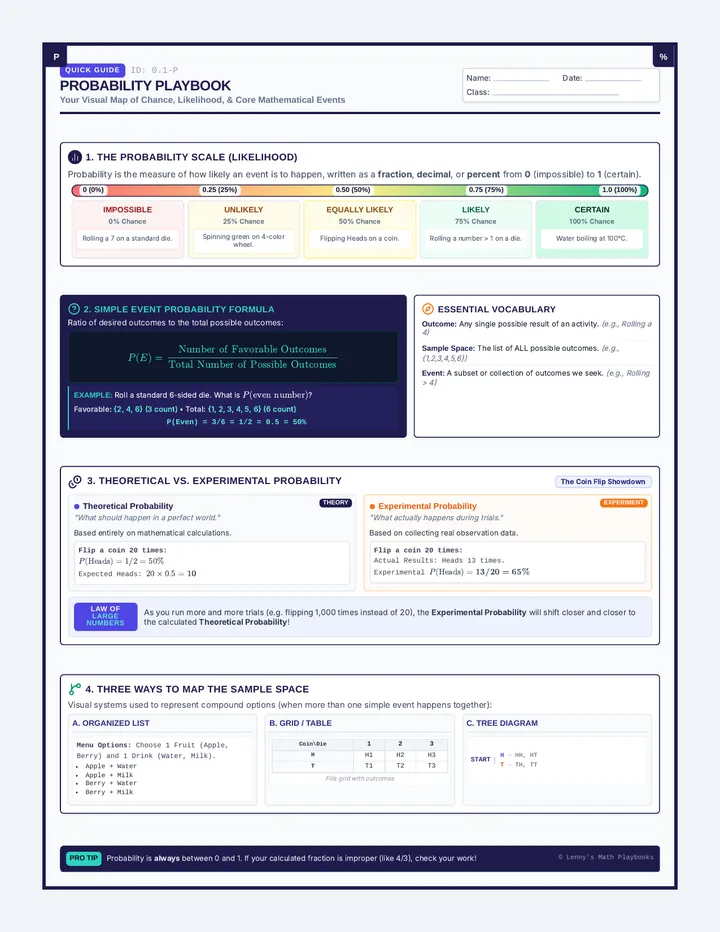
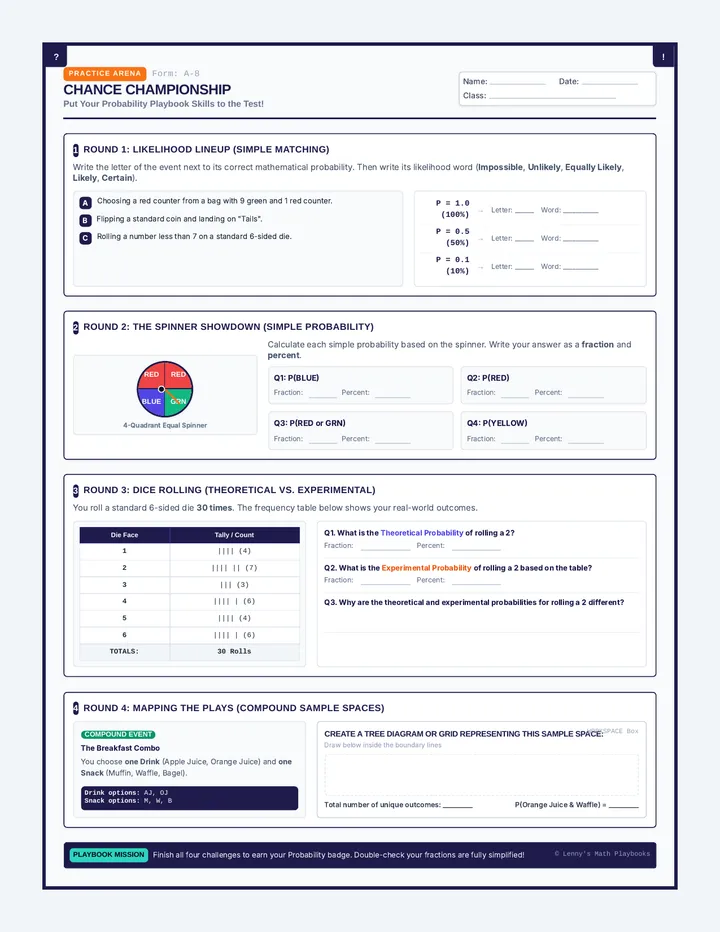
A foundational lesson block designed for middle school students to master probability concepts, covering simple events, sample spaces, likelihood, and experimental versus theoretical probability.
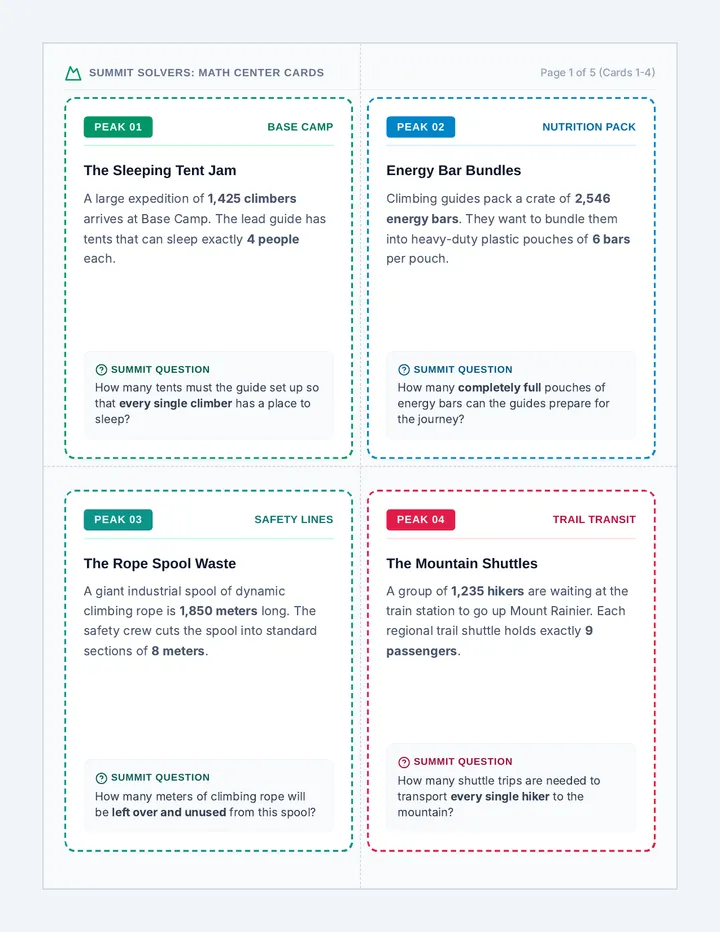
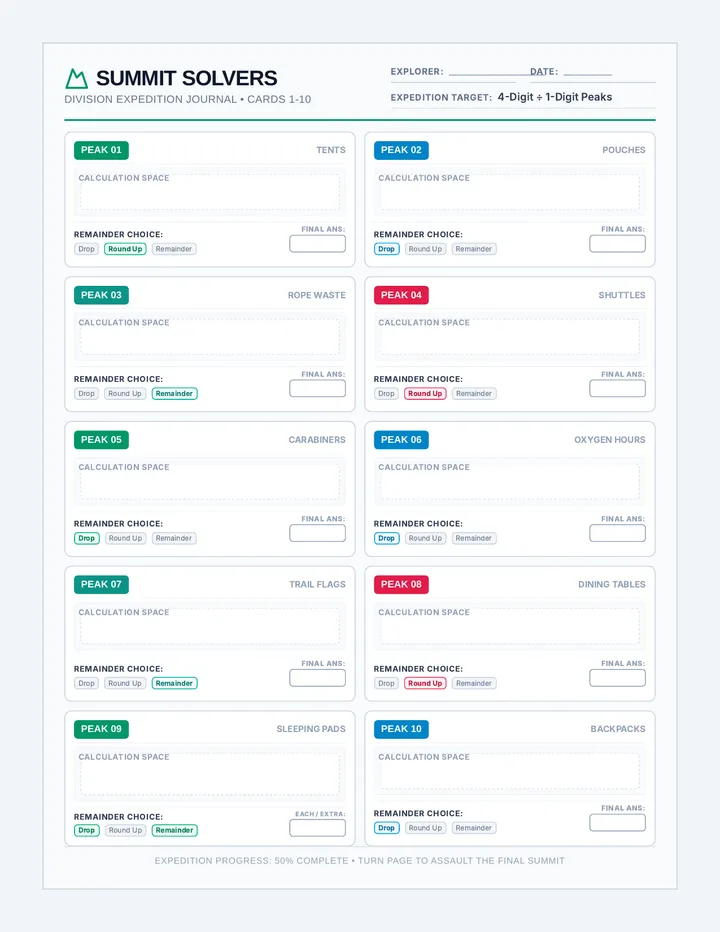
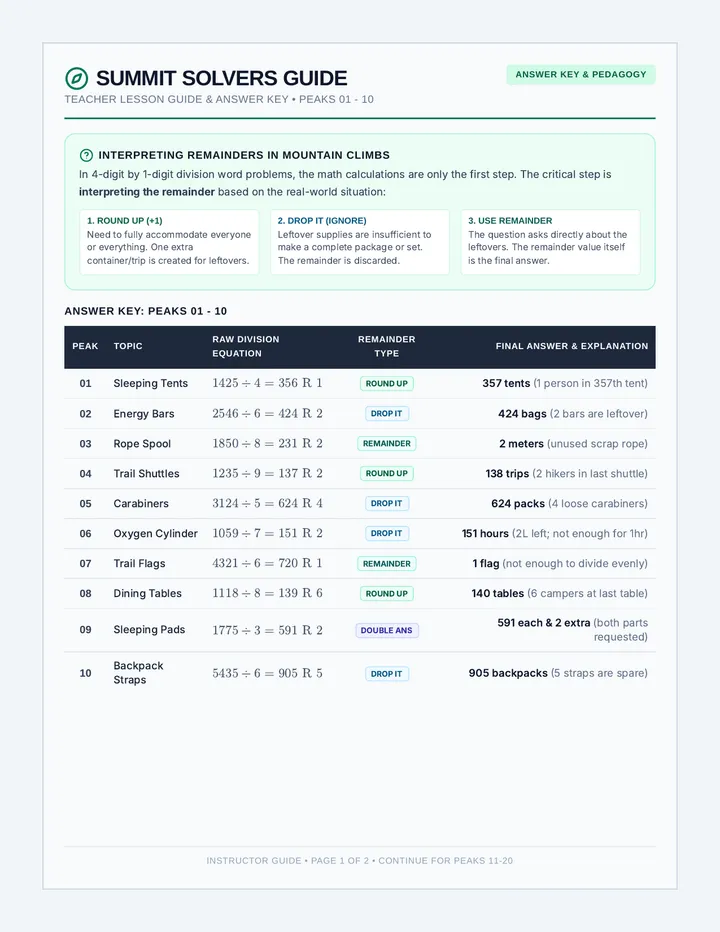
A math lesson focused on solving and interpreting 4-digit by 1-digit division word problems with remainders in a mountain climbing theme. Includes task cards, a recording sheet, and a detailed teacher answer guide.
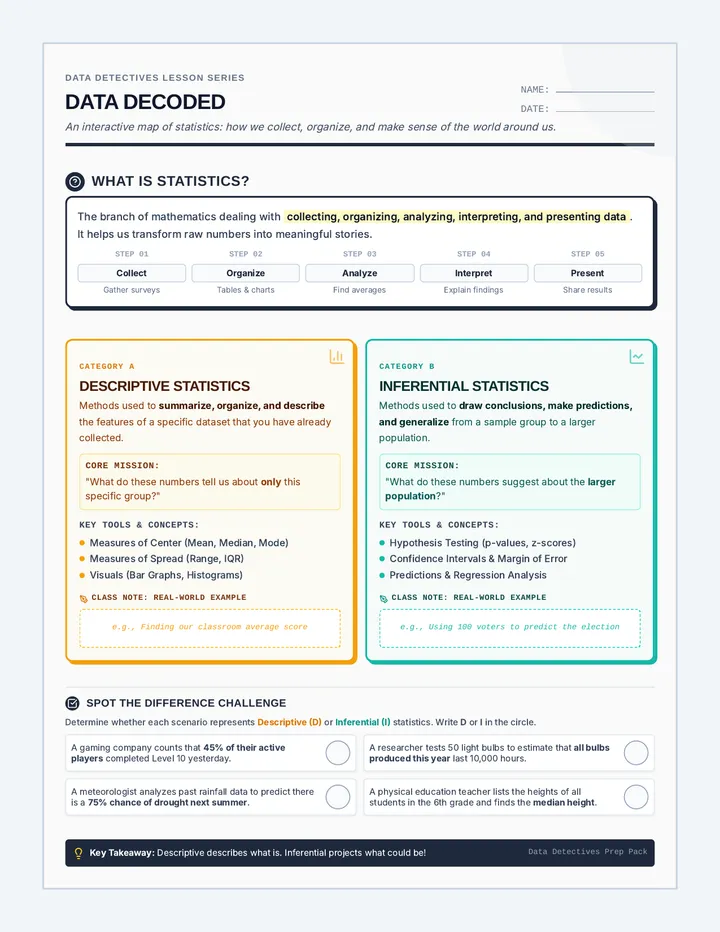
An introductory lesson to understanding what statistics is, exploring the difference between descriptive and inferential statistics, and engaging with data concepts.
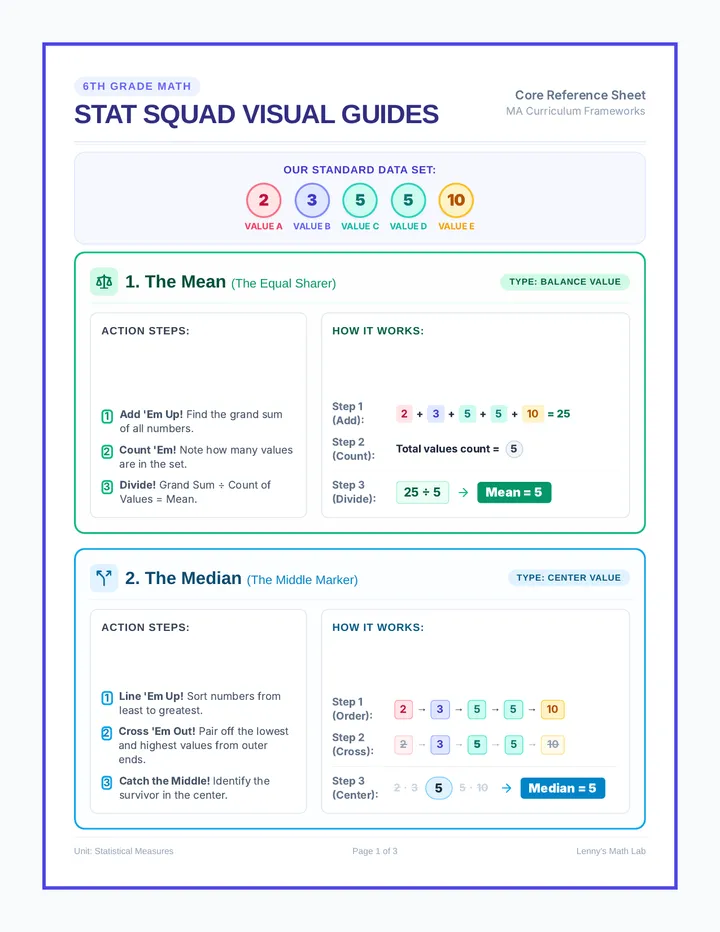
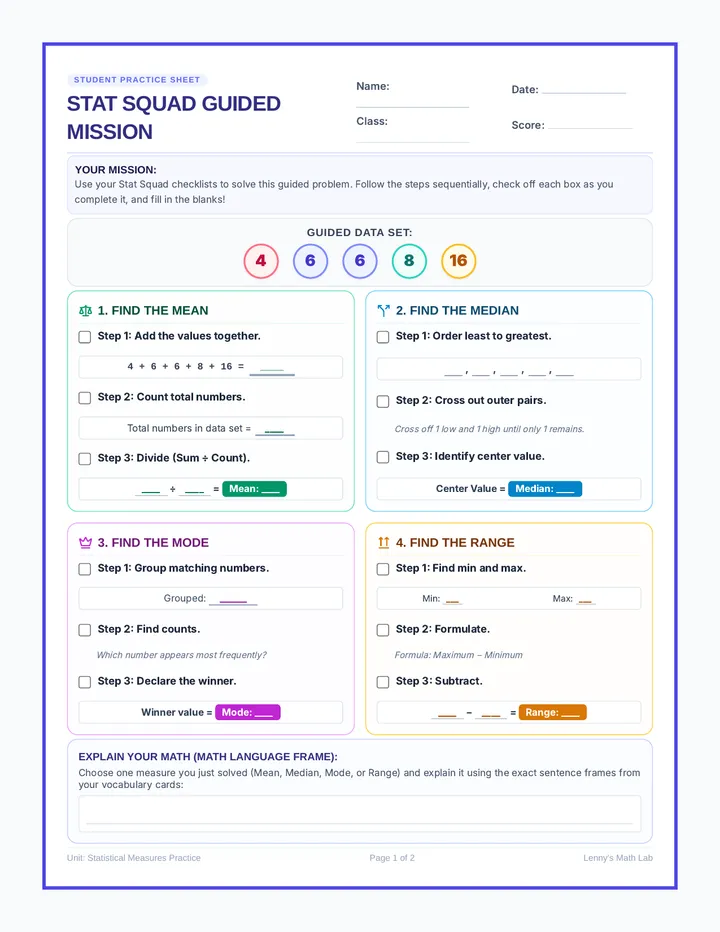
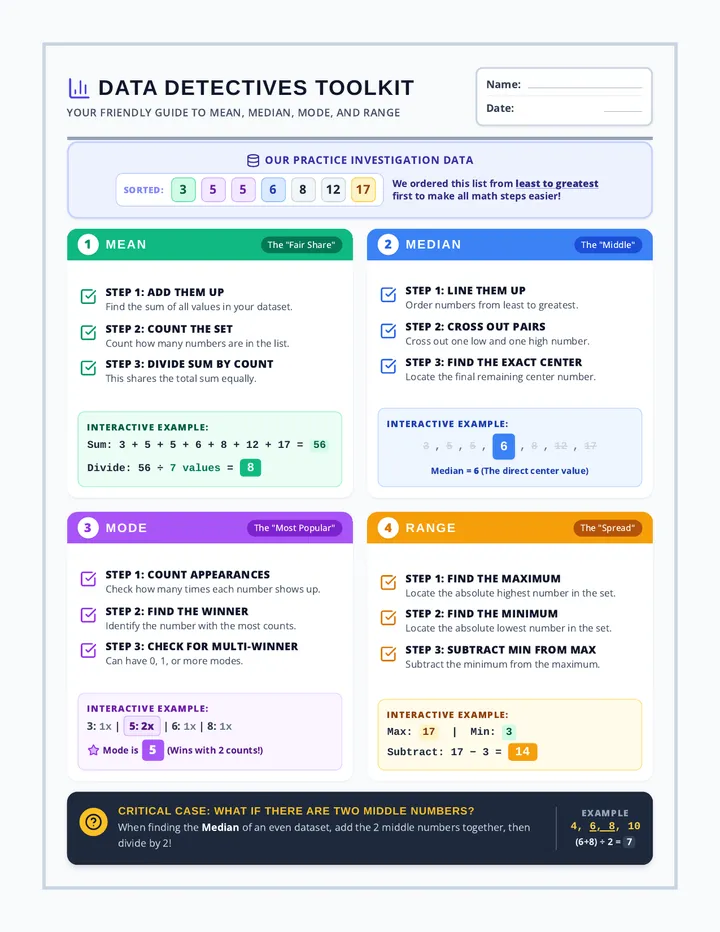
A visual, color-coded introduction to mean, median, mode, and range for 6th grade math. This lesson includes comprehensive, highly accessible anchor charts and structured practice guides with checklists and vocabulary focus cards.
A foundational lesson introducing 6th grade statistics concepts including measures of center (mean, median, mode) and variation (range) with visually accessible reference materials.
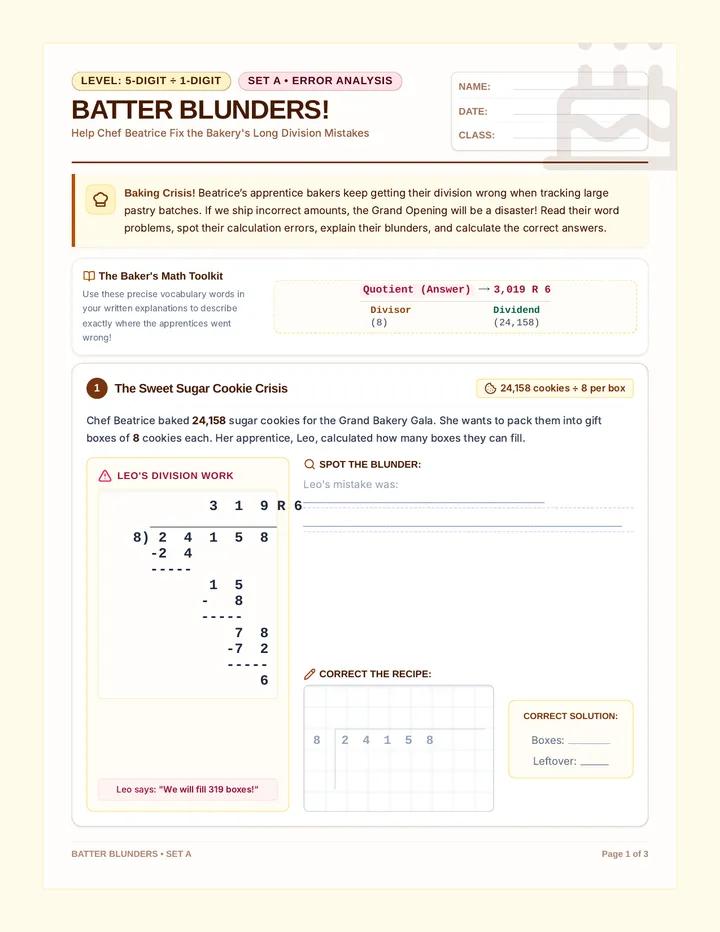
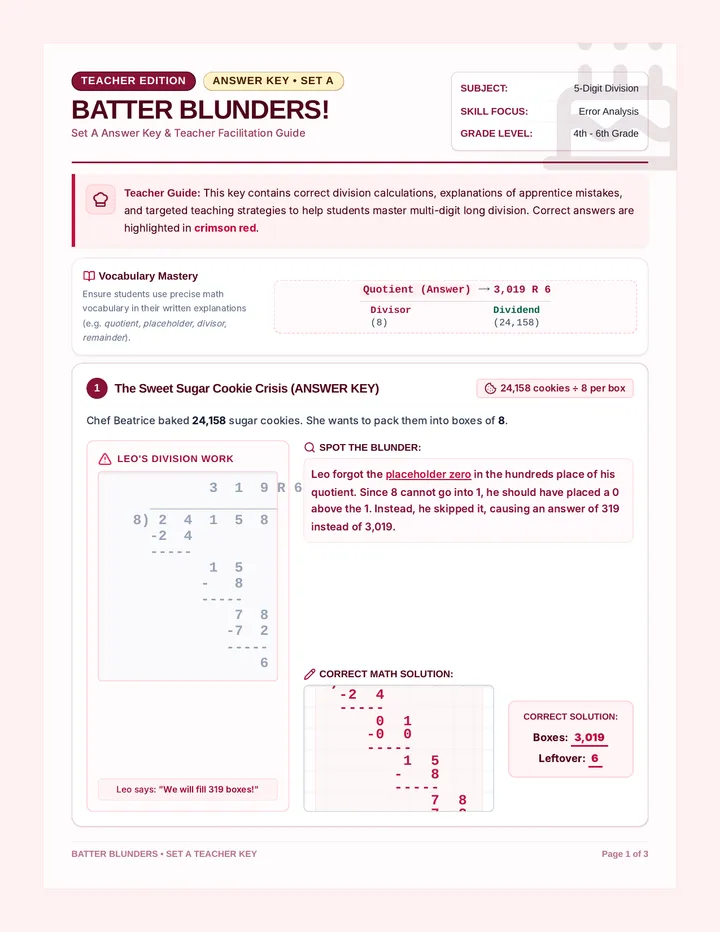
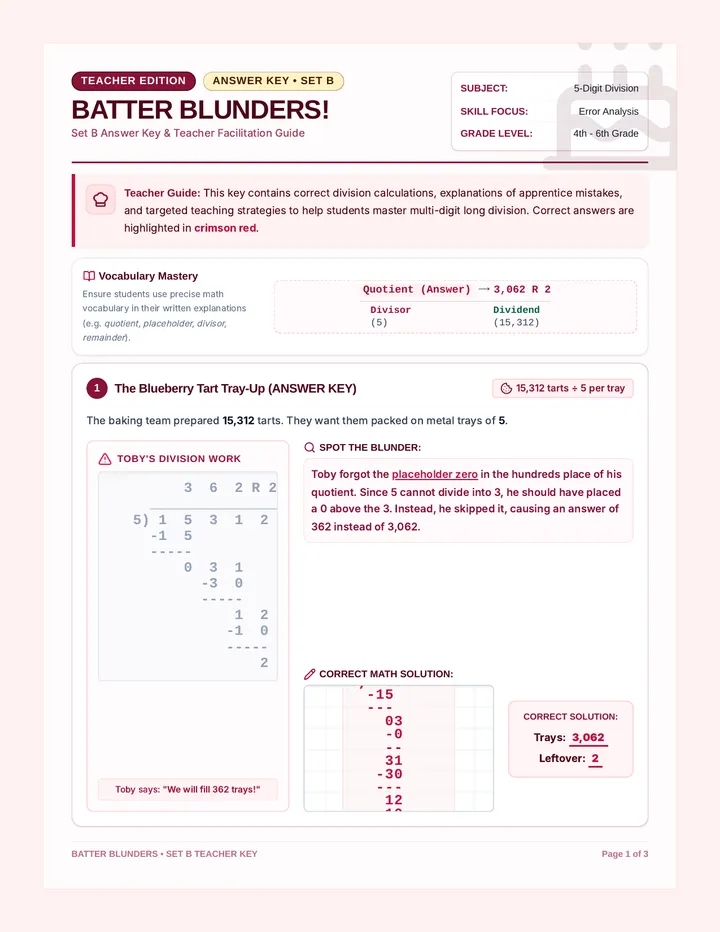
A sweet, bakery-themed math lesson where students analyze five-digit division problems to identify, explain, and correct common calculation mistakes.
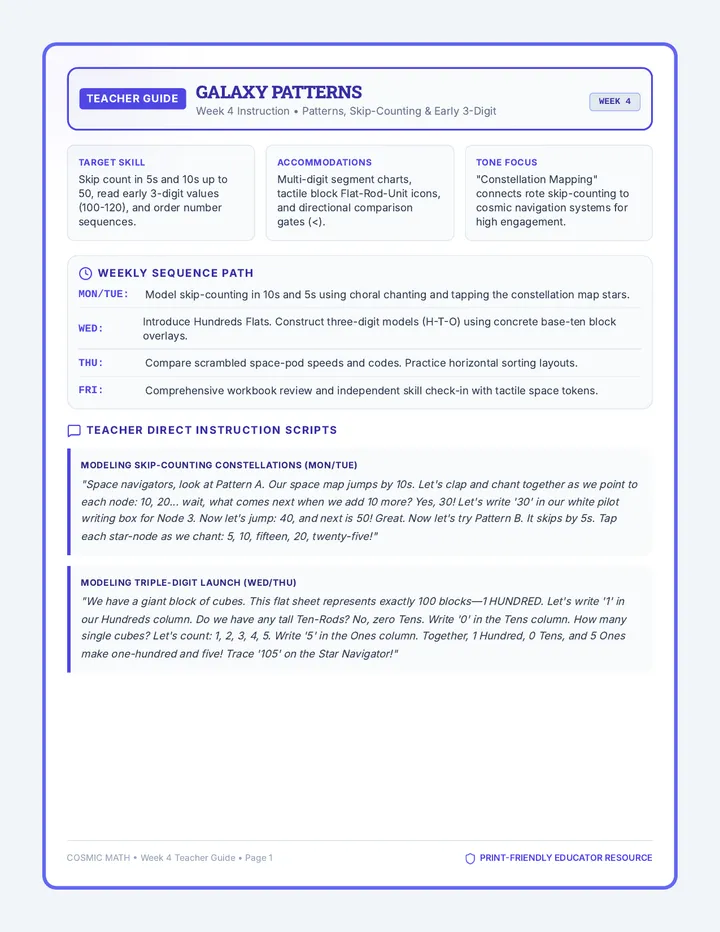
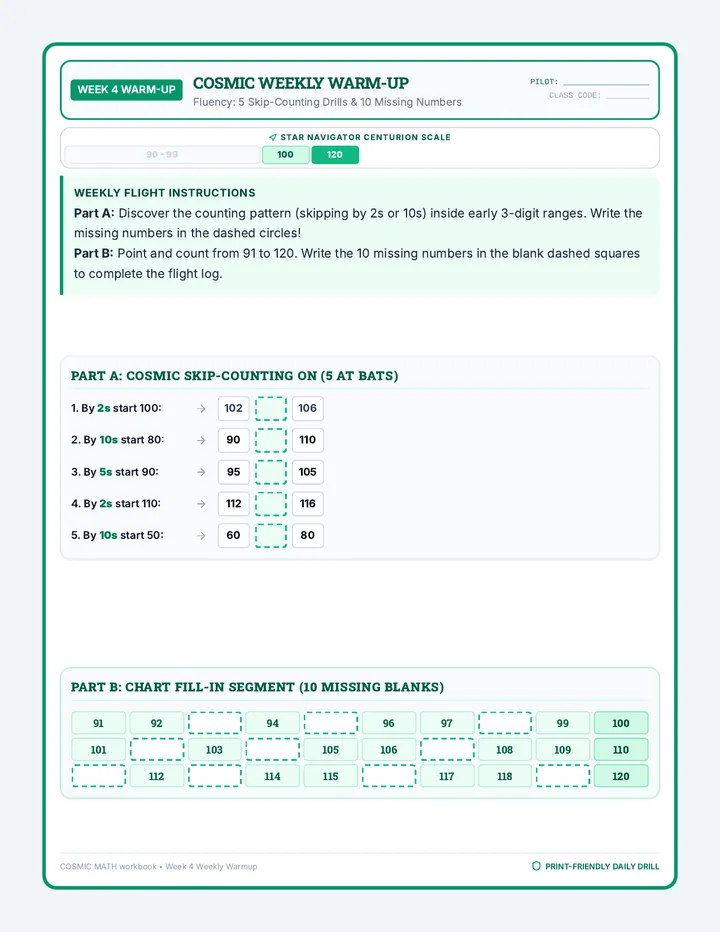
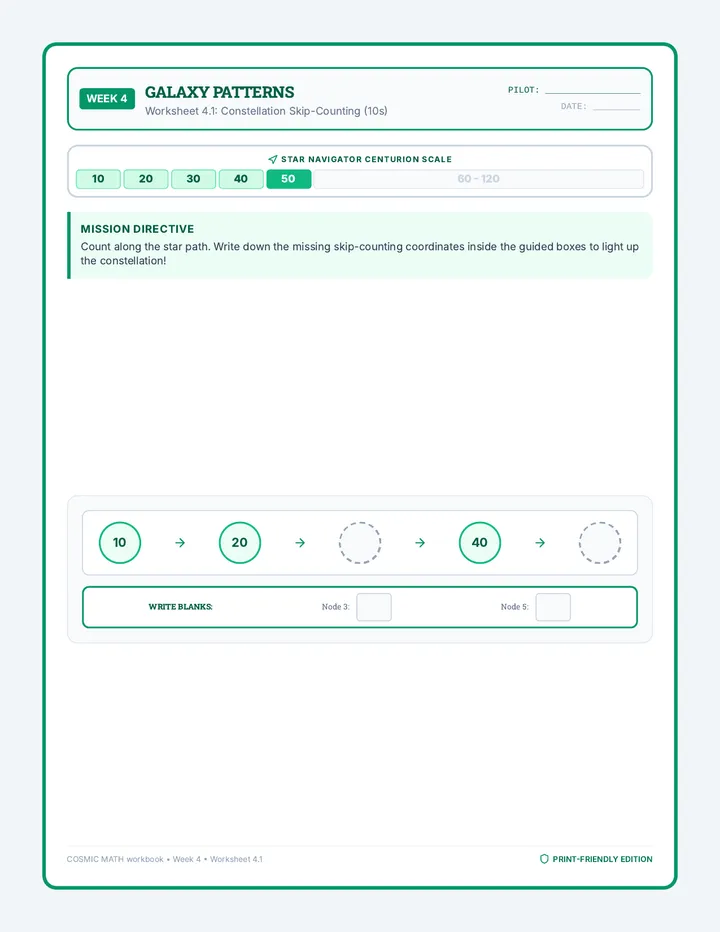
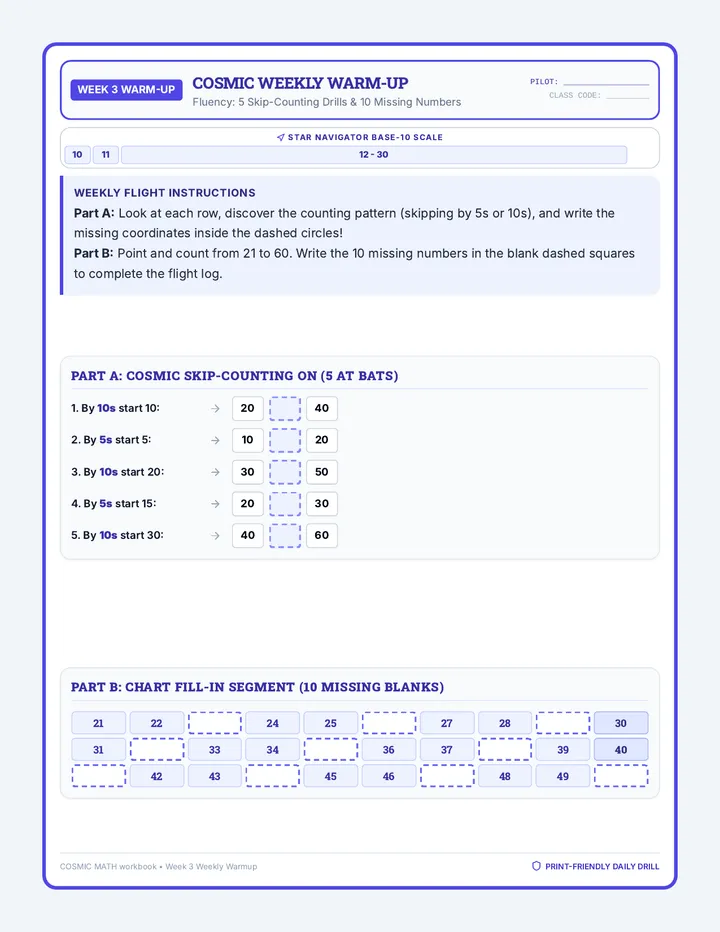
Introduces early 3-digit numbers (100-120), visual skip-counting (2s, 5s, 10s) using constellation maps, and ordering cosmic objects to build sequential logic.
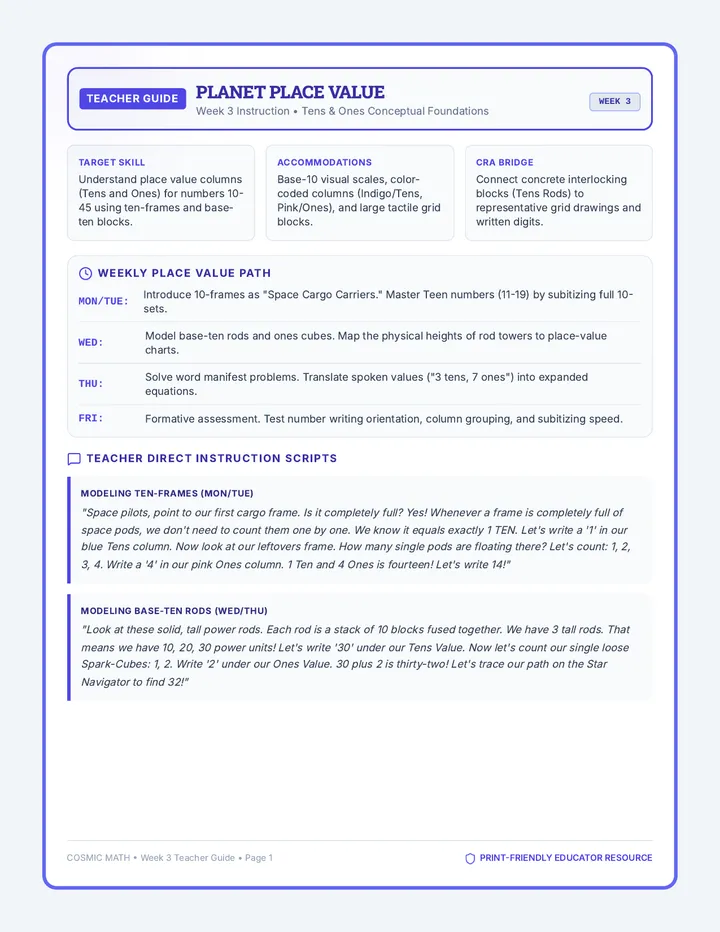
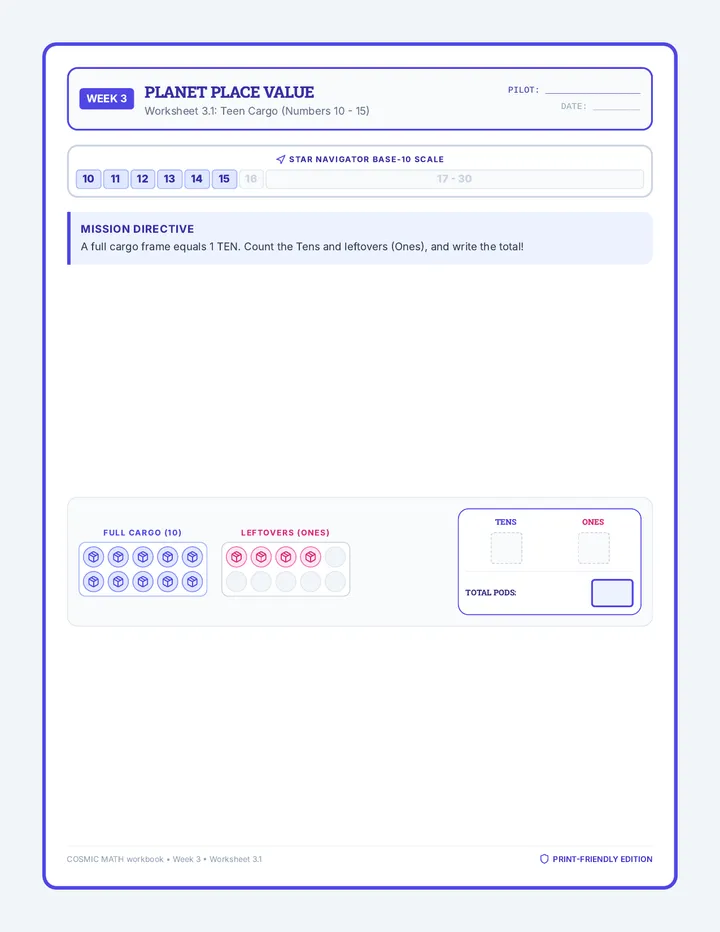
Focuses on identifying double-digit numbers (10-99), representing them using ten-frames and printable base-ten icons, and writing numbers in expanded place value charts (tens and ones) with clear physical boundaries.
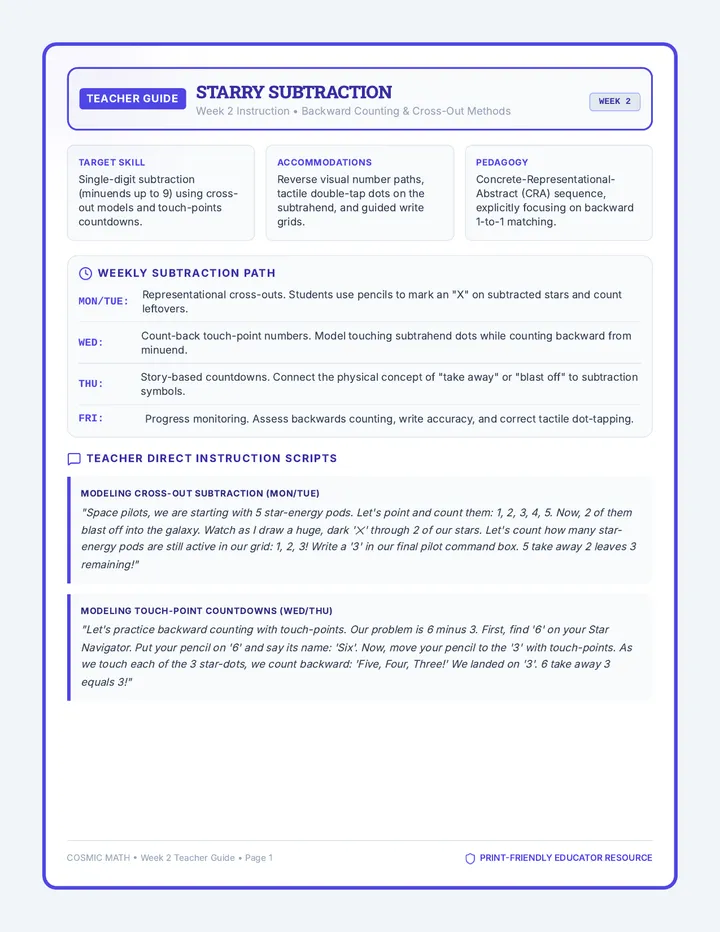
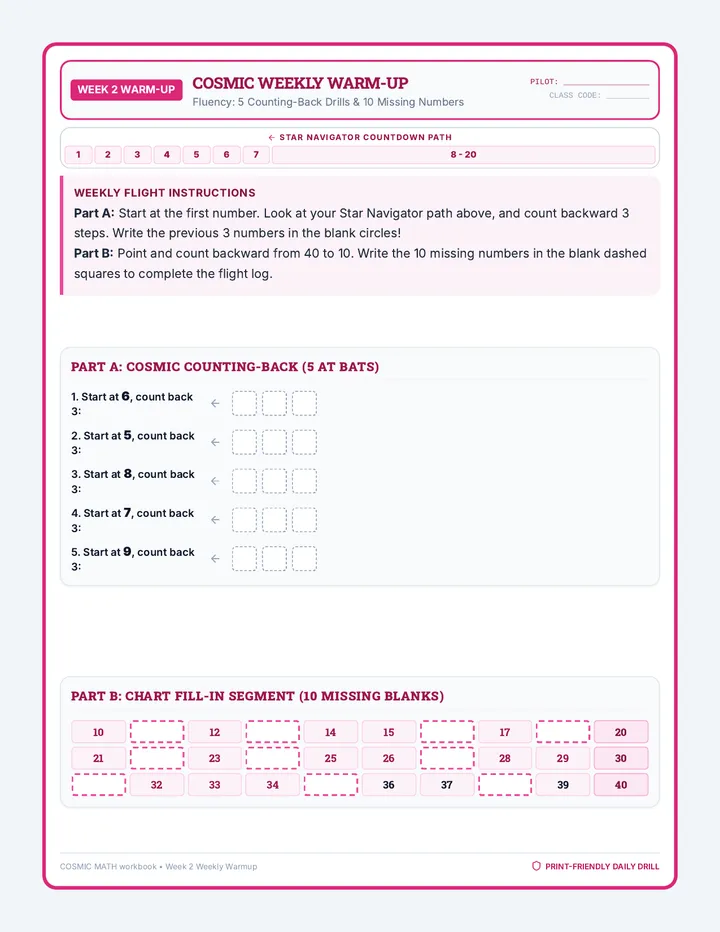
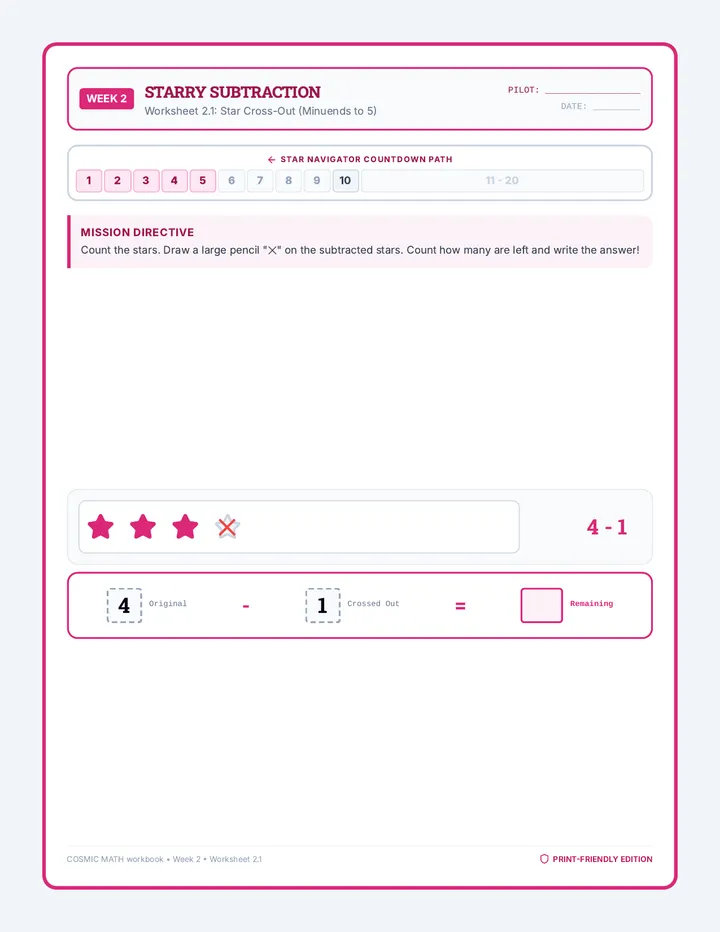
Covers single-digit subtraction (1-9) with cosmic countdowns, crossing-out stars or rocket fuel cells, embedded touch-points for backwards counting, and structured workspace templates.
Focuses on single-digit addition (1-9) using embedded touch-point numbers, pictorial representations of spaceships and stars, a persistent 1-20 number path, and large guided workspace boxes for physical alignment.
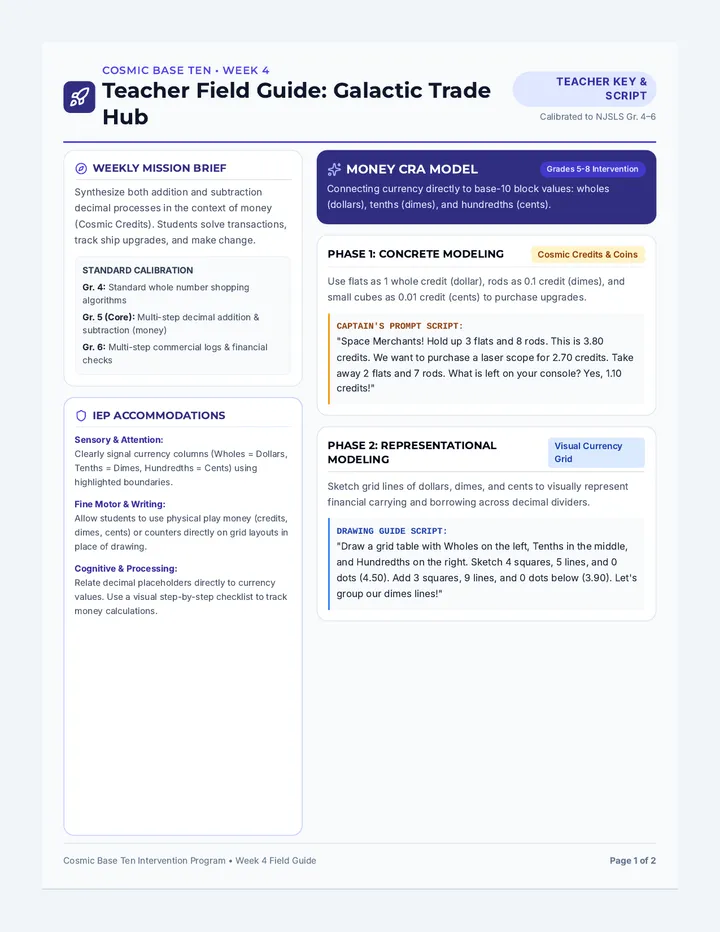
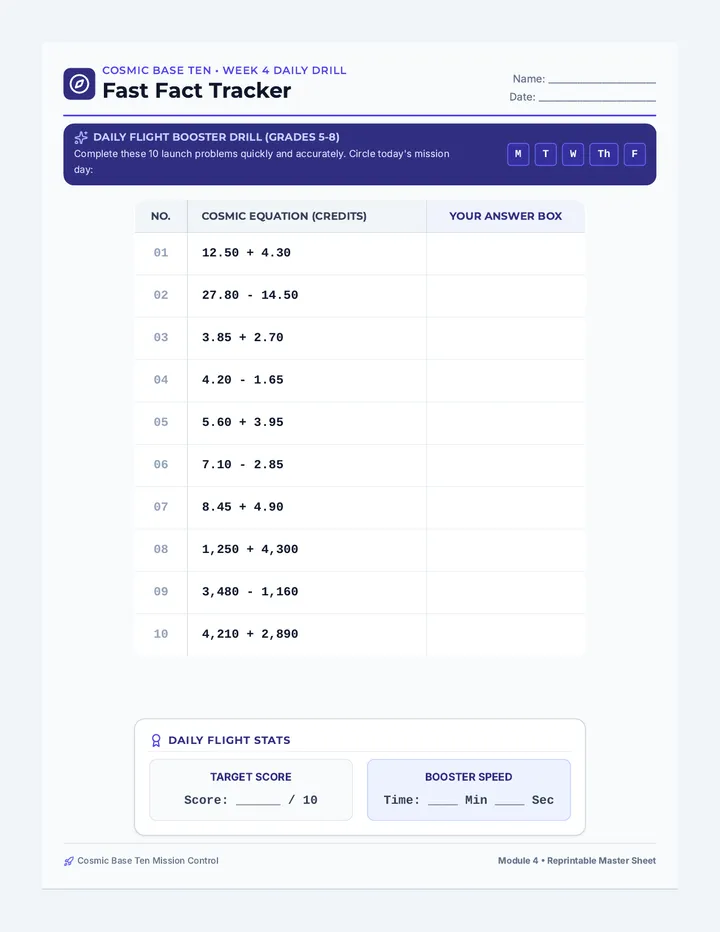
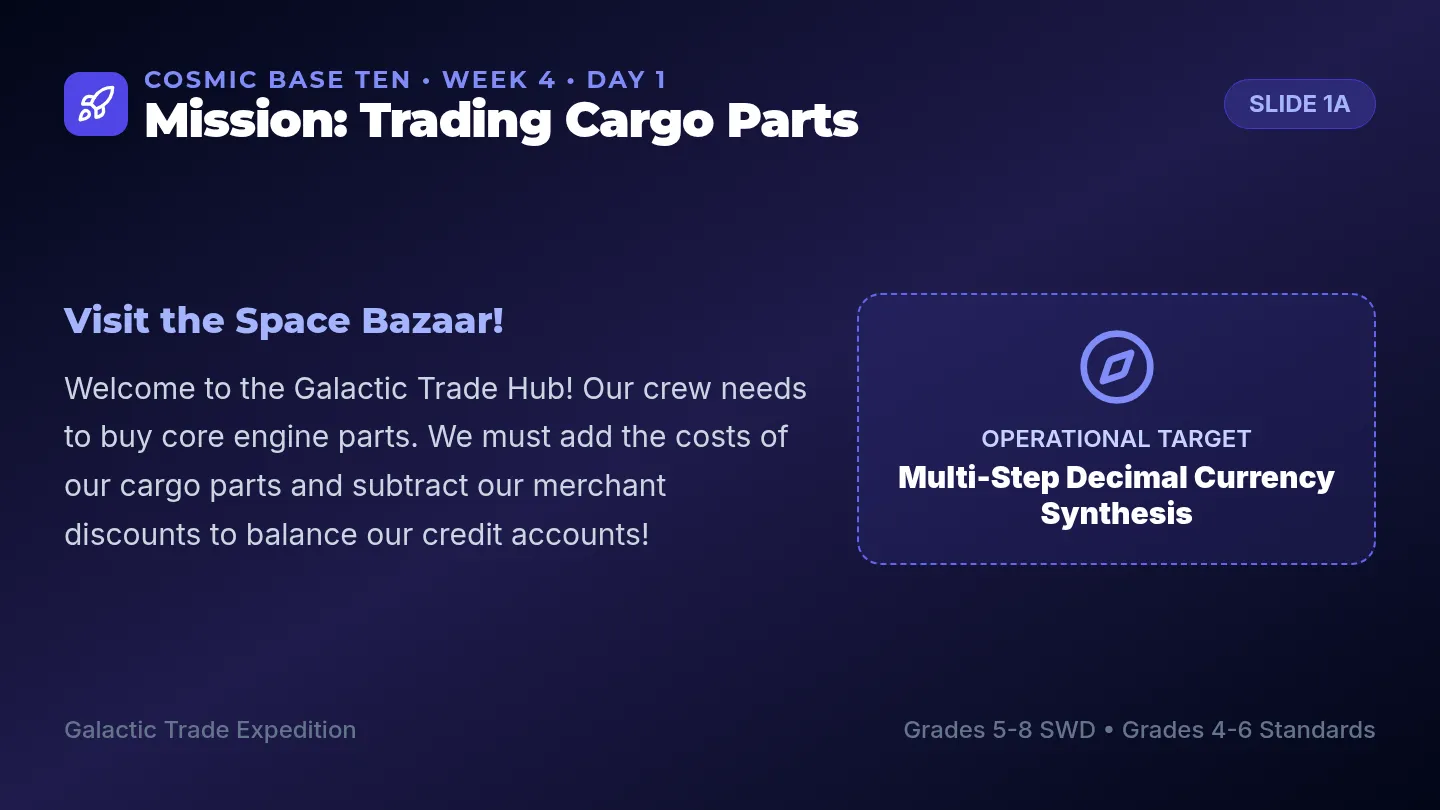
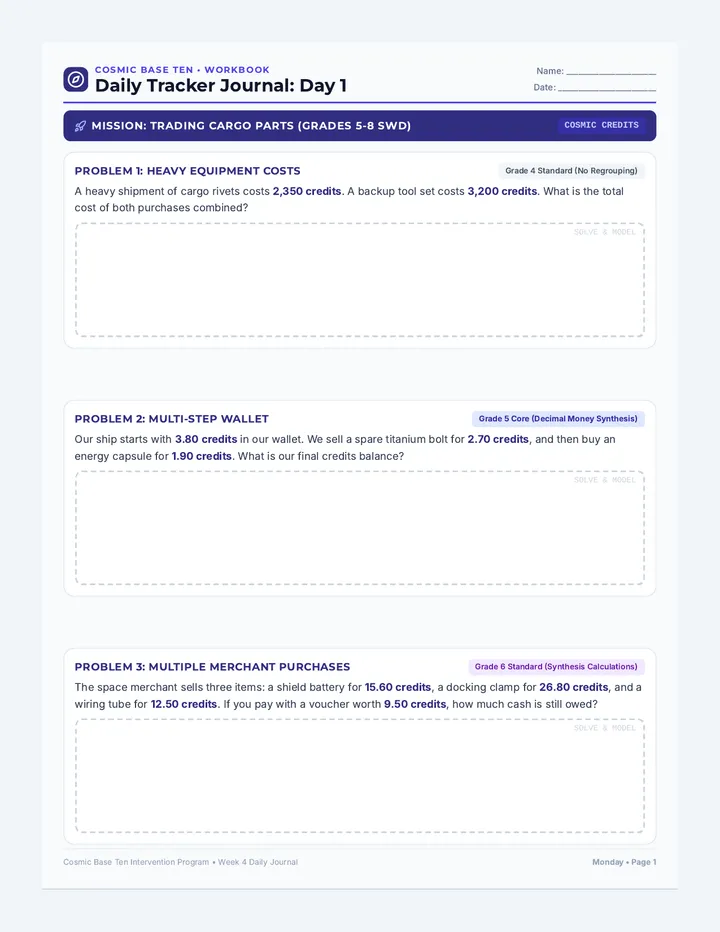
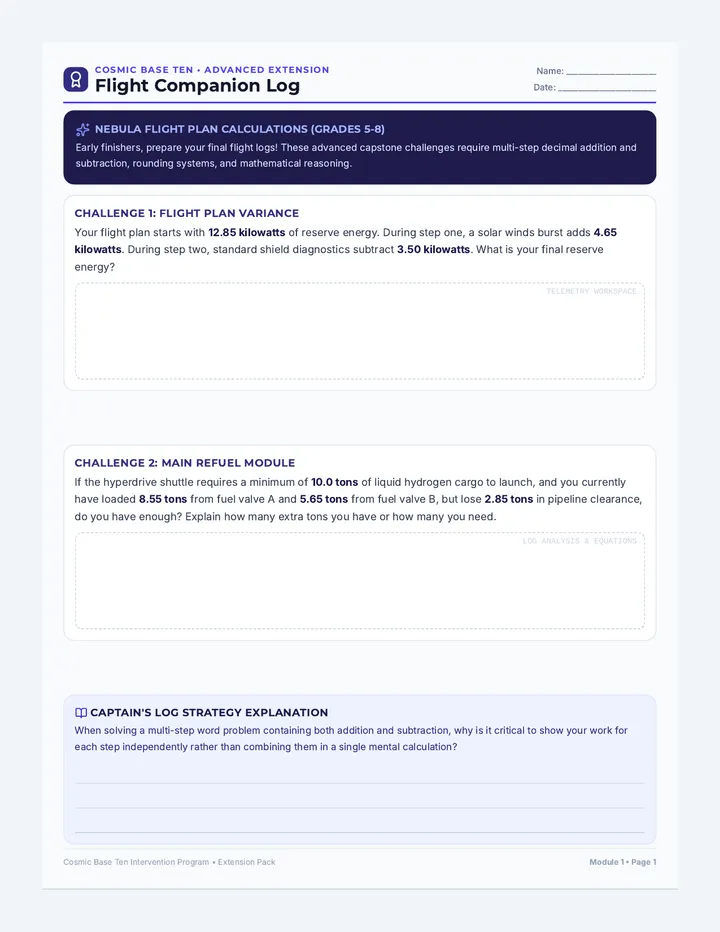
Week 4 is the capstone week where students synthesize their additive and subtractive decimal skills in the context of money. They solve multi-step commercial transactions, balance credit records, and purchase starship upgrades.