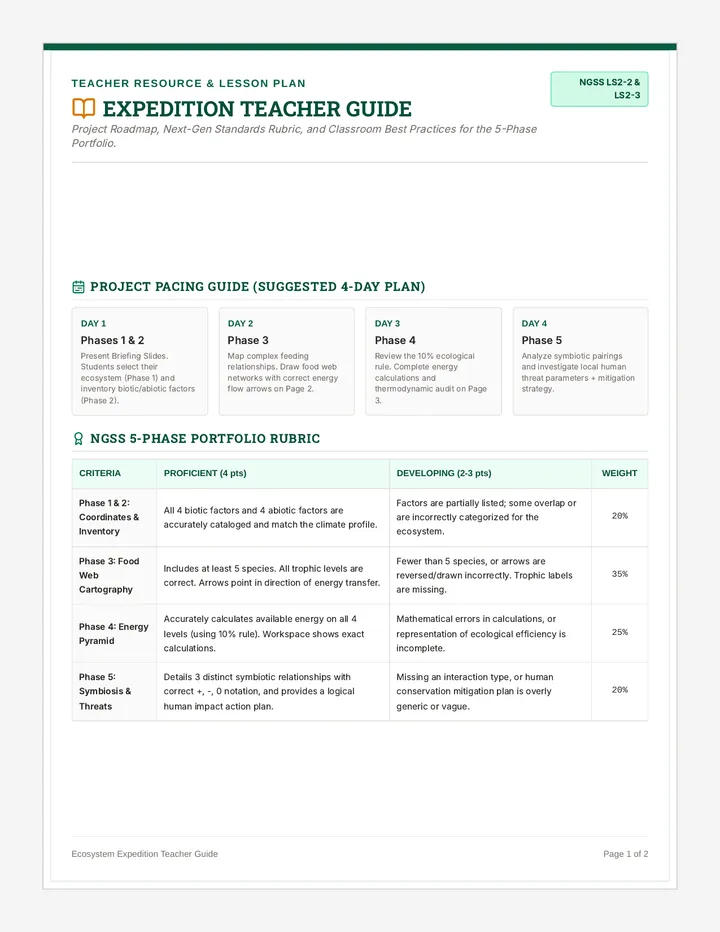
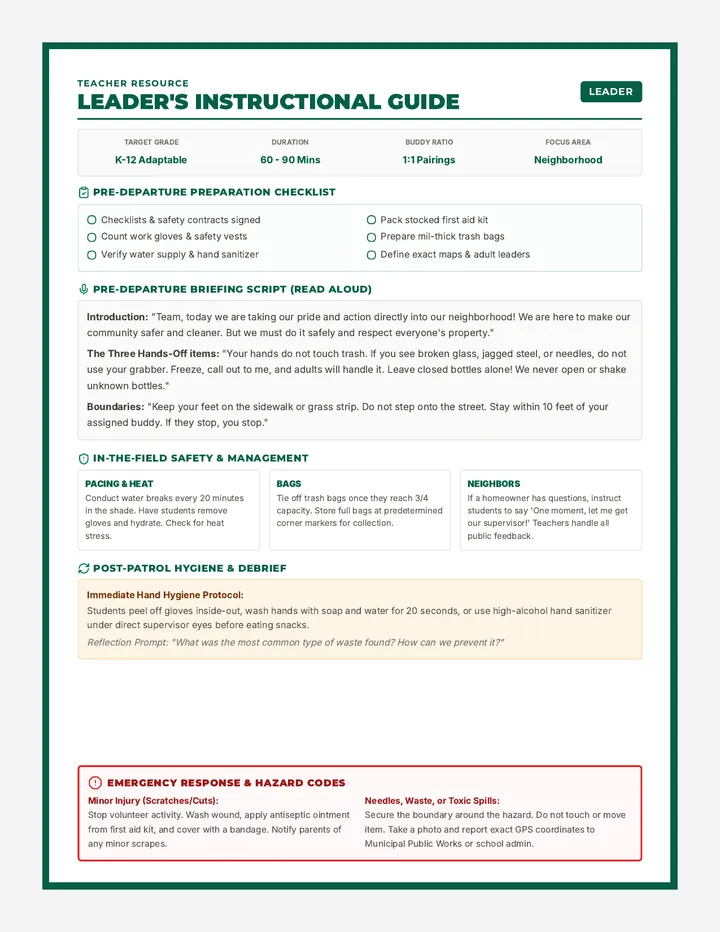
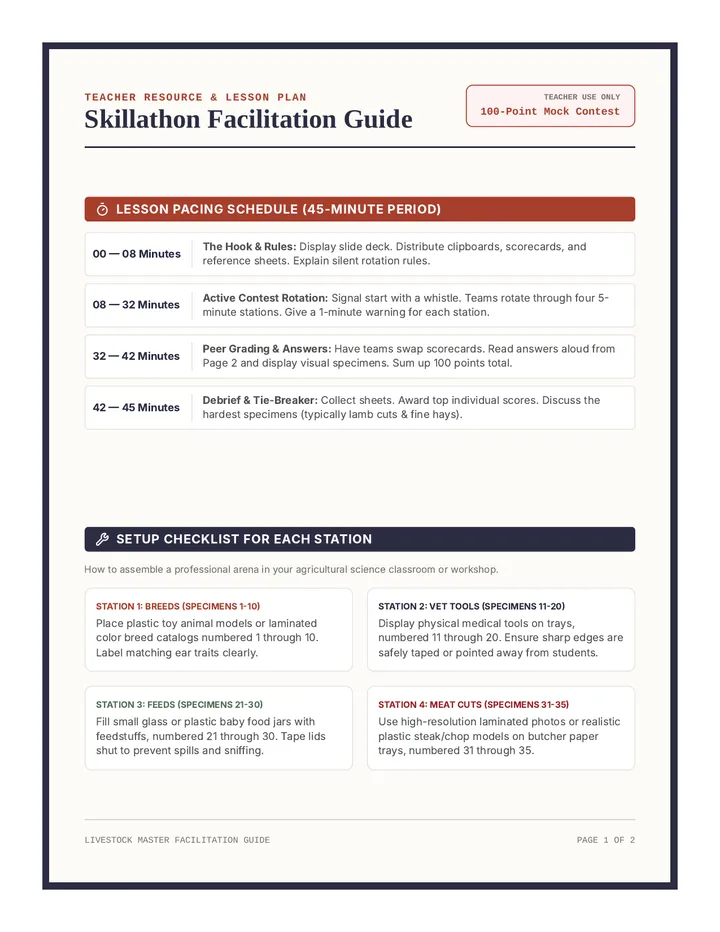
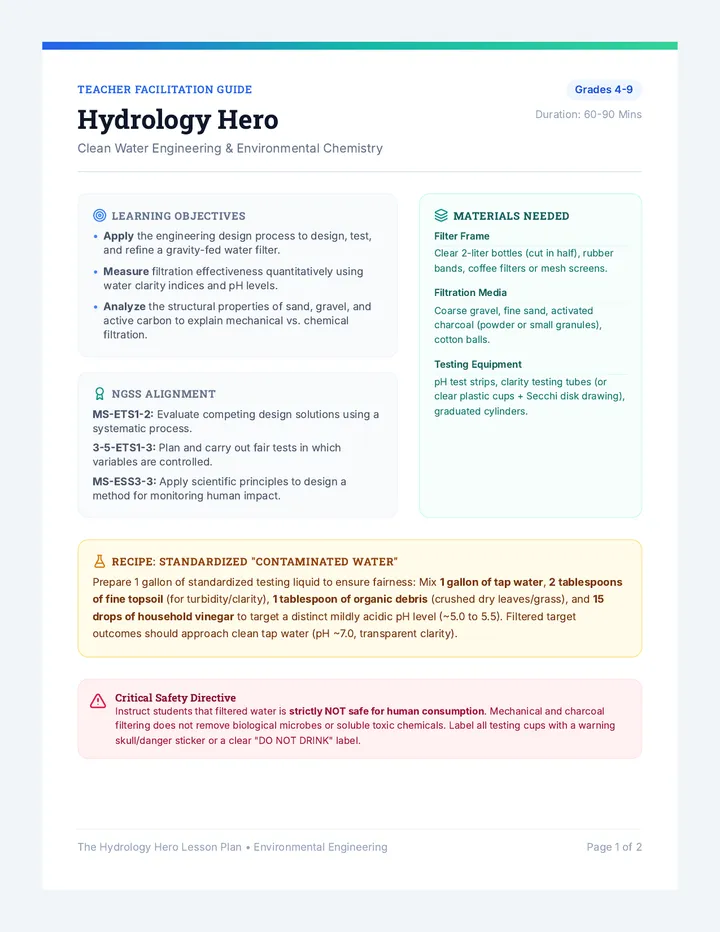
Thinking Machines Blueprint
A comprehensive teacher's guide for a 60-minute lesson on AI, including prep instructions, materials list, and a detailed instructional sequence.
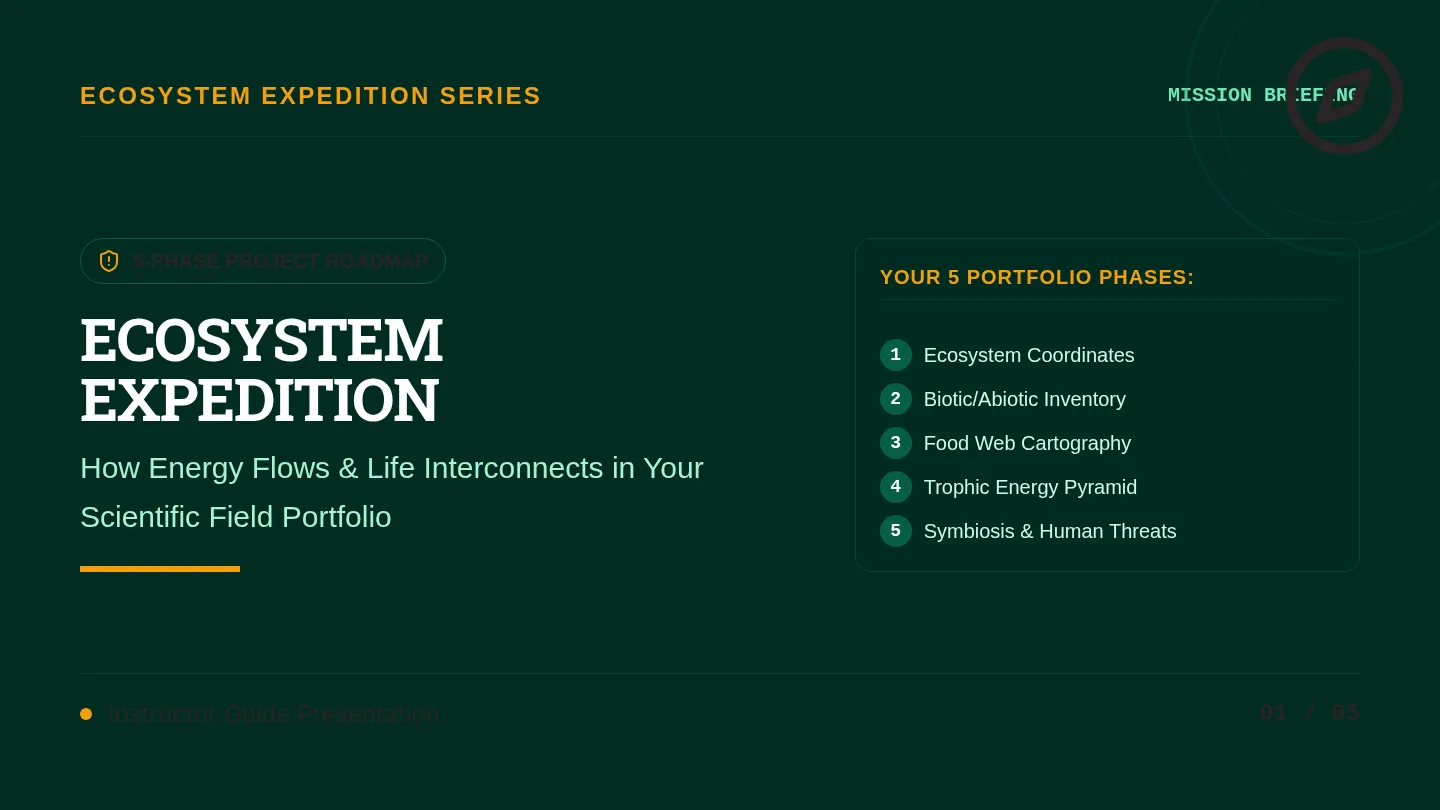
AI Brain Busters Slides
A visual presentation exploring AI definitions, the Turing Test, and the philosophical debate between imitation and actual thinking.
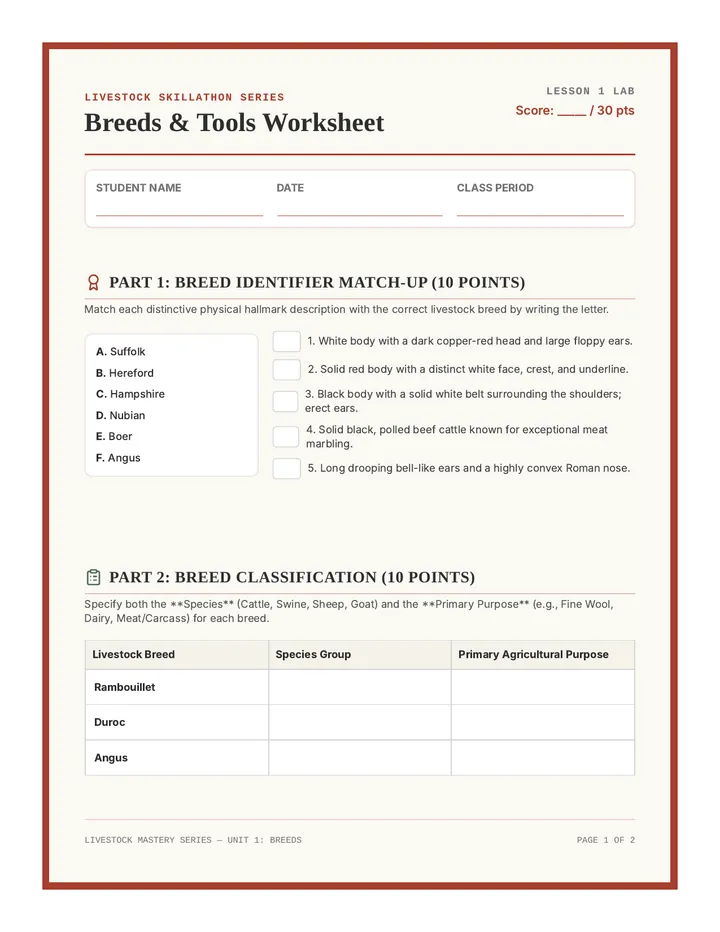
Turing Test Debate Prompts
A set of four scenario-based debate prompts for students to argue for and against the idea of machine intelligence.
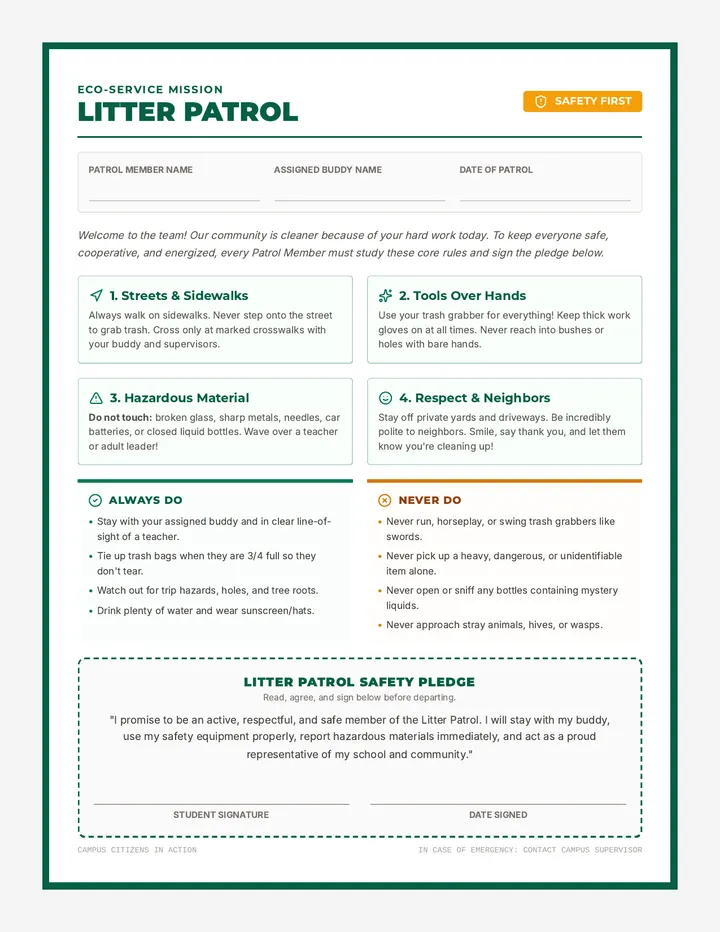
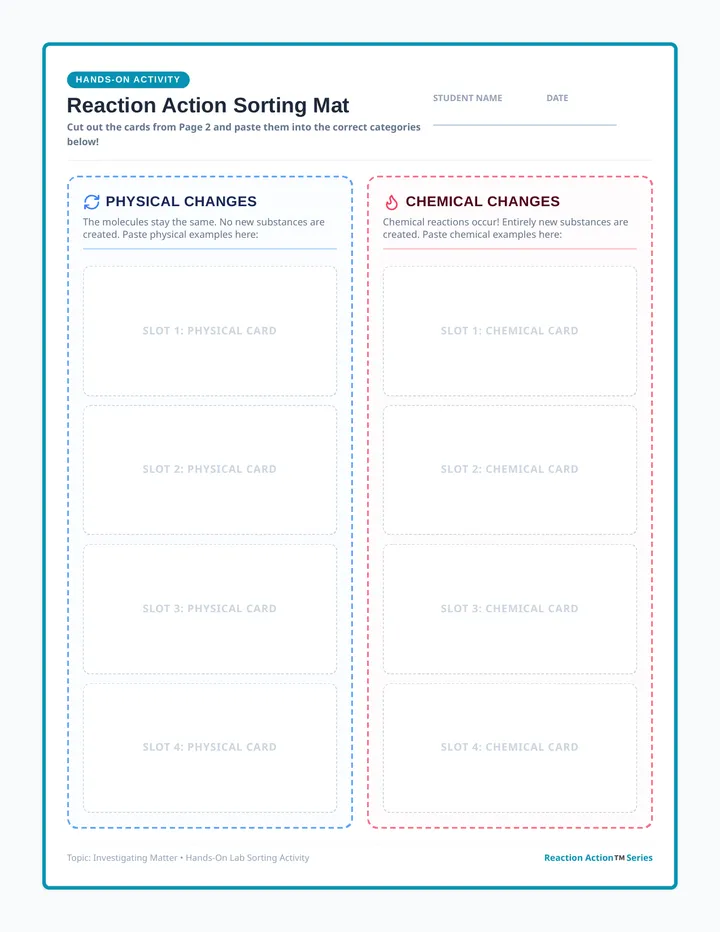
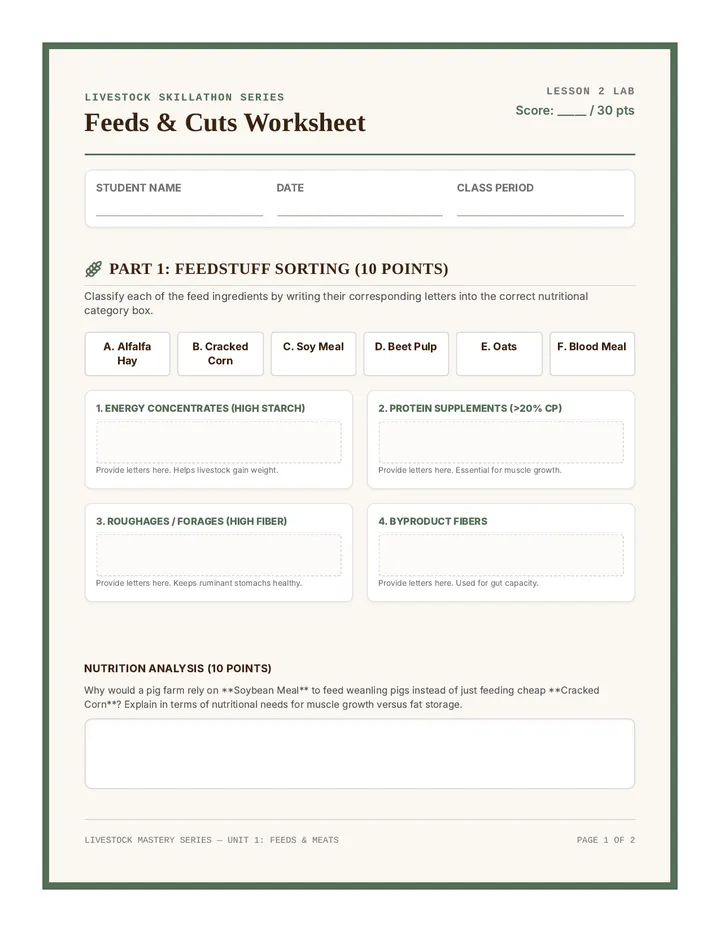
Human vs AI Sorting Challenge
A sorting activity where students categorize various tasks as performed by humans, AI, or both.
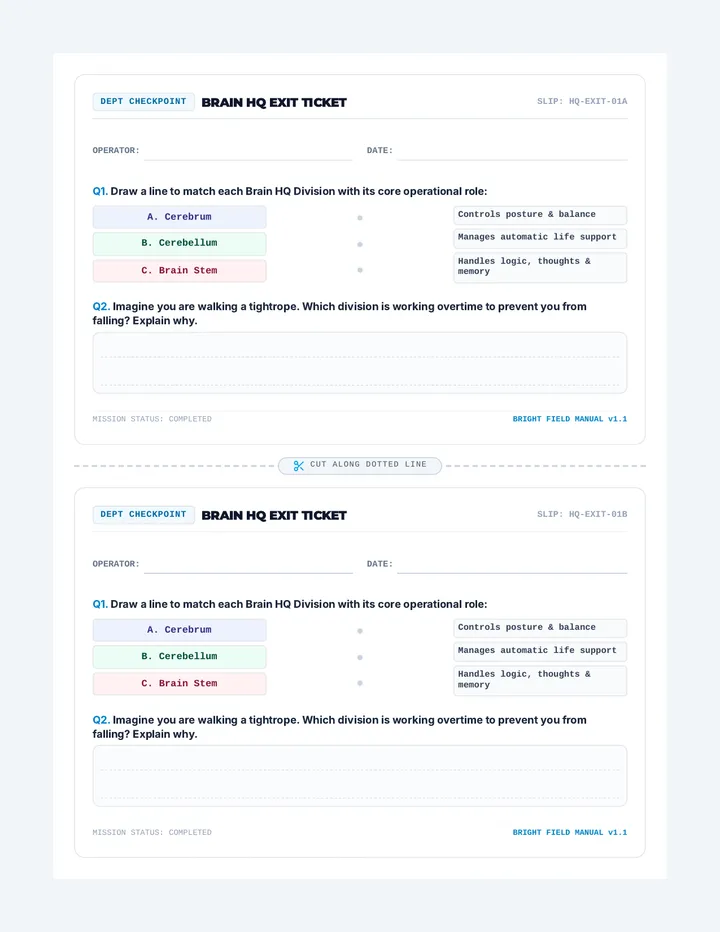
My AI Prediction Exit Ticket
A reflective exit ticket for students to record their learning and make predictions about the future of AI intelligence.
Sorting Challenge Answer Key
An answer key for the Human vs AI Sorting Challenge, featuring discussion points and nuances for the teacher.