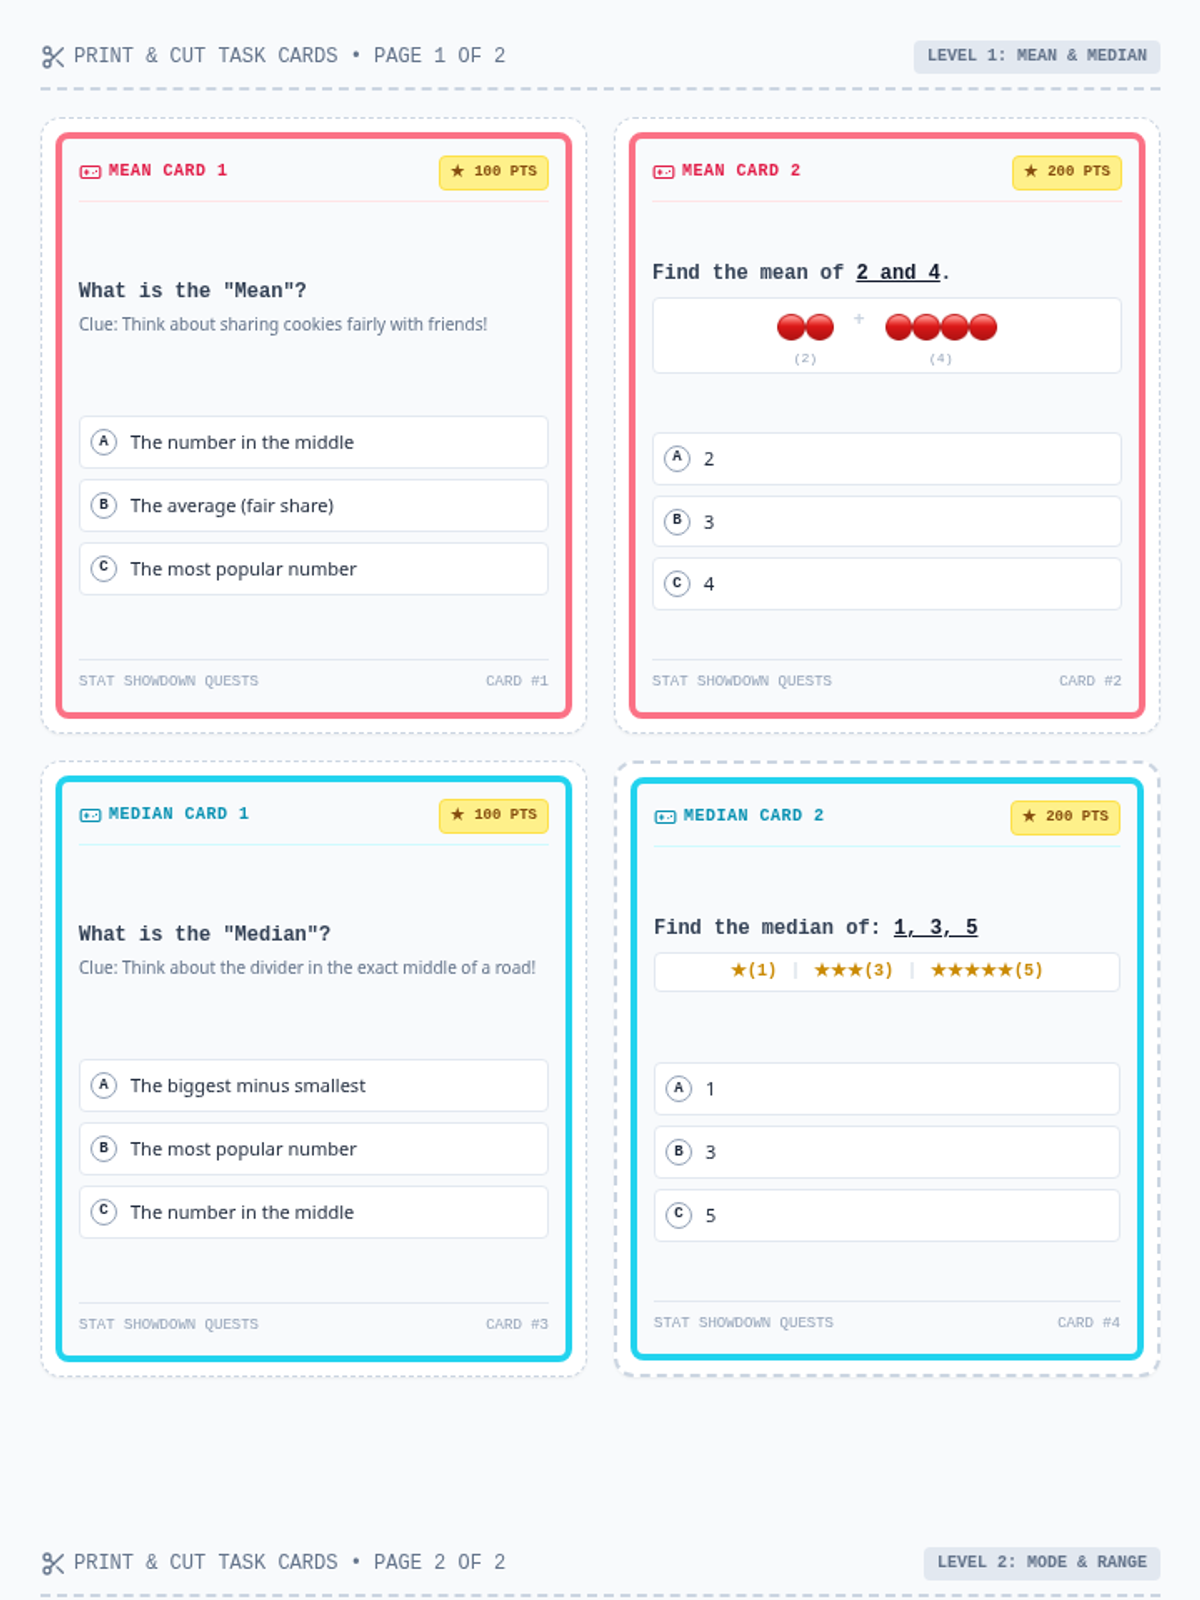
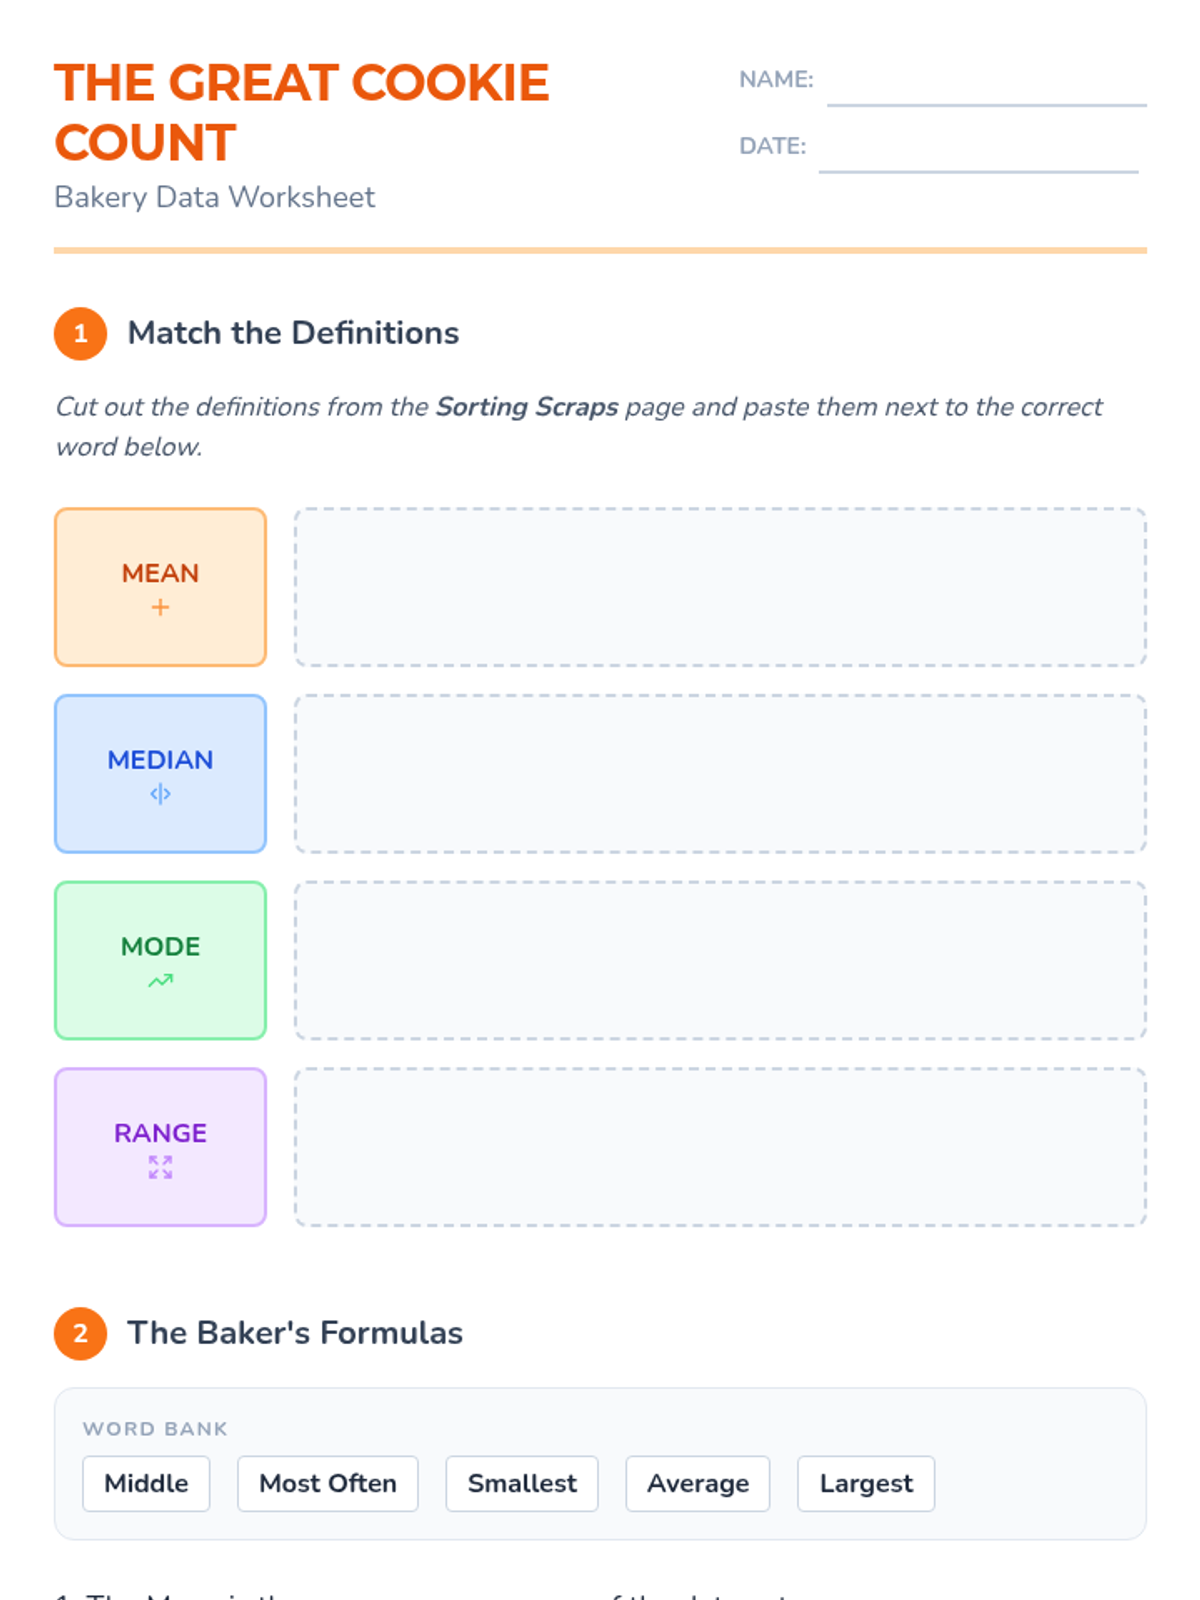
A hands-on 6th-grade statistics lesson where students collect sibling data from classmates, construct a physical dot plot, and then transition to Google Sheets to calculate key statistical measures (mean, median, mode, range) and generate digital charts.