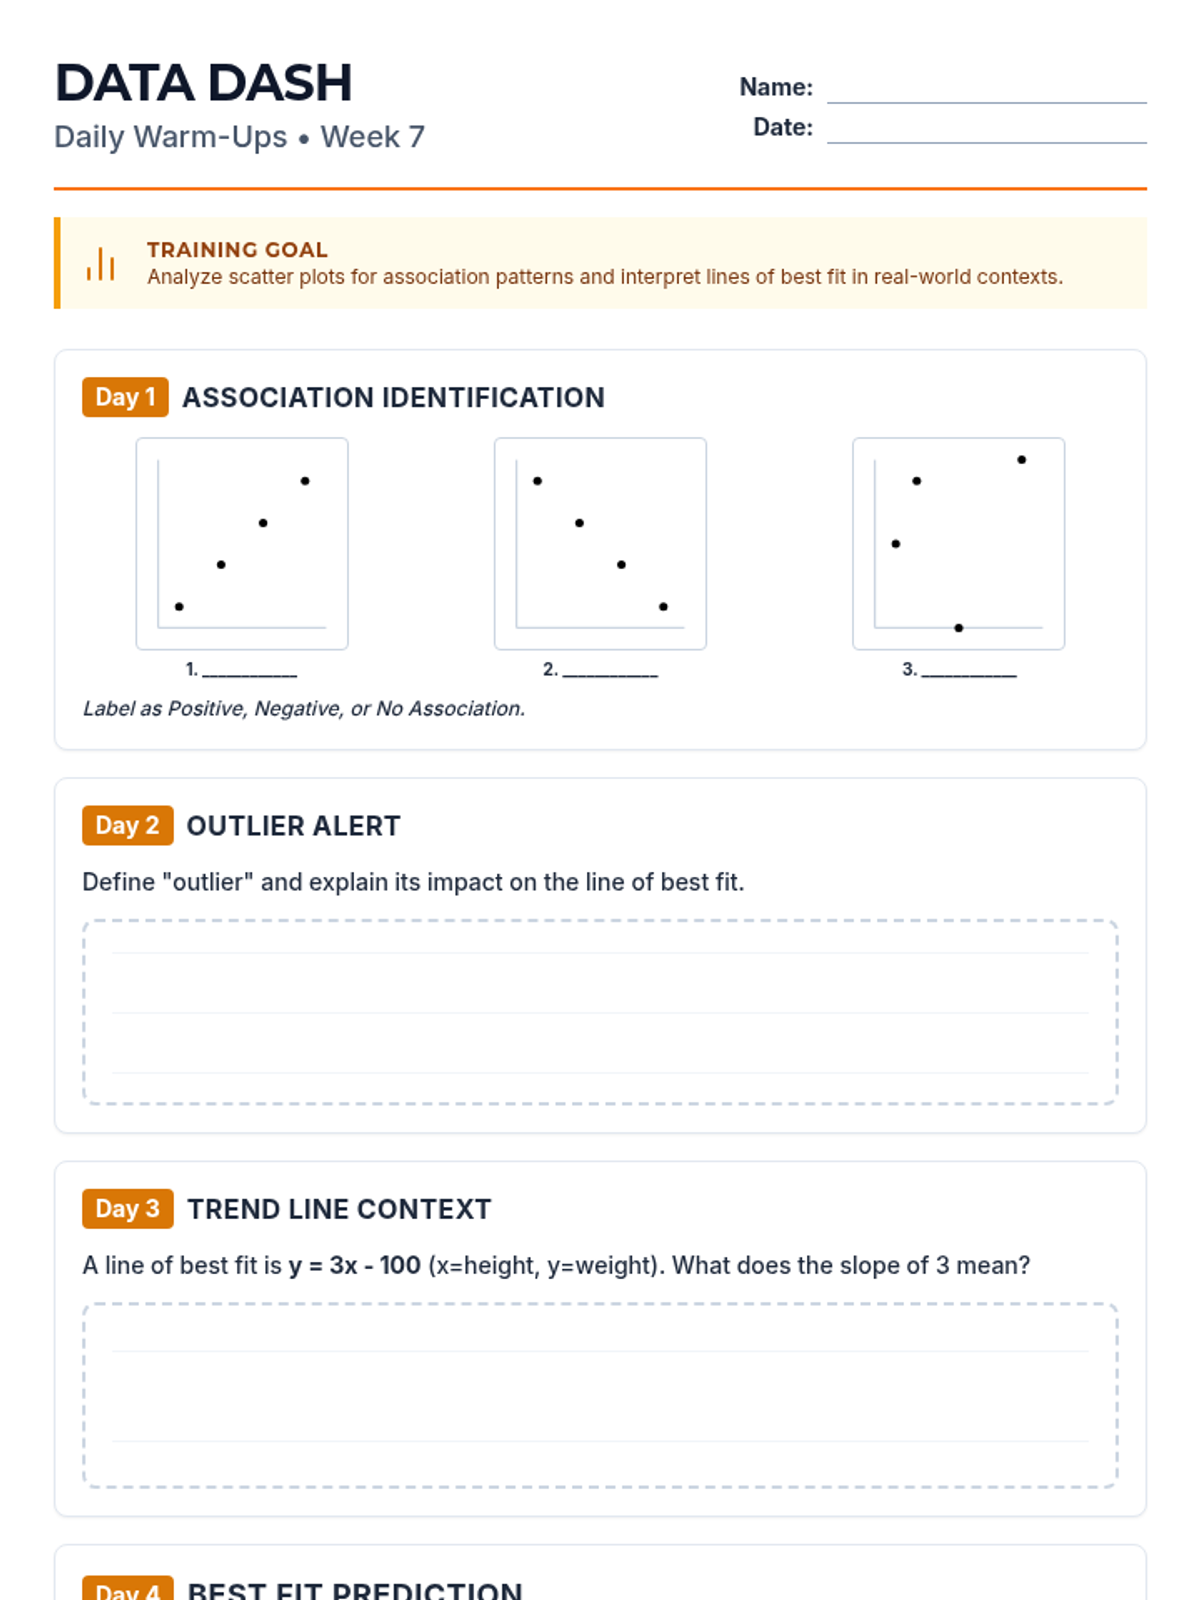
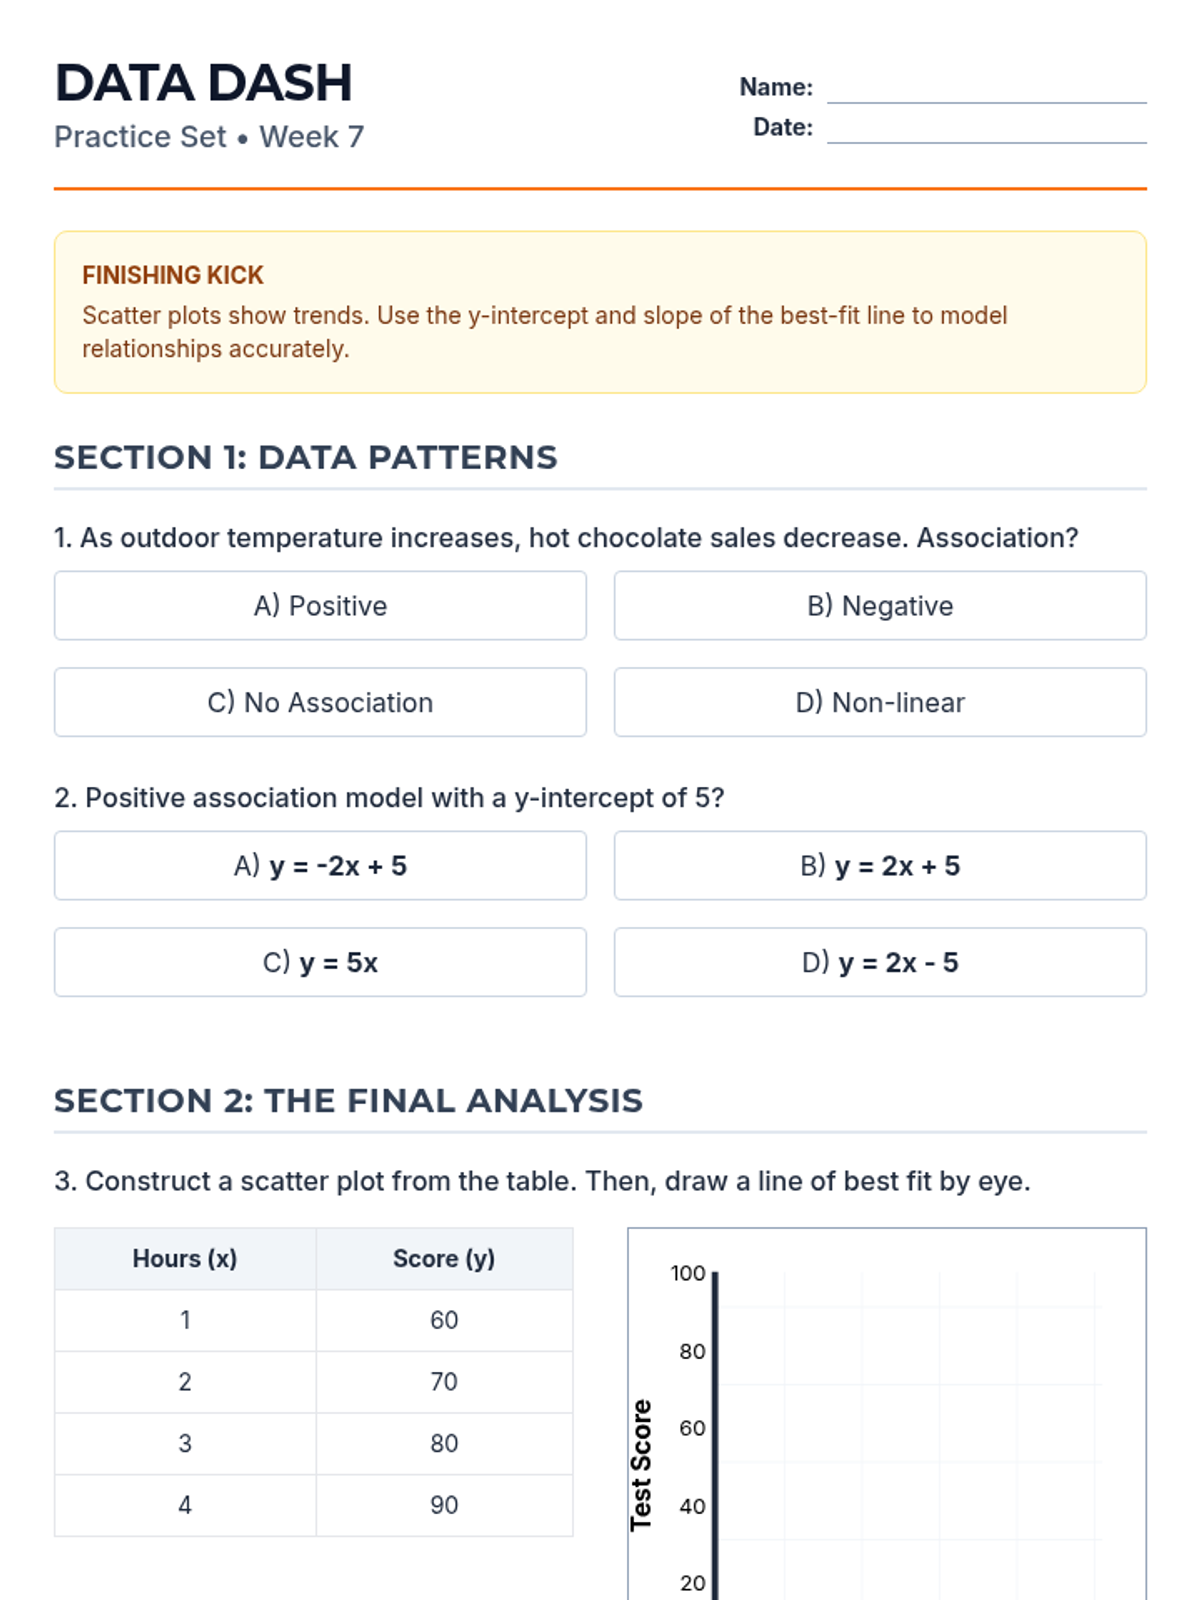
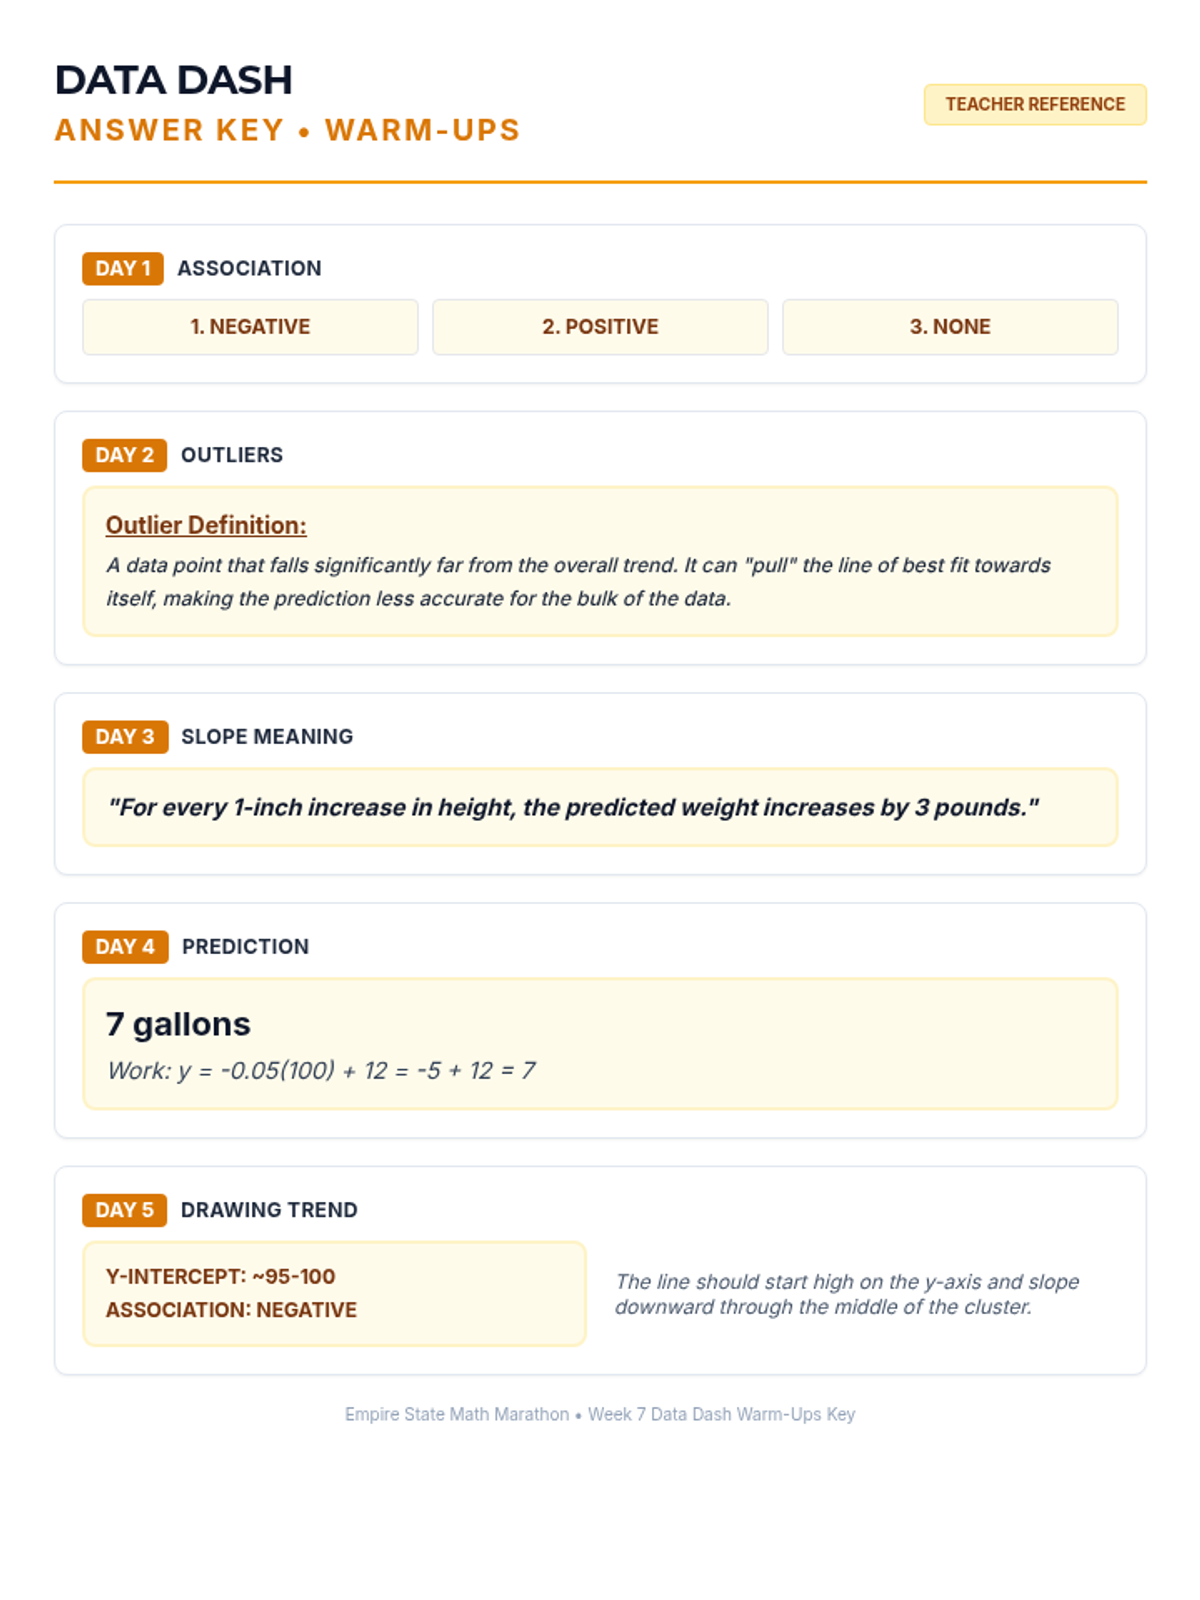
Students analyze various pre-made scatter plots to classify relationships as positive, negative, or having no association. They also distinguish between linear and non-linear patterns and identify outliers and clusters.
A high-stakes escape room challenge where students solve PEMDAS expressions involving exponents to crack the vault code. Students act as digital detectives navigating four distinct security layers.
A lesson introducing the distributive property through the metaphor of a delivery service, featuring guided and independent practice.
Students will model the exponential growth of a pepper population, starting from one pepper and doubling every season, to understand the power of geometric growth.
A comprehensive introduction to data sampling methods for Year 8 students, focusing on the mechanics of systematic, stratified, and capture-recapture calculations through a secret agent lens.
Students explore geometric similarity through art and tessellations, applying ratios and proportional parts to create scaled masterpieces.
Students learn to apply Sine, Cosine, and Tangent to real-world measurements and abstract artistic design, culminating in a dual-phase project.
A hands-on geometry lesson where students explore the mathematical properties of circles through real-world measurement and creative geometric art design. Students discover the relationship between circumference and diameter while applying area formulas to their own masterpieces.
This lesson focuses on practical math applications in a retail setting, covering decimals, percentages, and basic arithmetic with a focus on money management.
A cumulative milestone assessment designed for students at Grade 6 proficiency (RIT 221-230). This assessment checks foundational understanding of ratios, expressions, and geometry needed for 8th-grade success.
Week 7 analyzes bivariate data through scatter plots, interpreting lines of best fit, and using linear models to make predictions.