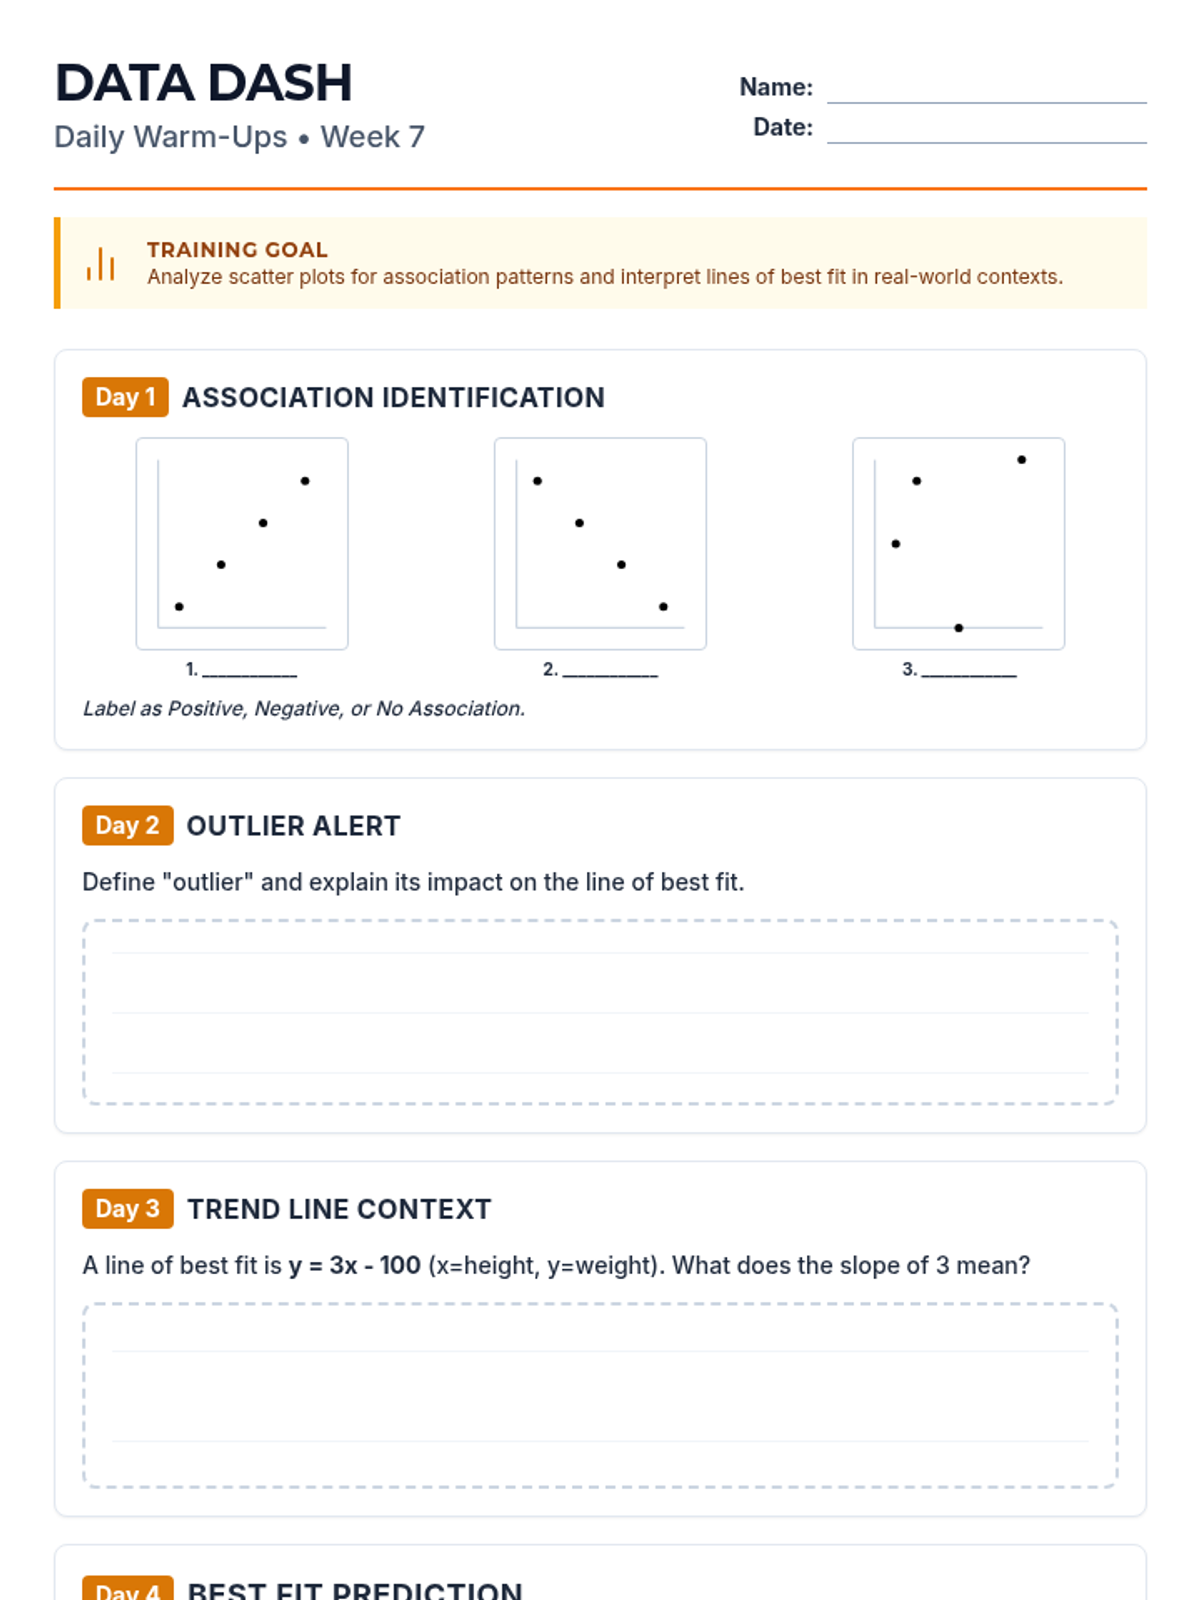
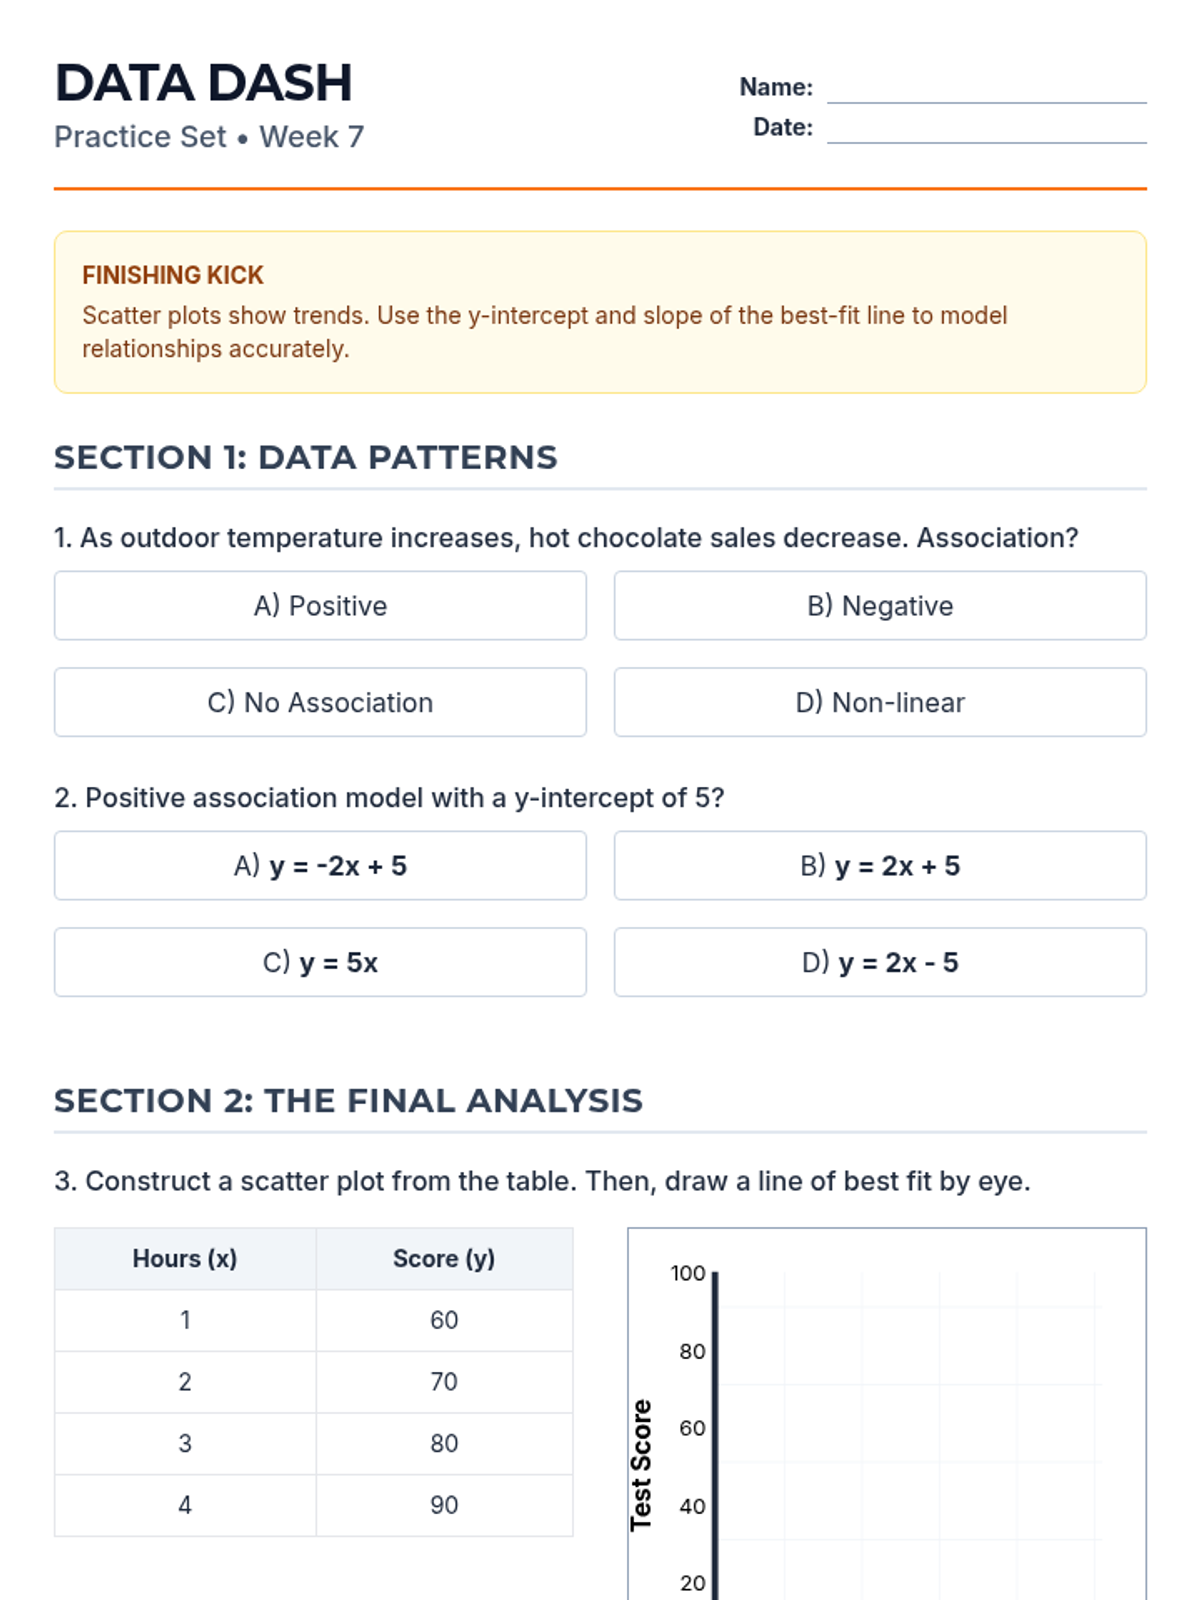
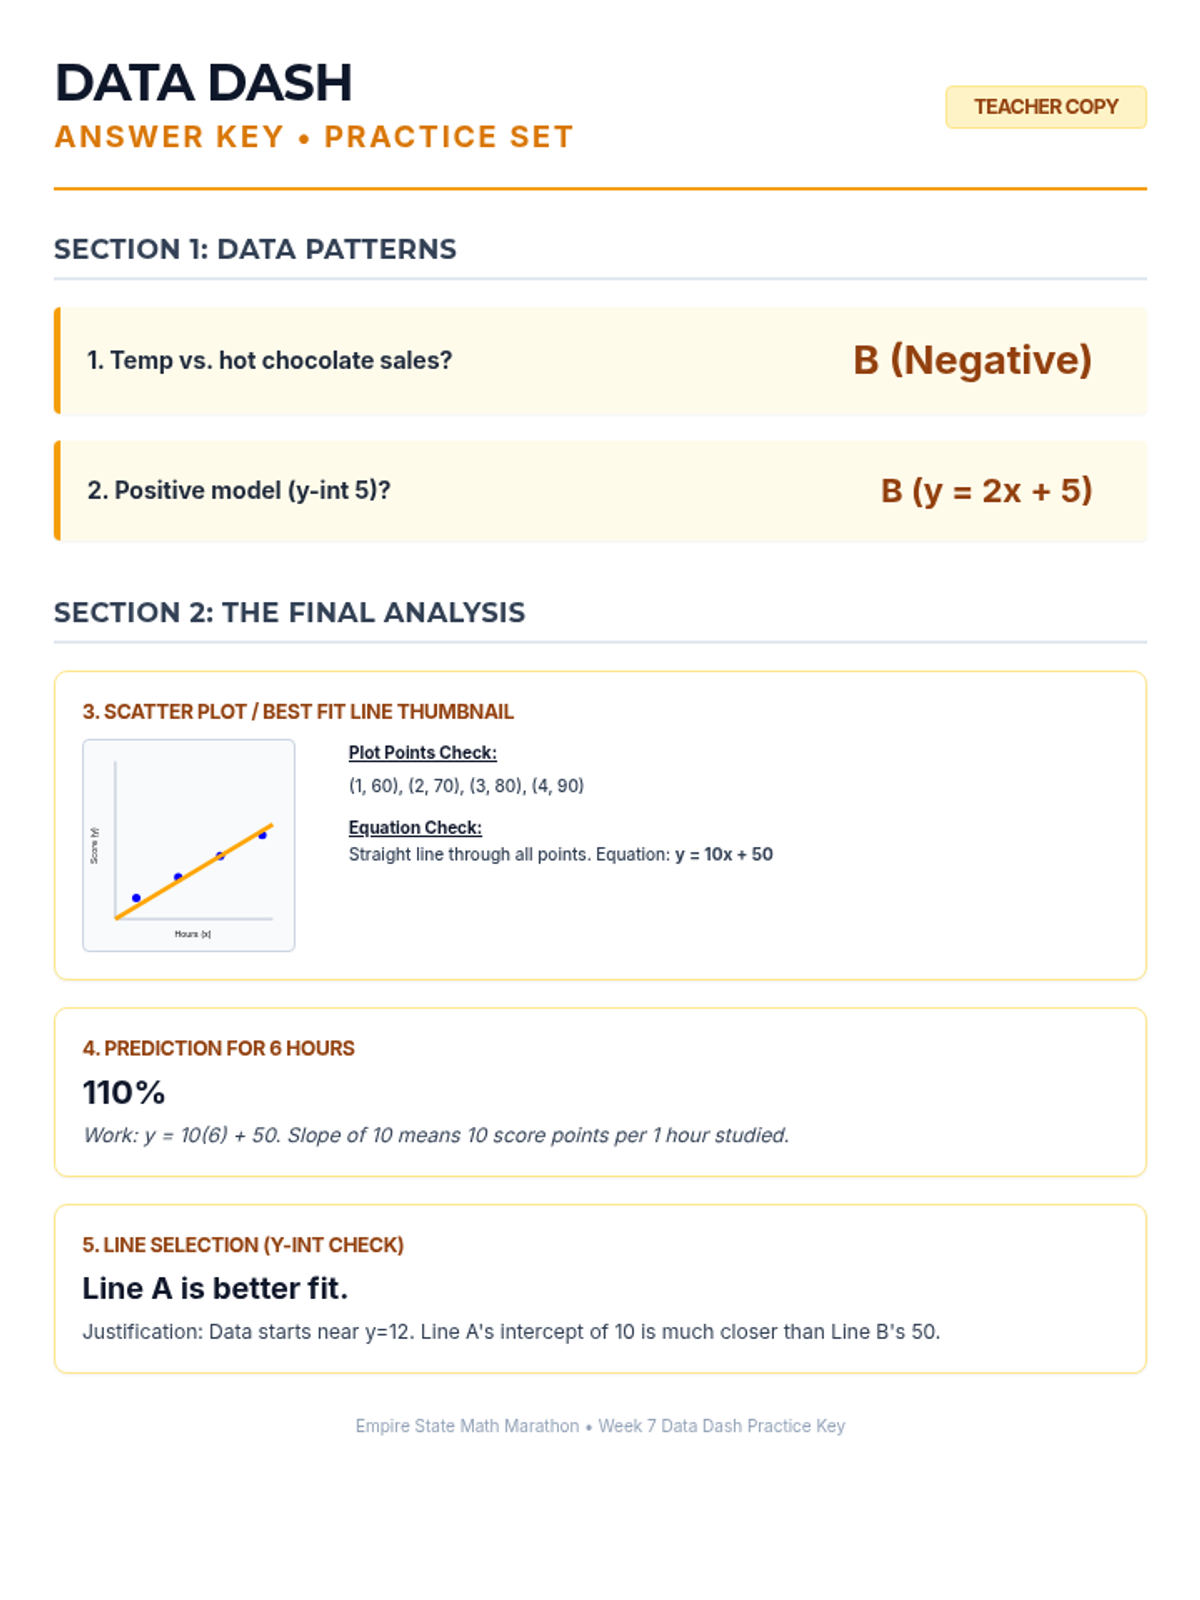
Students learn to draw a straight line that best represents the trend in a scatter plot. They judge the 'goodness' of fit visually by balancing points above and below the line, understanding that a linear model summarizes complex data.
Students learn to draw a straight line that best represents the trend in a scatter plot. They judge the 'goodness' of fit visually by balancing points above and below the line, understanding that a linear model summarizes complex data.