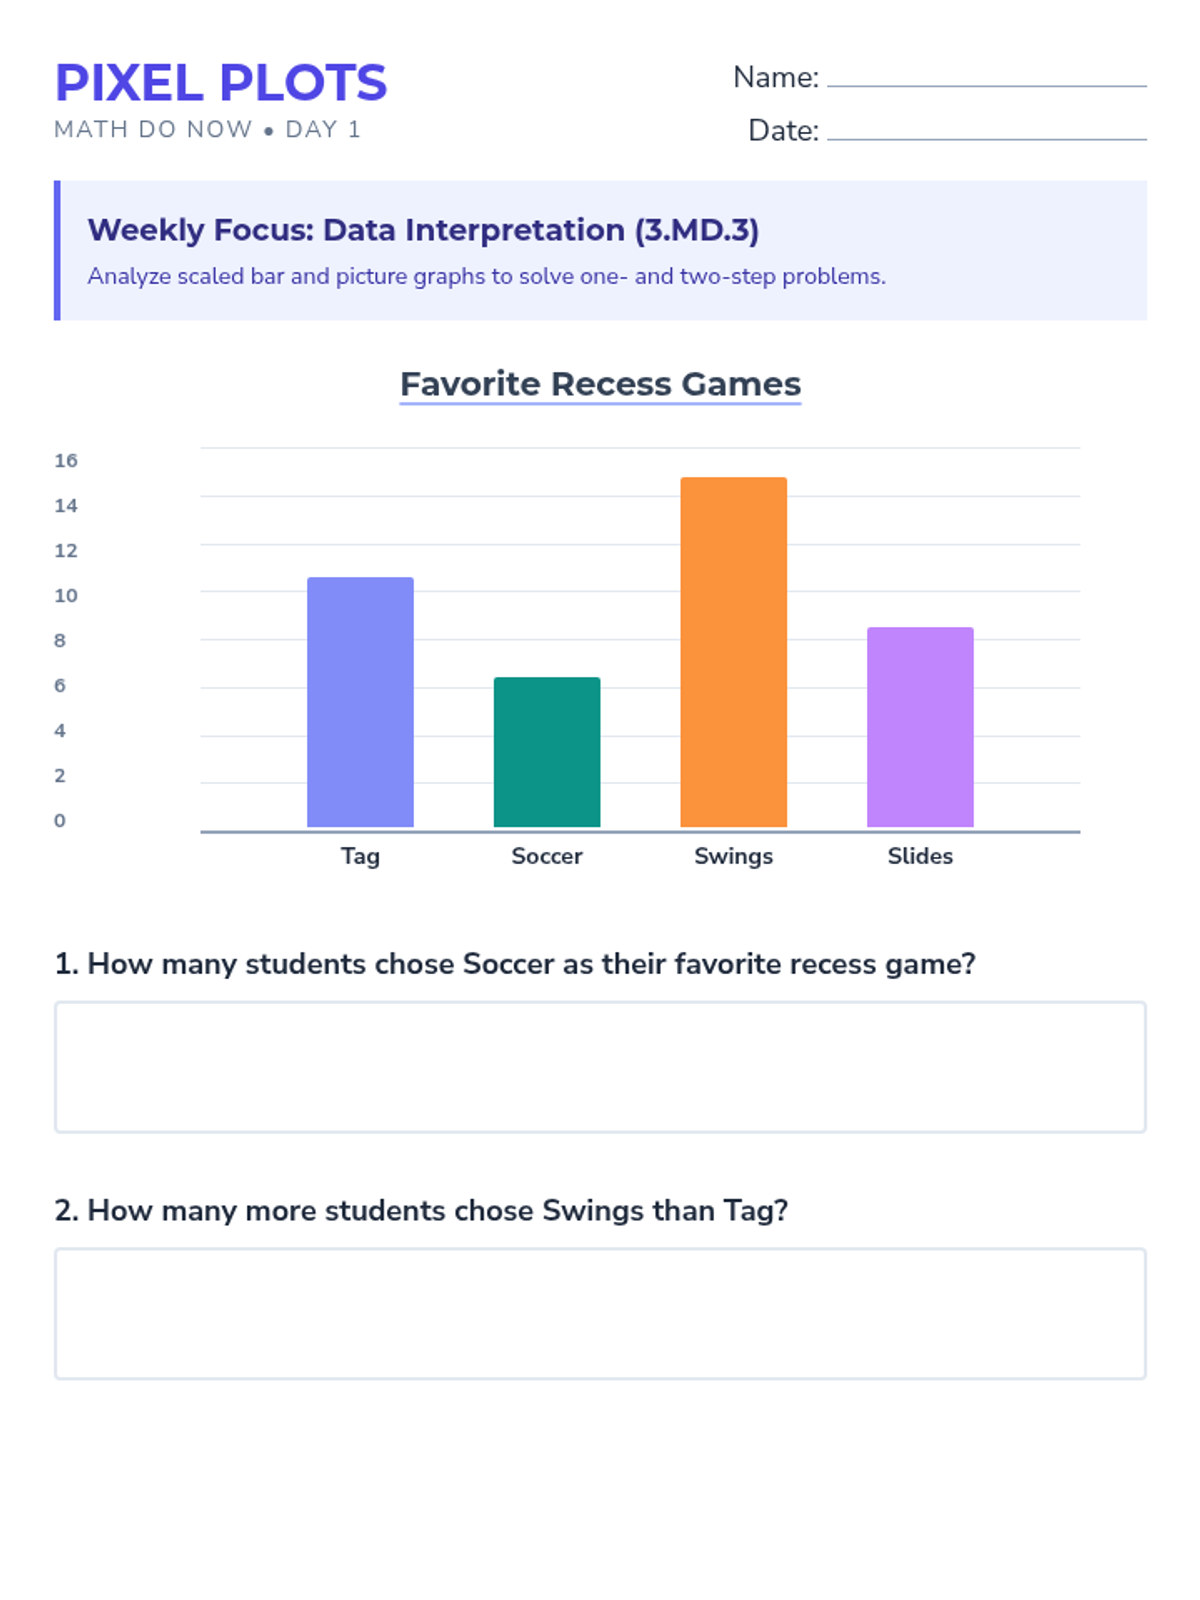
A comprehensive lesson on interpreting scaled picture graphs and bar graphs, focusing on one- and two-step data problems. Students will analyze data from a virtual 'Data Arcade' to solve 'how many more' and 'how many fewer' challenges.
A comprehensive lesson on interpreting scaled picture graphs and bar graphs, focusing on one- and two-step data problems. Students will analyze data from a virtual 'Data Arcade' to solve 'how many more' and 'how many fewer' challenges.