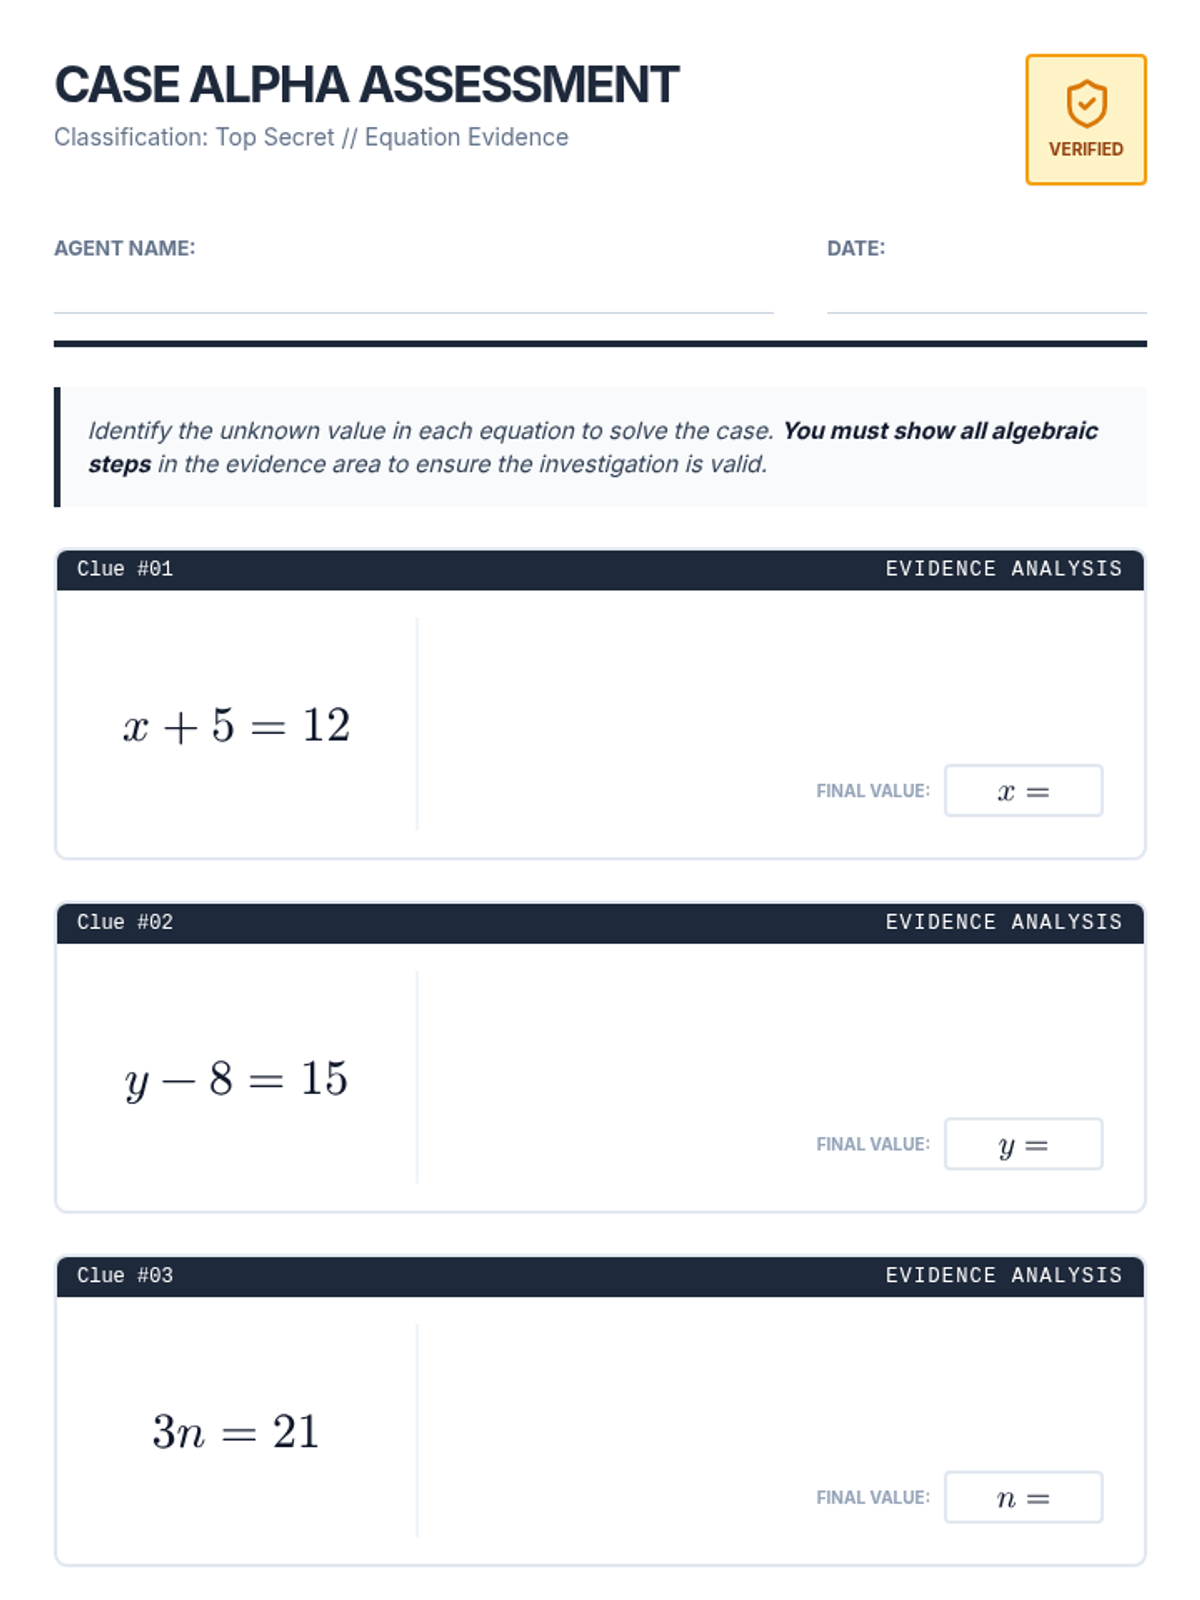
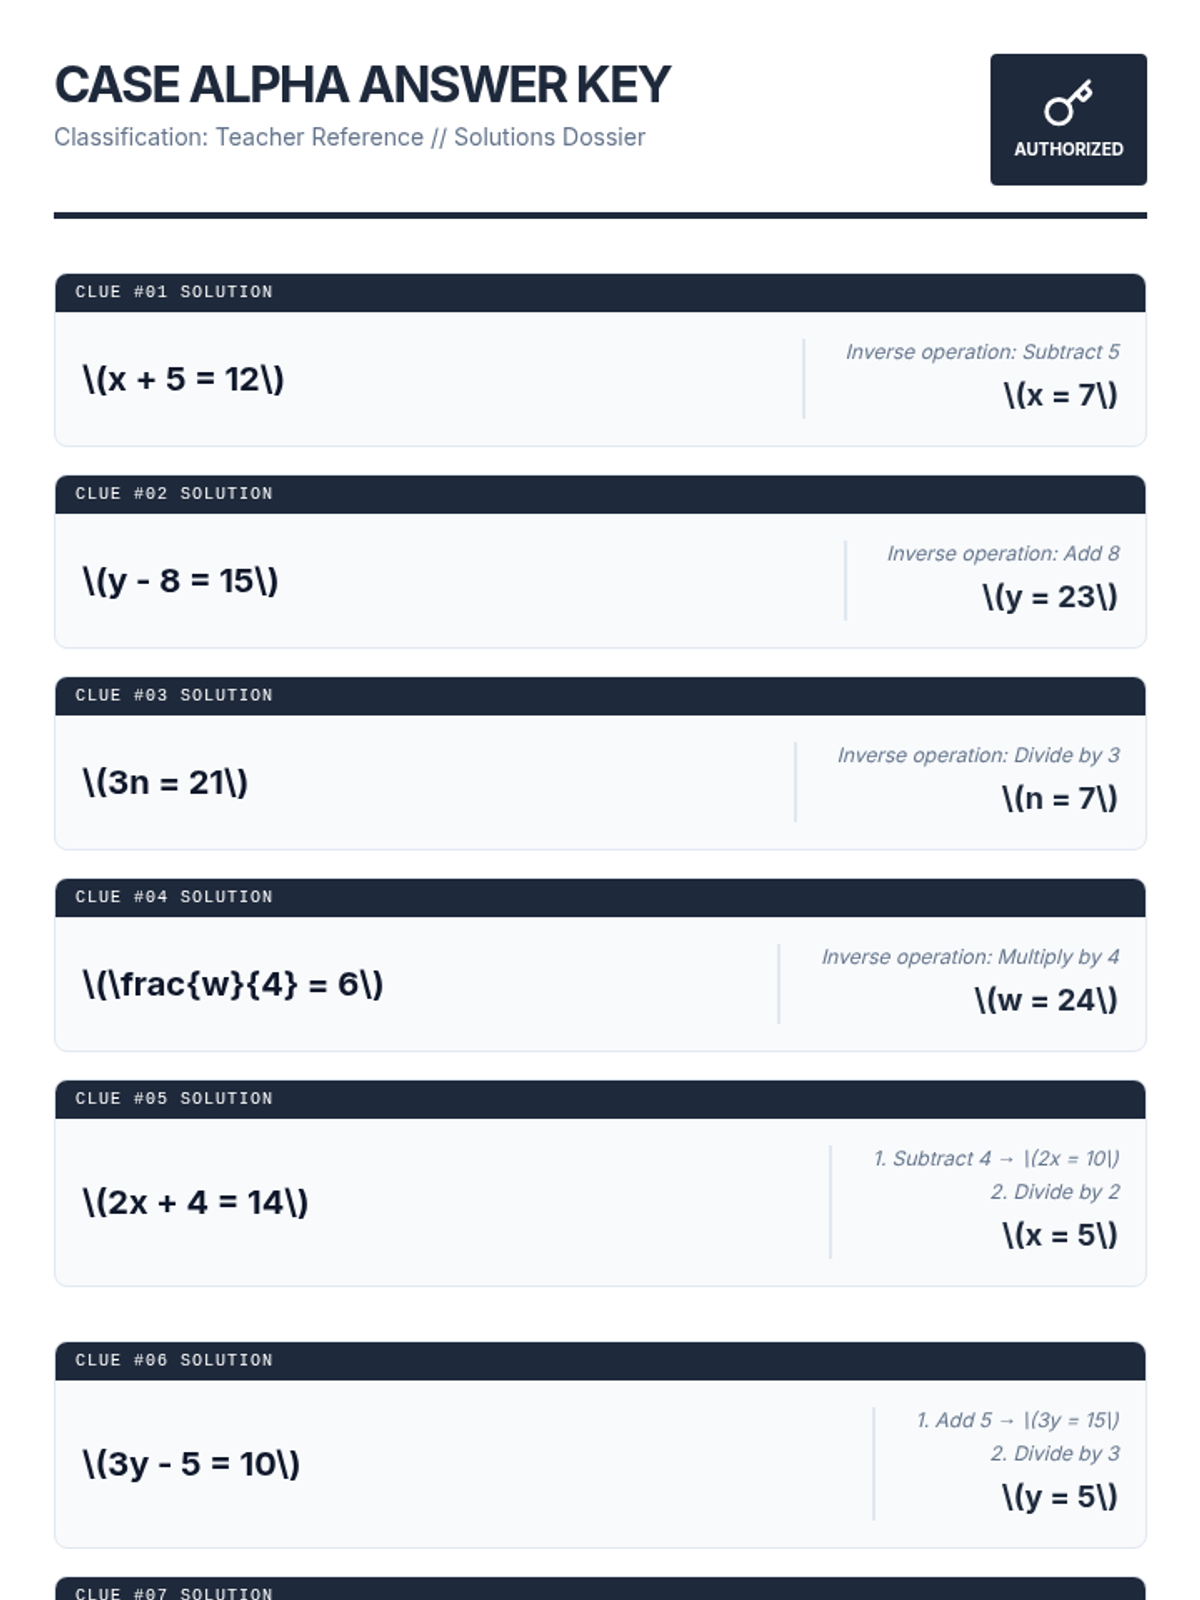
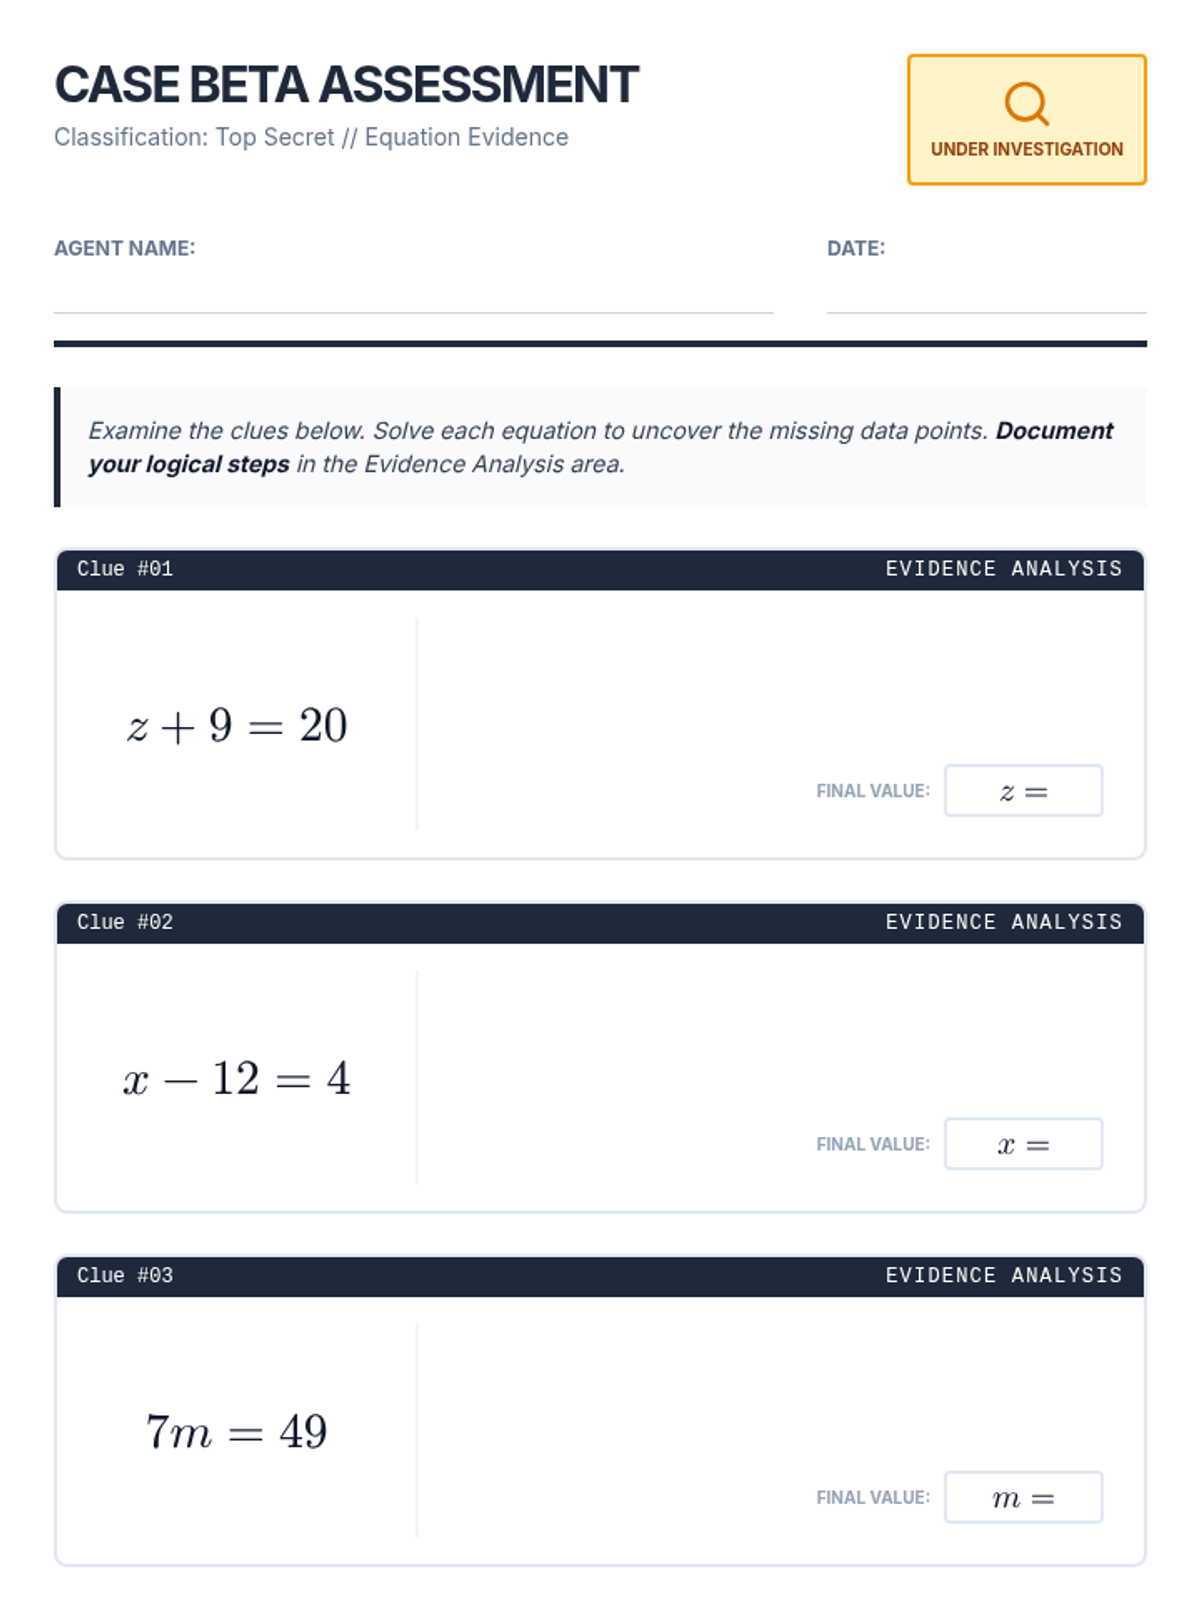
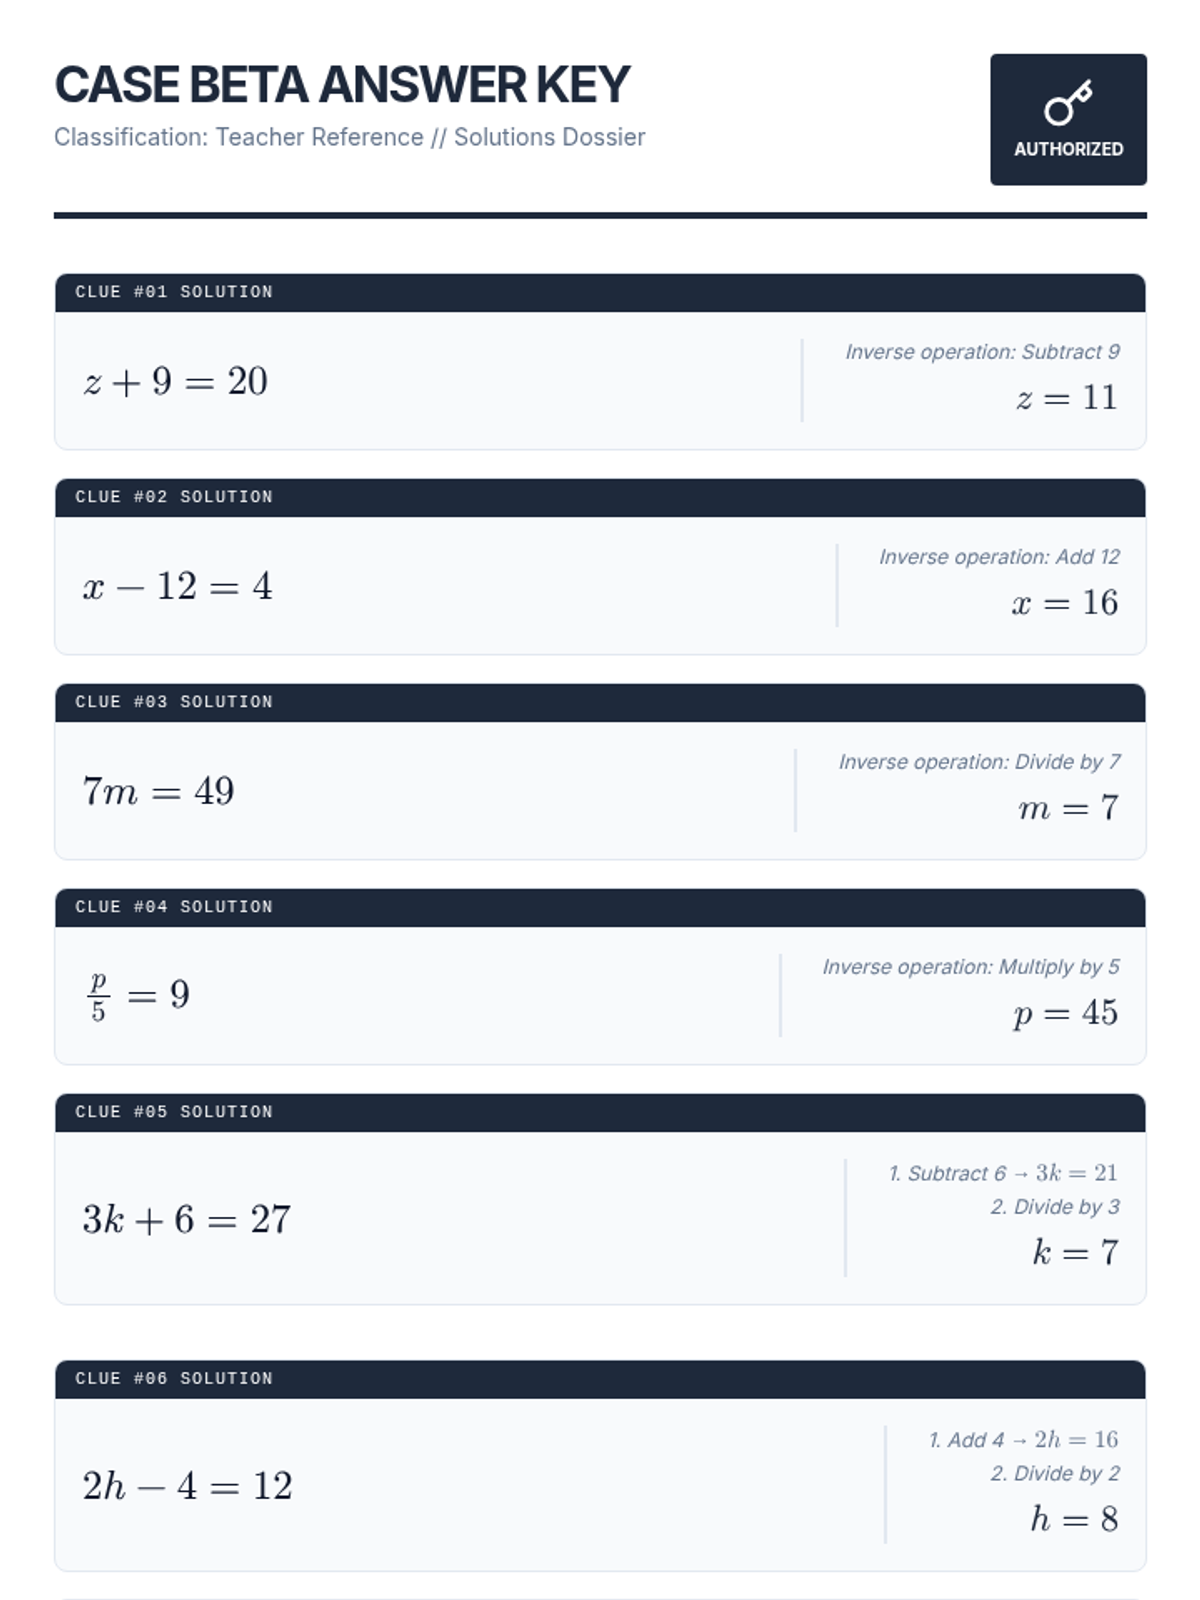
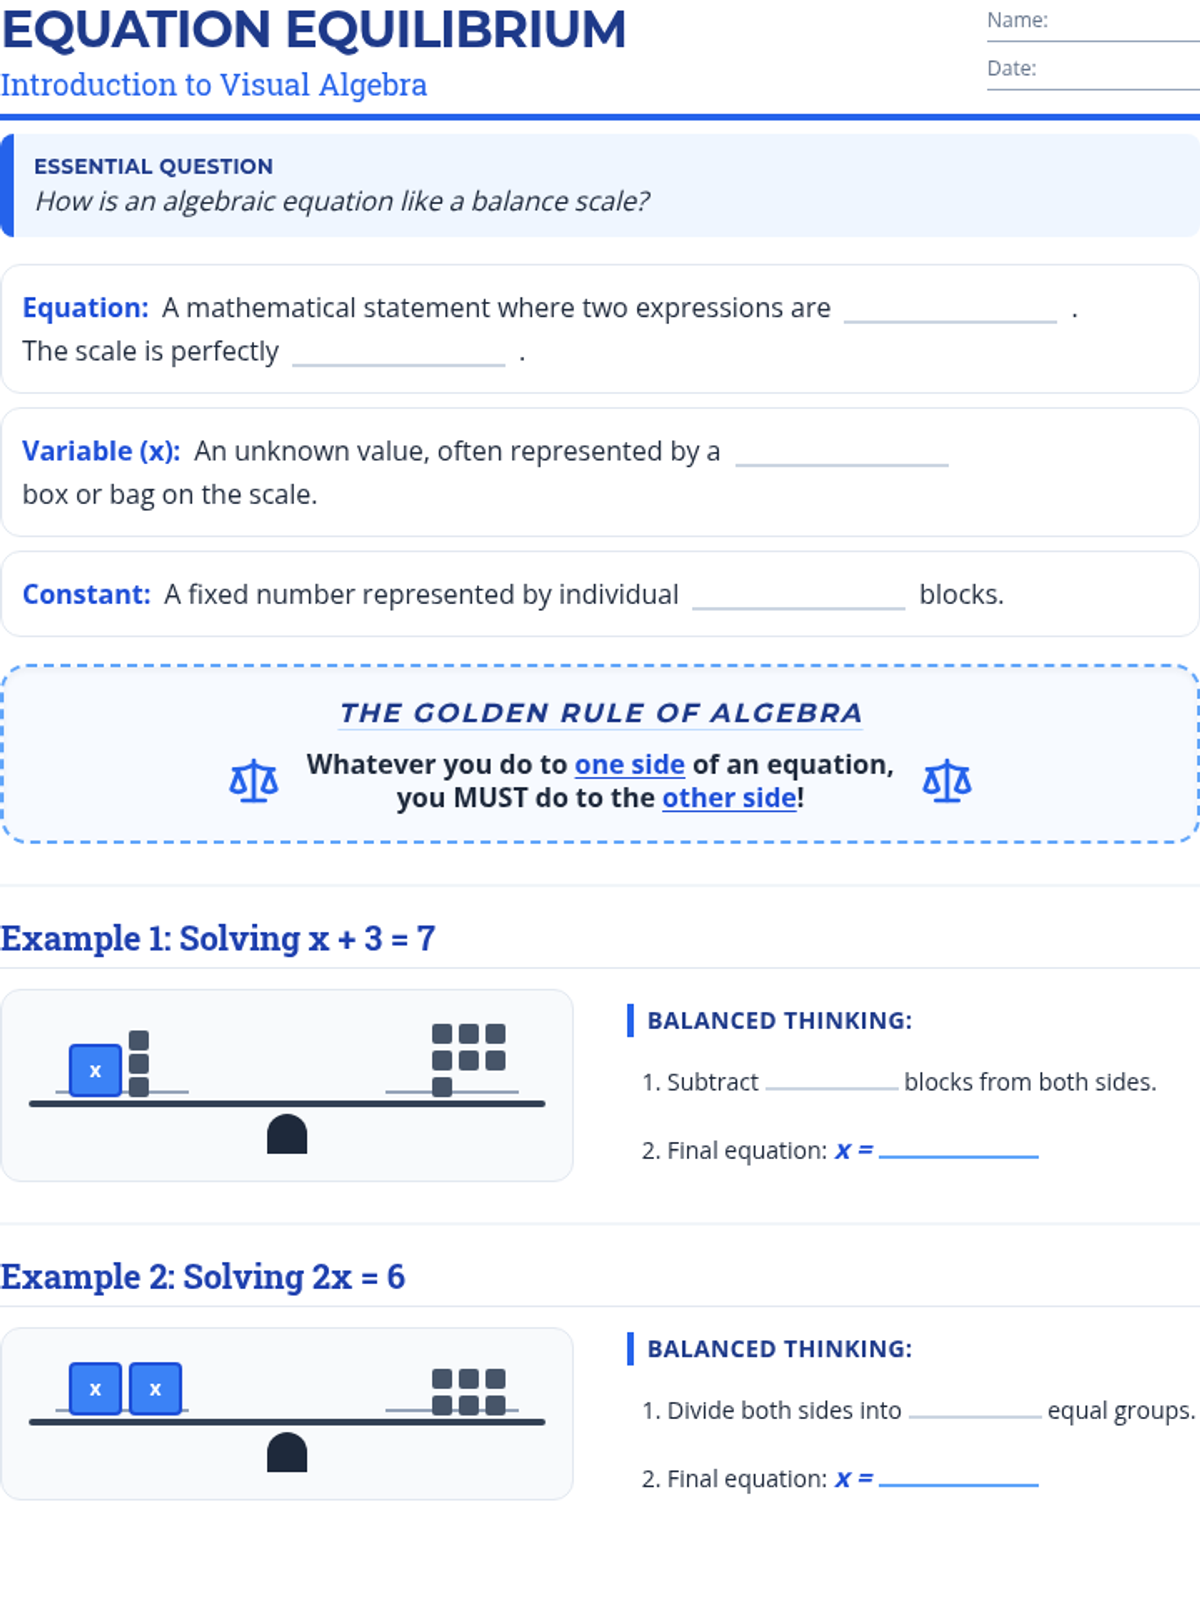
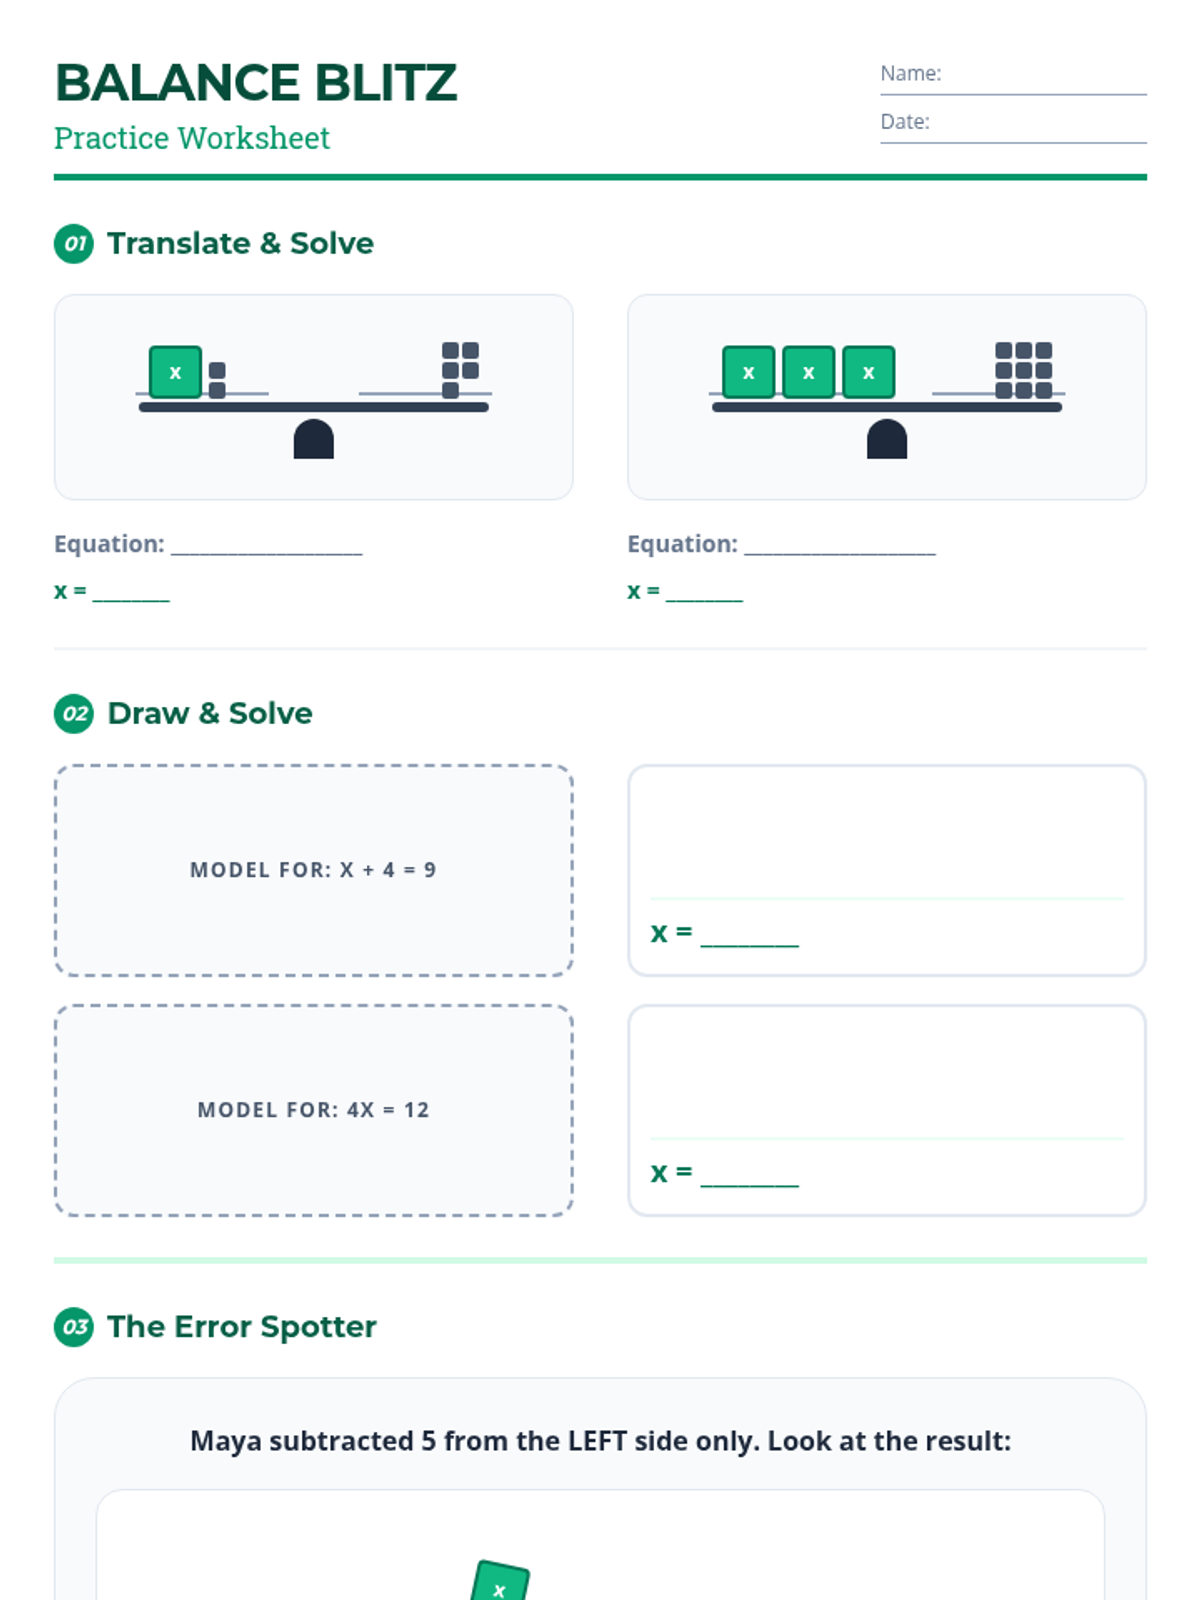
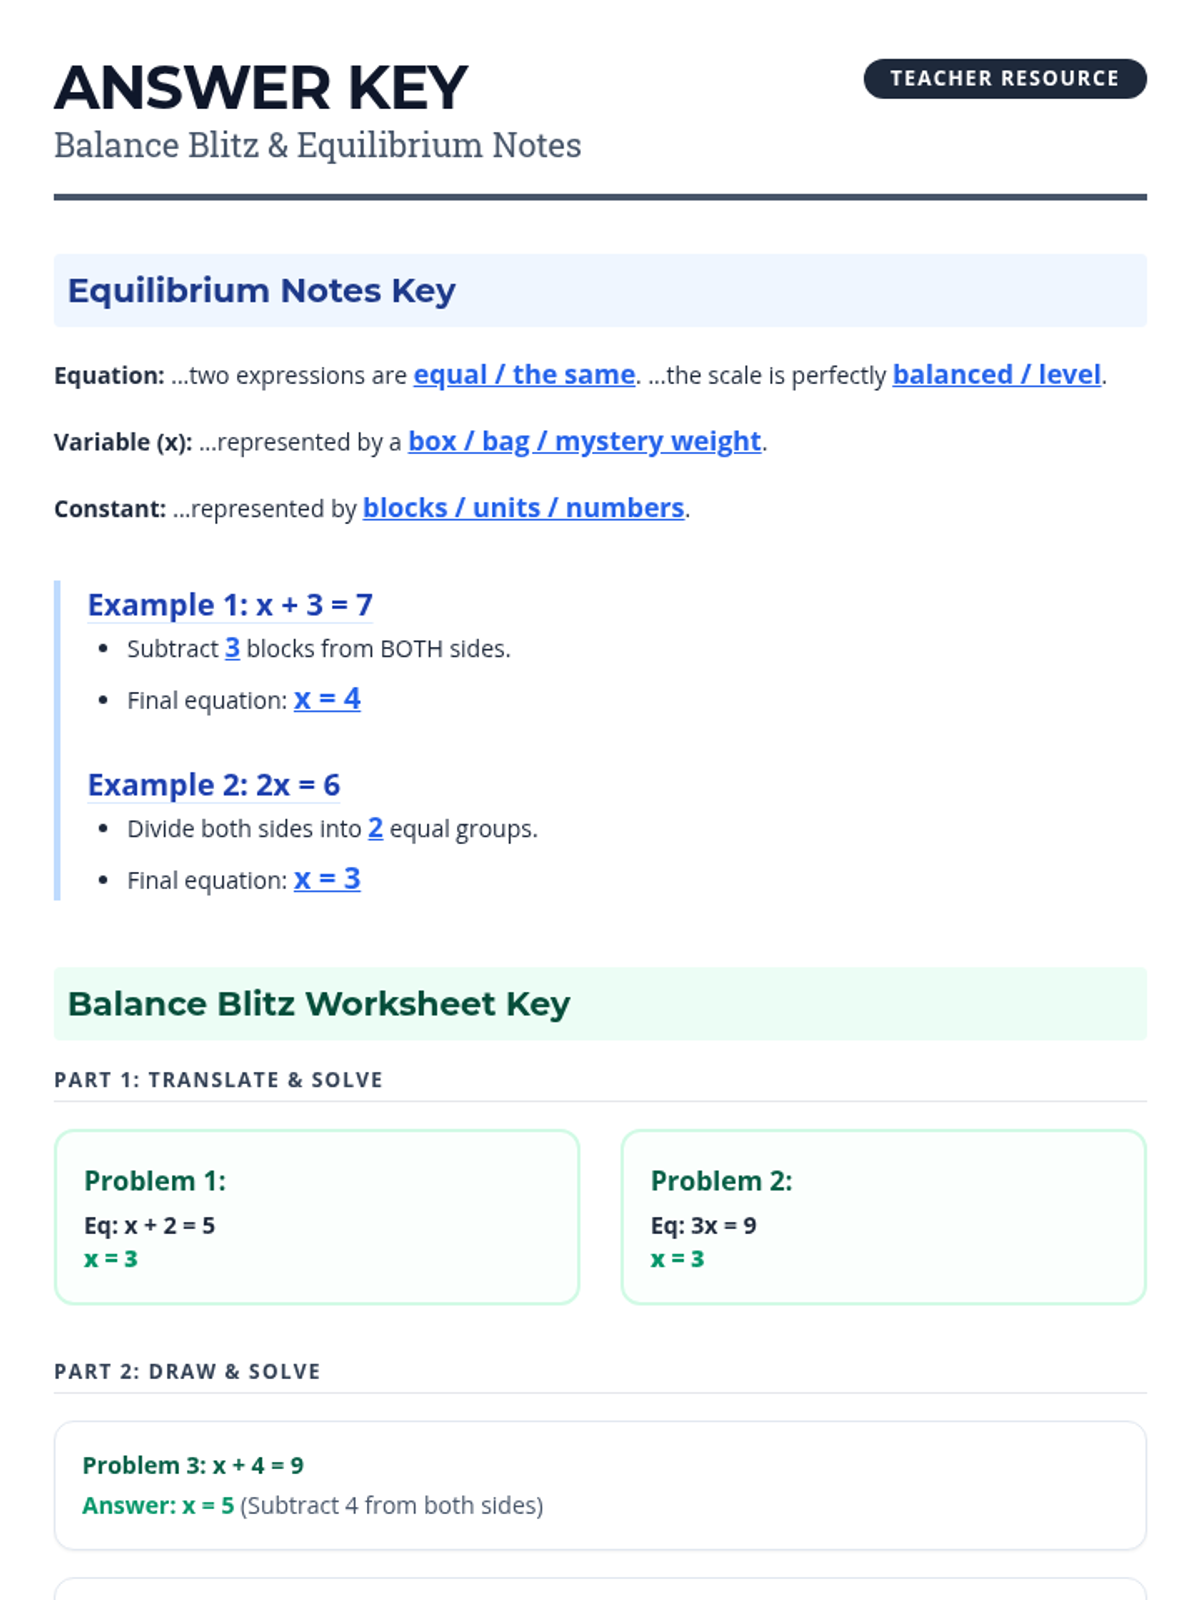
A foundational lesson on solving one-step equations using inverse operations, featuring a blueprint-inspired design to help students 'build' their algebraic skills.
A collection of four distinct assessments and their corresponding answer keys focused on solving one and two-step equations.
A comprehensive lesson on 7th-grade probability covering likelihood, theoretical and experimental probability, compound events, and making predictions.
A visual lesson on multiplying 2-digit numbers by 2-digit numbers using the box method (area model). Students use a blueprint-themed layout to decompose numbers and calculate partial products.
A lesson focused on adding and subtracting fractions with unlike denominators using a structural 'blueprint' approach. Students use step-by-step assembly guides and visual area models to understand common denominators.
A lesson focused on calculating the area of rectangles with fractional and mixed number side lengths by relating the concept to multiplication. Students will practice converting mixed numbers to improper fractions and applying the area formula.
A comprehensive assessment lesson for 9th-grade statistics, covering central tendency, data visualization, sampling, and correlation through a blueprint-themed instructional arc.
A 65-minute 9th-grade algebra lesson where students master drawing lines of best fit on scatter plots and using them to make mathematical predictions through interpolation and extrapolation.
A 65-minute lesson for 9th-grade students to master scatter plots and correlation. Students act as 'Data Detectives' to identify positive, negative, and no correlation patterns in real-world data sets.
A 9th-grade lesson focused on interpreting and comparing multiple box plots to analyze data distributions, spread, and skewness. Students will transition from basic identification to making data-driven conclusions across various scenarios.
A comprehensive 9th-grade statistics lesson focused on transforming raw data into structured visualizations including frequency tables, dot plots, and box-and-whisker plots. Students move from manual data collection to sophisticated statistical representation.
Students explore compound probability and shuffle algorithms by analyzing song frequencies and streaming data to determine the likelihood of hearing their favorite tracks.
Students learn to identify the necessary operations and sequence of steps required to solve complex, multi-part word problems.
This lesson helps students identify and define the parts of a mathematical expression (constant, coefficient, variable) within the context of one-step money word problems. Students will learn to translate real-world financial scenarios into algebraic expressions.
A series of 7 structured worksheets focusing on adding and subtracting fractions with simple denominators (2, 3, 4, 5, 6, 8) using a blueprint-inspired design. Includes step-by-step examples and visual scaffolds for students to master finding common denominators.
A comprehensive logic lesson where students act as detectives to identify rules in visual and numerical sequences, building inductive reasoning and prediction skills.
A focused math mini-lesson designed for 8th-grade special education students to review substitution across three levels: expressions, 2-step equations, and systems of equations. The lesson uses a 'Code Breaker' theme to make the abstract concepts more concrete and engaging.
A 9th-grade algebra lesson where students master drawing trend lines on scatter plots and using them to make real-world predictions through interpolation and extrapolation.
A comprehensive assessment lesson focusing on data analysis and statistics. Students will review key concepts, complete a summative assessment, and reflect on their learning progress across measures of central tendency, data visualization, and bivariate data.
A 65-minute lesson for 9th Grade students exploring the fundamental concepts of population, sampling, and statistical bias. Students learn to distinguish between fair and biased collection methods through scenario analysis and sorting activities.
In this 9th-grade math lesson, students become 'Data Detectives' to uncover relationships between variables. They will learn to construct scatter plots and identify positive, negative, and zero correlation through hands-on matching and real-world data analysis.
A comprehensive introduction to data visualization where students learn to transform raw tallies into organized frequency tables, dot plots, and box-and-whisker plots through a collaborative class survey.
A 65-minute lesson for 9th-grade students on interpreting and comparing box plots to analyze data sets. Students will learn to identify skewness, spread, and central tendency across multiple distributions.
A 9th-grade statistics lesson exploring mean, median, and mode, with a focus on identifying the most appropriate measure of central tendency in the presence of outliers. Students act as 'Data Detectives' to investigate real-world scenarios.
A lesson focused on adding and subtracting proper and improper fractions by identifying the least common denominator. Includes a progress monitoring worksheet and a detailed teacher answer key.
A 90-minute investigative math lesson where 6th grade students analyze independent and dependent variables through science experiment data. Students connect tables, graphs, and equations using real-world laboratory scenarios.
A hands-on math simulation where students practice addition and estimation by planning a party within a budget, developing real-world financial literacy skills.
A foundational multiplication lesson for 6th grade special education students, focusing on facts 0-5 using number lines as visual scaffolding to support conceptual understanding and skip counting.
An exploration of geometric growth and the power of incremental habits for grades 7-12, combining mathematical modeling with behavioral science.
A focused assessment and practice module on right-triangle trigonometry, specifically covering the concepts of elevation and depression through architectural and surveying contexts.
A comprehensive geometry lesson on angles of elevation and depression, ranging from basic trigonometry to complex algebraic applications. Students will master identifying, labeling, and solving for angles and distances in real-world scenarios.
A lesson introducing one-step algebraic equations through the conceptual lens of a balance scale, focusing on the principle of keeping both sides equal.