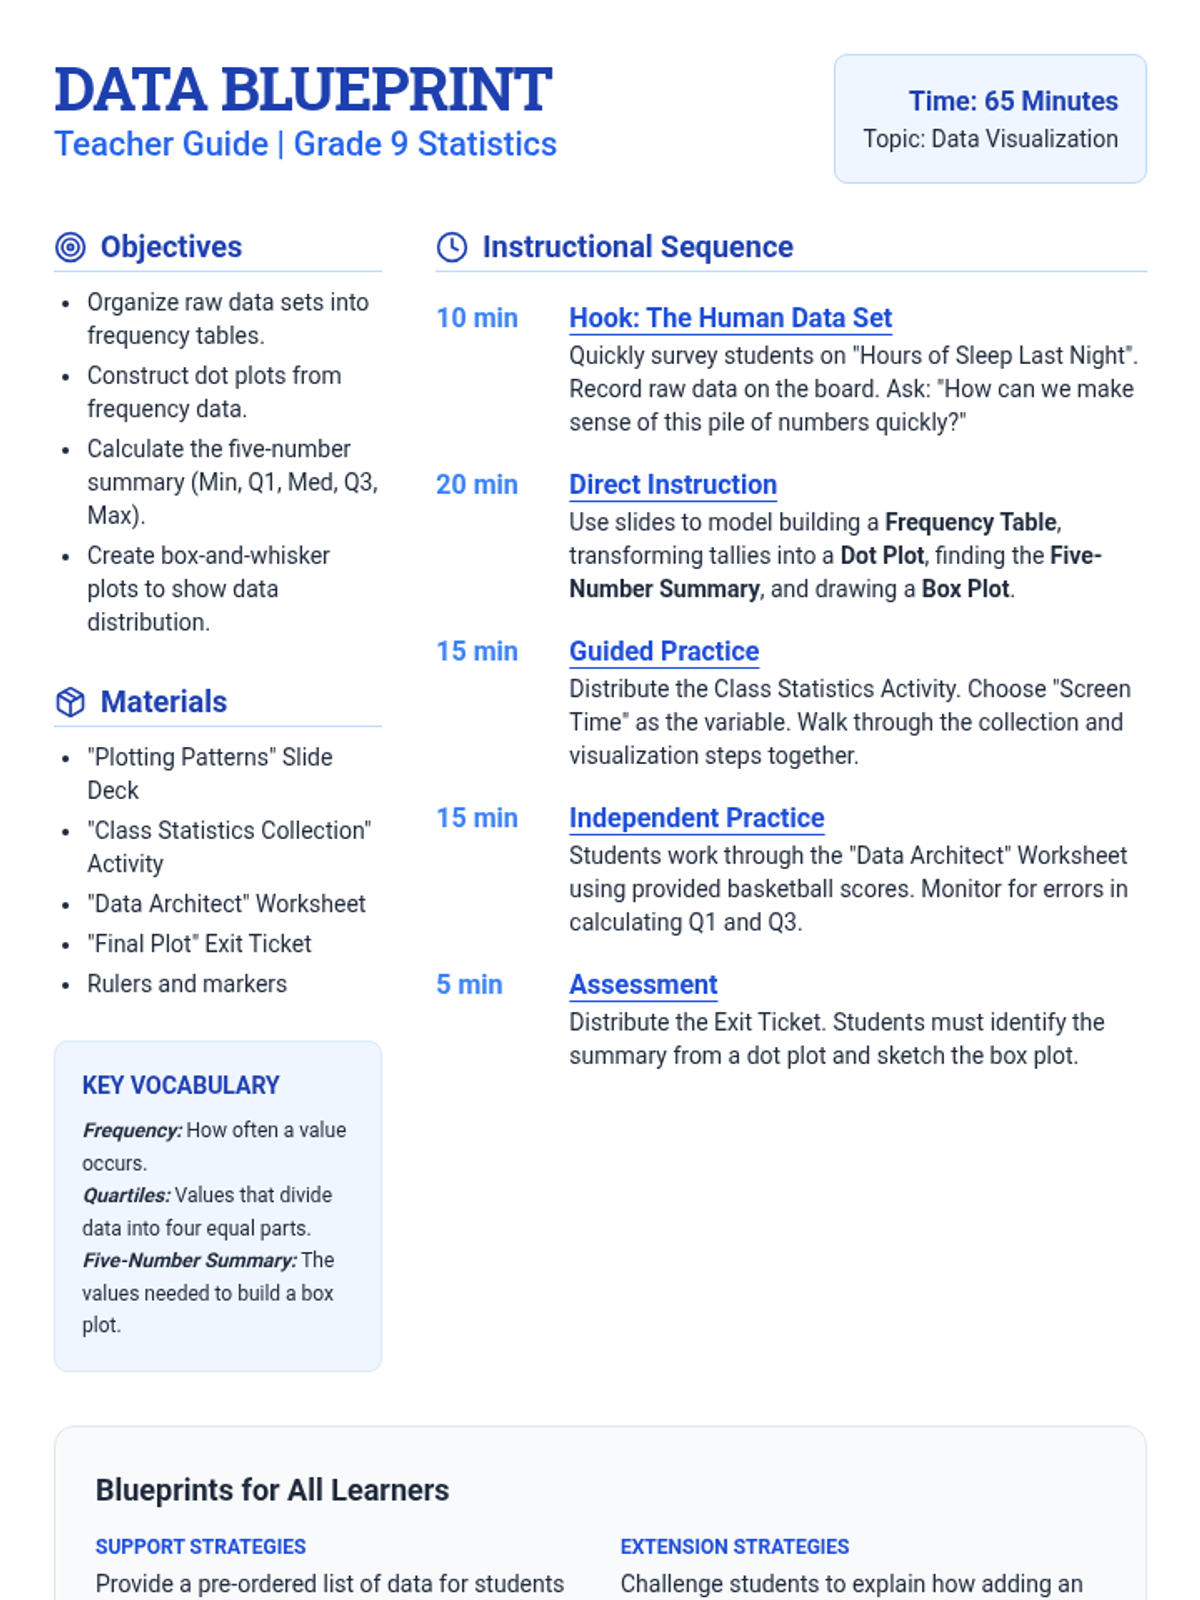
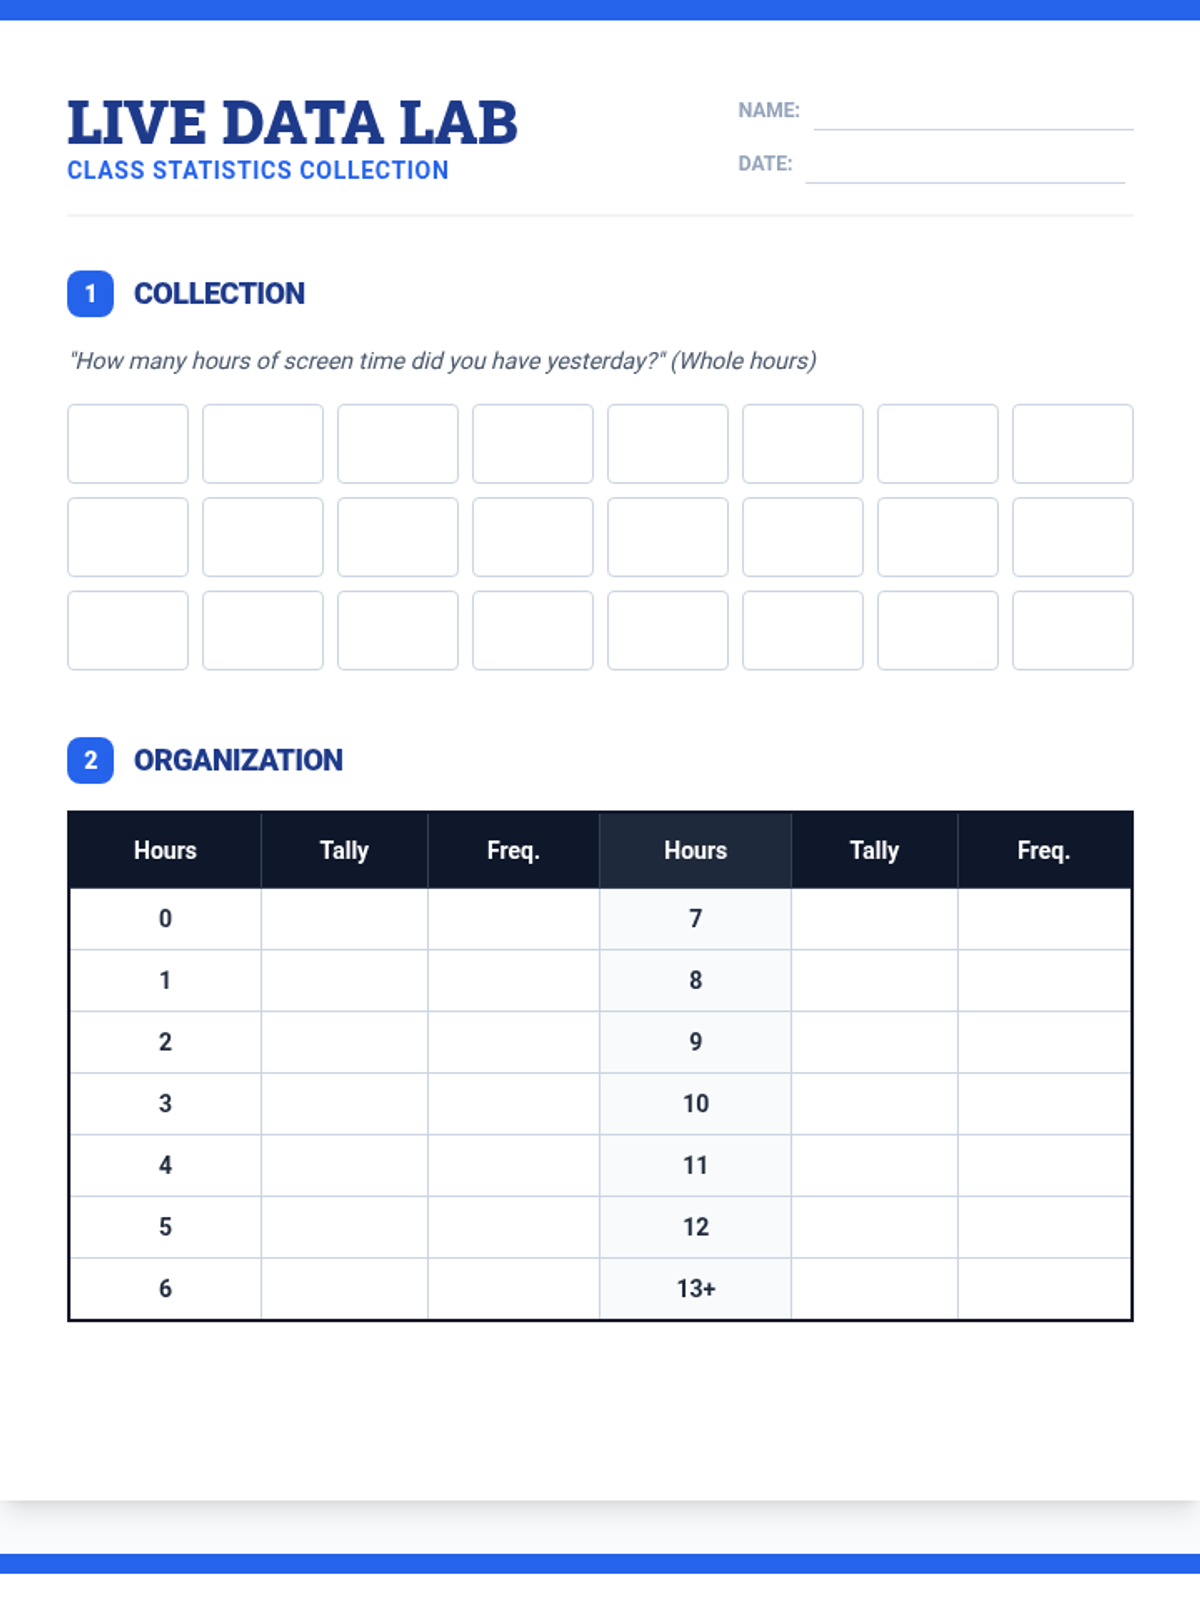
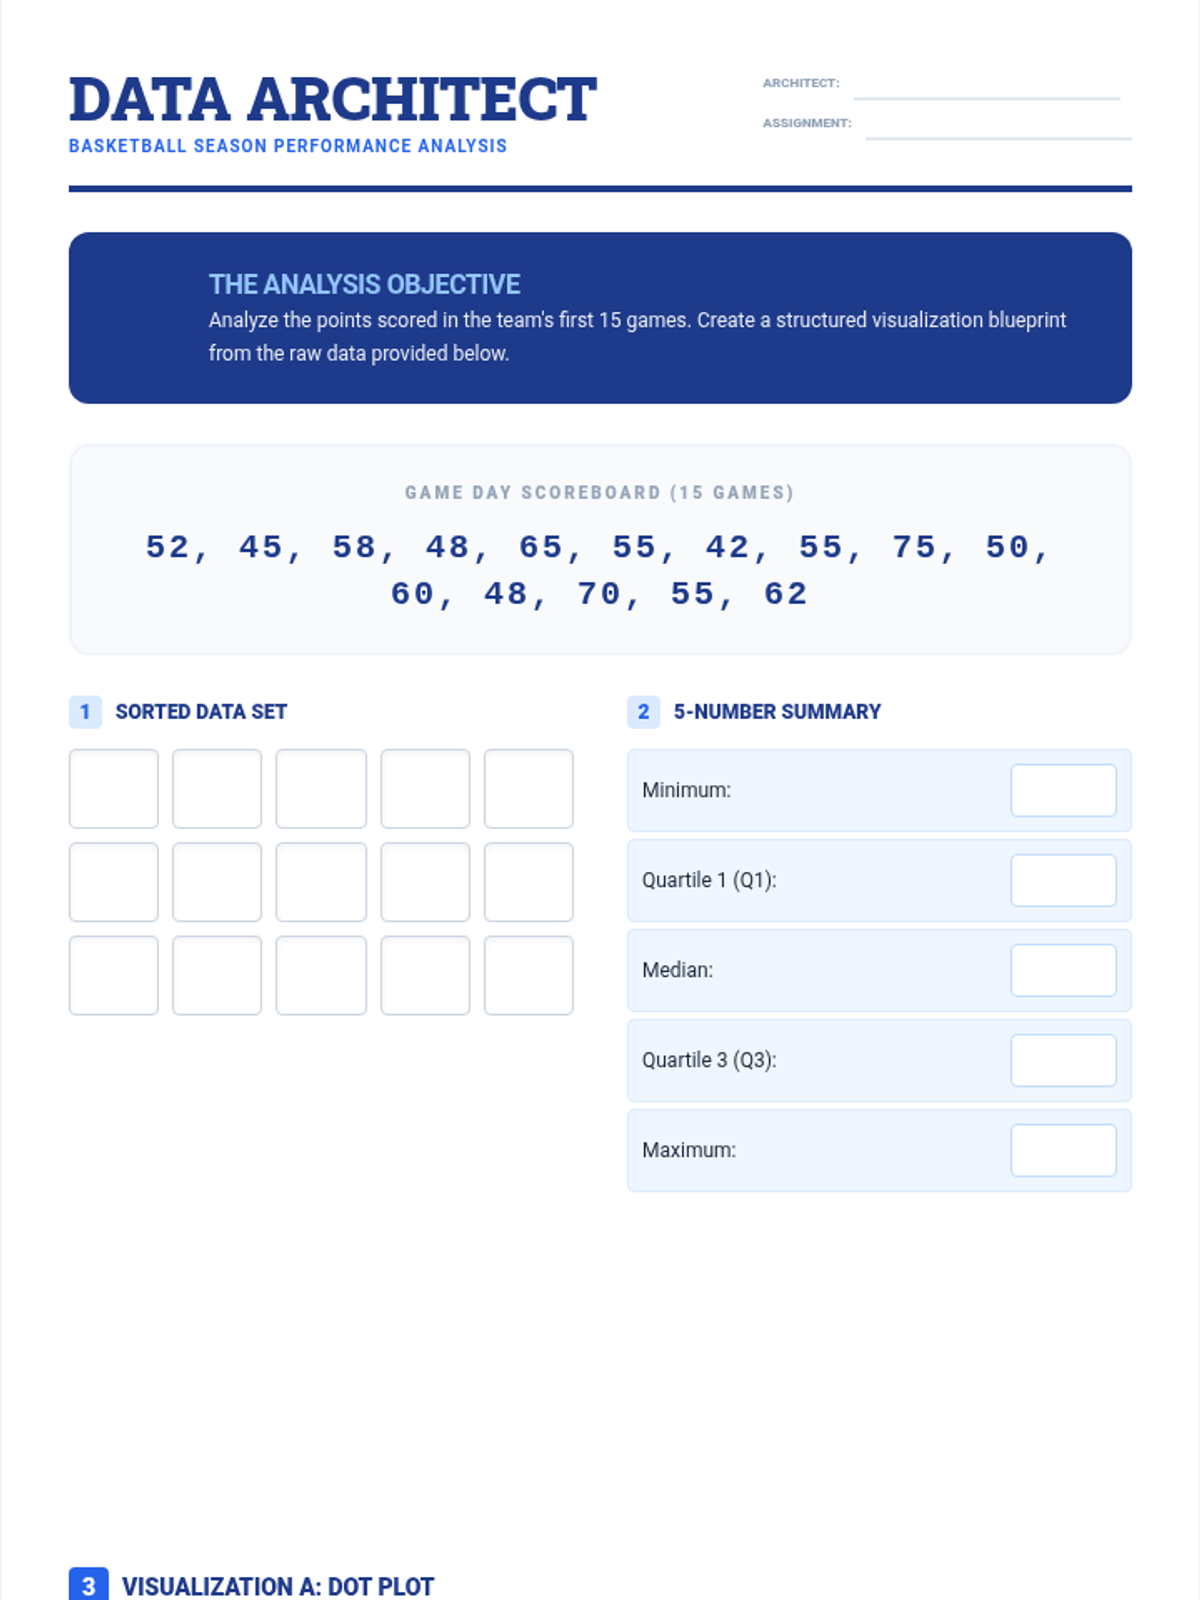
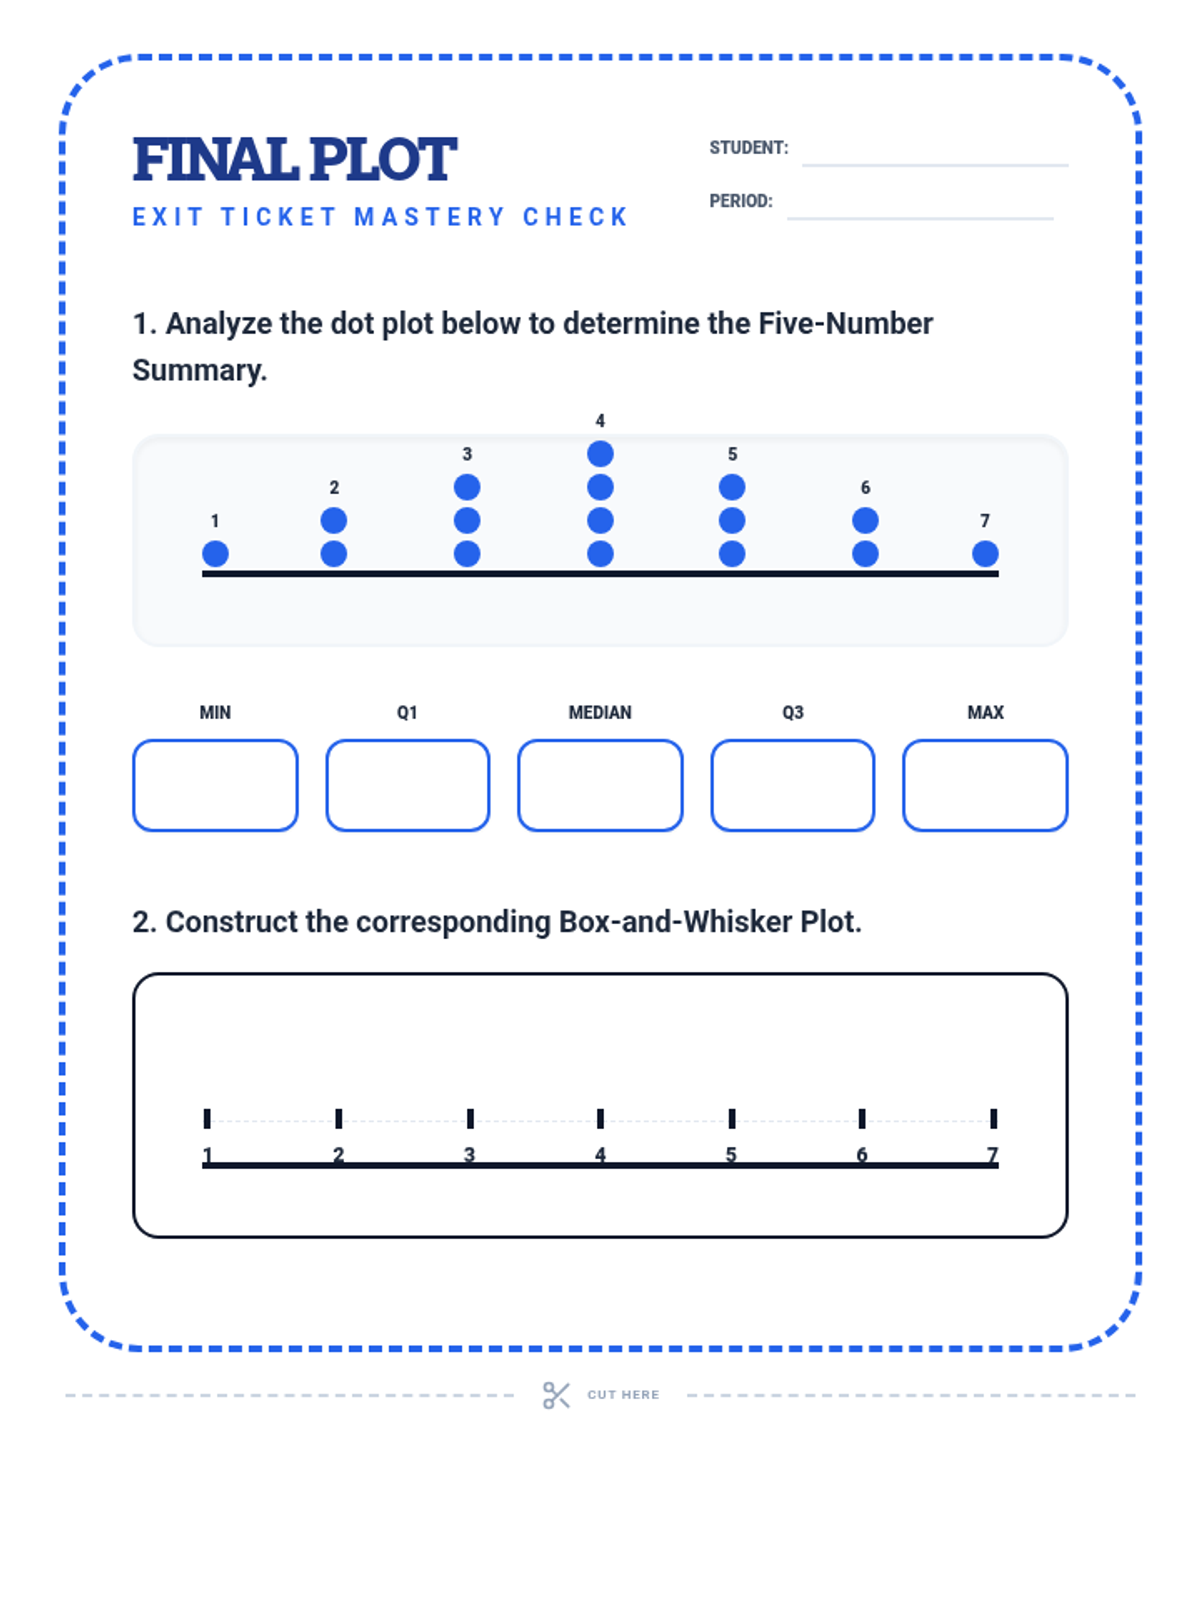
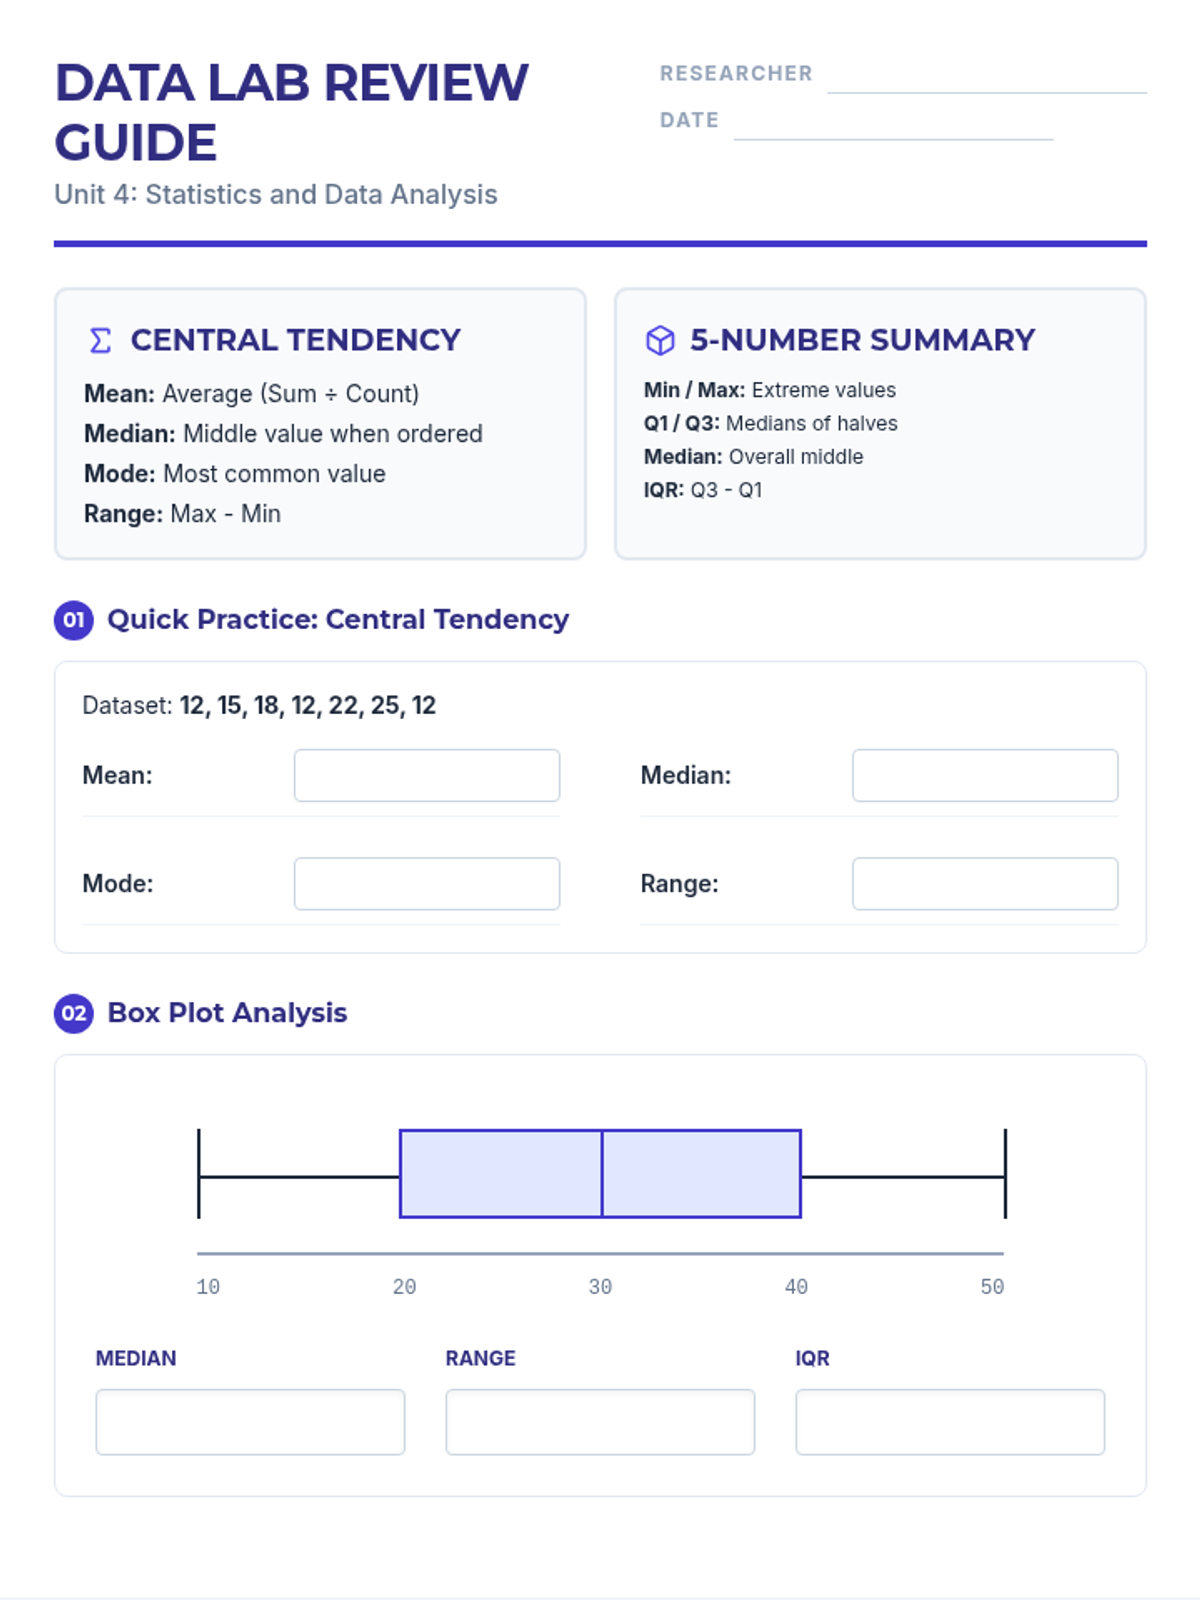
A comprehensive introduction to data visualization where students learn to transform raw tallies into organized frequency tables, dot plots, and box-and-whisker plots through a collaborative class survey.
A comprehensive assessment lesson for 9th-grade statistics, covering central tendency, data visualization, sampling, and correlation through a blueprint-themed instructional arc.
A 65-minute 9th-grade algebra lesson where students master drawing lines of best fit on scatter plots and using them to make mathematical predictions through interpolation and extrapolation.
A 65-minute lesson for 9th-grade students to master scatter plots and correlation. Students act as 'Data Detectives' to identify positive, negative, and no correlation patterns in real-world data sets.
A 9th-grade lesson focused on interpreting and comparing multiple box plots to analyze data distributions, spread, and skewness. Students will transition from basic identification to making data-driven conclusions across various scenarios.
A comprehensive 9th-grade statistics lesson focused on transforming raw data into structured visualizations including frequency tables, dot plots, and box-and-whisker plots. Students move from manual data collection to sophisticated statistical representation.
A foundational lesson on solving one-step equations using inverse operations, featuring a blueprint-inspired design to help students 'build' their algebraic skills.
Students explore compound probability and shuffle algorithms by analyzing song frequencies and streaming data to determine the likelihood of hearing their favorite tracks.
A 9th-grade algebra lesson where students master drawing trend lines on scatter plots and using them to make real-world predictions through interpolation and extrapolation.
A comprehensive assessment lesson focusing on data analysis and statistics. Students will review key concepts, complete a summative assessment, and reflect on their learning progress across measures of central tendency, data visualization, and bivariate data.
A 65-minute lesson for 9th Grade students exploring the fundamental concepts of population, sampling, and statistical bias. Students learn to distinguish between fair and biased collection methods through scenario analysis and sorting activities.
In this 9th-grade math lesson, students become 'Data Detectives' to uncover relationships between variables. They will learn to construct scatter plots and identify positive, negative, and zero correlation through hands-on matching and real-world data analysis.
A 65-minute lesson for 9th-grade students on interpreting and comparing box plots to analyze data sets. Students will learn to identify skewness, spread, and central tendency across multiple distributions.
A 9th-grade statistics lesson exploring mean, median, and mode, with a focus on identifying the most appropriate measure of central tendency in the presence of outliers. Students act as 'Data Detectives' to investigate real-world scenarios.
An exploration of geometric growth and the power of incremental habits for grades 7-12, combining mathematical modeling with behavioral science.
A focused assessment and practice module on right-triangle trigonometry, specifically covering the concepts of elevation and depression through architectural and surveying contexts.
A comprehensive geometry lesson on angles of elevation and depression, ranging from basic trigonometry to complex algebraic applications. Students will master identifying, labeling, and solving for angles and distances in real-world scenarios.
A comprehensive guide to graphing linear inequalities on a number line, focusing on symbol recognition, circle types, and directional mapping.
A comprehensive lesson introducing 45-45-90 and 30-60-90 triangles through the lens of architectural drafting and technical blueprints.
Master the art of writing linear equations from proportional tables using the architect's blueprint for constant of proportionality. Students will learn to identify the unit rate and construct y=kx equations with precision.
A practice-focused lesson where students identify independent and dependent variables in relatable, modern scenarios like sports, snacks, and technology.
A high-speed, foundational introduction to solving one-step equations using the balance scale analogy. Designed for a 20-minute instructional block.
A 9th-grade algebra lesson focusing on applying the quadratic formula to real-world projectile motion. Students will calculate the time a kicked ball spends in the air before hitting the ground by solving for the zeros of a quadratic equation.
A professional development resource for educators to explore and implement alternative teaching models when traditional math instruction isn't reaching every student. This lesson provides frameworks for co-teaching, math workshops, and targeted interventions.