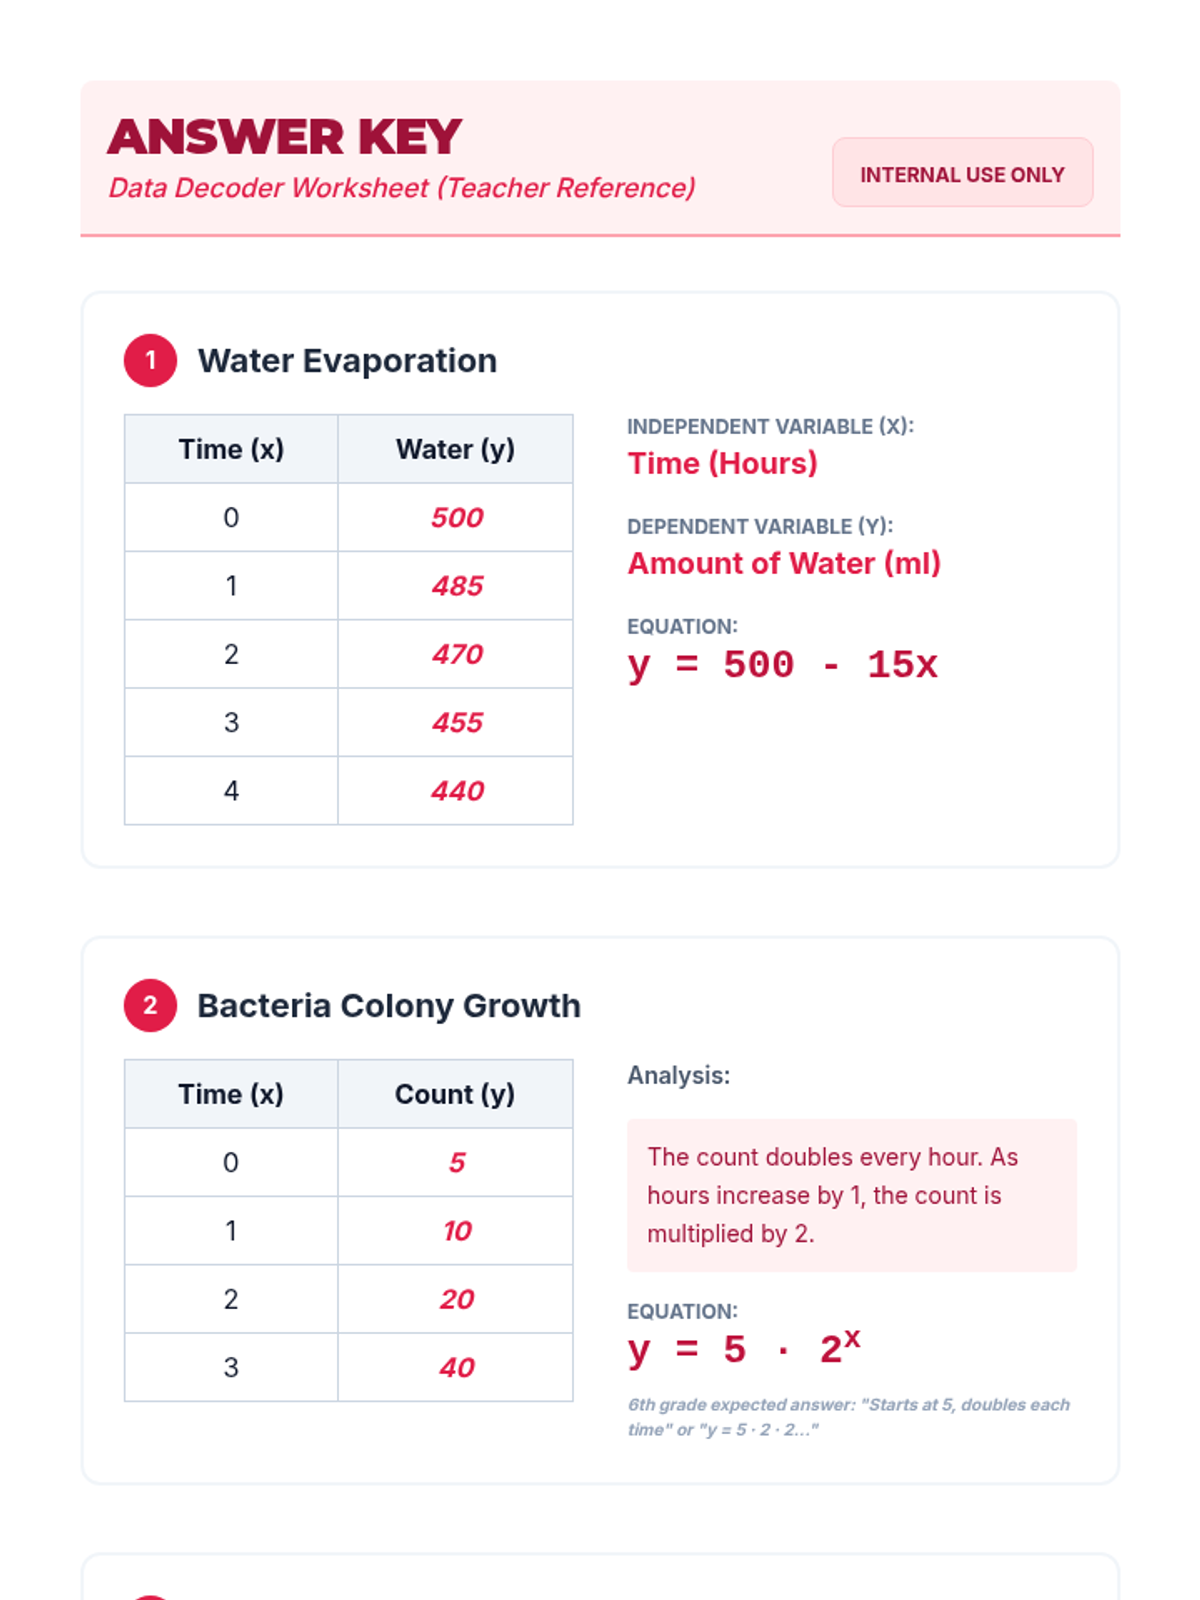
Teacher version of the box plot guided notes, including all definitions, calculated values for the example problem, a completed box plot diagram, and a reflection response.
A concise answer key for the Price Tag Pro Exit Ticket, including completed calculations and a sample conceptual response. Fixes layout, contrast, and page breaks.
An answer key and teacher reference for the Shopping Spree Project, including math formulas, an item price list, and a complete sample solution. Fixes PDF rendering issues and text contrast. Final one-page layout.
A detailed answer key for the Bistro Menu Activity, providing itemized breakdowns, tax and tip calculations, and final totals for both scenarios. Fixes page breaks and alignment.
Teacher answer key for the Fraction Forge worksheet. Provides LCD identification, step-by-step conversion, and final answers for all 10 fraction computation problems. Matchings the blacksmith theme.
A blacksmith-themed math worksheet for monitoring progress in adding and subtracting proper and improper fractions using the least common denominator. Includes dedicated workspace for finding the LCD and final computation for 10 problems. Optimized layout to keep problems whole on each page.
A set of activity cards and teacher guide for a 'Whiteboard Dash' classroom game, where students compete in teams to represent scientific data scenarios as tables, graphs, and equations.
Teacher answer key for the Equation Engineer worksheet, containing completed data tables and explanations for graph intercepts and proportional relationships.
A student worksheet that reverses the process by providing equations for science scenarios and requiring students to generate data tables, plot graphs, and reflect on the origin point of different variable relationships.
Teacher answer key for the Data Decoder worksheet, containing solved data tables, variable identifications, and mathematical equations for all science experiment scenarios.
Revised student worksheet with improved page breaks, a professional graphing grid for the physics experiment, and clearer instructional prompts for 6th-grade level analysis.
Updated instructional slide deck replacing the astronomy visual with a Botany Lab growth sequence, visually demonstrating plant growth at 0, 2, 4, and 6 days to set up the corresponding data table. Includes fixed SVG rotation and improved visuals.
Revised 90-minute teacher's guide for the Variable Lab investigation, condensed to fit on one page with fixed math rendering and clearer lesson flow.
A detailed instructional script for teachers to facilitate the Savvy Shopper Simulation, including word-for-word prompts, pacing cues, and classroom management tips.
Printable price tag cards for the Savvy Shopper Simulation. Each card represents a party item with a specific price and category. Revised for improved layout, consistent footers, and better page breaks.
A student worksheet for the Savvy Shopper Simulation, featuring a structured budget tracker for items, prices, and estimates. Revised for better page breaks and increased workspace for addition.
A visually engaging slide deck for the Savvy Shopper Simulation, introducing students to the budget challenge, estimation strategies, and cost-comparison techniques.
A comprehensive teacher lesson plan for the Savvy Shopper Simulation, outlining objectives, instructional steps, and differentiation strategies for grades 3-7. Revised for improved page breaks and accessibility.
The answer key for the Fact Leap Worksheet, including solved products and a scoring guide for teachers.
A comprehensive teacher resource providing instructional strategies, common misconceptions, and guided prompts for teaching multiplication via number lines to special education students.
An instructional slide deck designed for special education students, introducing multiplication through repeated addition and the visual "number line leap" strategy for facts up to 5.
A multiplication worksheet (facts 0-5) featuring 8 problems, each with a 0-20 number line for skip counting and visual support, designed for special education students.
A student worksheet for 'Momentum Lab' where learners solve exponential growth problems and apply the '1% Rule' to their own personal habits and skill development.
A classroom simulation activity where students model and compare linear vs. geometric growth patterns to discover the tipping point of compounding.
A high-impact slide deck for the 'Momentum Lab' lesson, featuring visual proofs of compounding, comparisons of linear vs. geometric growth, and the '1% Rule' mathematical breakdown.
A detailed lesson plan for 'Momentum Lab', outlining objectives, materials, and a step-by-step instructional sequence focused on the compounding effect and geometric growth.
An introductory presentation slide deck defining the angles of elevation and depression with visual diagrams and a step-by-step problem-solving strategy.
A detailed teacher answer key for the Summit Sight Quiz, including full trigonometric step-by-step solutions and final answers rounded to specified precision.
A 5-question printable assessment on the angle of elevation and depression, featuring a technical architectural drafting theme and ample workspace for calculations.
A teacher's answer key for the Skyline Sightlines Quiz, providing final numerical answers and step-by-step trigonometric solutions.
A summative assessment covering angle of elevation and depression, including conceptual explanations, basic trig ratios, and multi-step word problems.
A quick assessment for the end of the lesson, featuring one diagram/concept question and one calculation problem to gauge student understanding of angles of elevation and depression.
A teacher's solution guide for the advanced challenge problems, providing step-by-step algebraic systems and substitution methods for finding heights and distances.
An advanced set of word problems requiring students to use algebraic systems and multi-step trigonometric solutions for complex elevation and depression scenarios.
A detailed teacher's answer key for the Skyline Sightlines Practice Worksheet, including step-by-step trigonometric equations and final rounded answers.
A multi-level practice worksheet covering angle of elevation and depression, including basic identification, solving for missing sides/angles, and multi-step word problems.
Student-facing guided notes designed to accompany the Skyline Sightlines slides, featuring fill-in-the-blank definitions and dedicated workspace for classroom examples.
A visual reference guide and graphic organizer showing the relationship between angles of elevation and depression, including the "Z" rule for alternate interior angles.
An instructional slide deck for Skyline Sightlines, covering definitions, the "Z" rule (alternate interior angles), and step-by-step examples across three difficulty levels.
A teacher's lesson plan for Skyline Sightlines, detailing instructional flow, common misconceptions, and differentiation strategies for angles of elevation and depression.
Comprehensive answer key and teacher resource for the Equation Equilibrium lesson. Includes completed notes, worksheet solutions, and teaching tips for addressing common misconceptions. Fixed variable rendering, layout orphans, and clarified answer descriptions.
Practice worksheet for one-step algebraic equations. Features exercises on translating visual balance models to equations, drawing models for given equations, and identifying errors in the balancing process. Consolidated layout to 1-2 pages, rebuilt robust scale diagrams, and cleared pre-filled student answers. Reversed the tilt logic in Part 3 to correctly represent mass.
Guided notes for introducing one-step algebraic equations using a balance scale visual model. Includes key vocabulary, the "Golden Rule" of algebra, and walkthrough examples for addition and multiplication. Fixed variable rendering and visual alignment issues. Standardized fill-in-the-blank widths and ensured instructional blocks do not split across pages. Consolidated layout to a single page.
A visual slide deck teaching the process of subtracting mixed numbers with regrouping. Features a construction-themed narrative and 10 practice problems formatted vertically for clear calculation alignment.
Teacher's answer key for the Mixed Number Rescue Worksheet, providing full step-by-step solutions including common denominators and regrouping steps for all 12 problems formatted vertically. Includes clear problem numbers and avoids awkward page breaks.
A guided practice worksheet for subtracting mixed numbers with unlike denominators that require regrouping. Features a checklist of steps and 12 total exercises formatted vertically with ample space for working out calculations.
The teacher answer key for the Border Patrol Worksheet, featuring visual solution graphs and written inequalities.
A practice worksheet for students to graph various inequalities on number lines and write inequalities from given graphs.
A comprehensive reference sheet for graphing inequalities on a number line, including a symbol cheat sheet, keyword signals, and visual examples.
A visual presentation deck for teaching how to graph basic inequalities on a number line, including symbol meanings, circle types, and keywords.
Complete teacher answer key for the Decimal Dash quiz, including final answers, problem references, and a suggested scoring rubric.