Data representation, distributions, and statistical variability using sampling and inference techniques. Integrates probability models, compound events, bivariate patterns, and linear models to guide data-driven decision making.
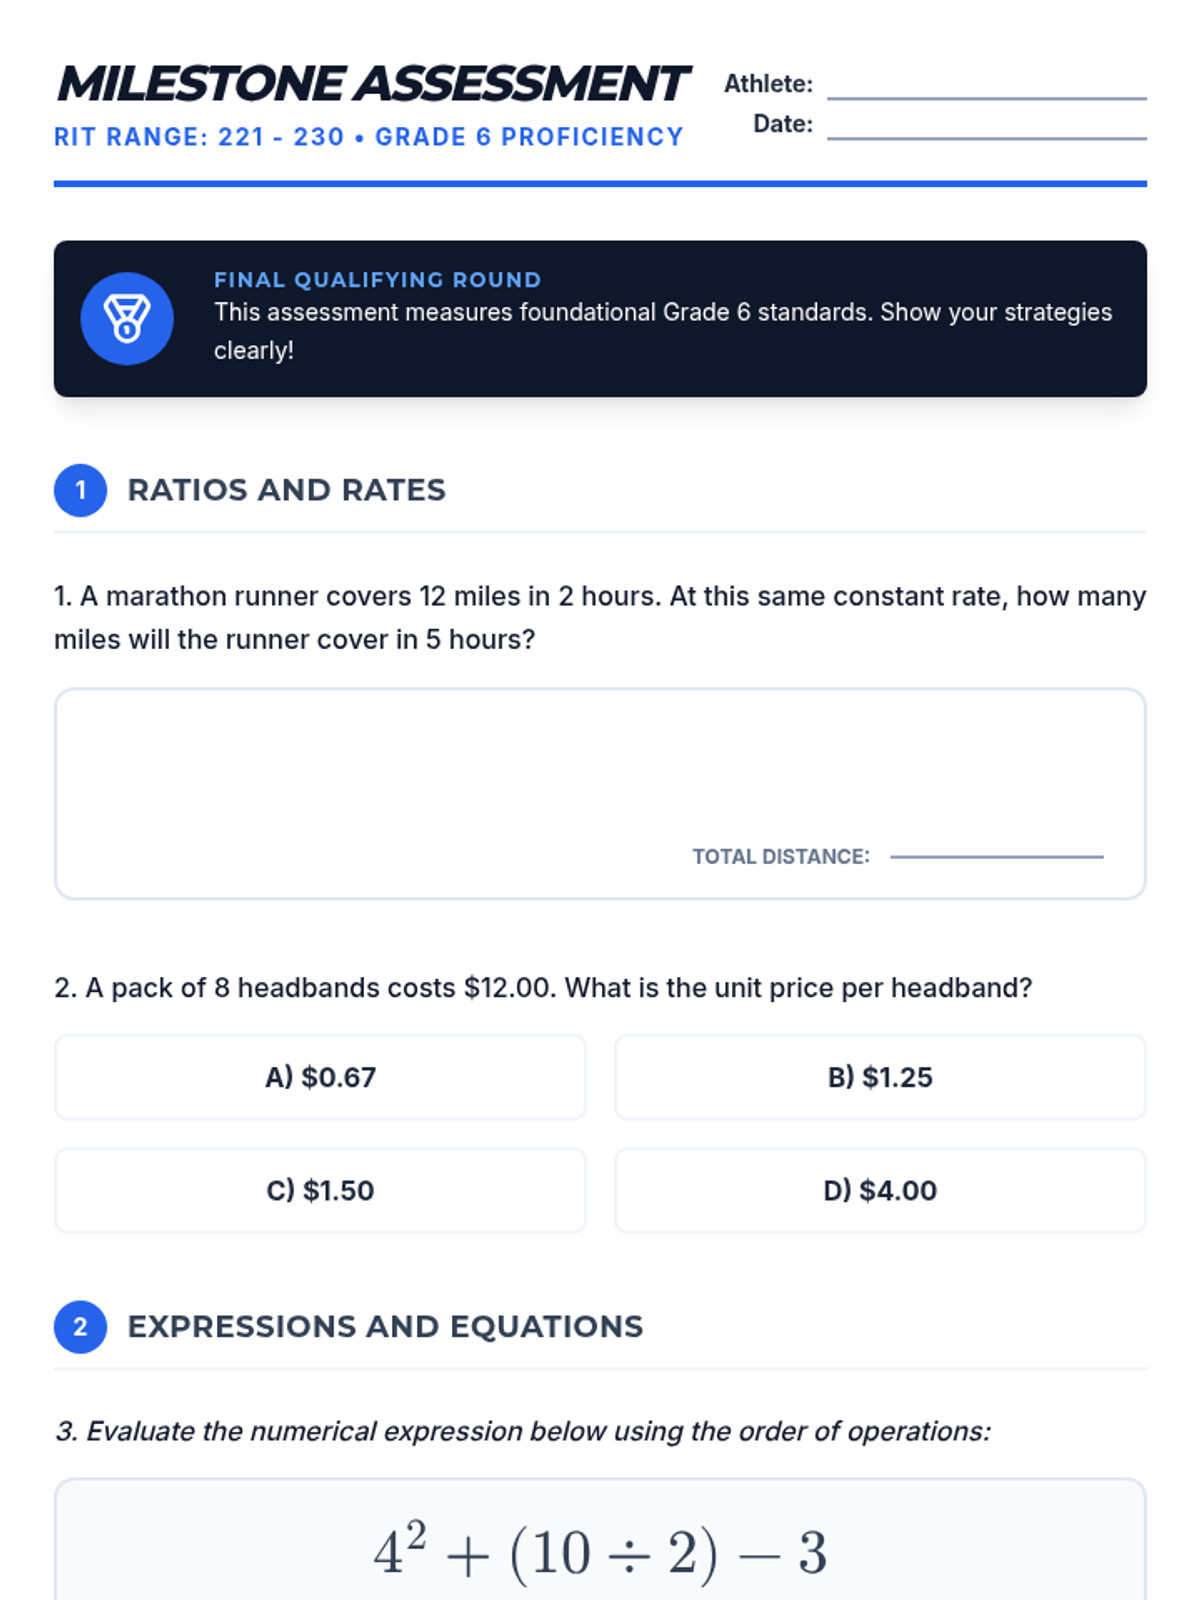
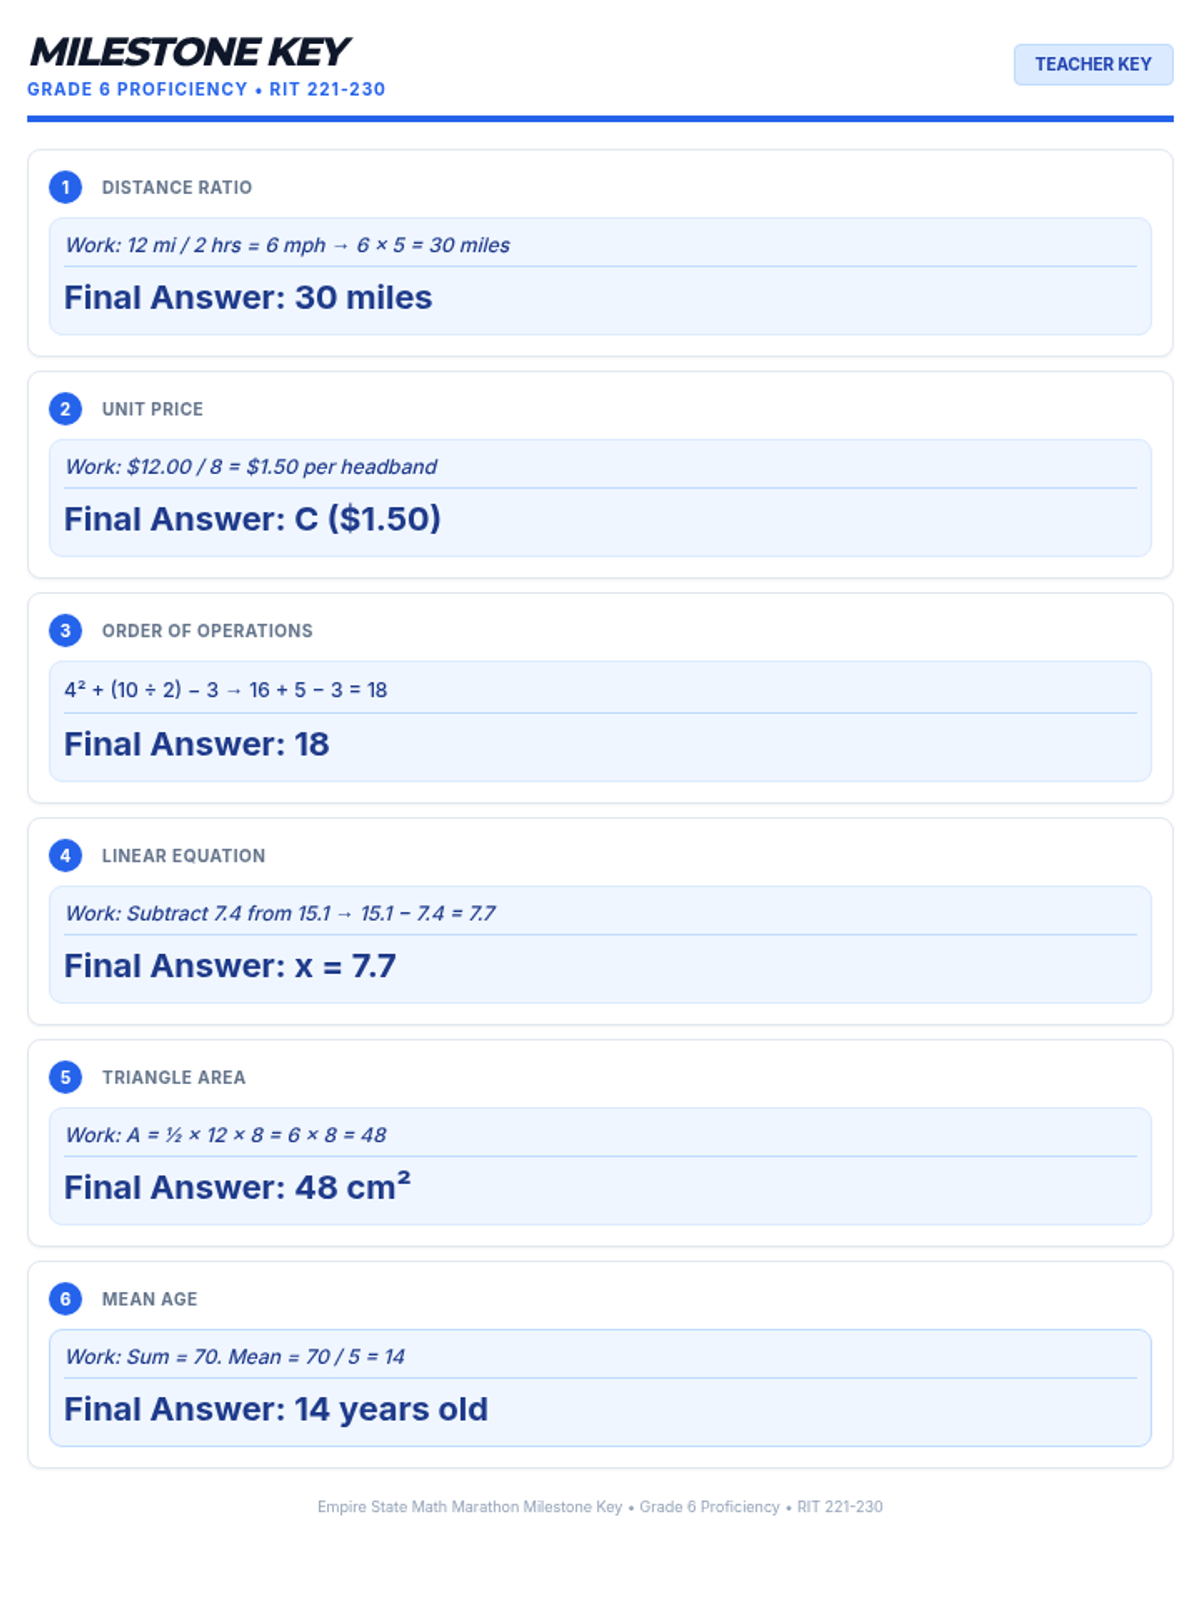
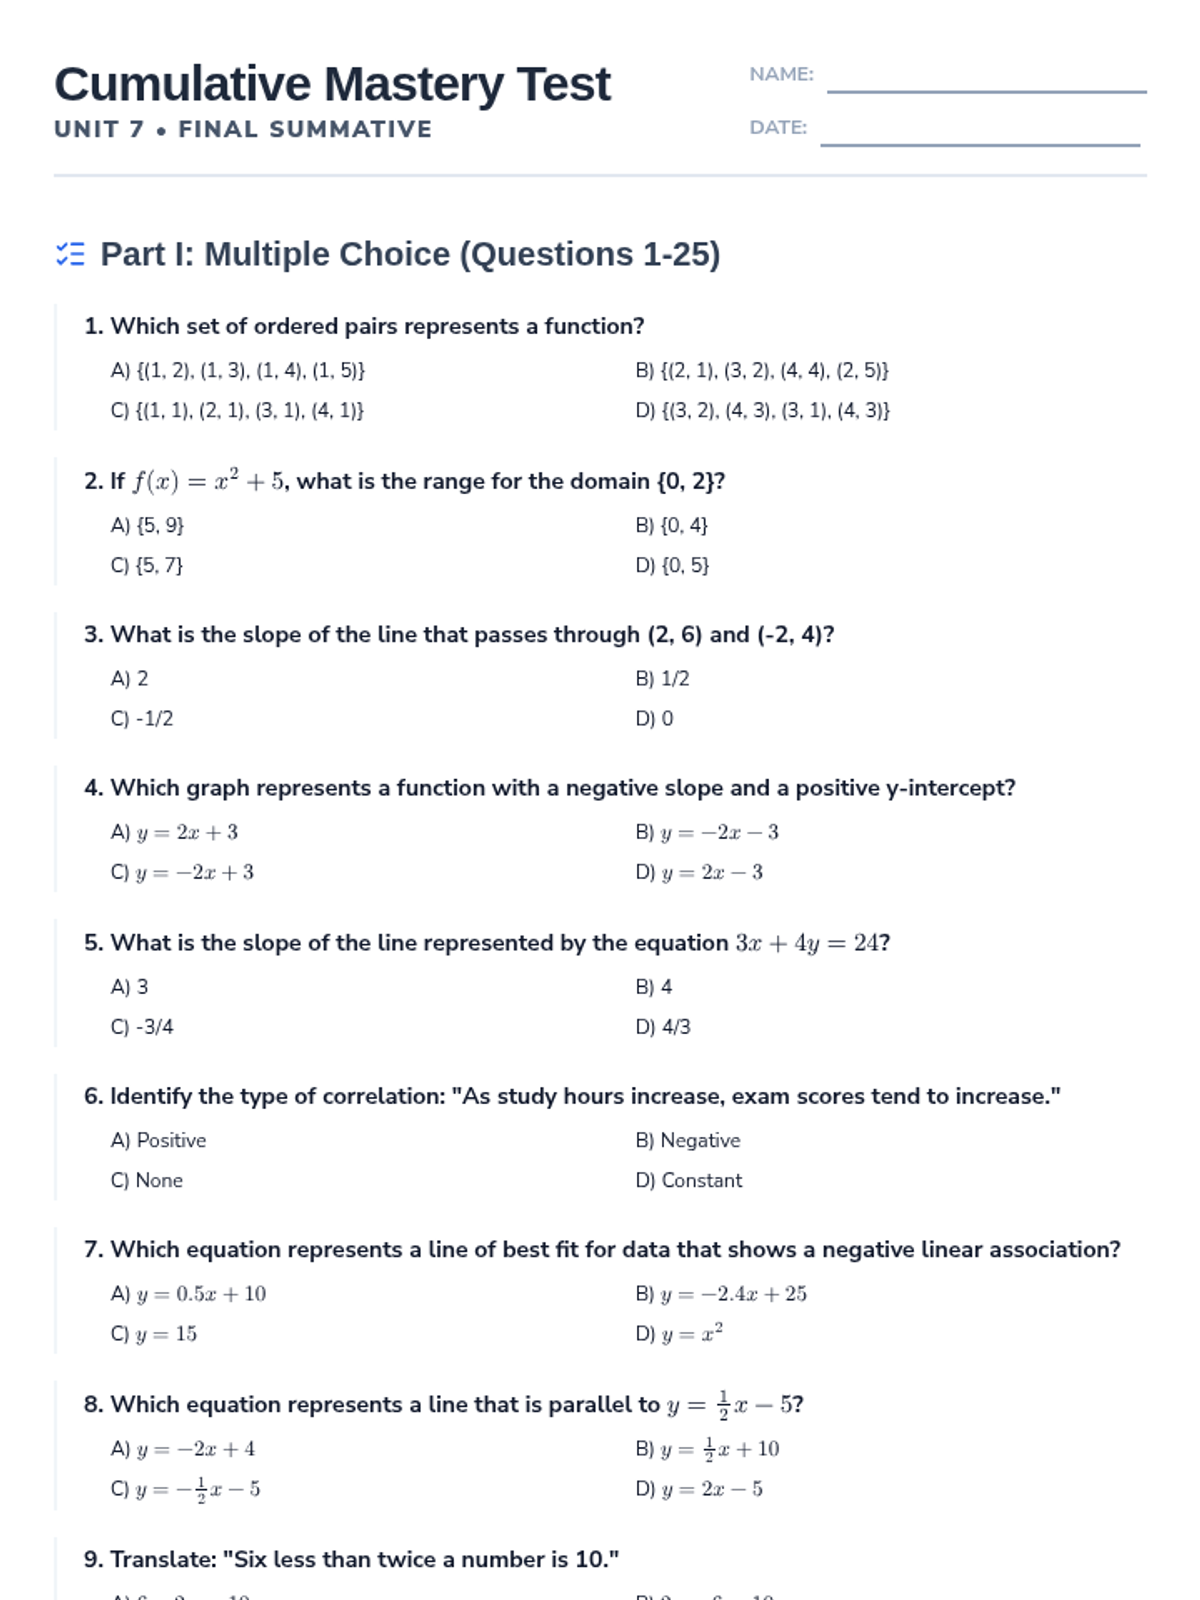
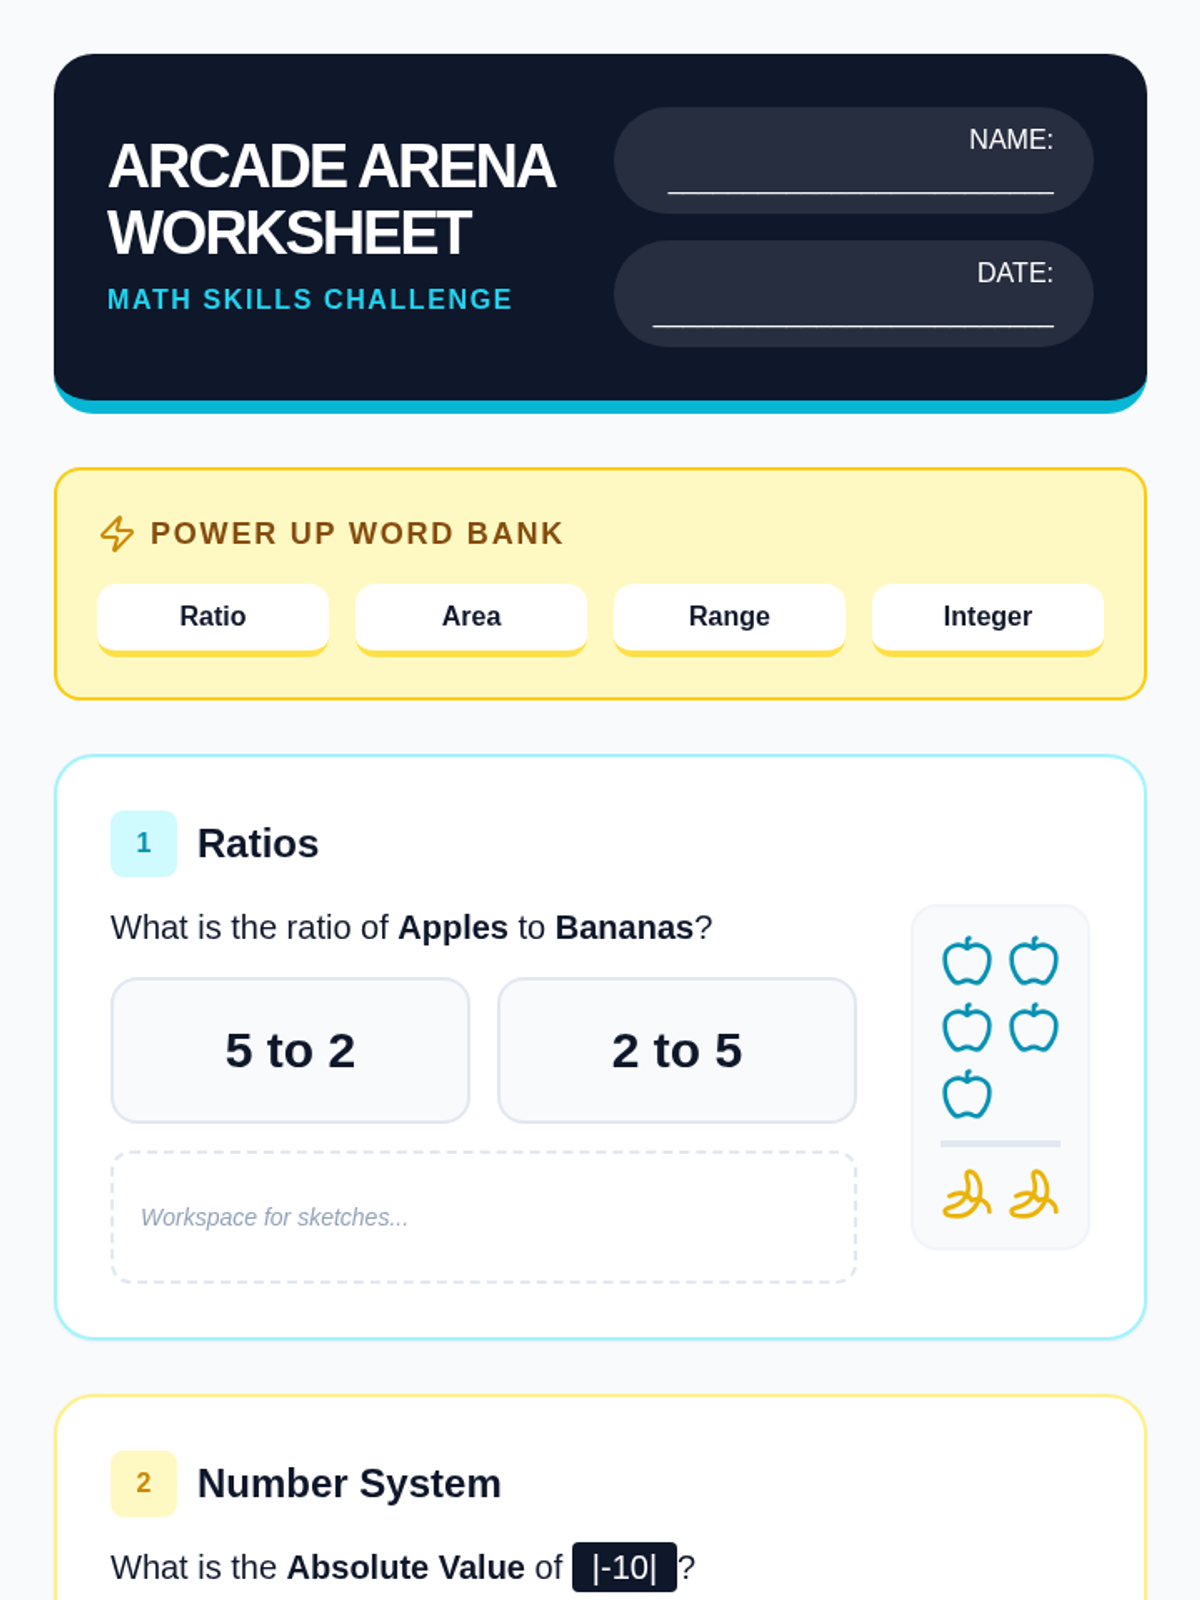
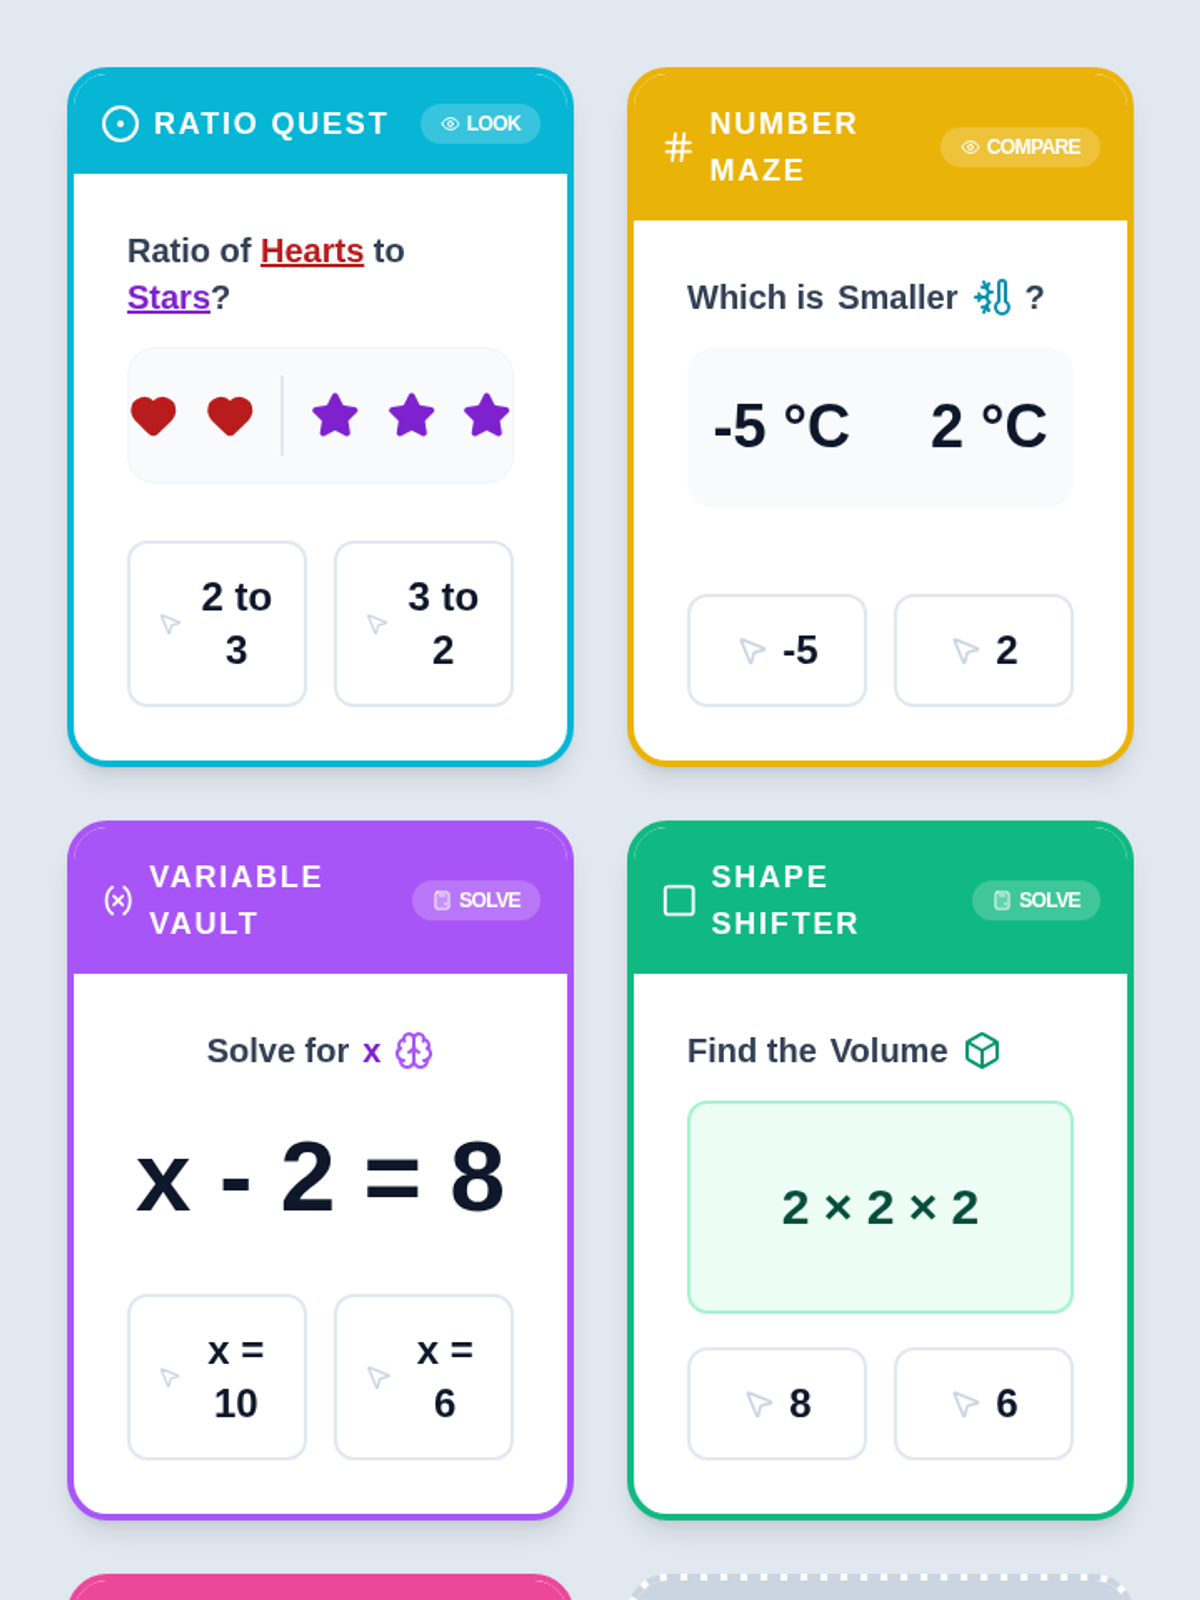
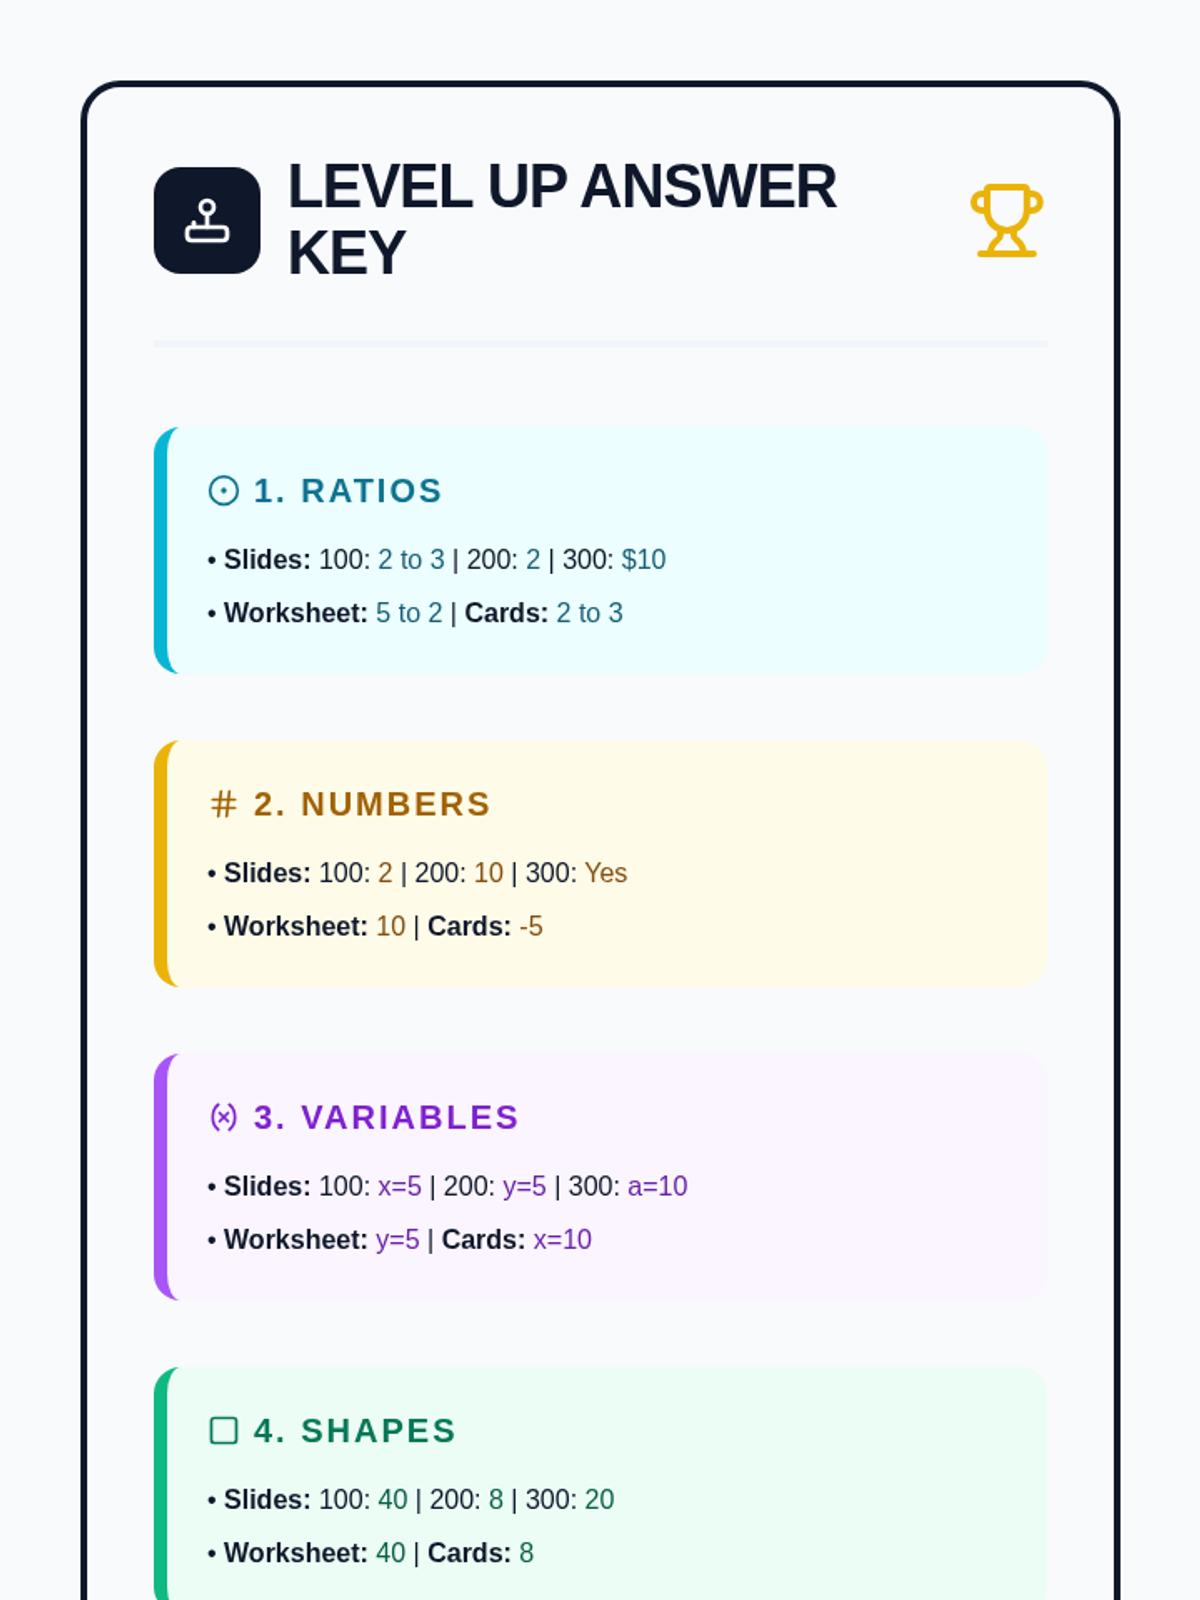
A cumulative milestone assessment designed for students at Grade 6 proficiency (RIT 221-230). This assessment checks foundational understanding of ratios, expressions, and geometry needed for 8th-grade success.
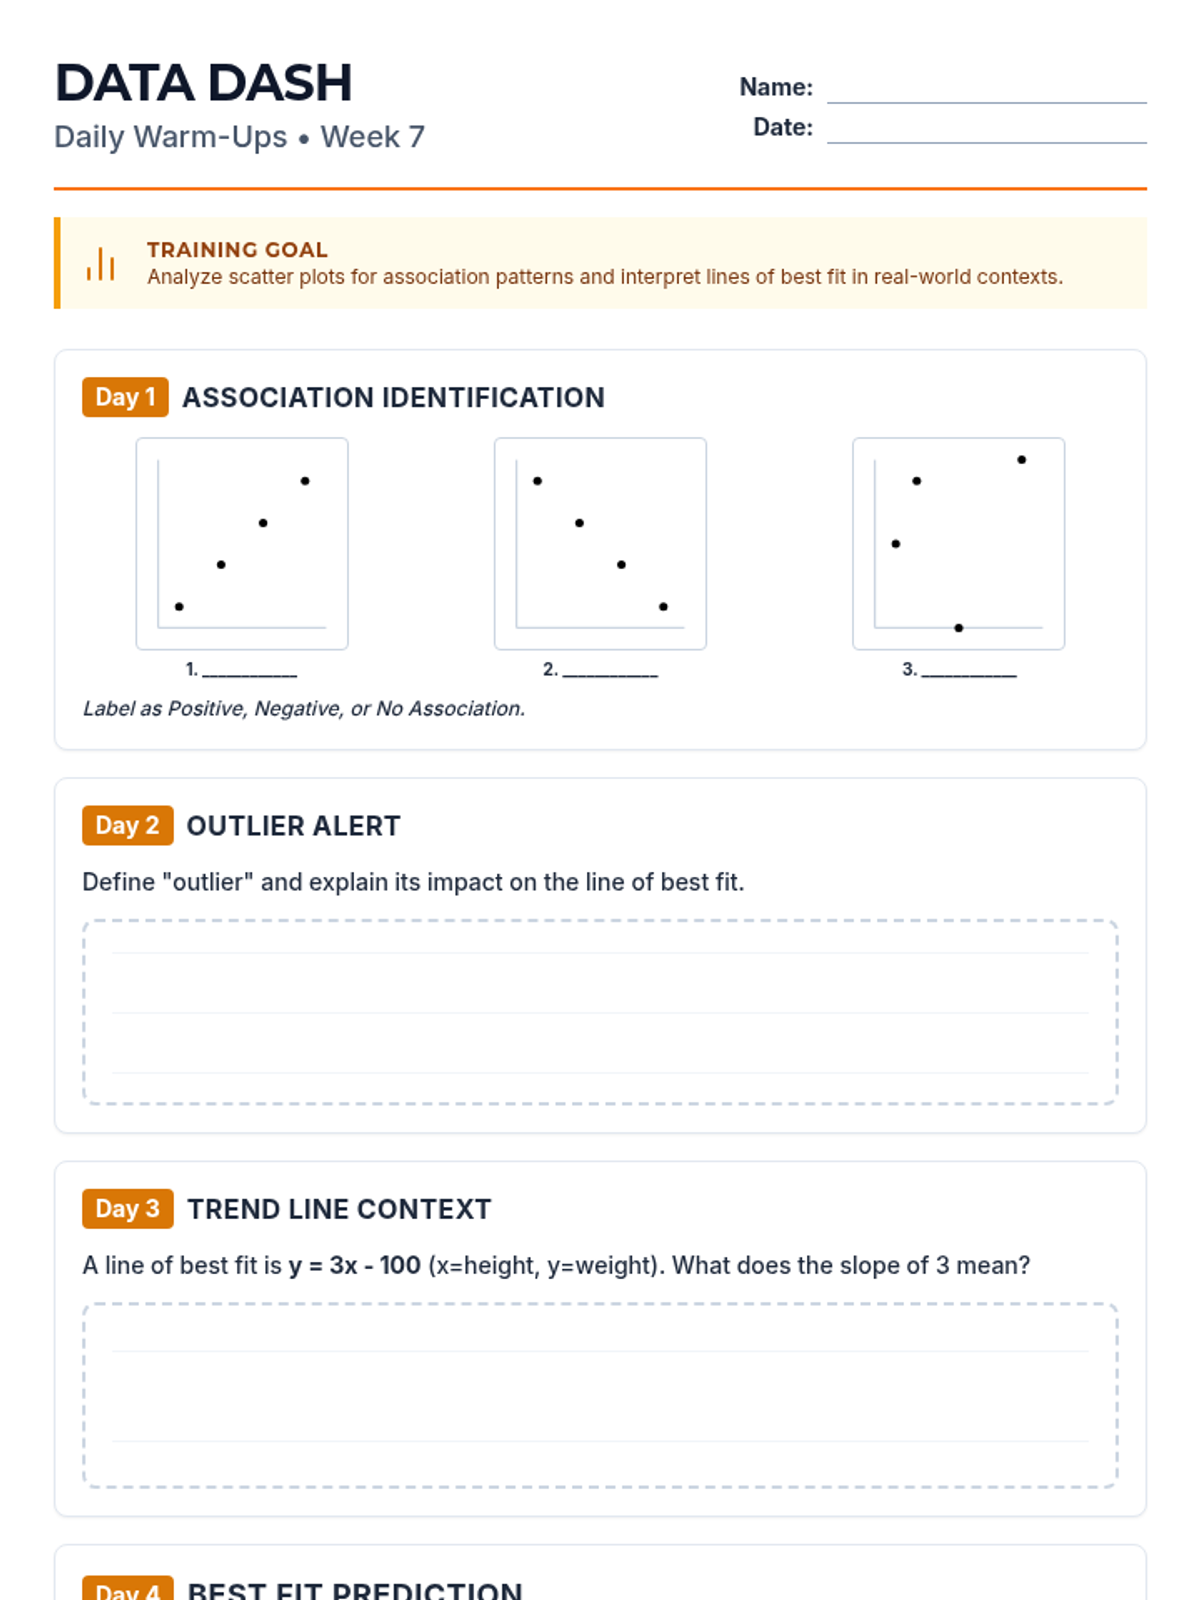
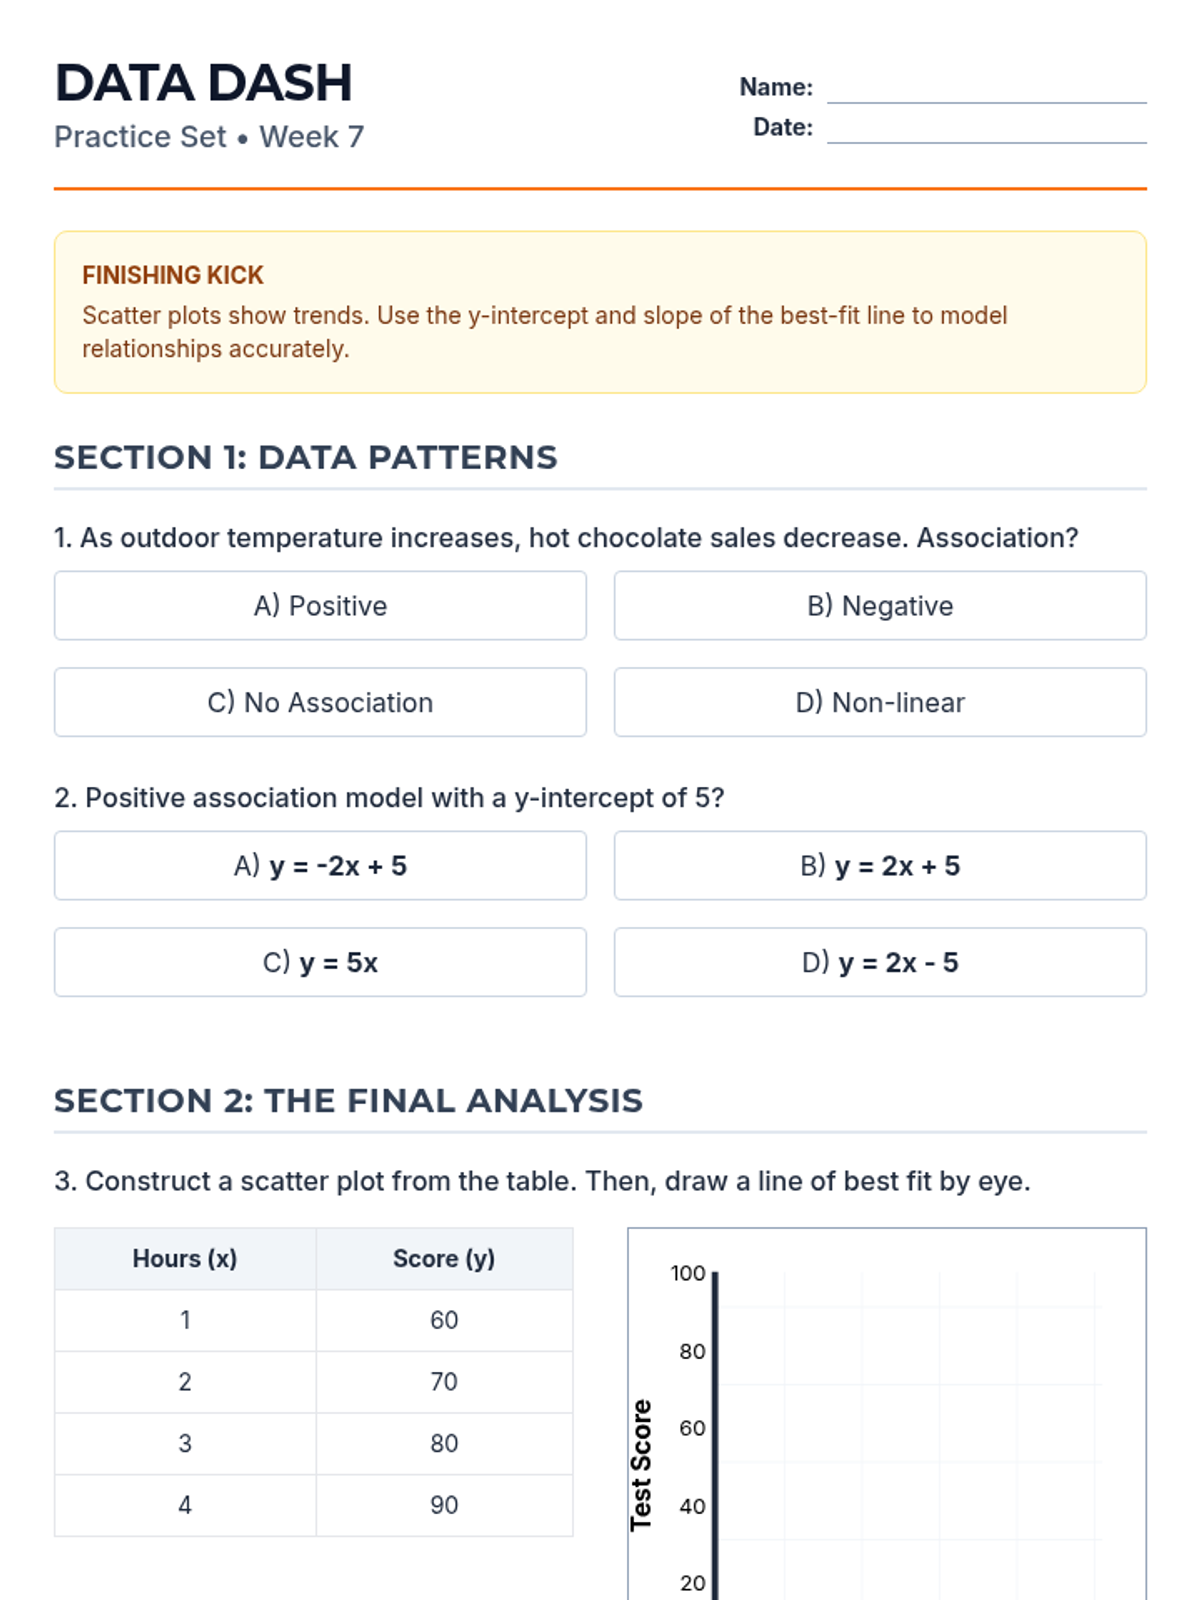
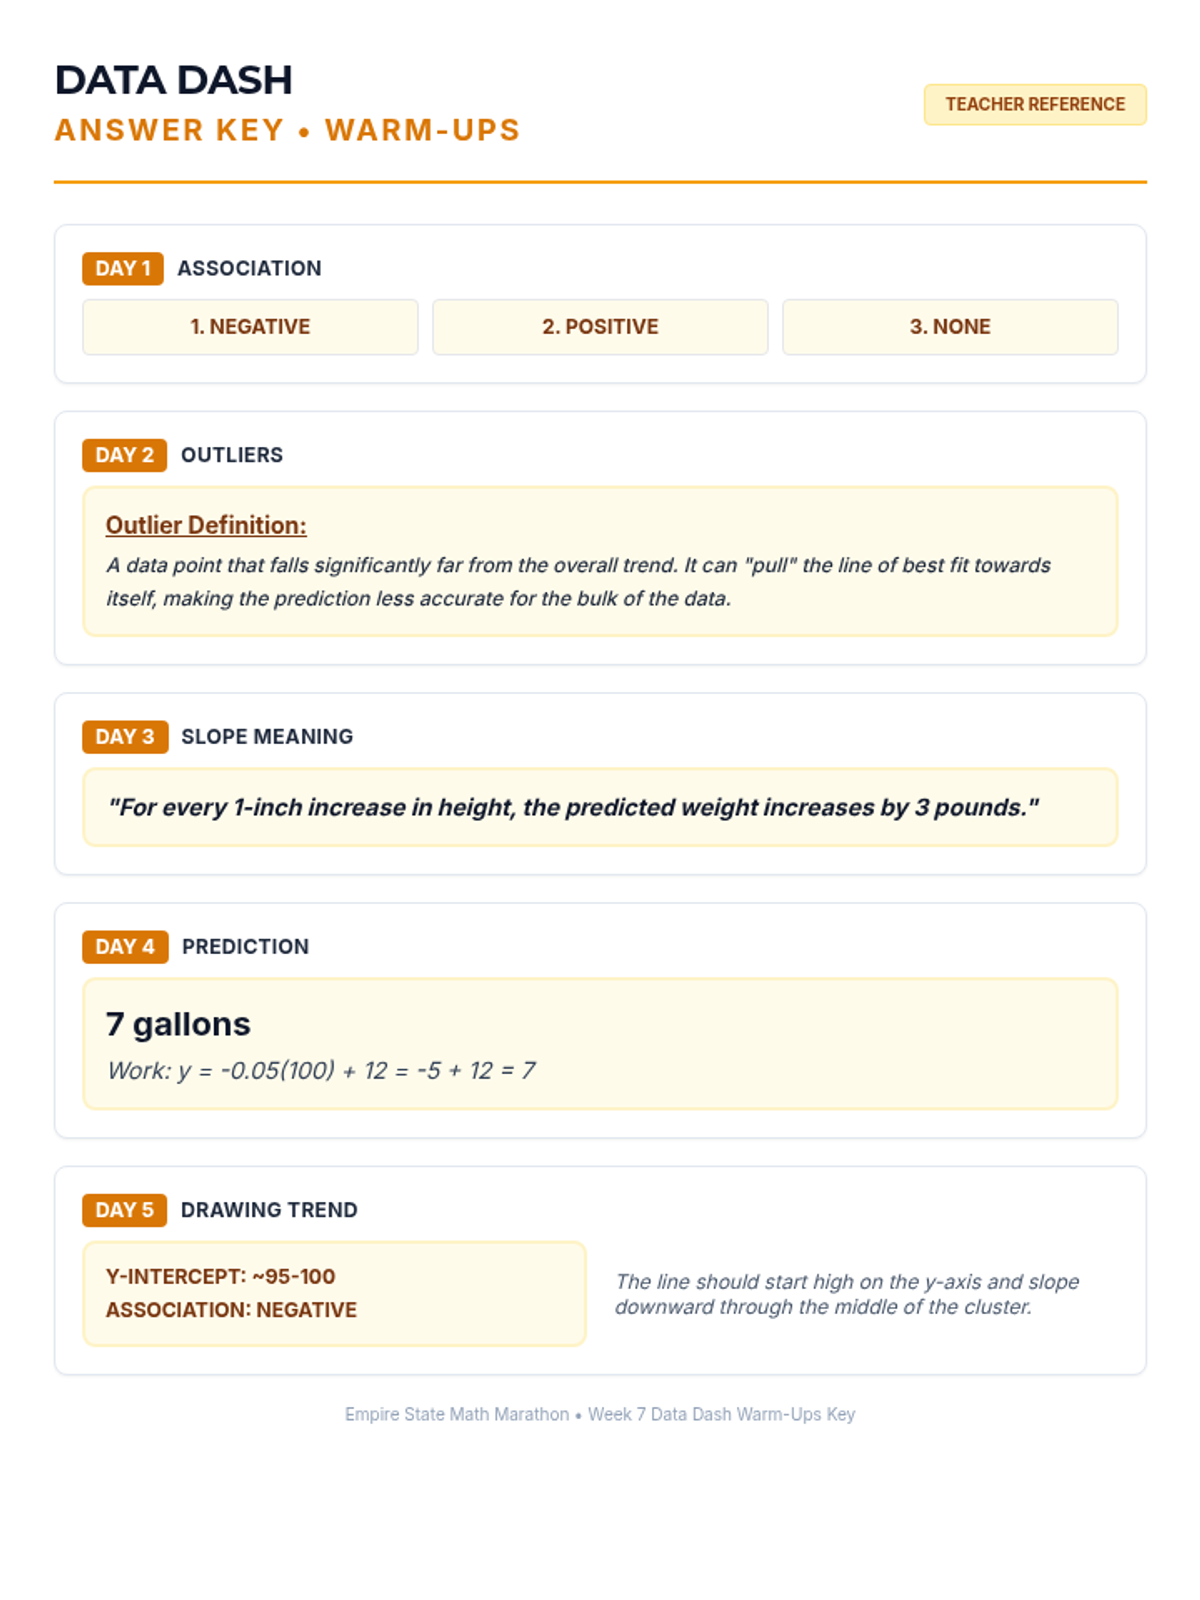
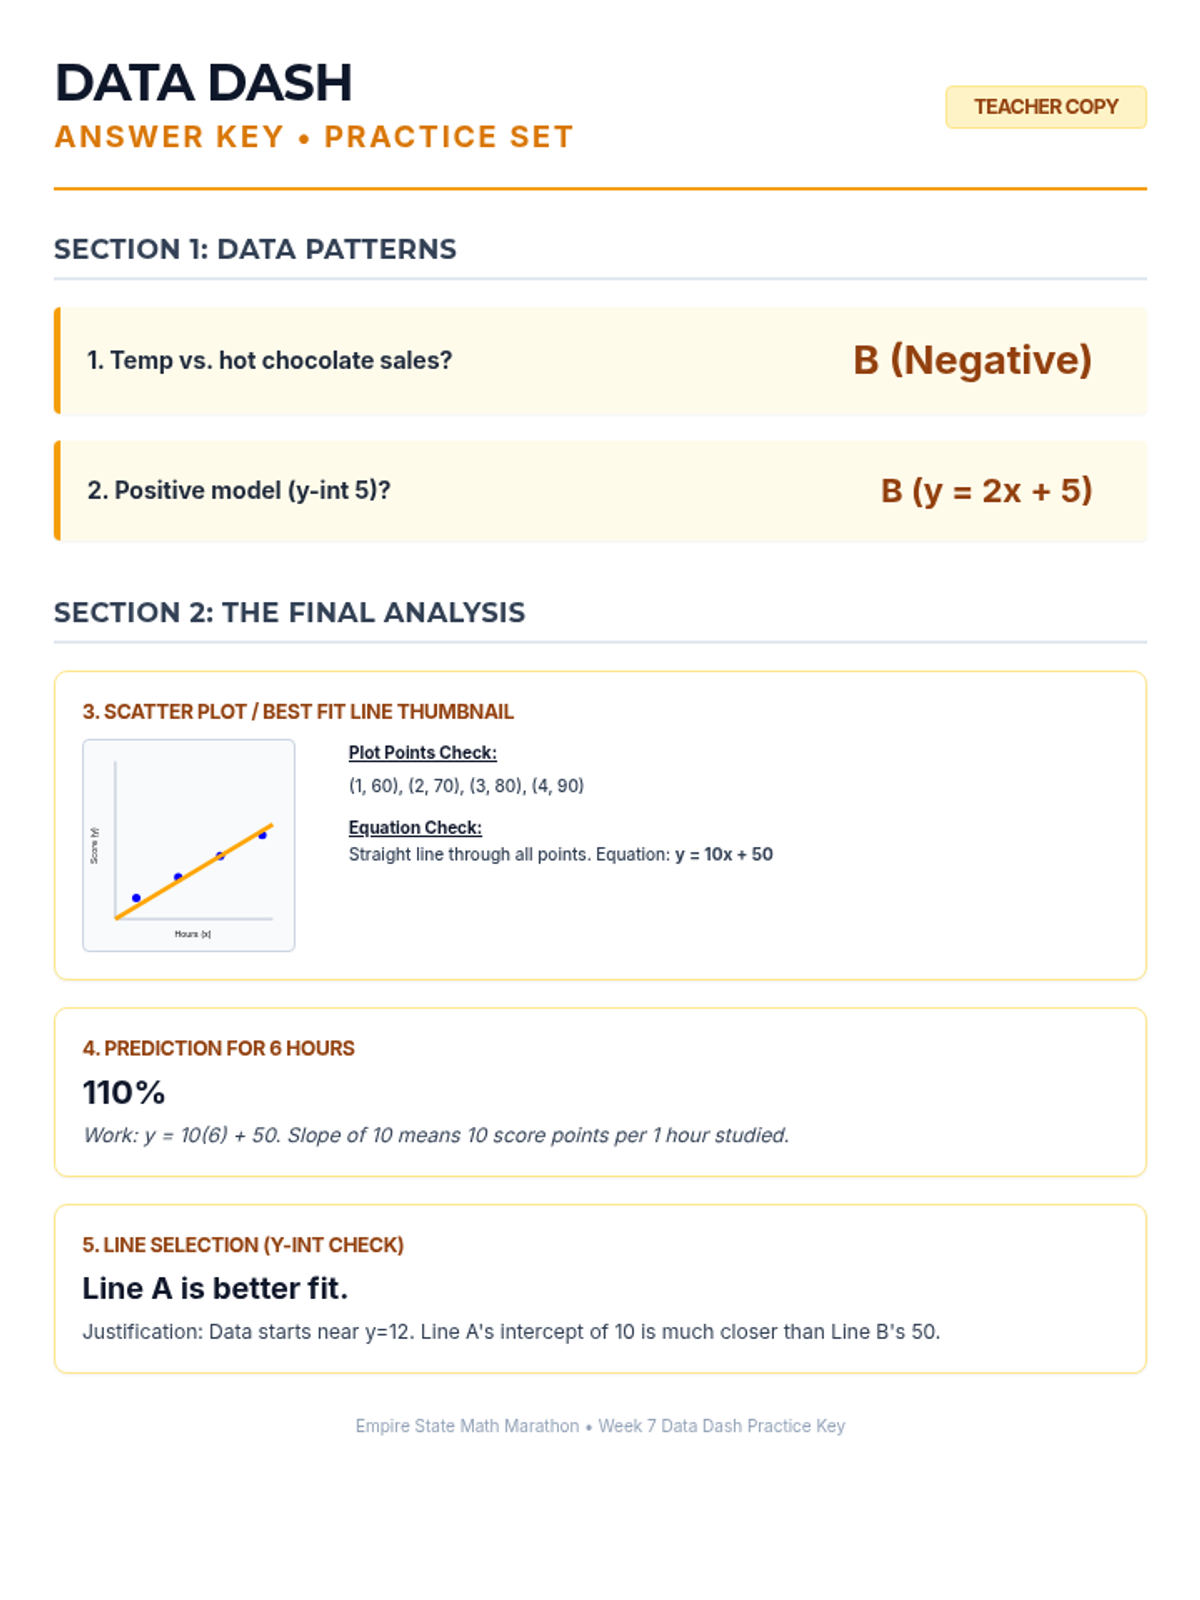
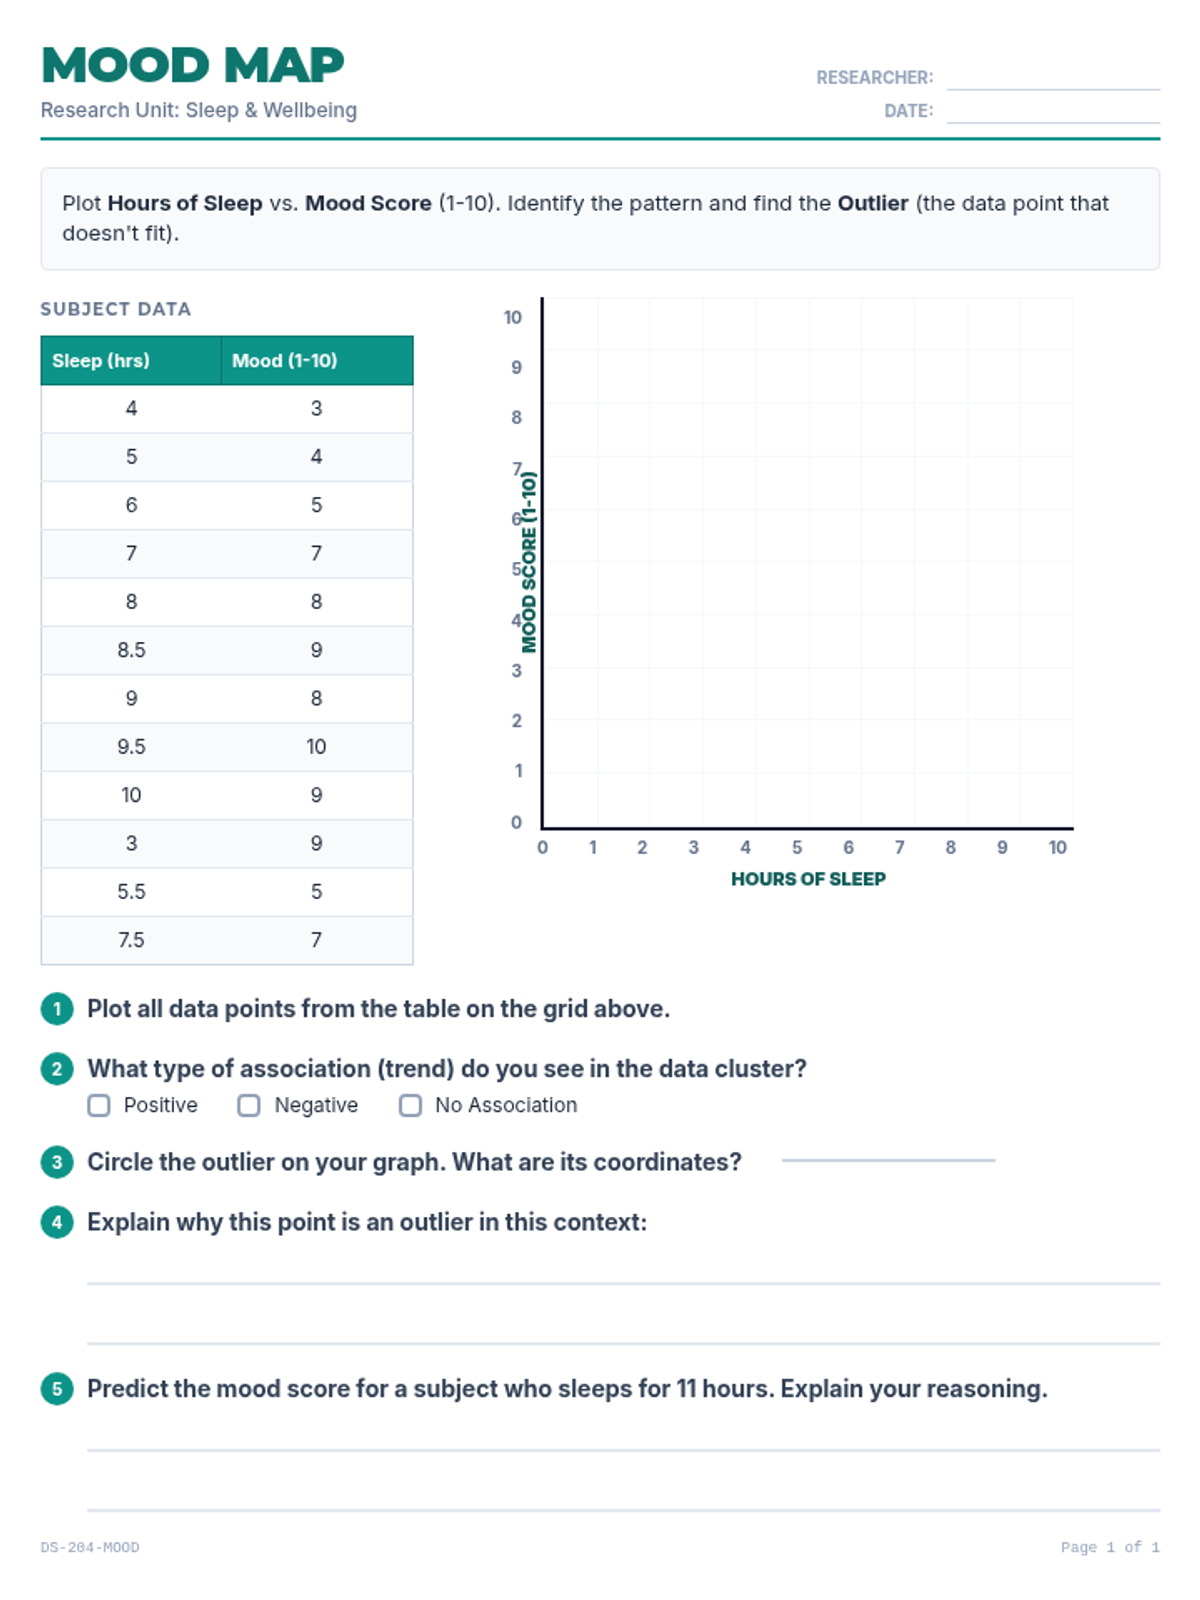
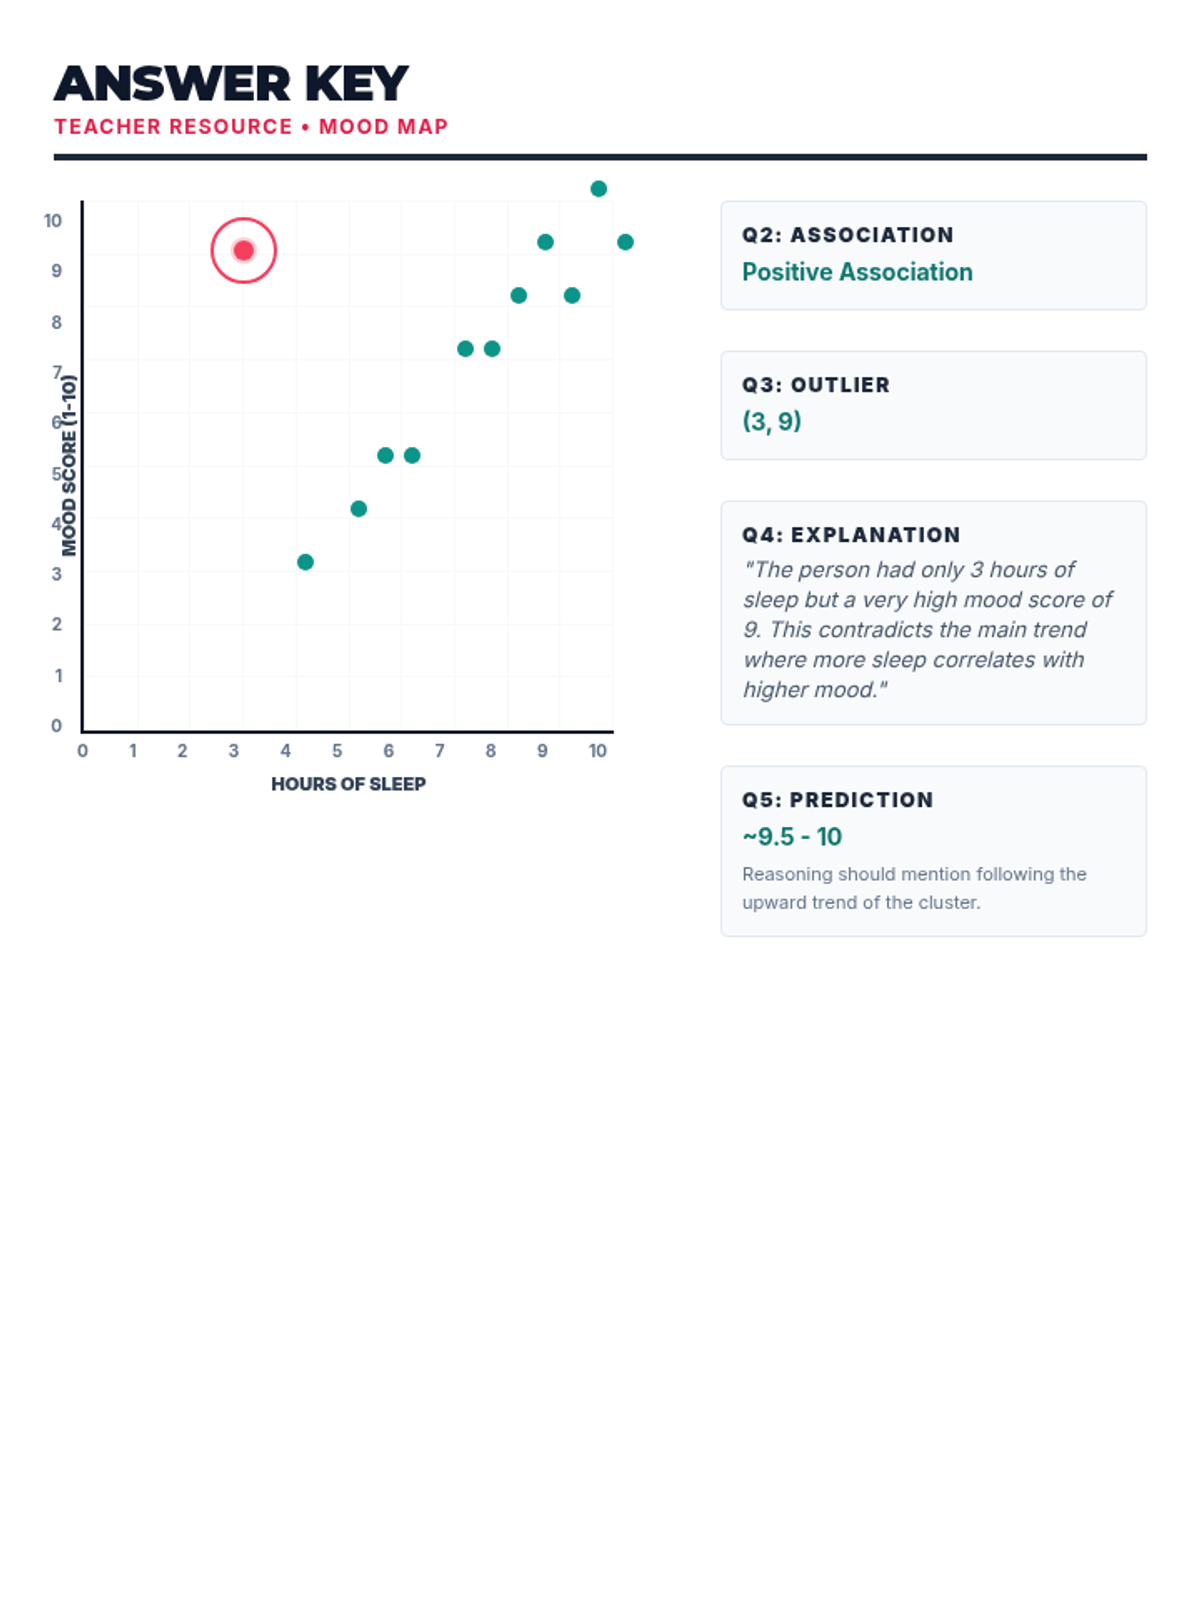
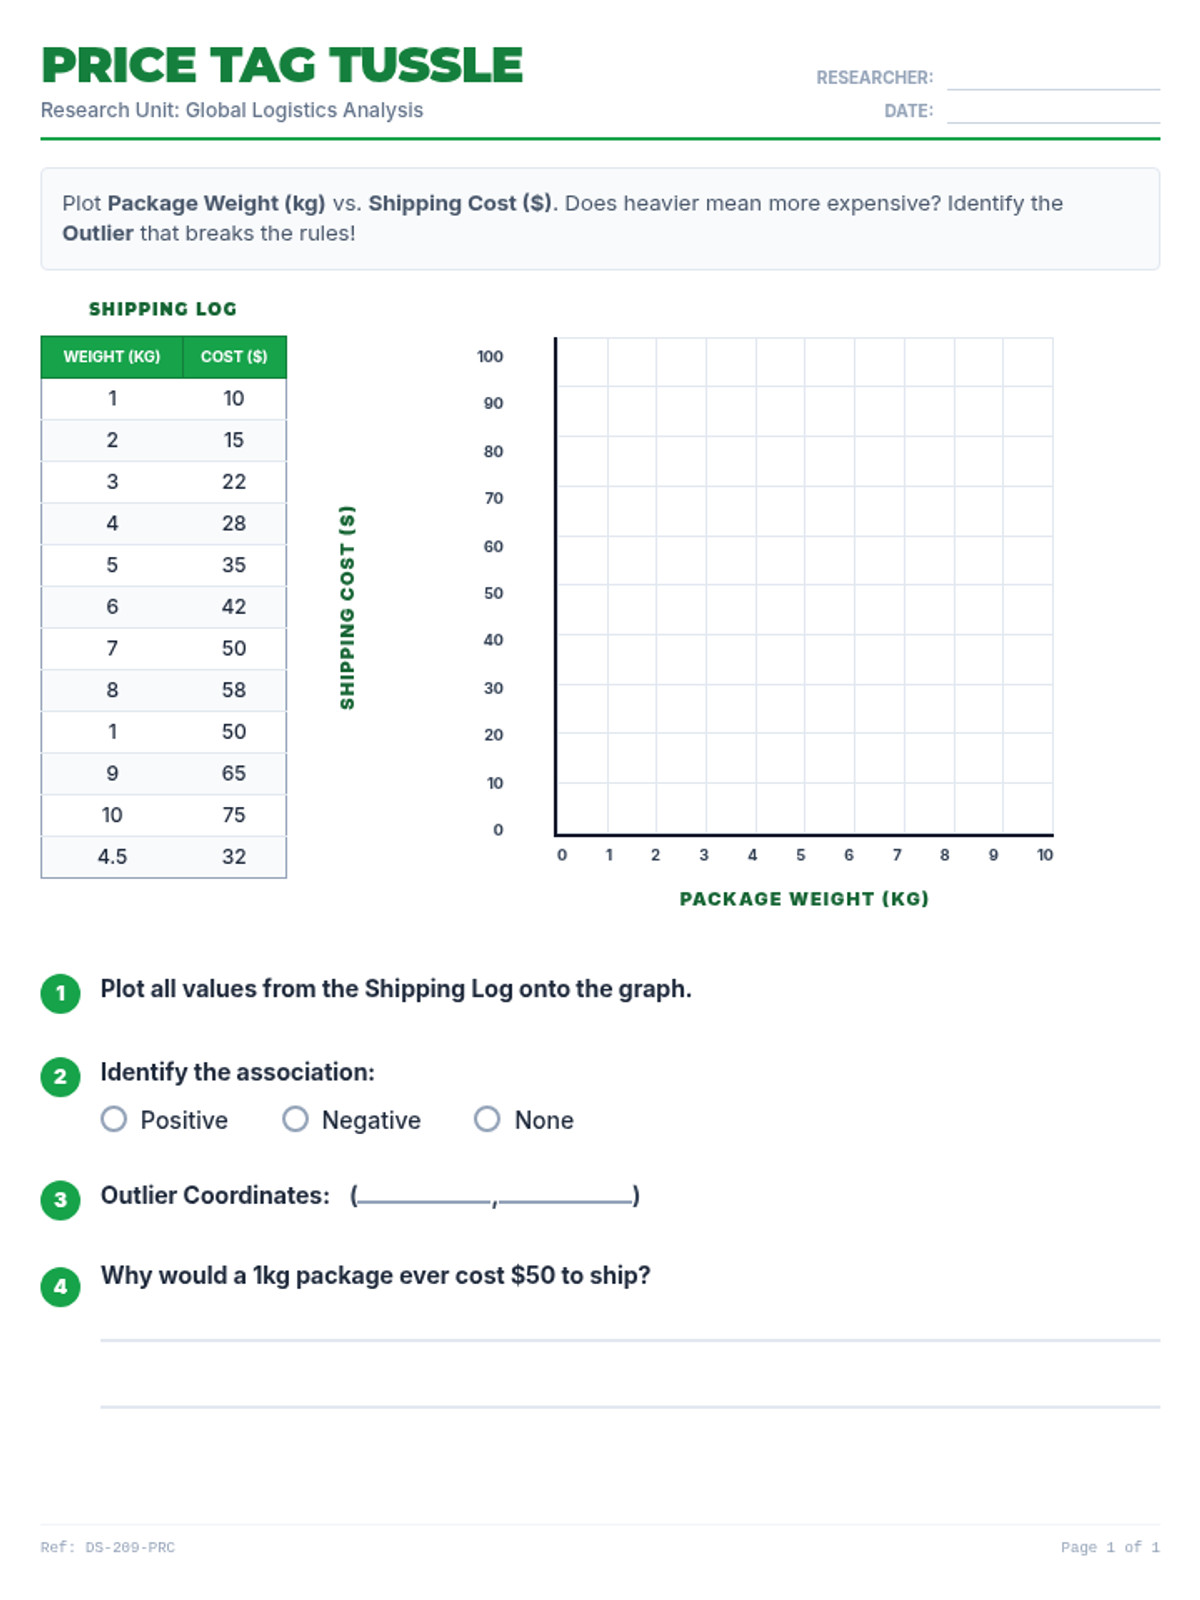
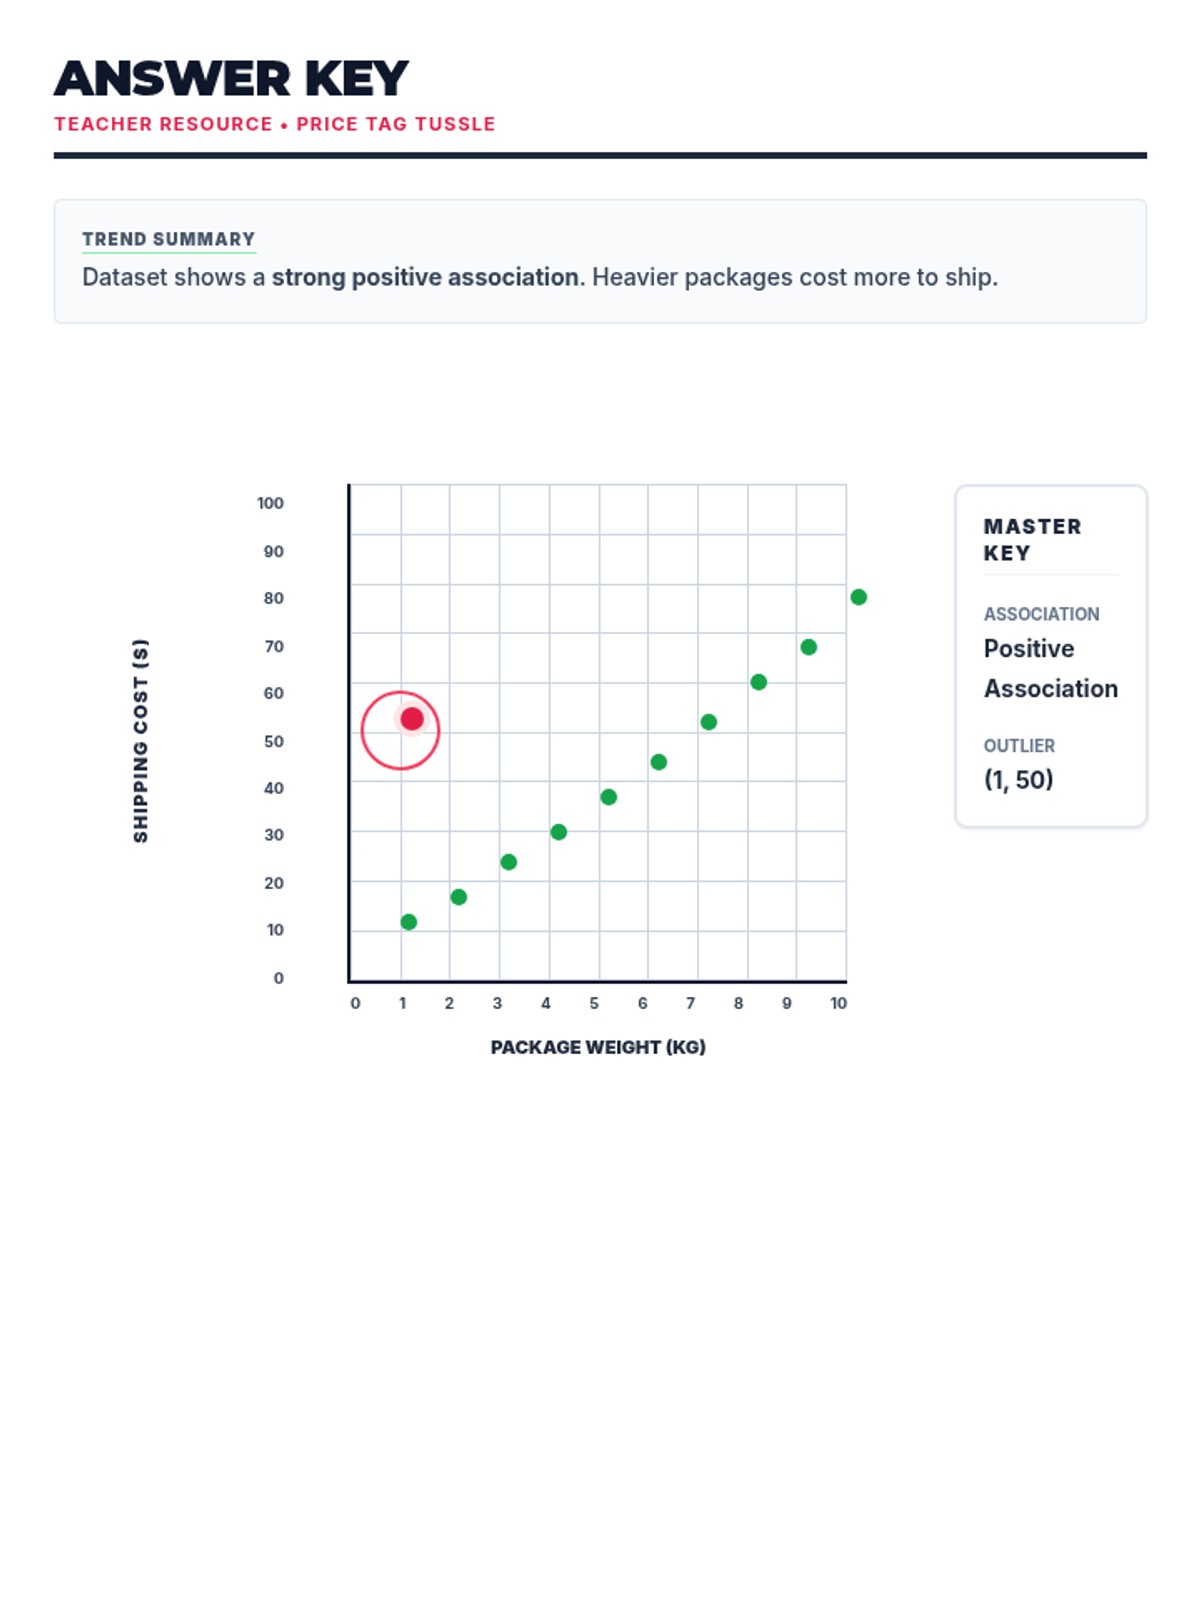
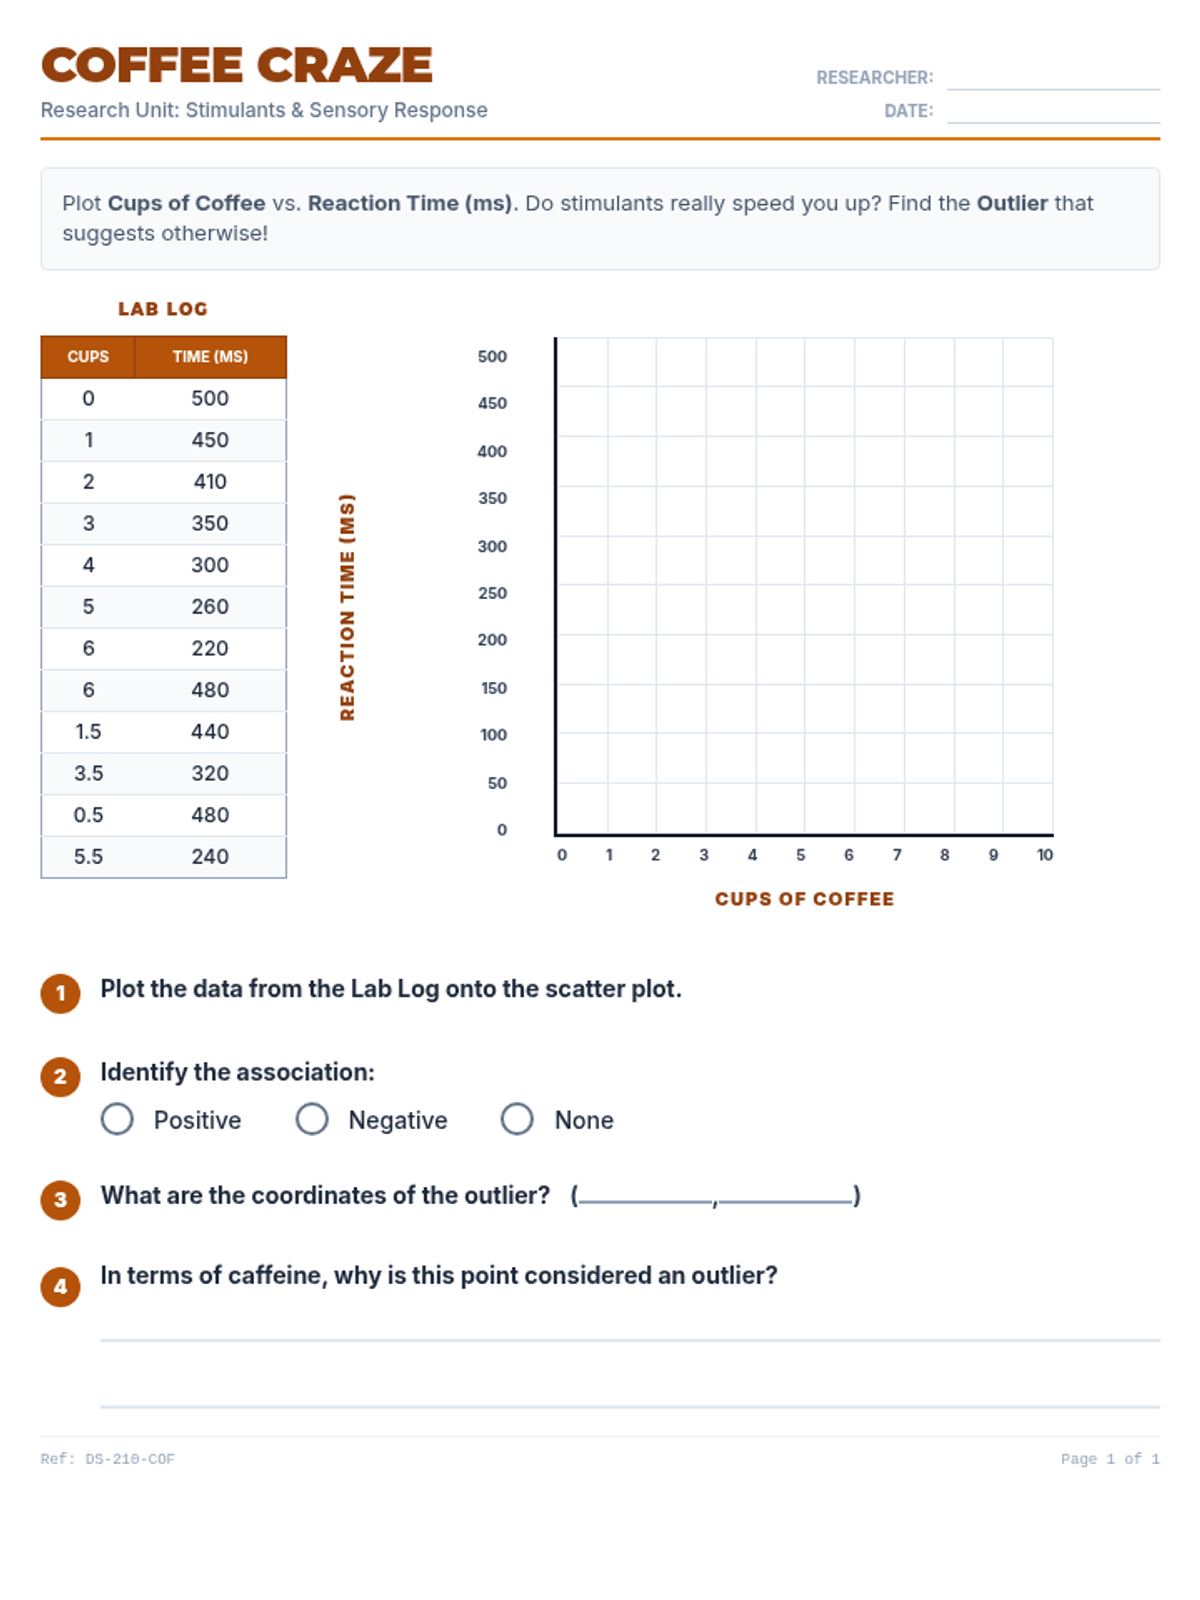
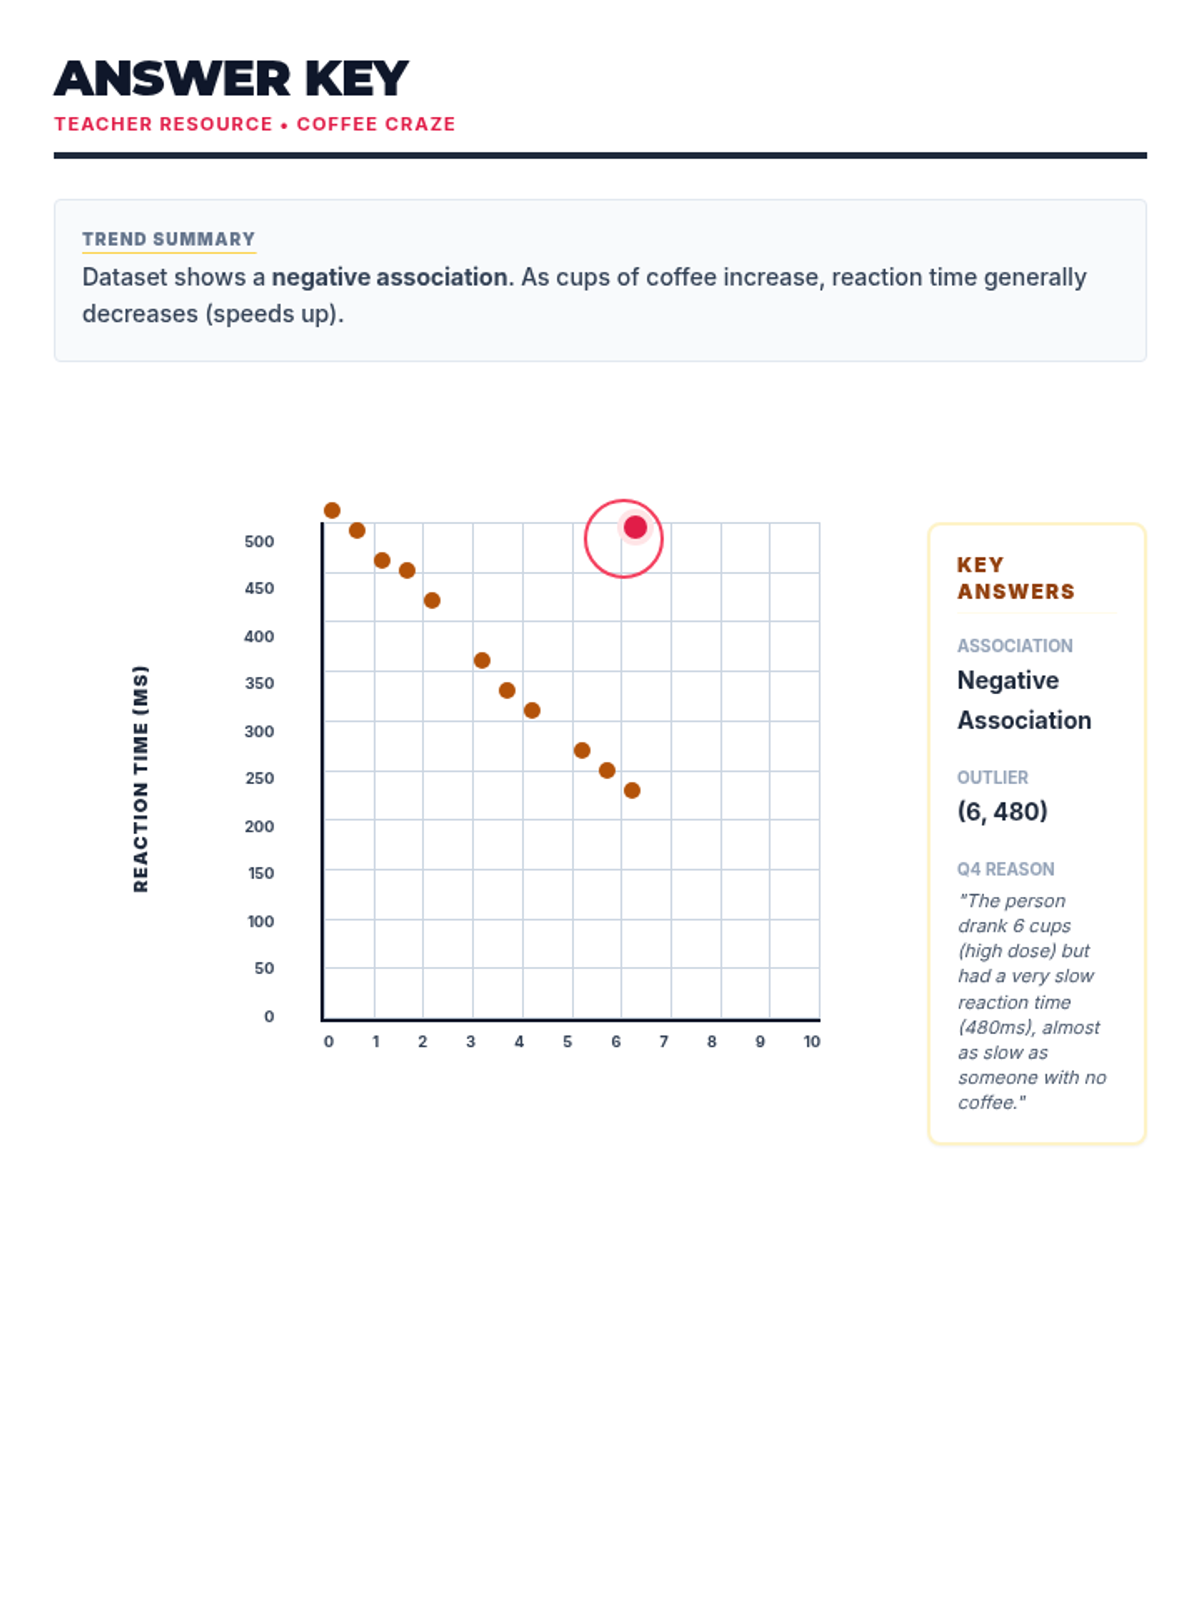
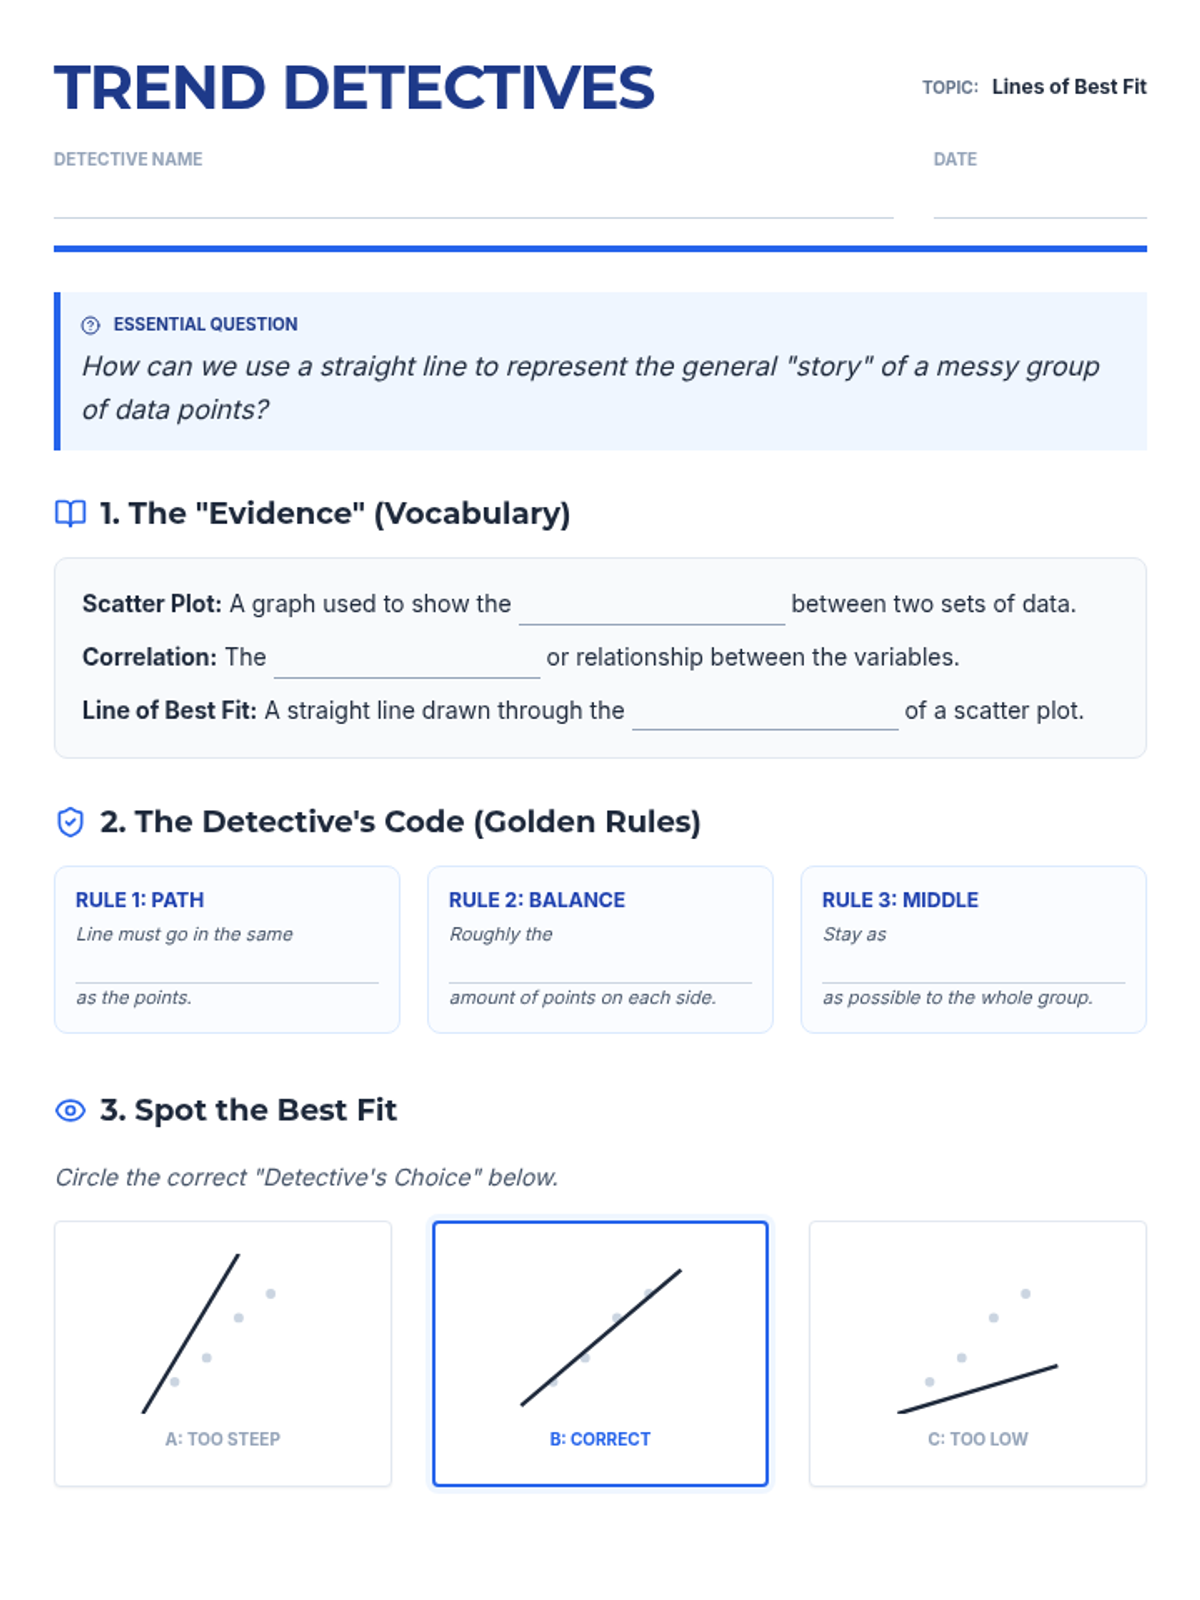
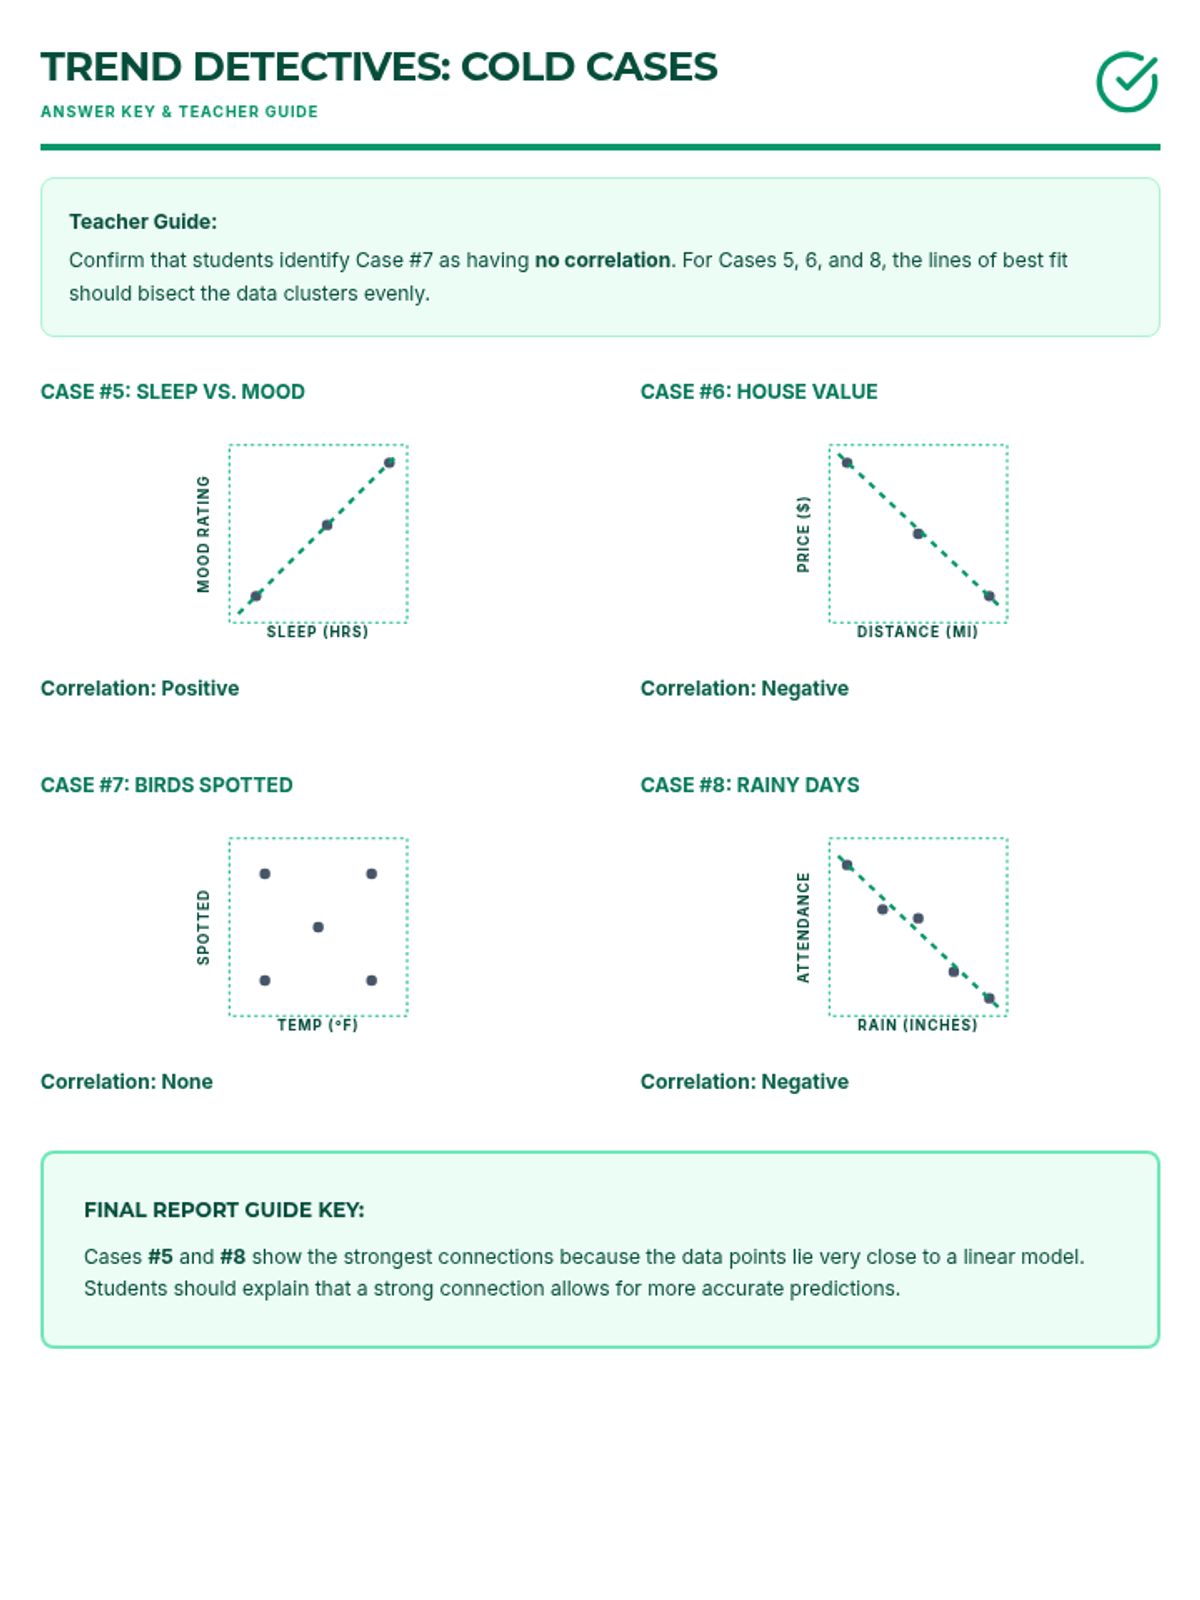
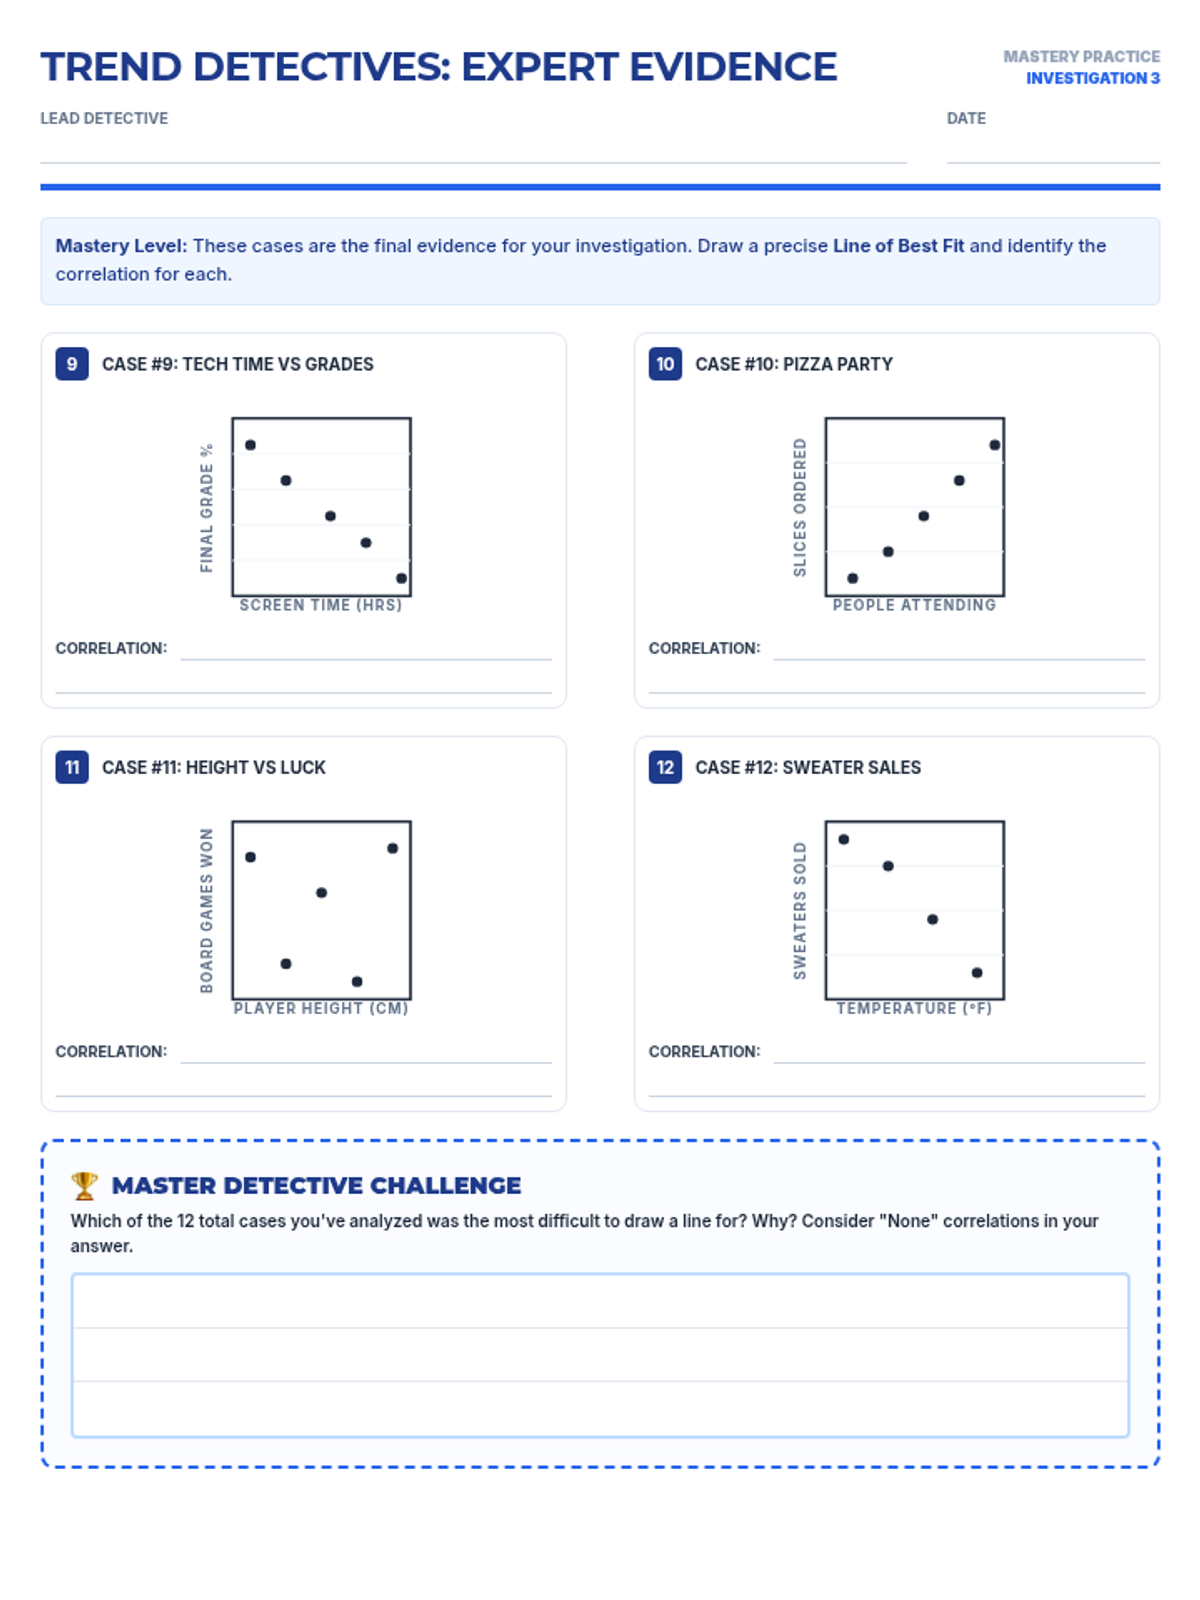
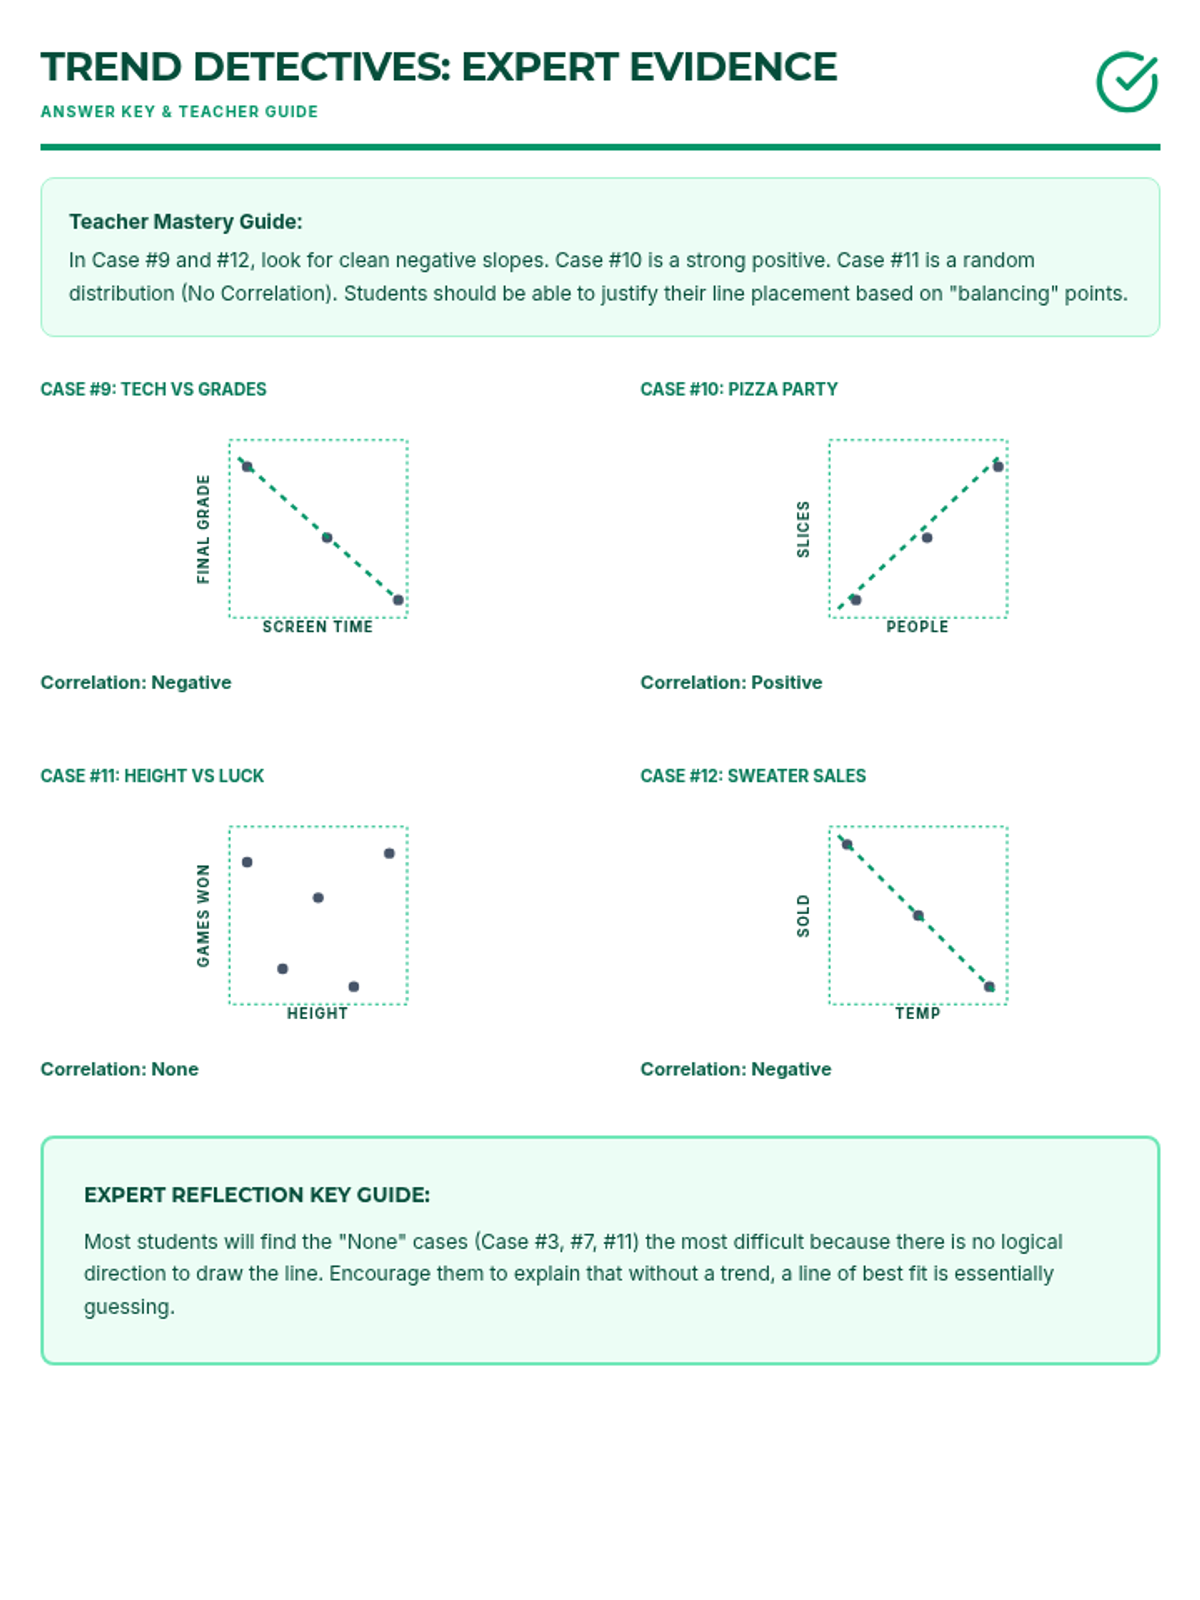
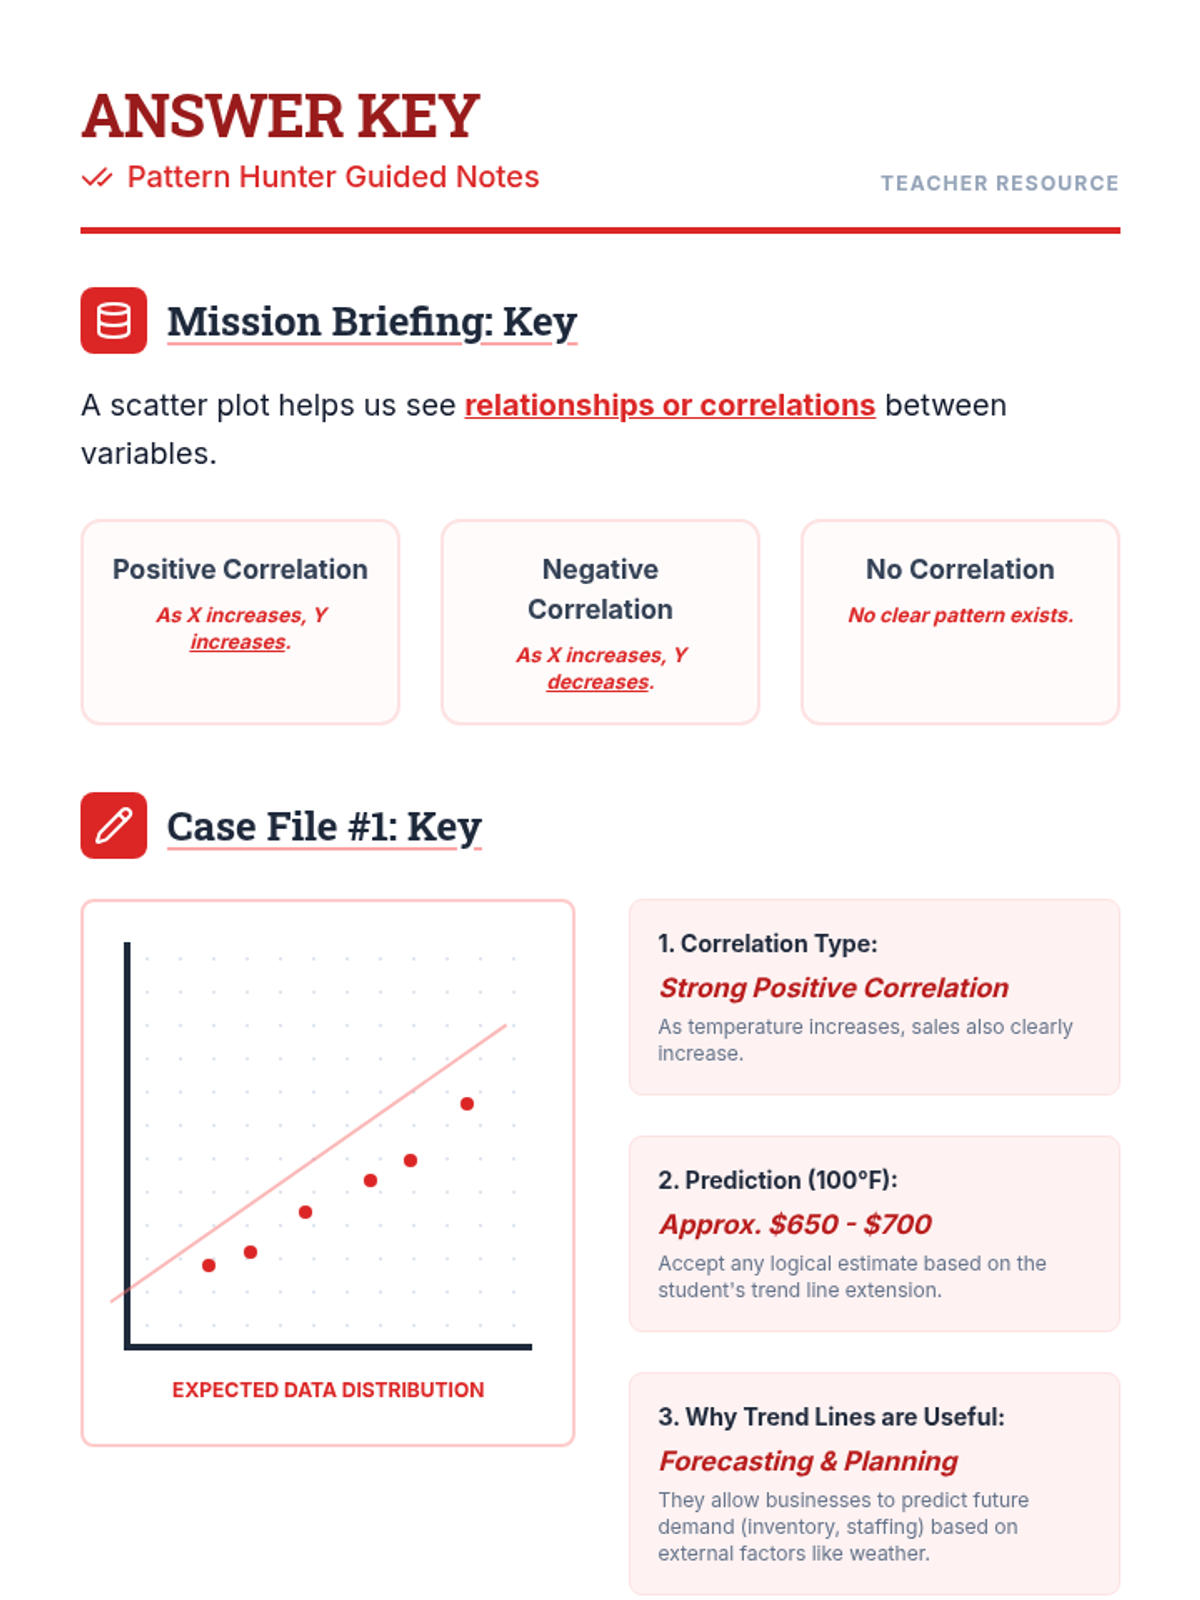
Week 7 analyzes bivariate data through scatter plots, interpreting lines of best fit, and using linear models to make predictions.
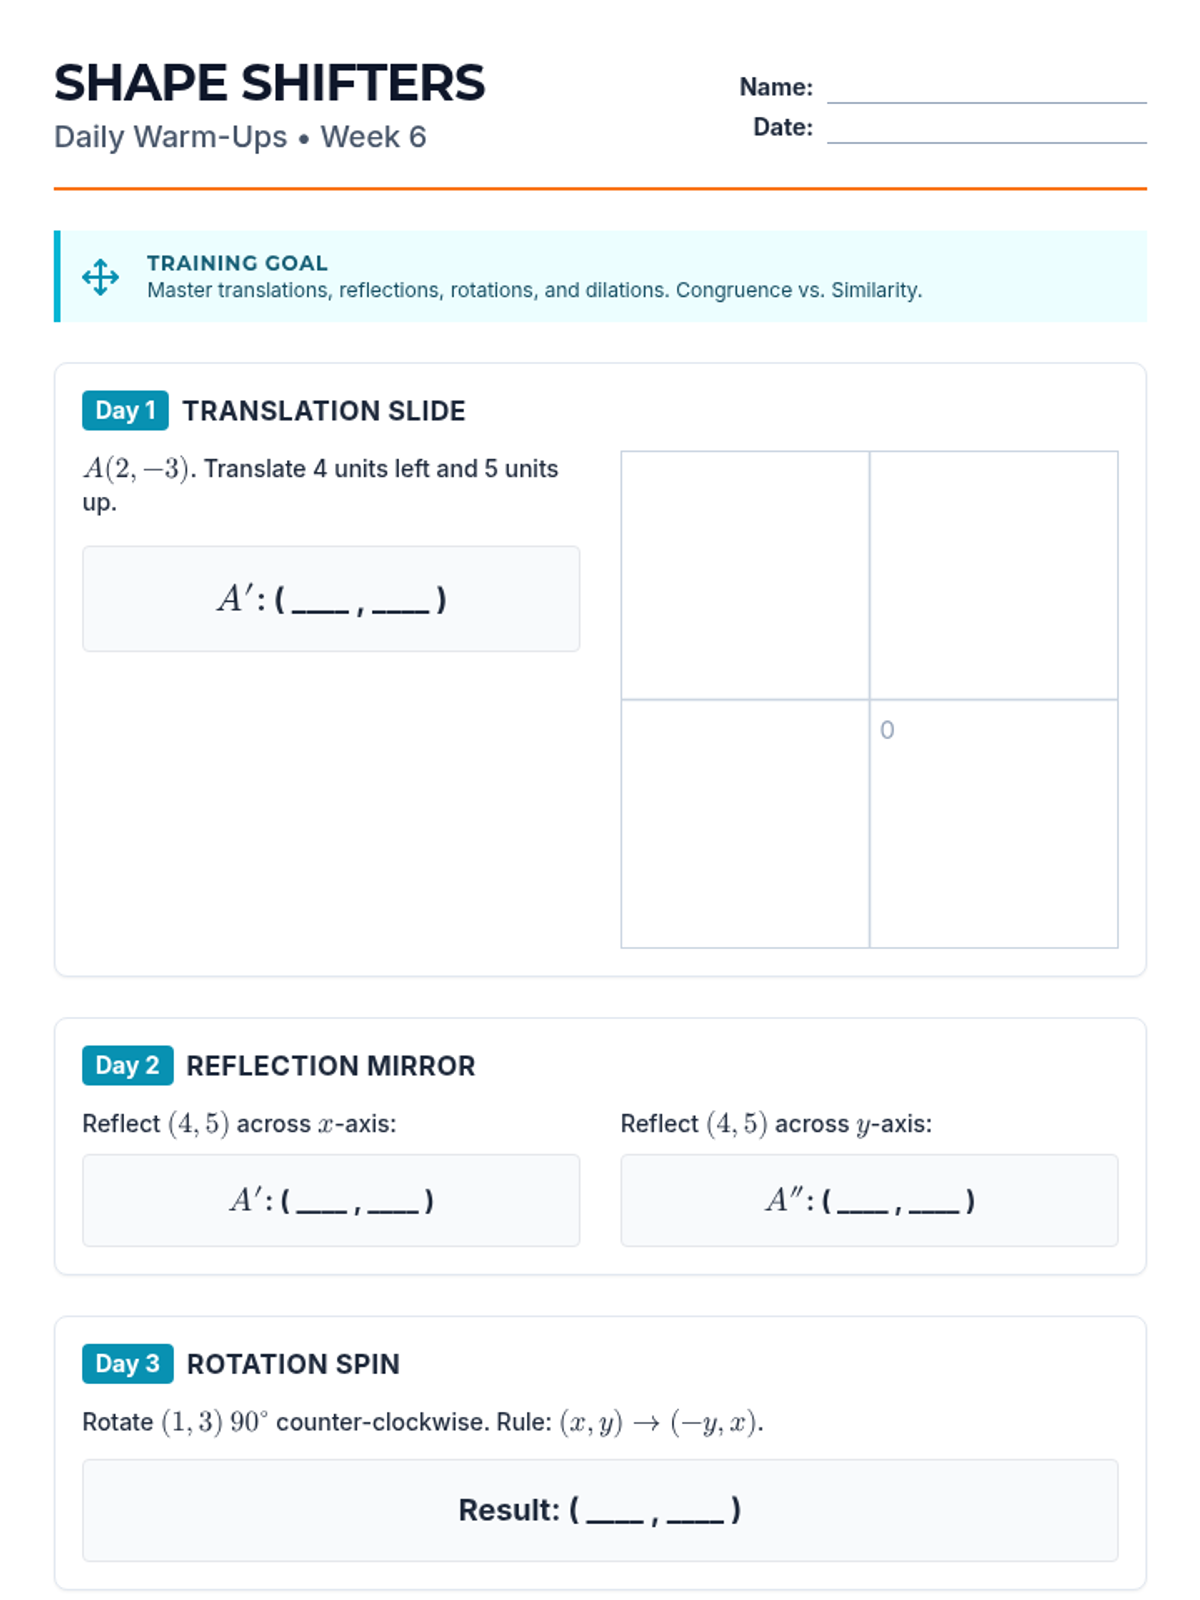
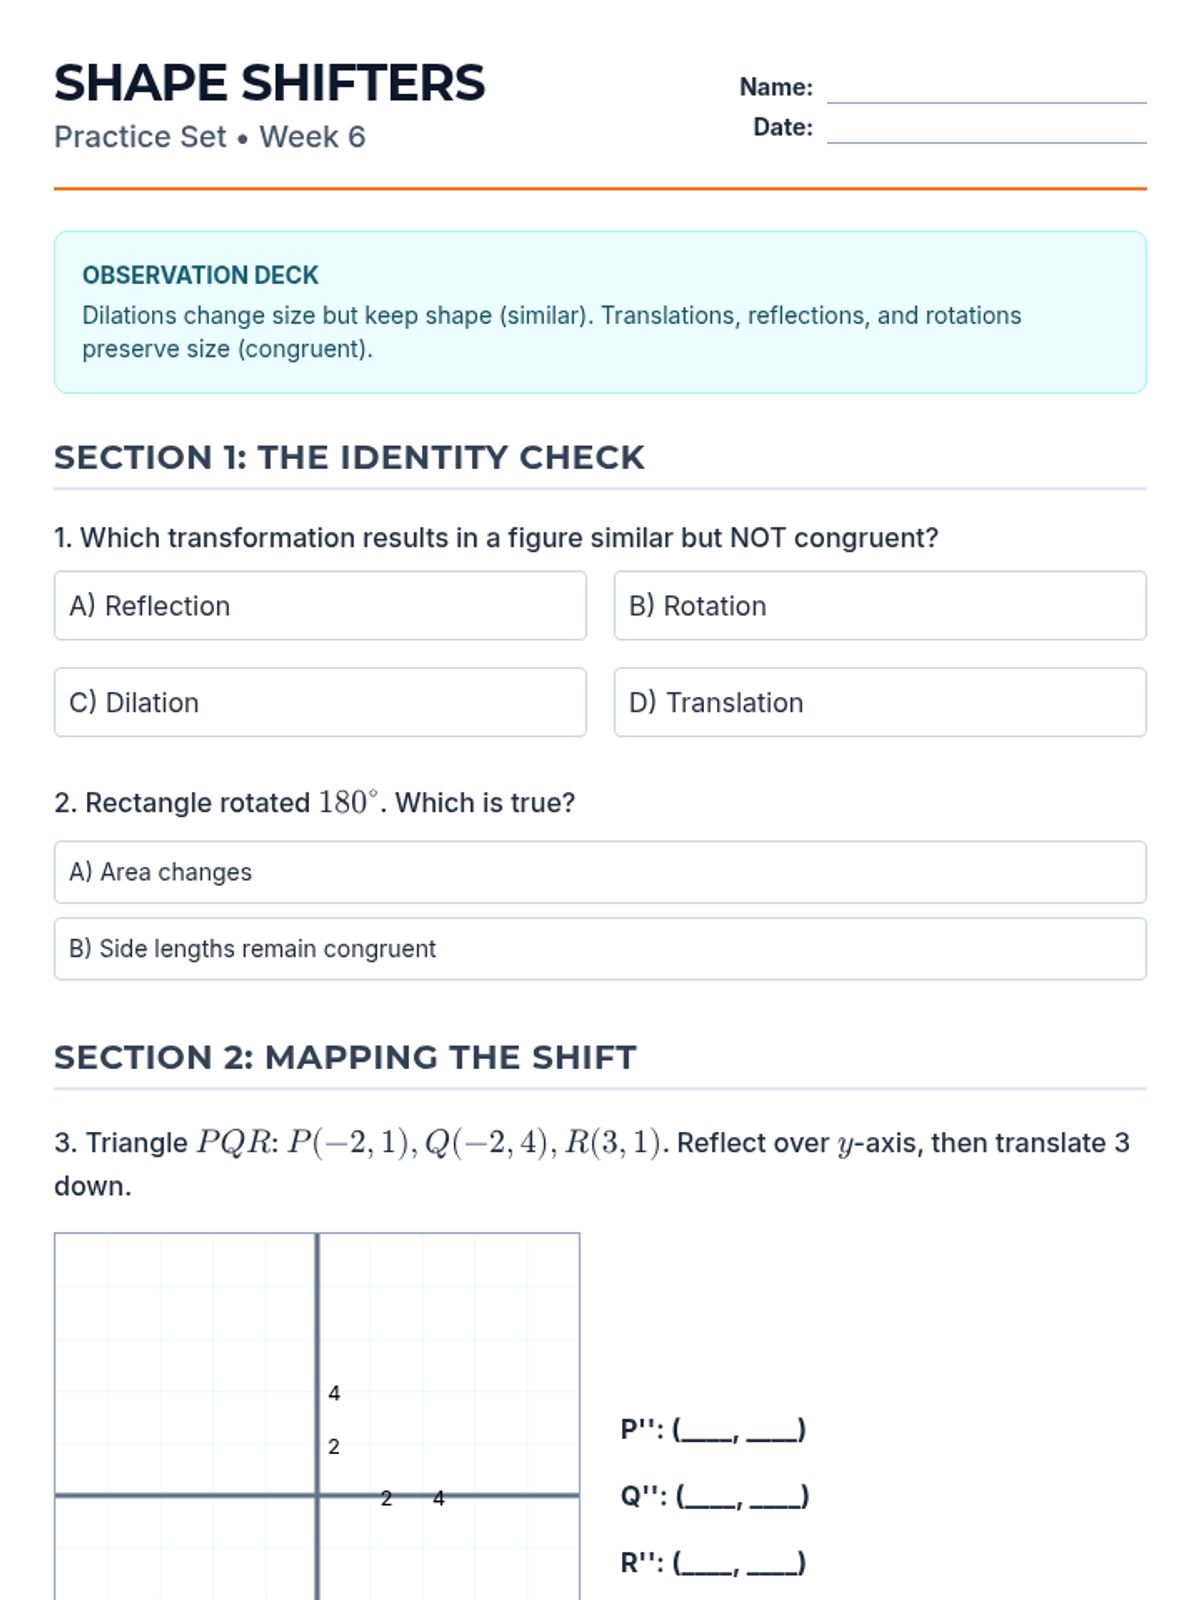
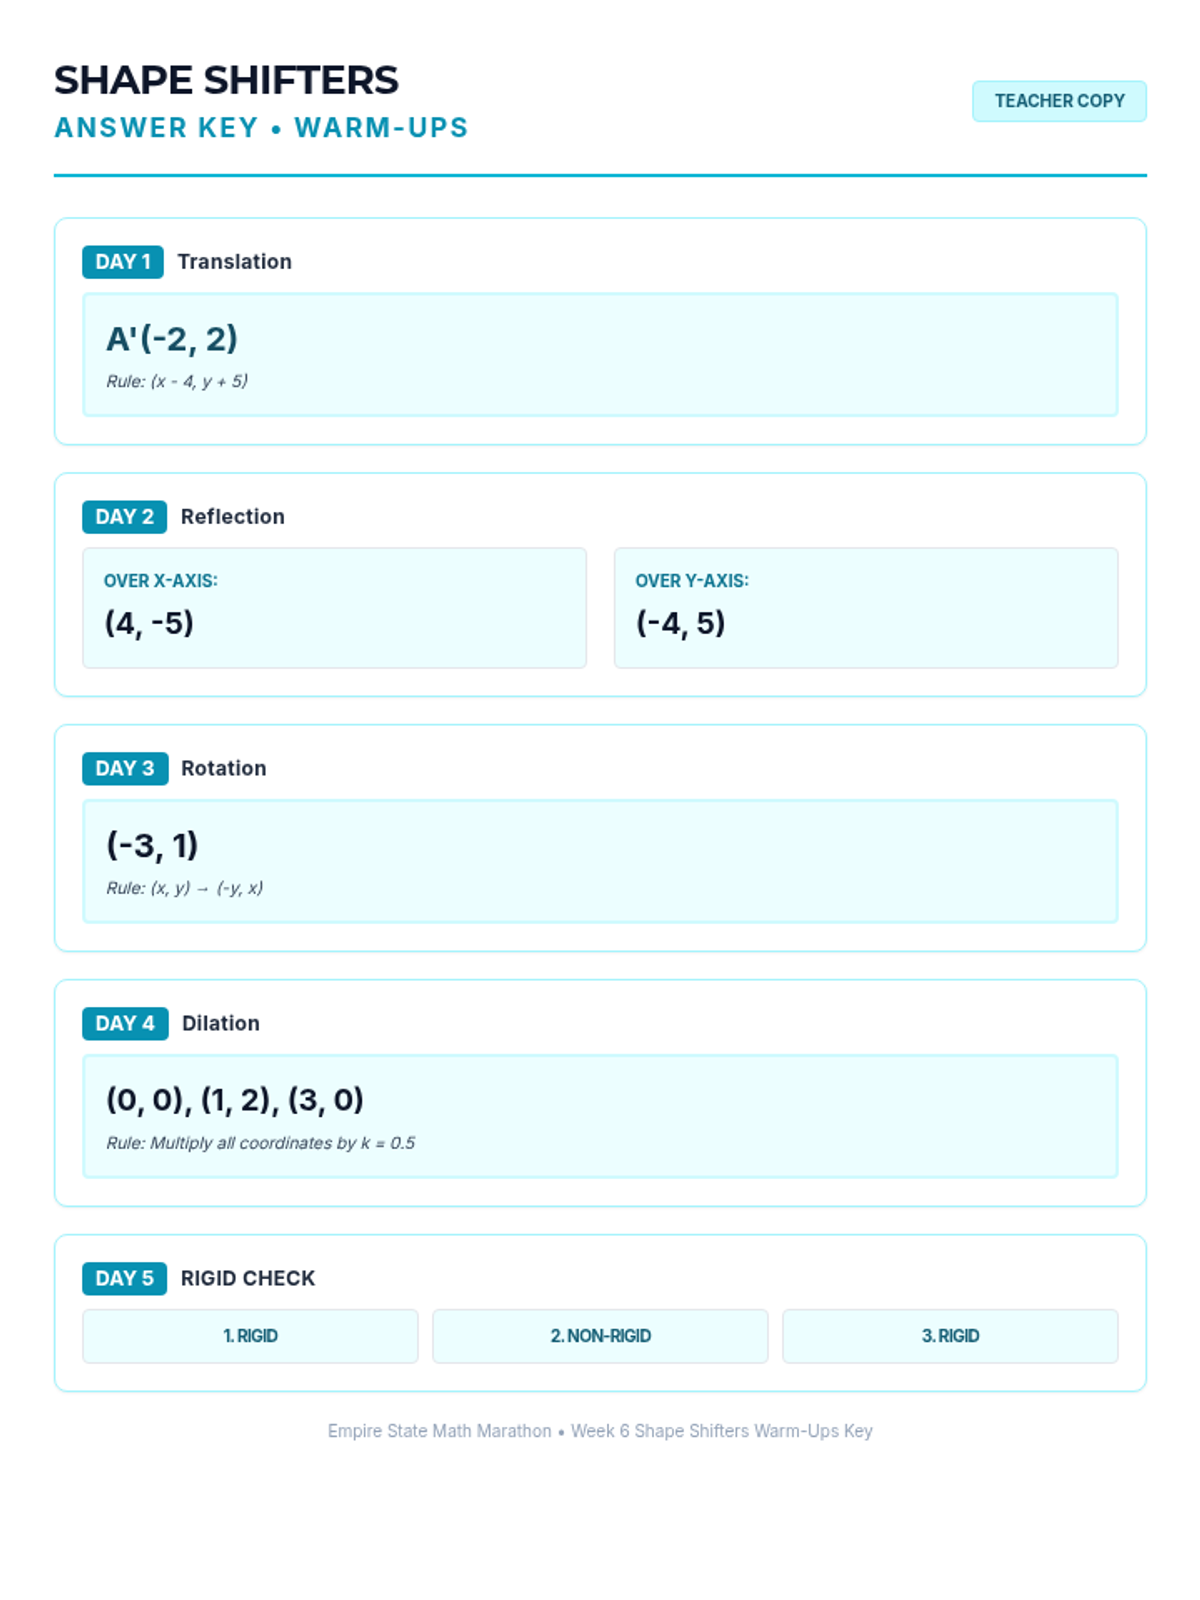
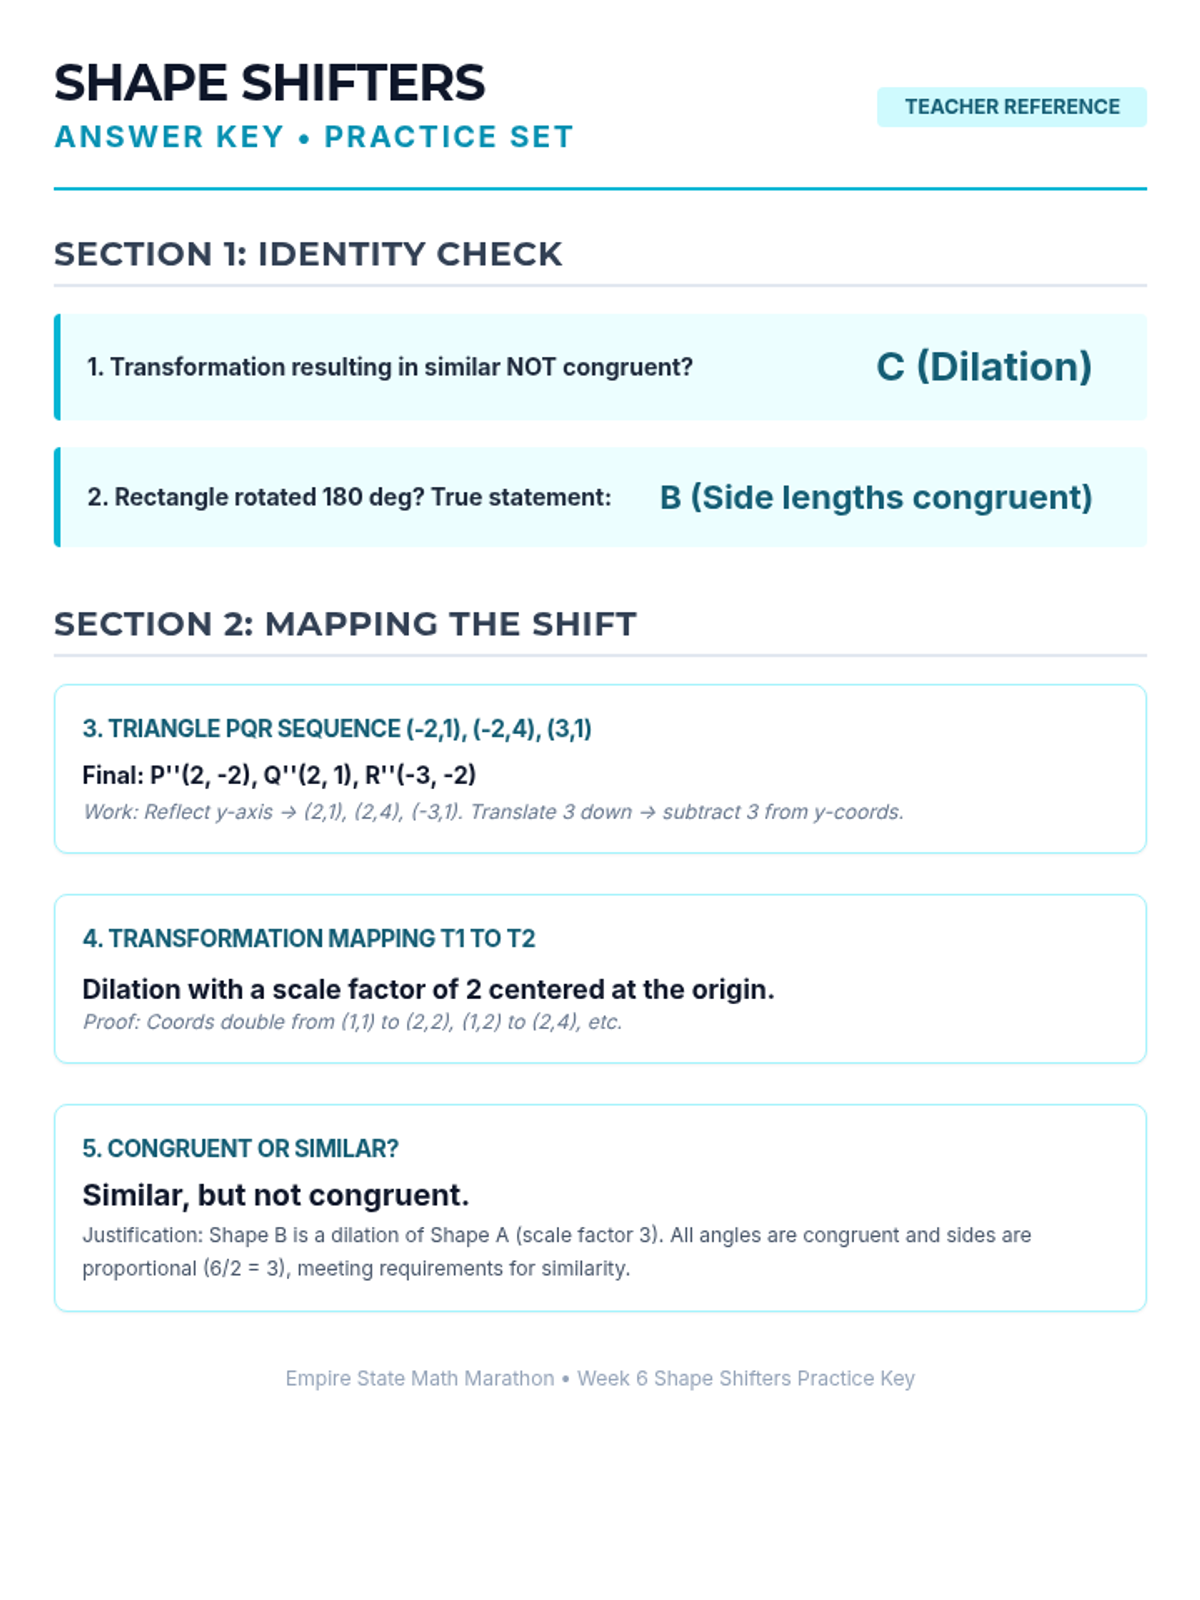
Week 6 focuses on rigid transformations (translations, reflections, rotations) and similarity transformations (dilations).
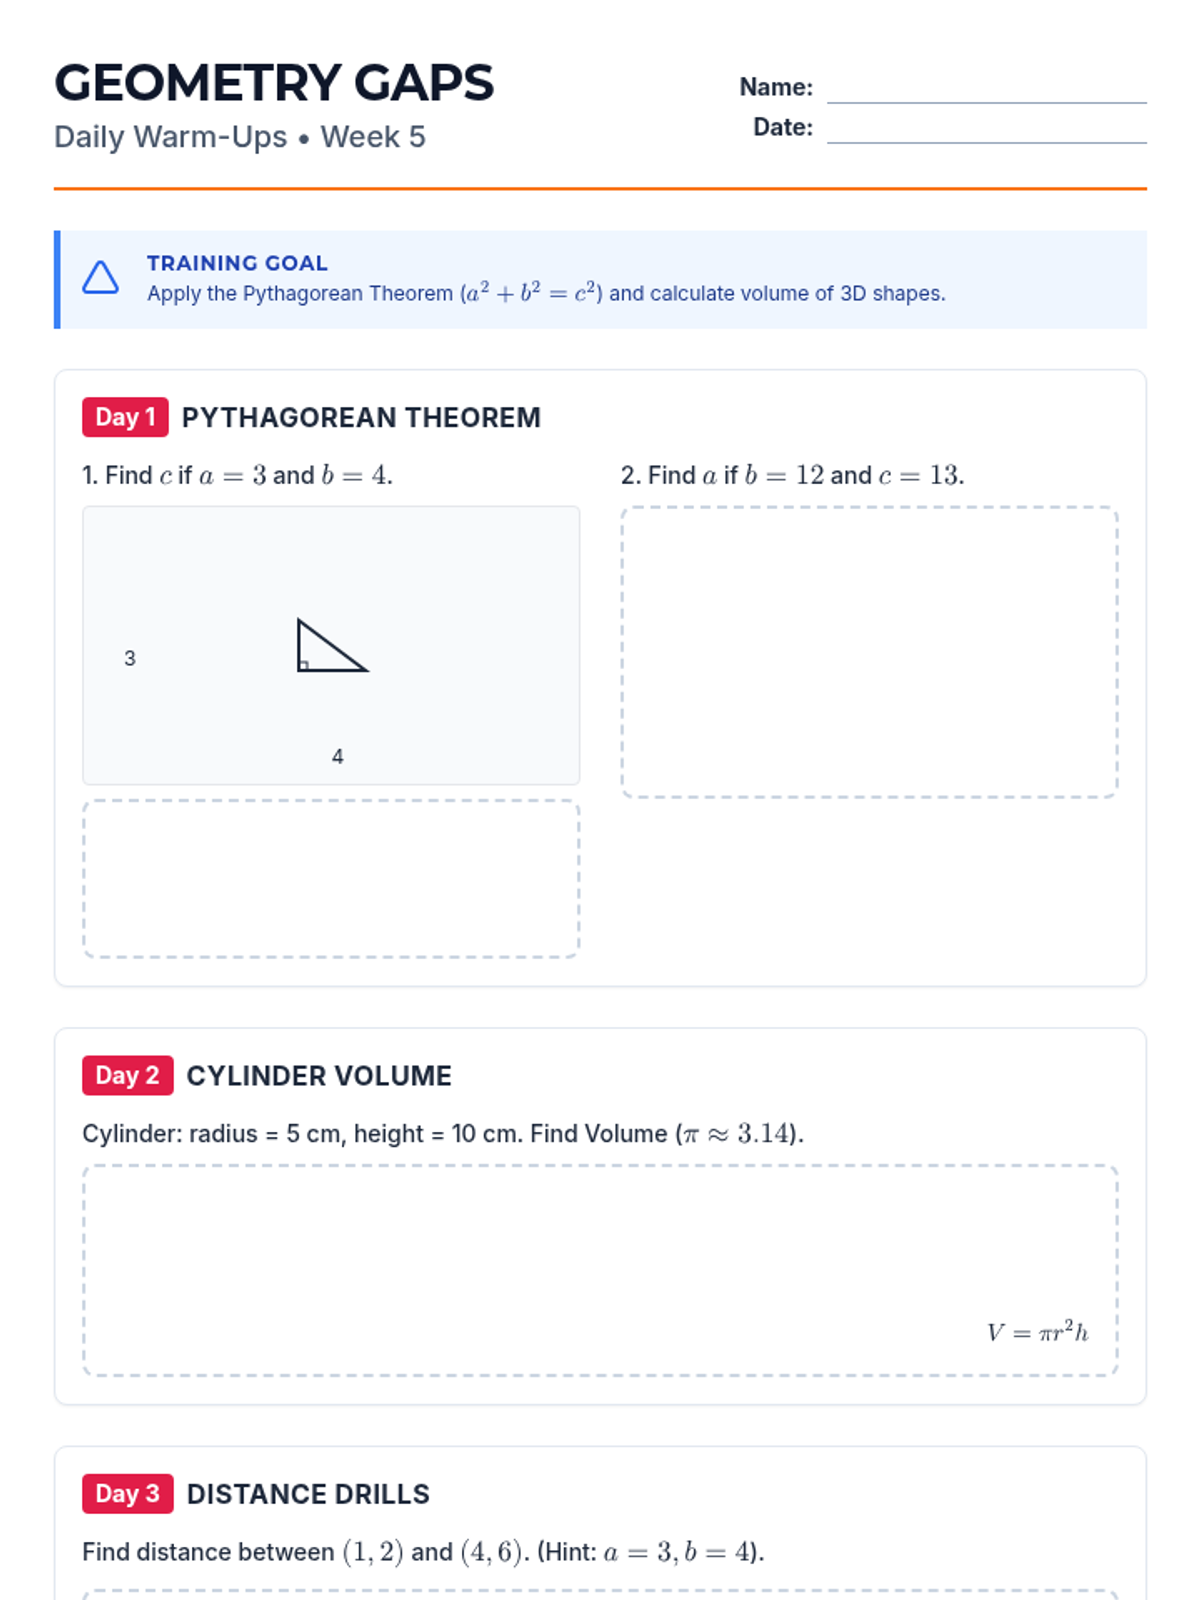
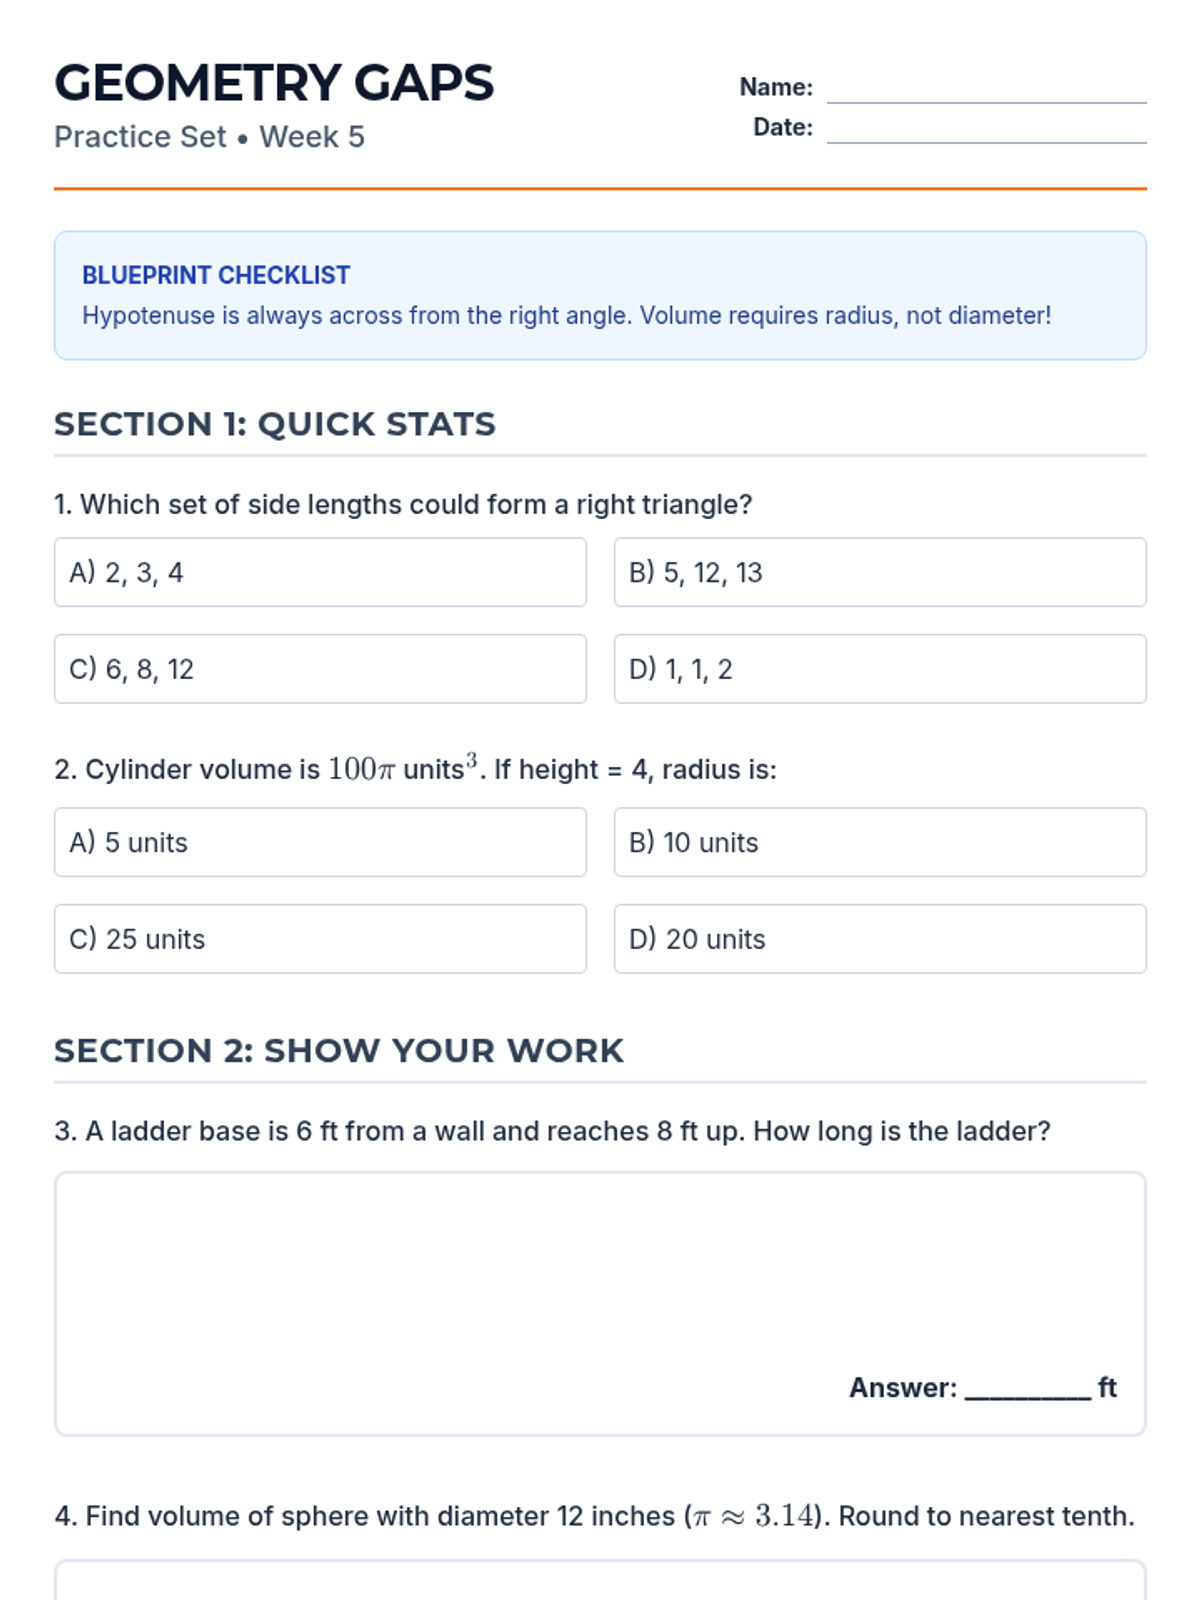
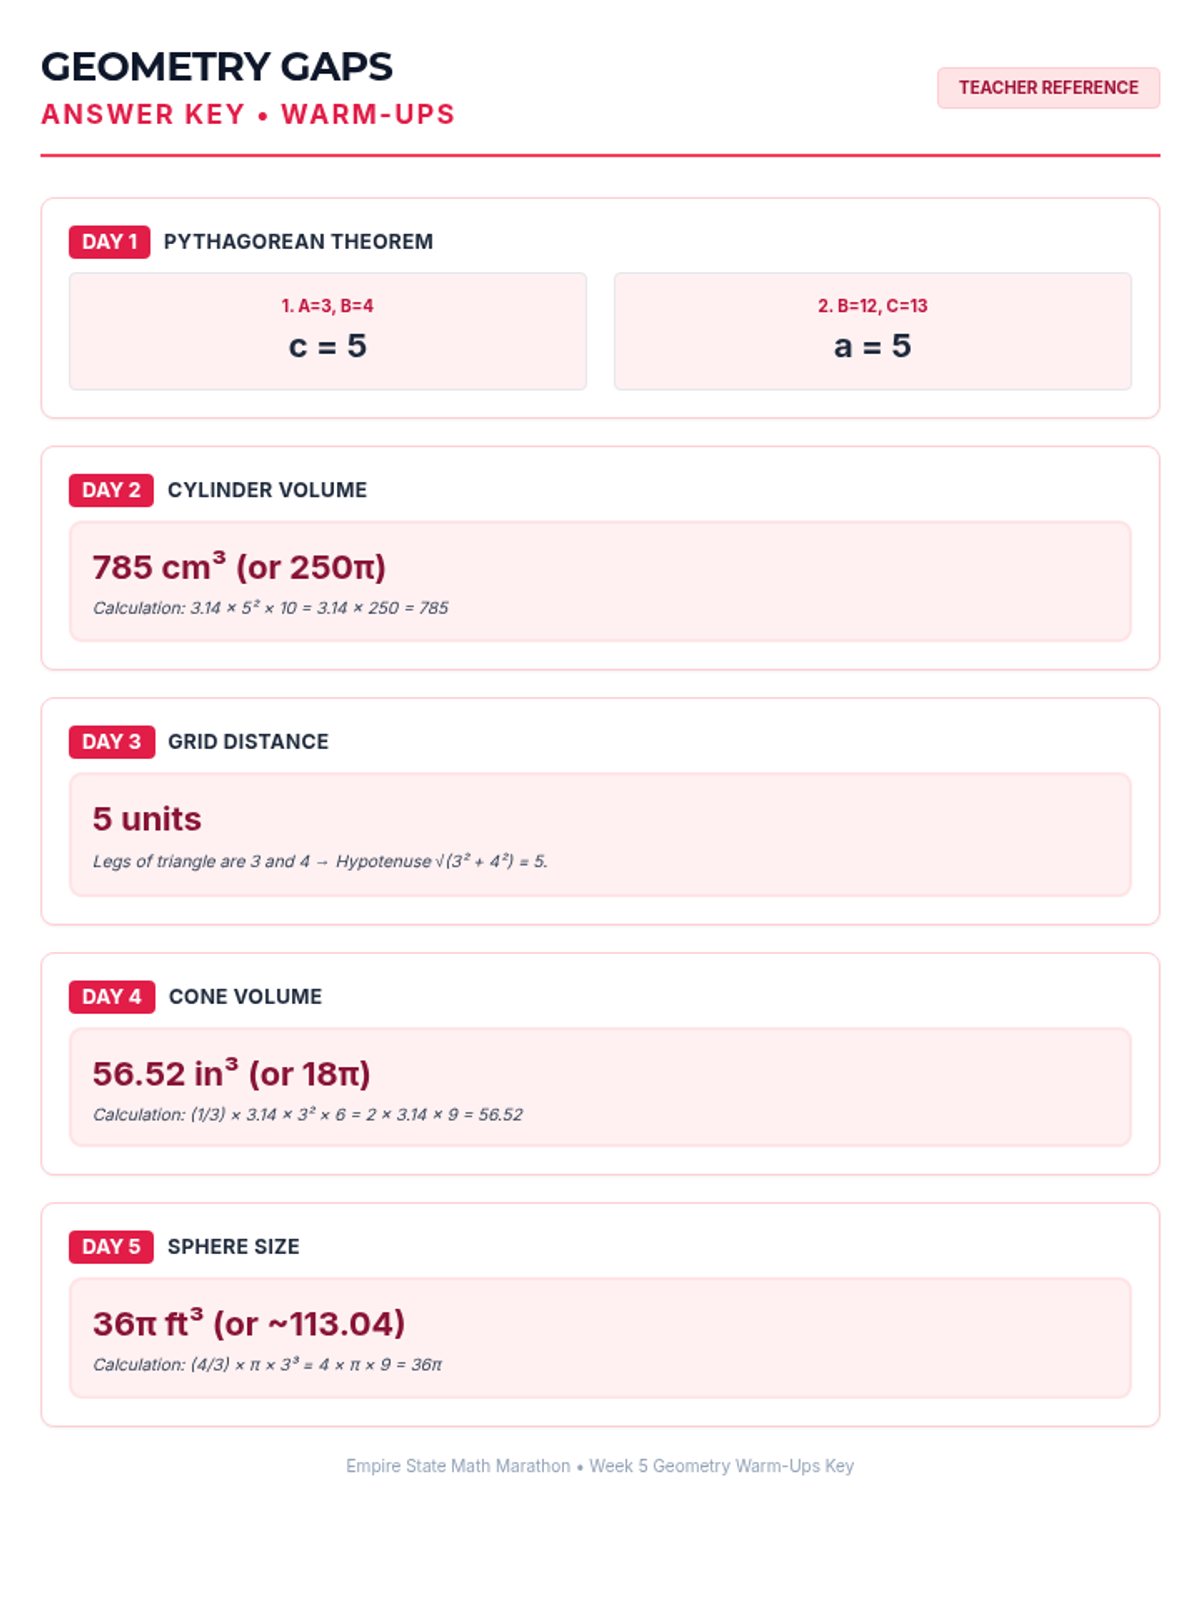
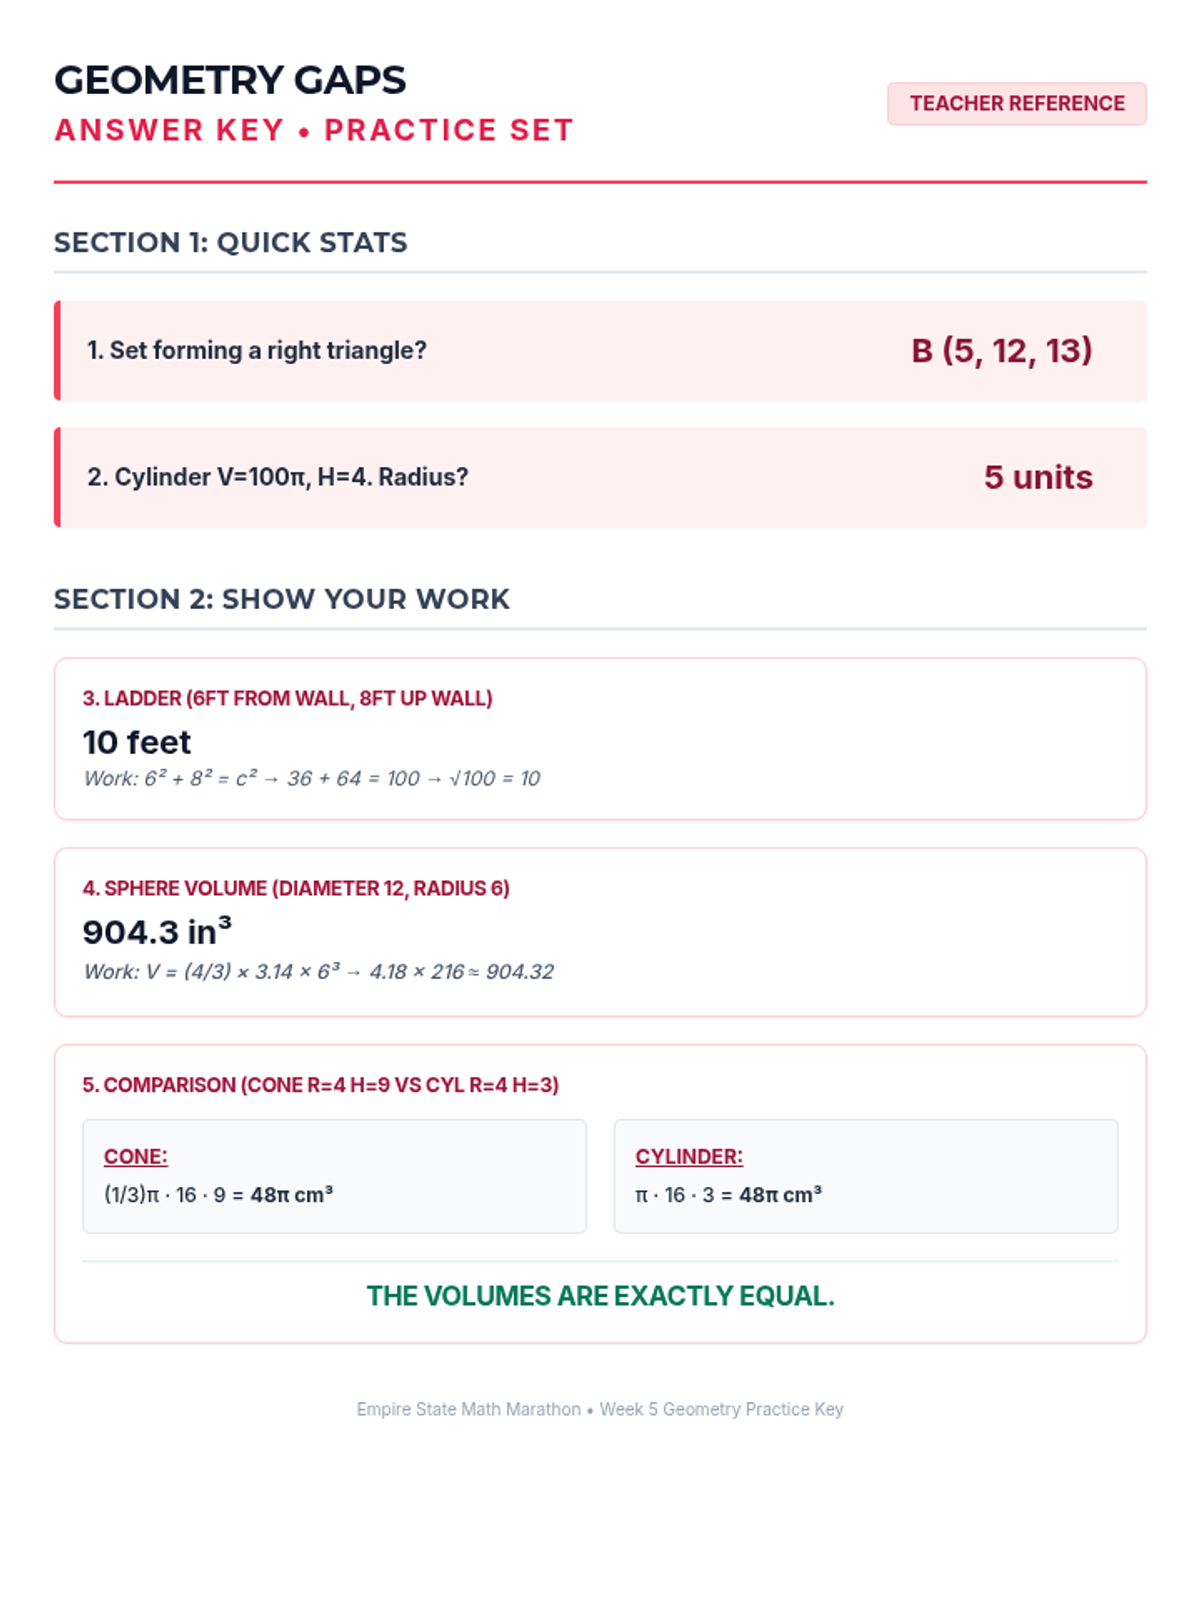
Week 5 reviews the Pythagorean Theorem and volume formulas for cylinders, cones, and spheres.
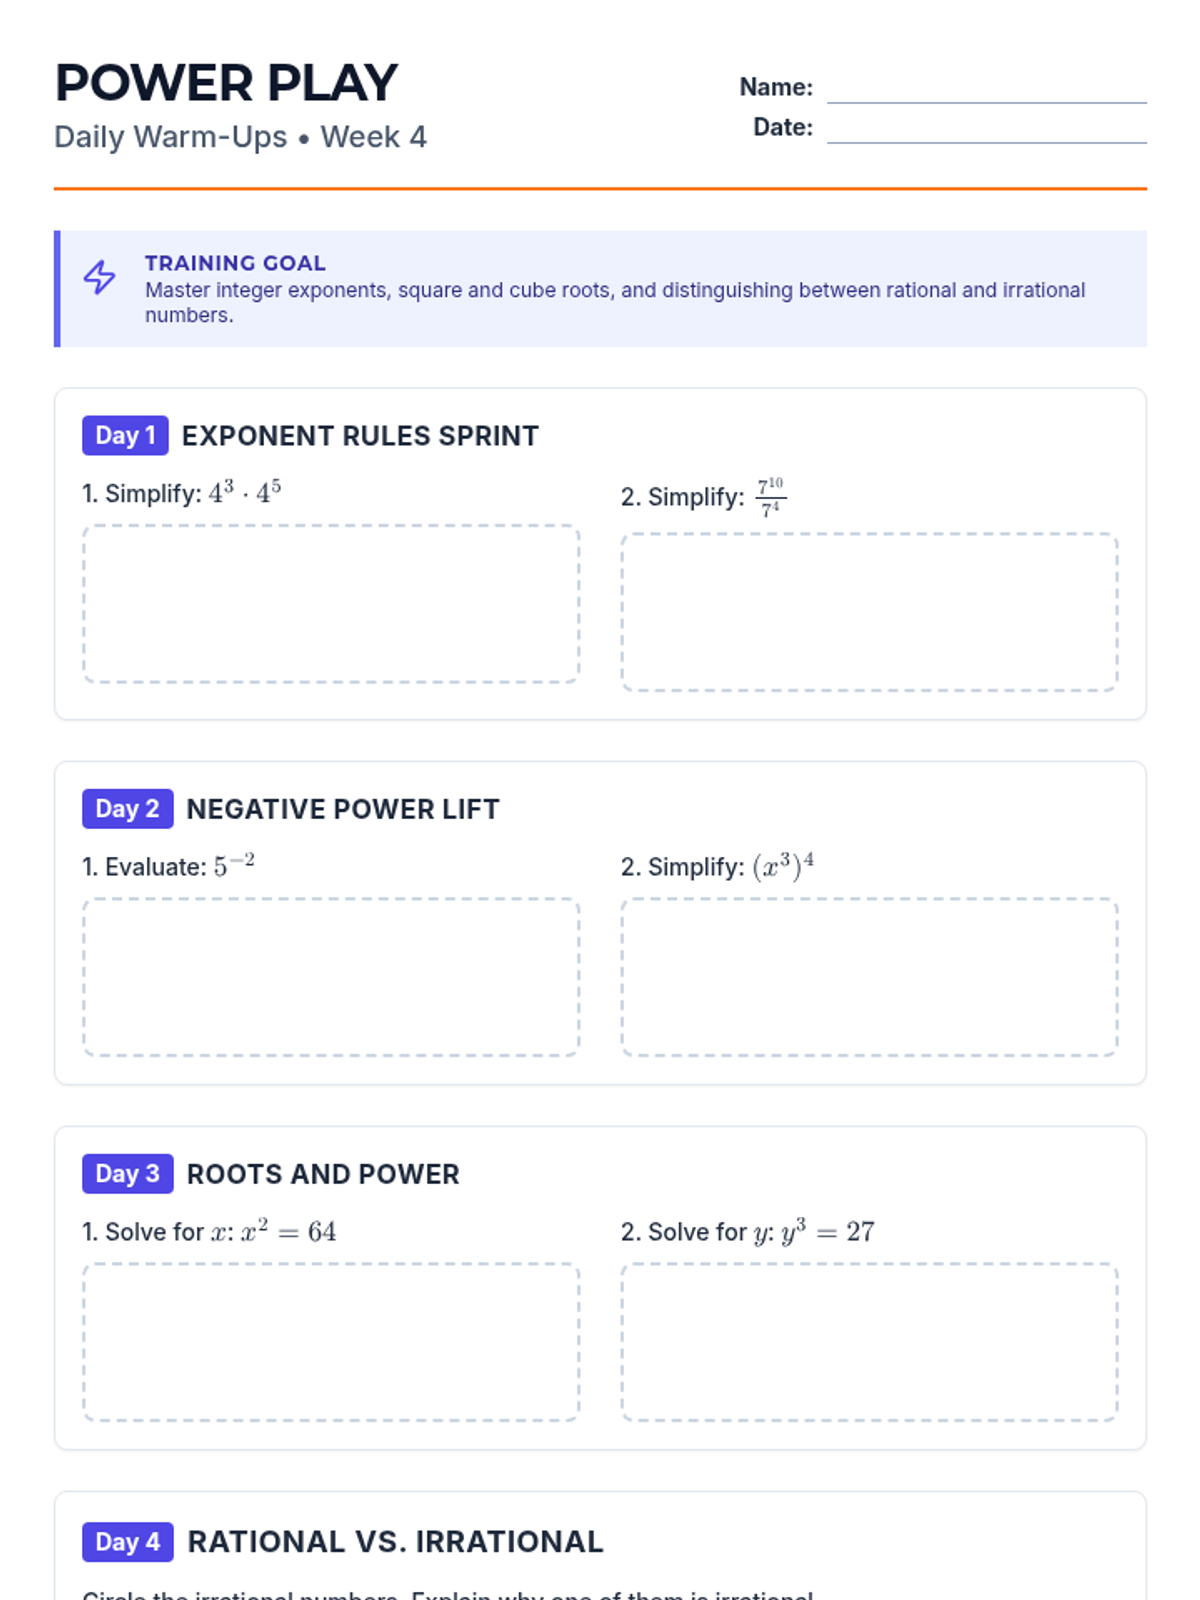
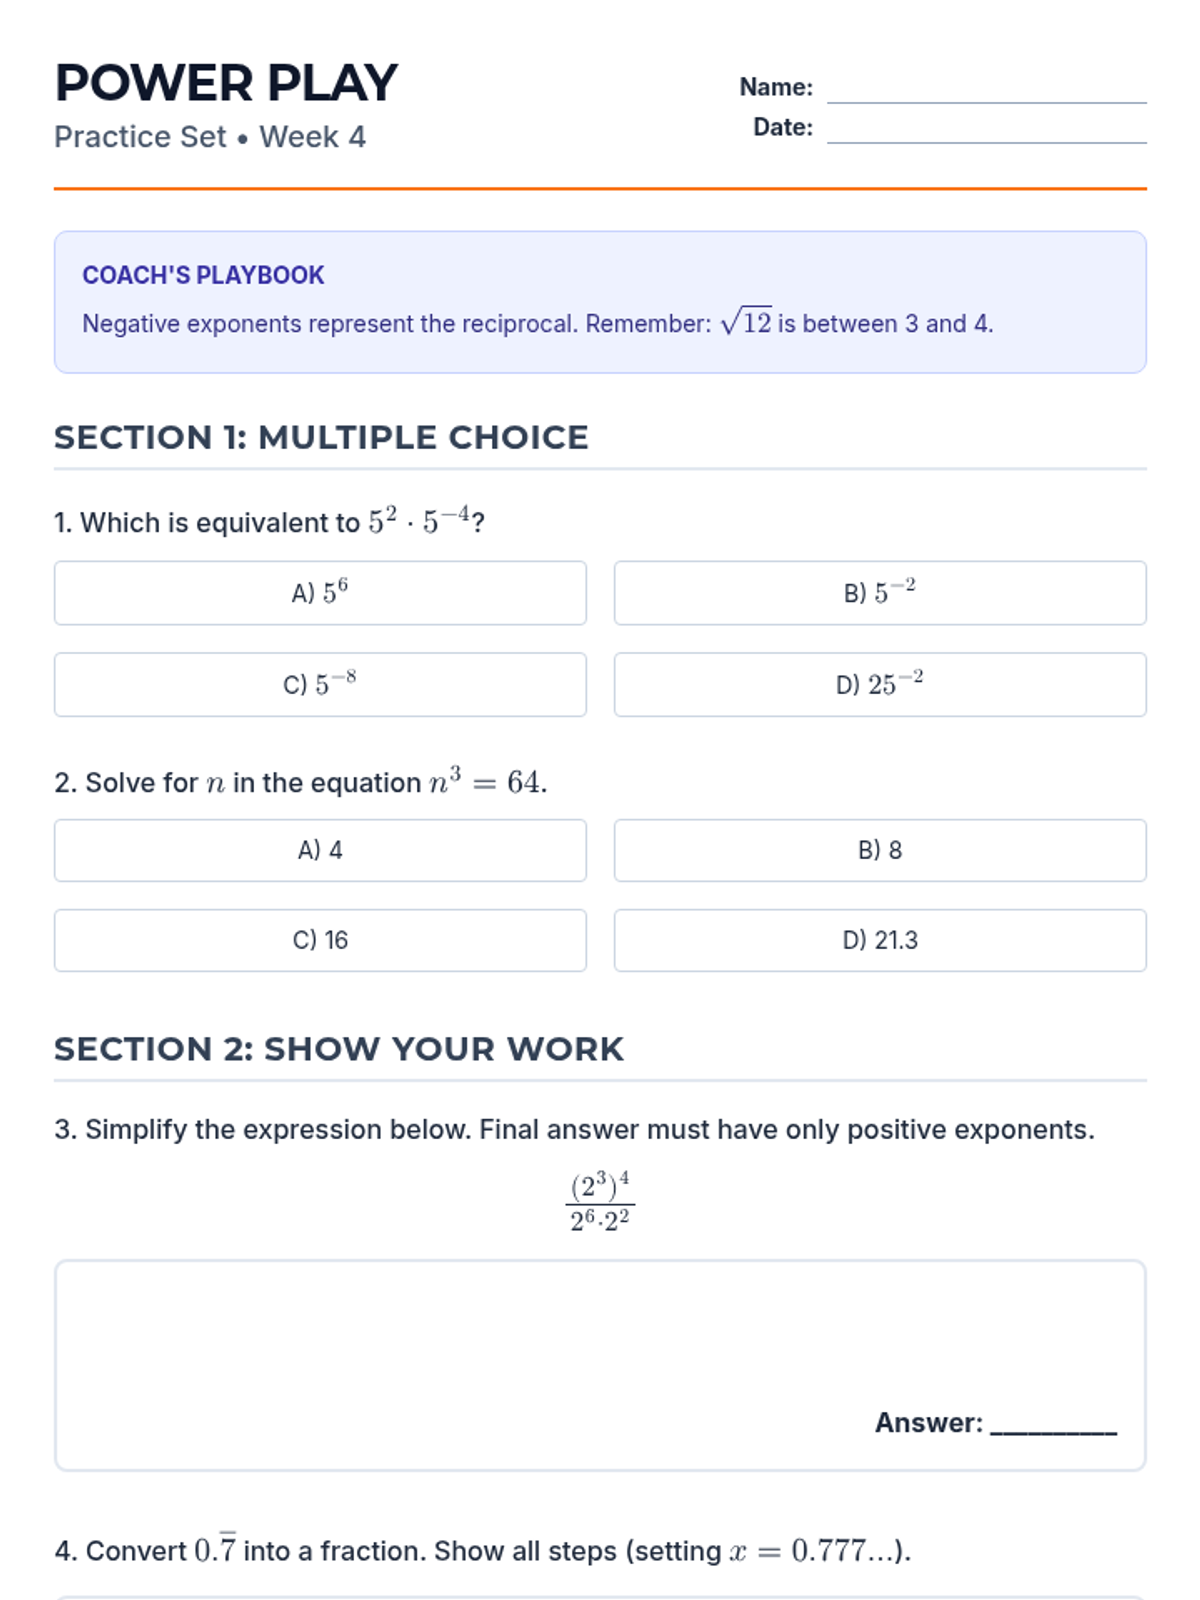
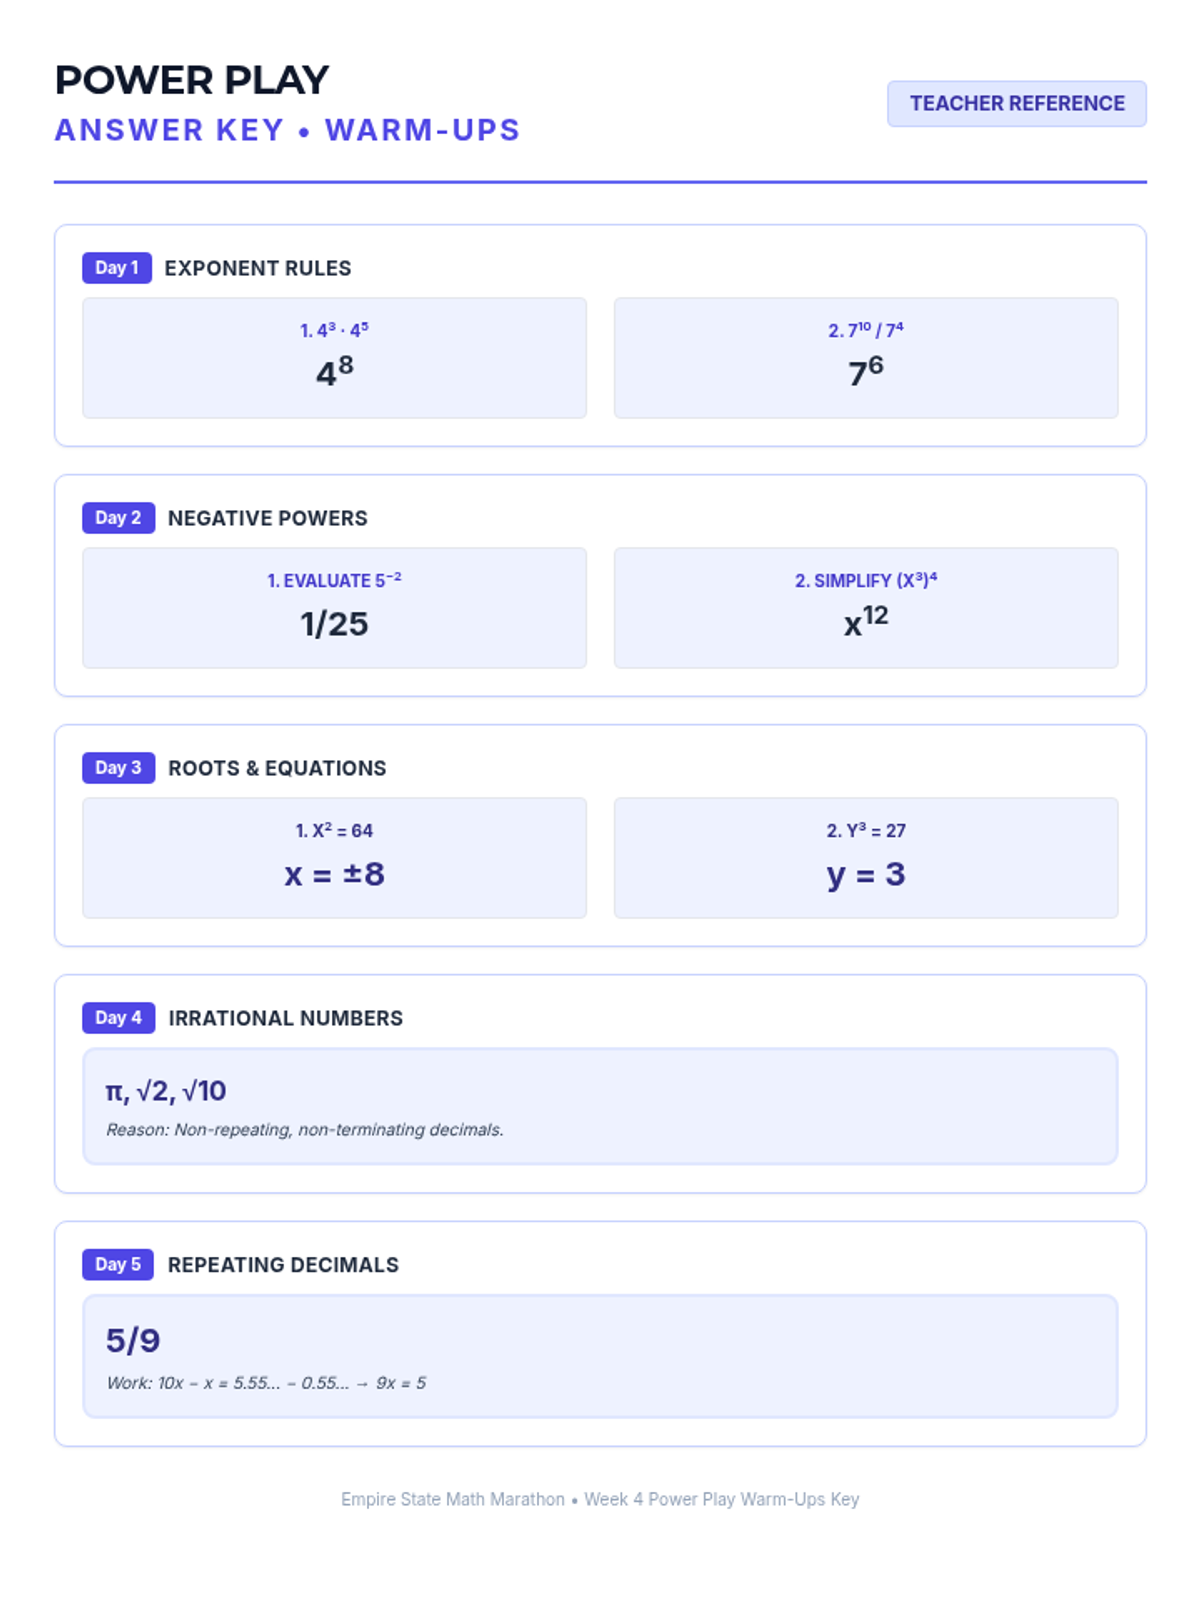
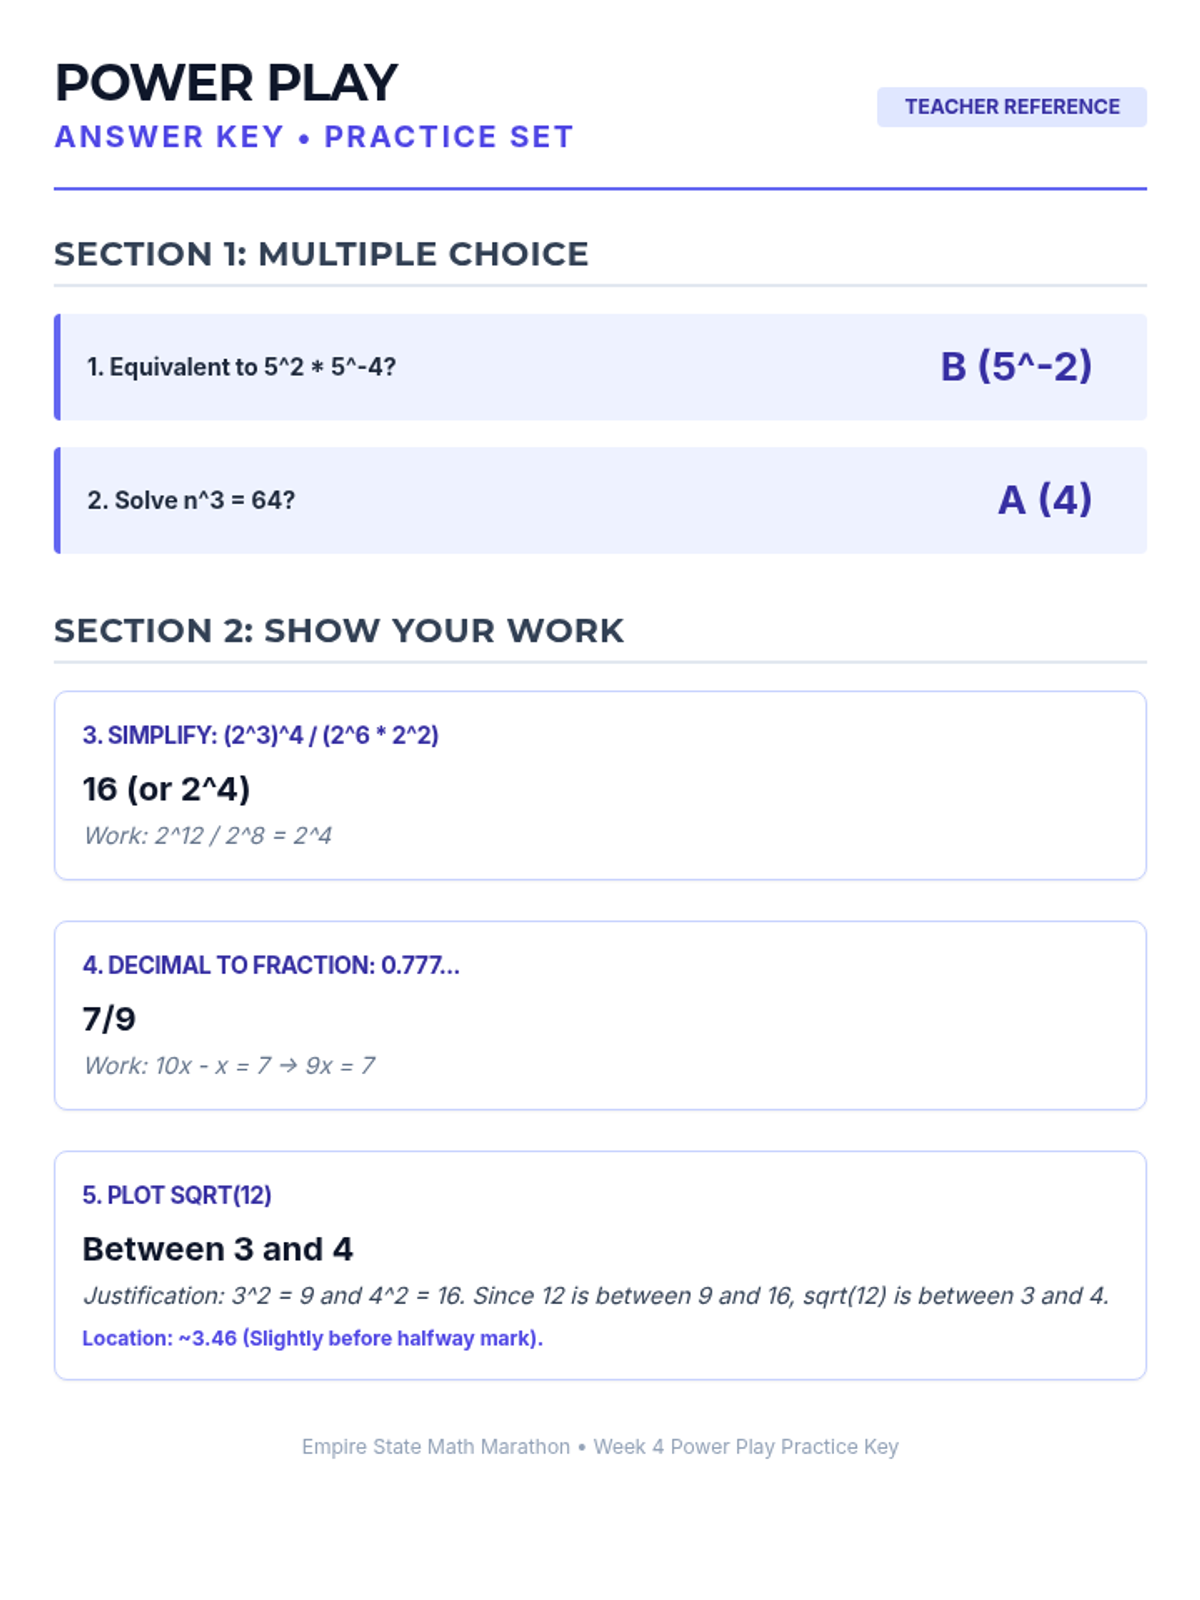
Week 4 explores integer exponent rules, perfect squares and cubes, and distinguishing between rational and irrational numbers.
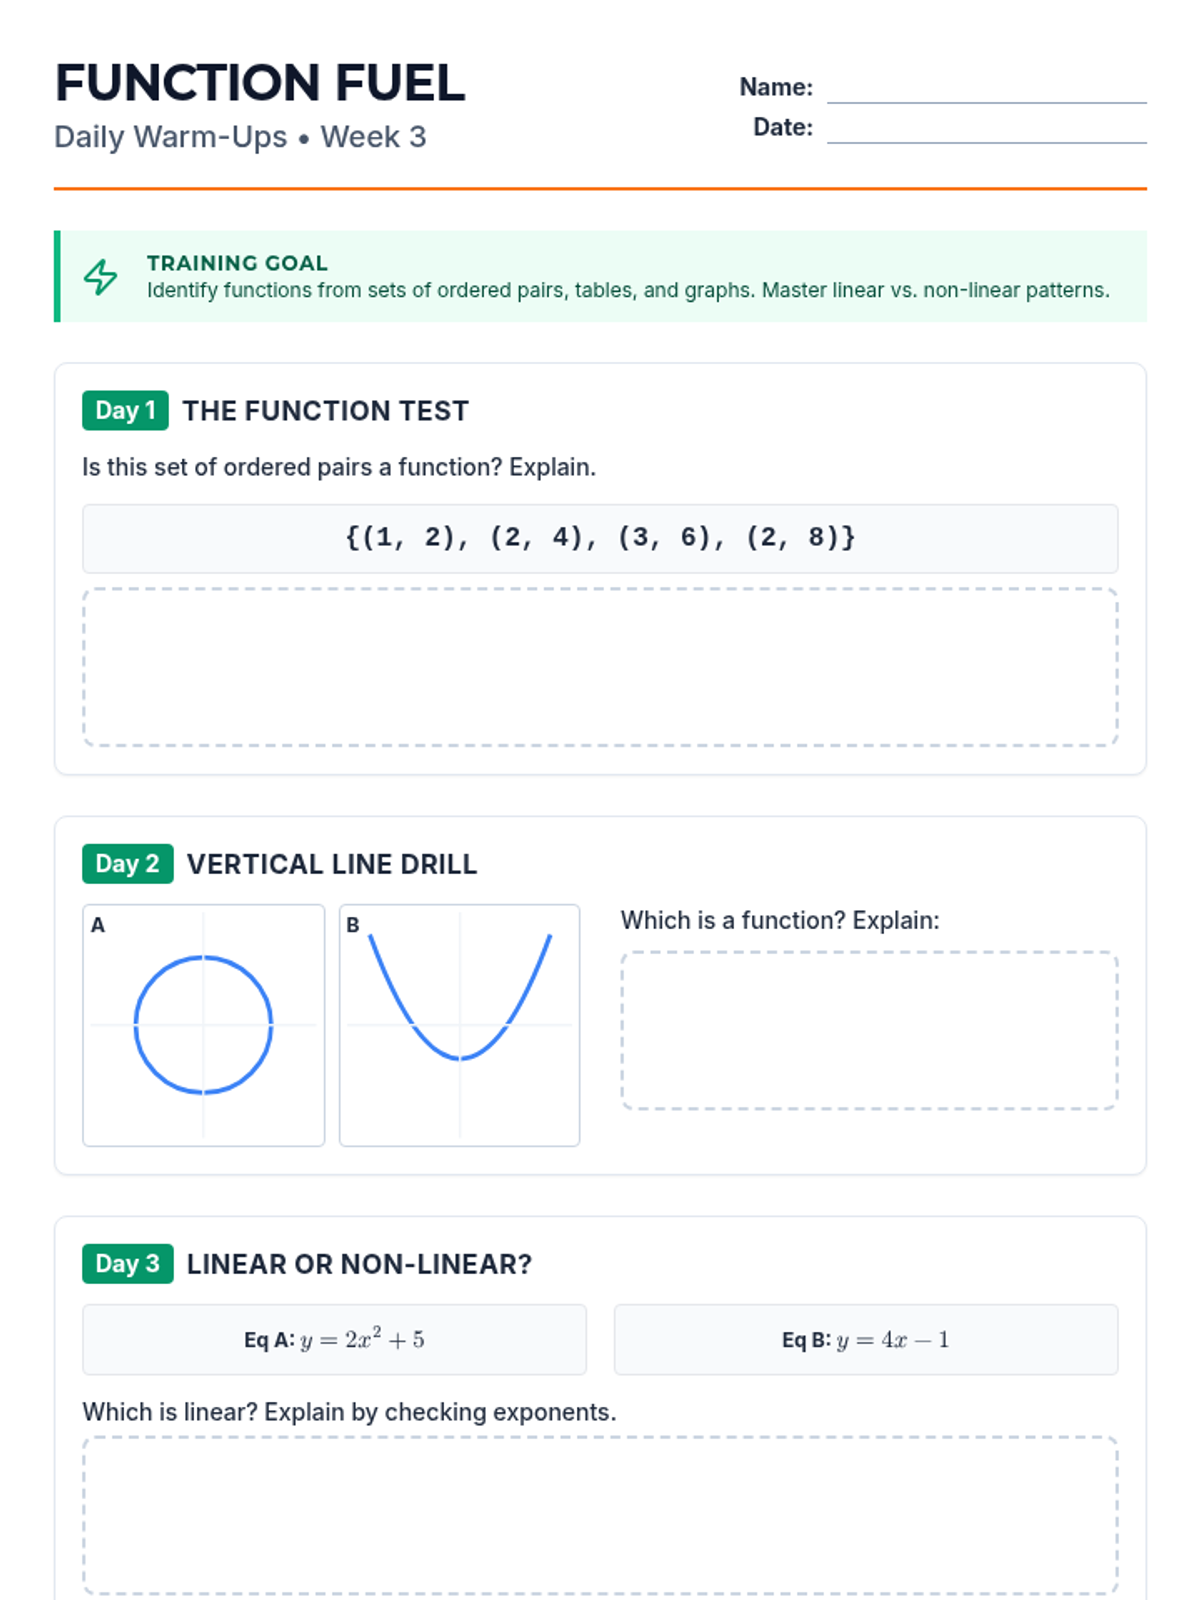
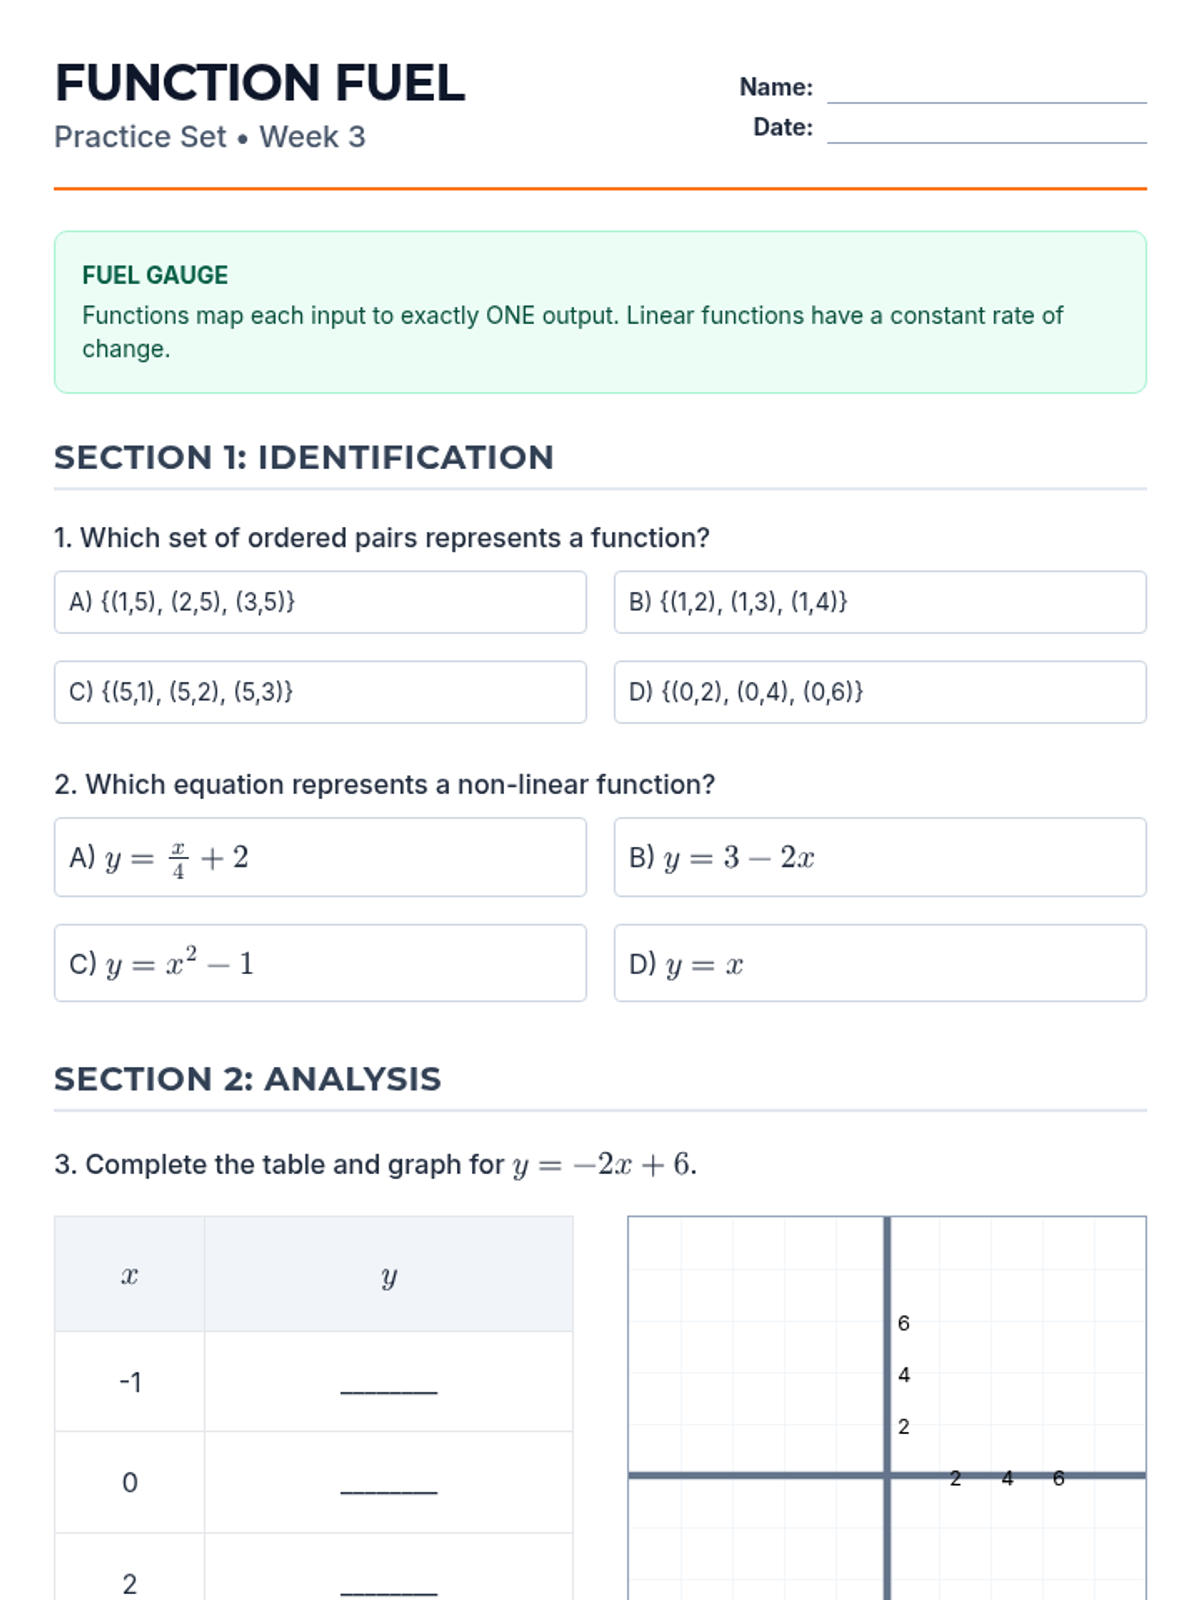
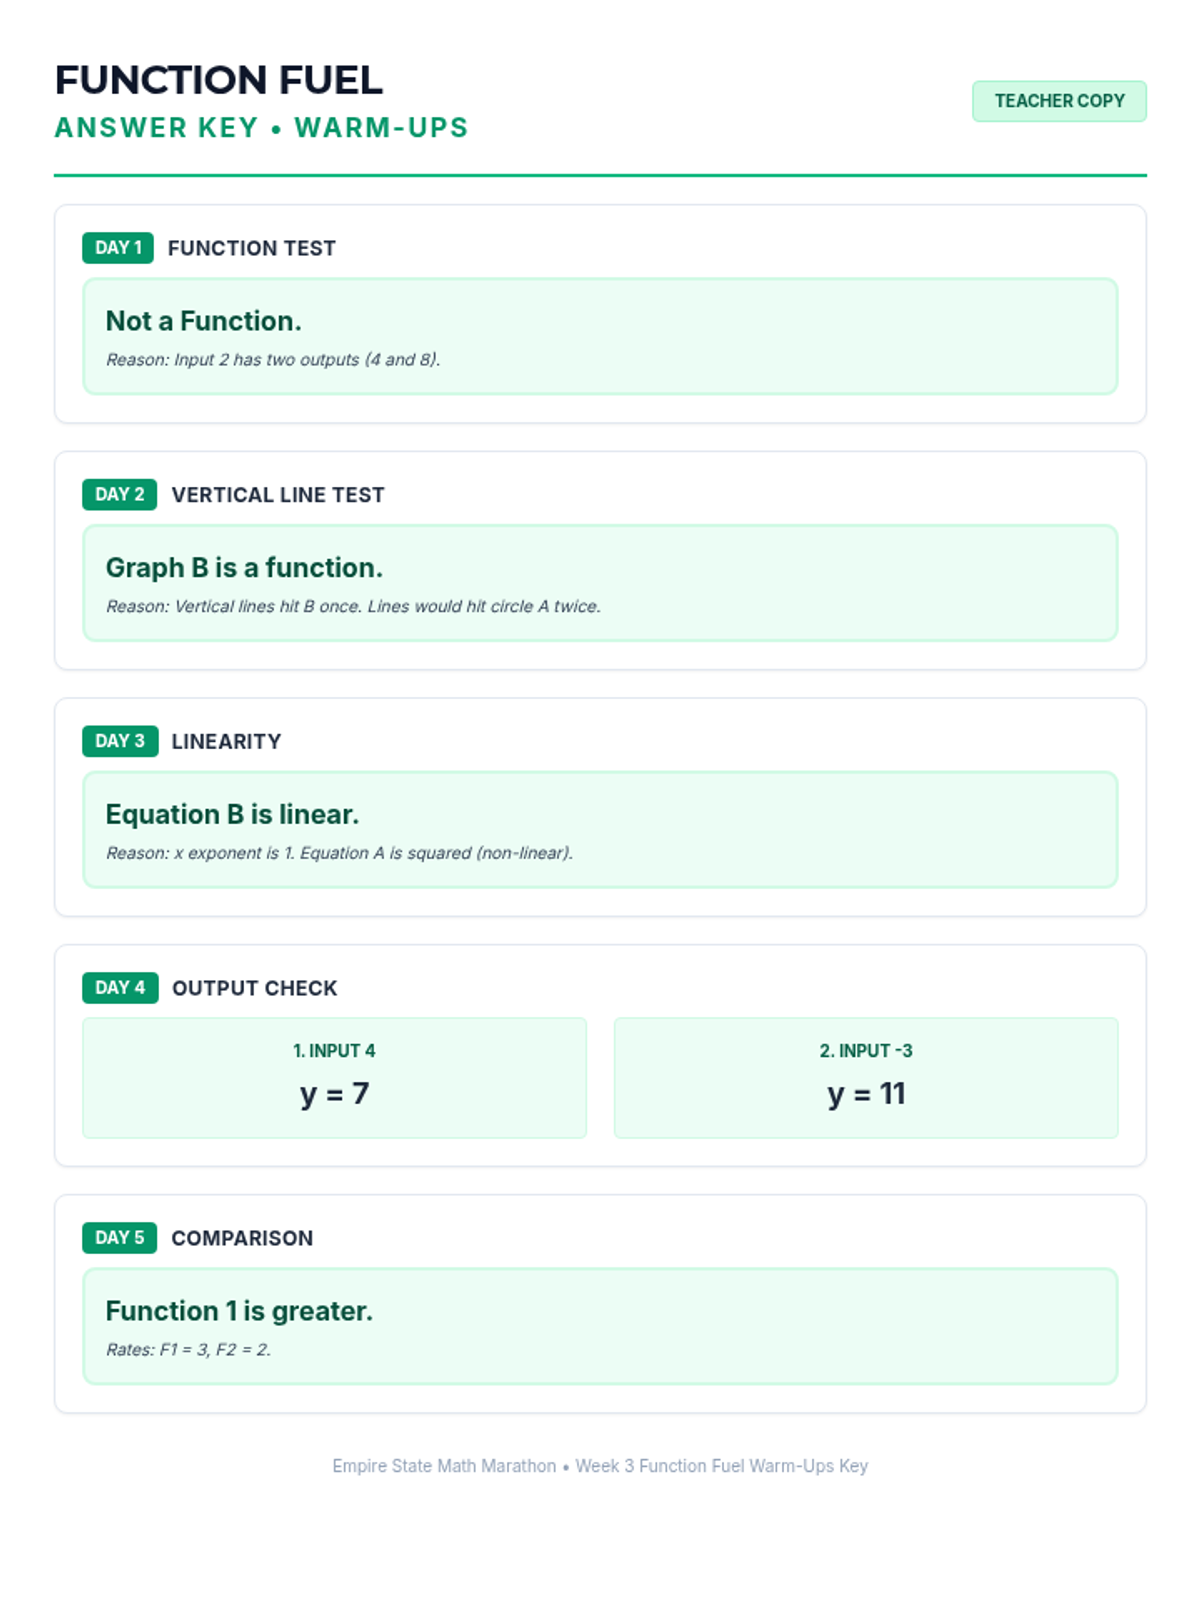
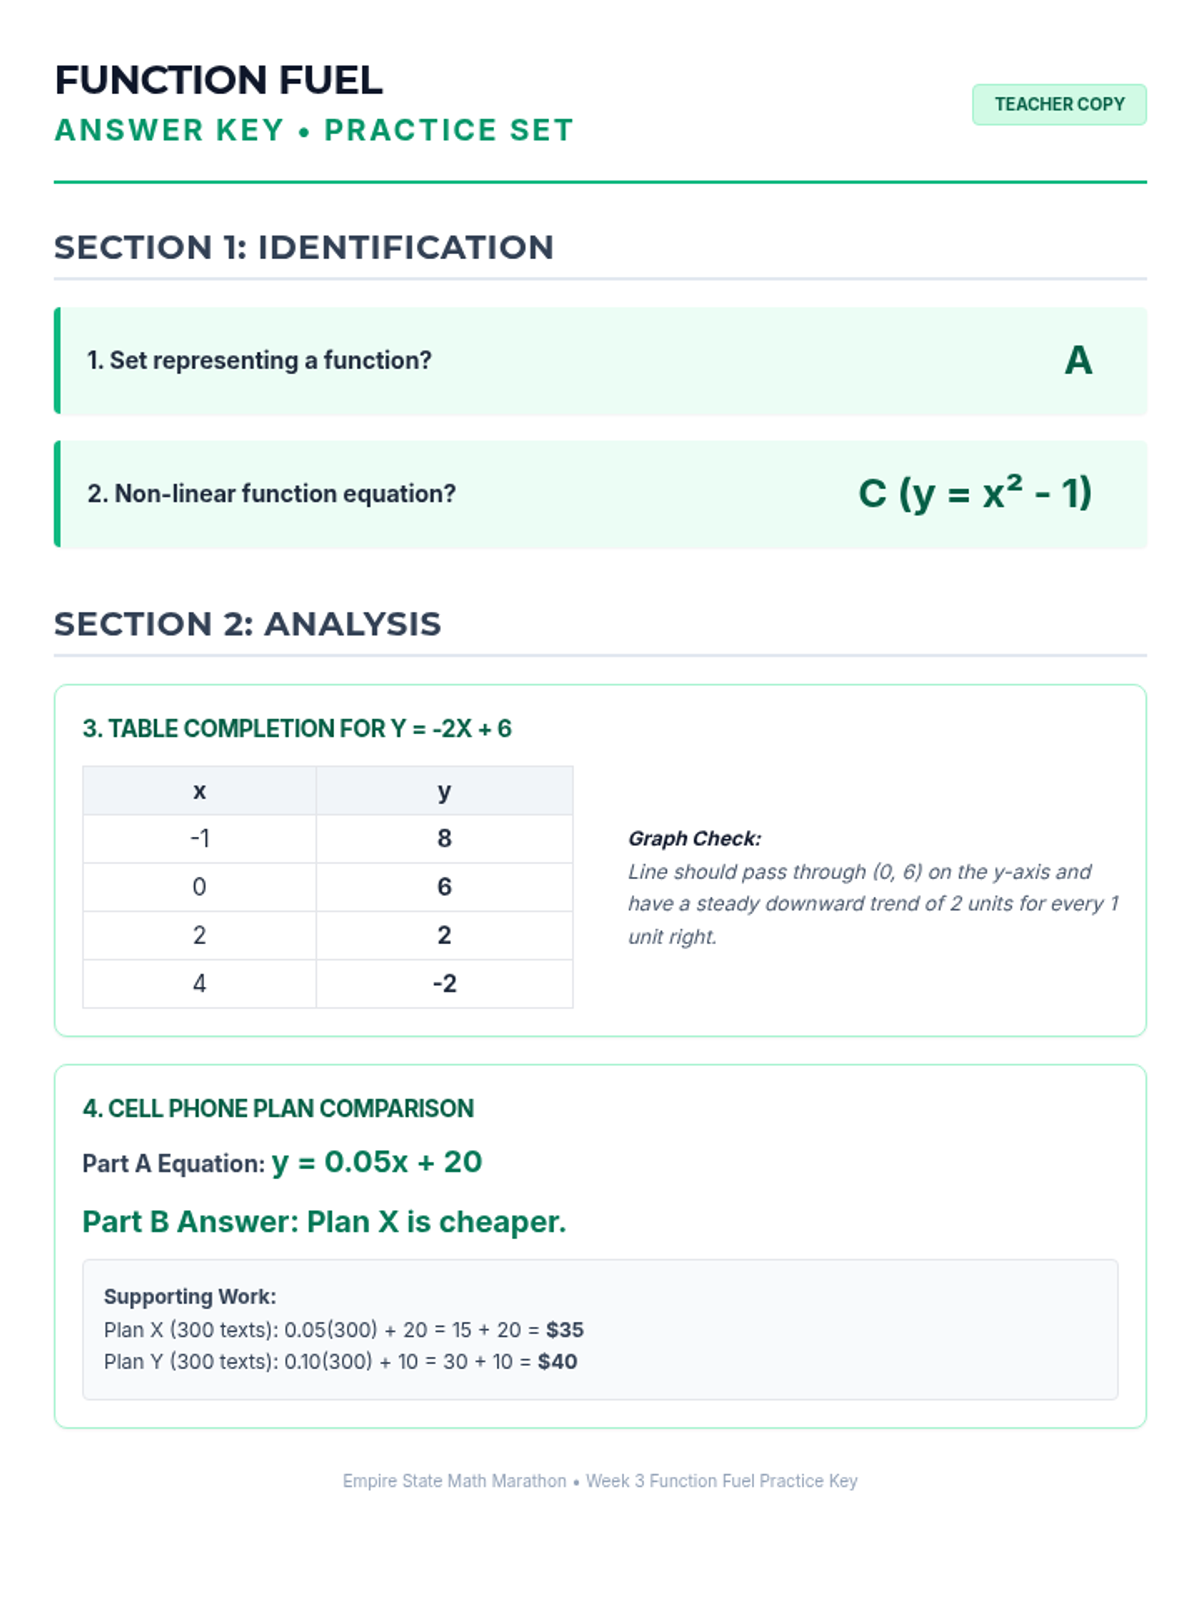
Week 3 defines, evaluates, and compares functions represented in different ways (tables, graphs, equations).
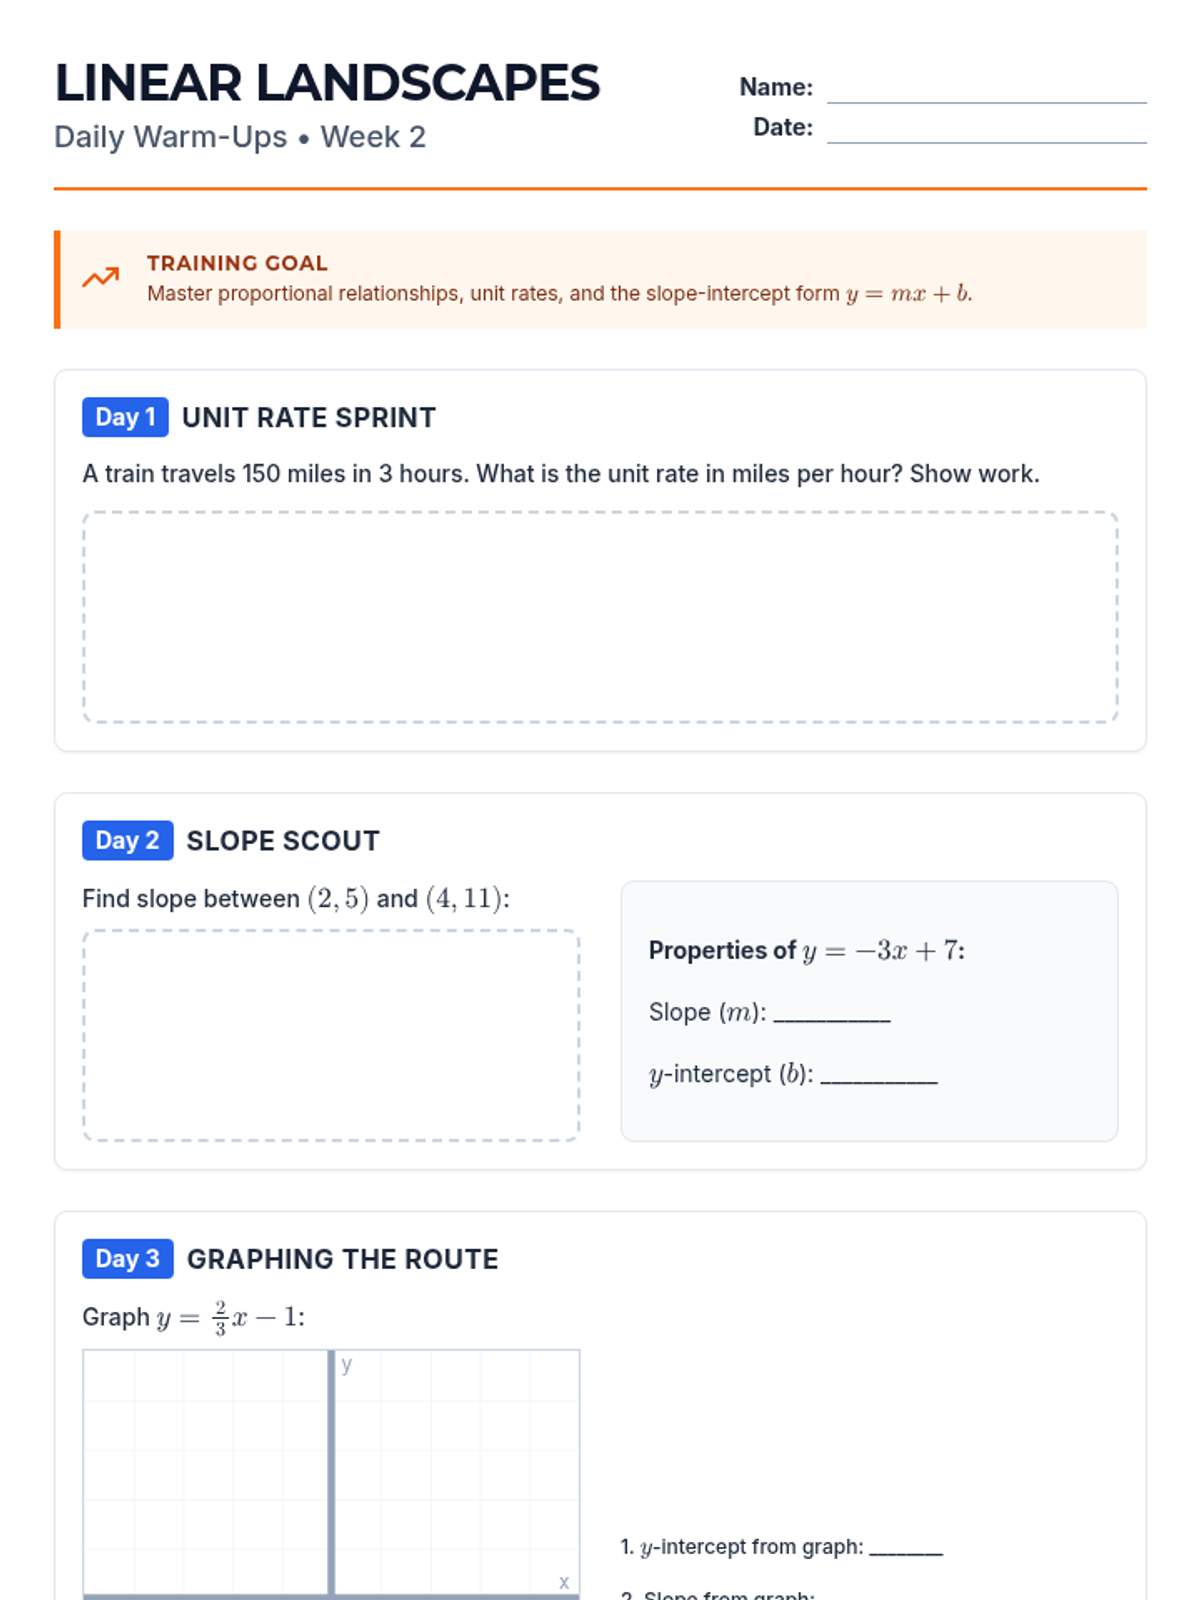
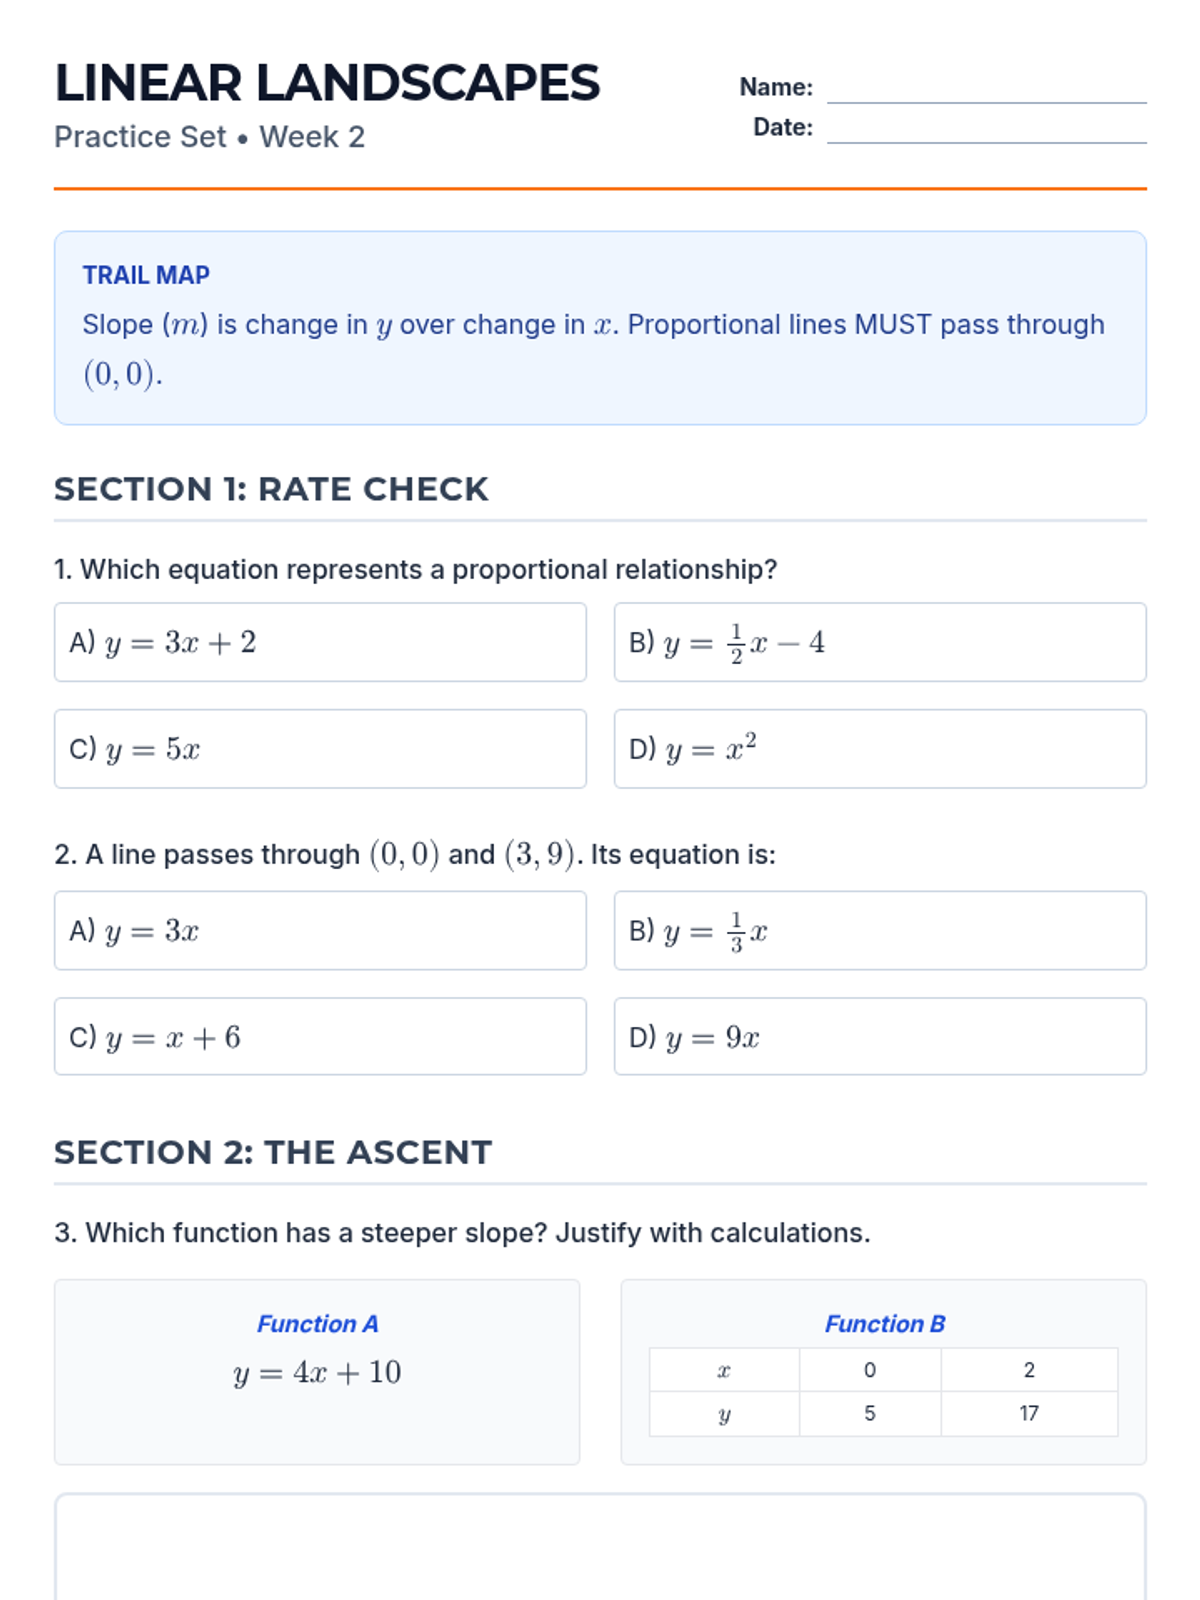
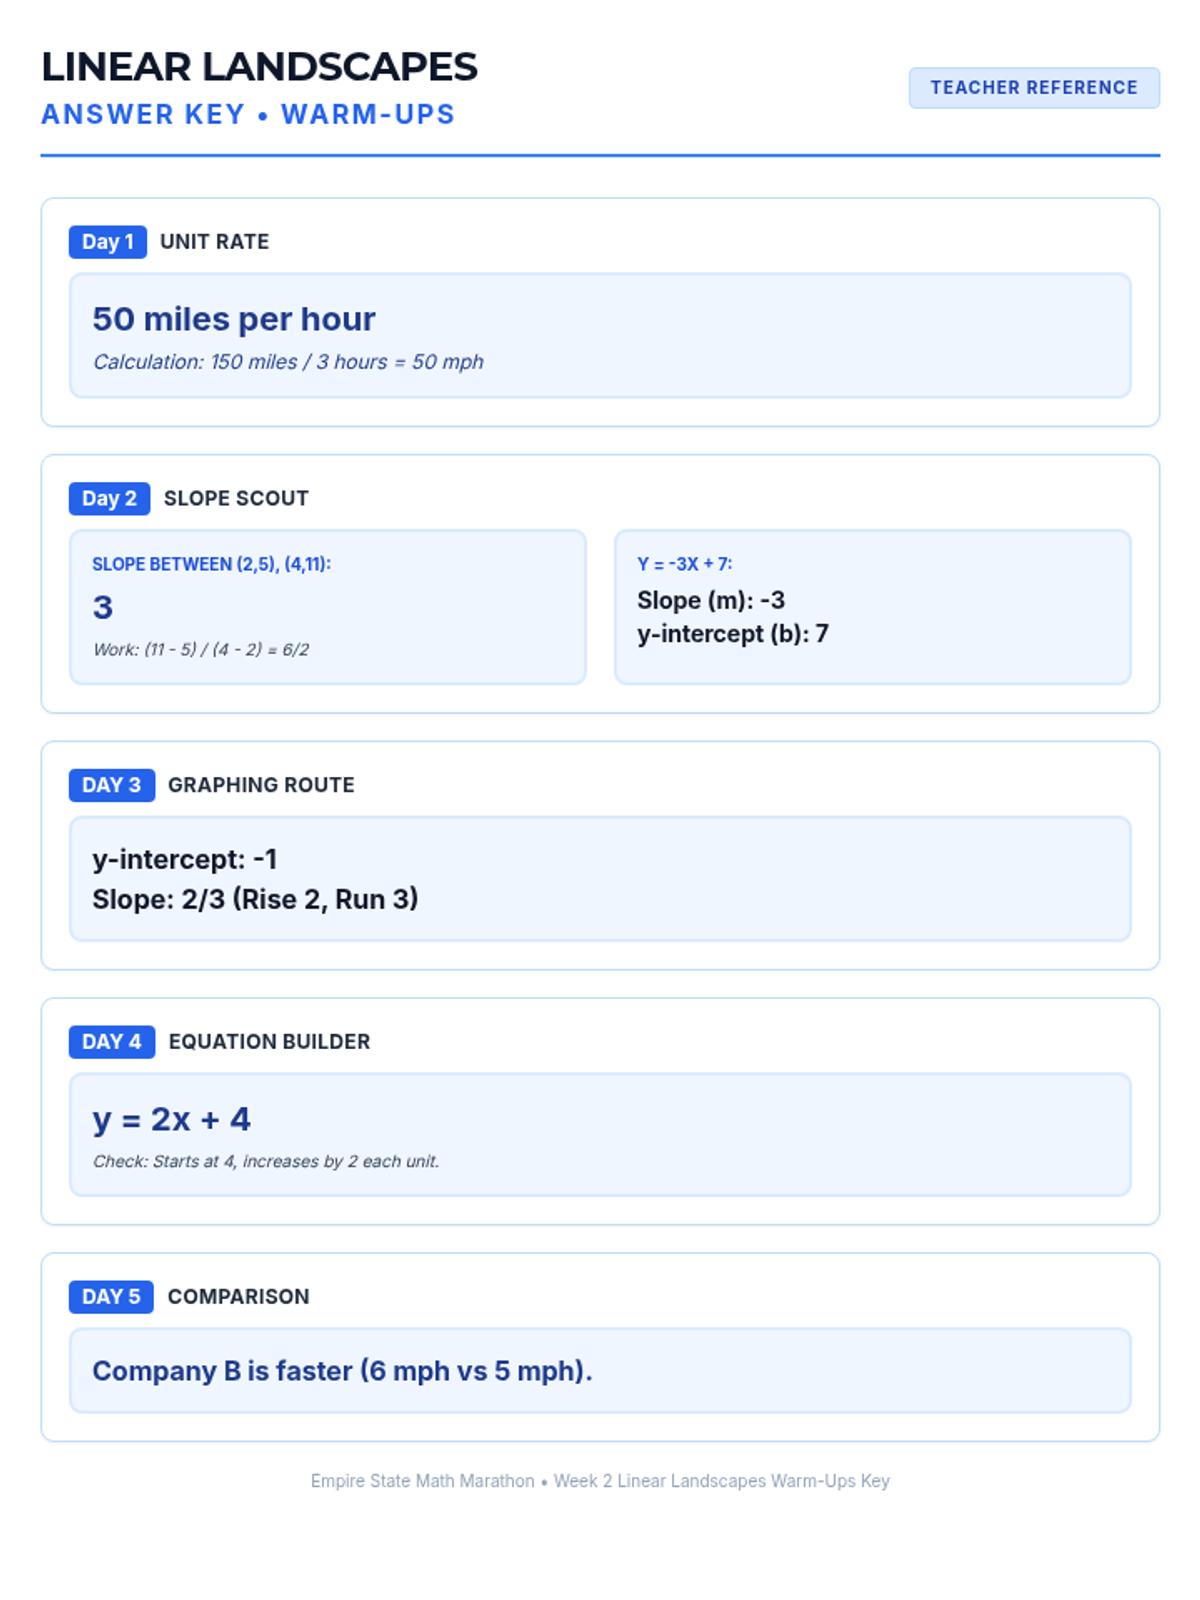
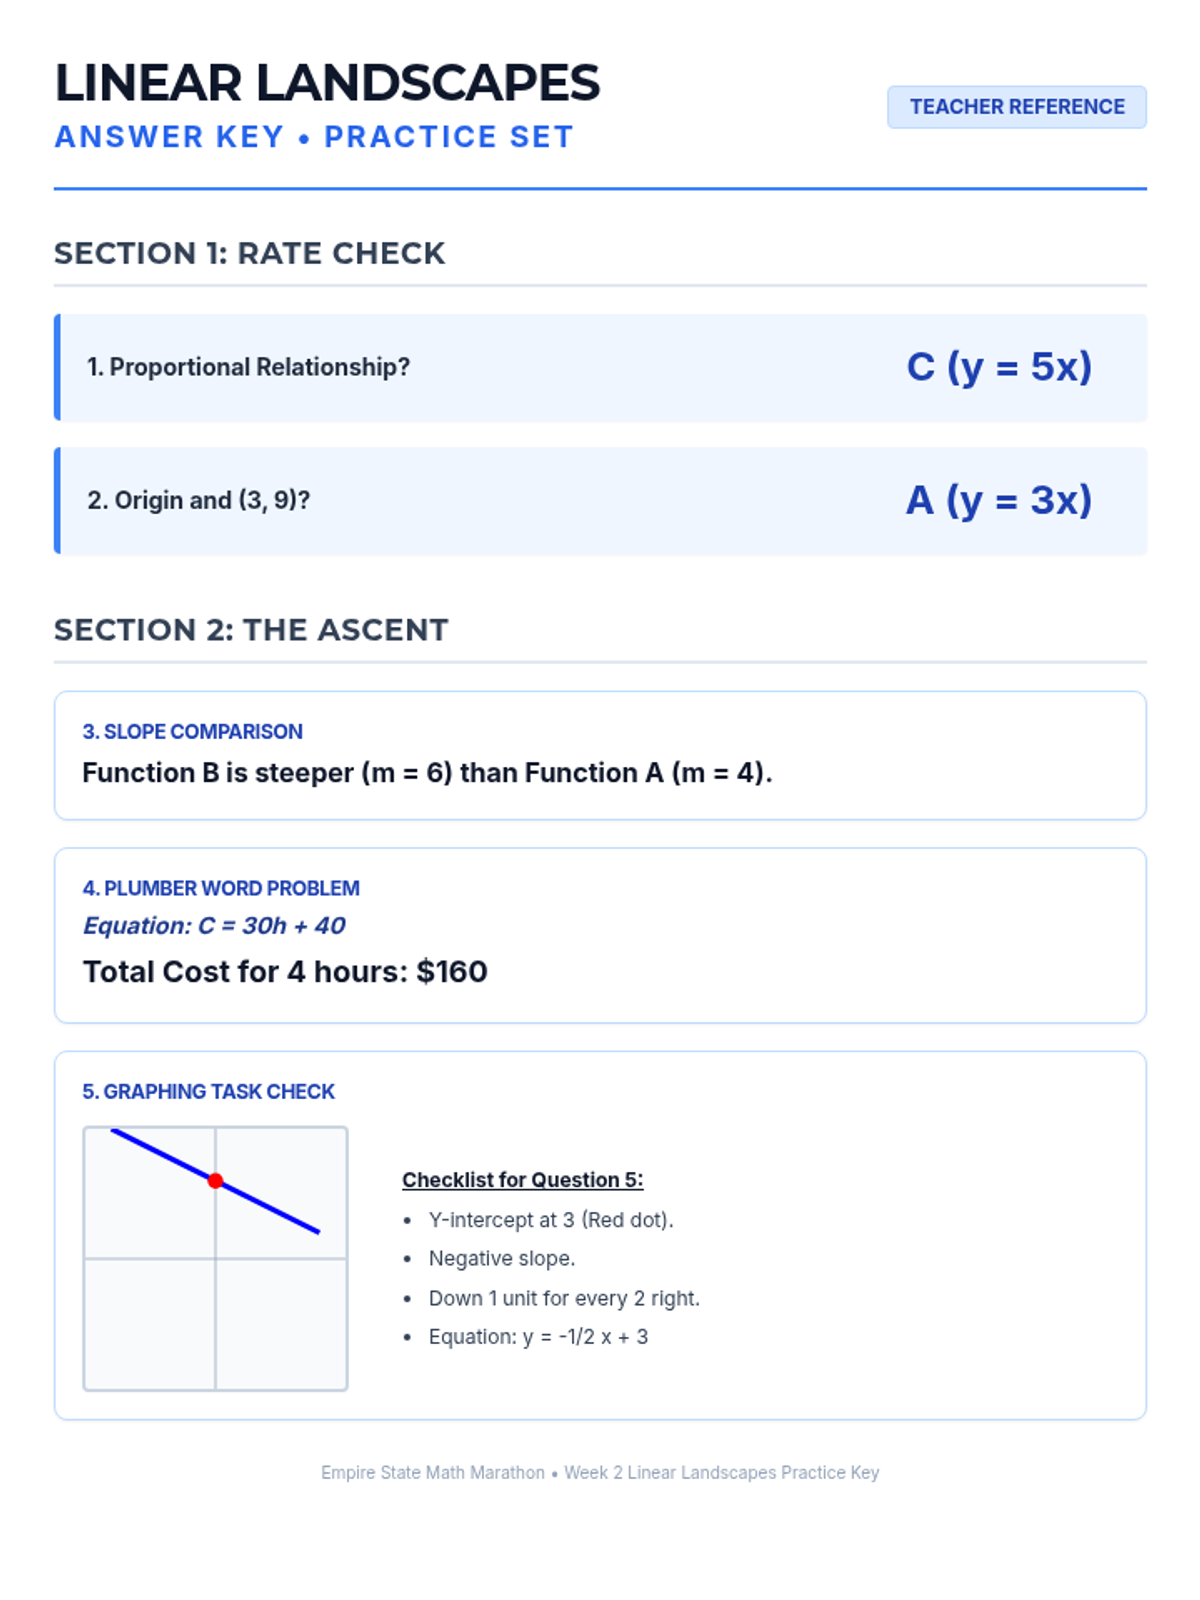
Week 2 covers proportional relationships, unit rates, and the slope-intercept form of linear equations.
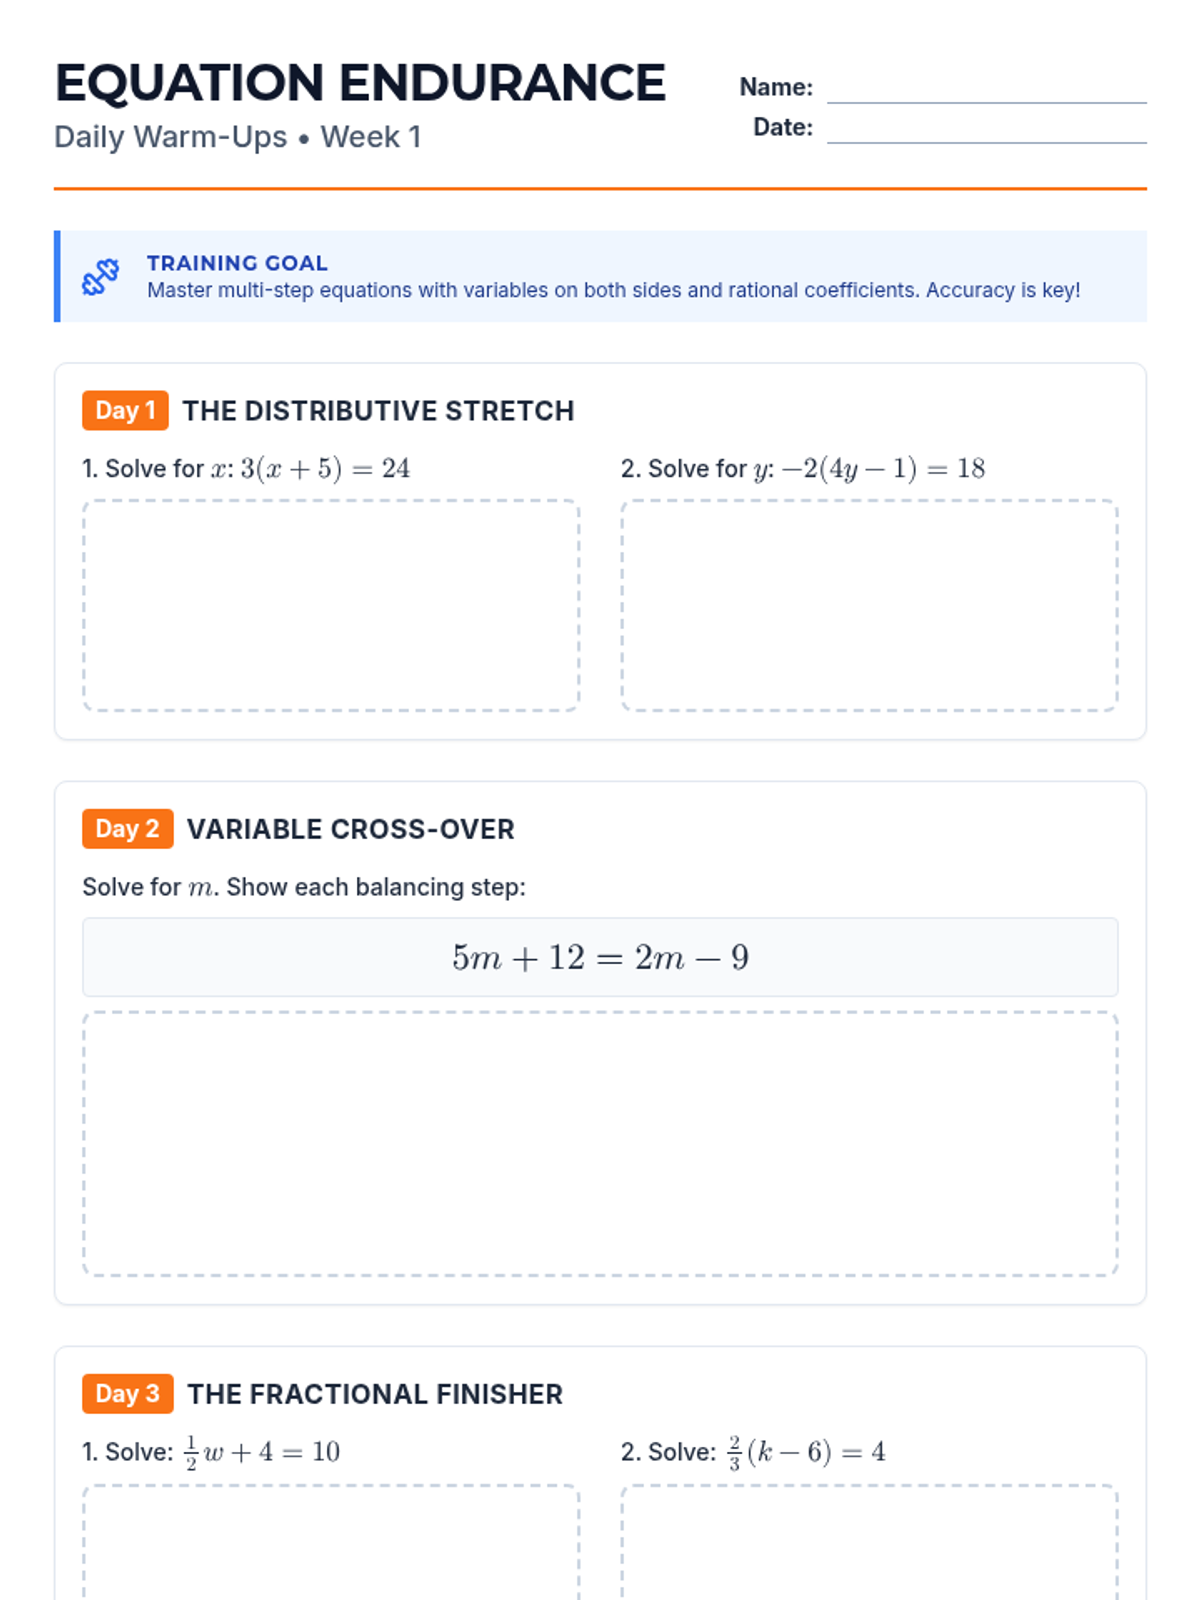
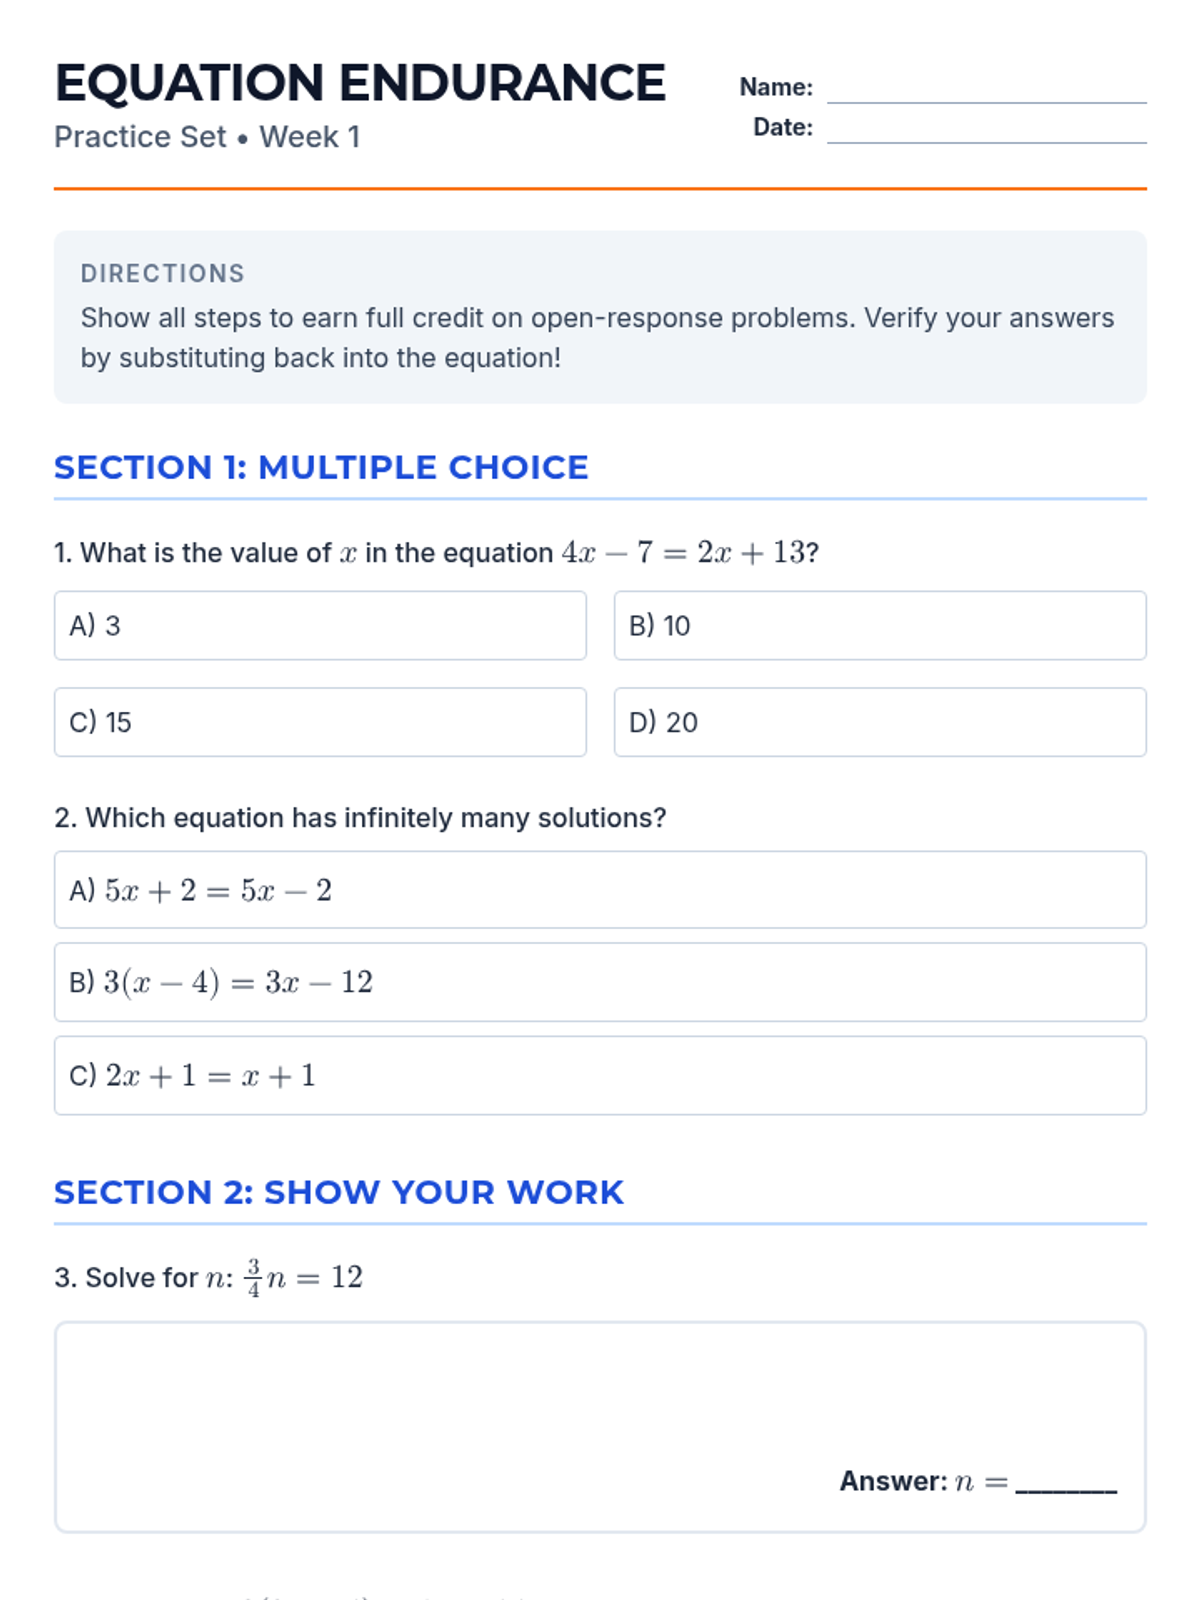
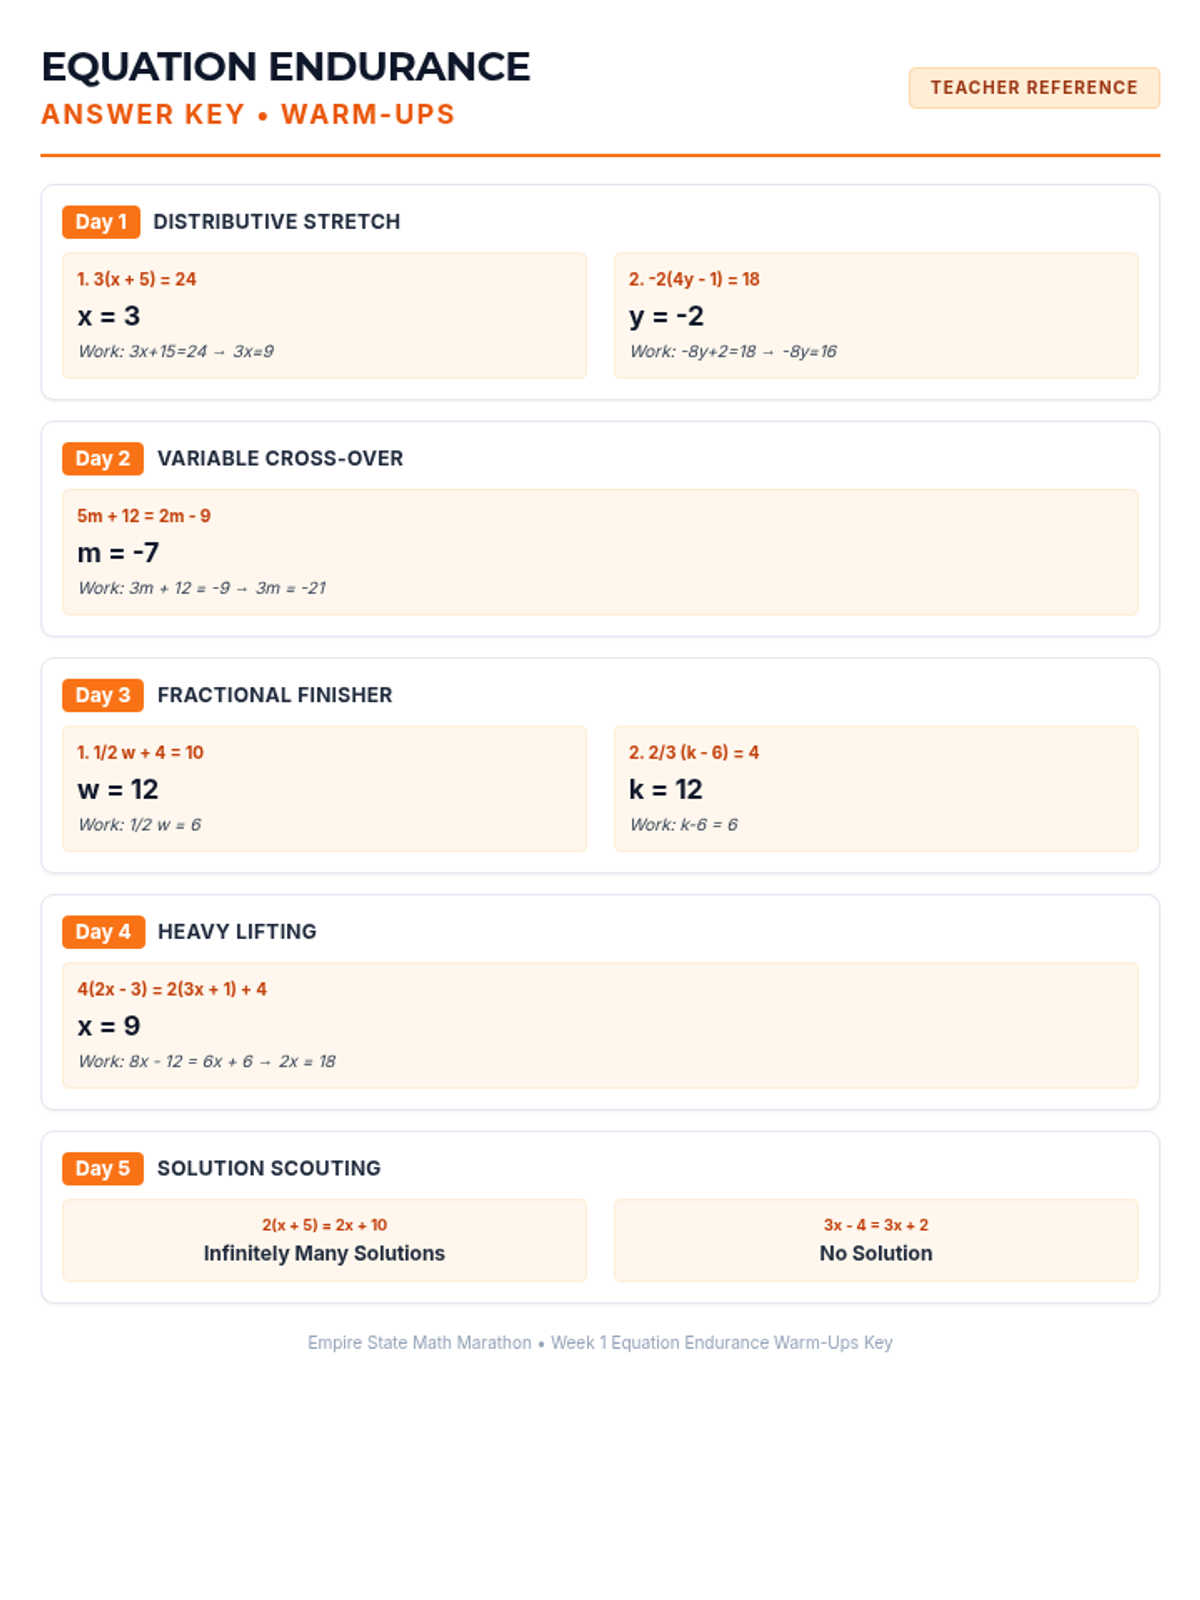
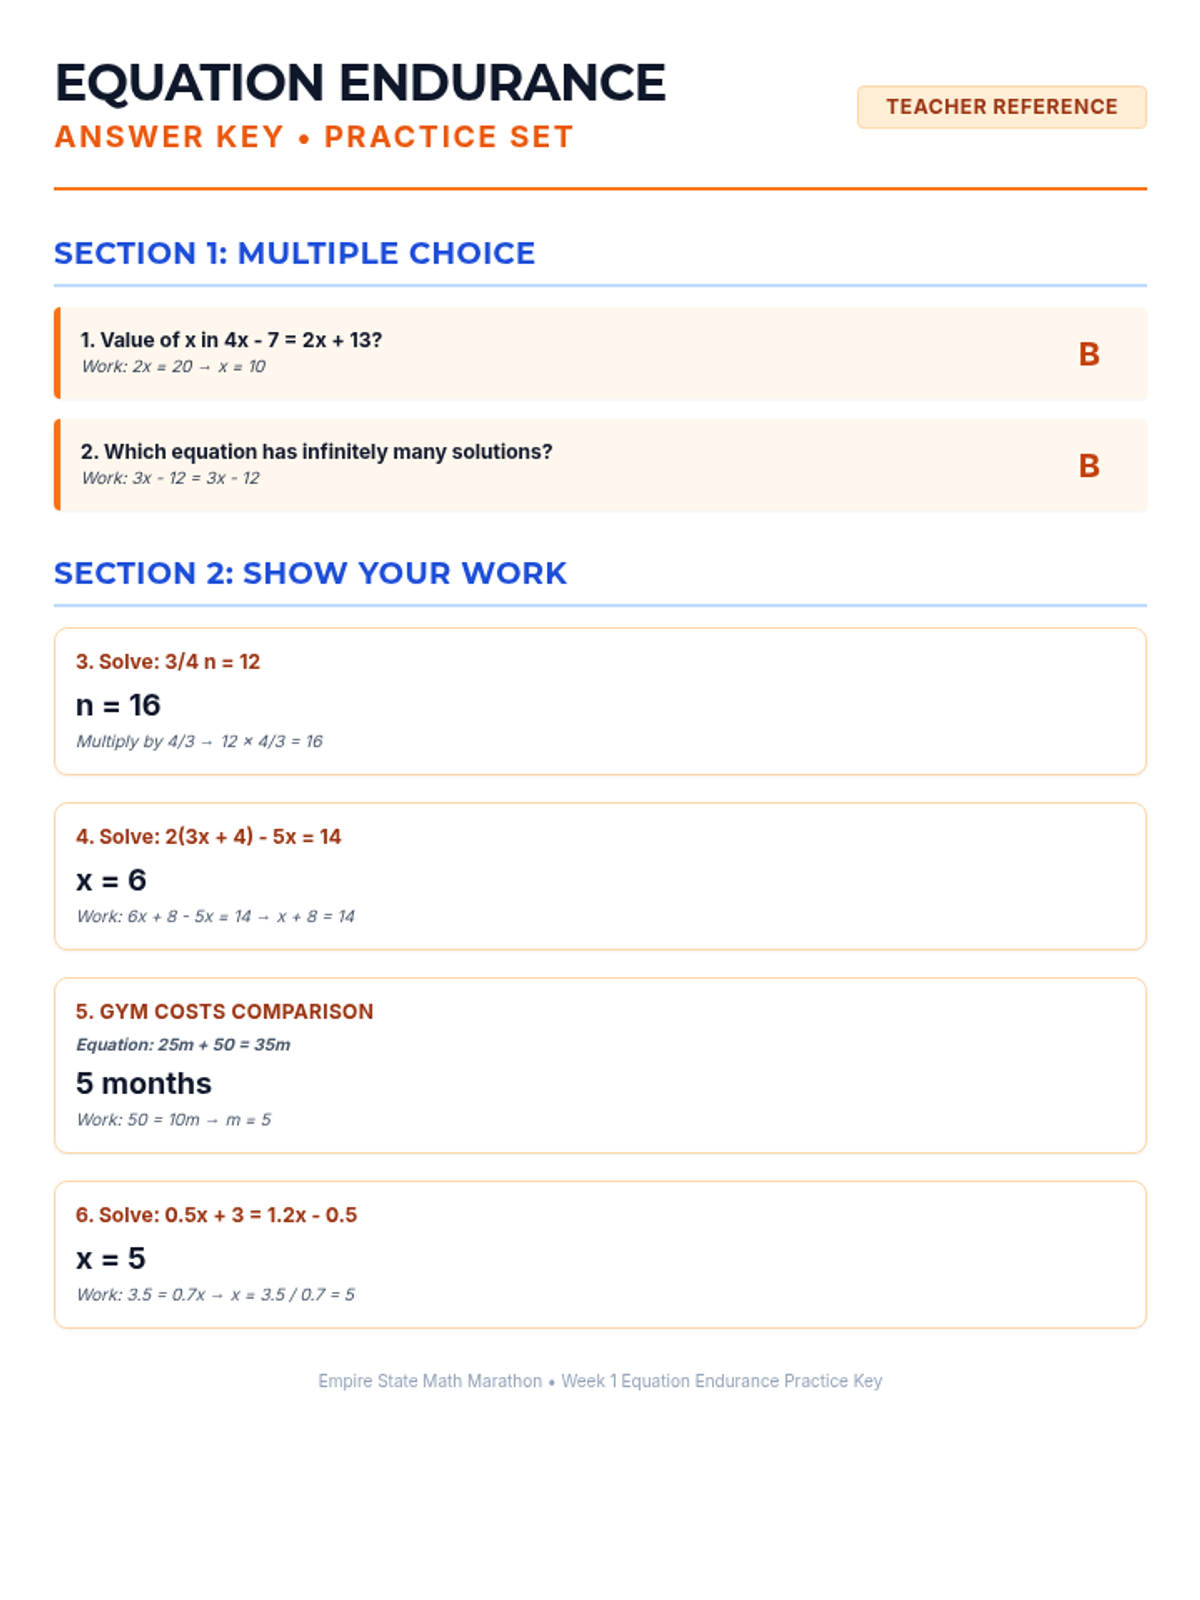
Week 1 focuses on solving multi-step equations, including those with variables on both sides, rational coefficients, and checking solutions.
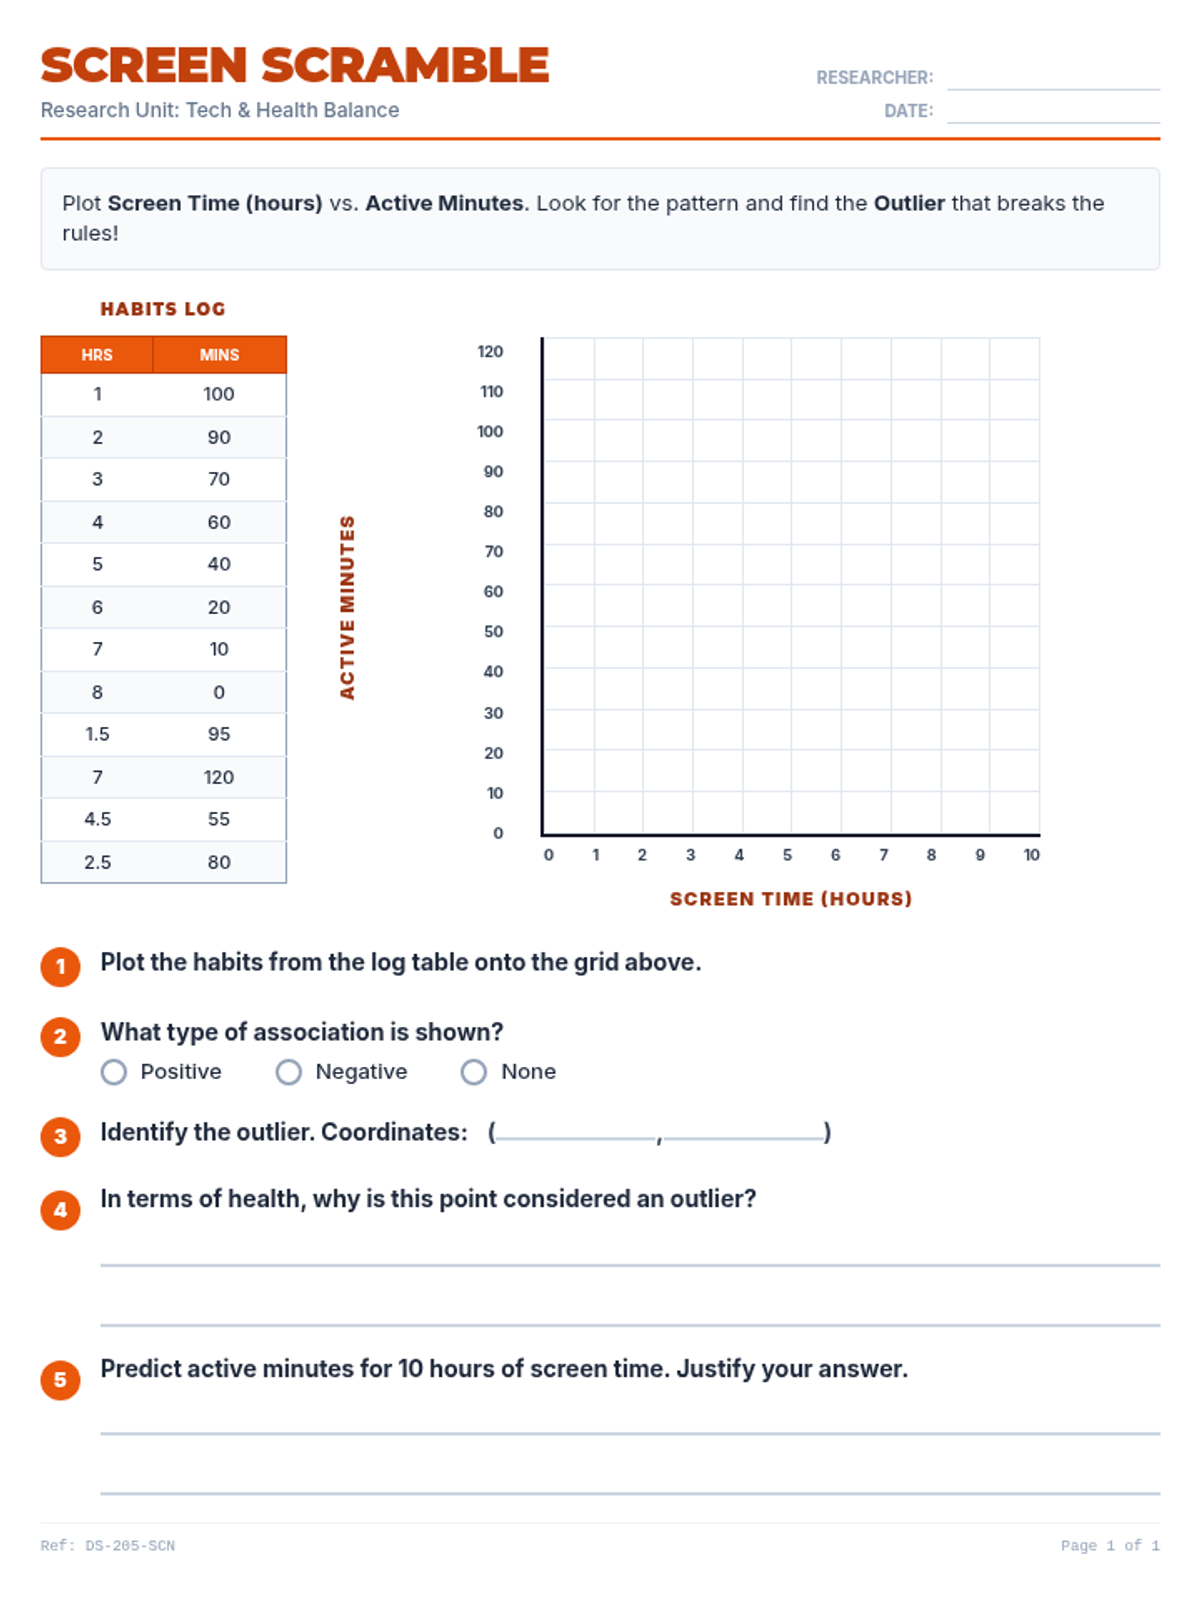
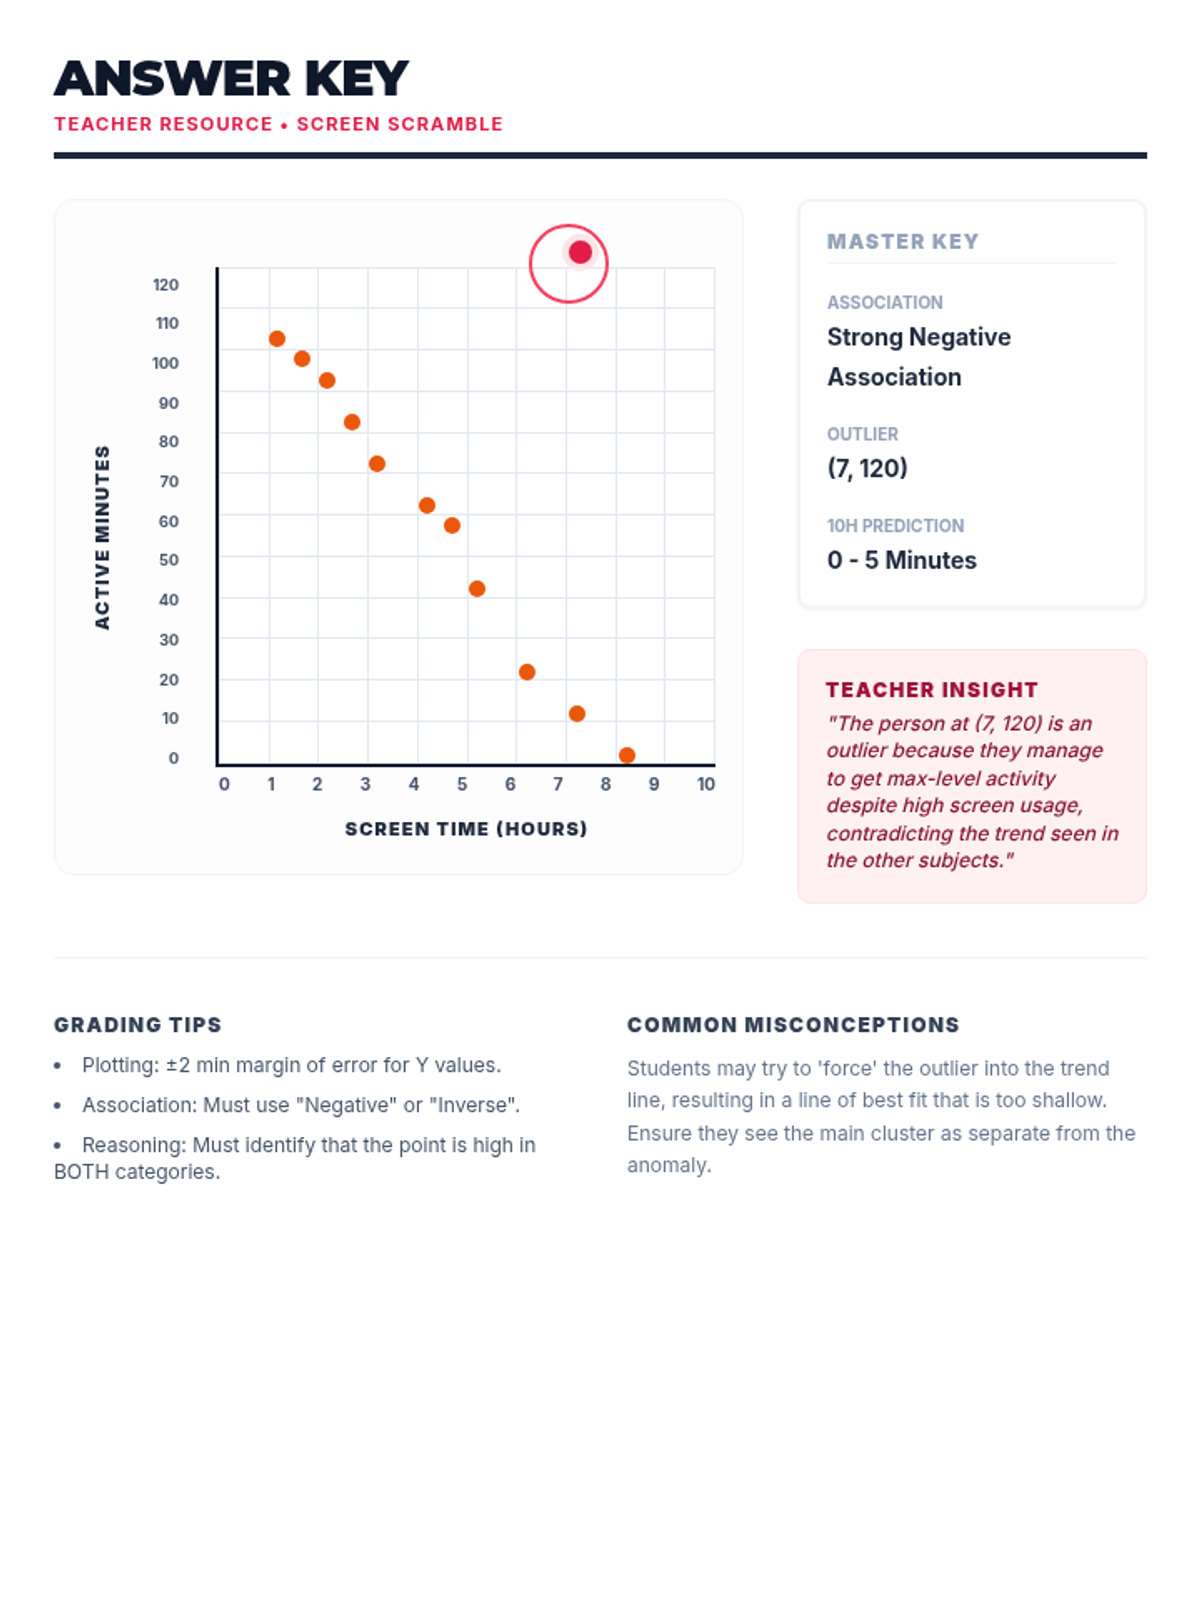
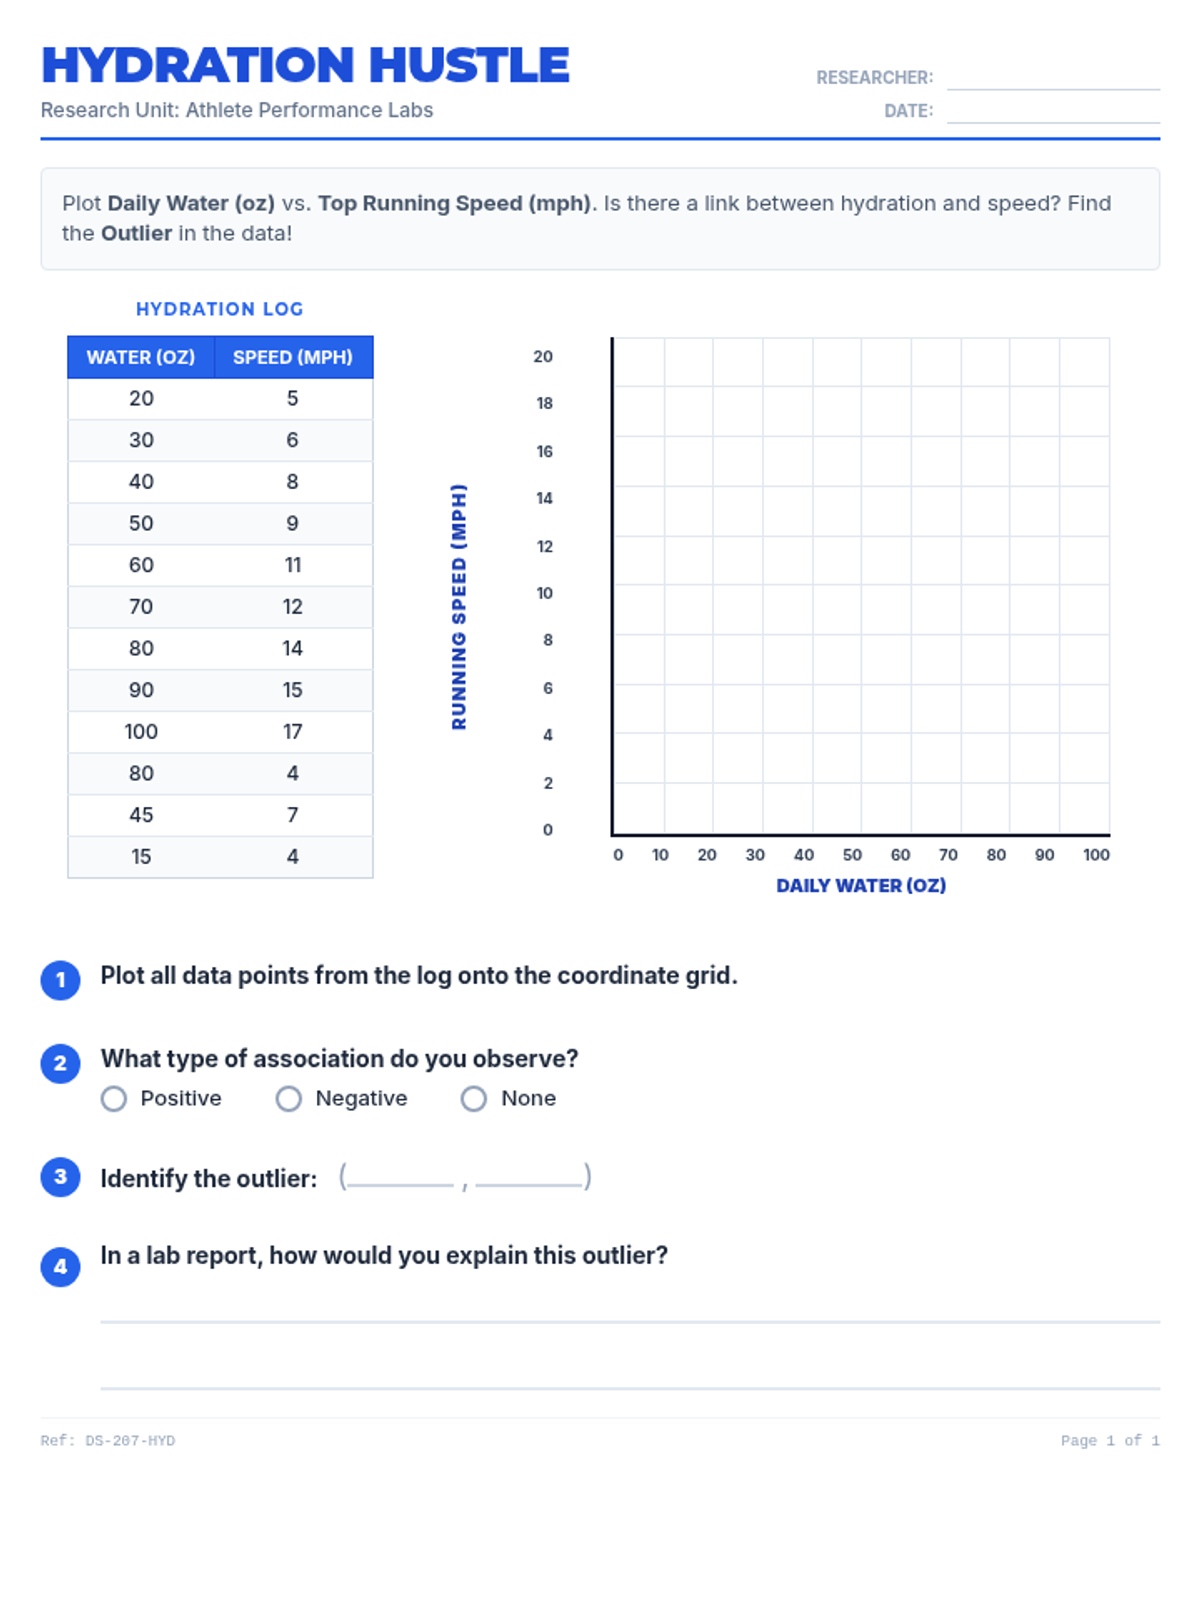
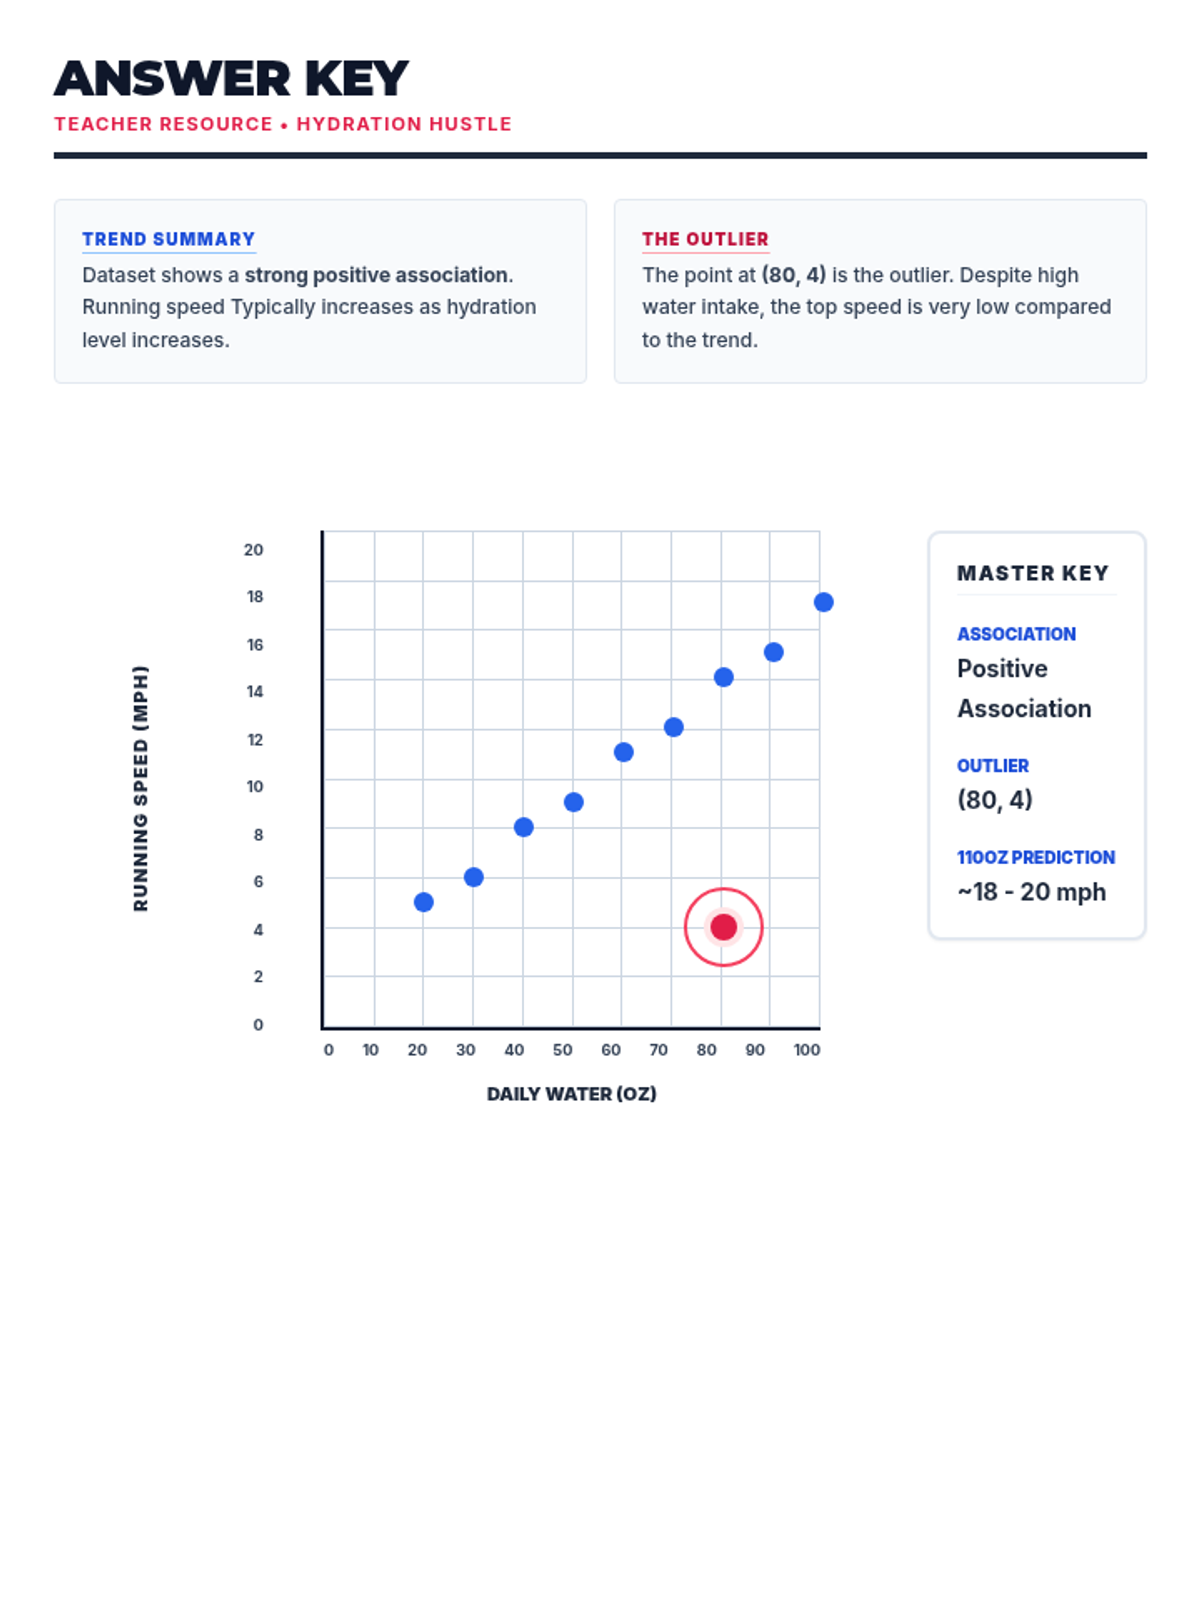
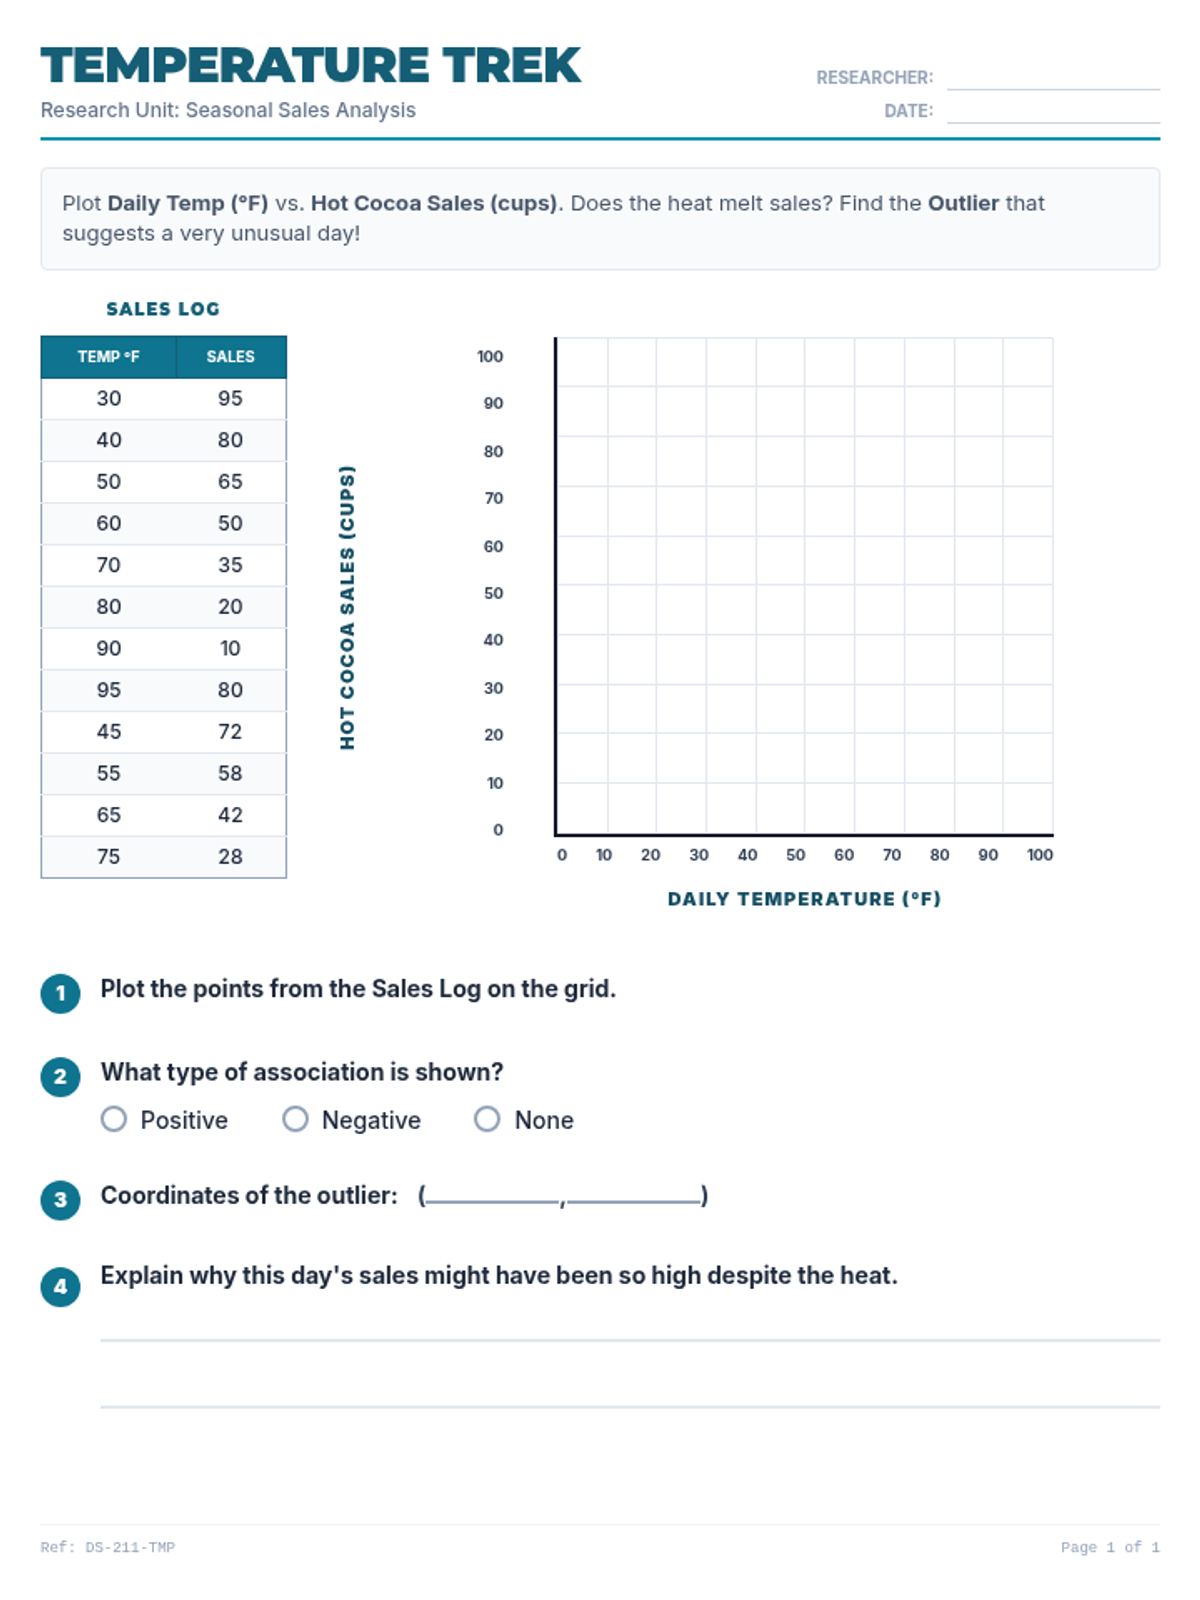
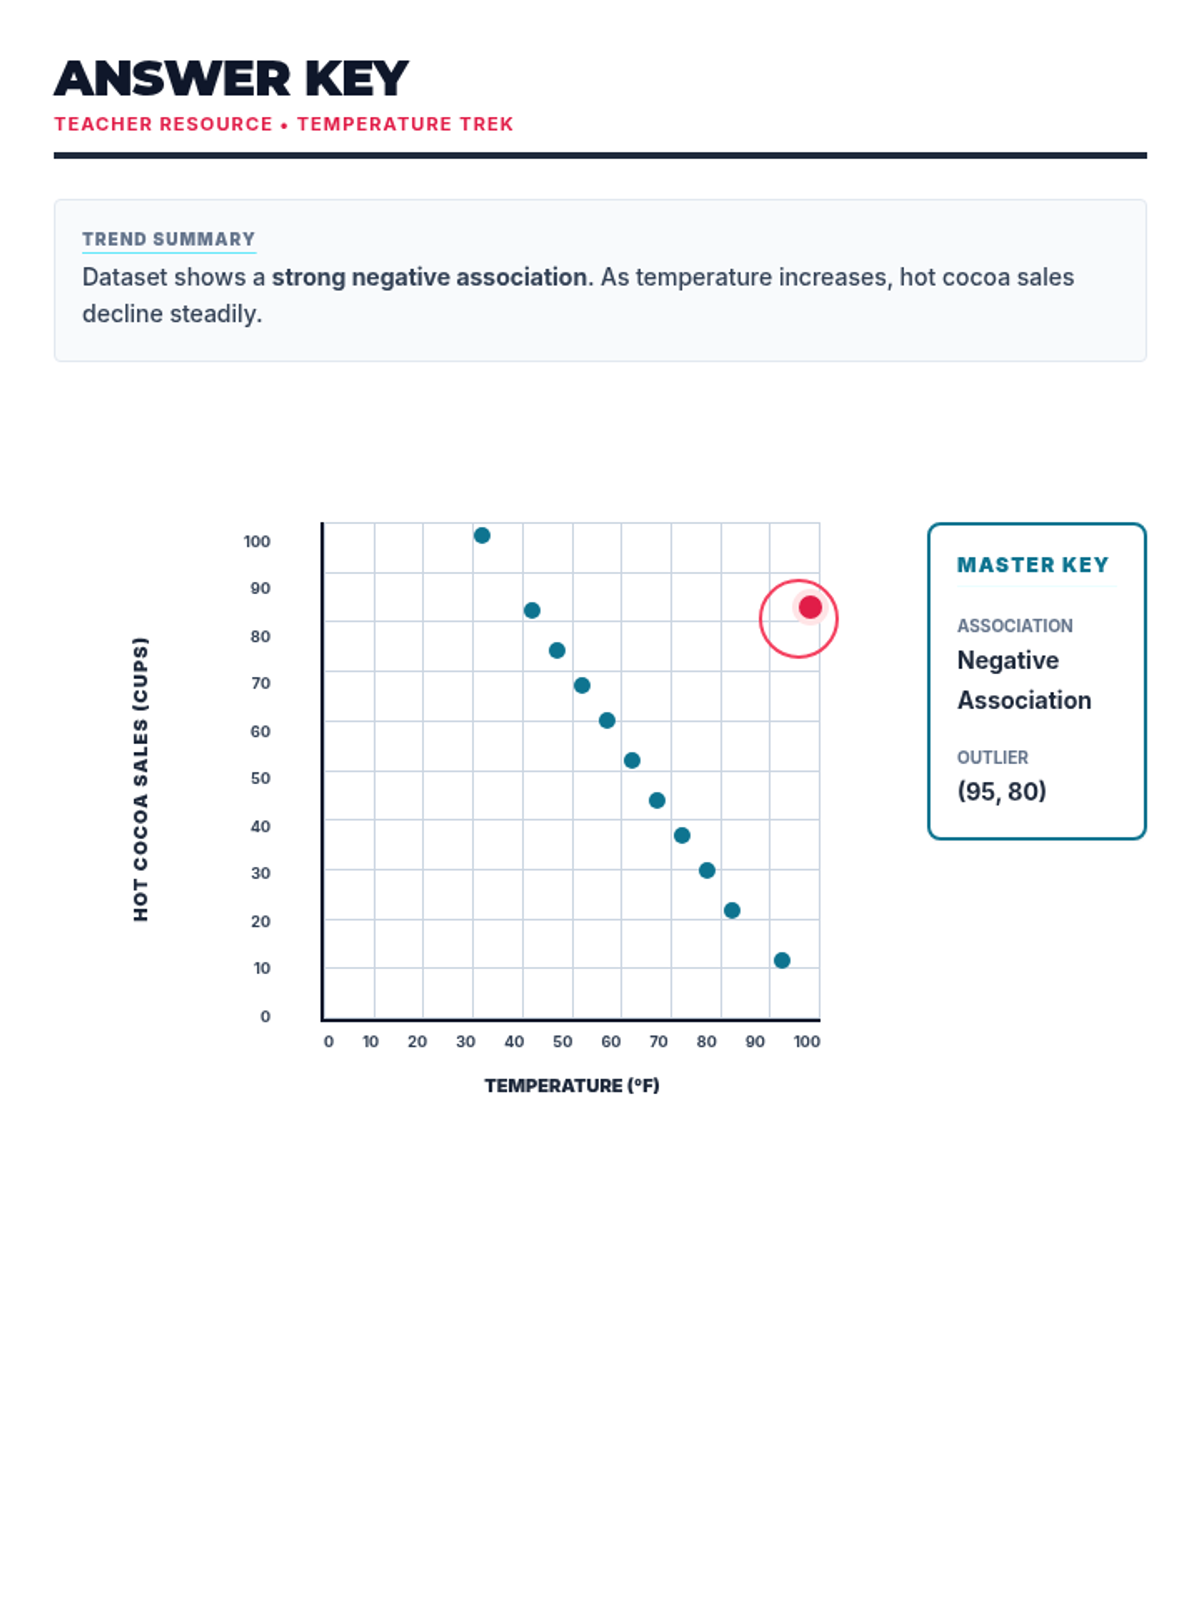
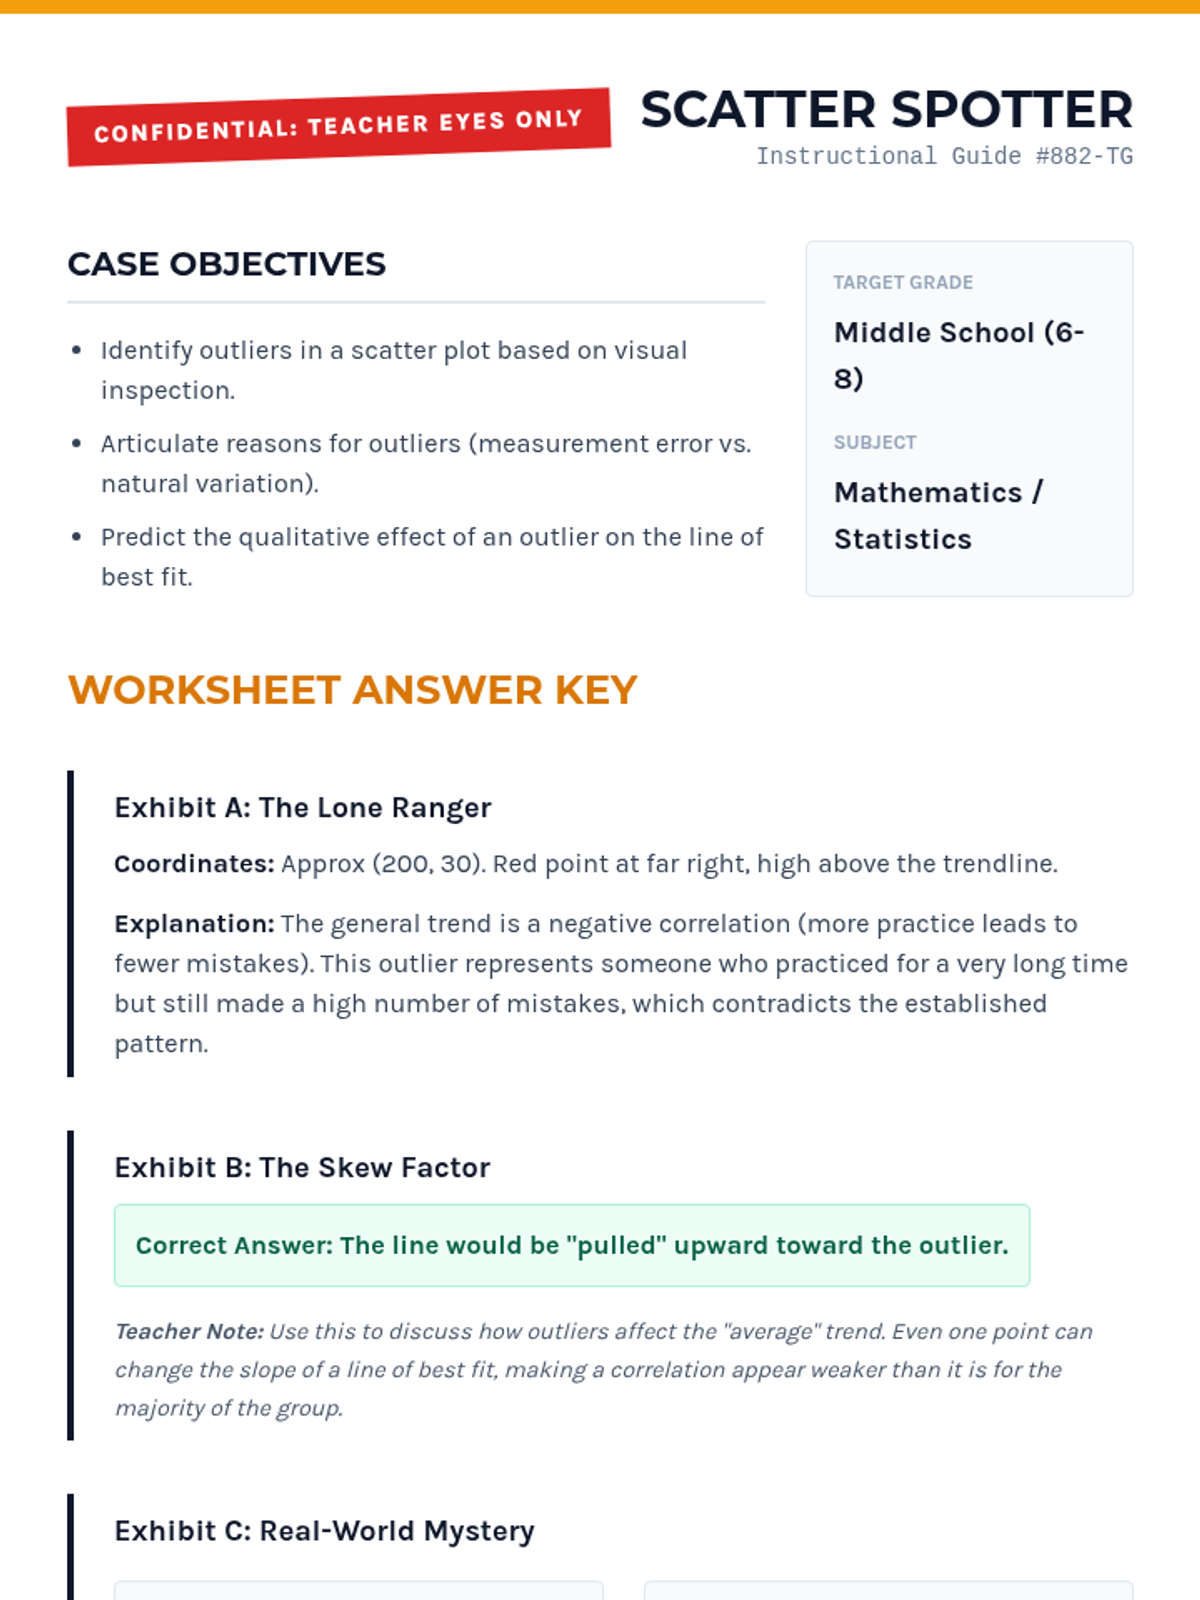
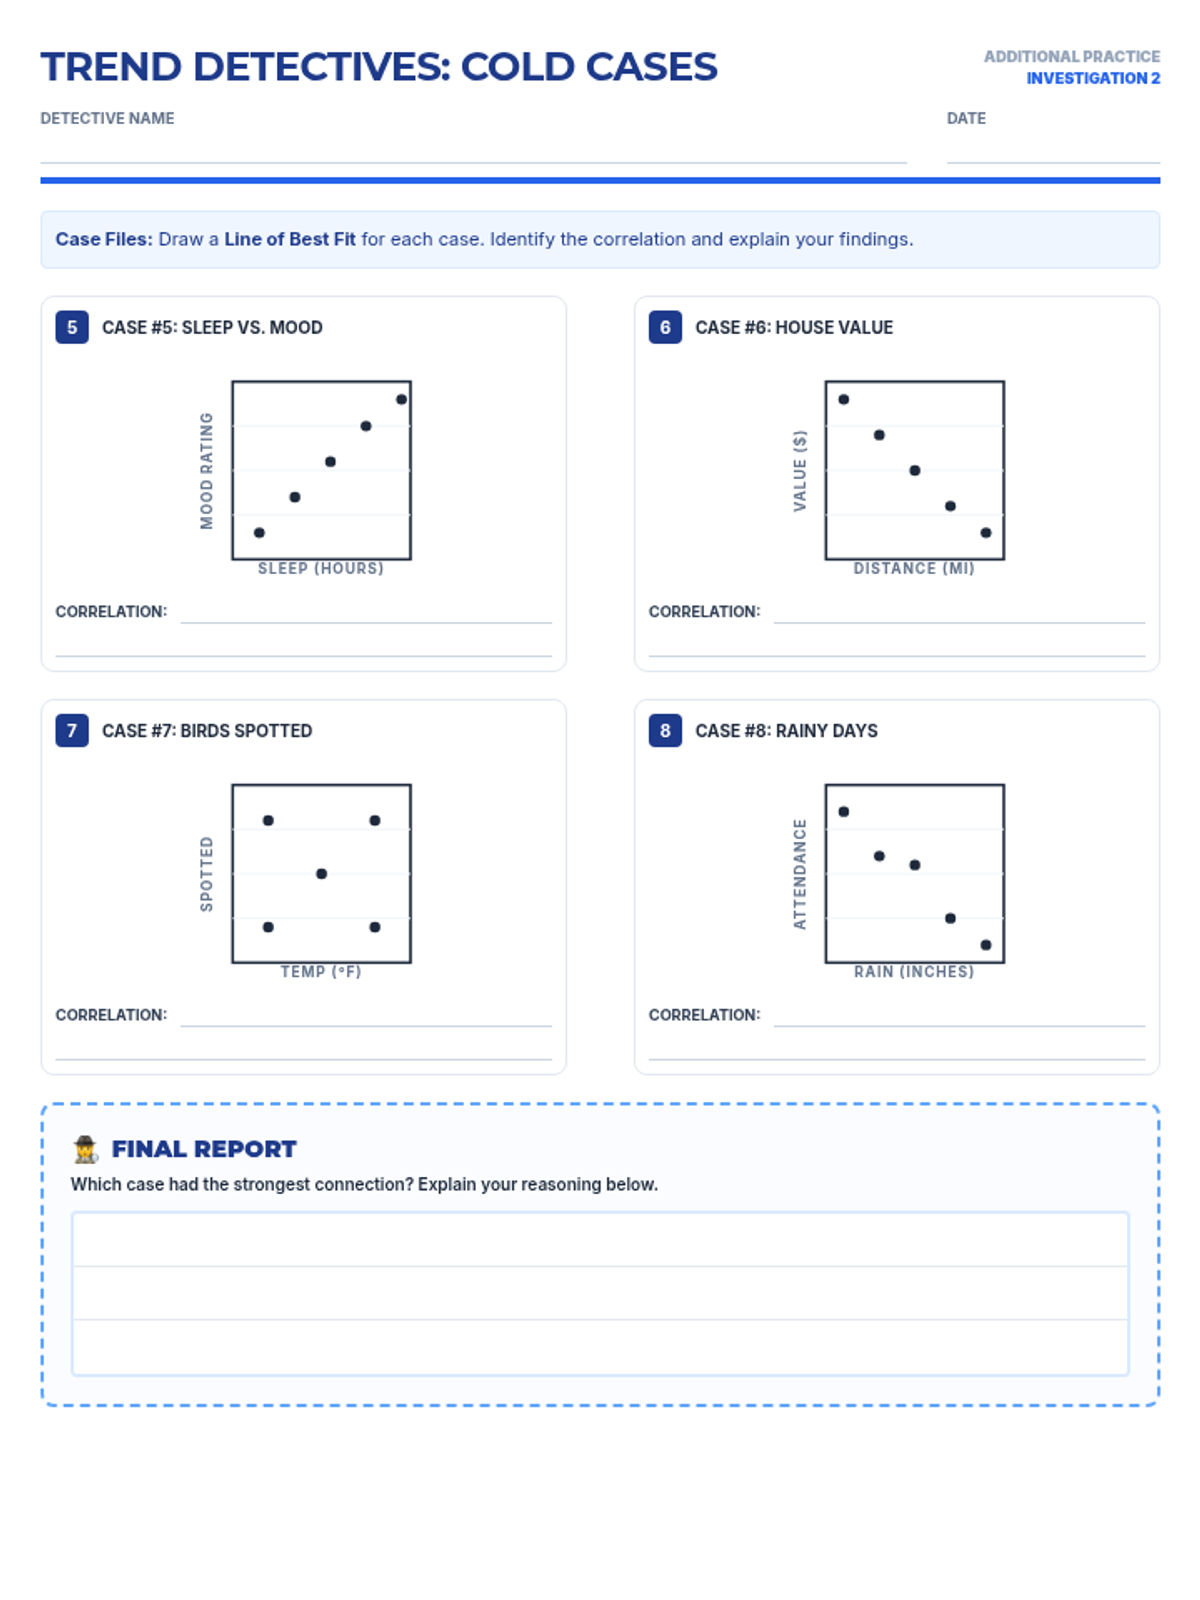
Students learn to plot bivariate data, identify trends, and spot outliers using a real-world scenario of sleep and mood.
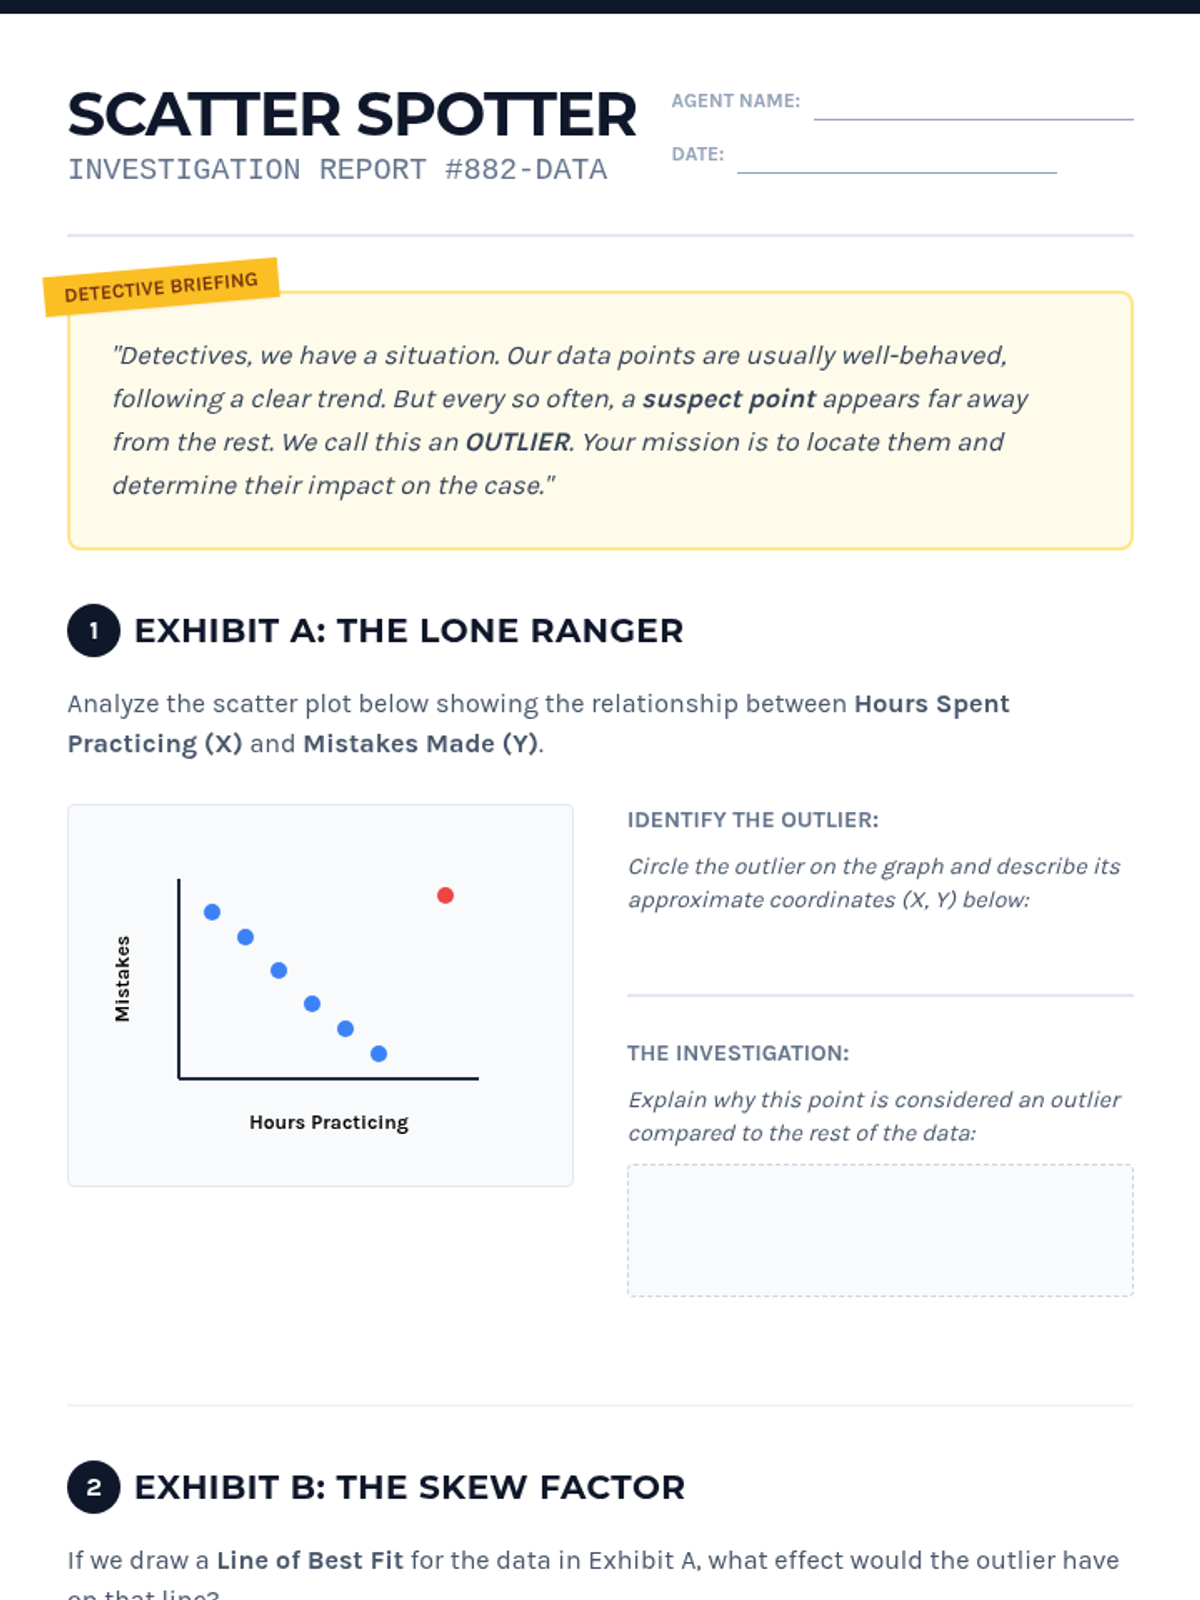
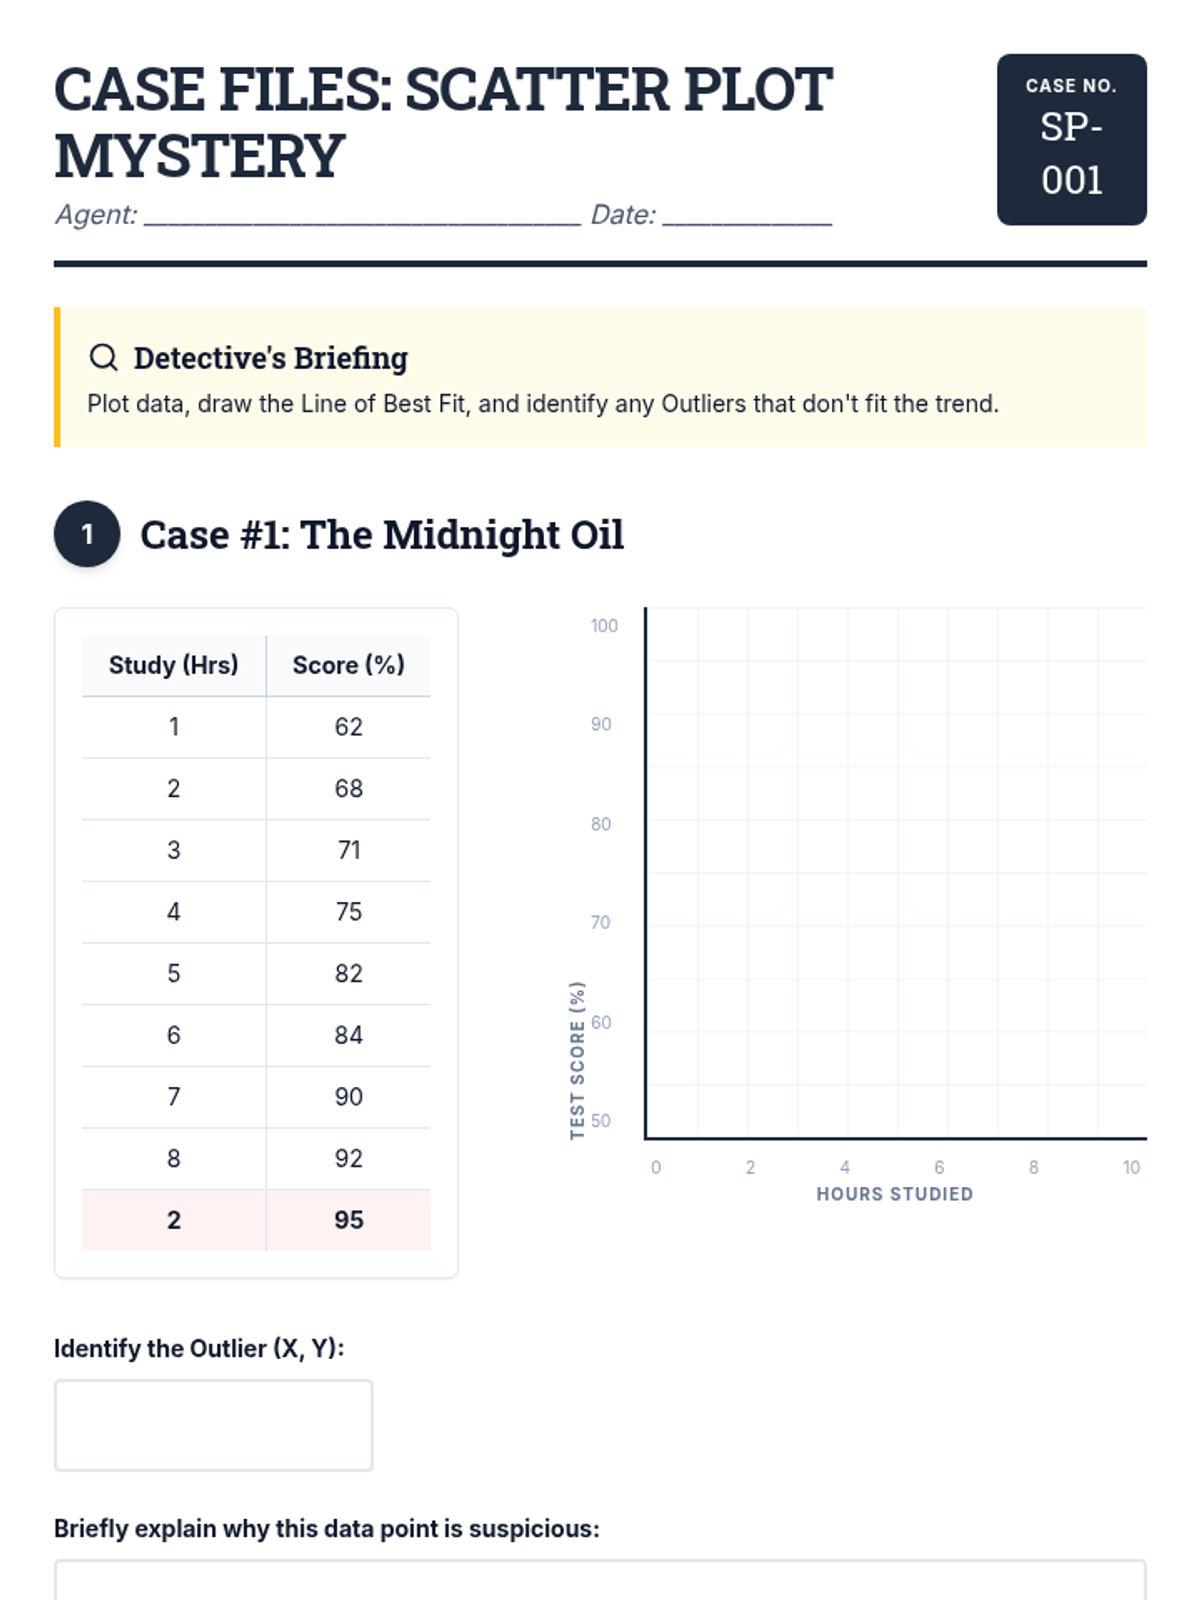
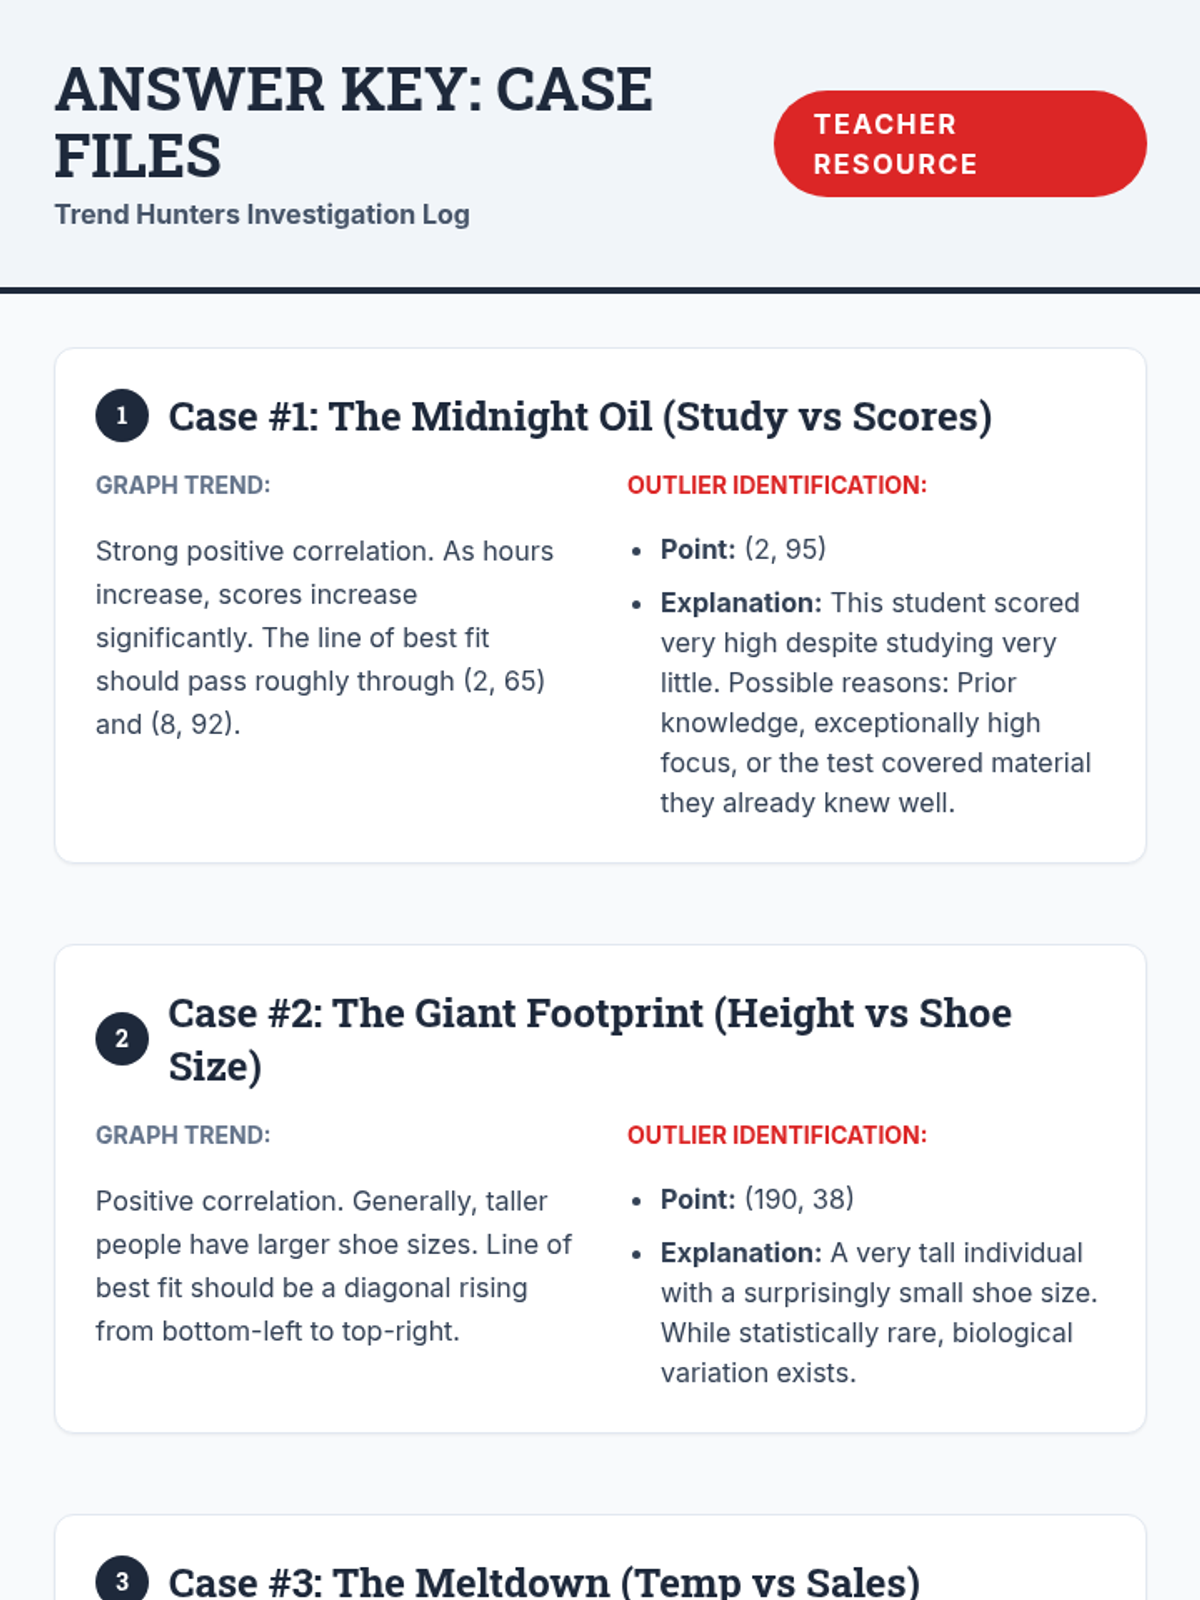
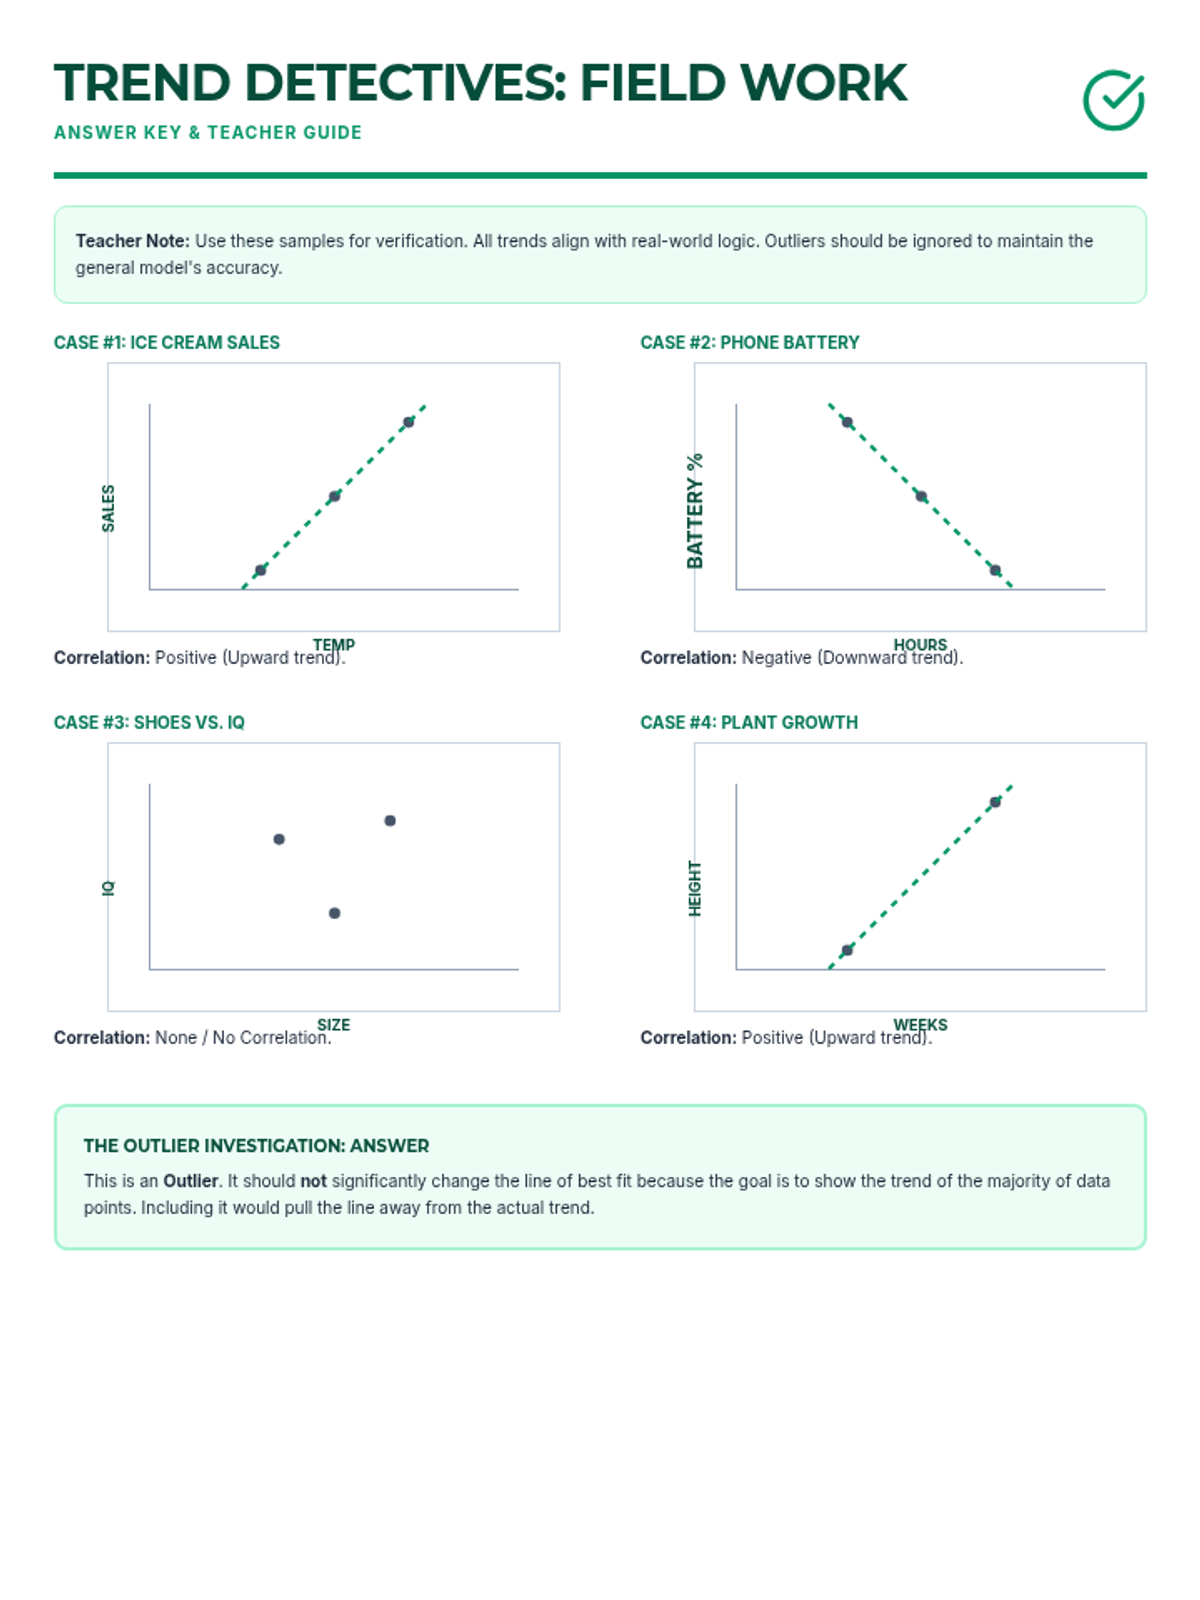
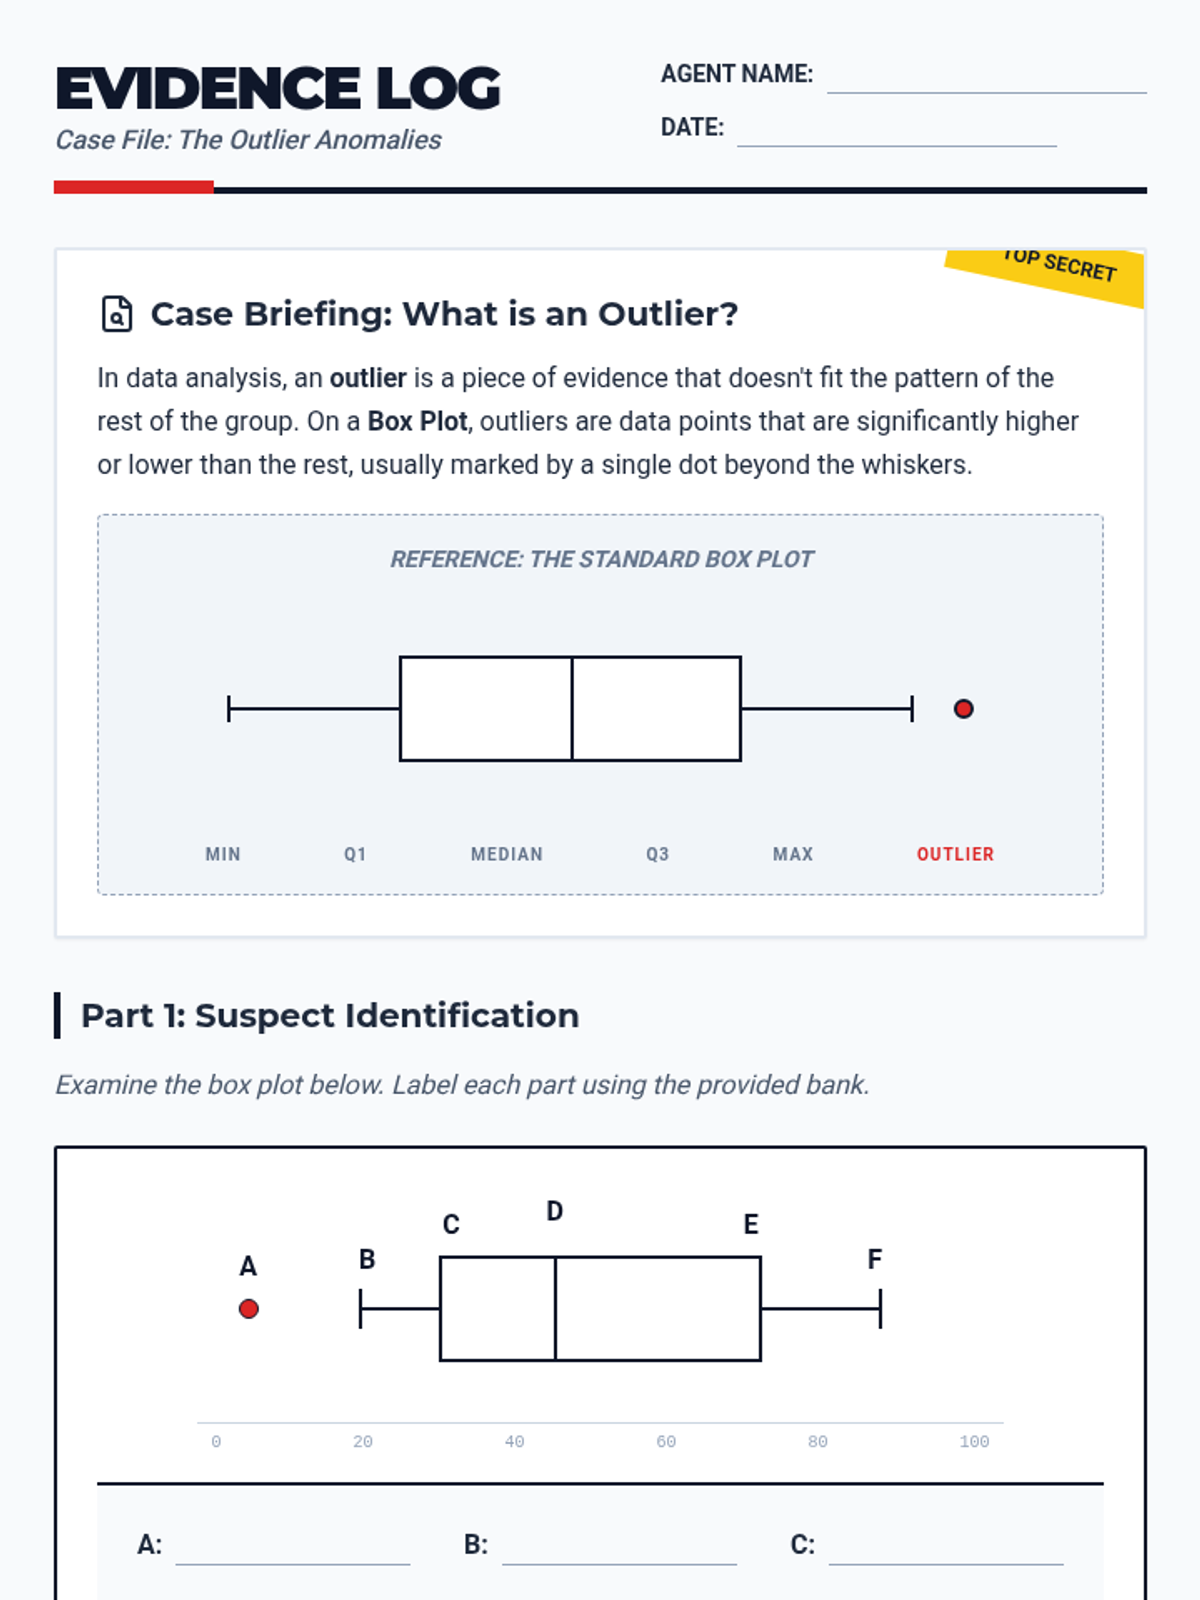
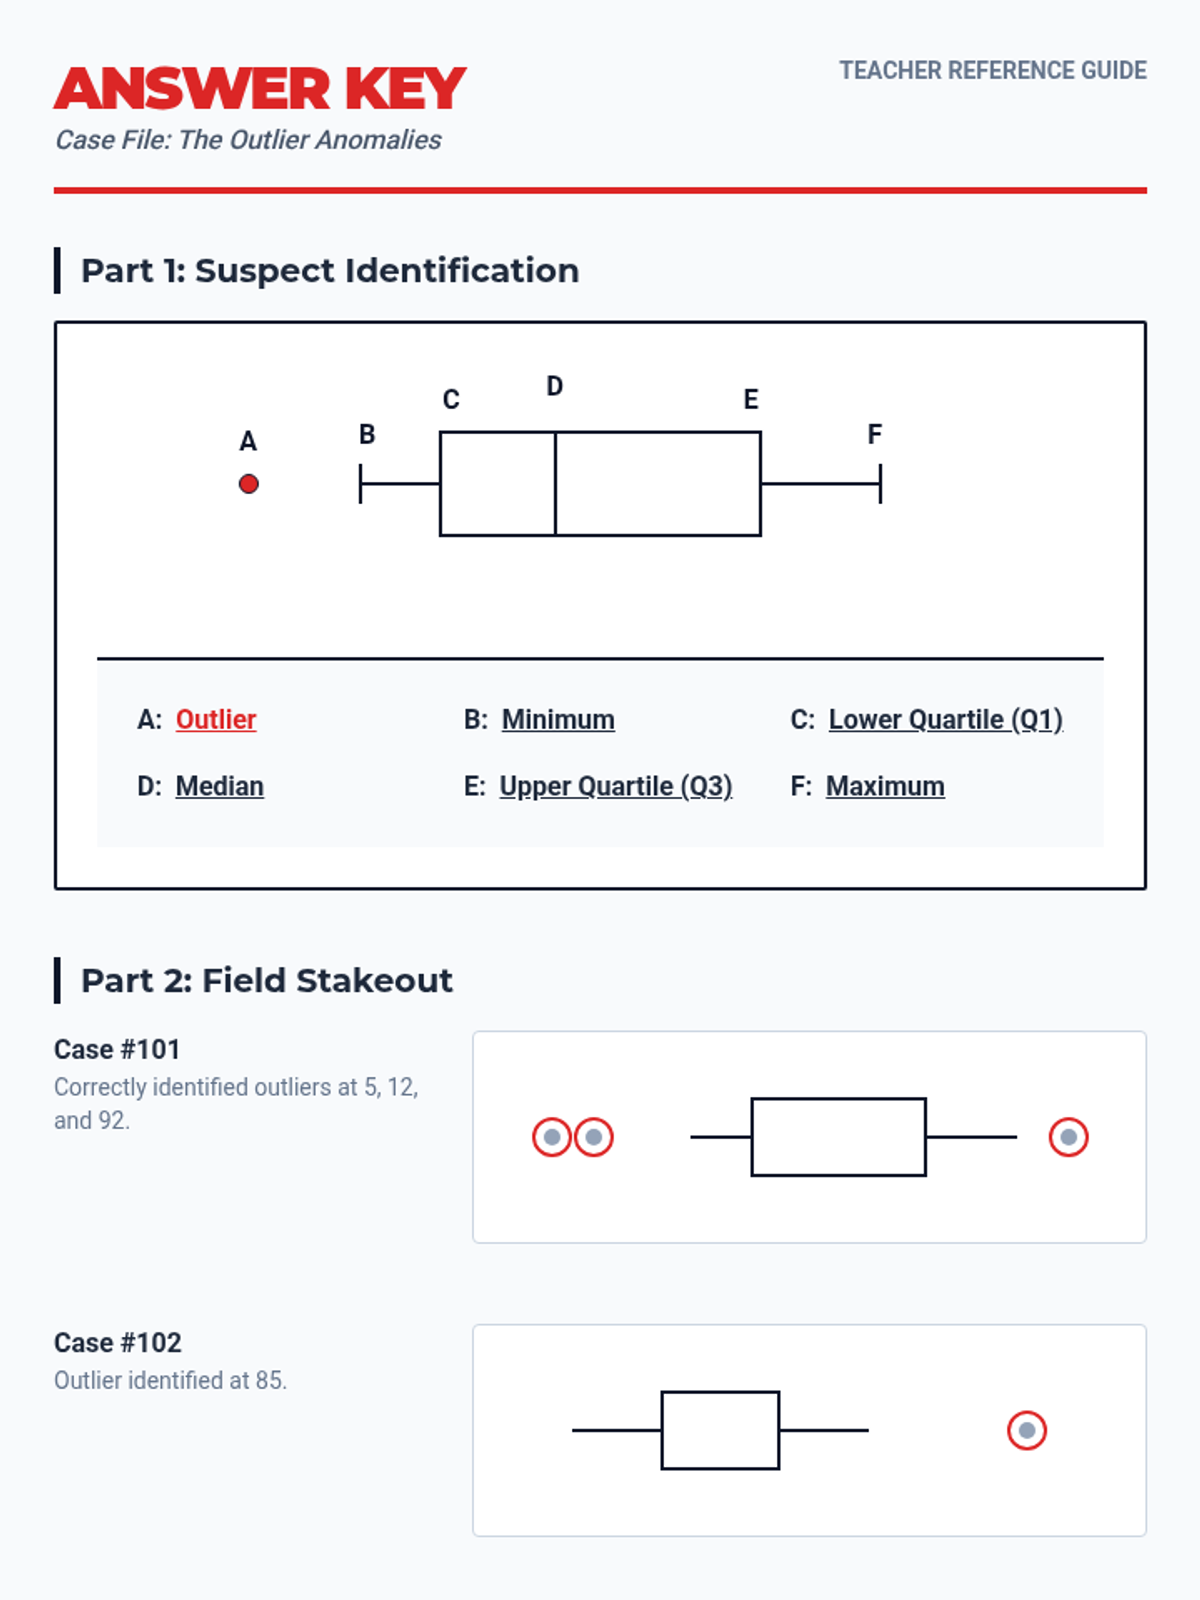
A comprehensive lesson on identifying and analyzing outliers within scatter plots using a 'Data Detective' theme. Students will learn to spot anomalous data points and understand their impact on trends.
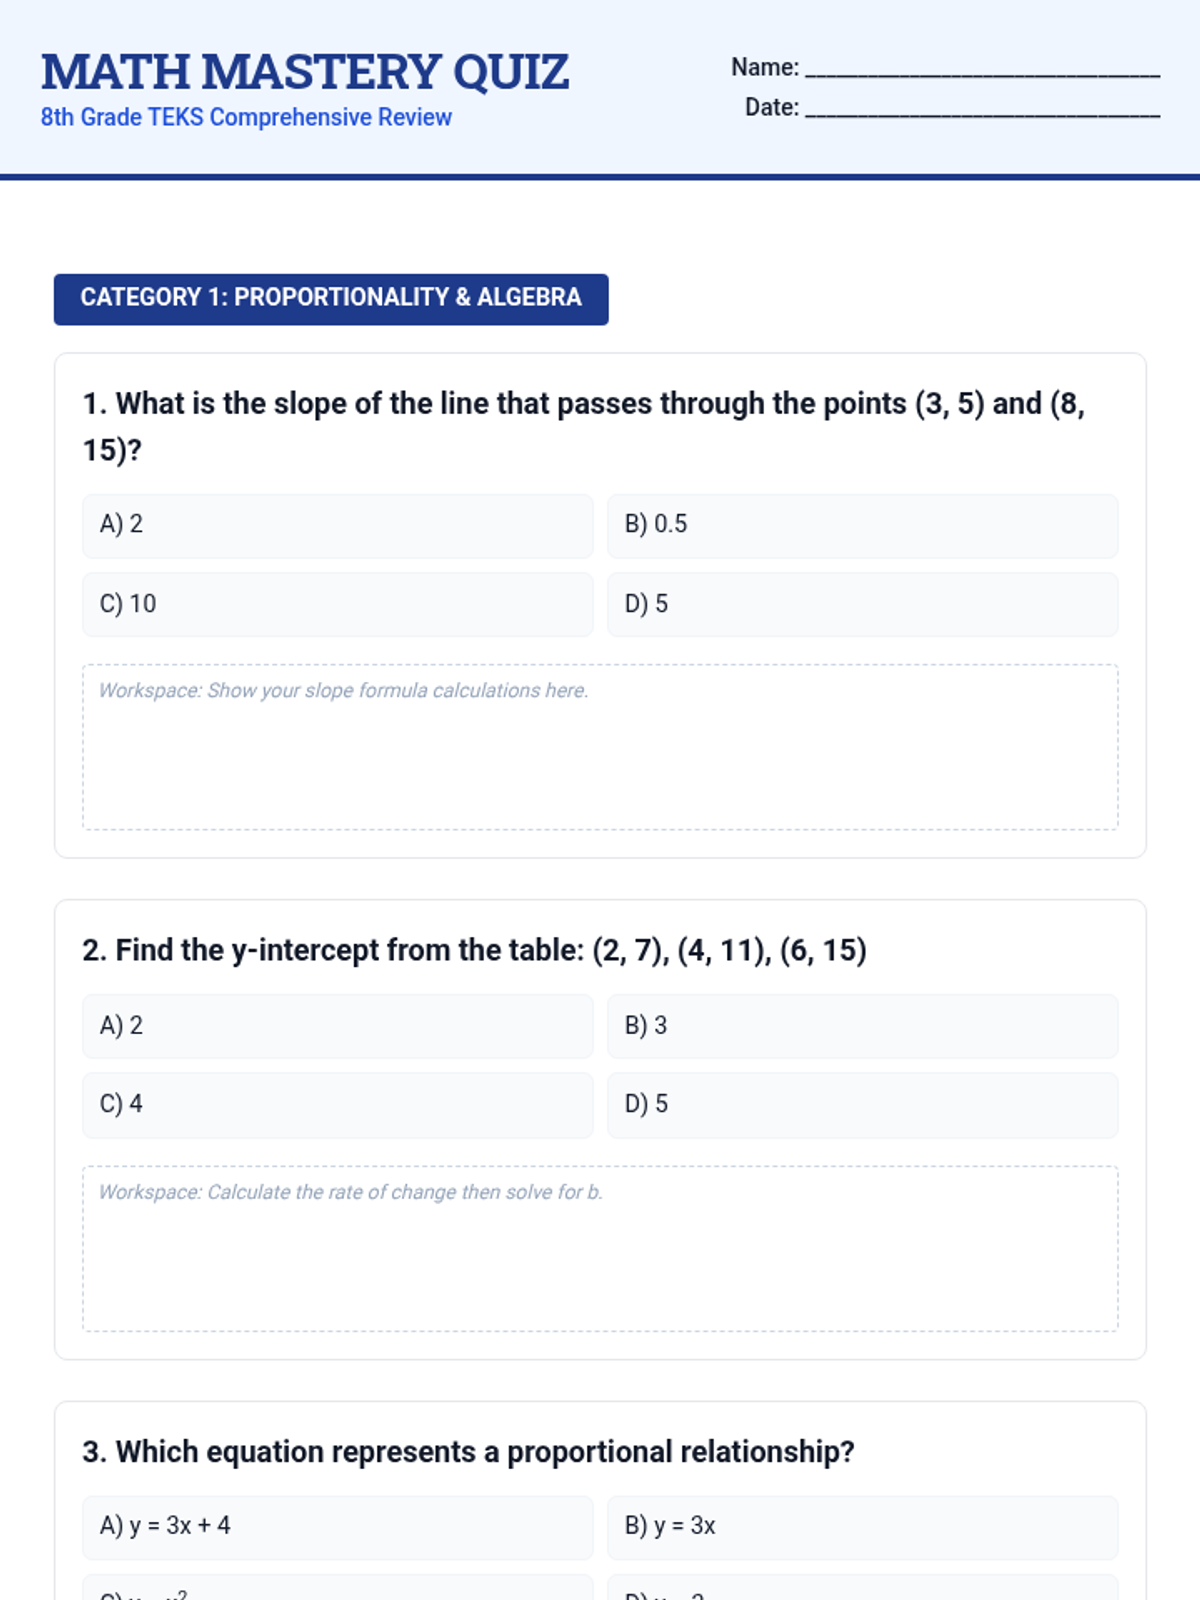
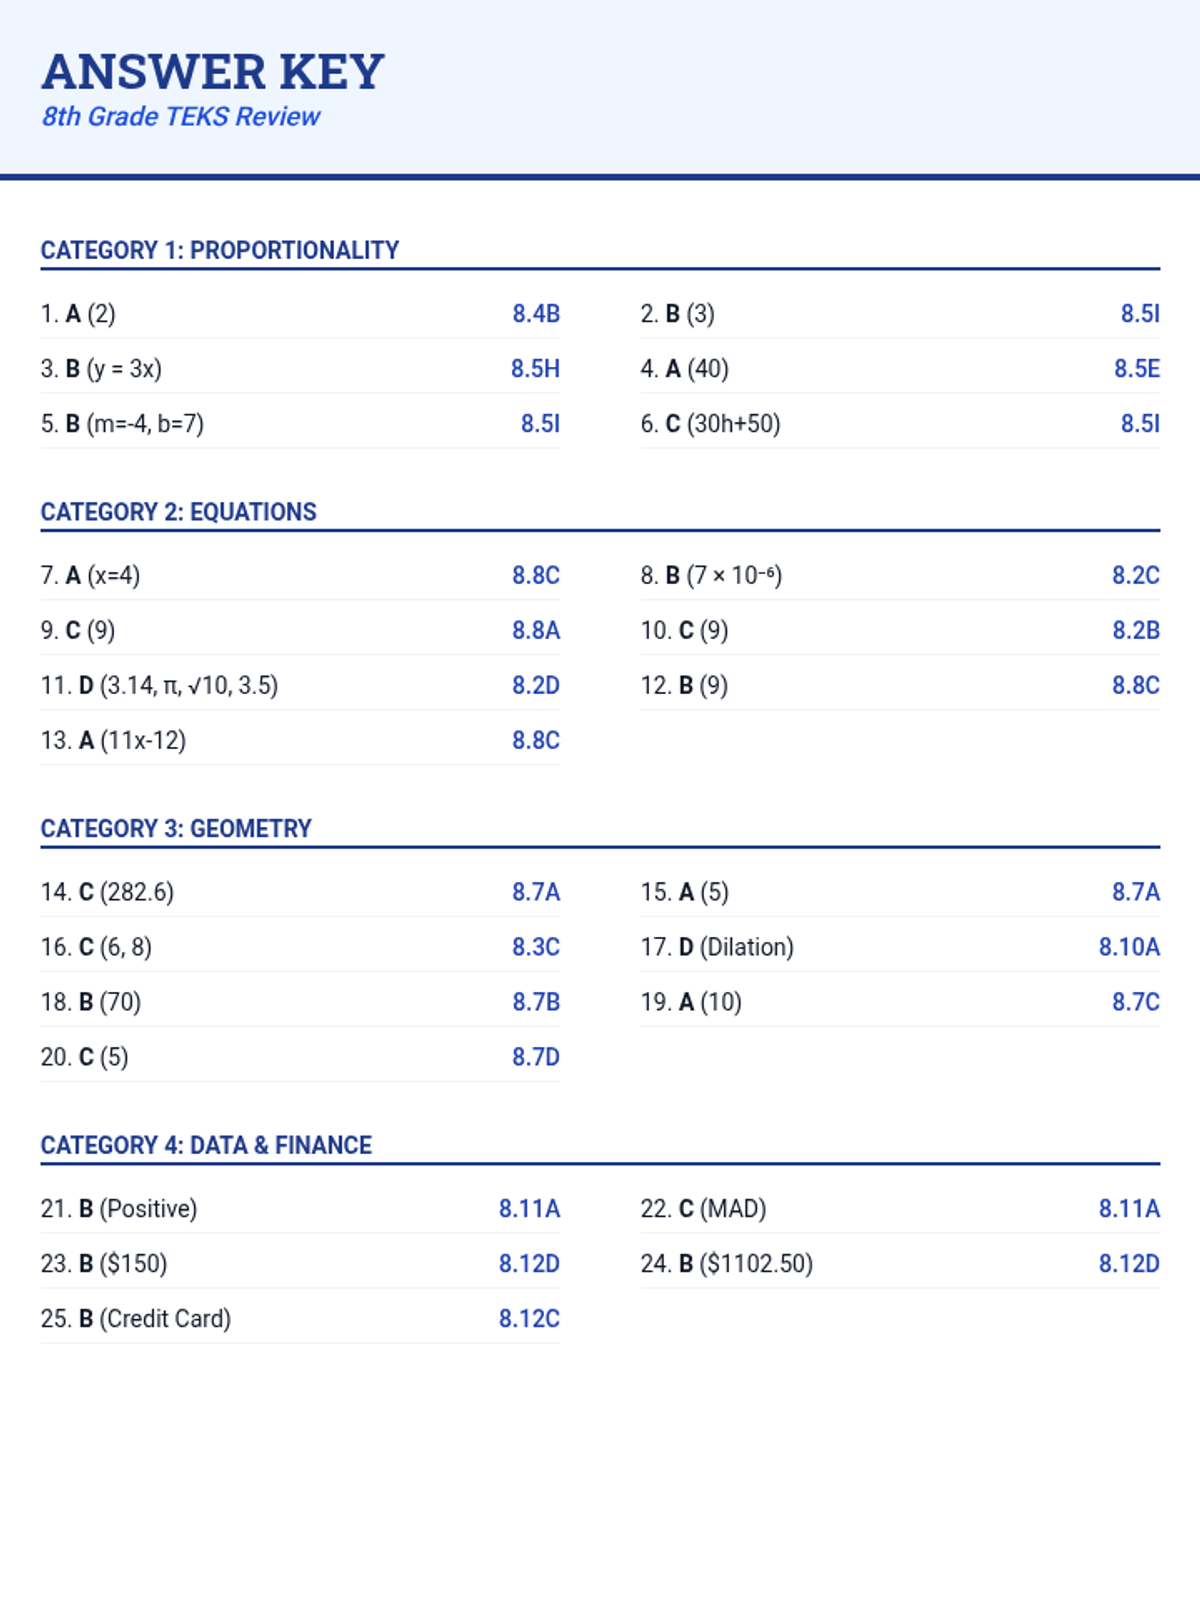
A comprehensive 8th-grade TEKS mathematics review focusing on Proportionality, Algebra, Expressions, Equations, Geometry, Measurement, and Data Analysis. This lesson includes a diagnostic quiz and a supporting presentation for classroom review.
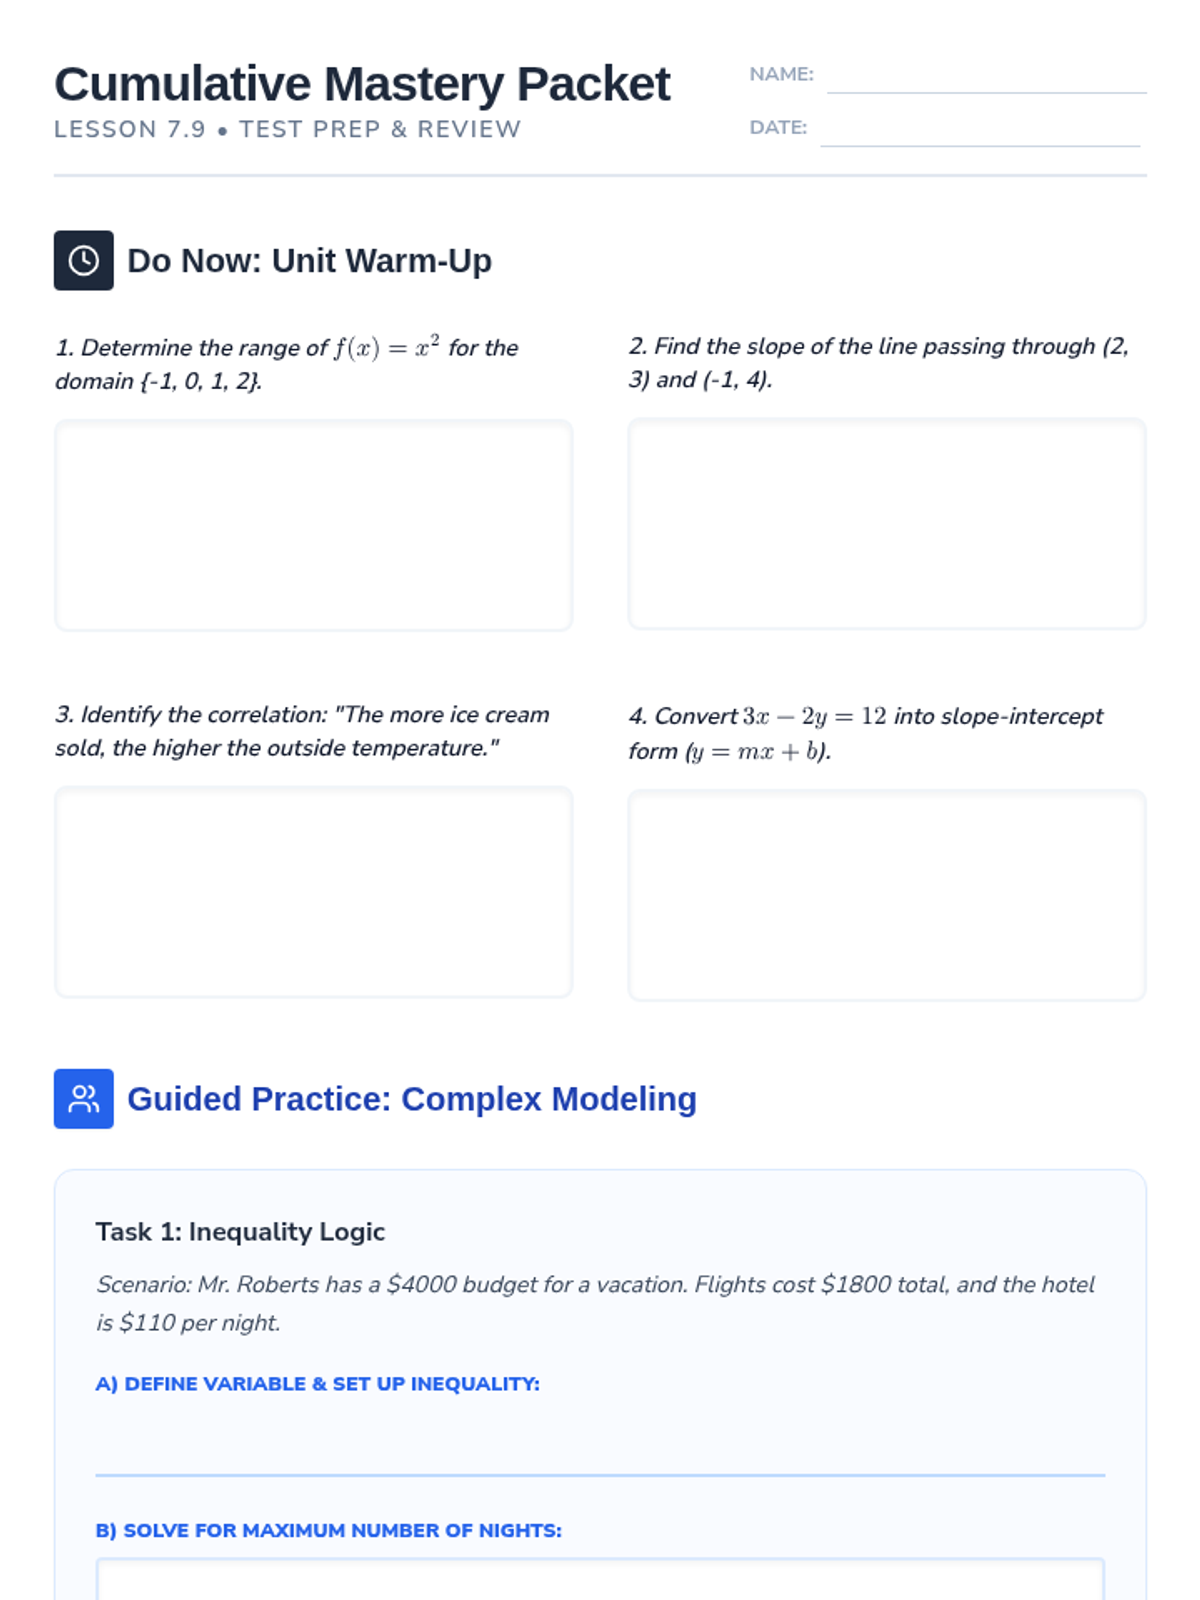
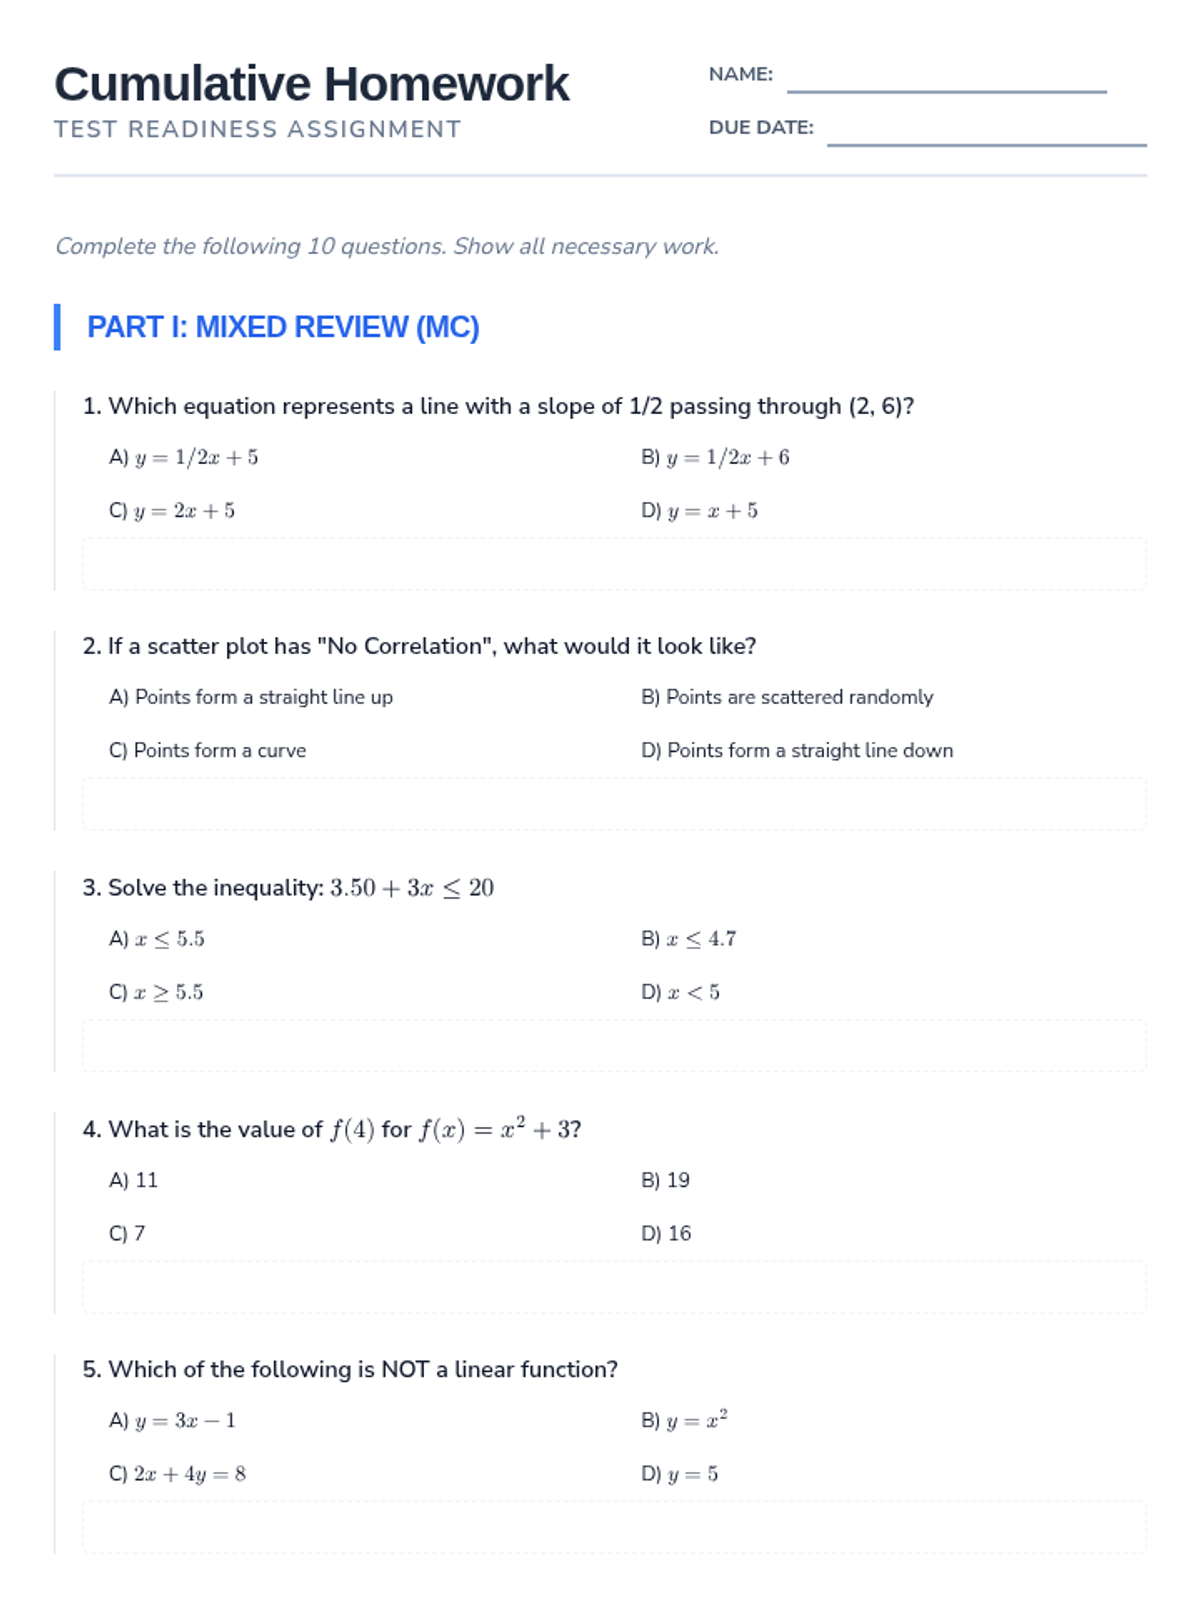
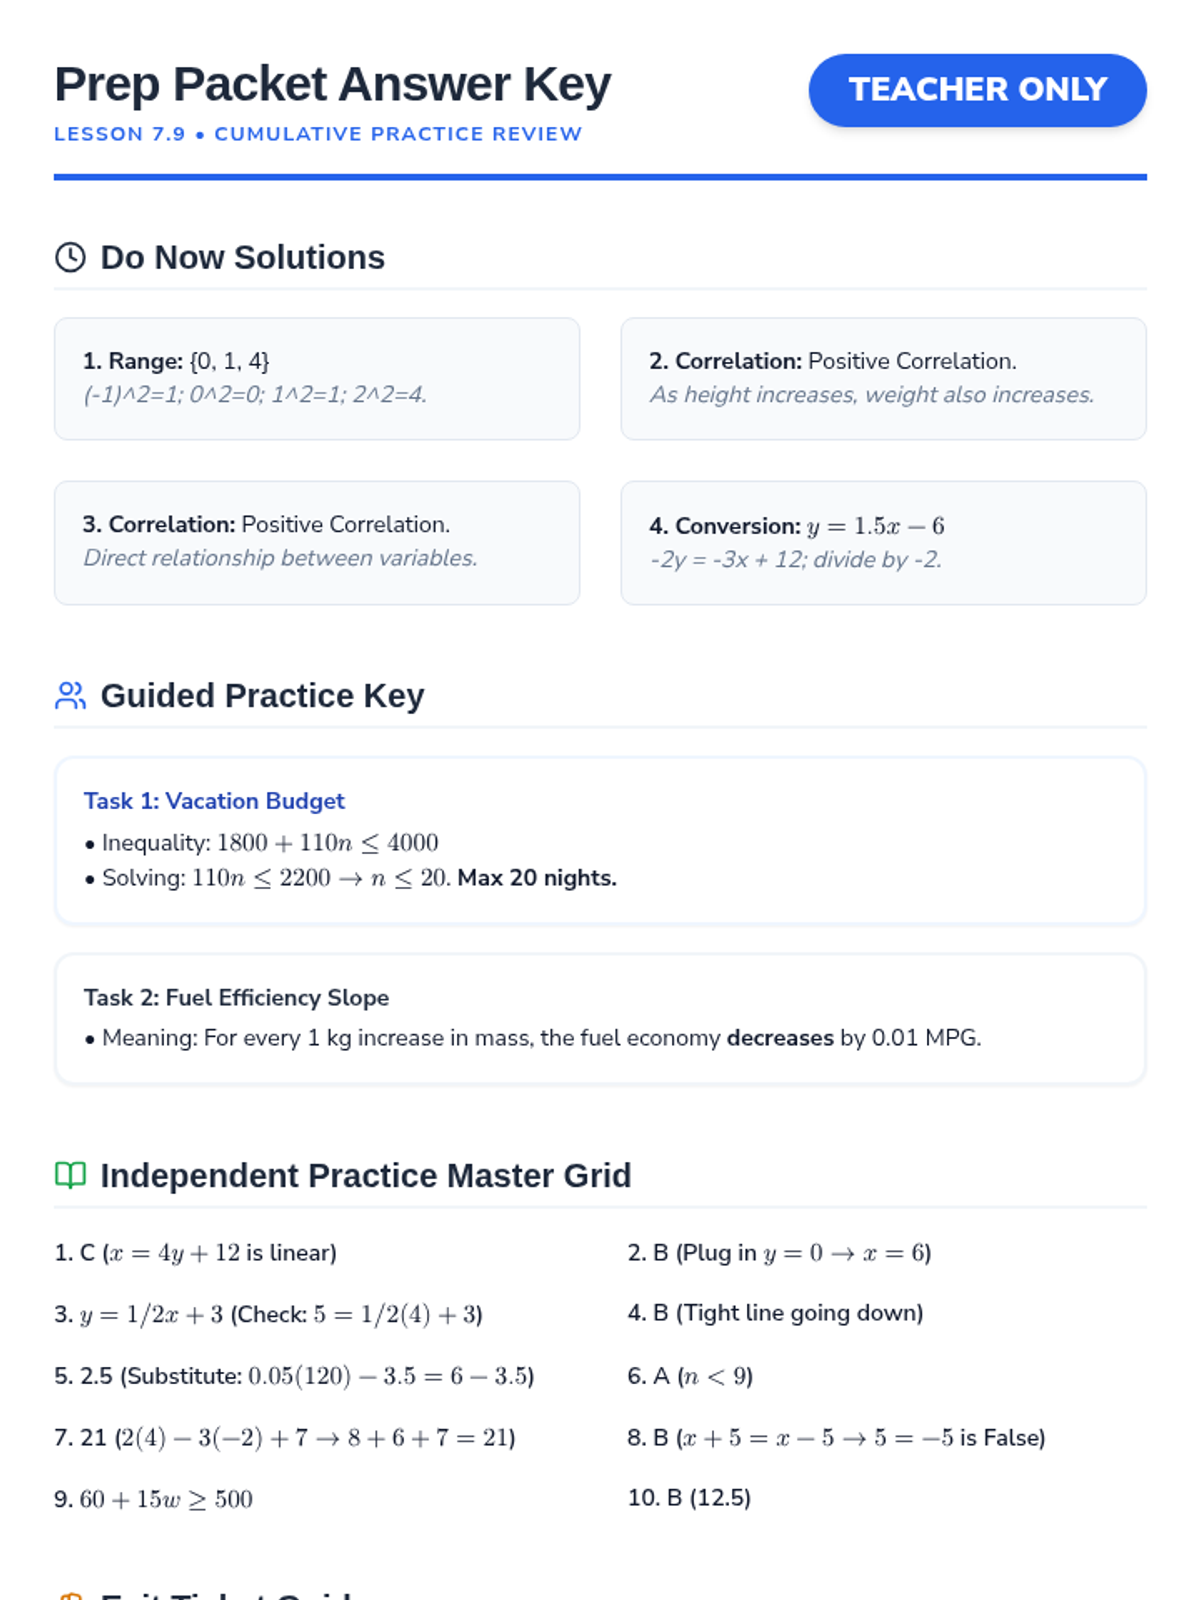
This prep lesson bridges previously mastered linear equation concepts with newer topics like scatter plots, correlation, and linear inequalities. Students will synthesize modeling techniques and algebraic conversions to prepare for the cumulative unit test.
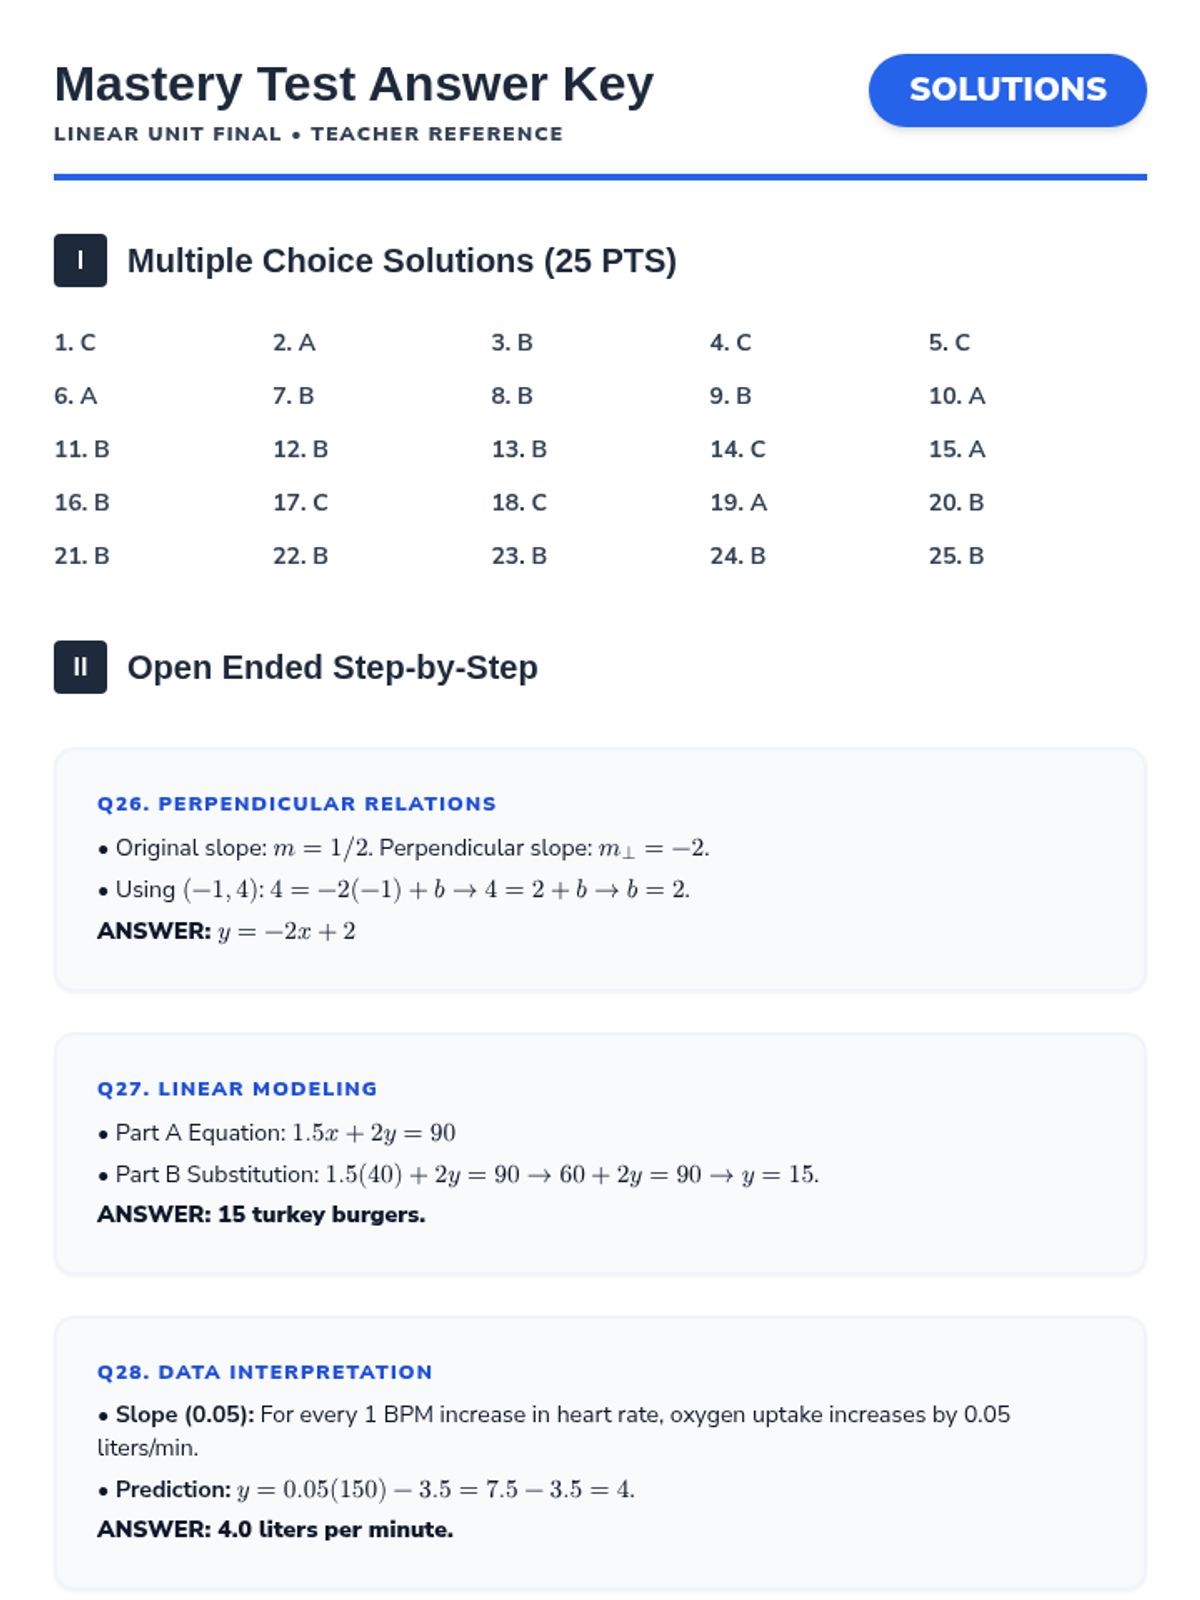
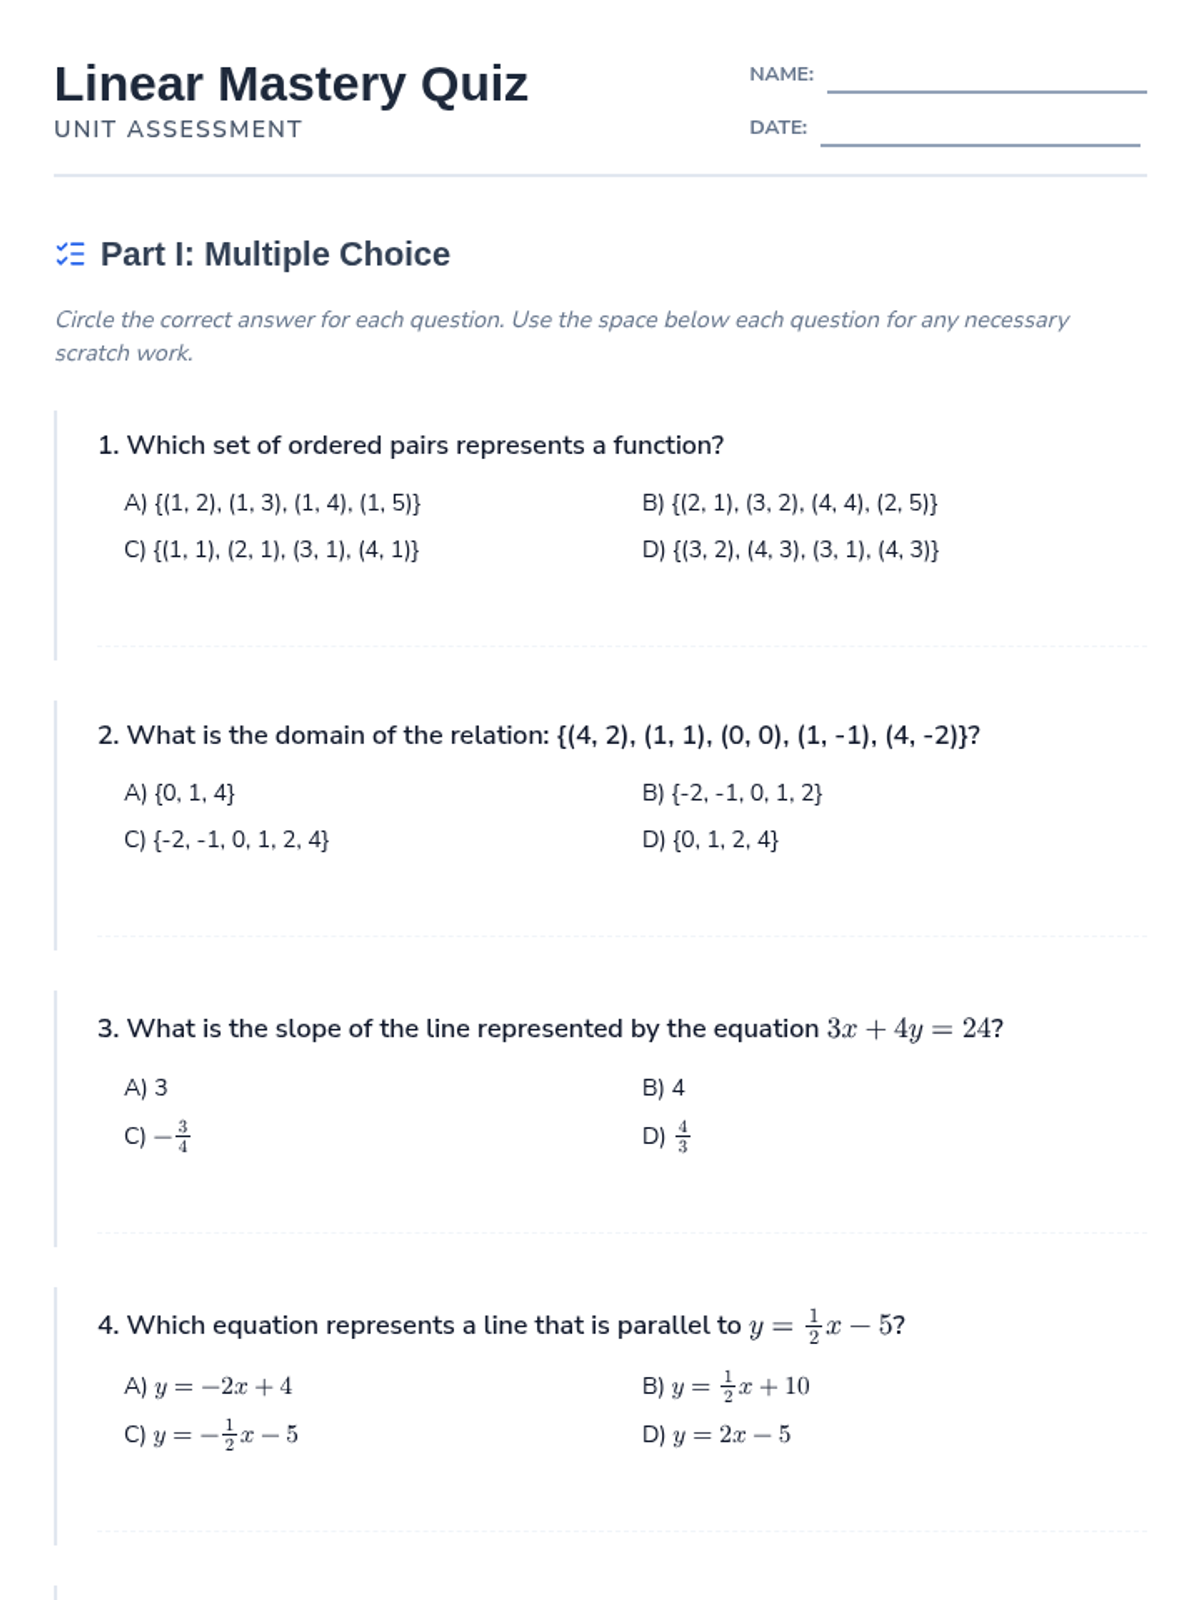
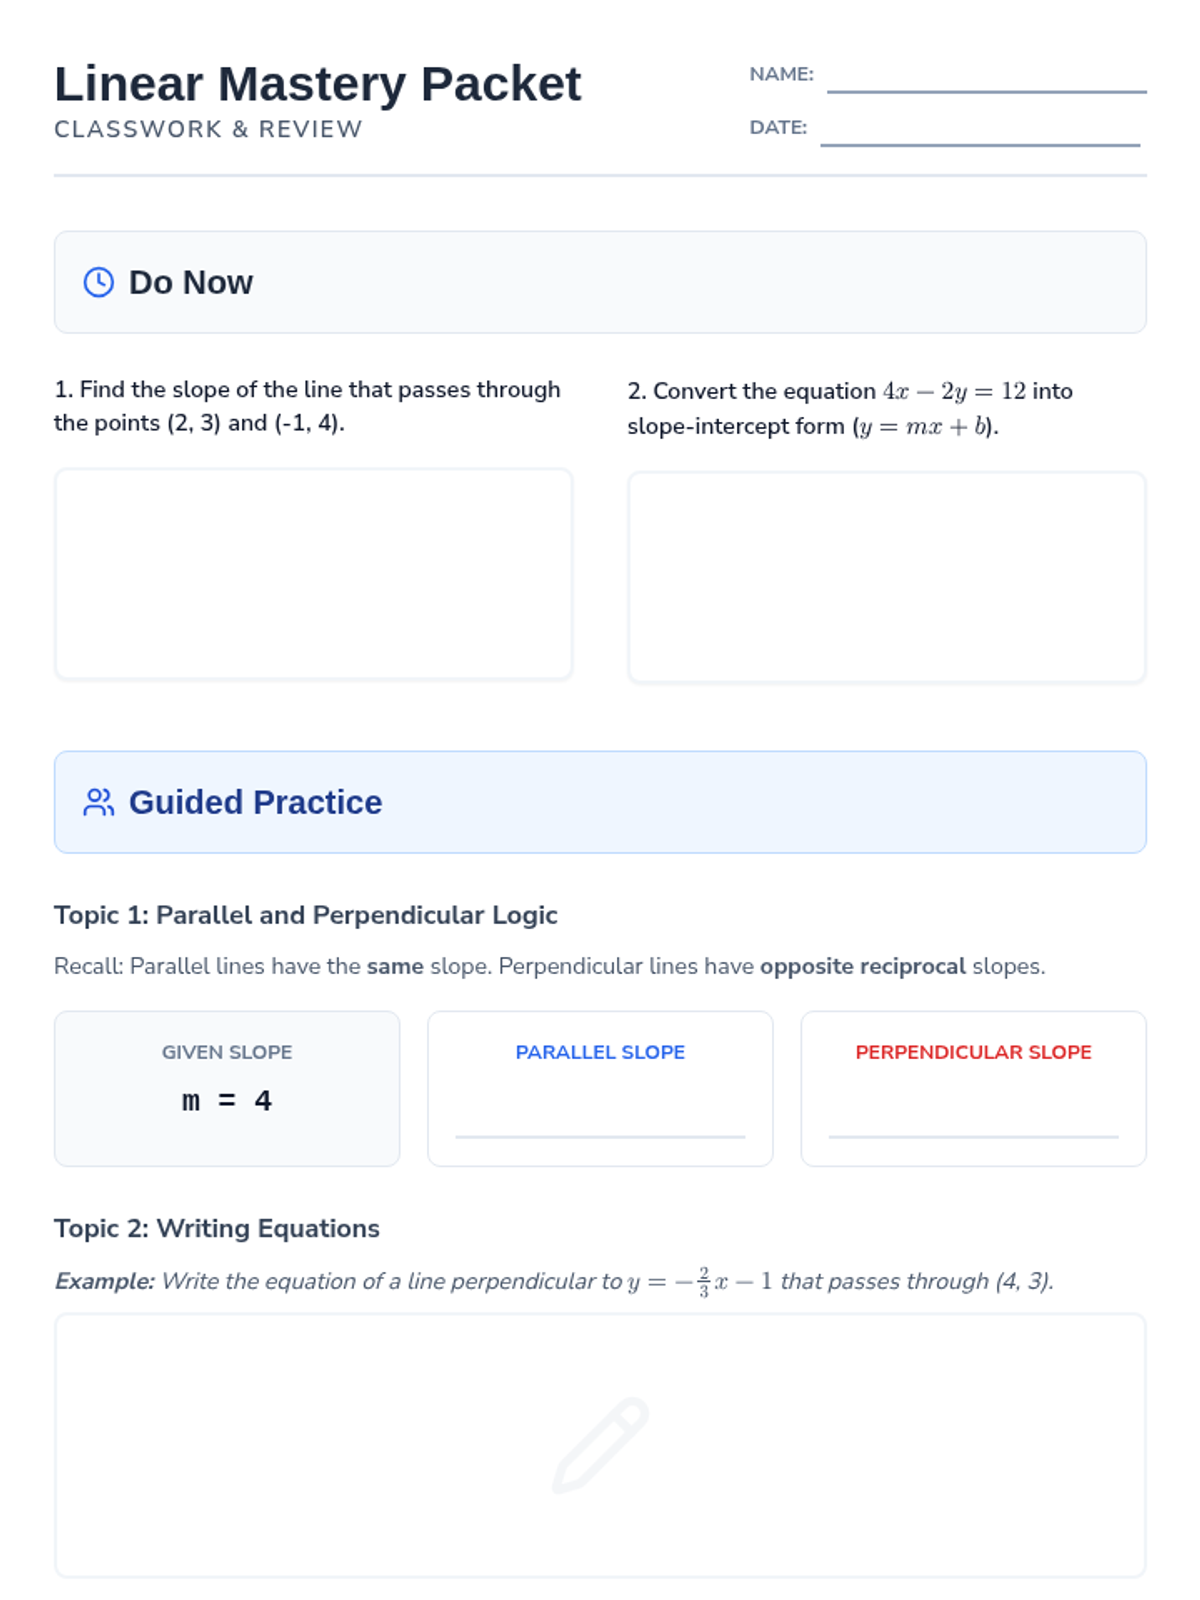
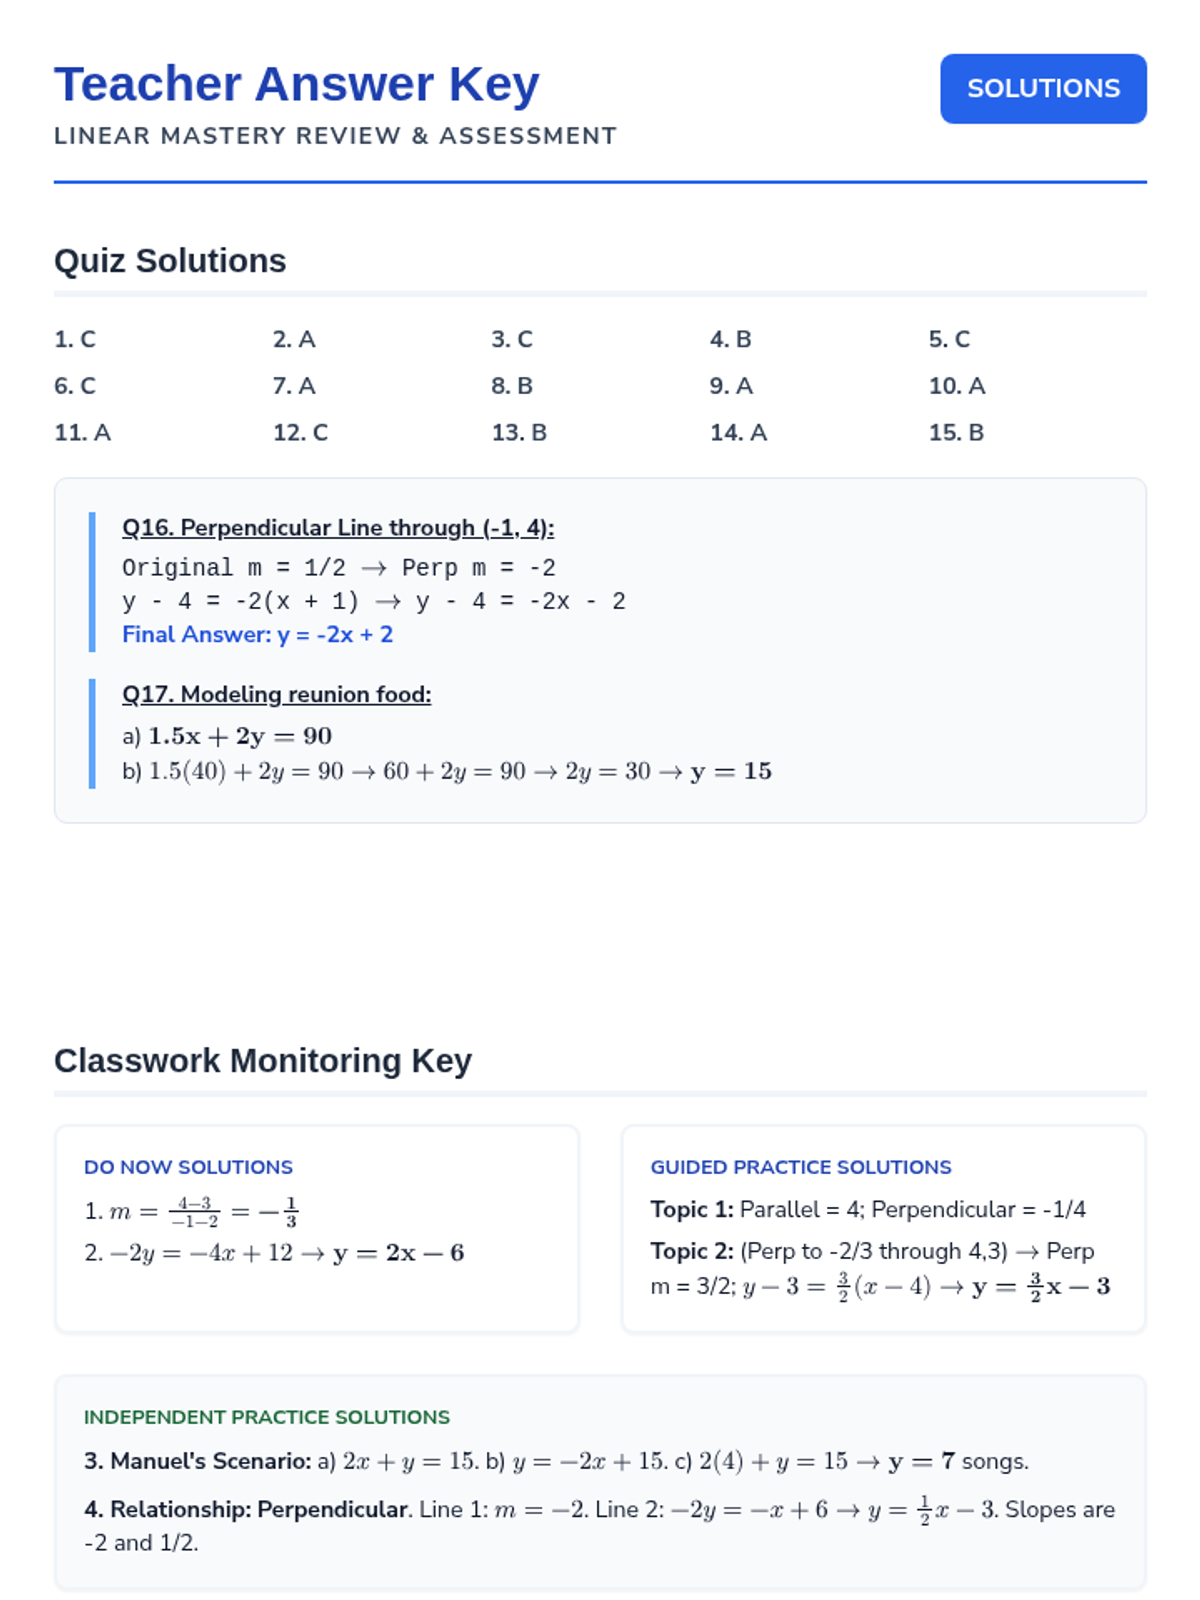
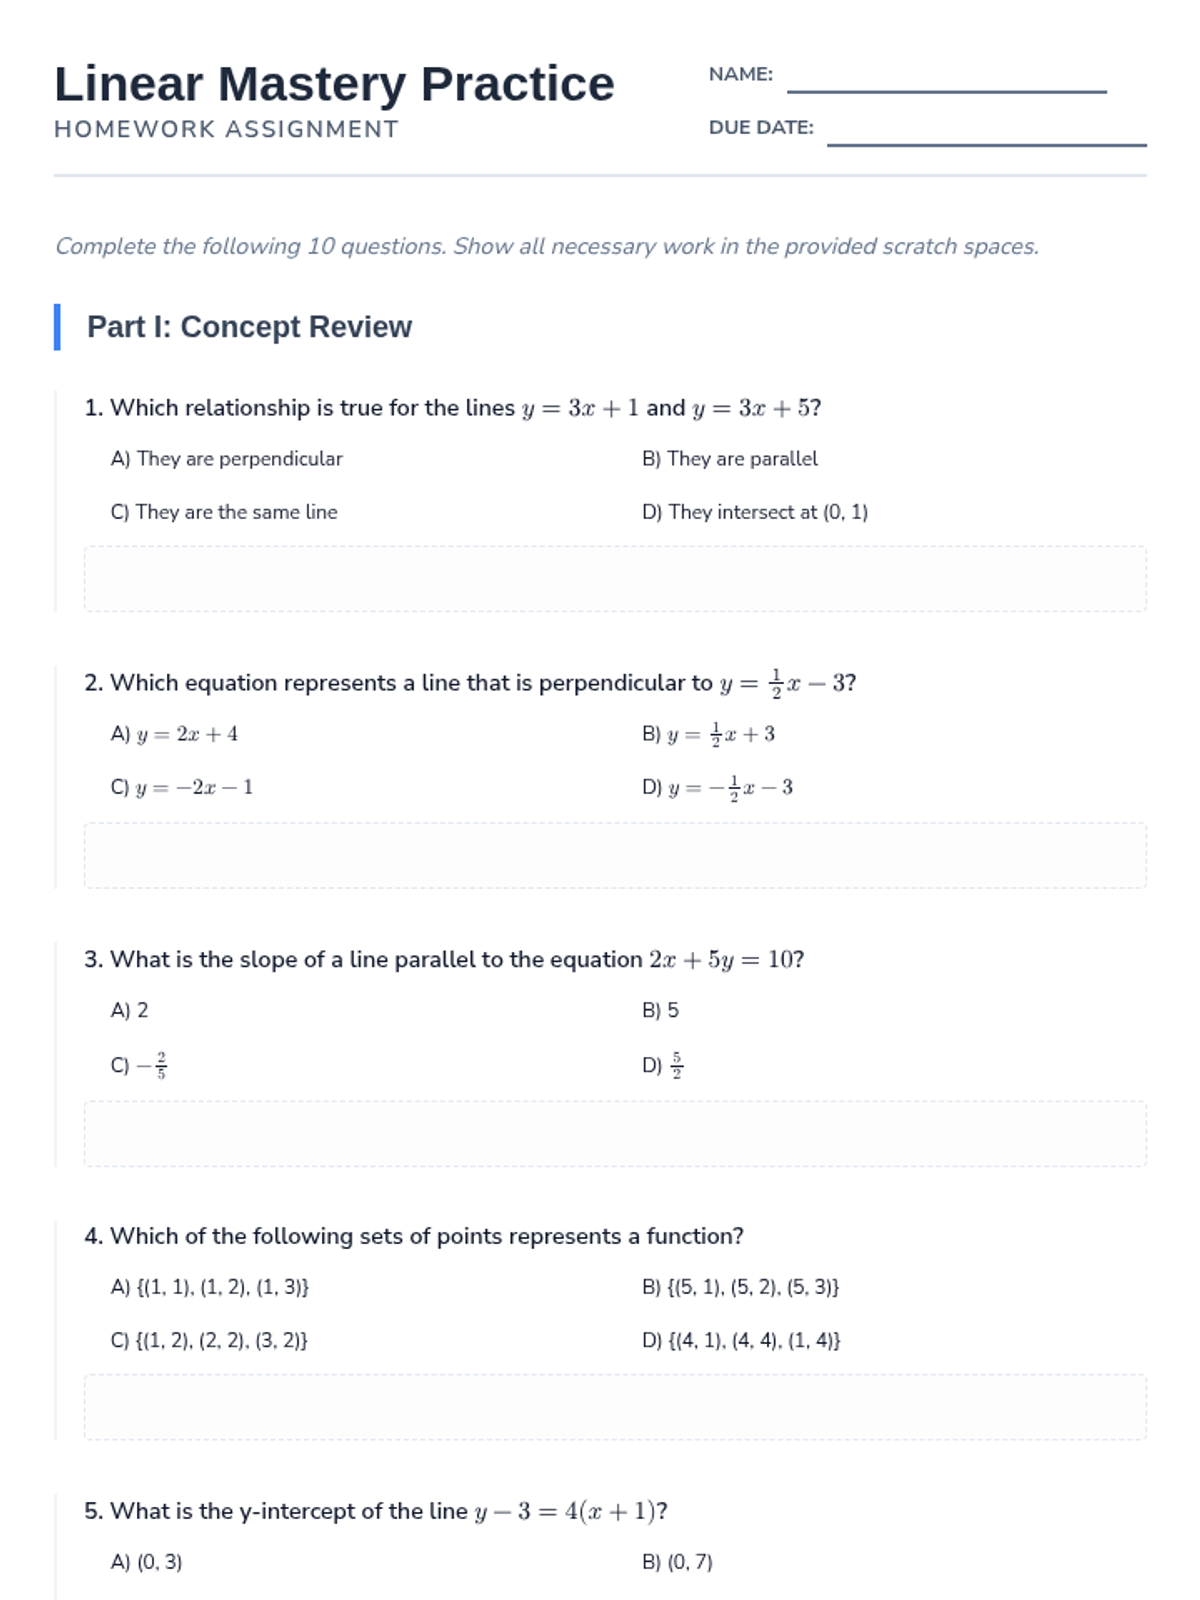
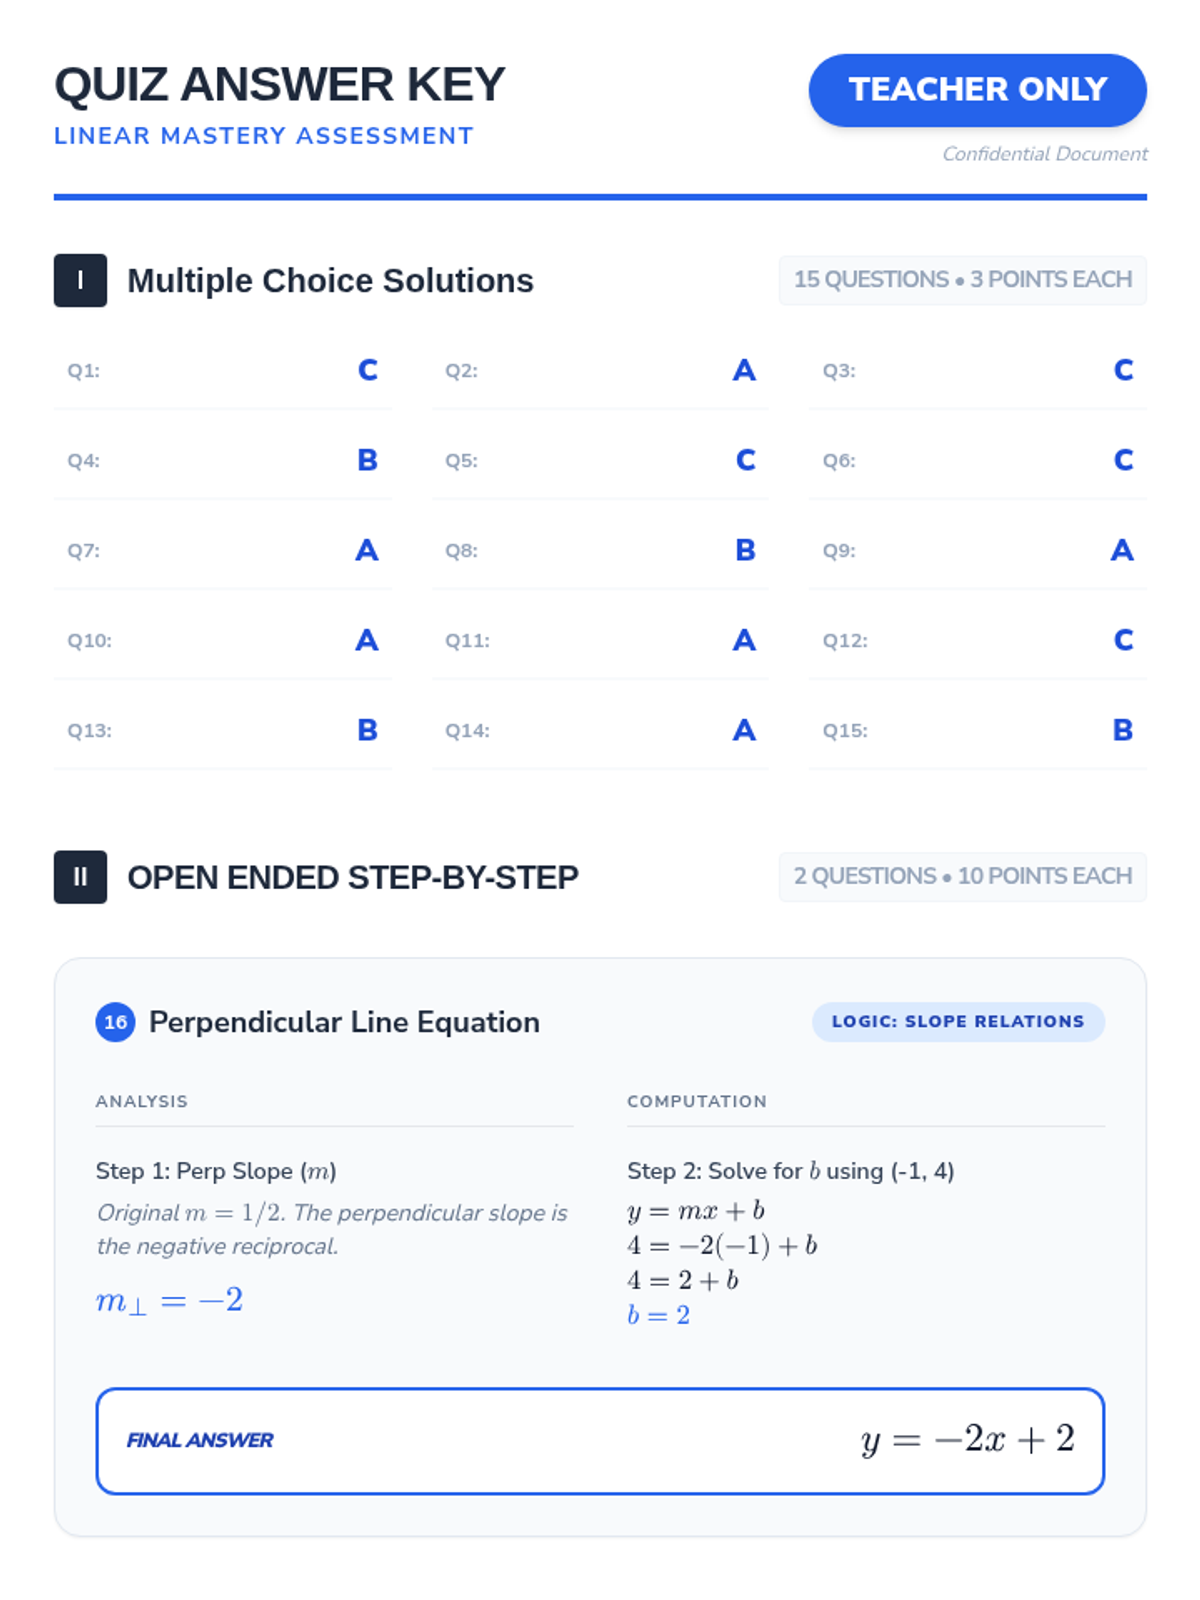
This lesson provides a comprehensive review and assessment of linear equations, covering function identification, standard form conversions, and the properties of parallel and perpendicular lines. Students will engage in guided practice, independent modeling, and summative evaluation to master linear relationships.
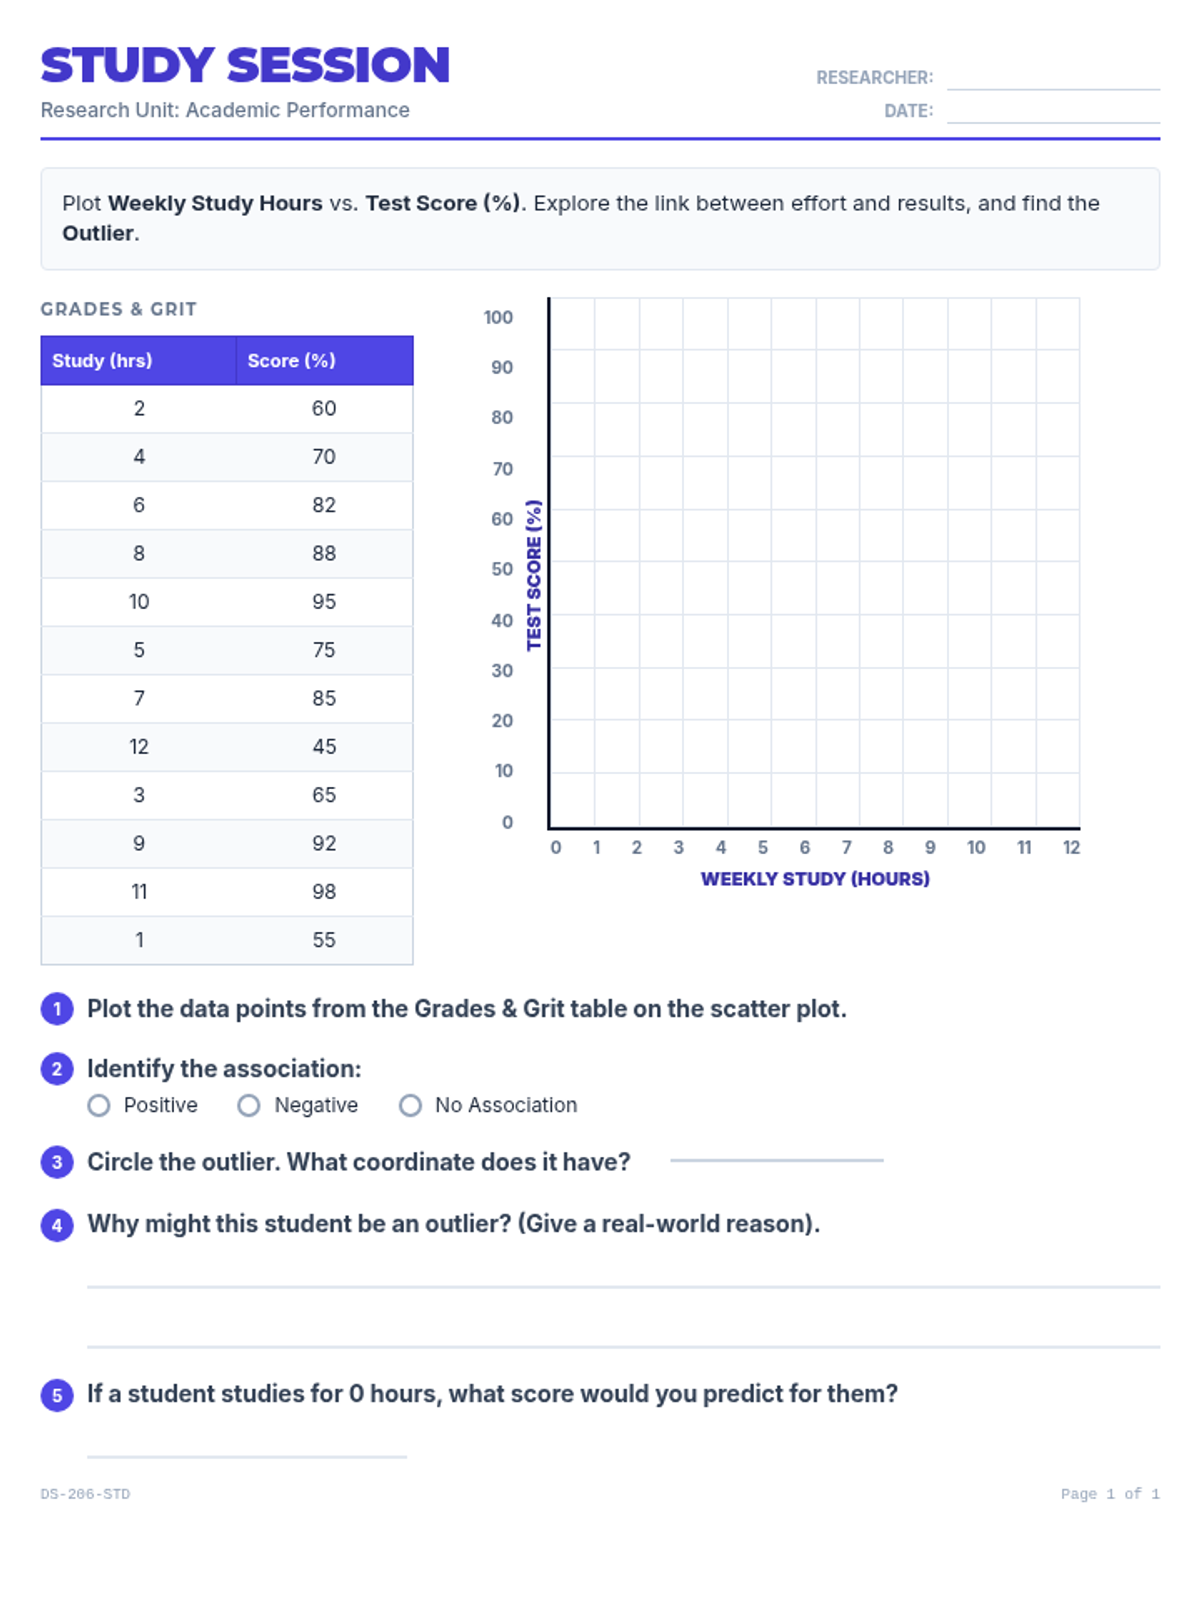
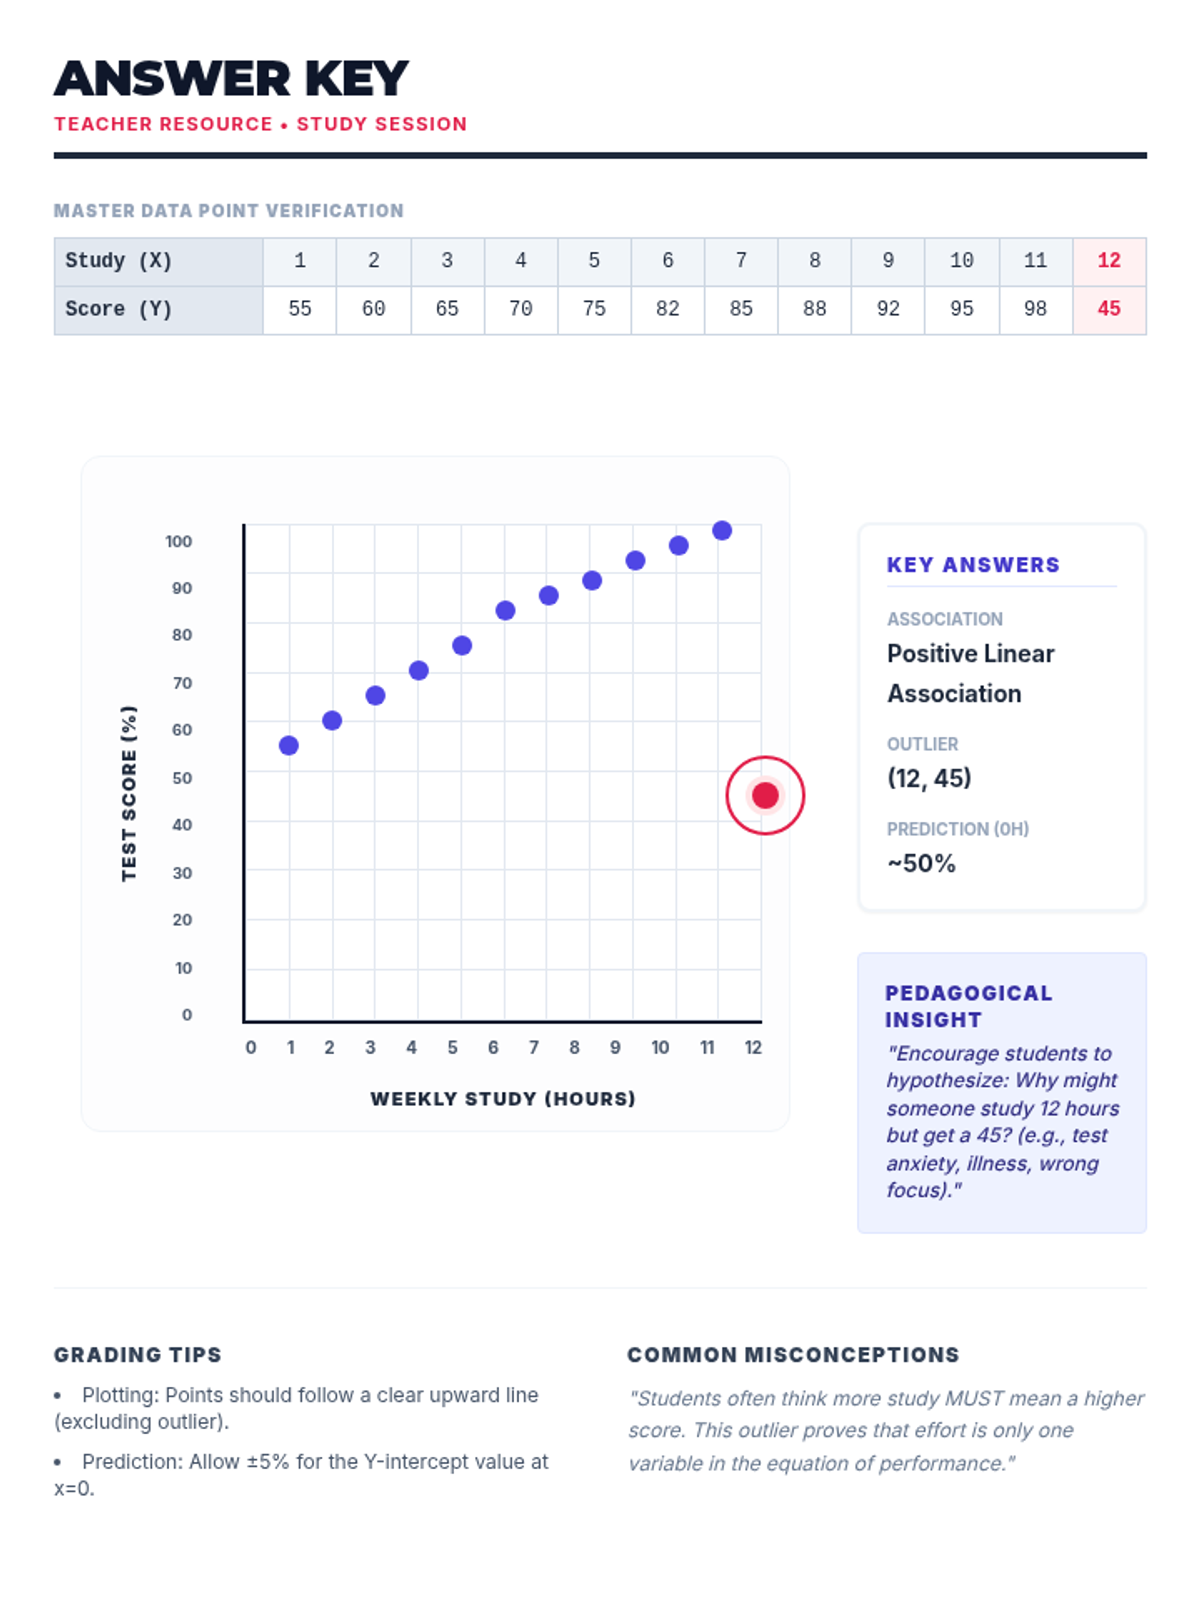
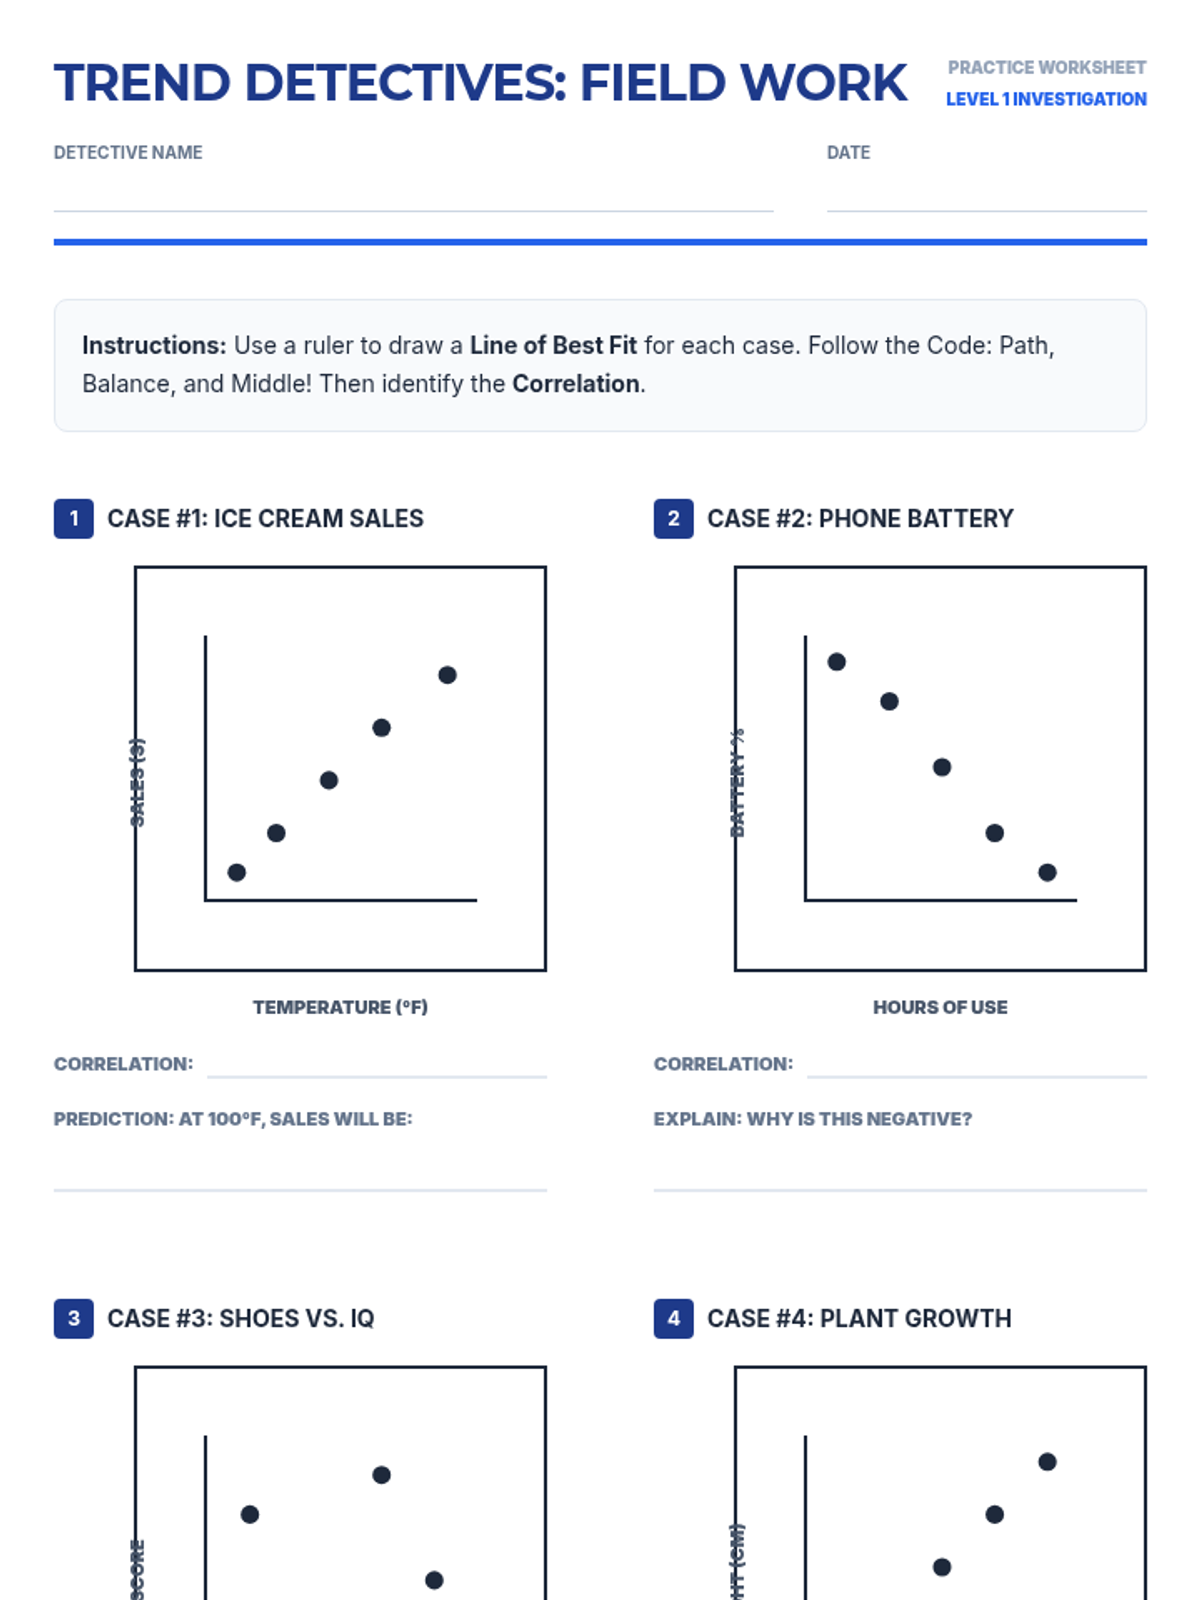
A hands-on investigation into scatter plots, lines of best fit, and identifying outliers using real-world scenarios like test scores and plant growth.
A lesson on understanding and drawing lines of best fit (trend lines) on scatter plots to identify data patterns and make predictions.
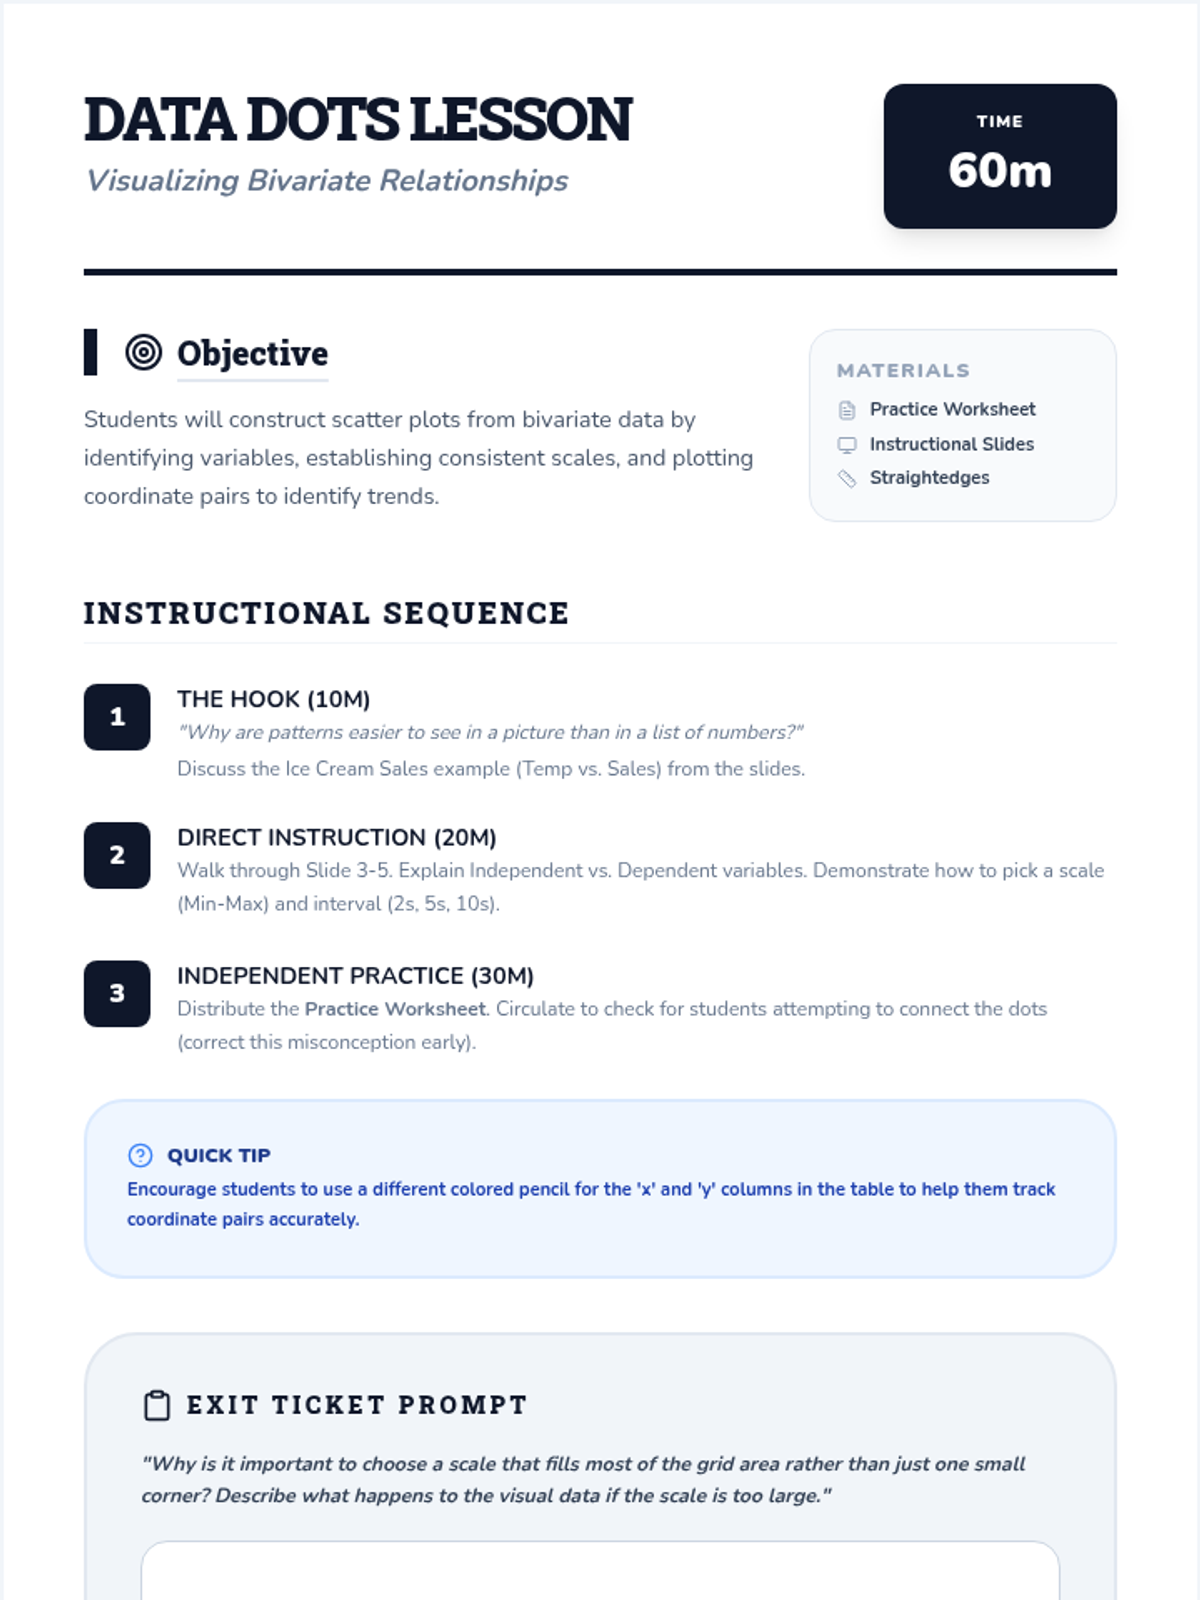
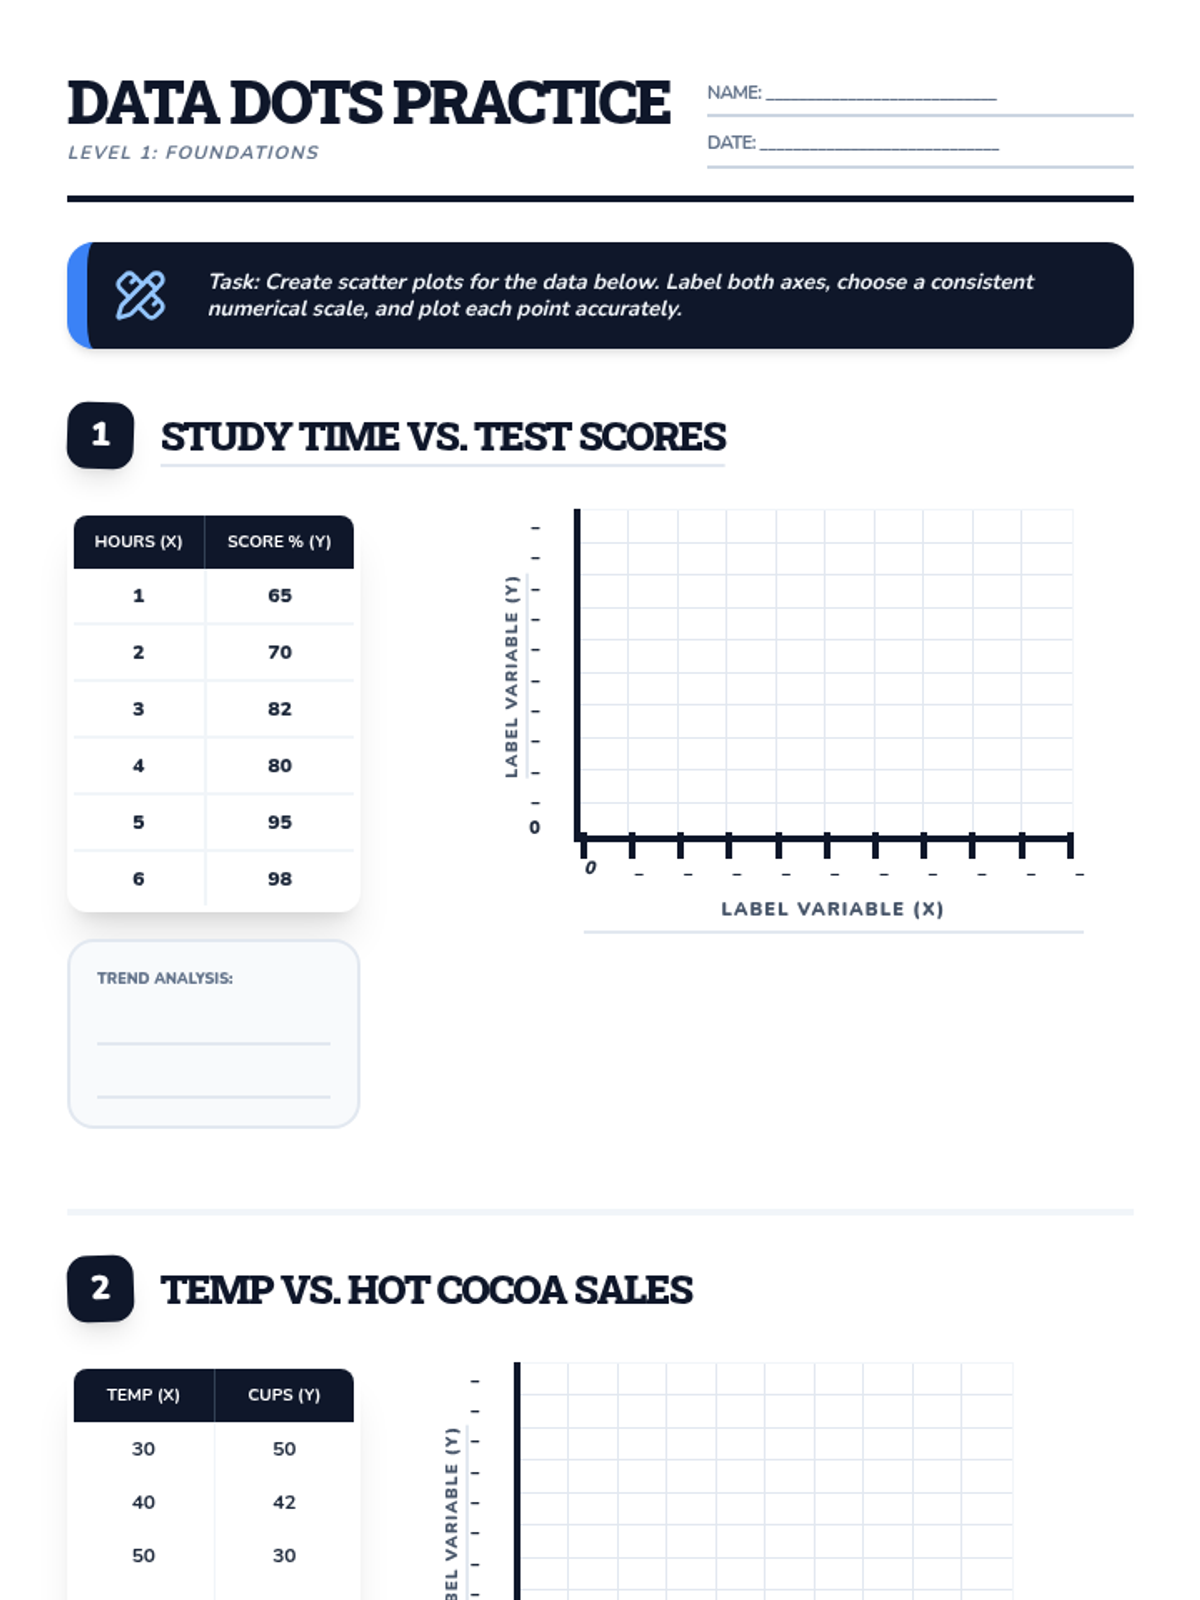
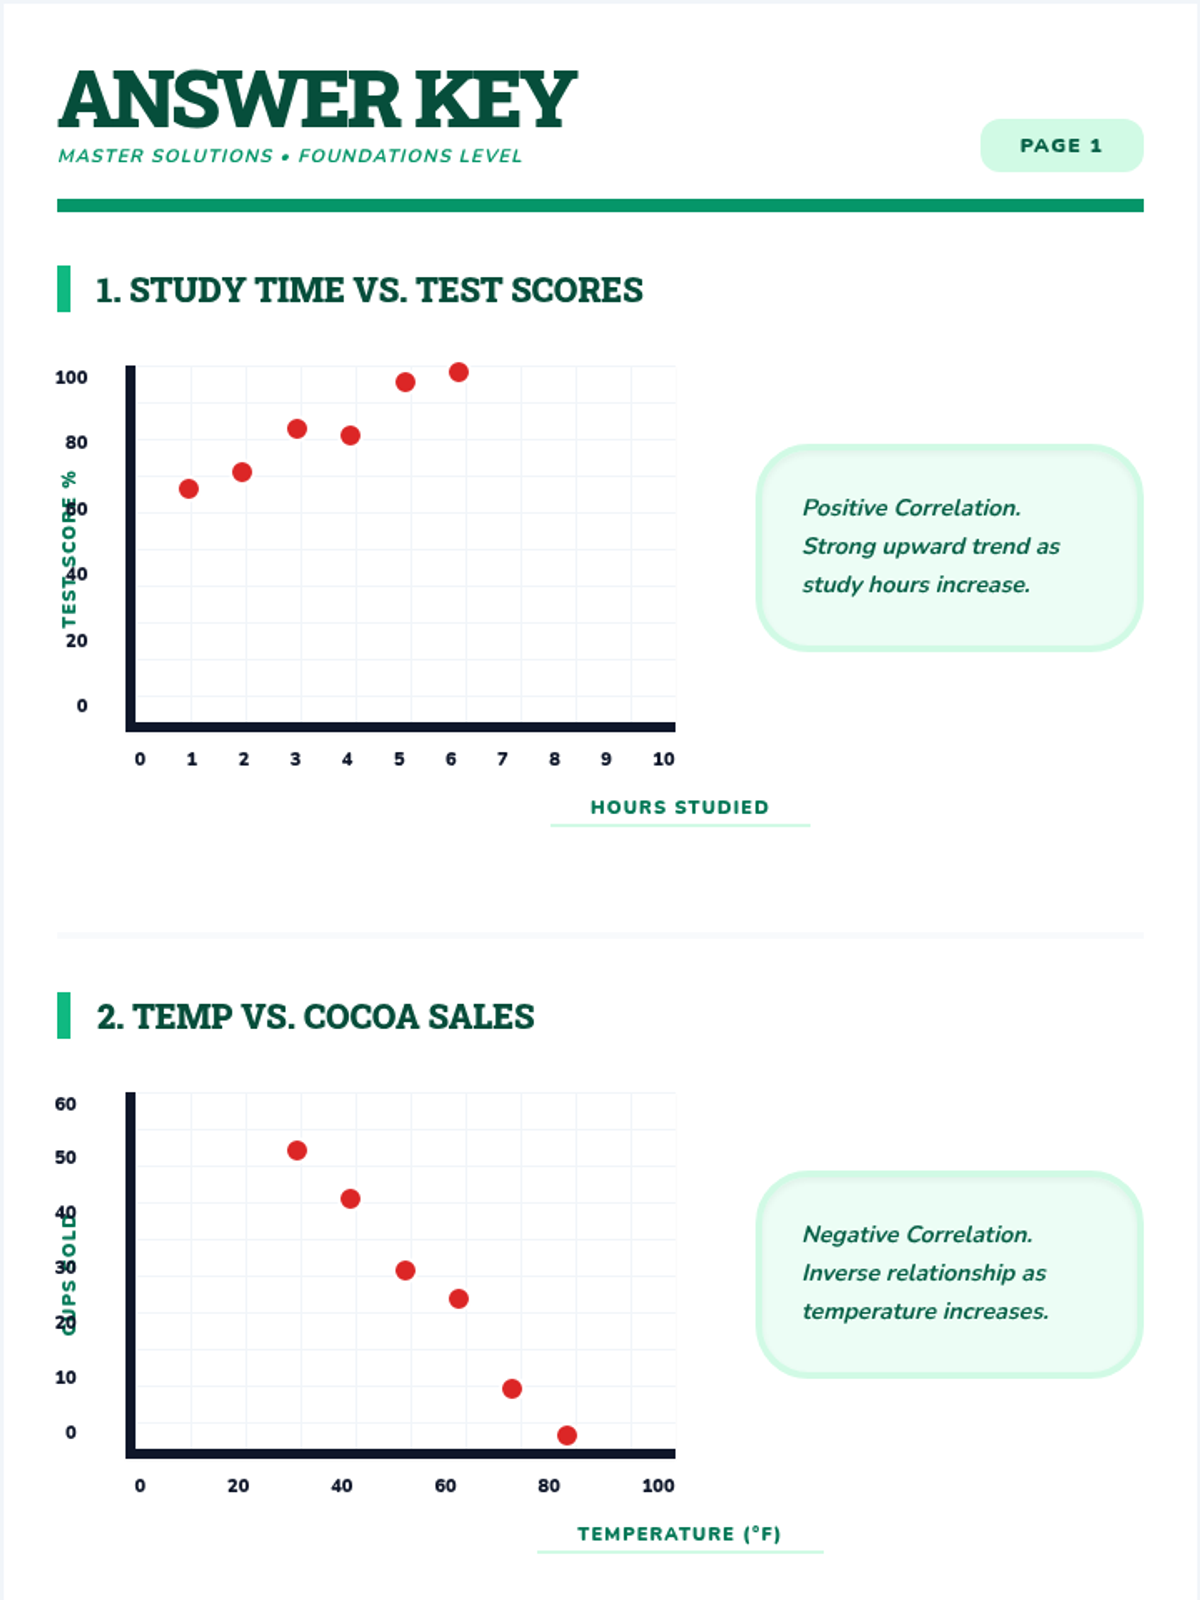
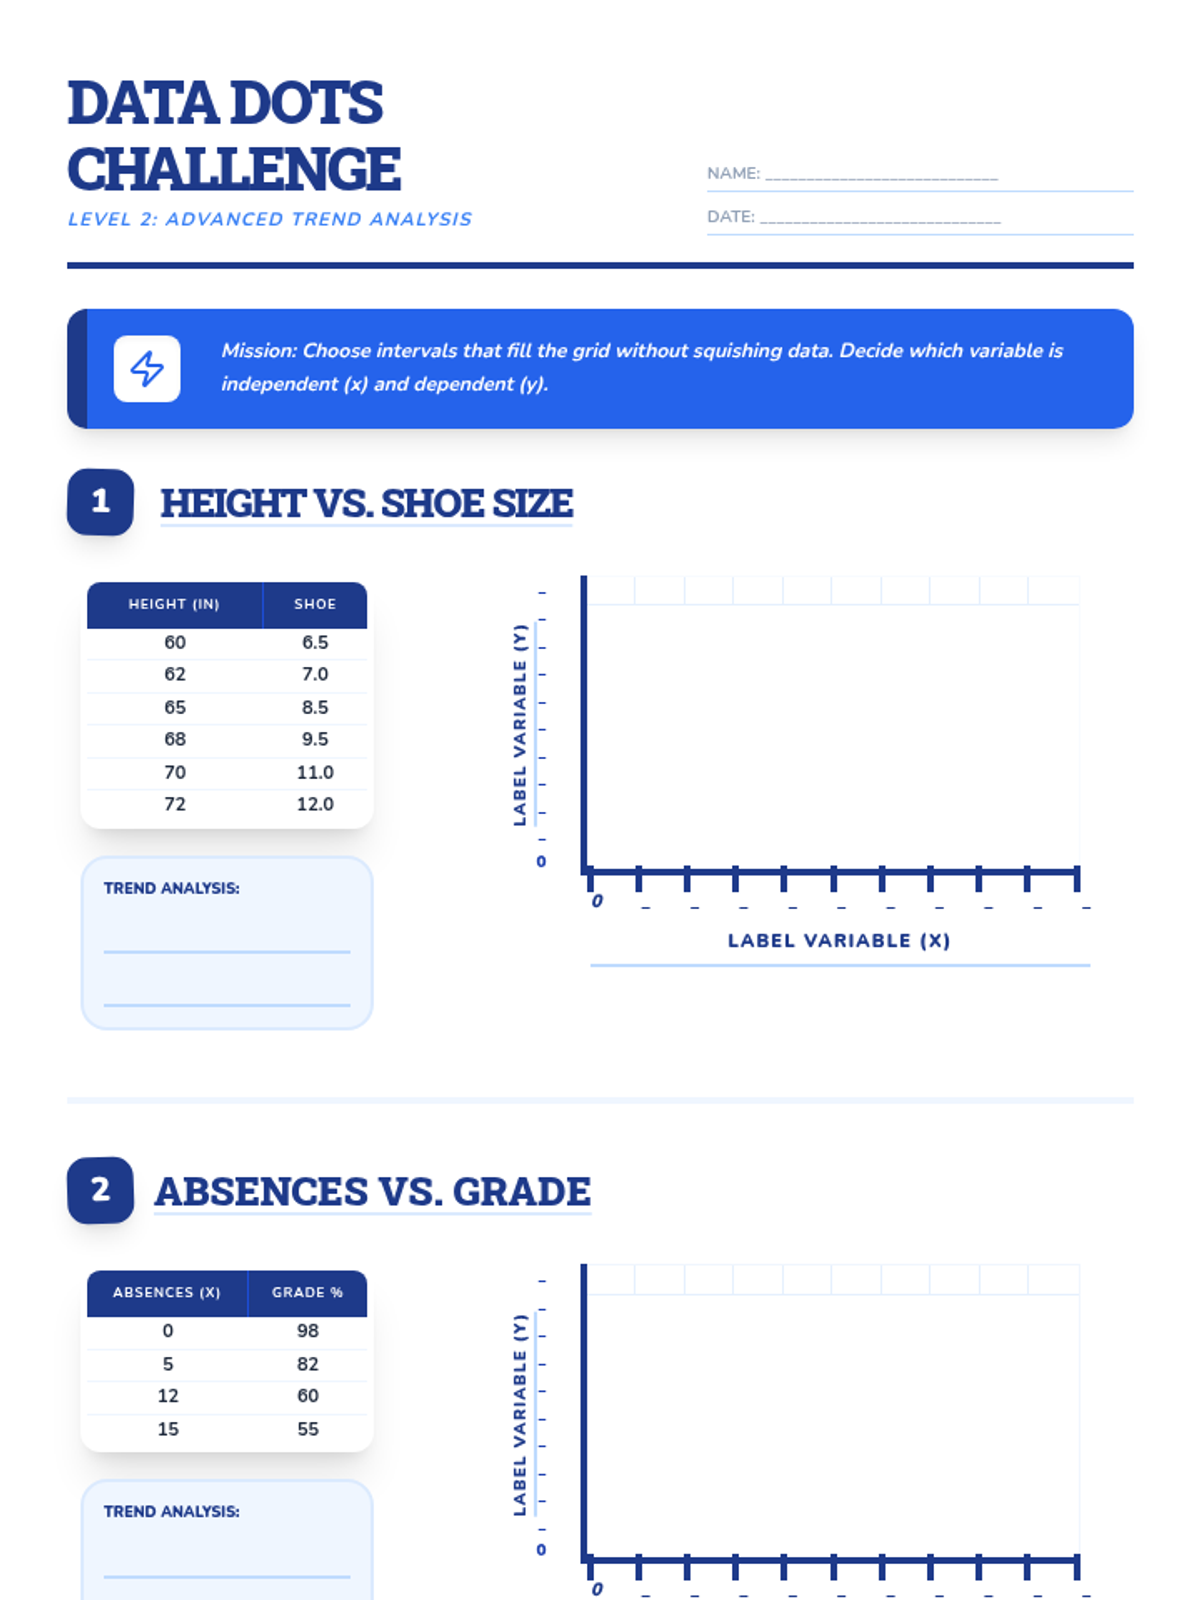
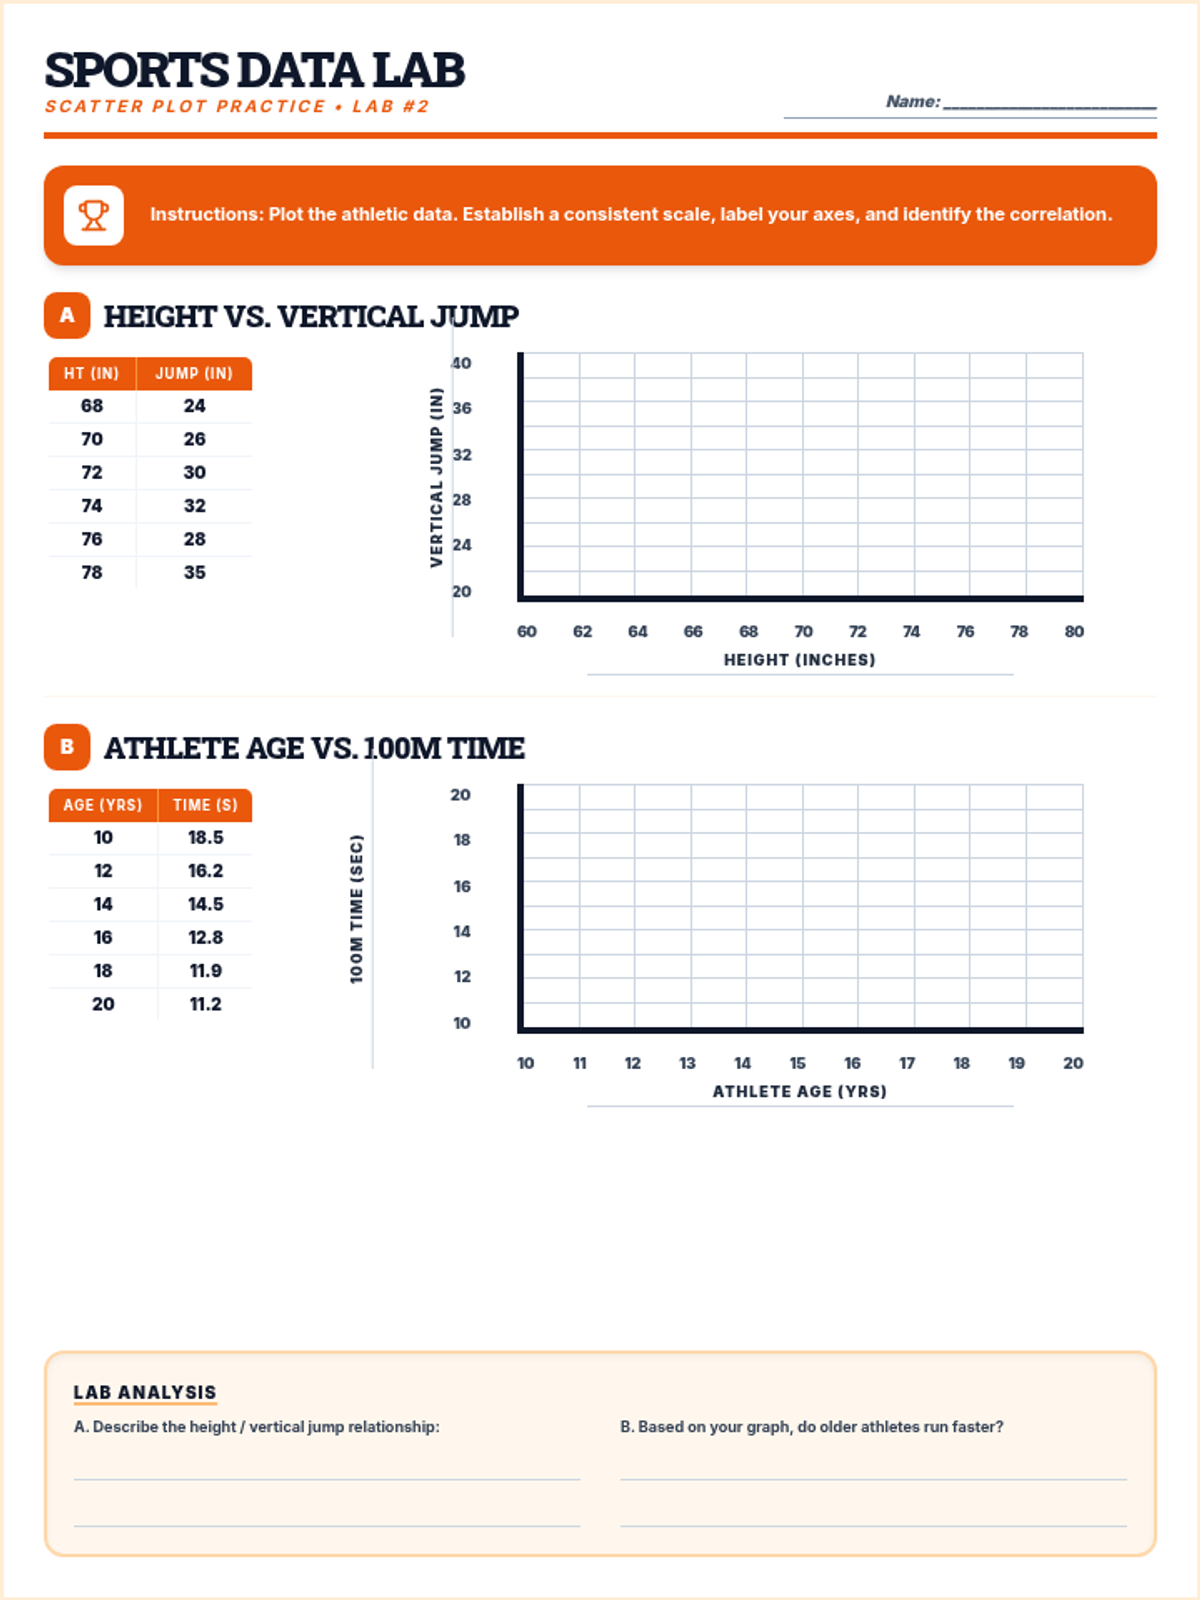
A comprehensive lesson on creating scatter plots from real-world data, including instruction on axes, scale, and plotting ordered pairs.
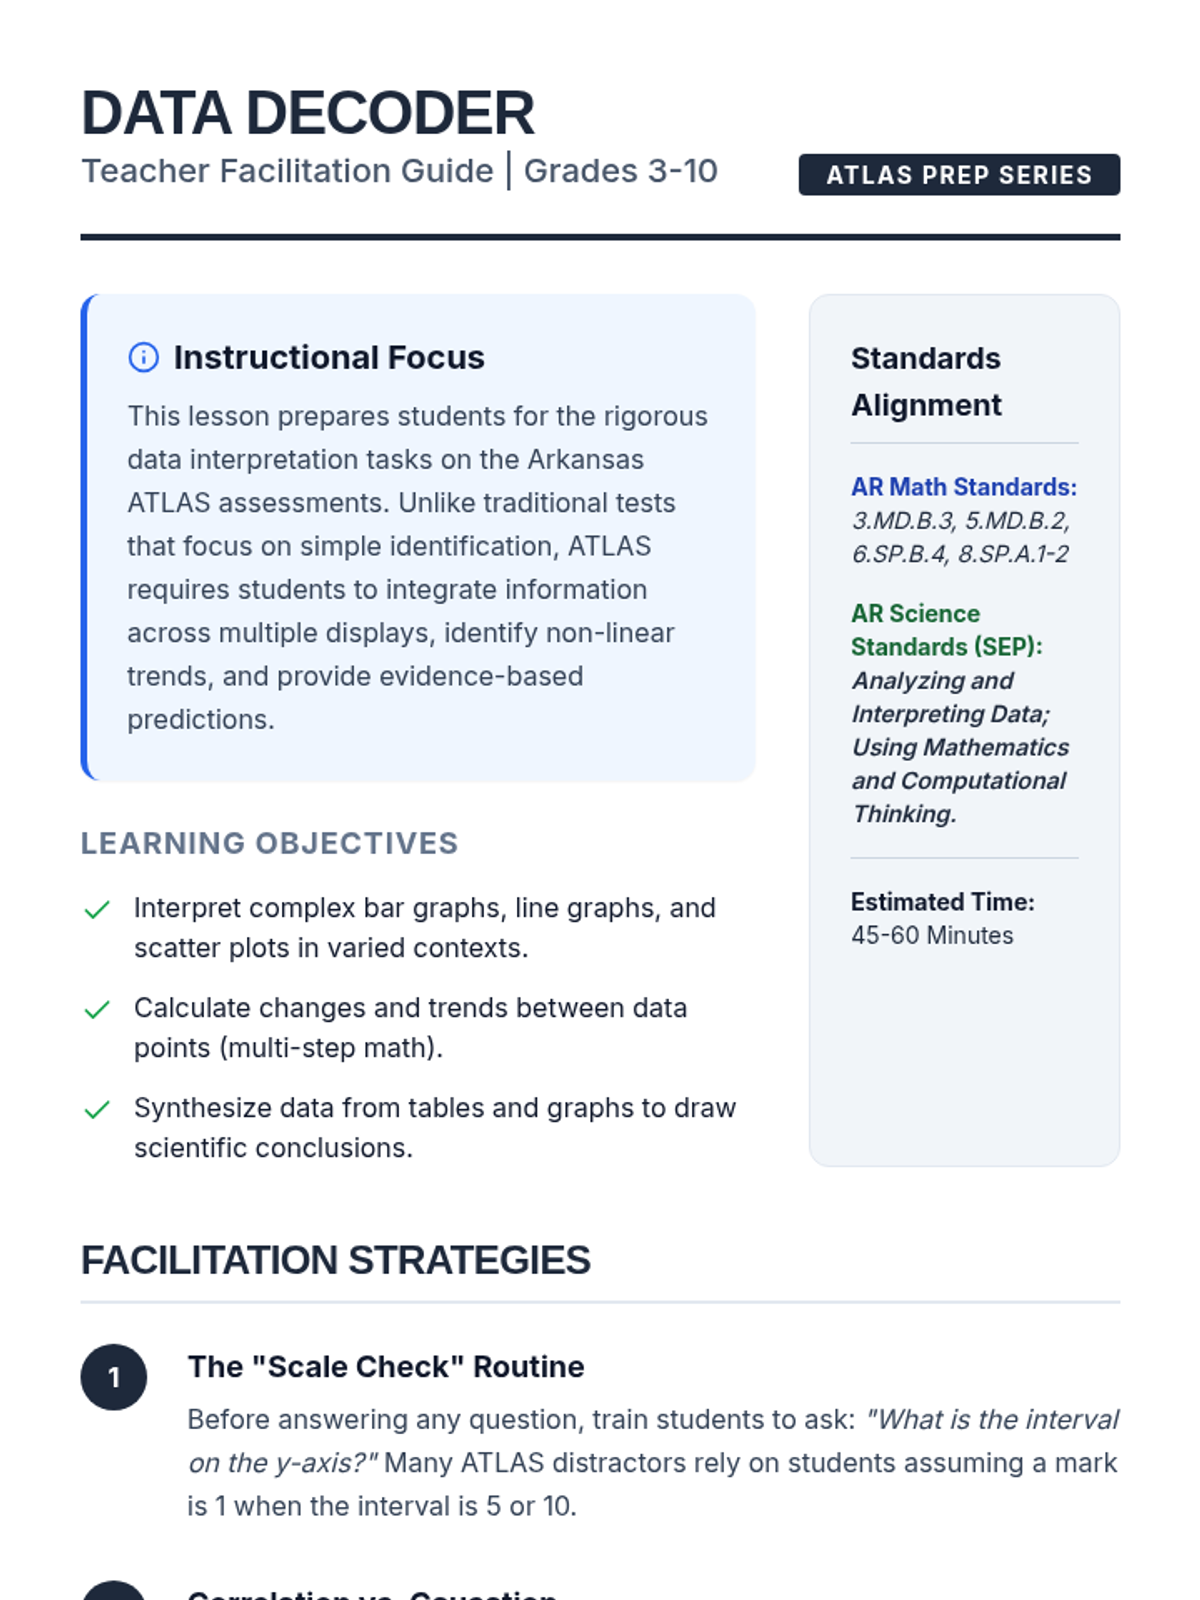
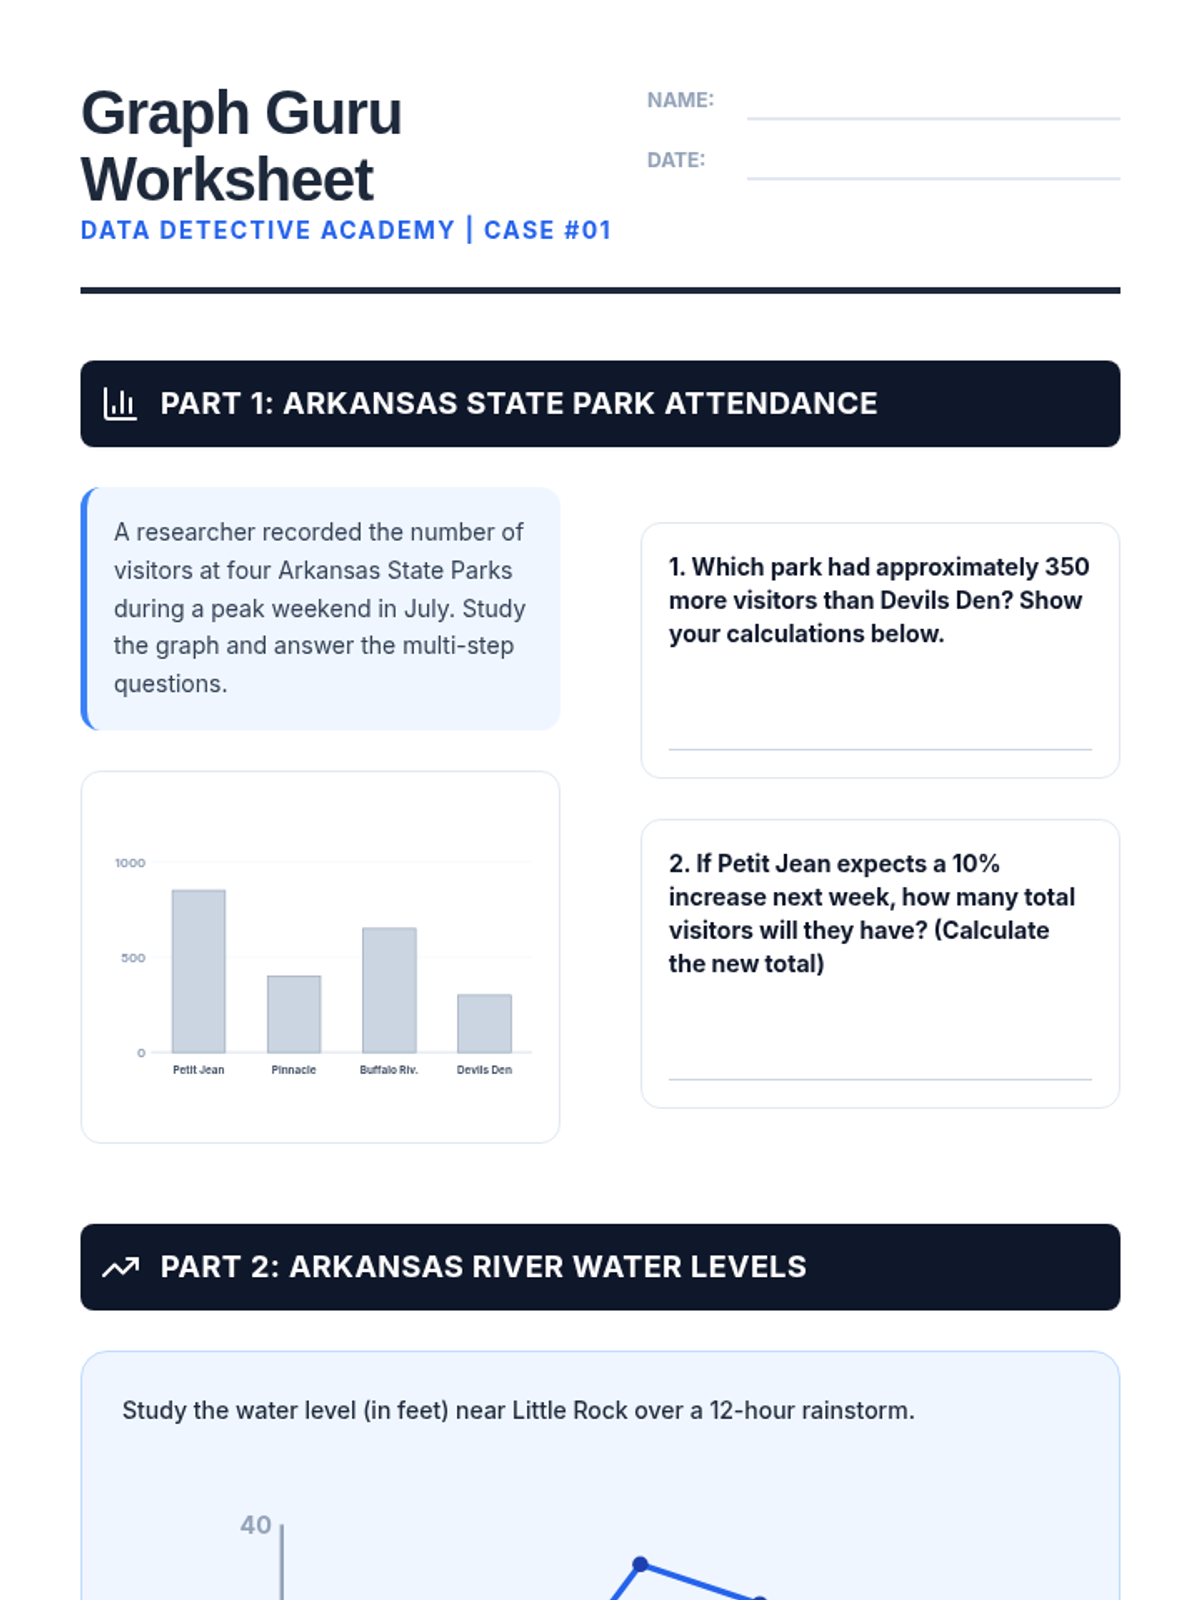
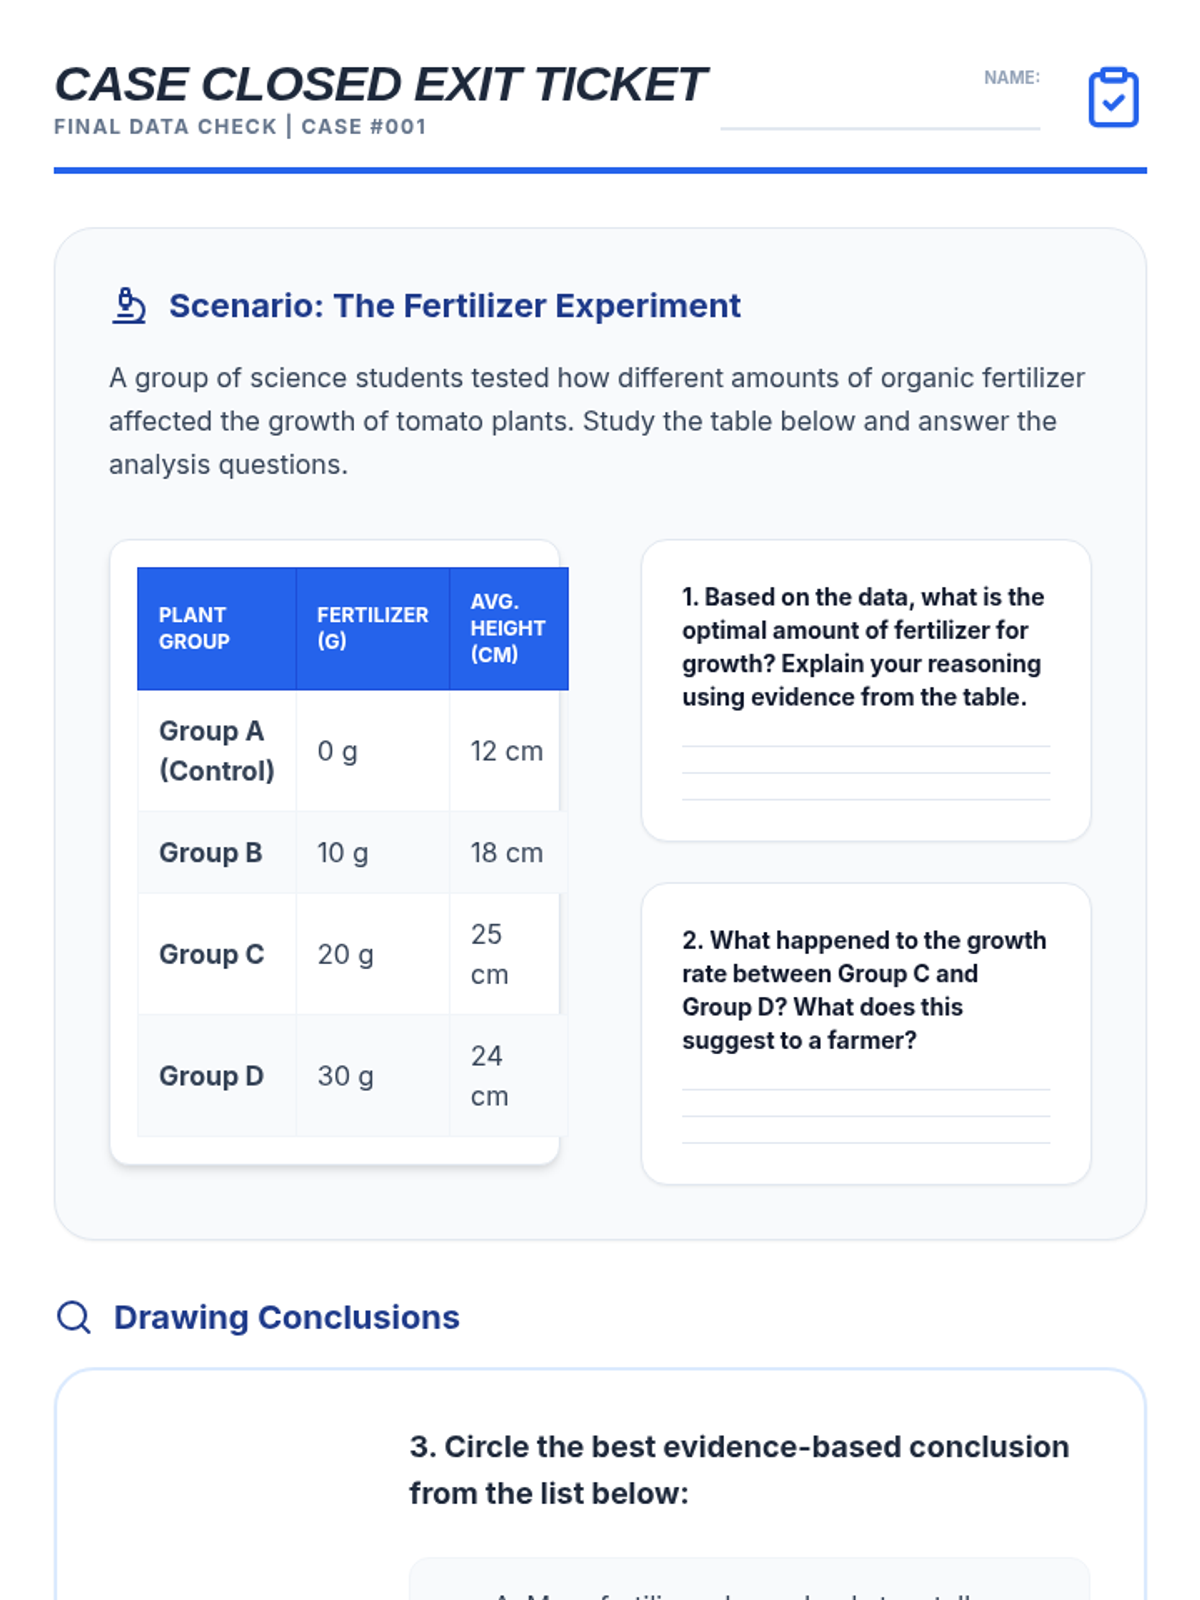
A comprehensive guide to mastering data interpretation for Arkansas ATLAS assessments, covering bar graphs, line graphs, scatter plots, and tables in math and science contexts. Students learn to decode complex visuals and draw evidence-based conclusions.
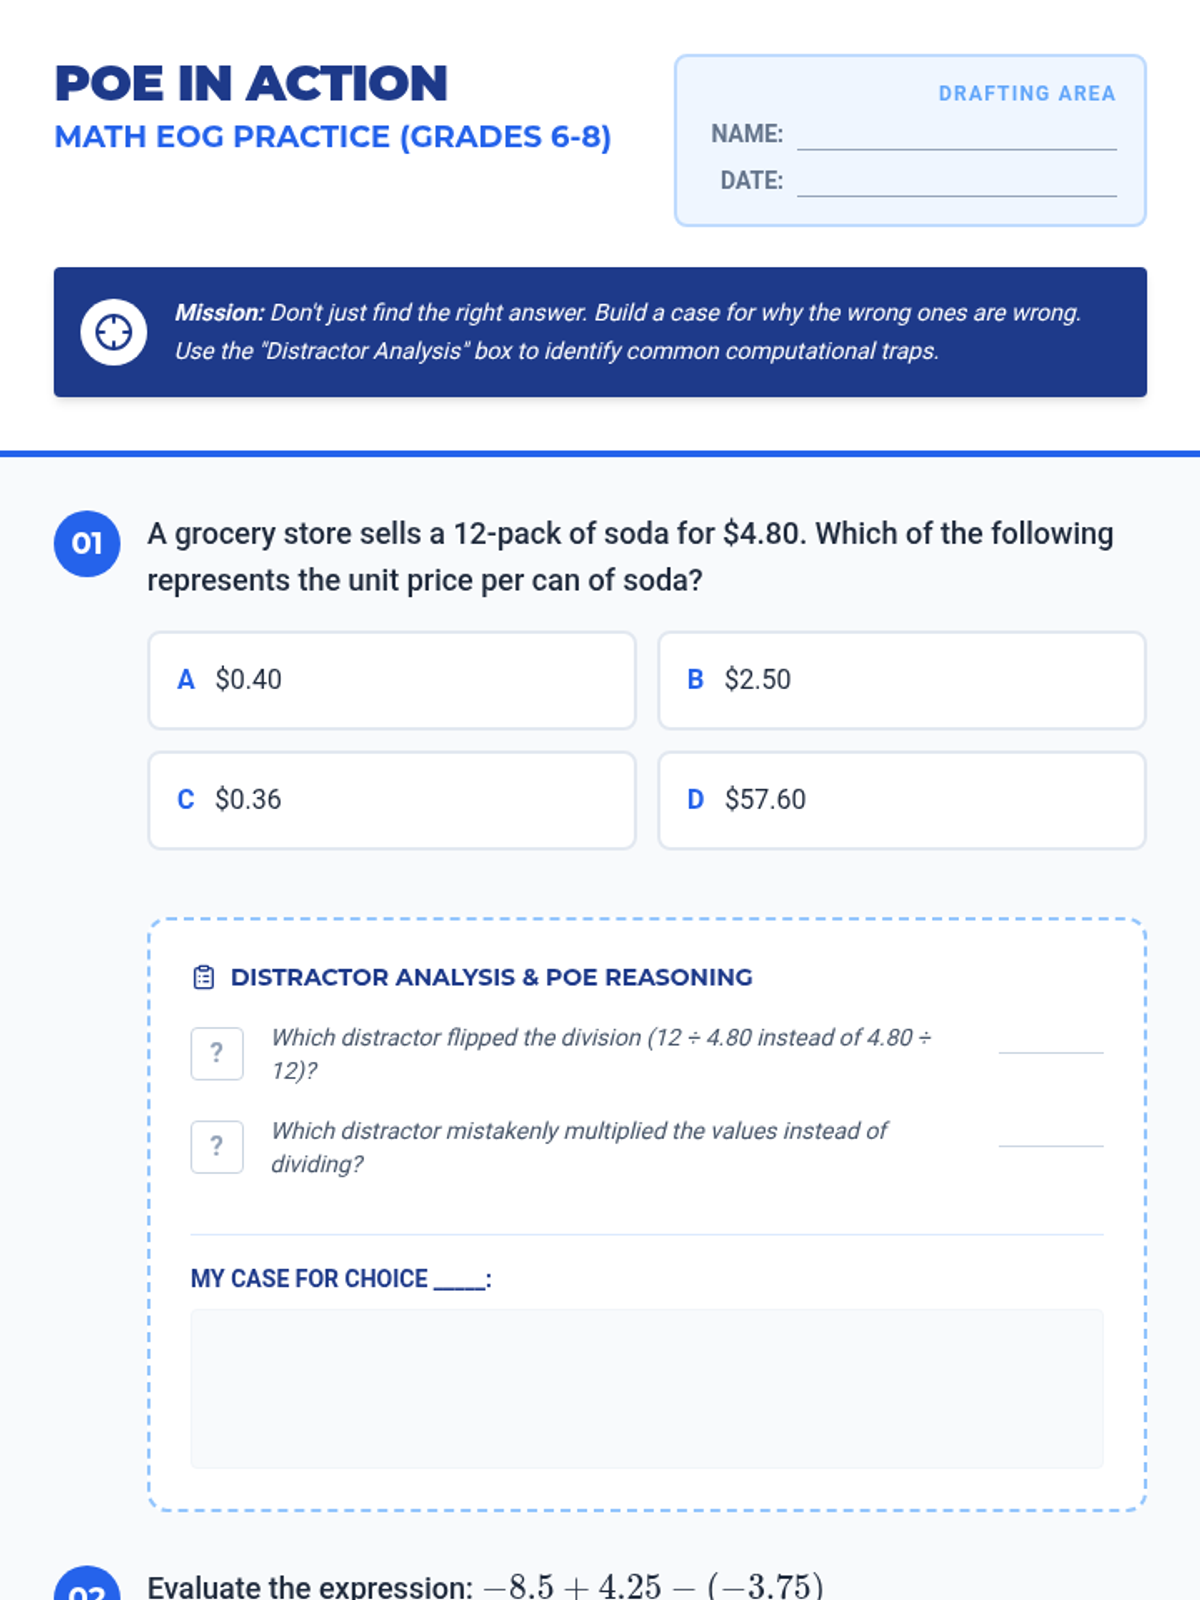
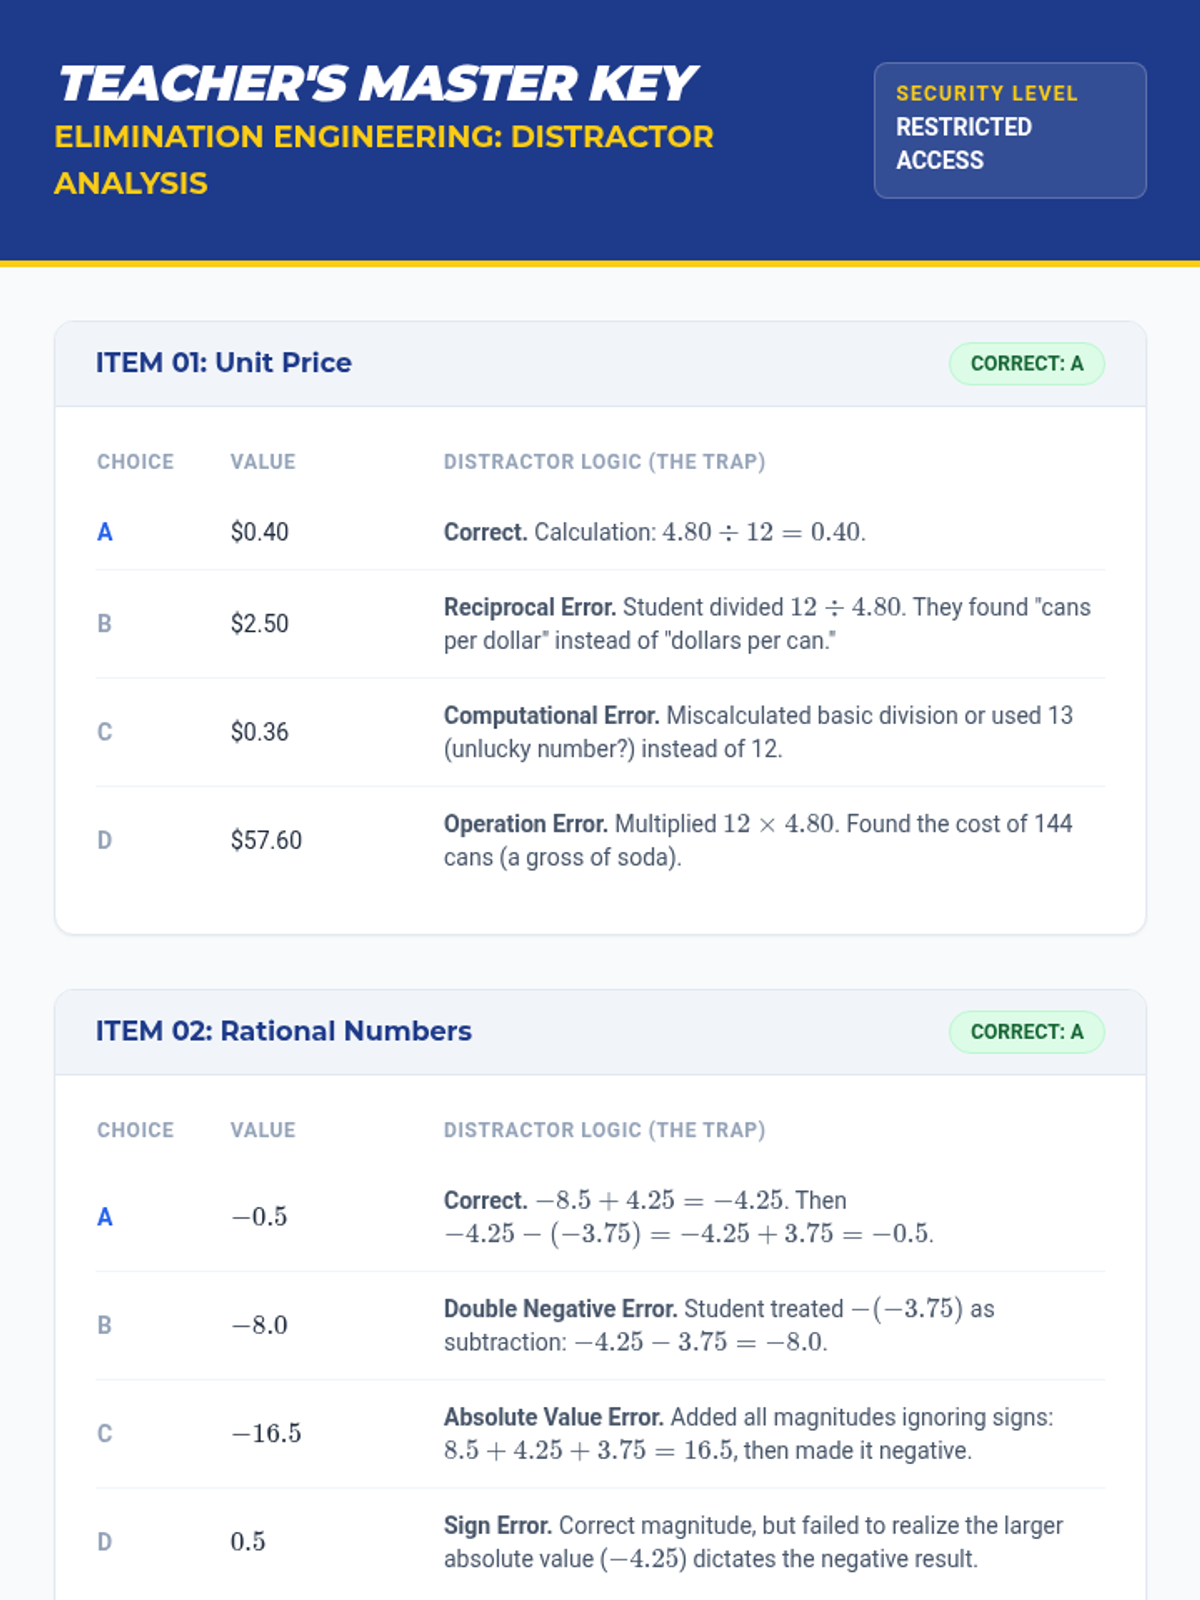
A guided practice set for middle school students to master the Process of Elimination in Math EOG exams through distractor analysis.
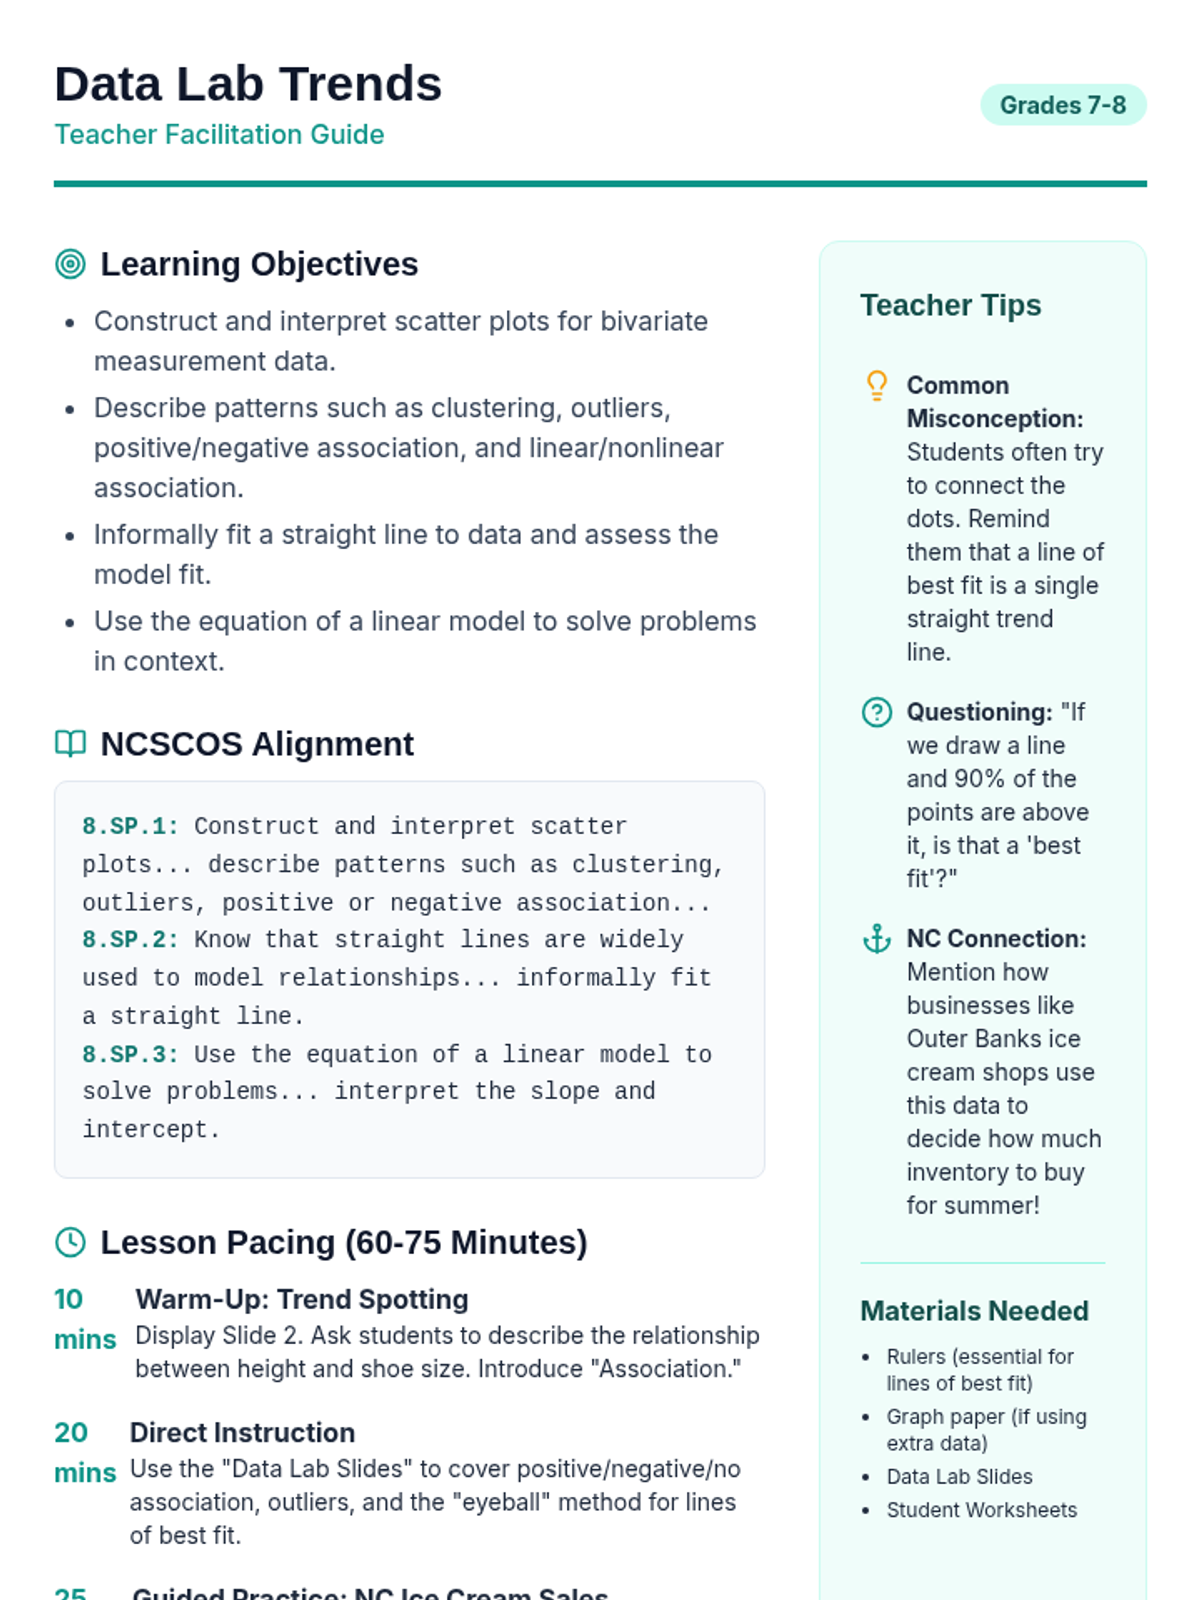
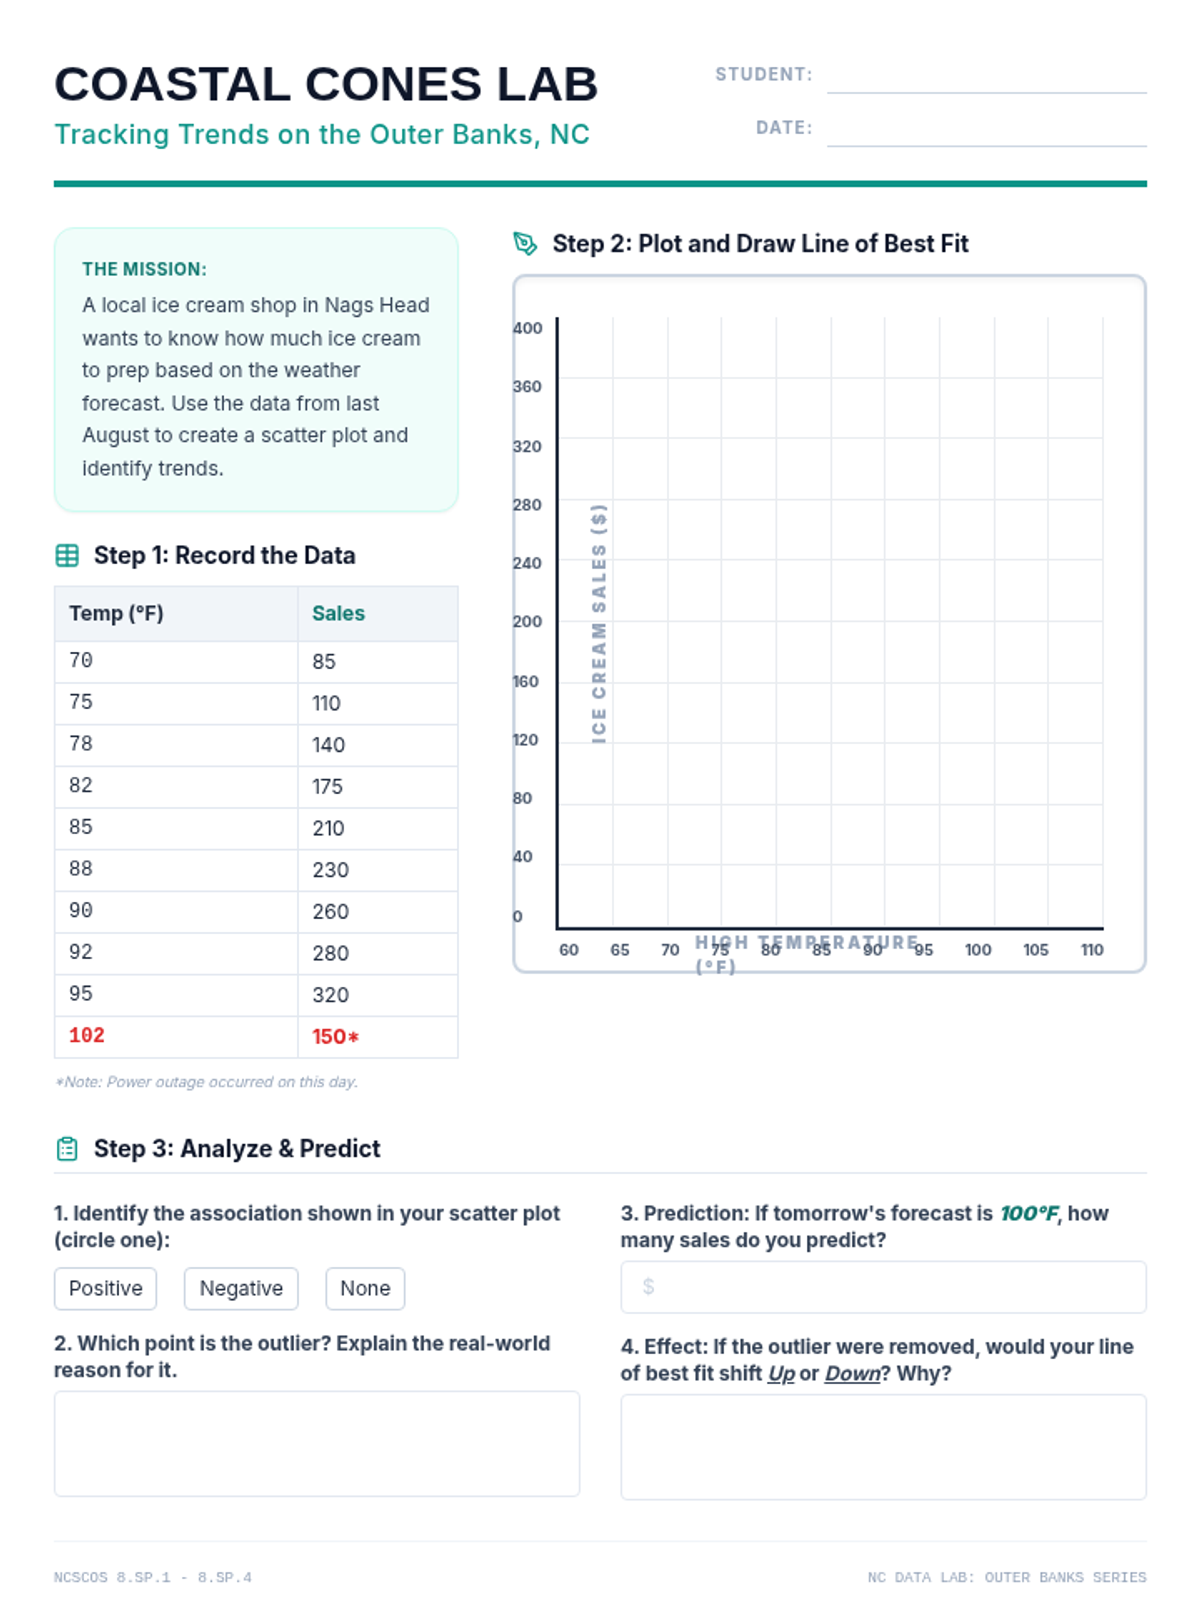
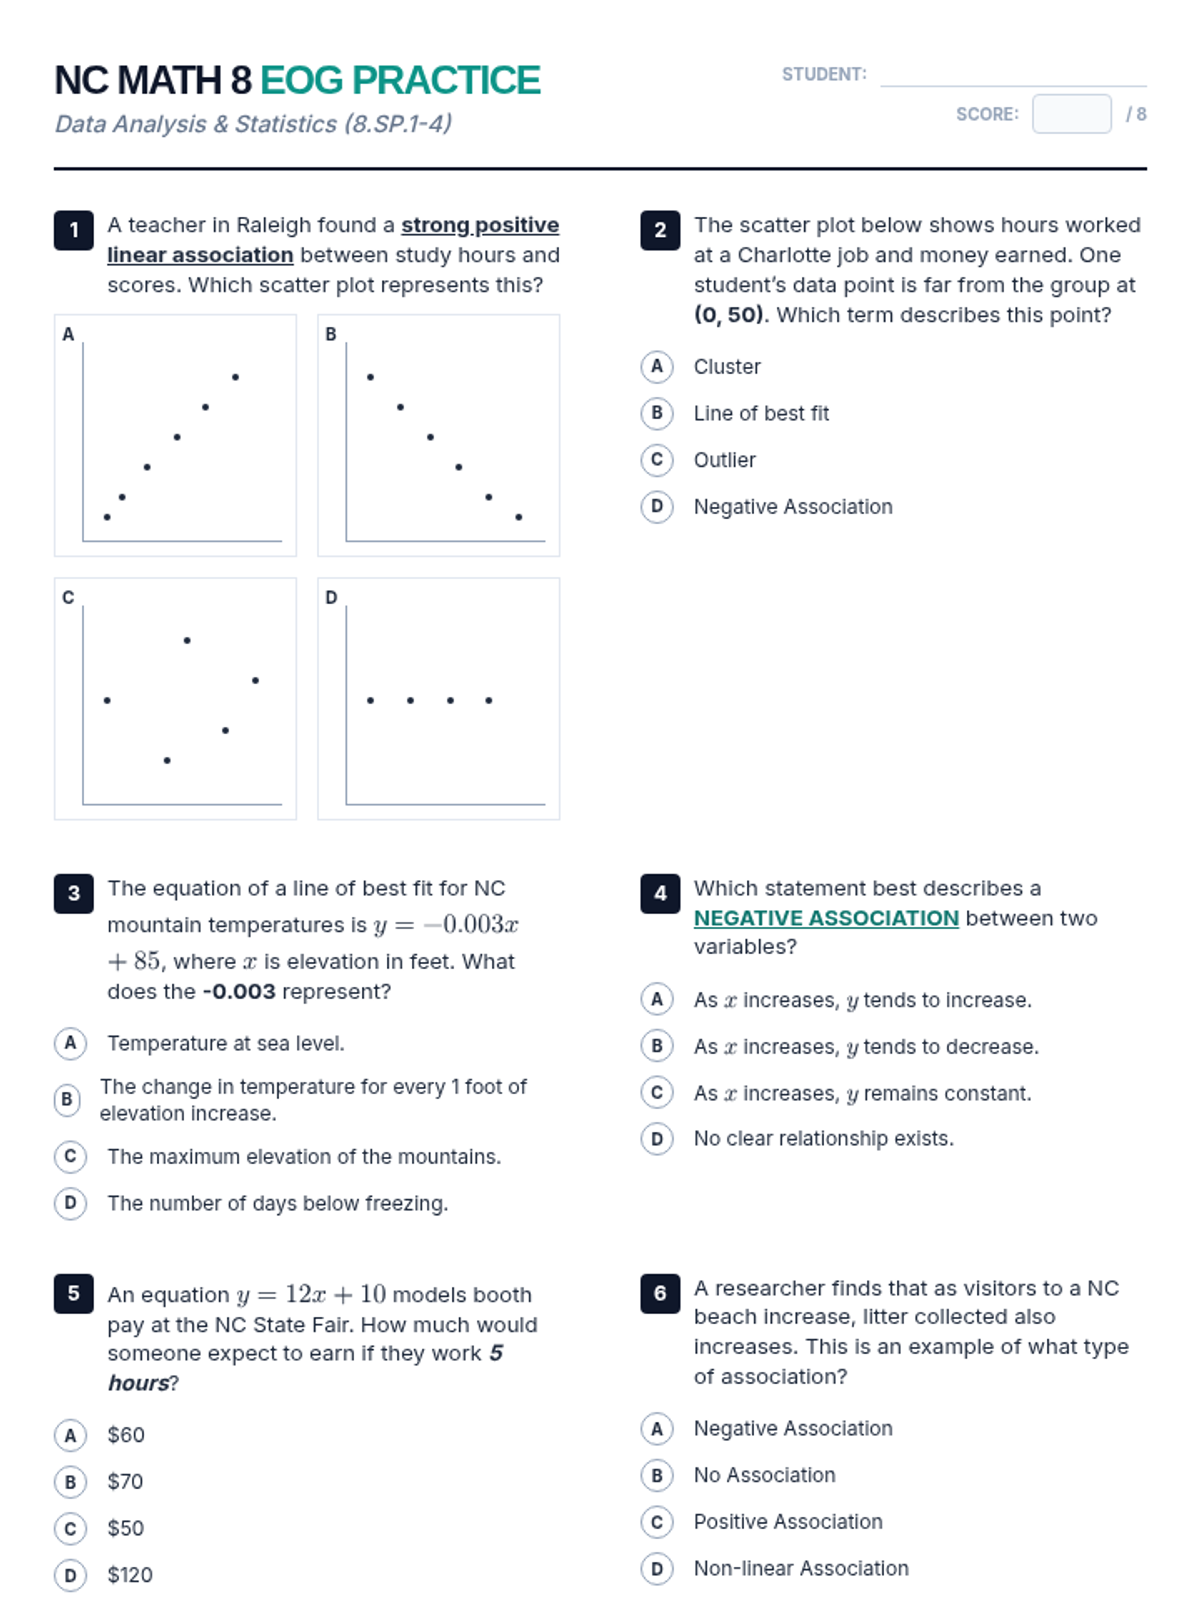
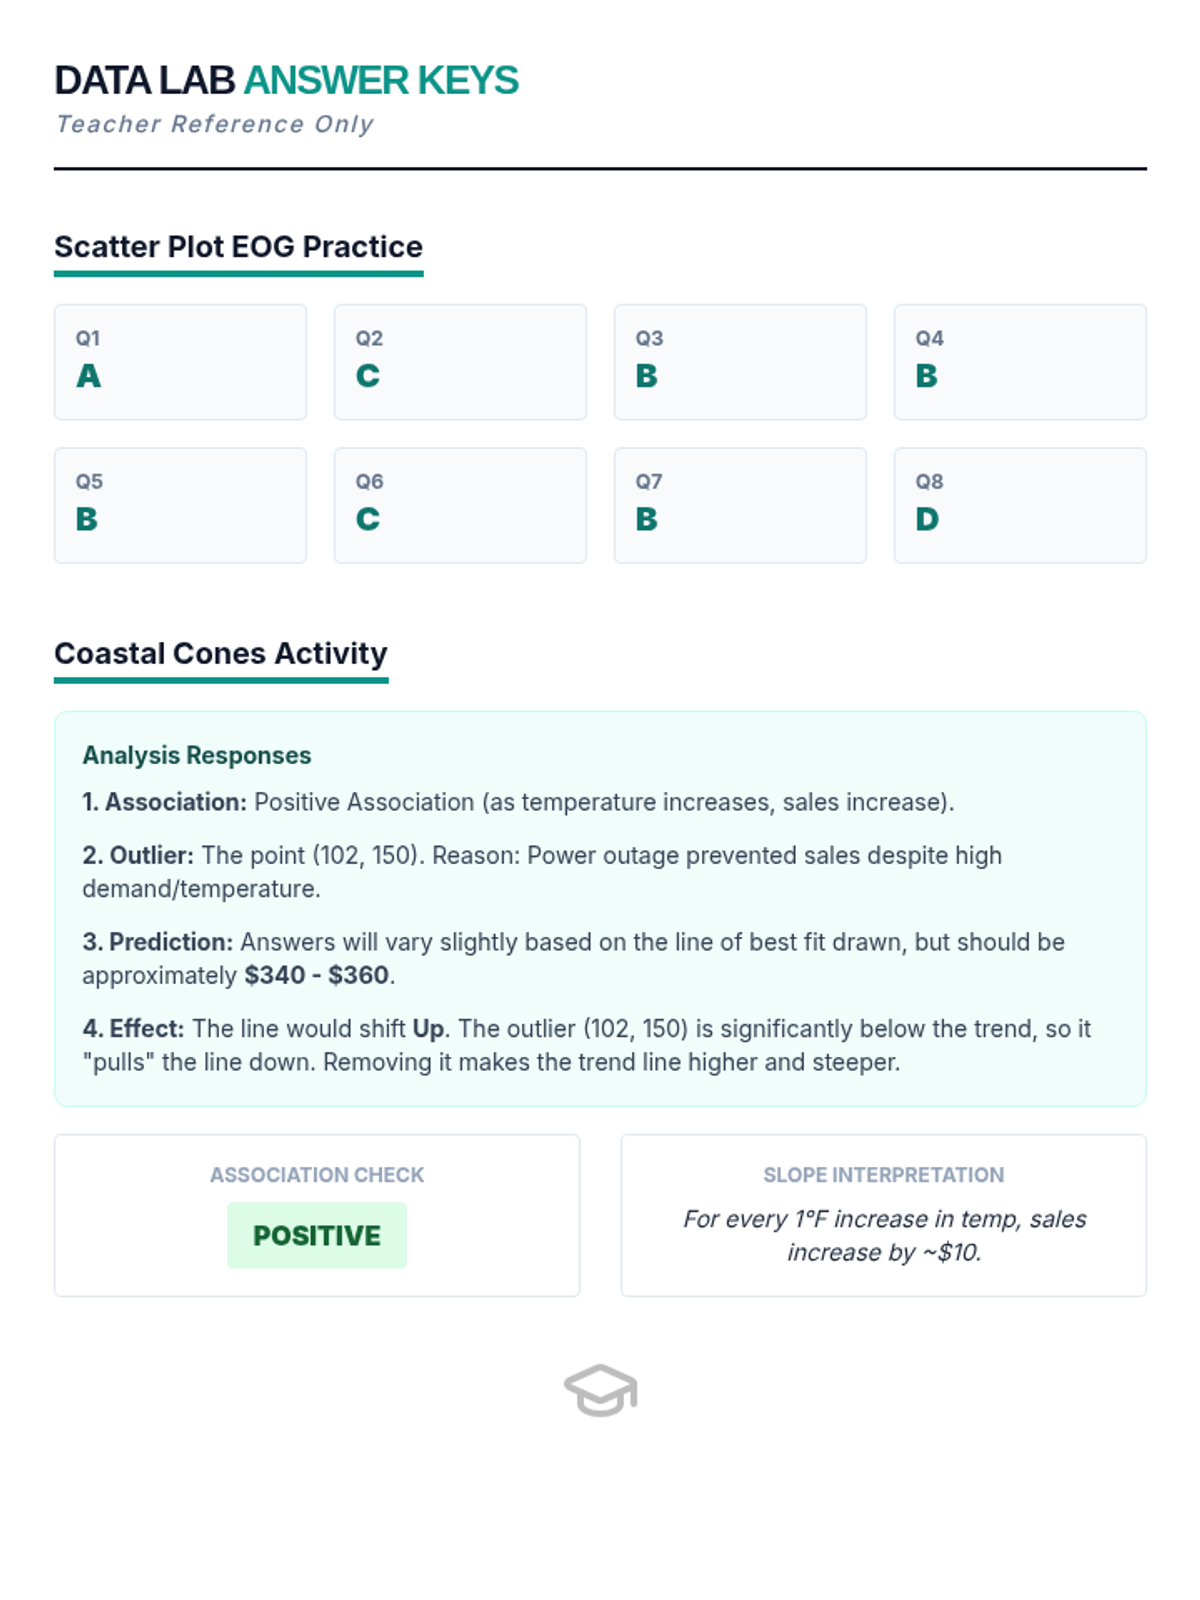
A comprehensive lesson on scatter plots and lines of best fit using North Carolina-specific data. Students will learn to identify associations, construct plots, and make predictions based on linear models.
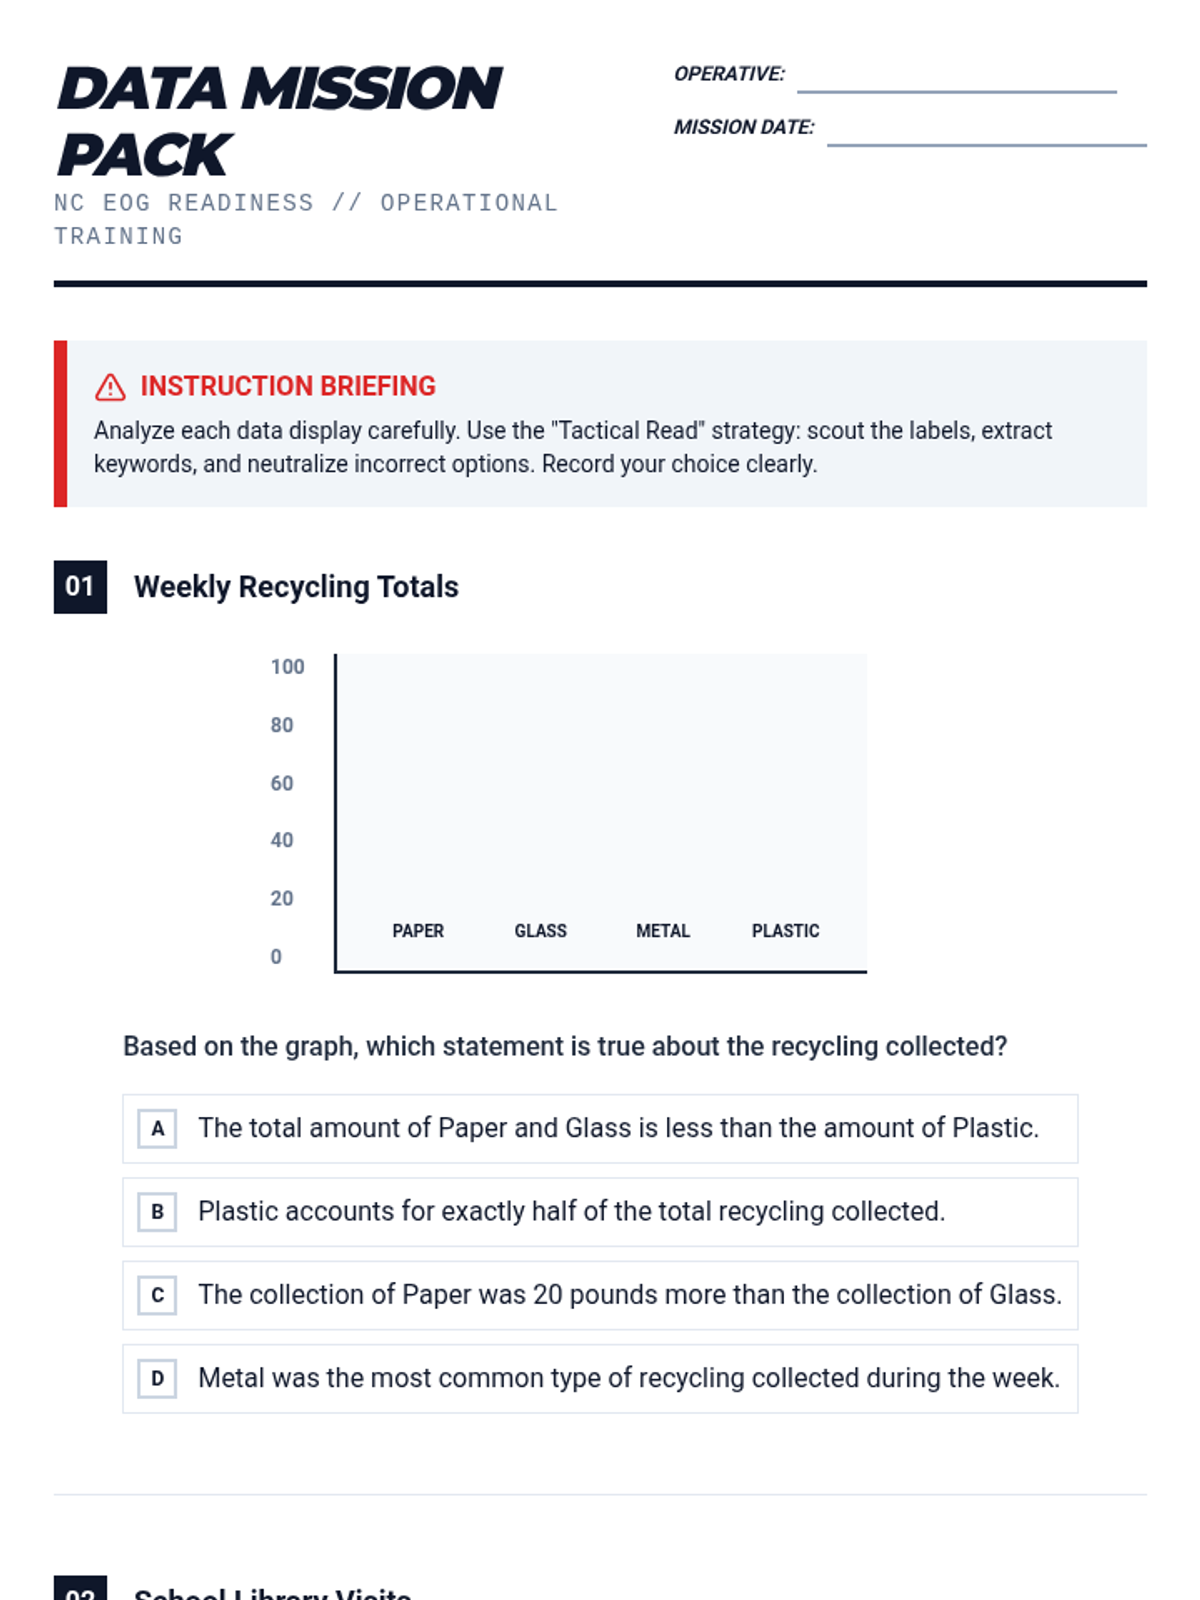
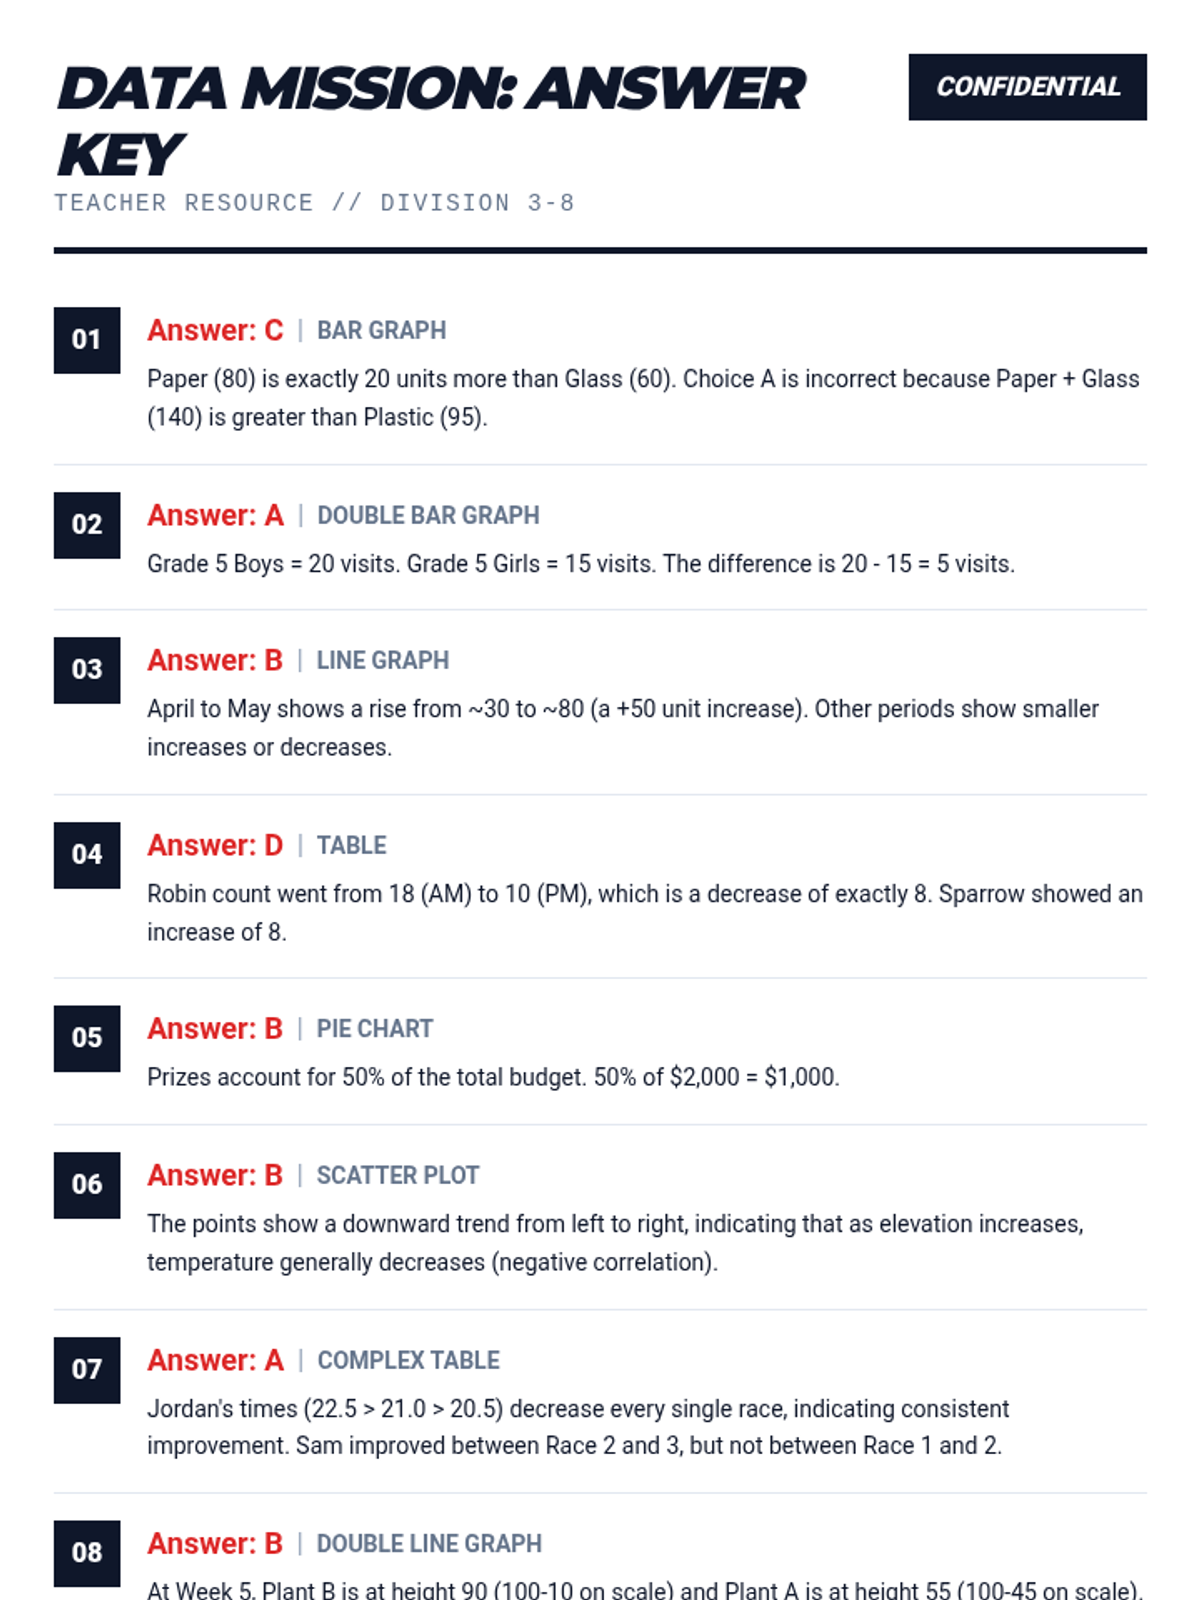
A comprehensive test preparation lesson focused on interpreting various data displays, including bar graphs, line graphs, pie charts, tables, and scatter plots, designed for NC EOG readiness.
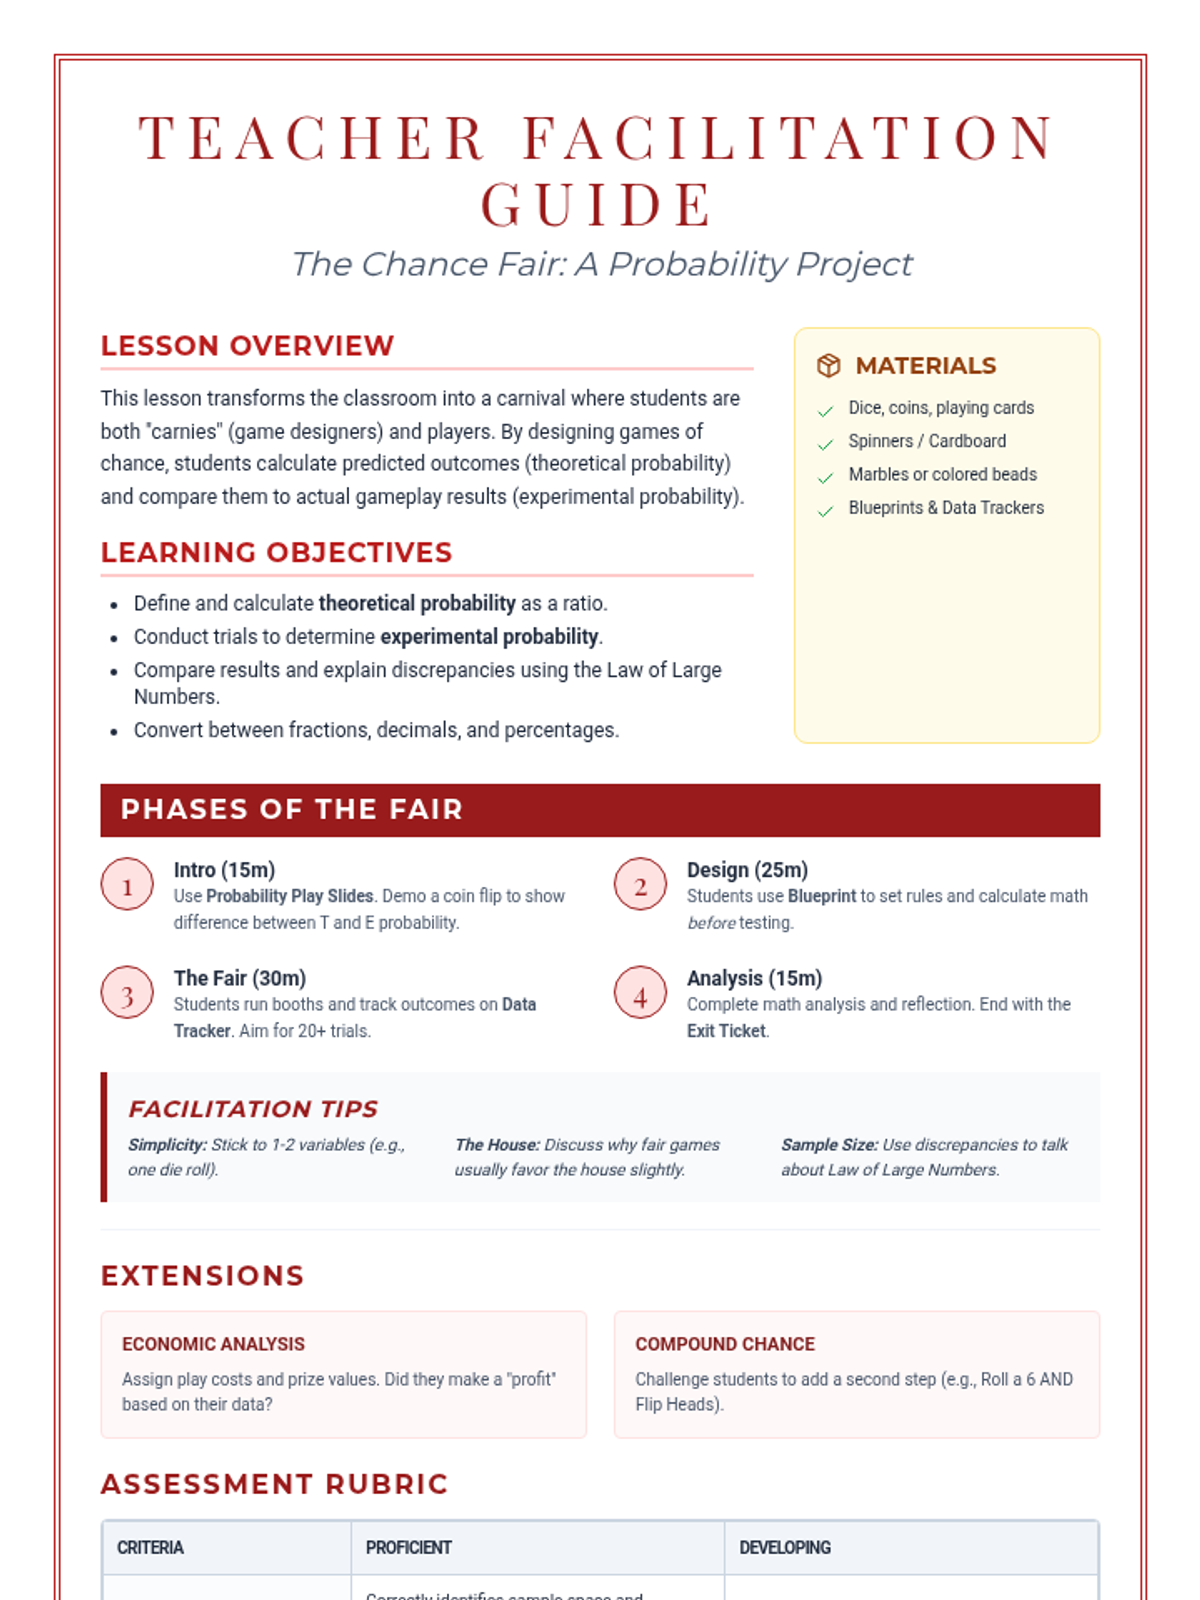
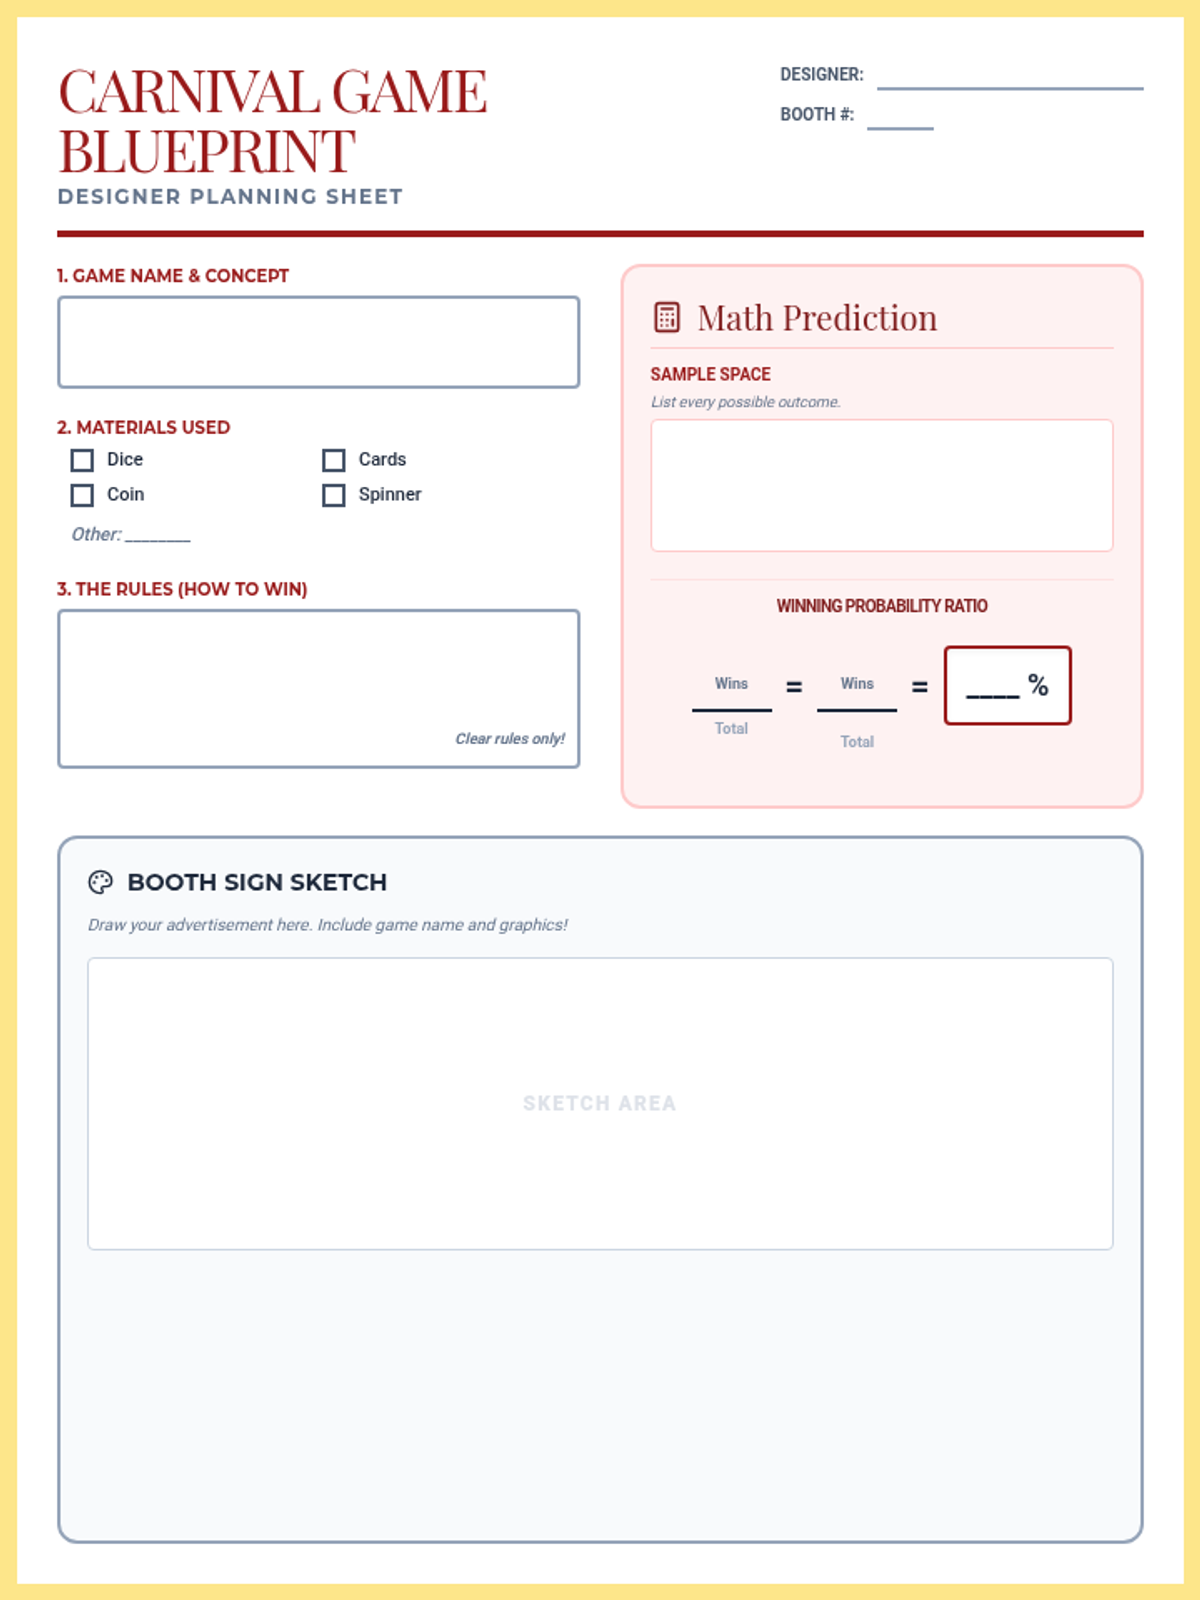
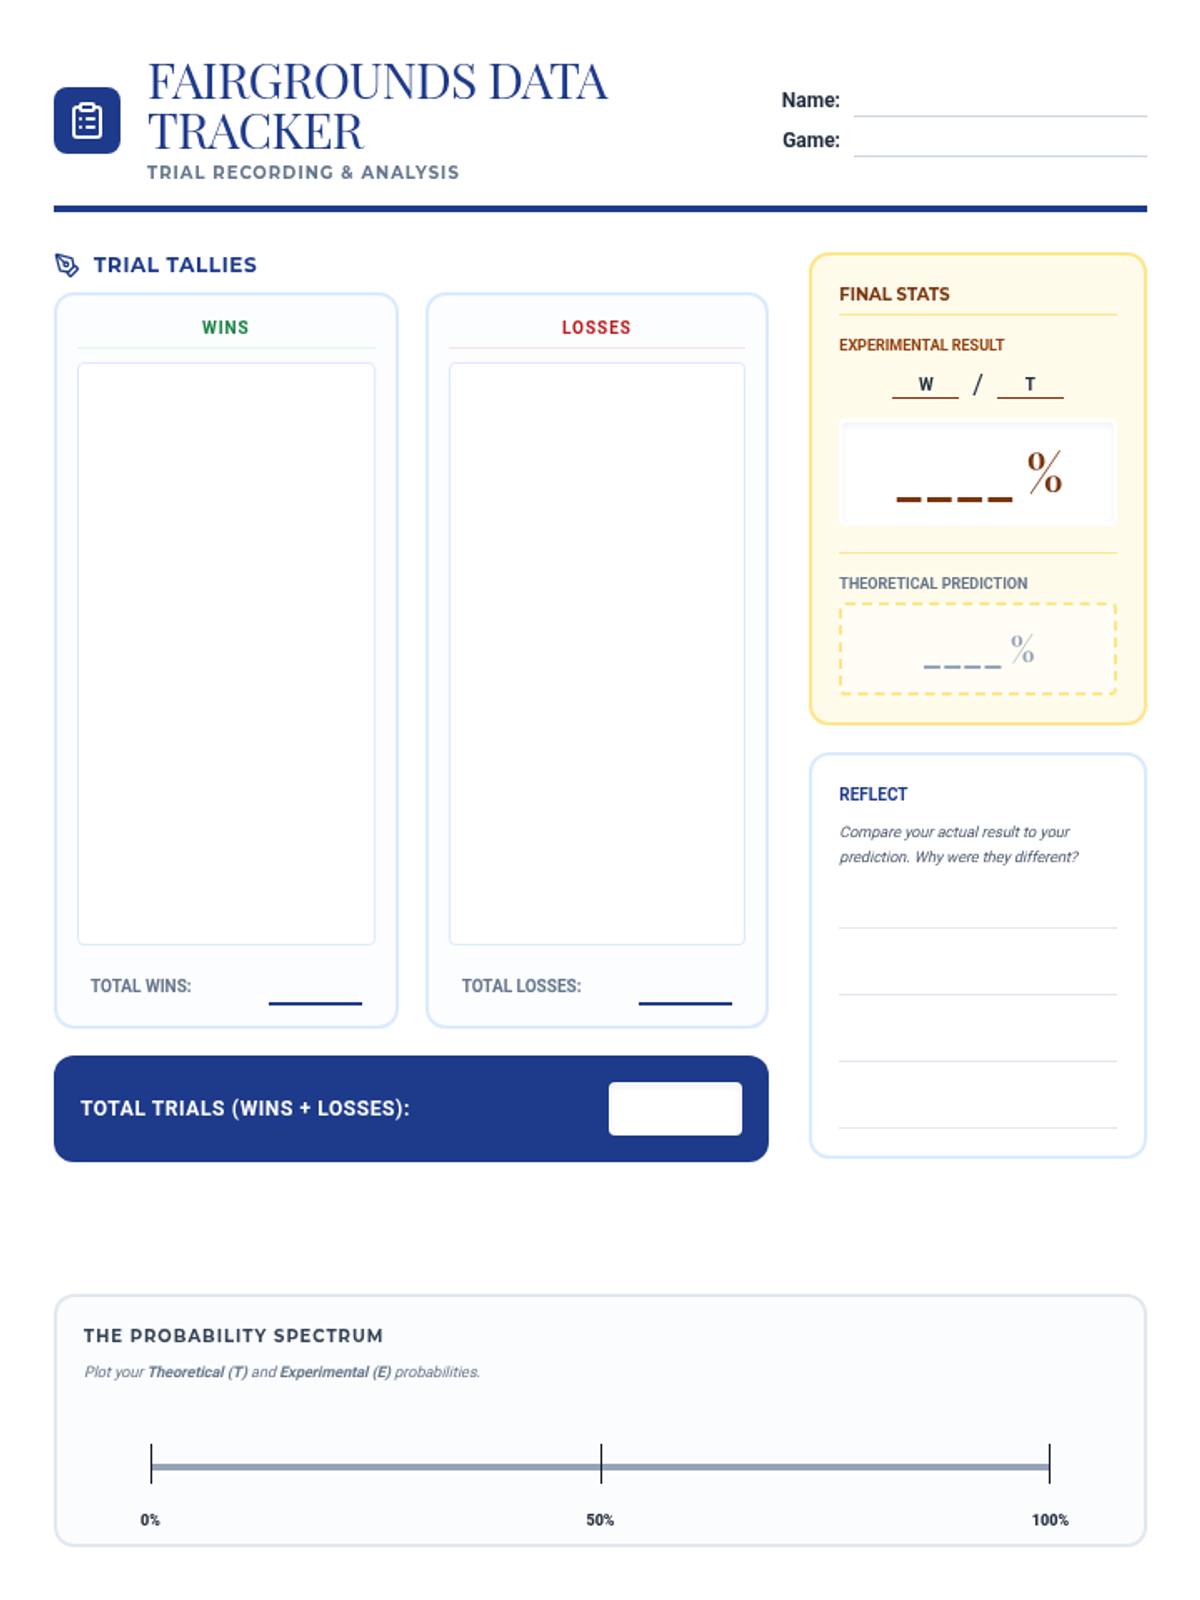
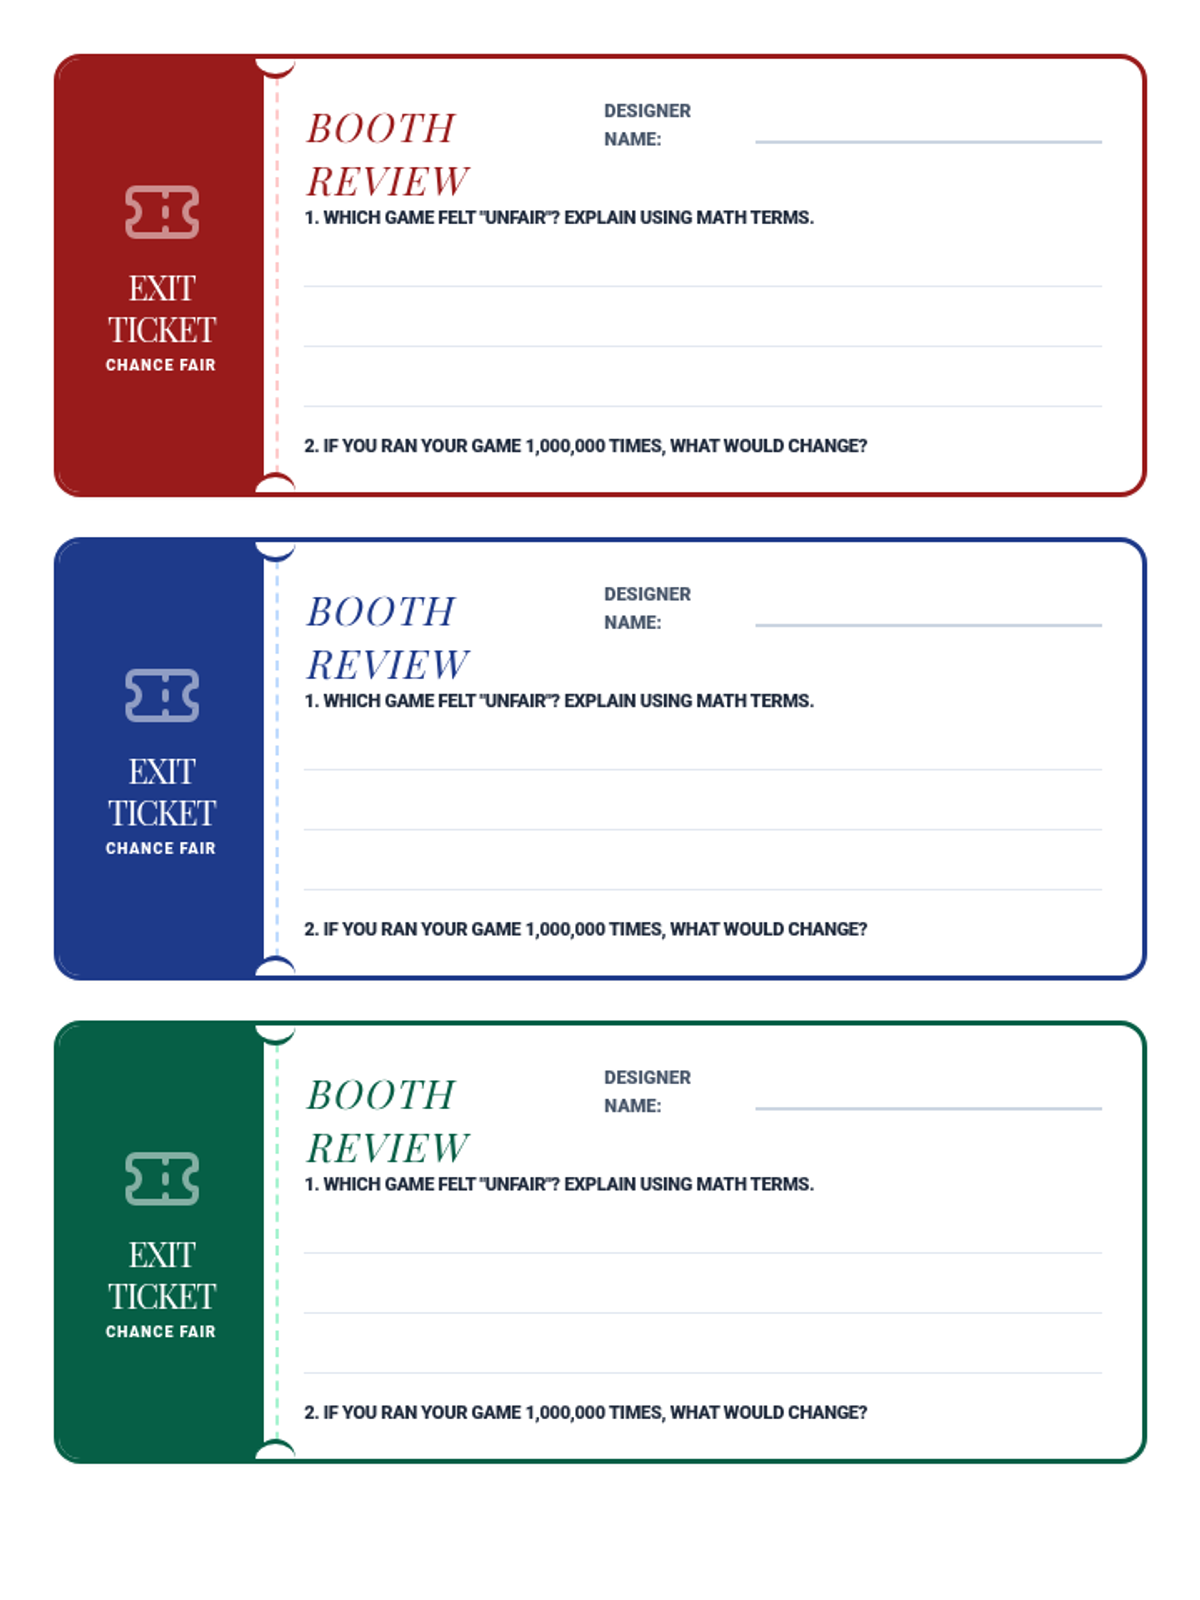
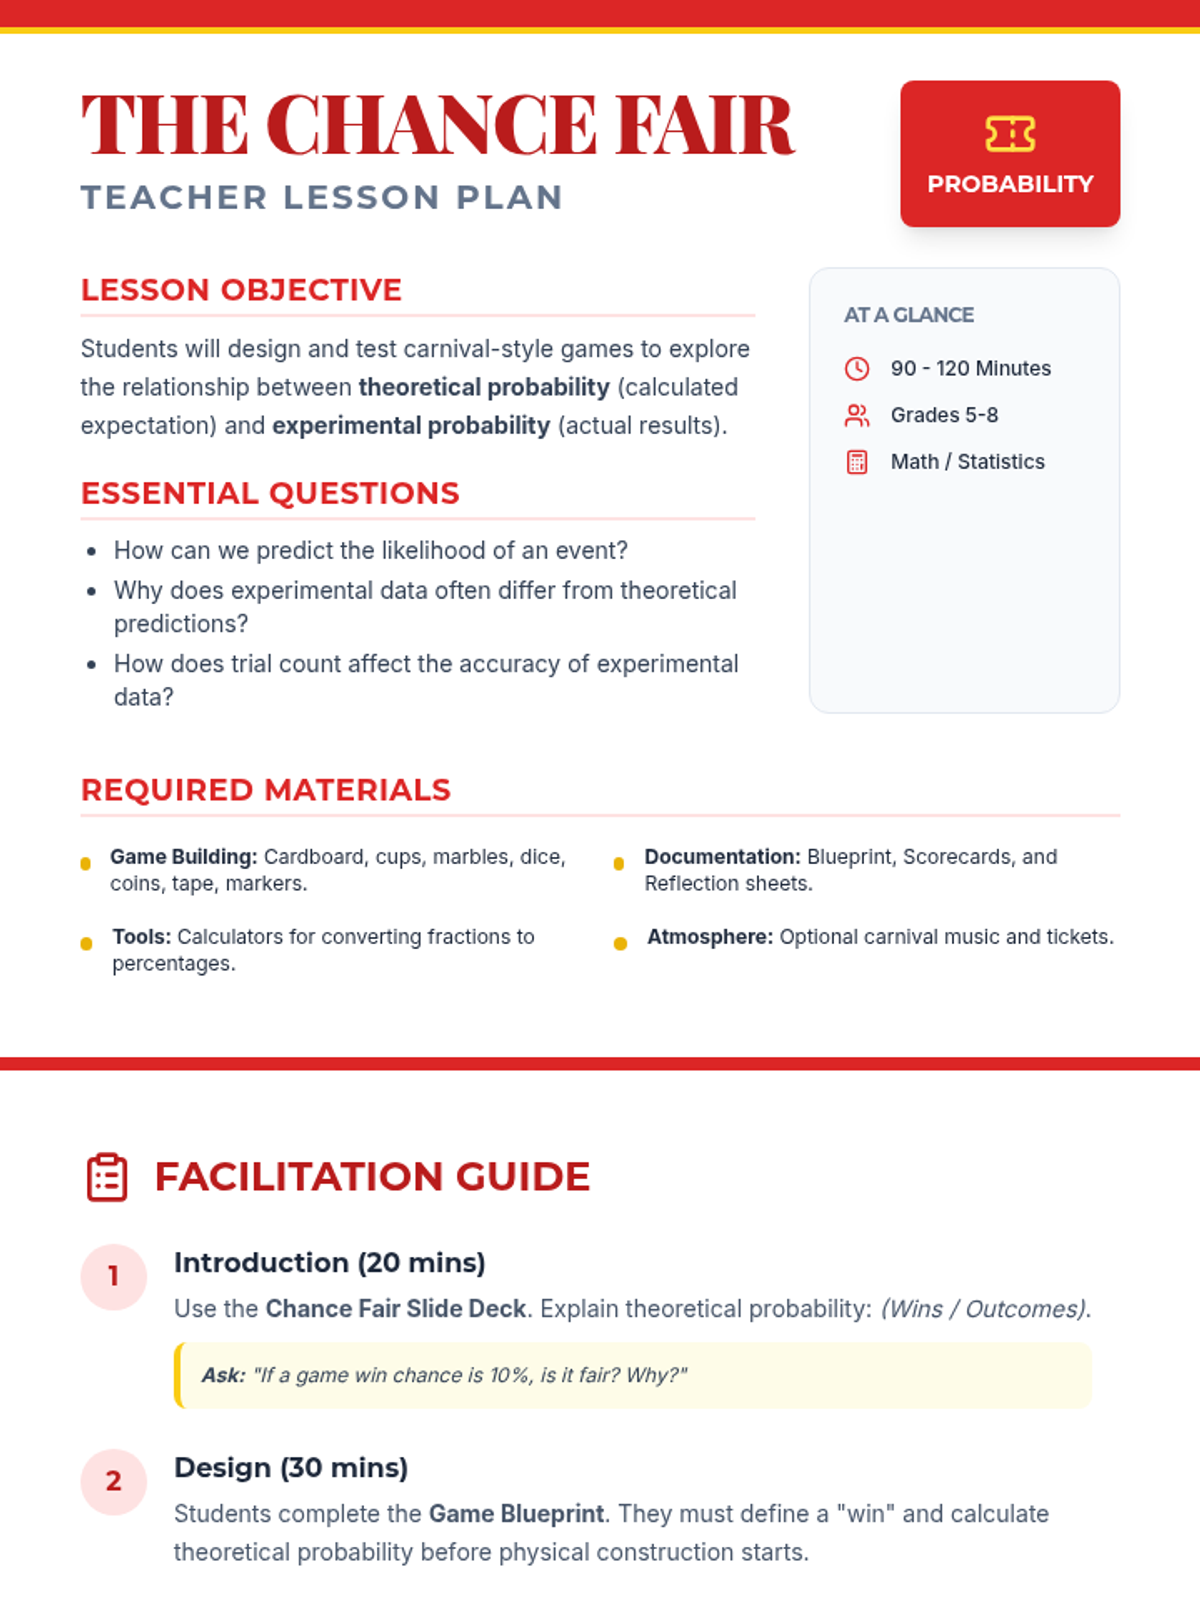
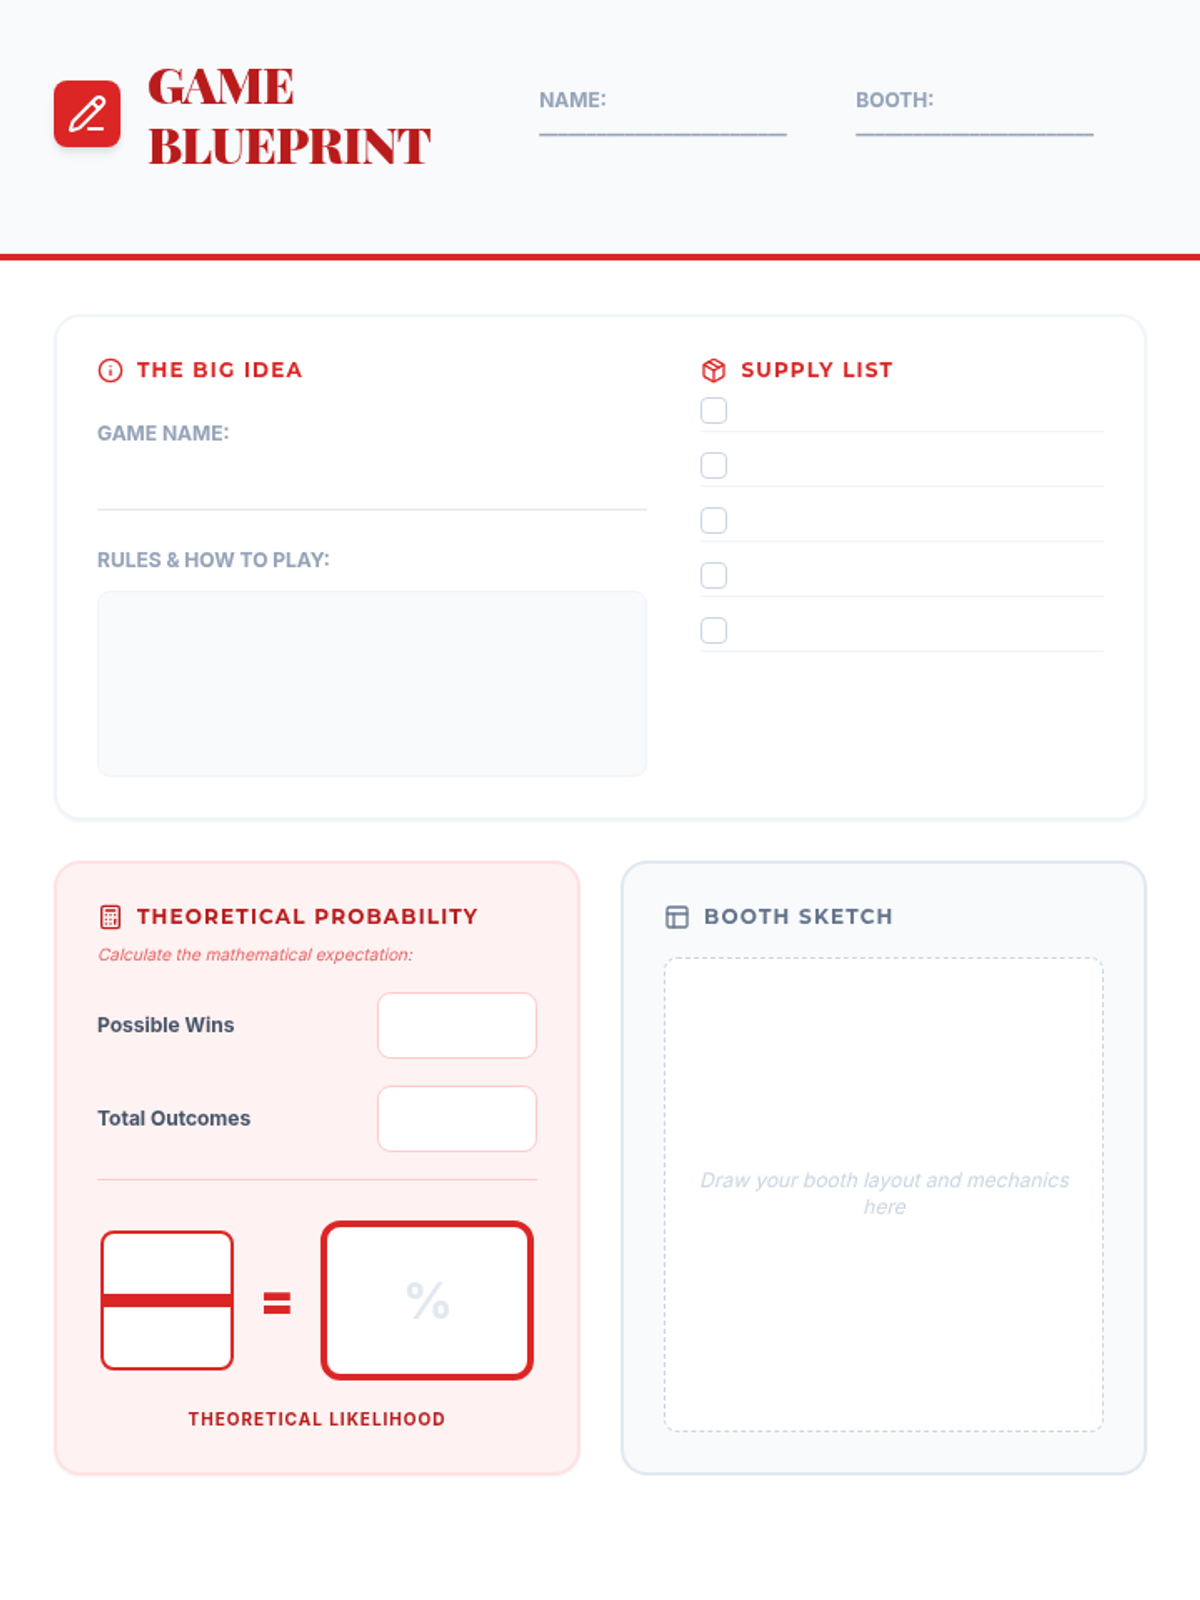
A hands-on math project where students design carnival games to explore theoretical versus experimental probability through data collection and analysis.
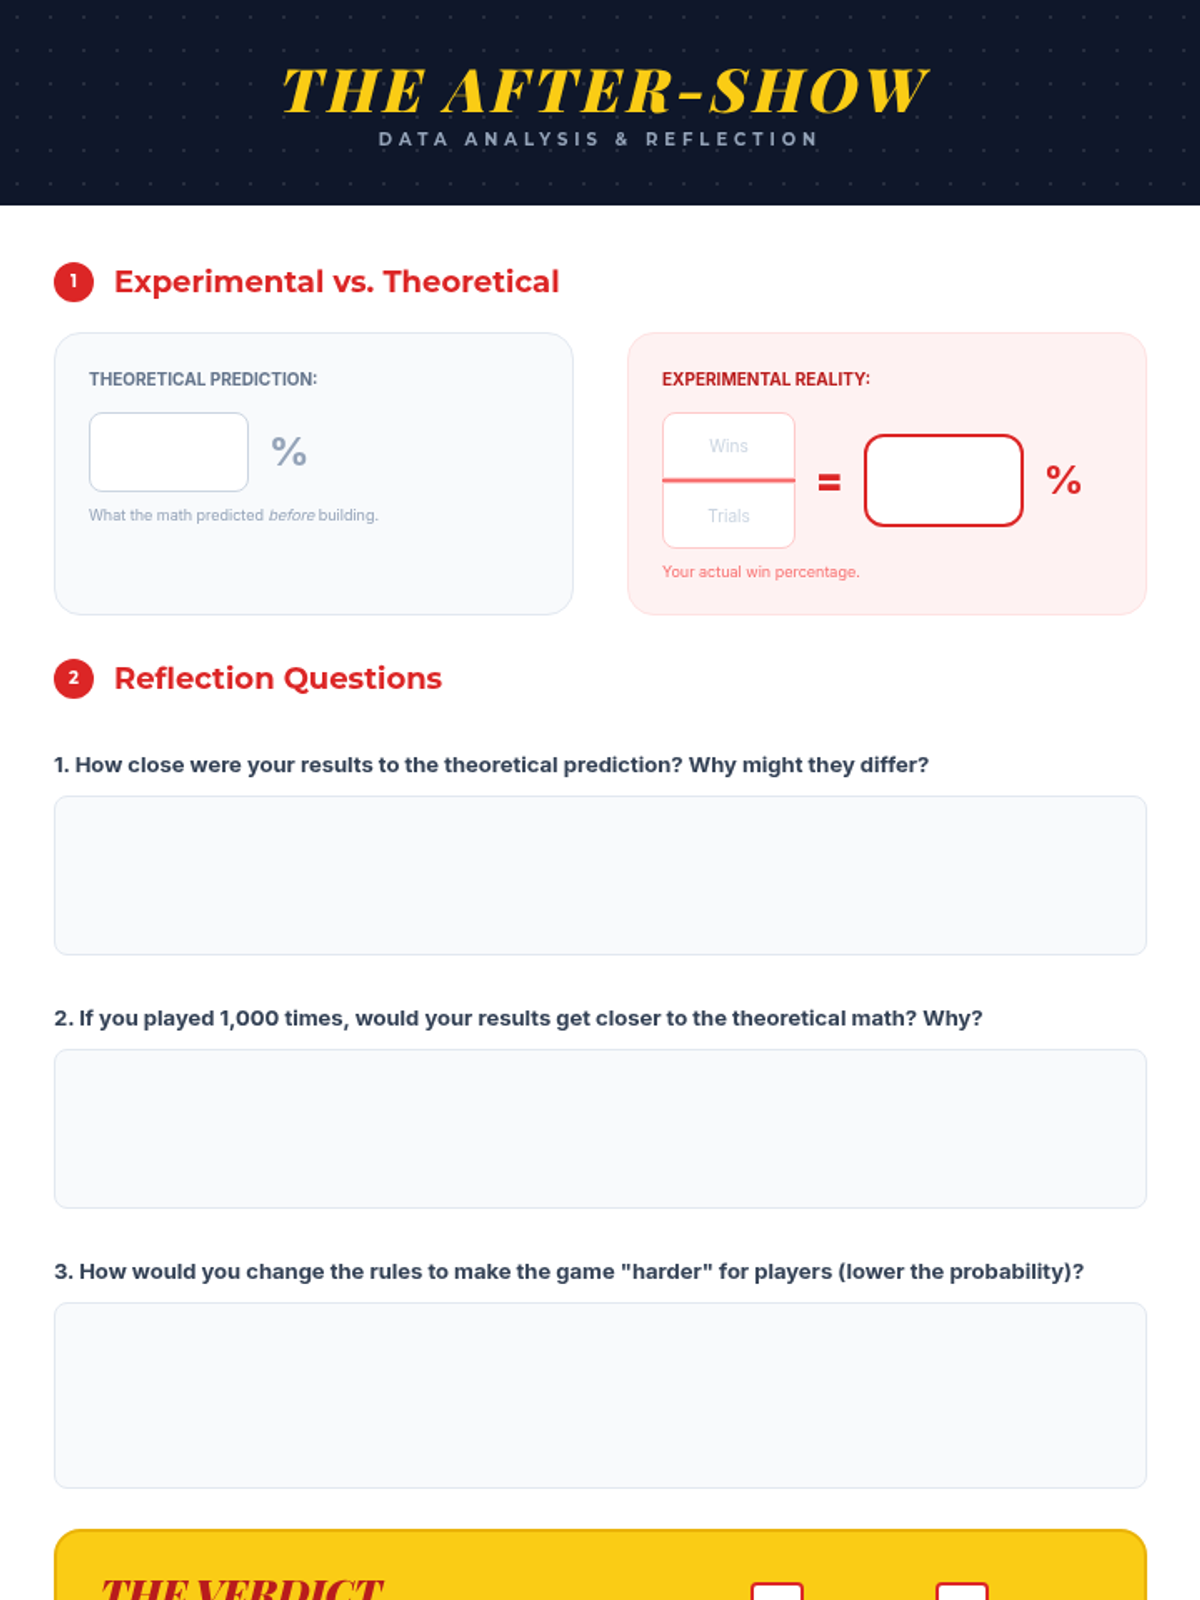
A hands-on probability project where students design, build, and test carnival games. They will calculate theoretical probability, collect experimental data, and analyze the results to understand statistical likelihood.
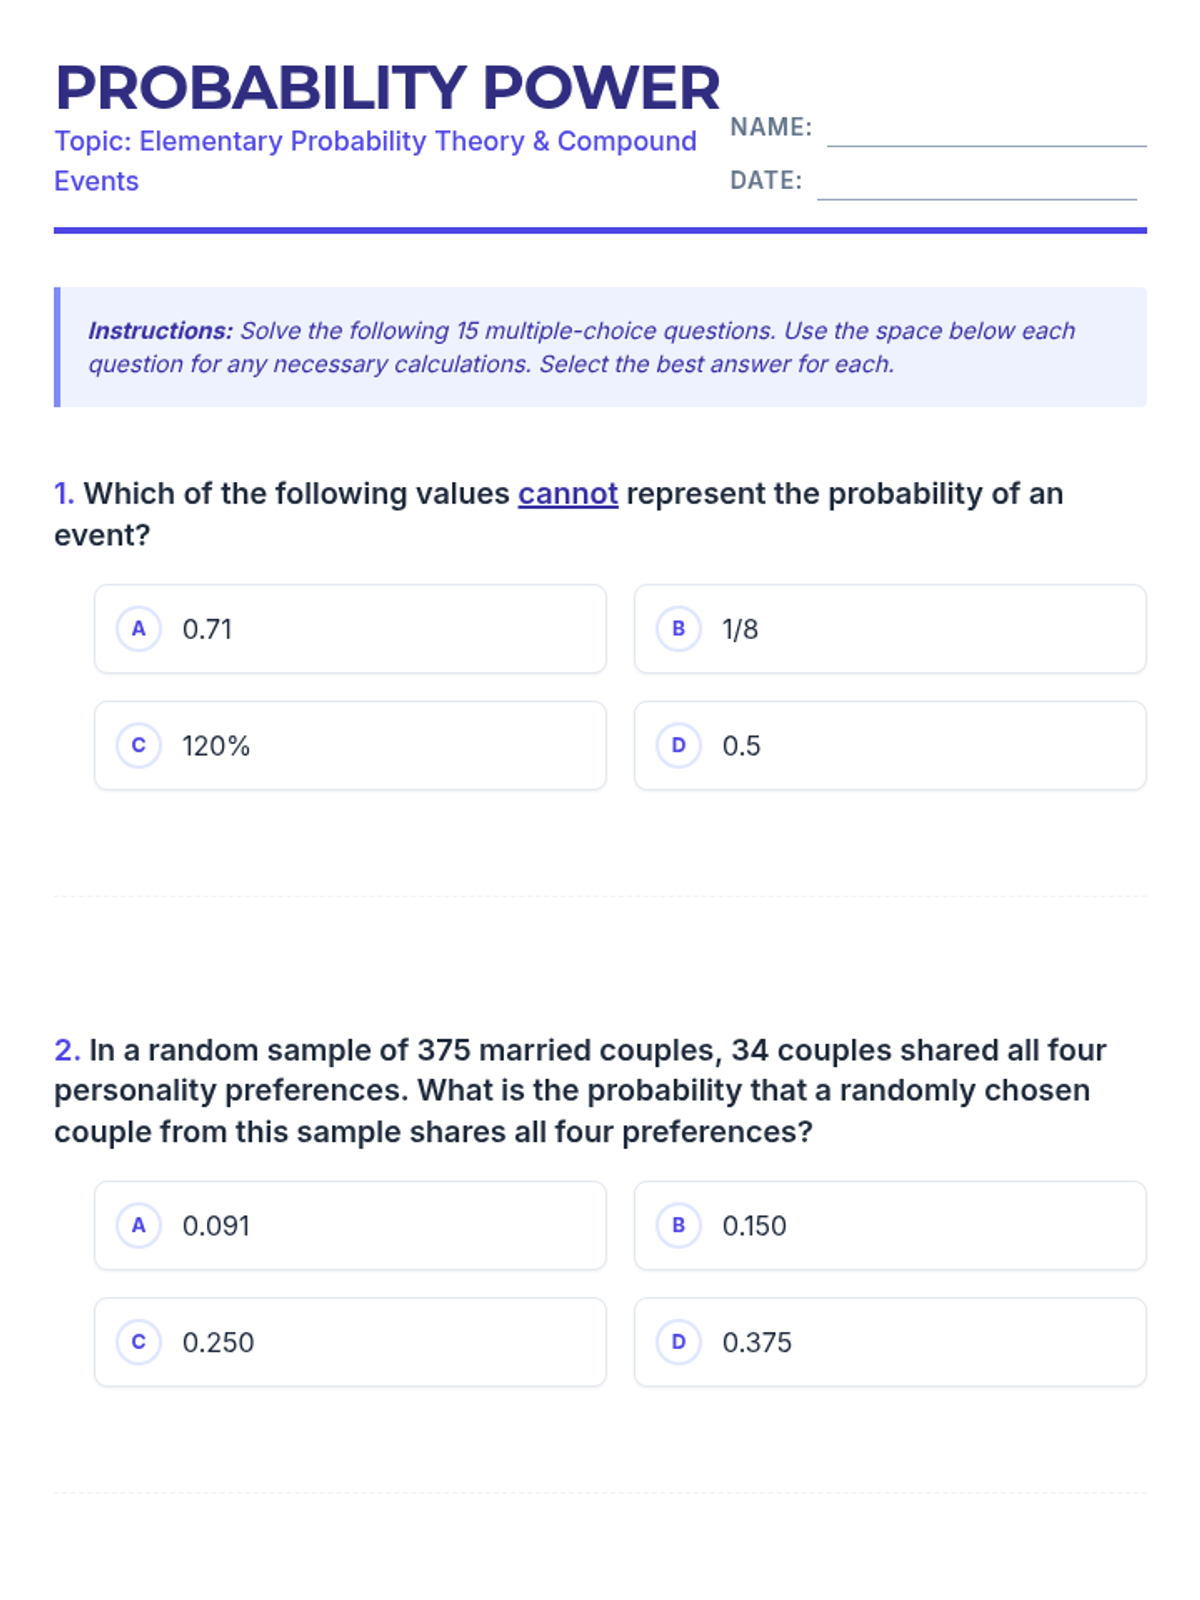
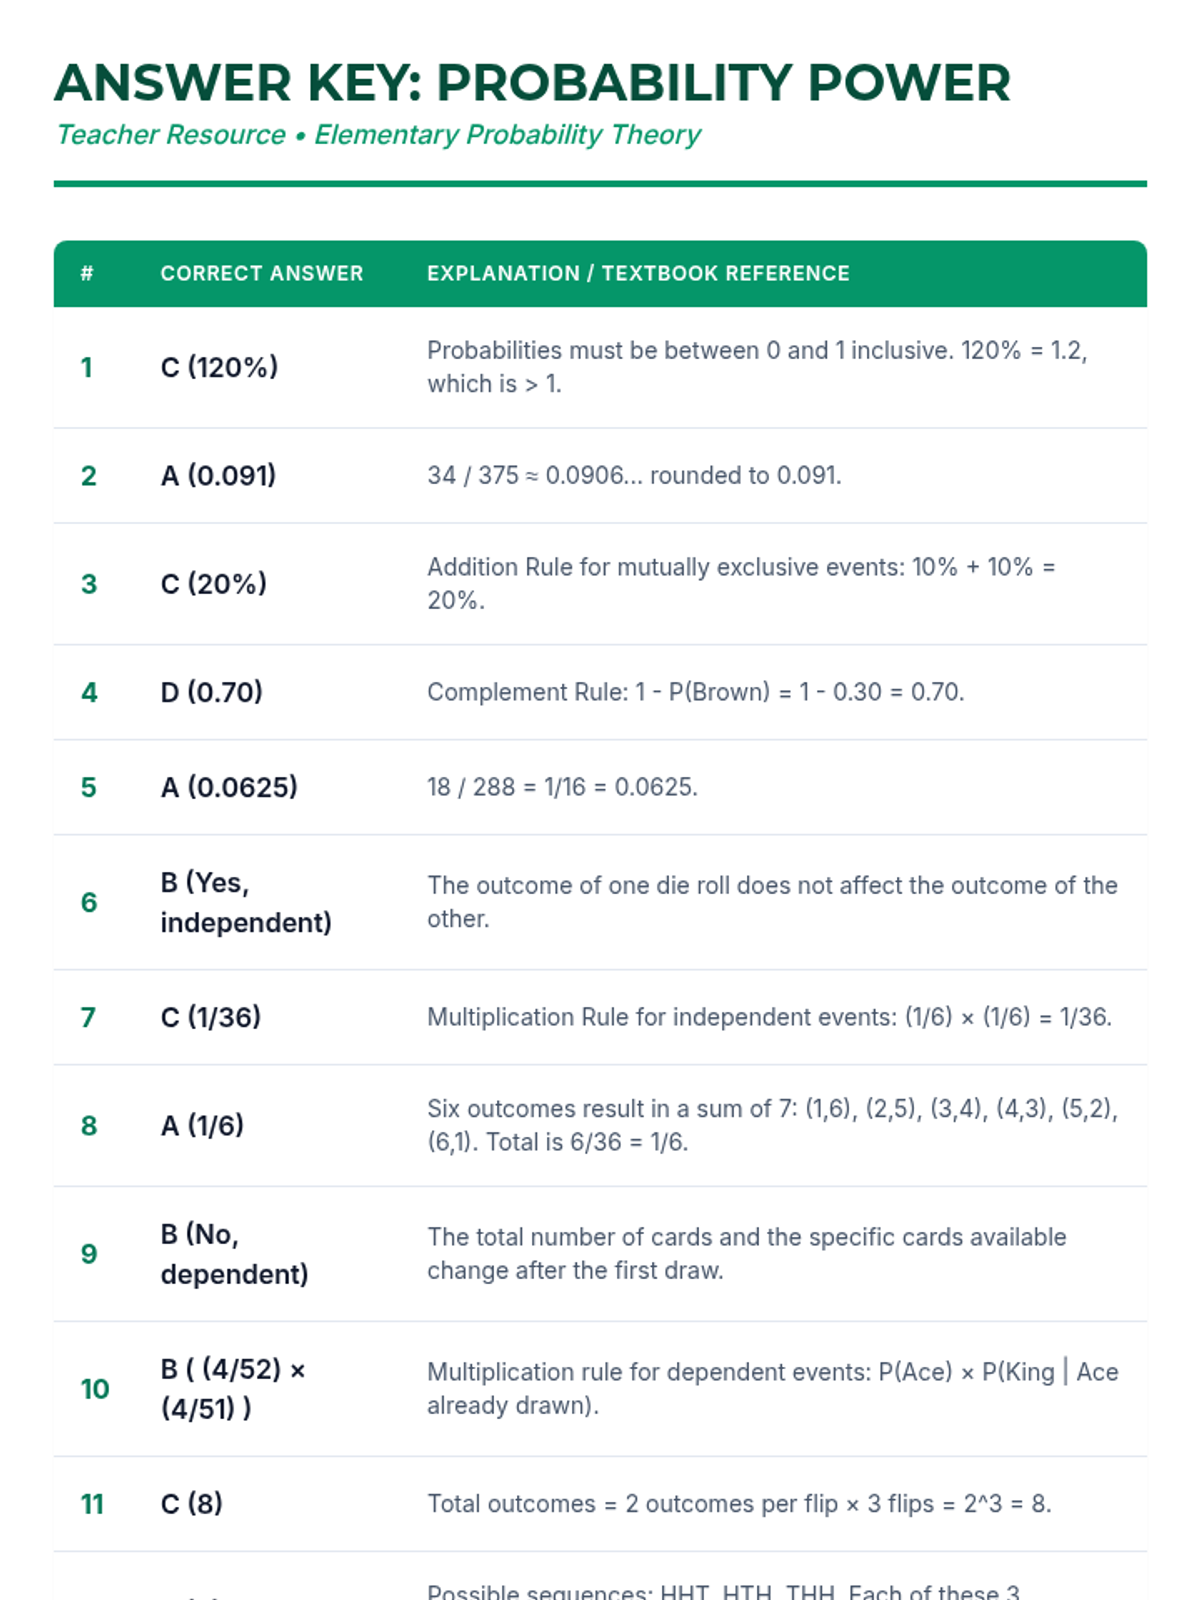
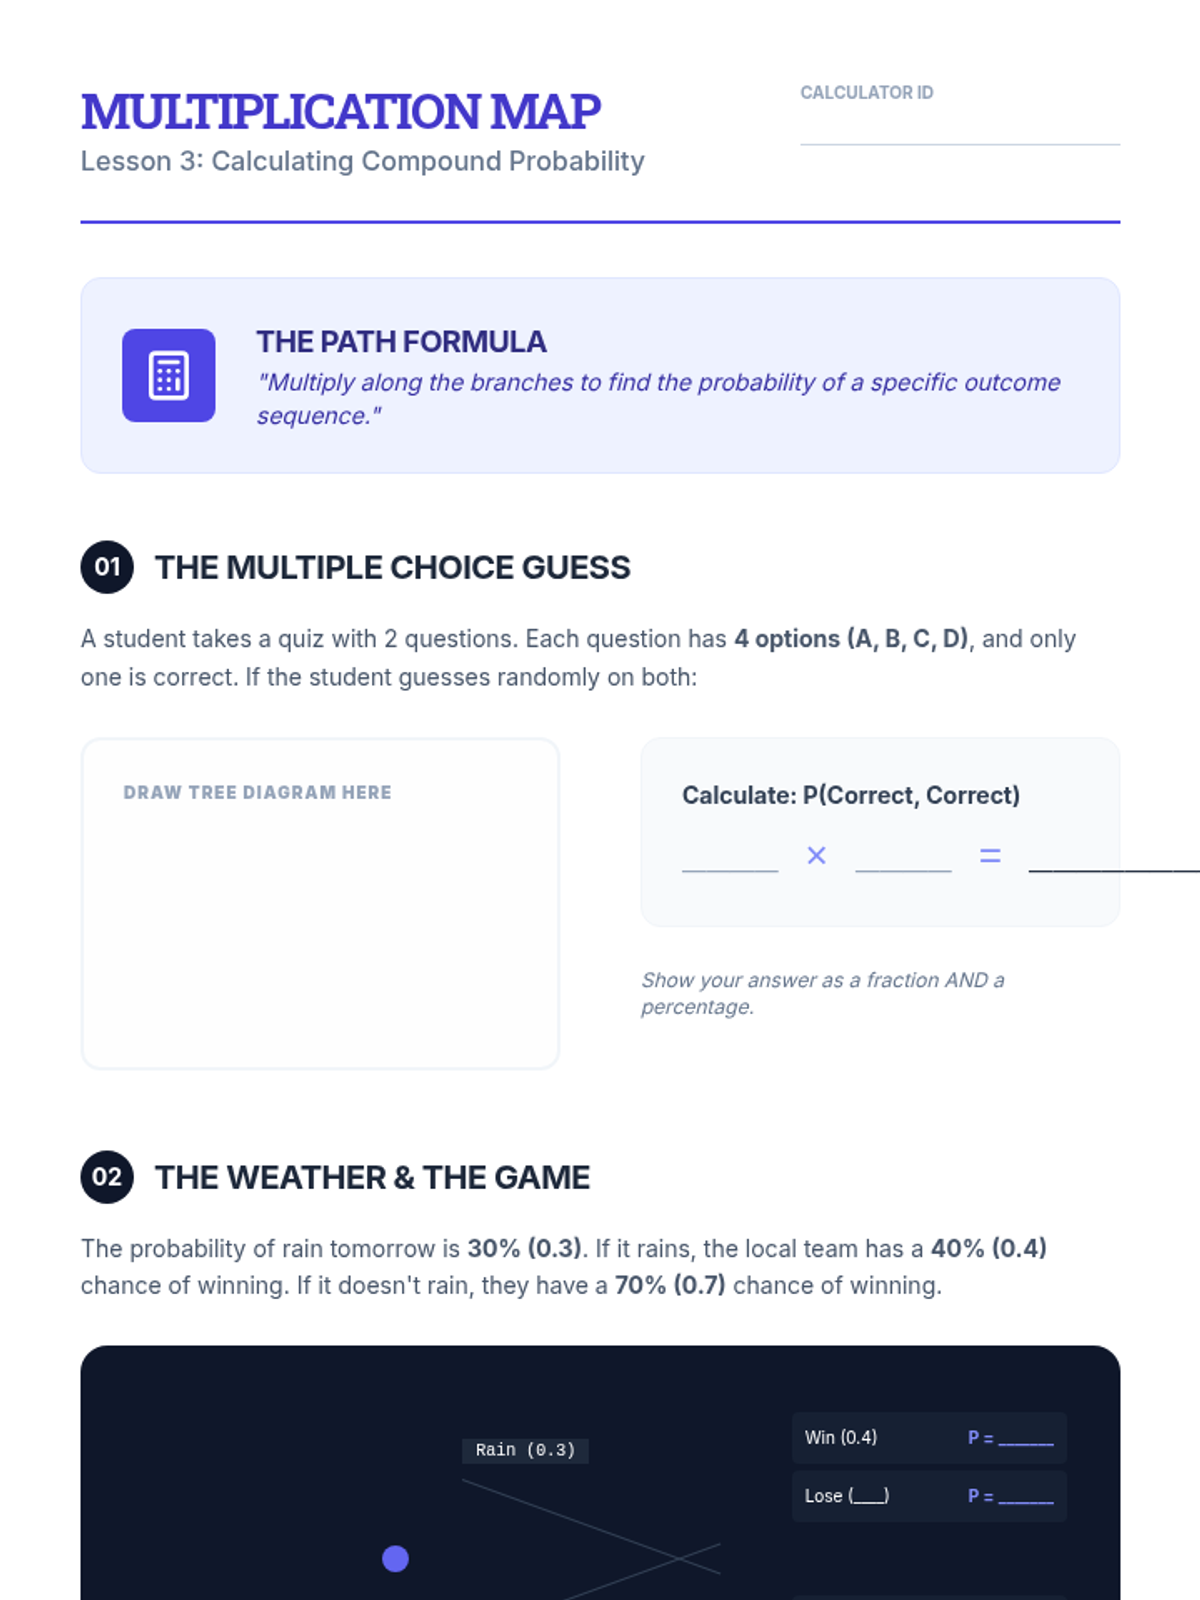
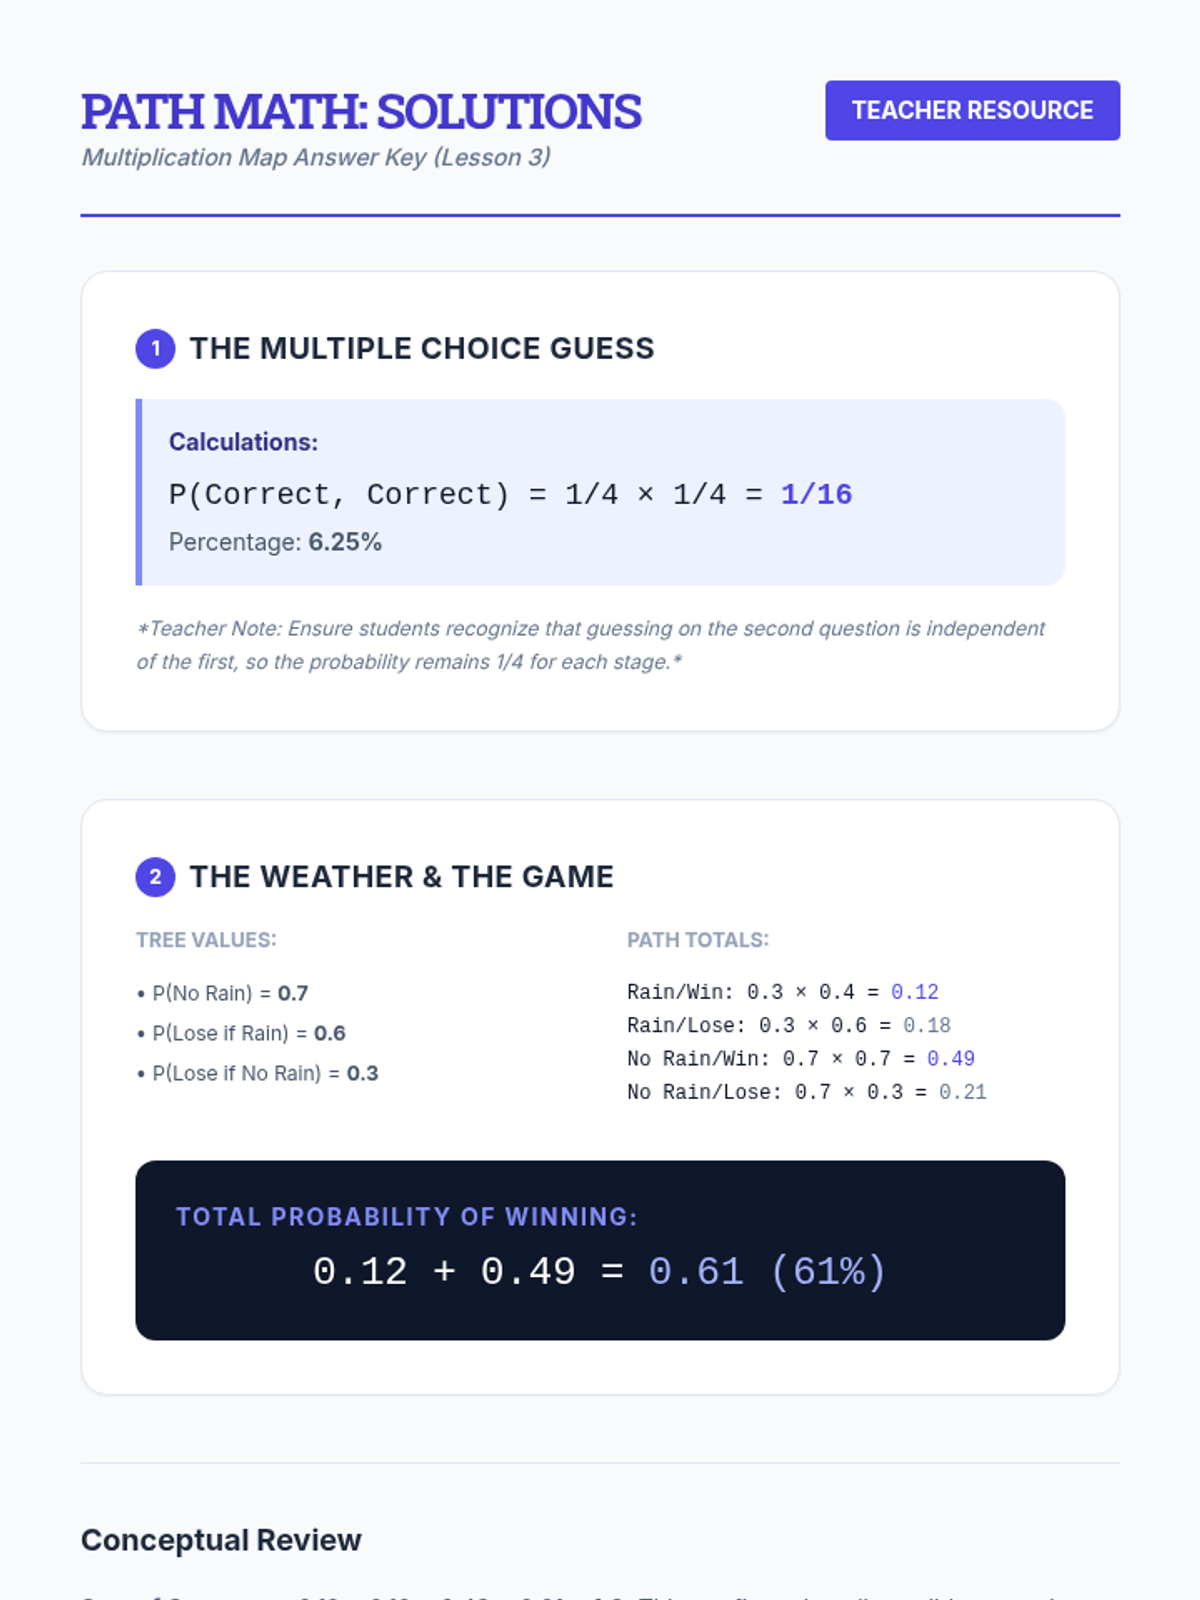
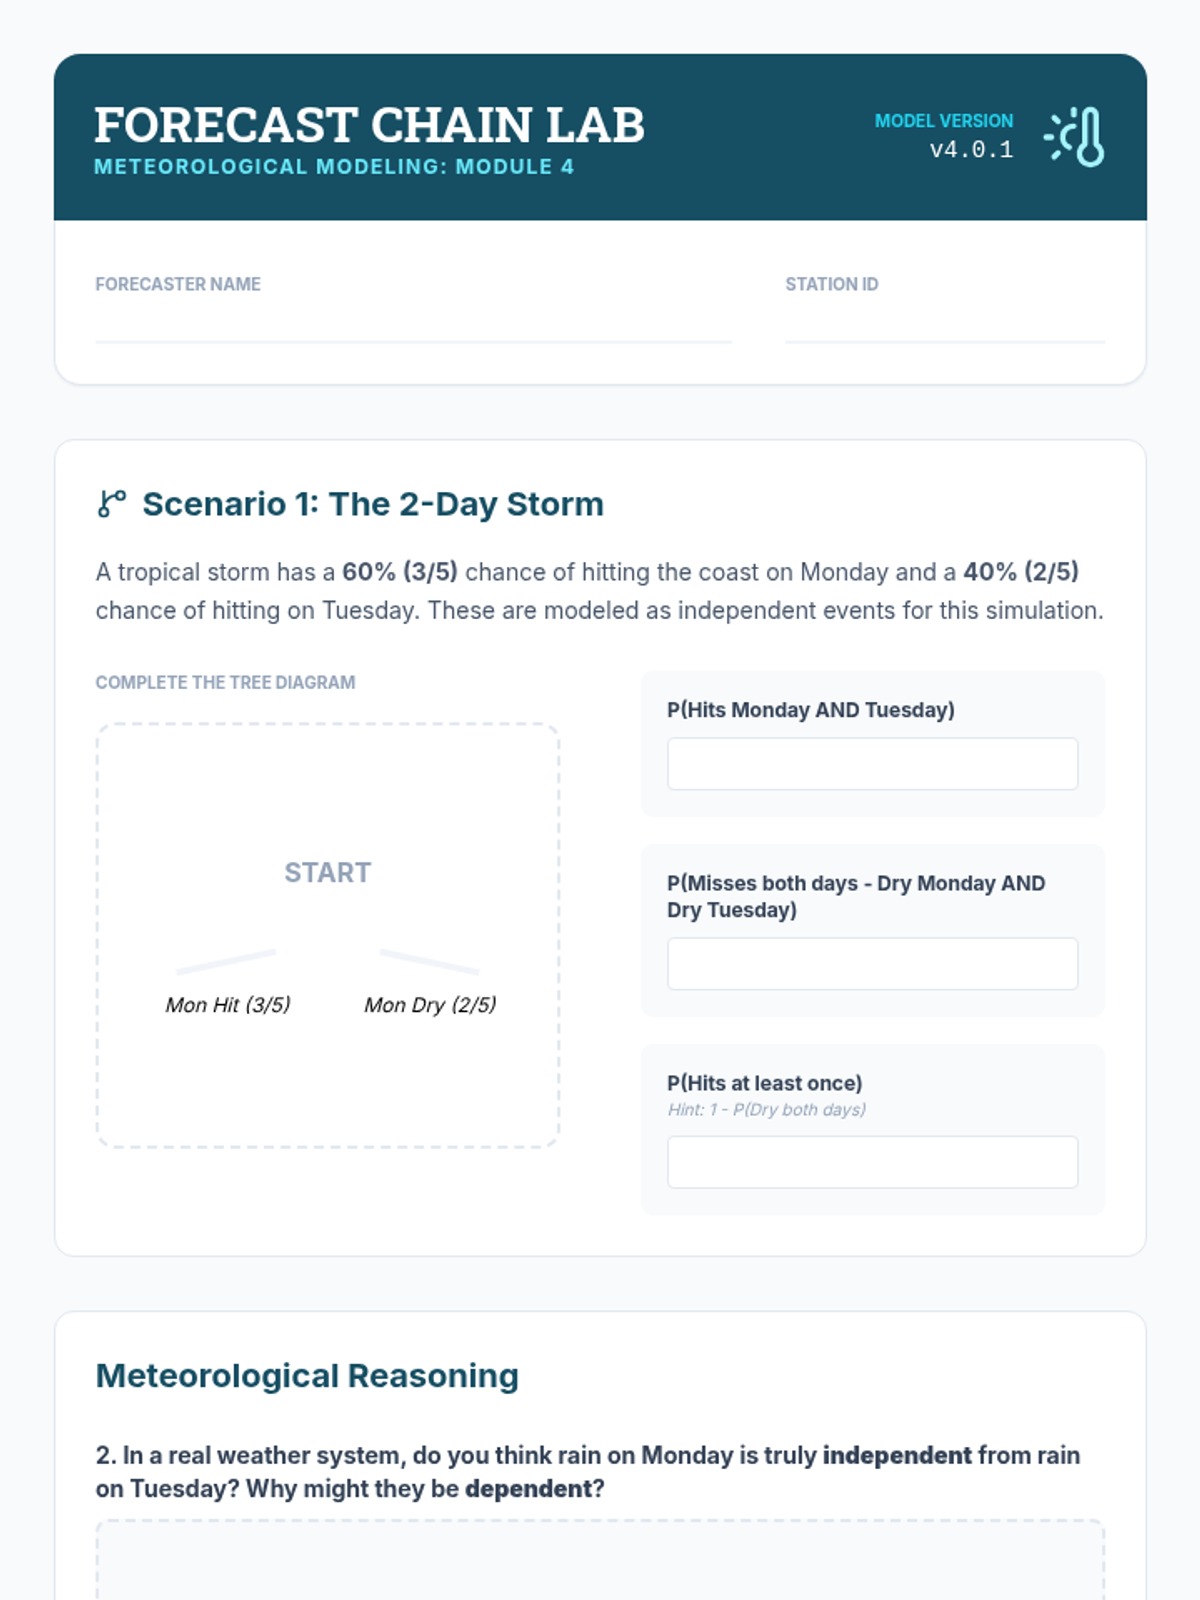
A comprehensive lesson on elementary probability theory covering valid probability ranges, compound events, independent and dependent outcomes, and tree diagrams based on textbook problems.
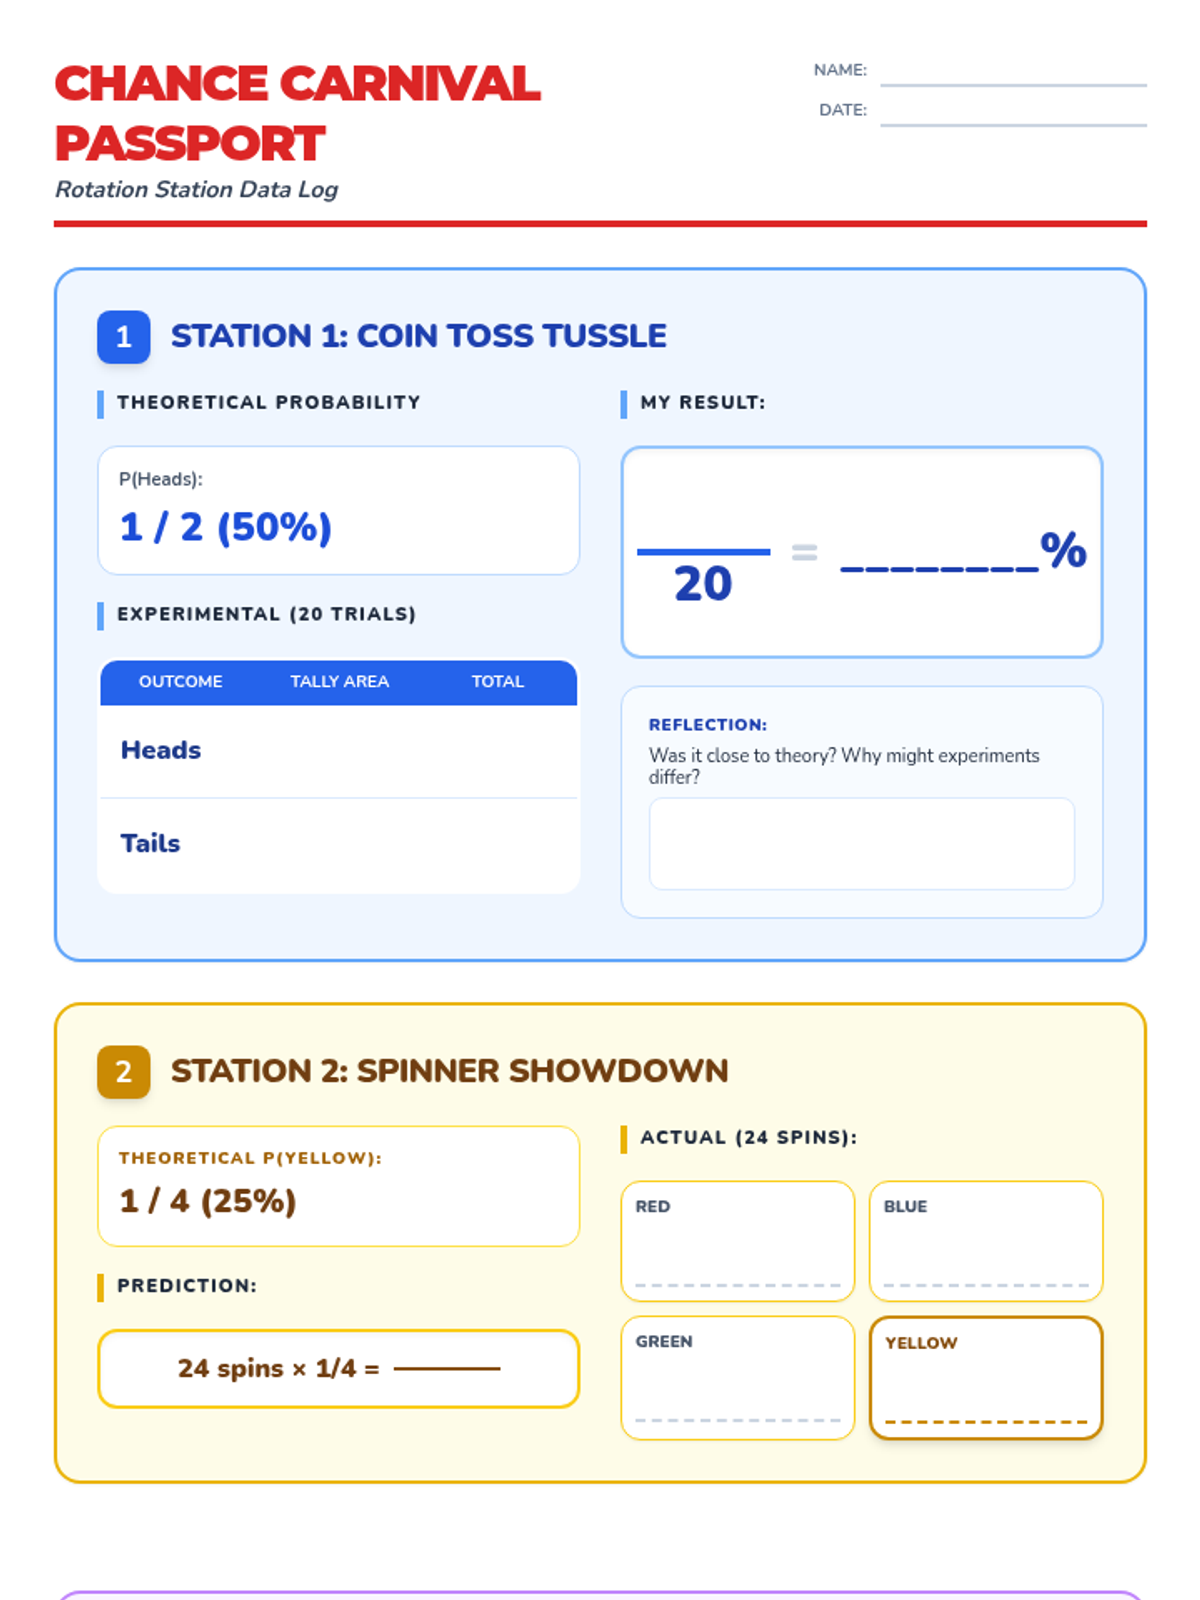
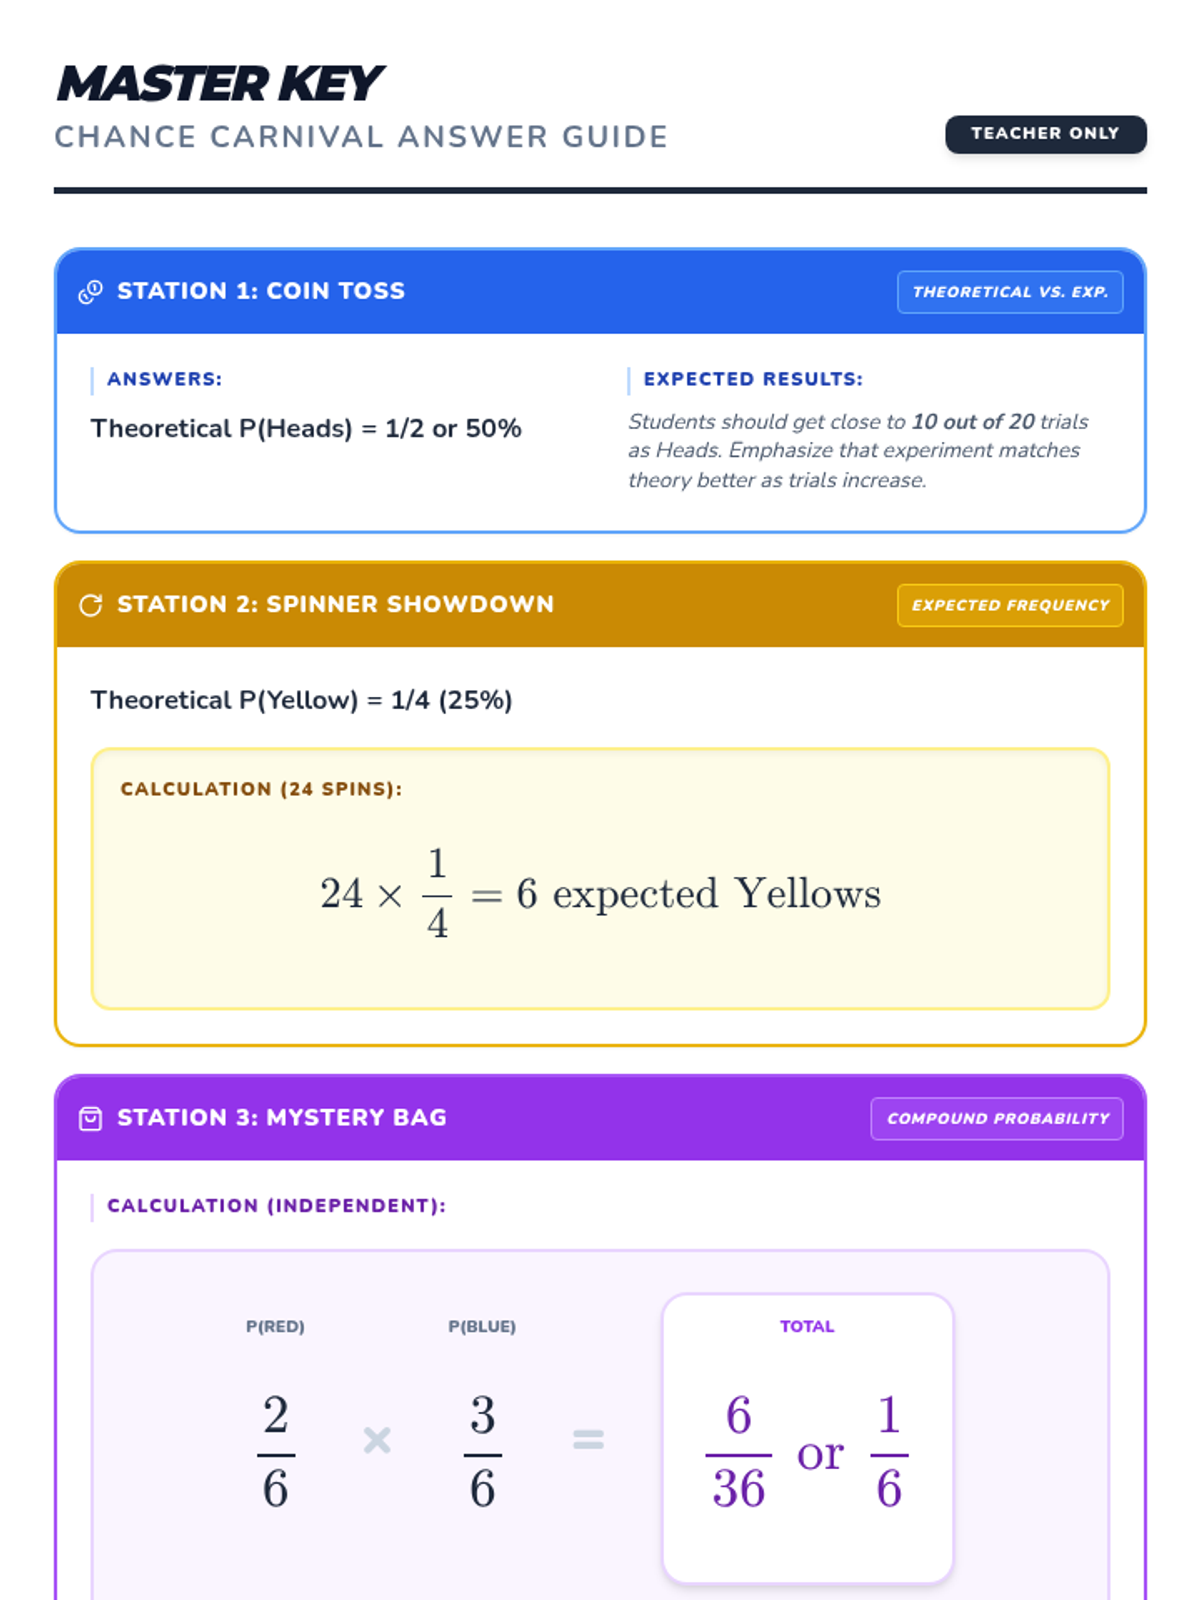
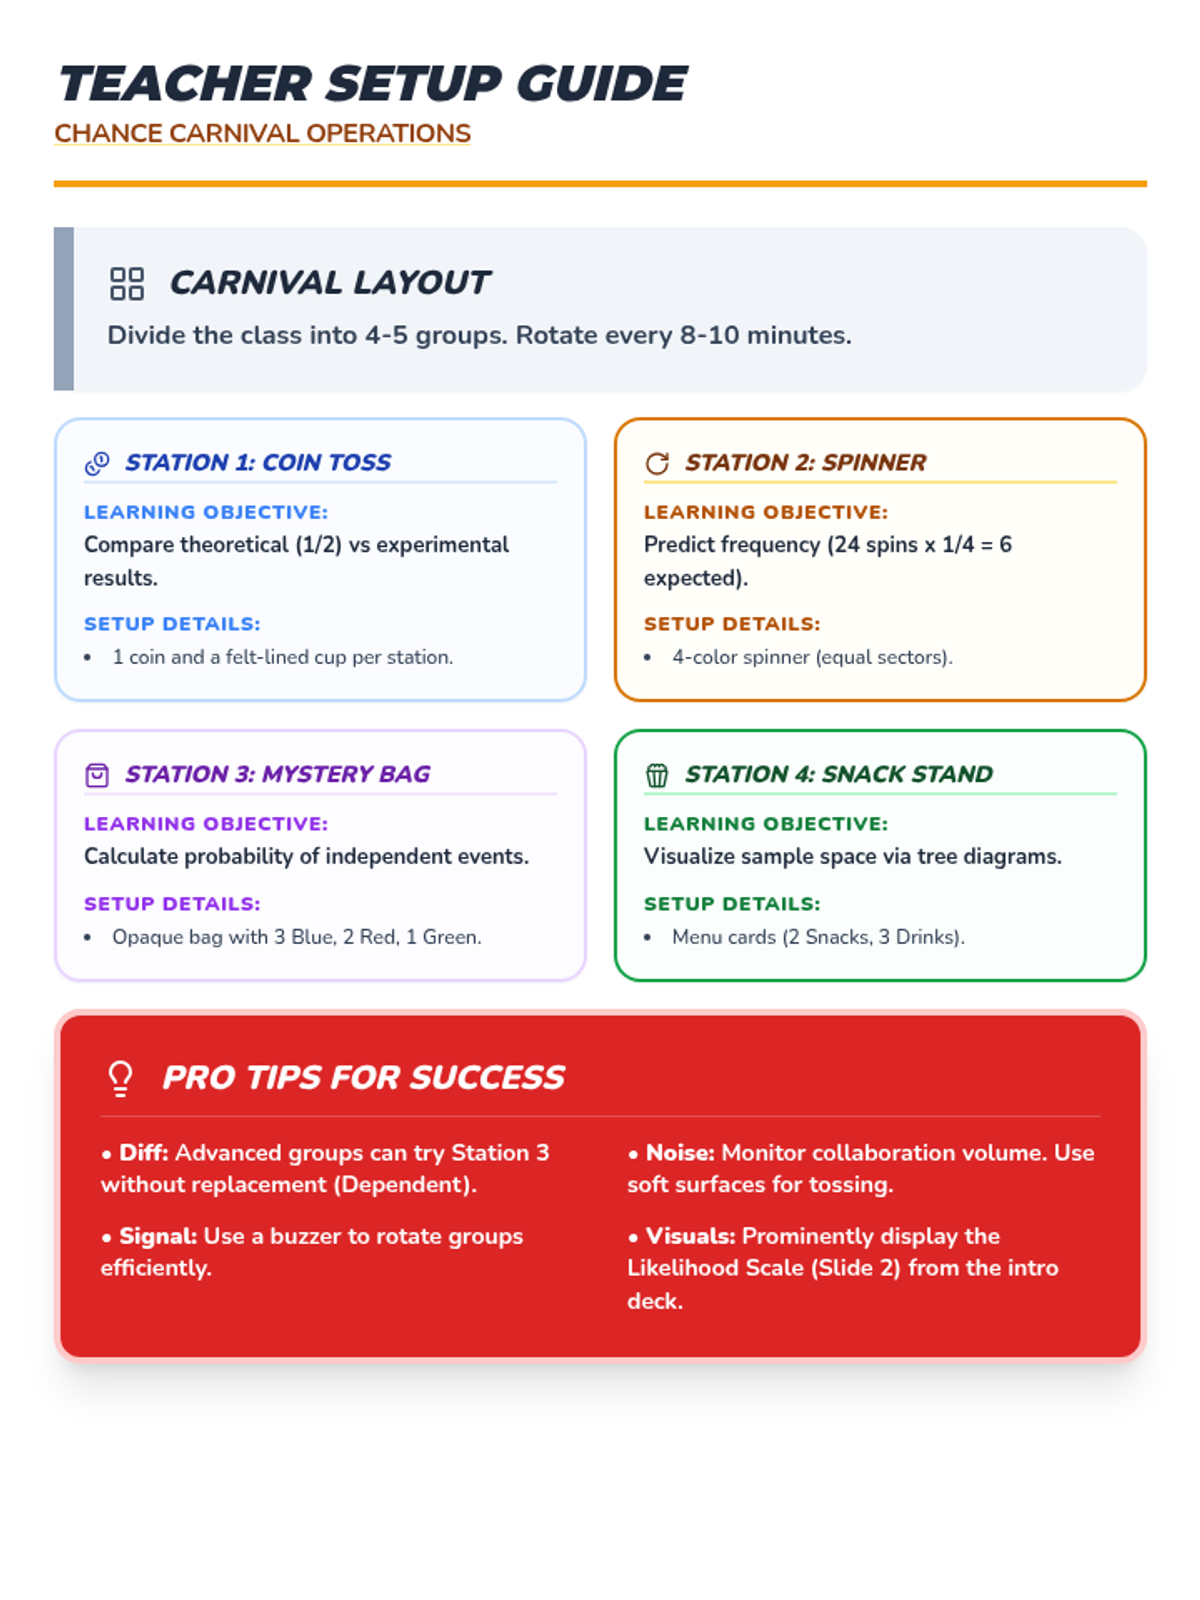
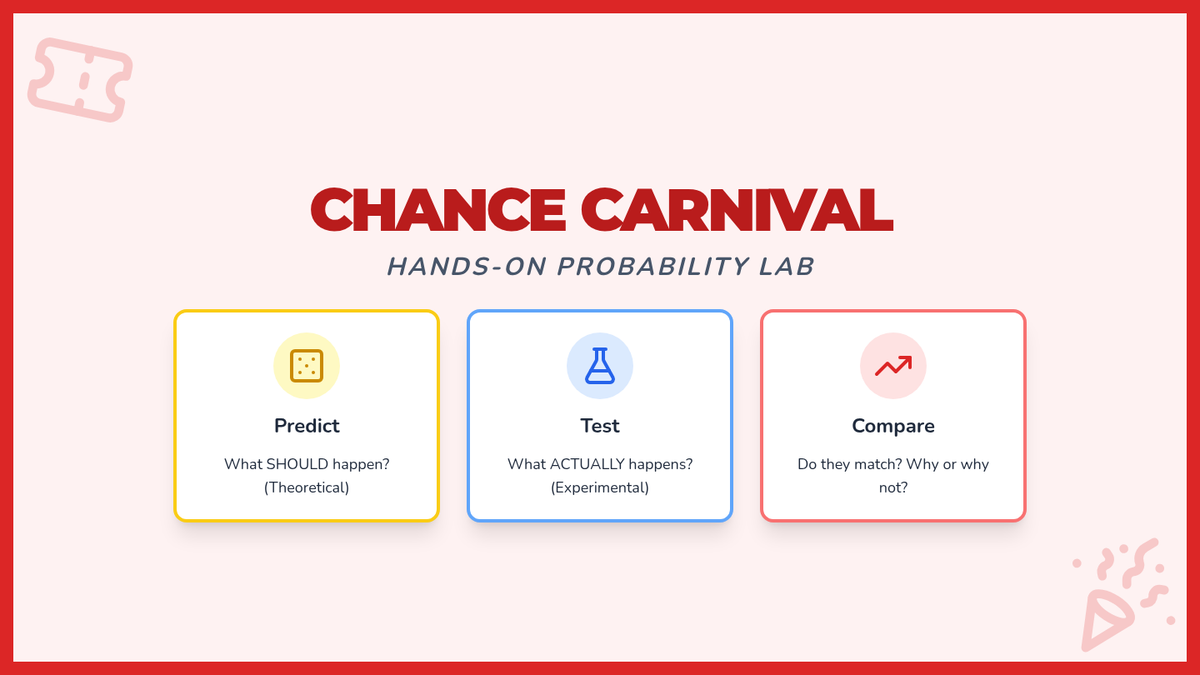
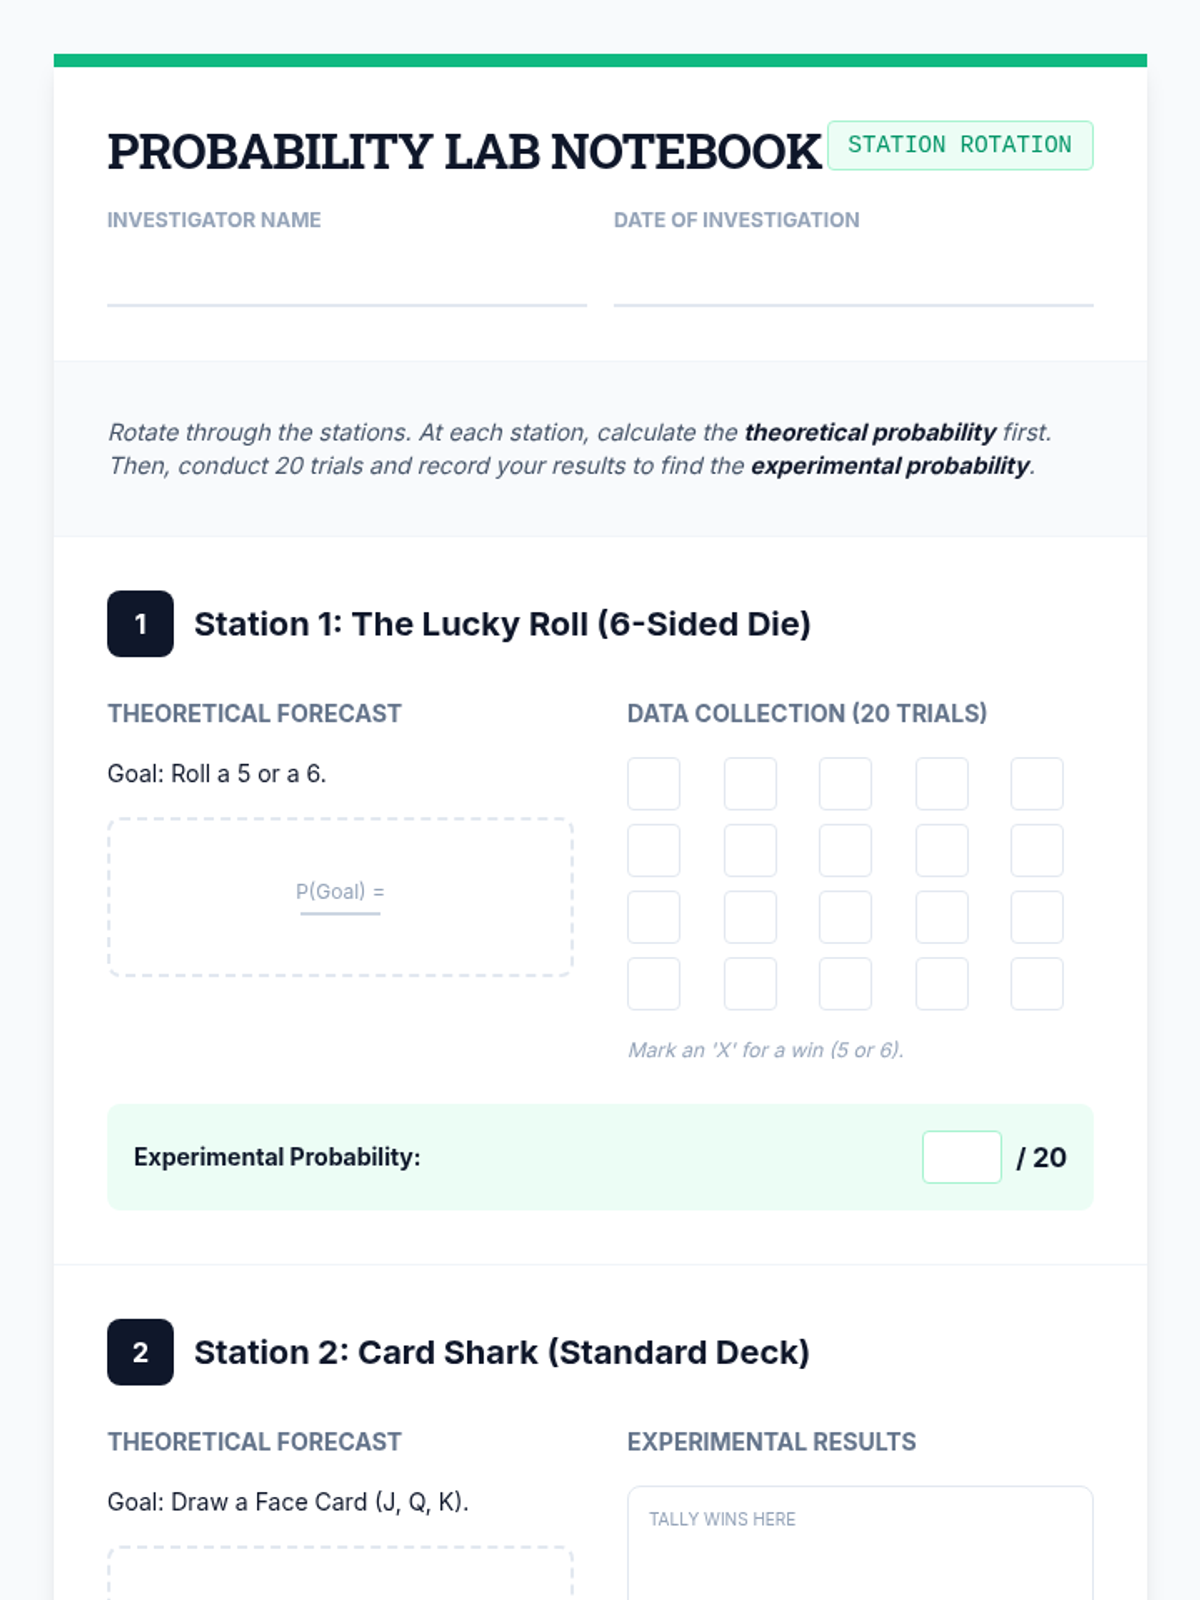
A hands-on probability lab where students rotate through various 'carnival' stations to explore theoretical and experimental probability, compound events, and tree diagrams.
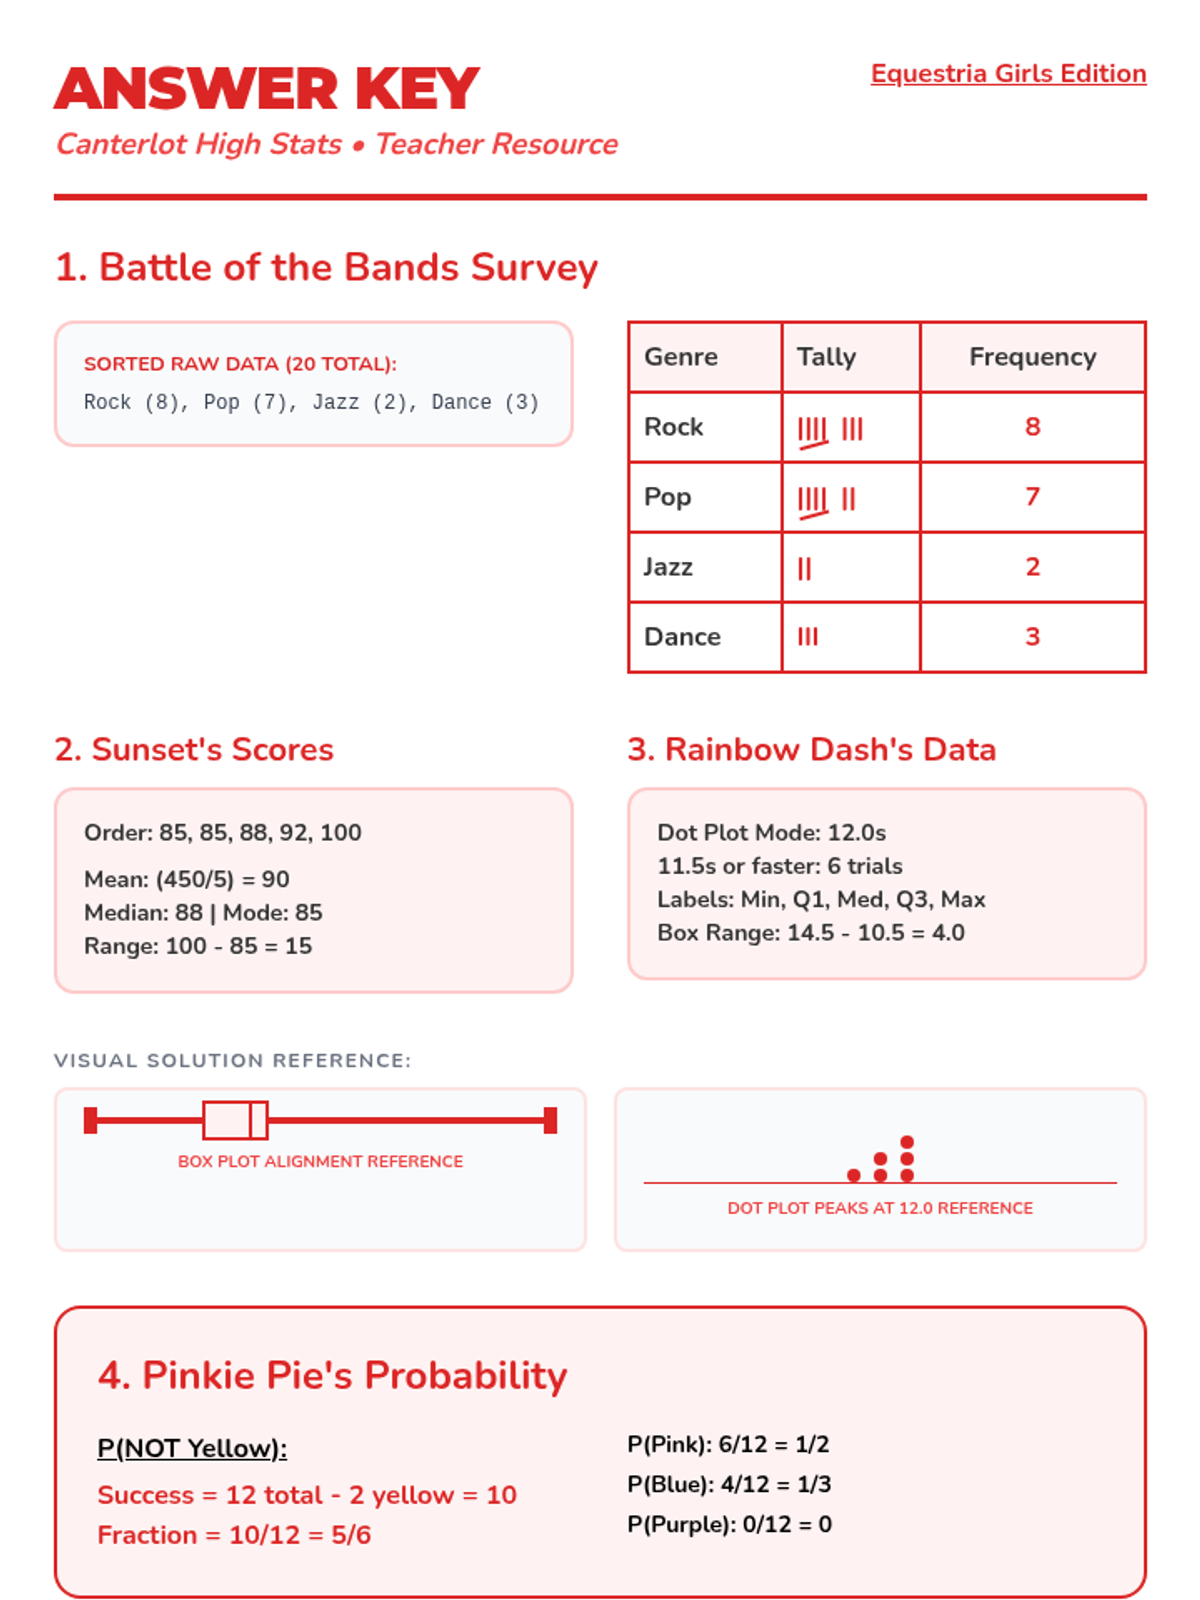
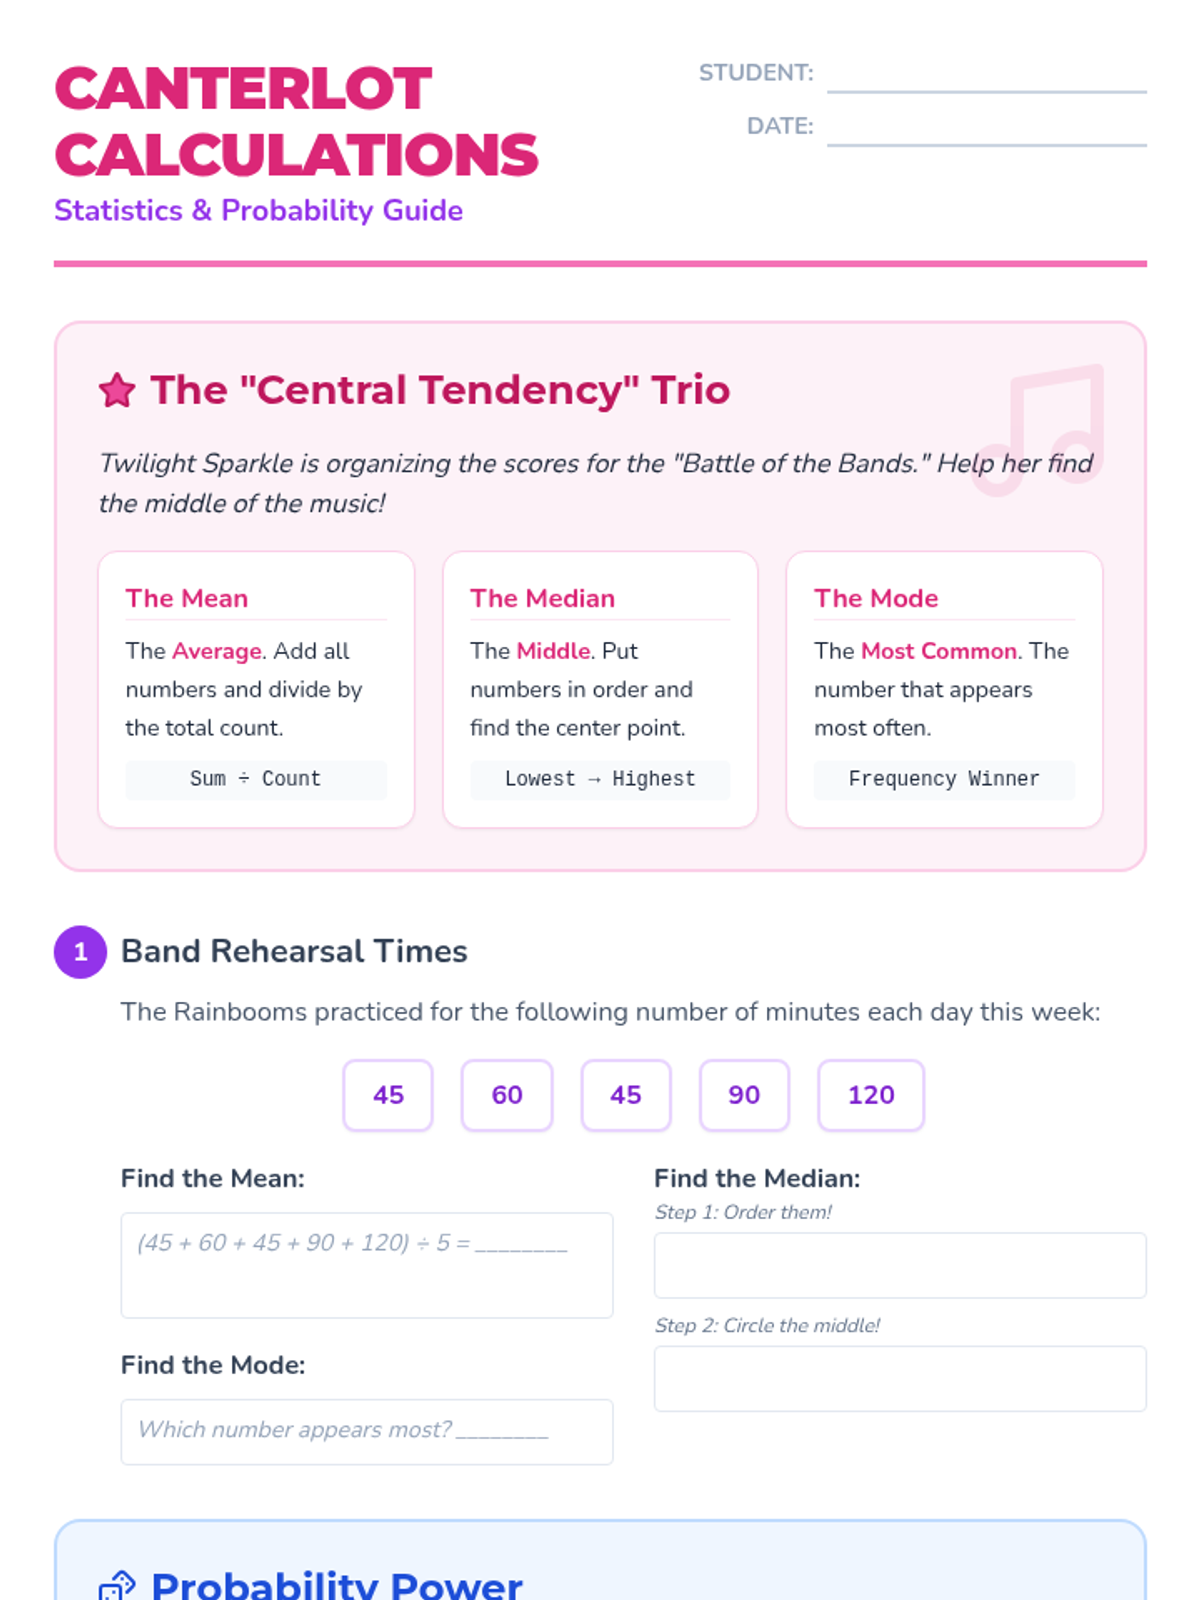
A statistics lesson themed around Canterlot High and the Equestria Girls, covering measures of center, data visualization, and simple probability. Students will help their favorite characters analyze school data through engaging, themed problems.
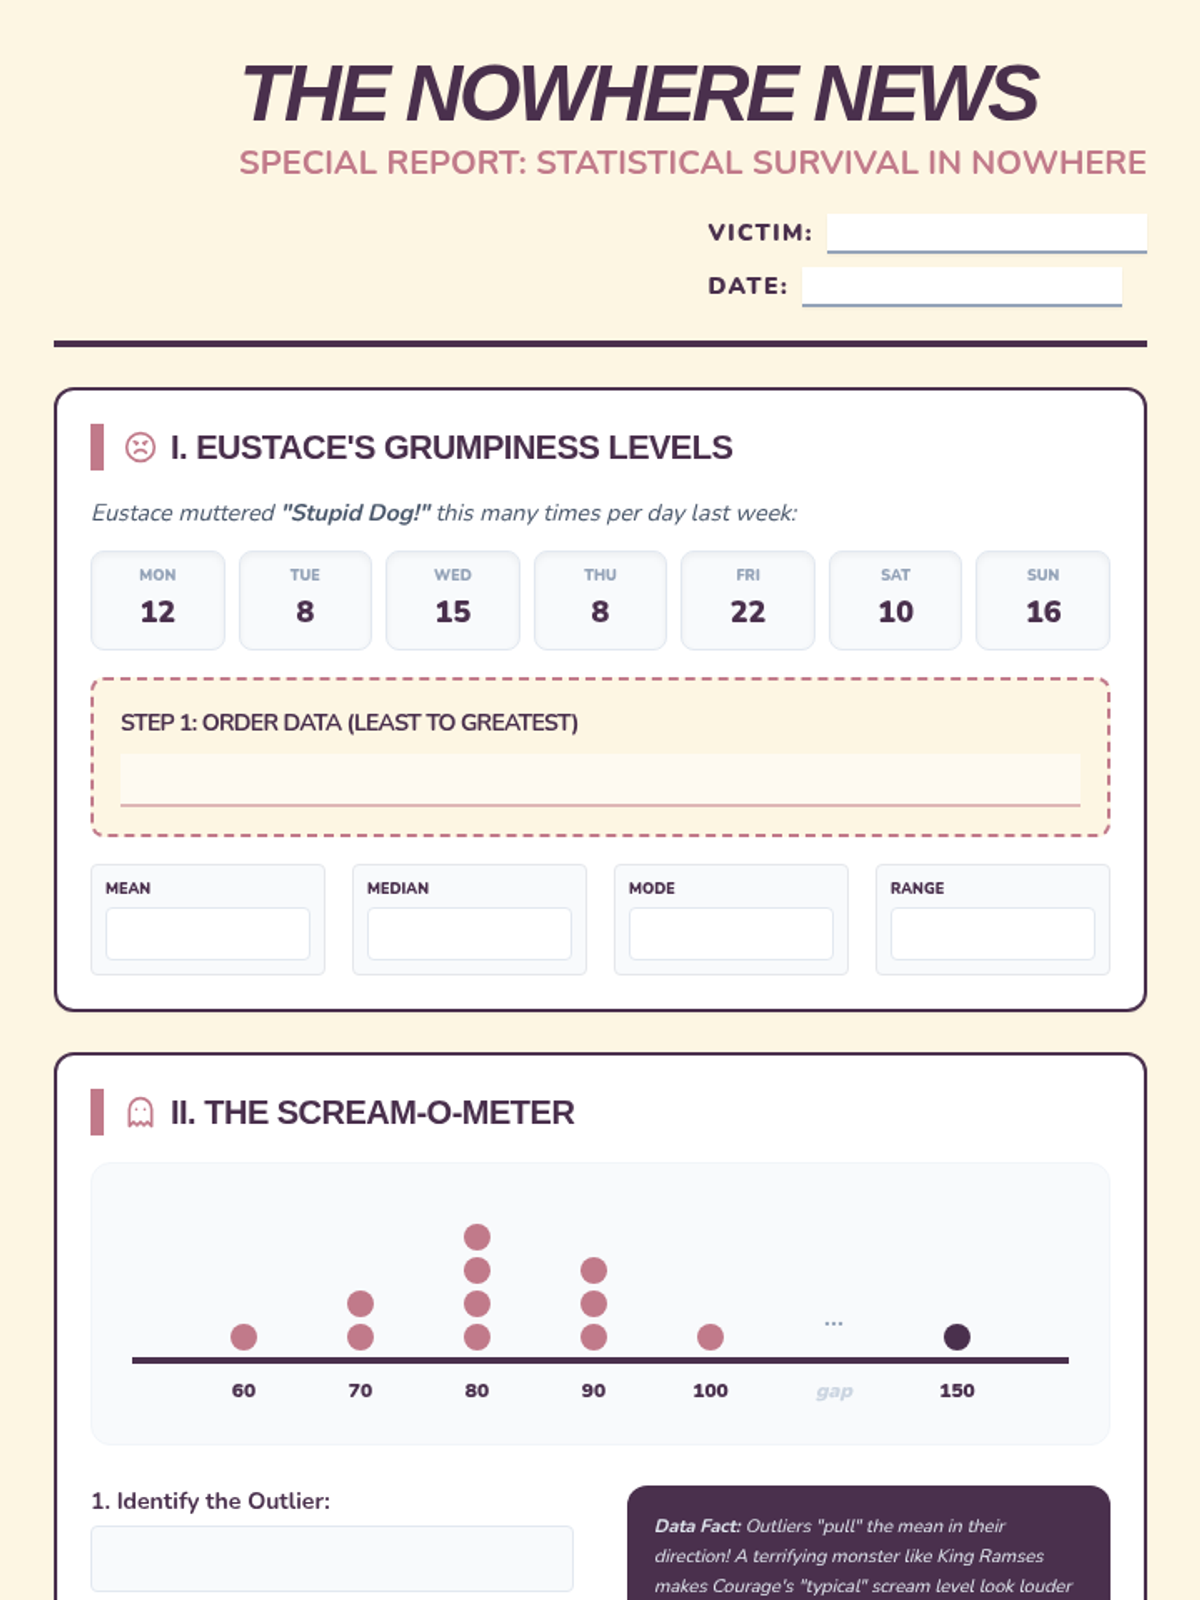
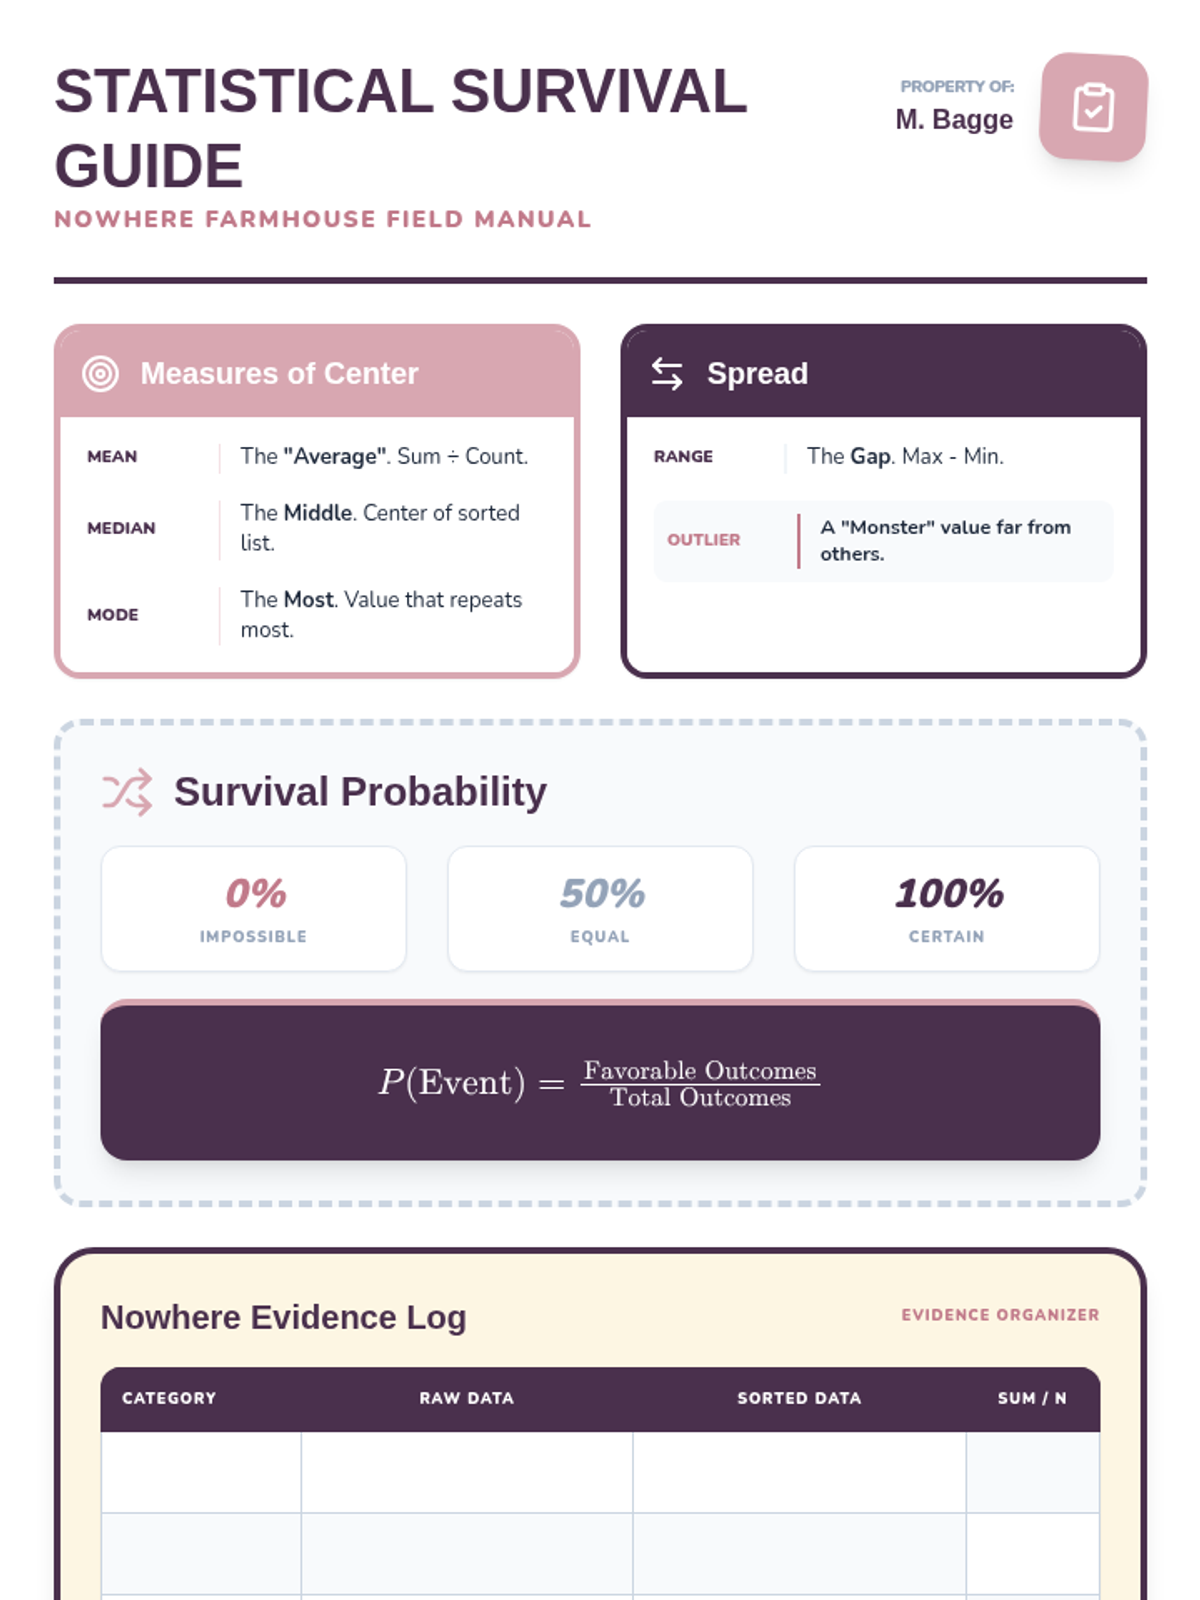
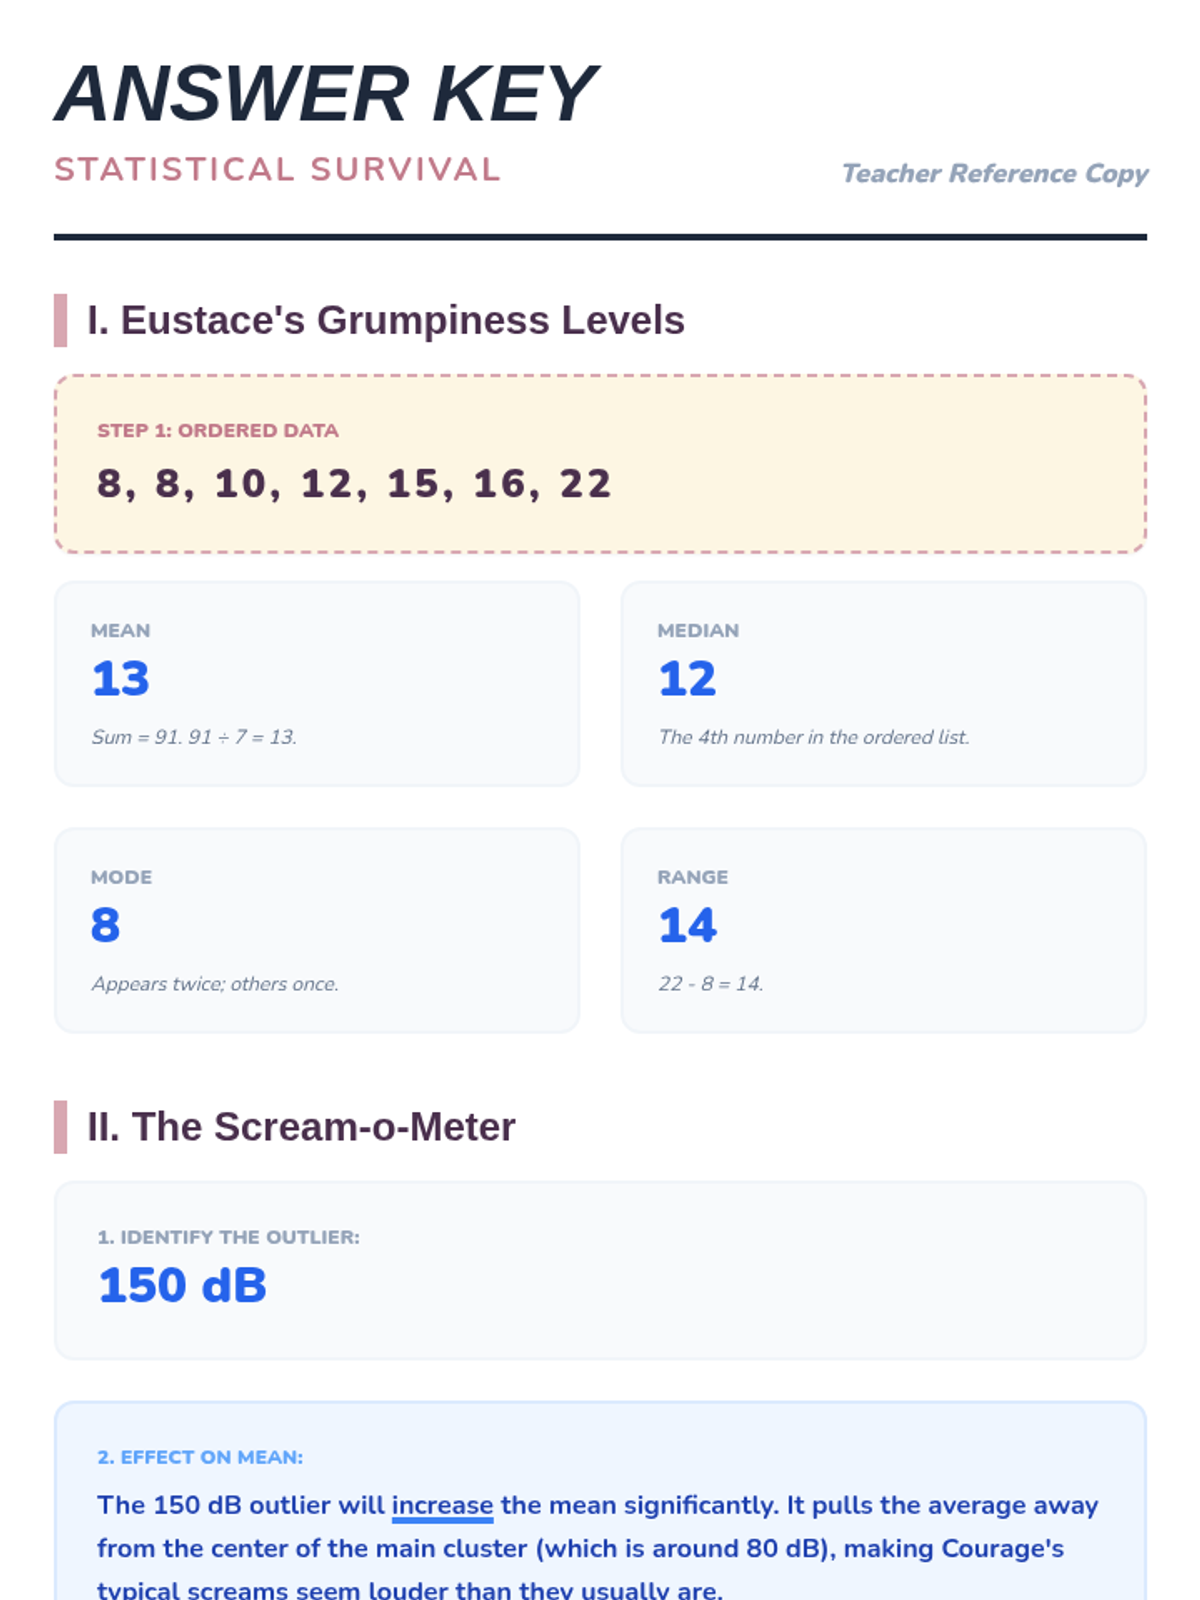
A statistics lesson themed around Courage the Cowardly Dog, covering central tendency, dot plots, and probability.
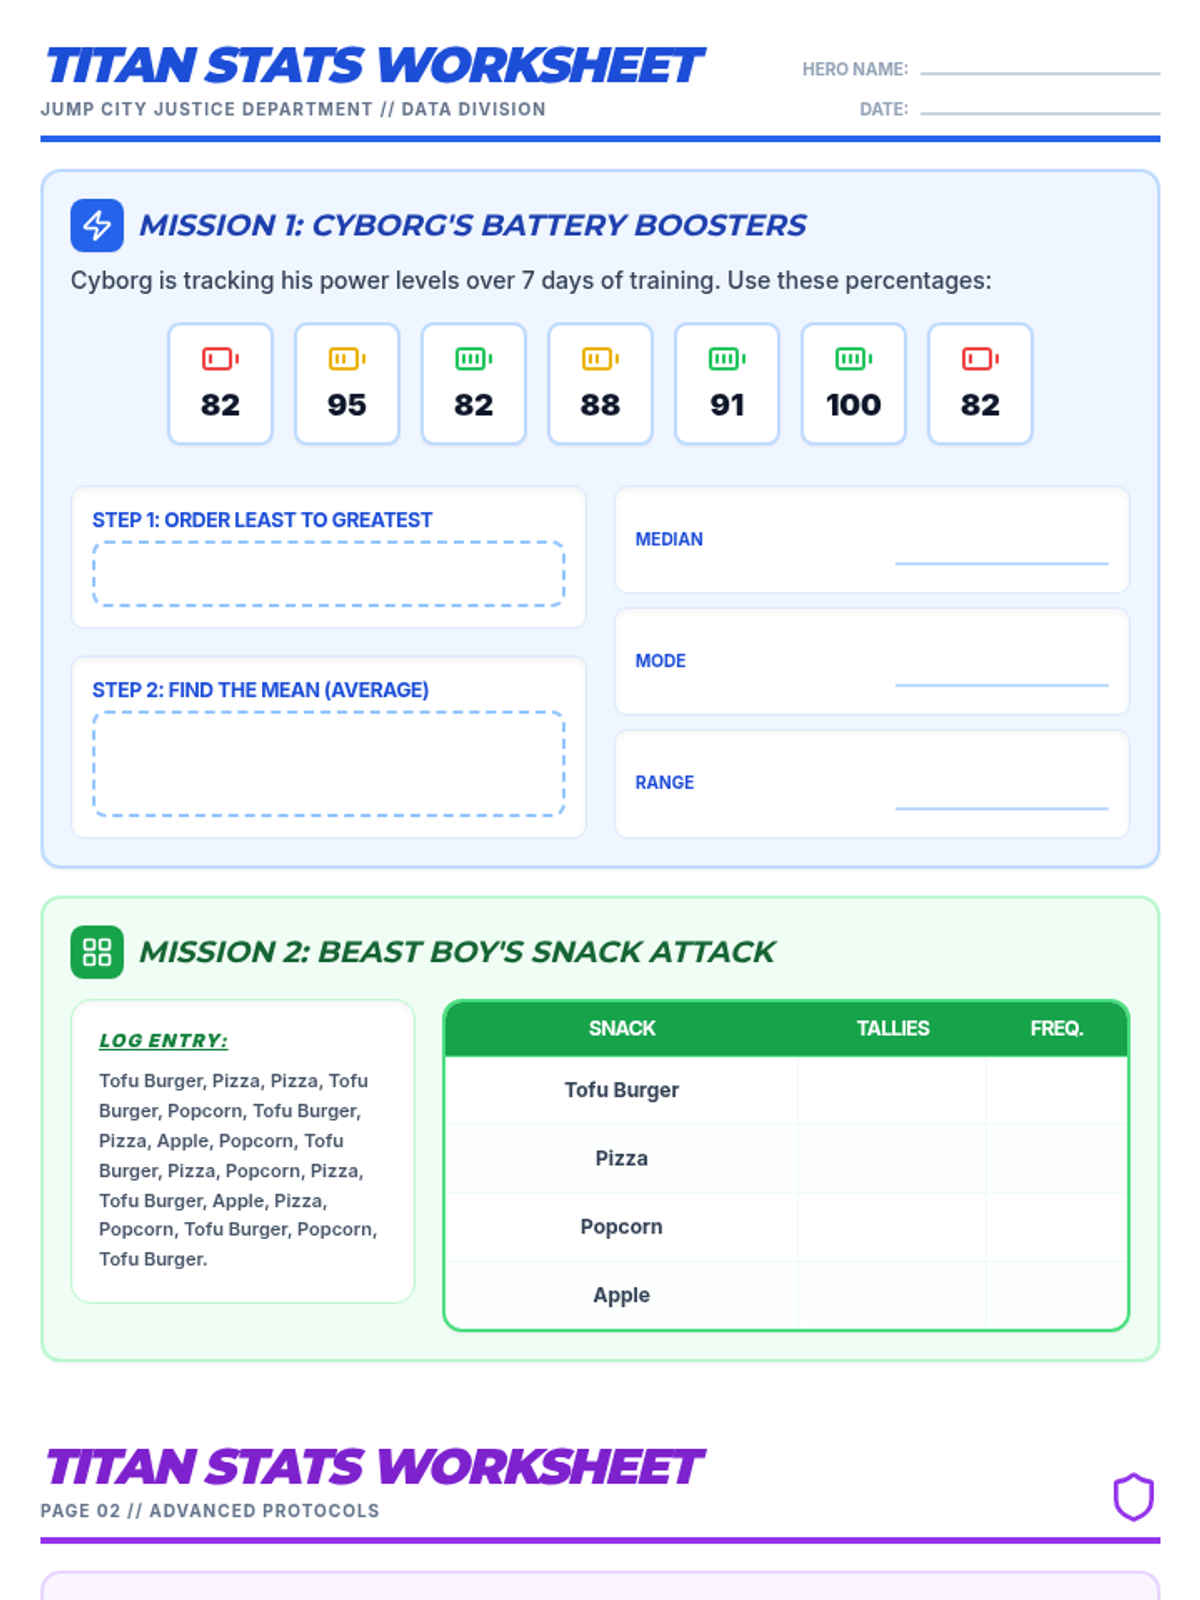
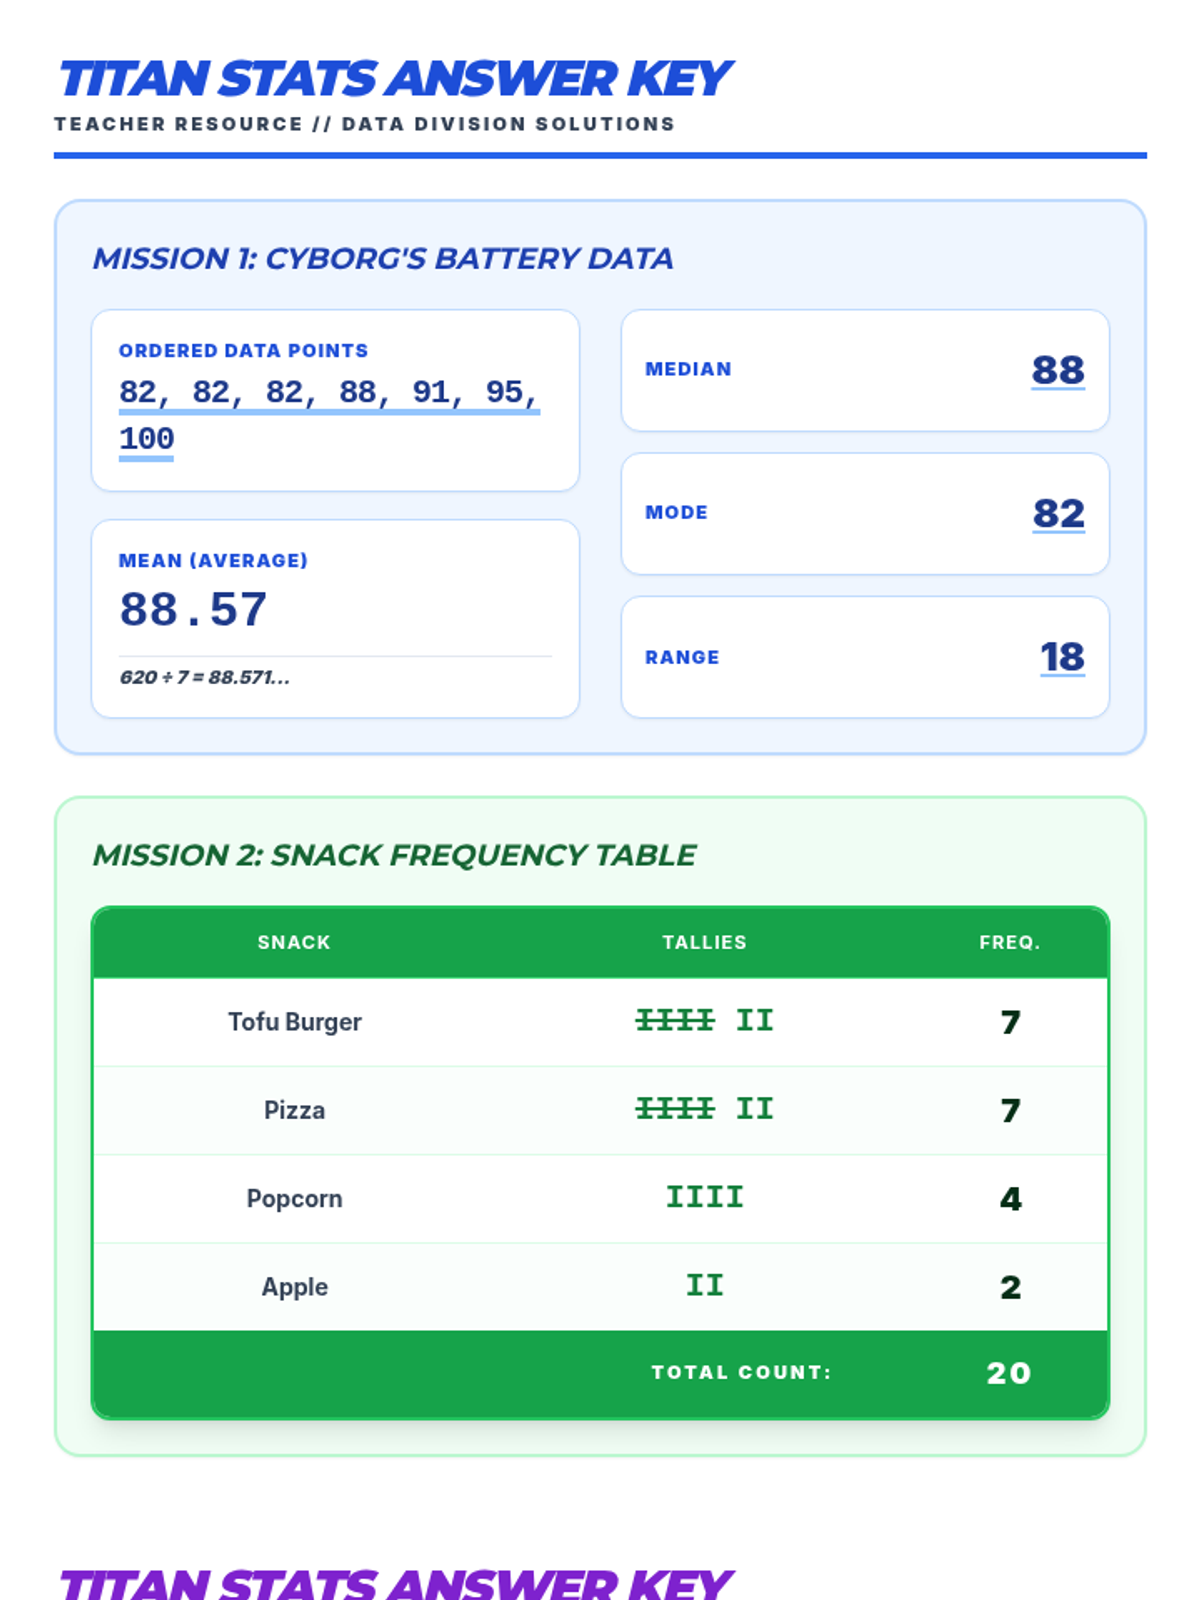
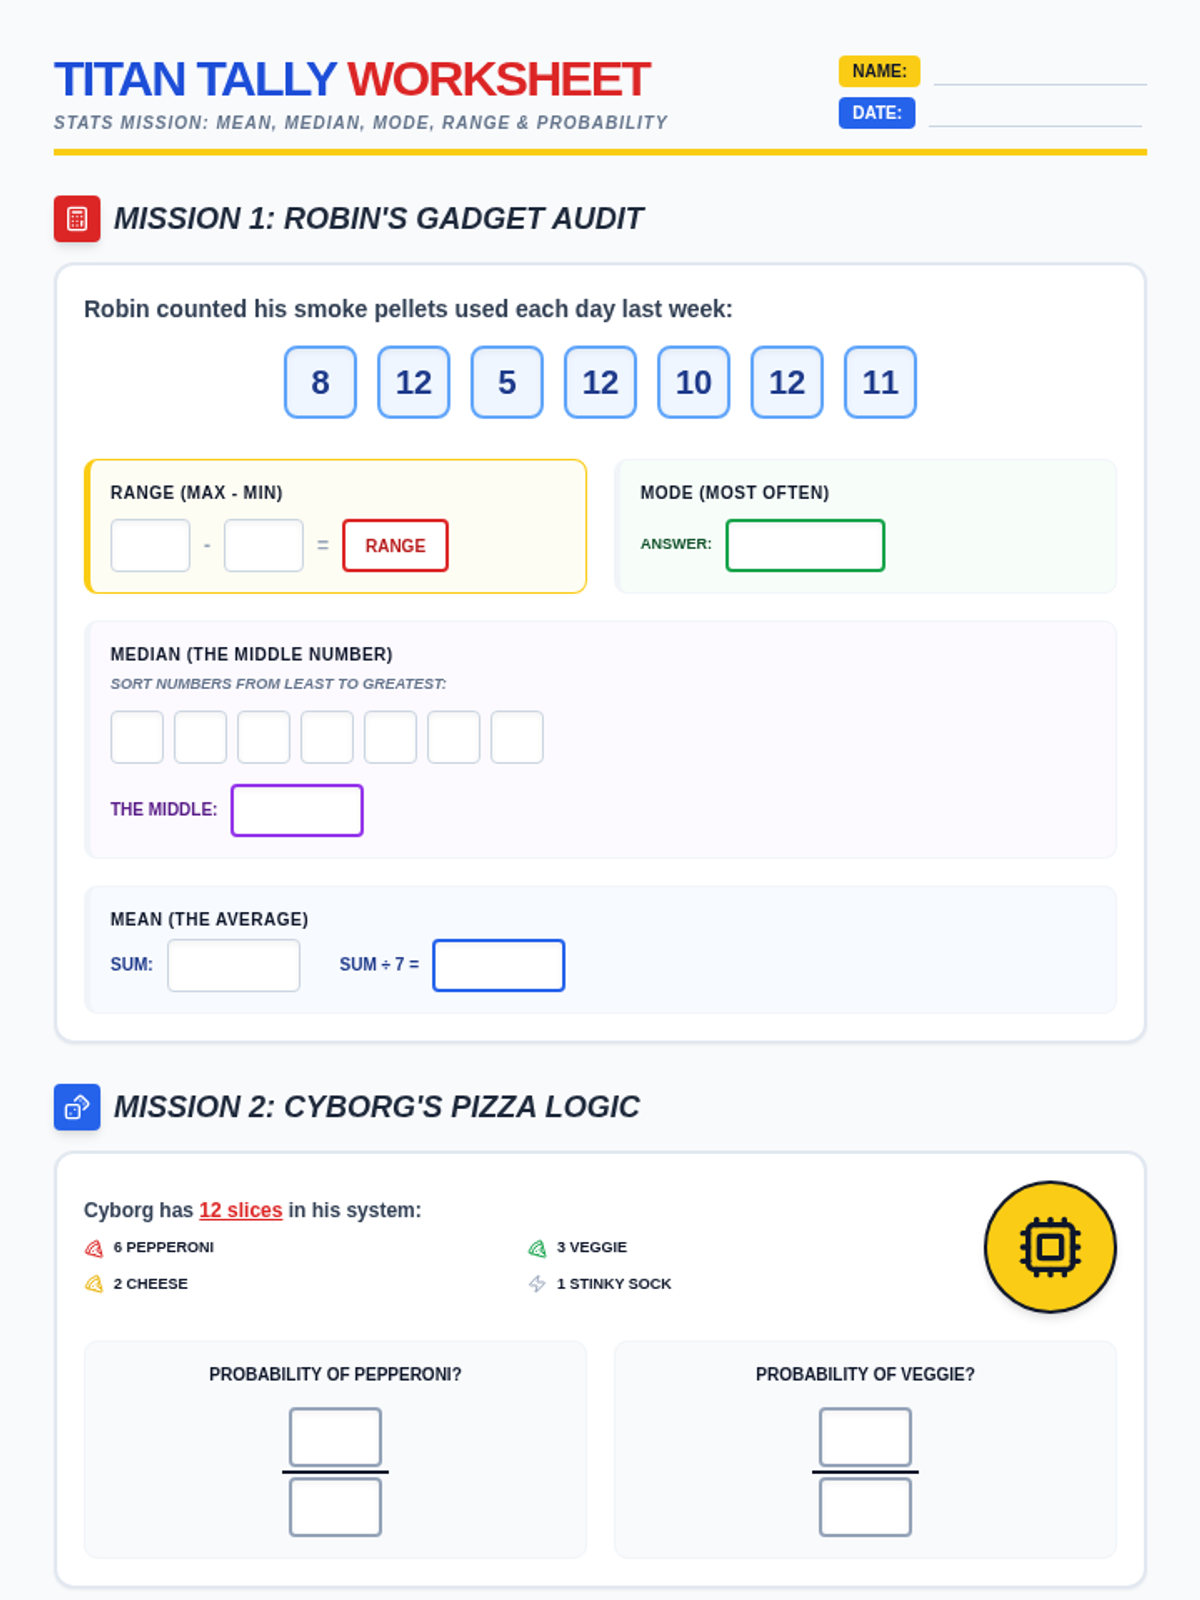
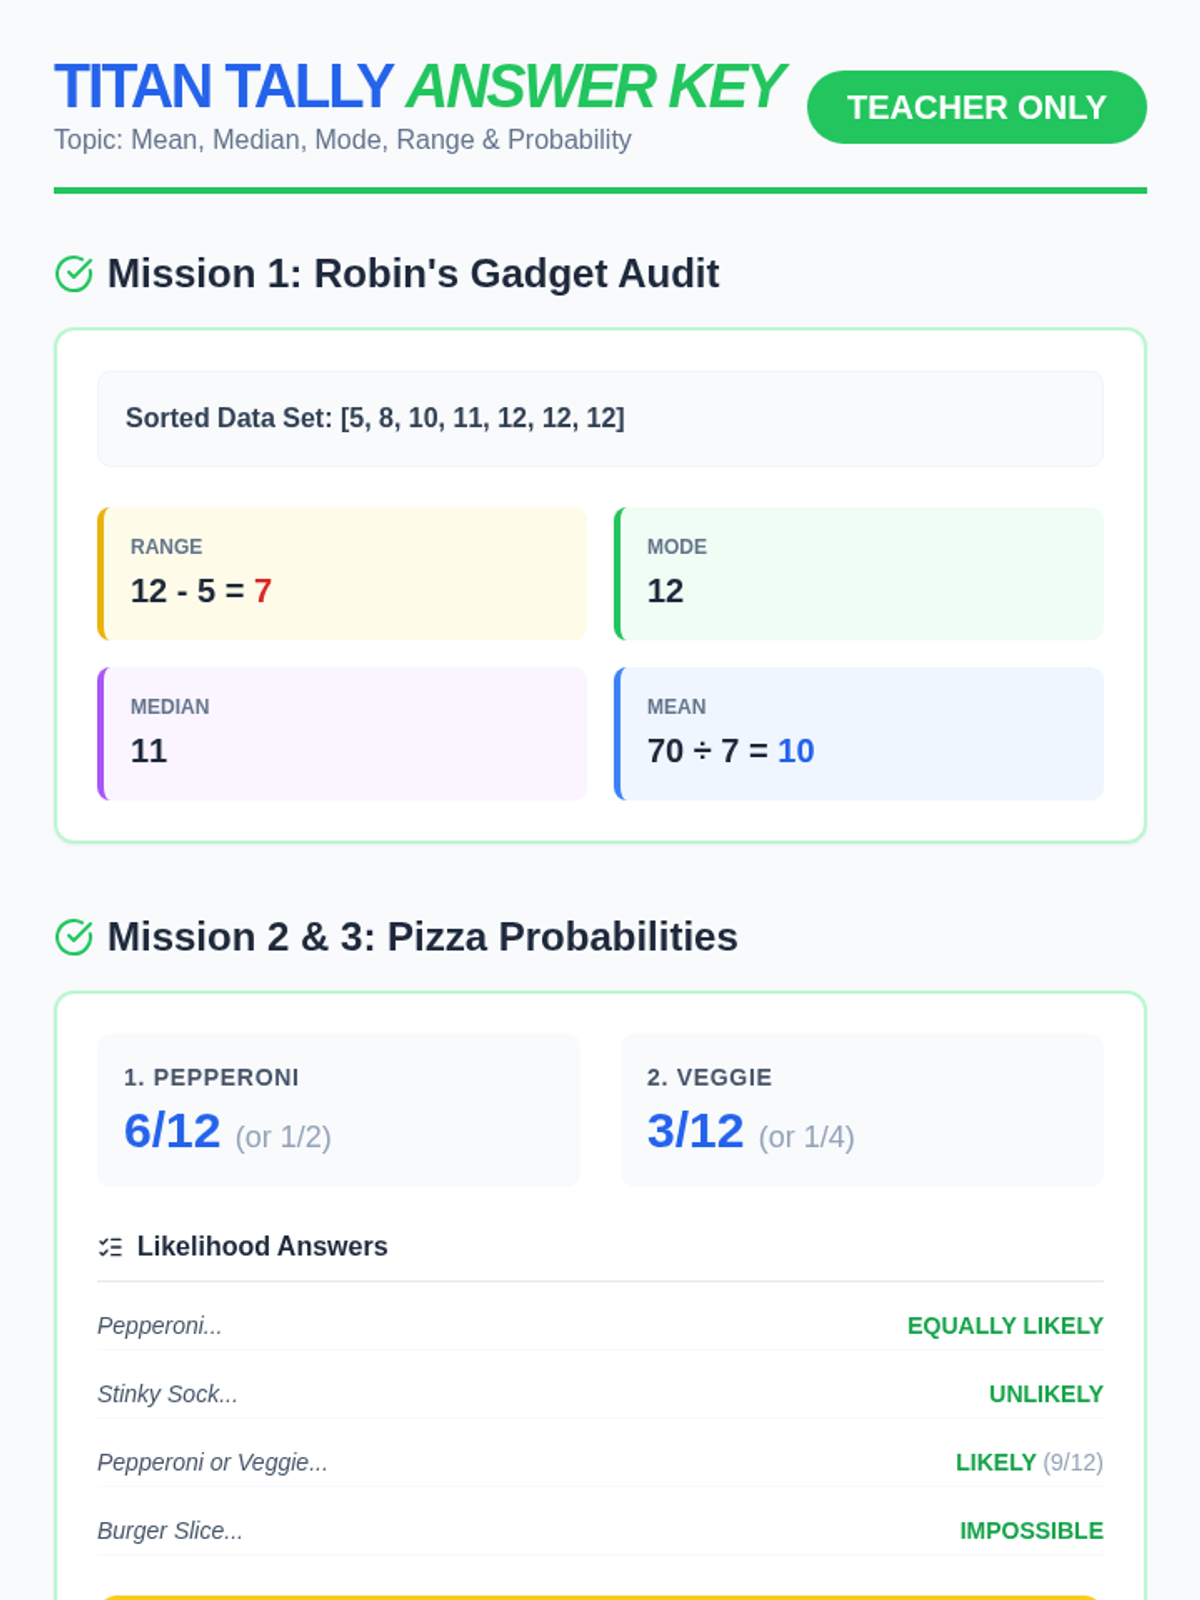
A high-energy statistics lesson featuring the Teen Titans, covering mean, median, mode, range, frequency tables, and probability through Jump City scenarios.
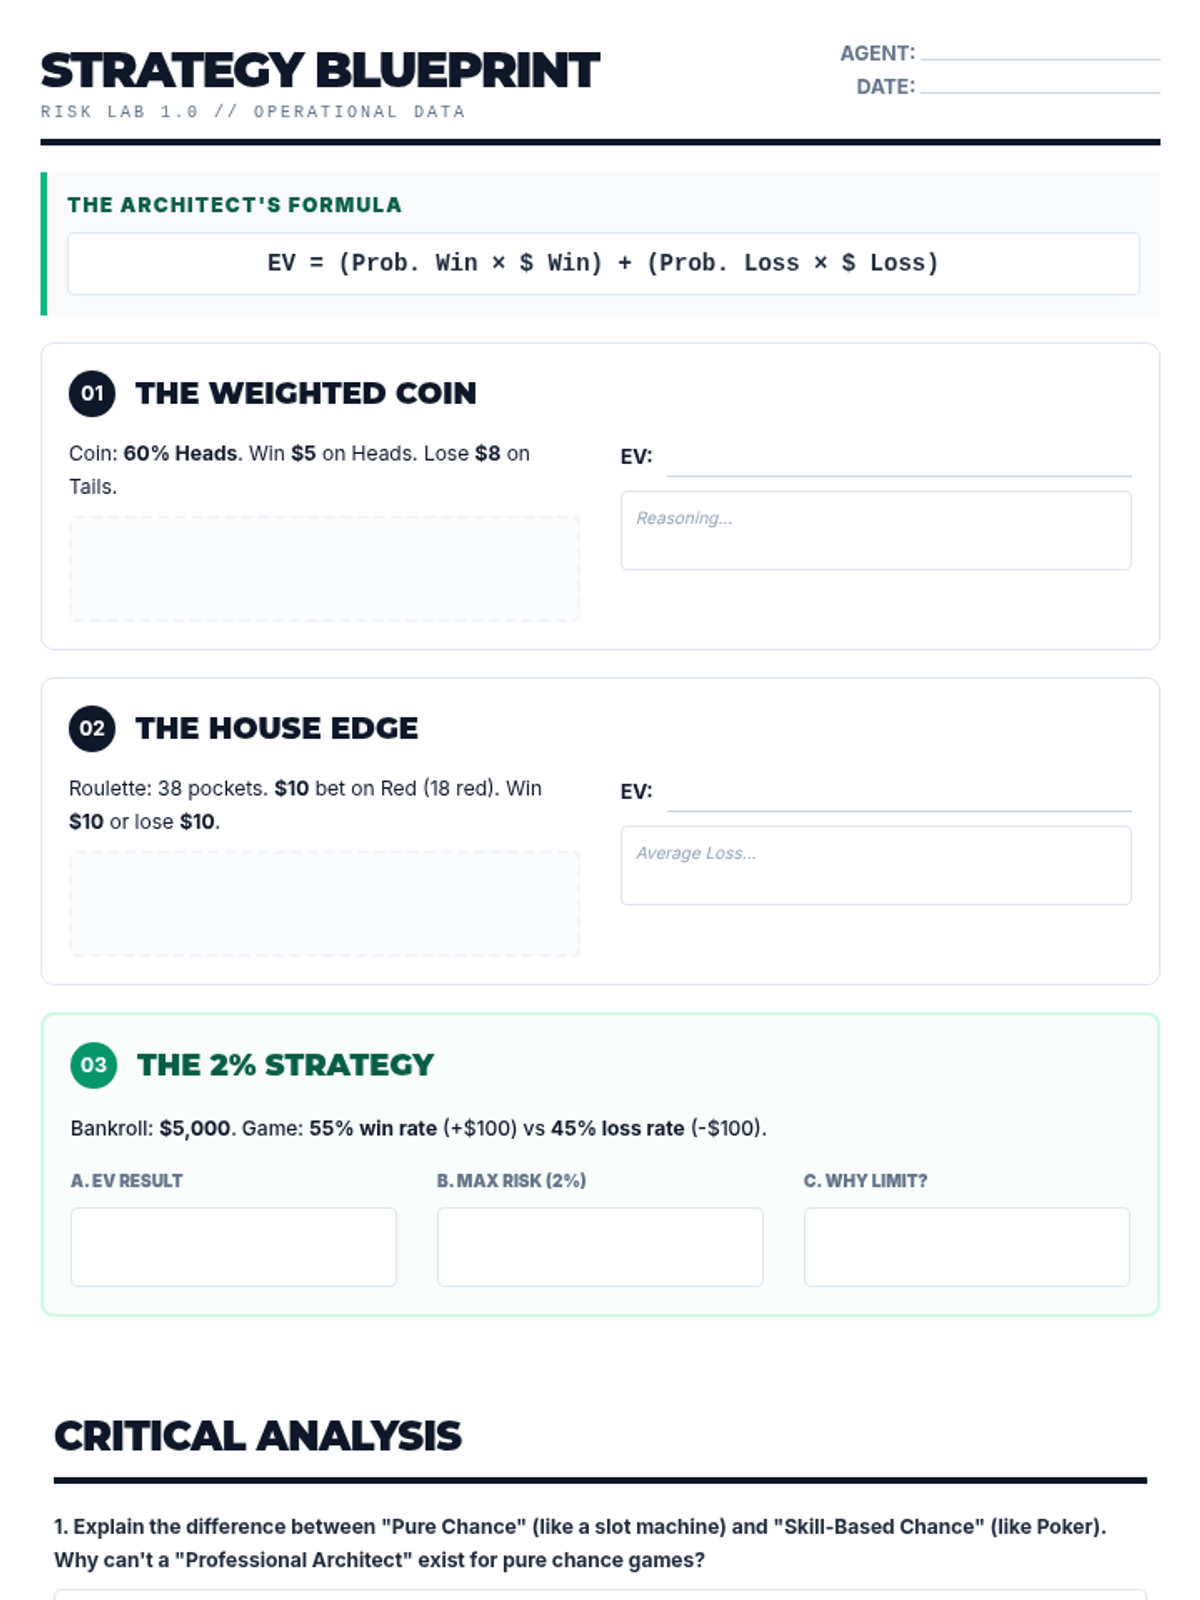
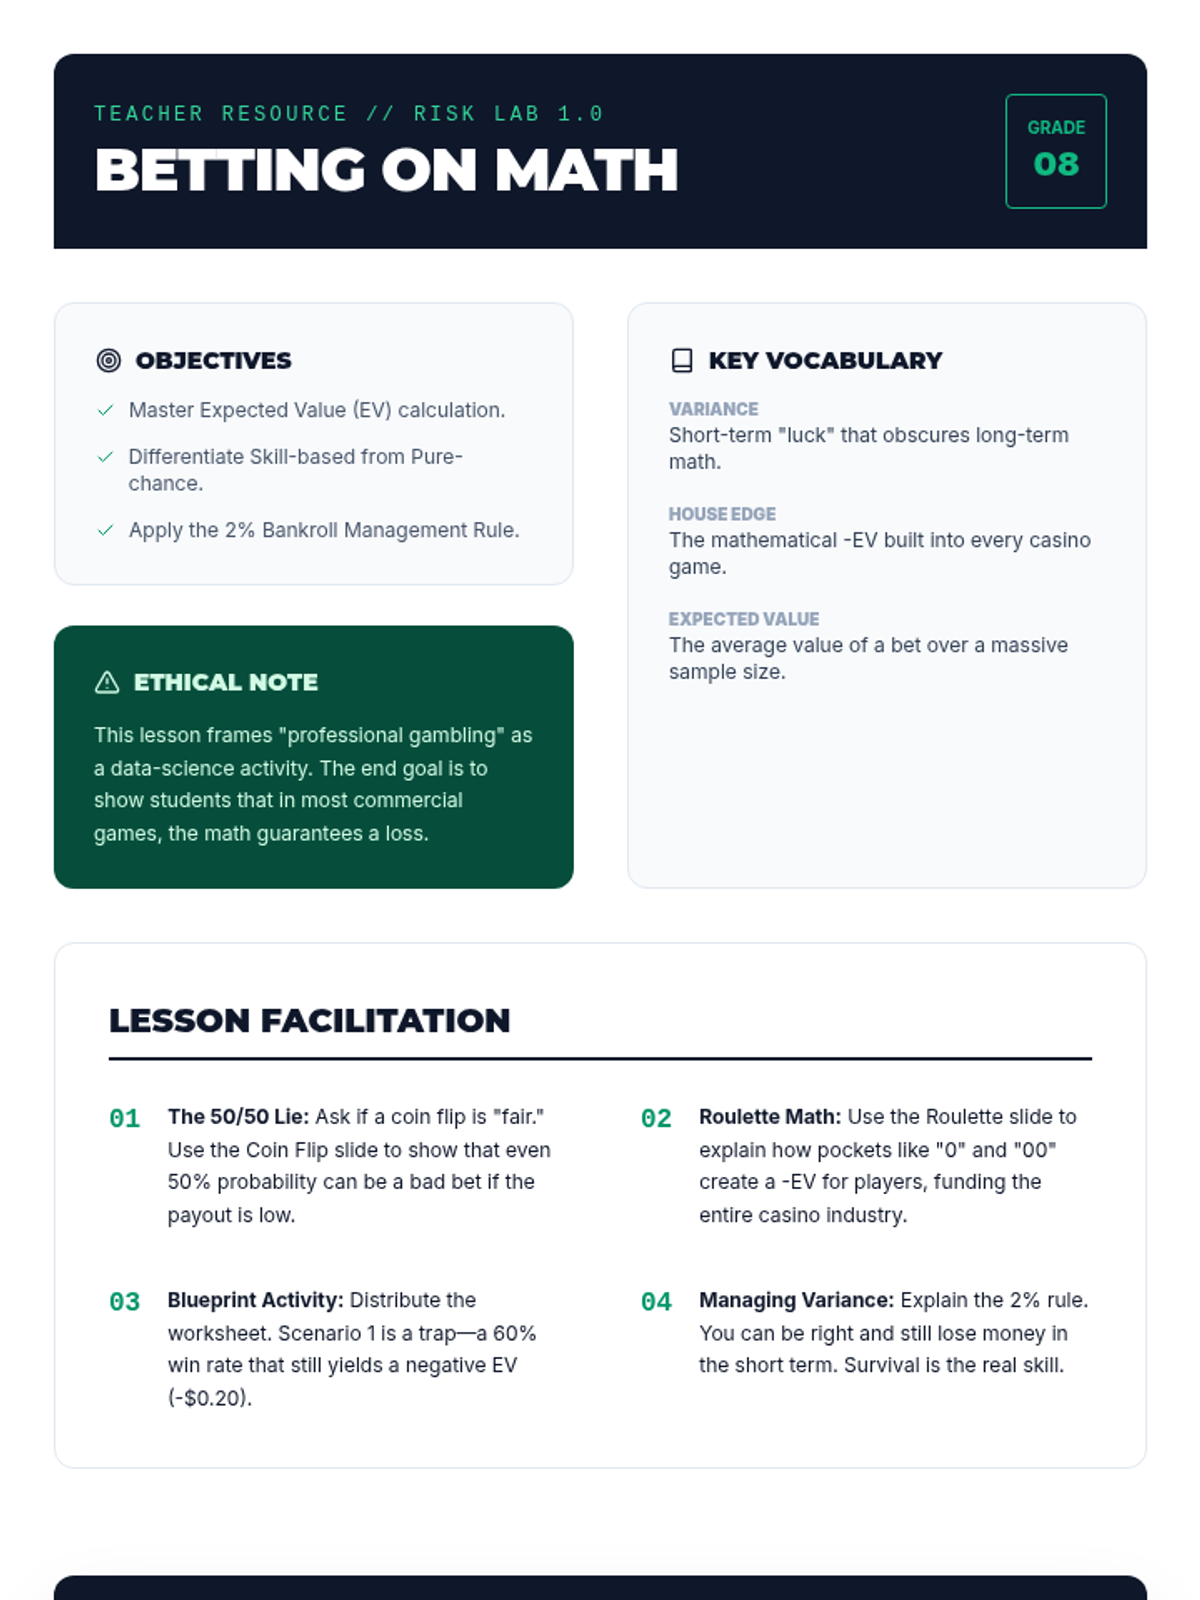
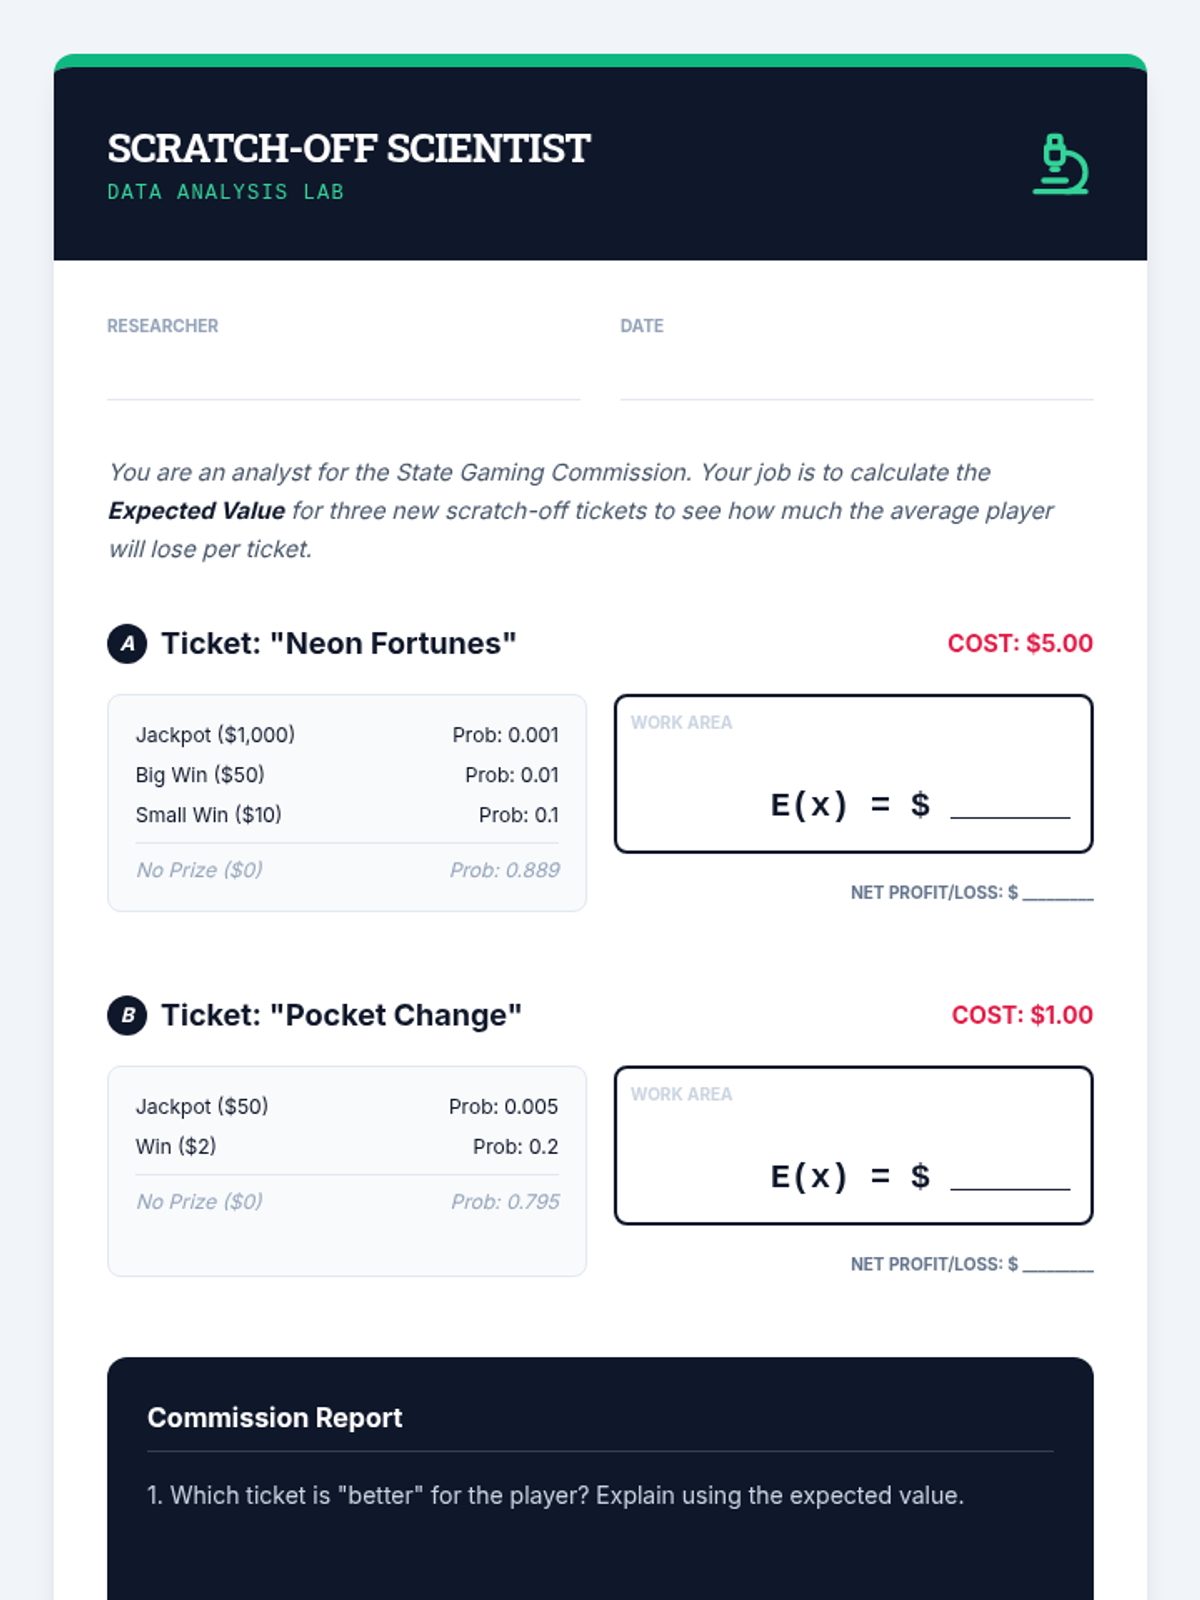
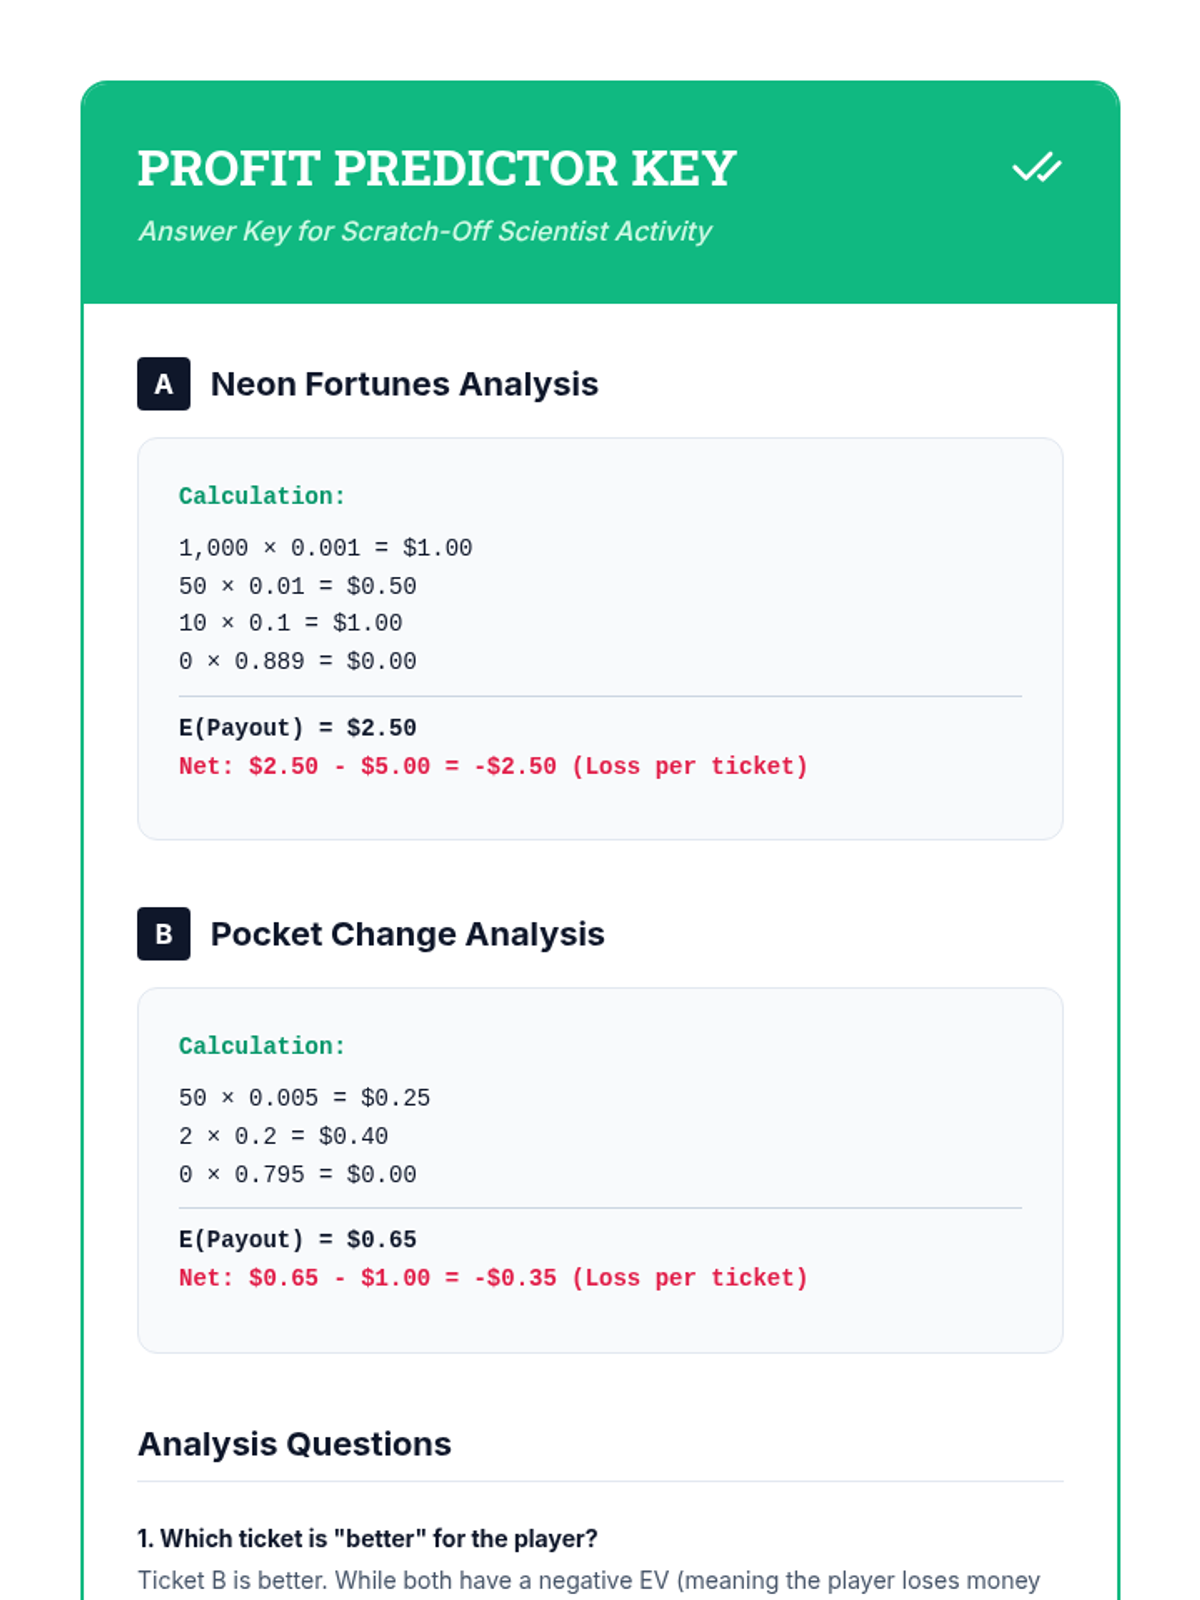
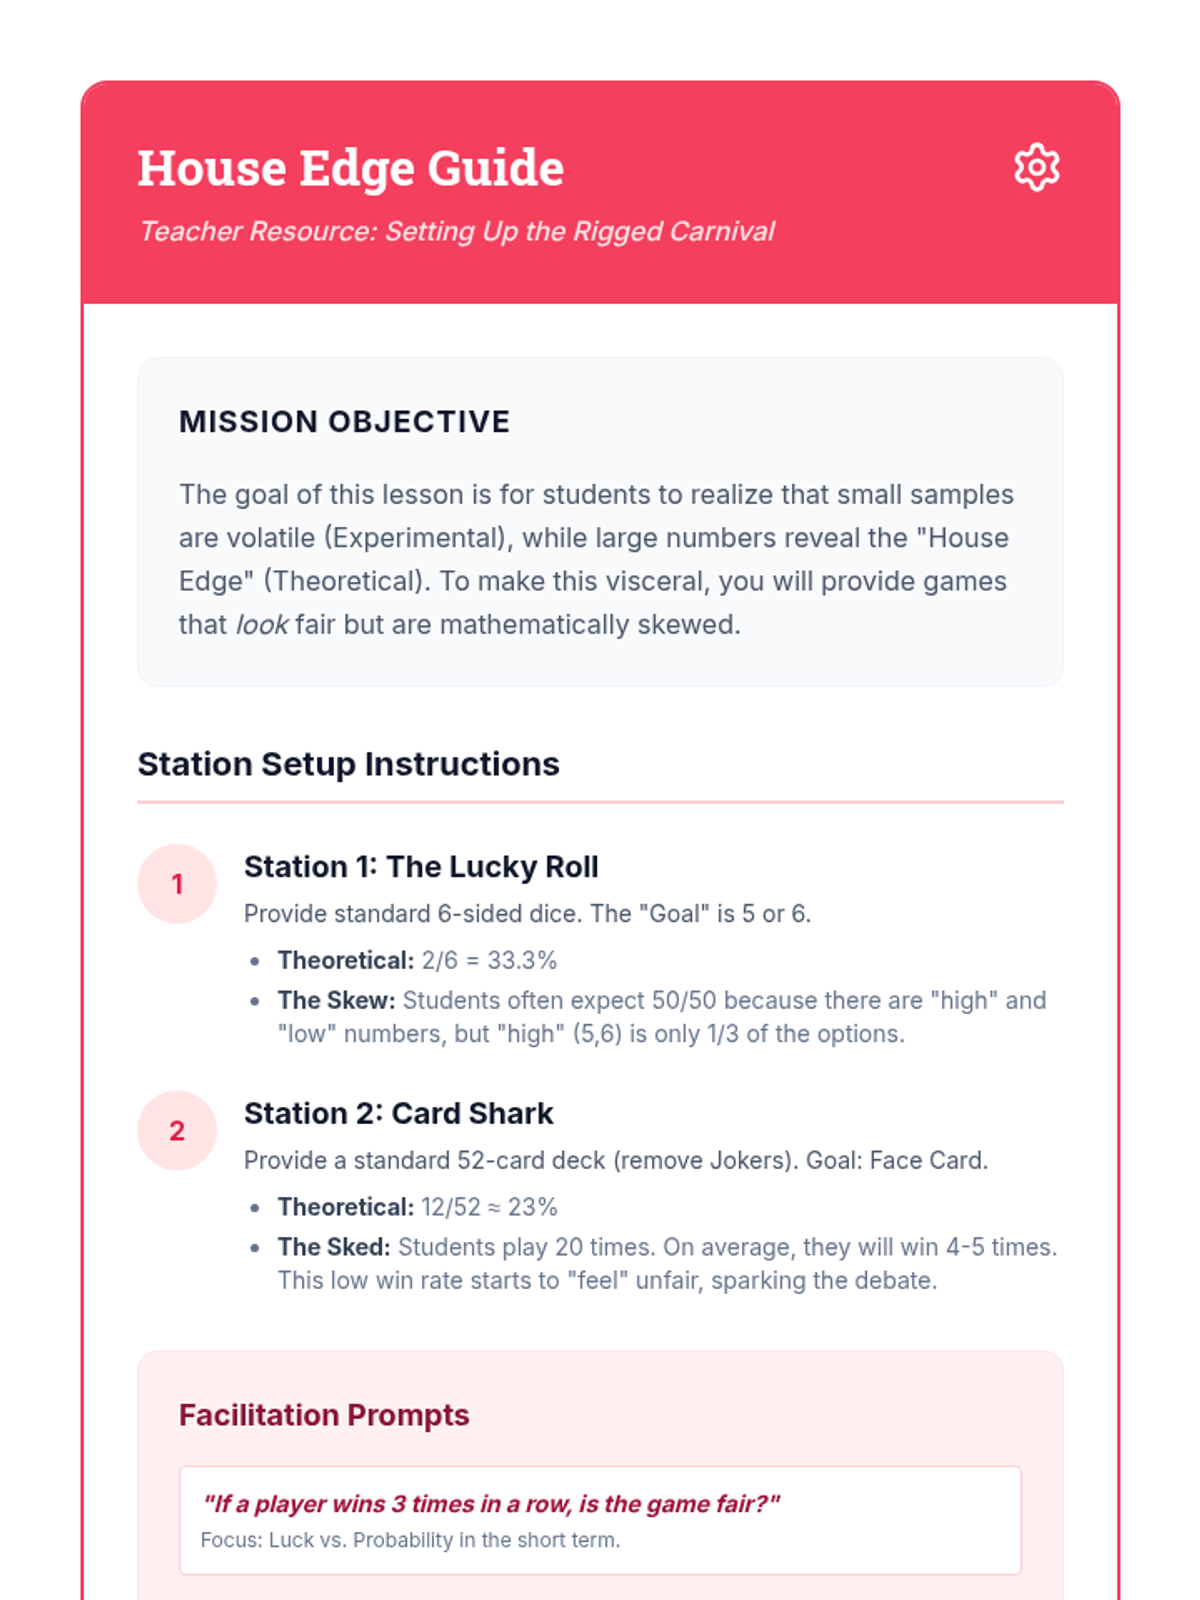
Students explore the concept of expected value and house edge to understand why certain strategies succeed while others are designed to fail.
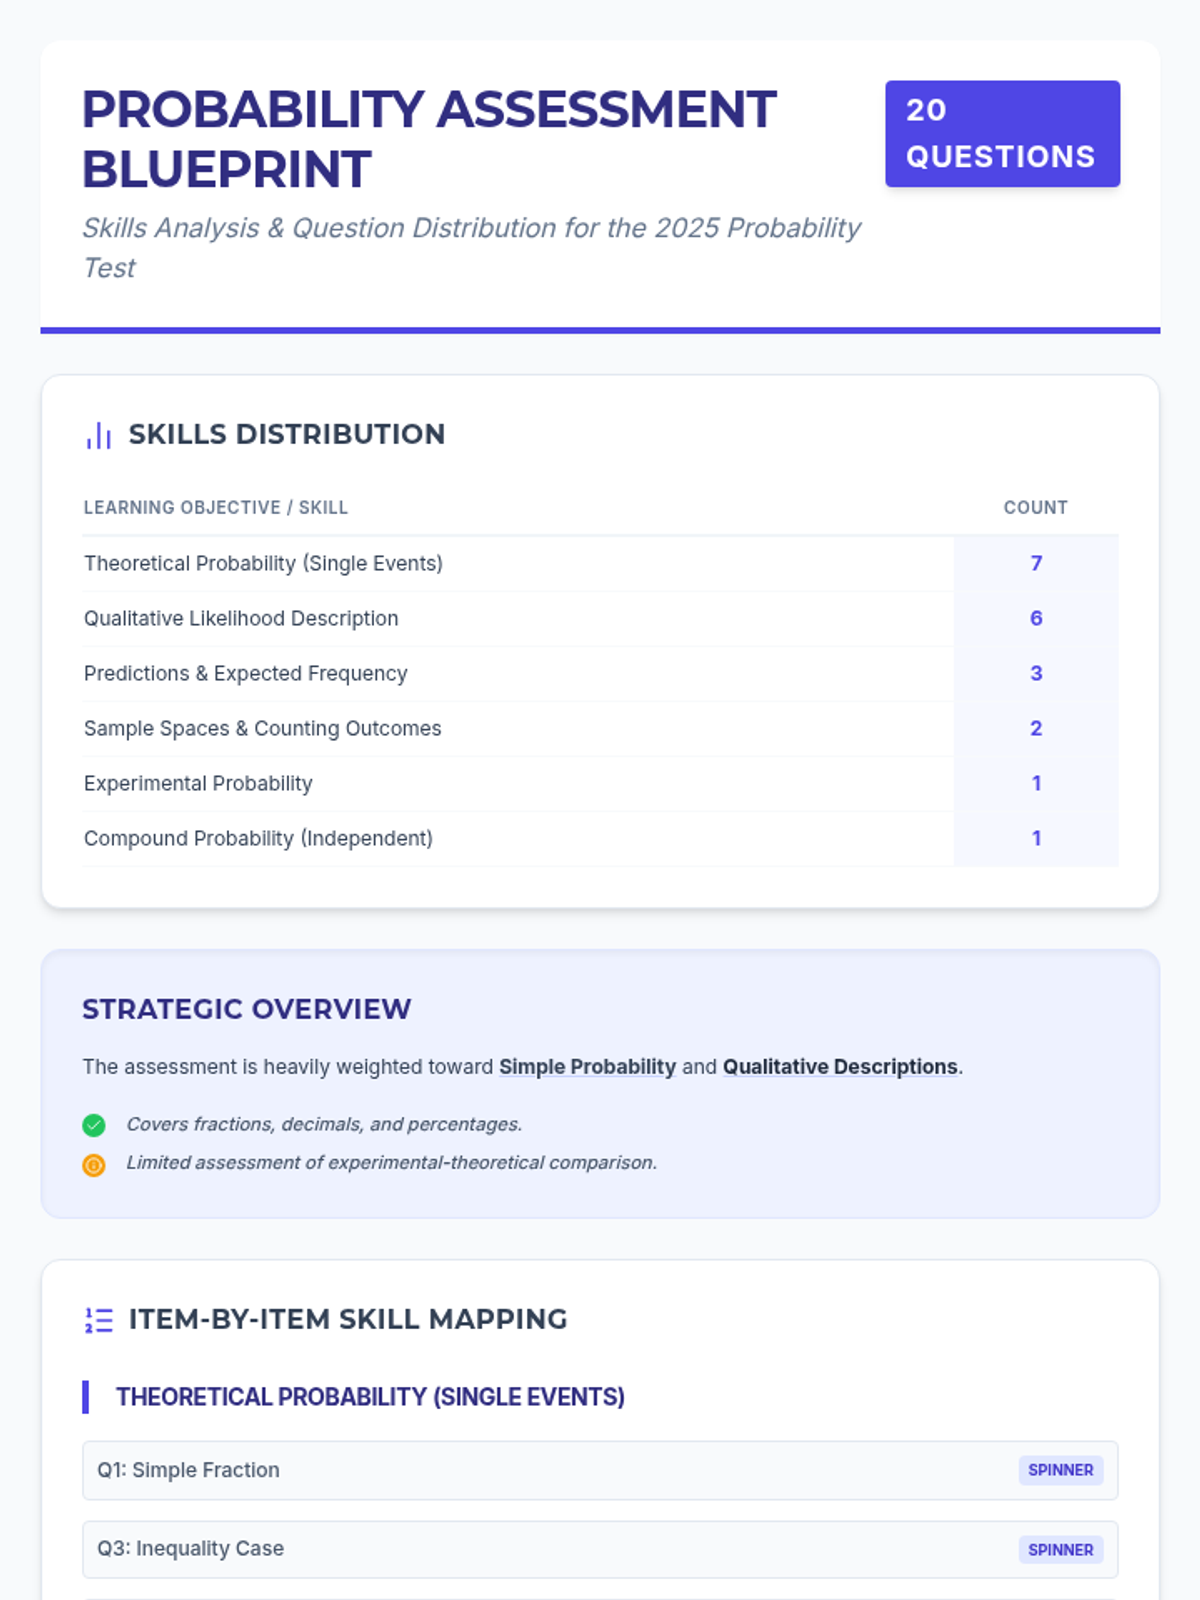
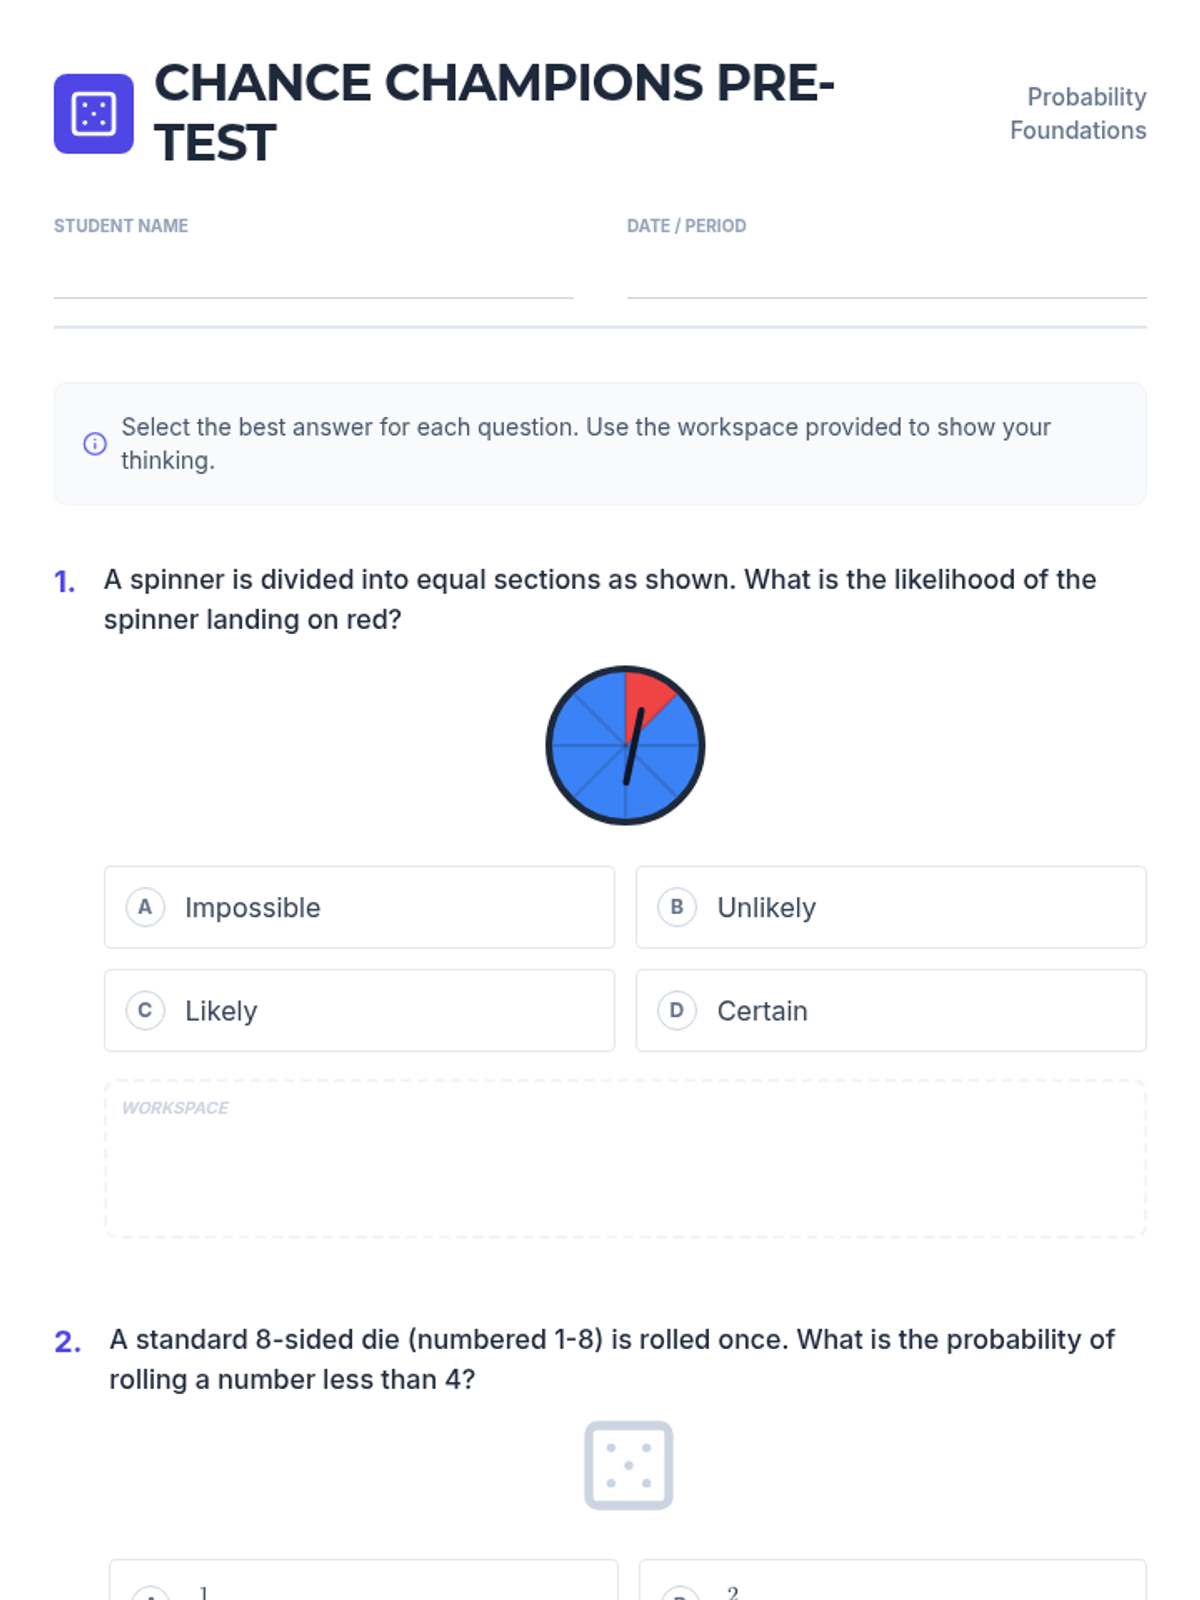
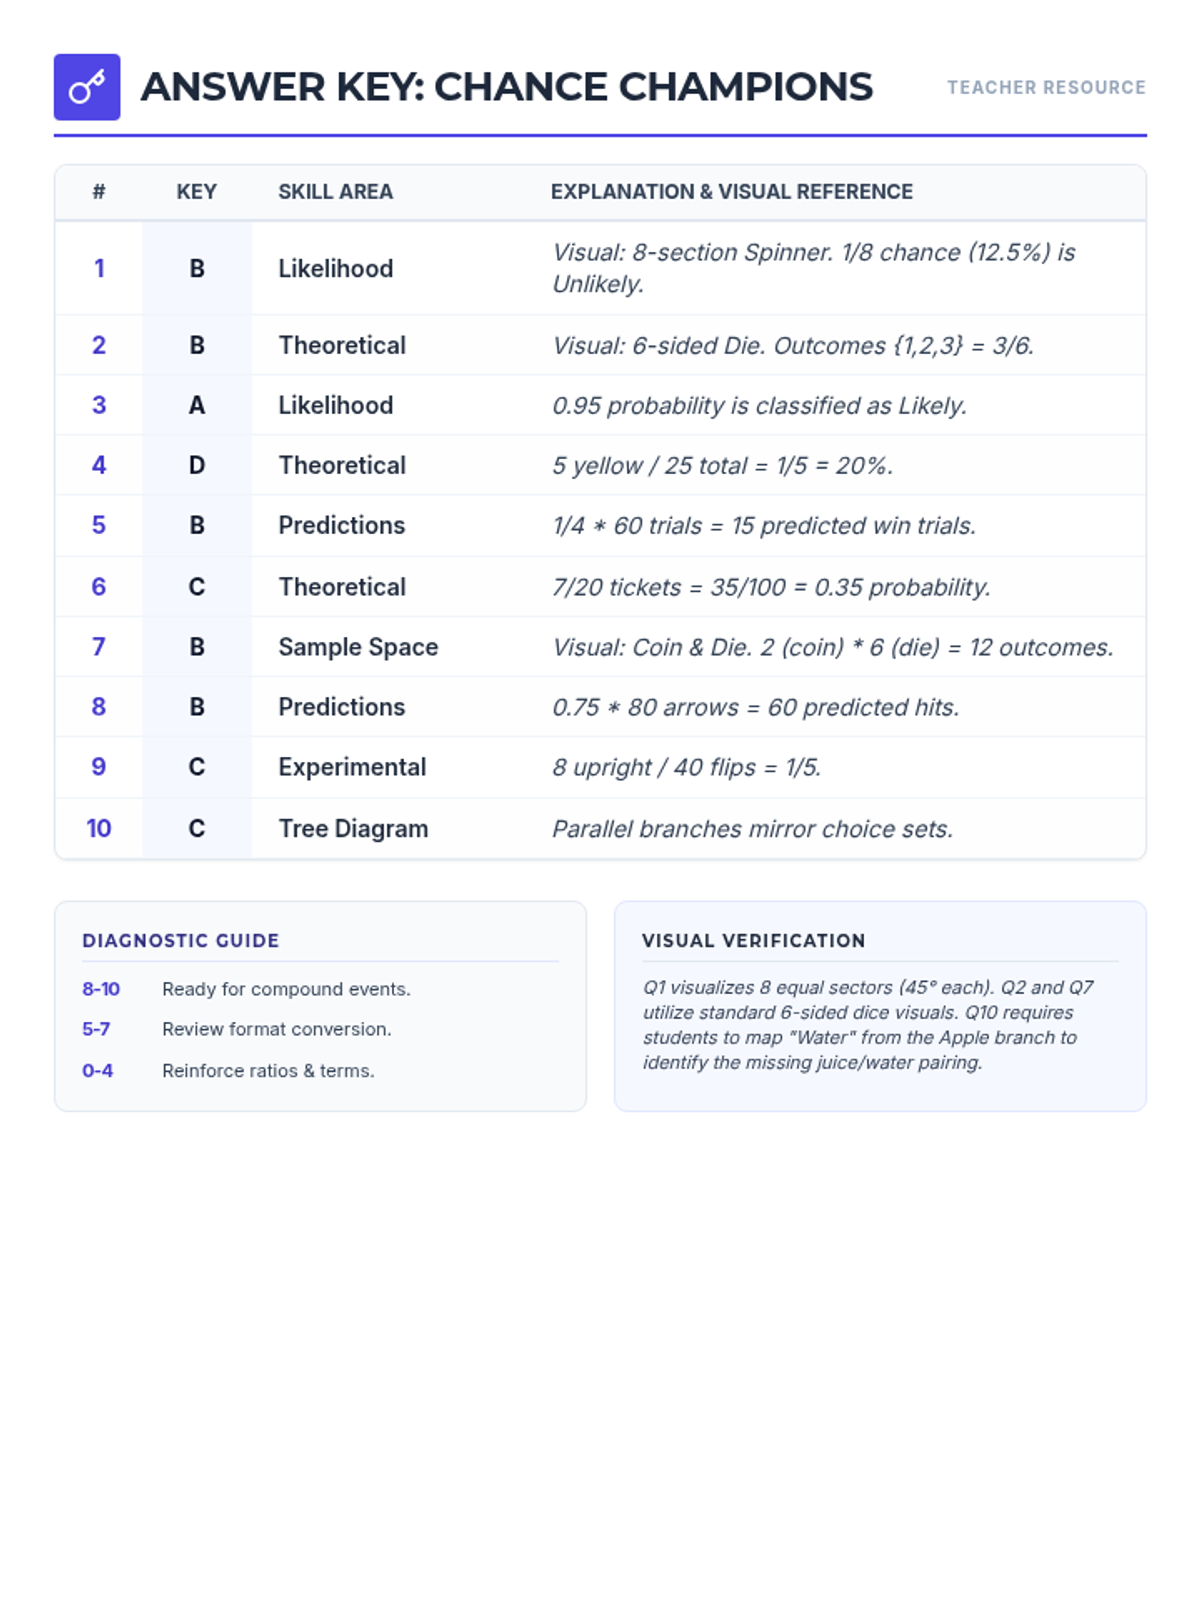
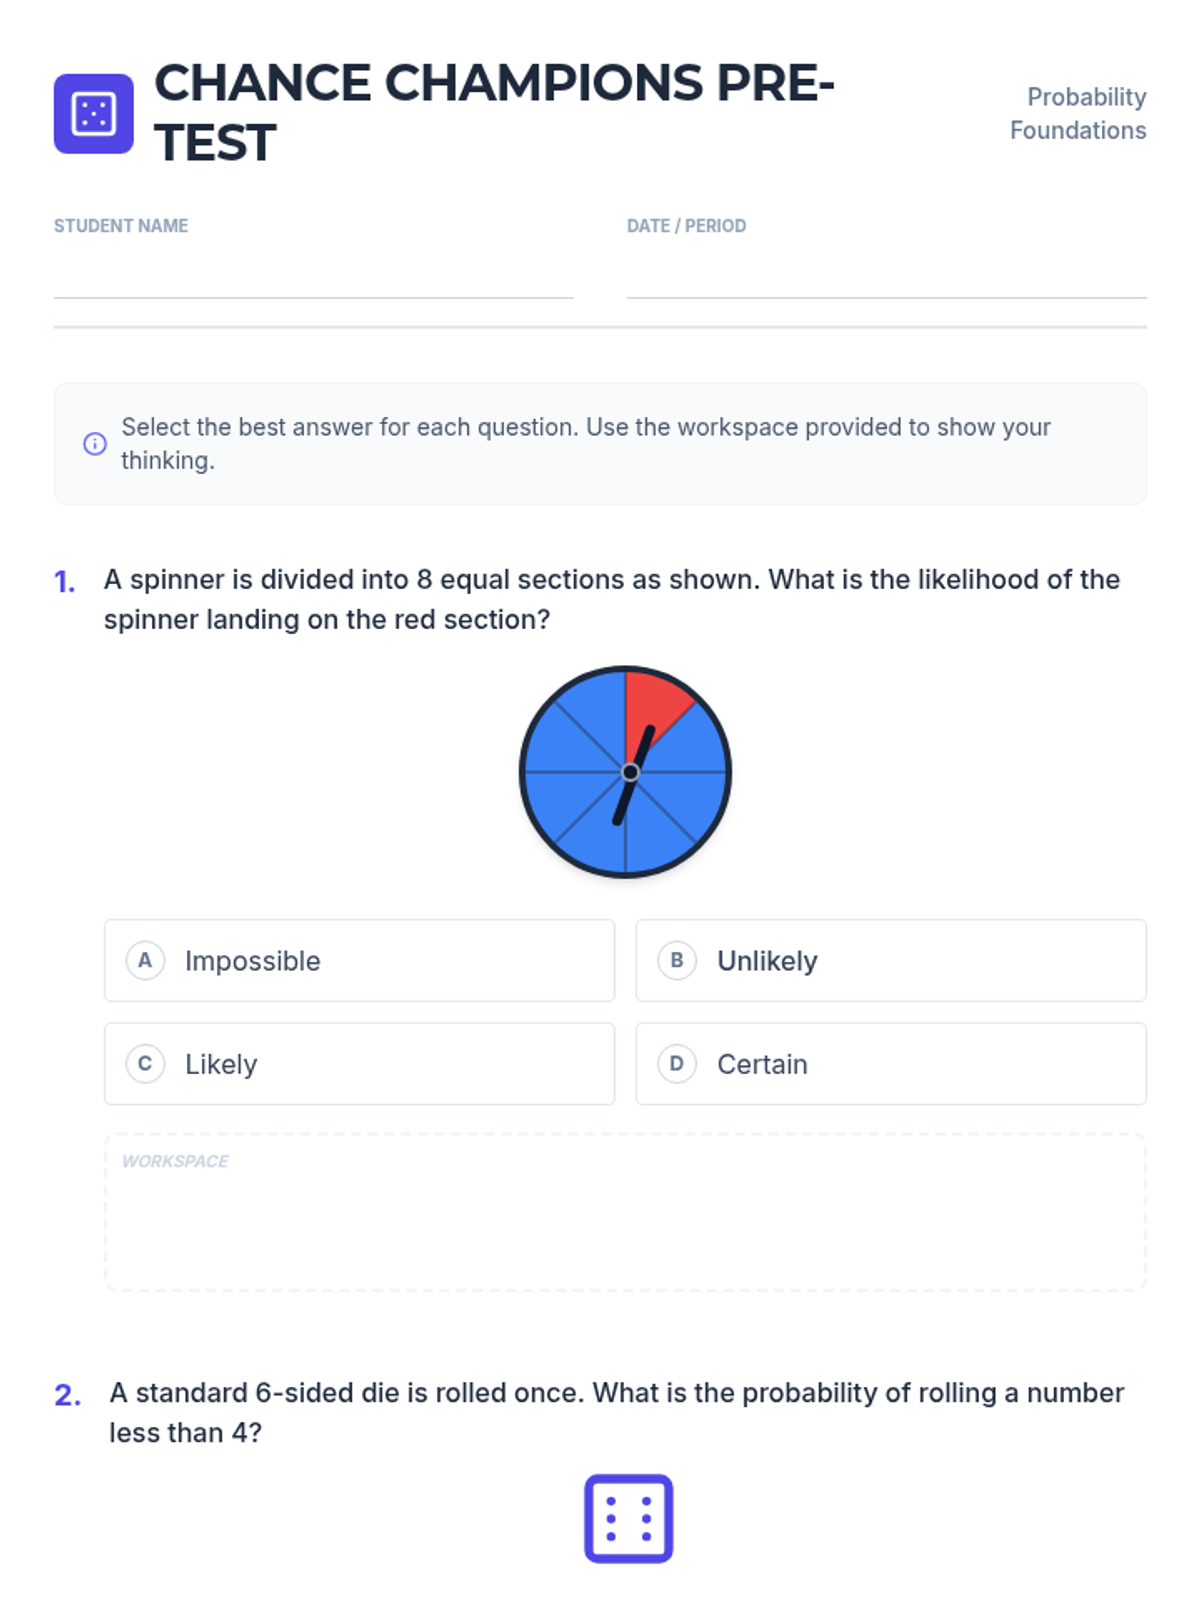
A foundational lesson on probability, covering qualitative likelihood, theoretical probability in various formats, and making predictions based on data.
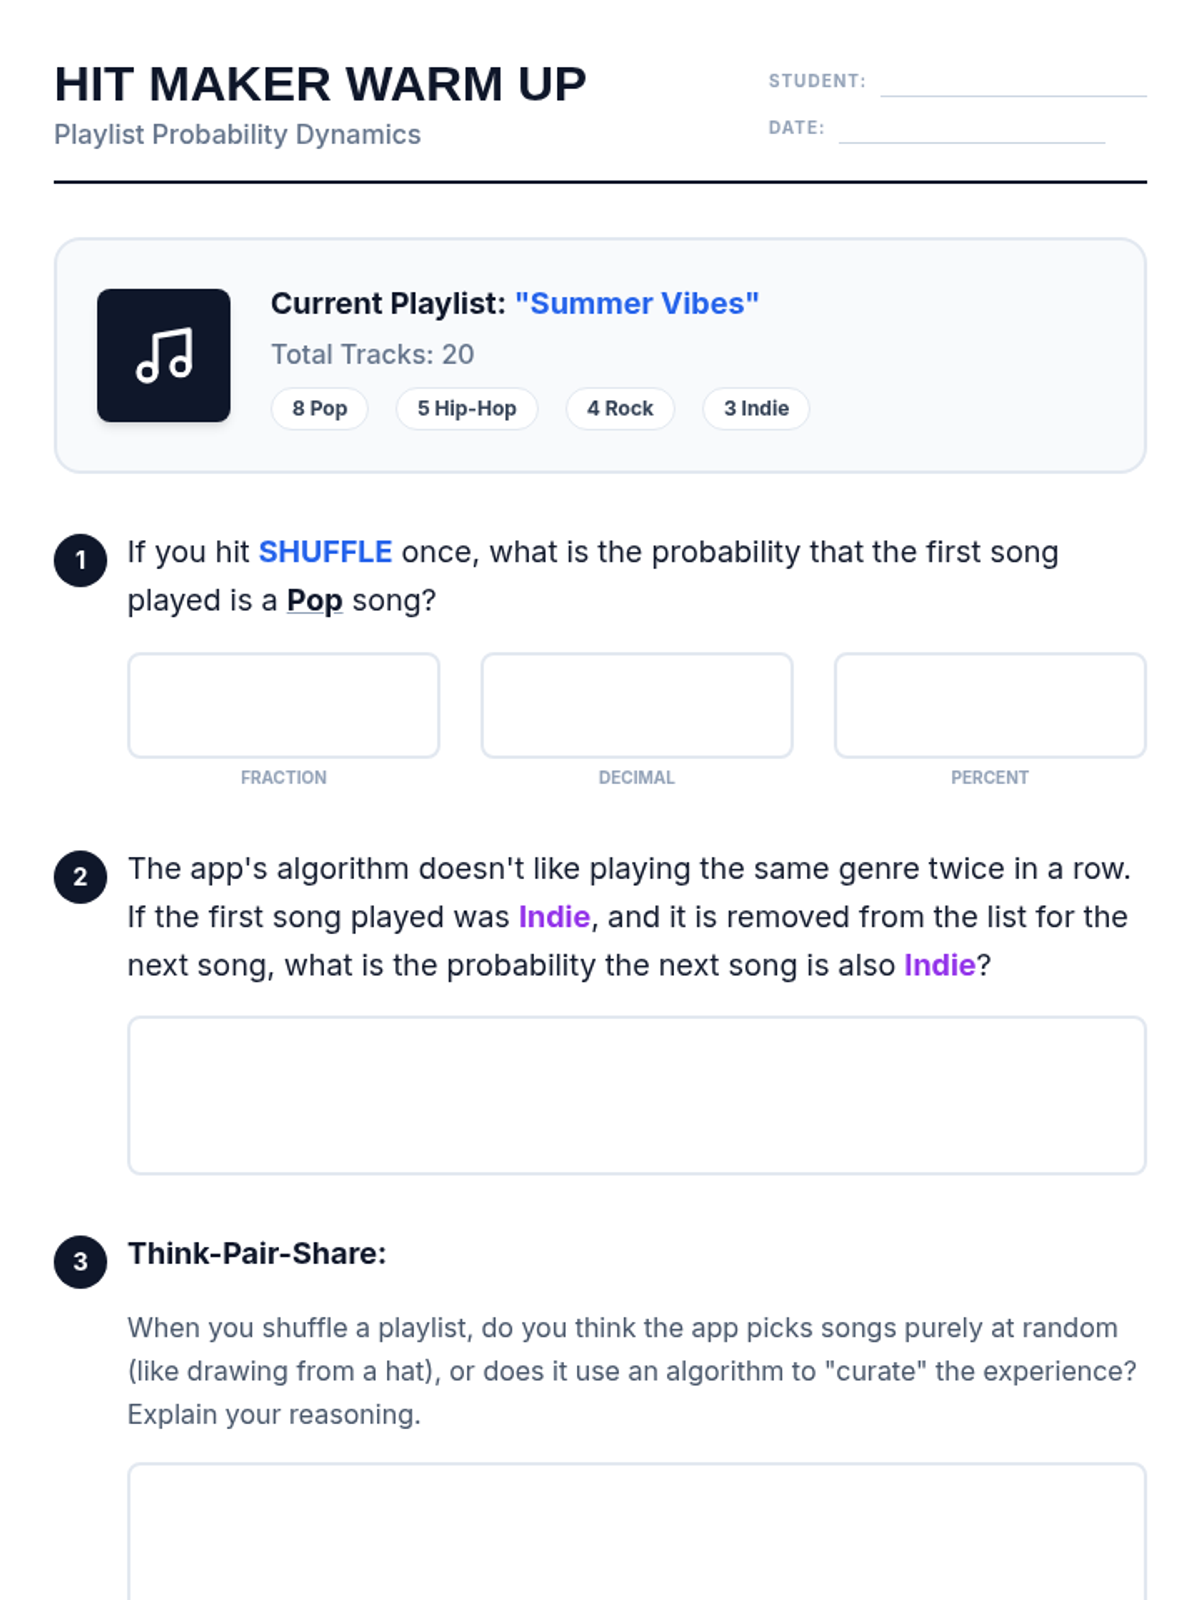
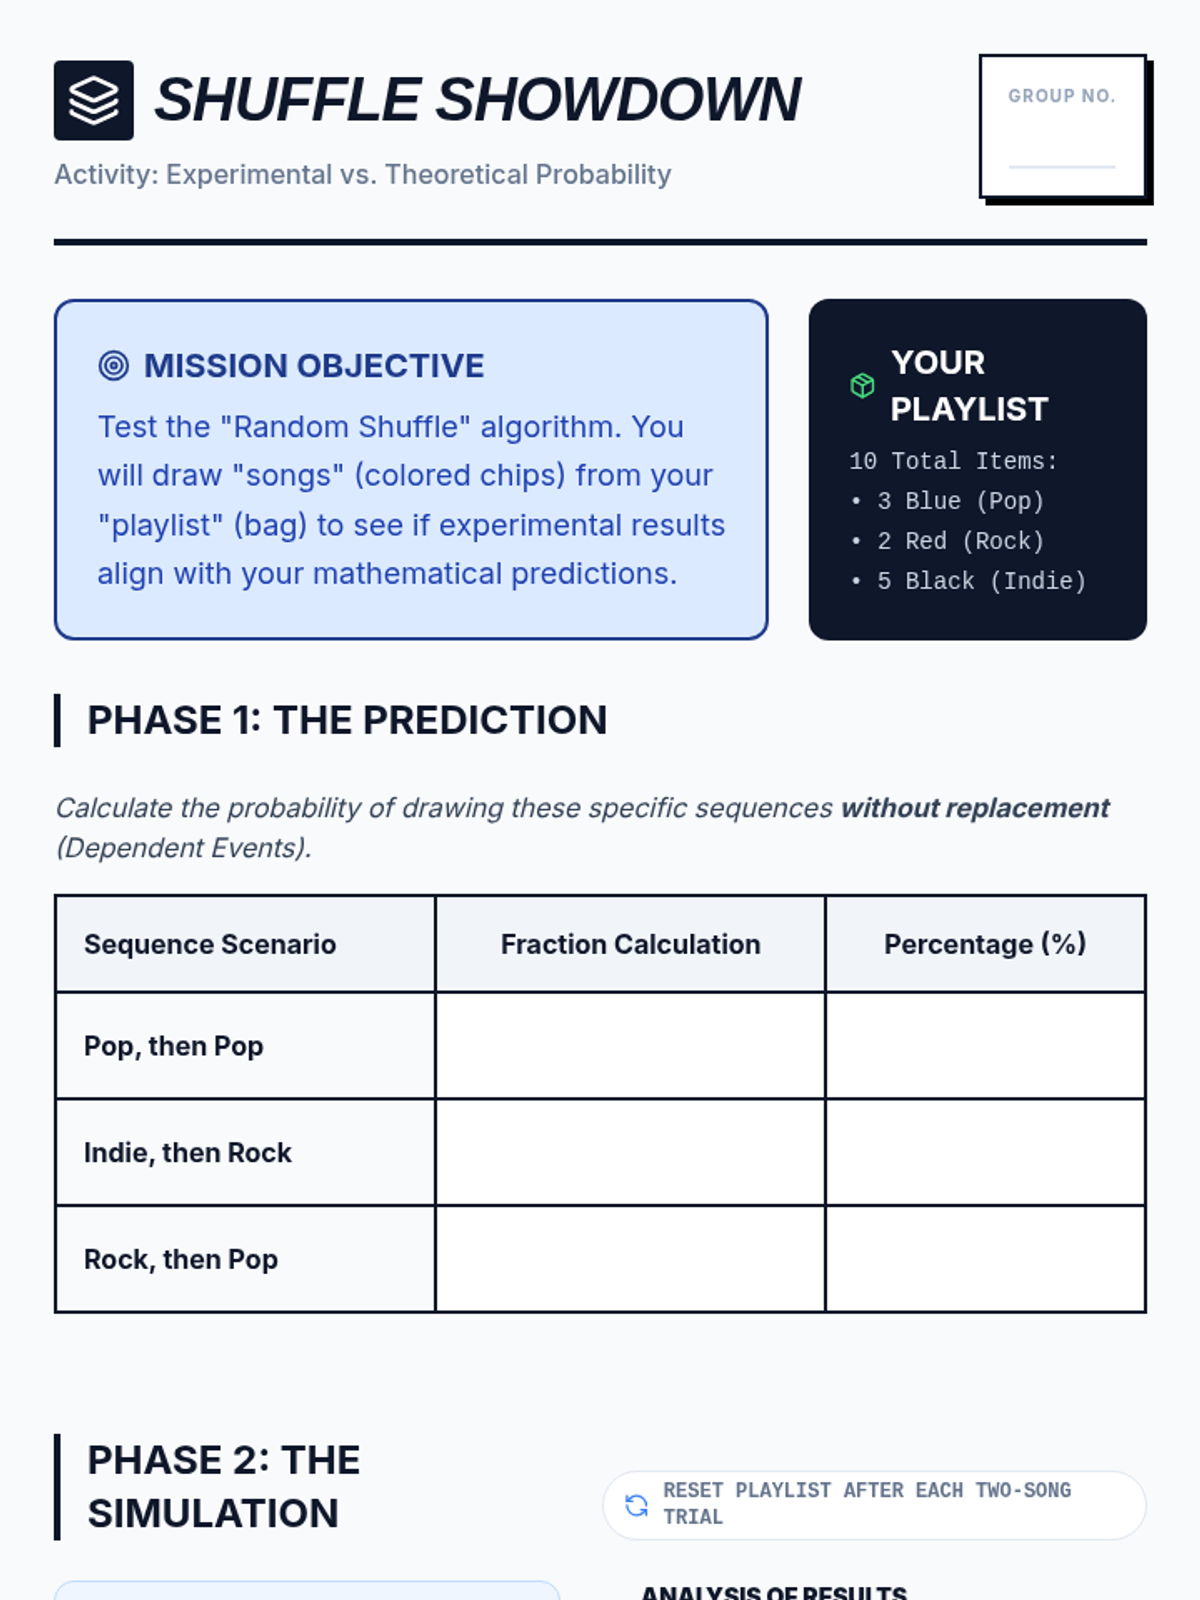
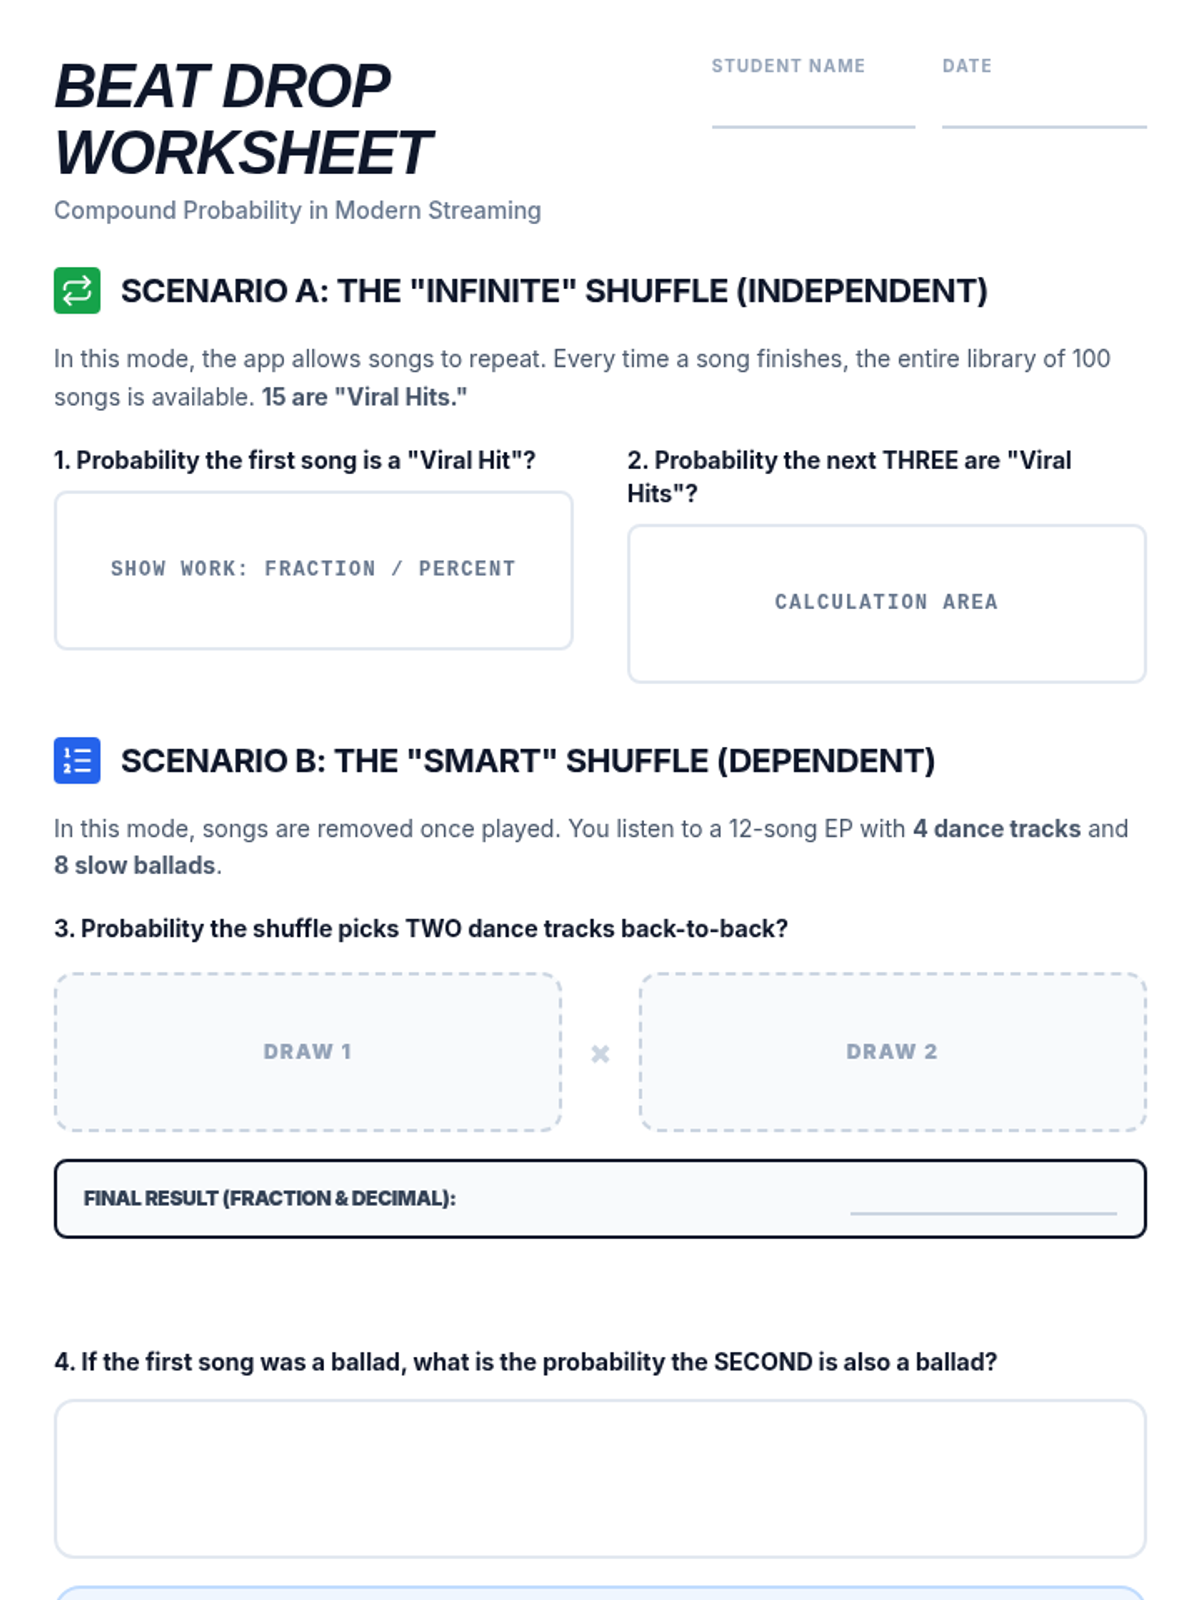
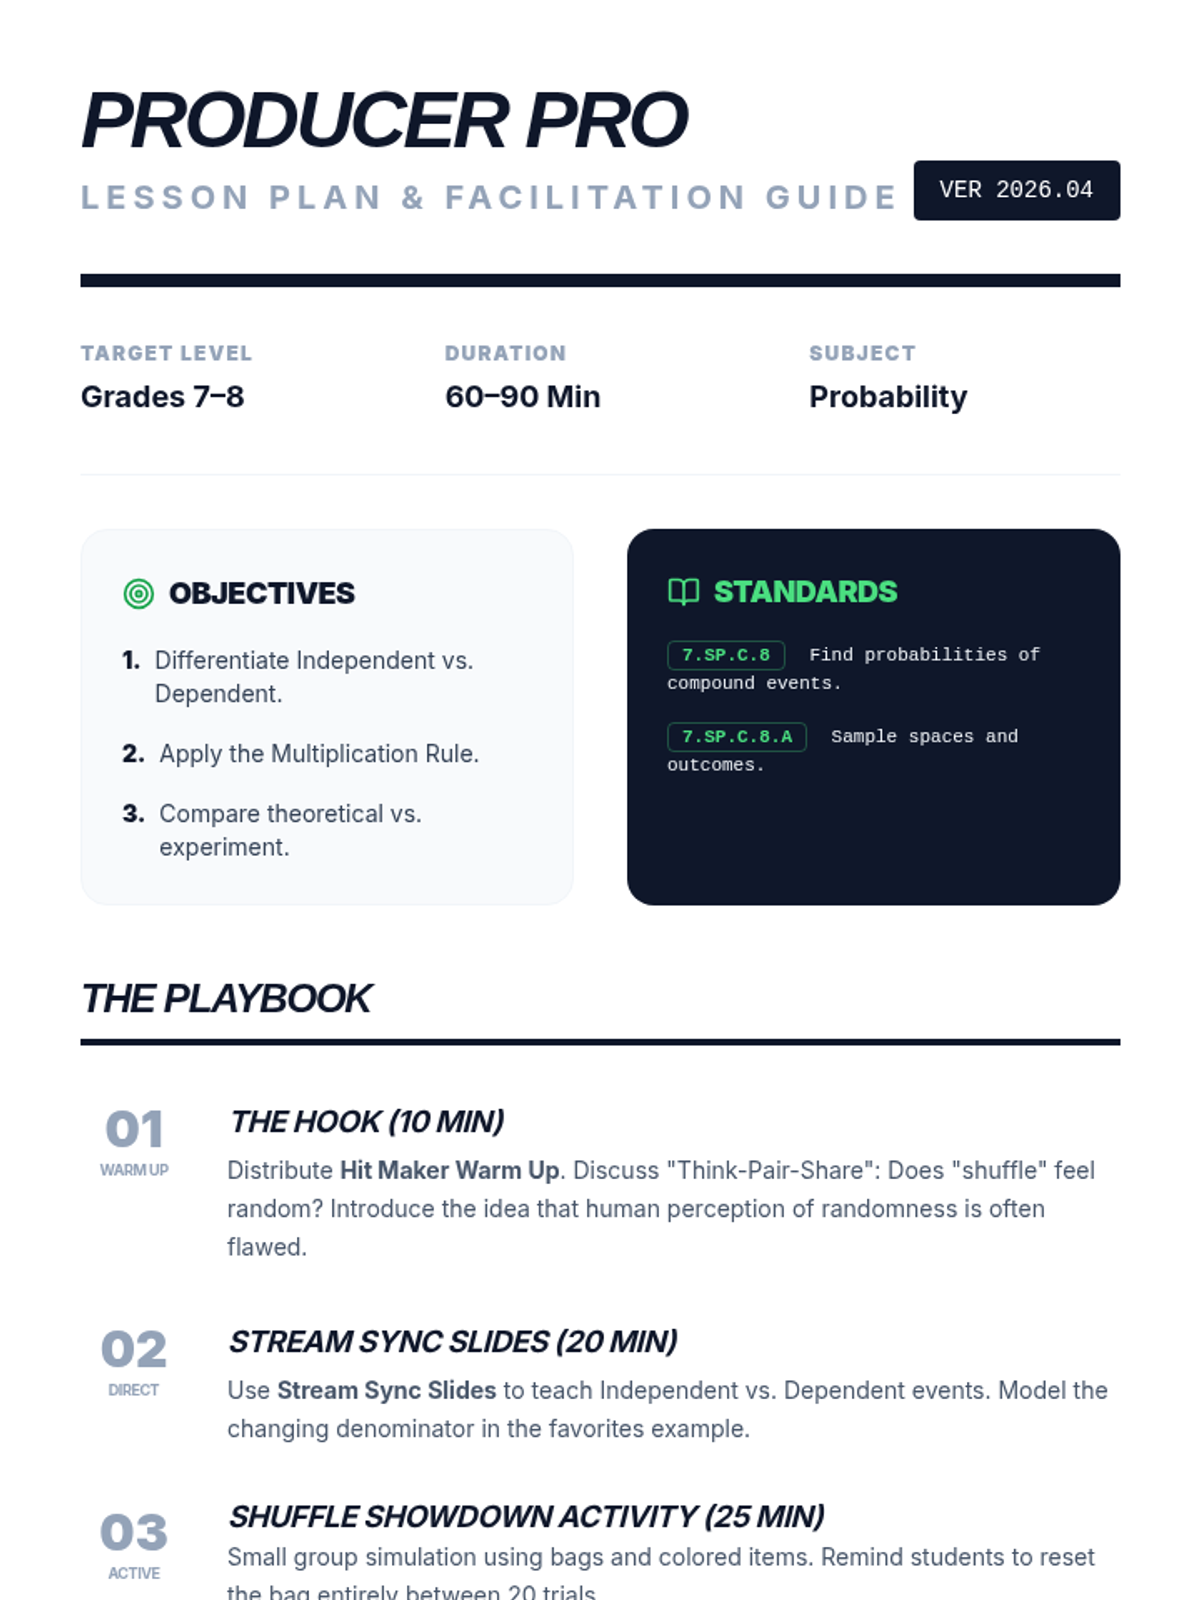
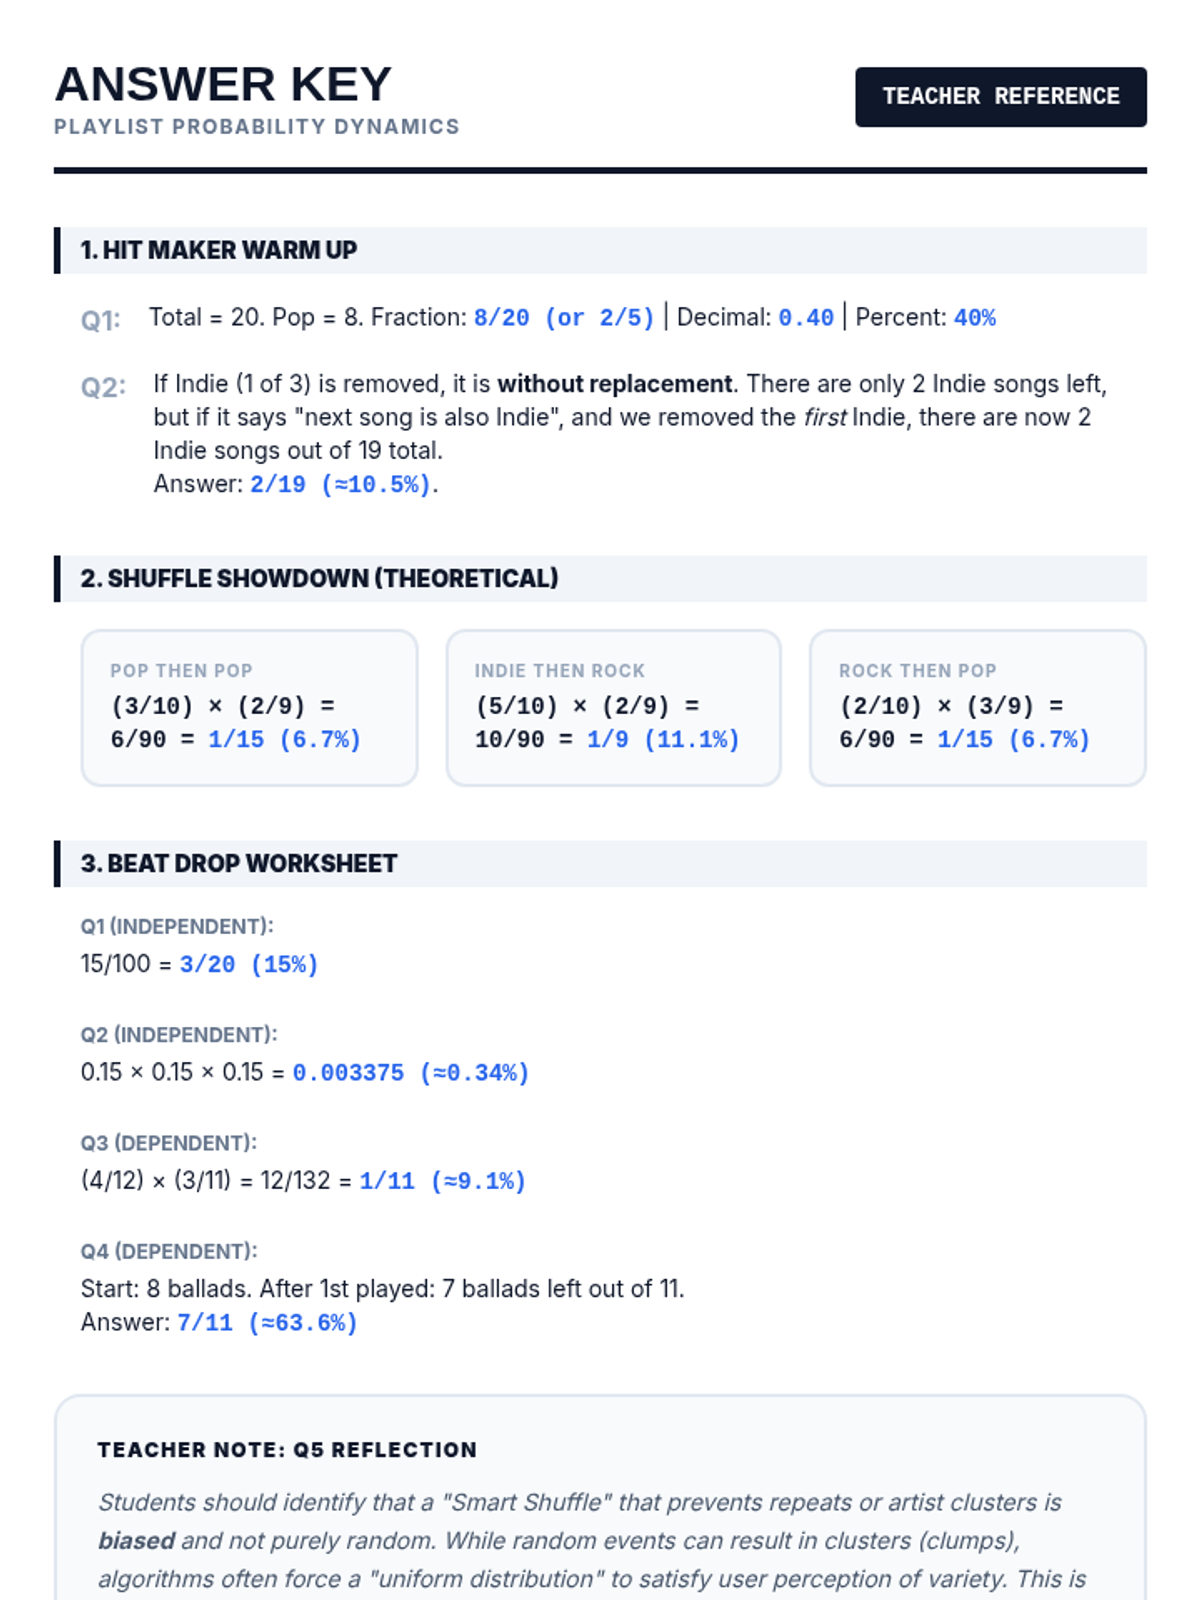
Students explore compound probability and shuffle algorithms by analyzing song frequencies and streaming data to determine the likelihood of hearing their favorite tracks.
A comprehensive introduction to basic statistics using the world of the Teen Titans. Students will master Mean, Median, Mode, Range, and Probability through hands-on practice with their favorite heroes.
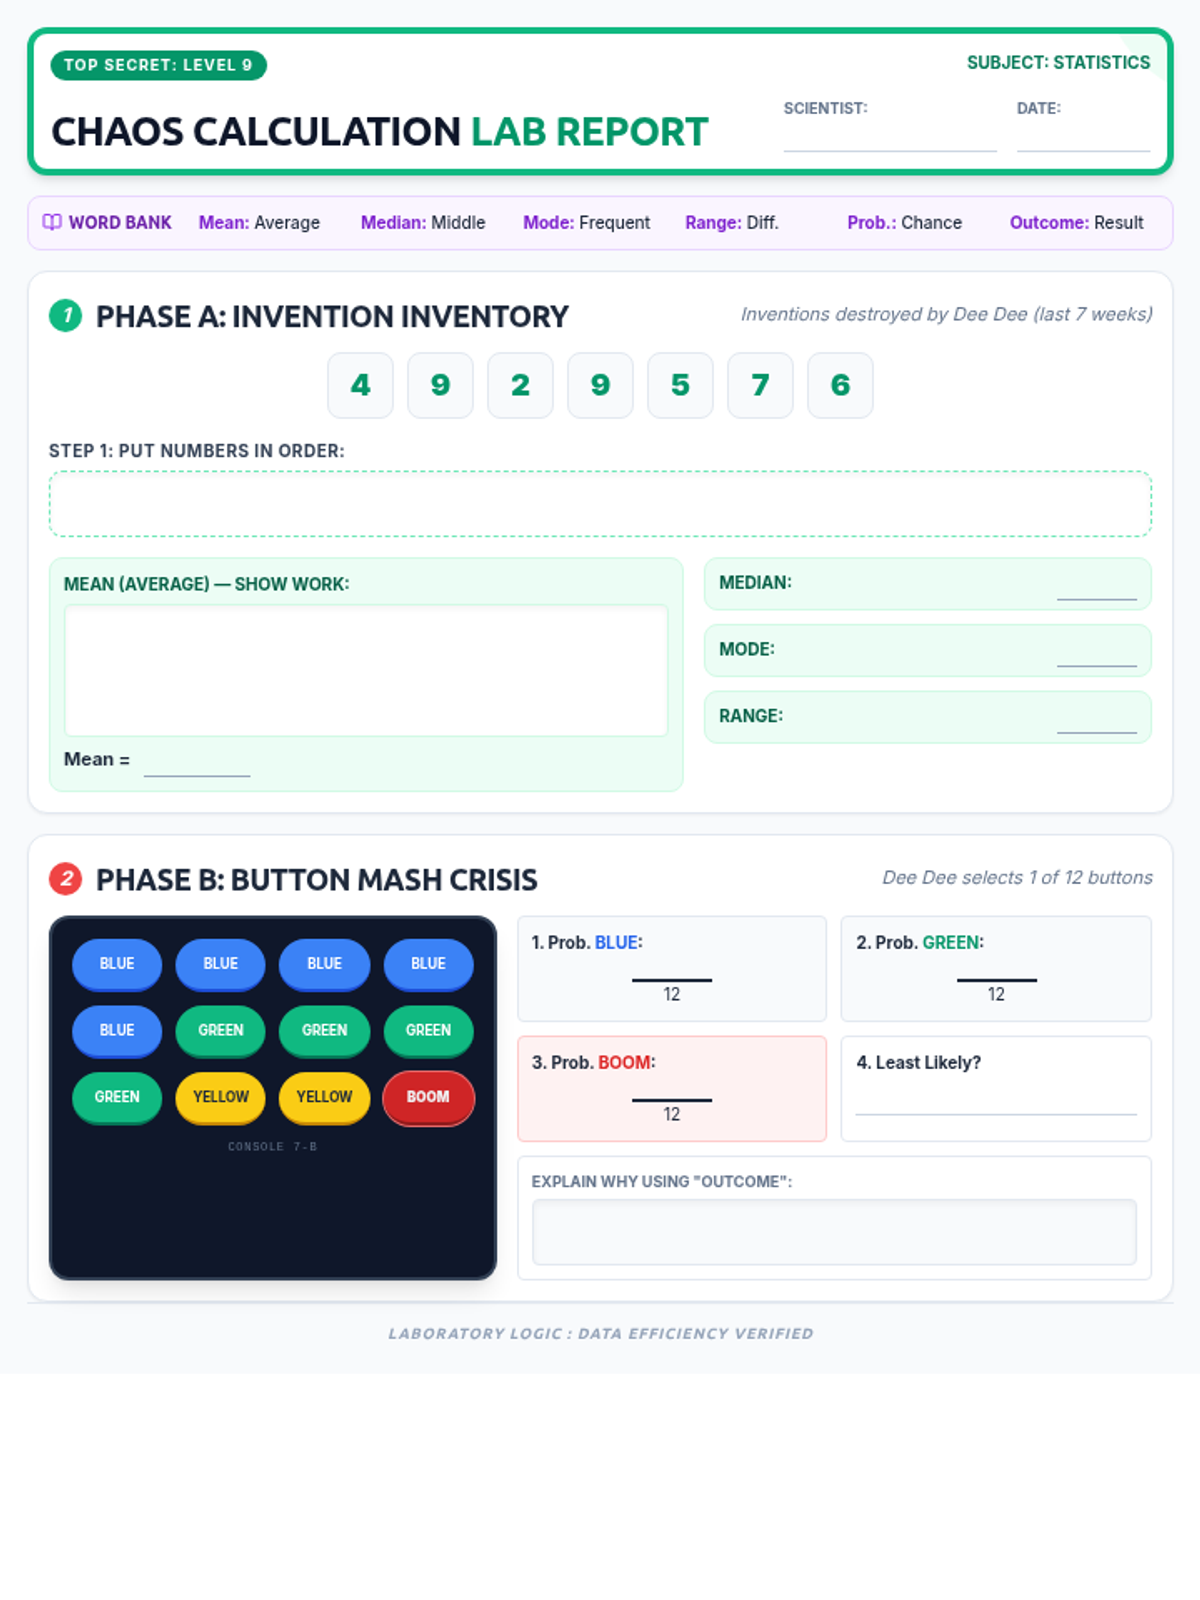
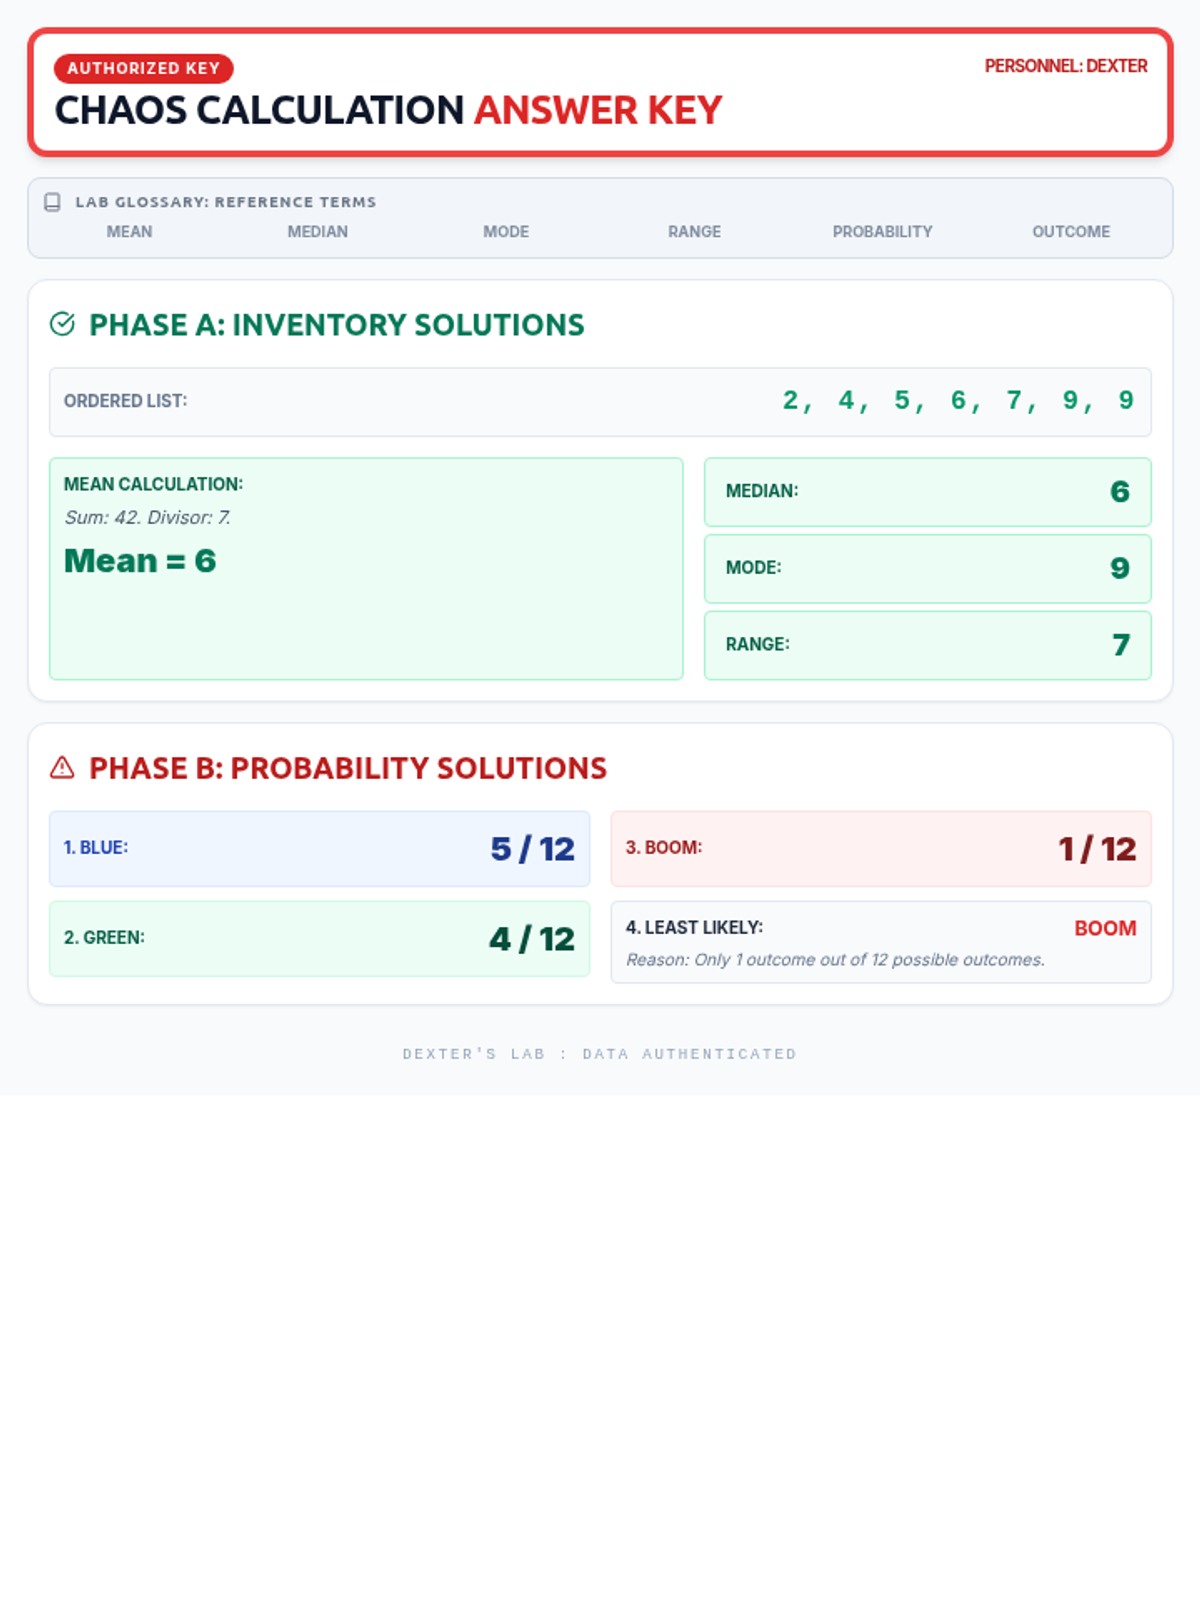
A statistics lesson set in Dexter's secret laboratory, focusing on central tendency (mean, median, mode) and basic probability amidst the chaos of Dee Dee's interference.
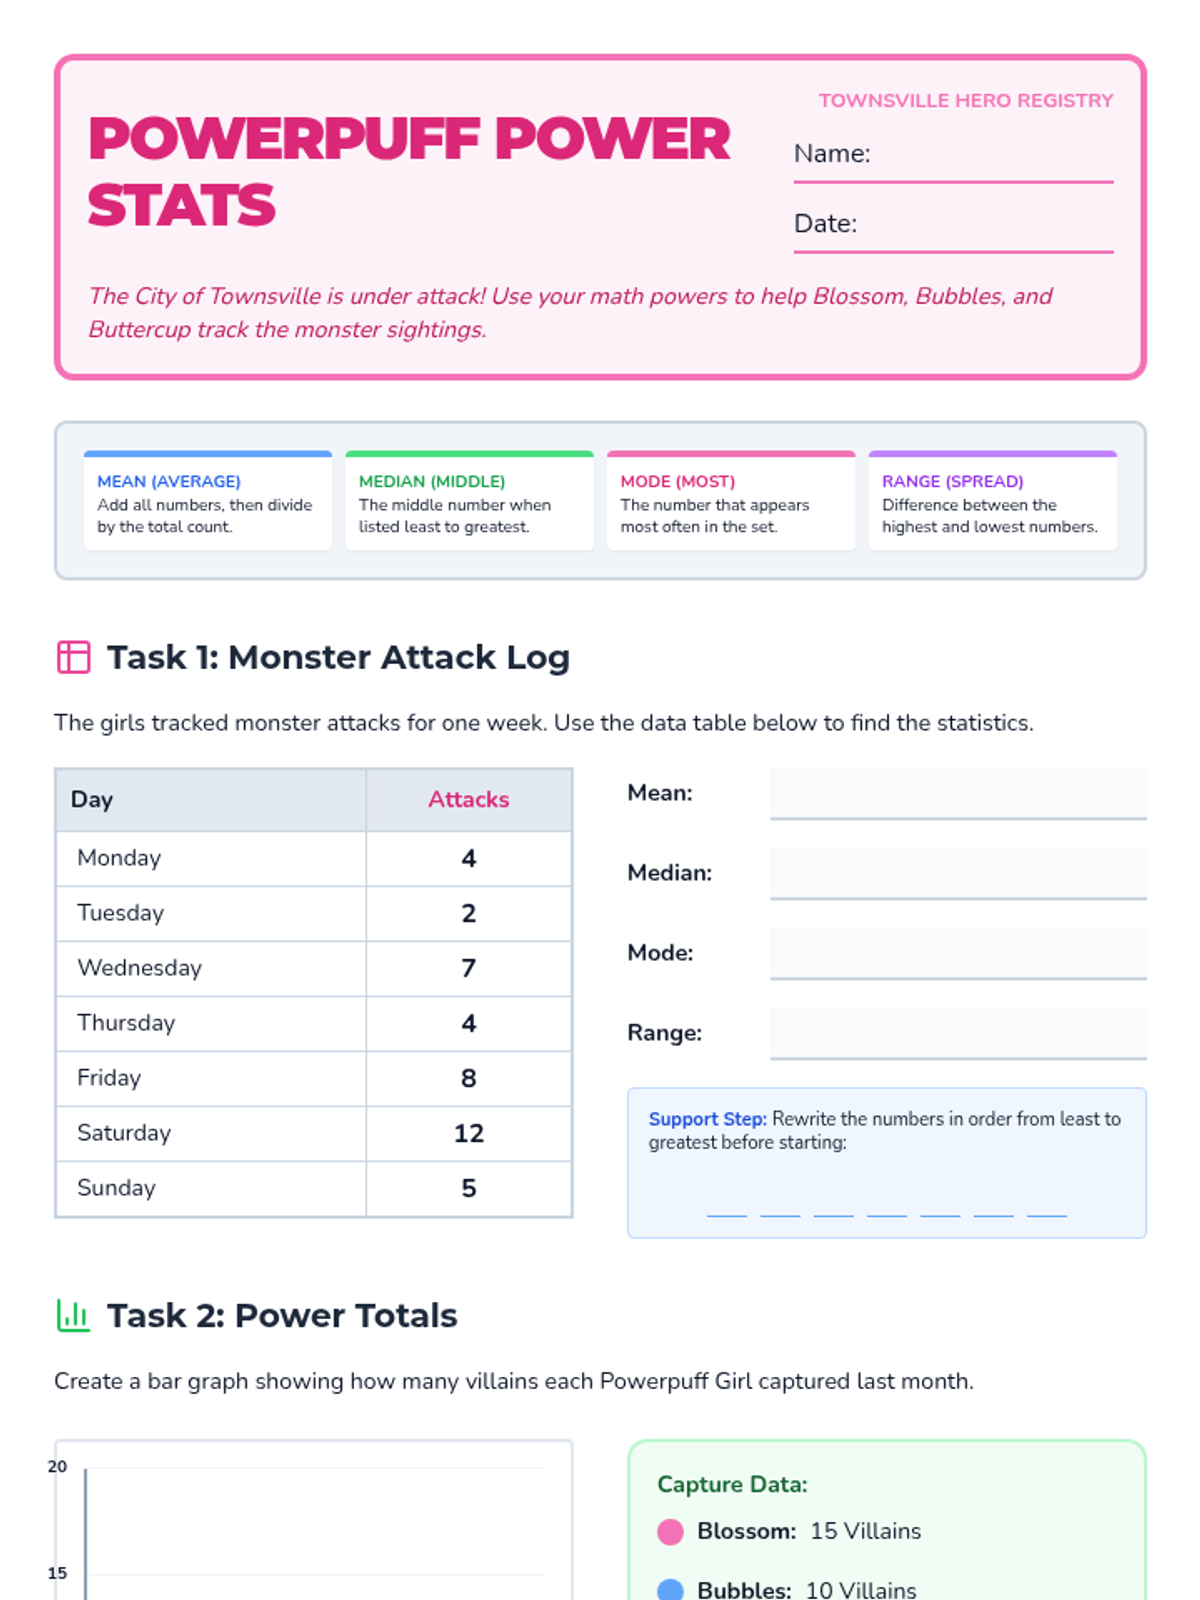
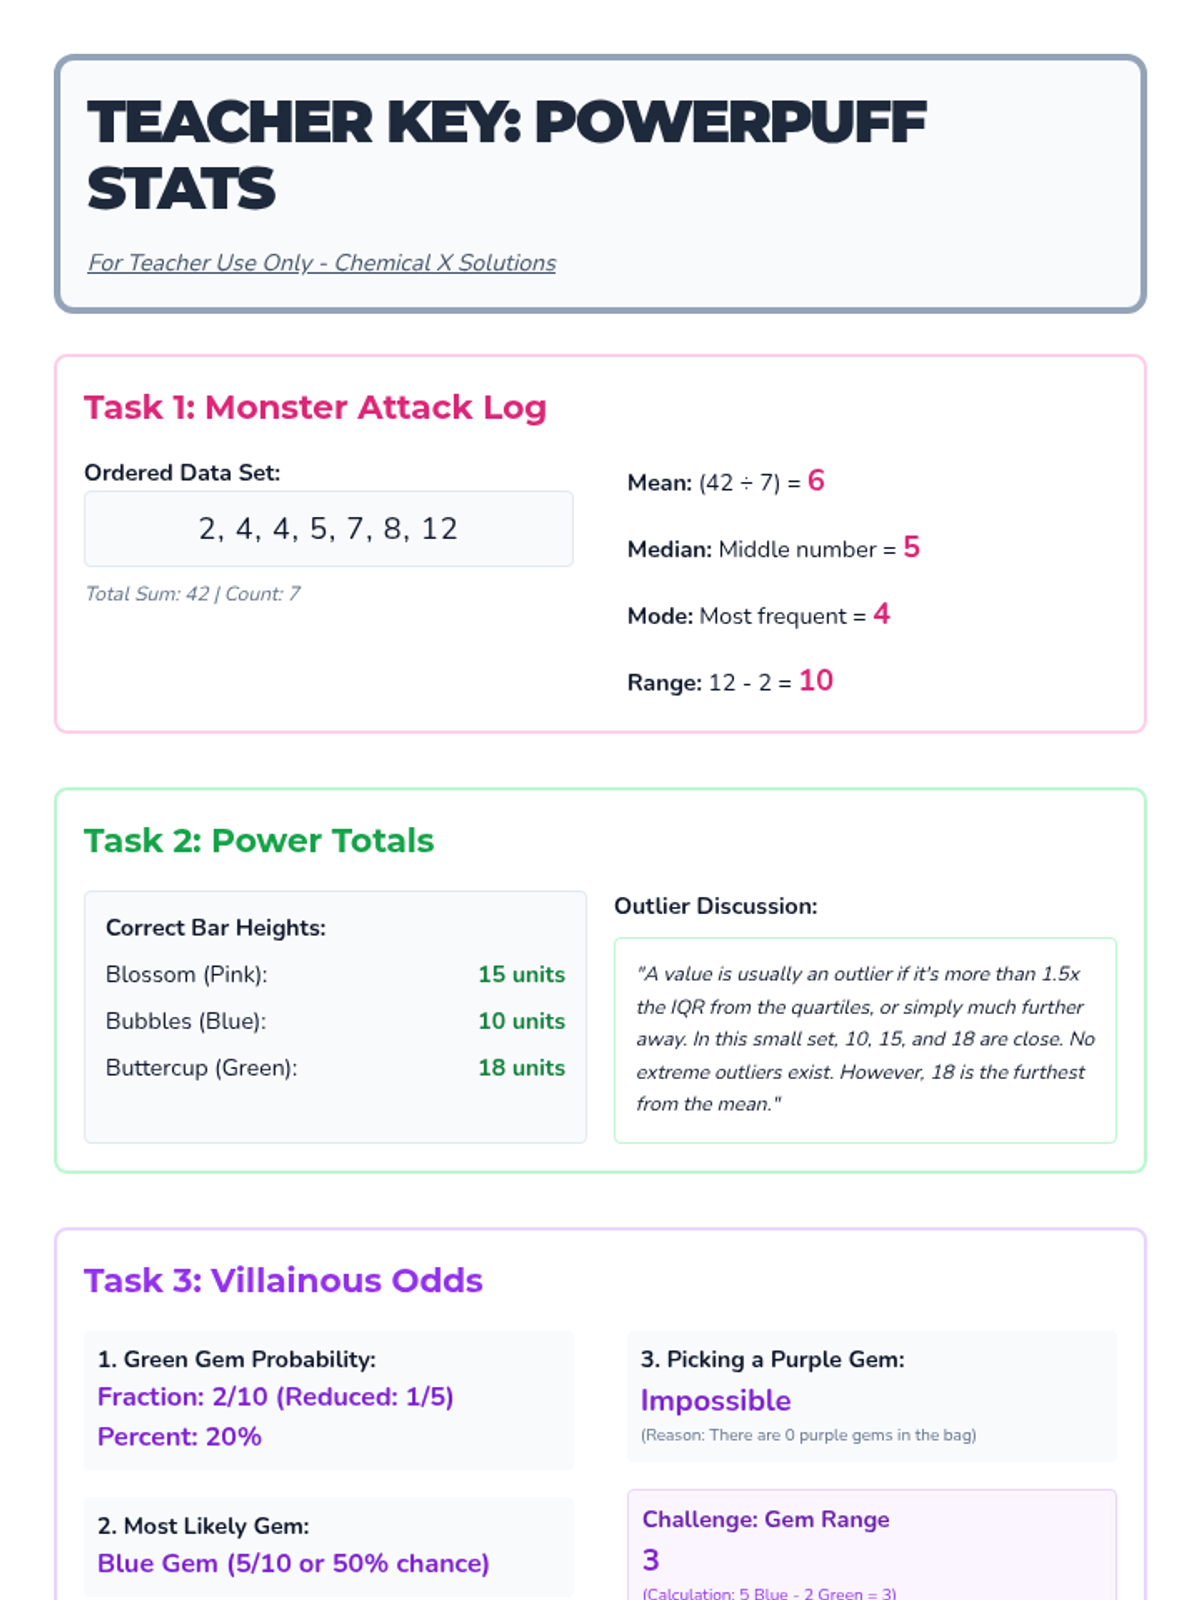
A statistics lesson themed around the Powerpuff Girls, covering central tendency, data visualization, and probability with clear visual supports for high-functioning students.
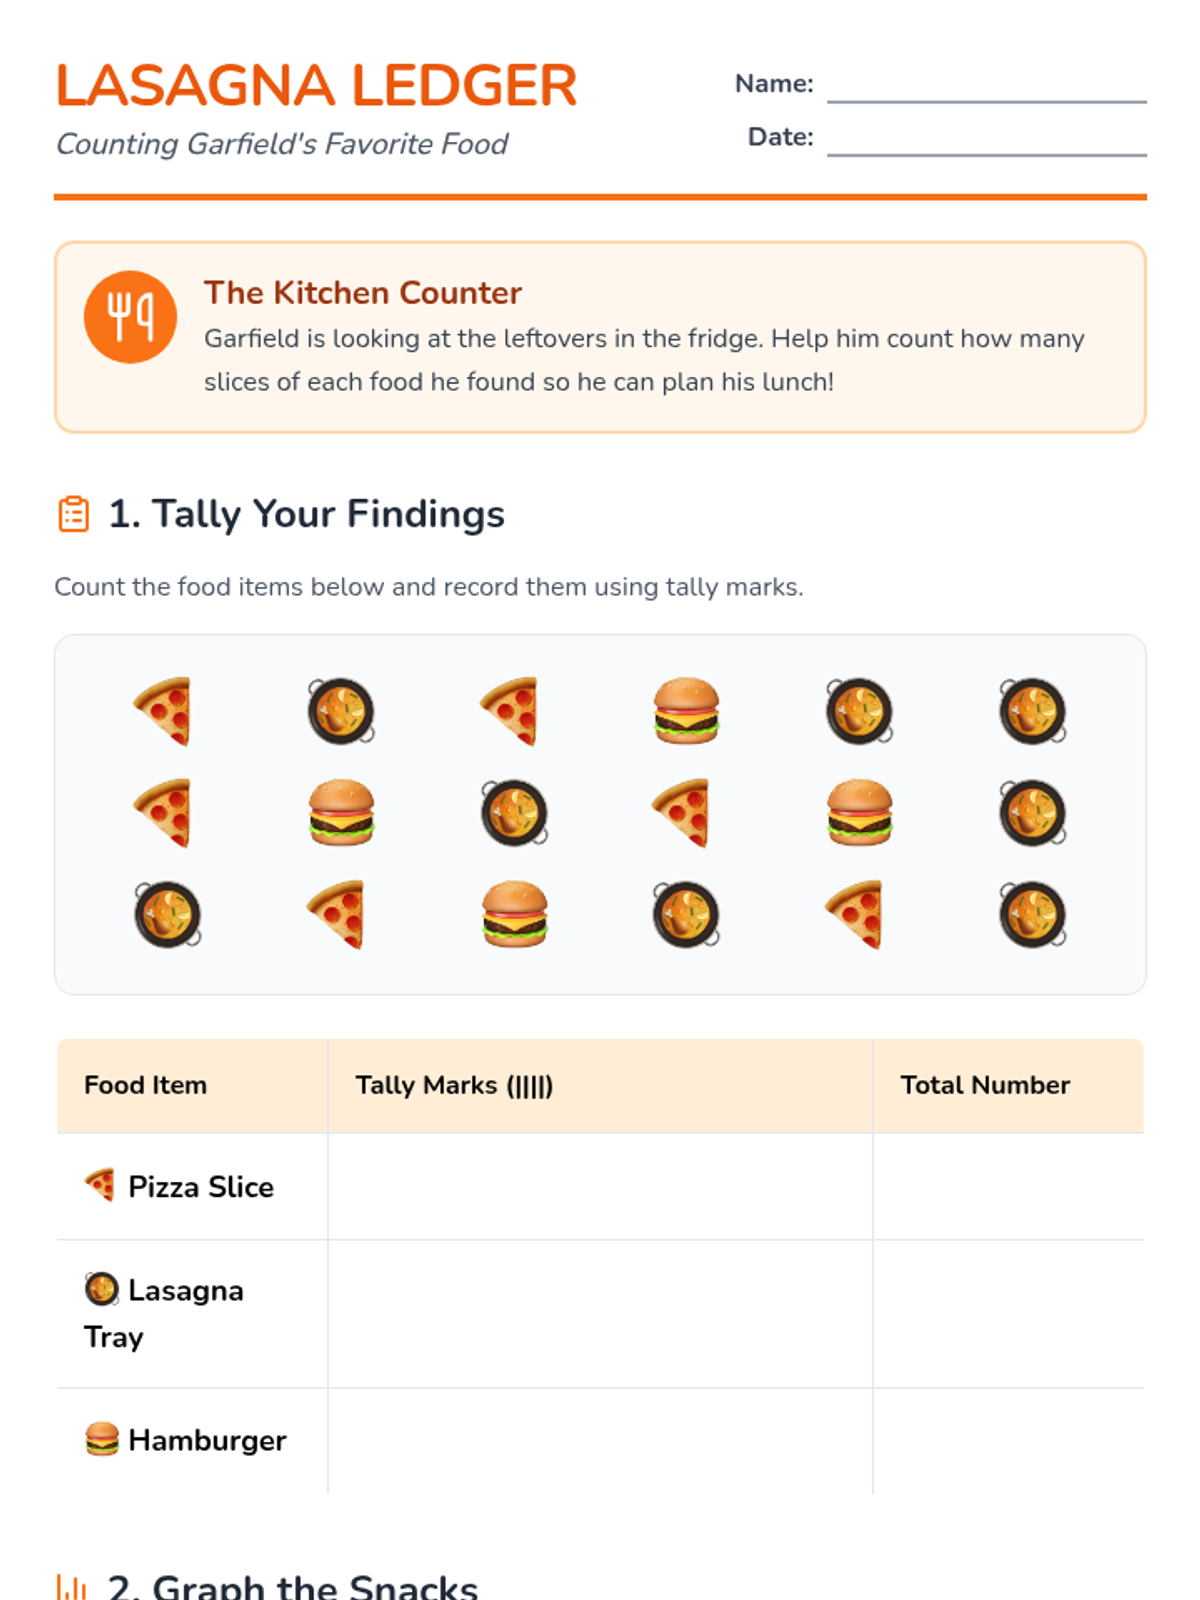
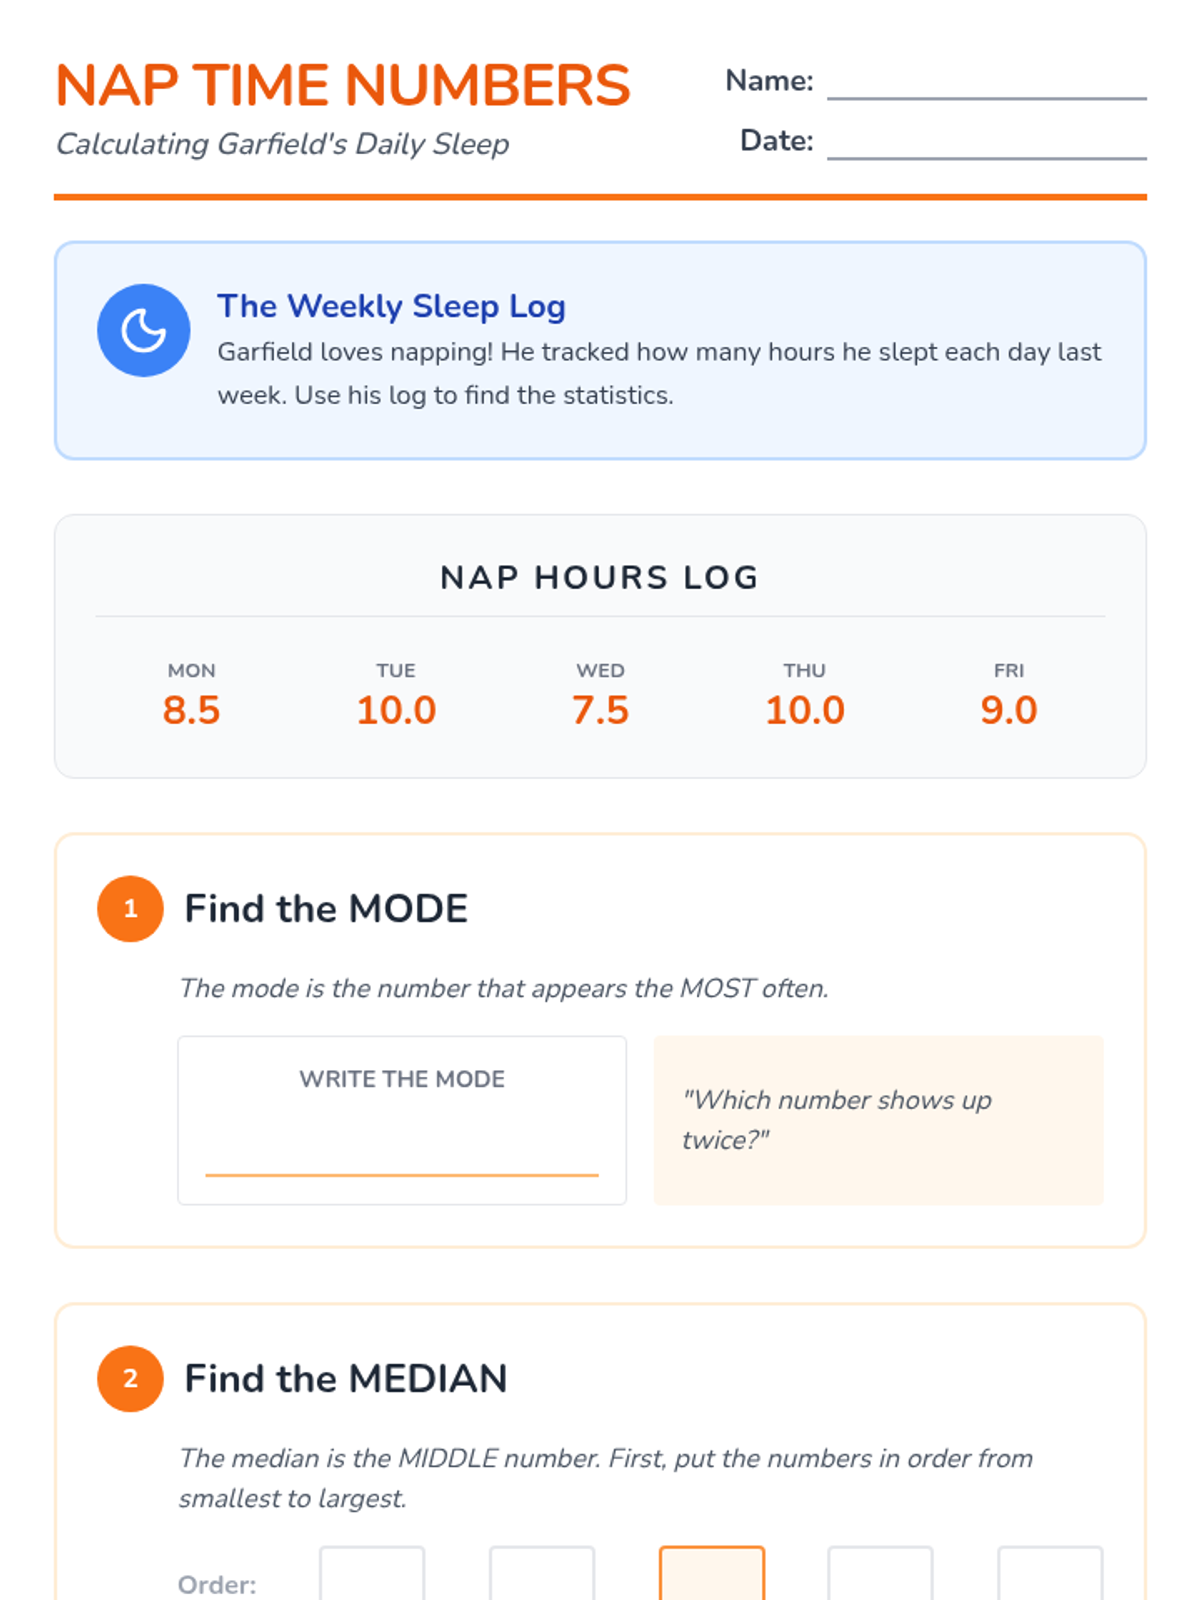
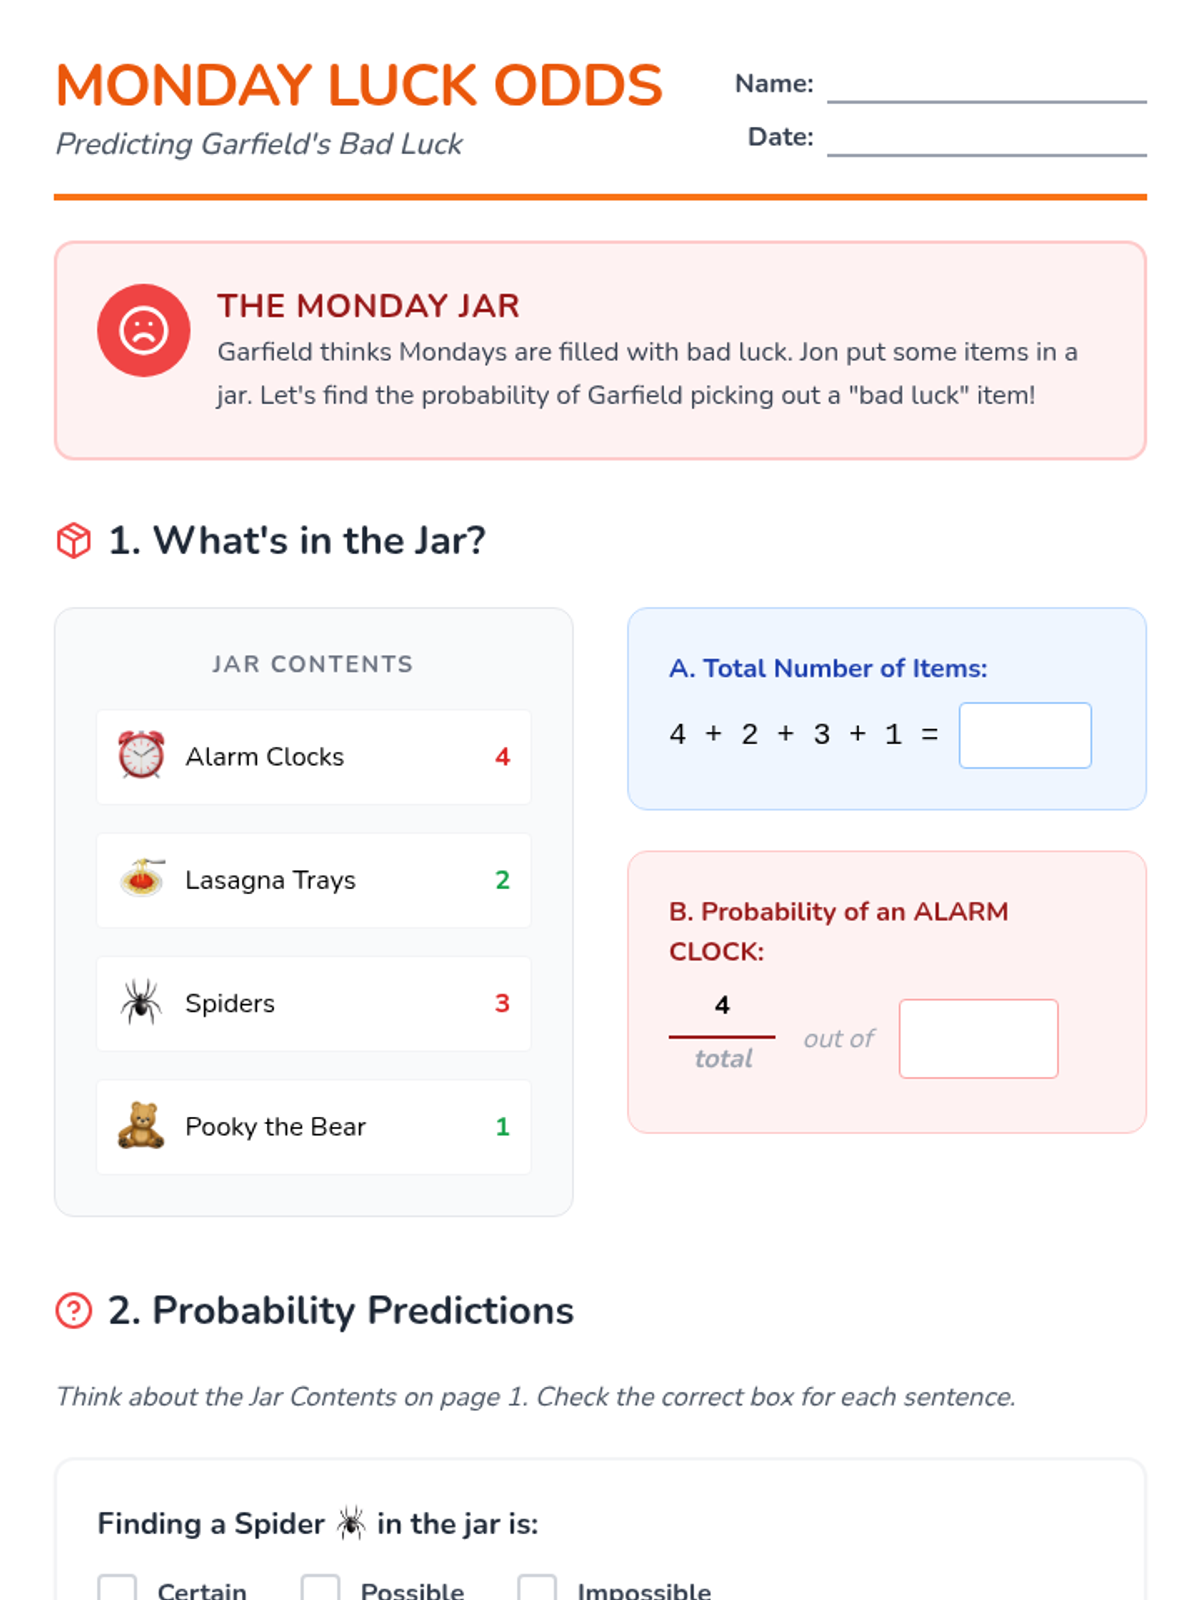
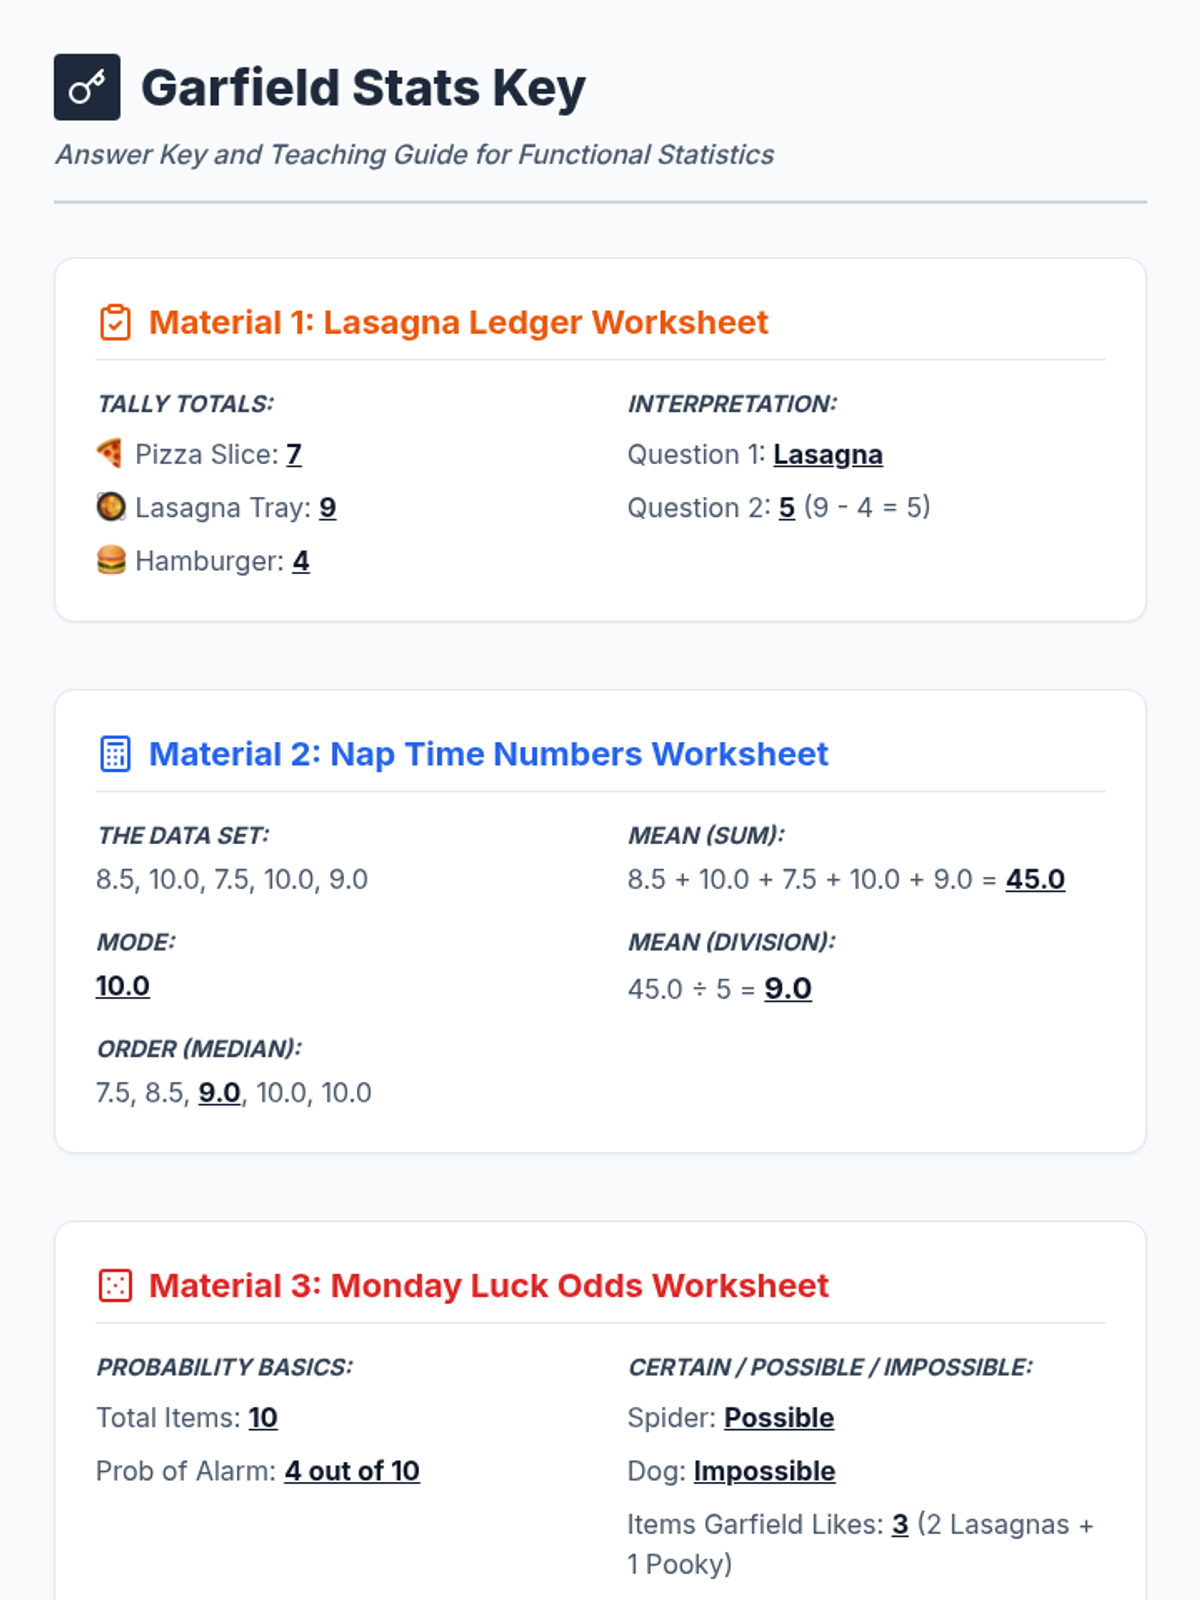
A collection of statistics activities themed around Garfield the cat, covering data collection, central tendency, and probability for students working with functional math and decimals.
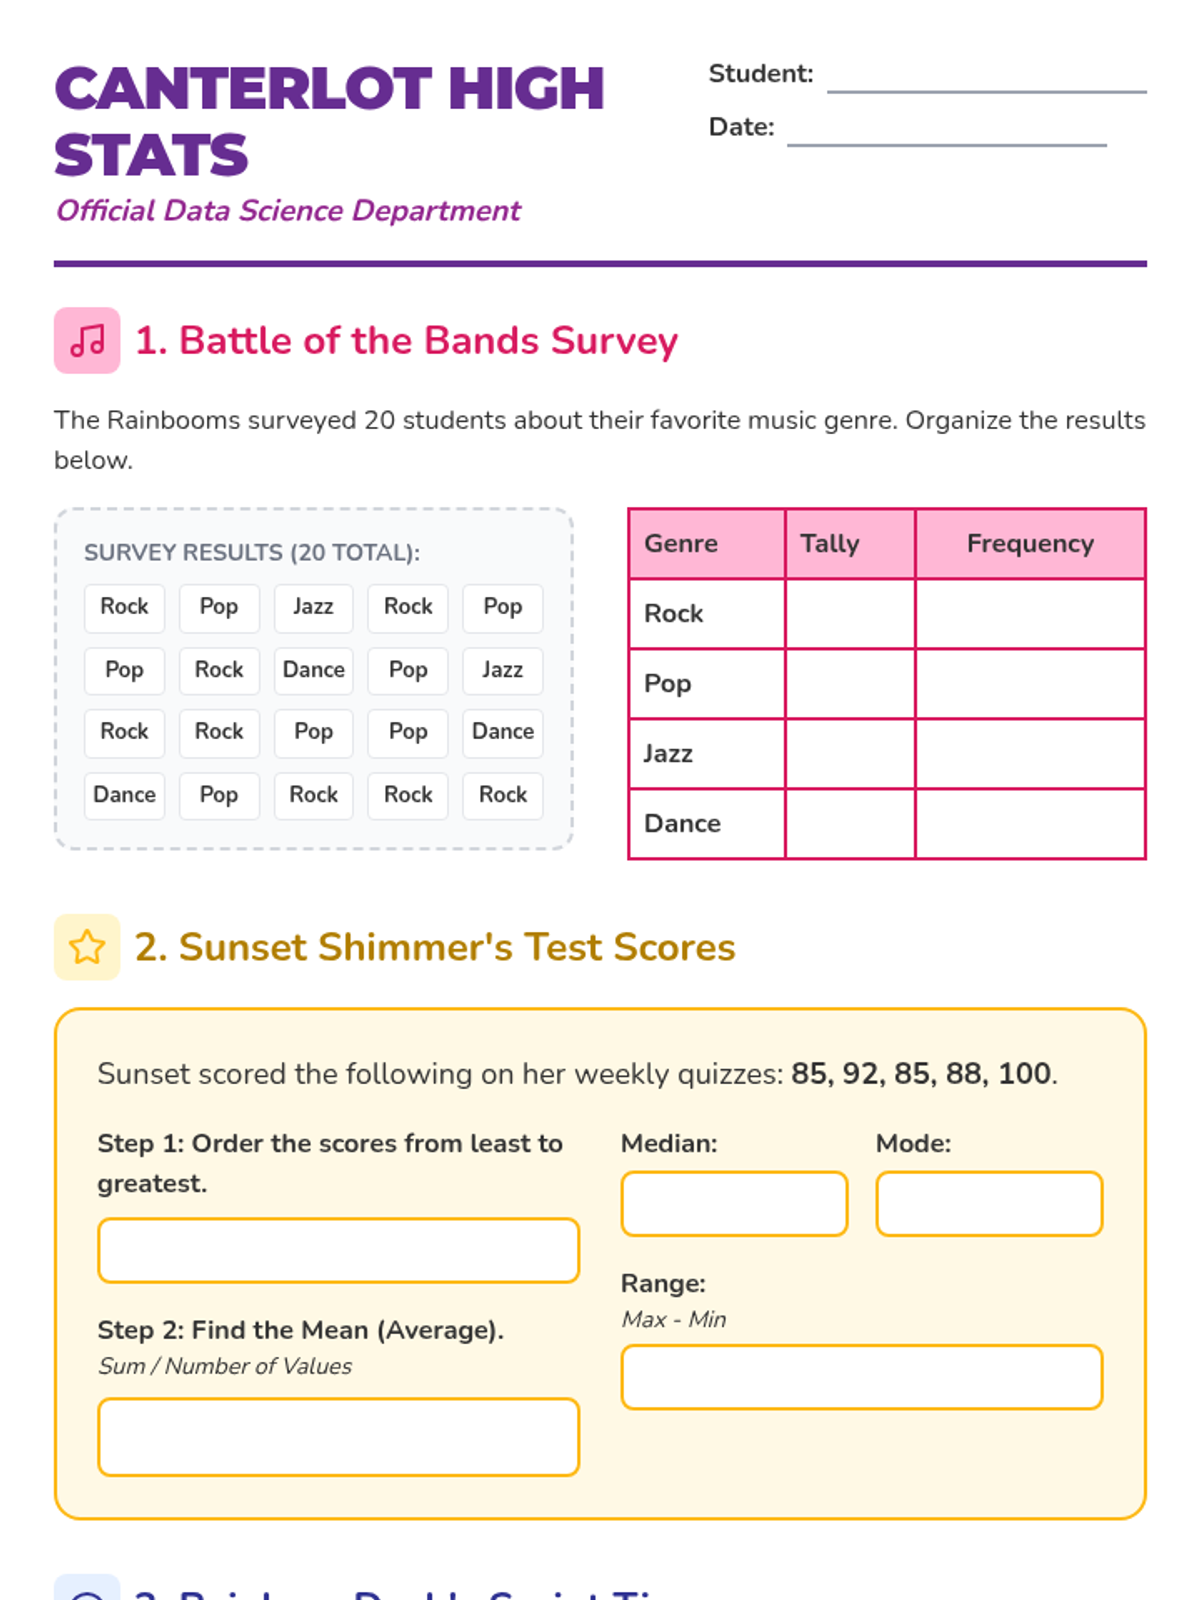
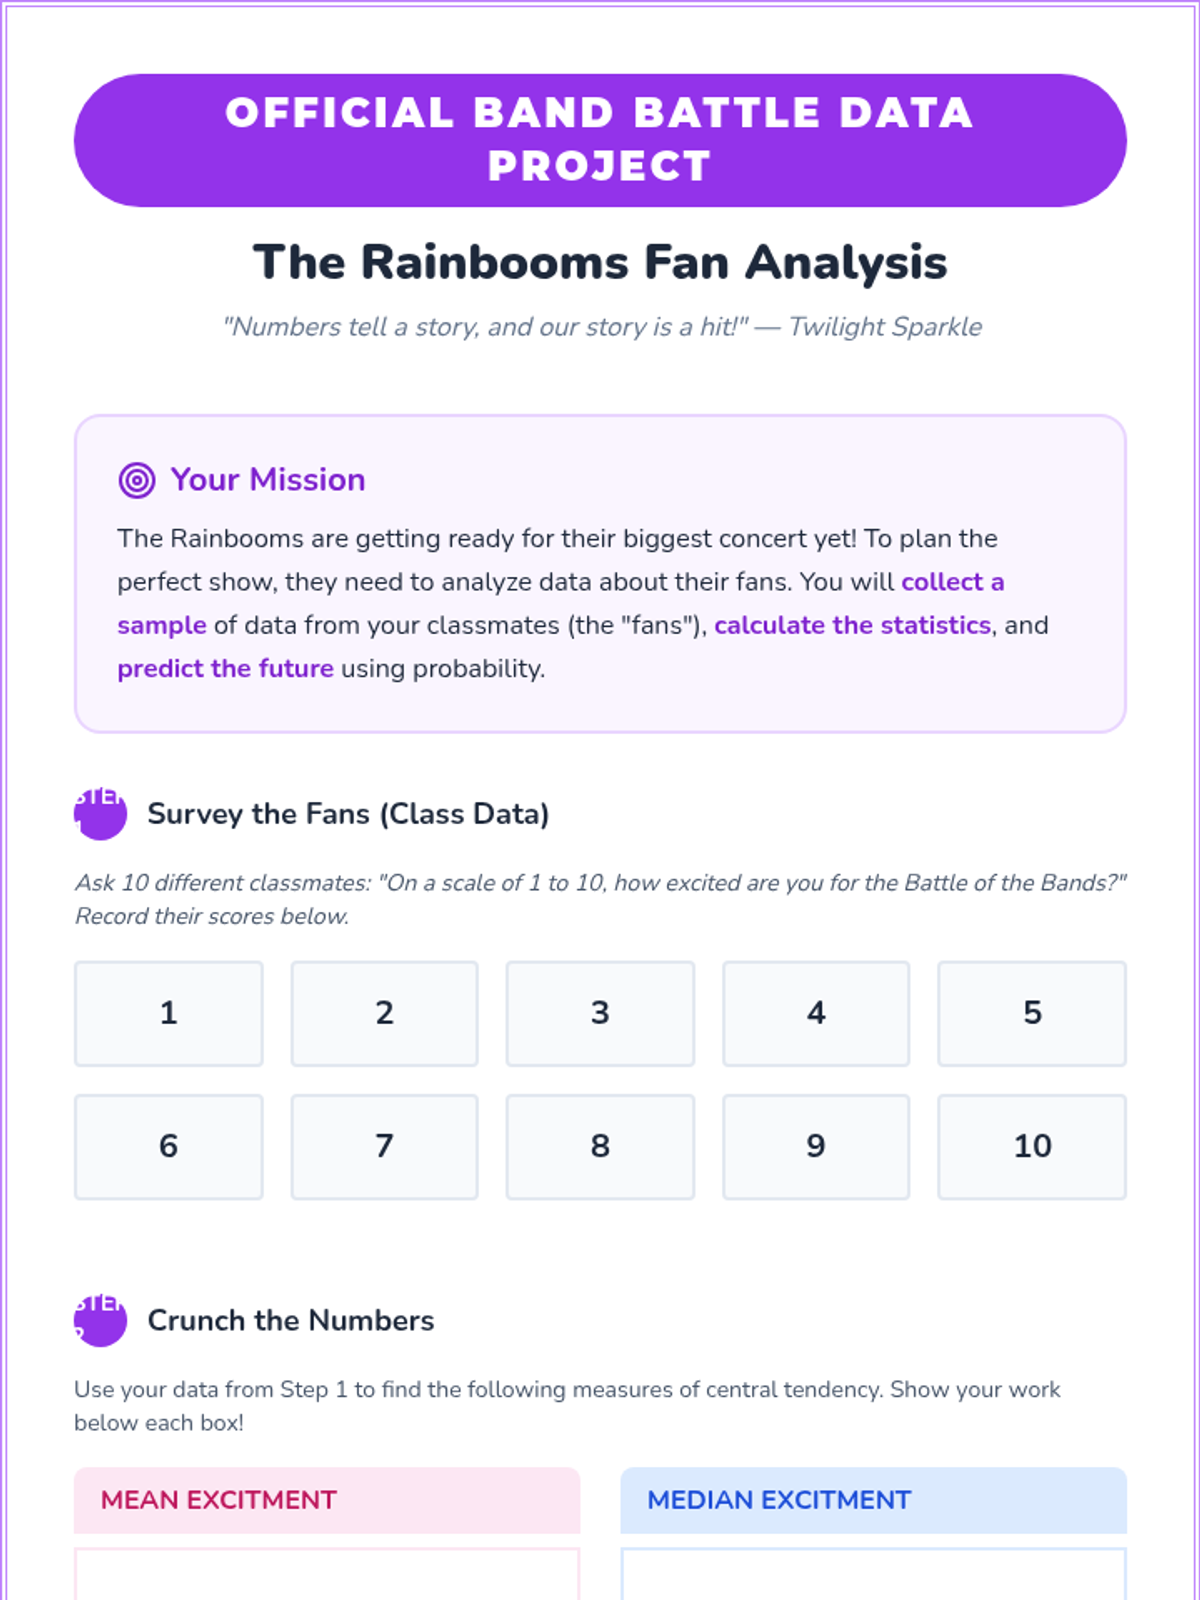
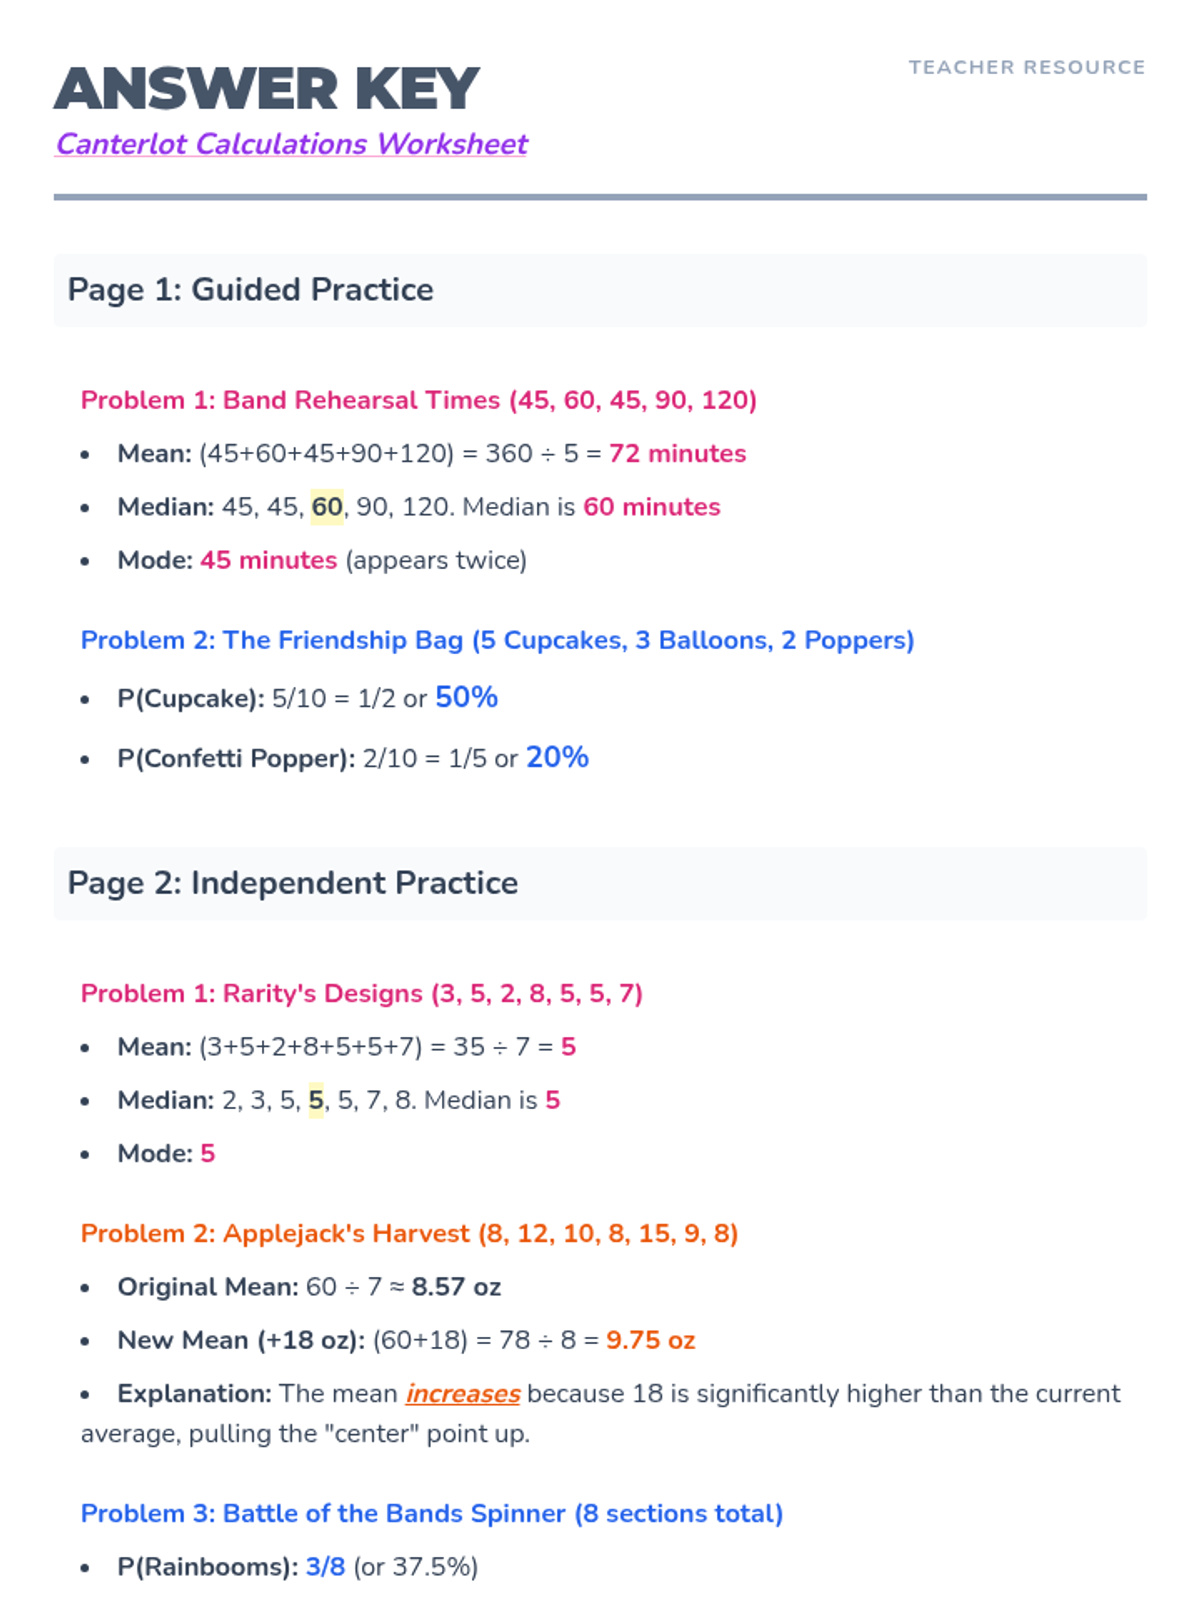
A comprehensive introduction to mean, median, mode, and basic probability themed around the world of Equestria Girls. Students will analyze data from the Battle of the Bands and student life at Canterlot High.
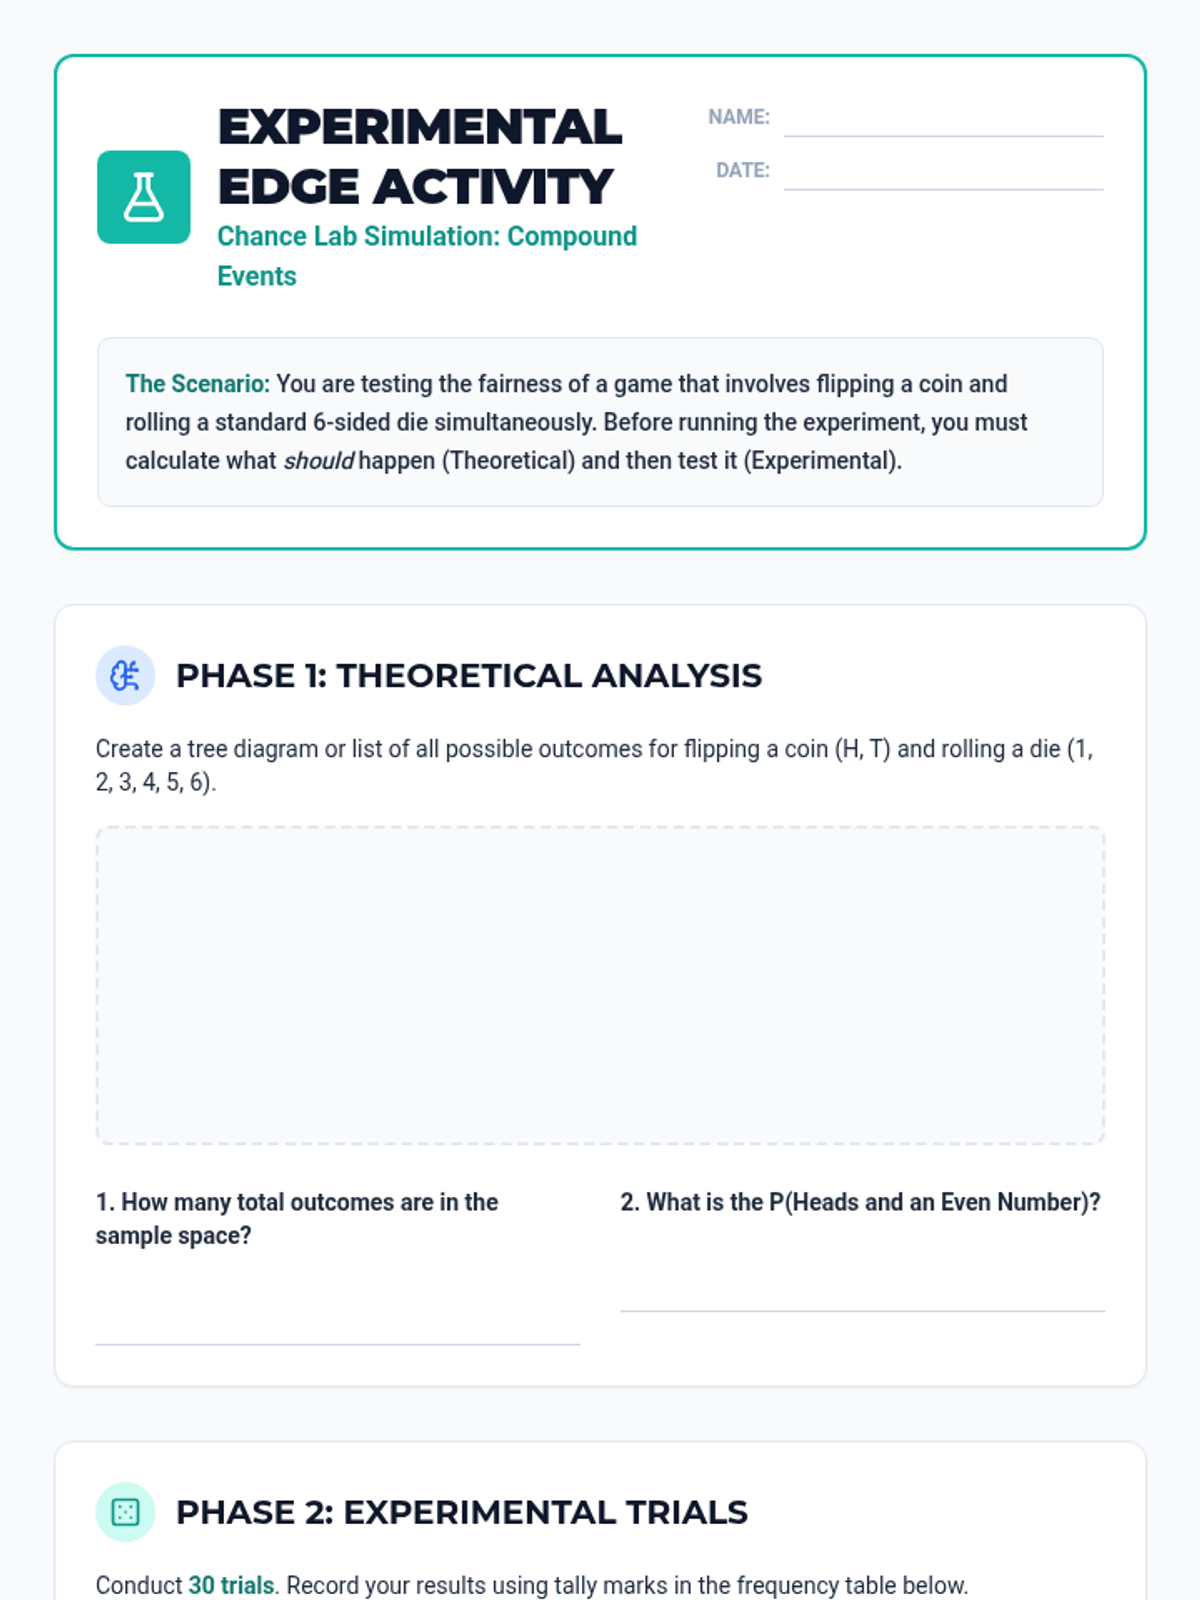
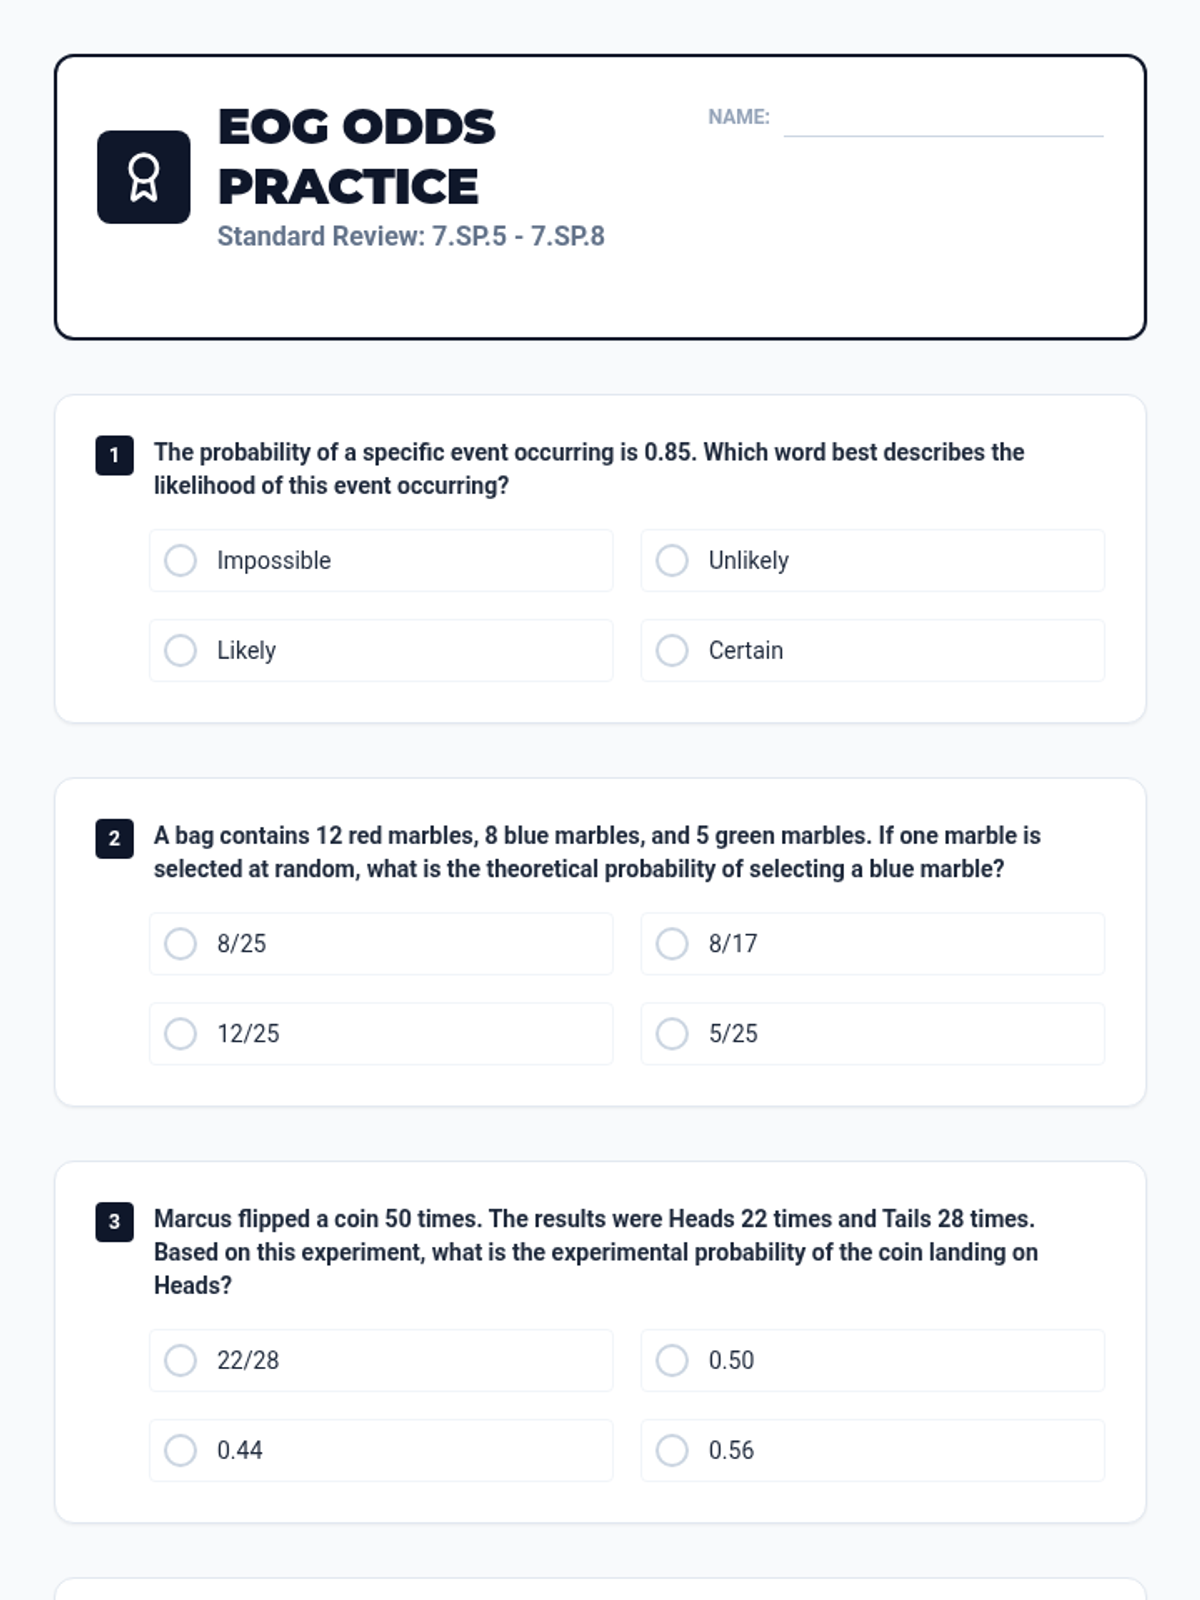
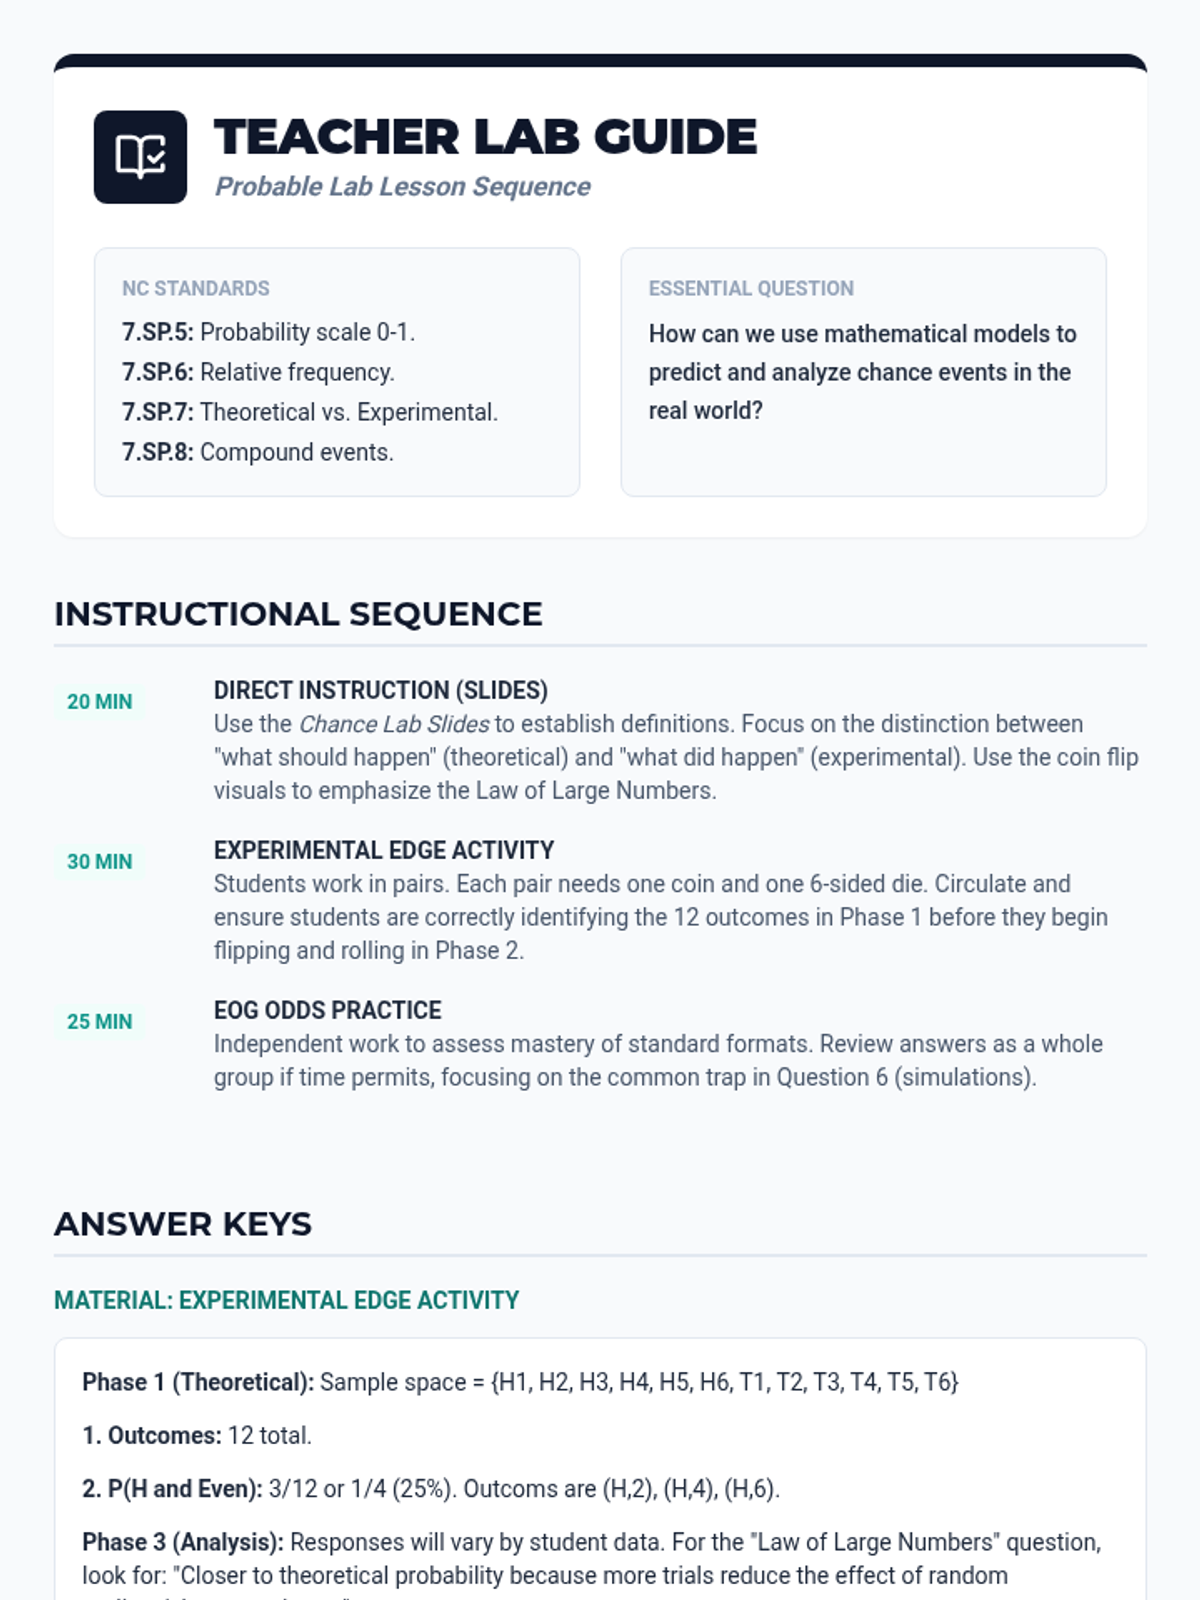
A comprehensive lesson exploring the relationship between theoretical and experimental probability through hands-on simulations and EOG-style practice. Students will move from understanding the probability scale to conducting their own chance experiments and analyzing the results.
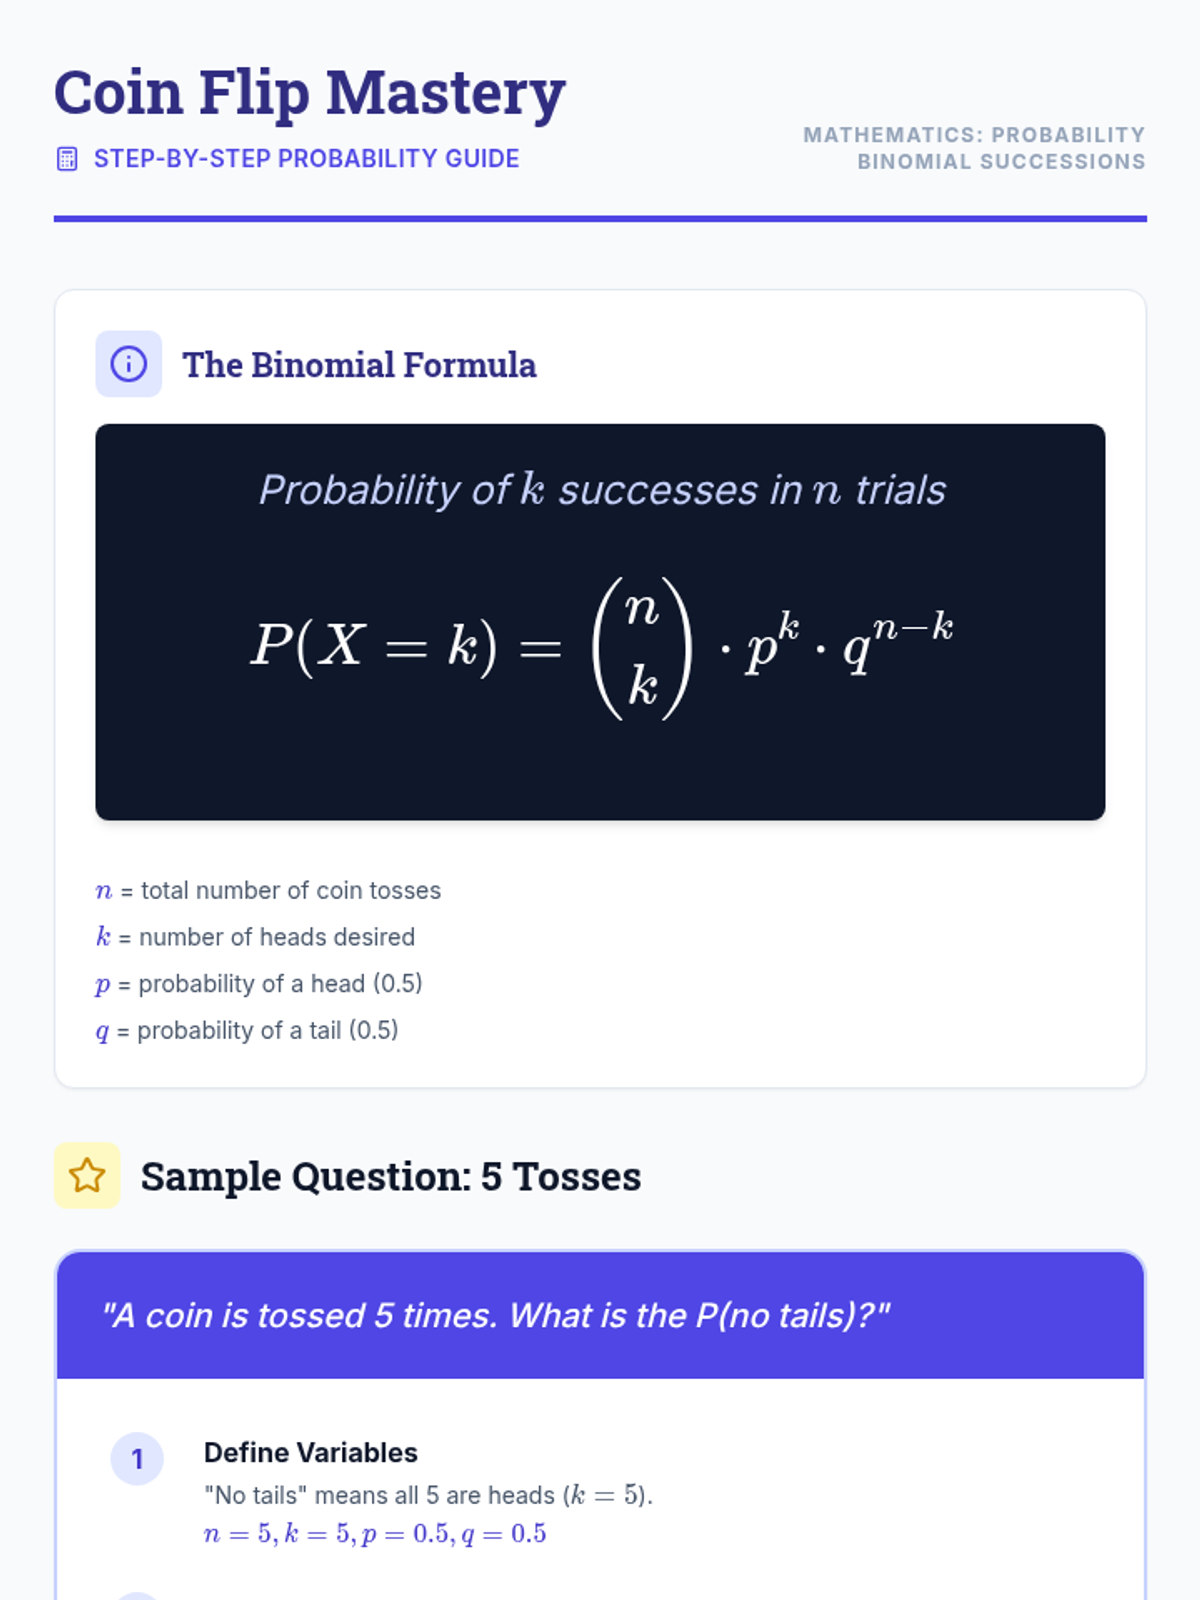
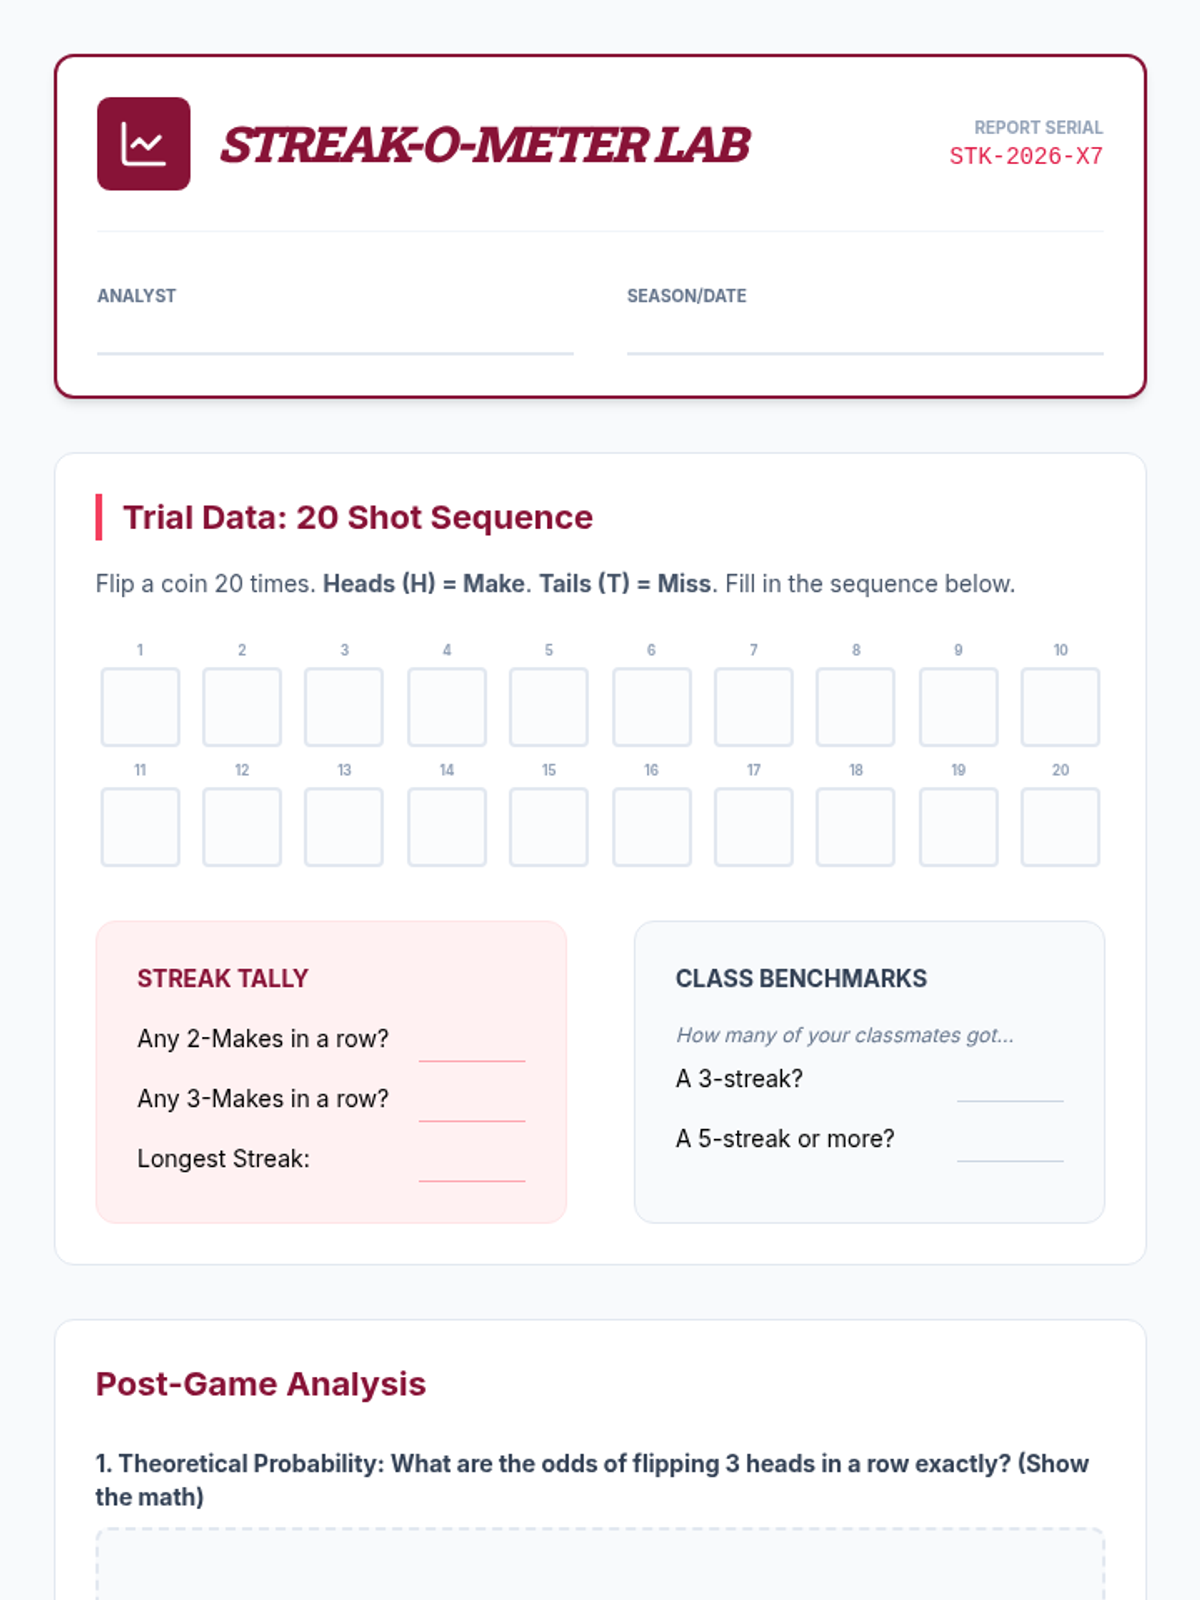
A focused lesson on calculating binomial probabilities for independent coin toss events, specifically focusing on 'all-or-nothing' outcomes.
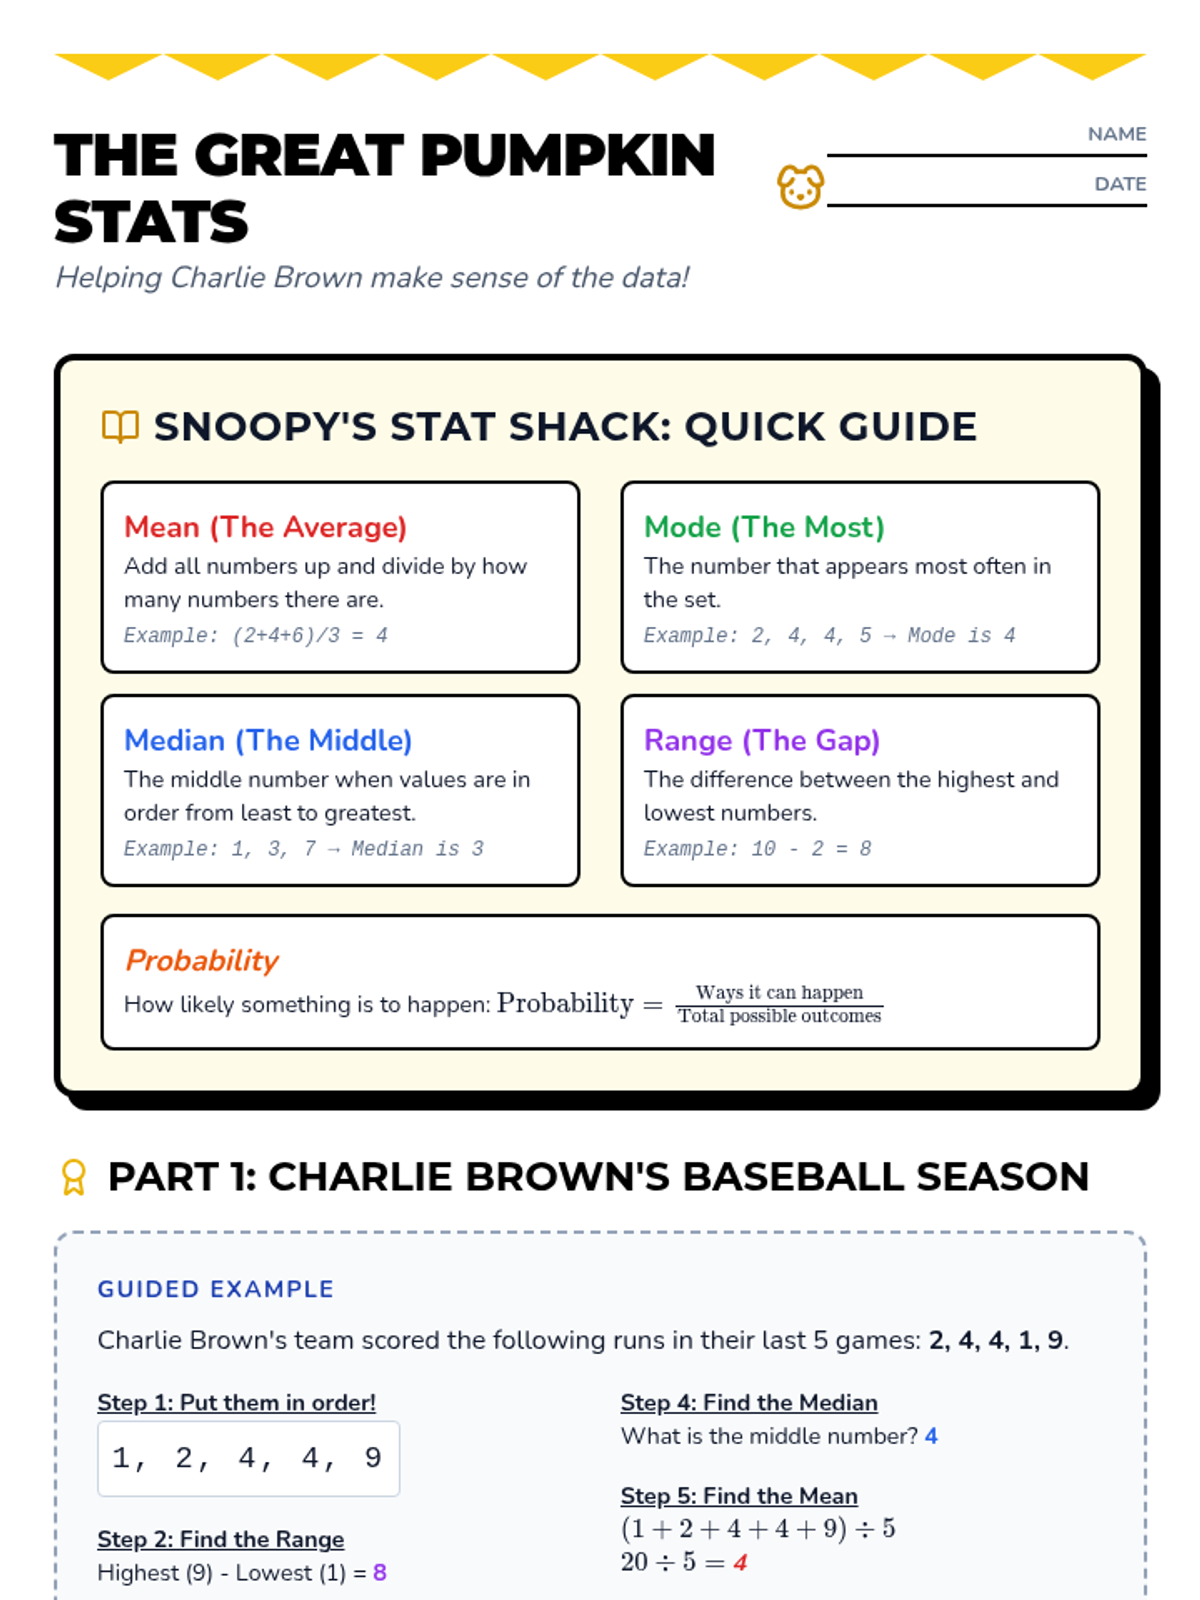
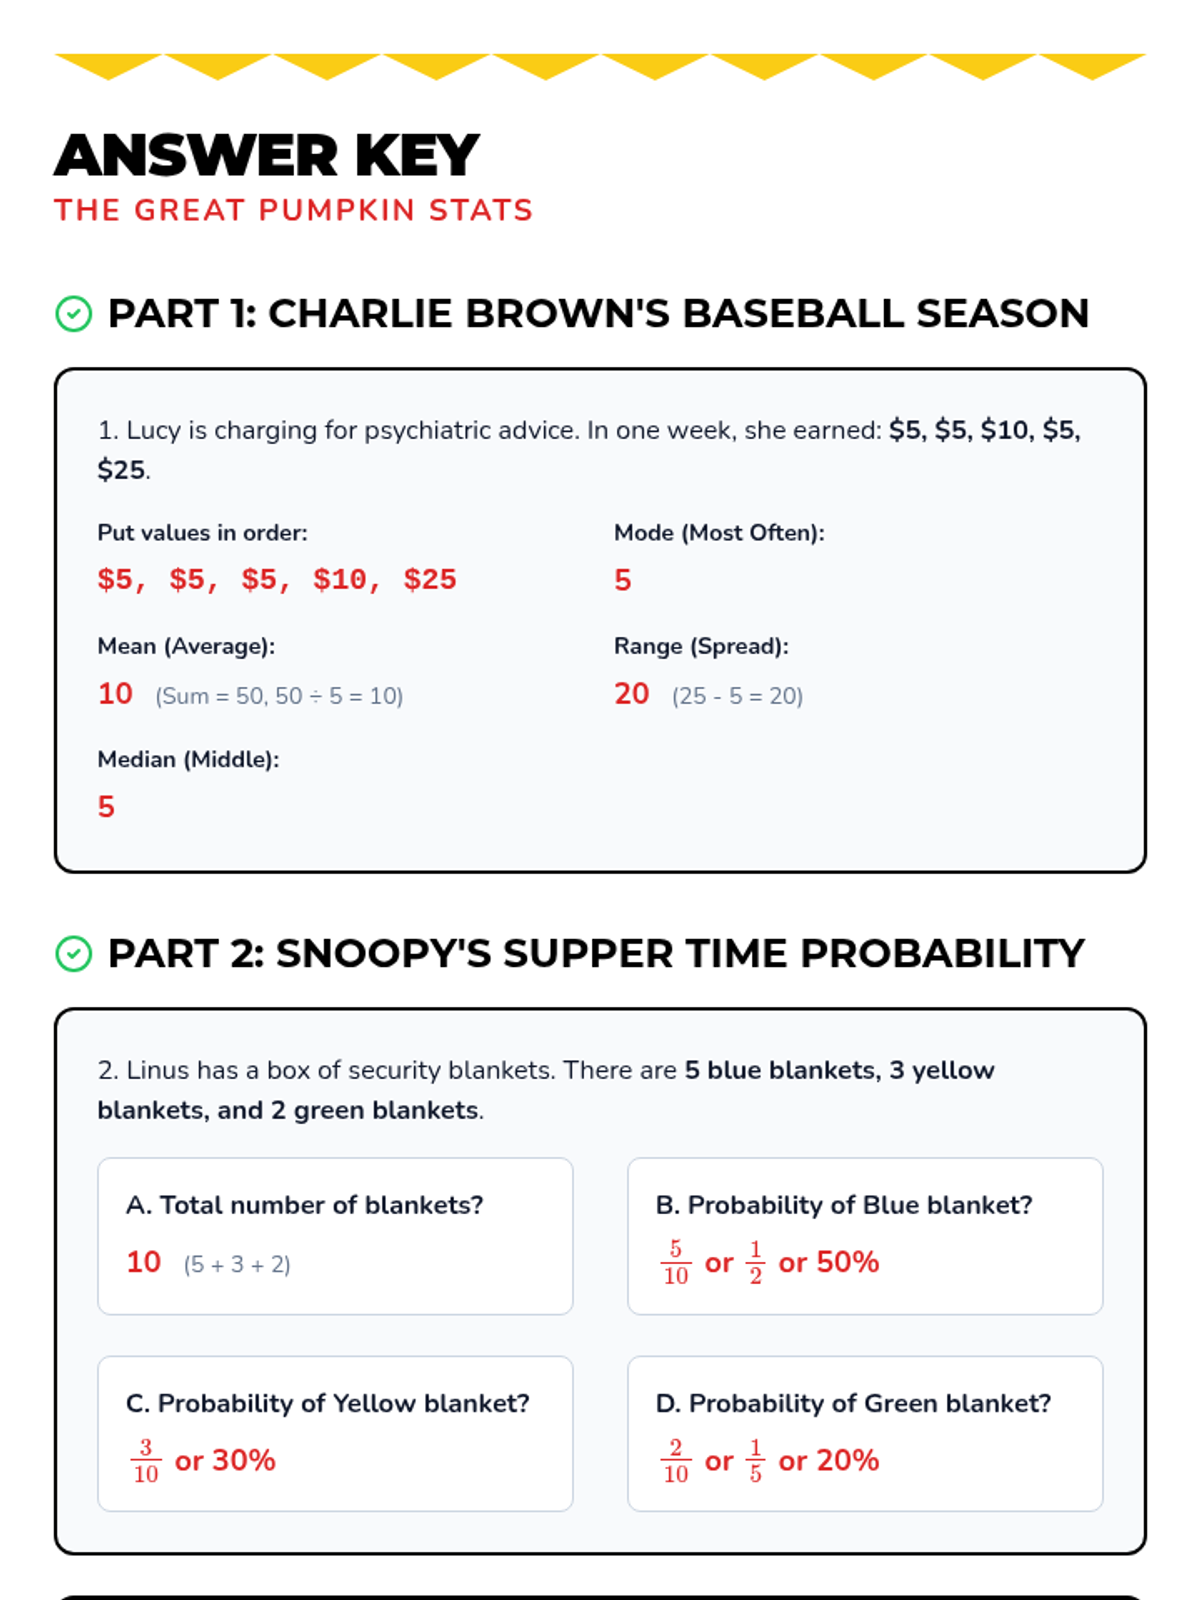
An introduction to basic statistics including measures of central tendency (mean, median, mode, range) and simple probability, themed around the Peanuts comic strip.
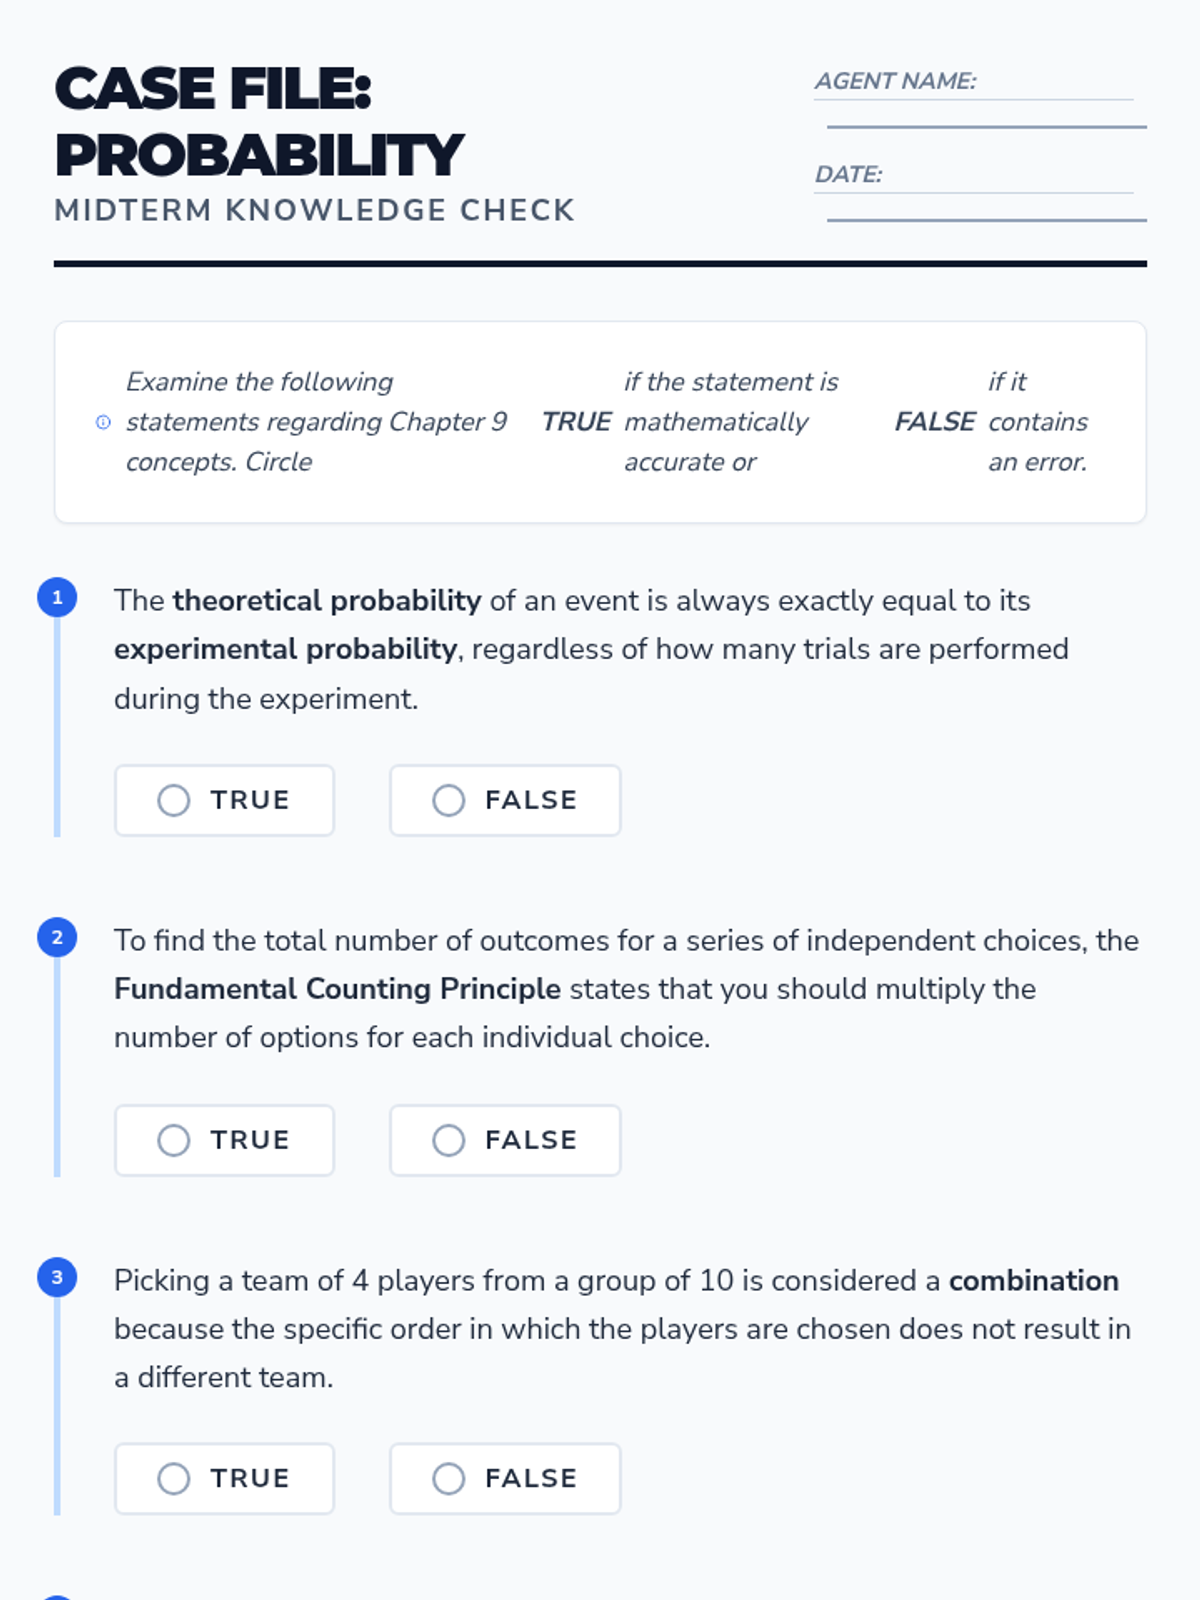
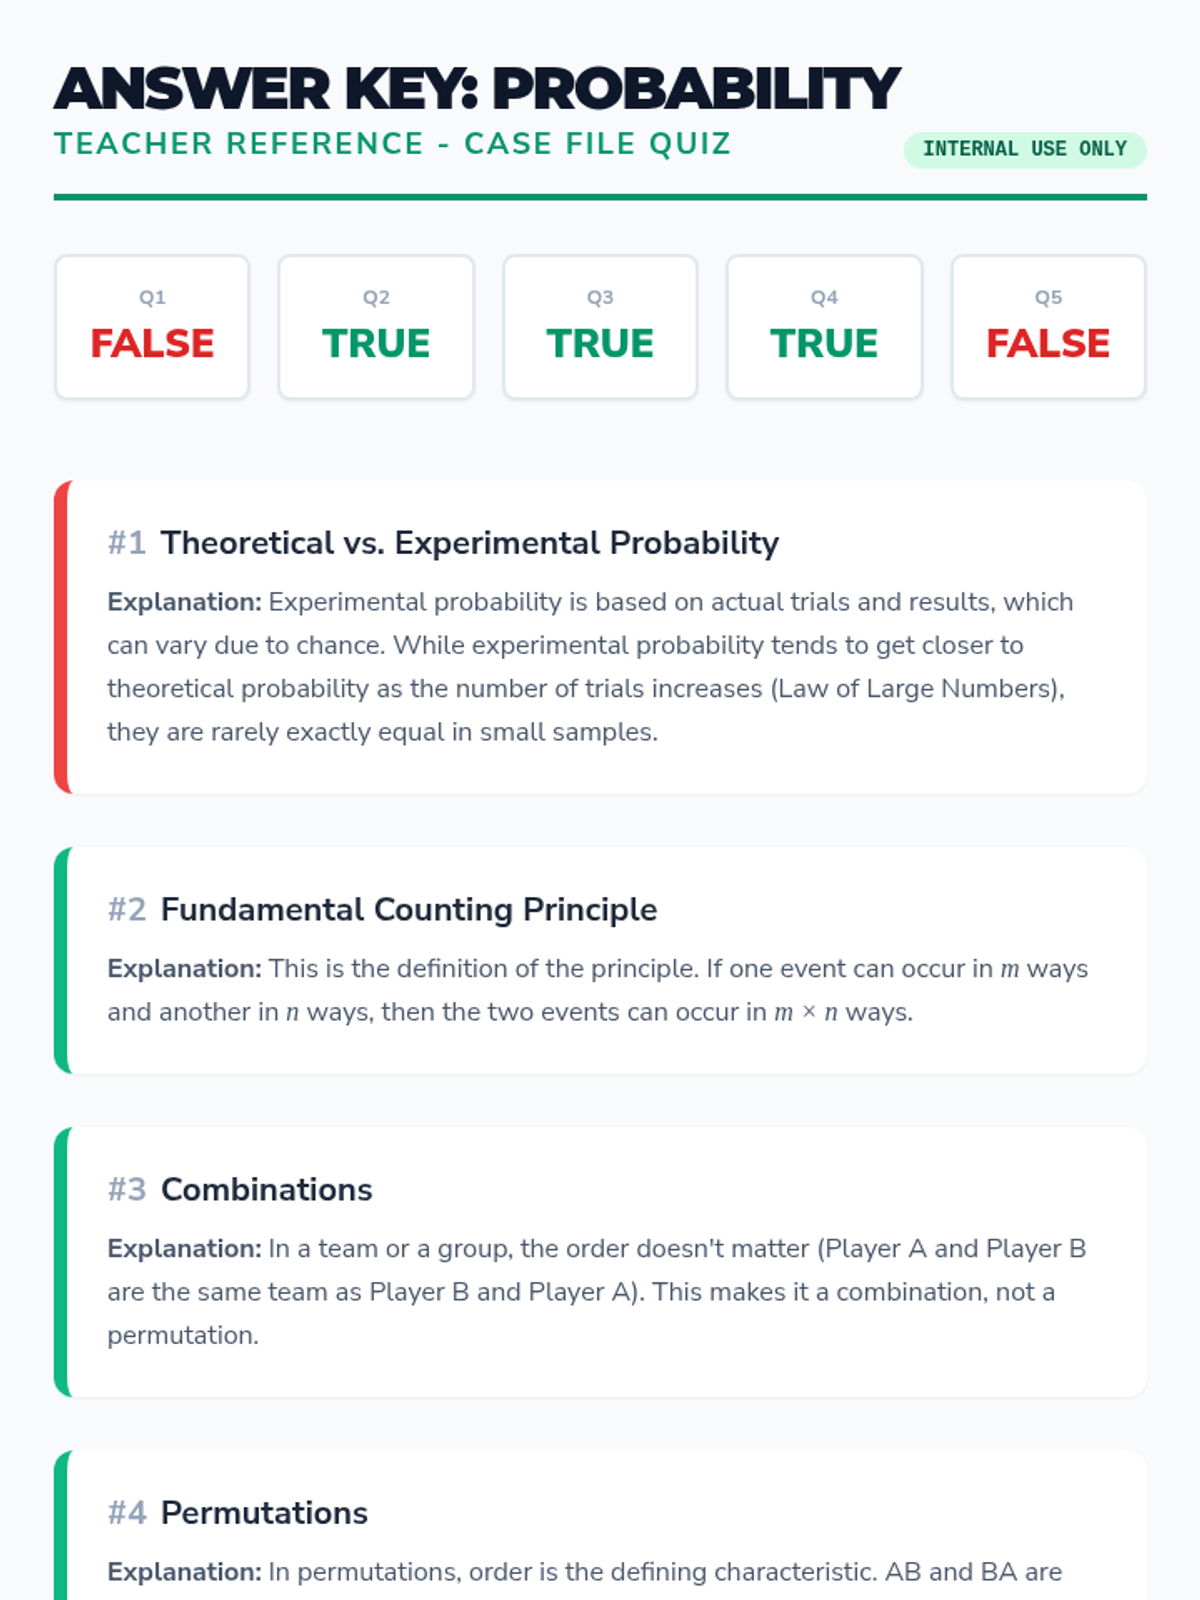
A focused review lesson covering the core concepts of probability, counting principles, and event types from Pre-Algebra Chapter 9.
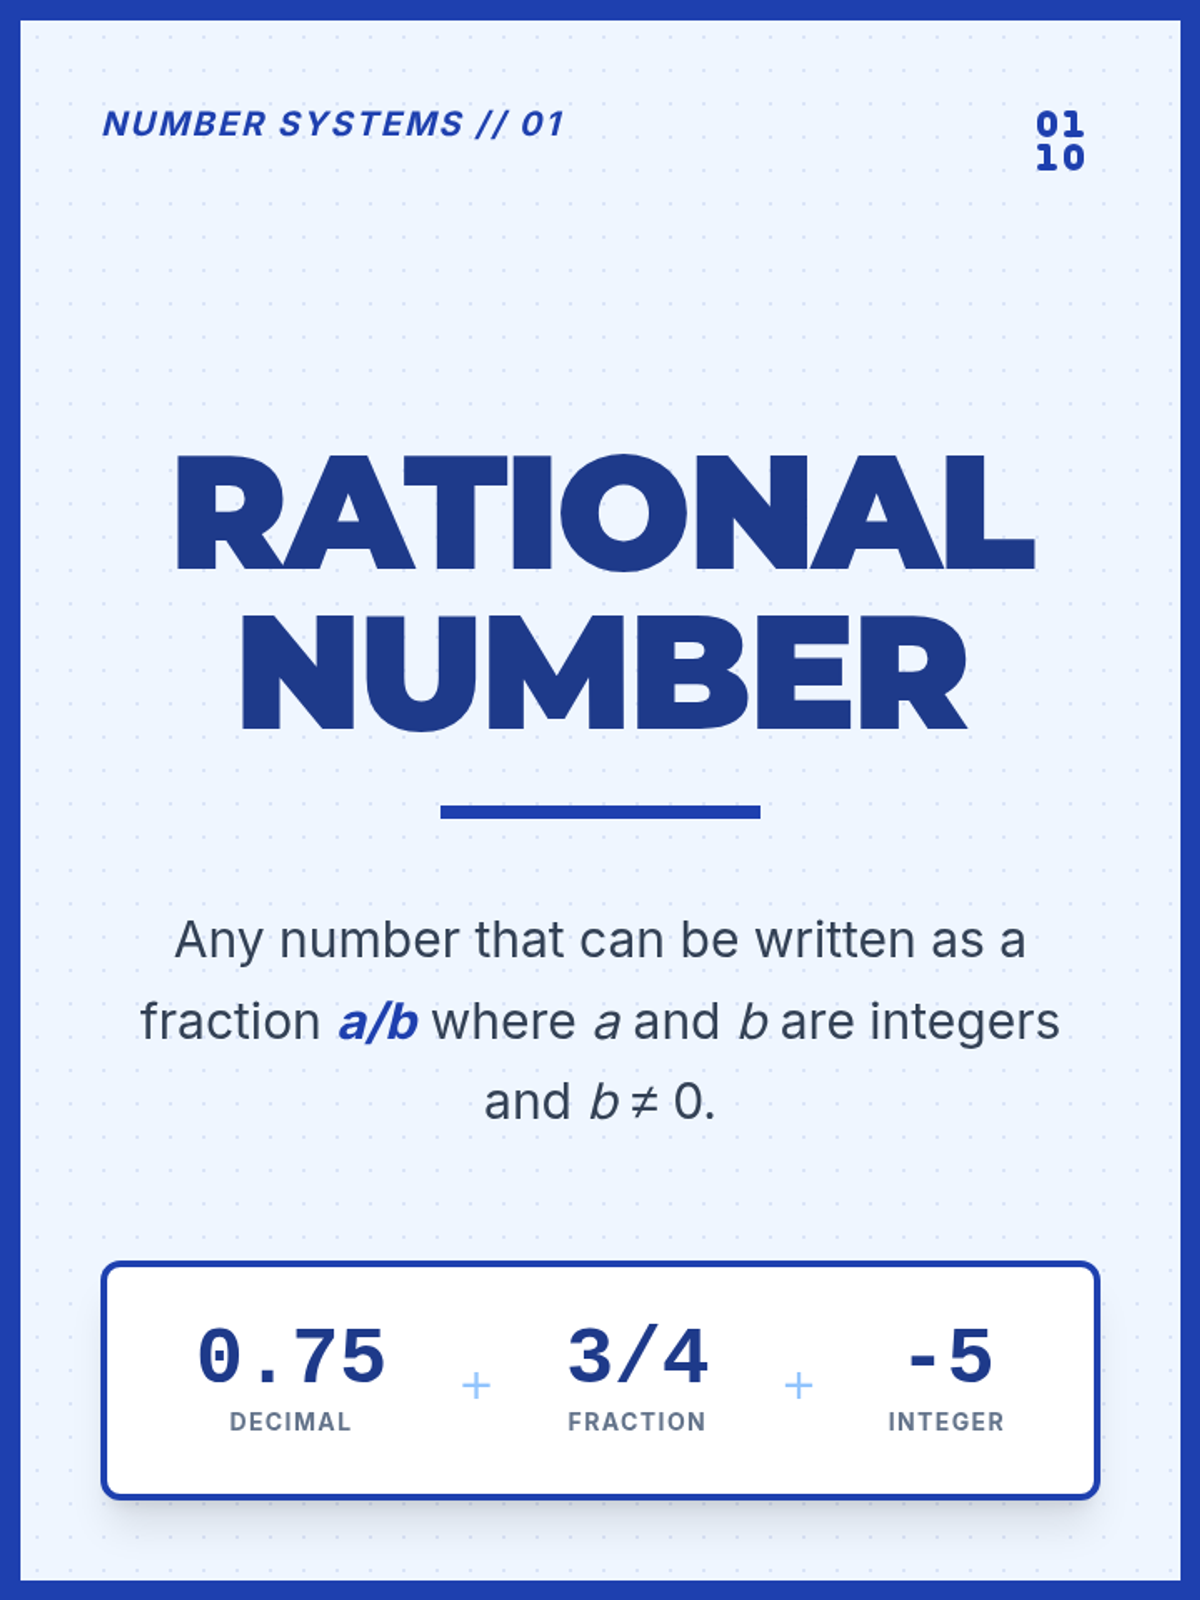
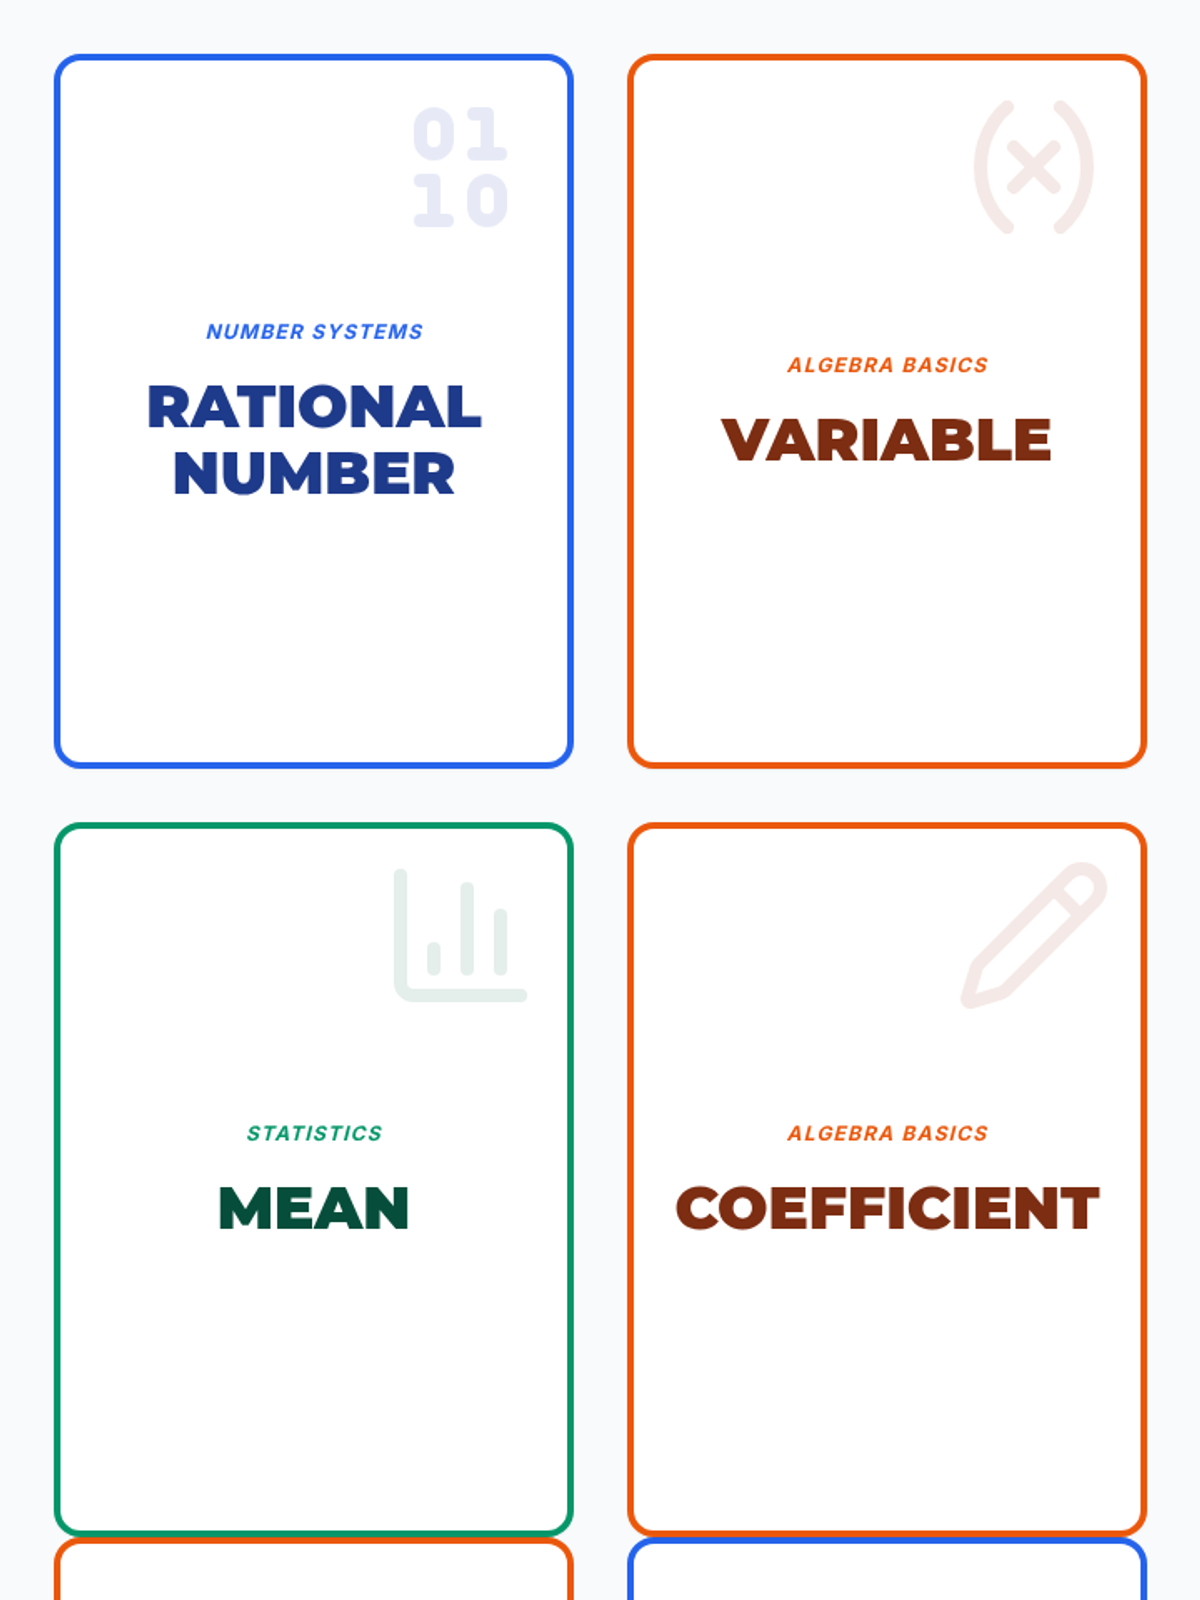
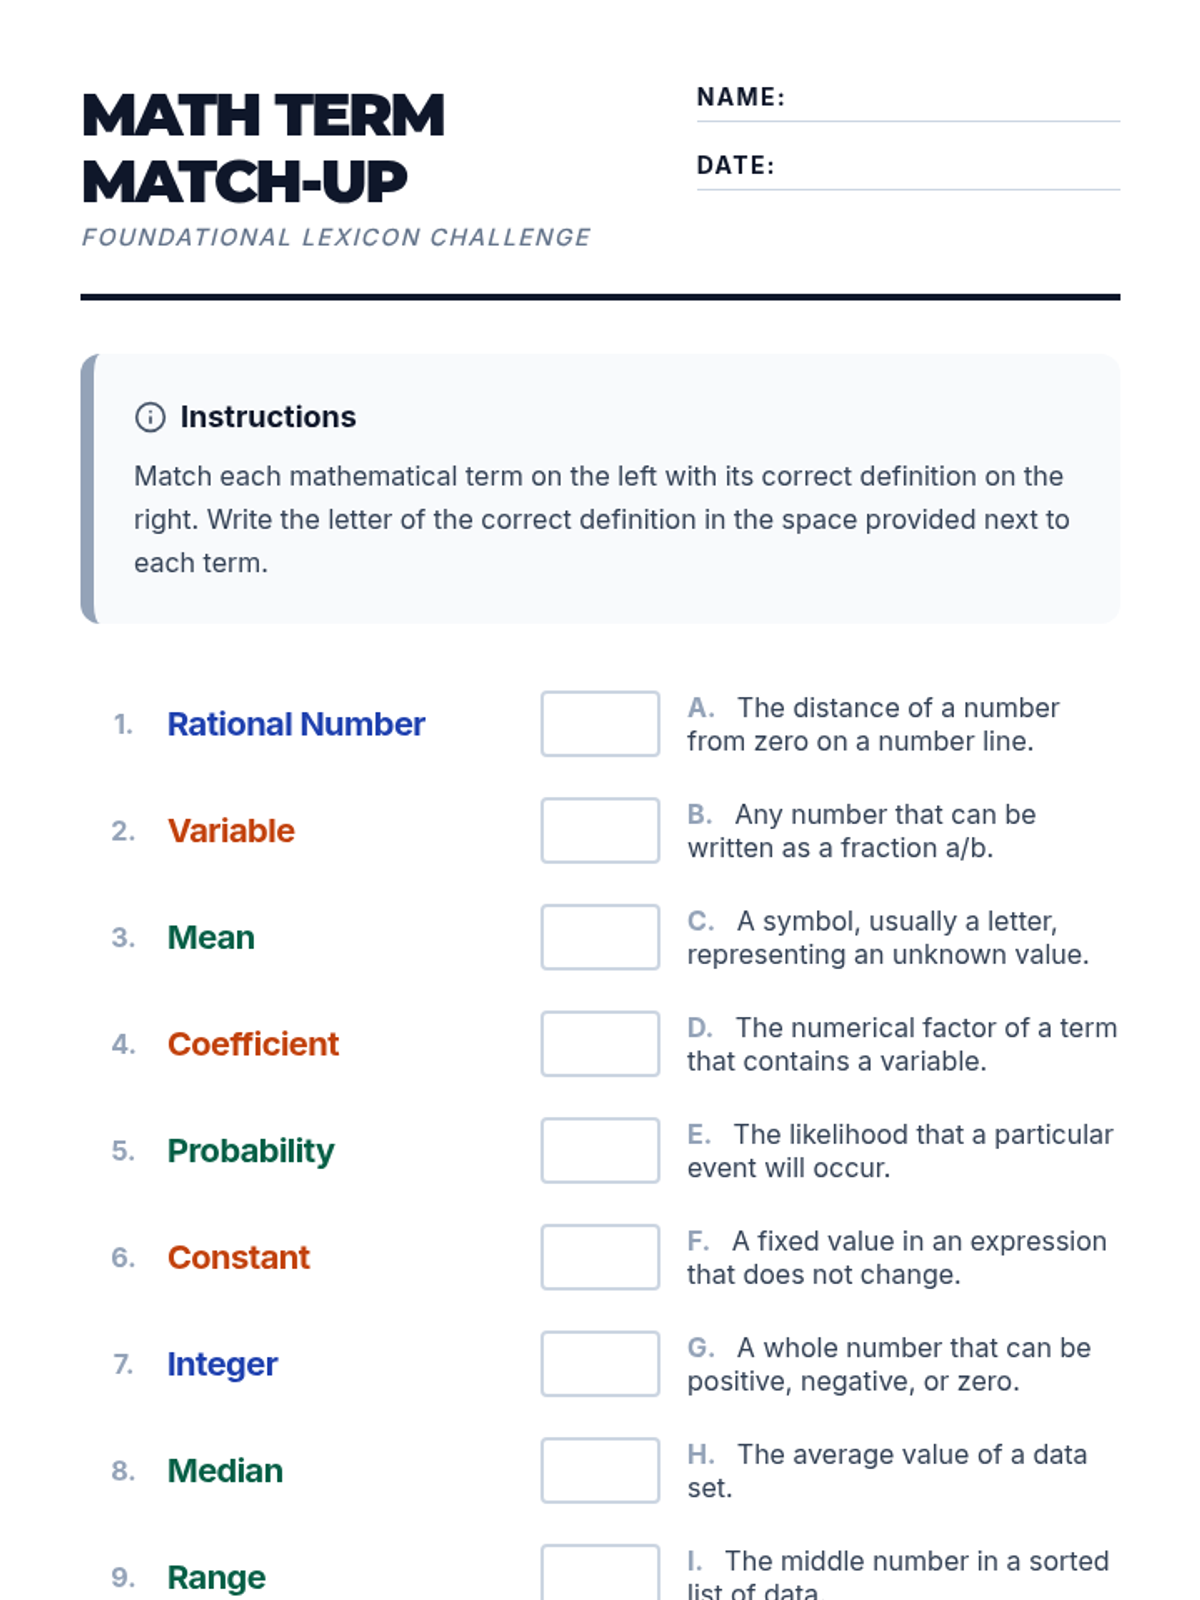
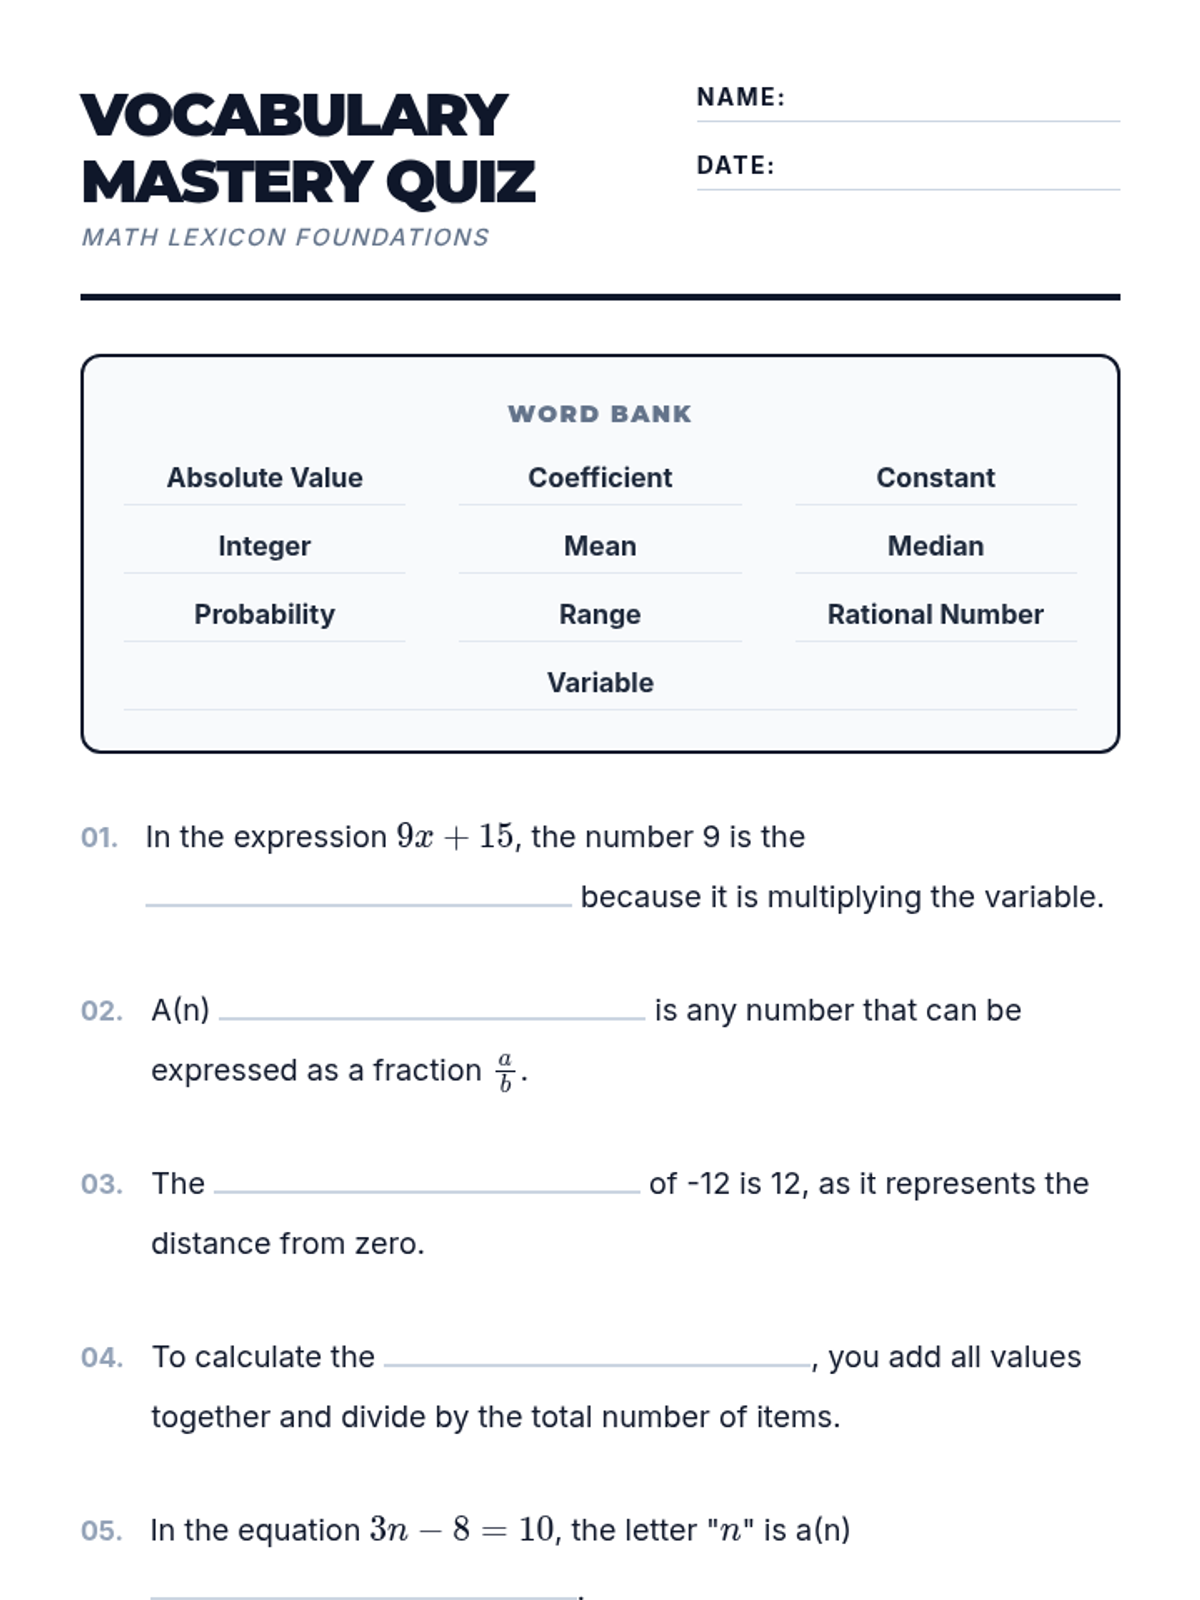
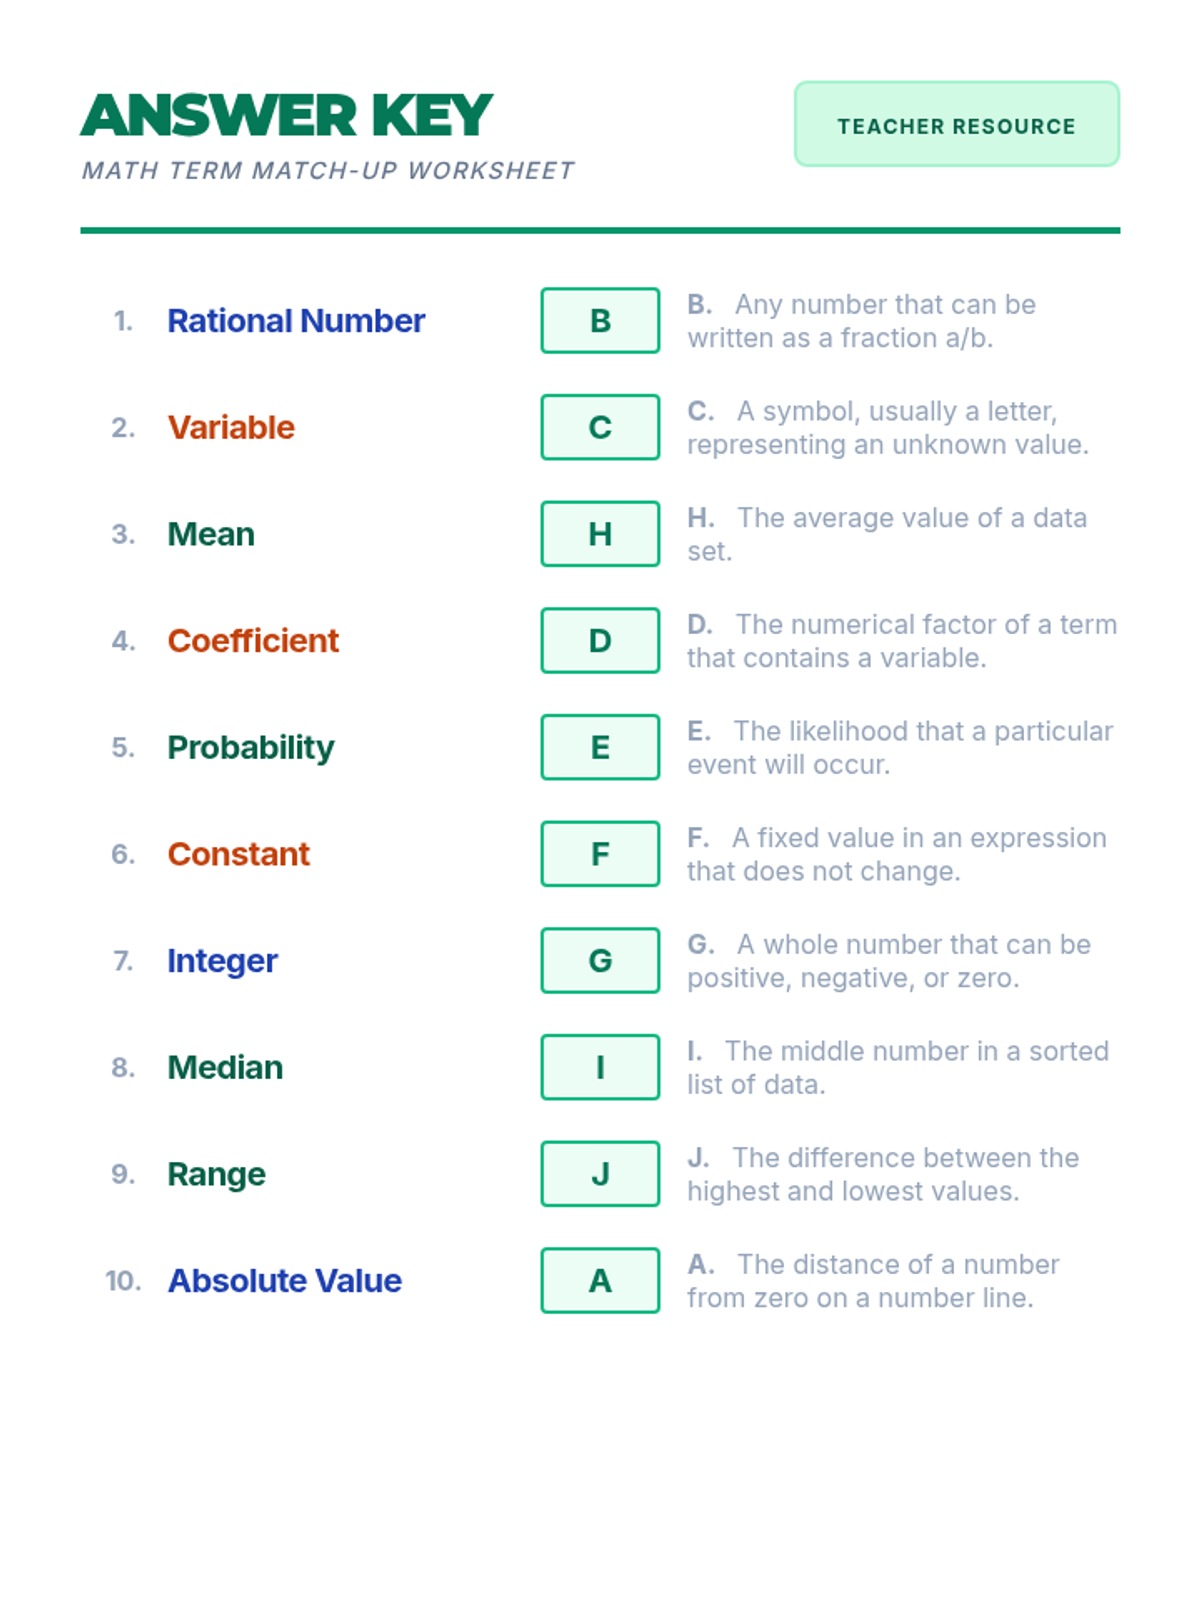
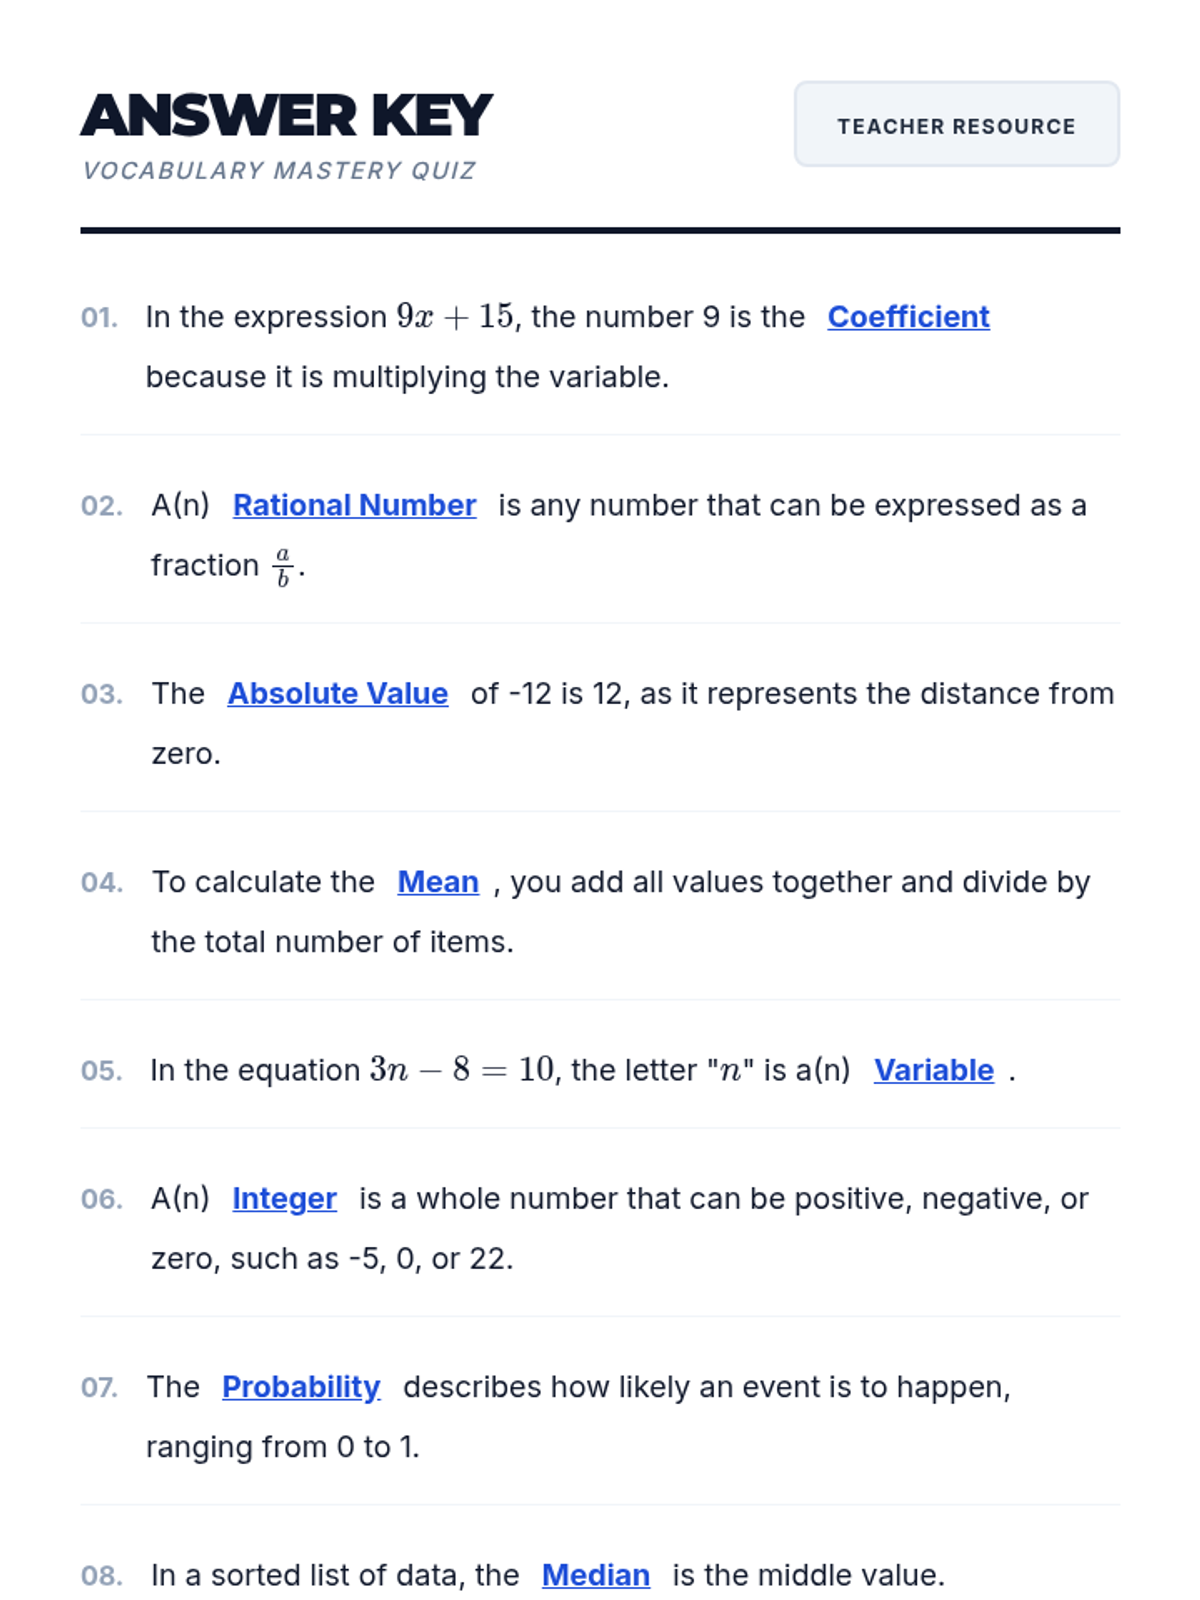
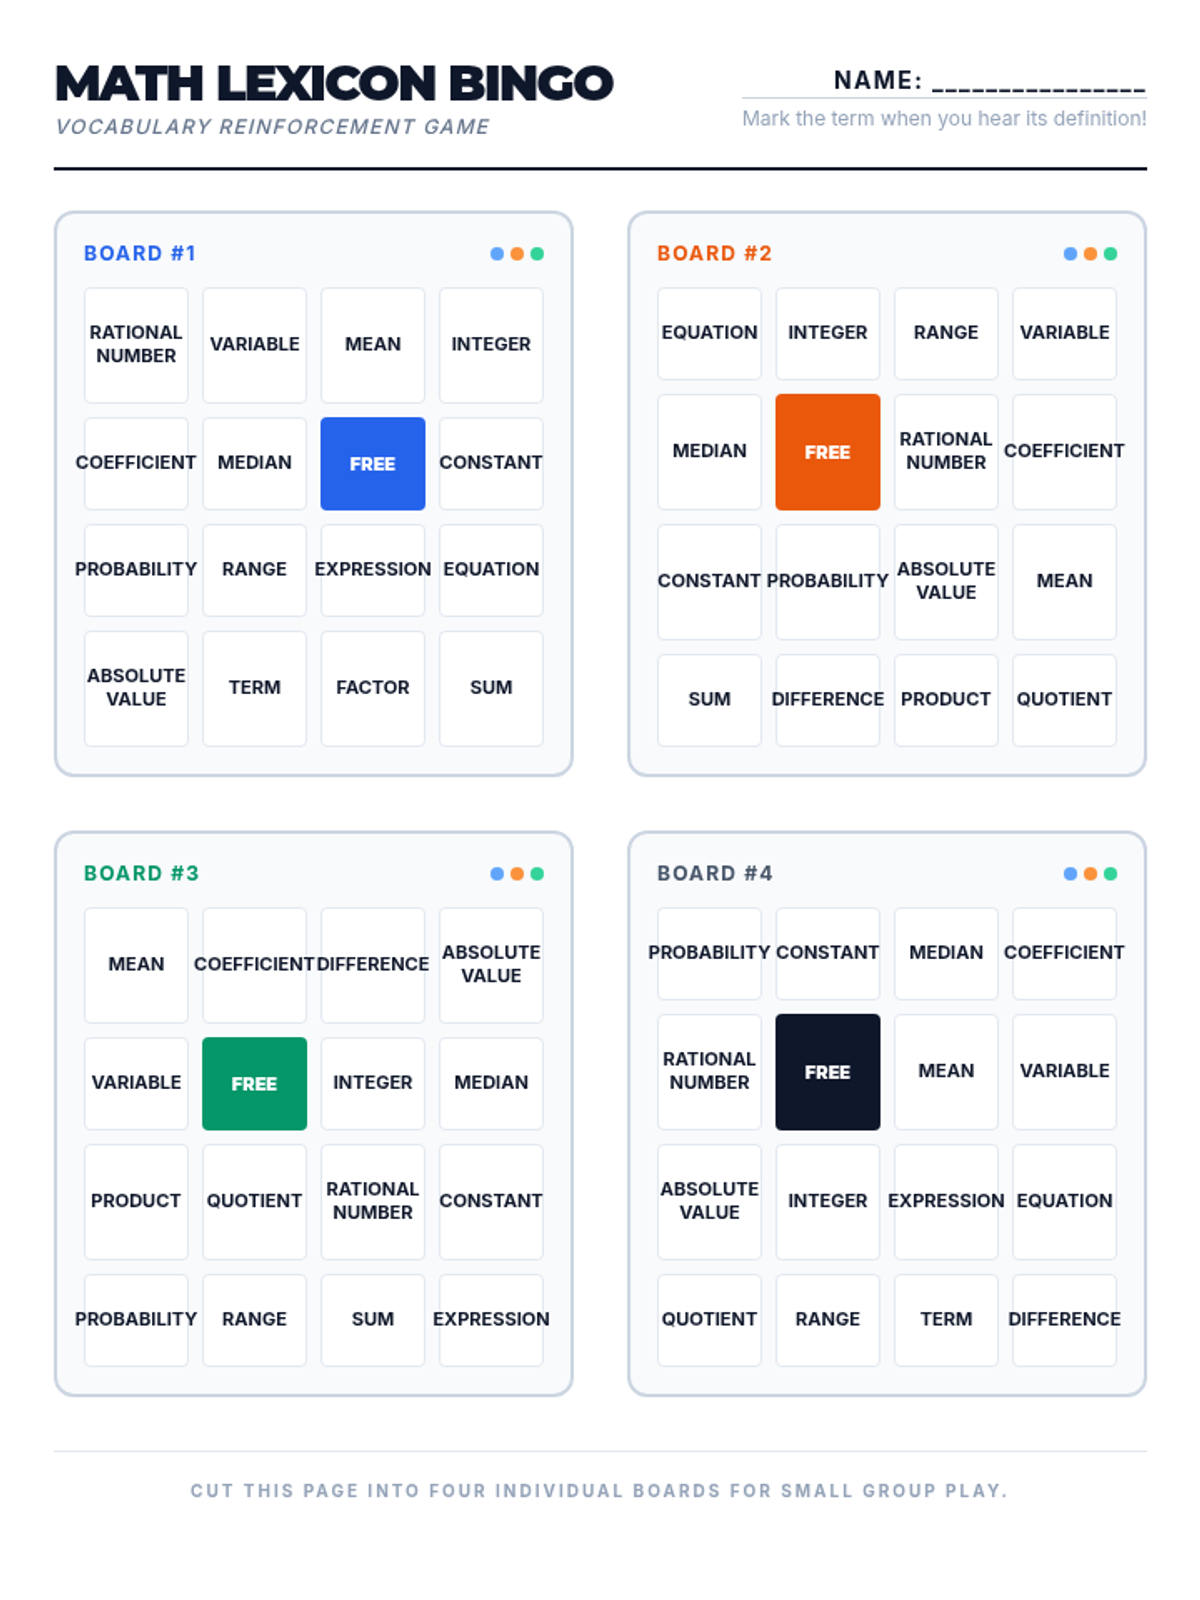
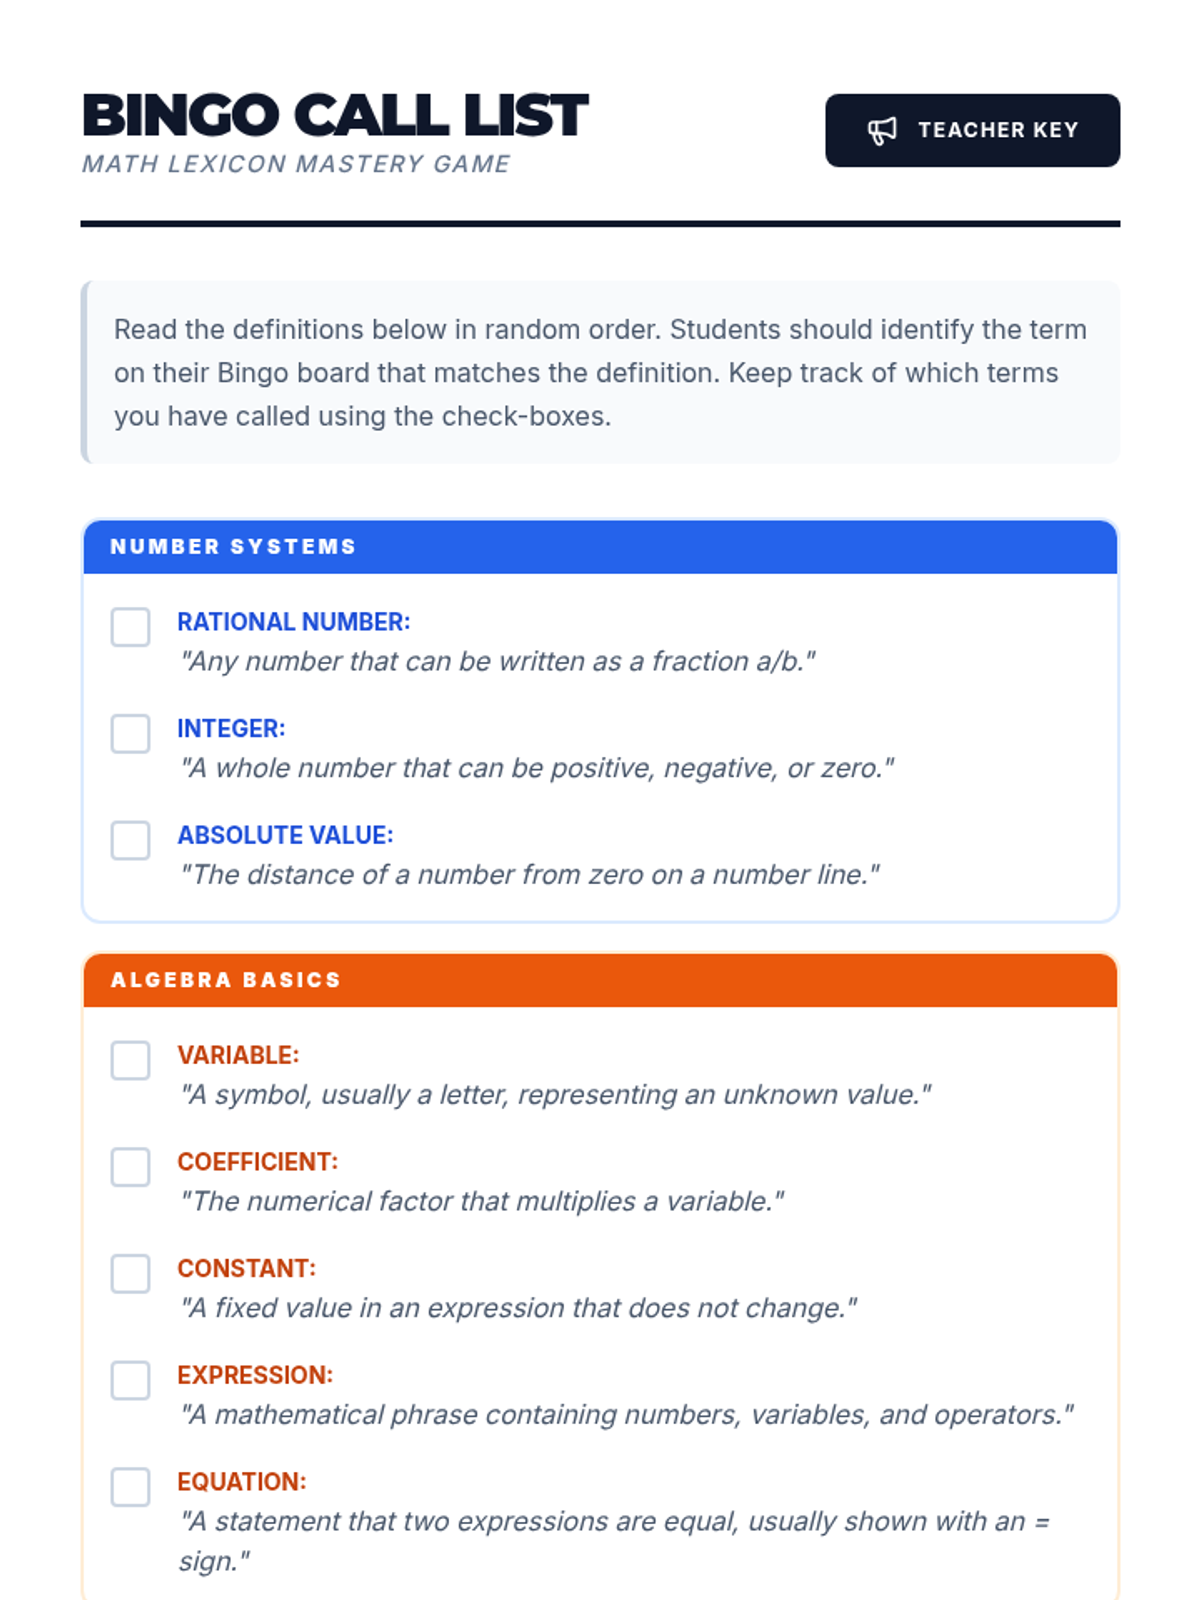
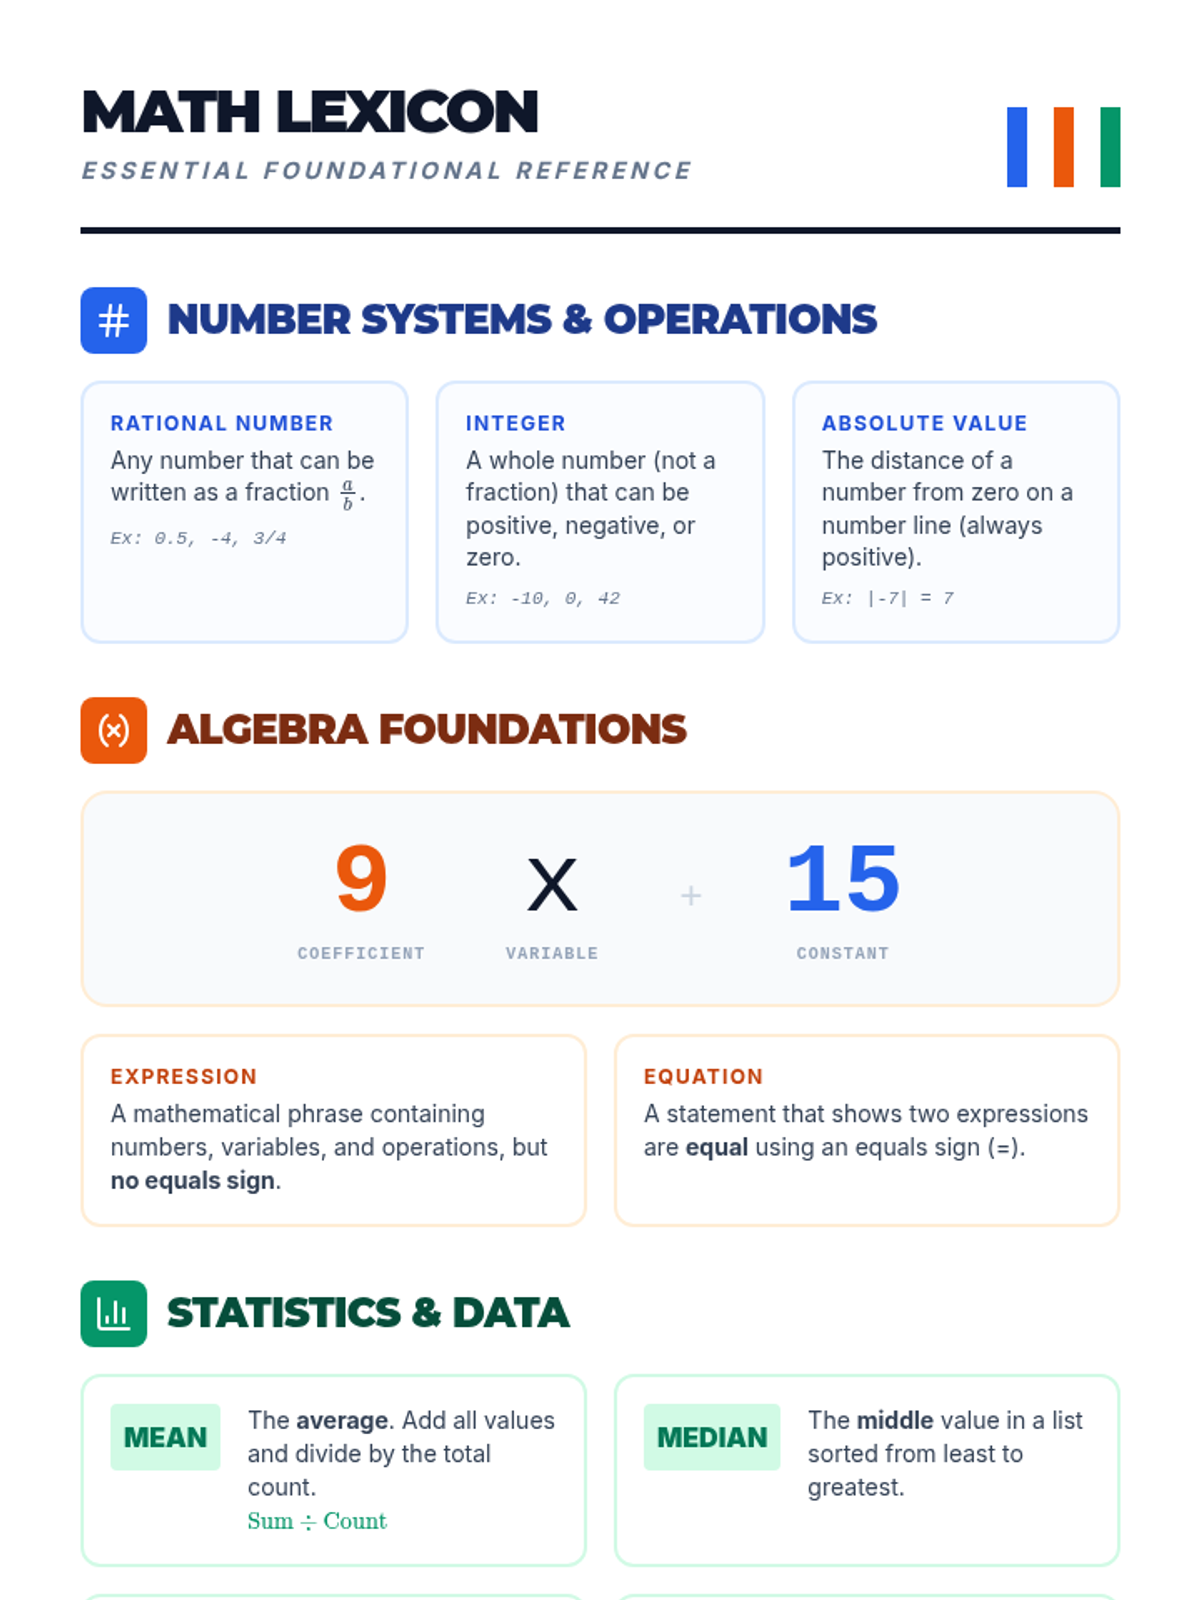
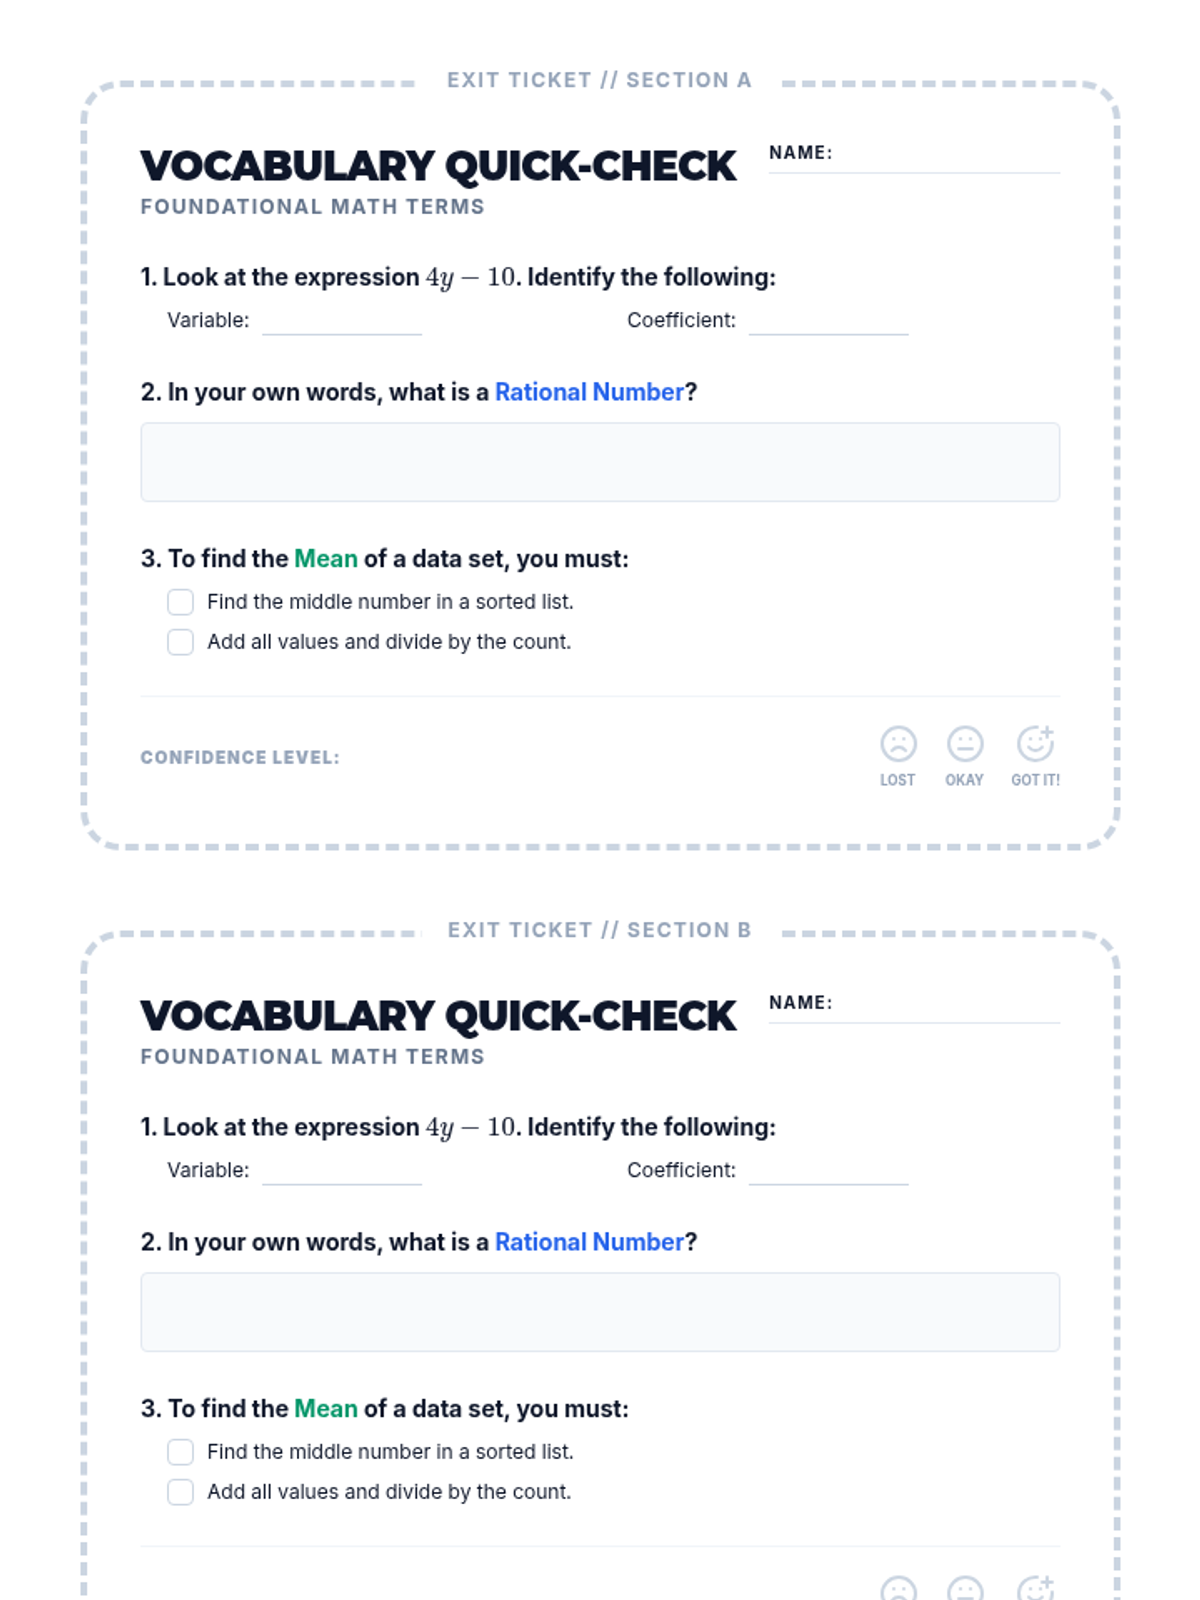
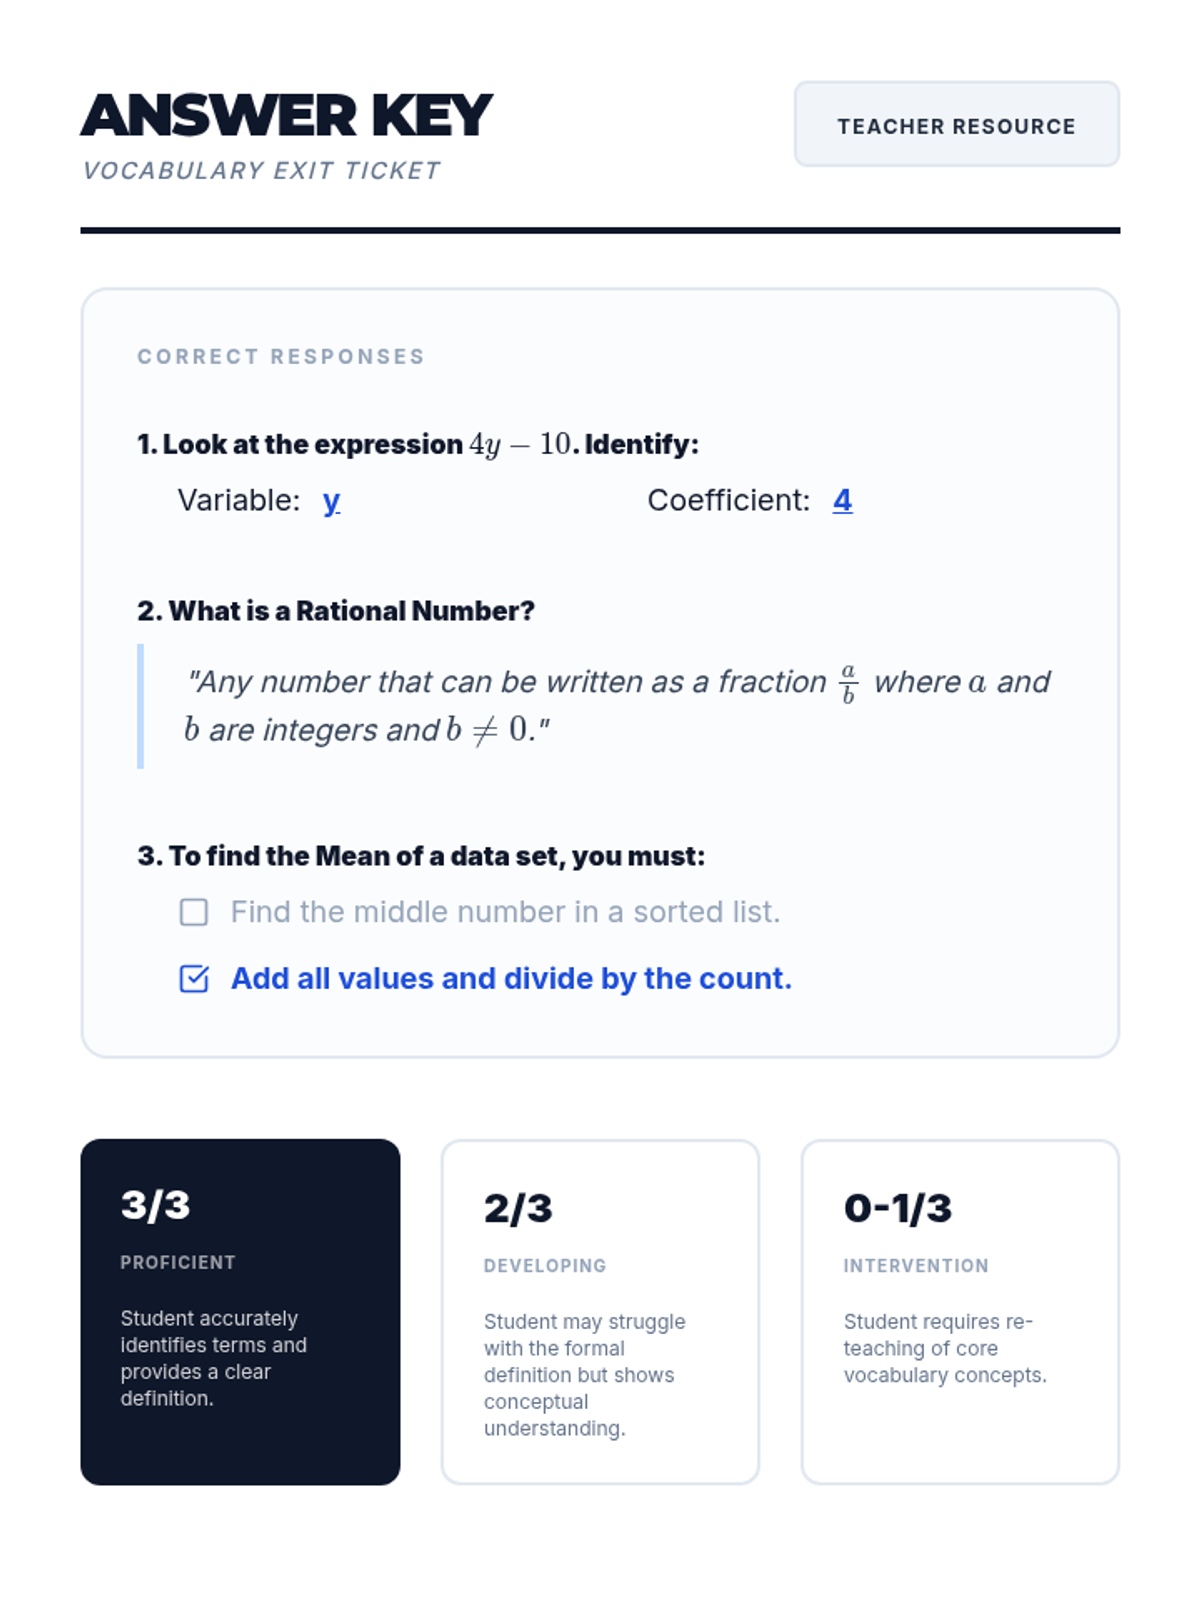
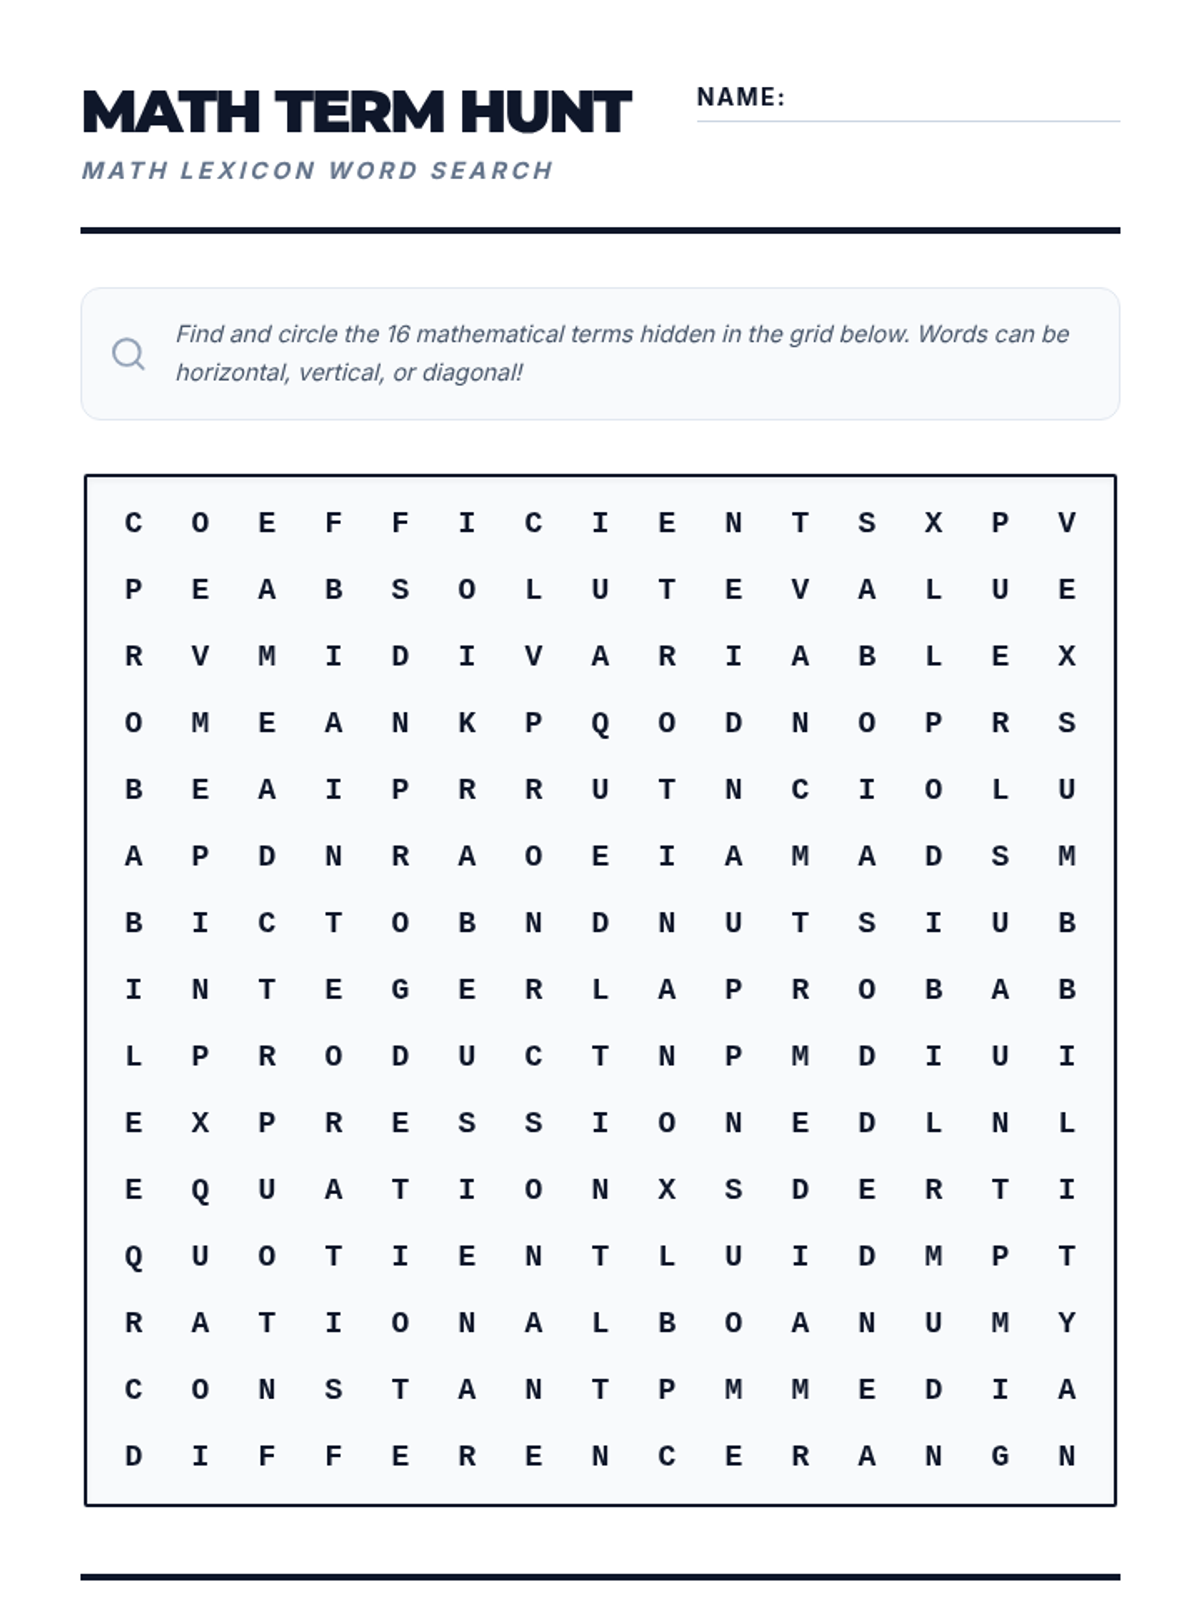
A foundational lesson introducing essential terminology for number systems, basic algebra, and statistics. Includes visual aids and interactive practice materials.
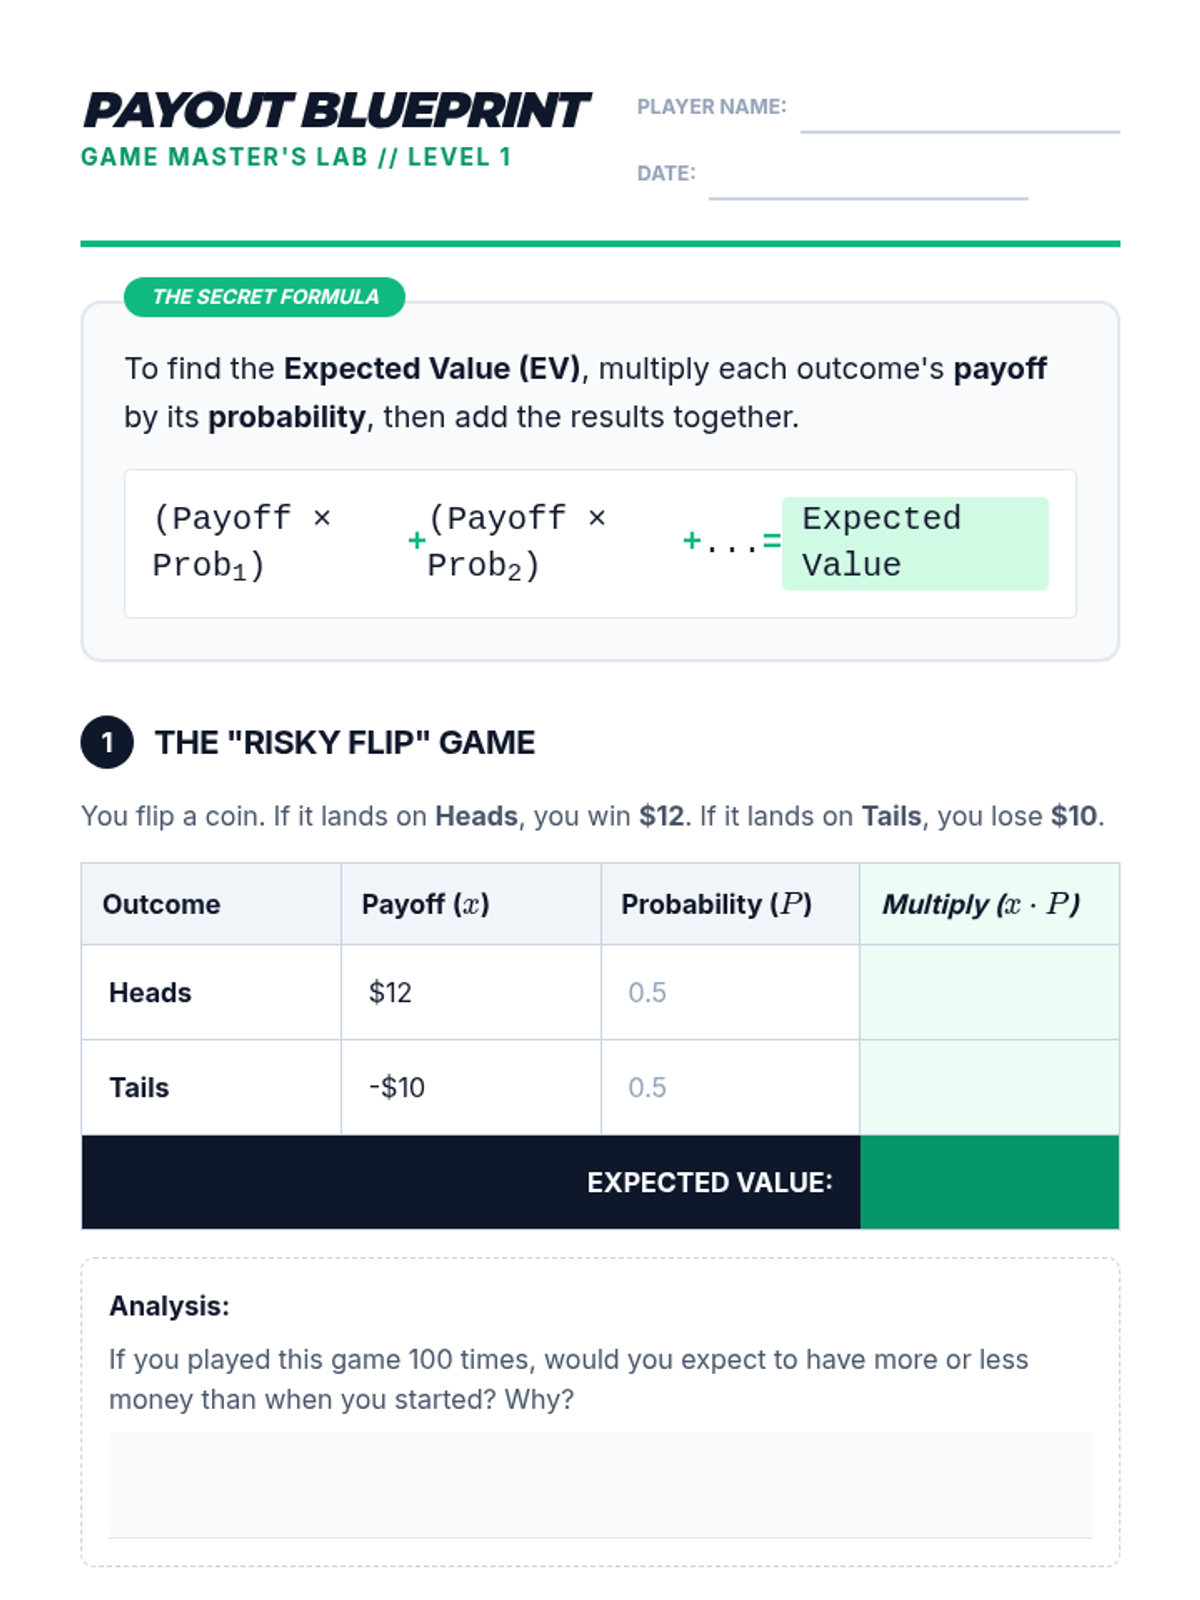
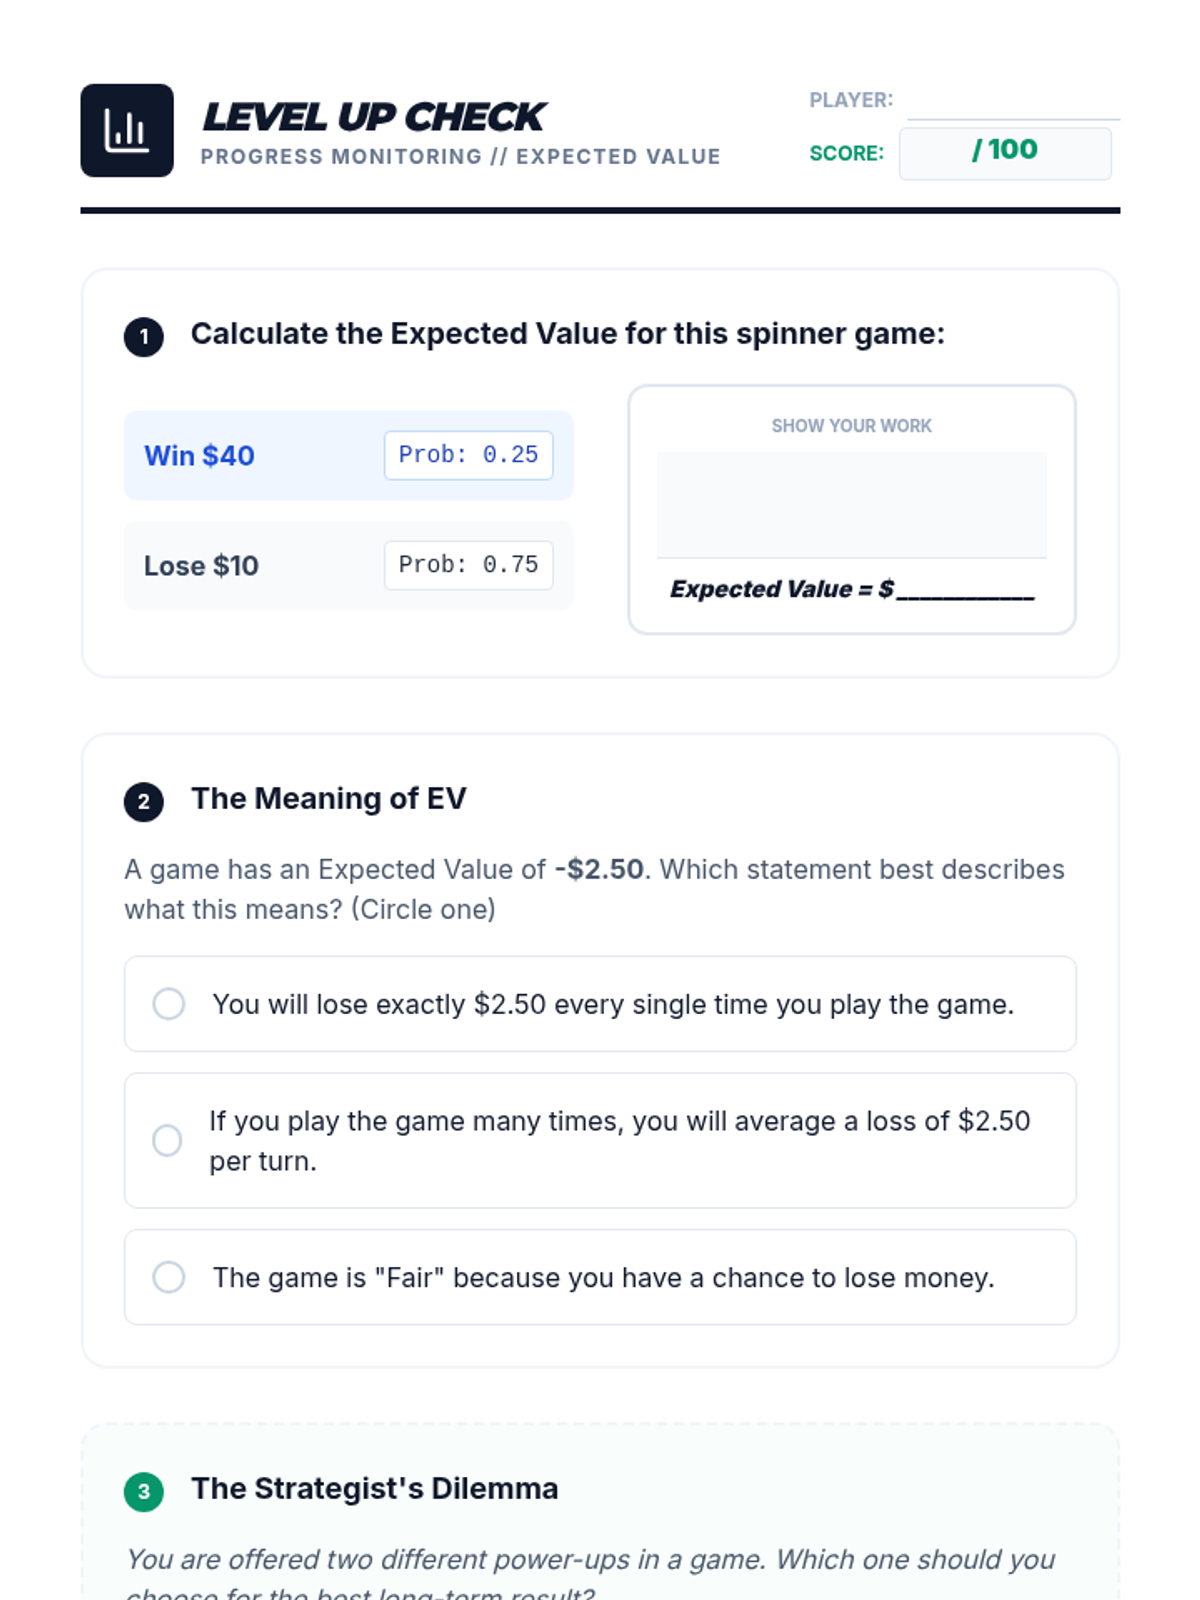
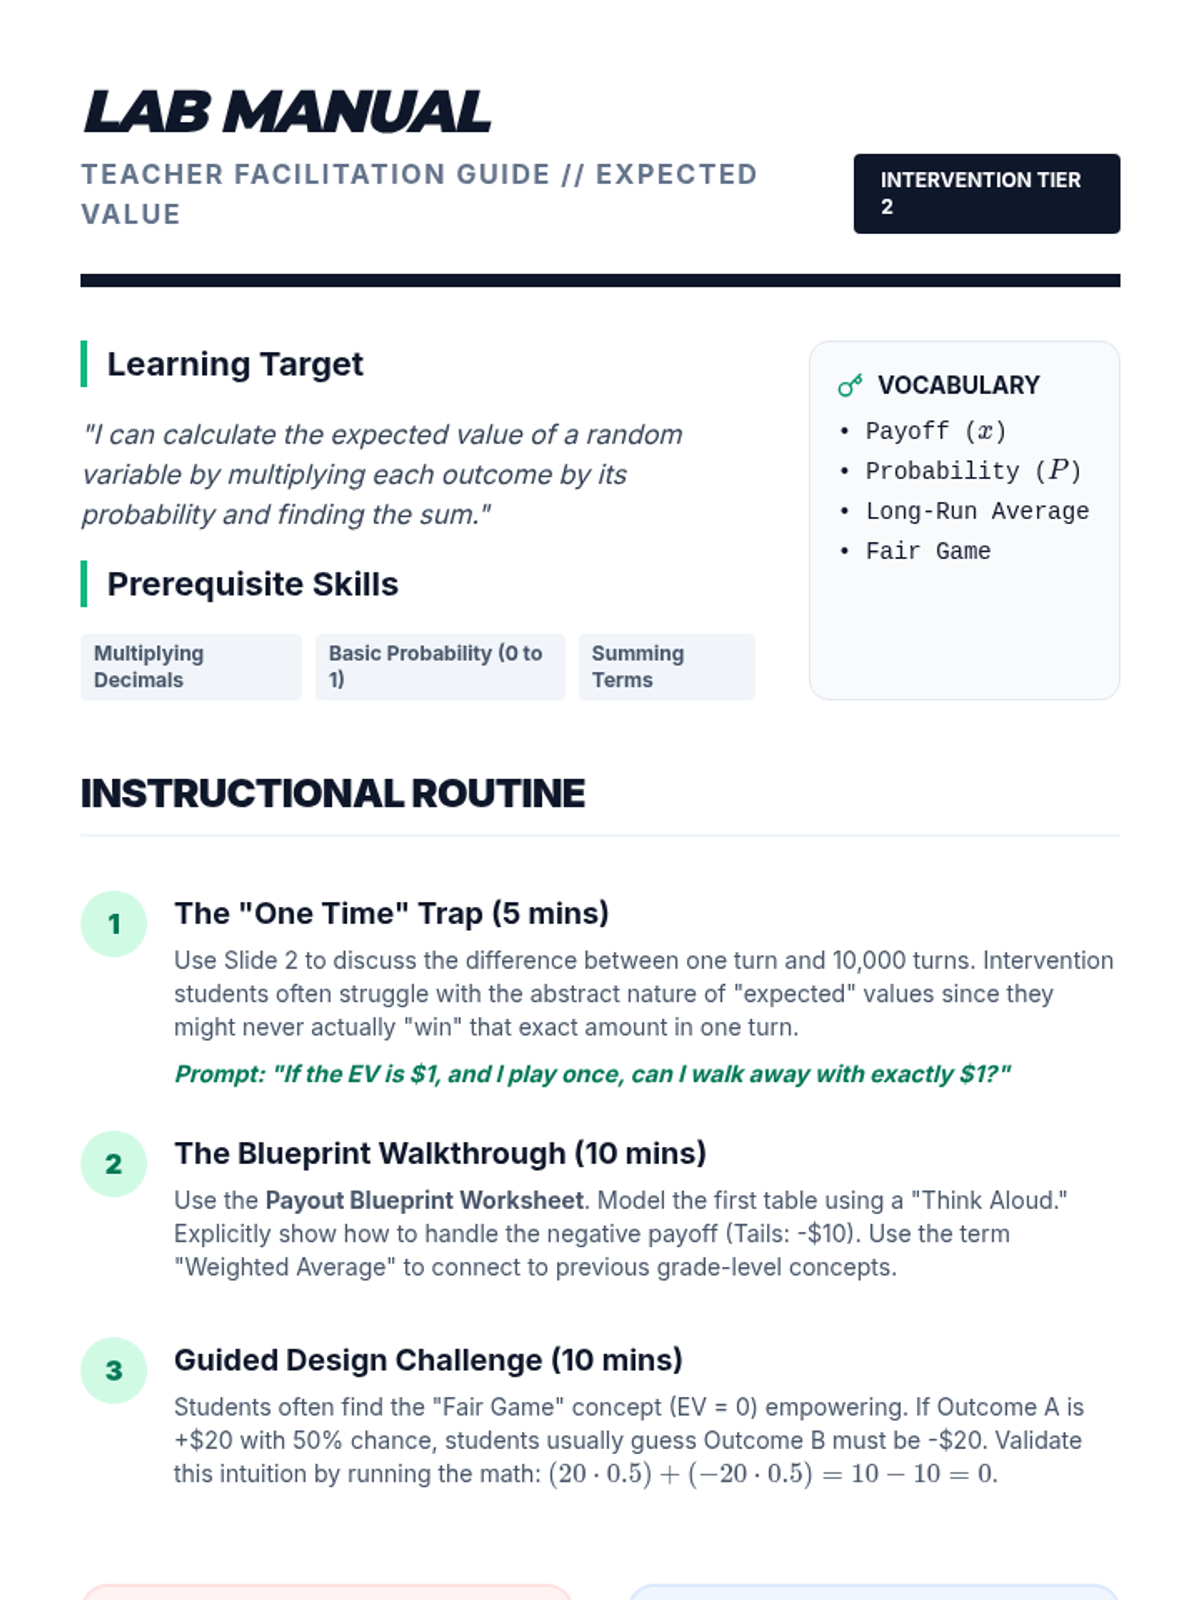
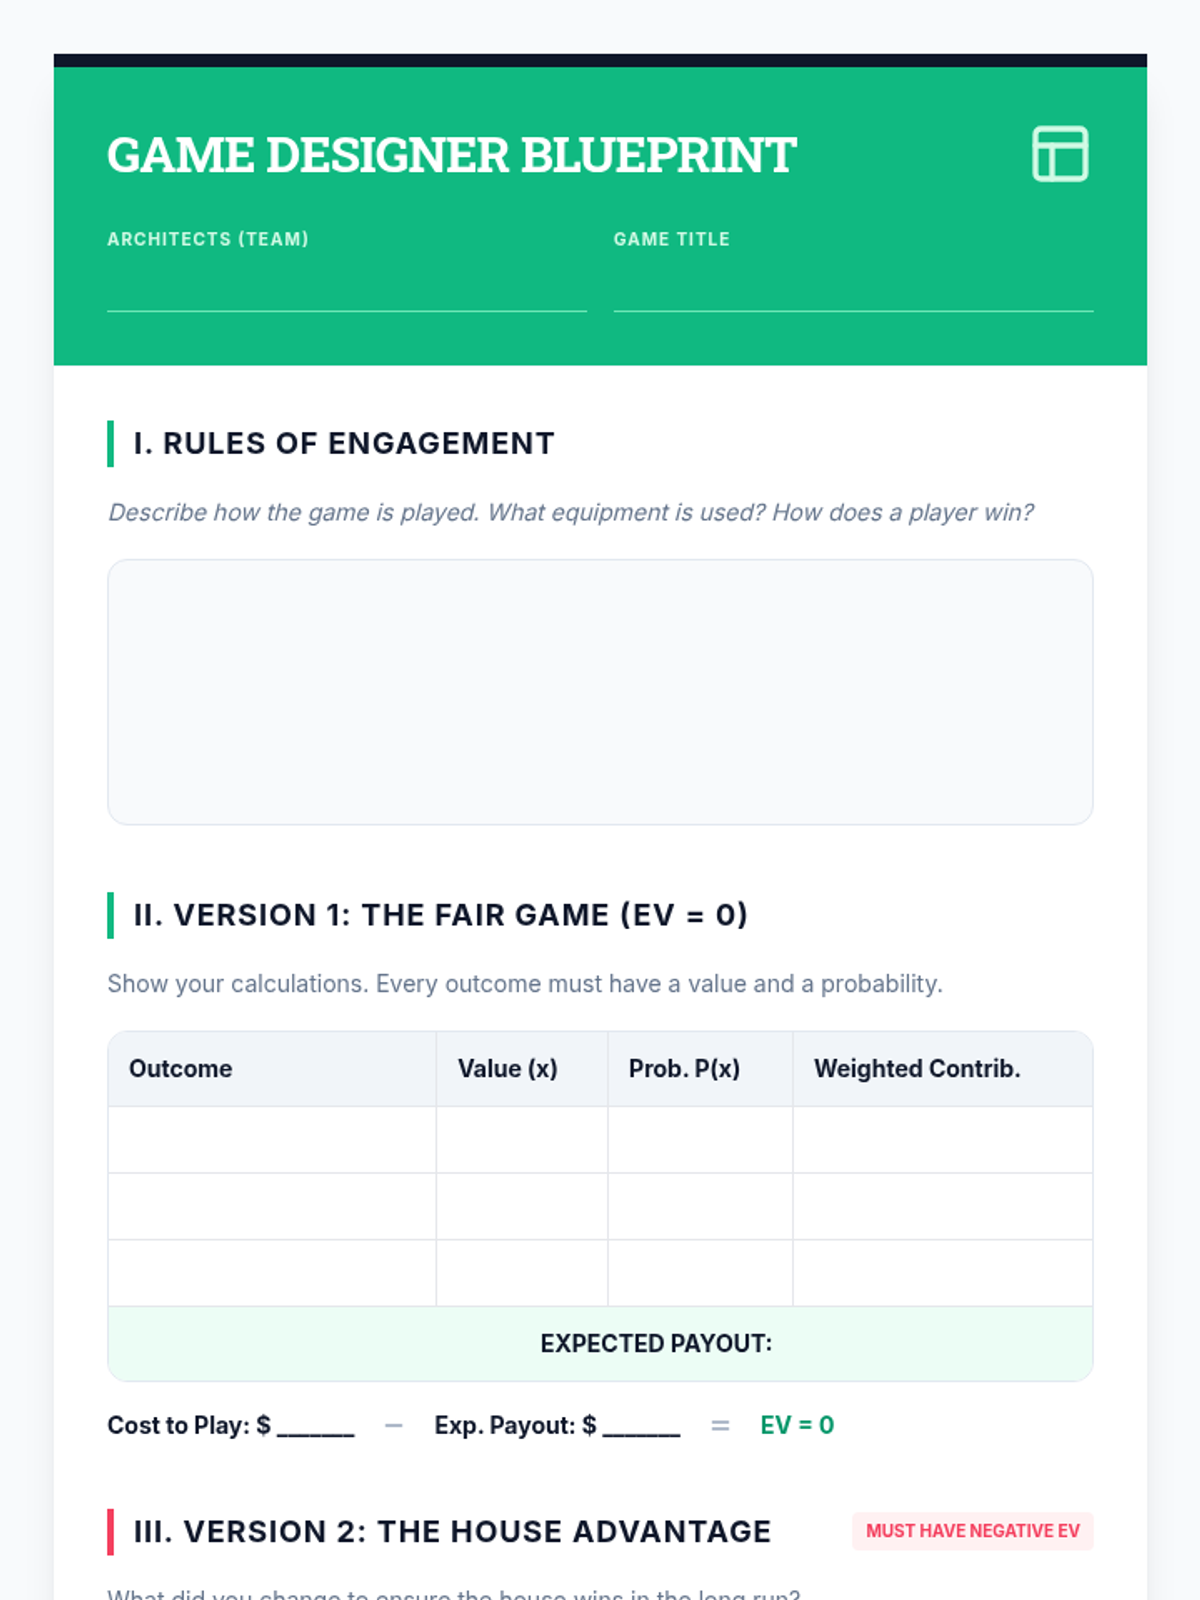
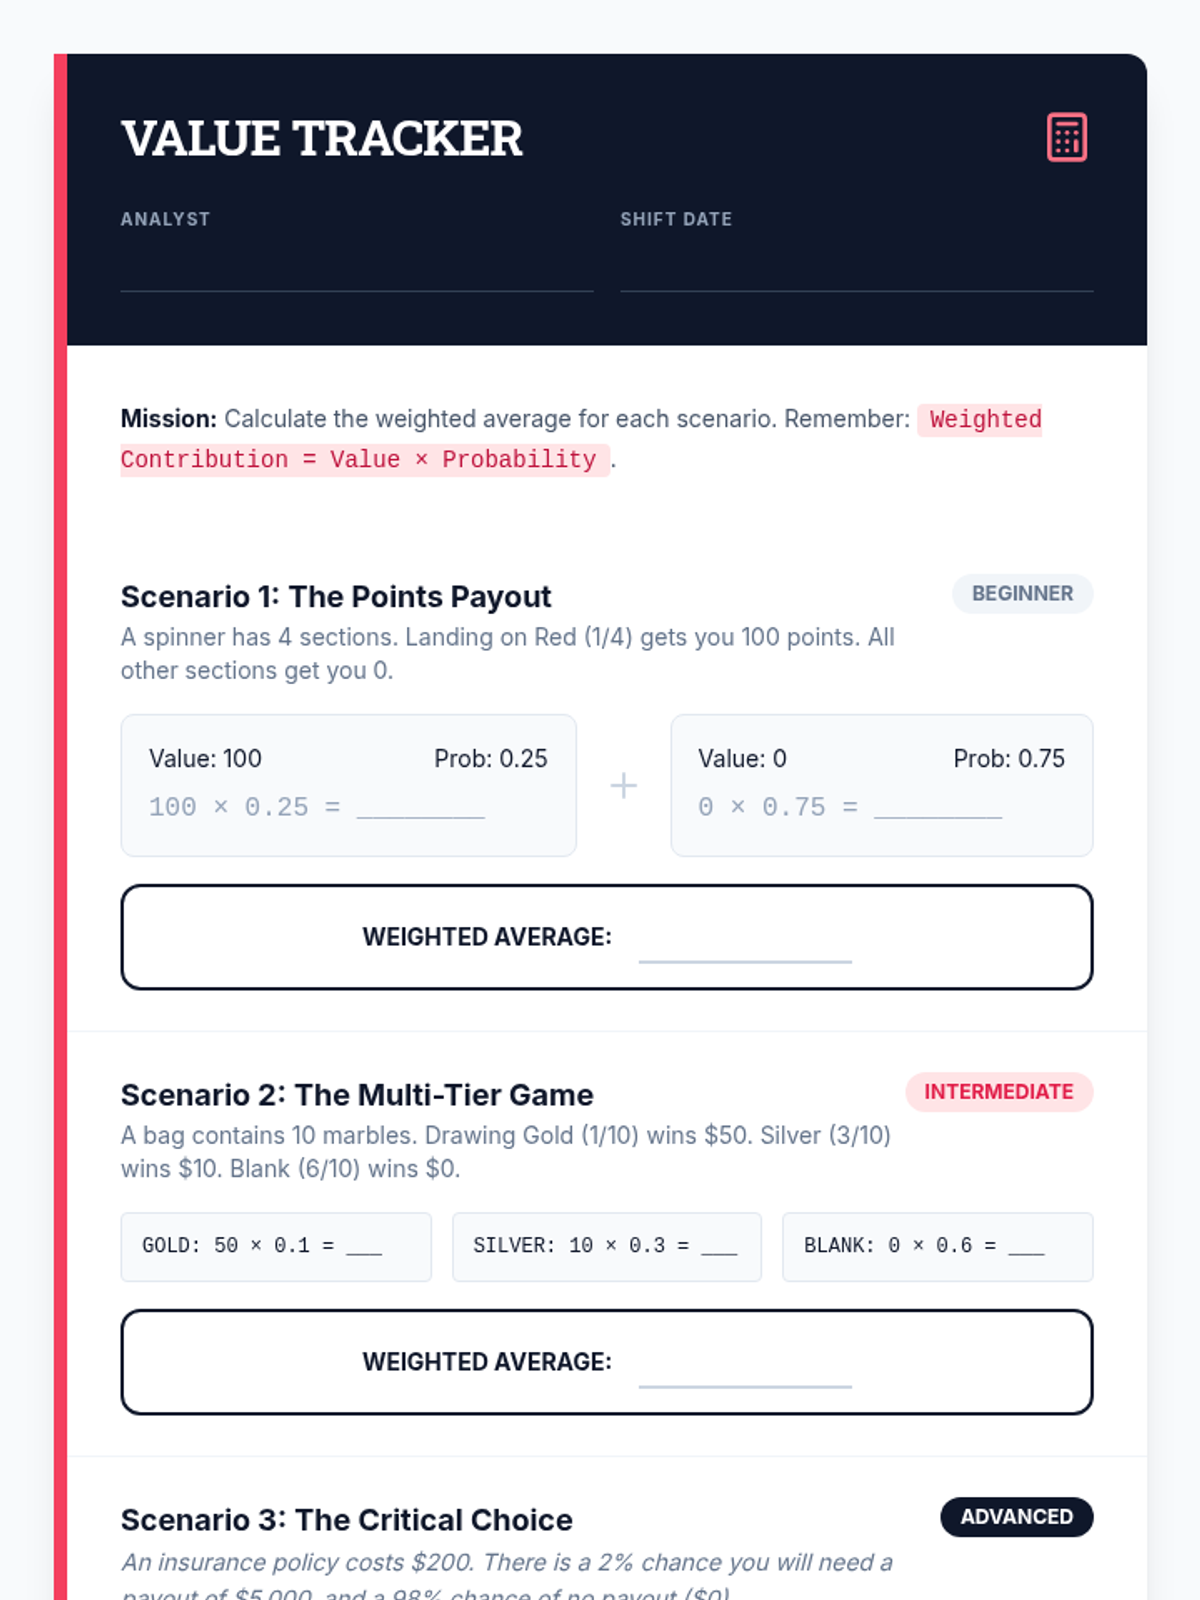
A targeted intervention lesson focused on calculating expected value through game design. Students learn to weigh outcomes by multiplying payoff values by their probabilities to make data-driven decisions.
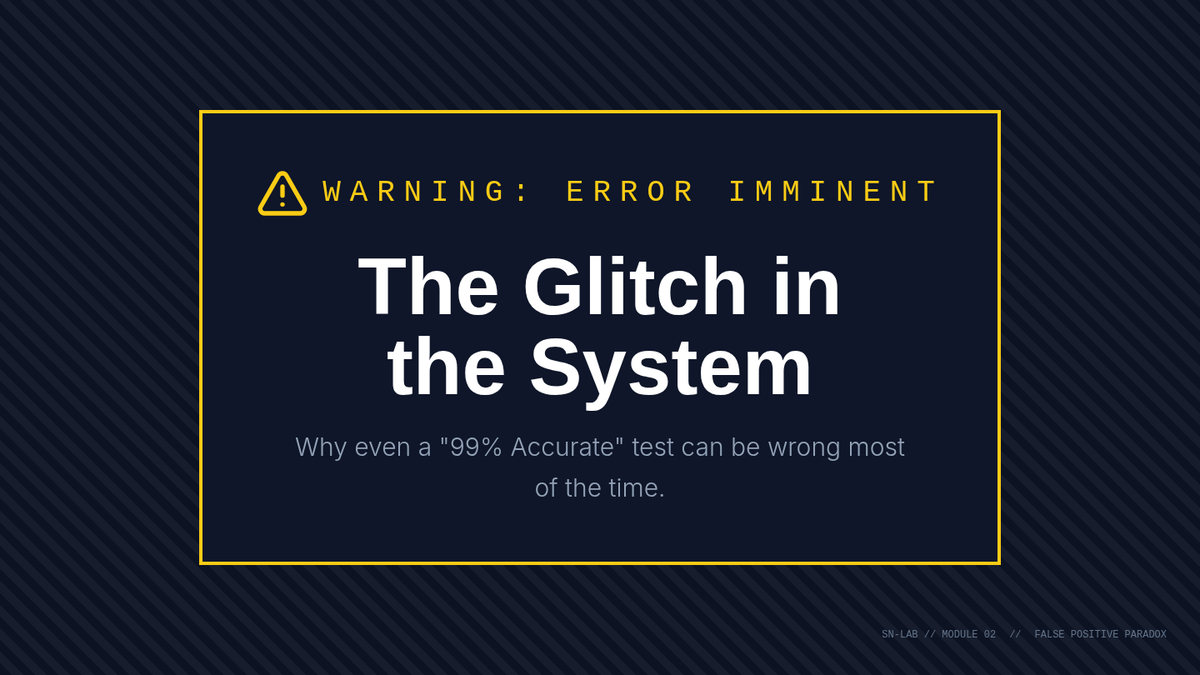
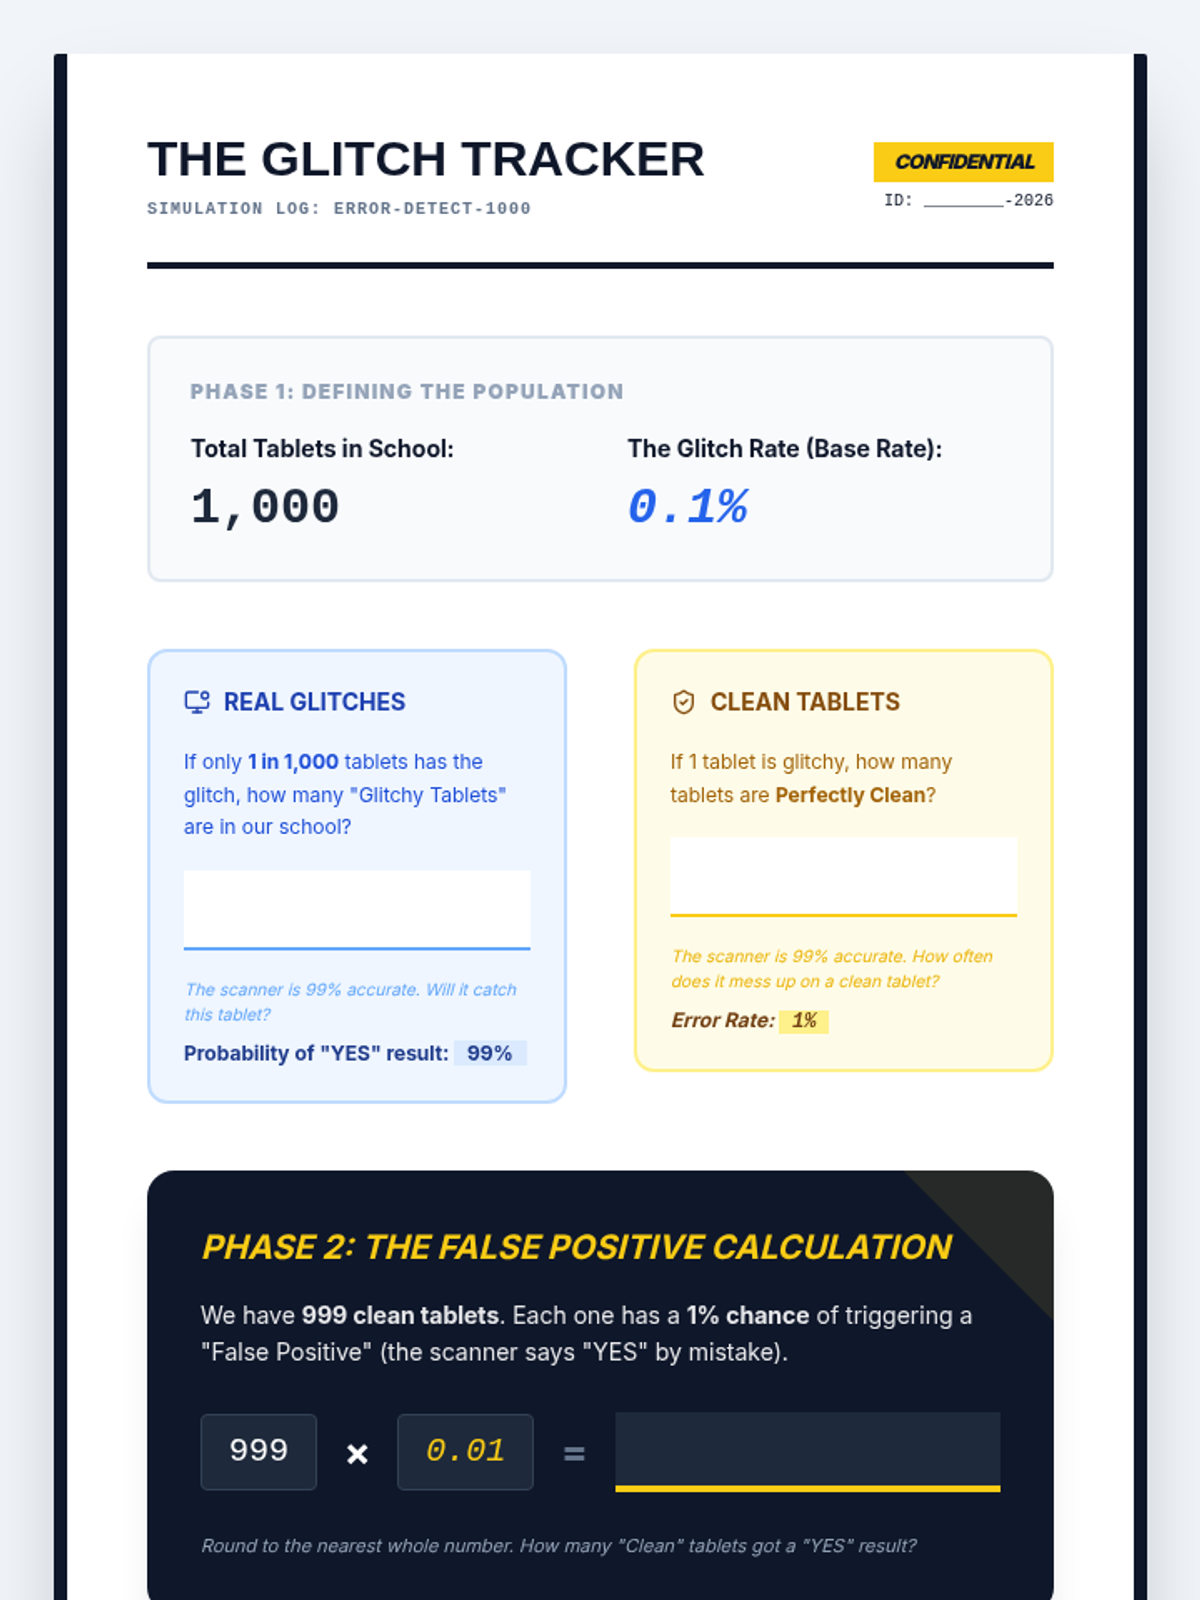
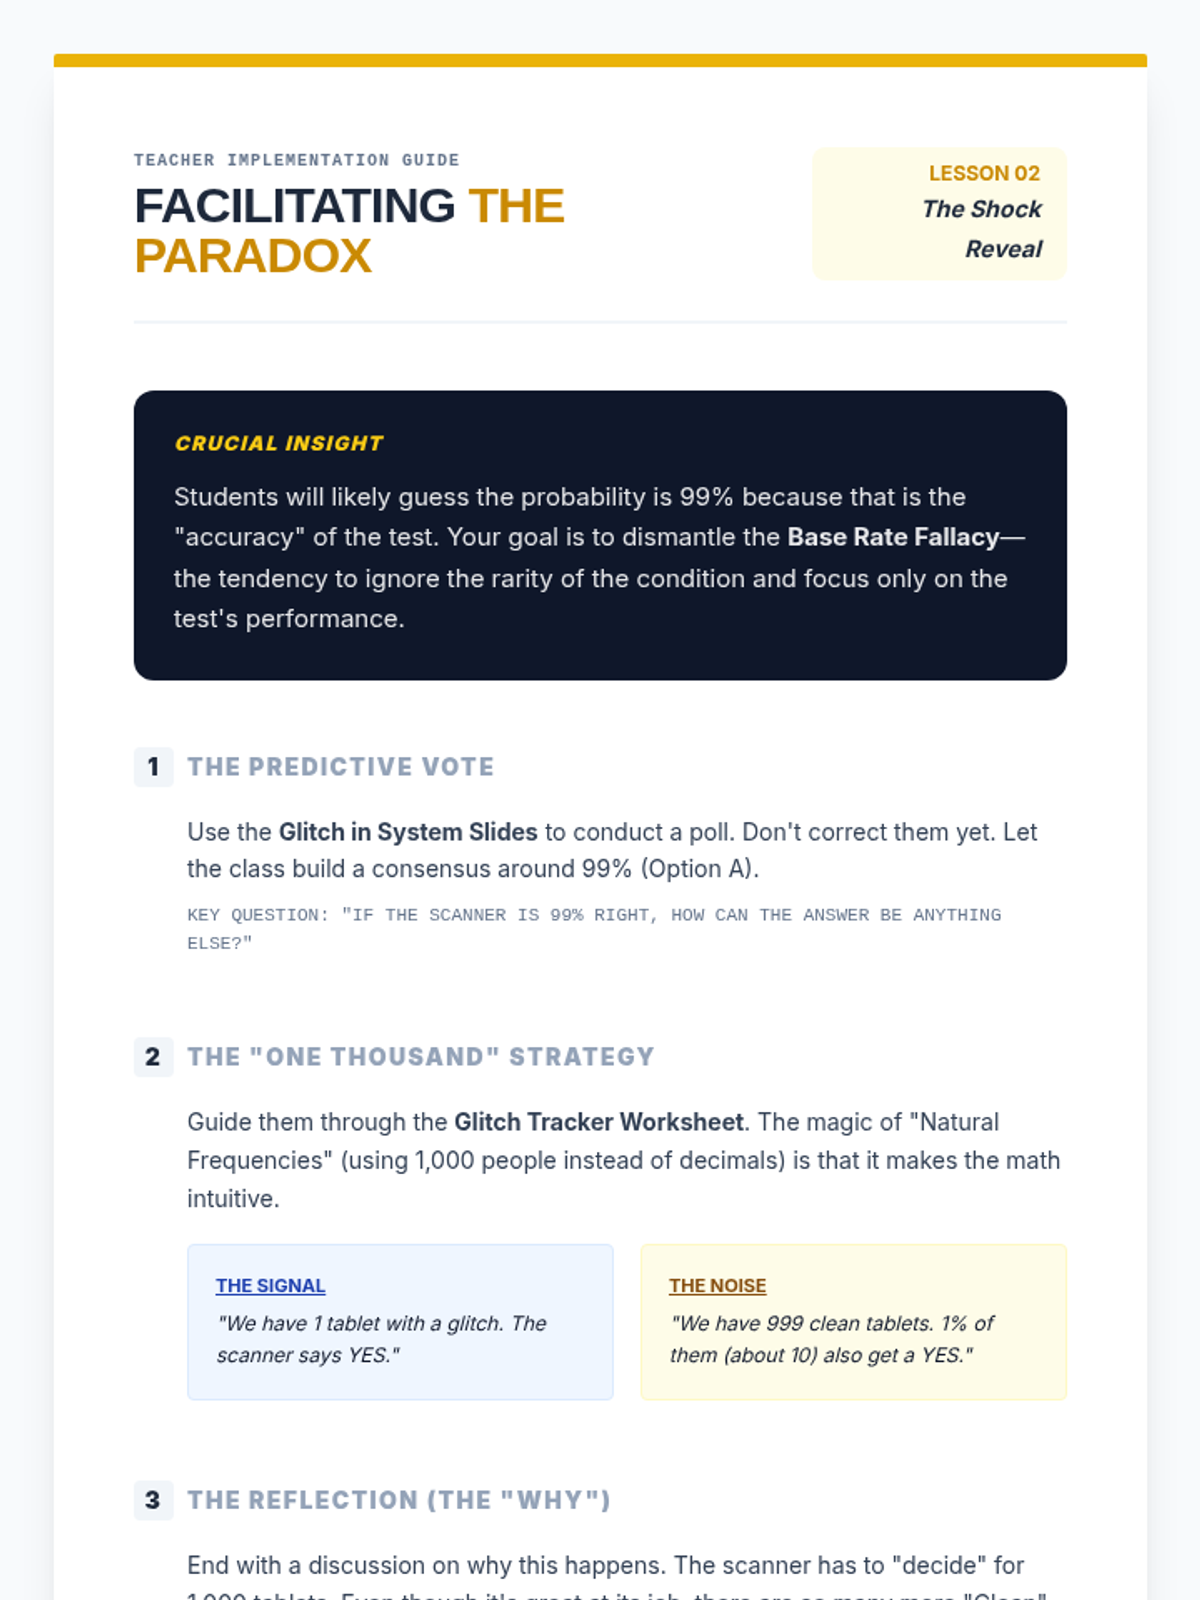
Students engage in a simulation where they 'test' a population for a rare trait using a 99% accurate test. They discover that rare traits result in many false alarms, introducing the base rate fallacy.
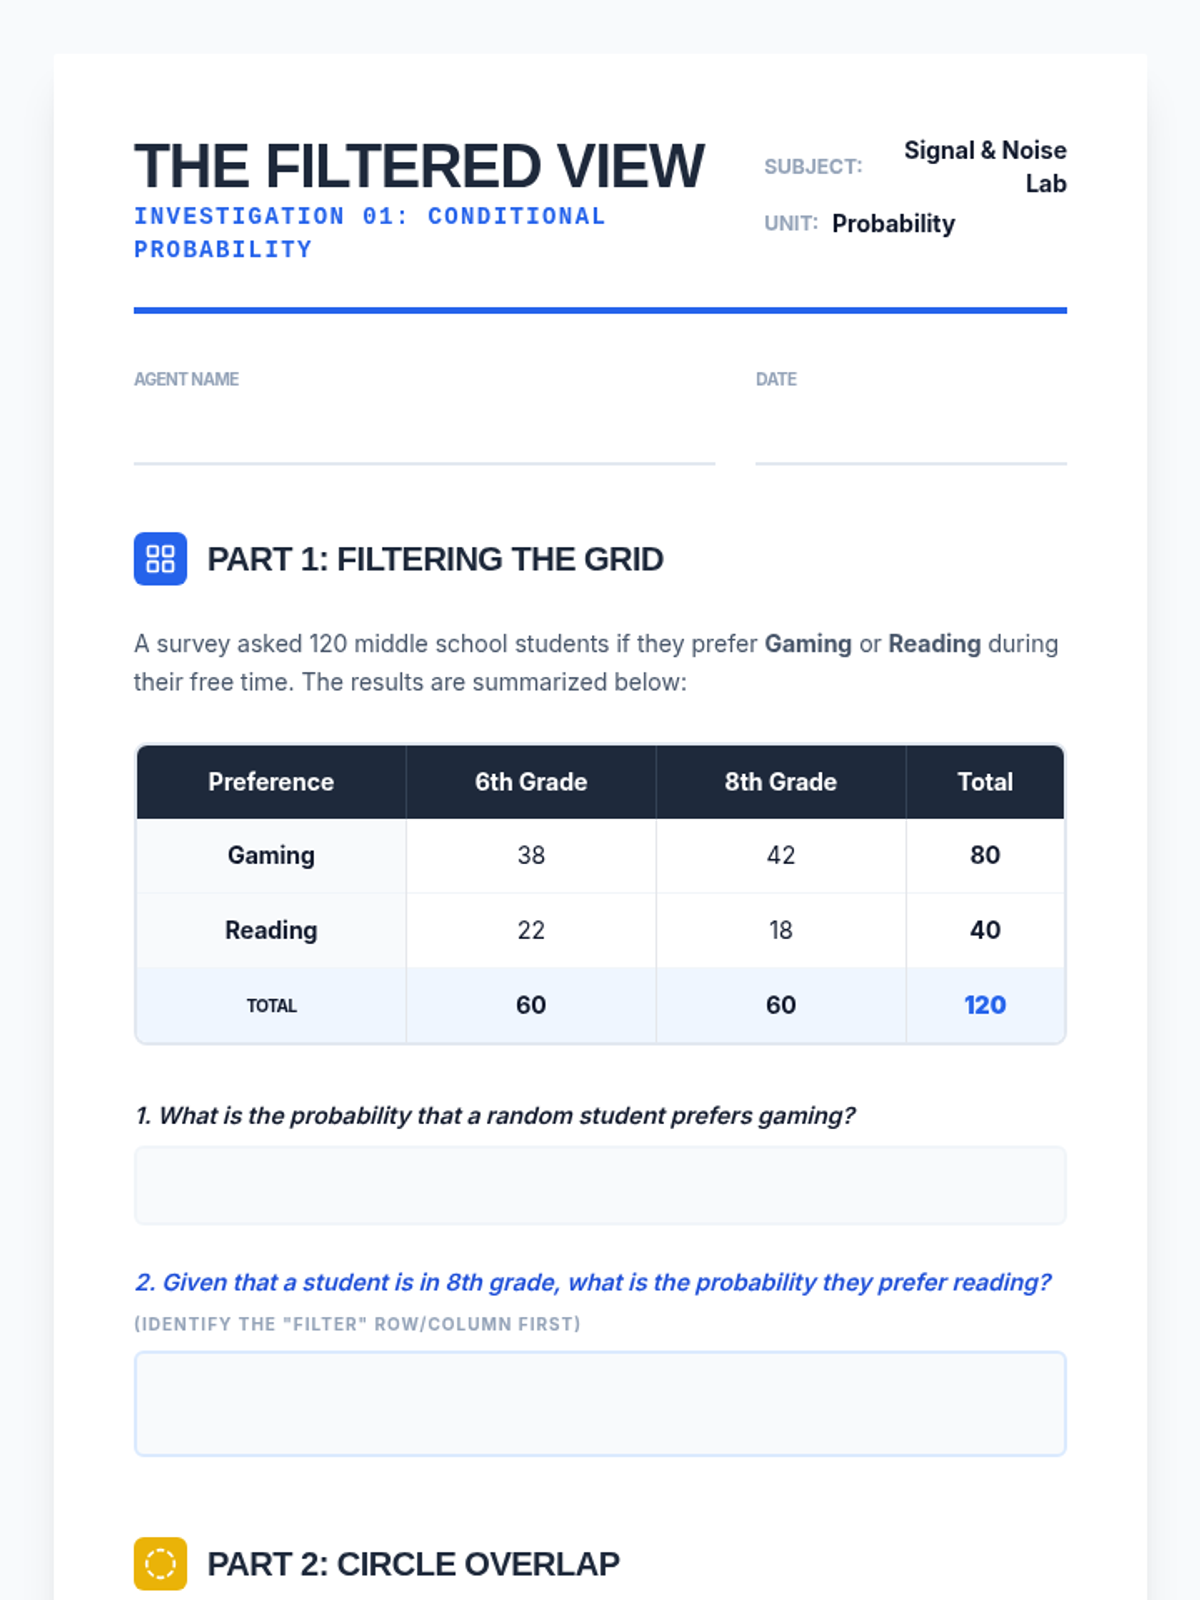
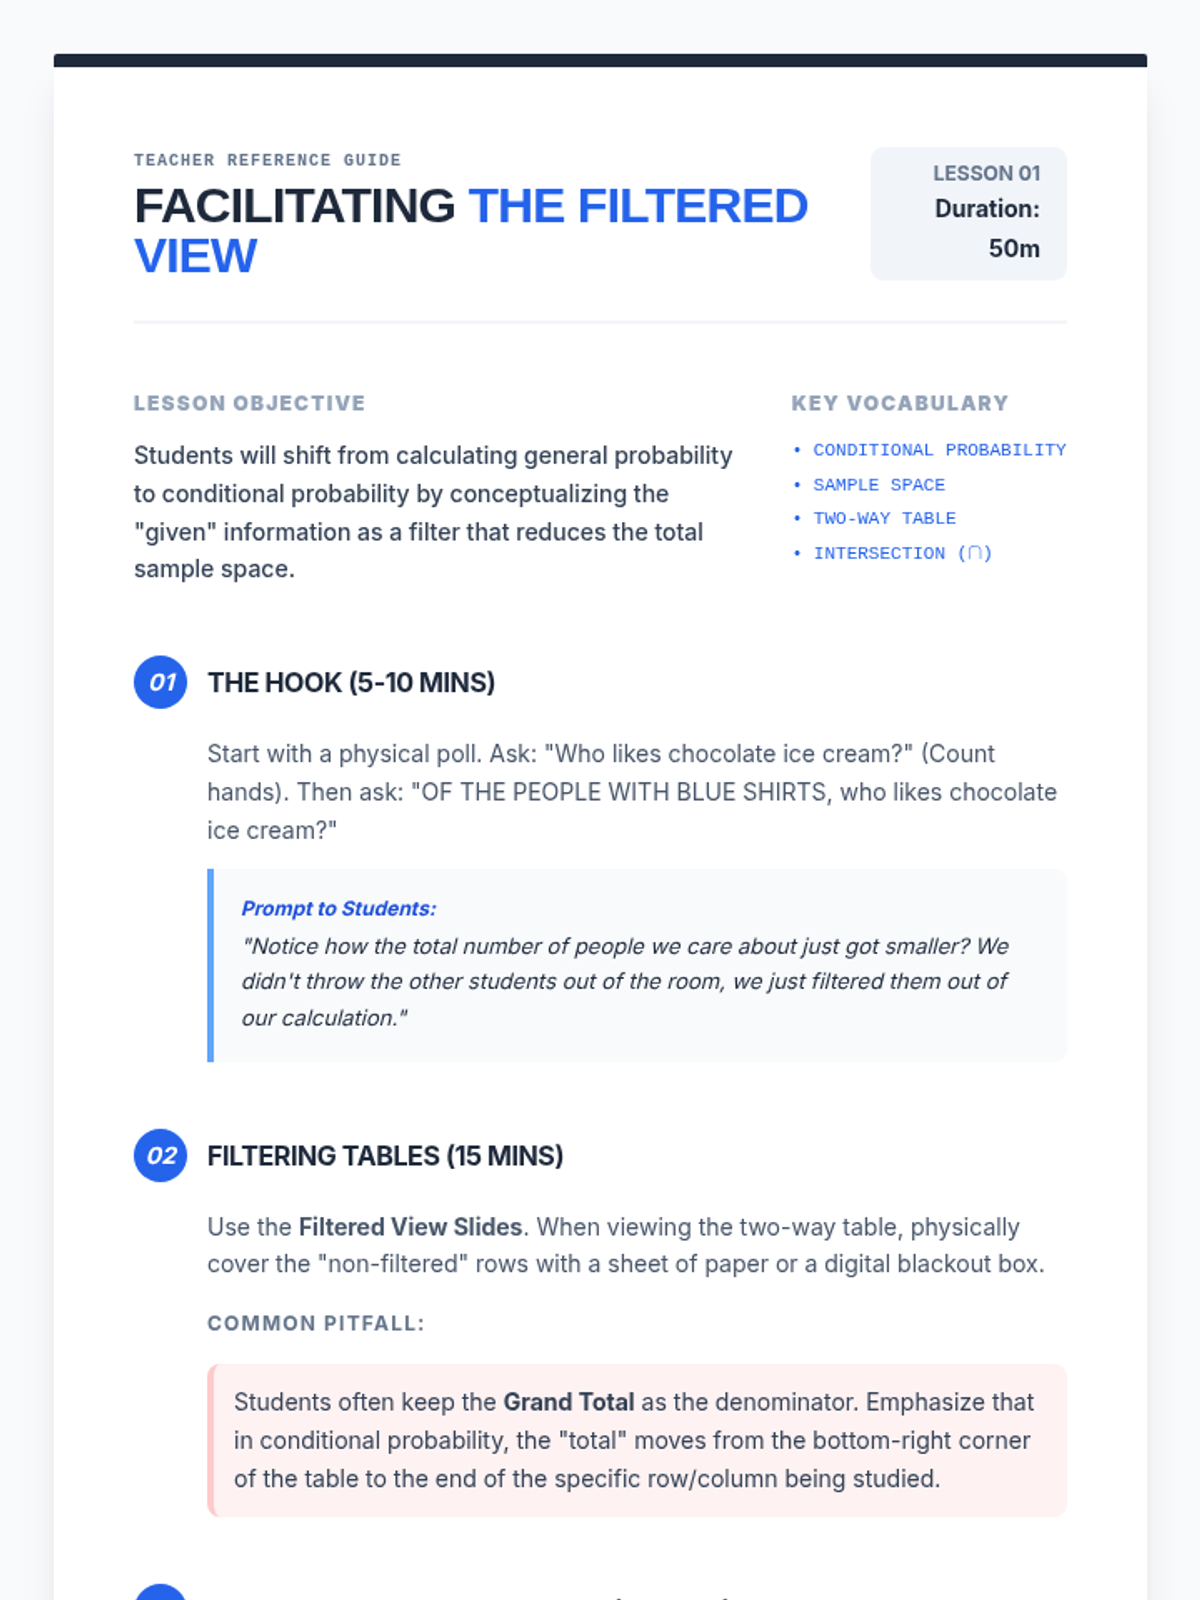
Students use two-way tables and Venn diagrams to find probabilities of an event given a specific condition, practicing how to 'filter' the sample space.
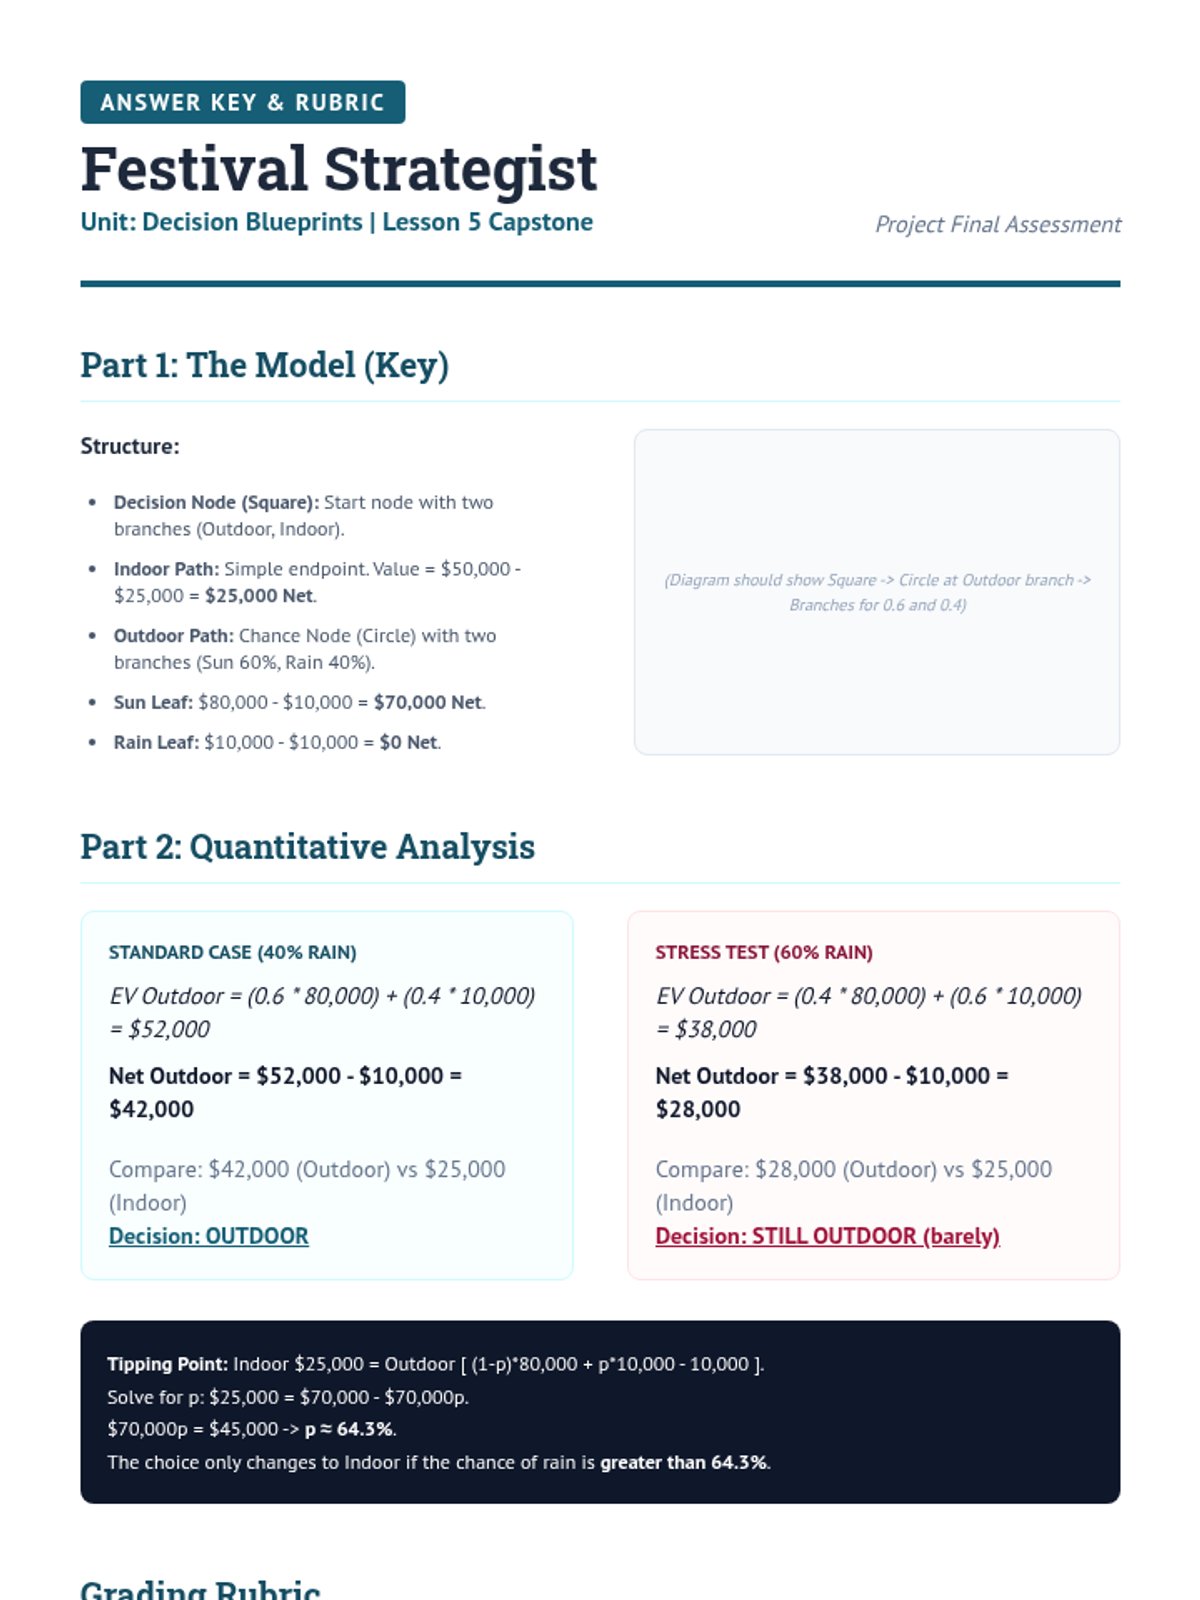
A cumulative project where students model and solve a complex event planning scenario involving risk and reward.
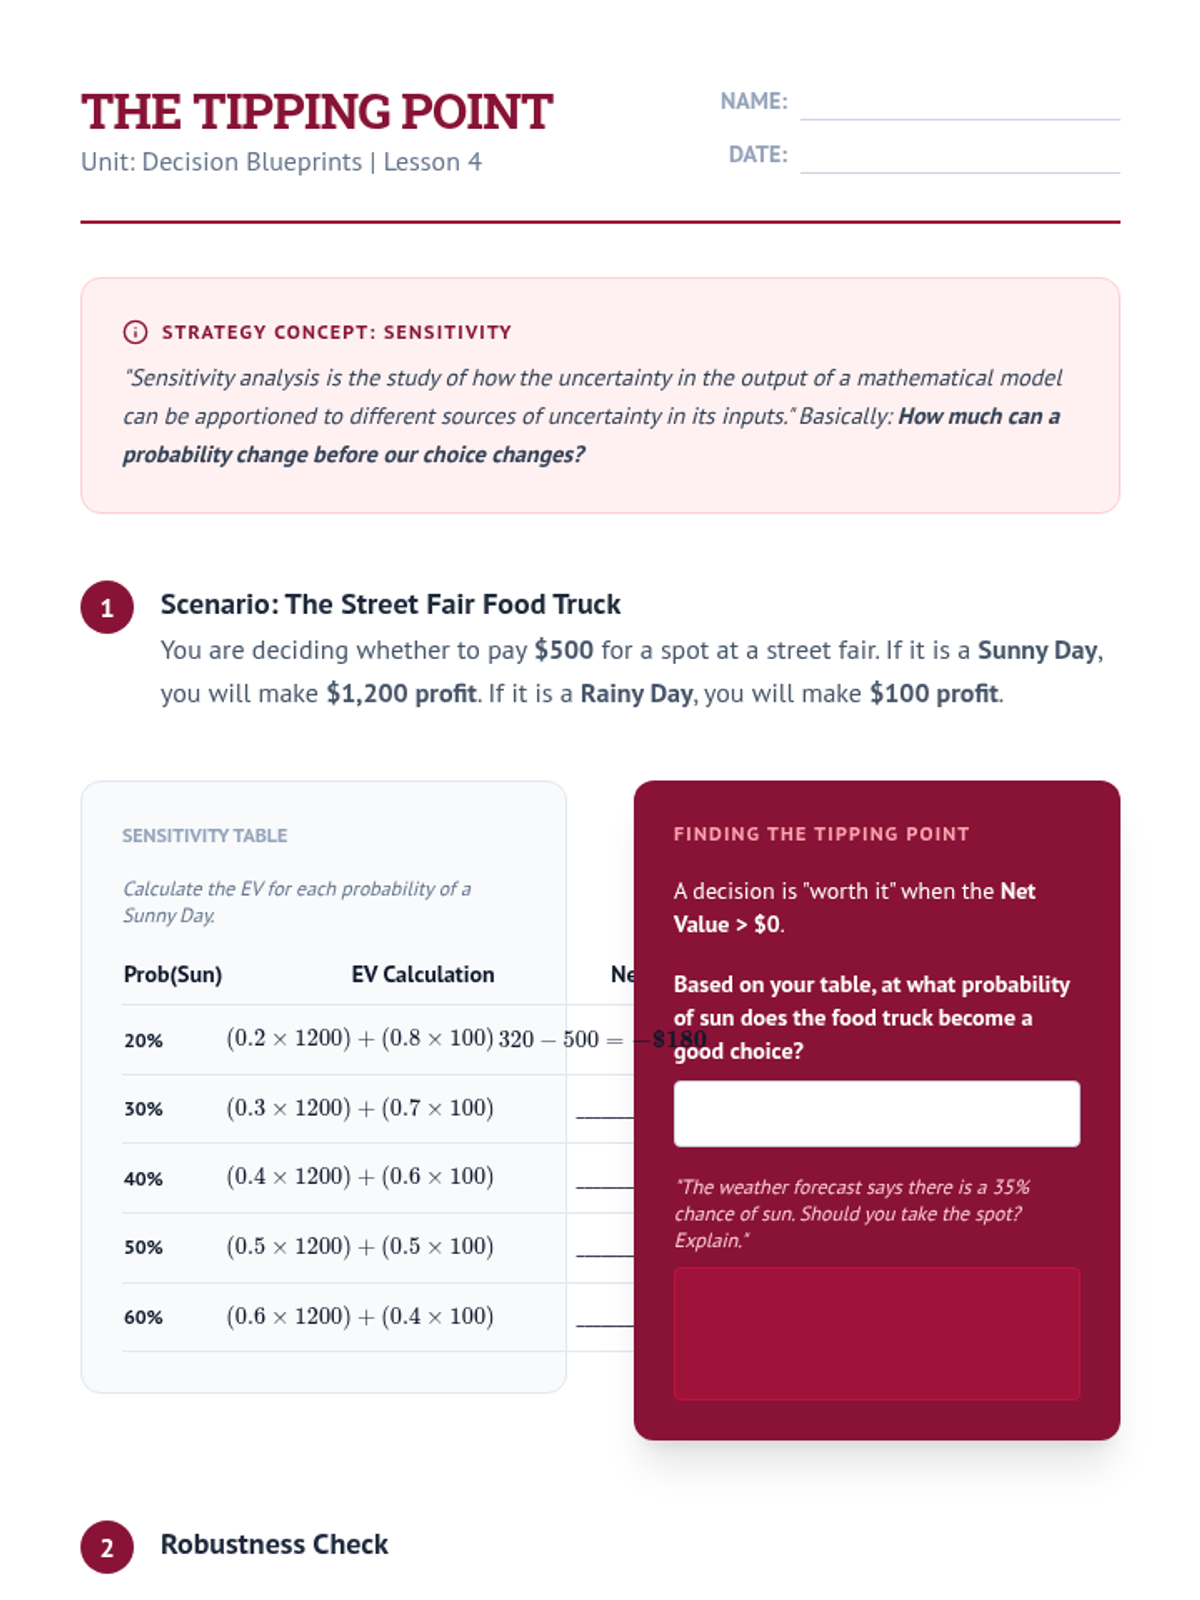
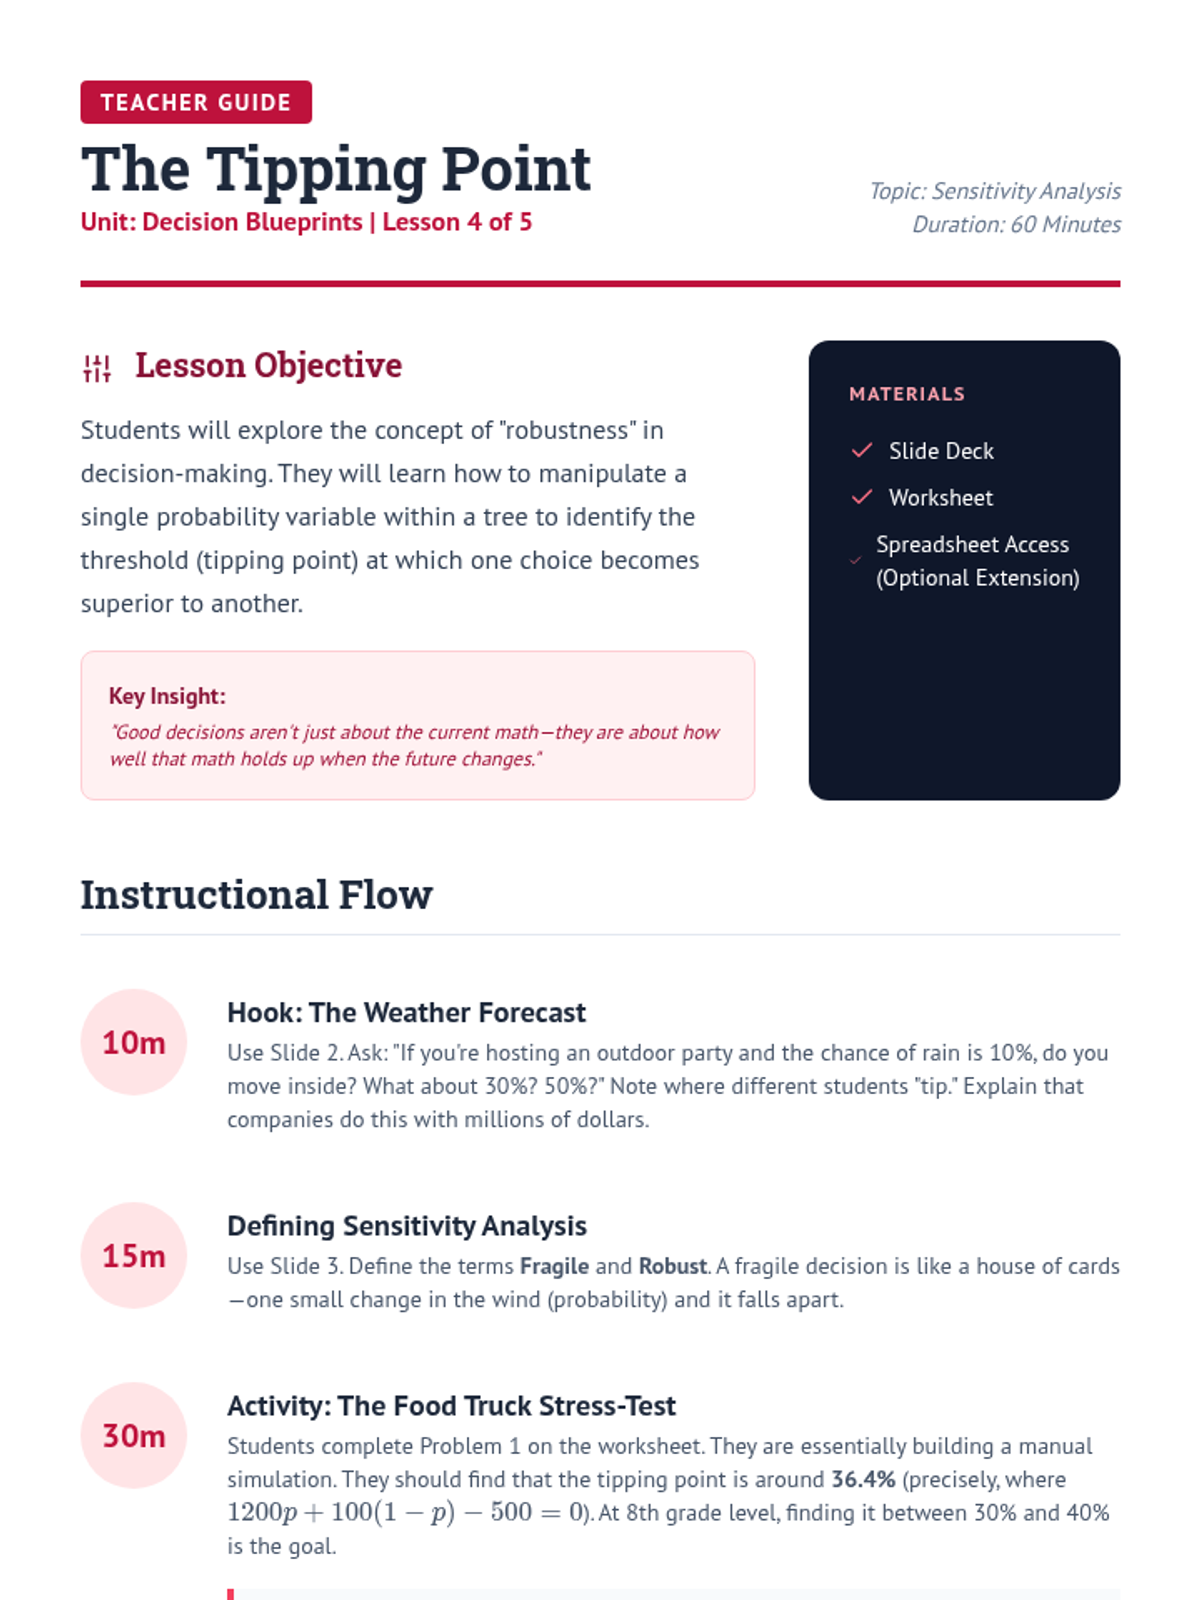
Students explore how changing probabilities impacts the final decision, identifying 'tipping points' in decision models.
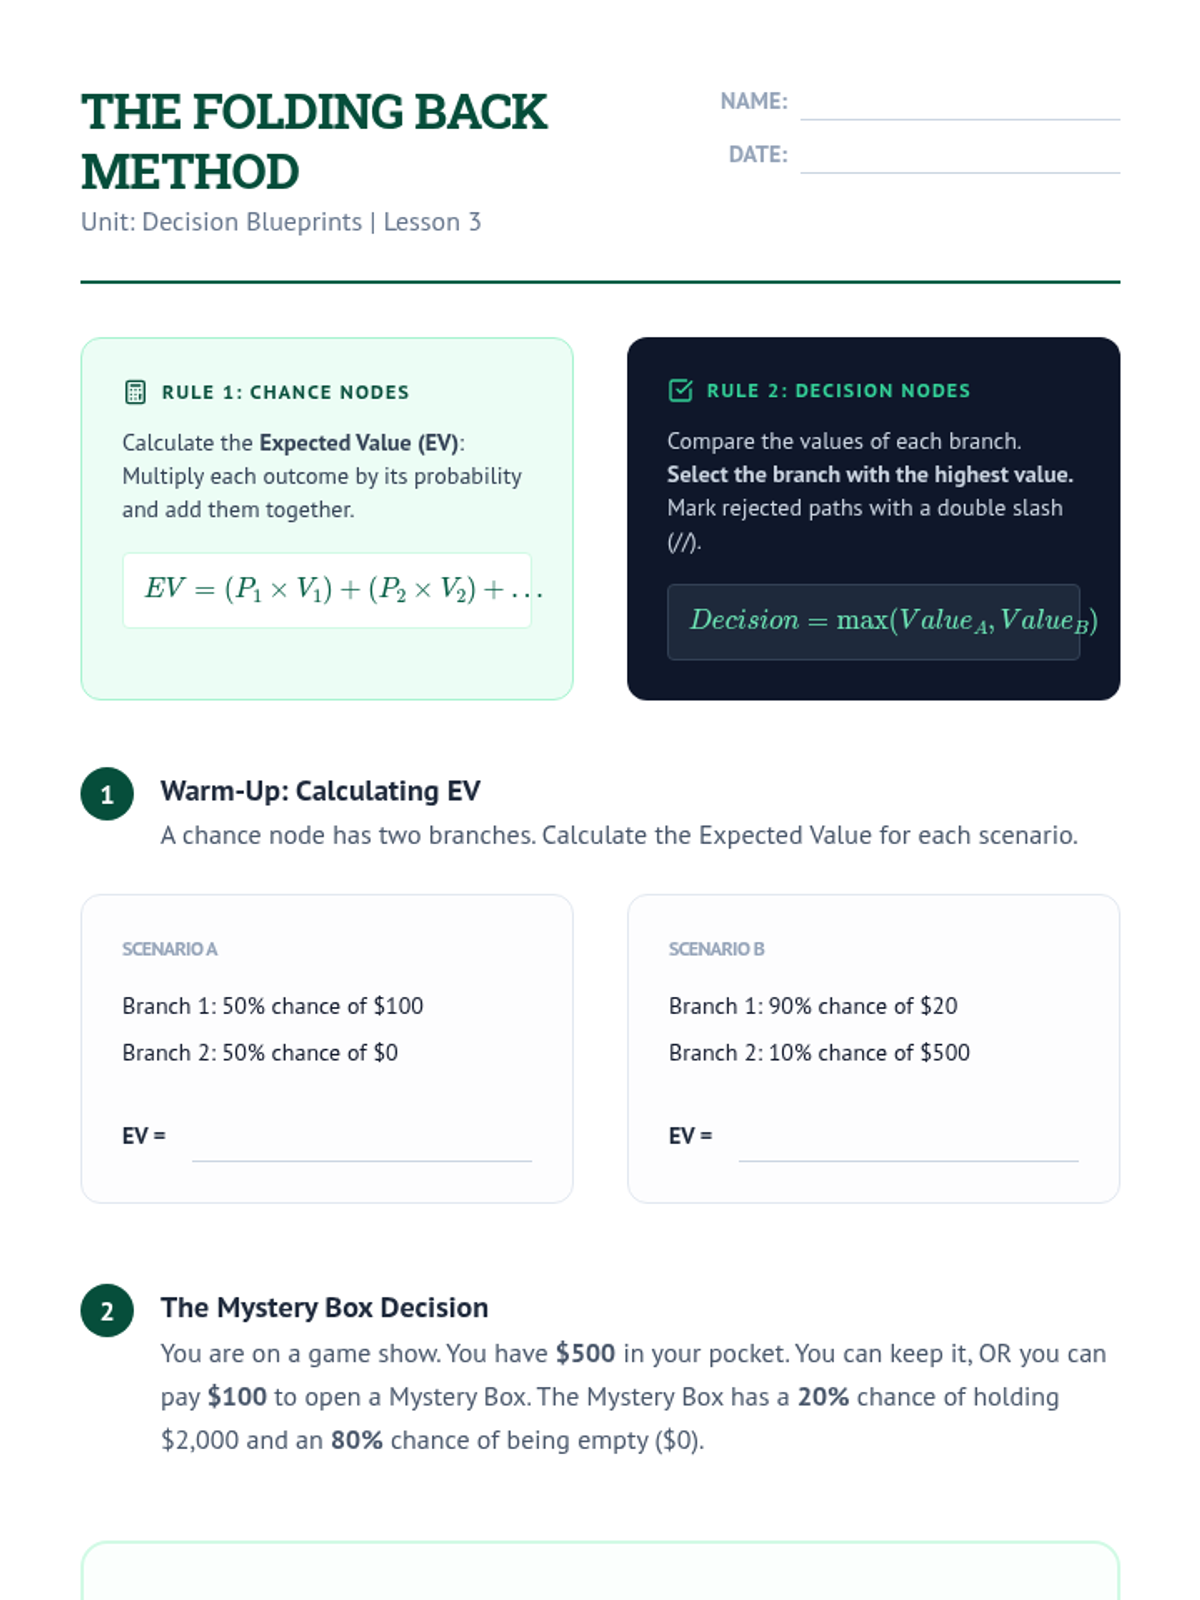
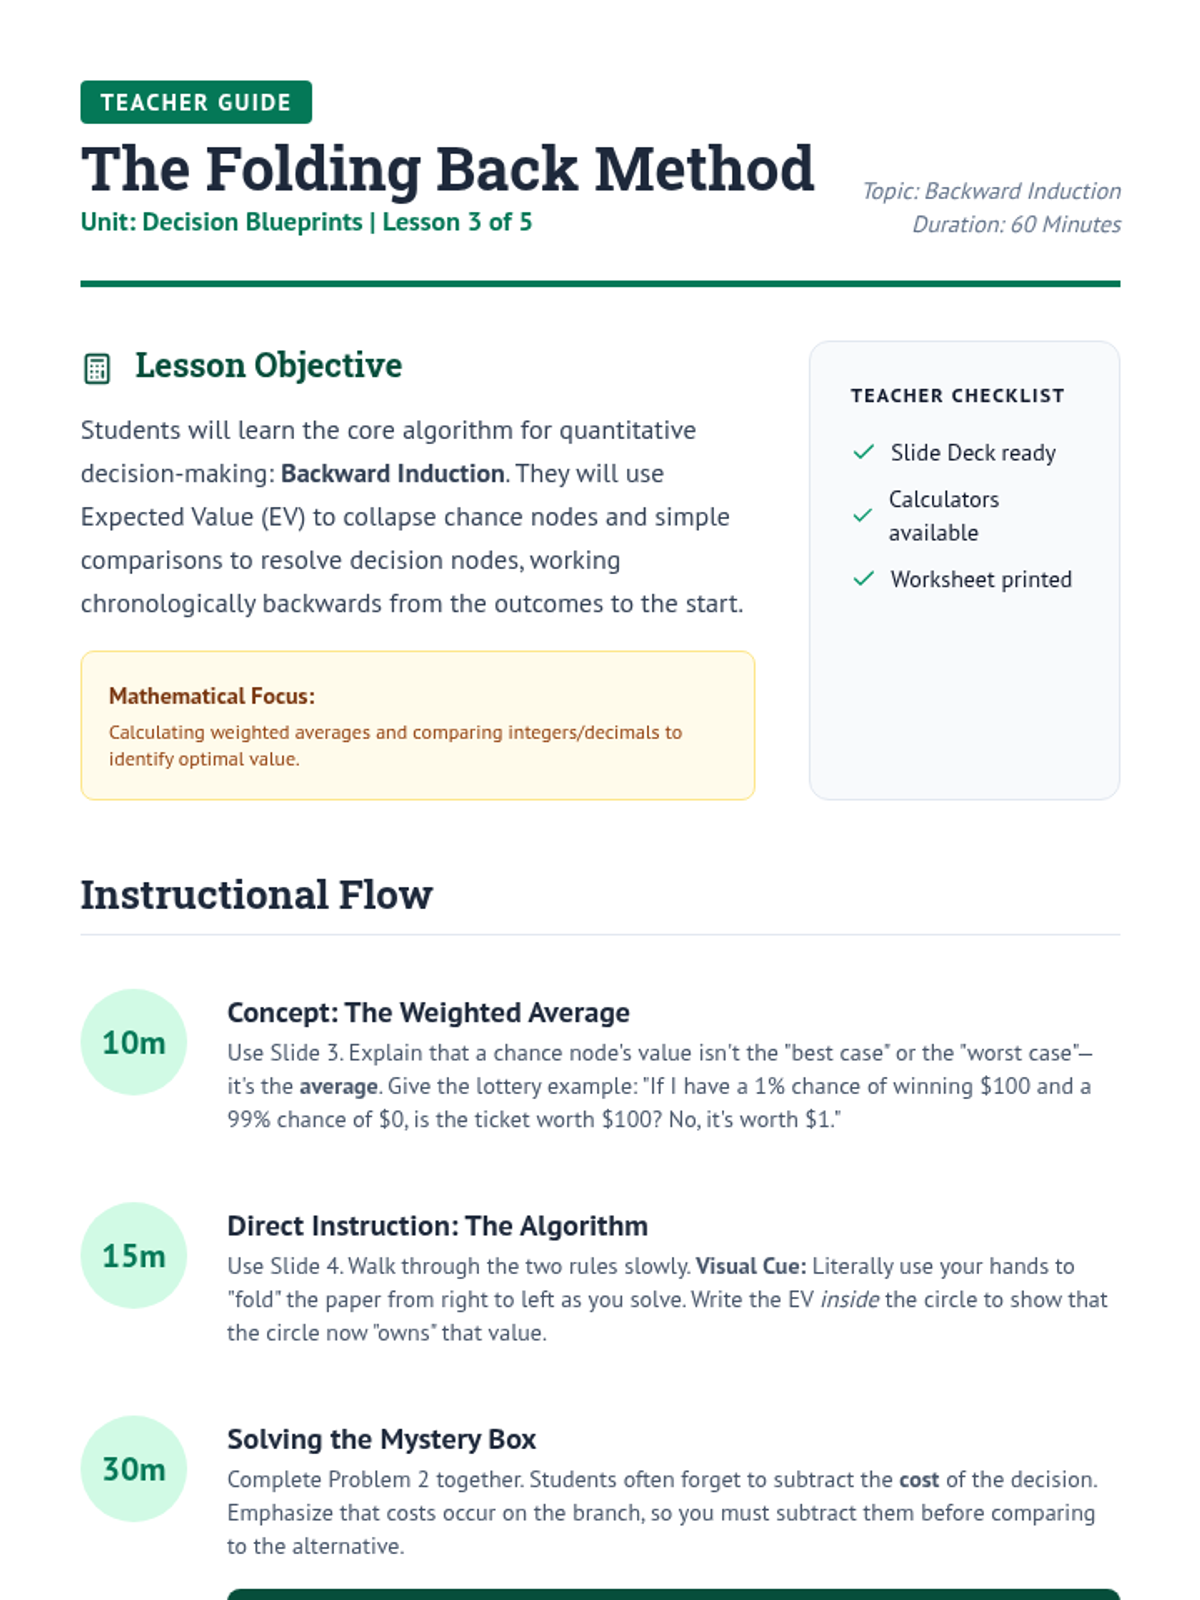
Students learn the algorithm for solving decision trees by calculating weighted averages from outcomes back to the start.
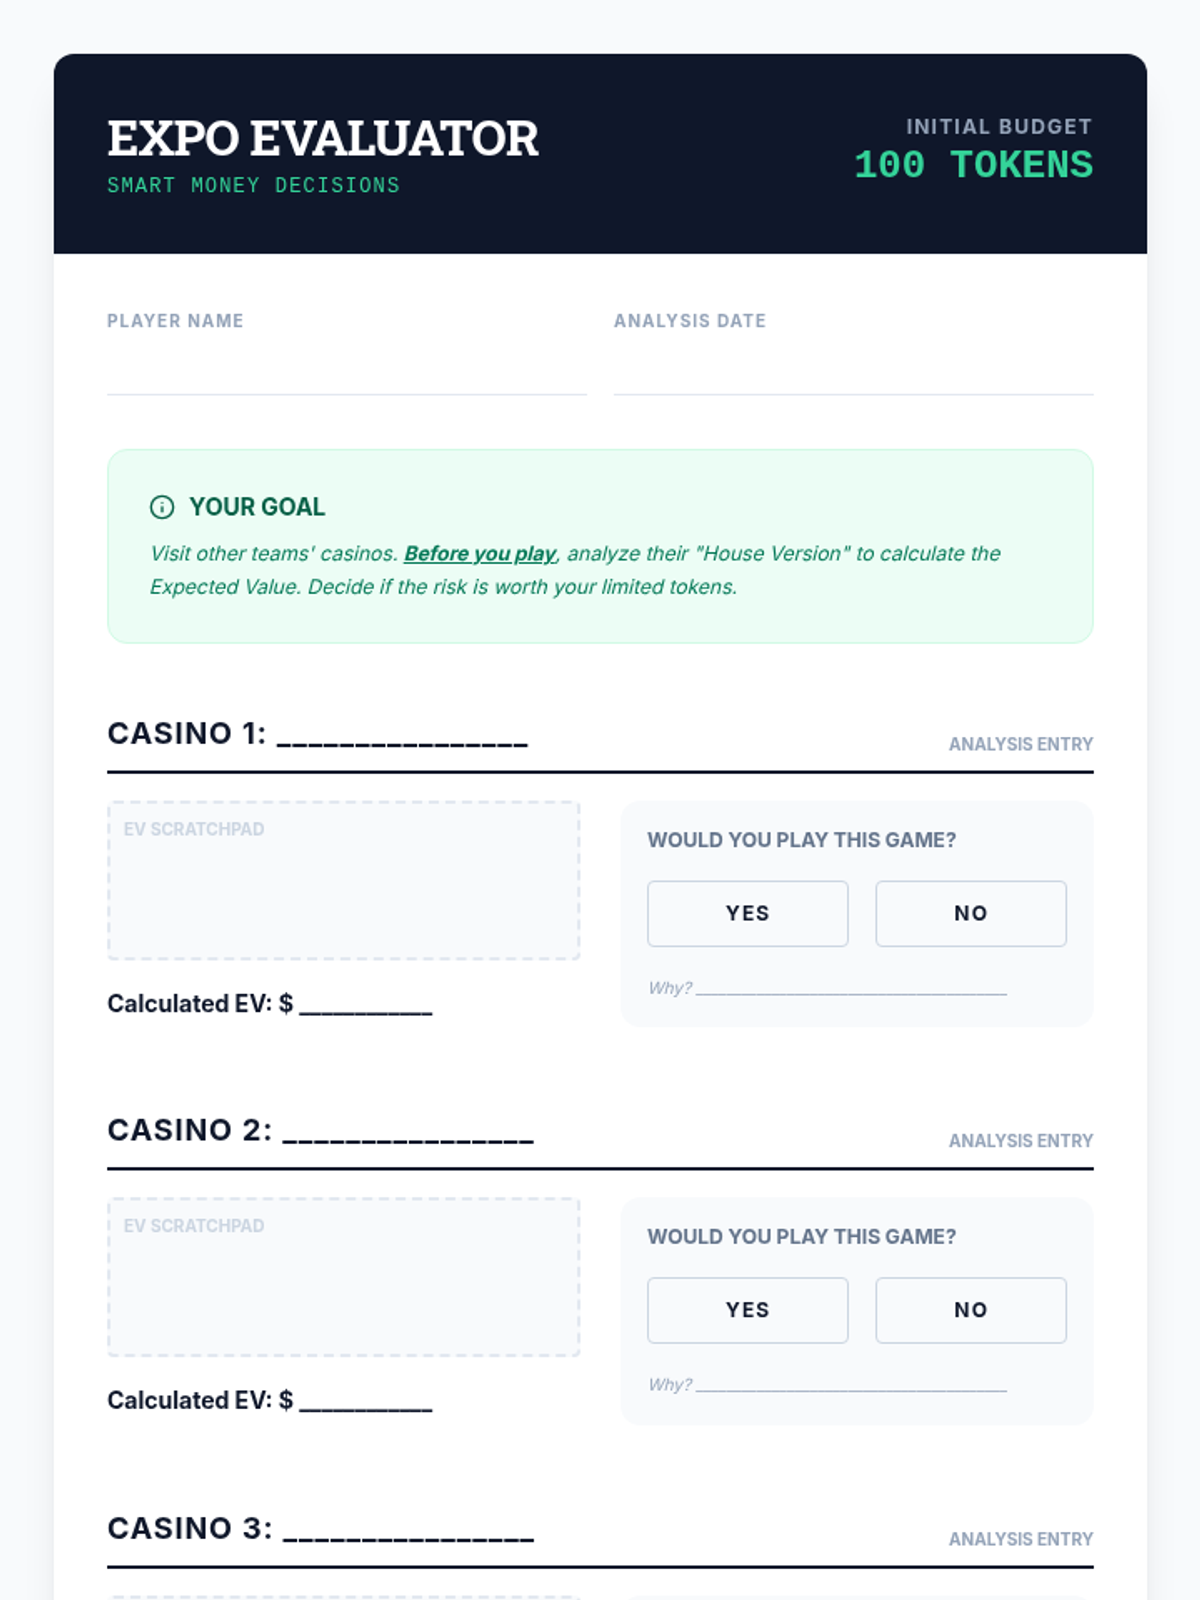
A simulation where students evaluate peer-designed games and make data-driven decisions on where to 'bet' their tokens.
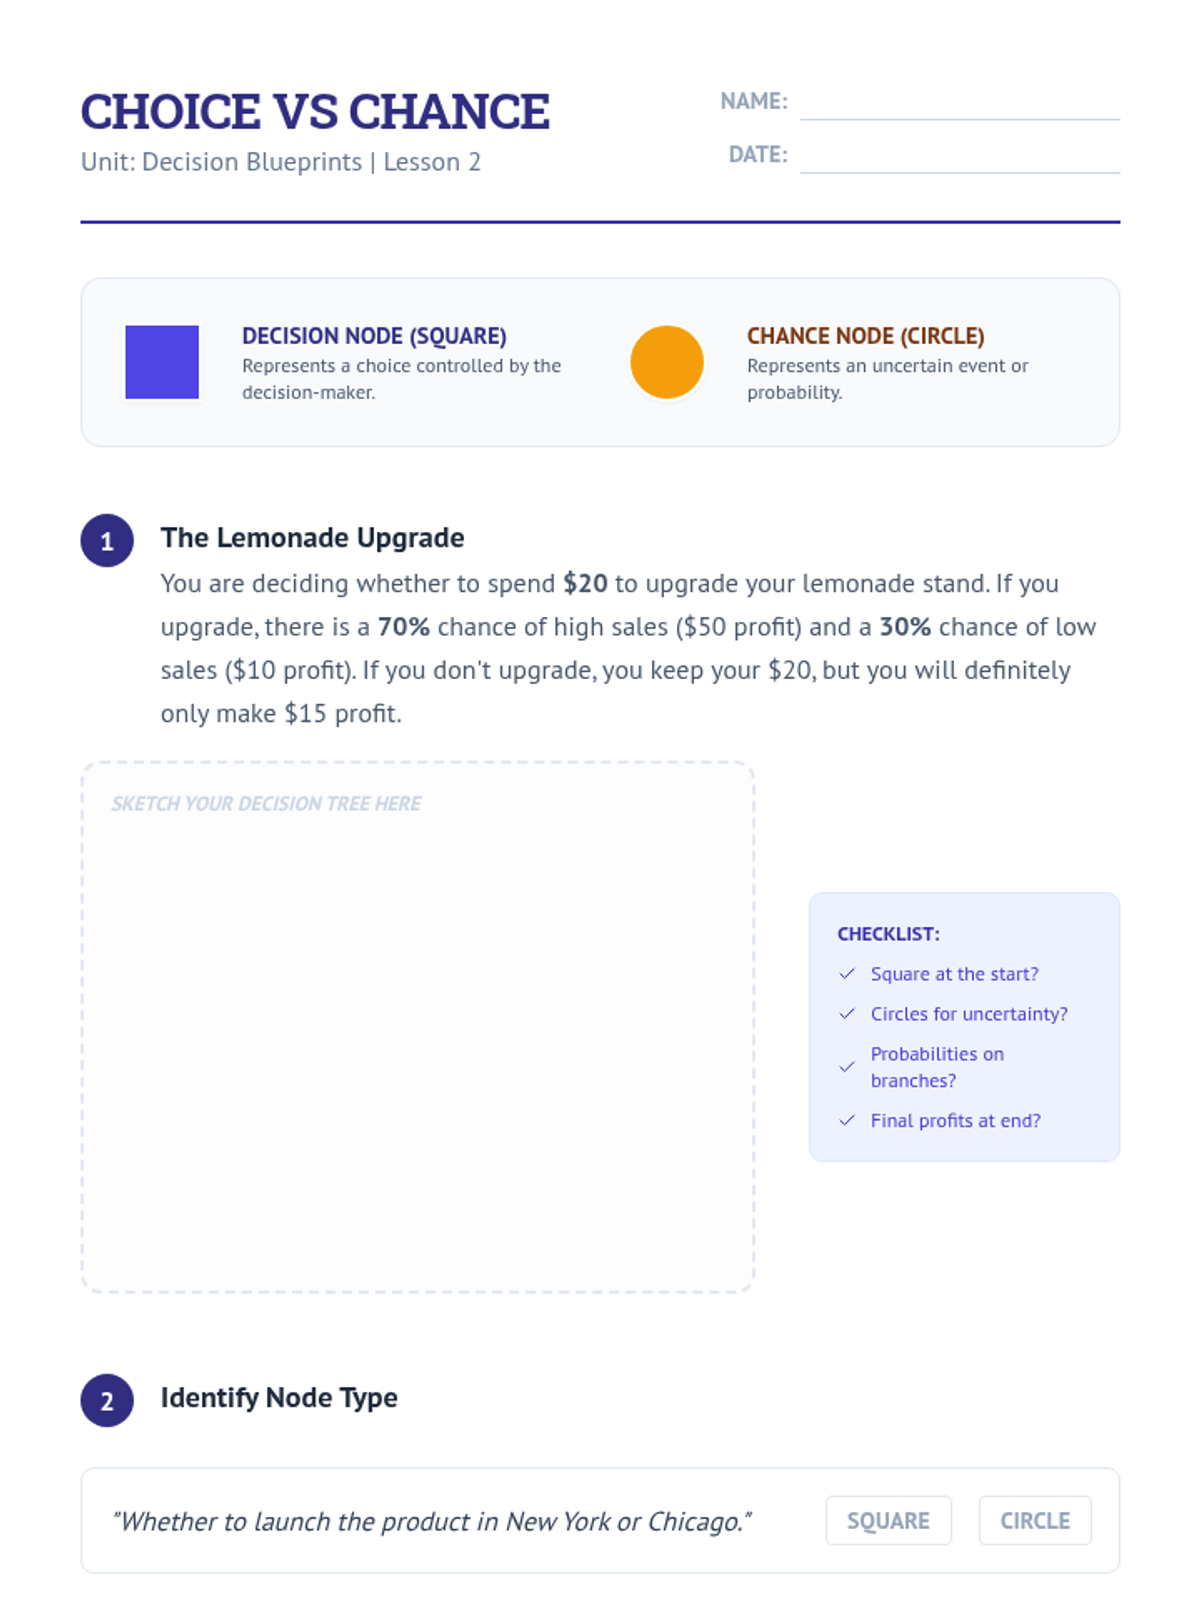
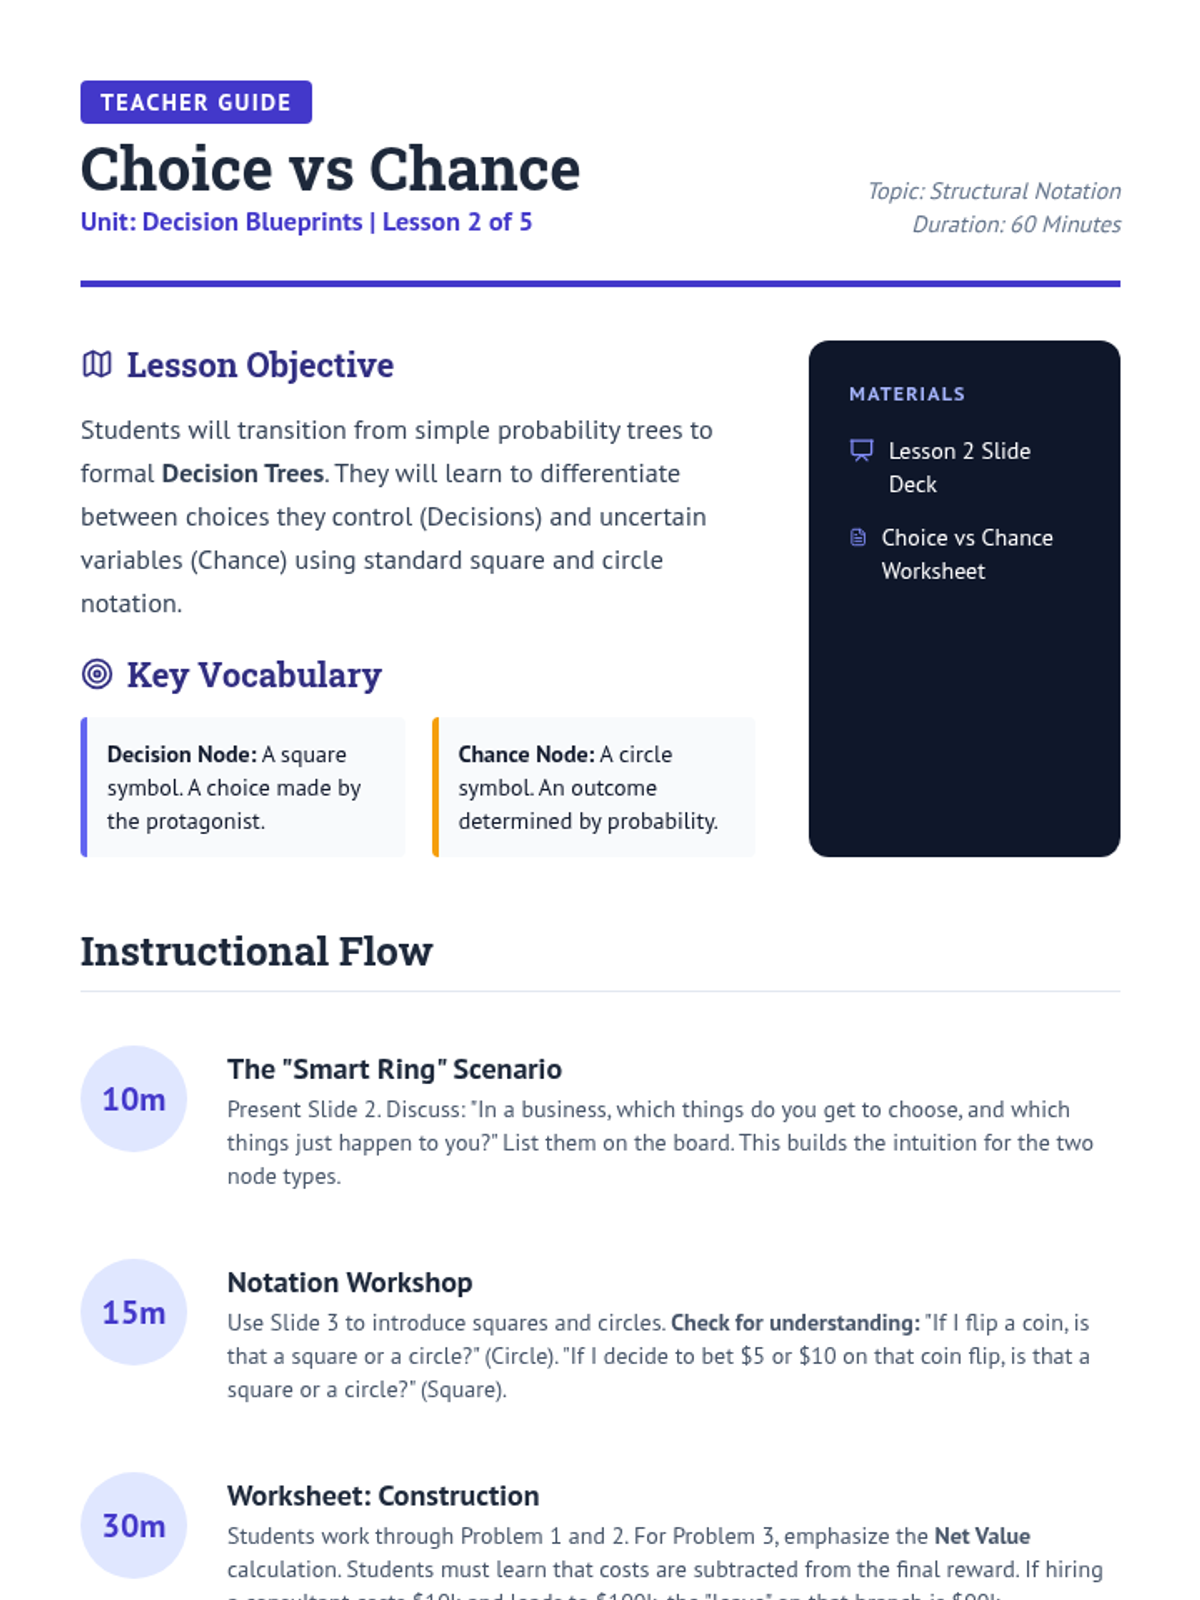
Students learn the formal notation for decision trees, distinguishing between decision nodes (squares) and chance nodes (circles).
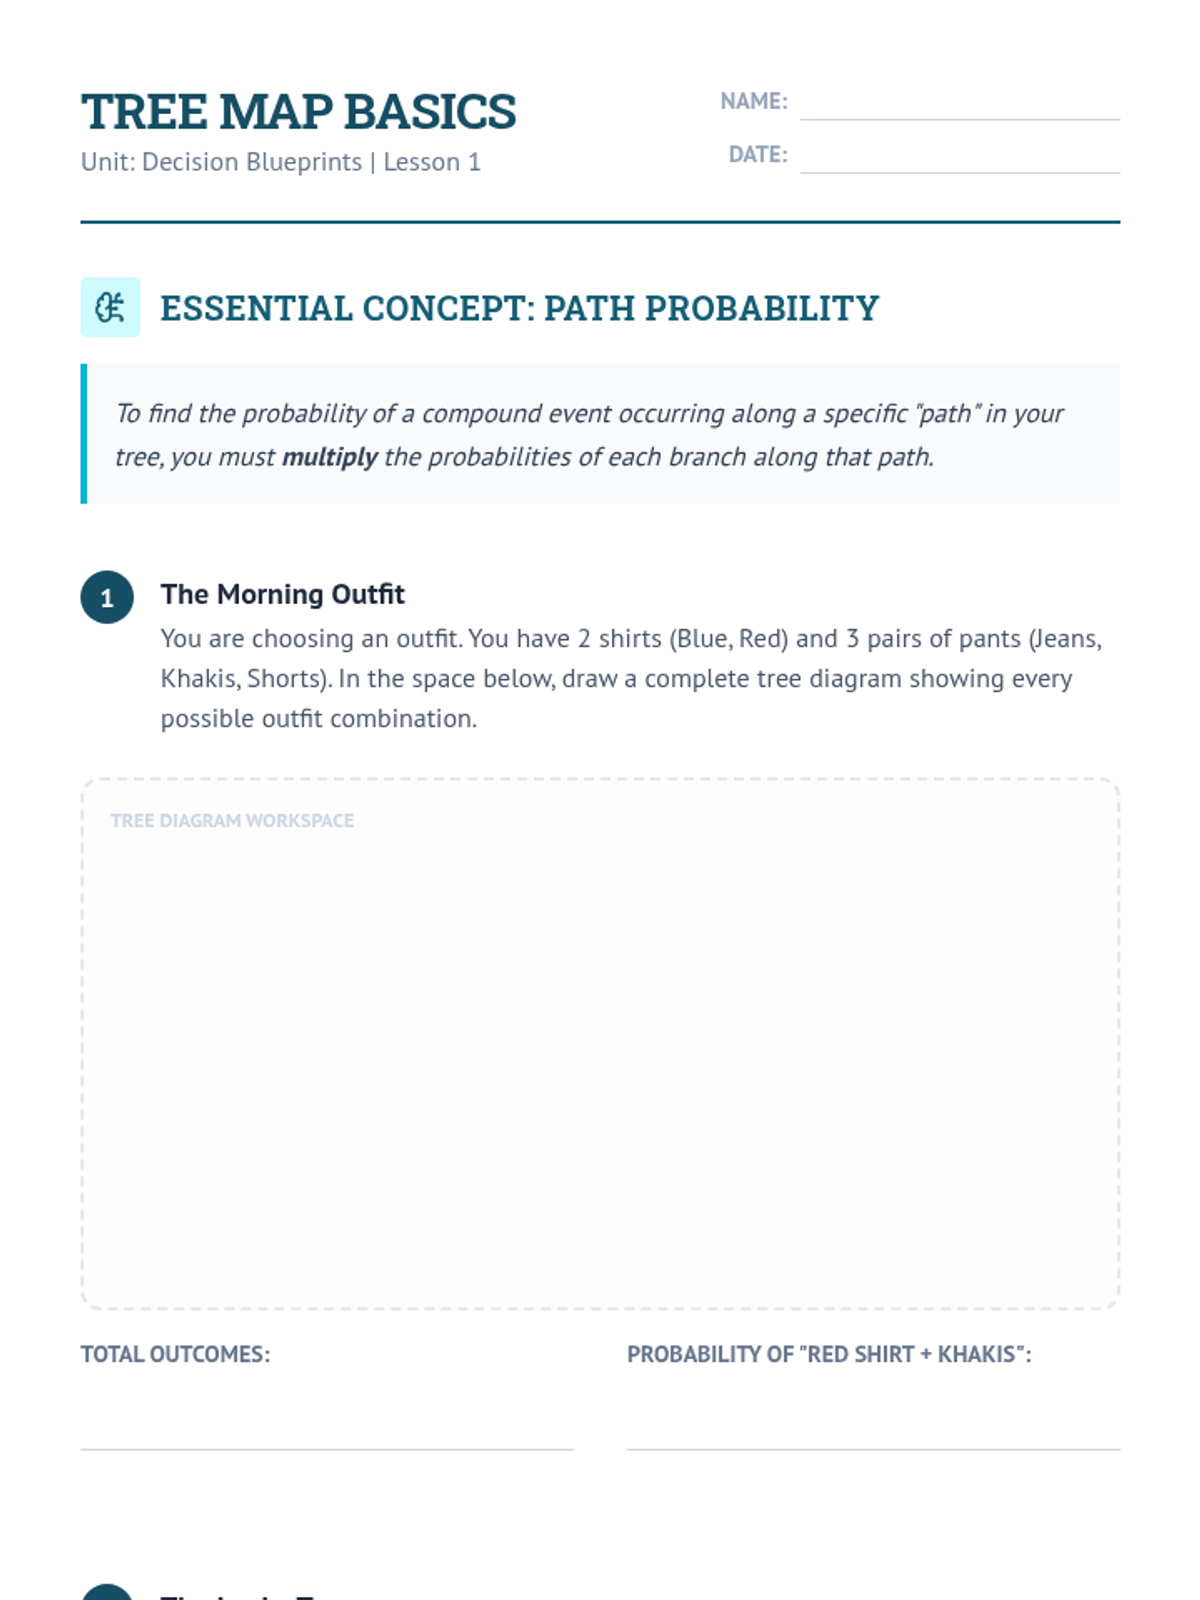
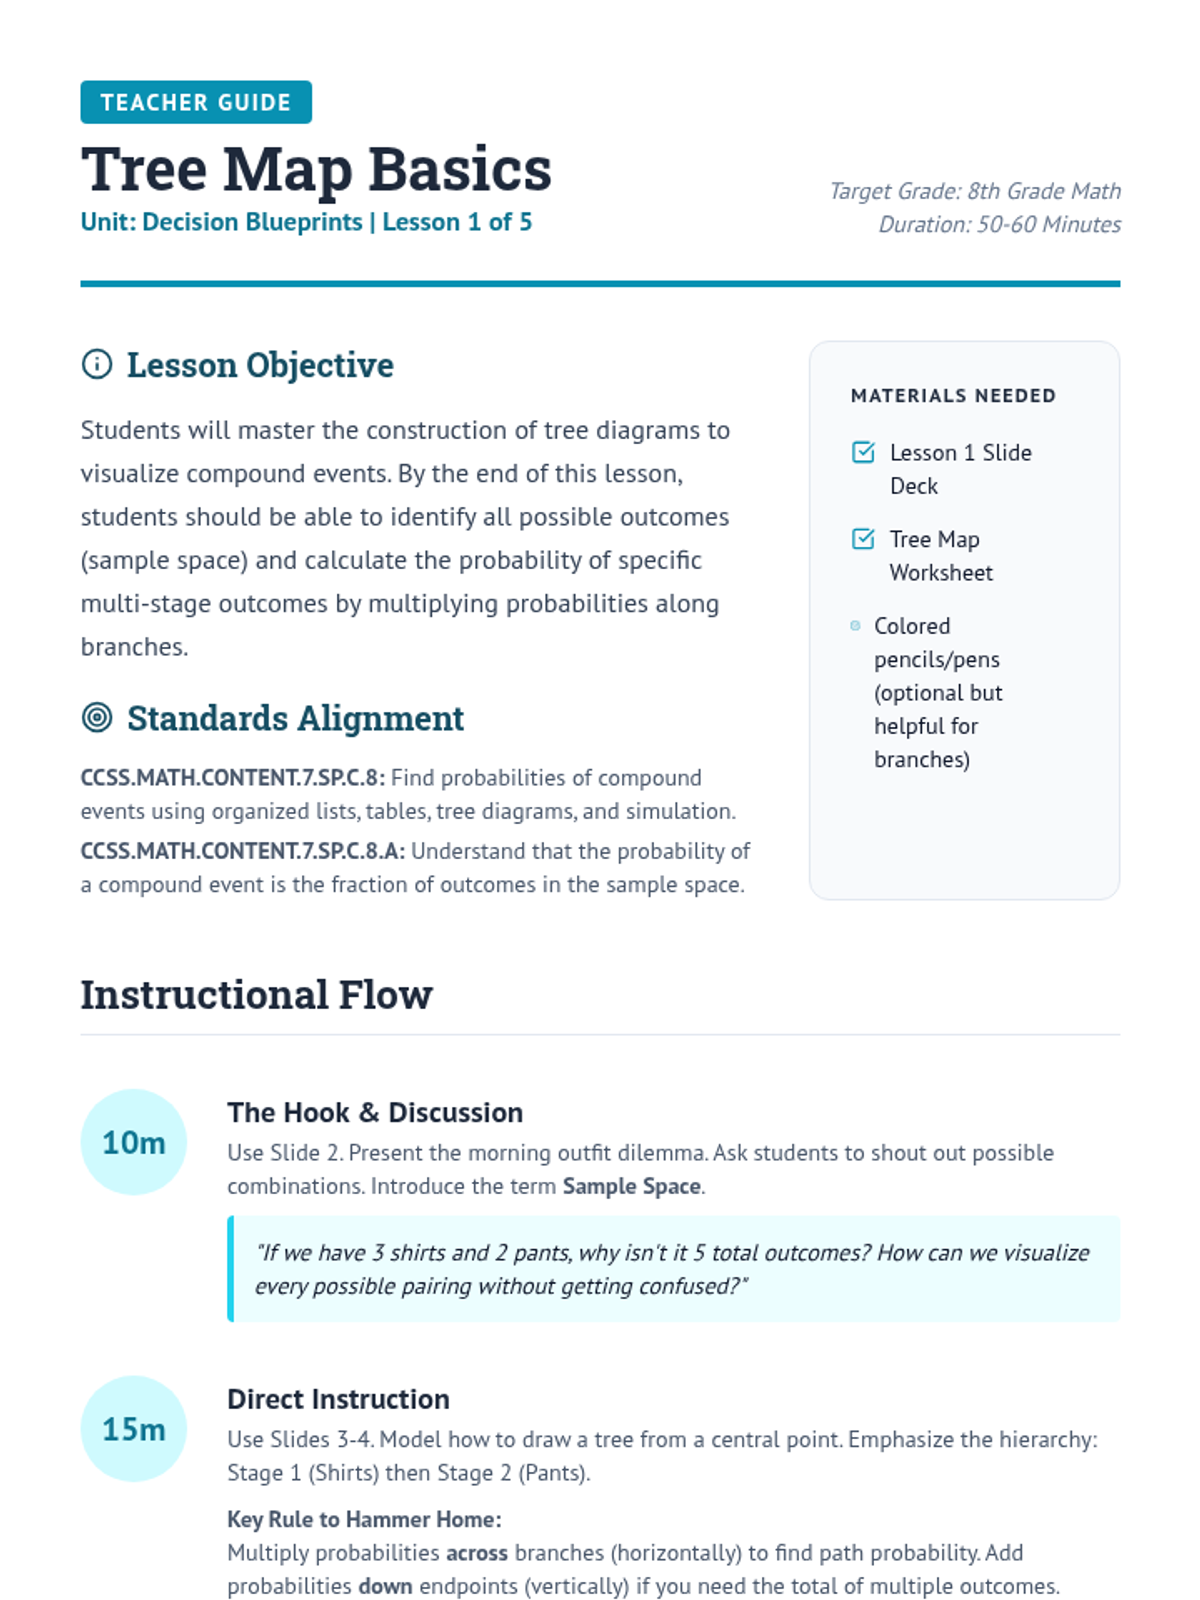
Students review how to draw tree diagrams for compound probability events, listing full sample spaces and calculating endpoint probabilities.
Teams design fair and unfair games, proving their long-term profitability using mathematical models.
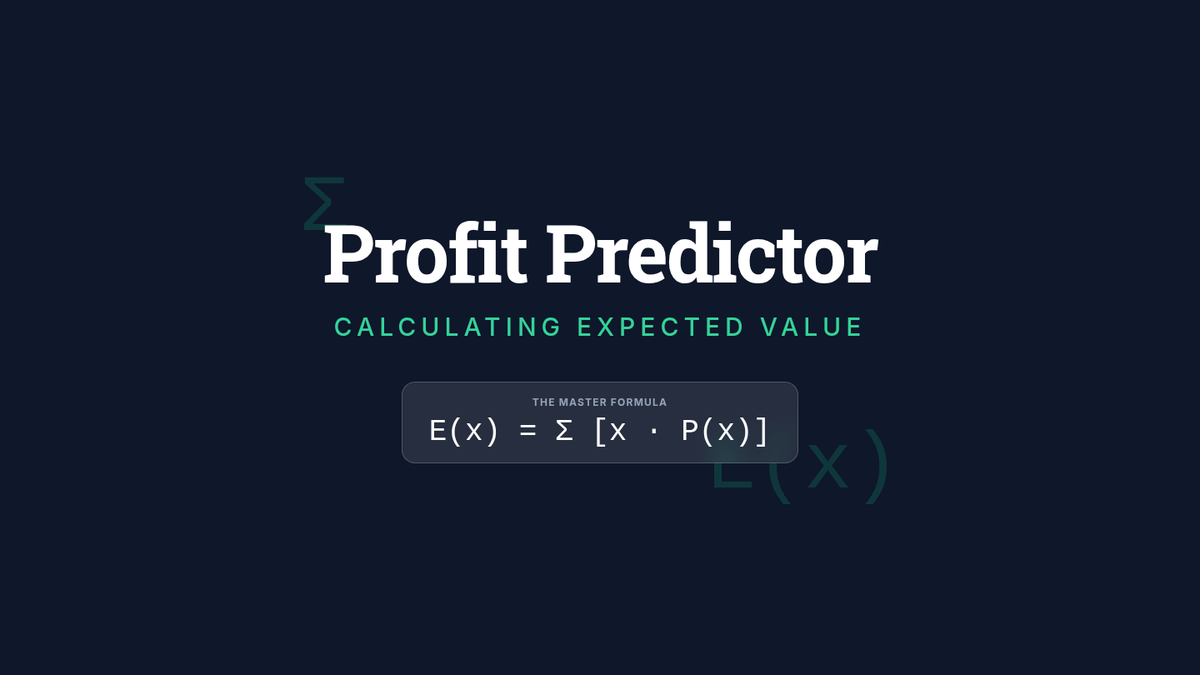
Formalization of the Expected Value formula E(x) = Σ [x * P(x)] through real-world case studies like lottery tickets.
Students learn to assign numerical values to outcomes and calculate weighted averages to quantify potential gains and losses.
Students compare experimental and theoretical probability by playing carnival-style games, discovering the Law of Large Numbers.
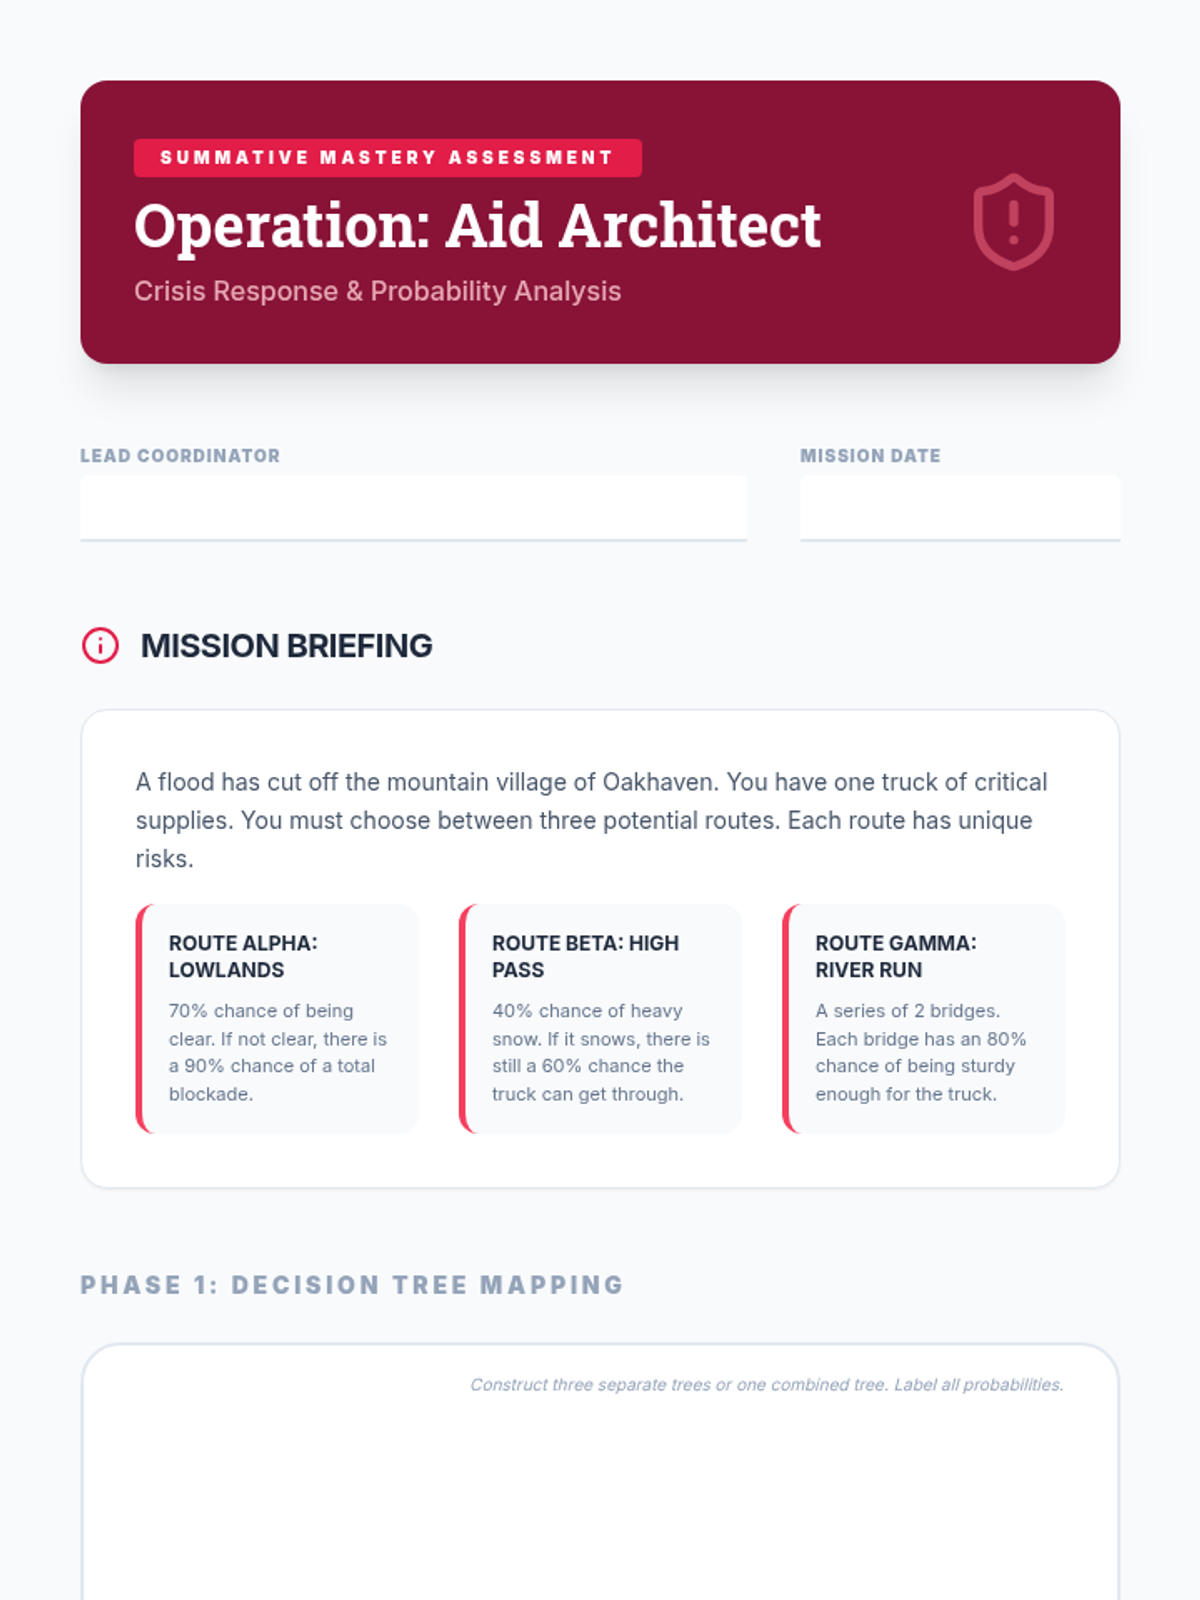
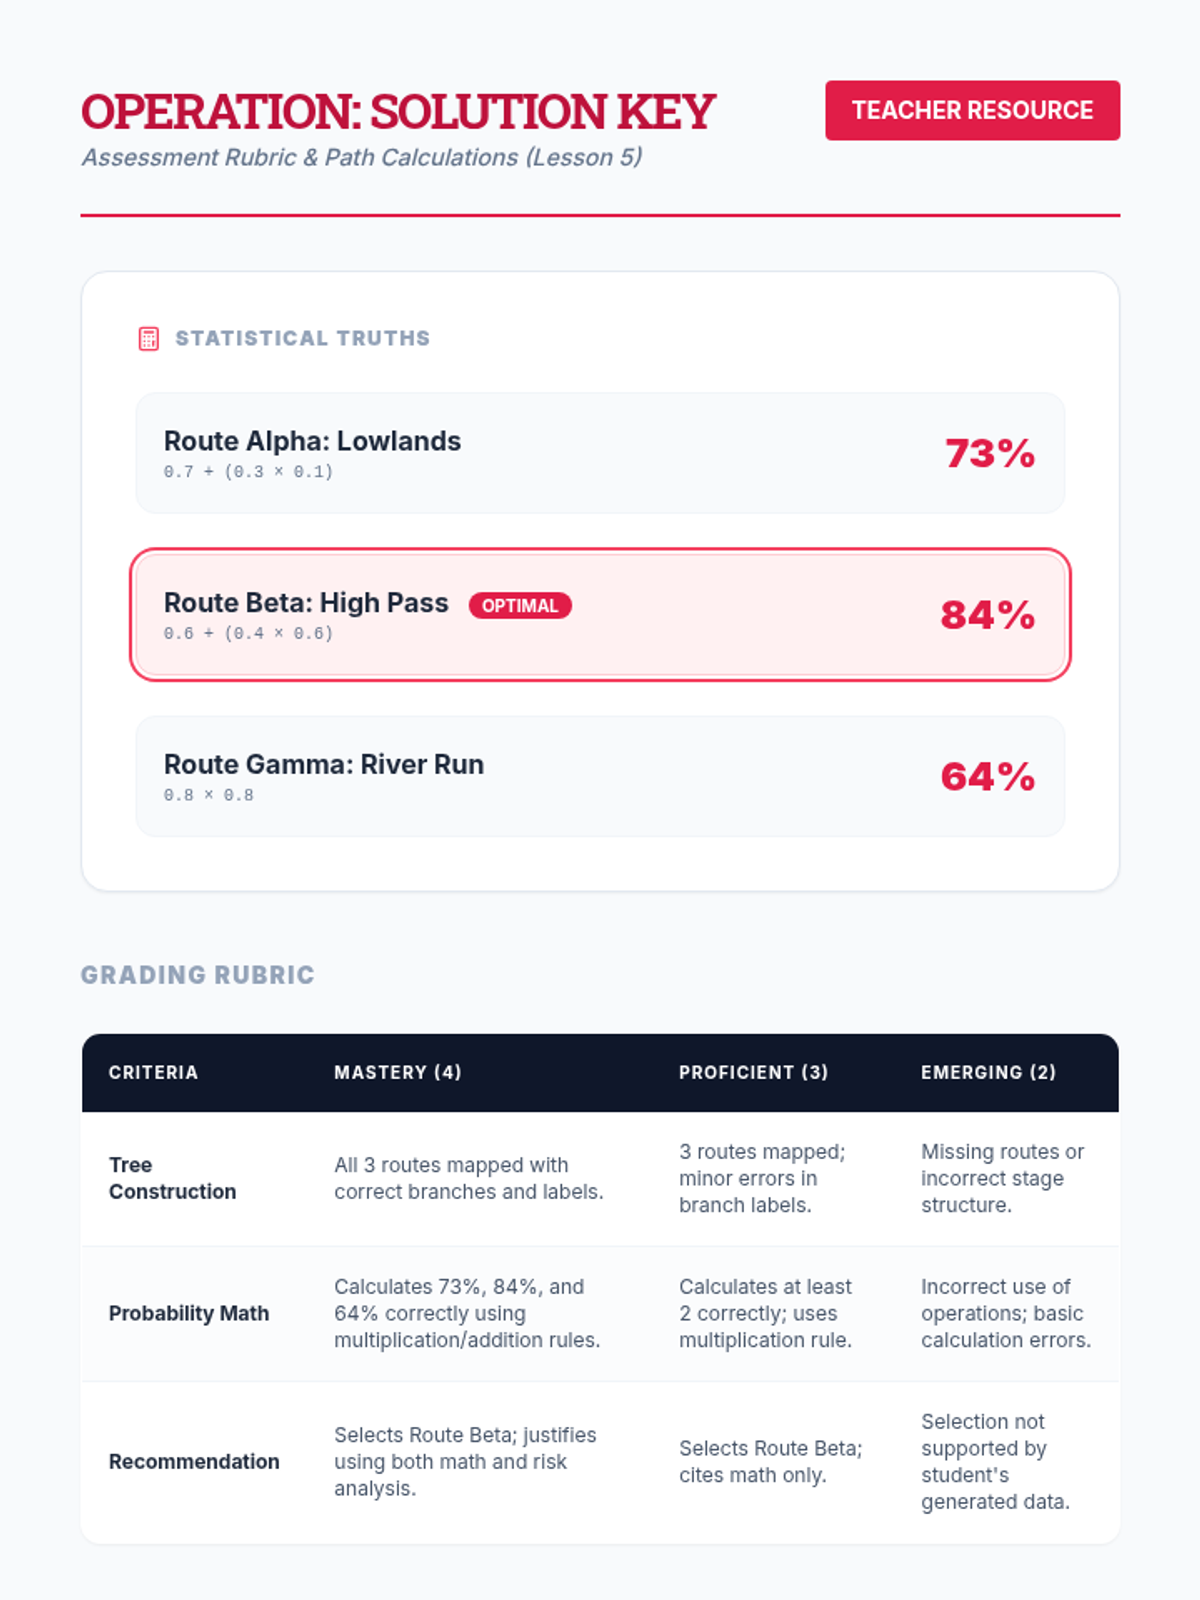
In a culminating assessment, students are given a complex scenario with three different decision paths. They must construct a tree, calculate probabilities for success for each path, and write a recommendation.
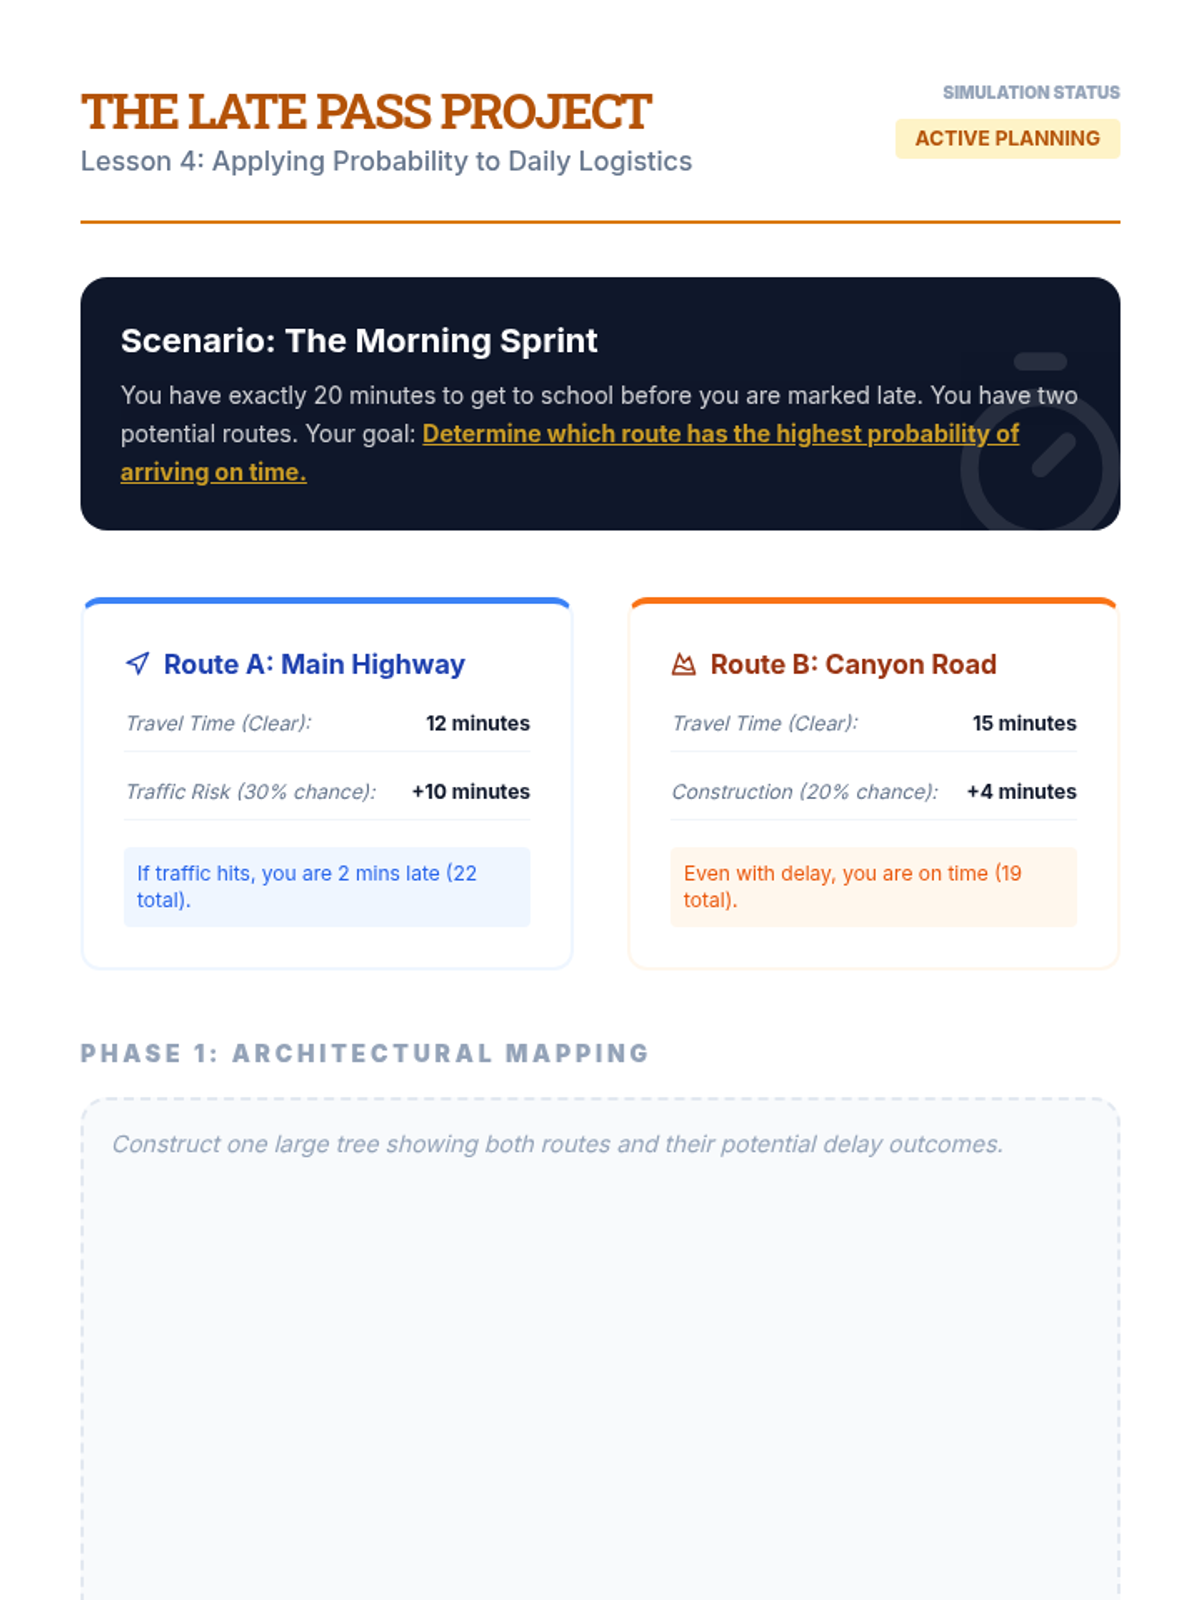
Students apply their skills to a real-world scenario, such as choosing a route to school based on traffic lights and train crossings. They map the probabilities of delays to choose the most efficient path.
Students move from counting branches to calculating probabilities along the branches using multiplication. They determine the likelihood of specific paths (e.g., outcome A then outcome B).
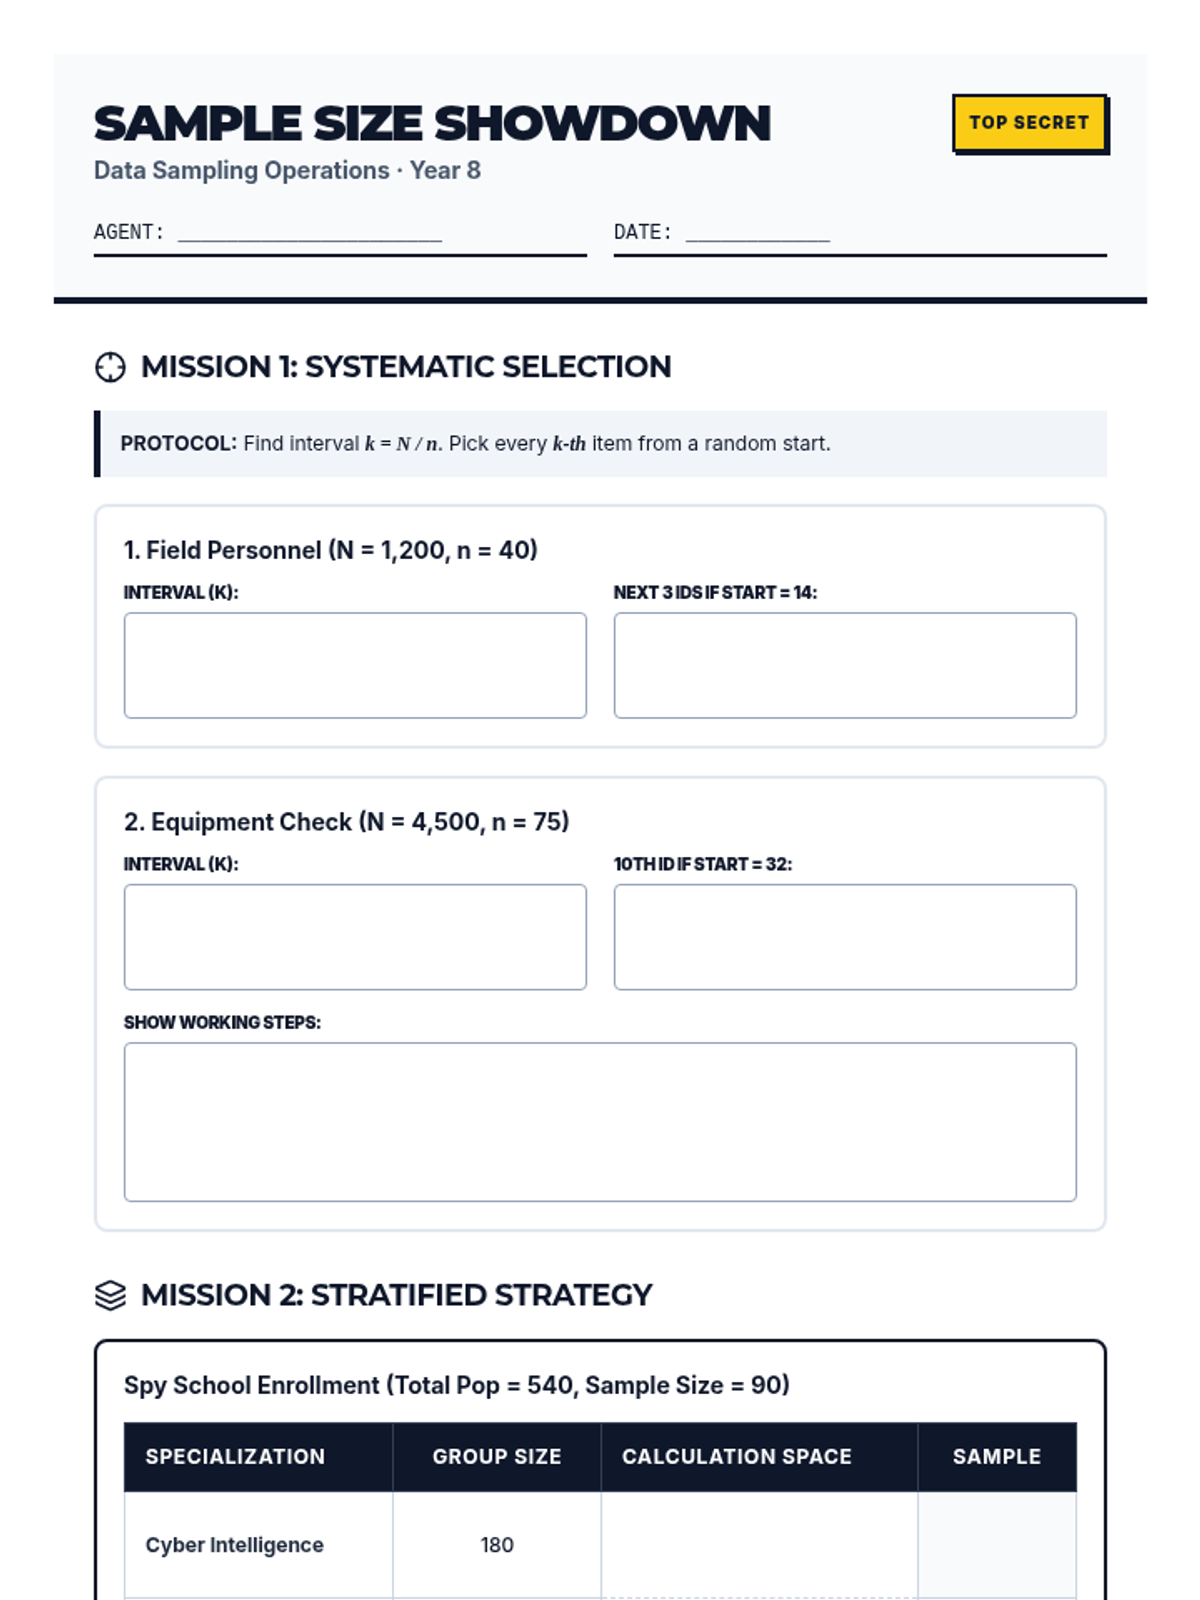
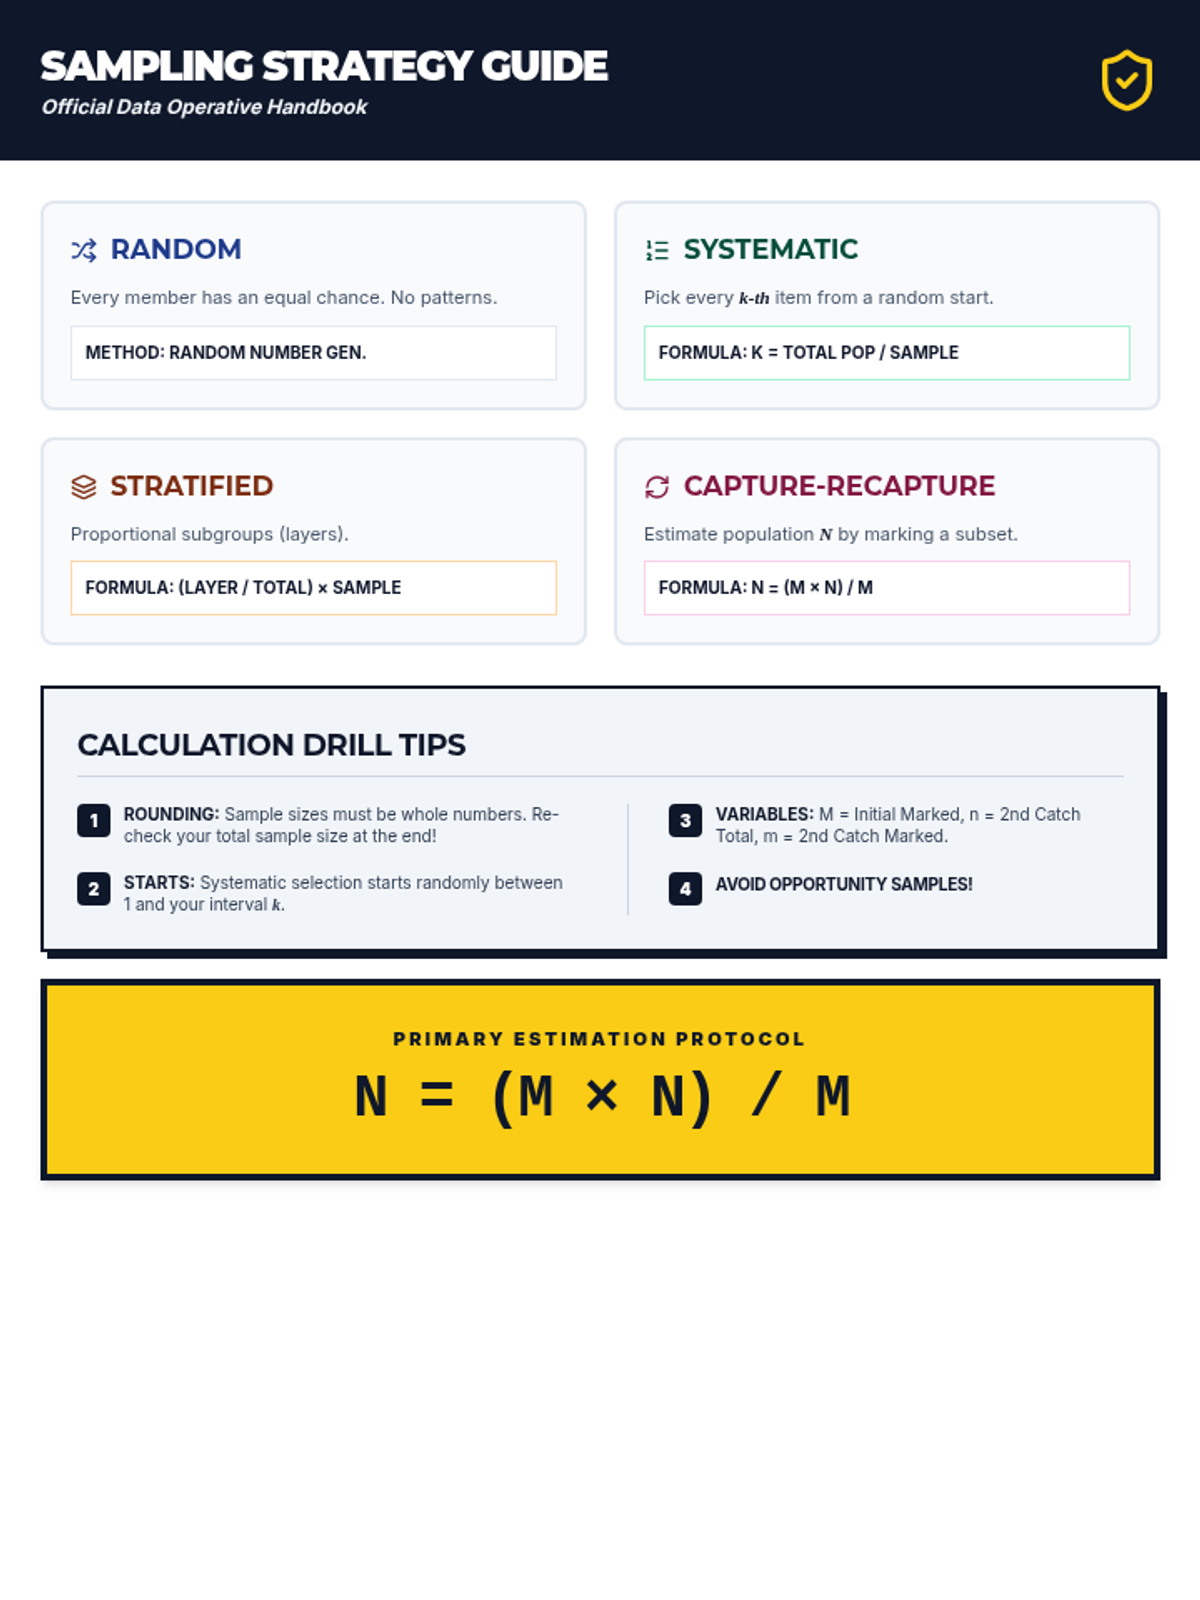
A comprehensive introduction to data sampling methods for Year 8 students, focusing on the mechanics of systematic, stratified, and capture-recapture calculations through a secret agent lens.
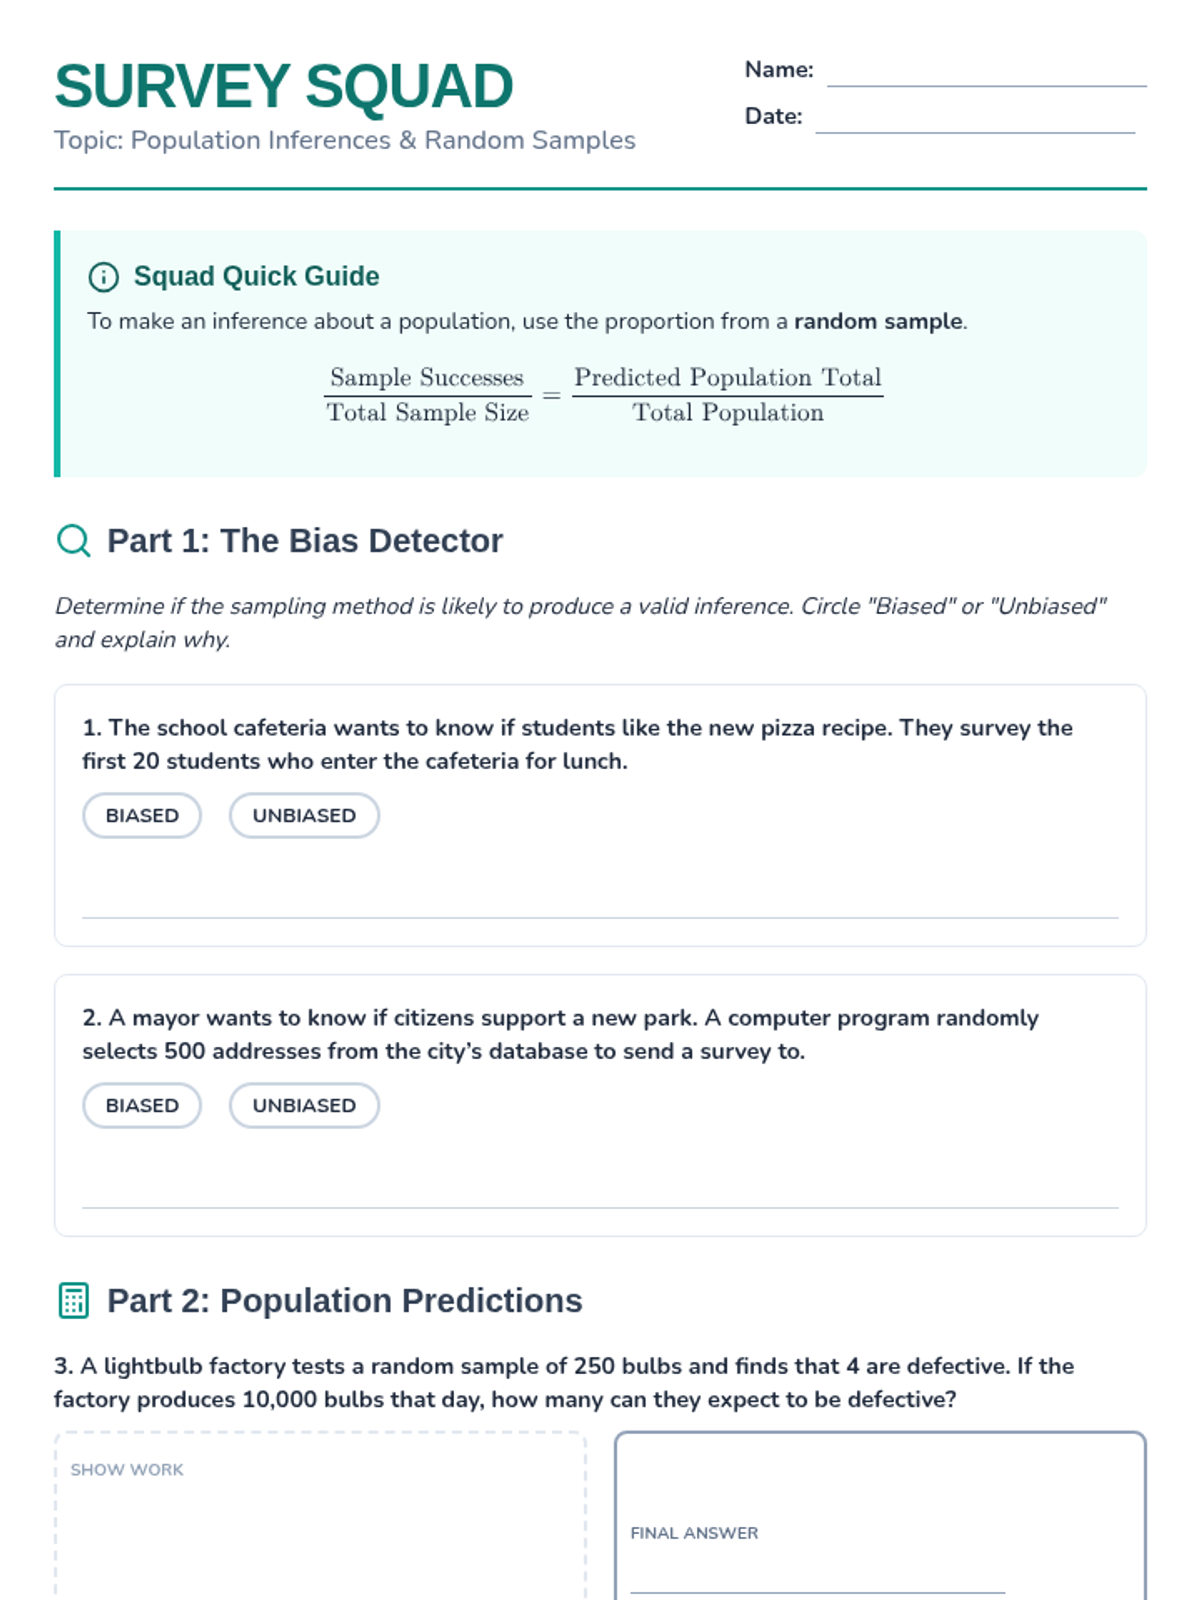
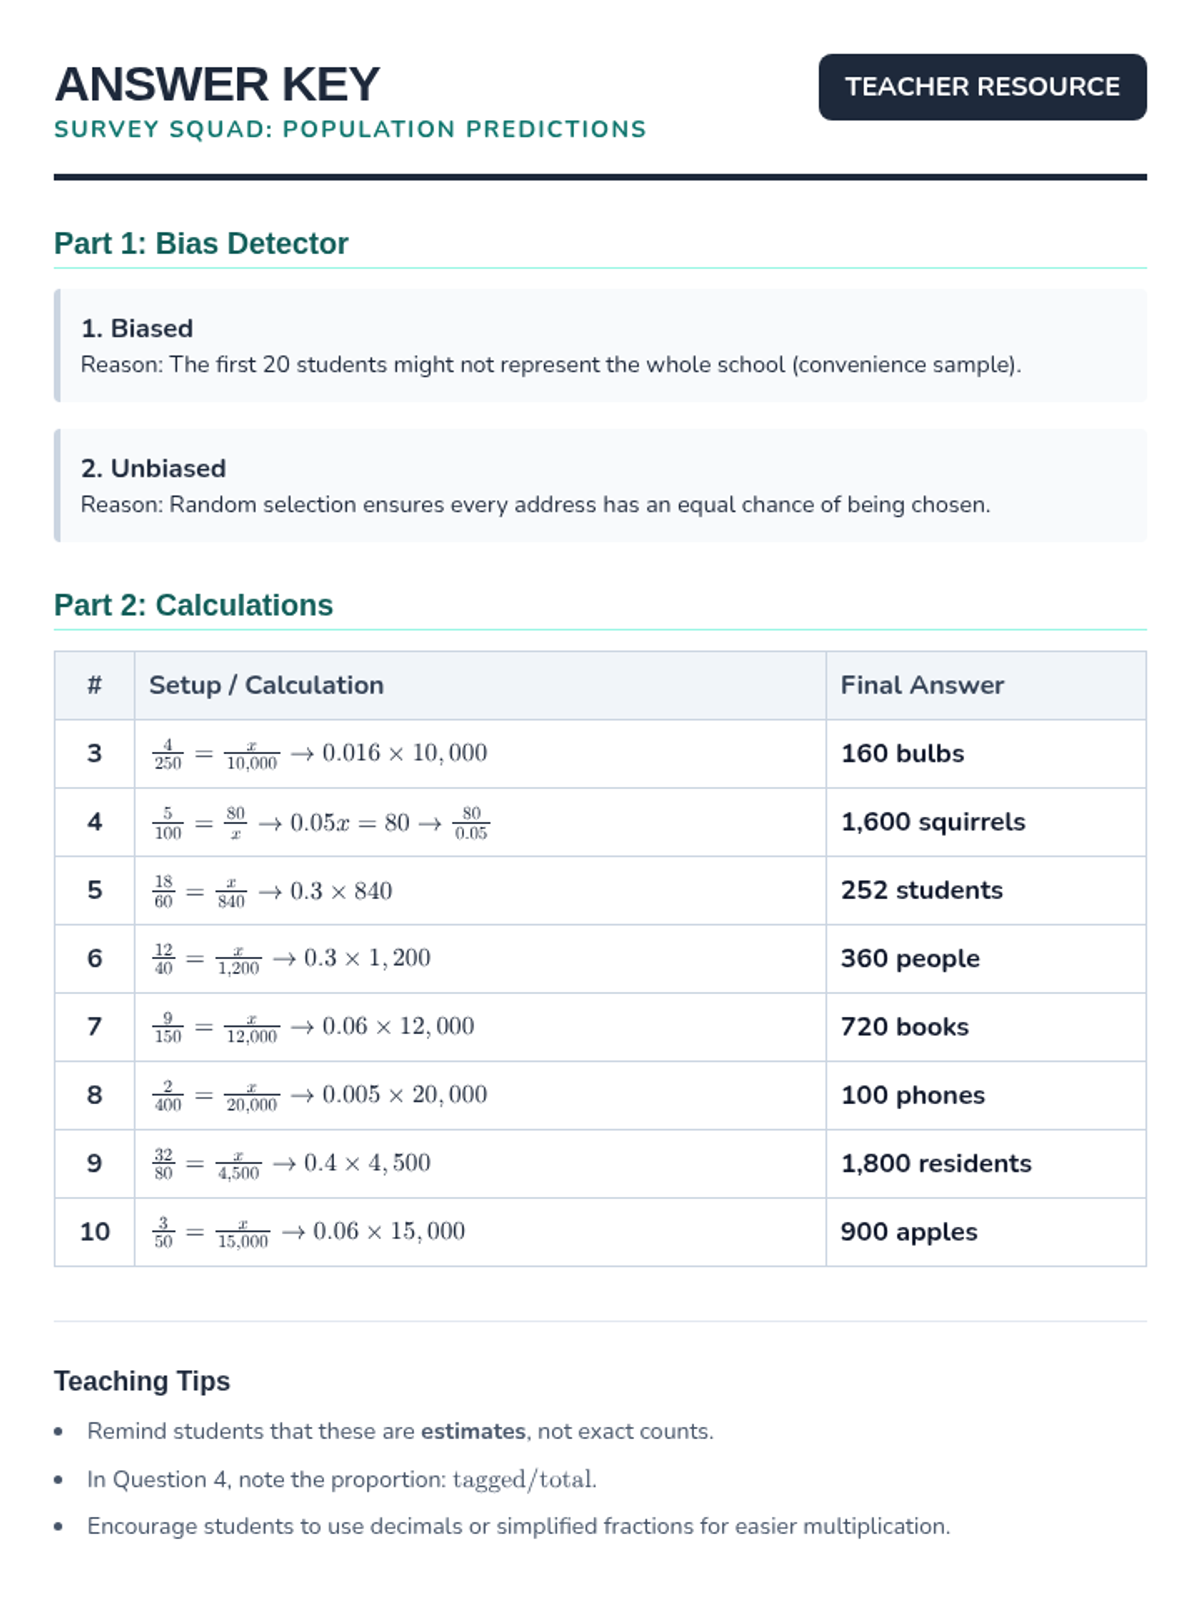
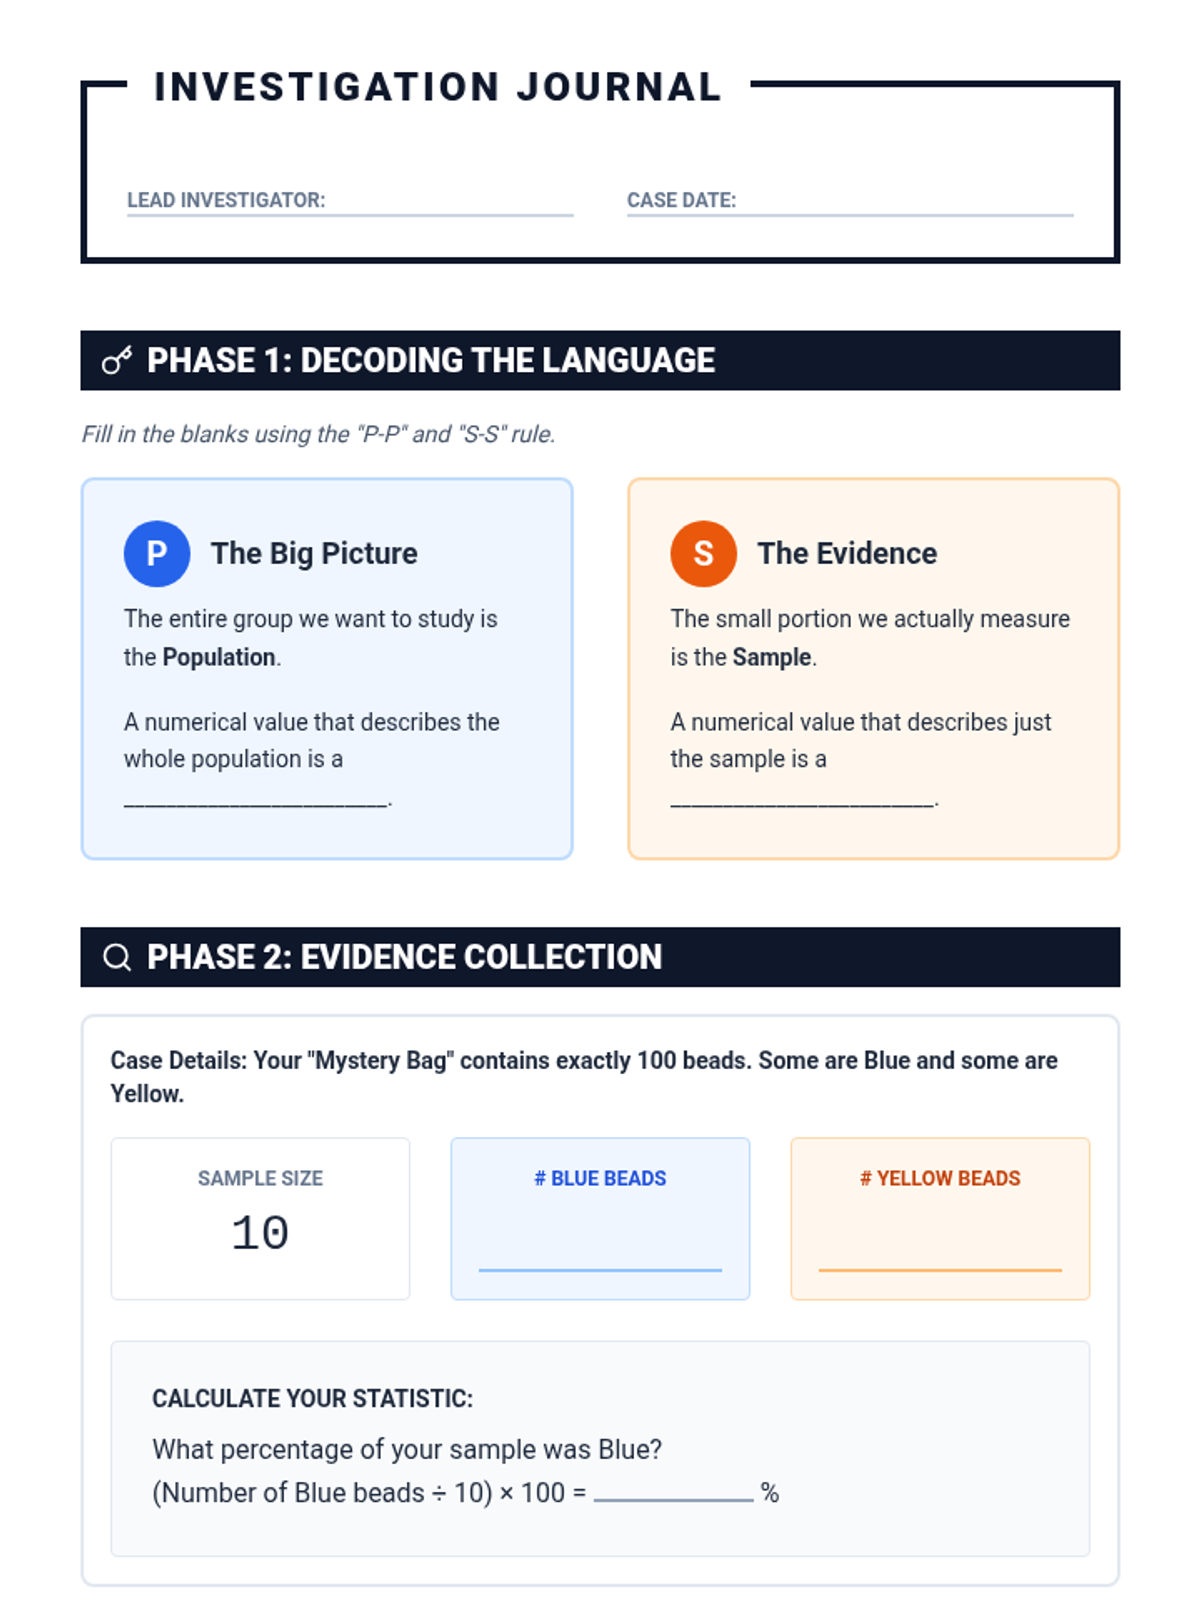
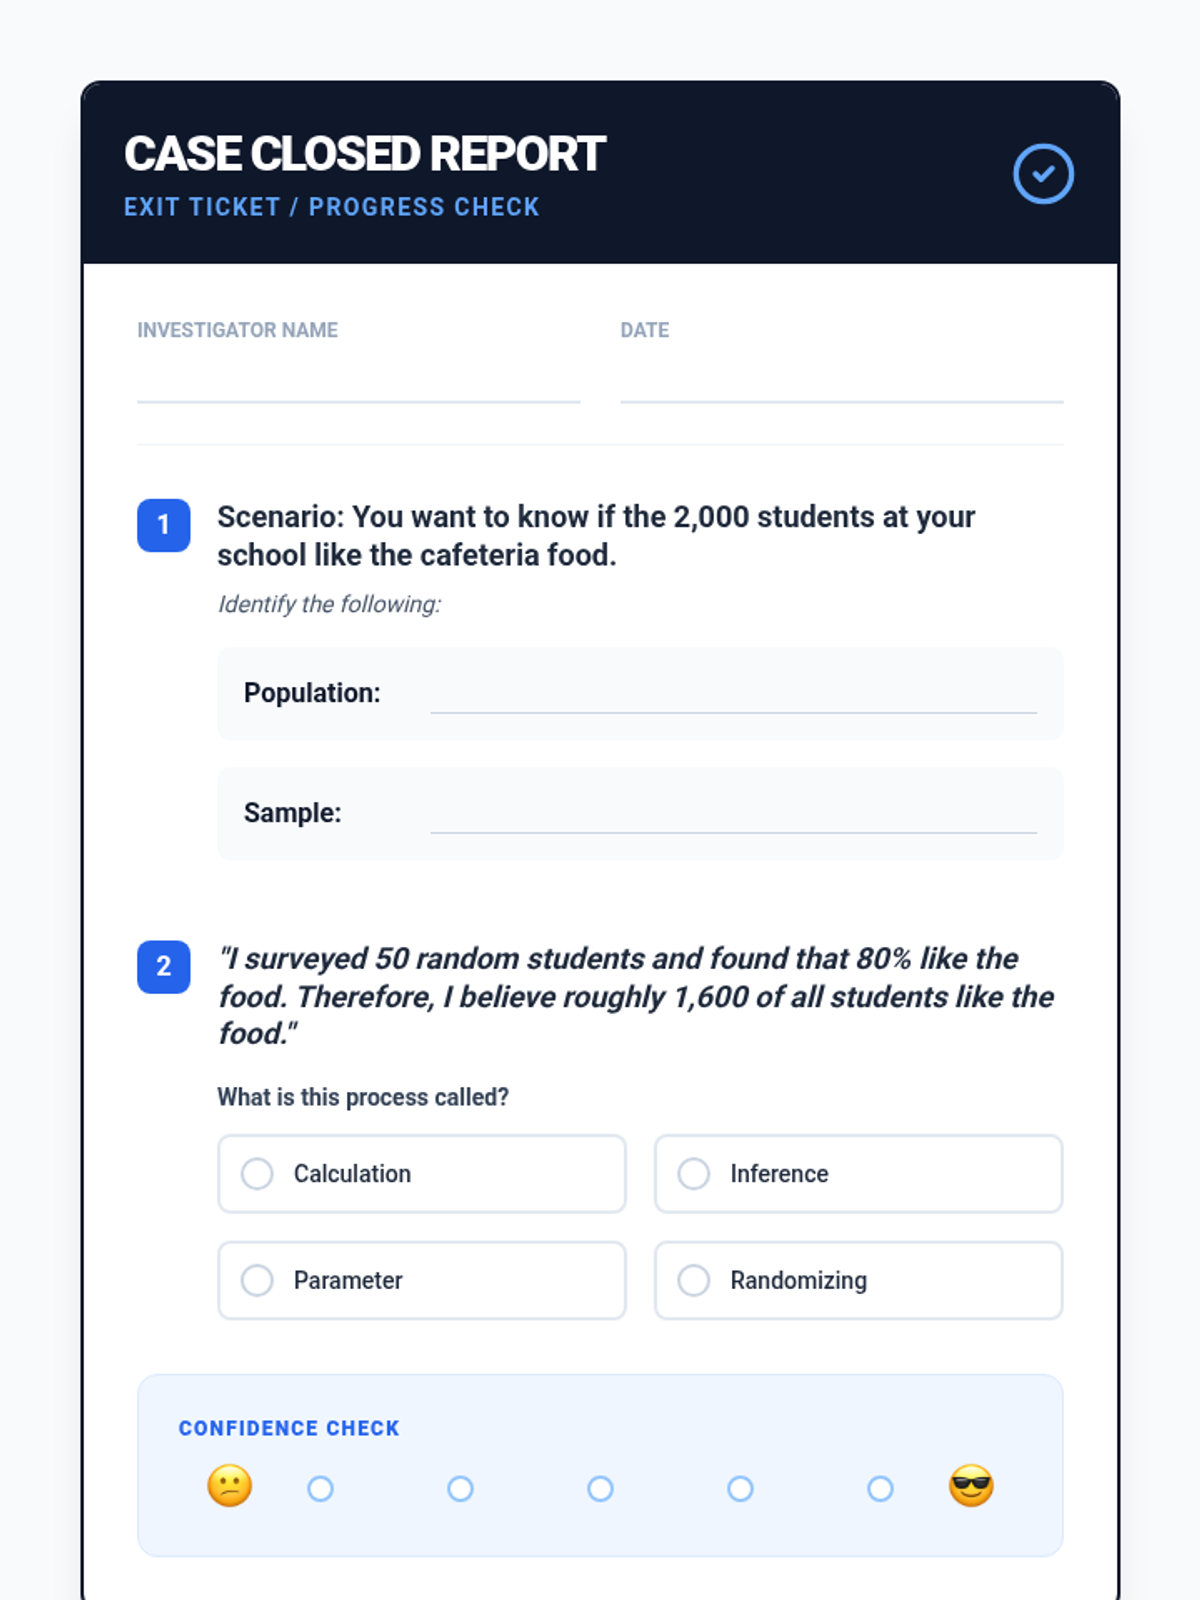
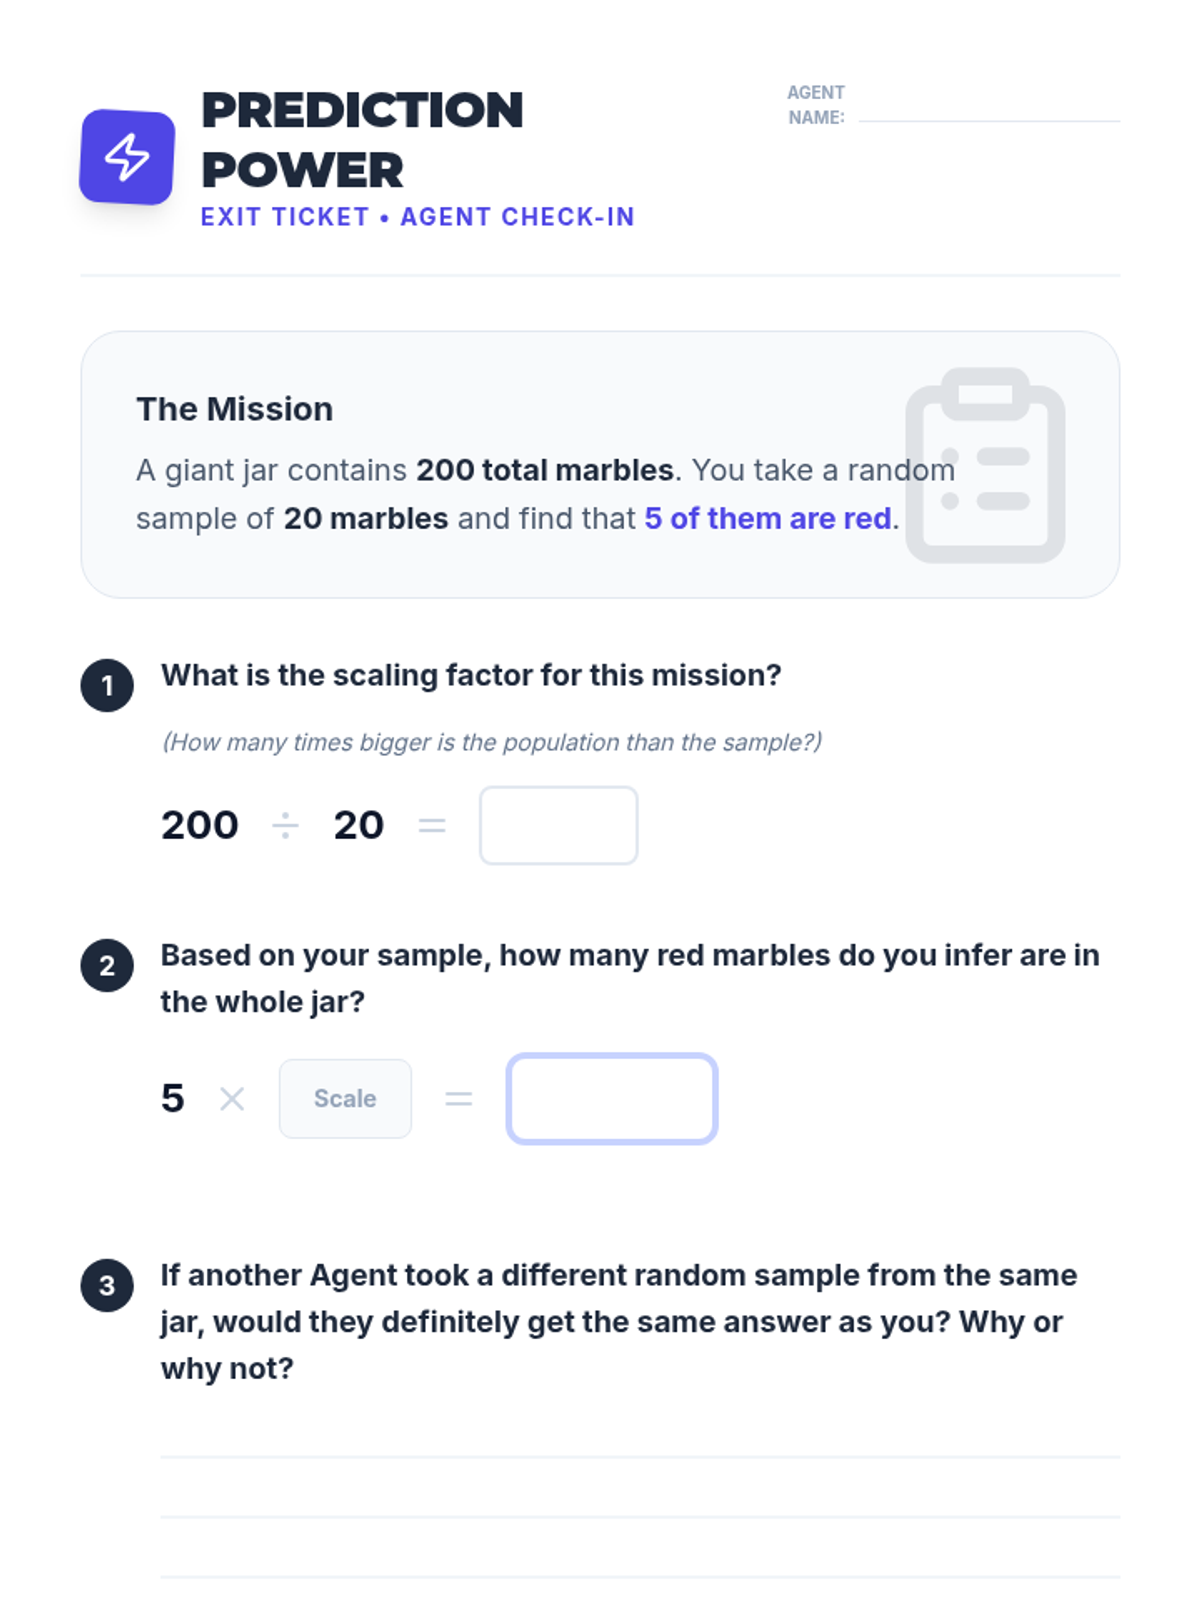
A lesson focused on using random sampling to make valid inferences about populations, including identifying bias and performing calculations.
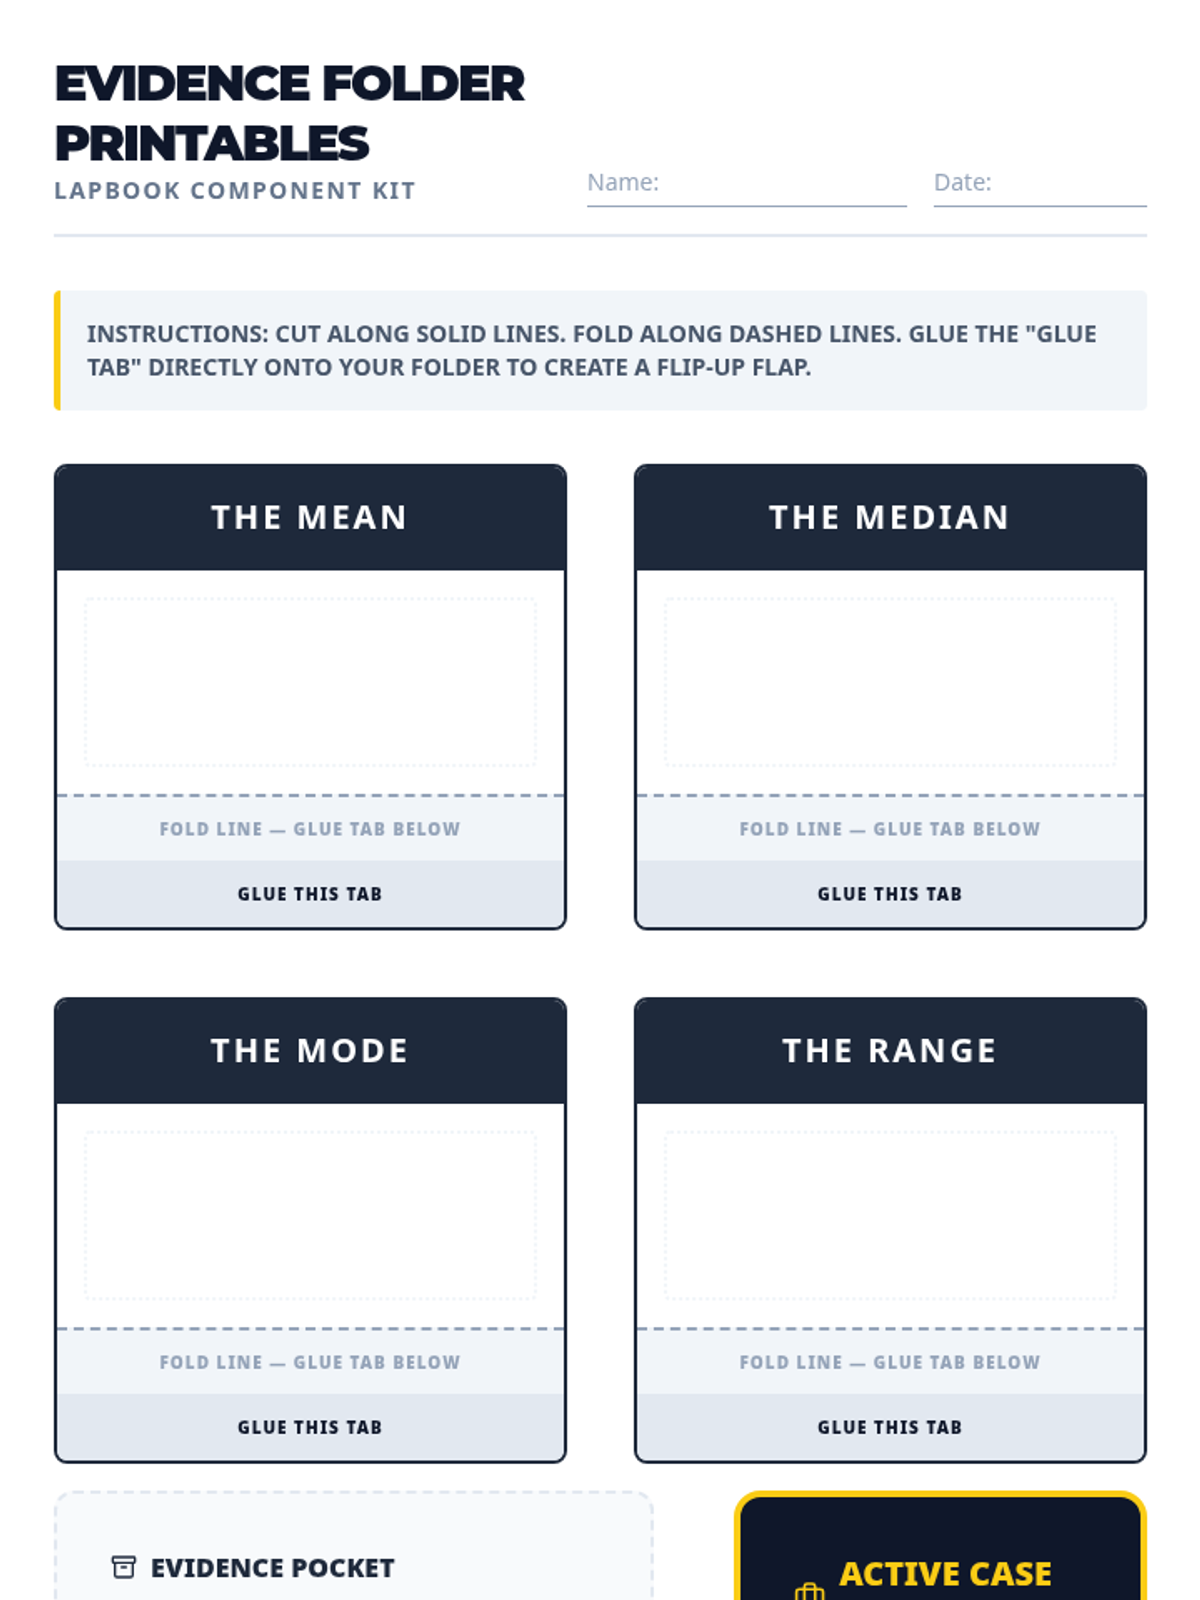
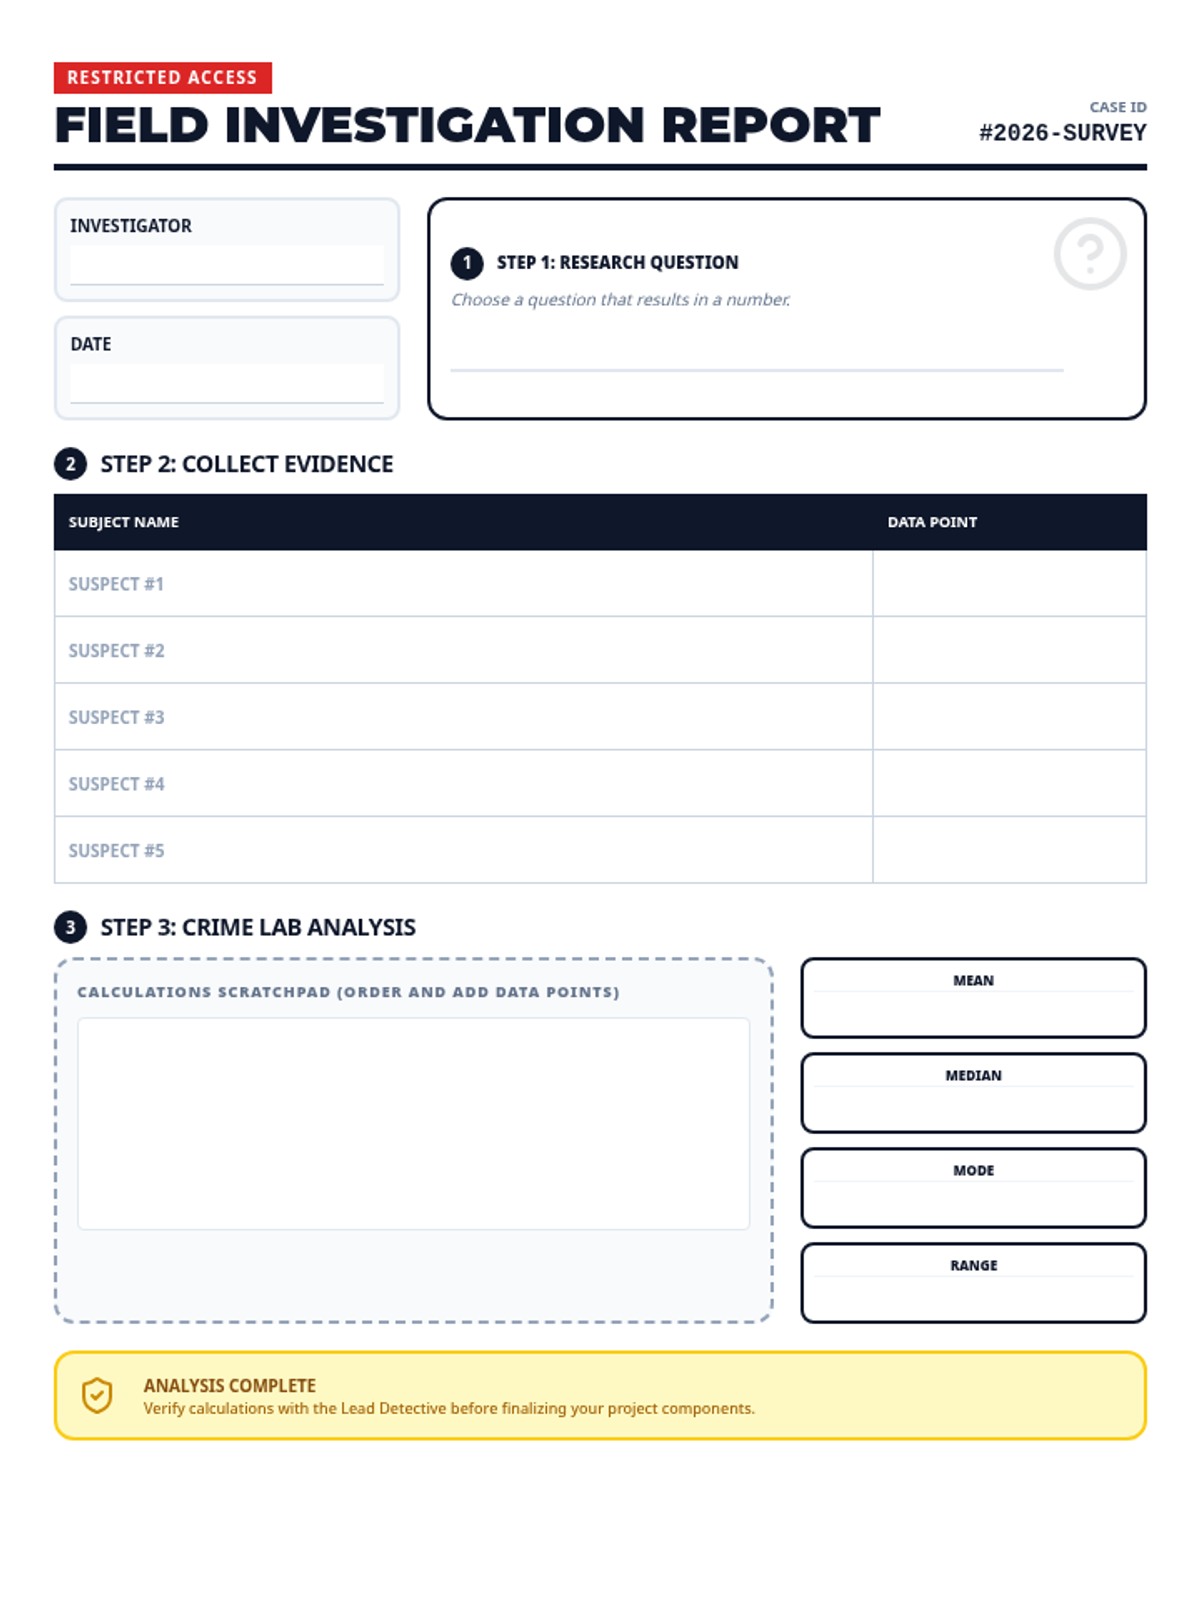
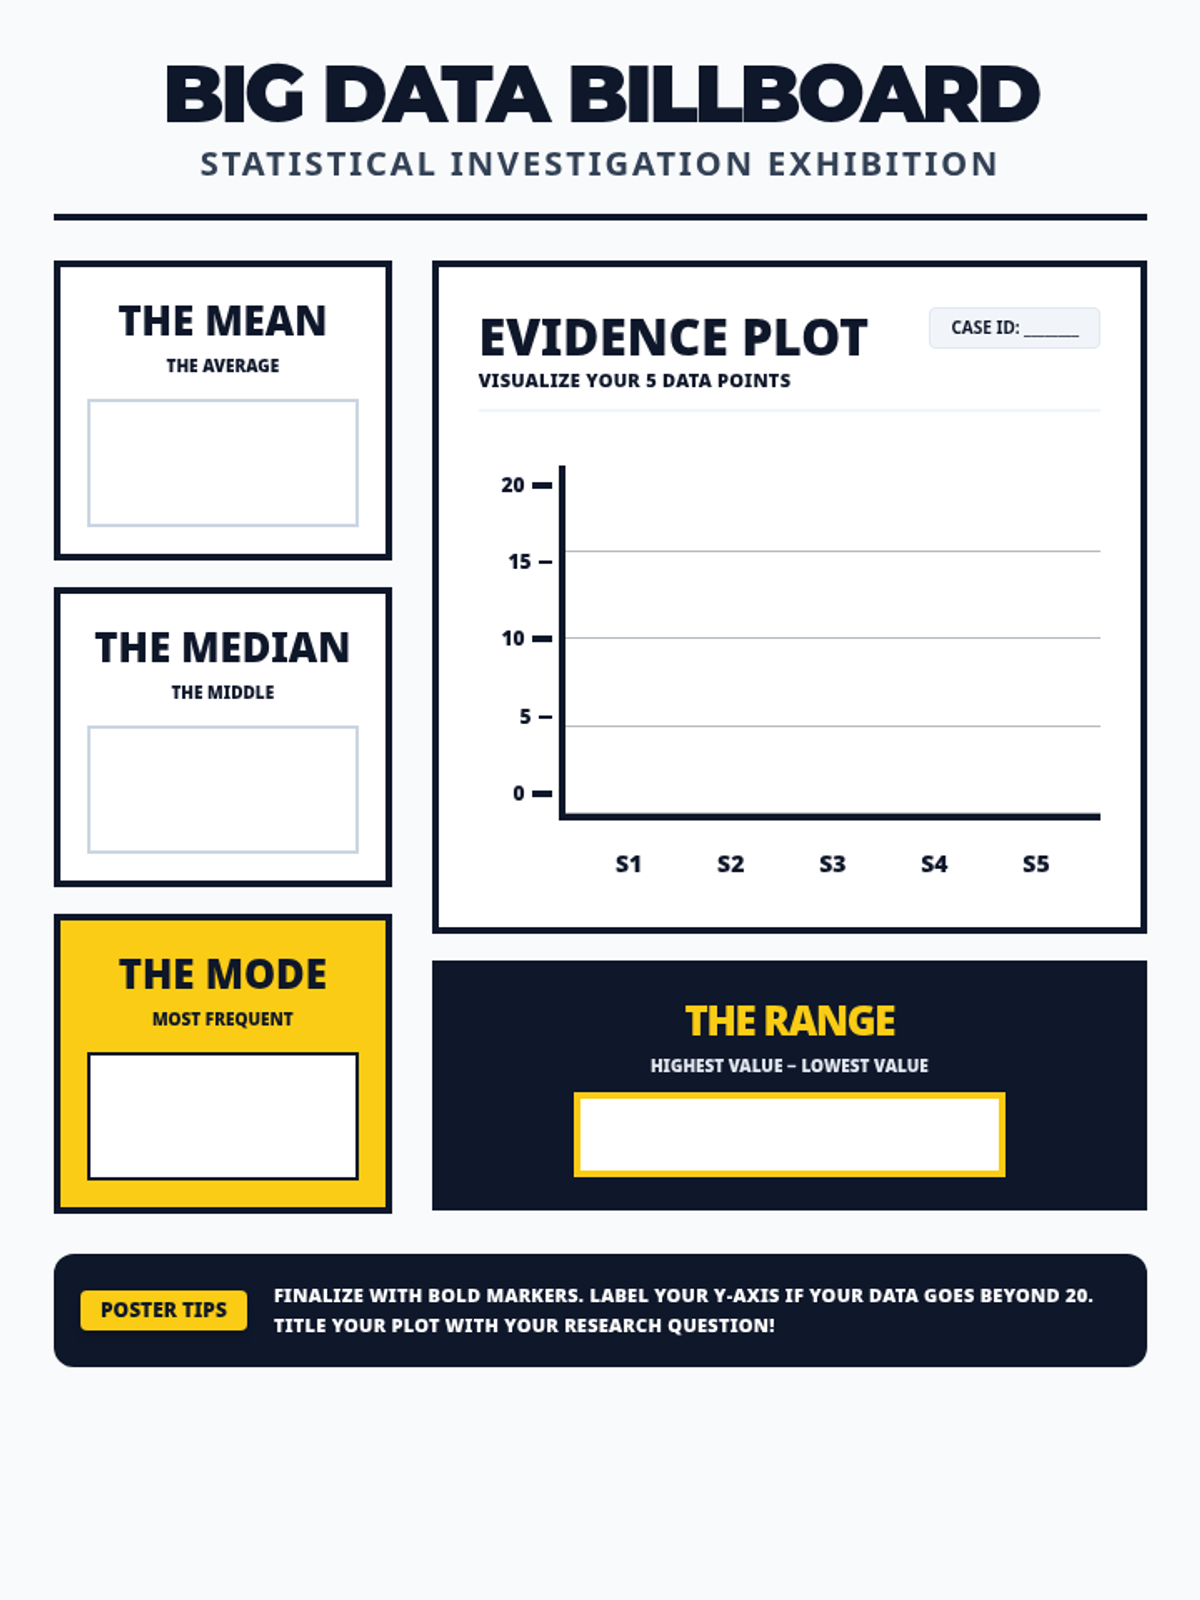
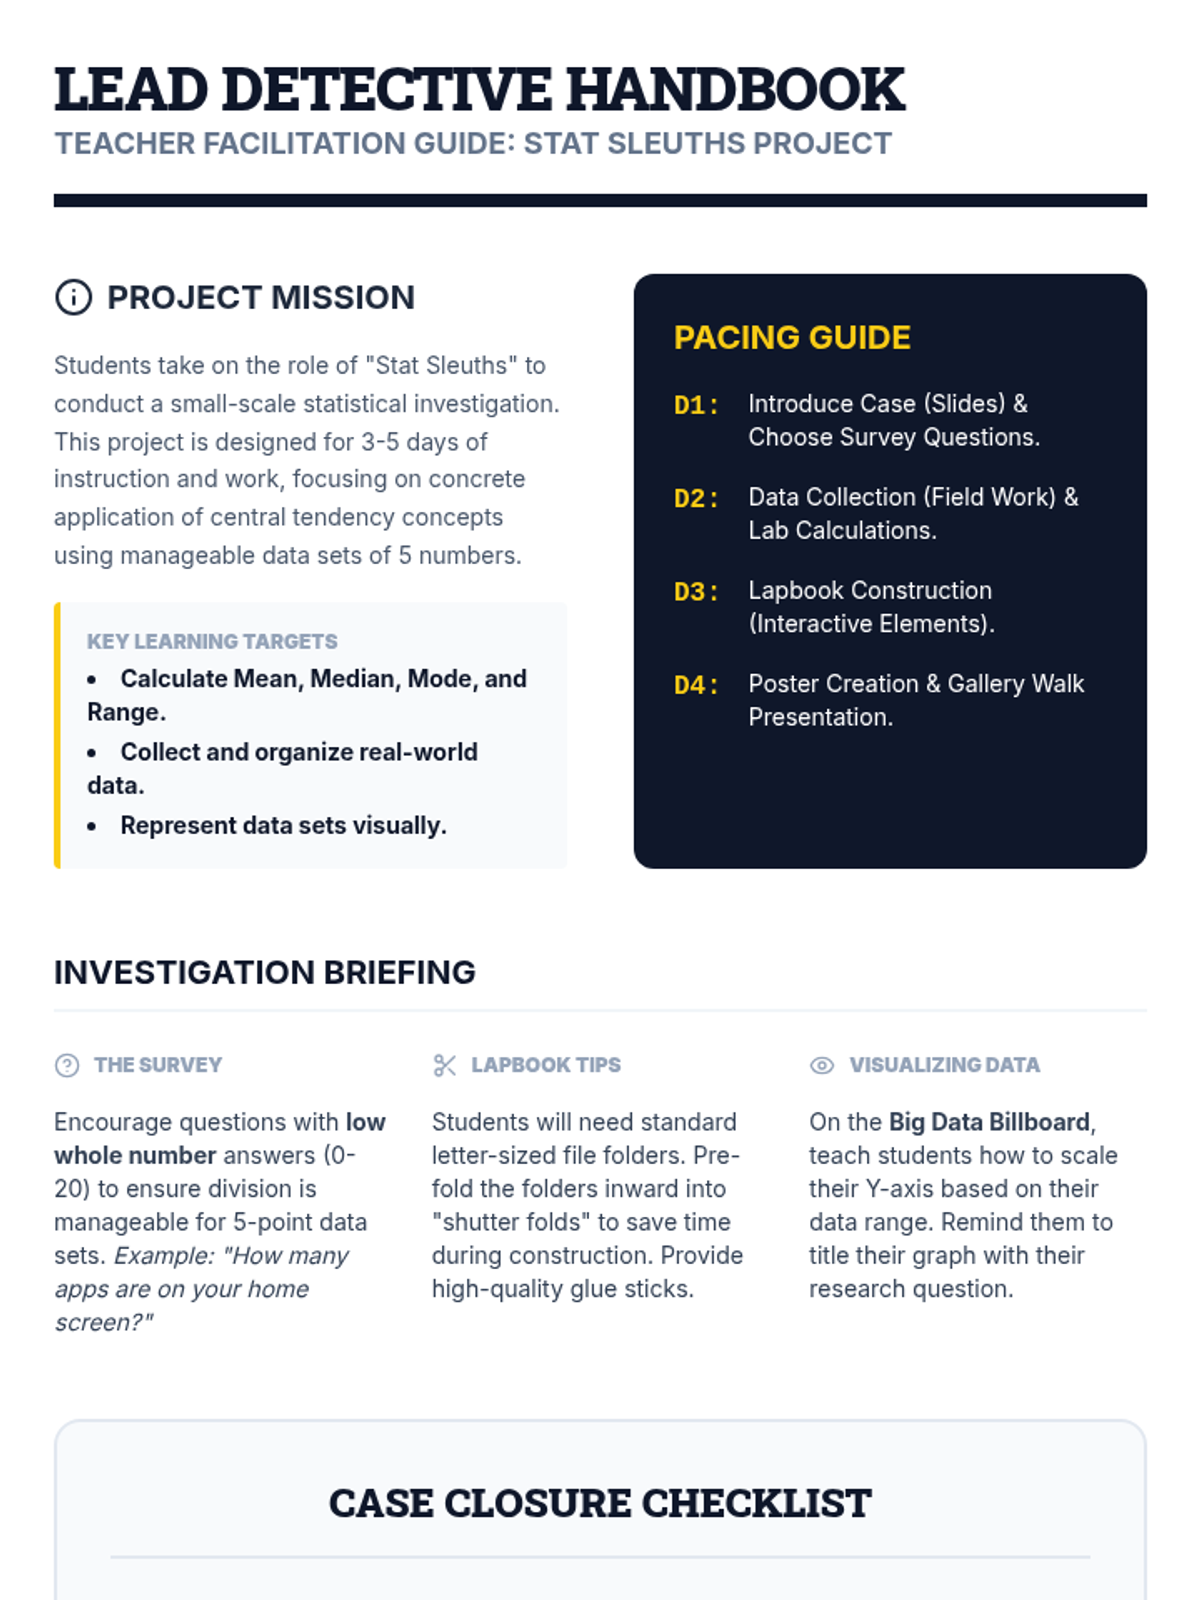
A comprehensive hands-on project where students become 'Stat Sleuths' to collect real-world data, calculate central tendencies, and present their findings through an interactive lapbook and poster.
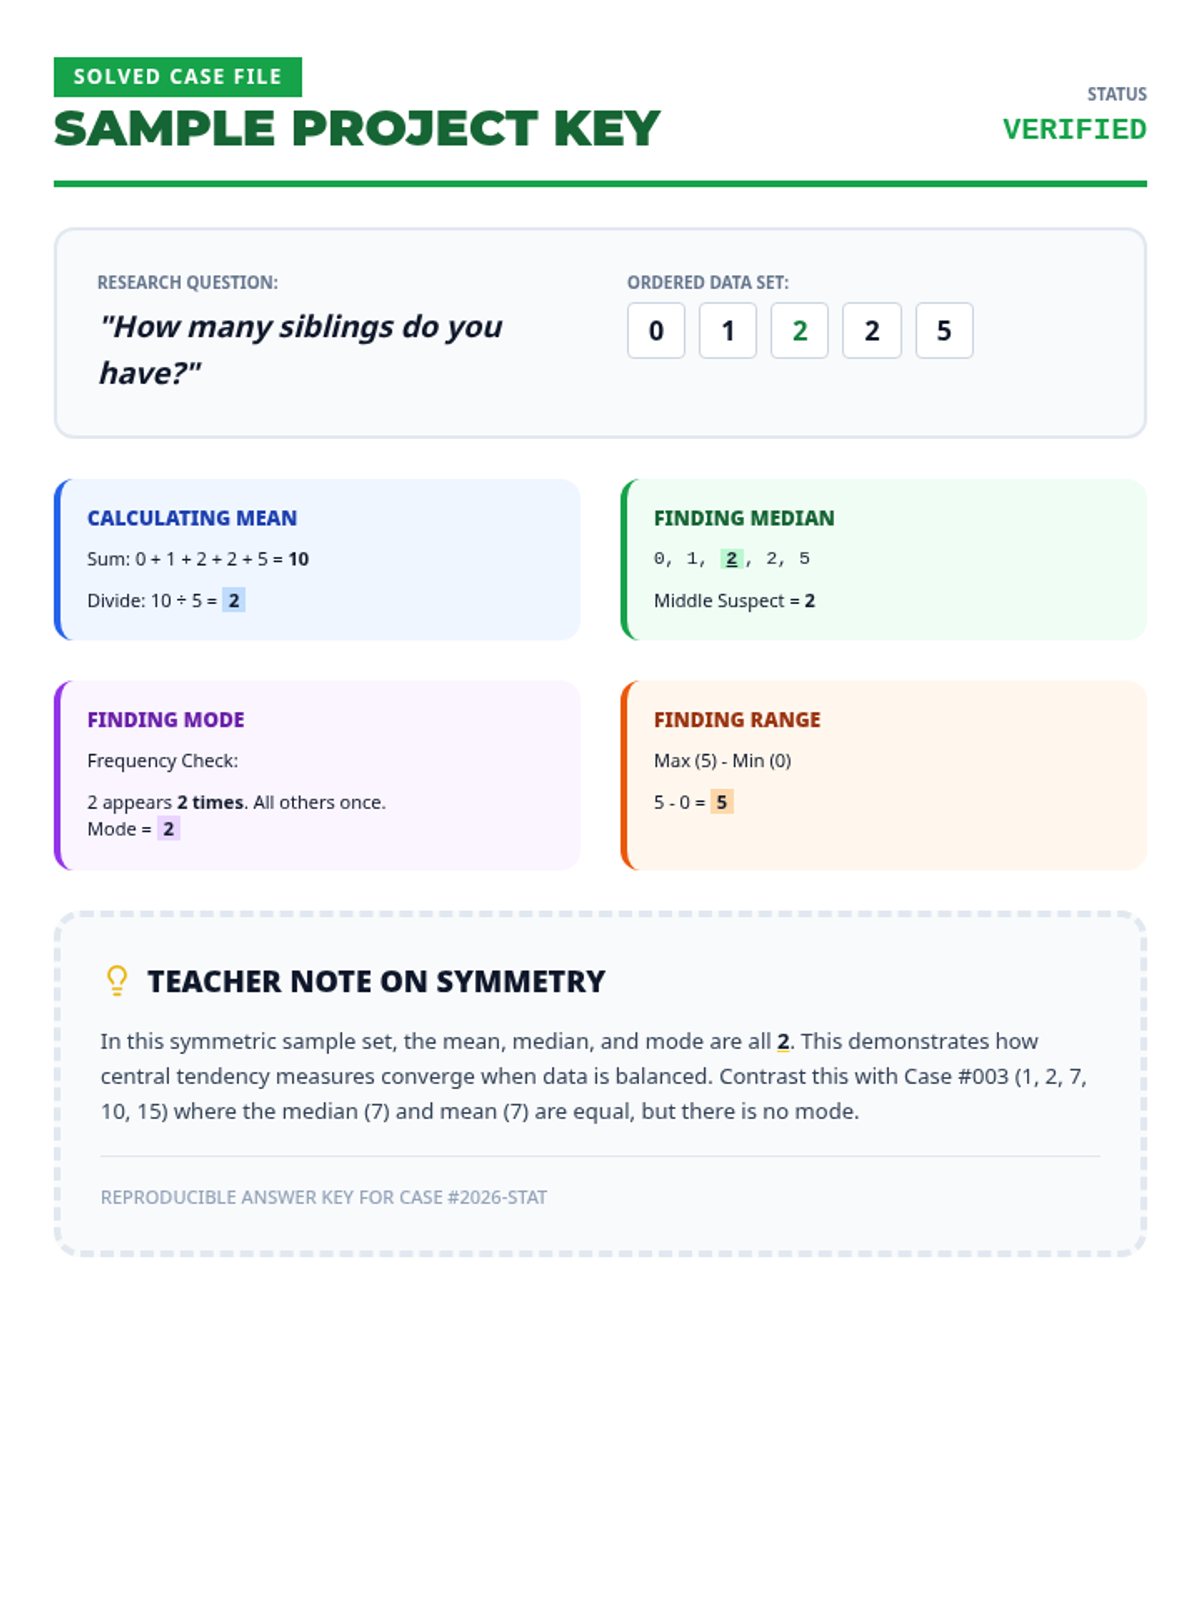
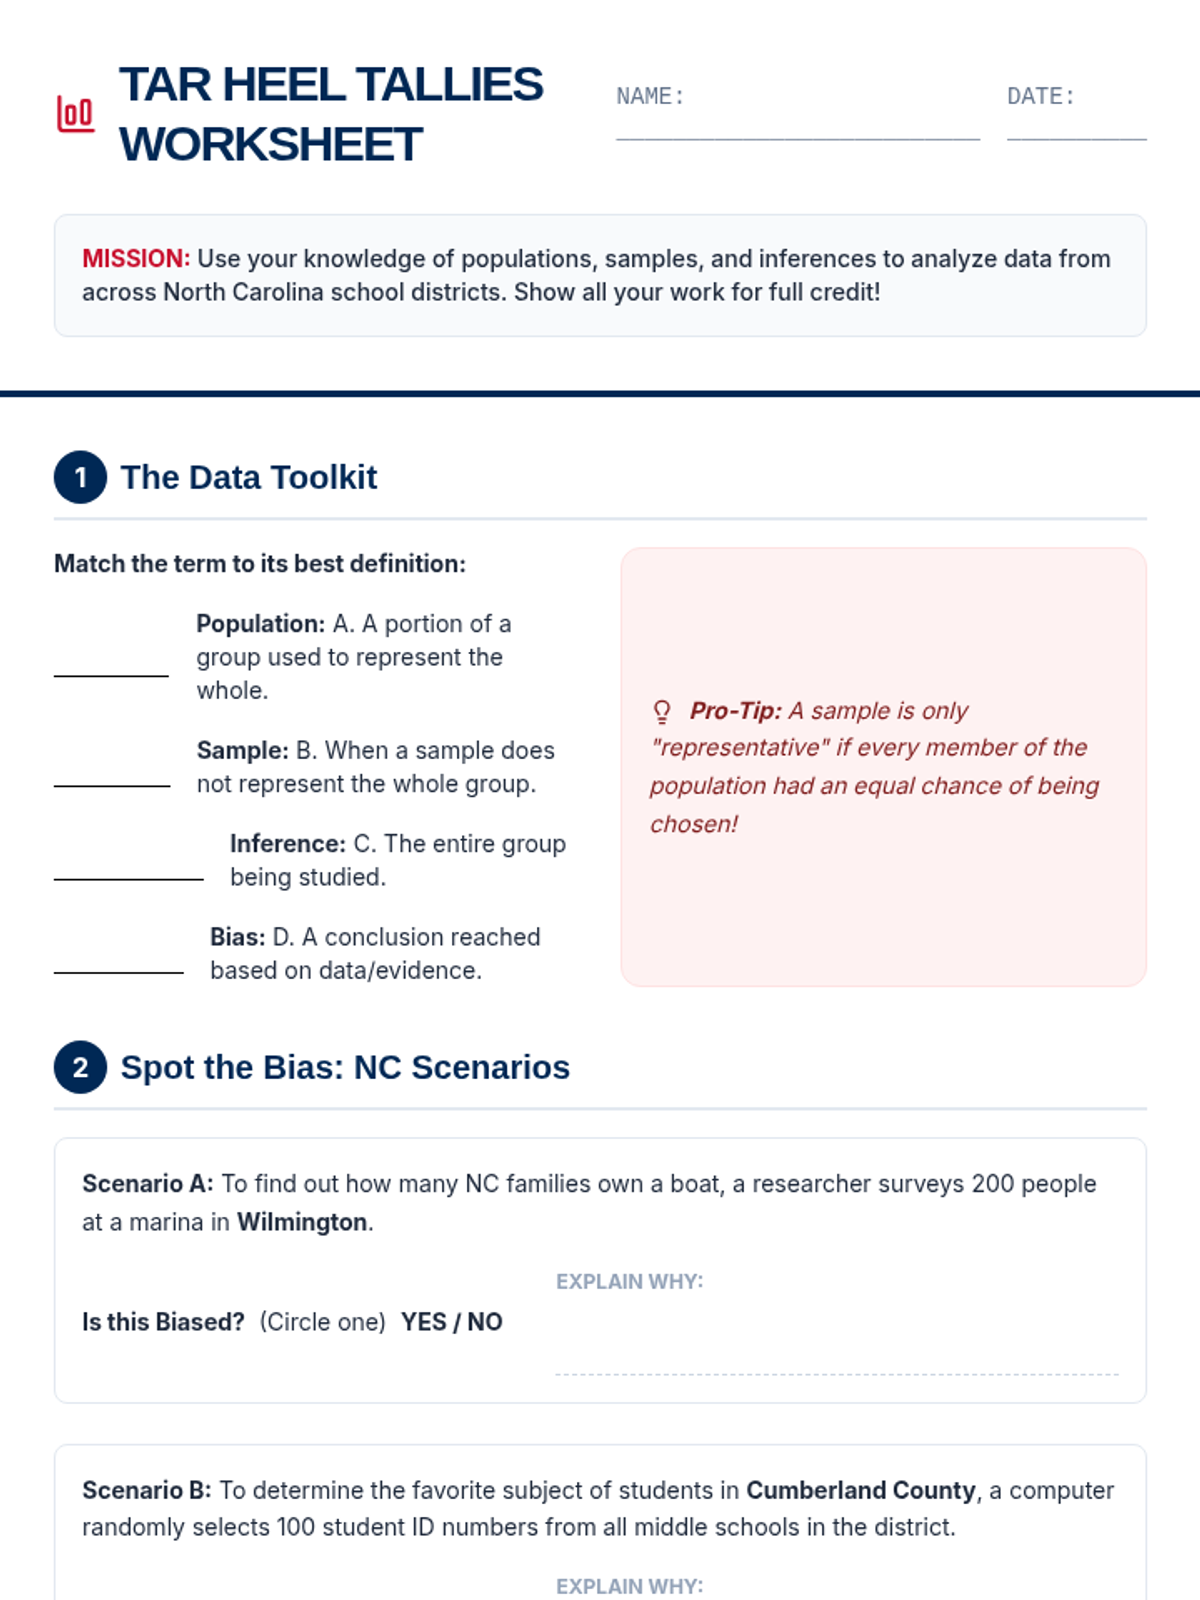
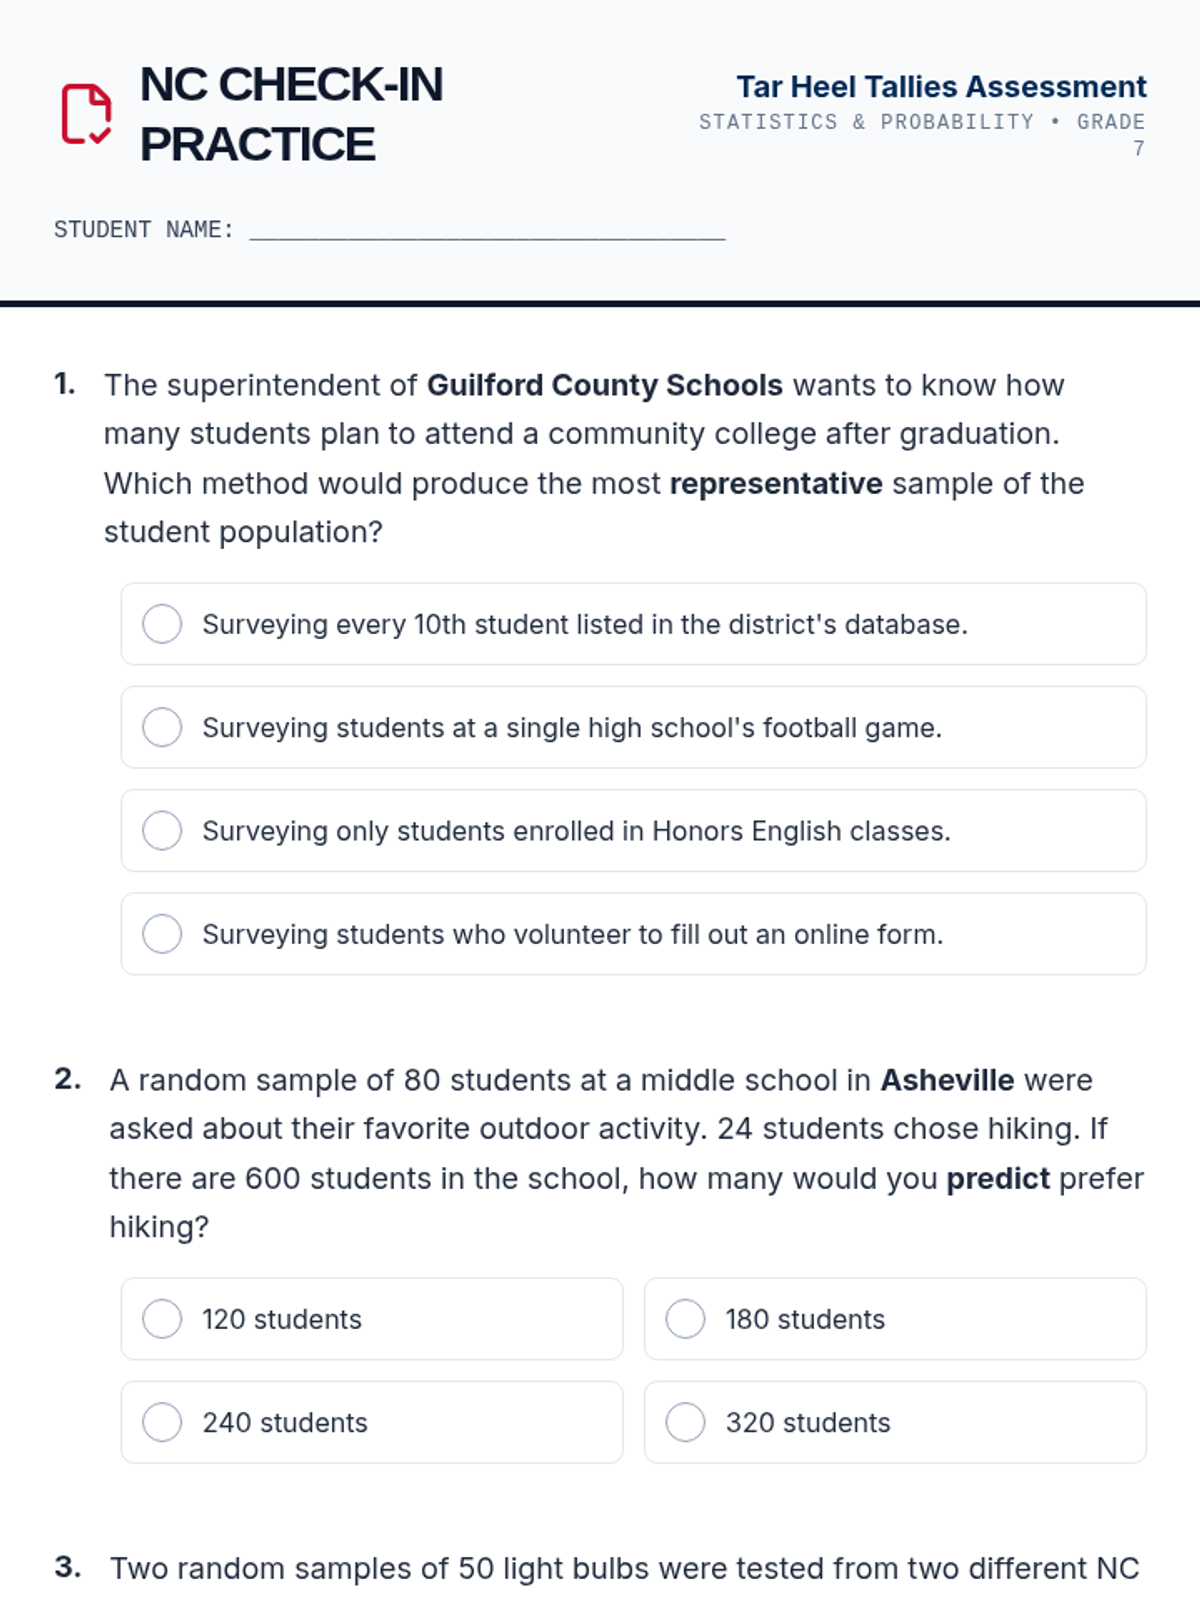
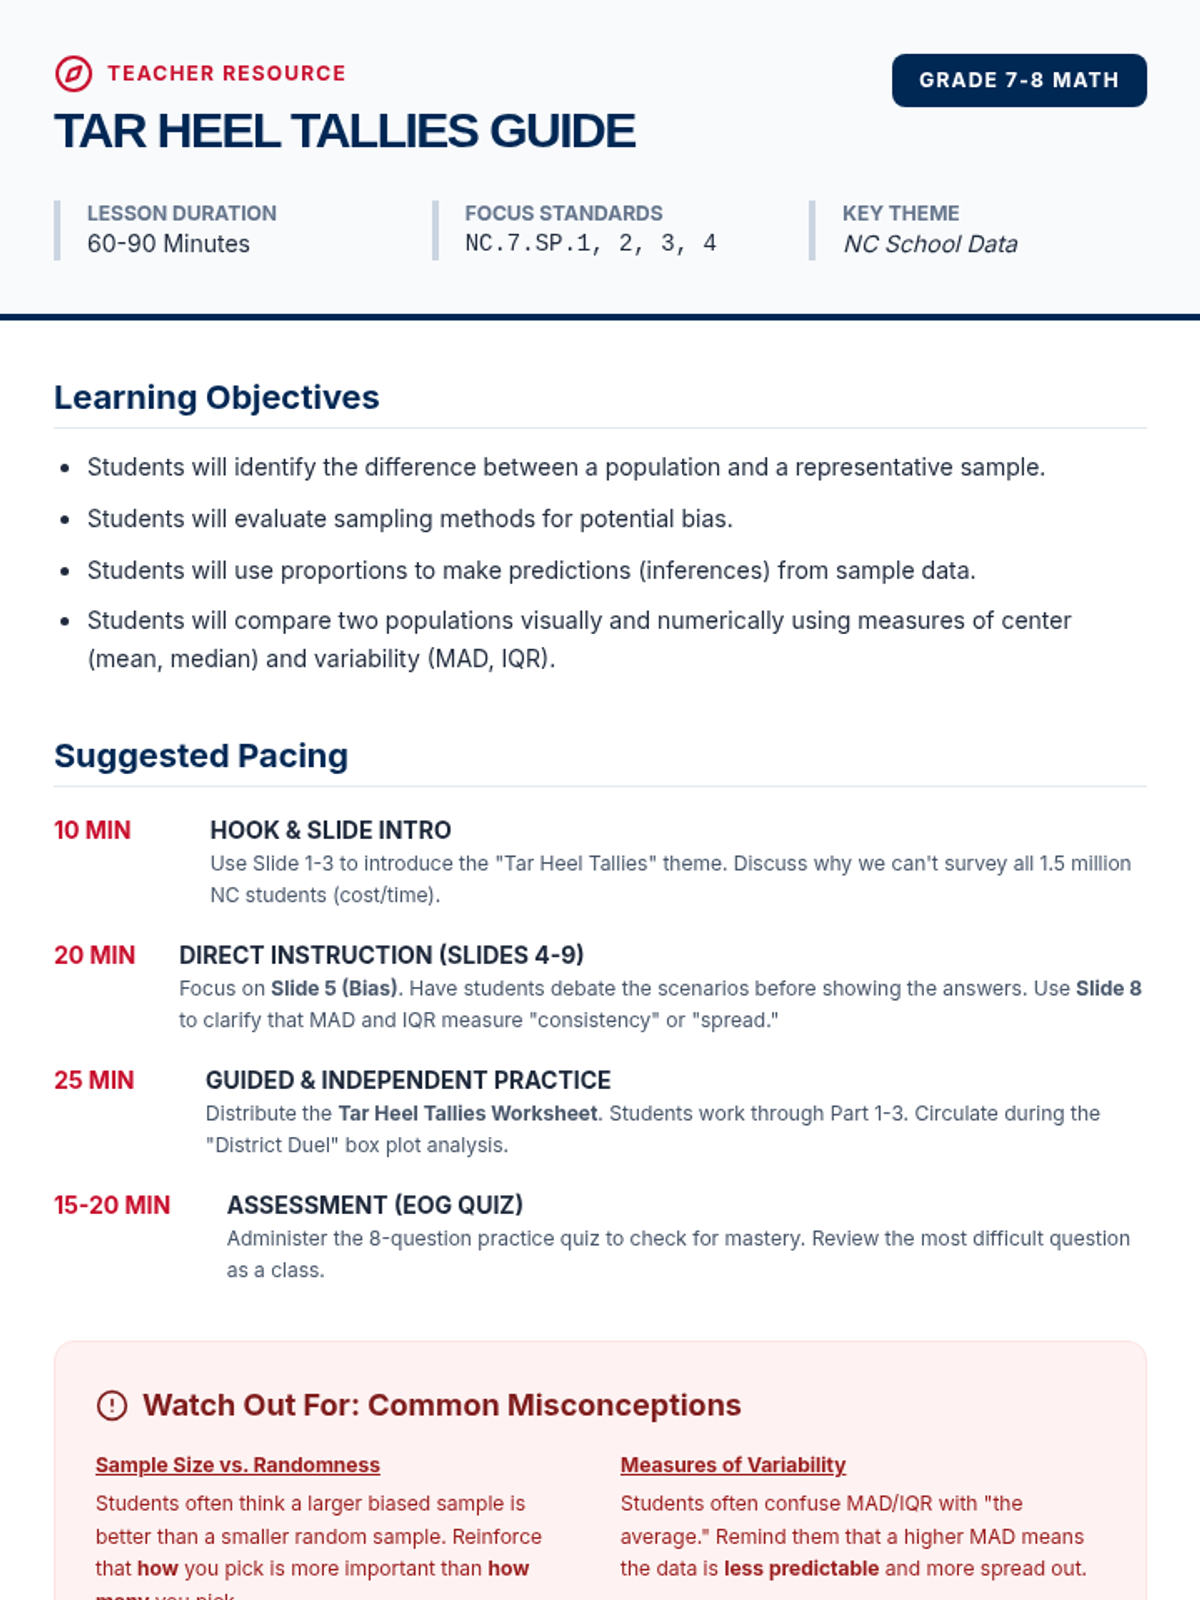
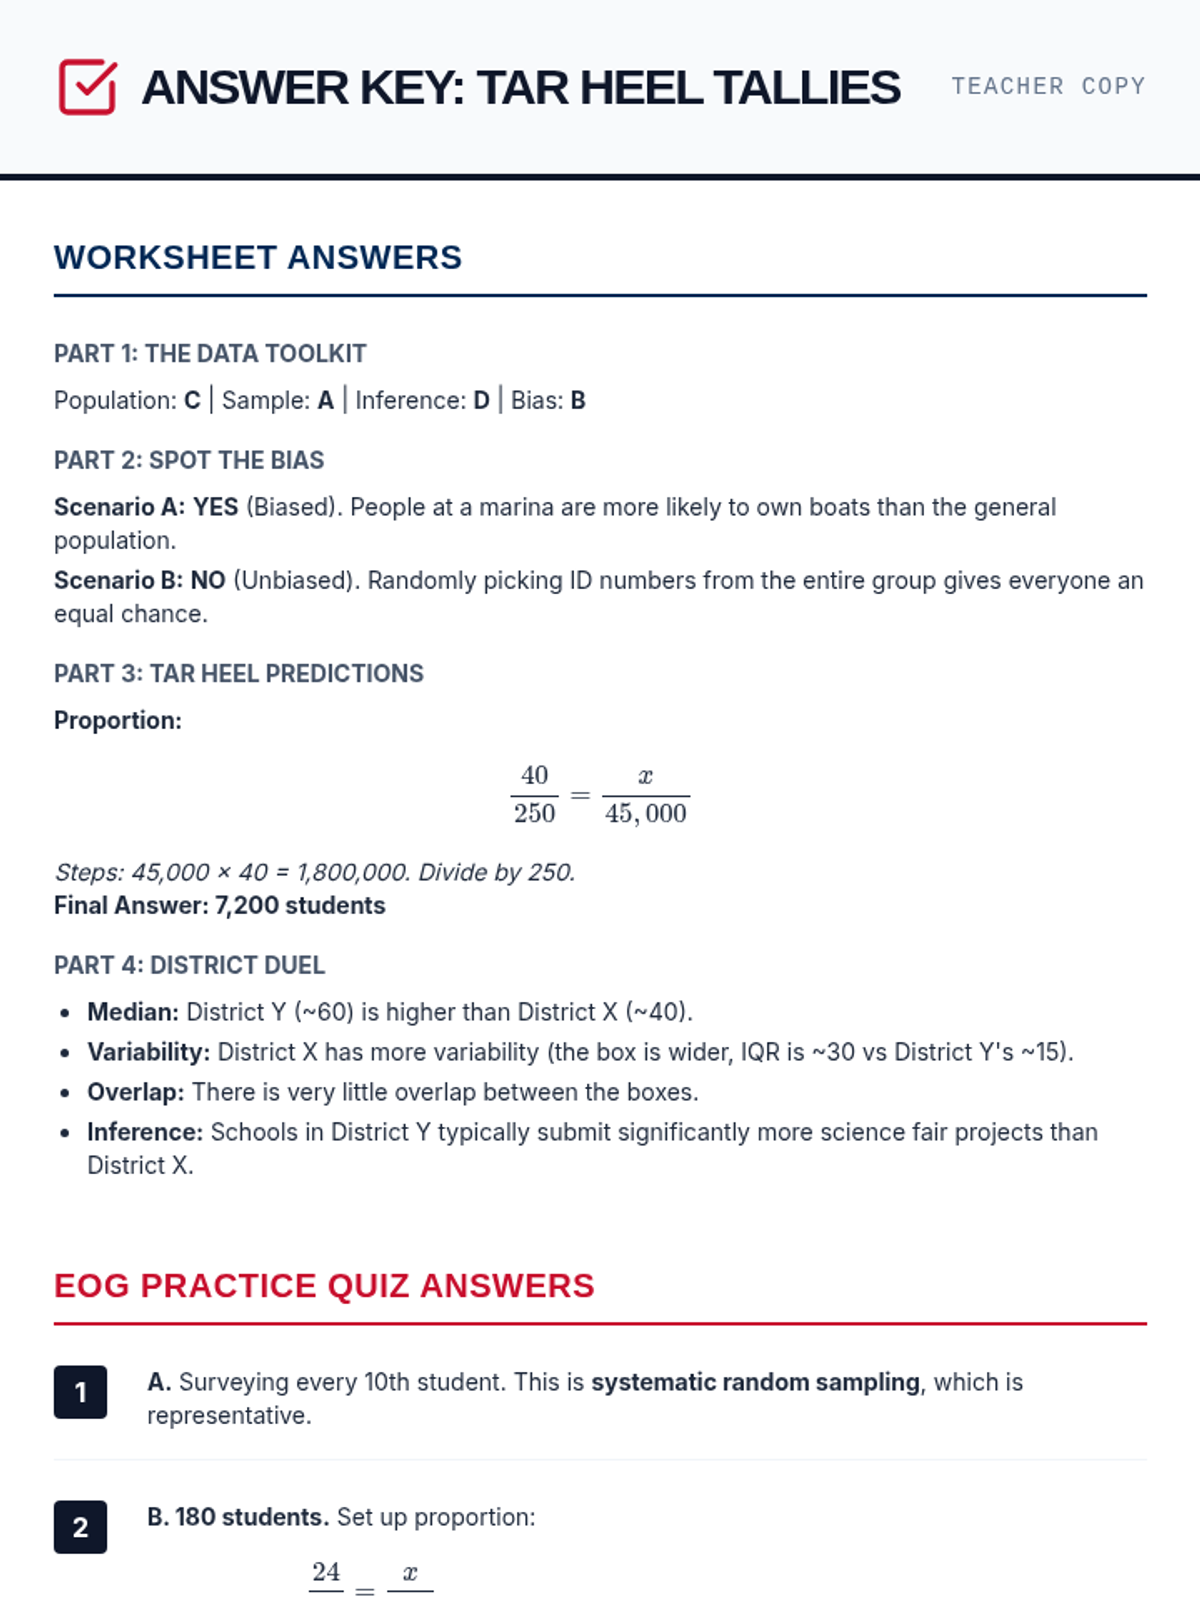
A comprehensive lesson on sampling techniques, population inferences, and data comparison using North Carolina school district data. Students will learn to identify biased sampling, make predictions from representative samples, and compare two populations using measures of center and variability.
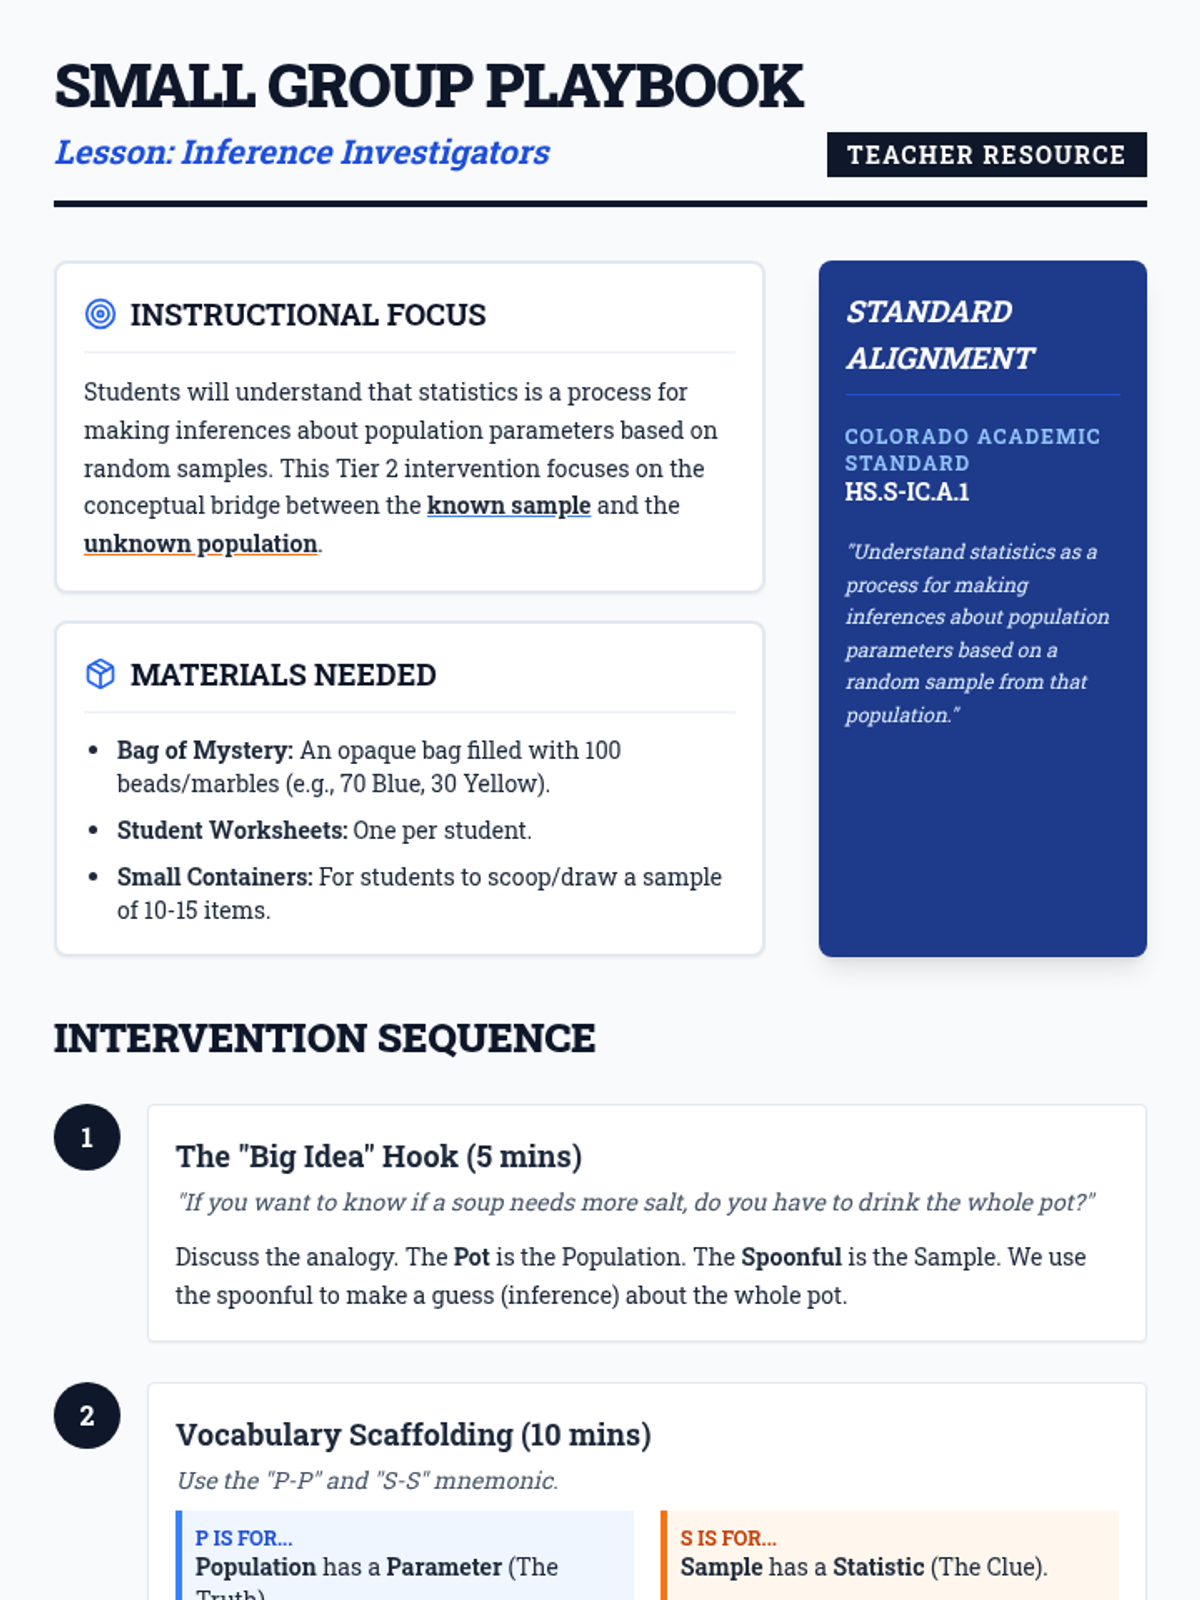
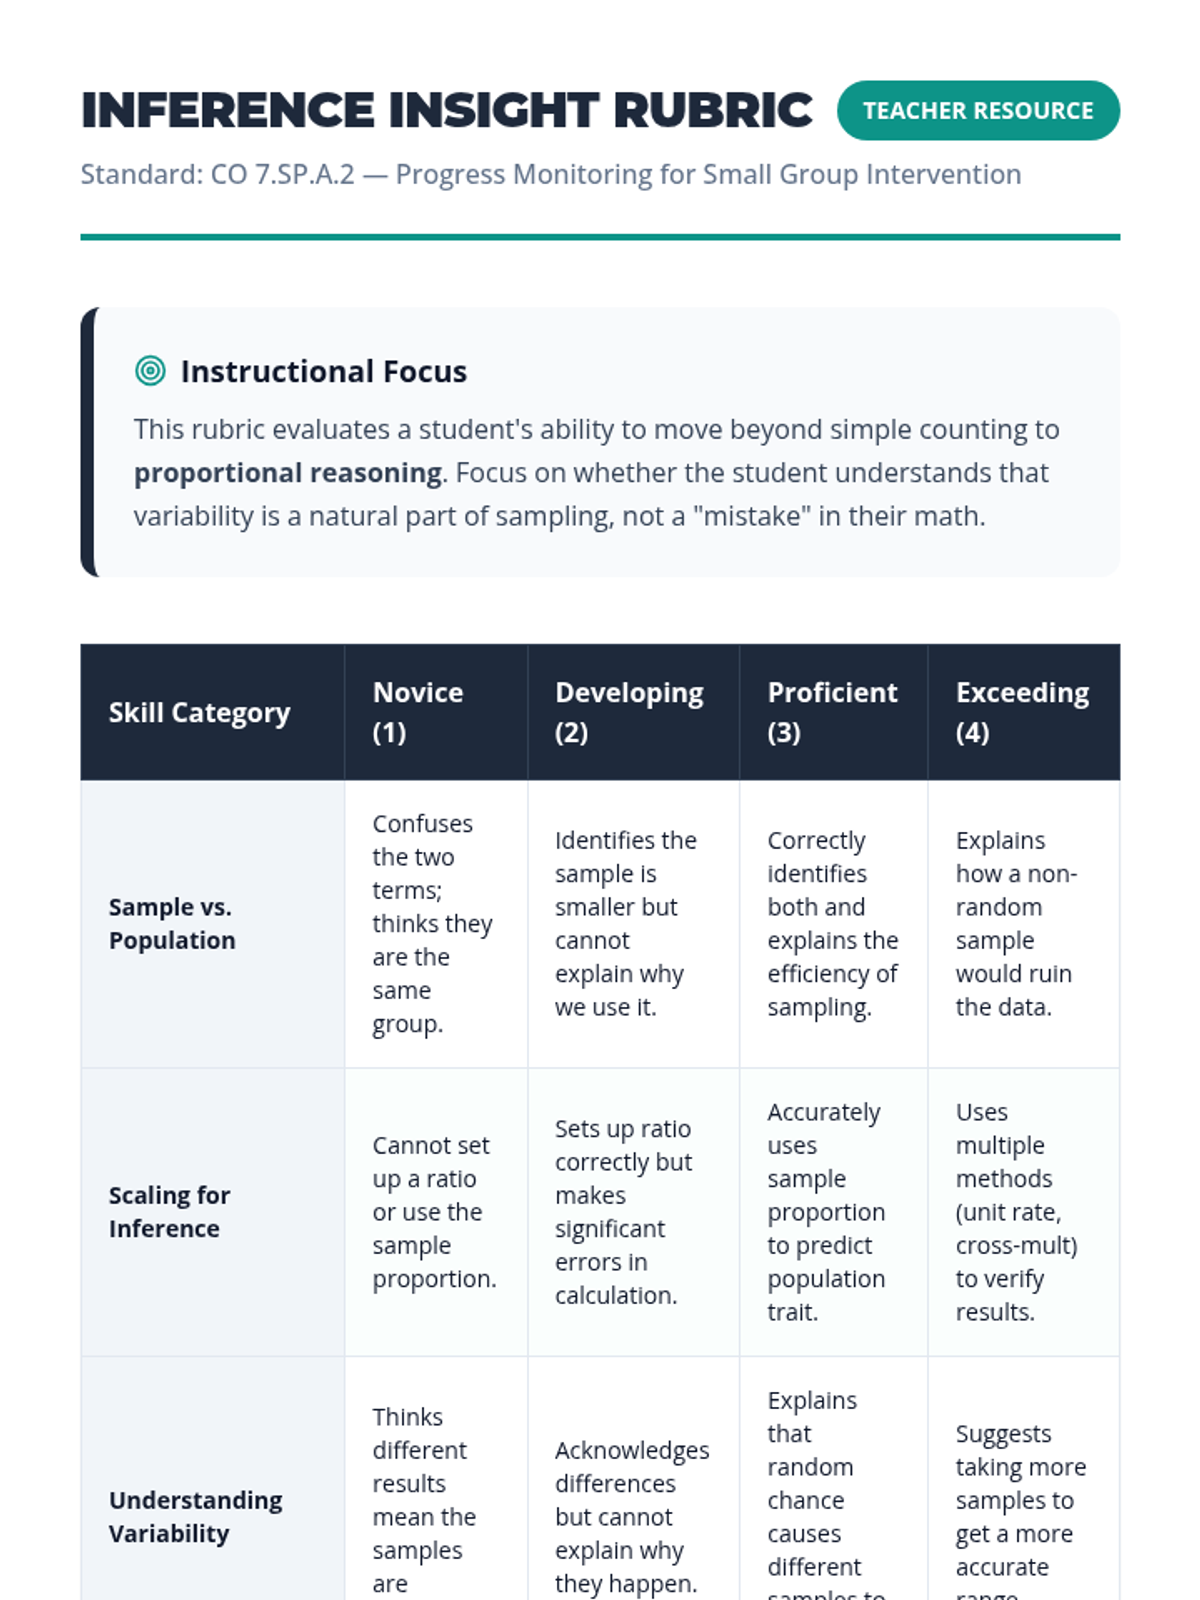
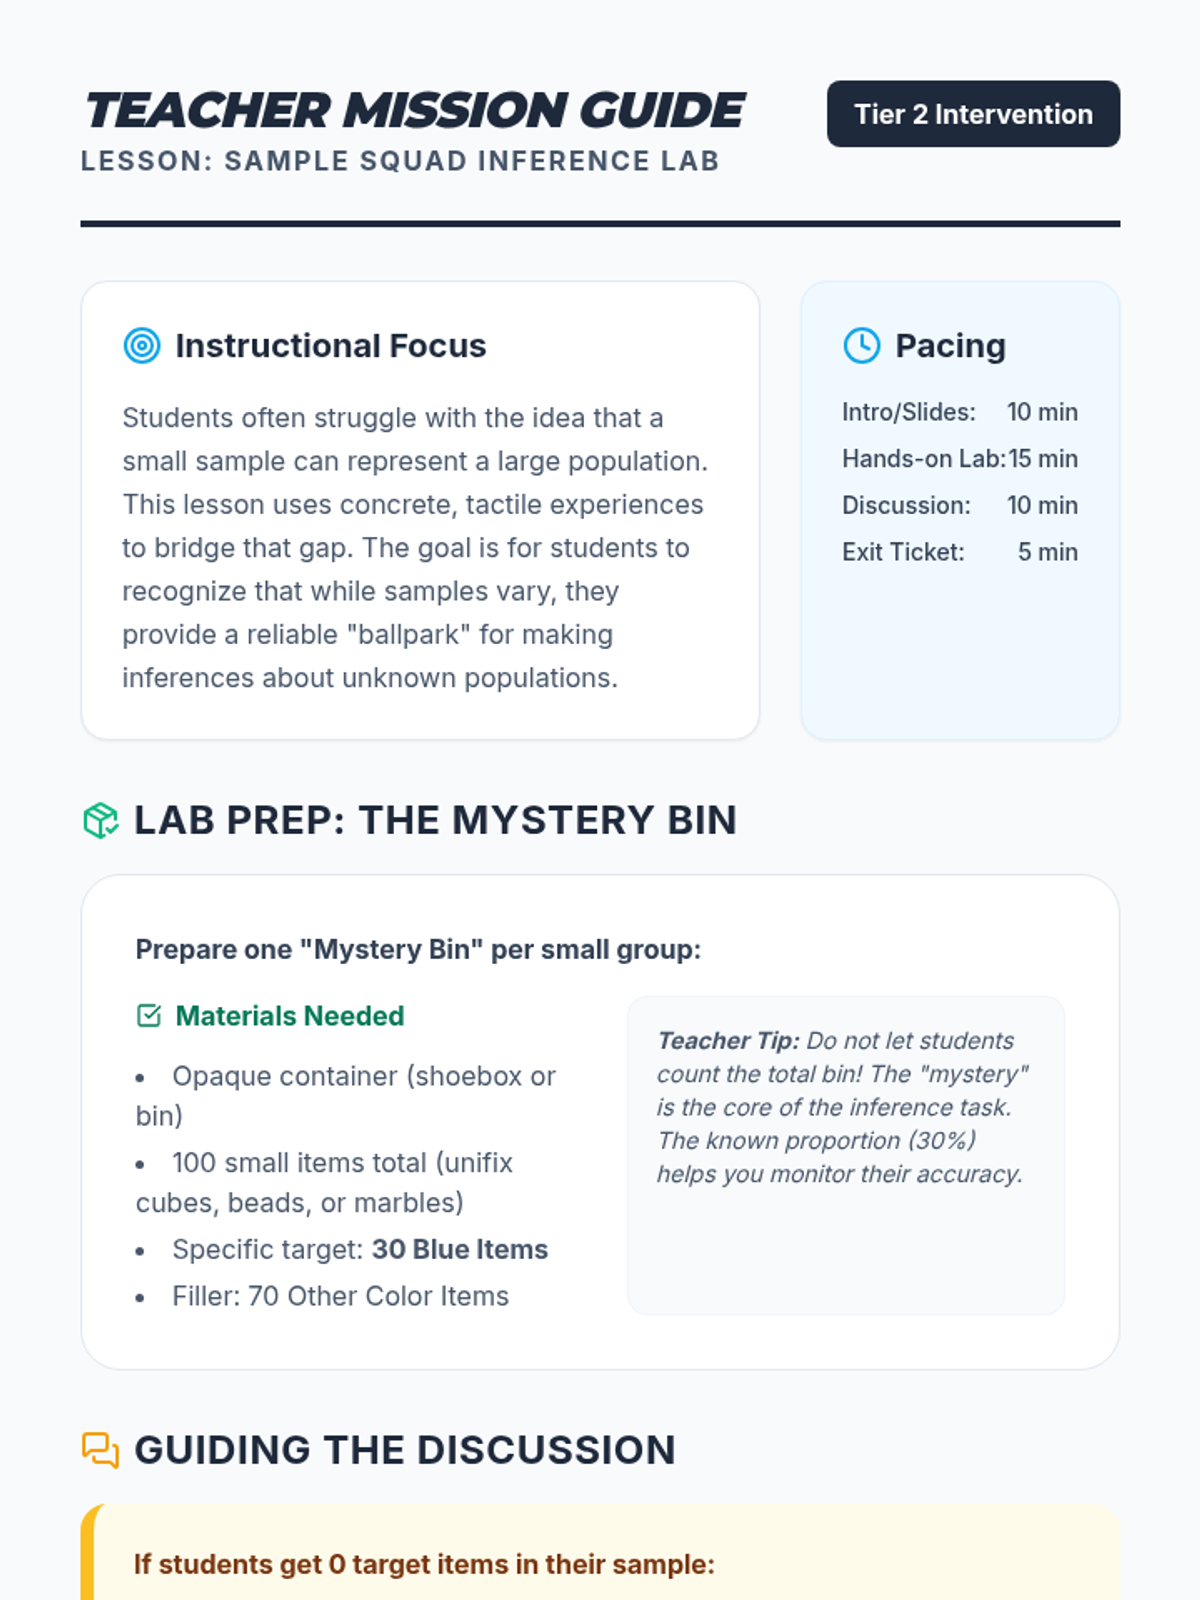
A Tier 2 intervention lesson focusing on the core logic of statistical inference. Students move from physical sampling to conceptual understanding of how samples represent populations.
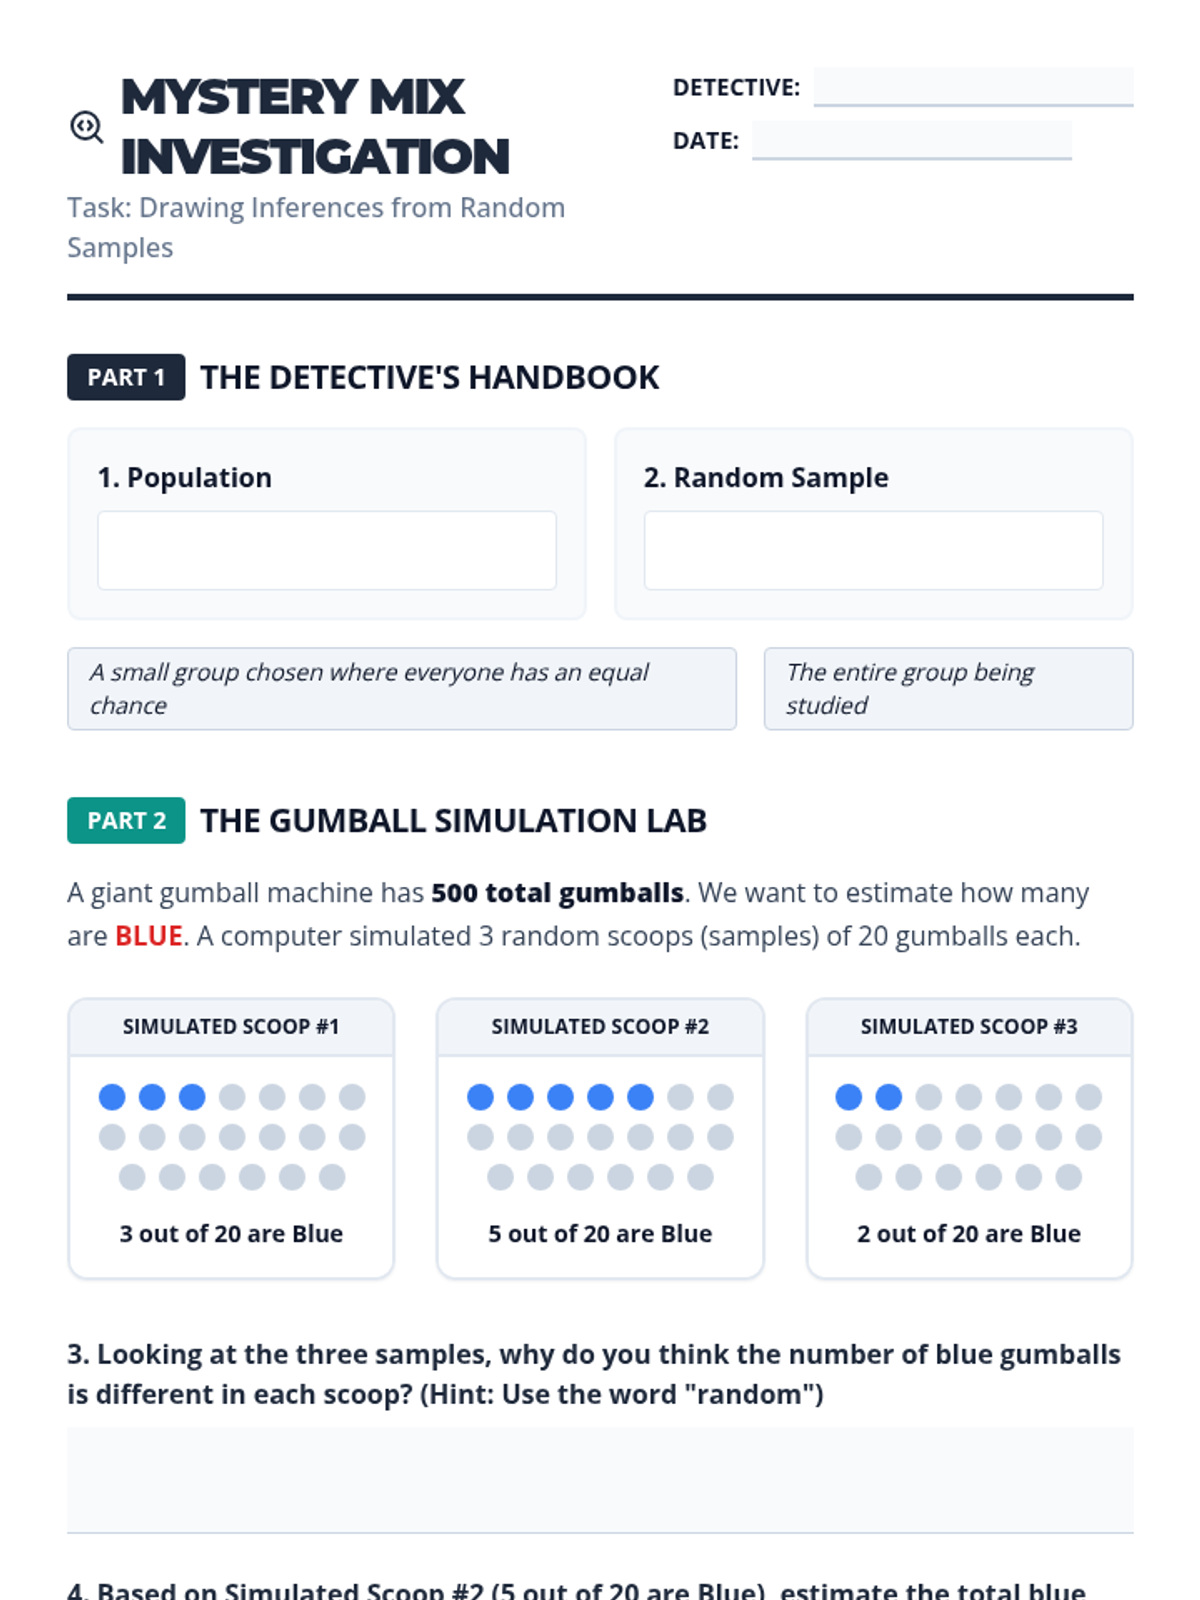
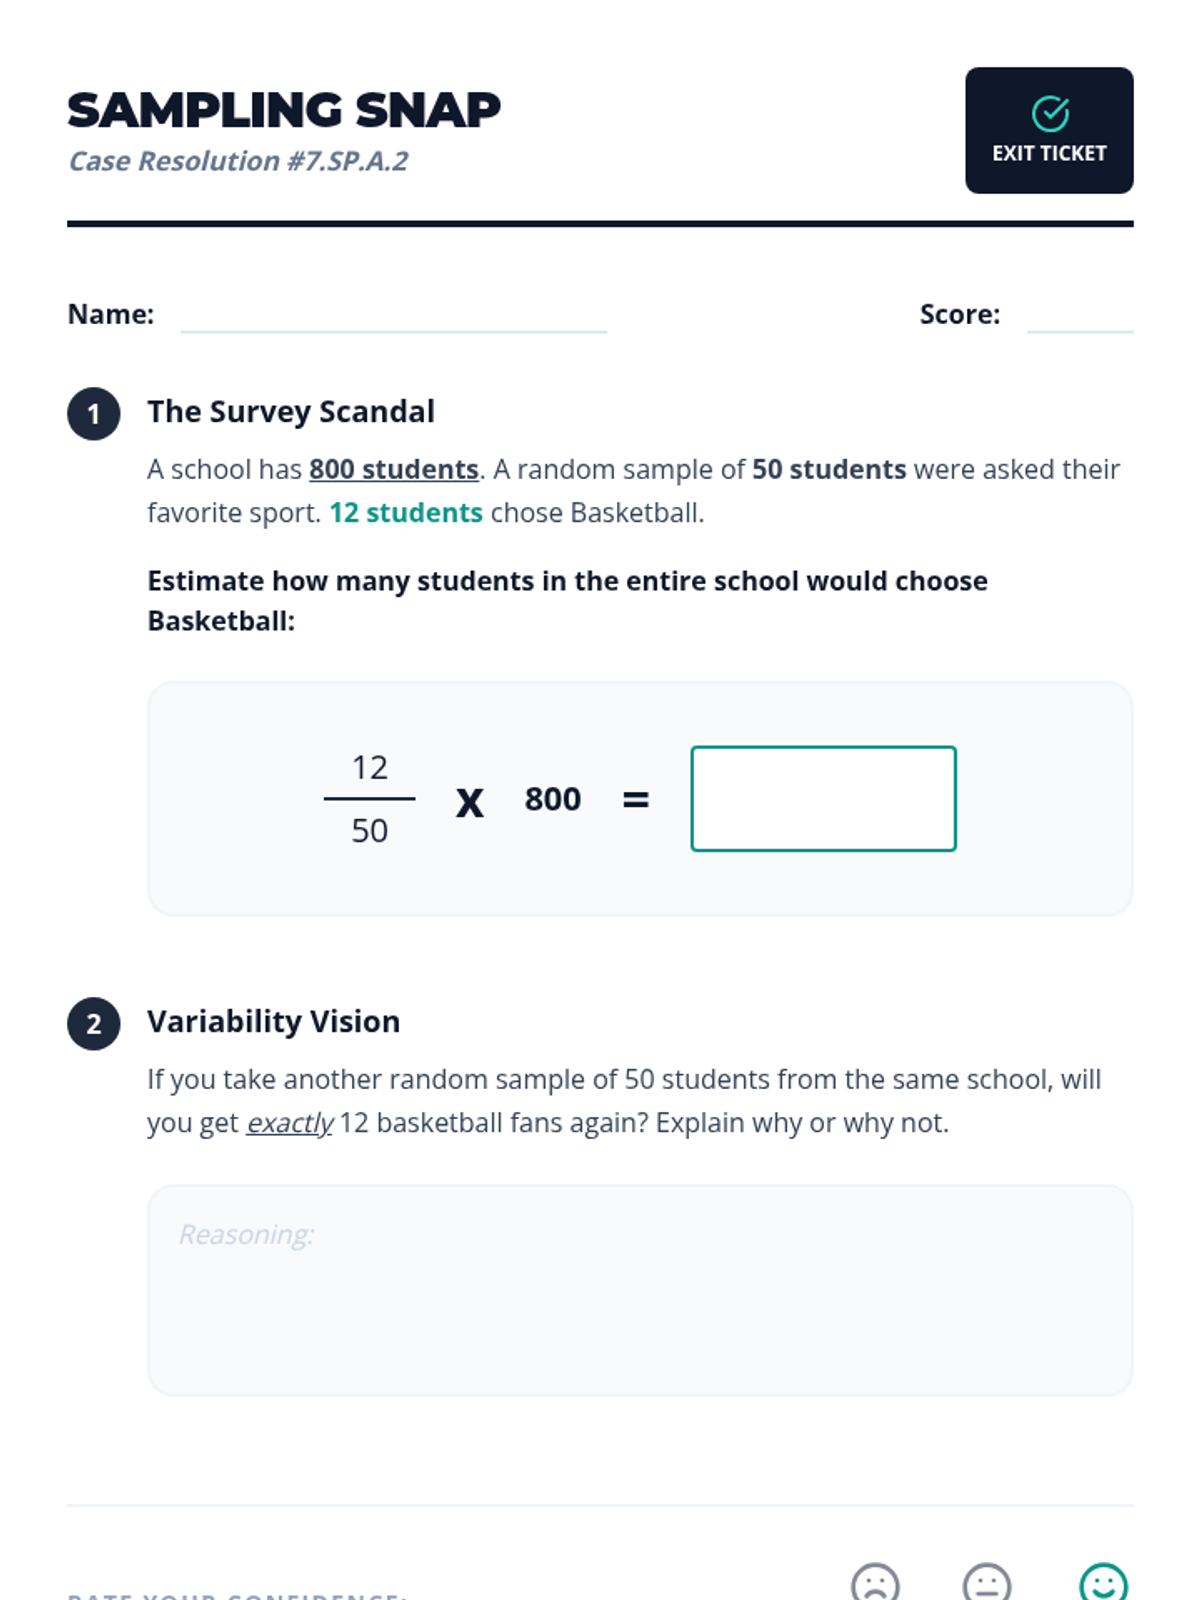
A Tier 2 intervention lesson focused on using random samples to make population inferences and understanding why different samples produce different results. Students analyze simulated data to gauge variability and develop reasoning skills for predicting population characteristics.
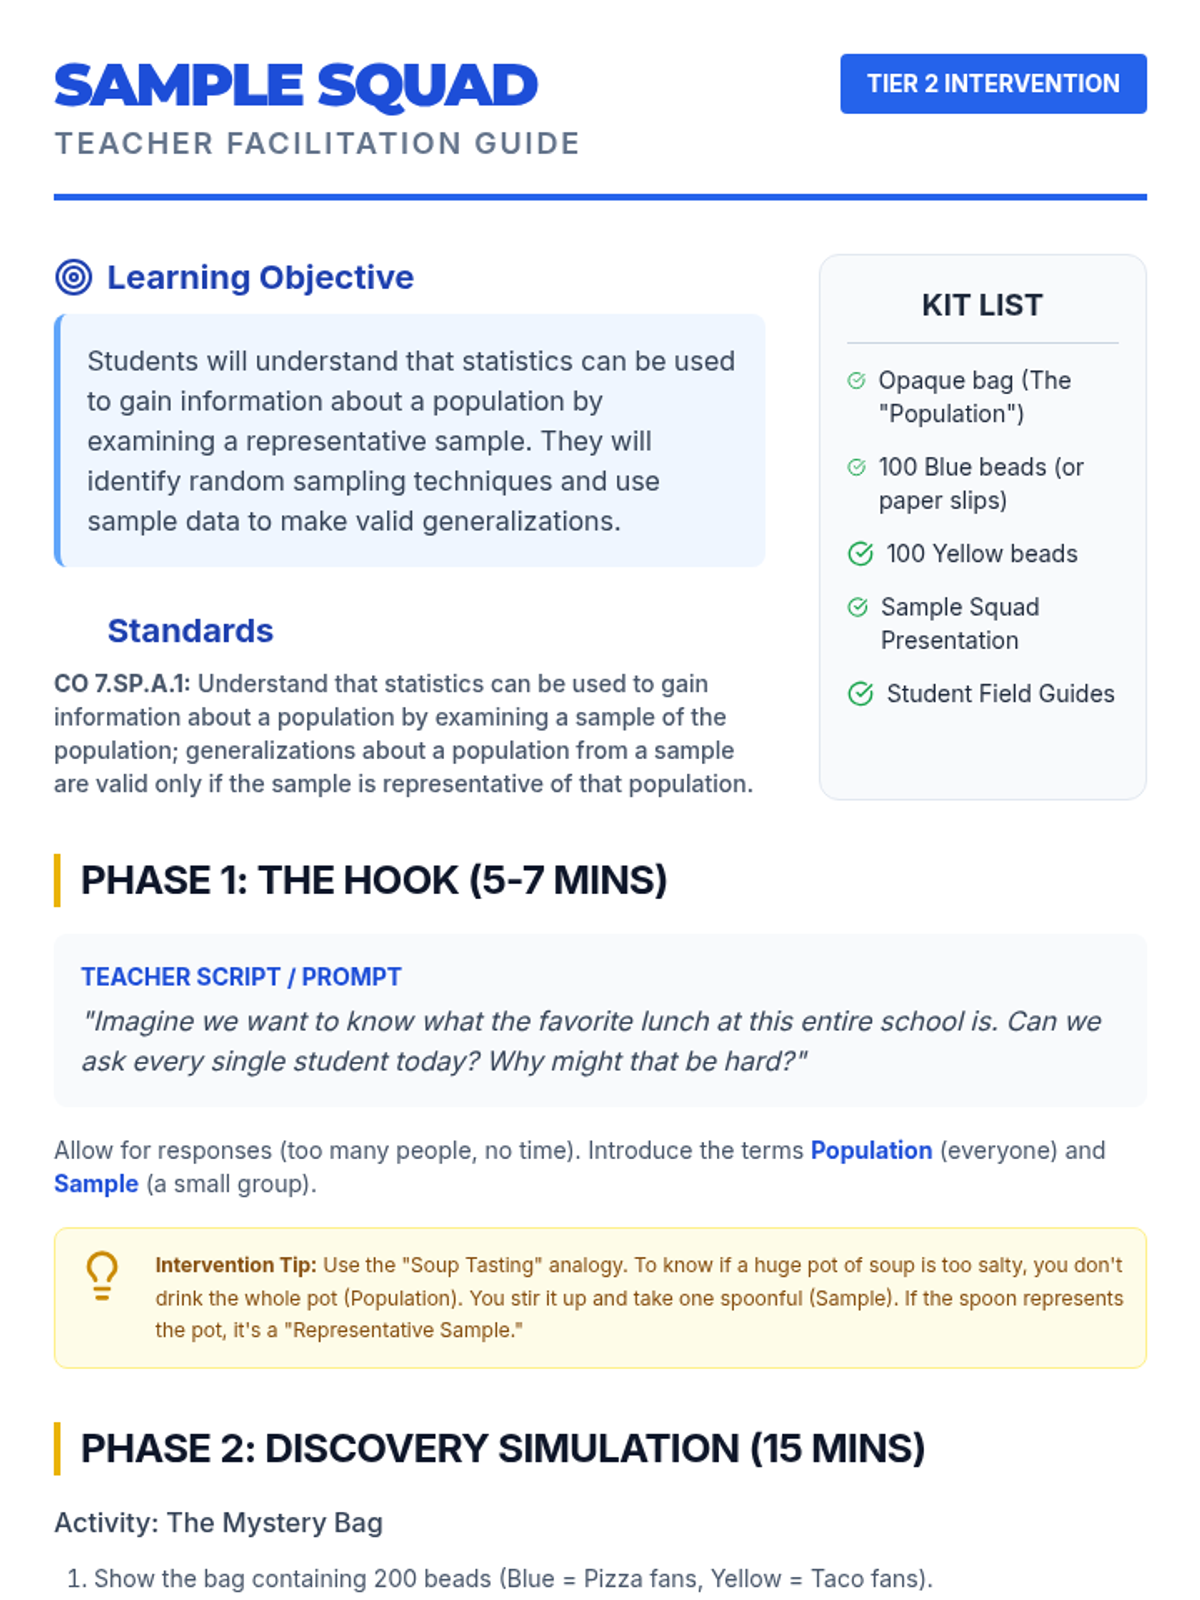
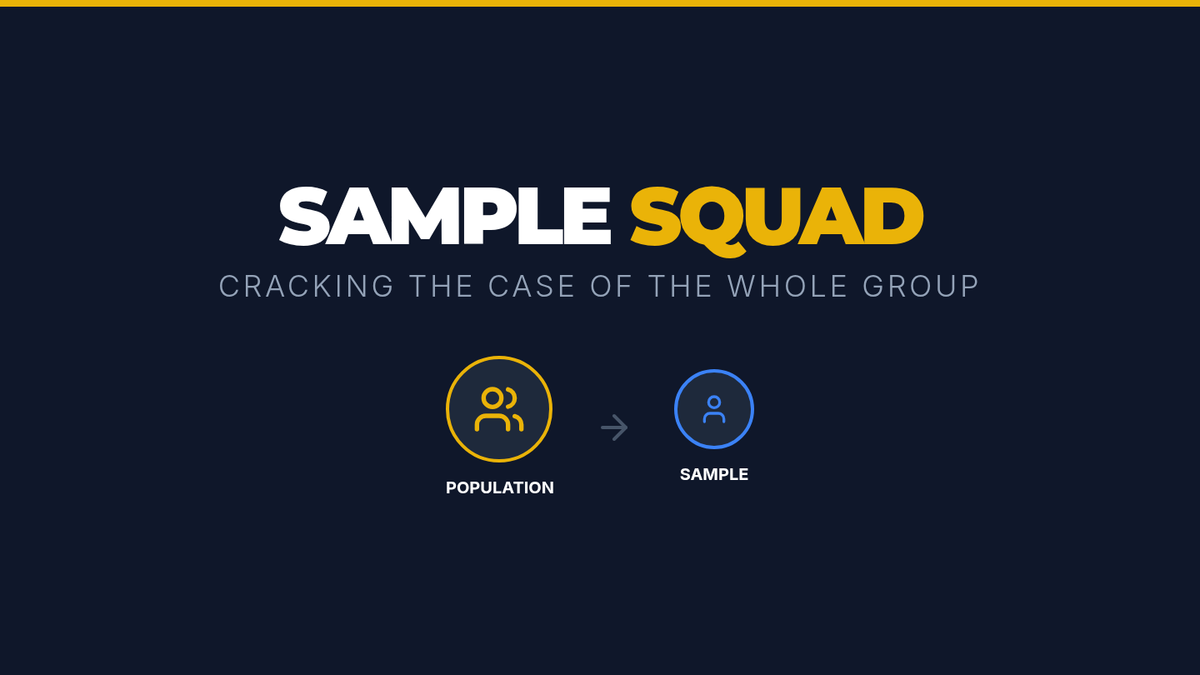
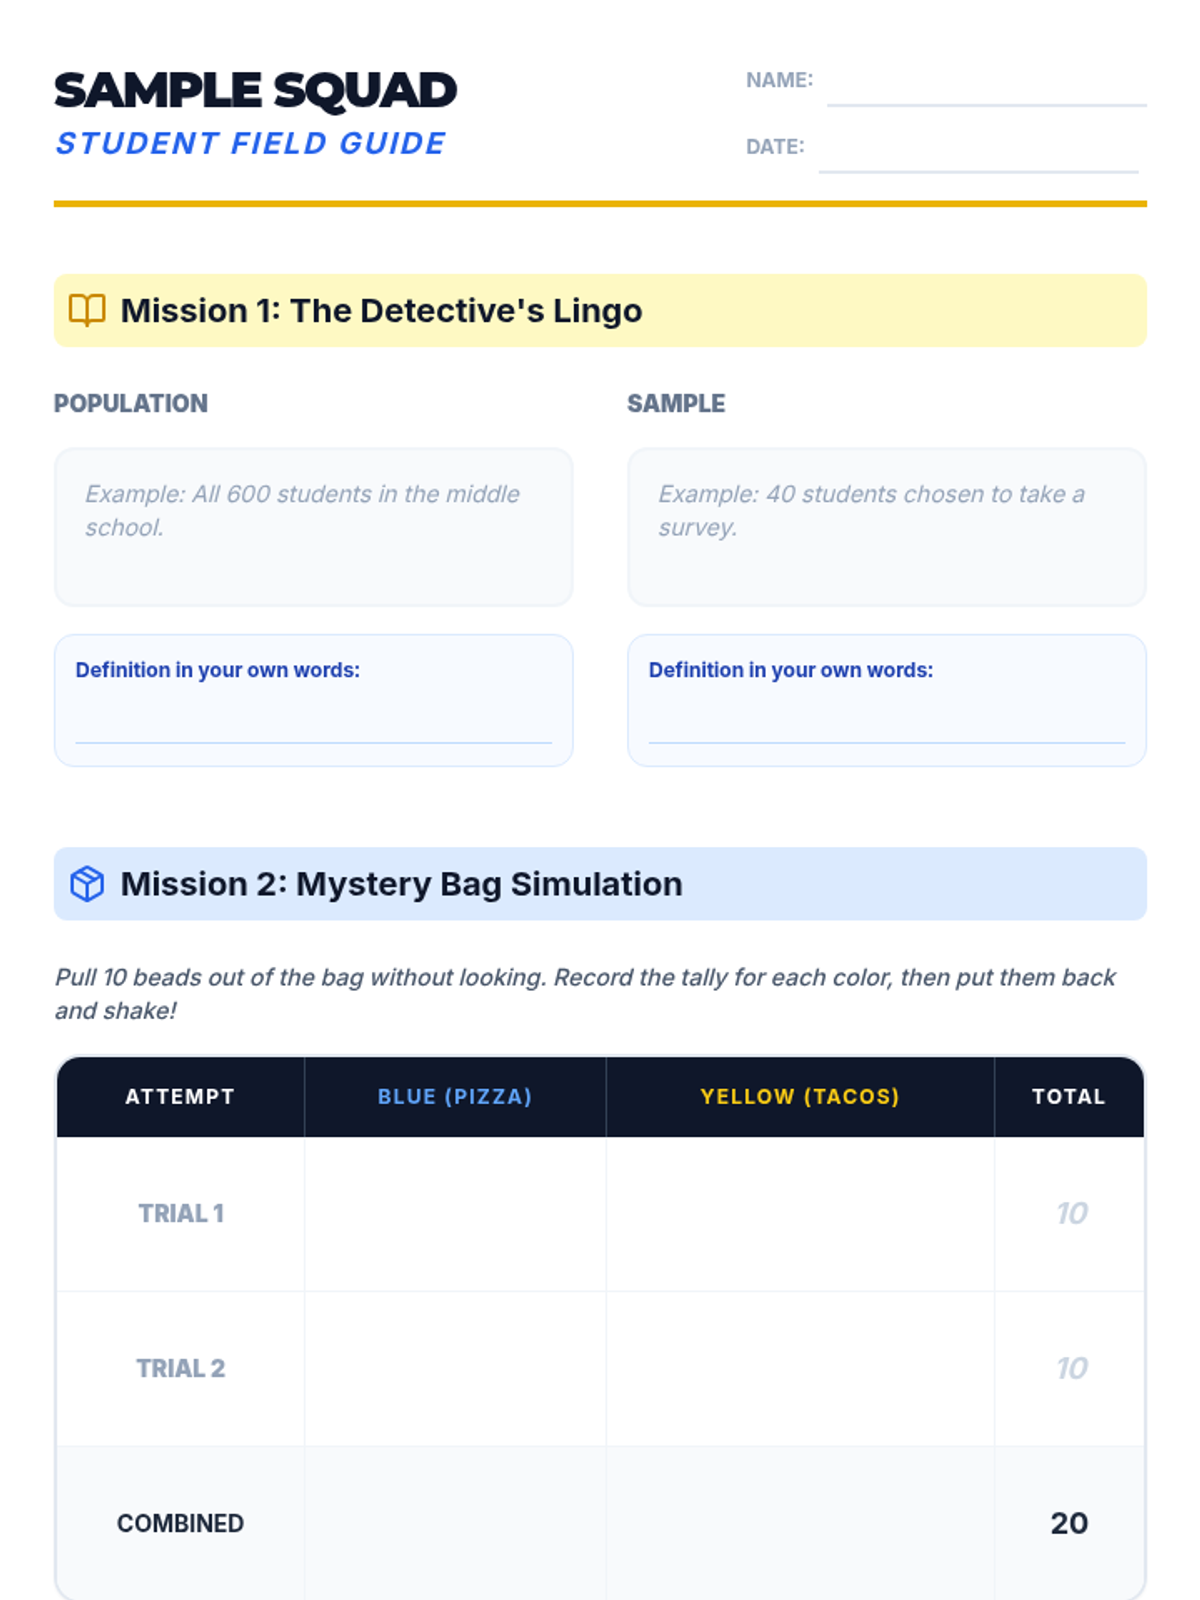
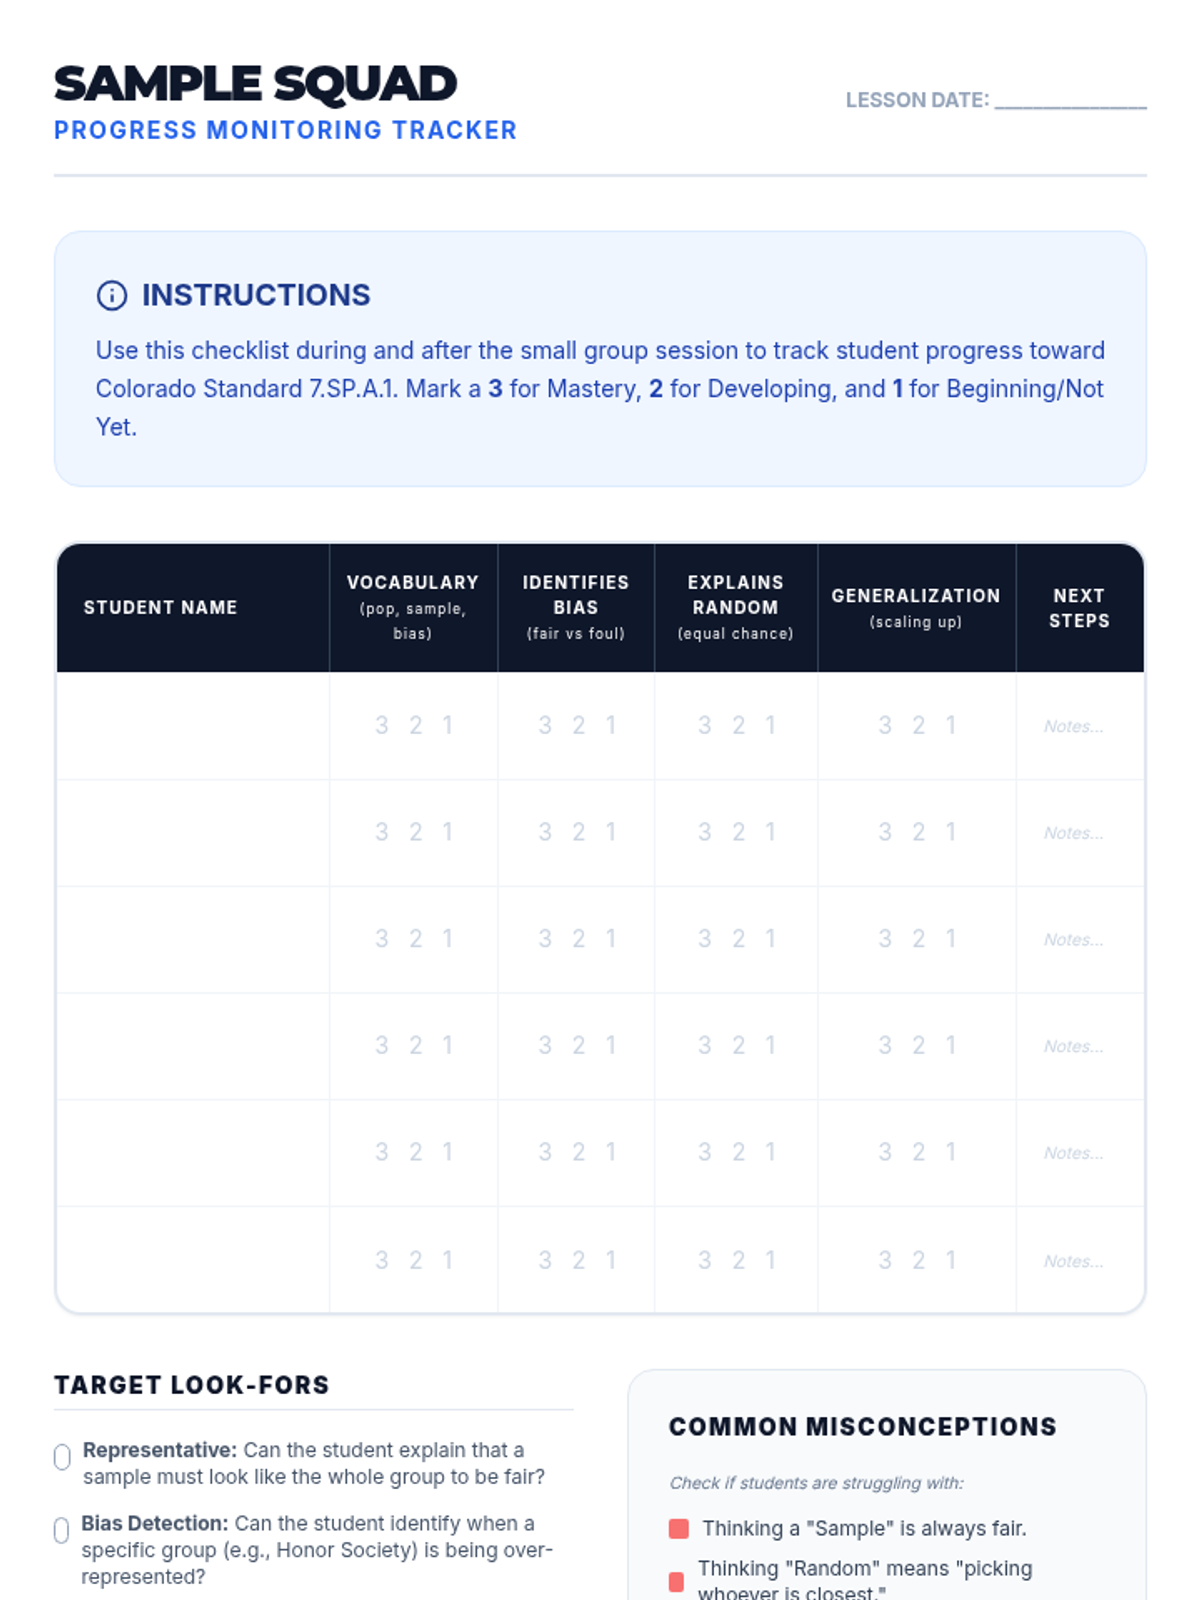
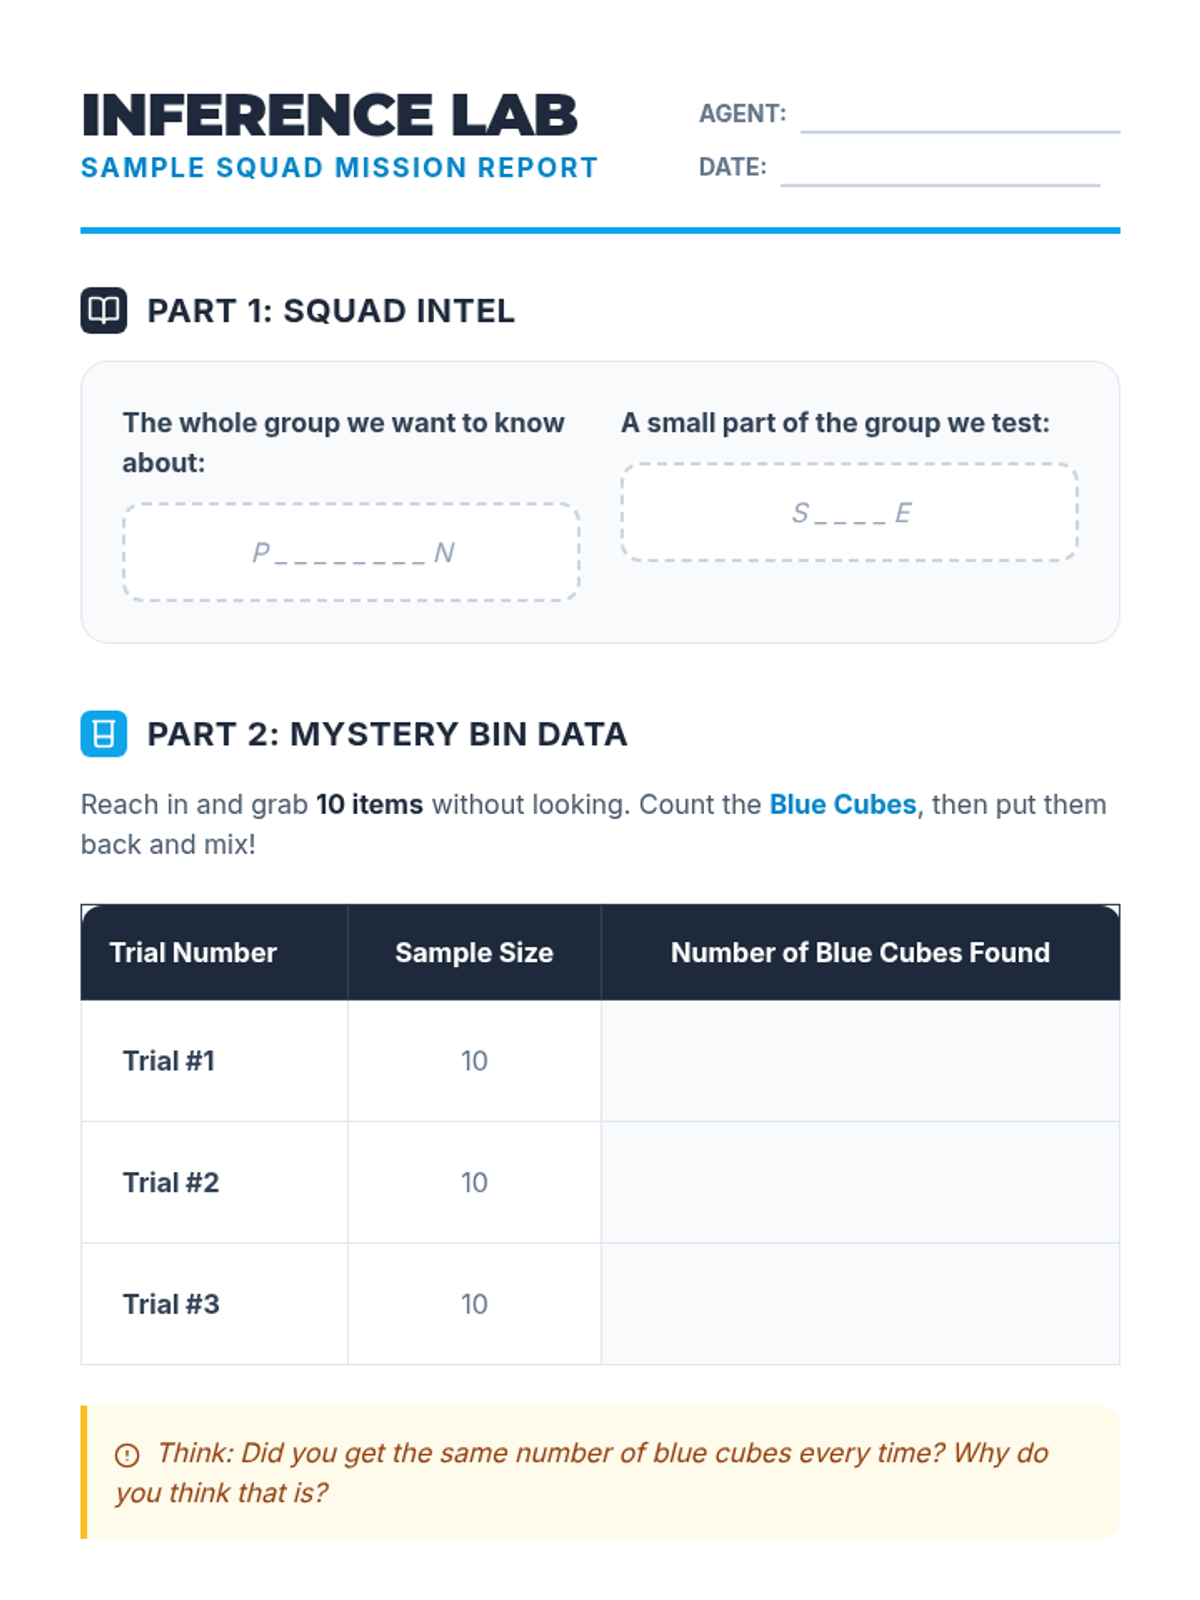
A Tier 2 intervention lesson designed for small groups to master the concepts of representative sampling and valid generalizations through scaffolded real-world scenarios and hands-on simulation.
A Tier 2 intervention lesson focused on using random sampling to make inferences about a population. Students engage in hands-on data collection and compare multiple samples to understand variation and prediction accuracy.
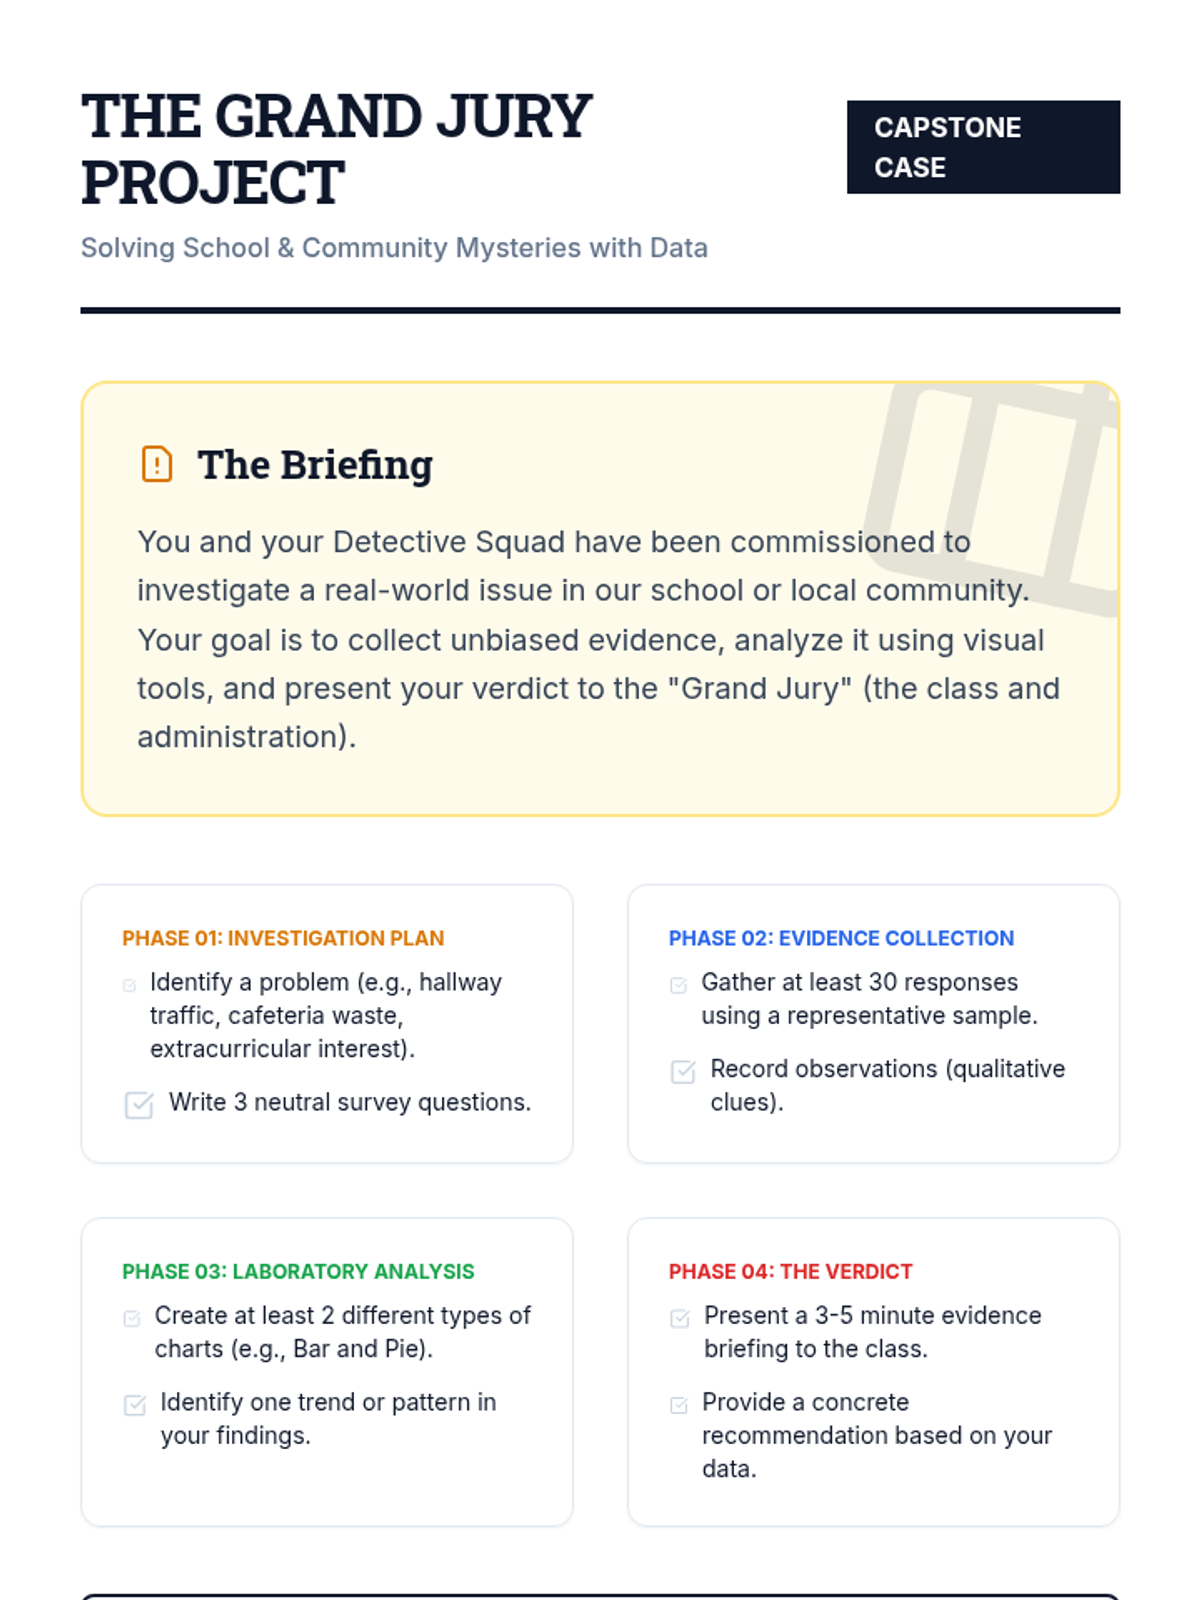
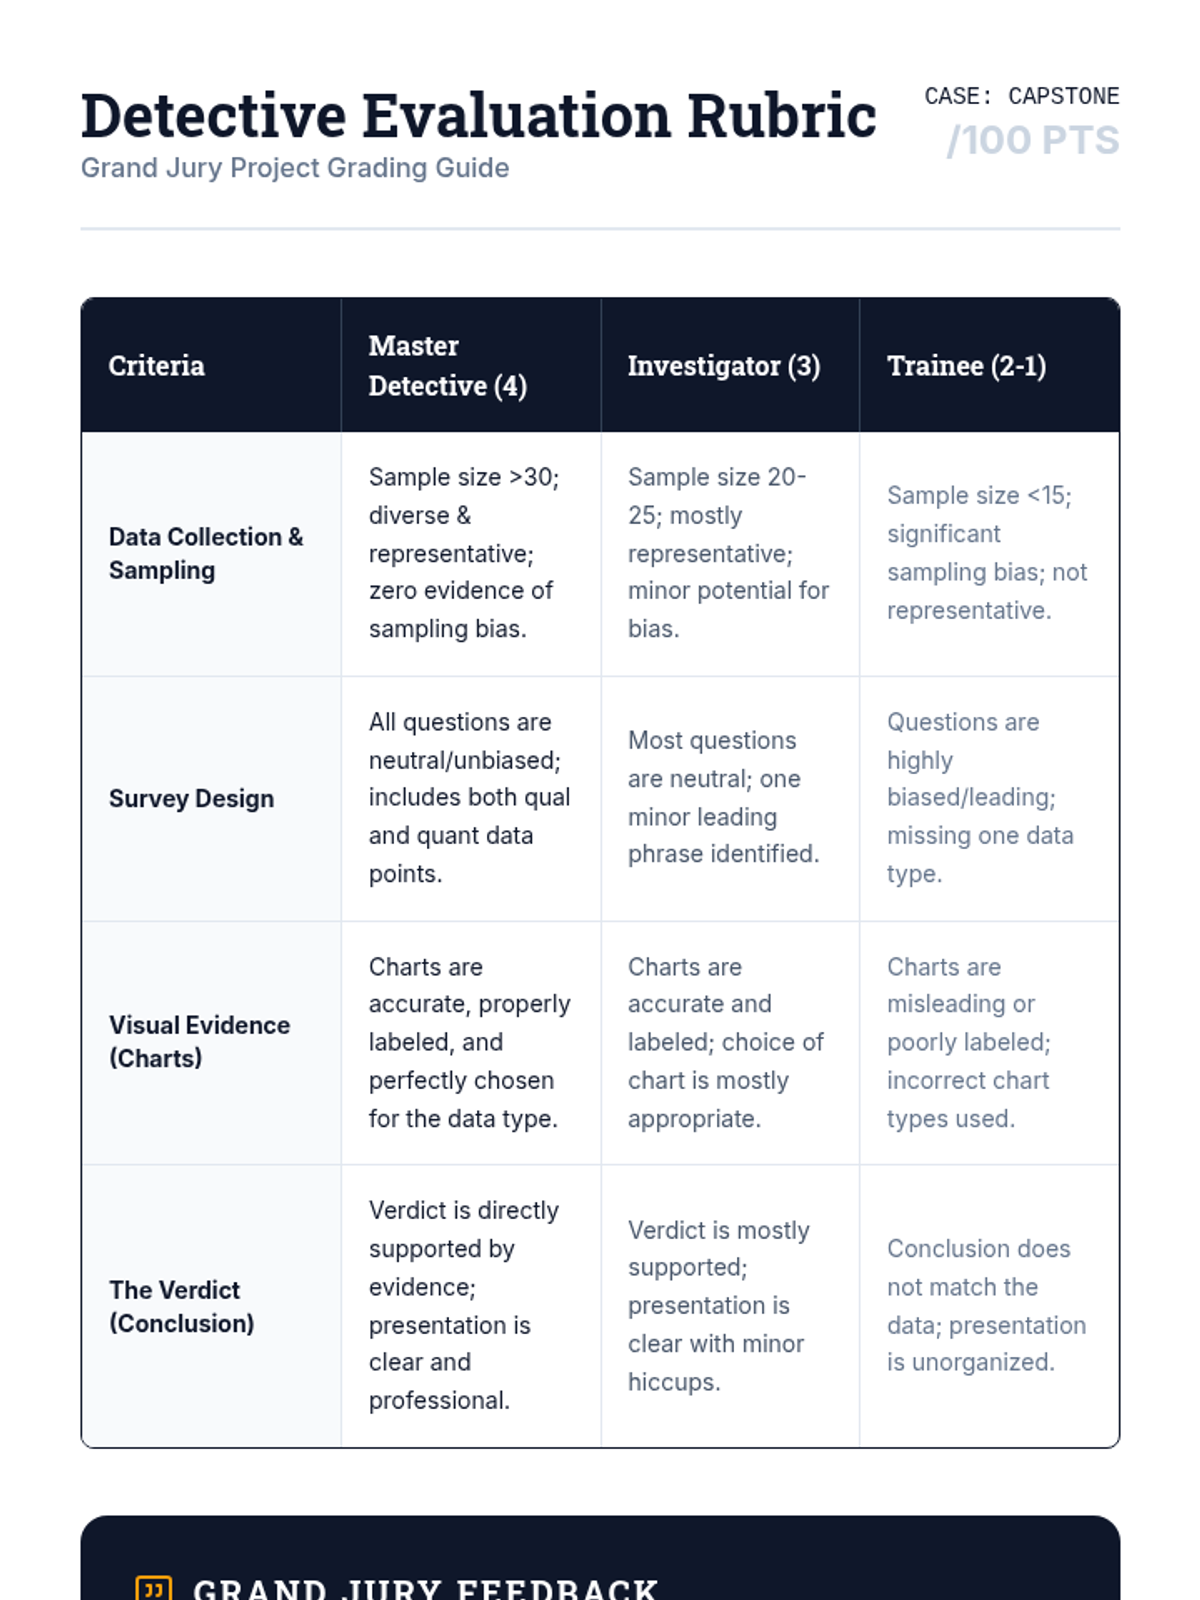
The capstone of the unit where students work in squads to solve a real-world community or school issue using the data skills they've developed.
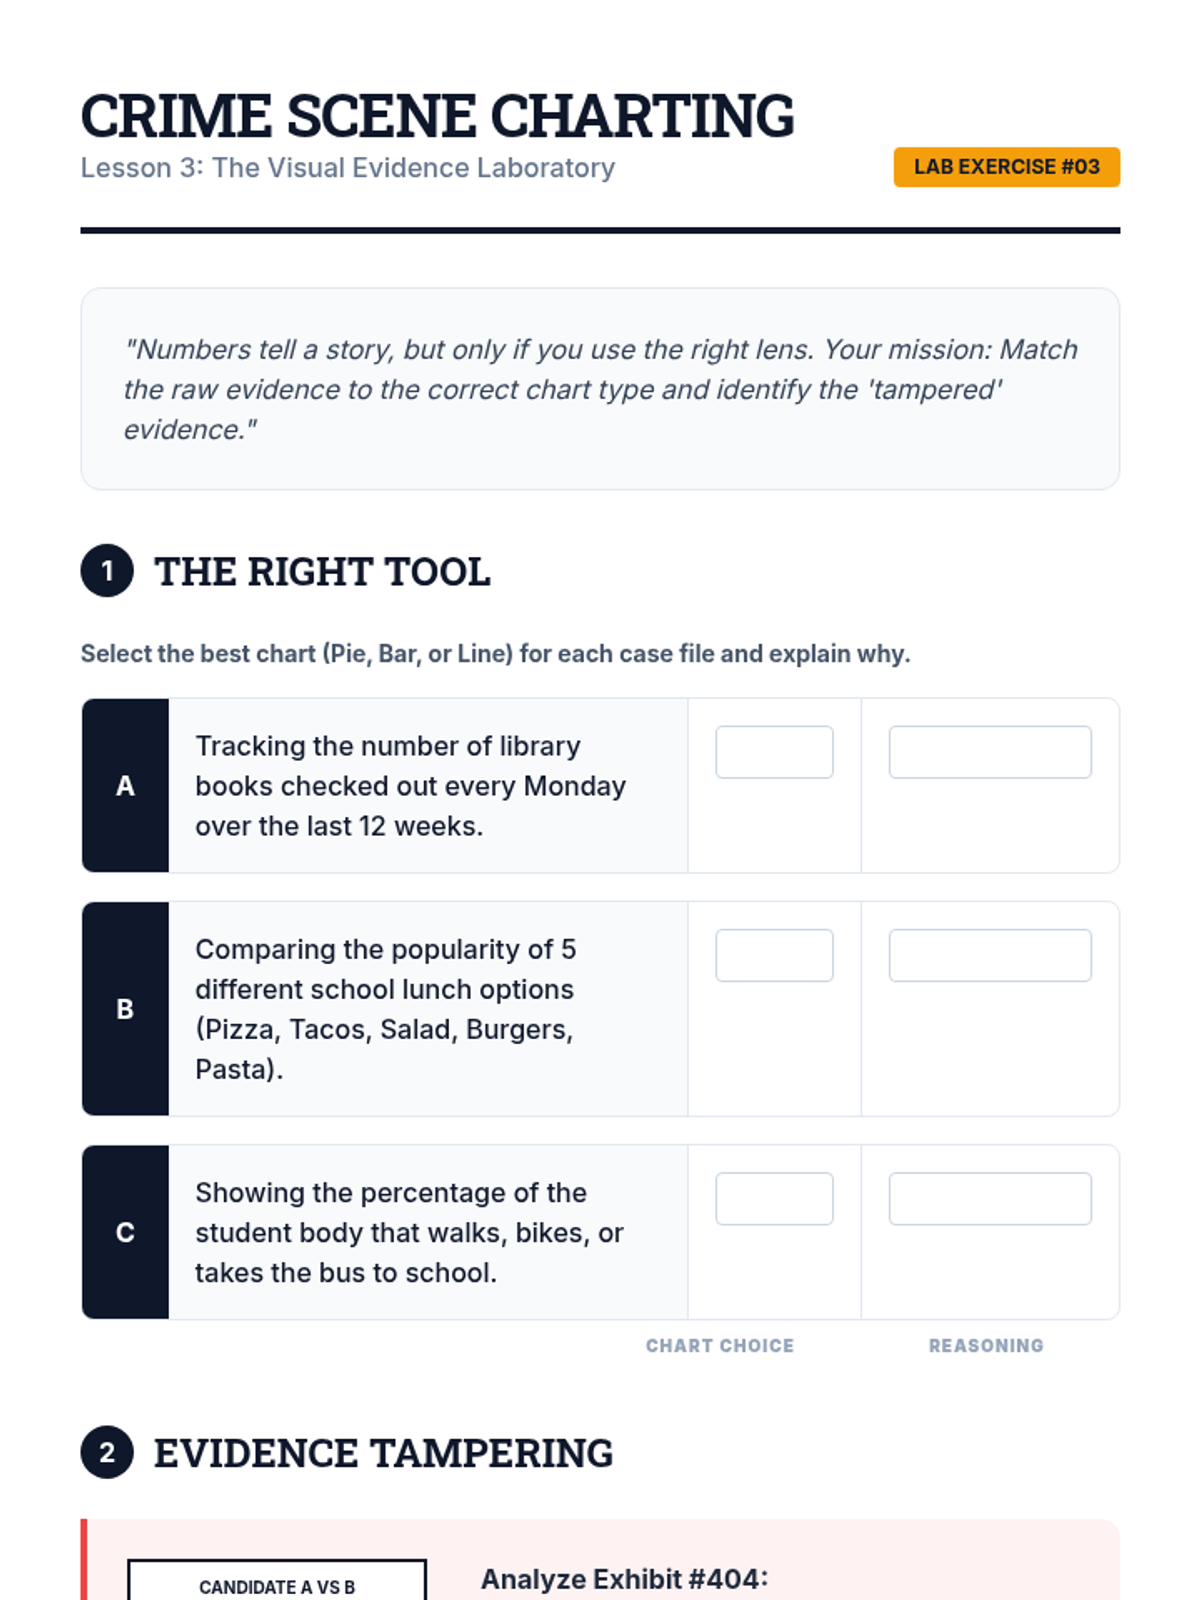
Focuses on transforming raw data into visual evidence. Students learn to choose the right chart for their 'case' and how to spot misleading visualizations.
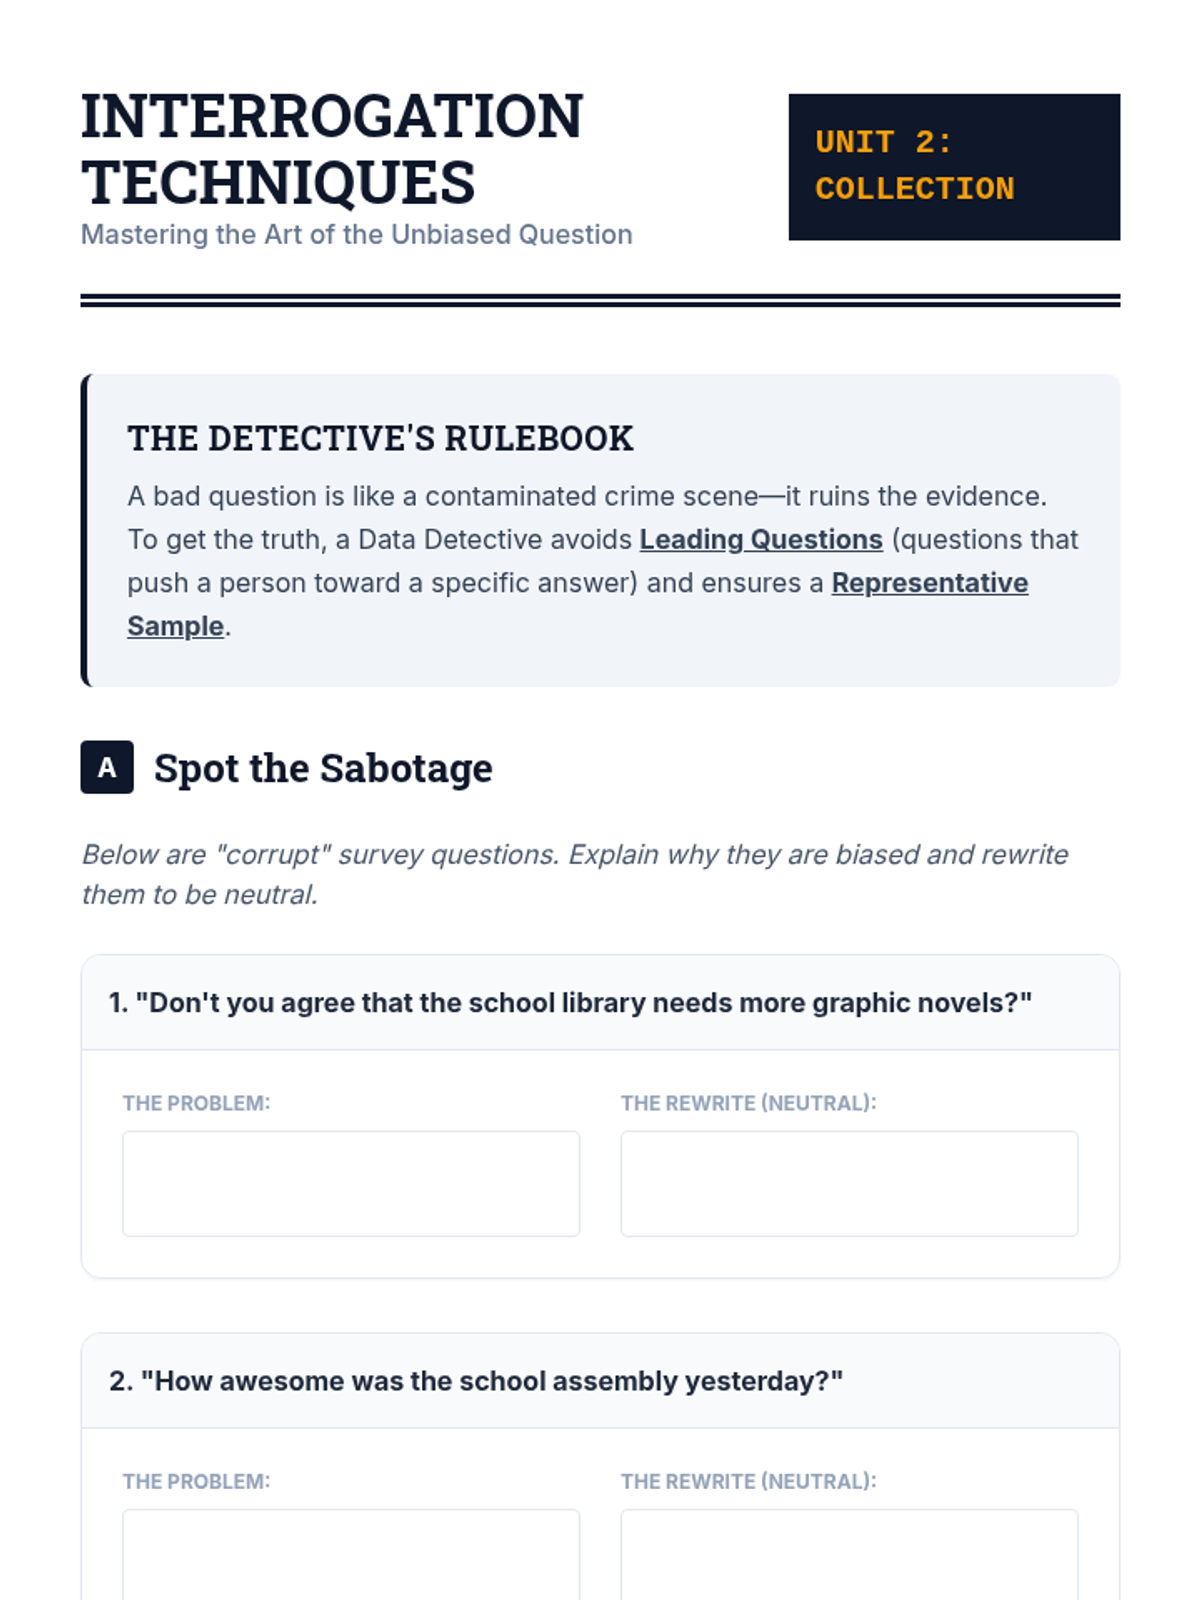
Students learn the art of gathering high-quality data through surveys and observations, focusing on creating unbiased questions and selecting representative samples.
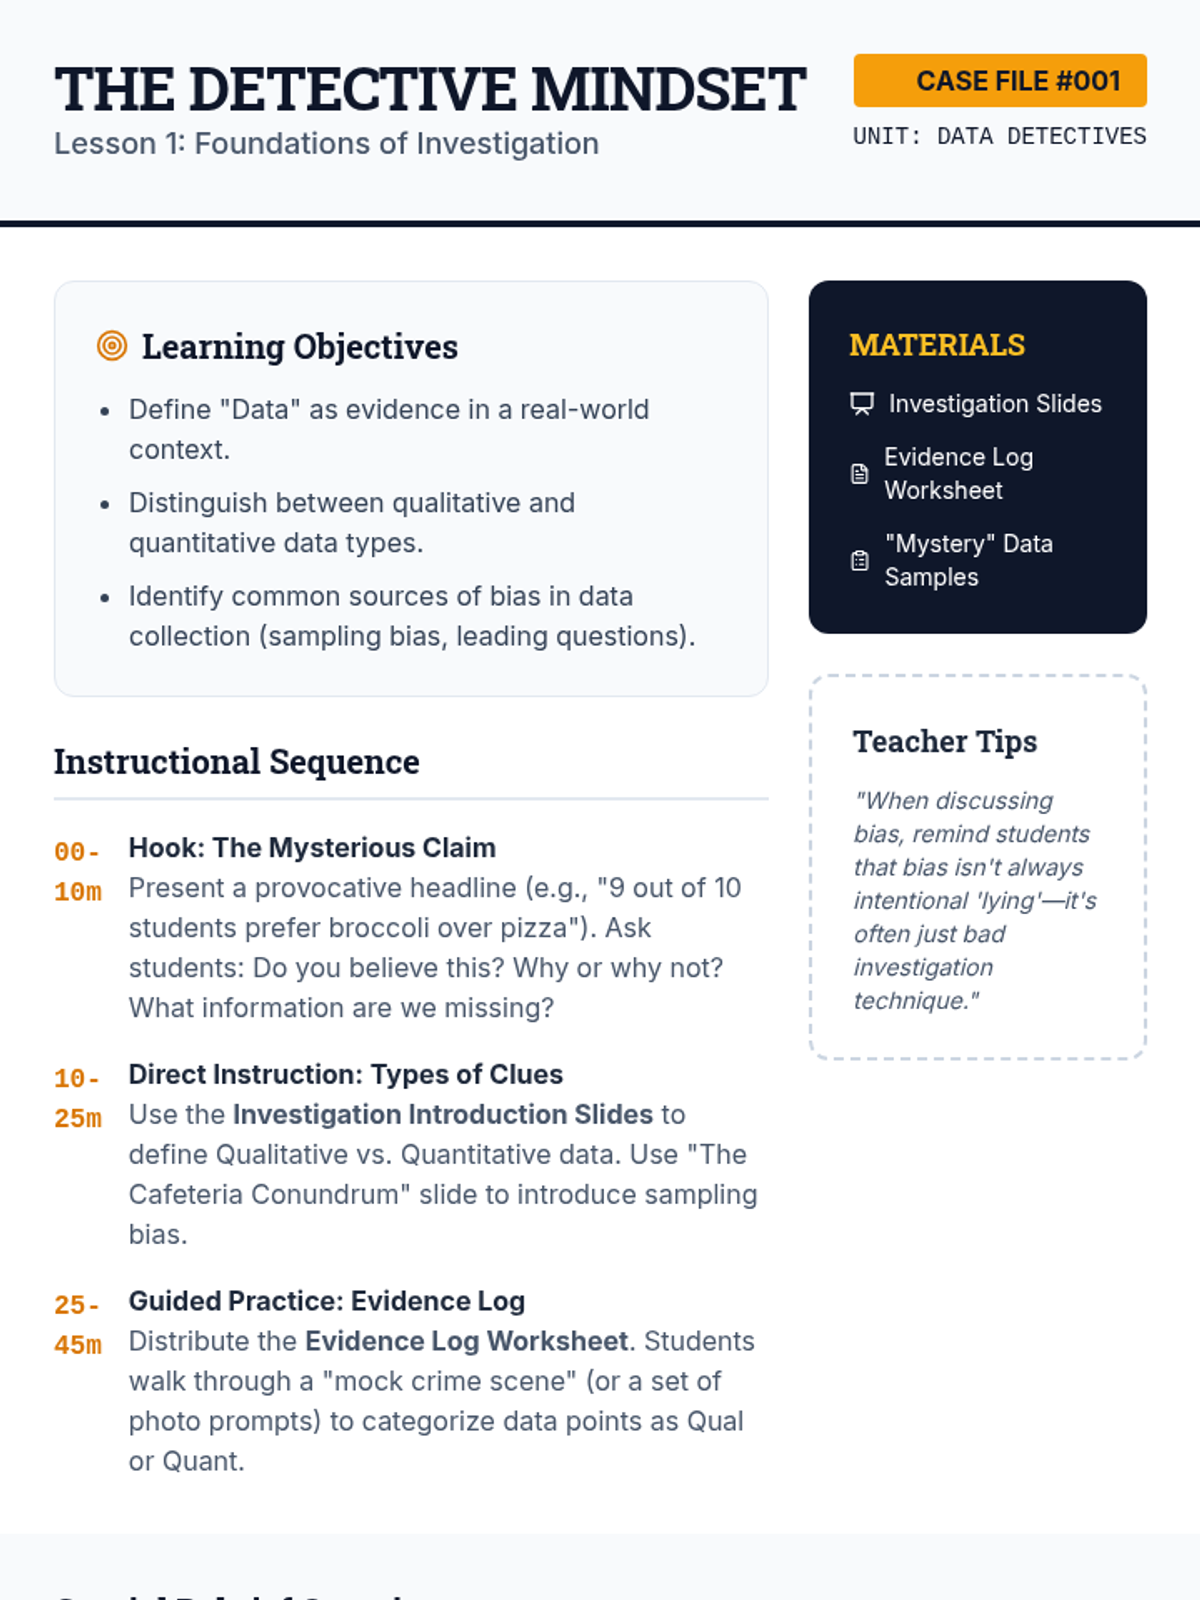
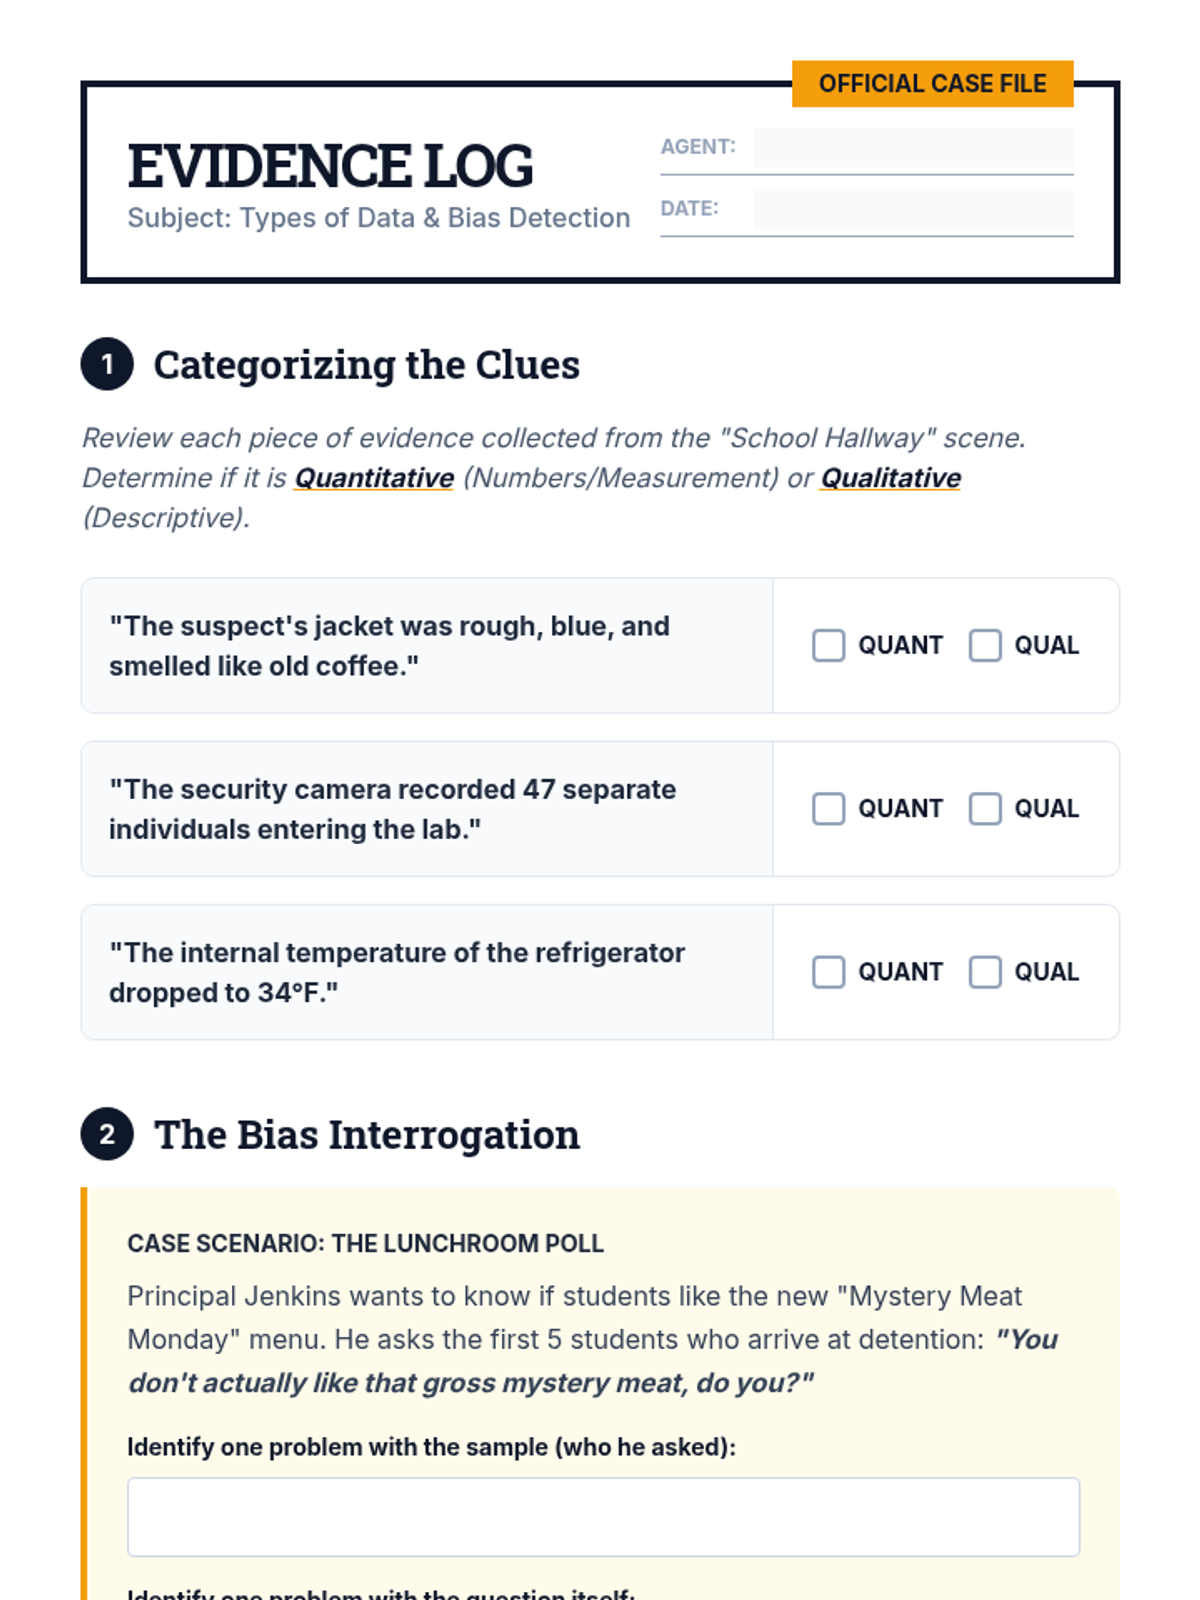
Students are introduced to the 'Data Detective' mindset, learning to distinguish between qualitative and quantitative data and identifying potential biases in datasets.
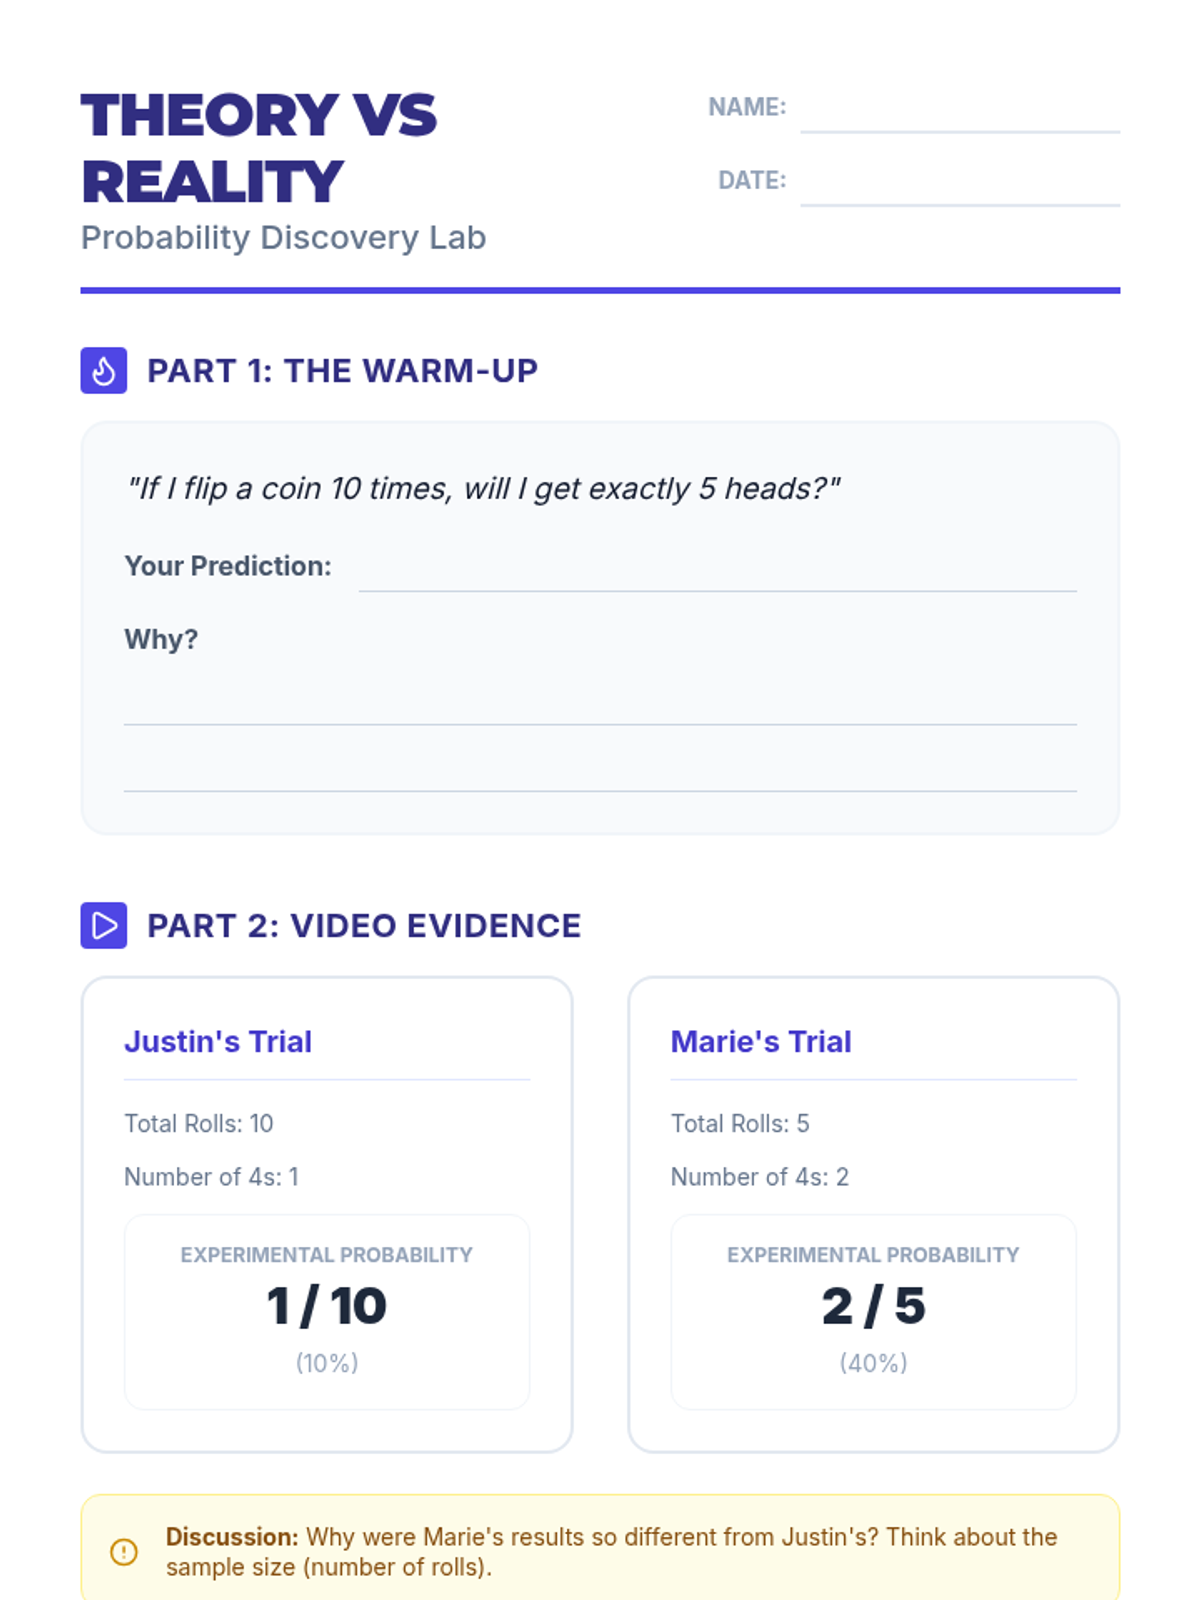
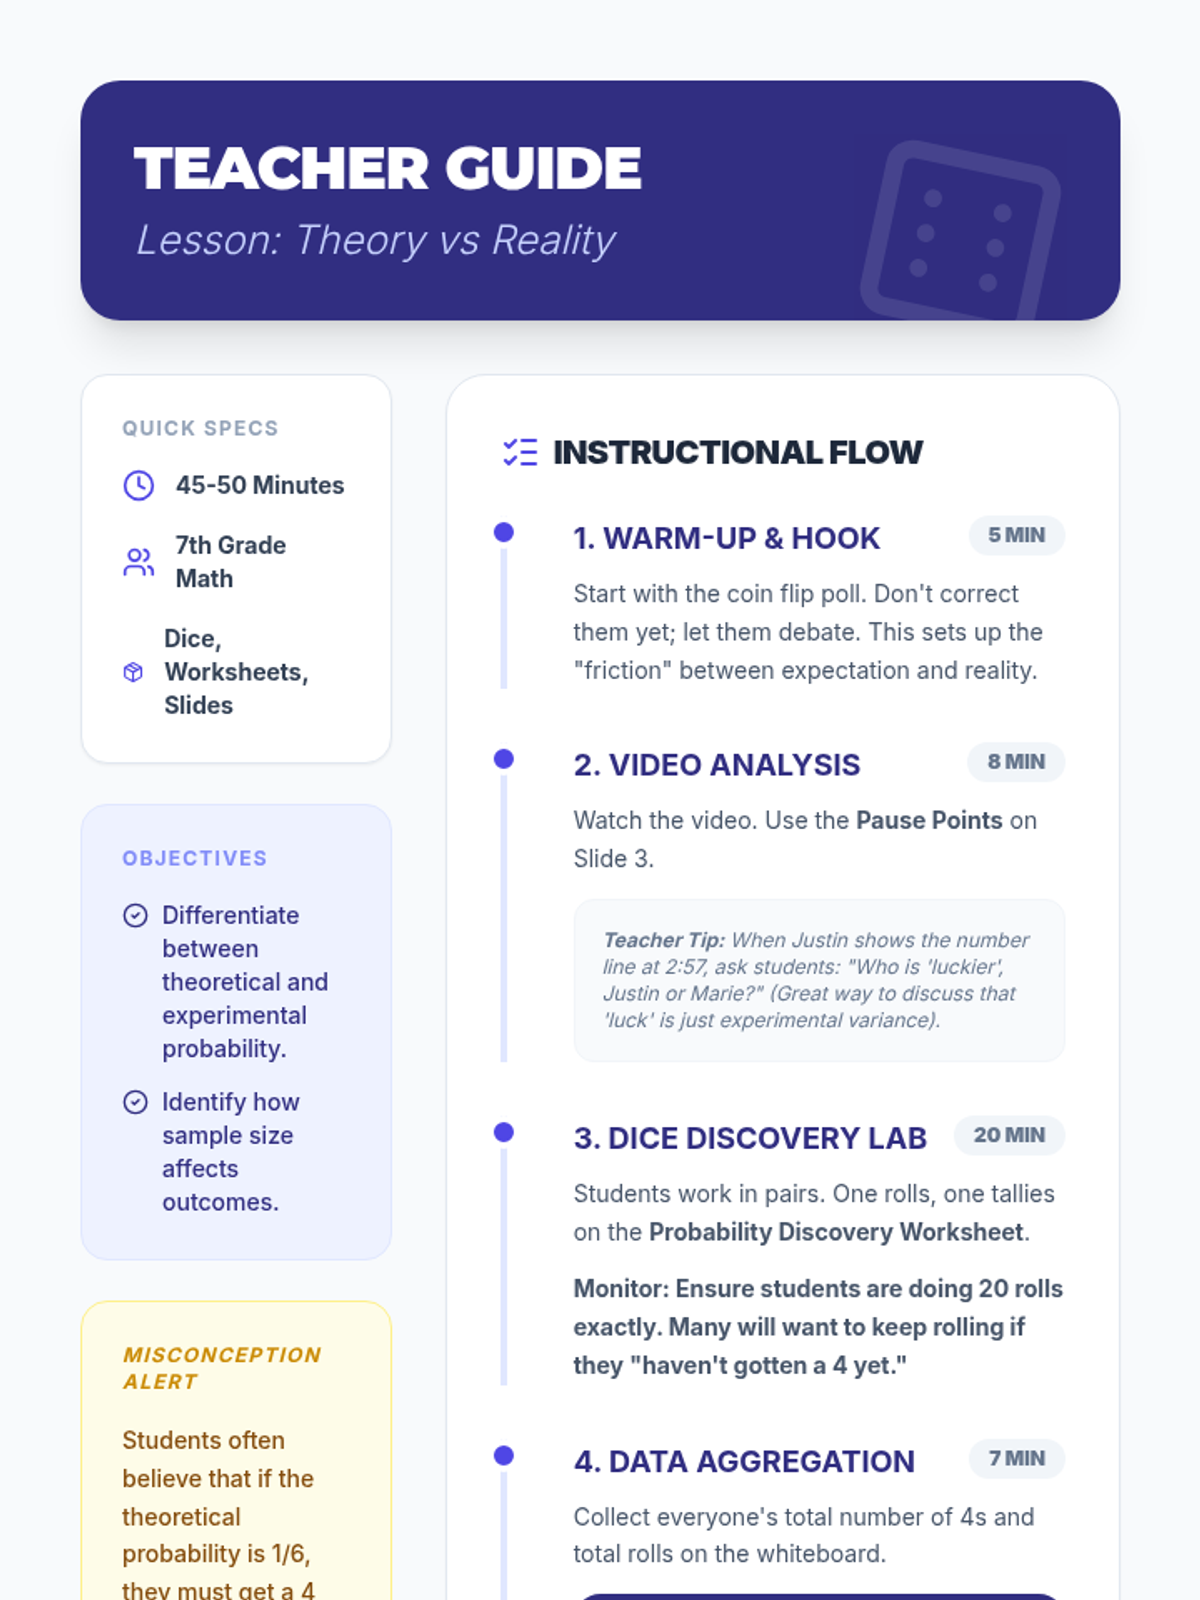
A hands-on exploration of theoretical versus experimental probability using a dice rolling lab and video analysis. Students compare mathematical expectations with real-world data to discover how sample size affects results.
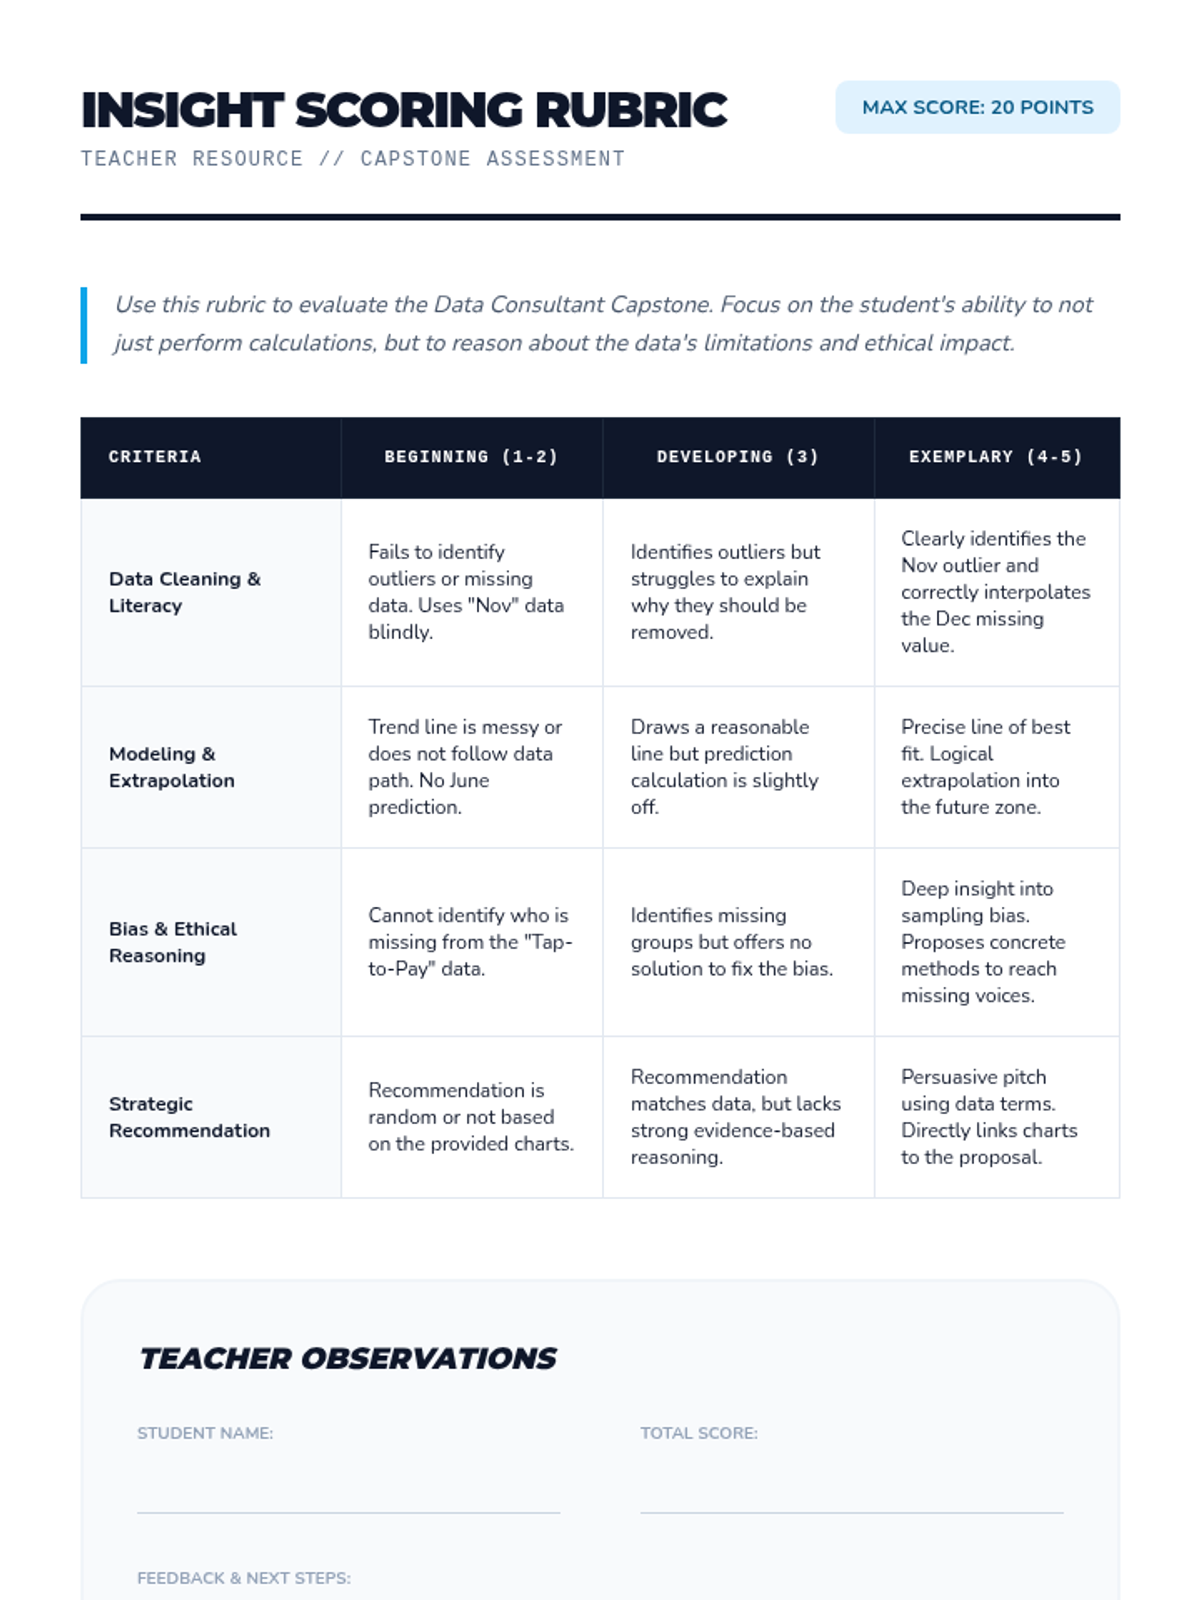
Students act as consultants to solve a real-world problem using a complex dataset. They synthesize cleaning, visualization, and modeling to provide actionable recommendations.
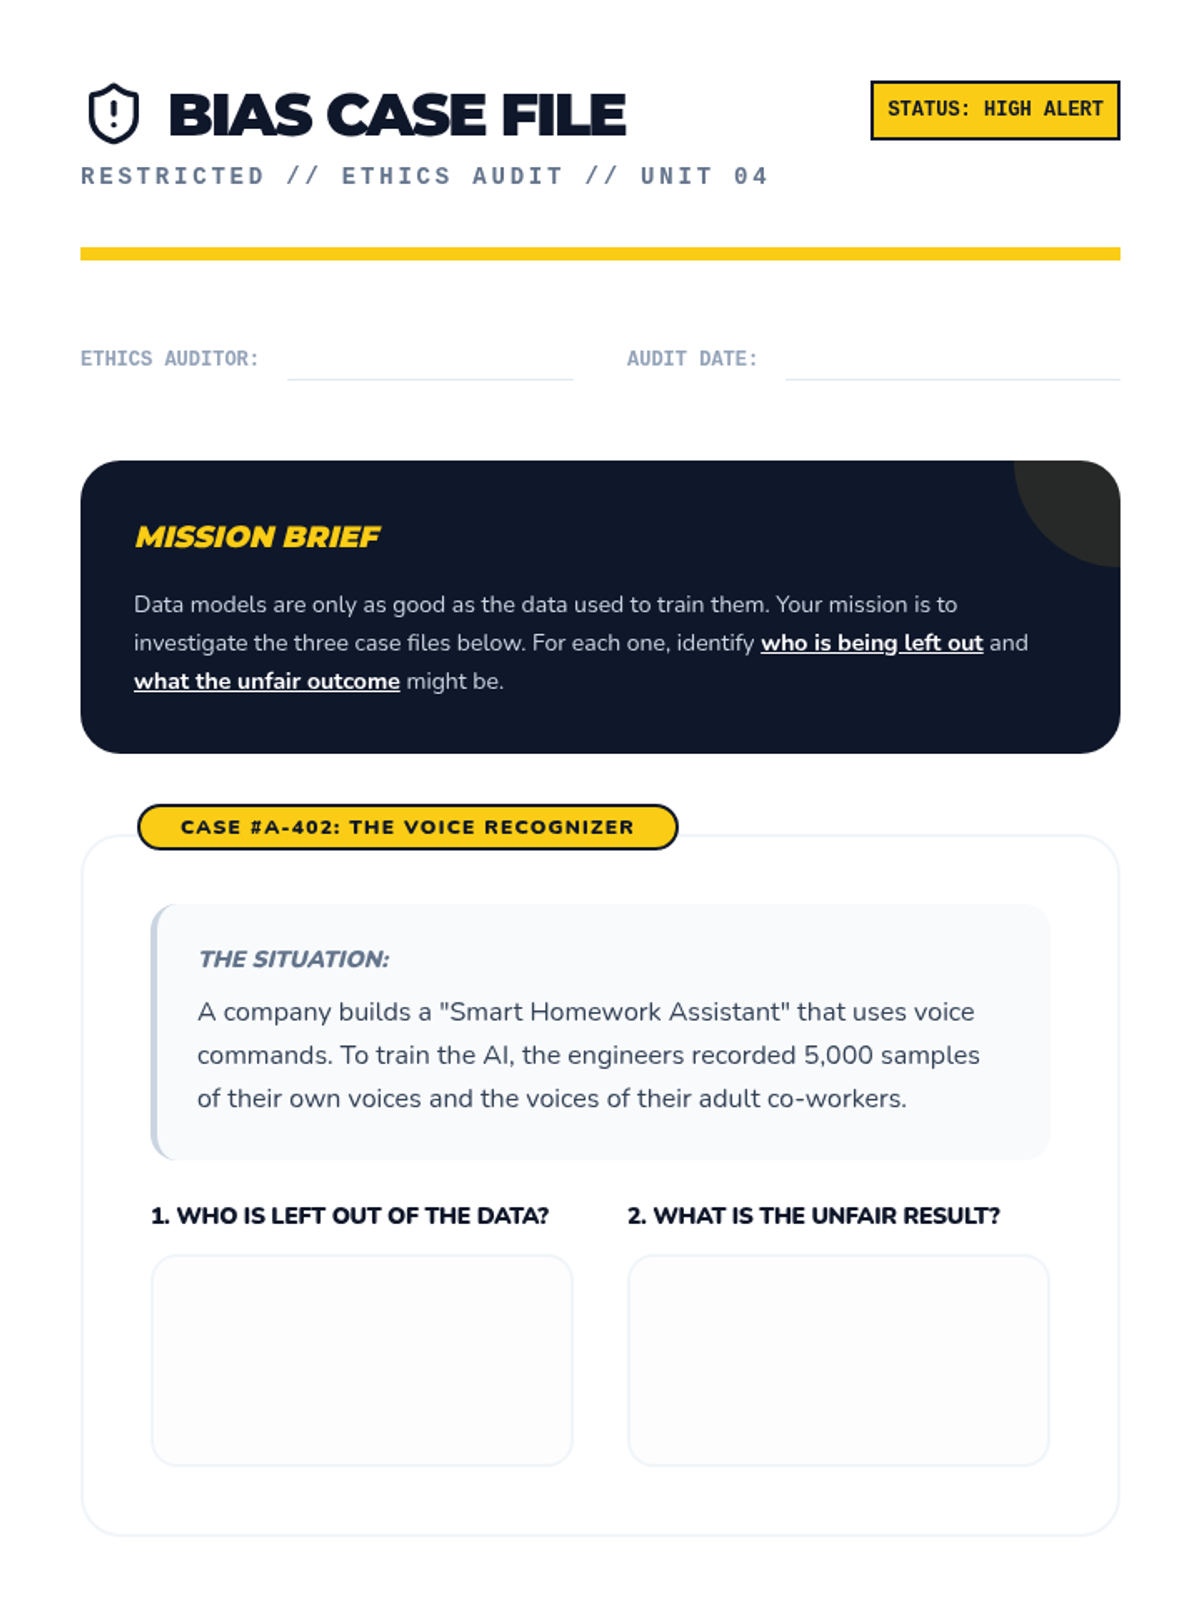
Students identify how missing or biased data collection leads to unfair models. They analyze ethics in data science through real-world case studies of algorithmic bias.
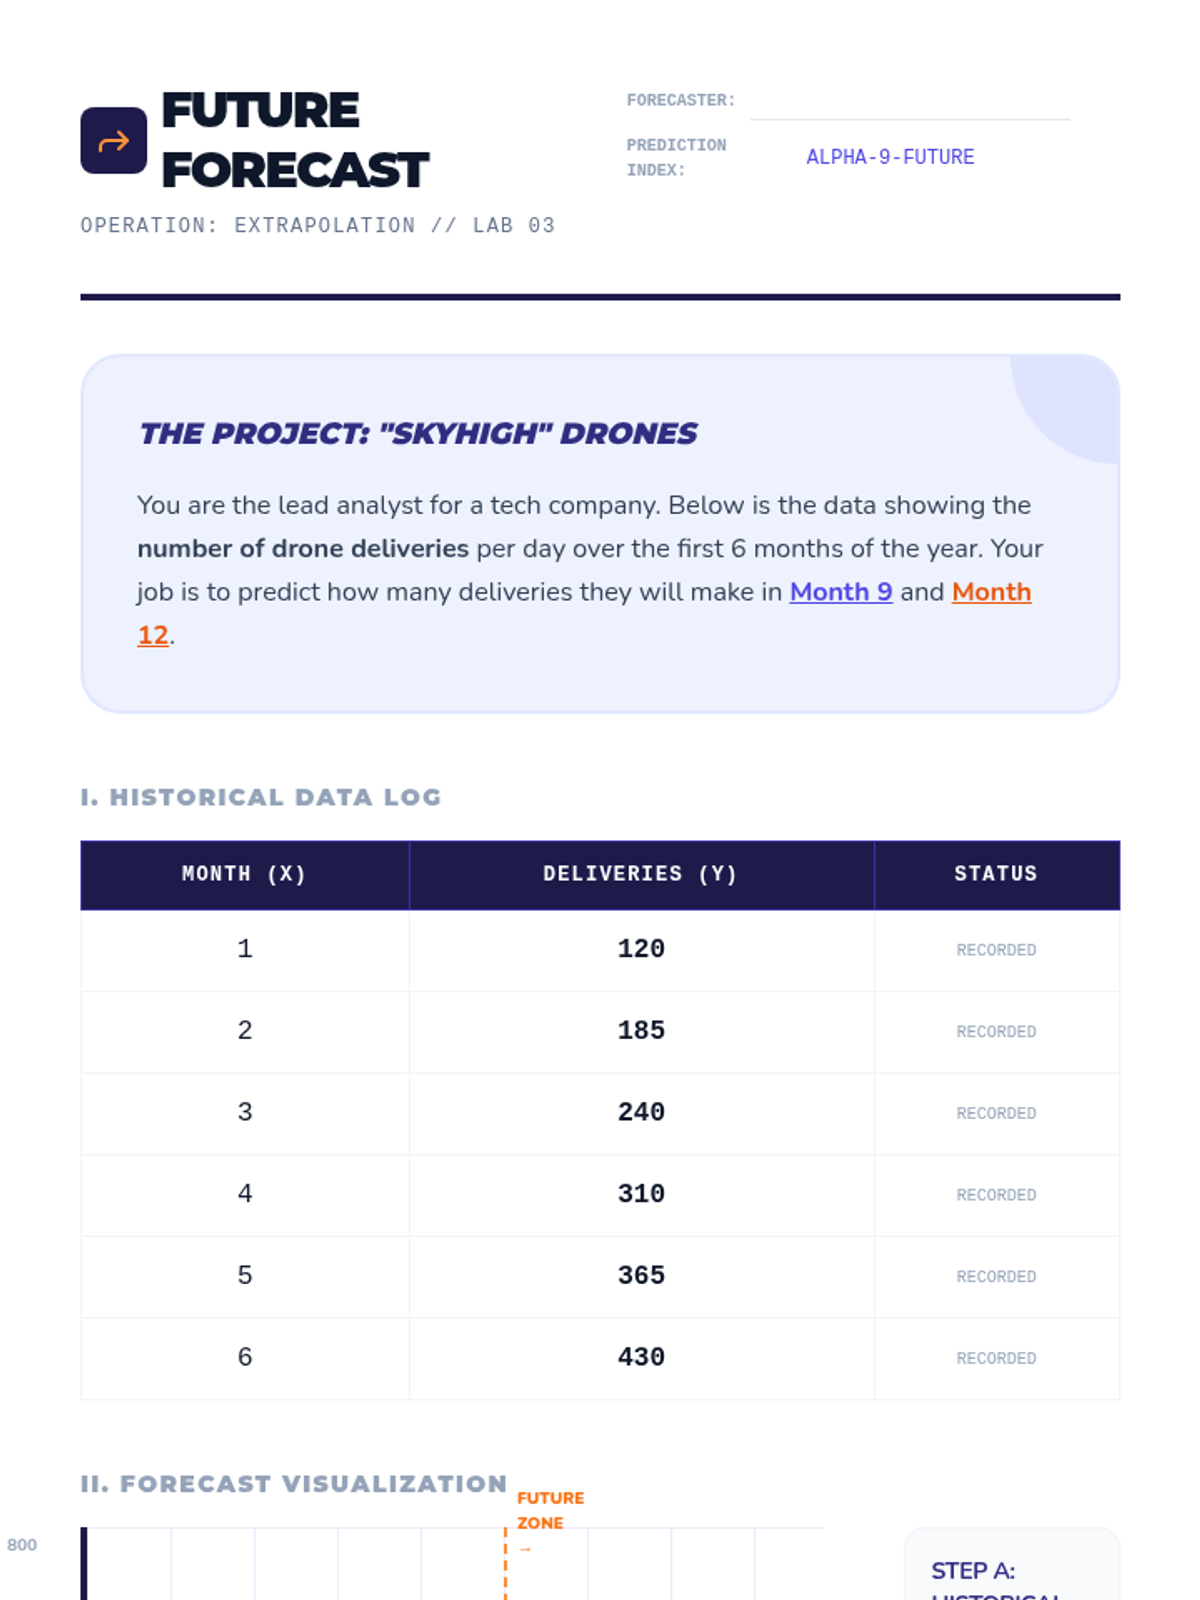
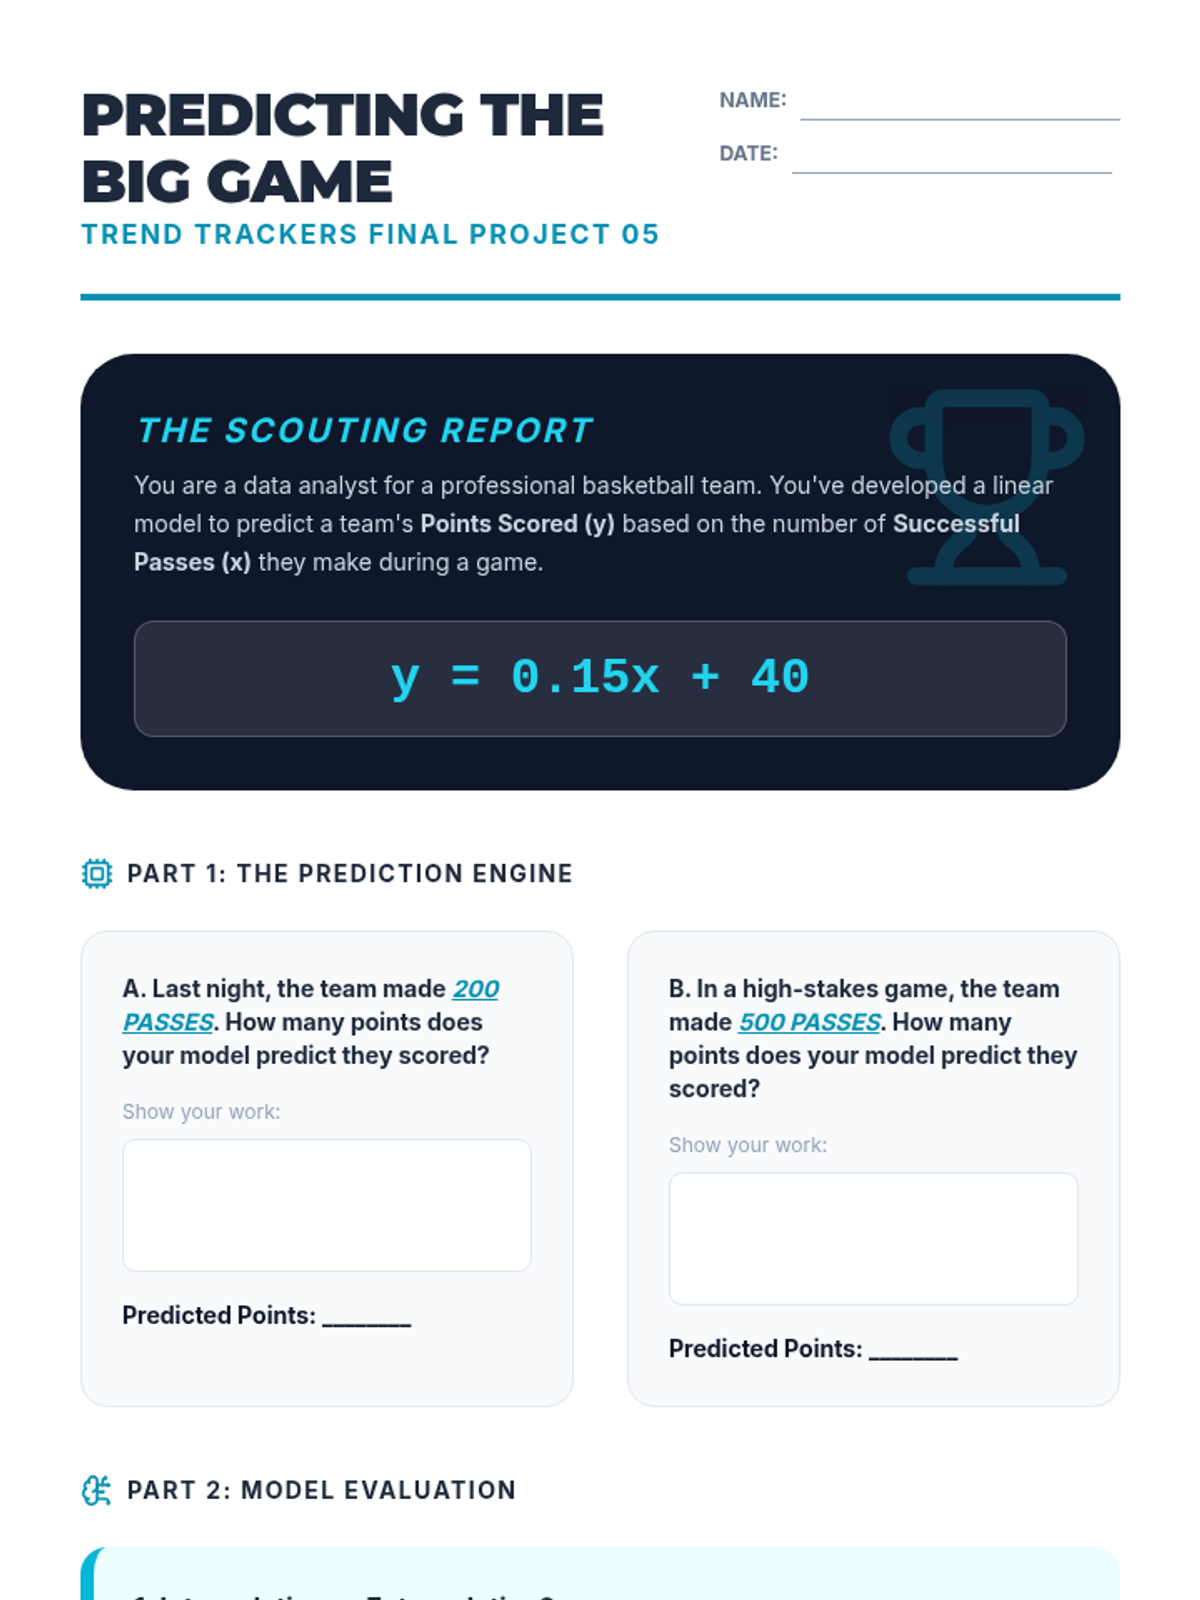
Students use trend lines to extrapolate future values and discuss the reliability of long-term predictions. They learn about the utility and limits of predictive modeling.
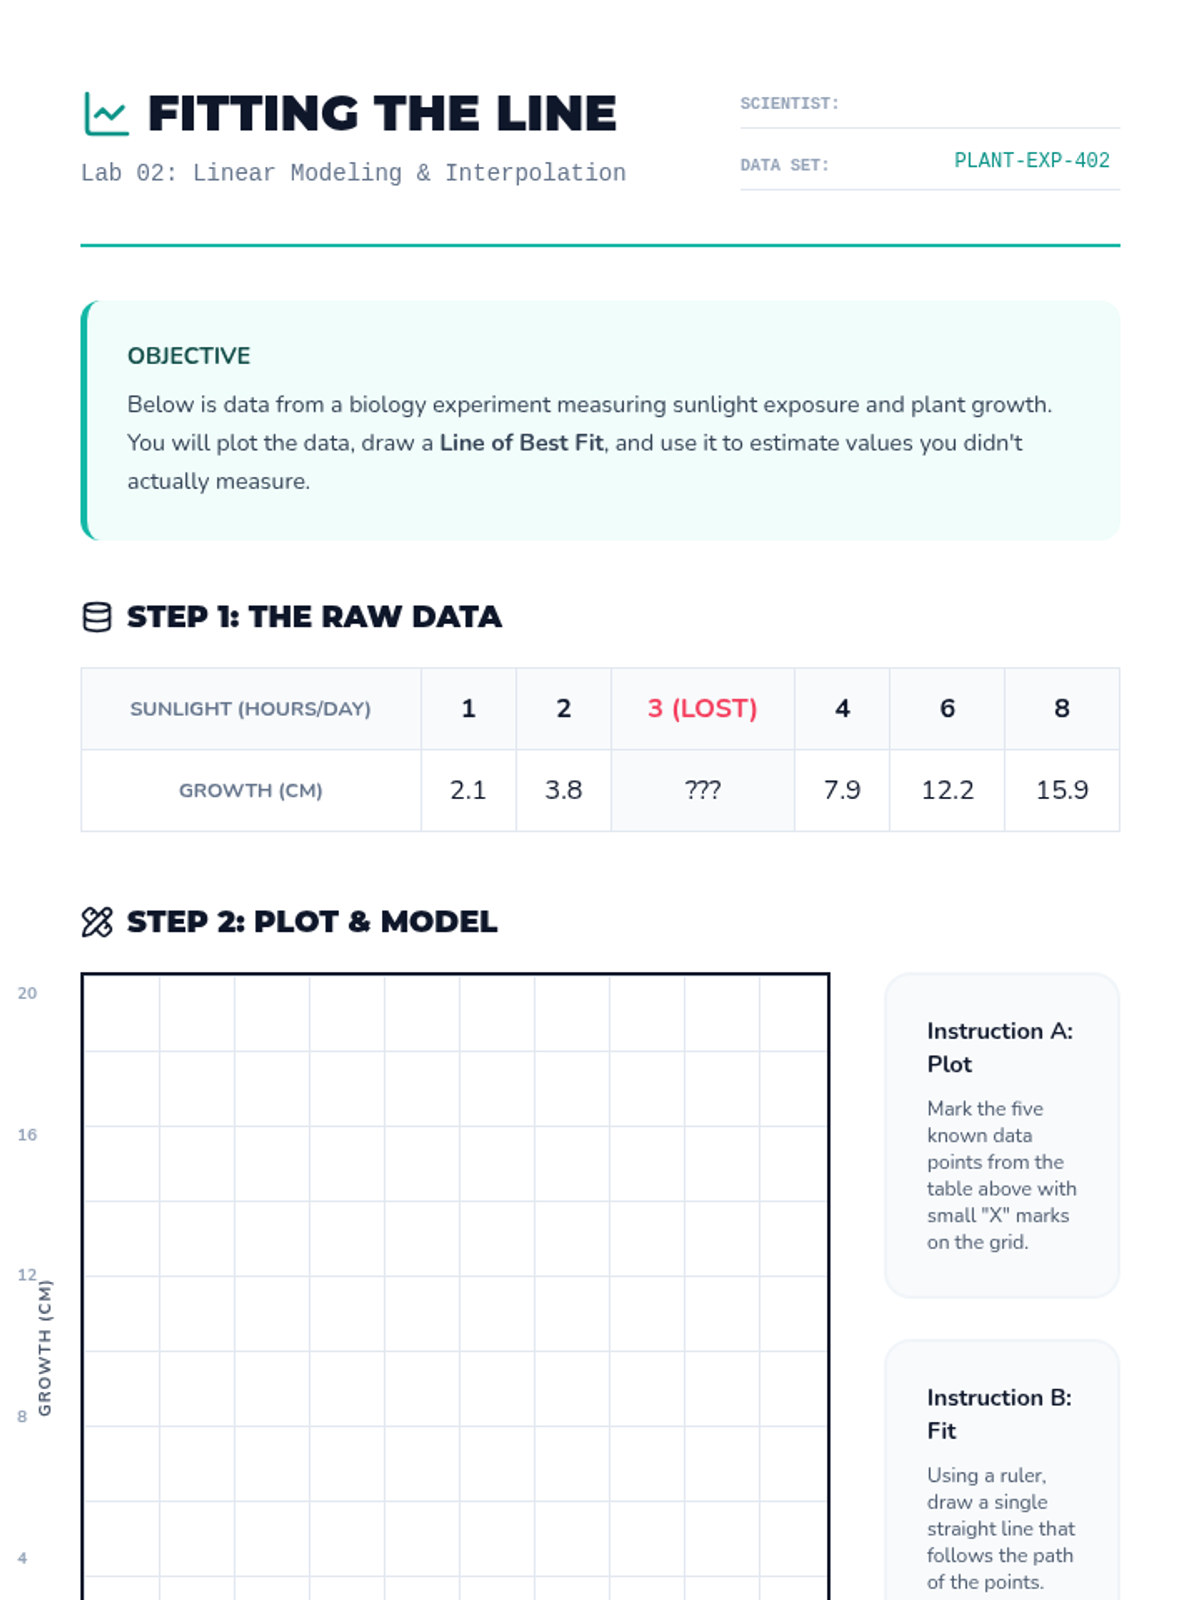
Students learn to fit simple trend lines to scatter plots to model data direction. They practice interpolation to estimate missing values within a data range.
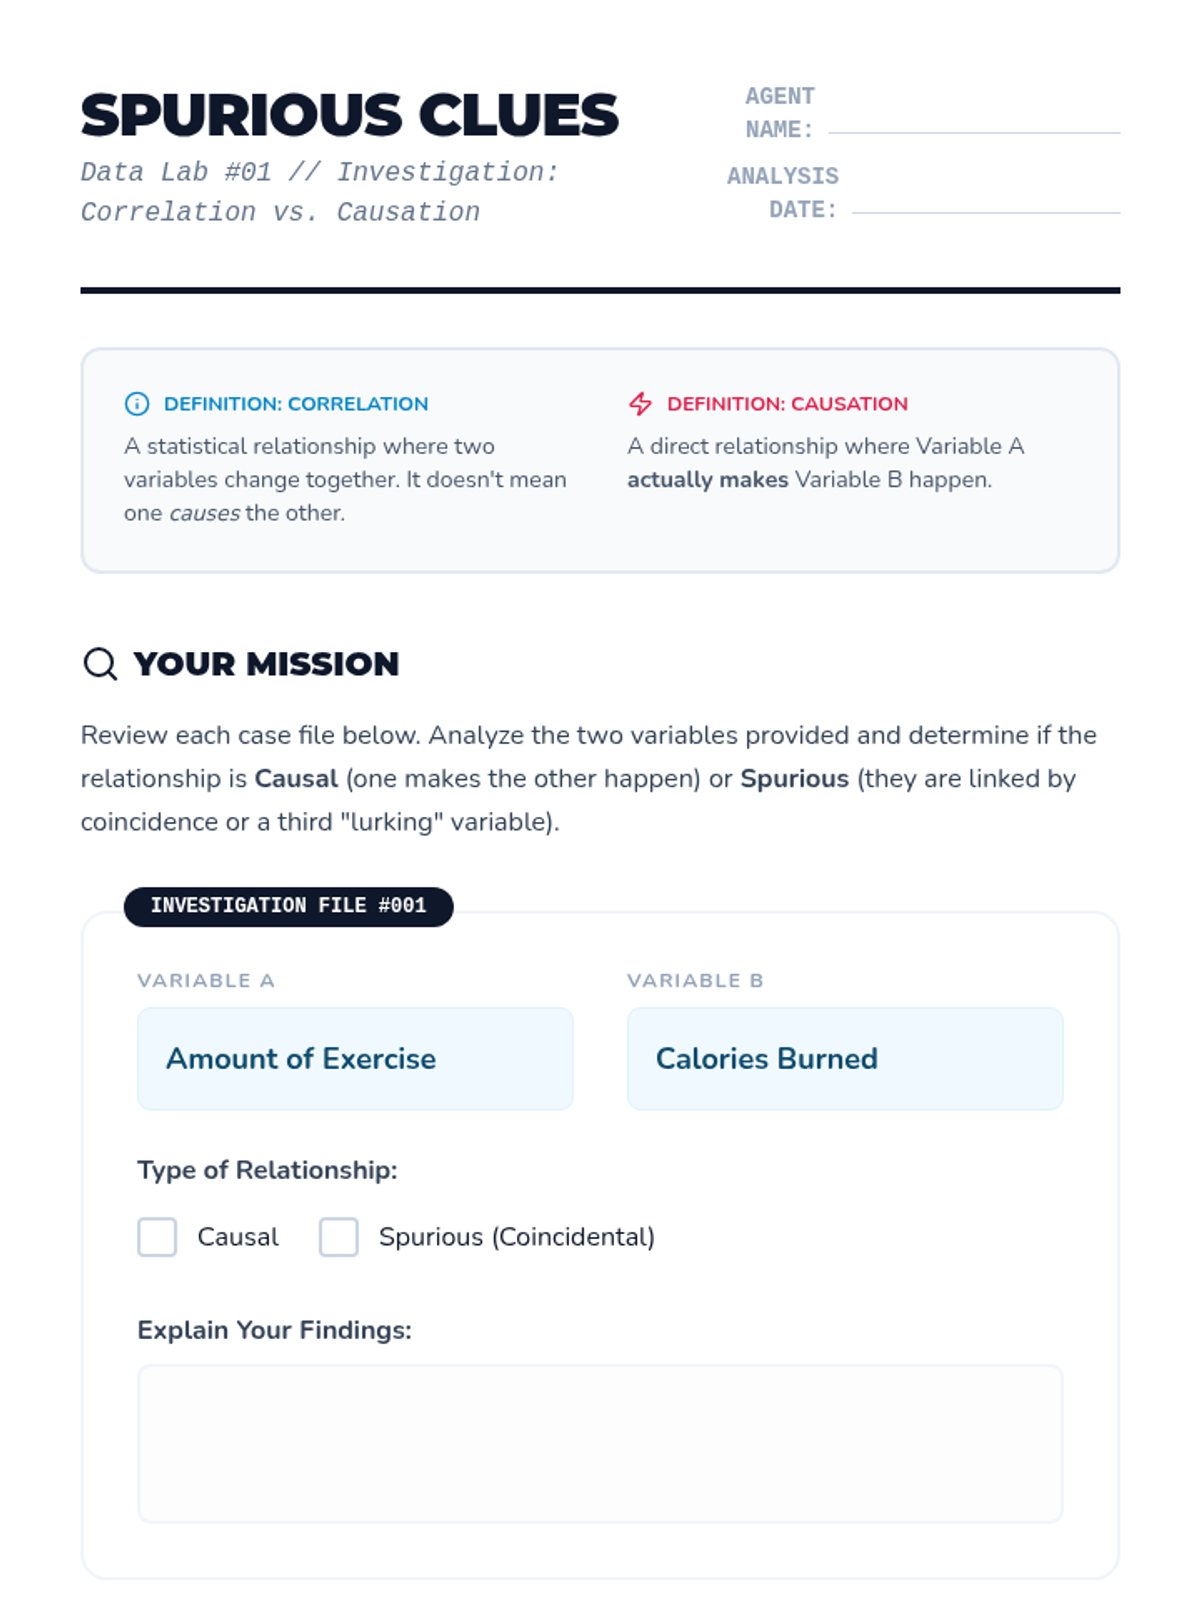
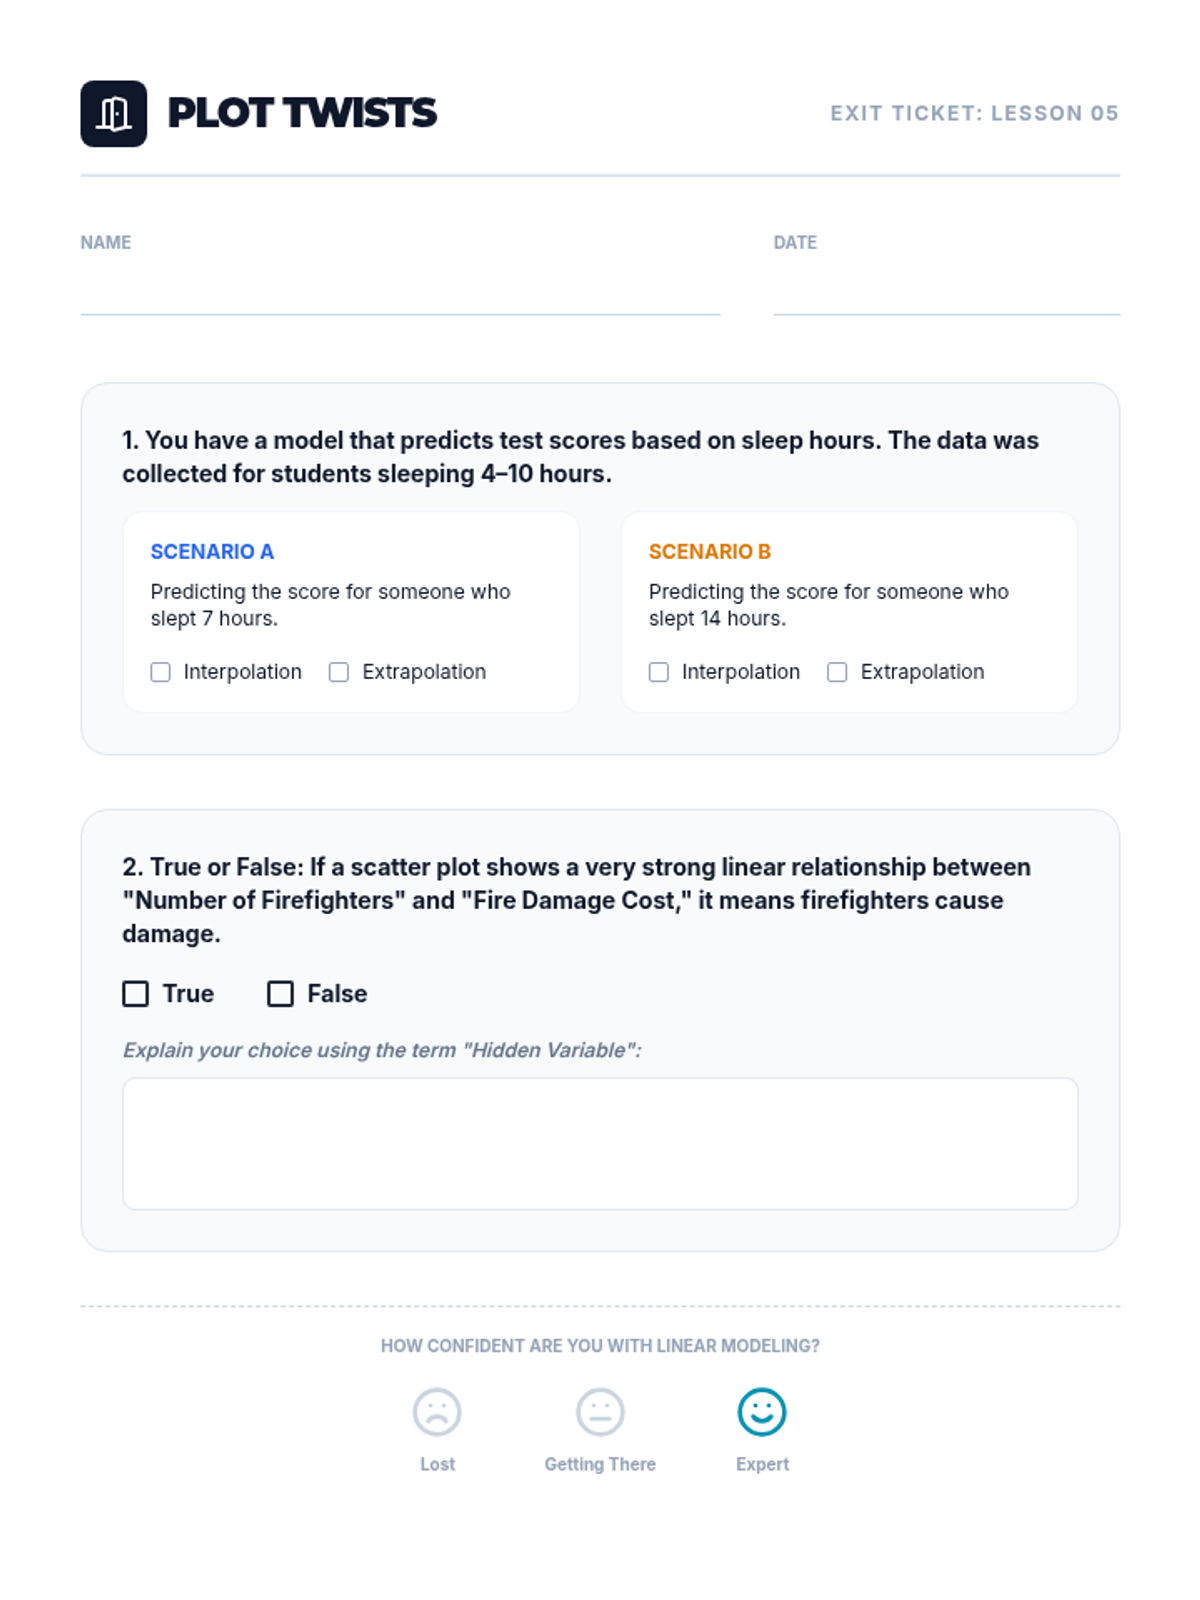
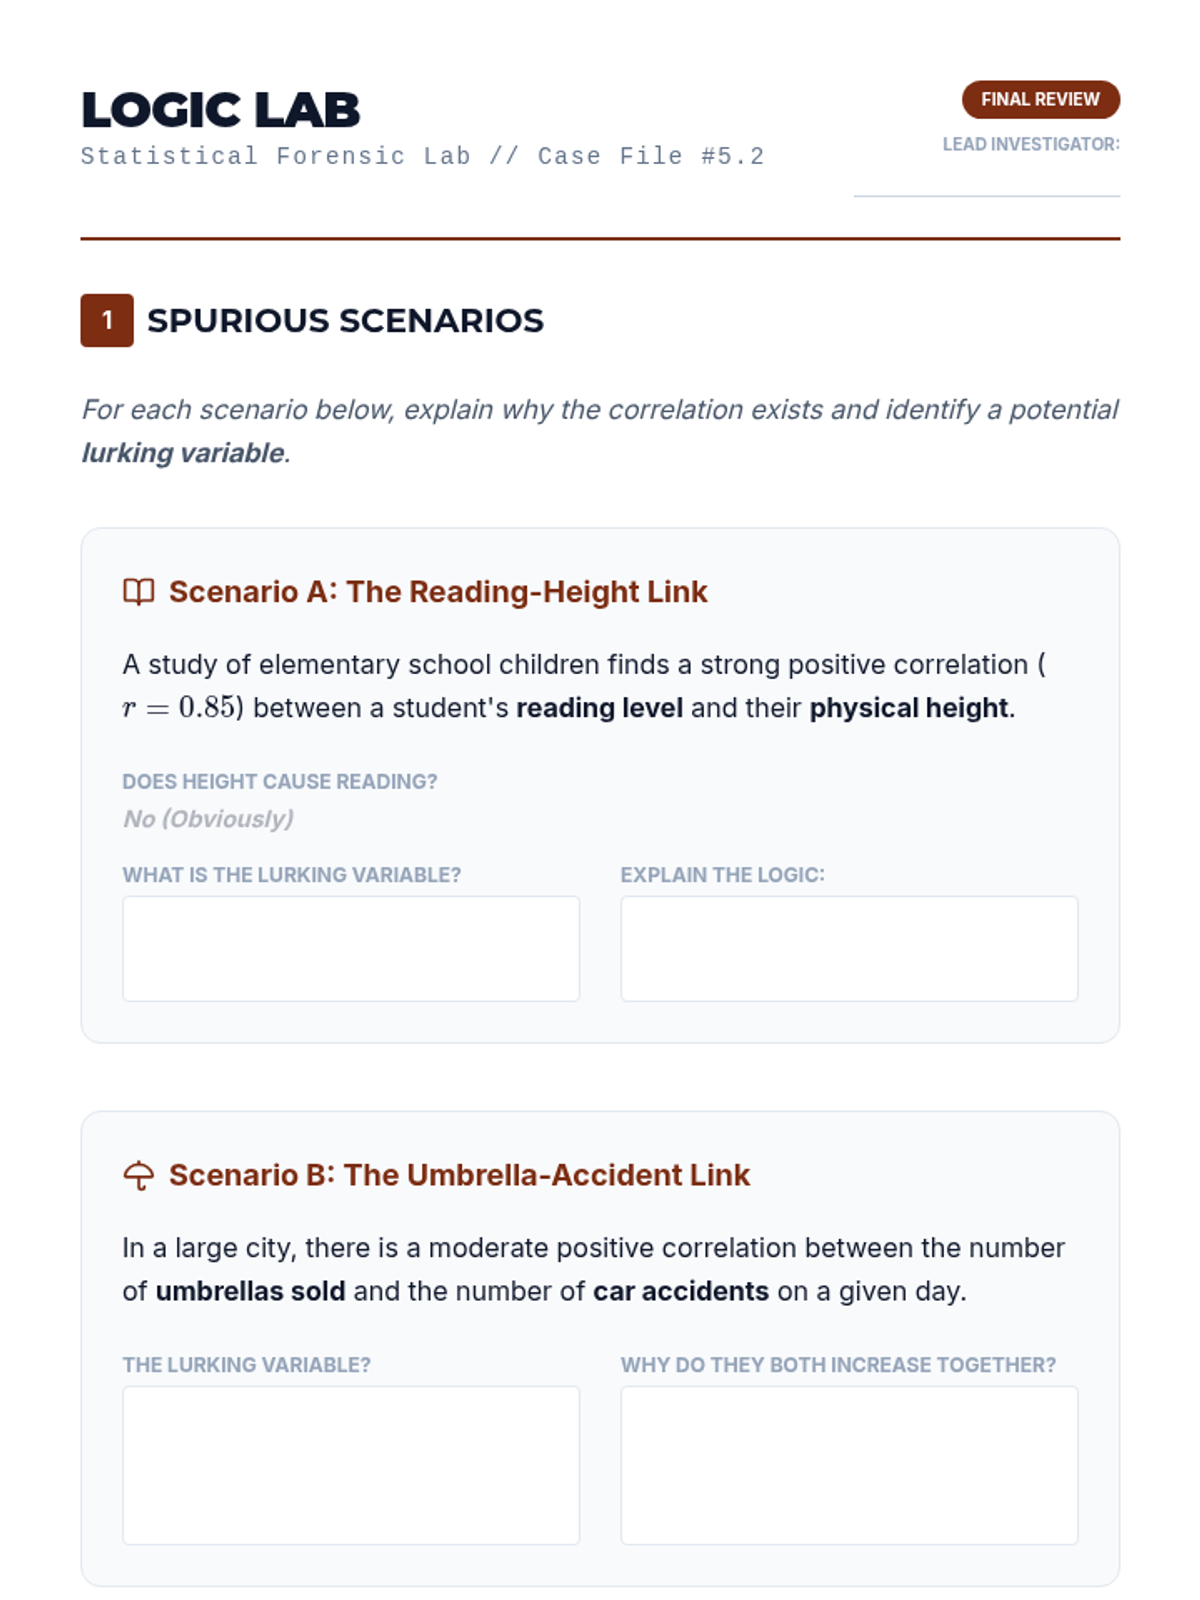
Students distinguish between variables that are coincidental and those that have a causal relationship. They analyze spurious correlations to build critical thinking skills in data analysis.
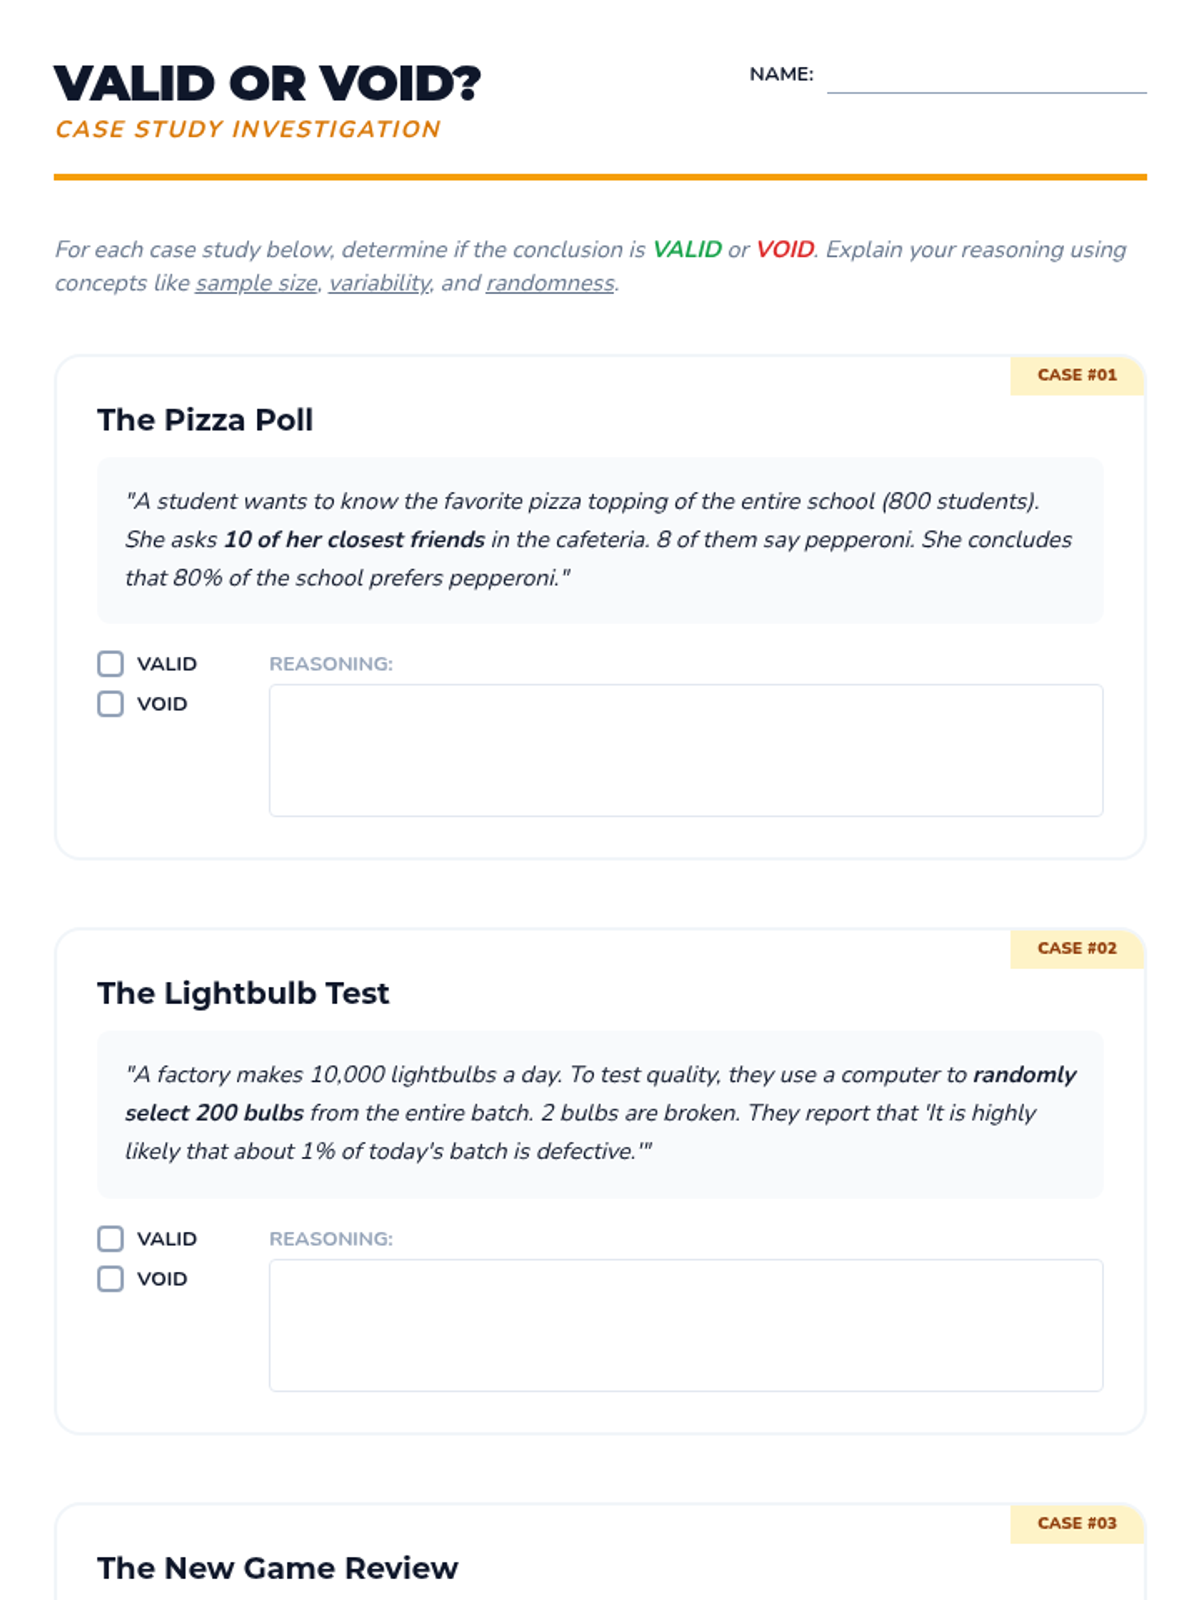
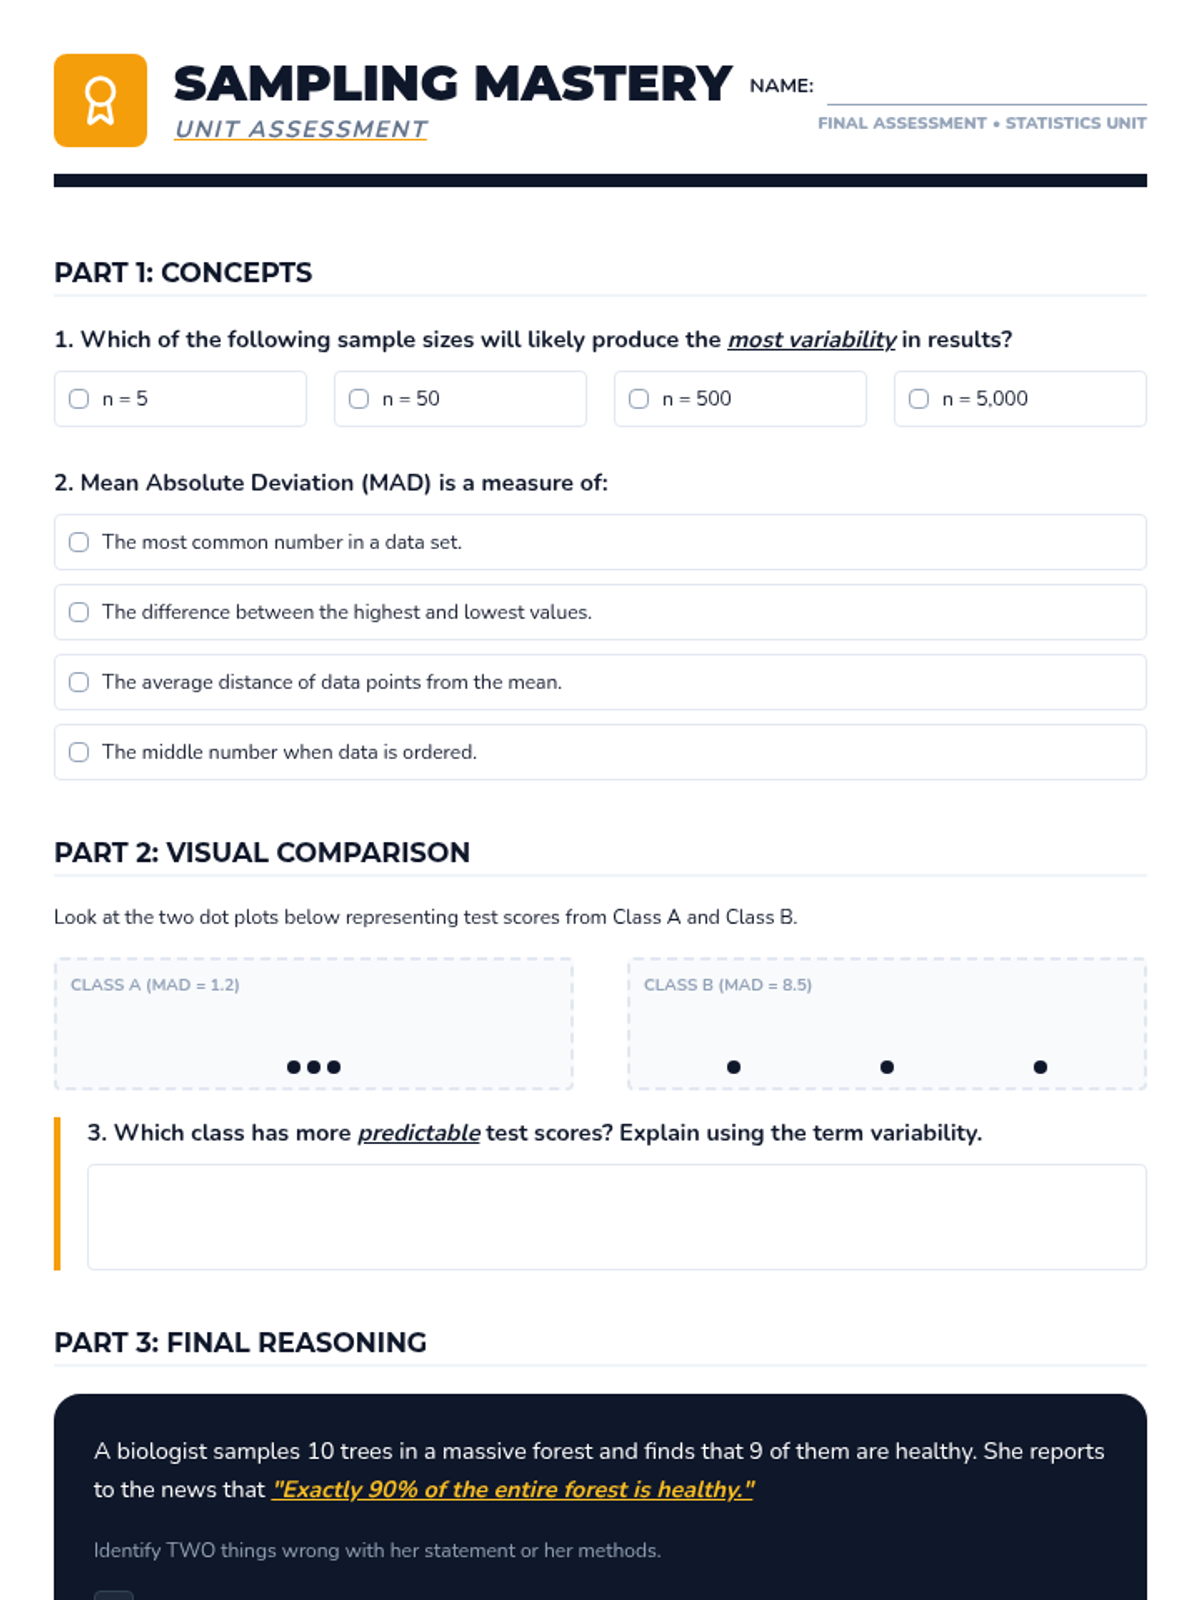
Students are presented with various sampling scenarios and must decide if the sample size and method are sufficient to draw a valid conclusion. They practice using language that reflects statistical uncertainty (likely, probable, estimated).
Students utilize their linear equations to predict values for data points inside (interpolation) and outside (extrapolation) the original data range. They also critically analyze the difference between correlation and causation.
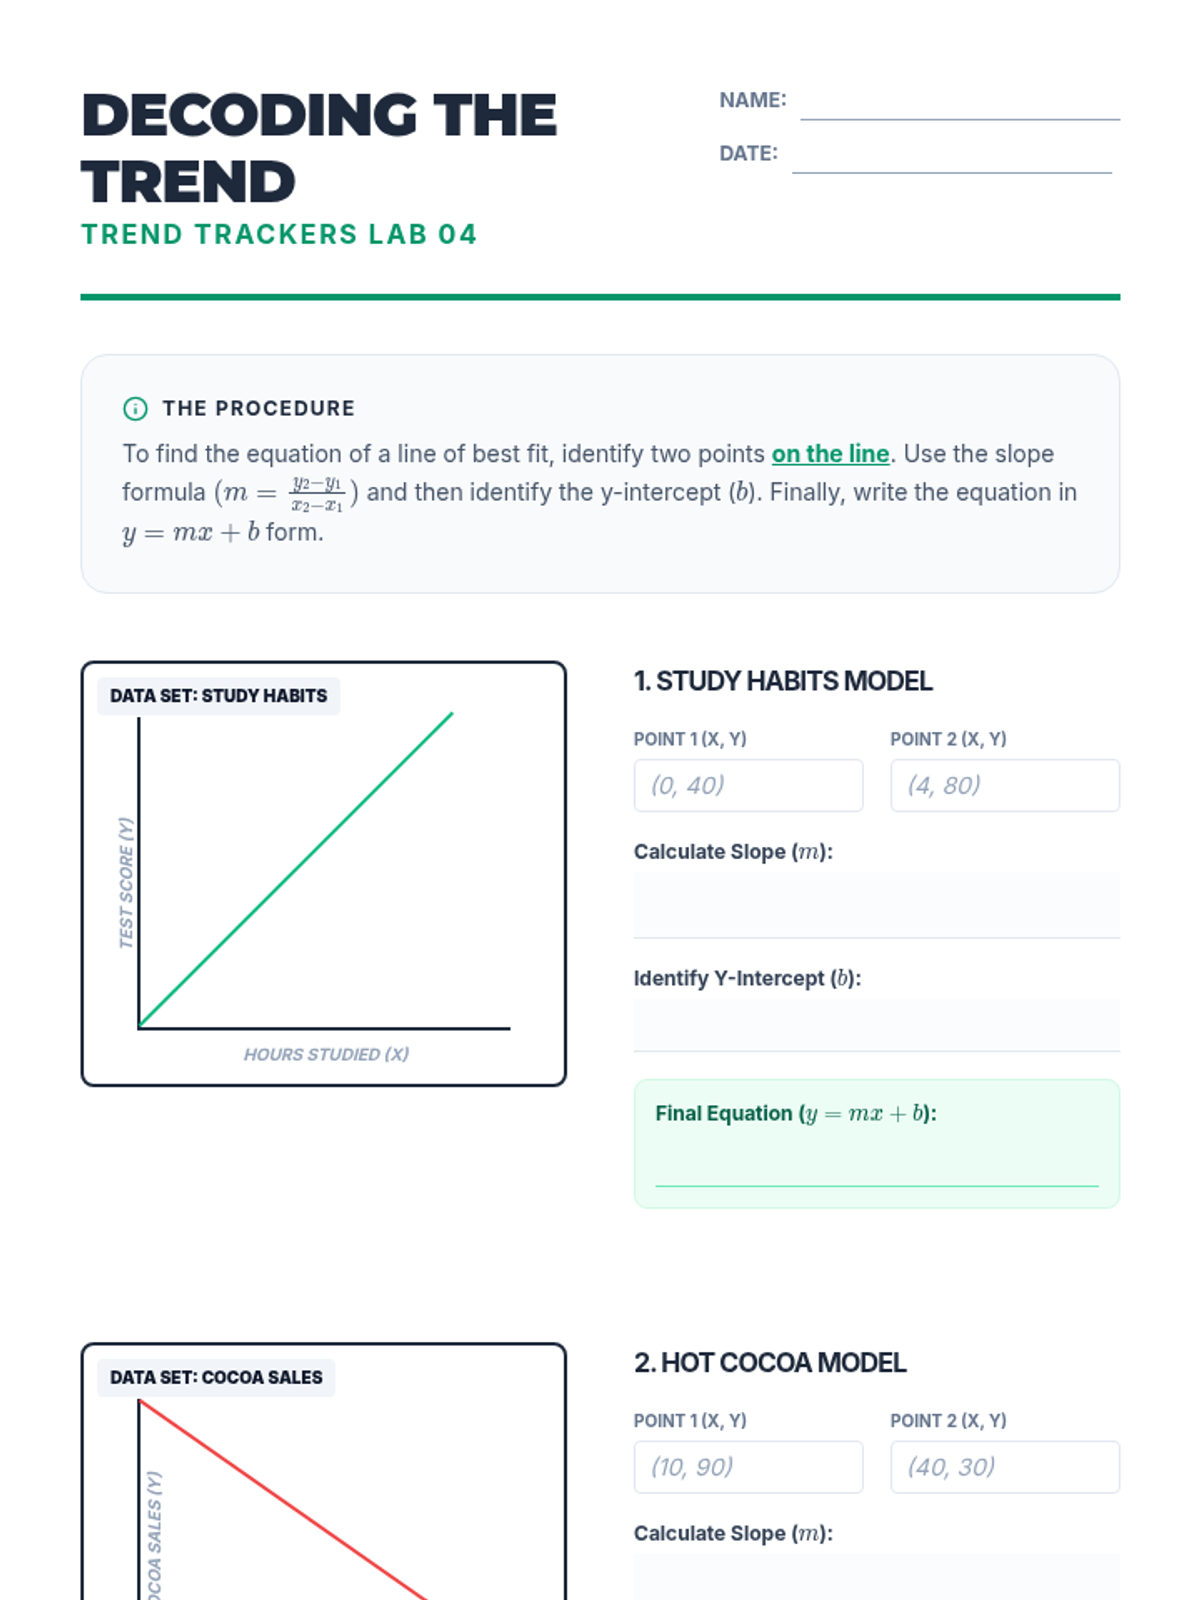
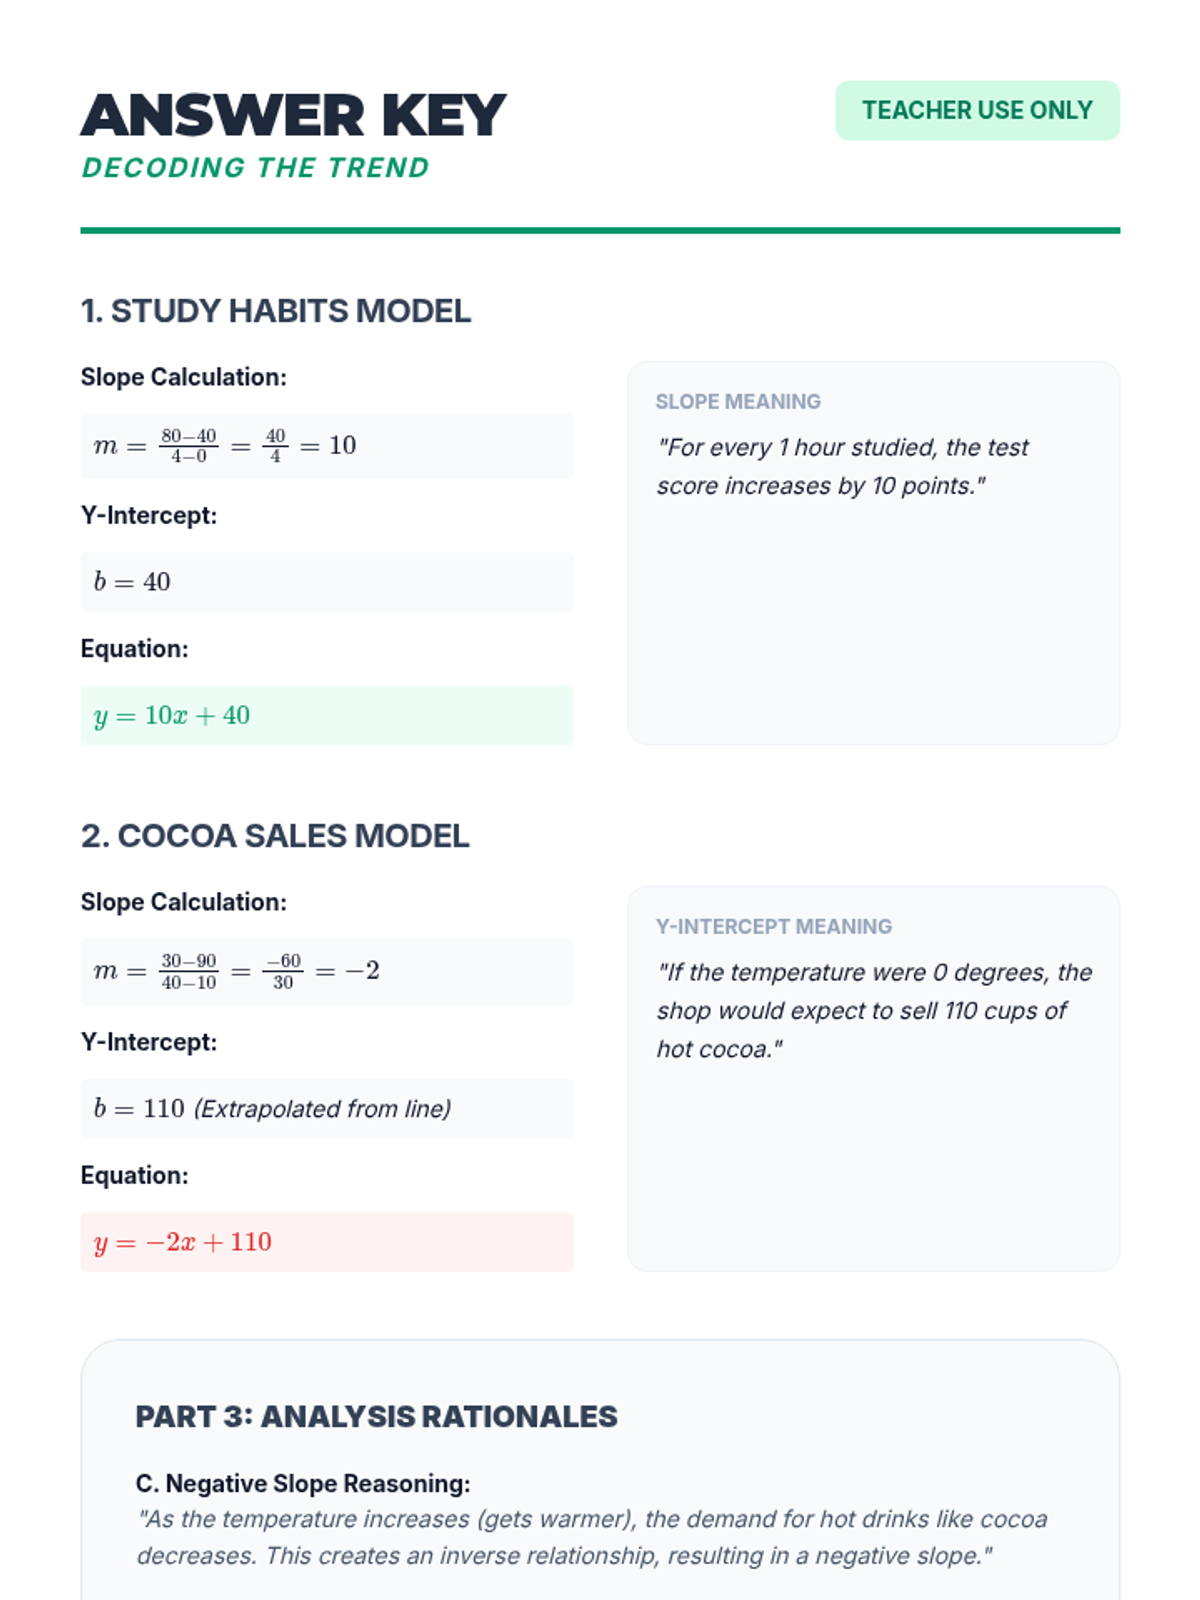
Using their drawn lines of best fit, students identify two distinct points on the line to calculate the slope and determine the y-intercept. They write the equation of the line in slope-intercept form (y = mx + b) and interpret these values in context.
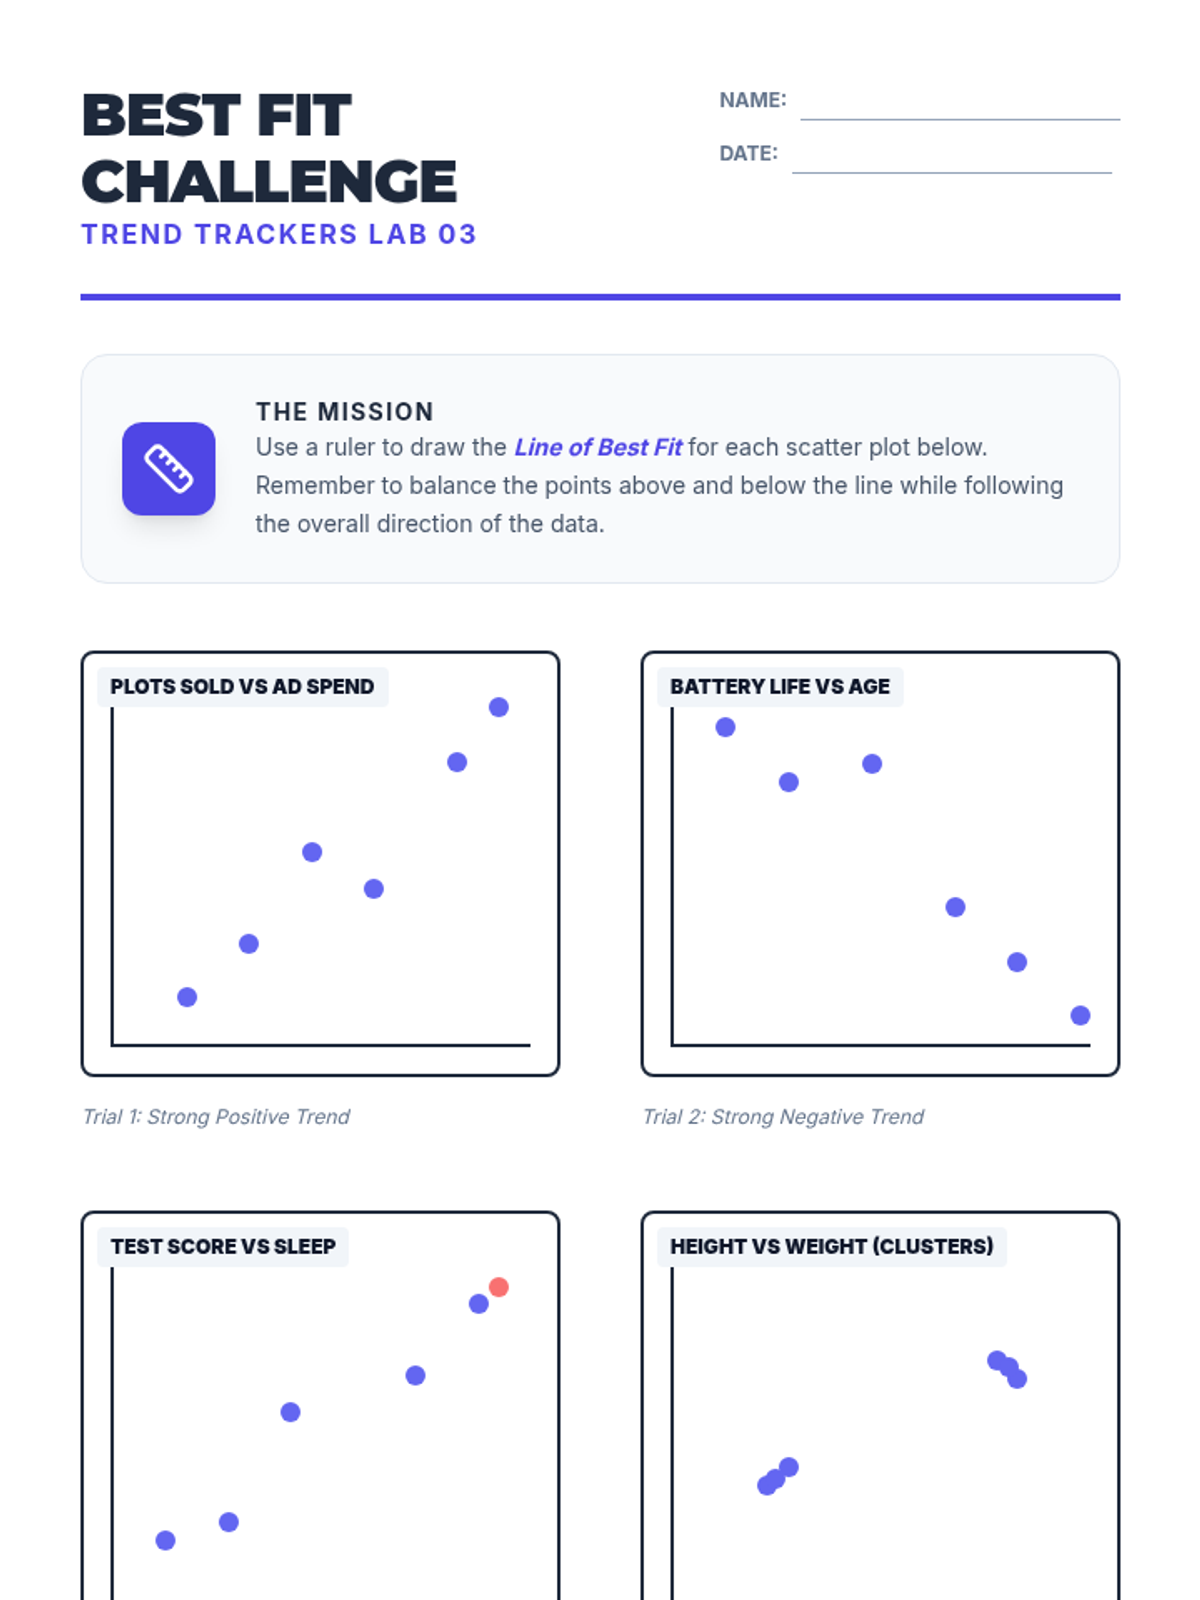
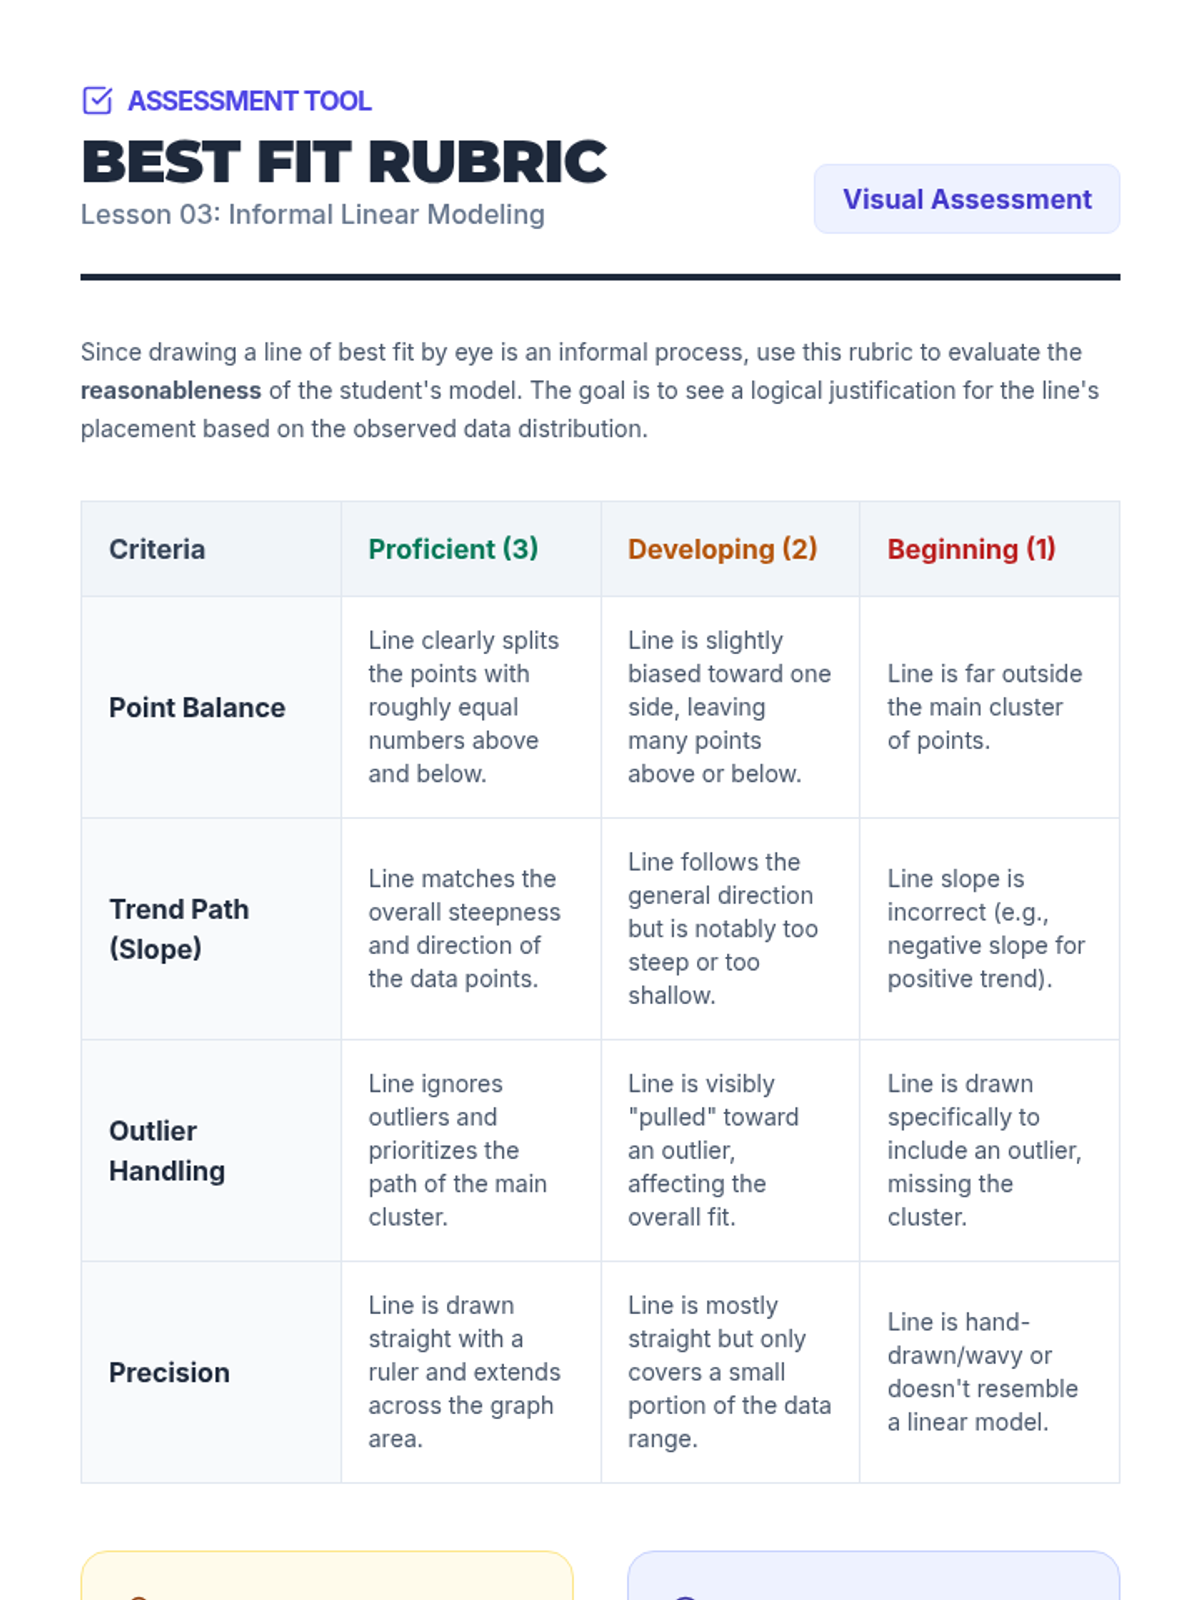
Students learn to draw a straight line that best represents the trend in a scatter plot. They judge the 'goodness' of fit visually by balancing points above and below the line, understanding that a linear model summarizes complex data.
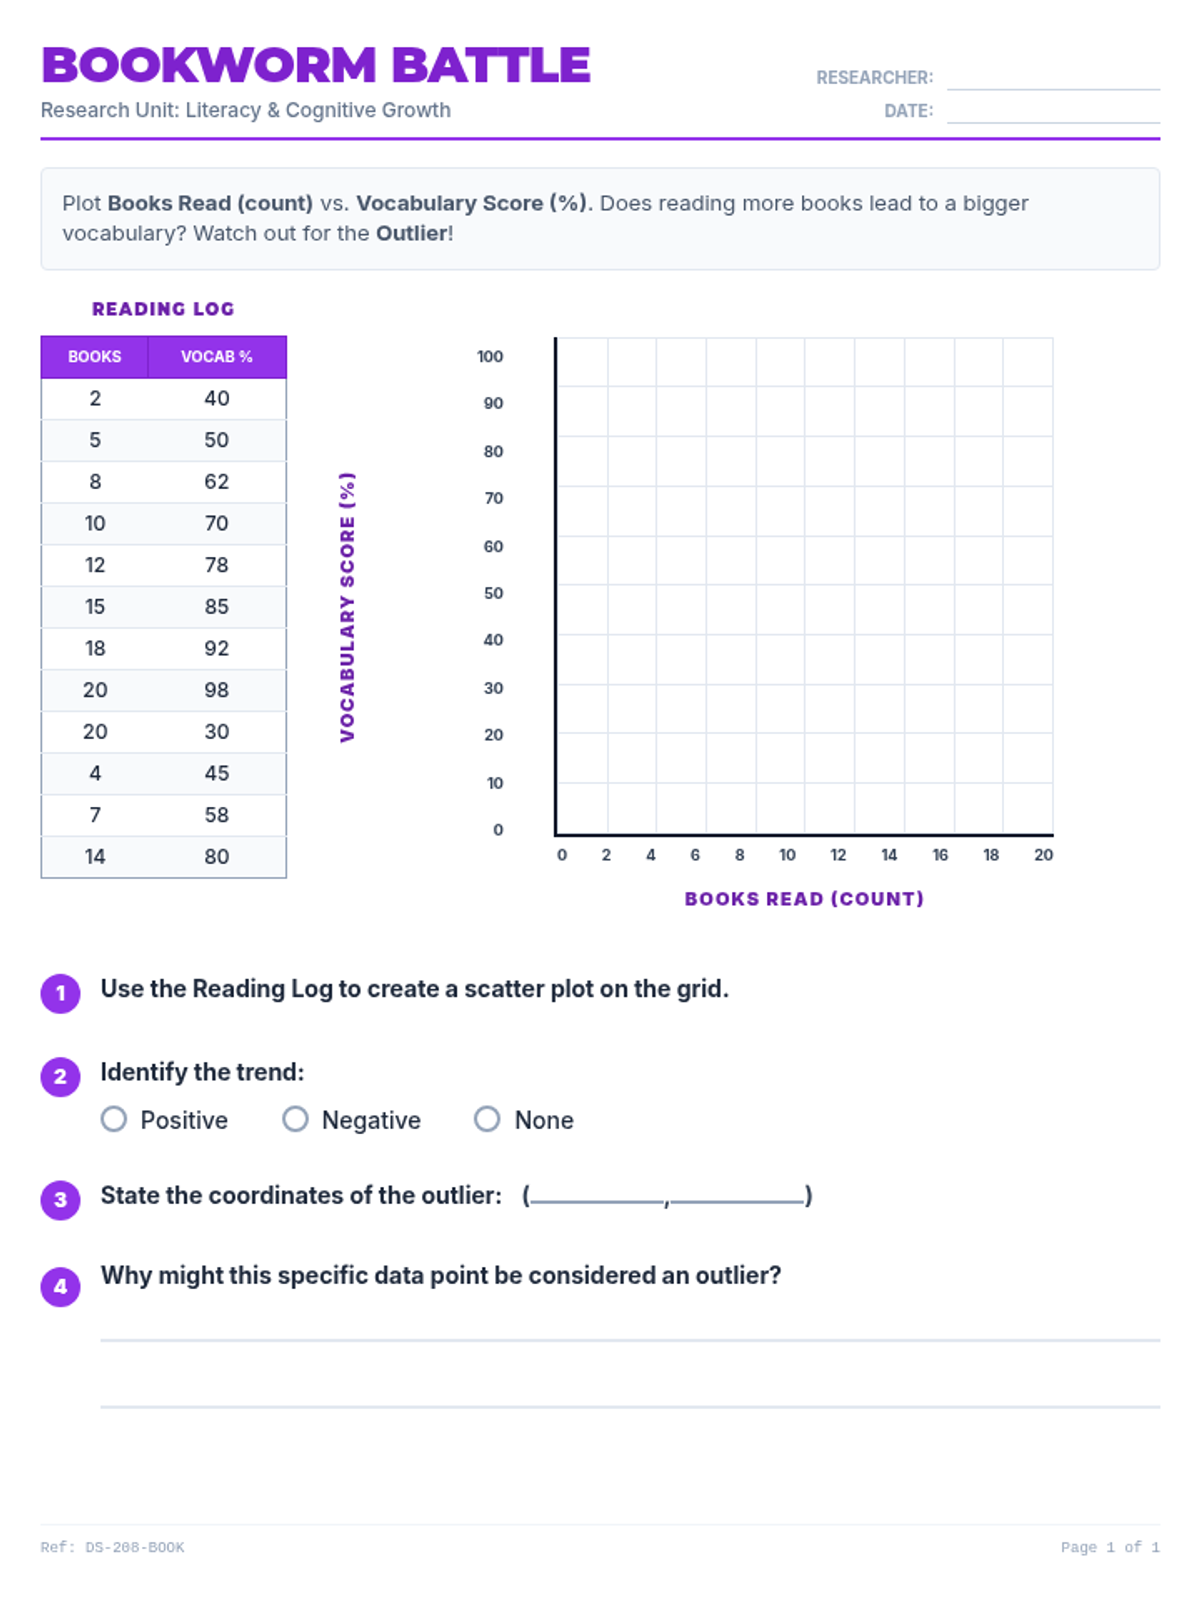
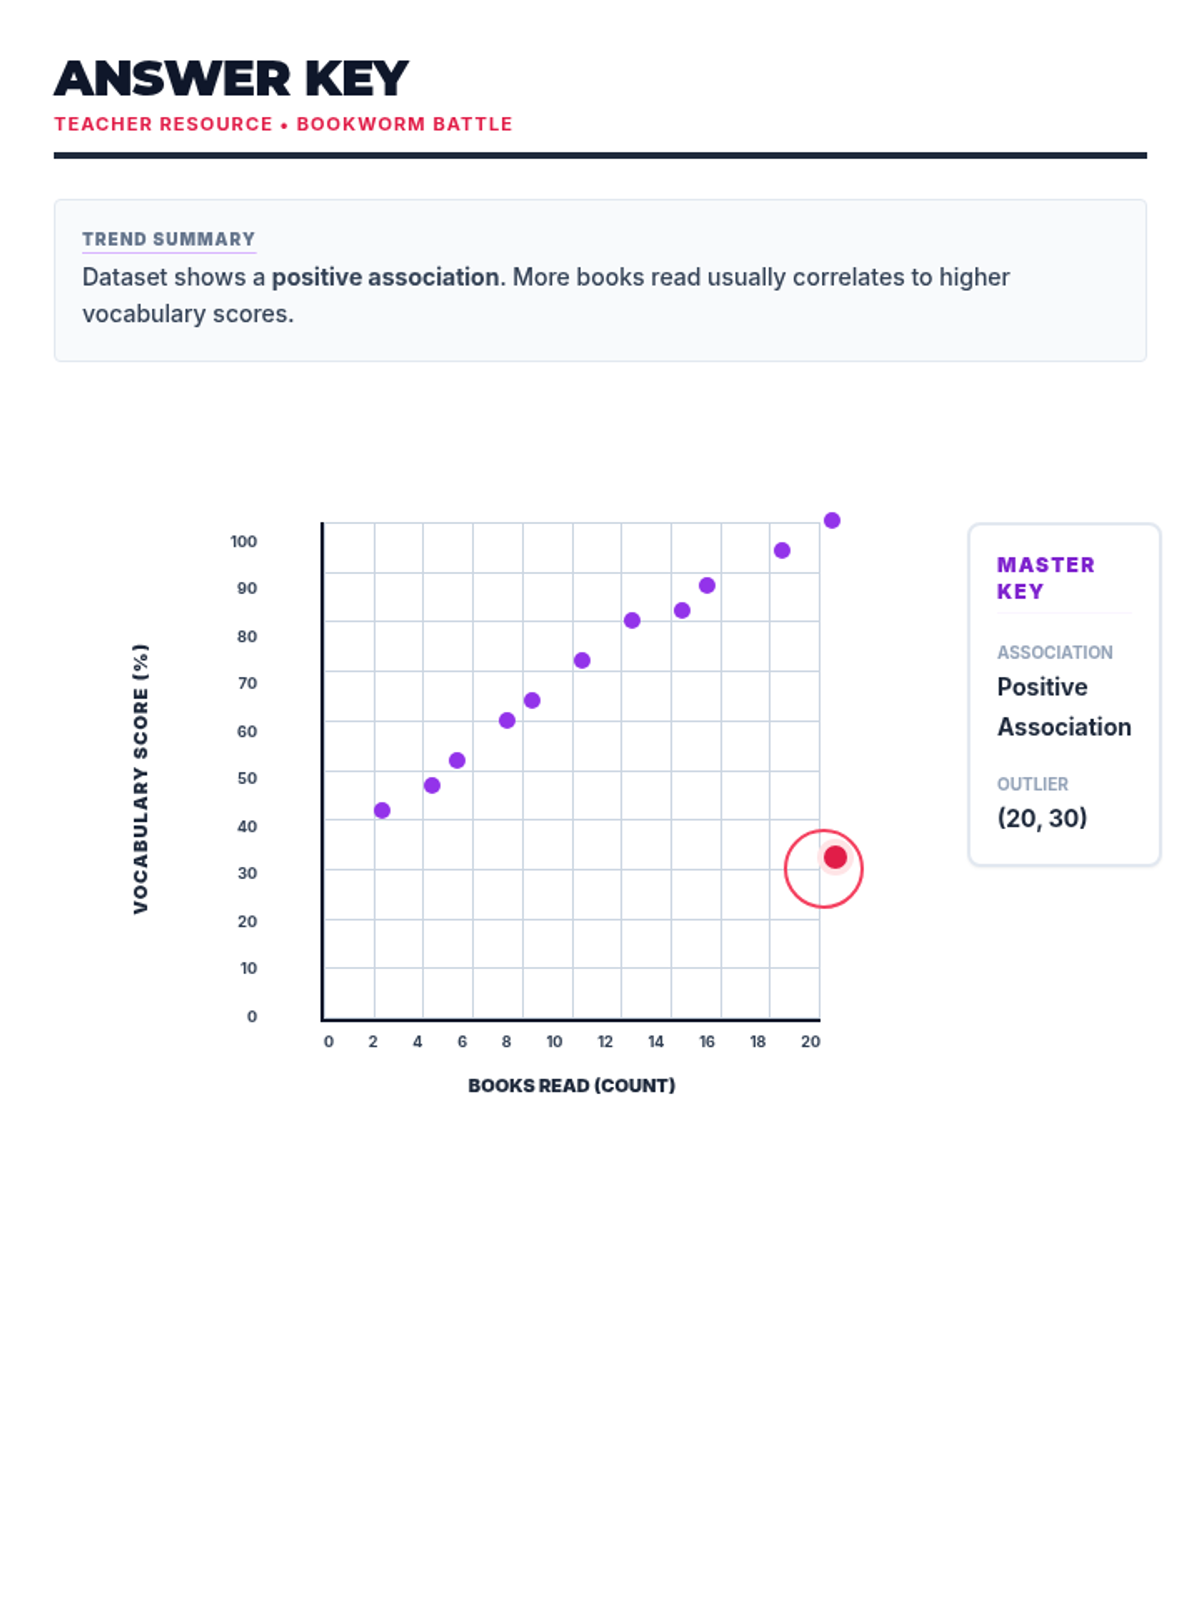
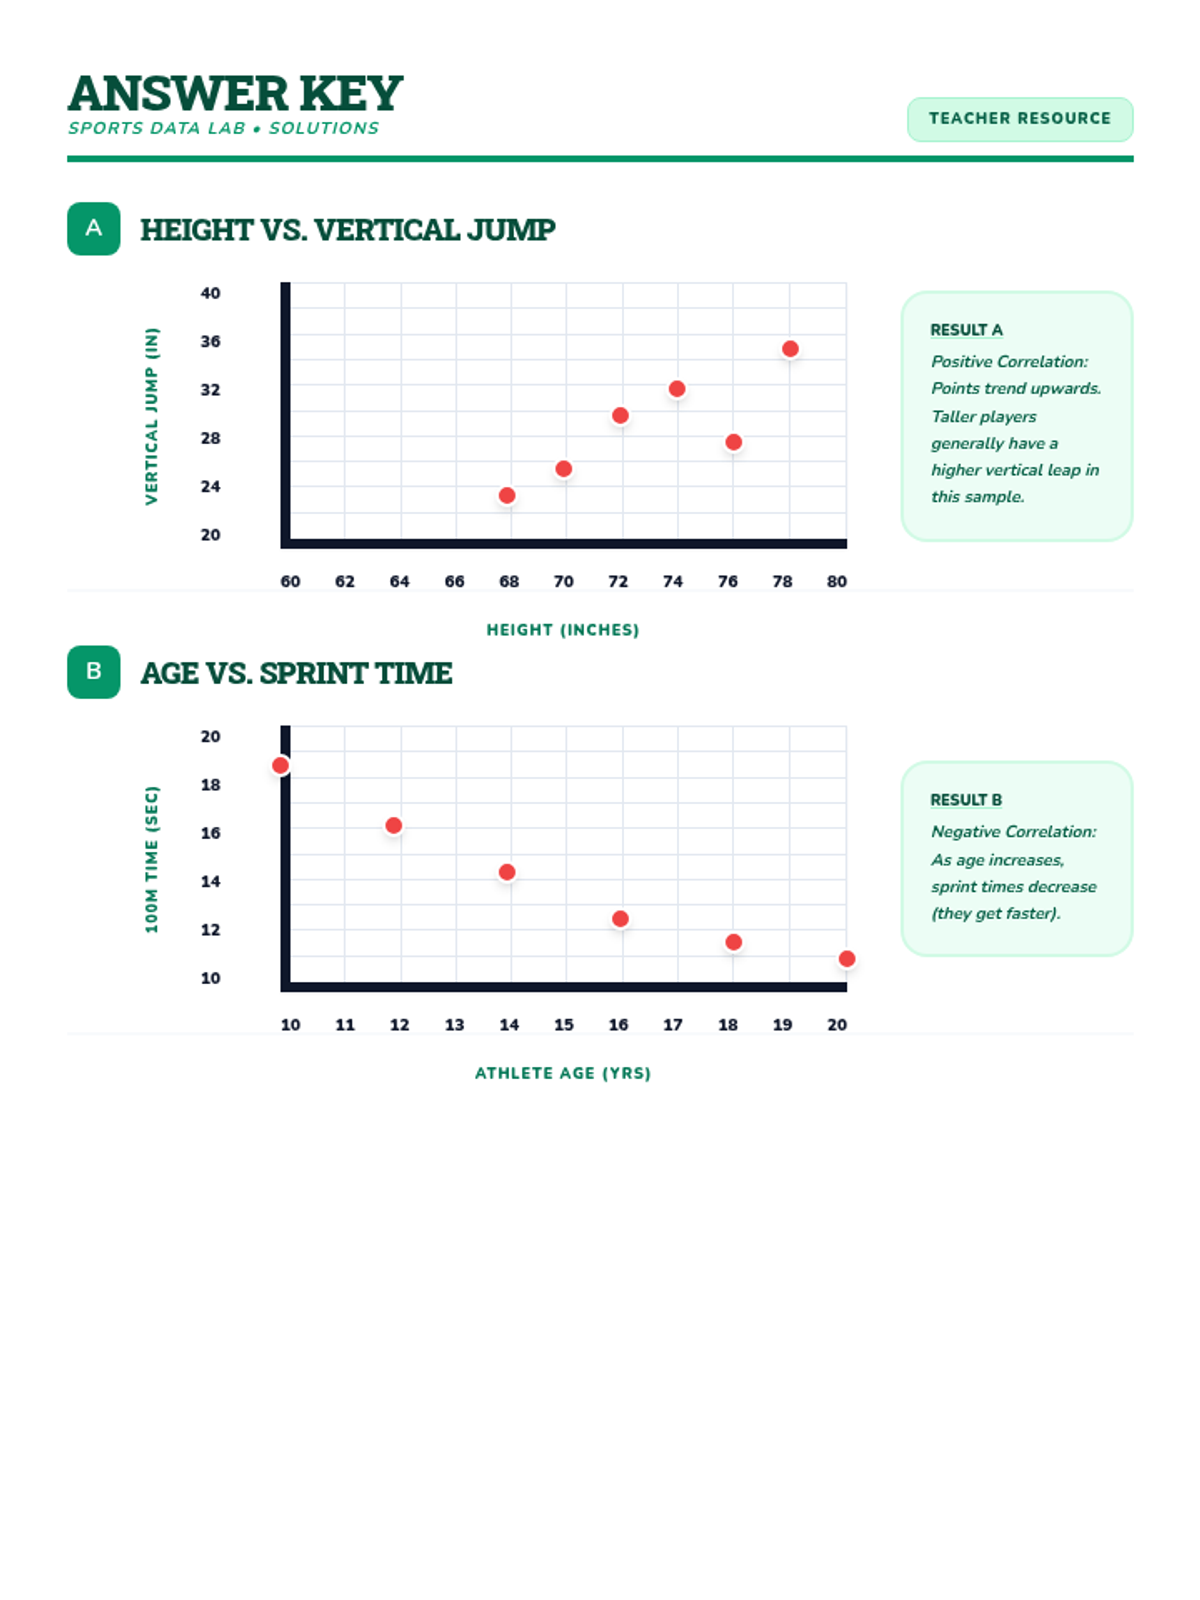
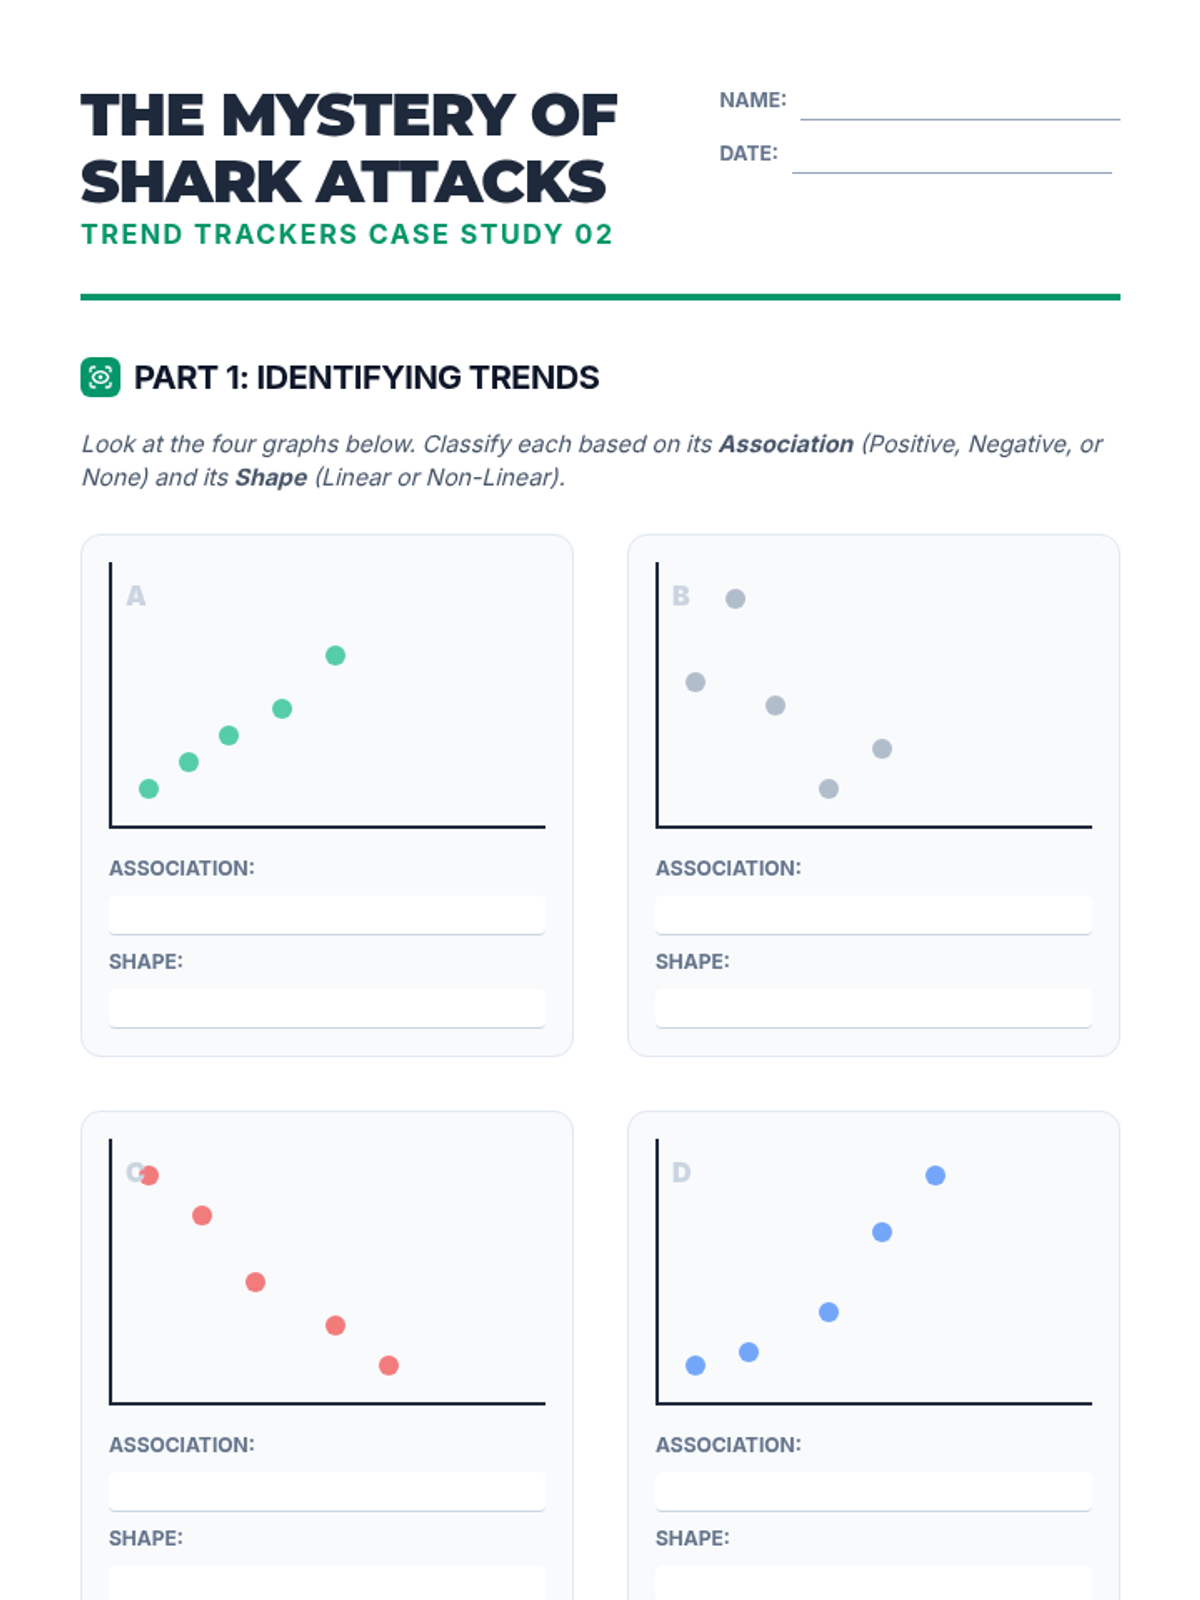
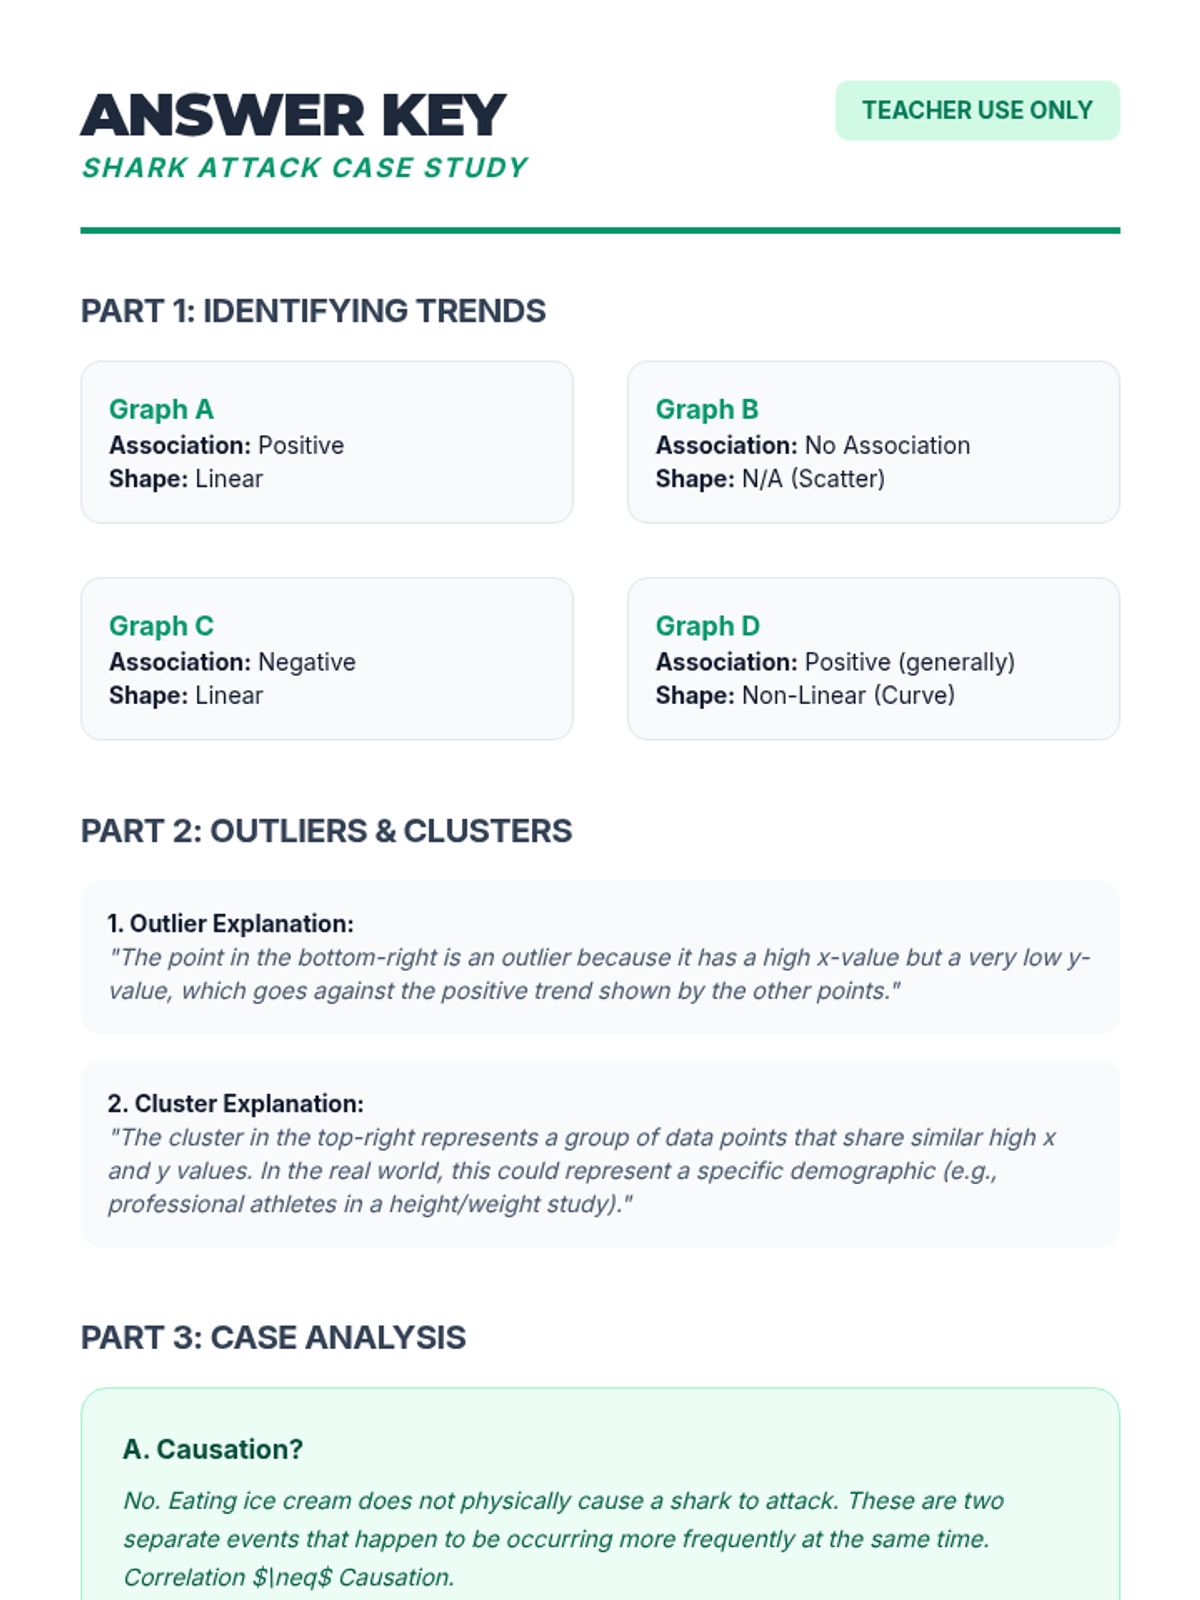
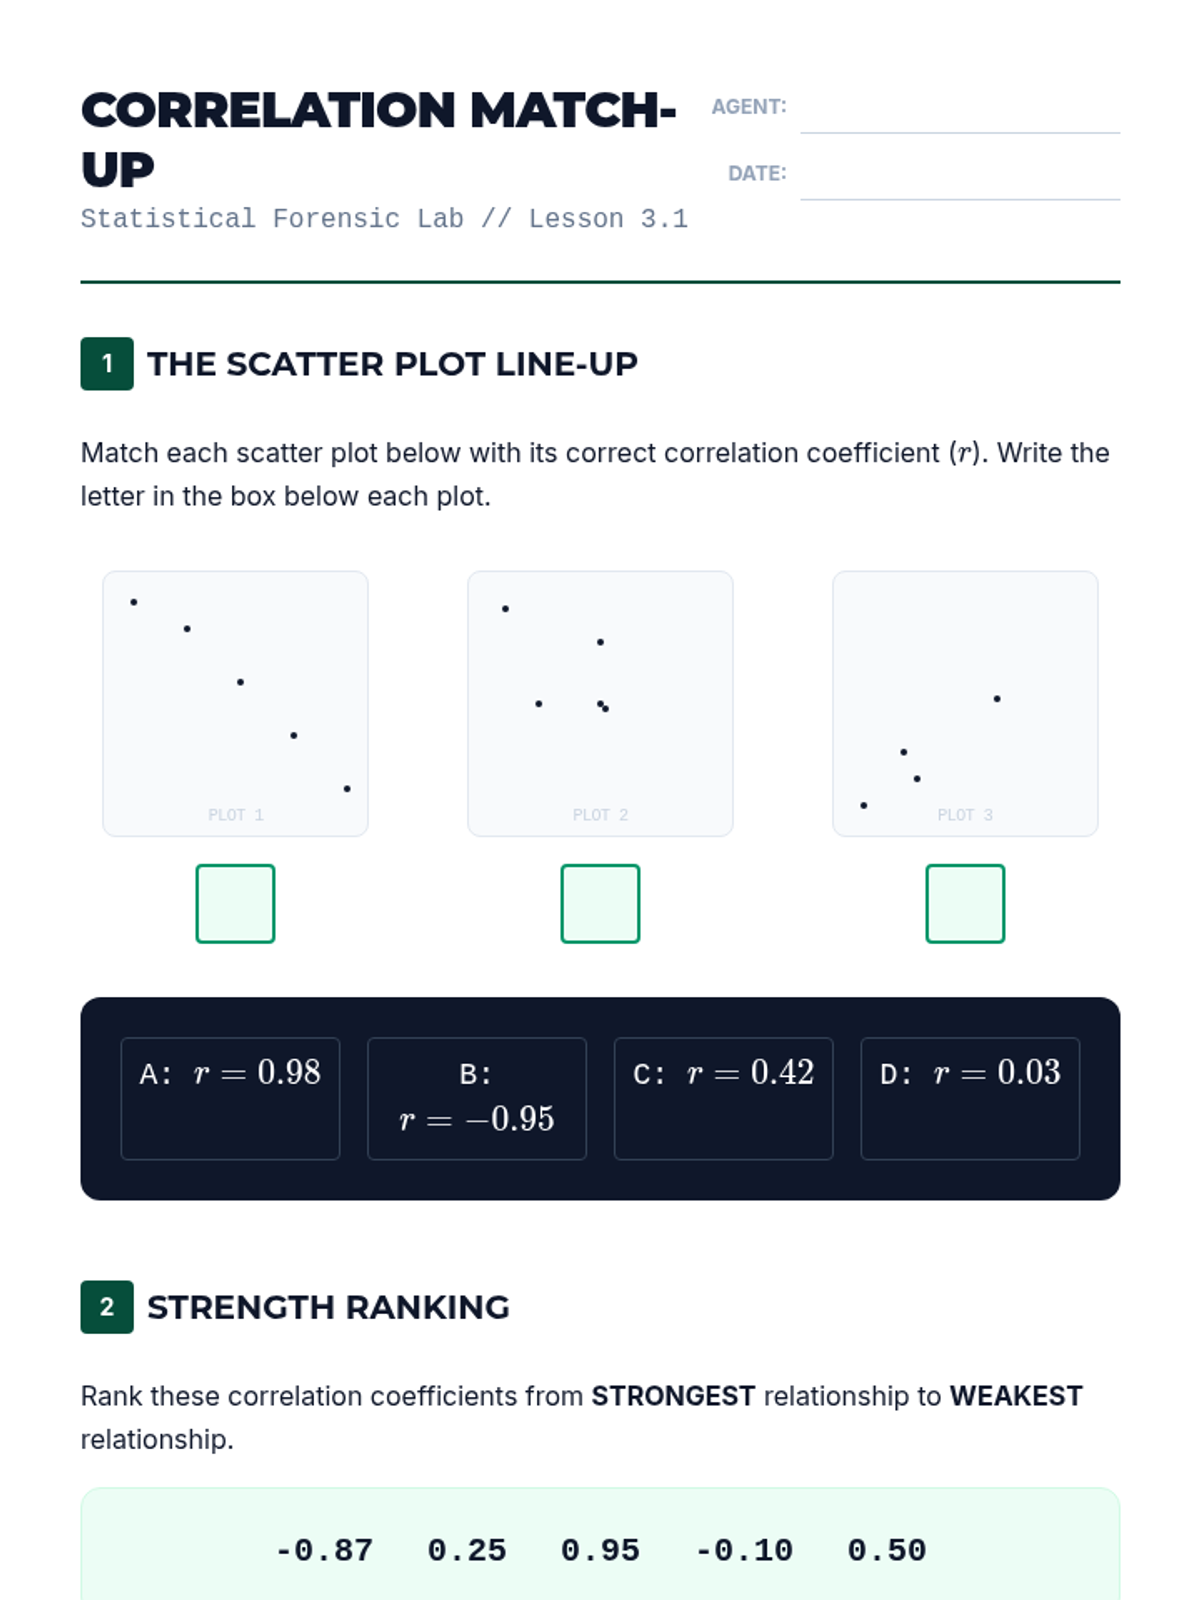
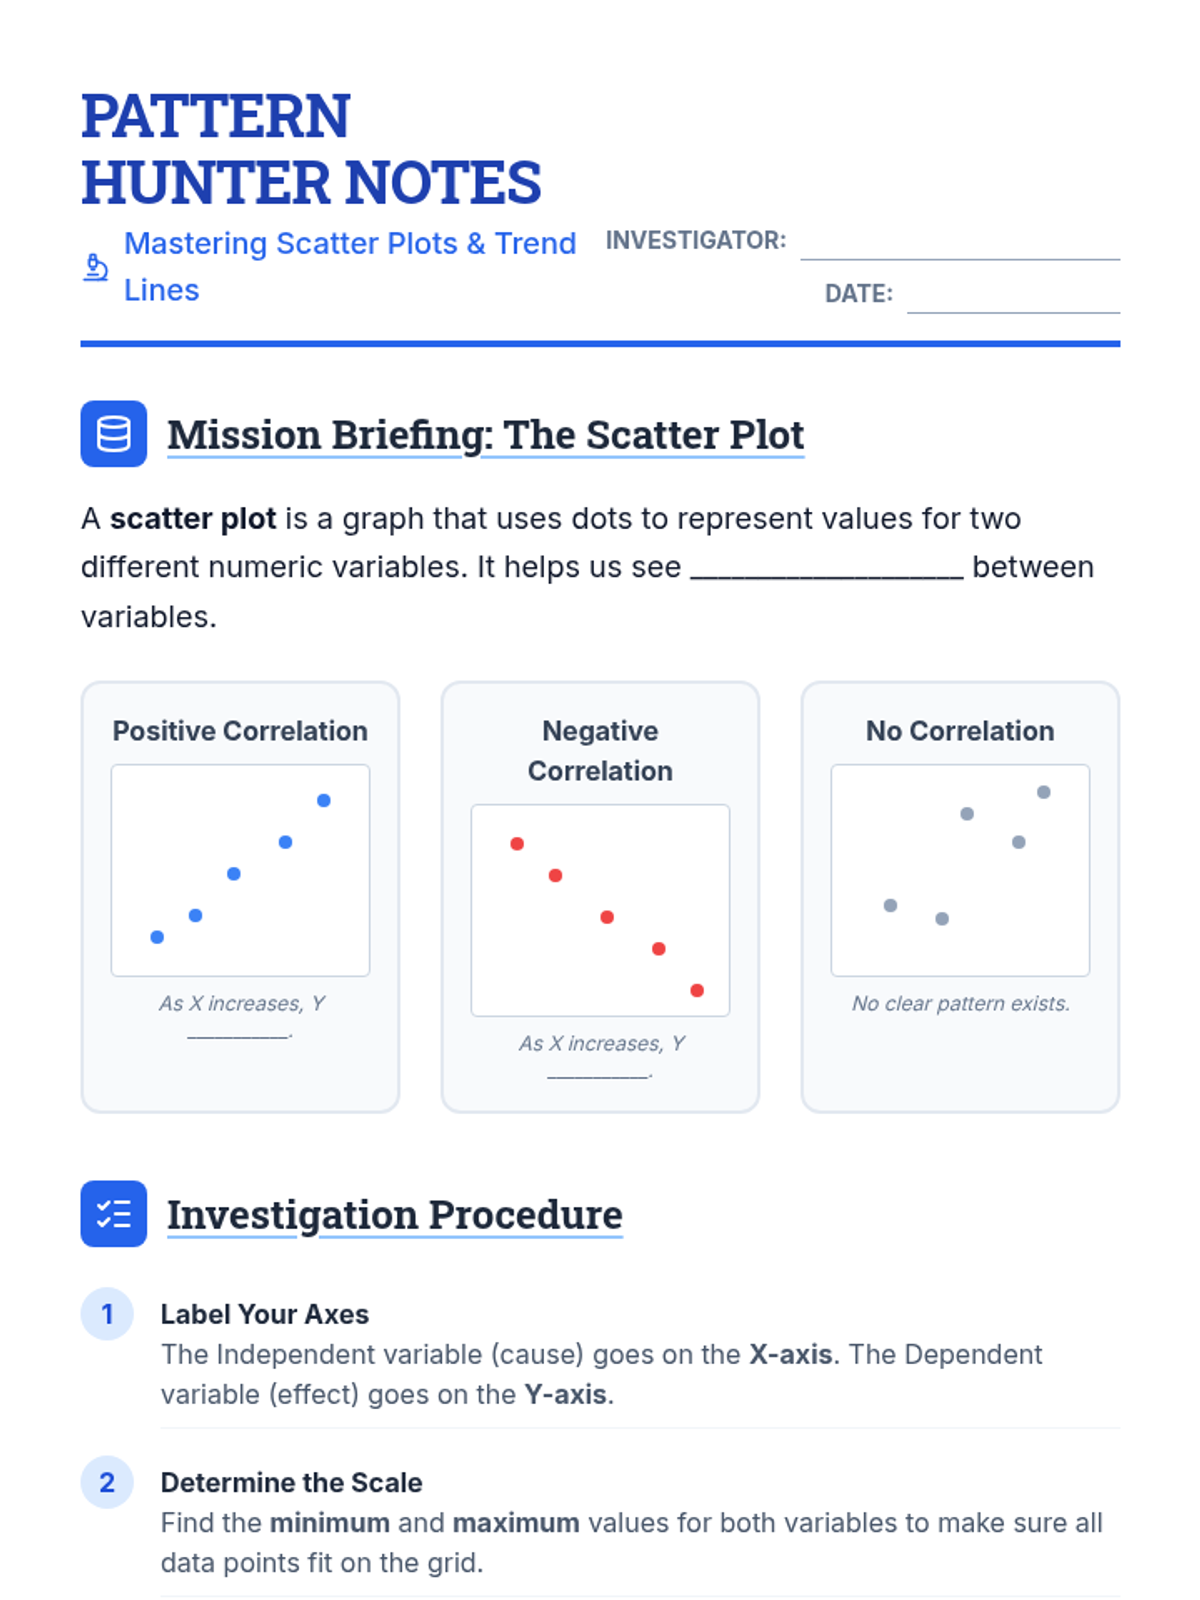
Students analyze various pre-made scatter plots to classify relationships as positive, negative, or having no association. They also distinguish between linear and non-linear patterns and identify outliers and clusters.
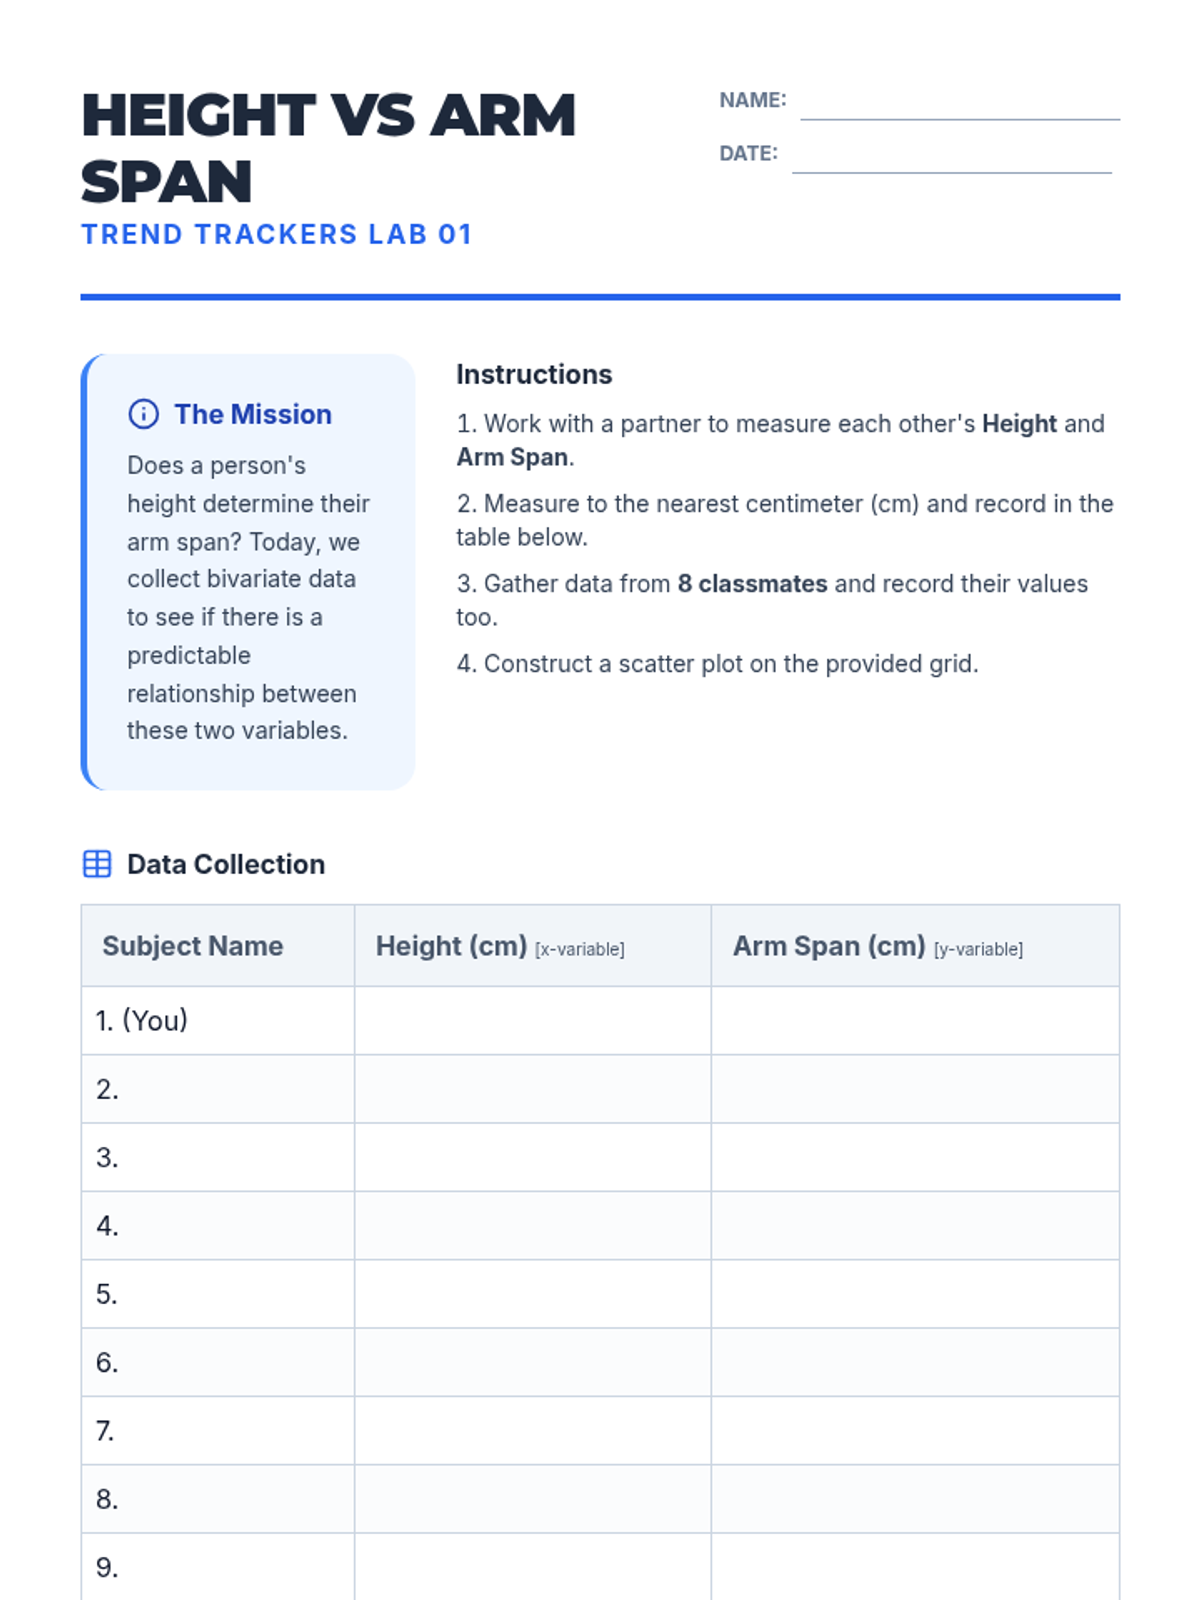
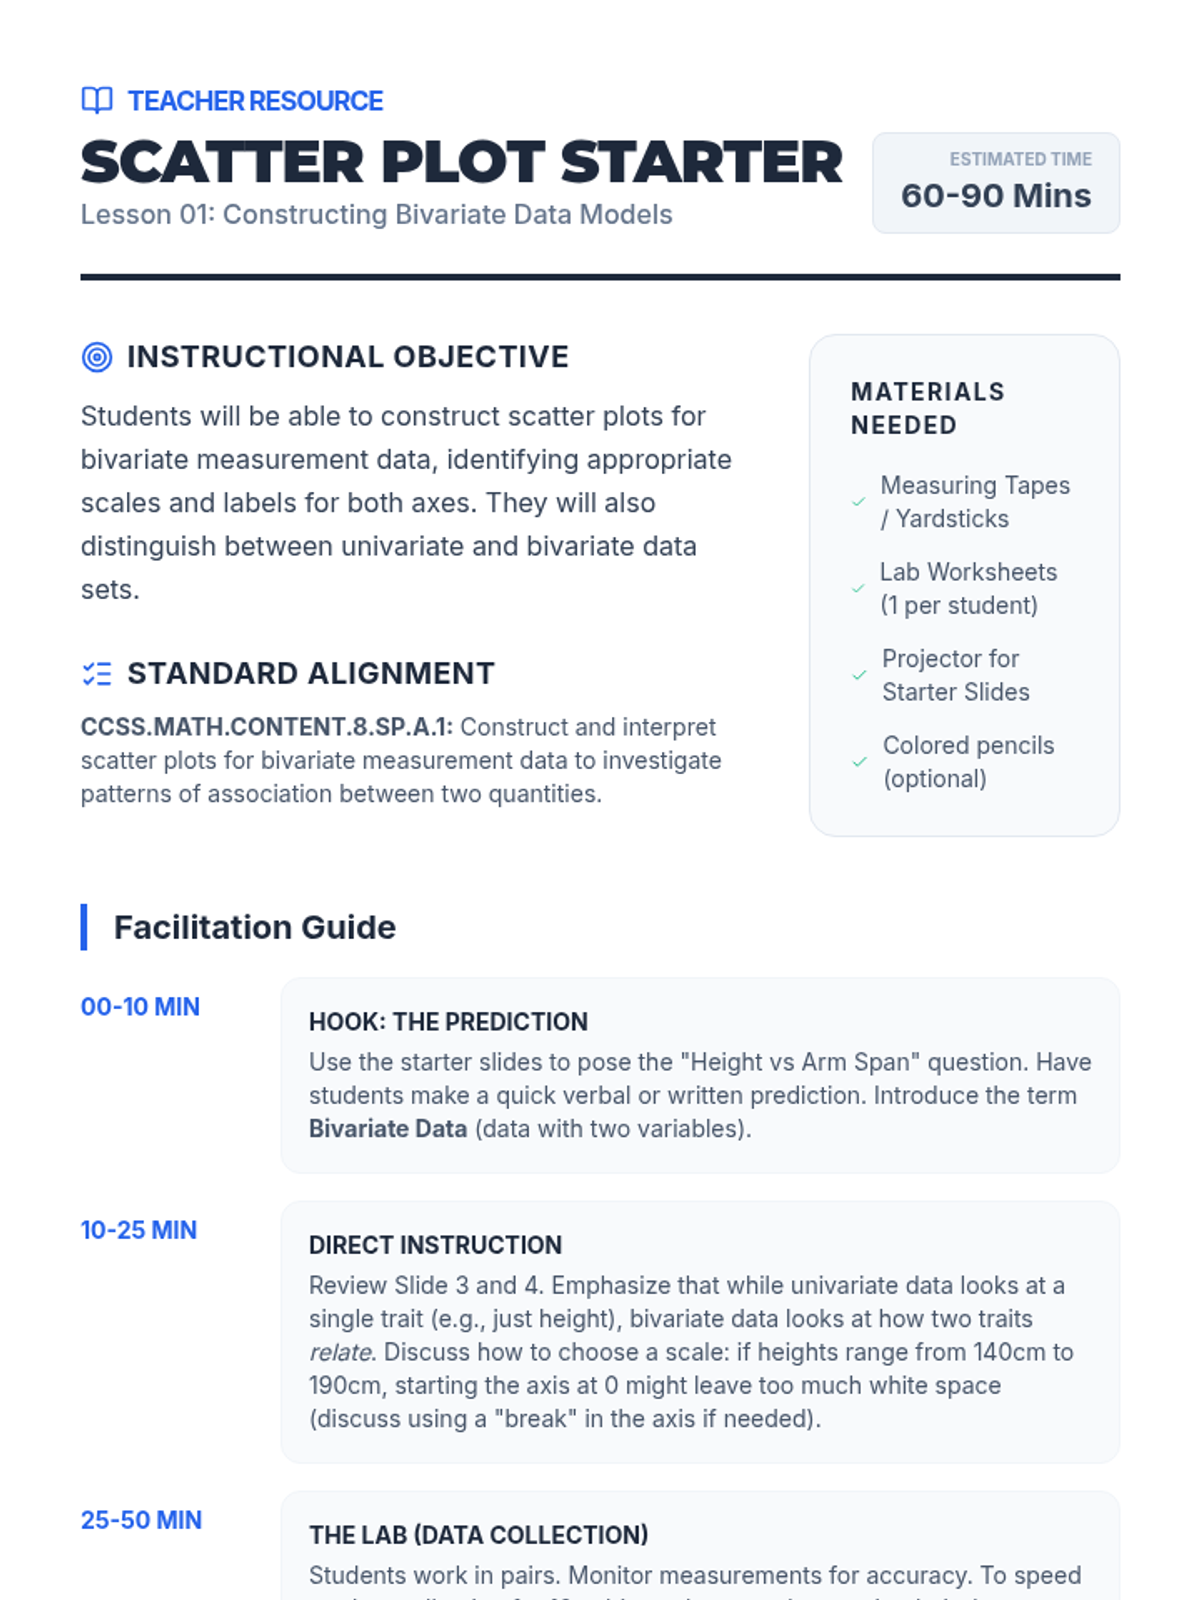
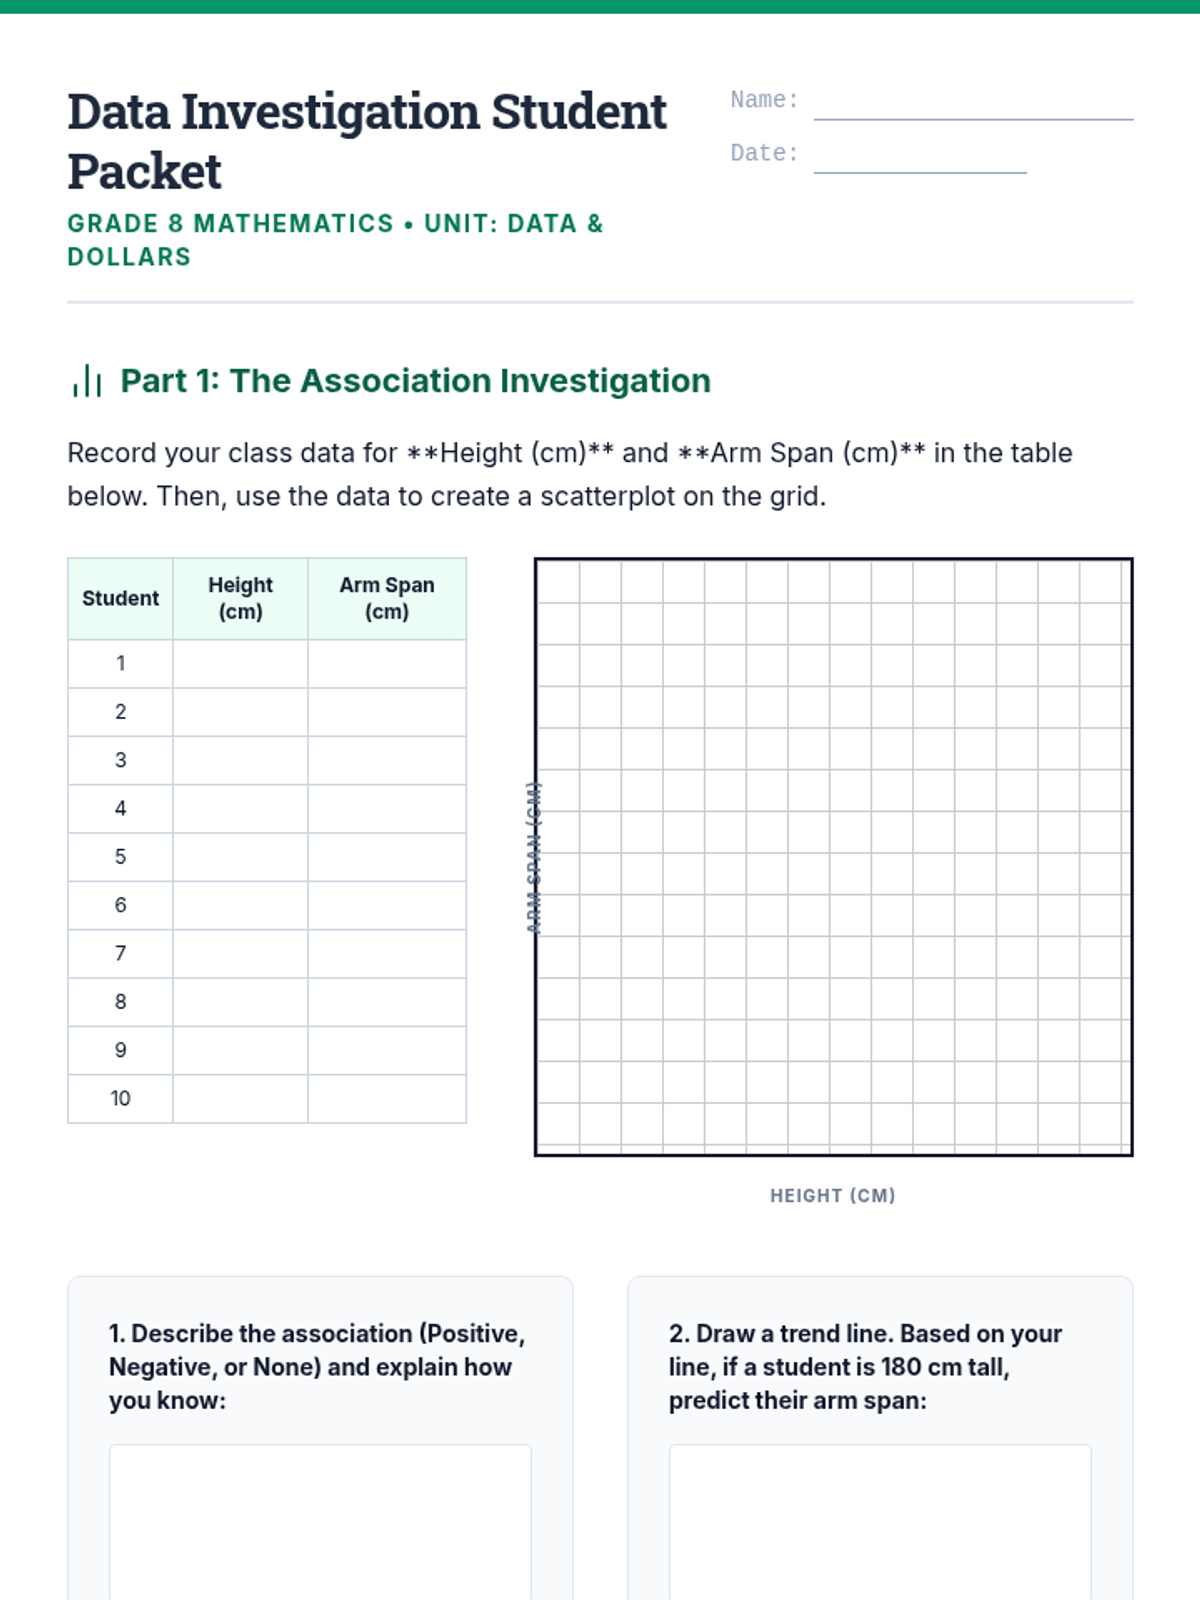
Students collect data on two quantitative variables and plot the results on a coordinate plane, focusing on proper axis labeling and differentiation between univariate and bivariate data.
Explores the logical distinction between mathematical correlation and physical causation, including the impact of lurking variables.
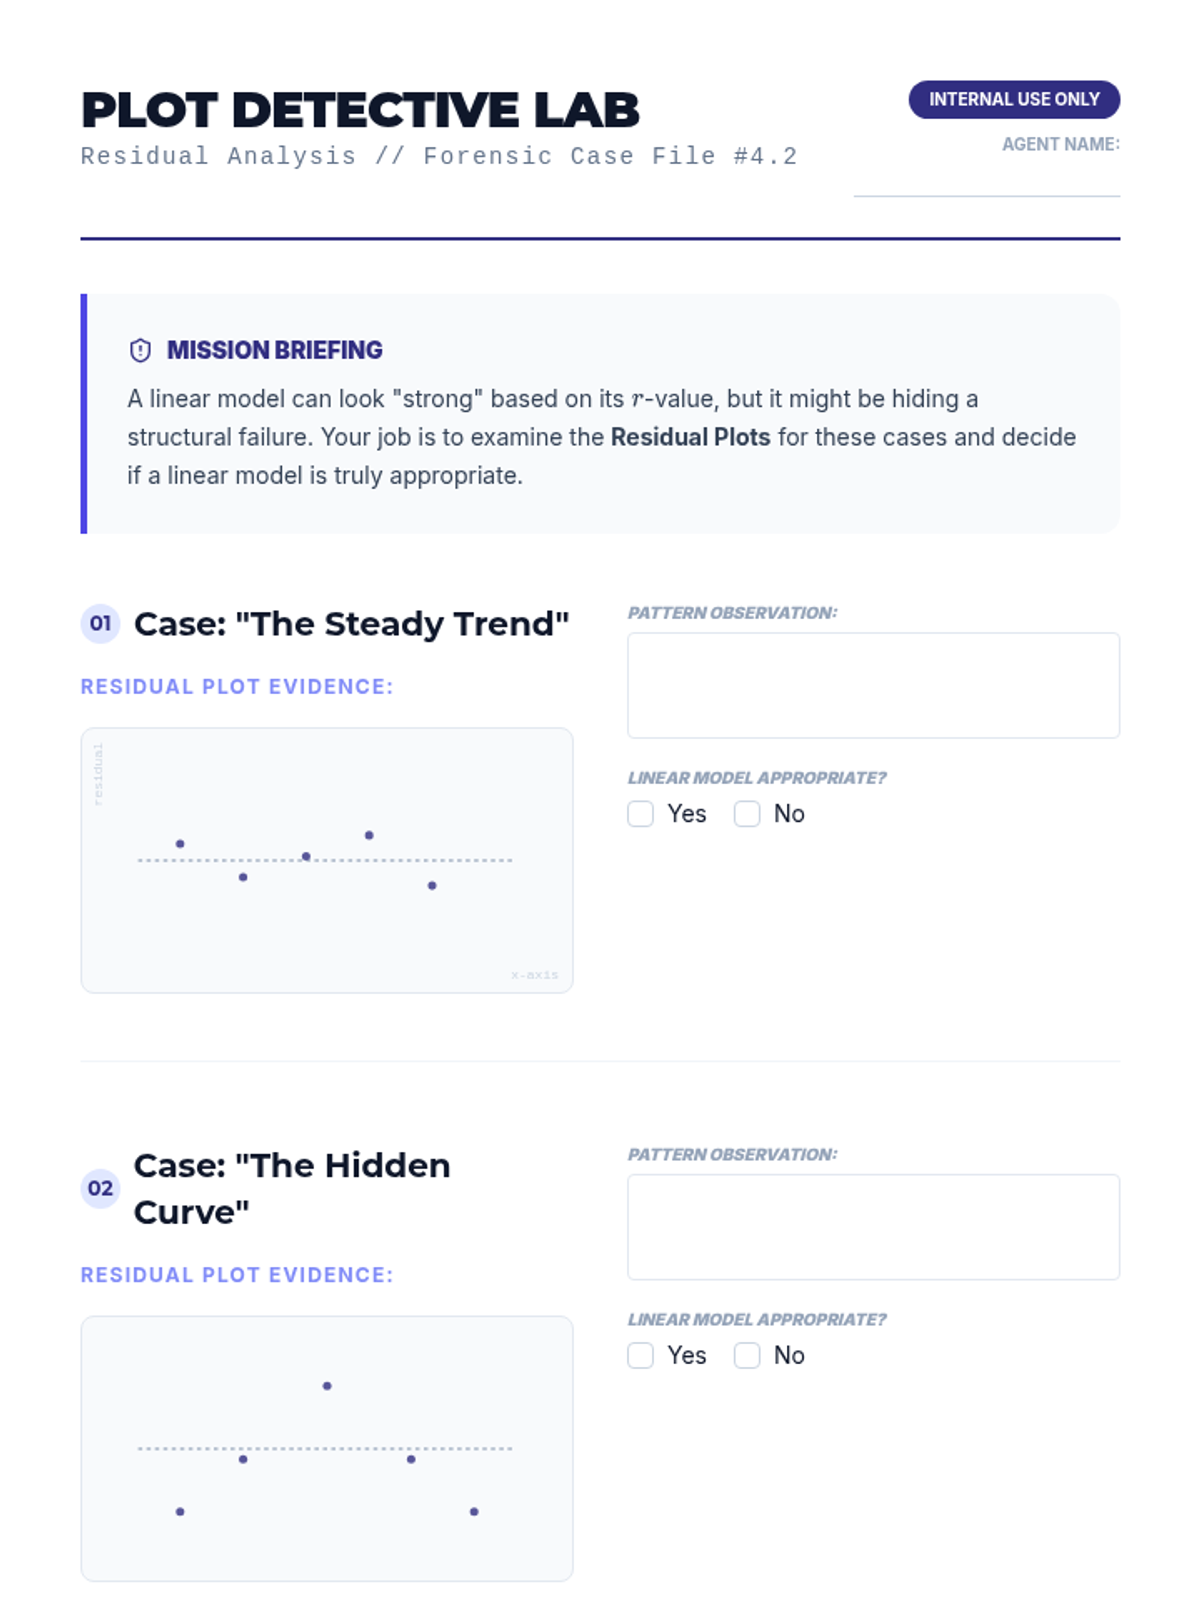
Students analyze residual plots to determine if a linear model is the most appropriate fit for a given dataset.
Focuses on interpreting the correlation coefficient (r) to quantify the strength and direction of linear relationships.
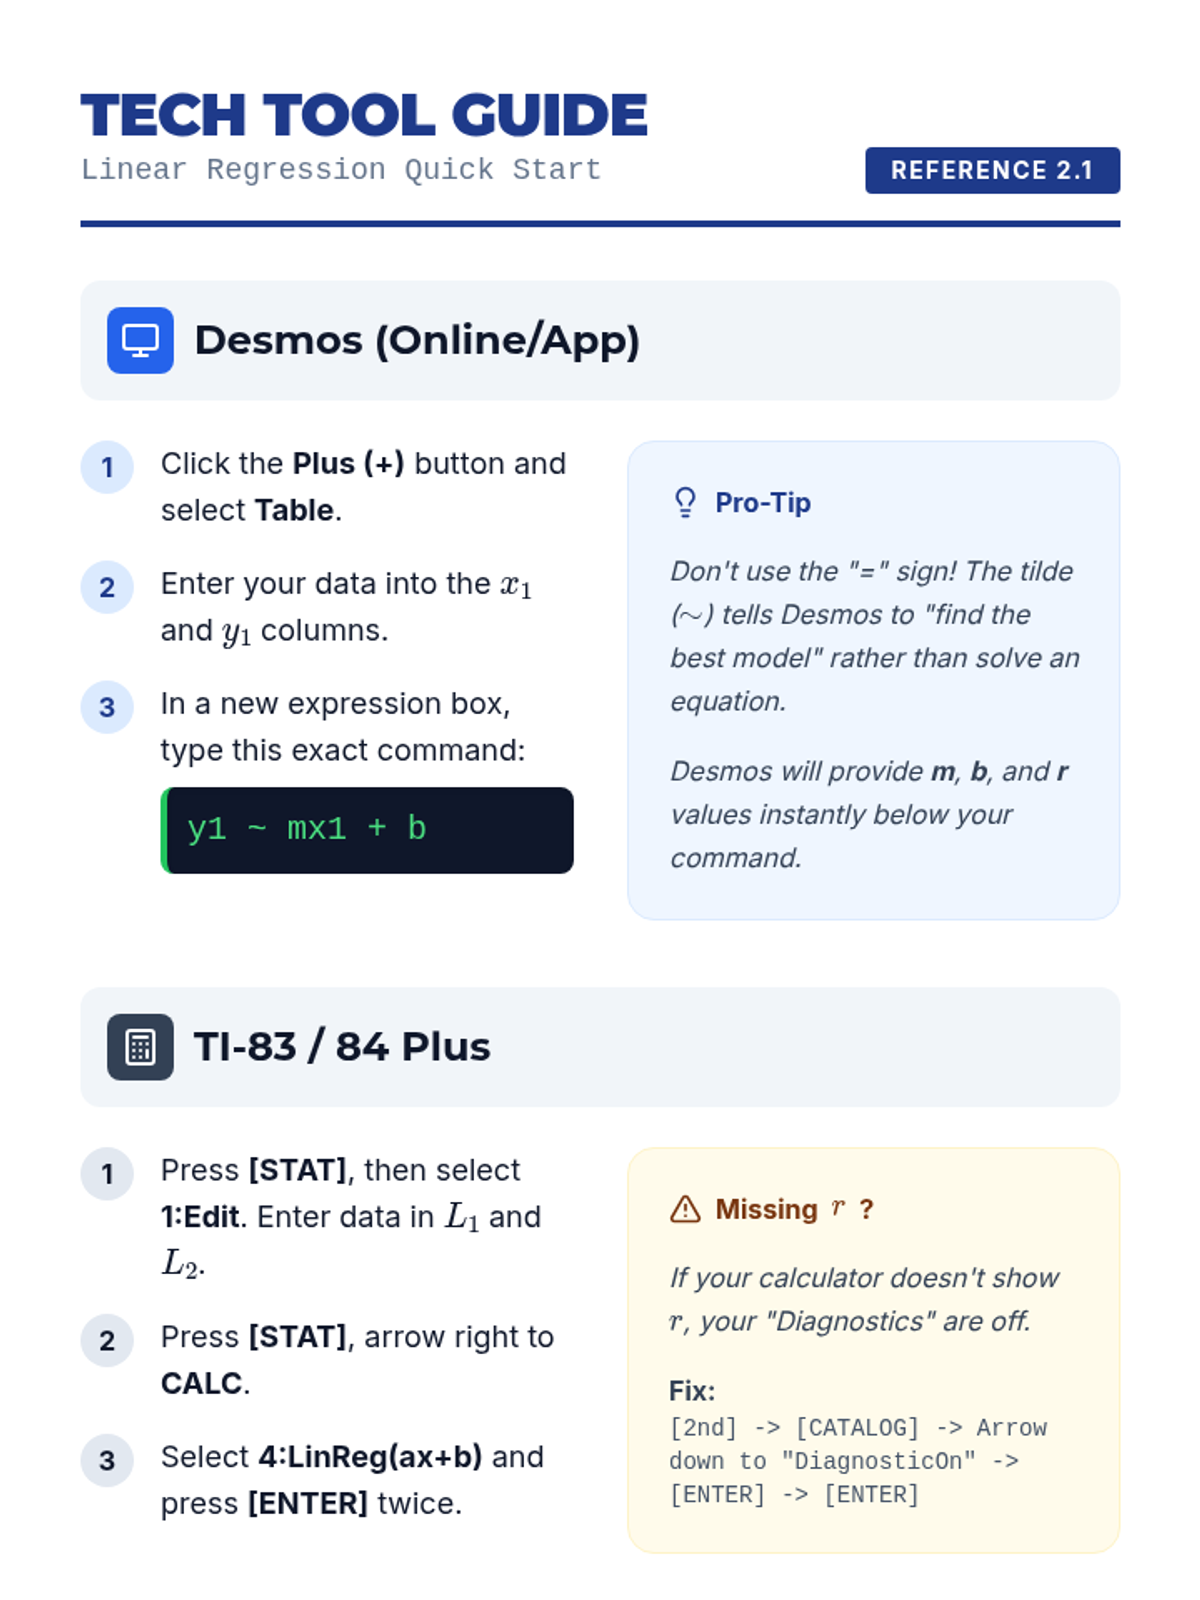
Students use graphing technology to perform linear regression, comparing digital models to manual estimations.
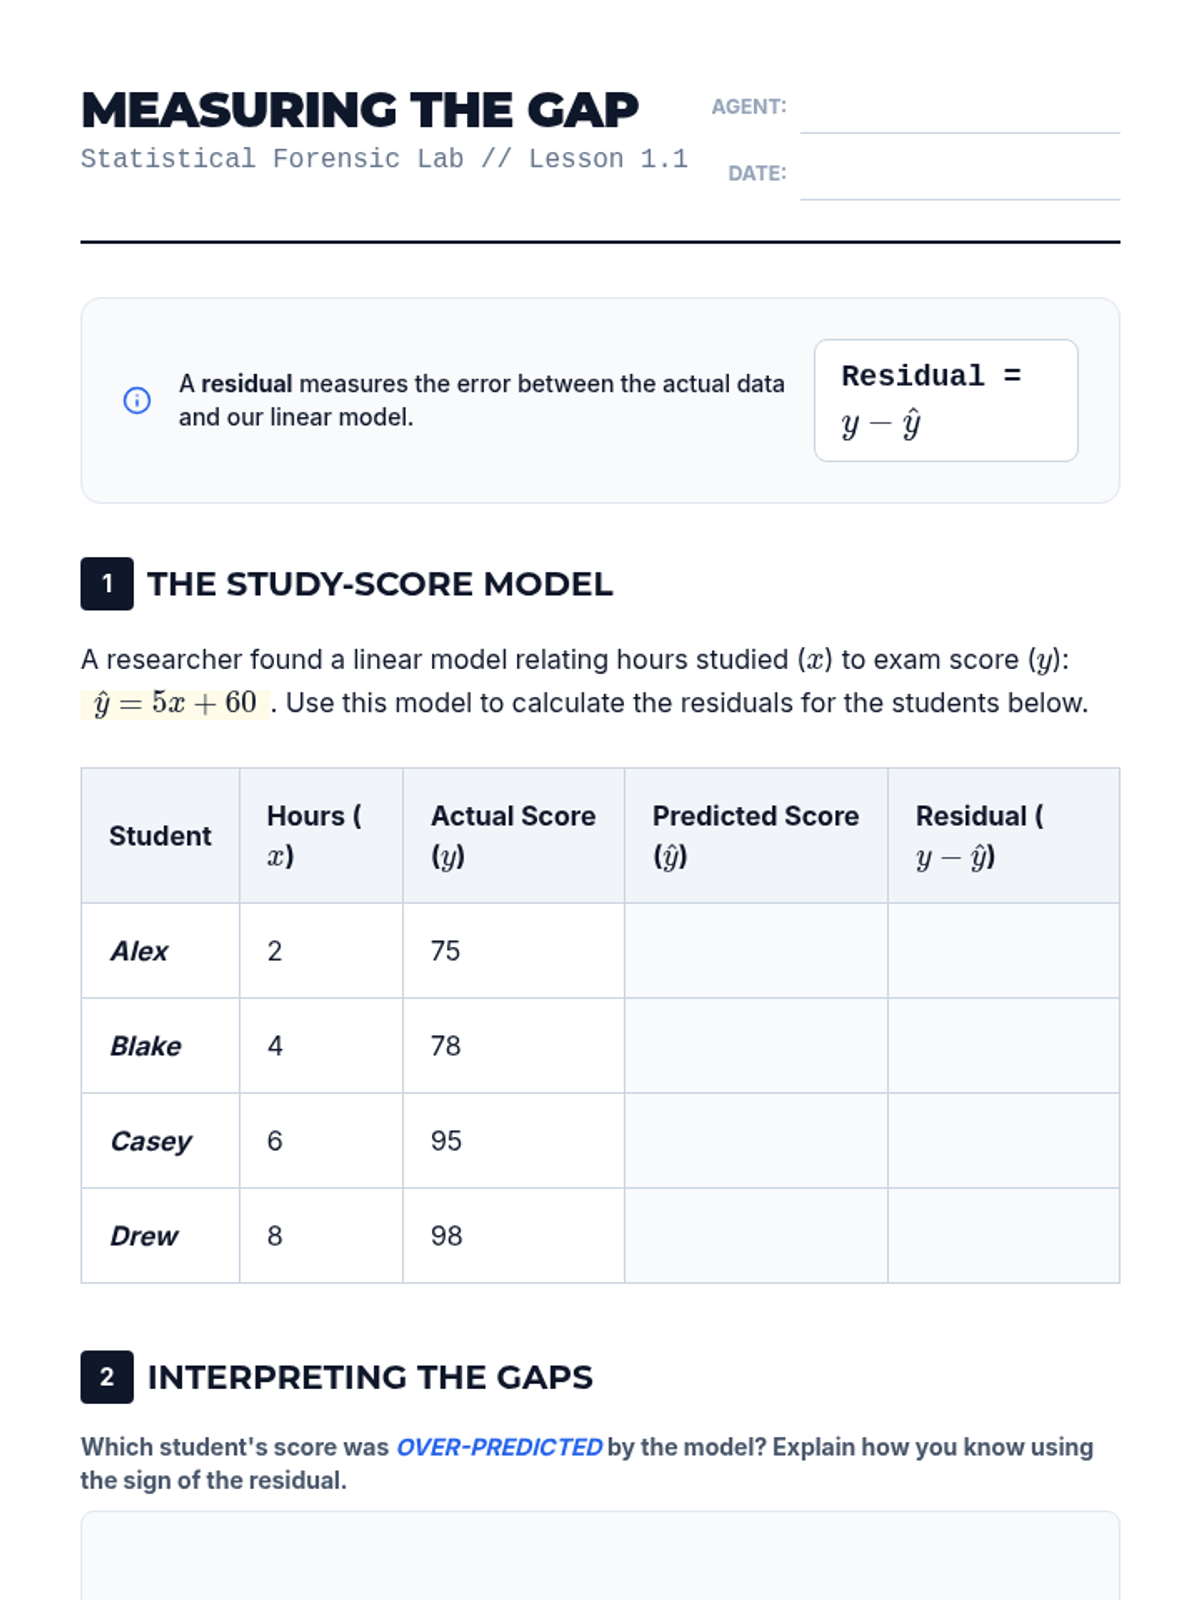
Students define residuals as the vertical distance between data points and a model, calculating them manually to understand the foundation of 'best fit'.
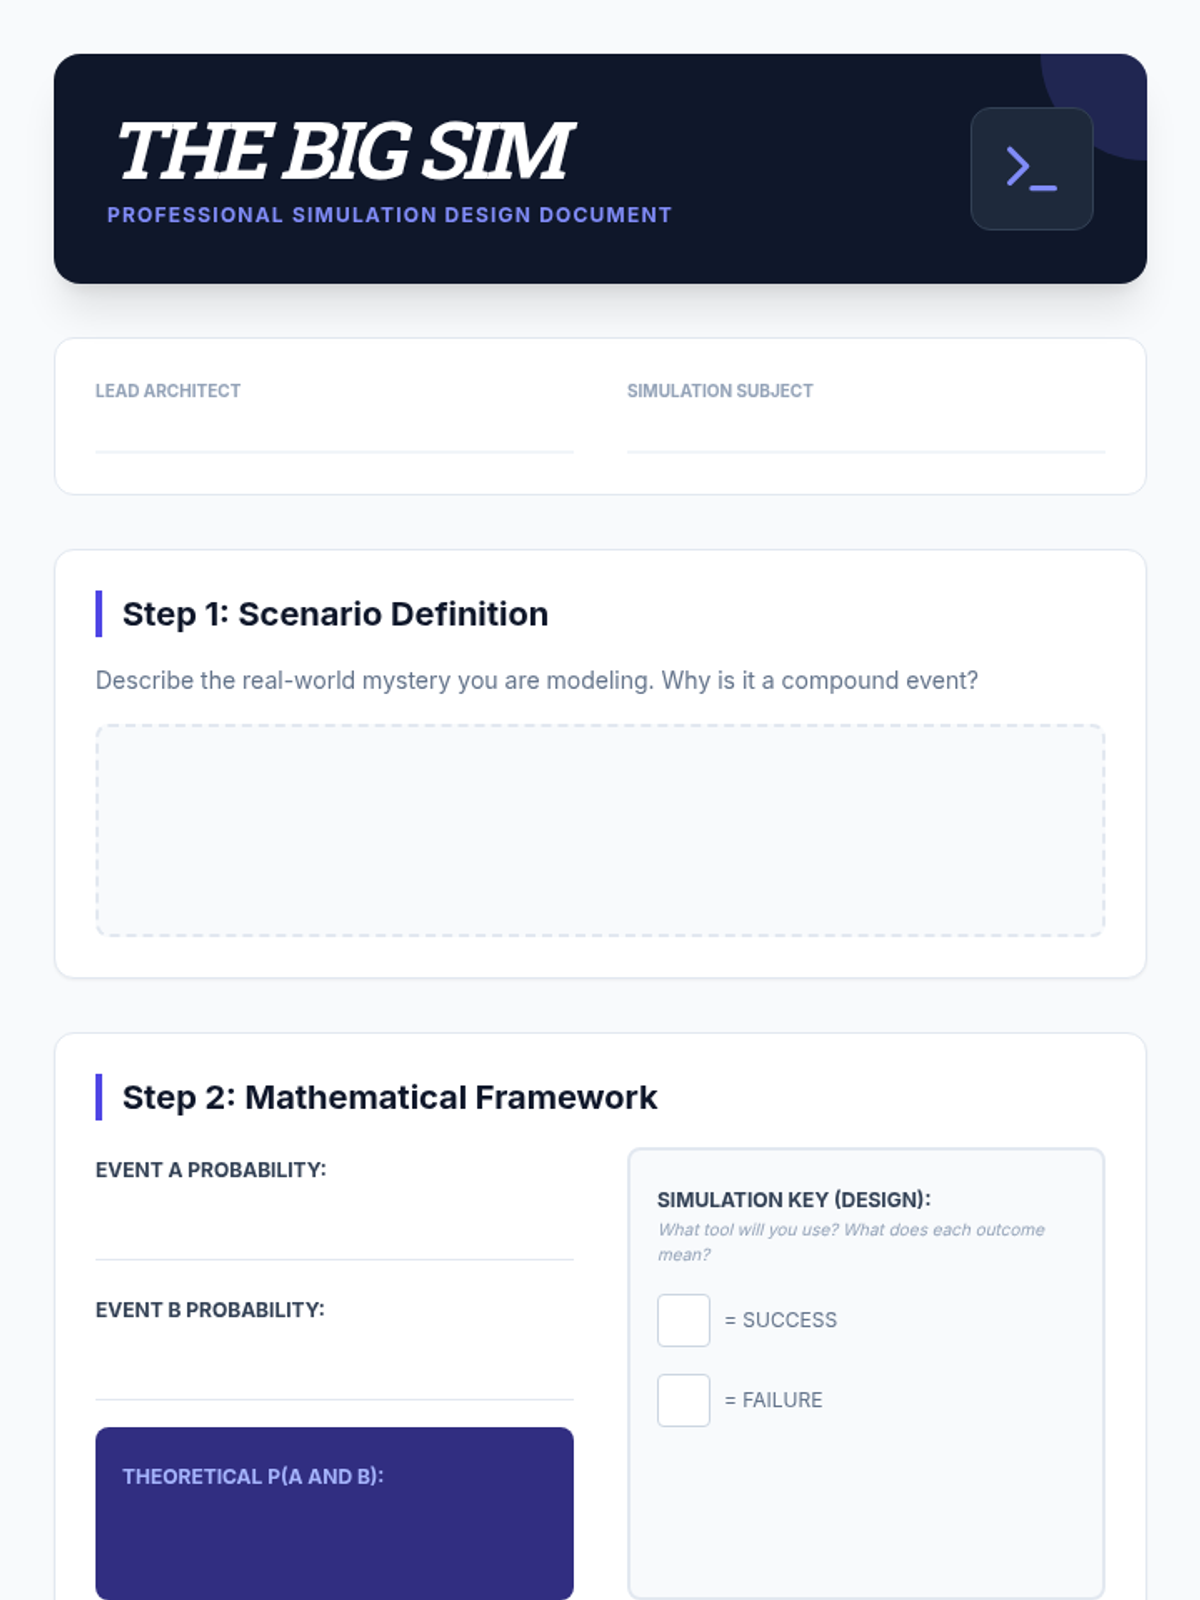
A culminating project-based lesson where students design and execute their own simulation for a complex real-world mystery.
Focuses on sequential weather events and the difference between independent and dependent variables in compound probability models.
Investigates sequential probability through the lens of sports, determining if winning streaks are statistically significant or expected random occurrences.
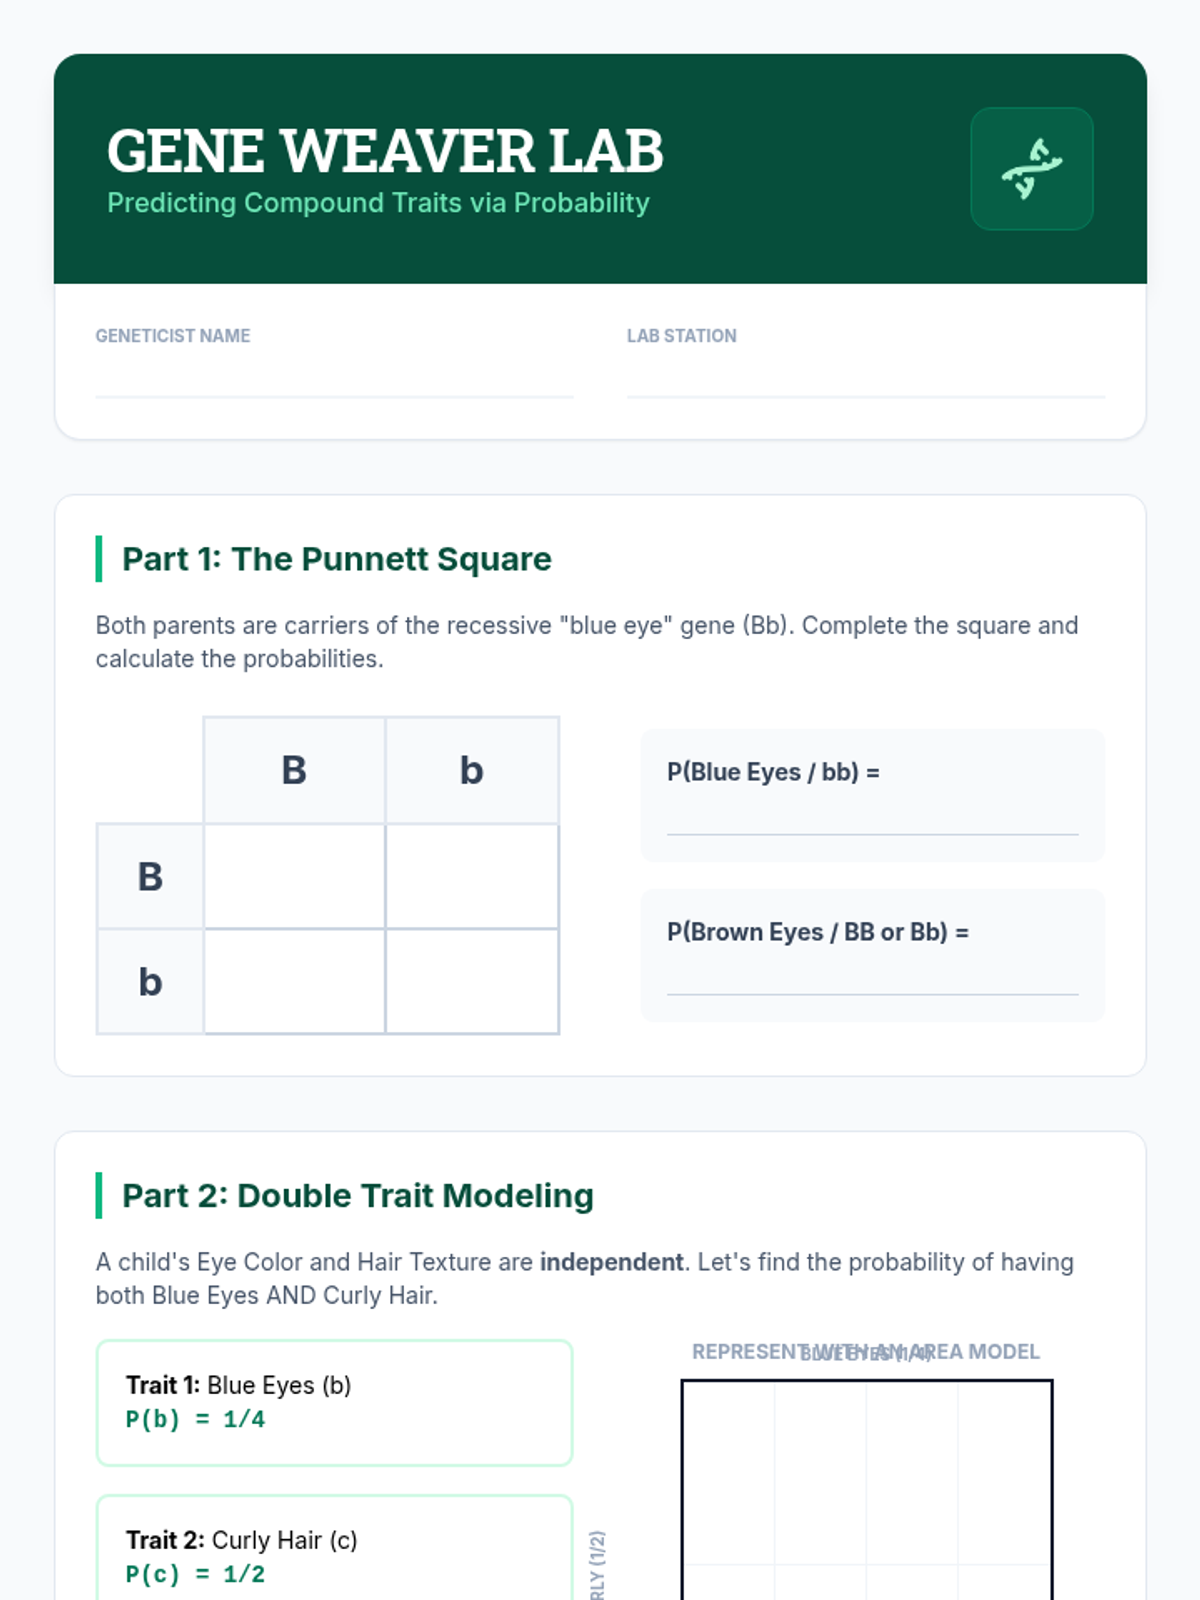
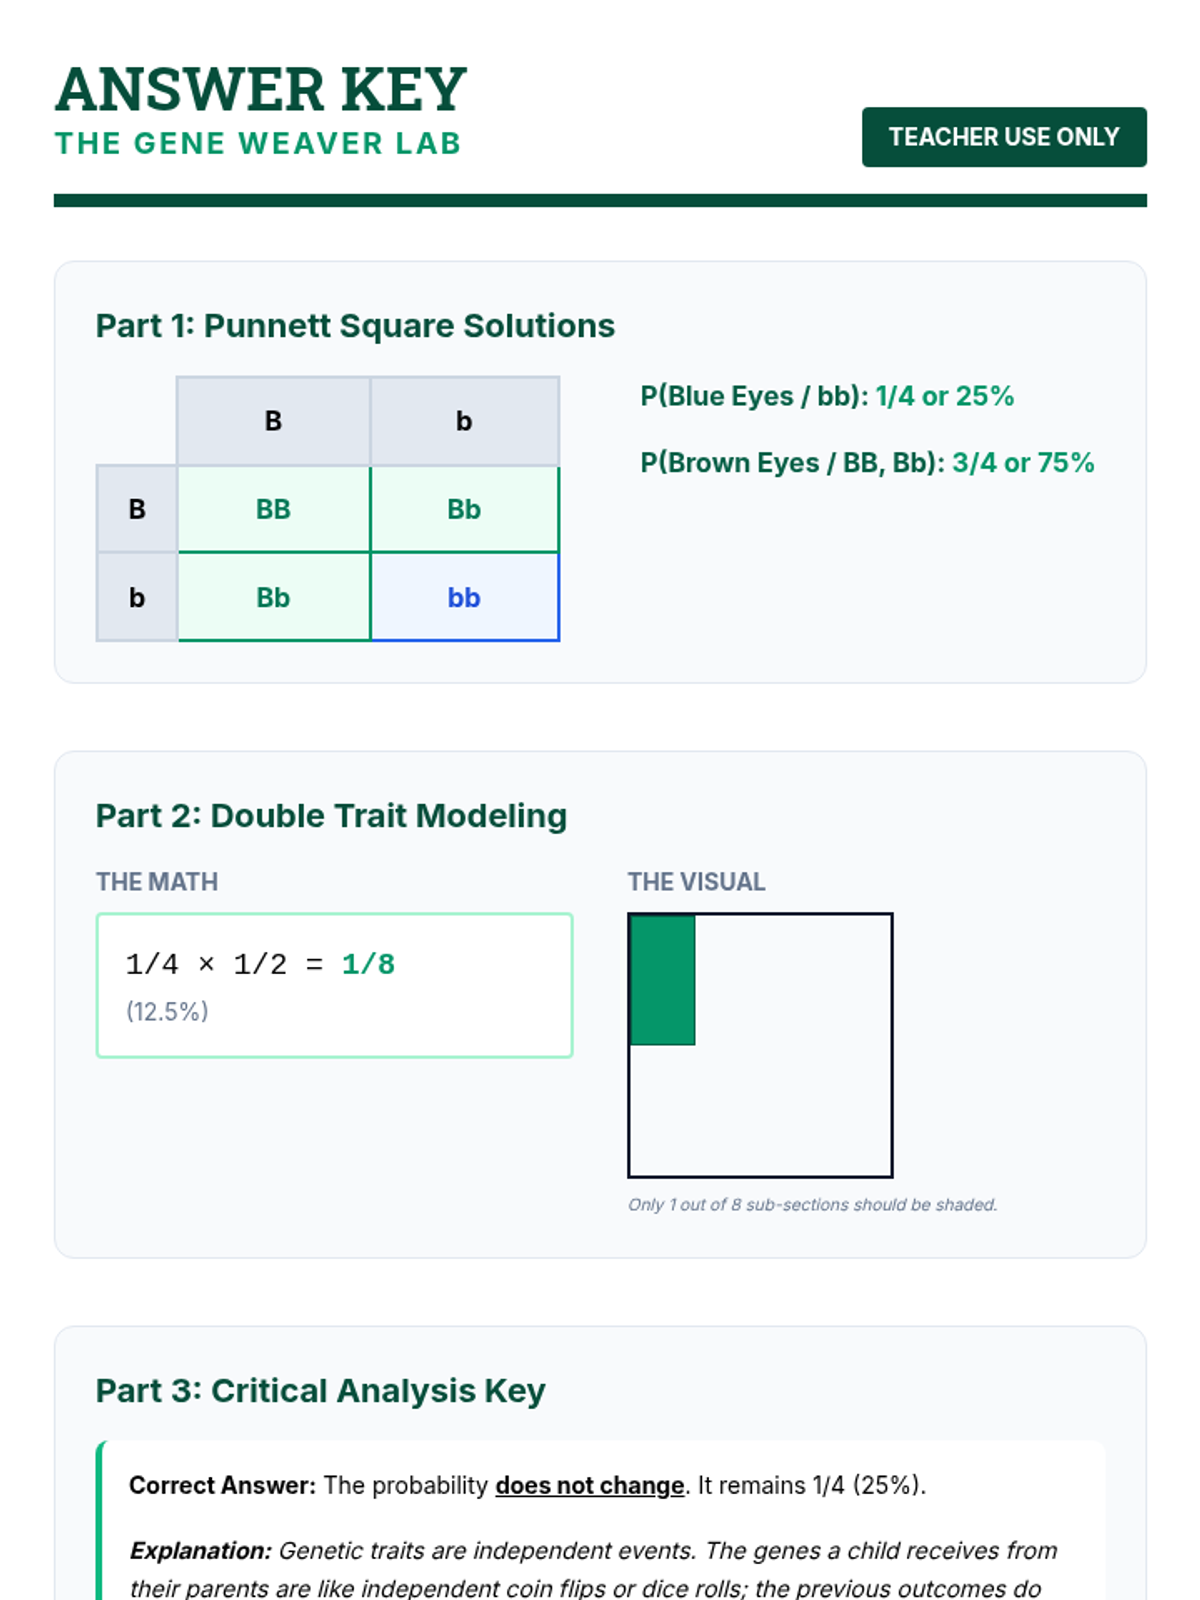
Explores the intersection of biology and math by using Punnett squares and area models to calculate the compound probability of independent genetic traits.
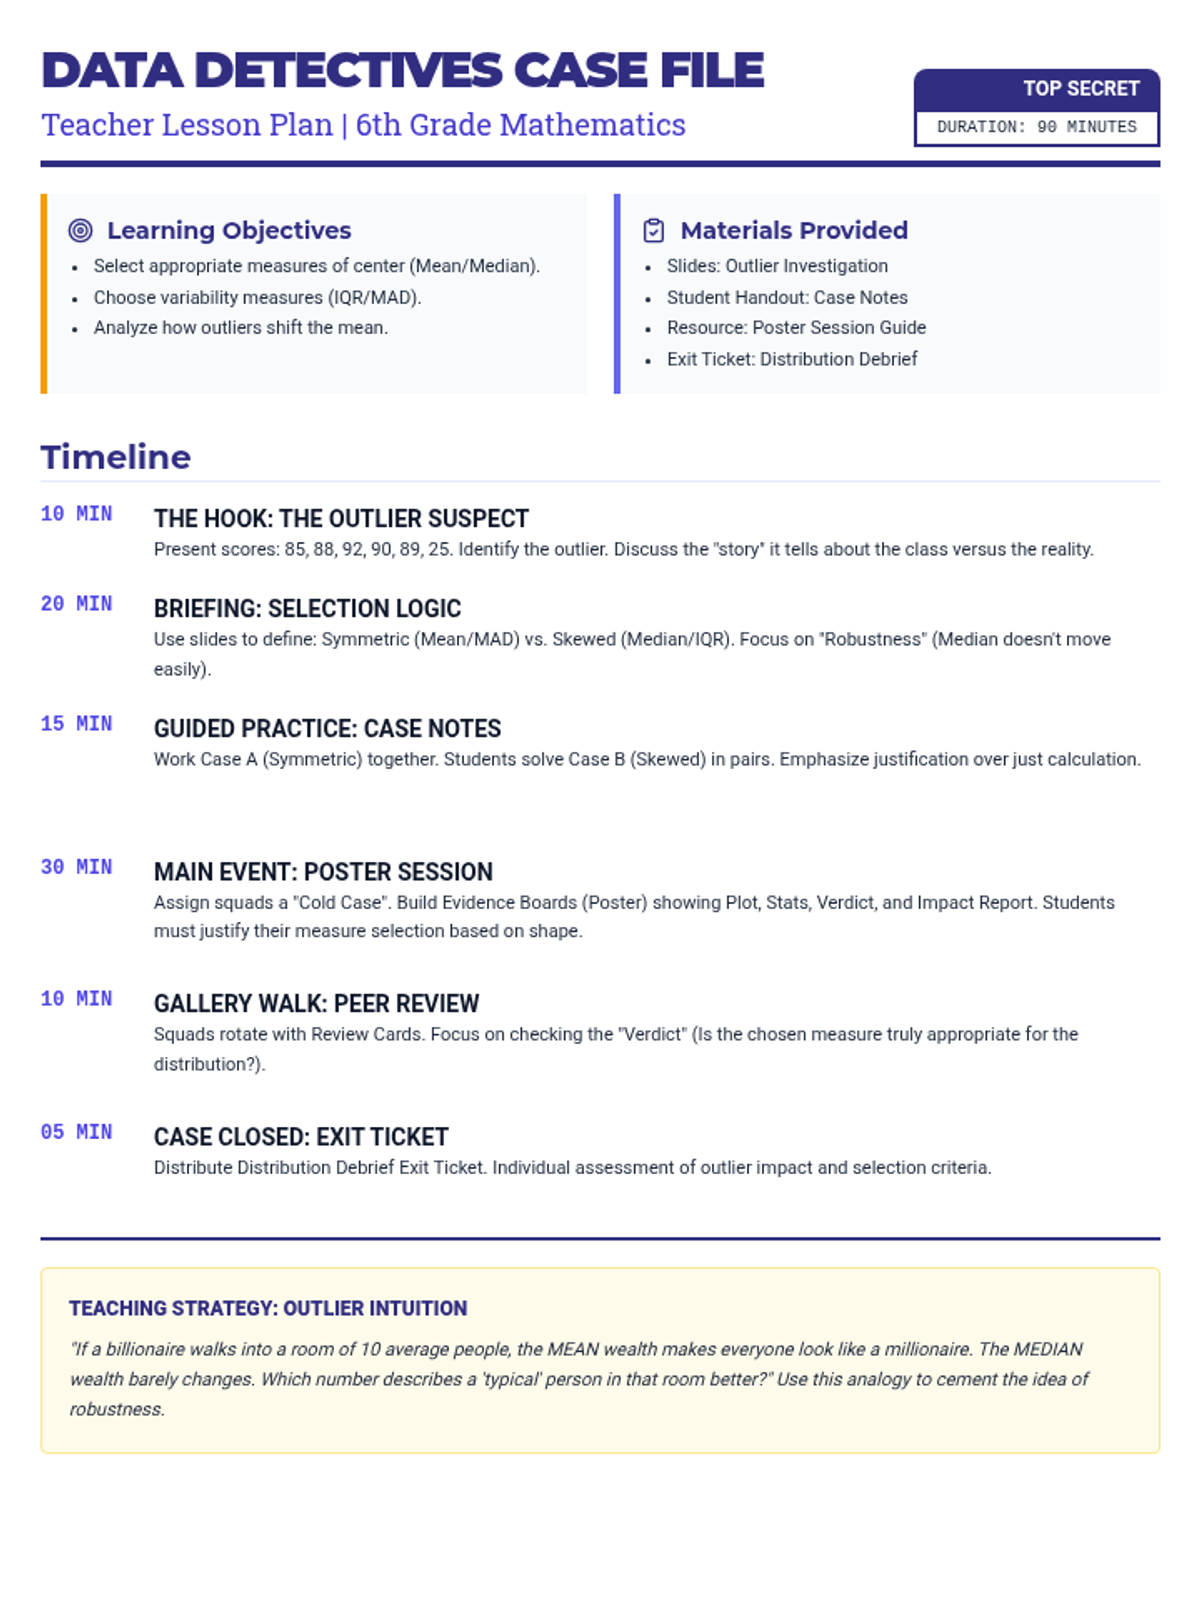
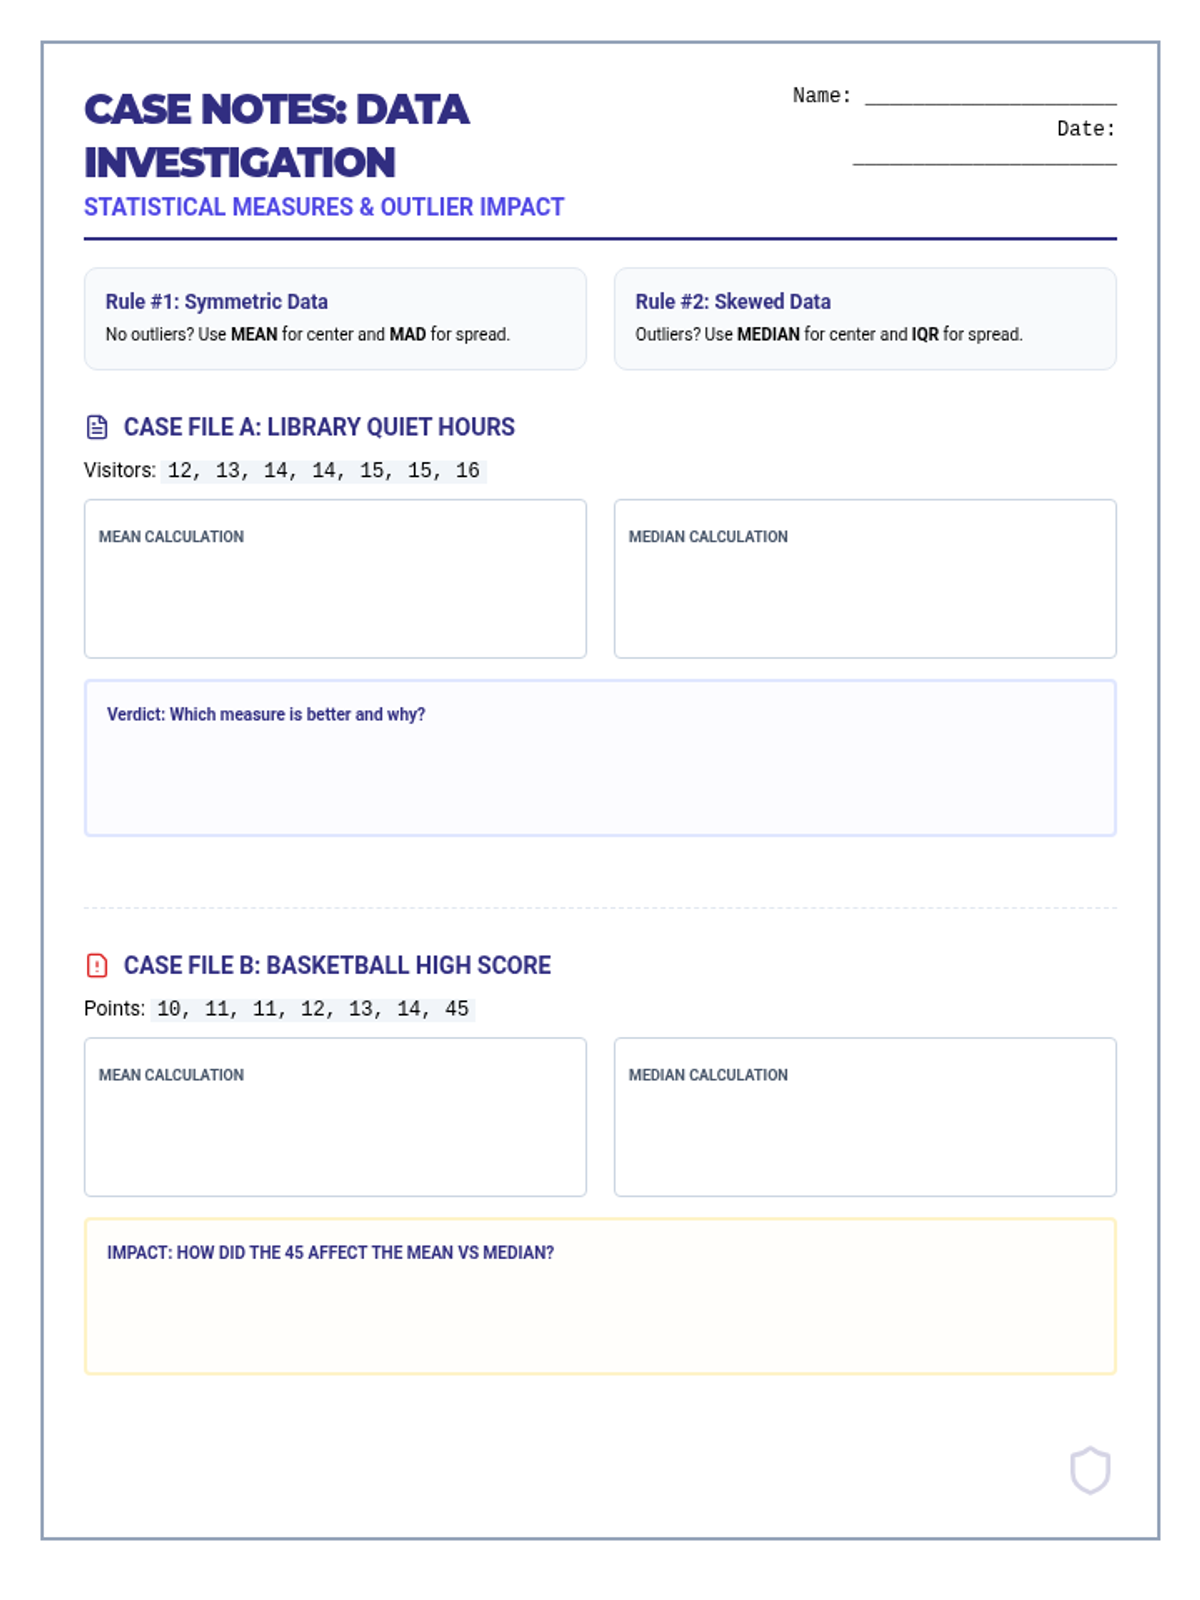
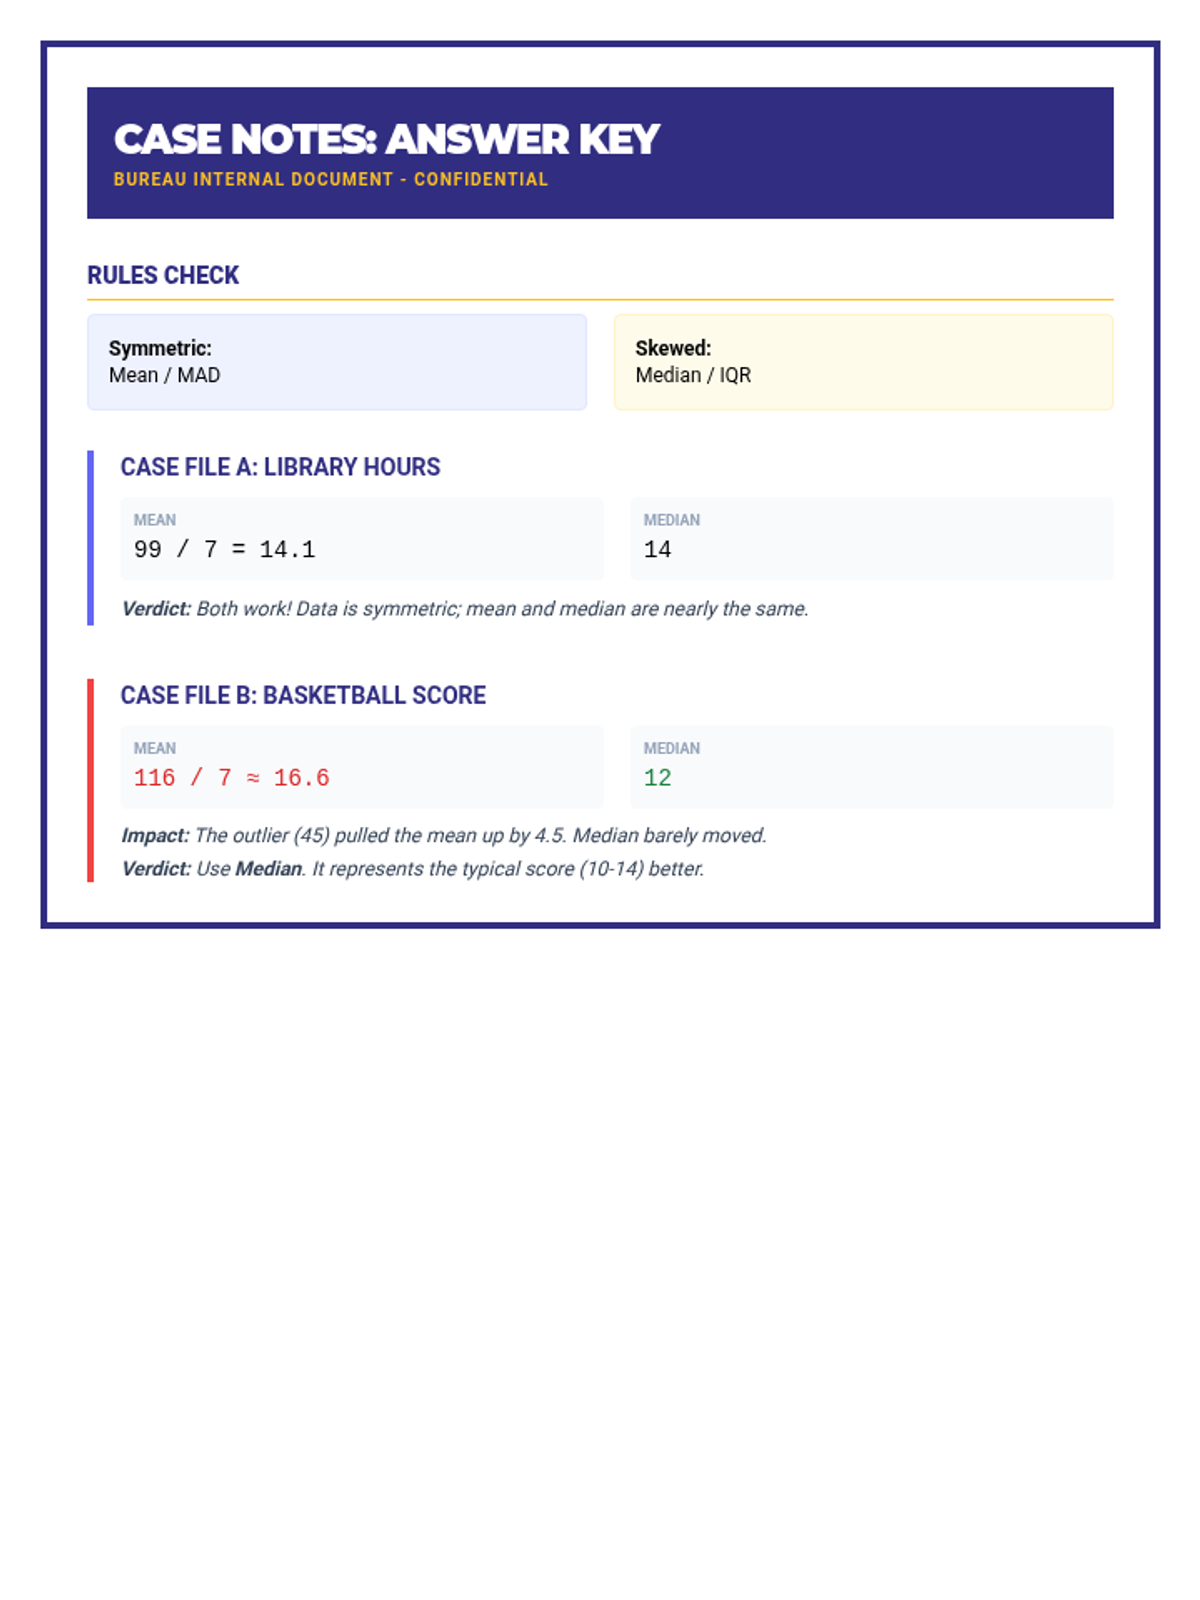
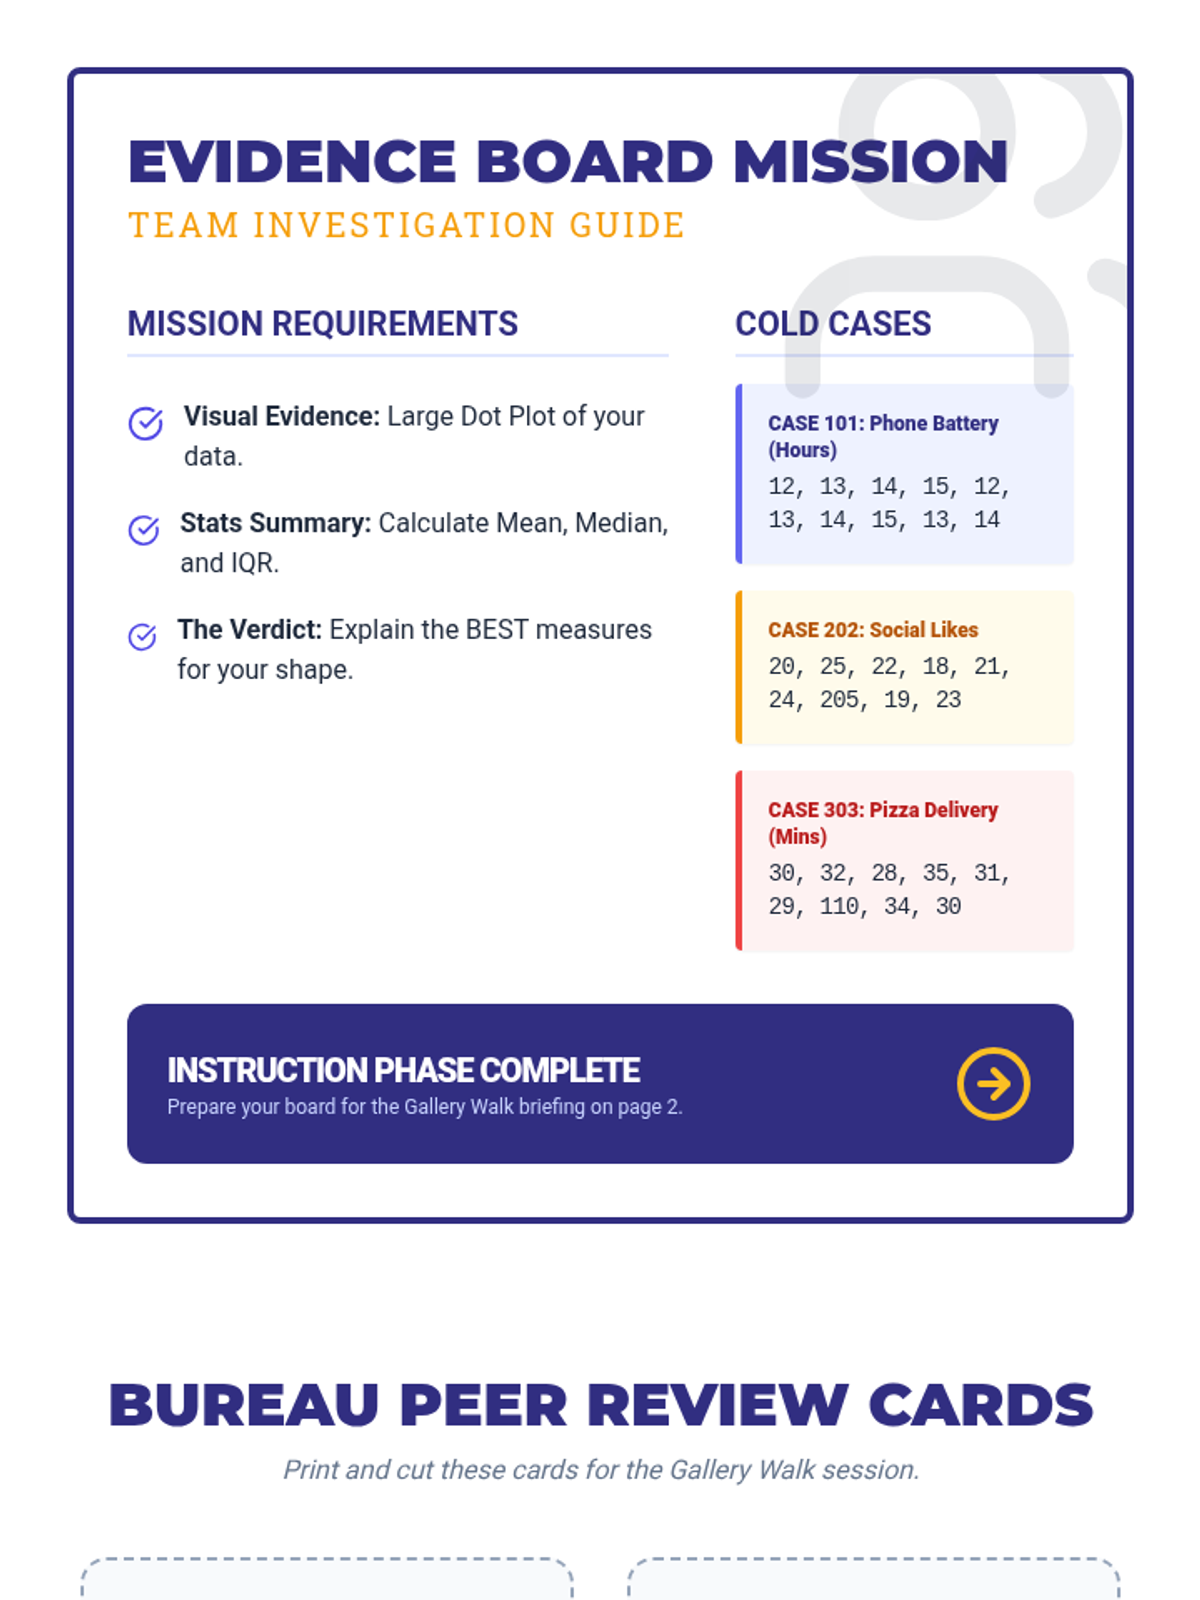
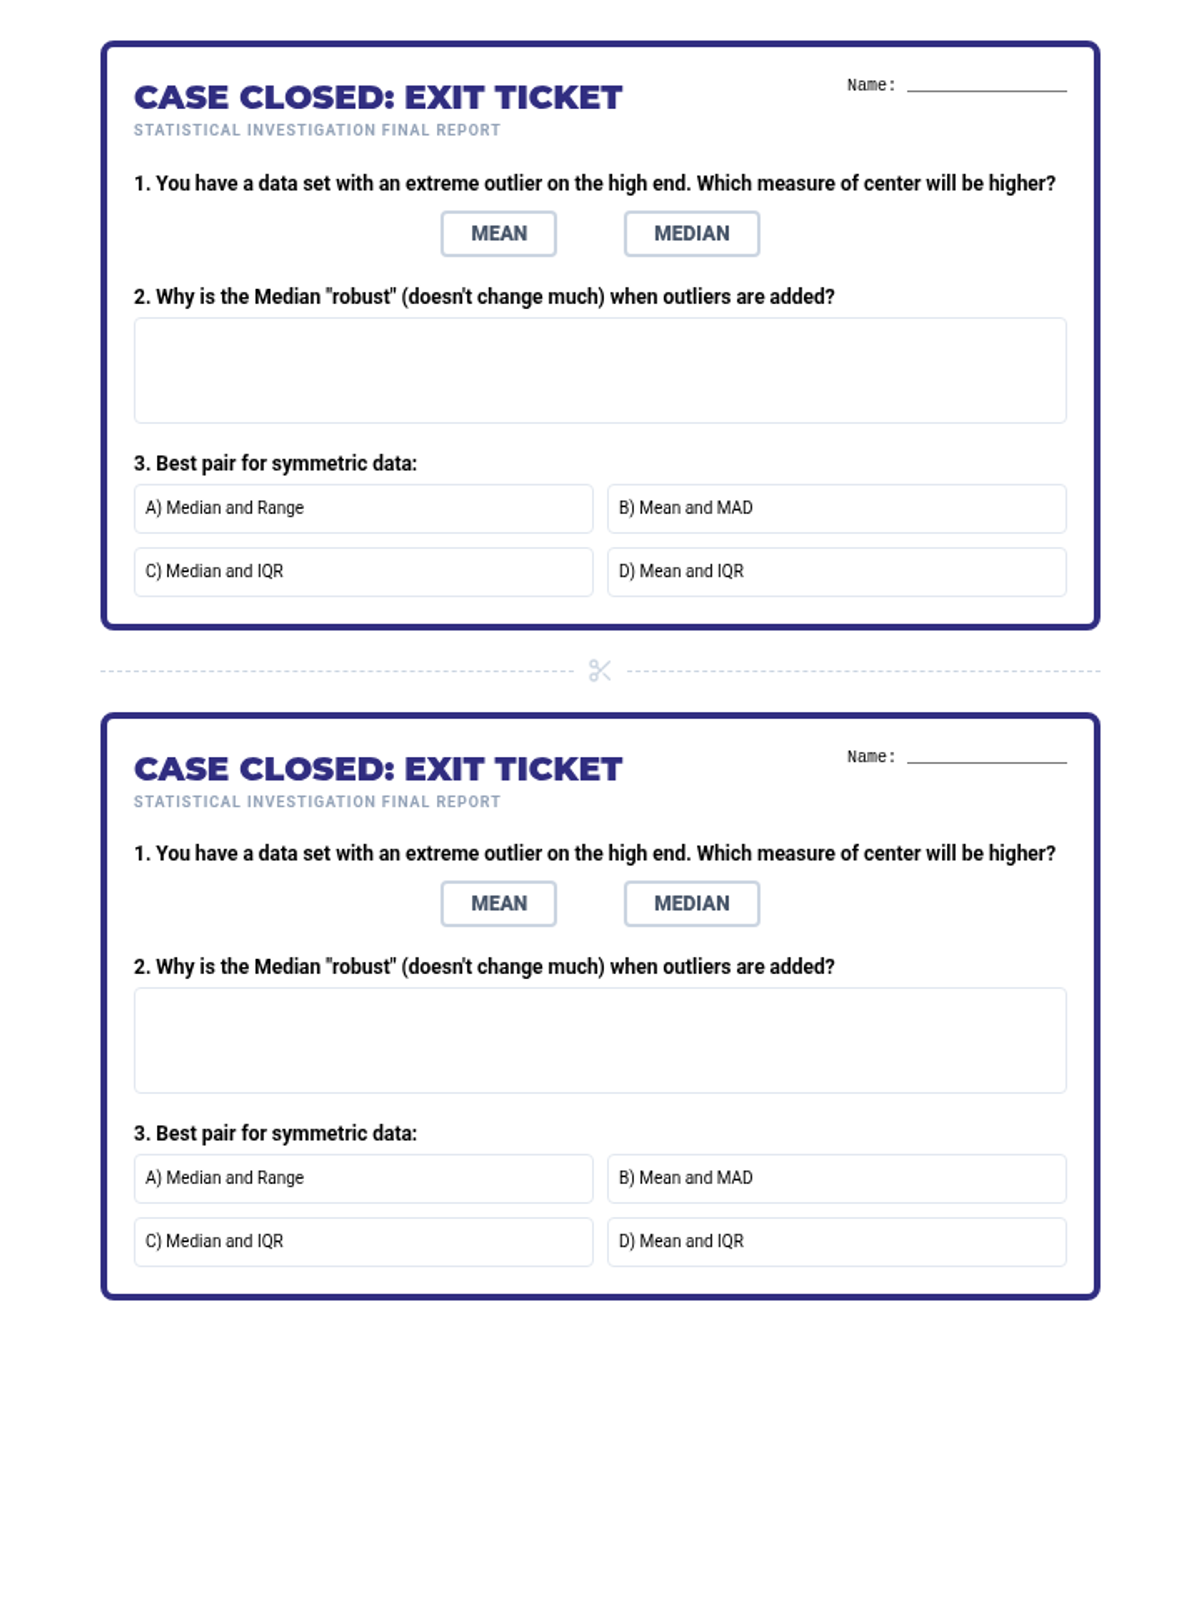
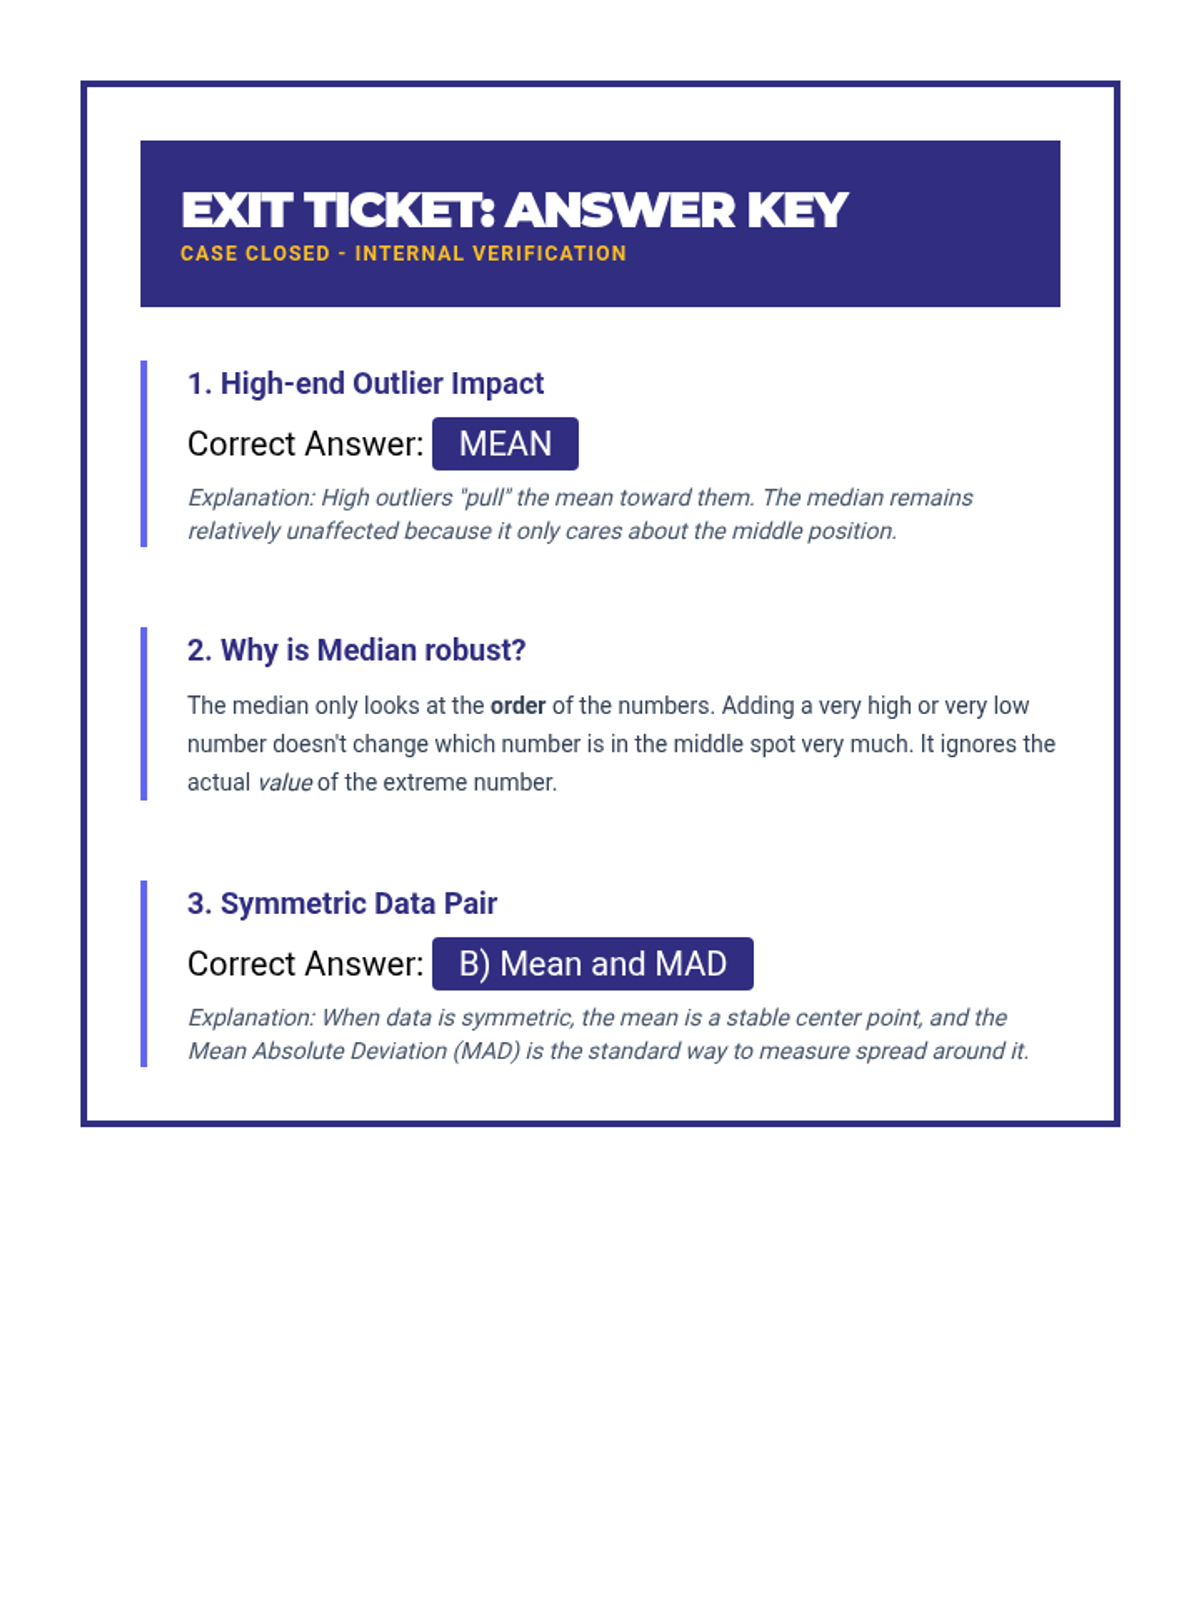
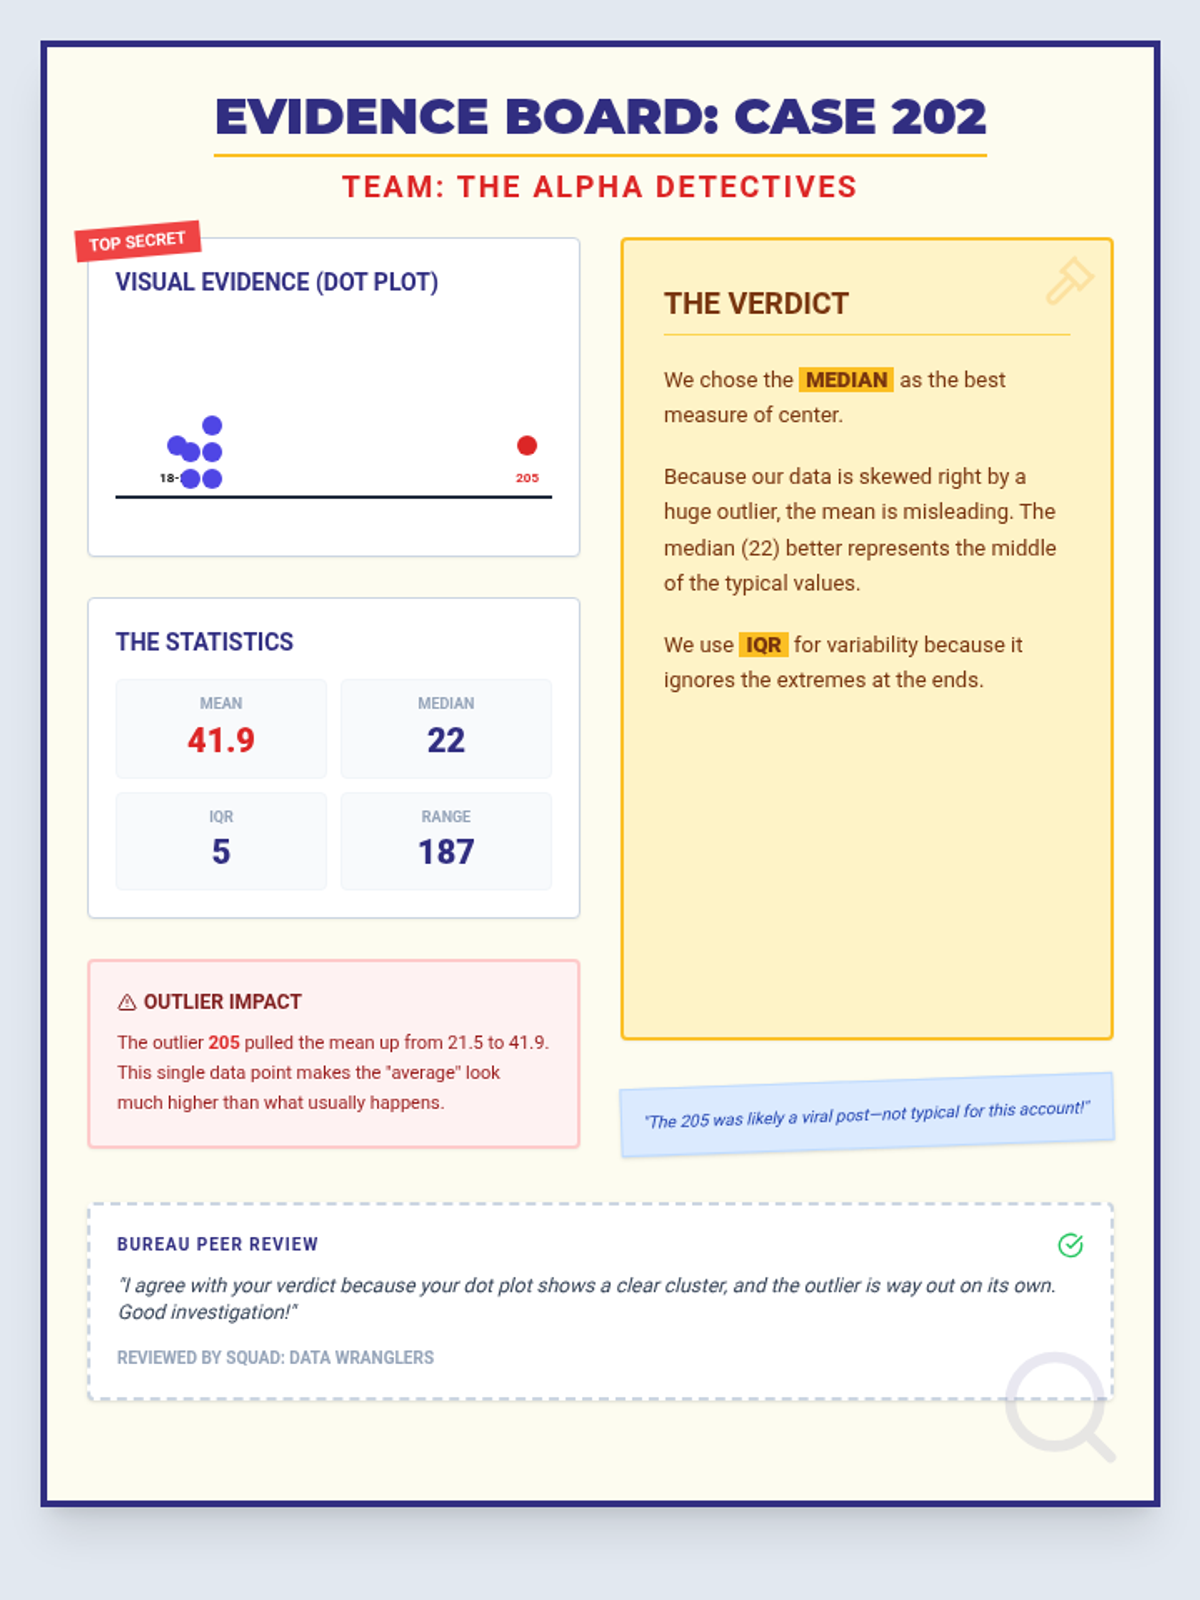
A comprehensive 90-minute lesson where students become 'Data Detectives' to investigate how outliers influence measures of center and variability, culminating in a collaborative poster session.
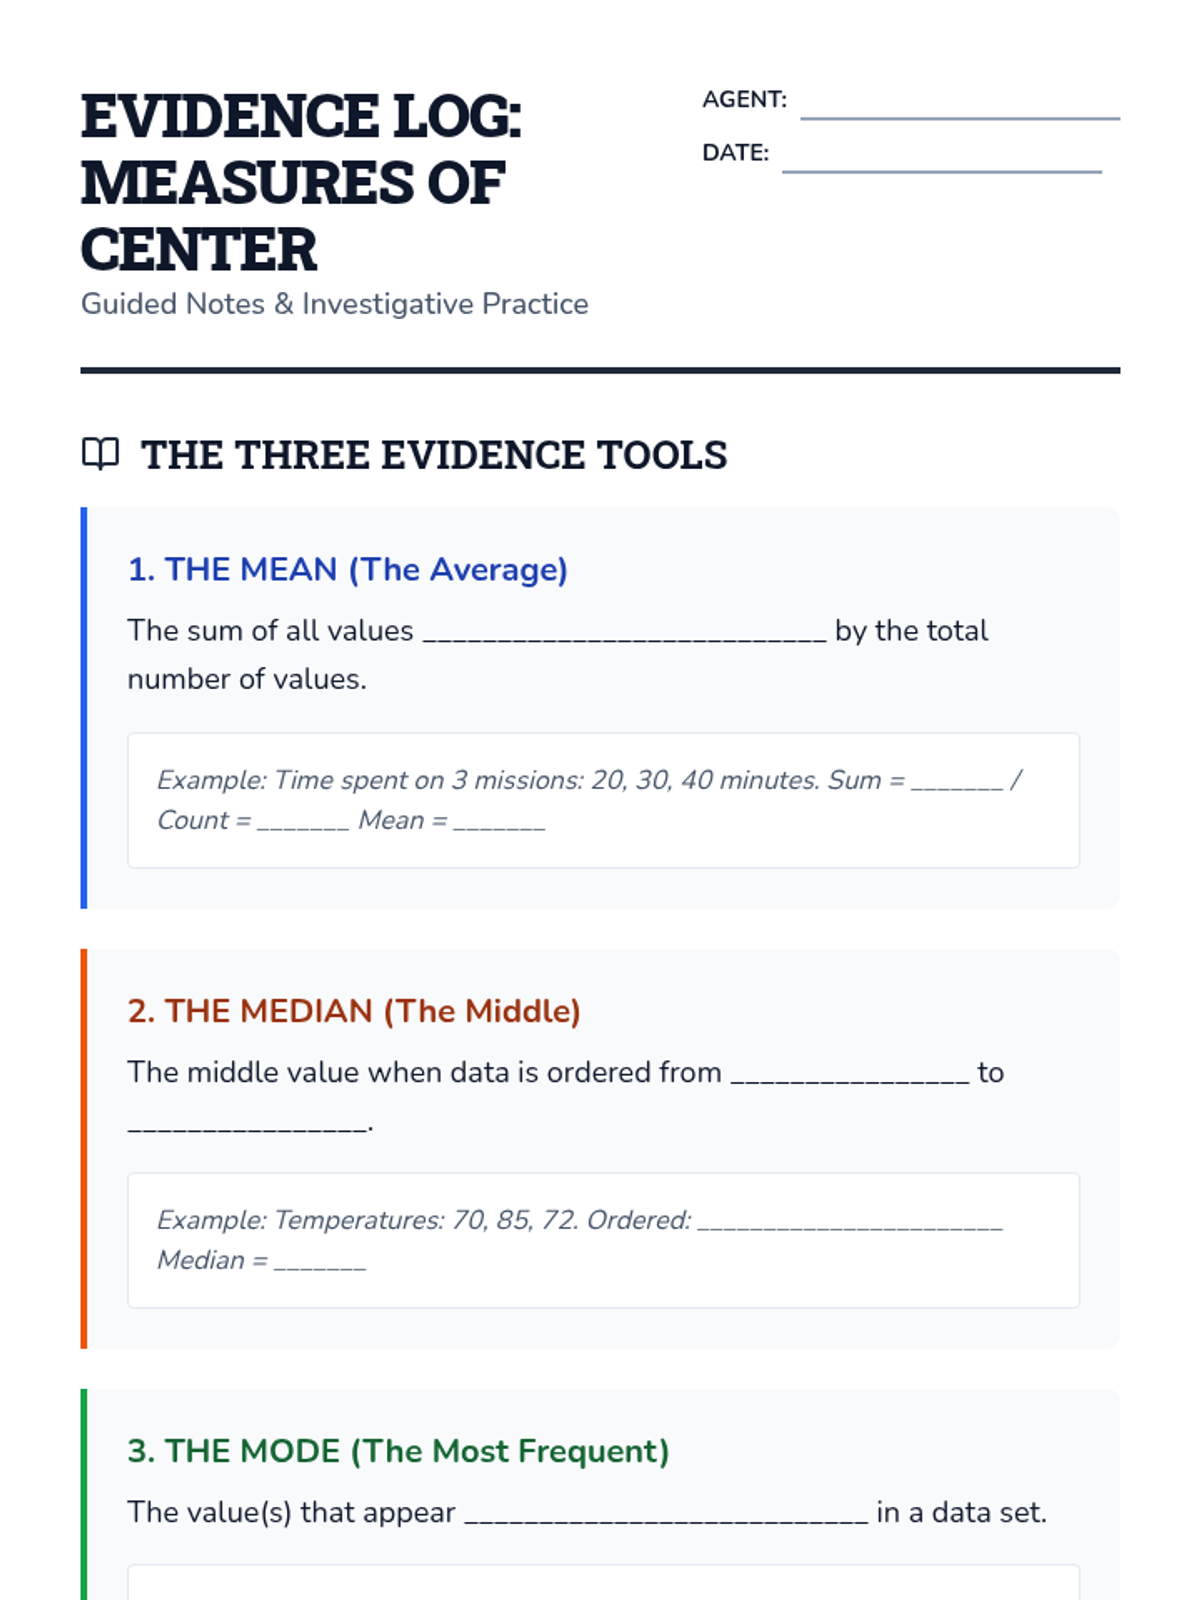
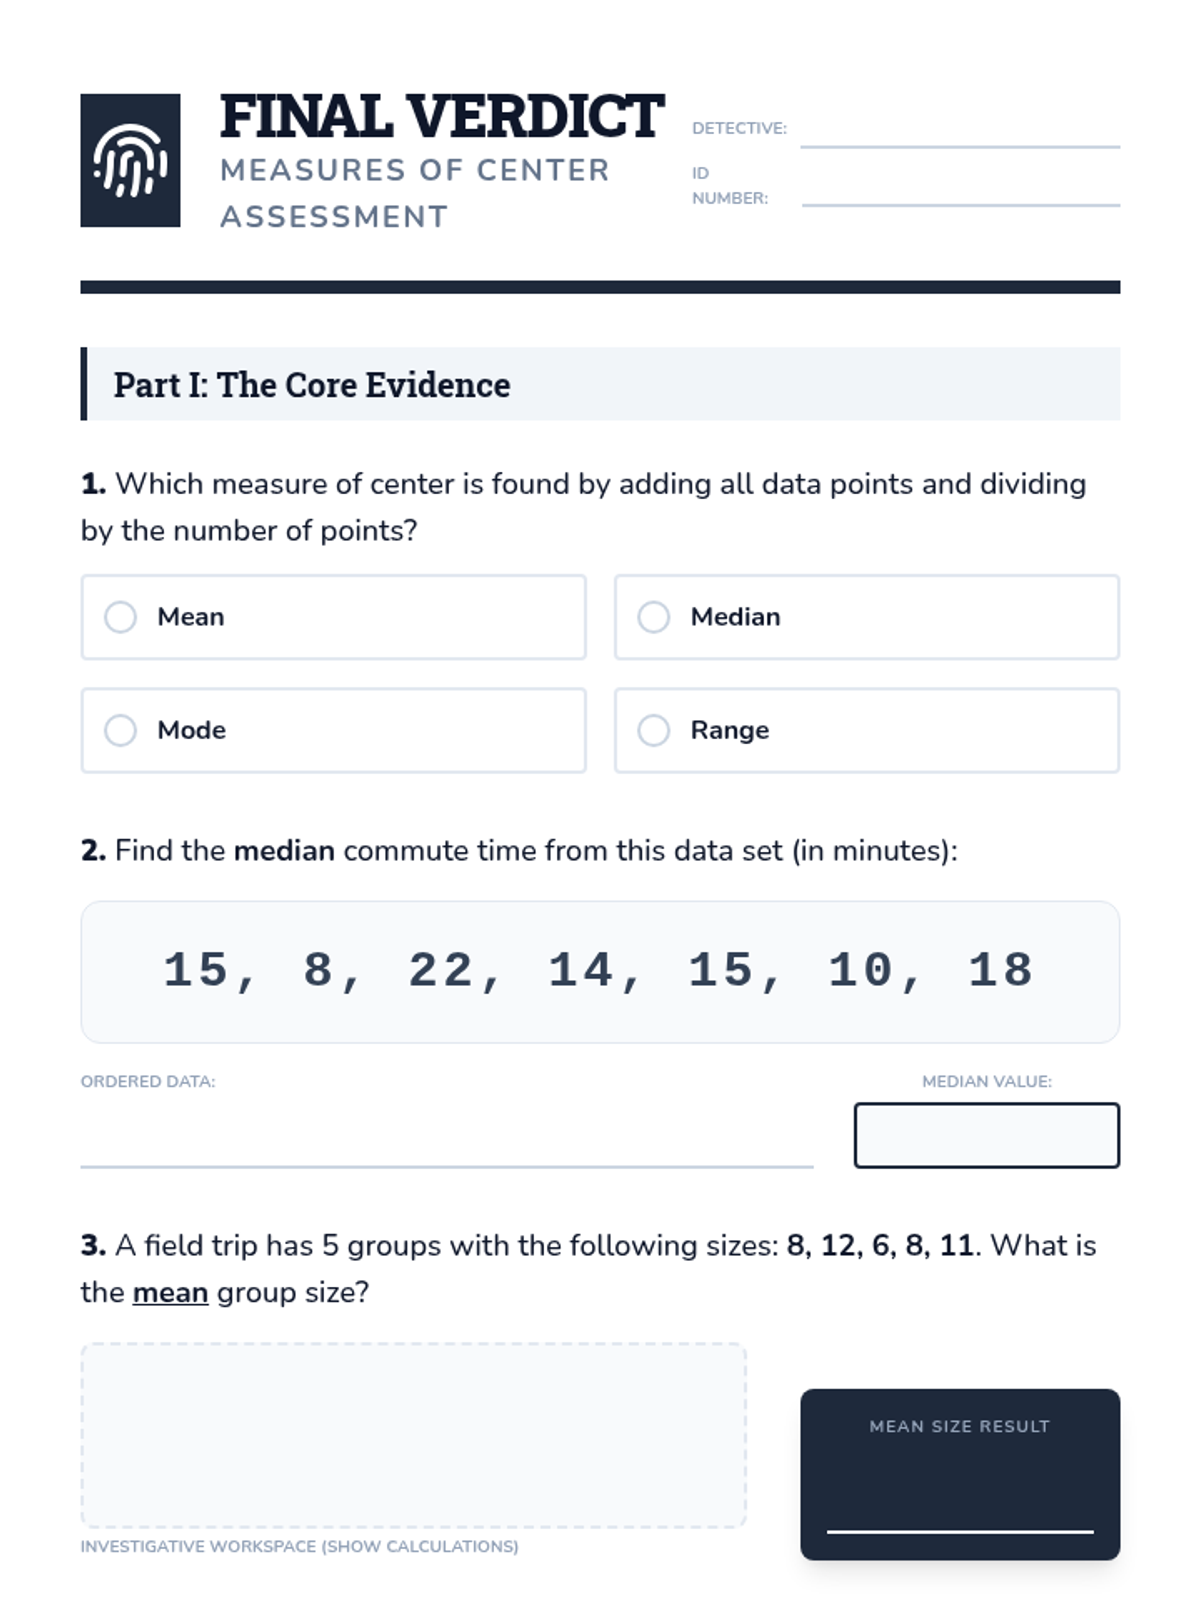
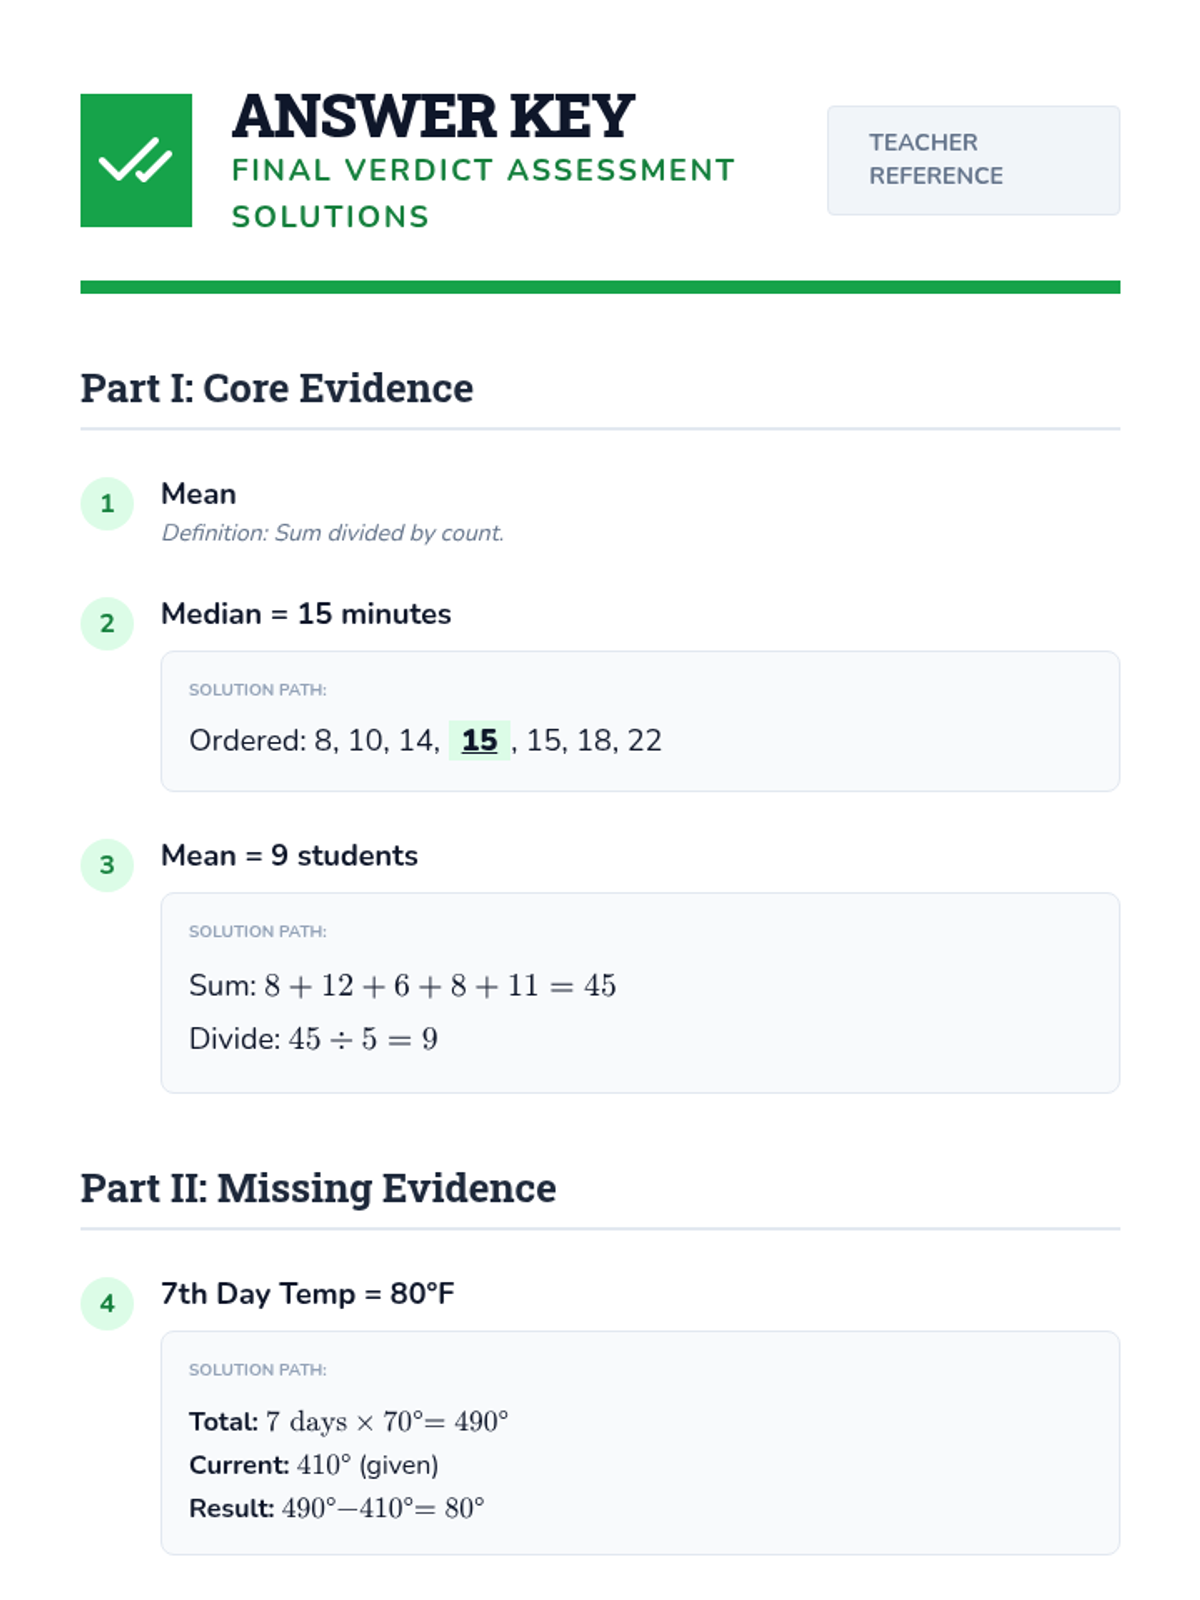
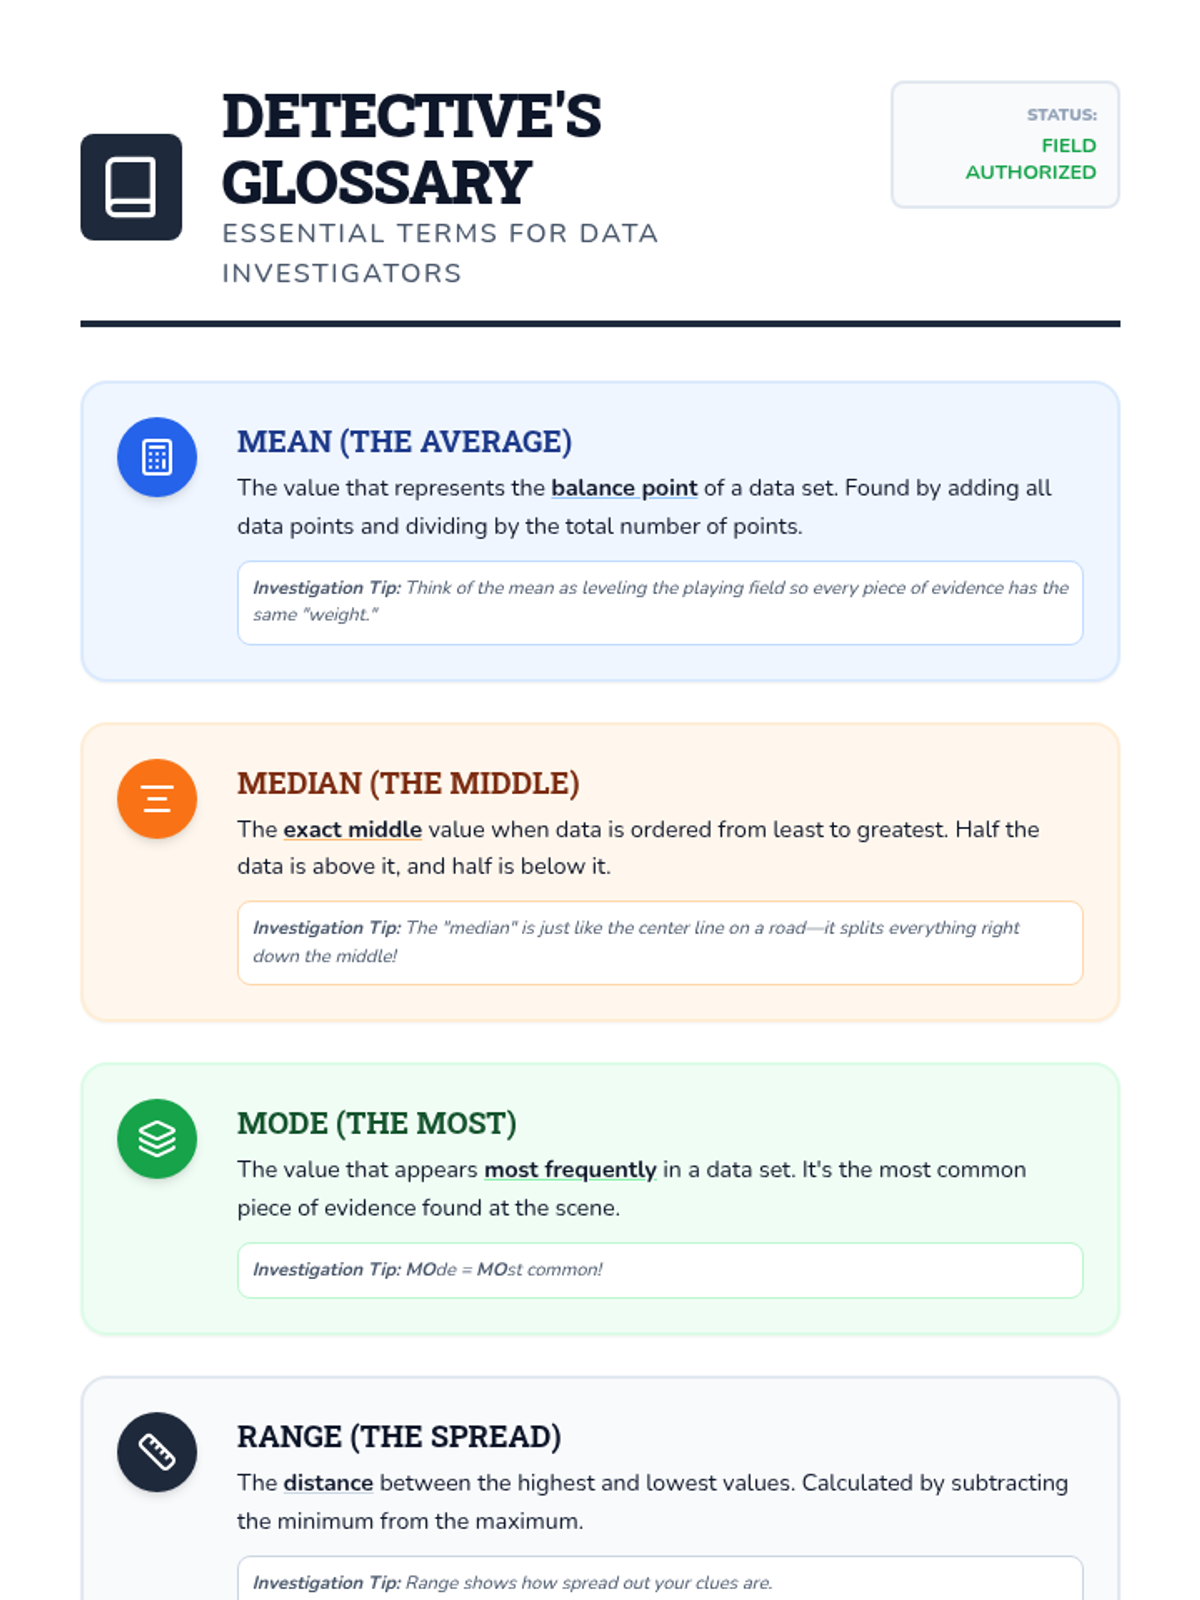
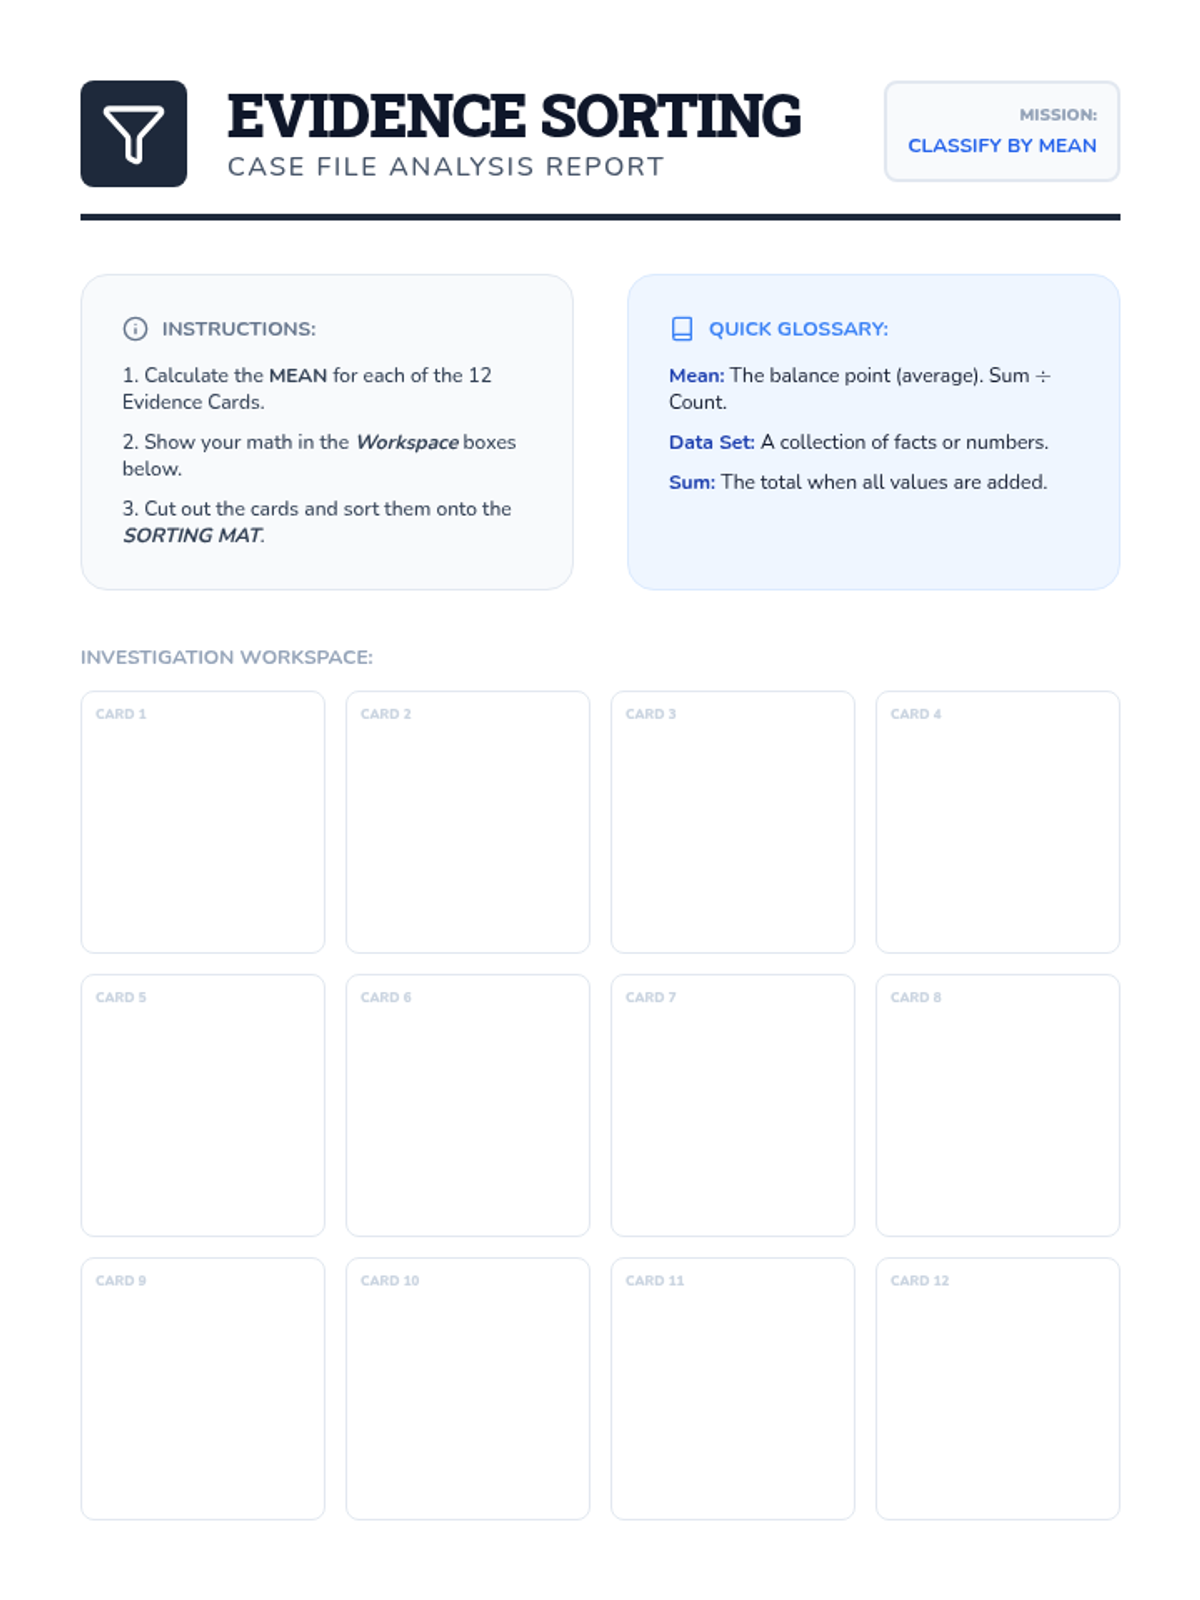
A comprehensive lesson on measures of center (mean, median, mode) where students learn to summarize numerical data and find missing values using time, temperature, and group size data.
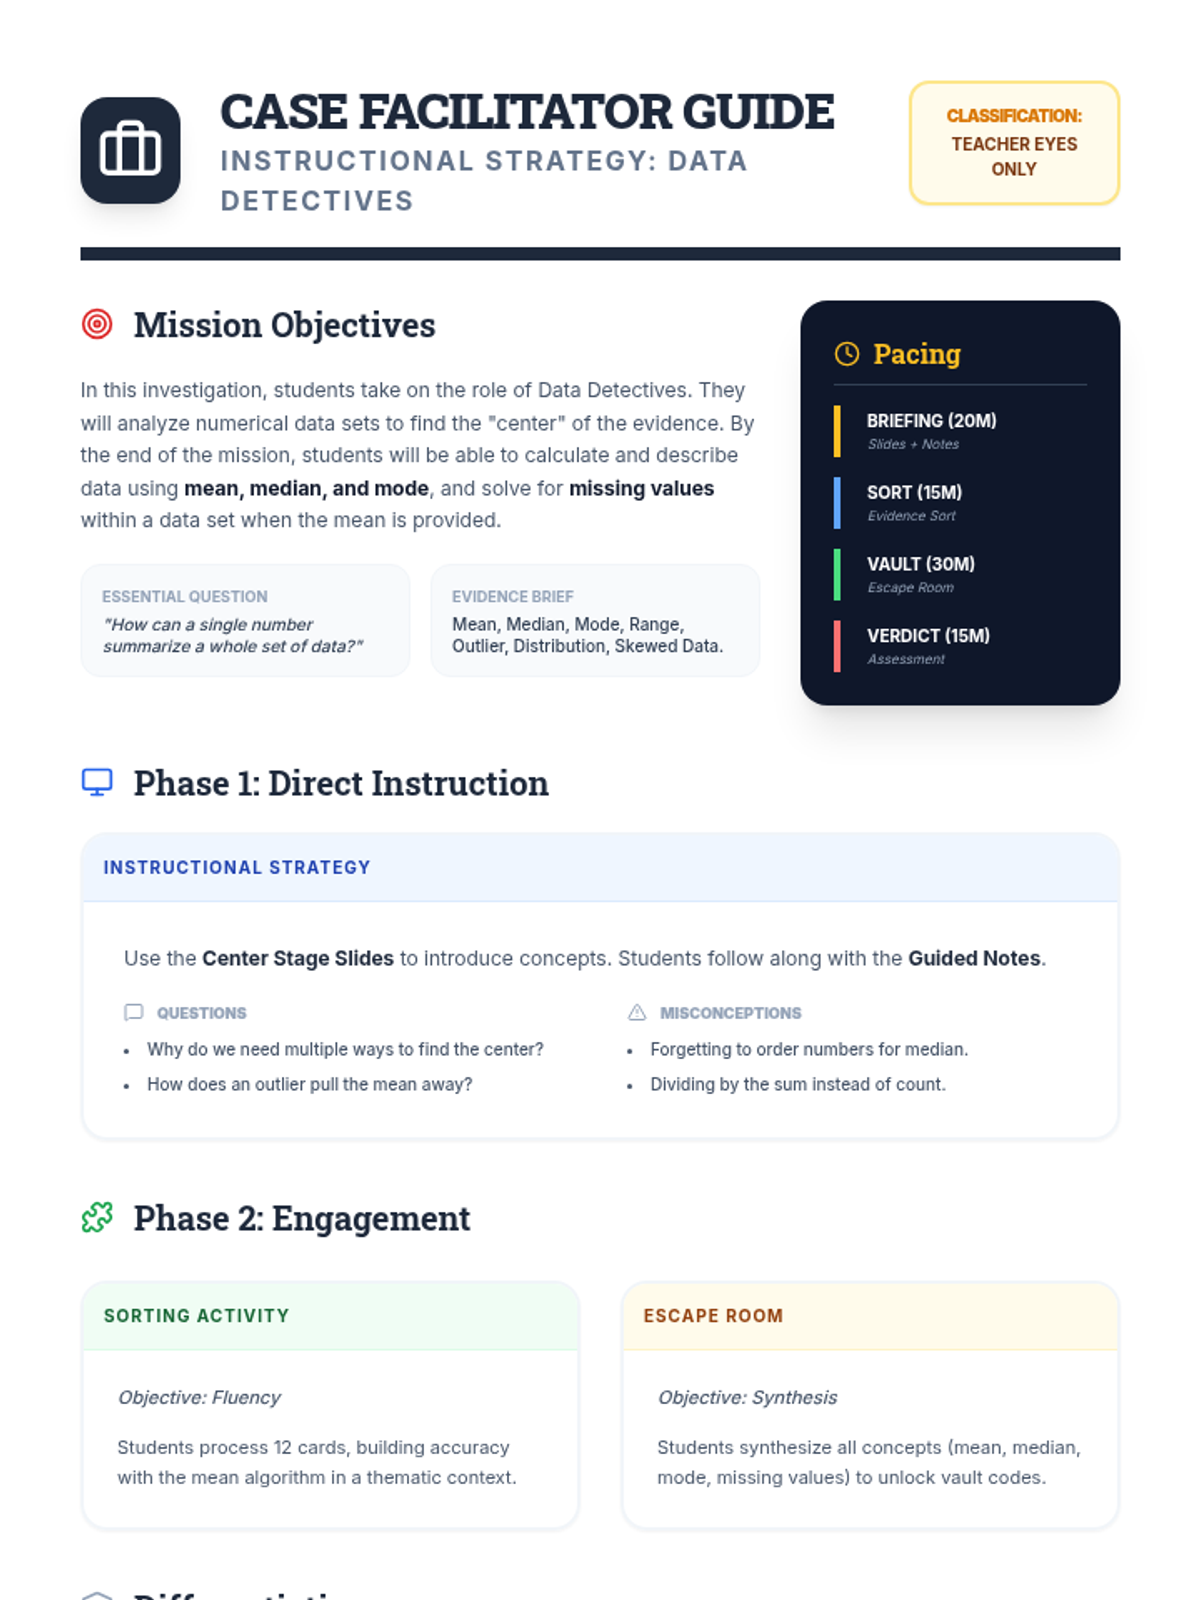
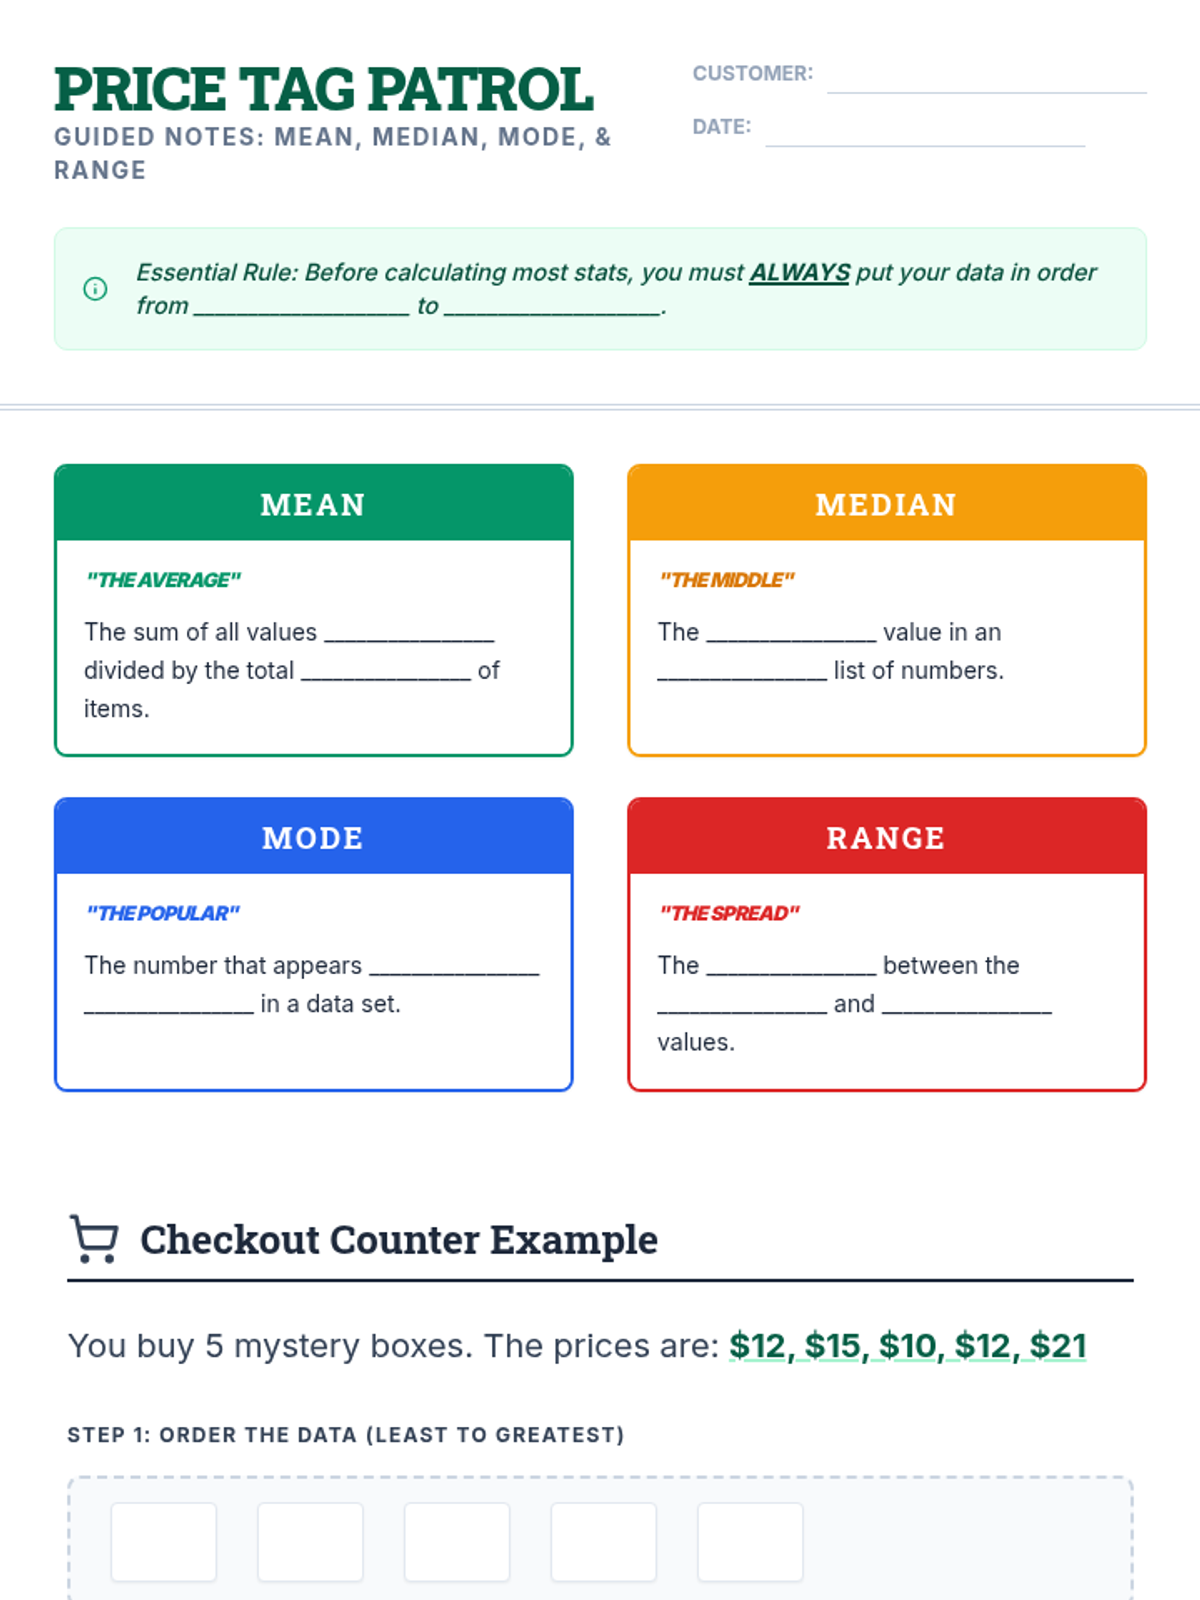
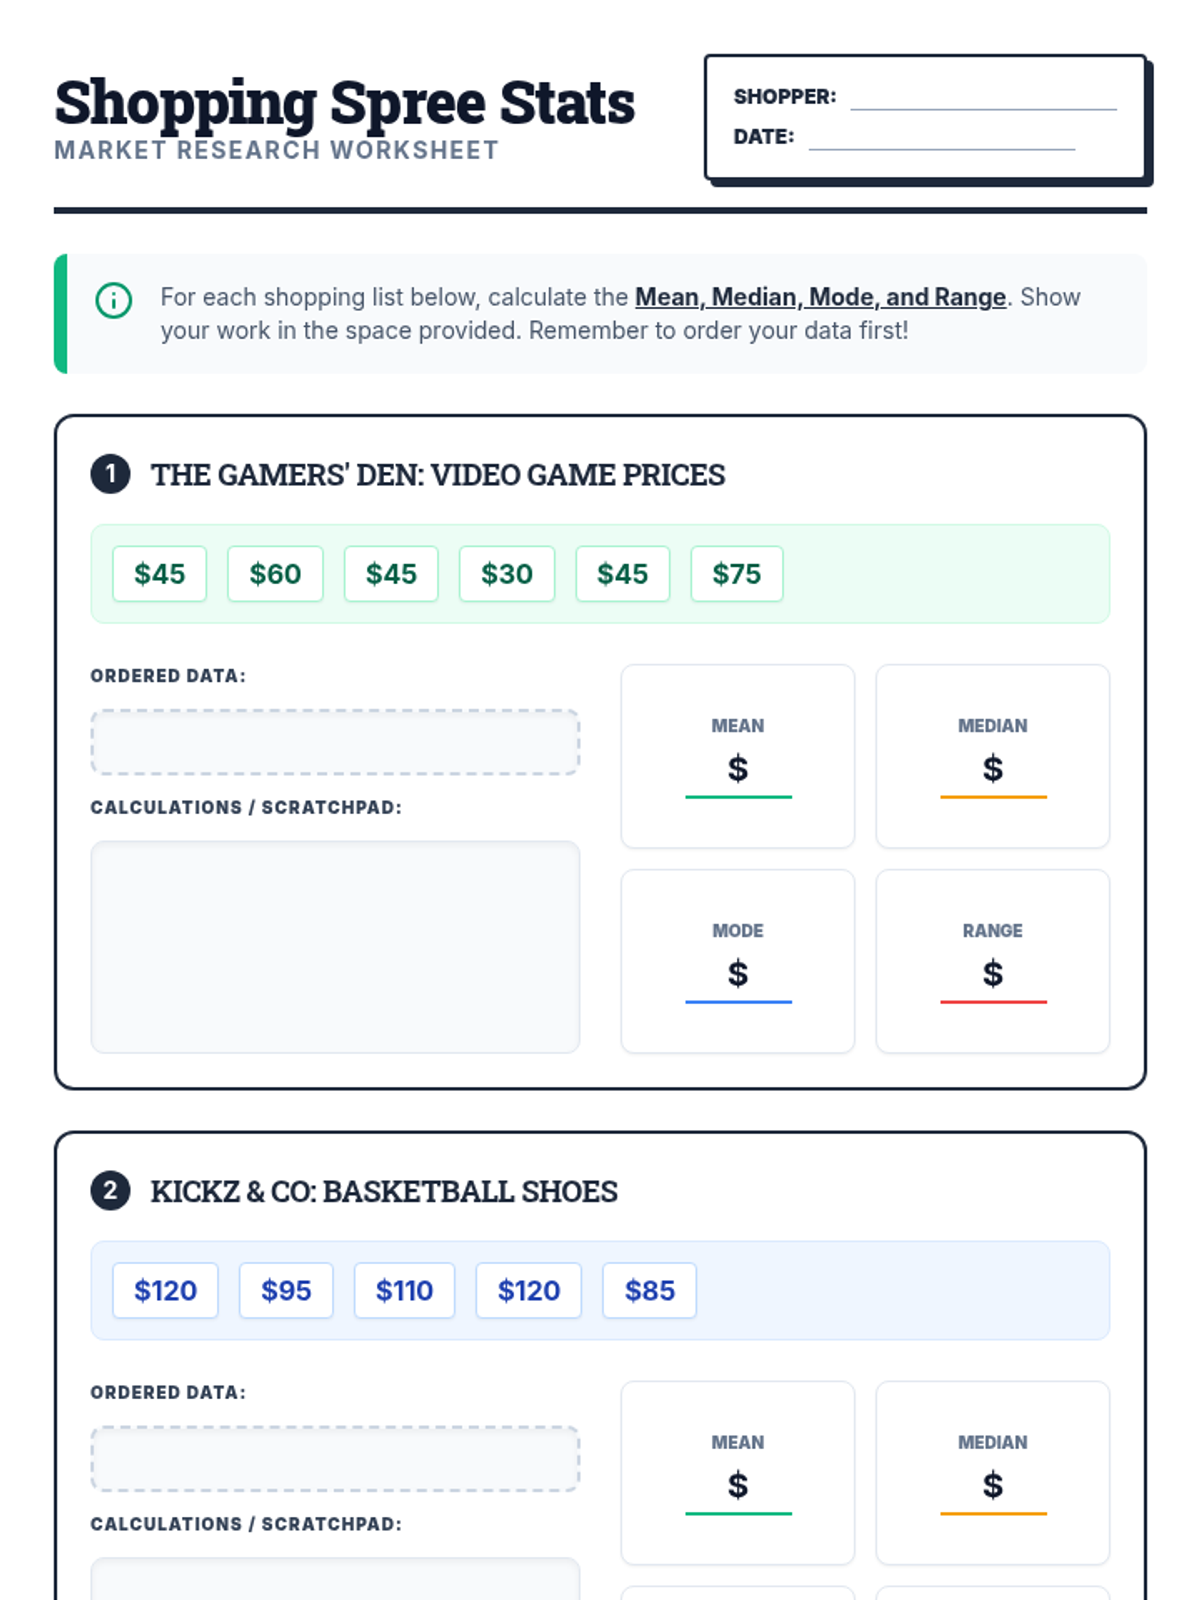
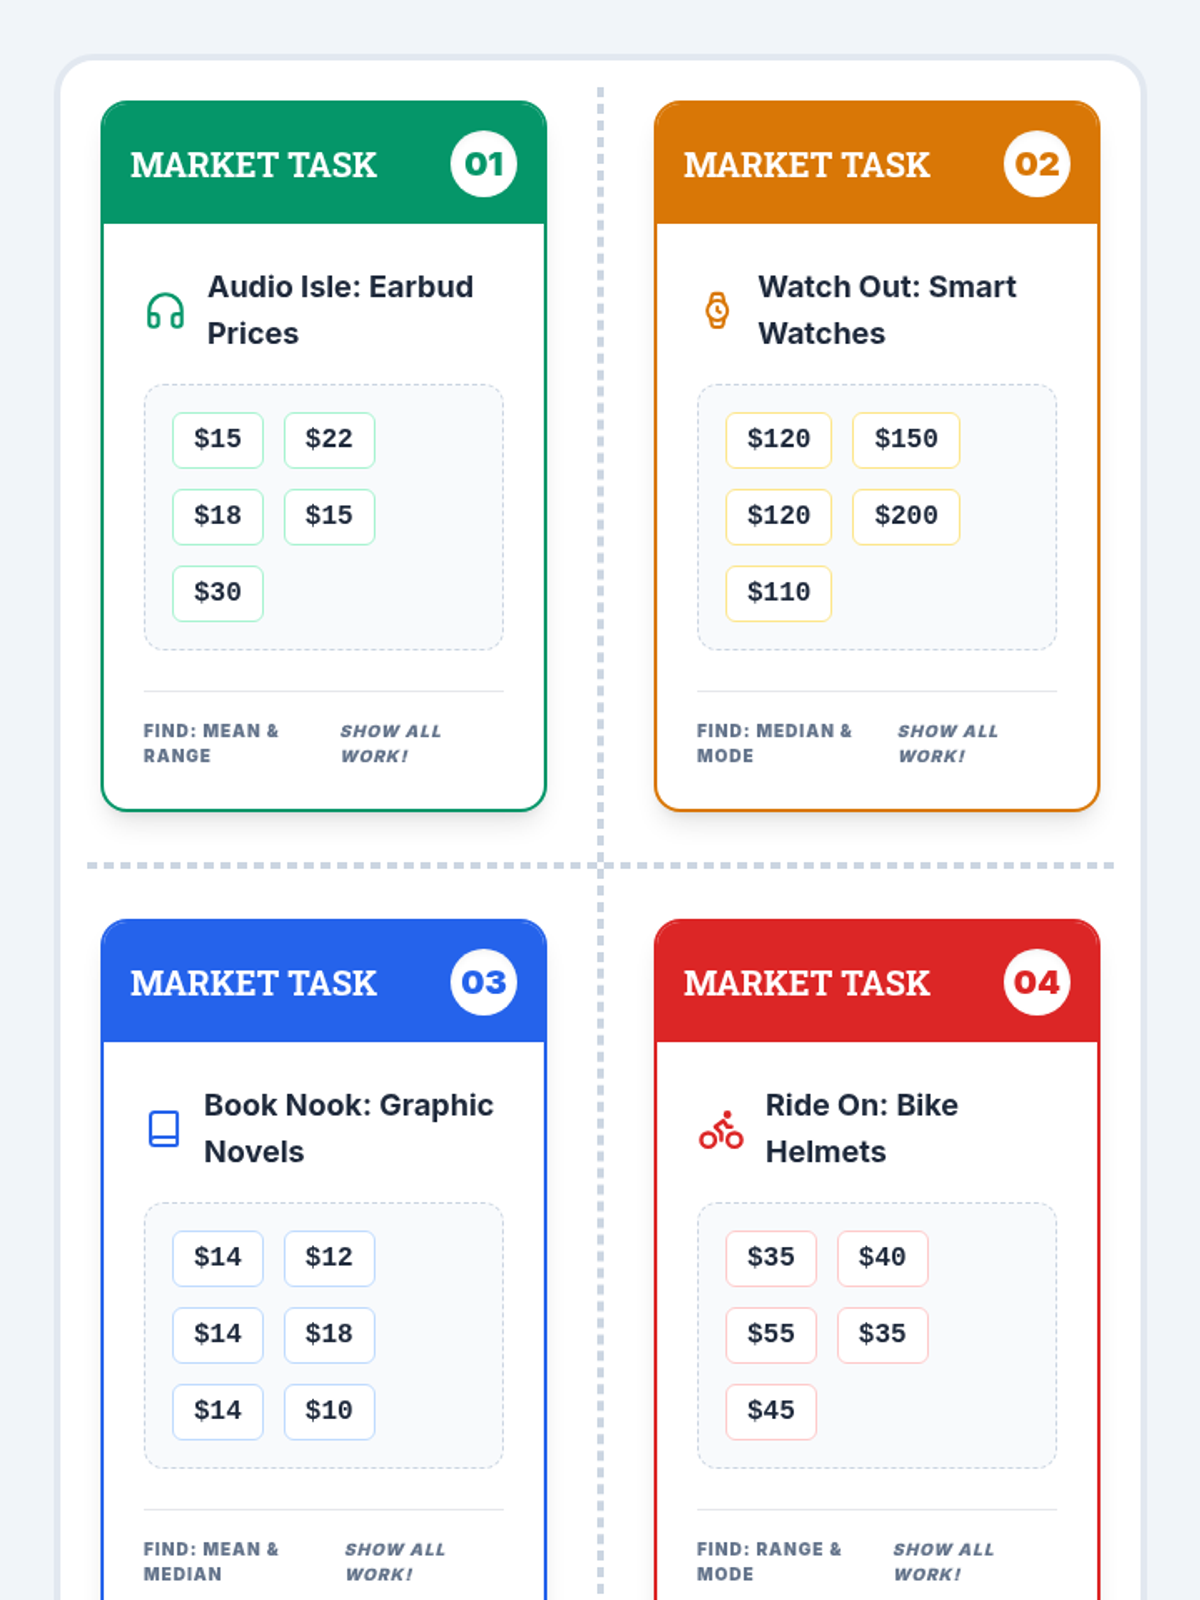
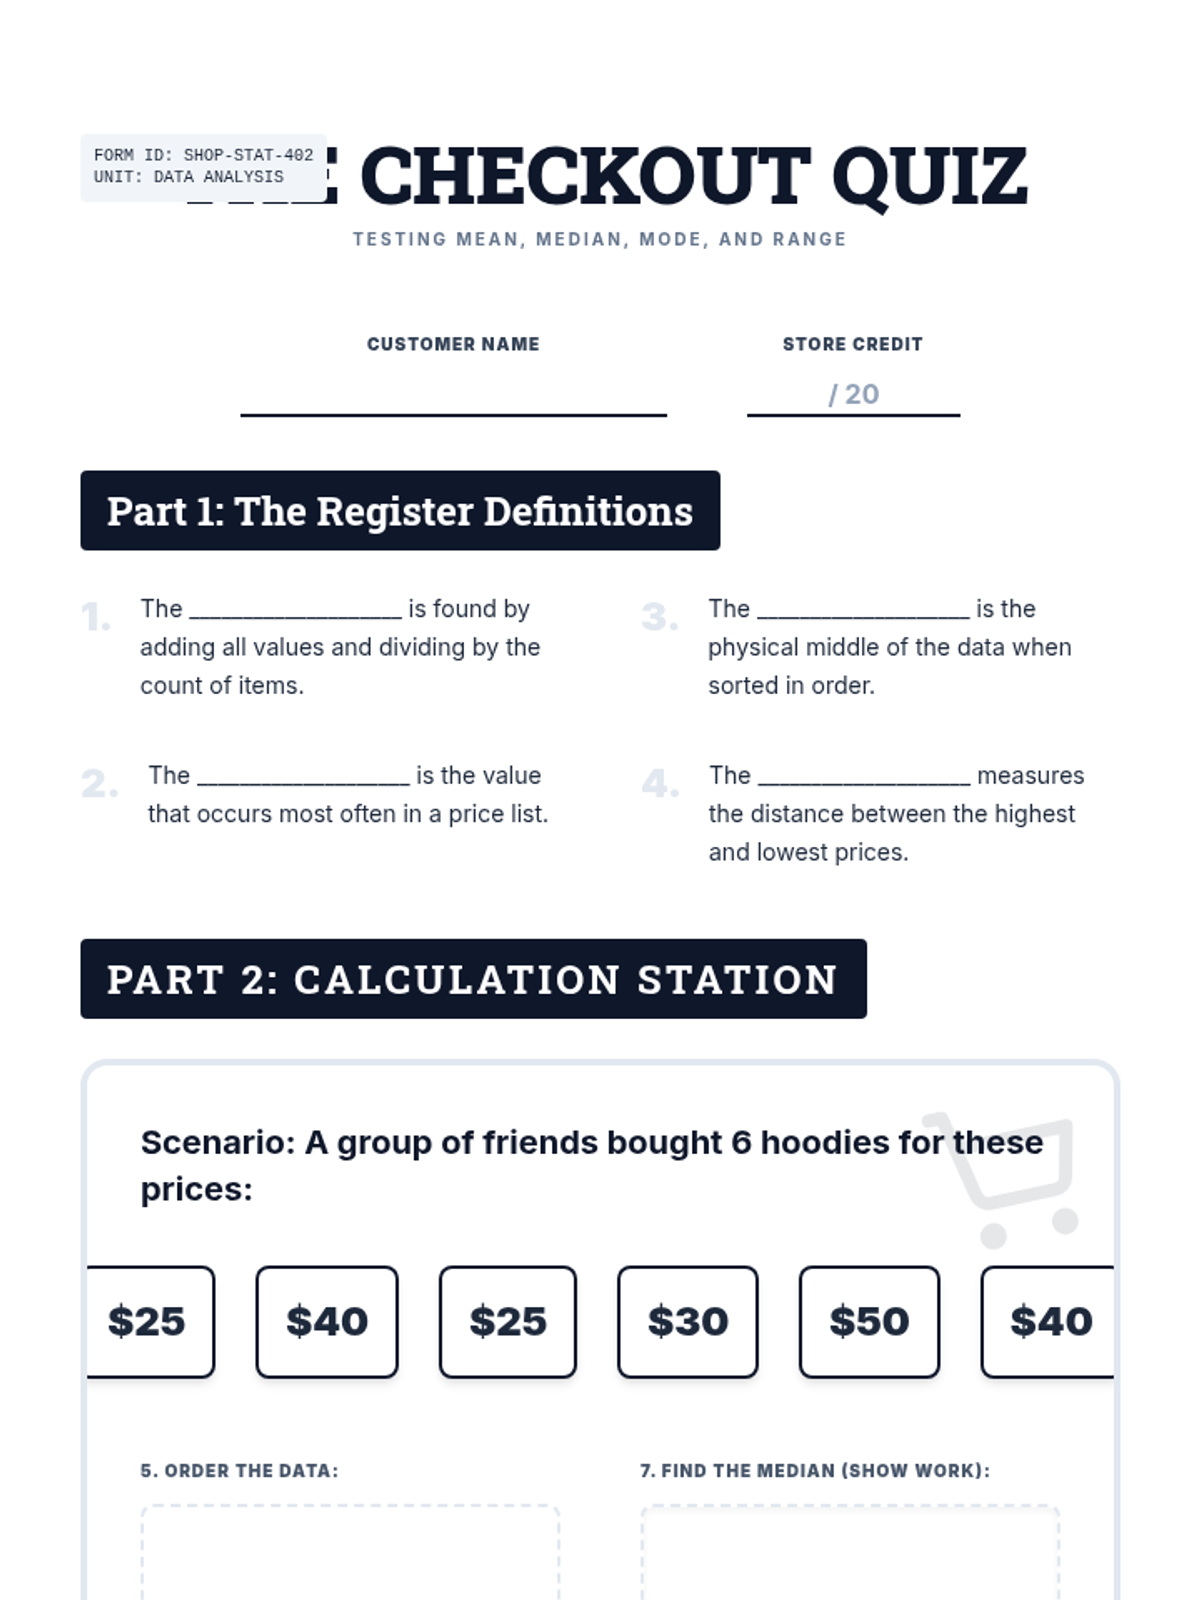
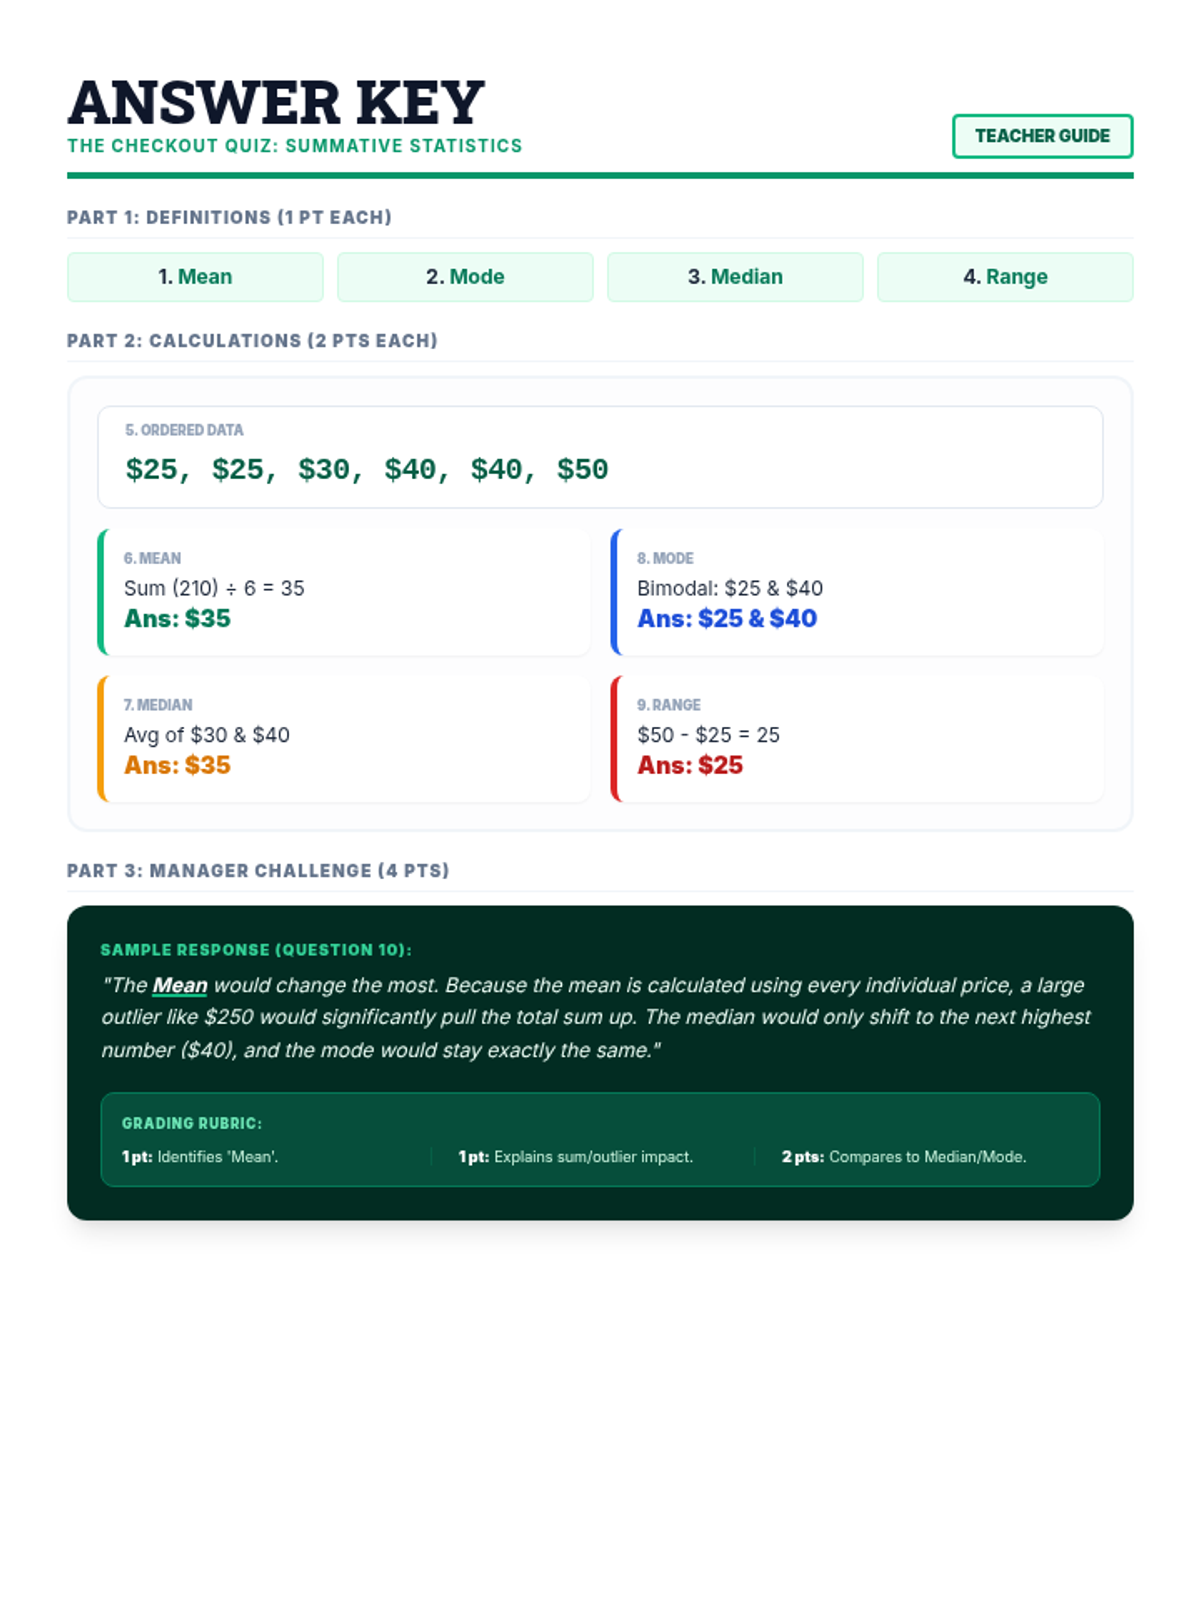
A comprehensive lesson on calculating and interpreting mean, median, mode, and range using real-world shopping and pricing data. Students will analyze price lists for various items to master basic statistics.
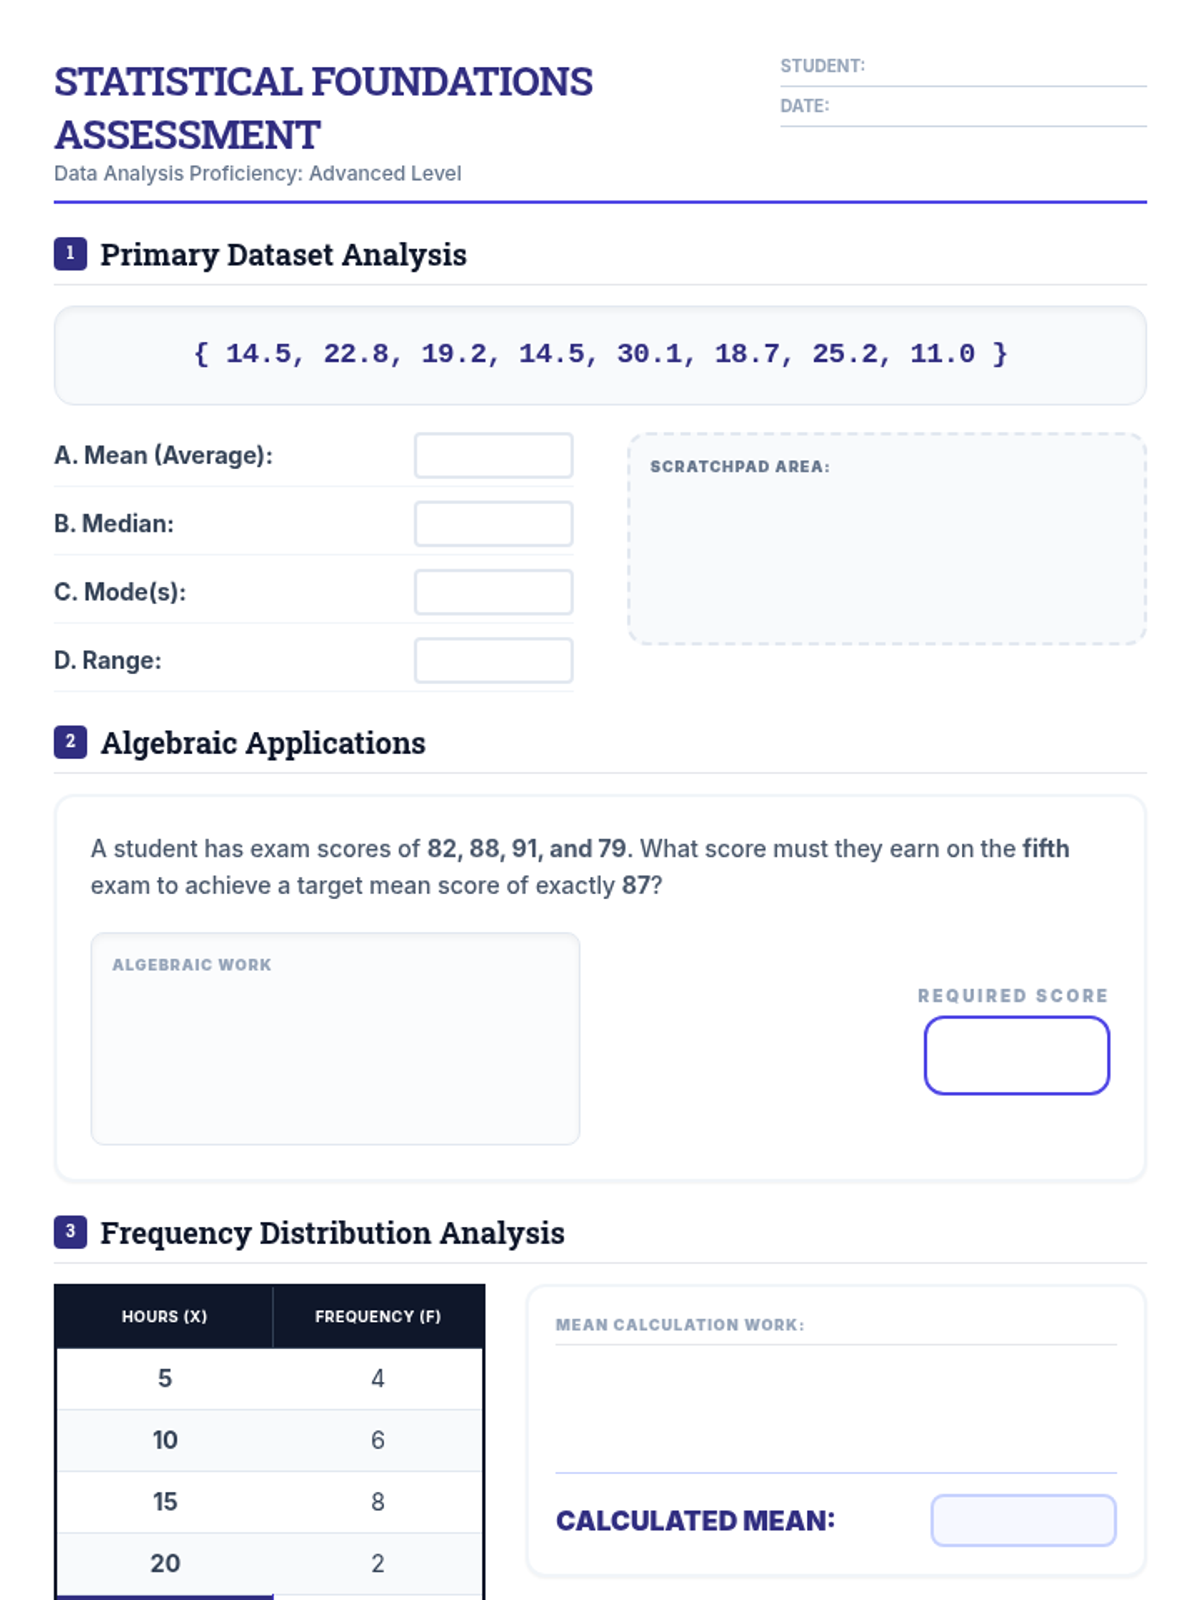
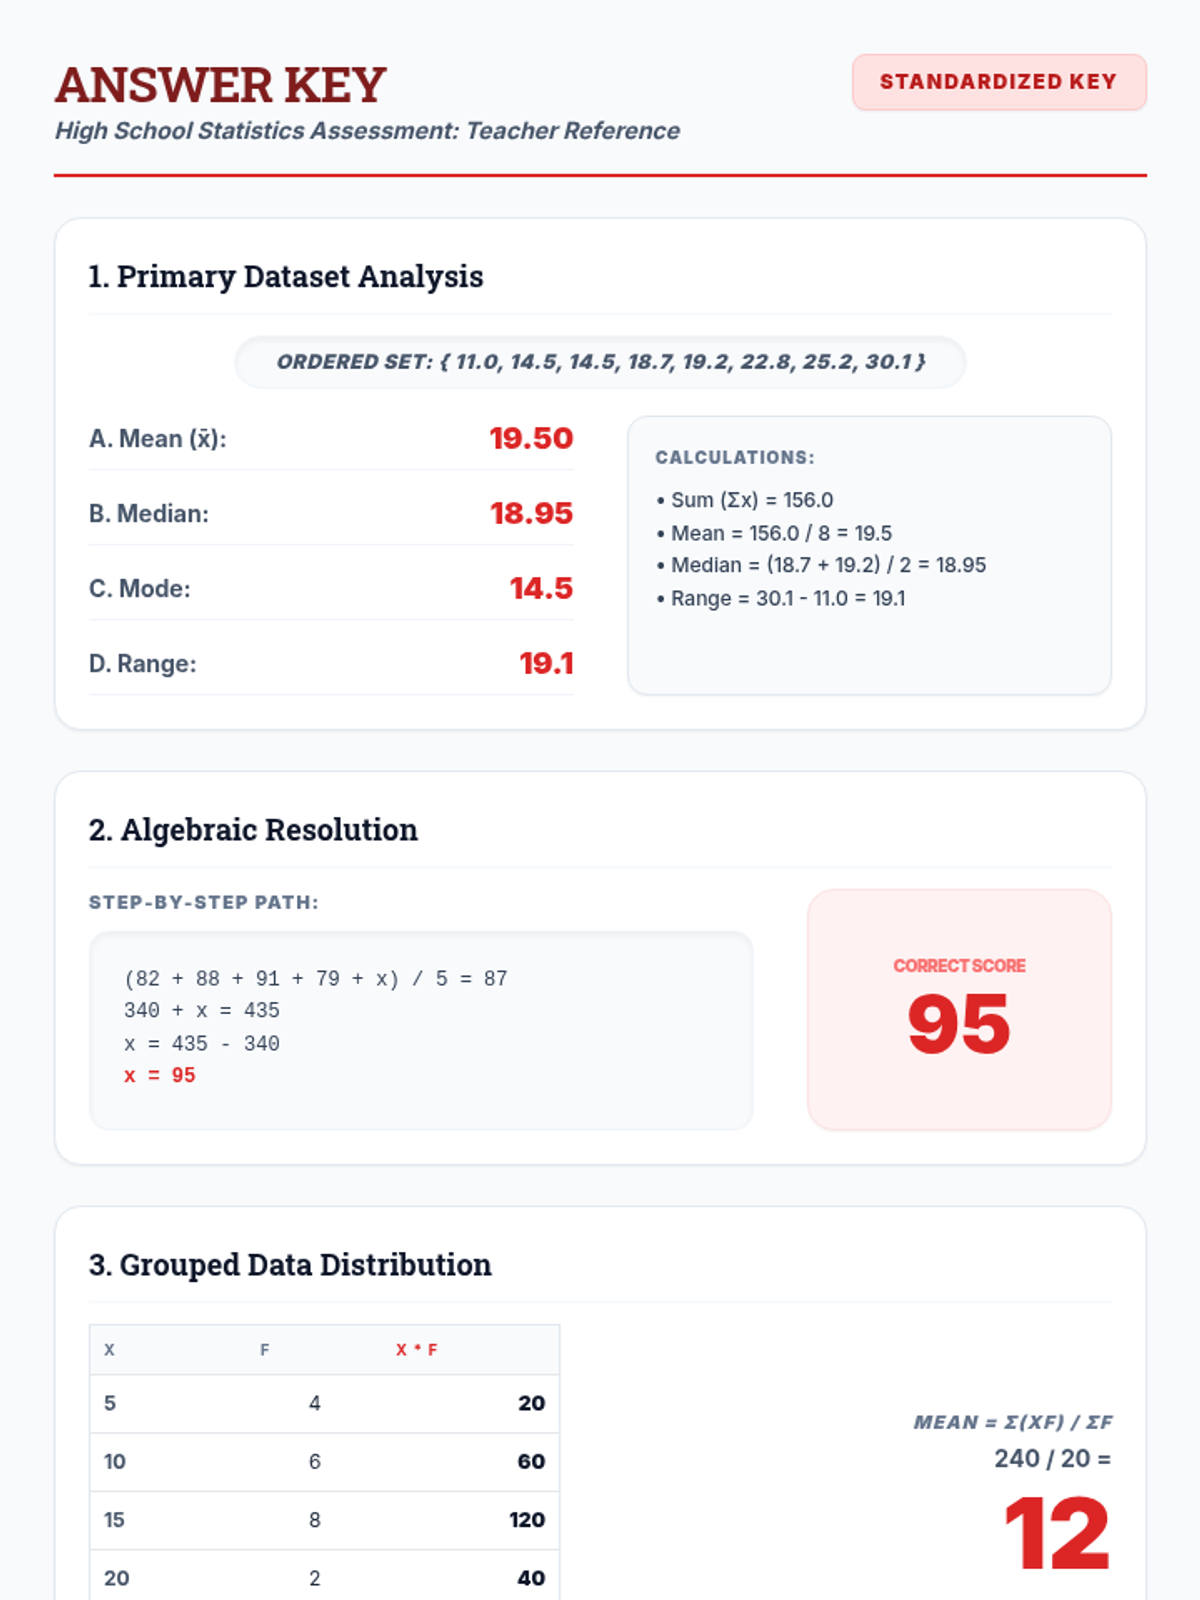
Advanced applications of central tendency and spread, including algebraic problem-solving, weighted means, and the mathematical impact of outliers for high school students.
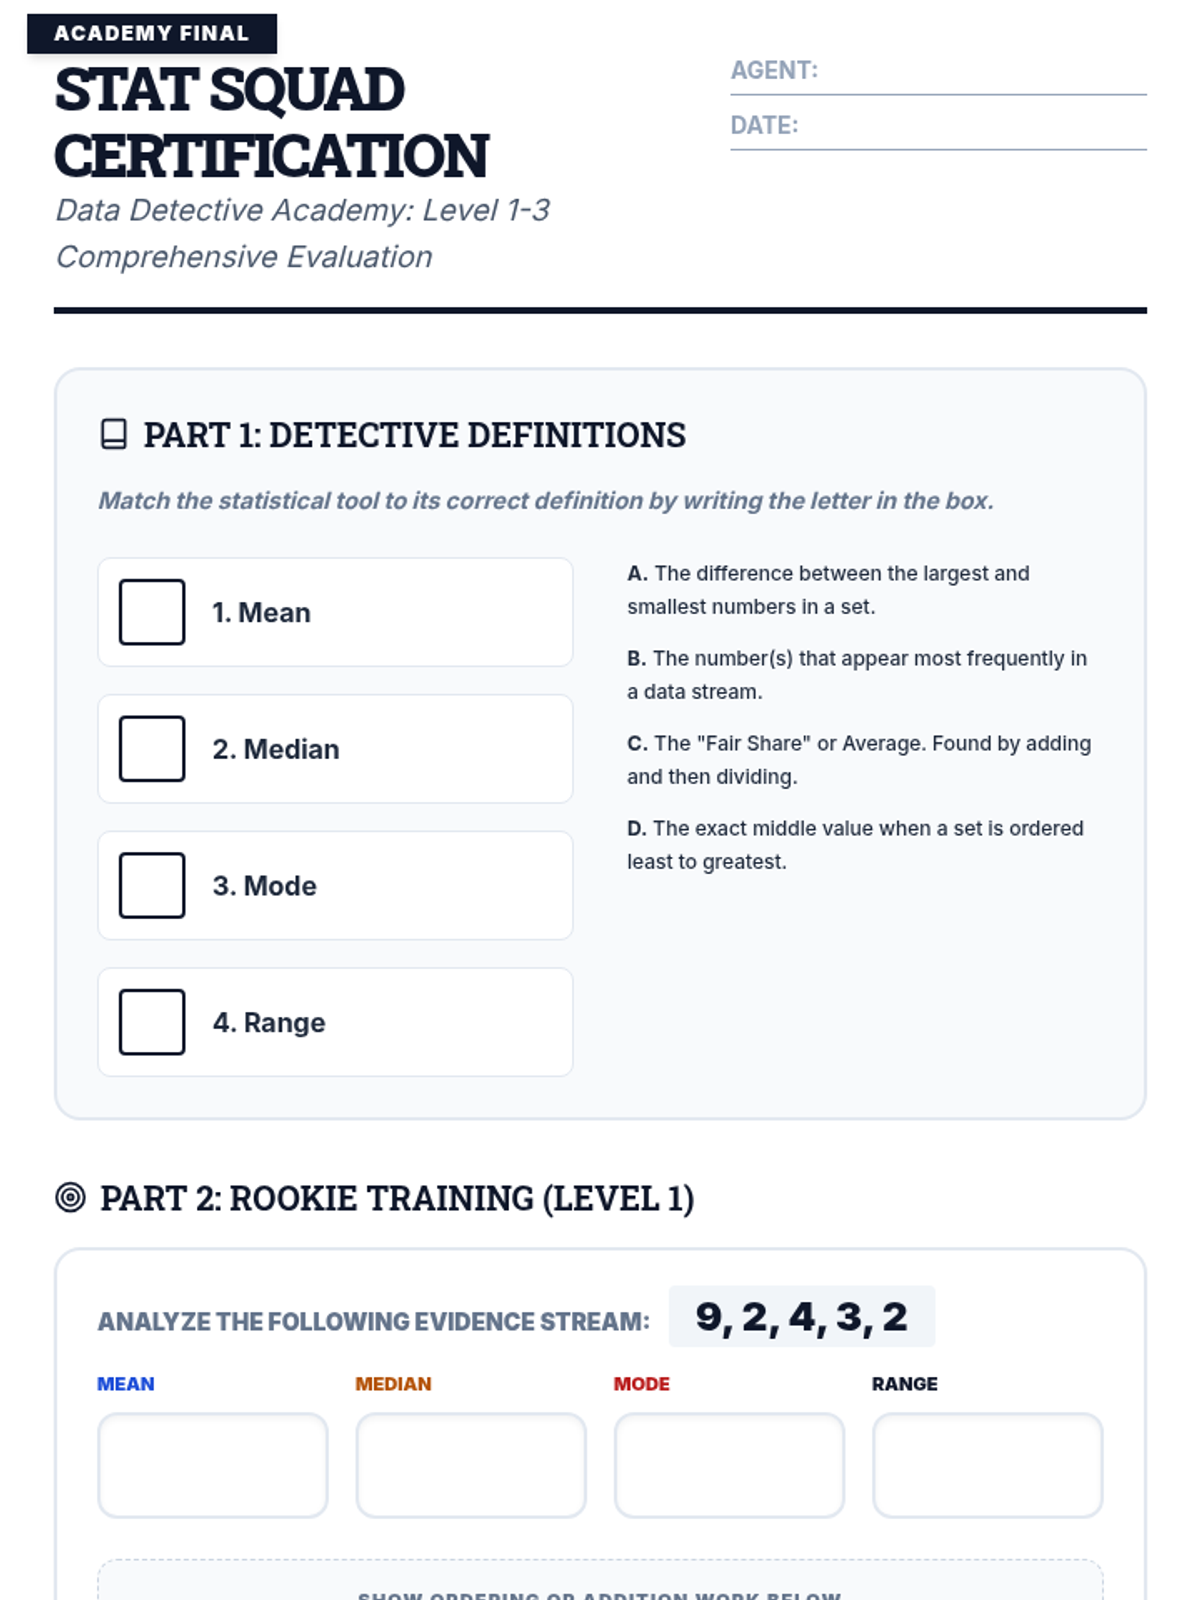
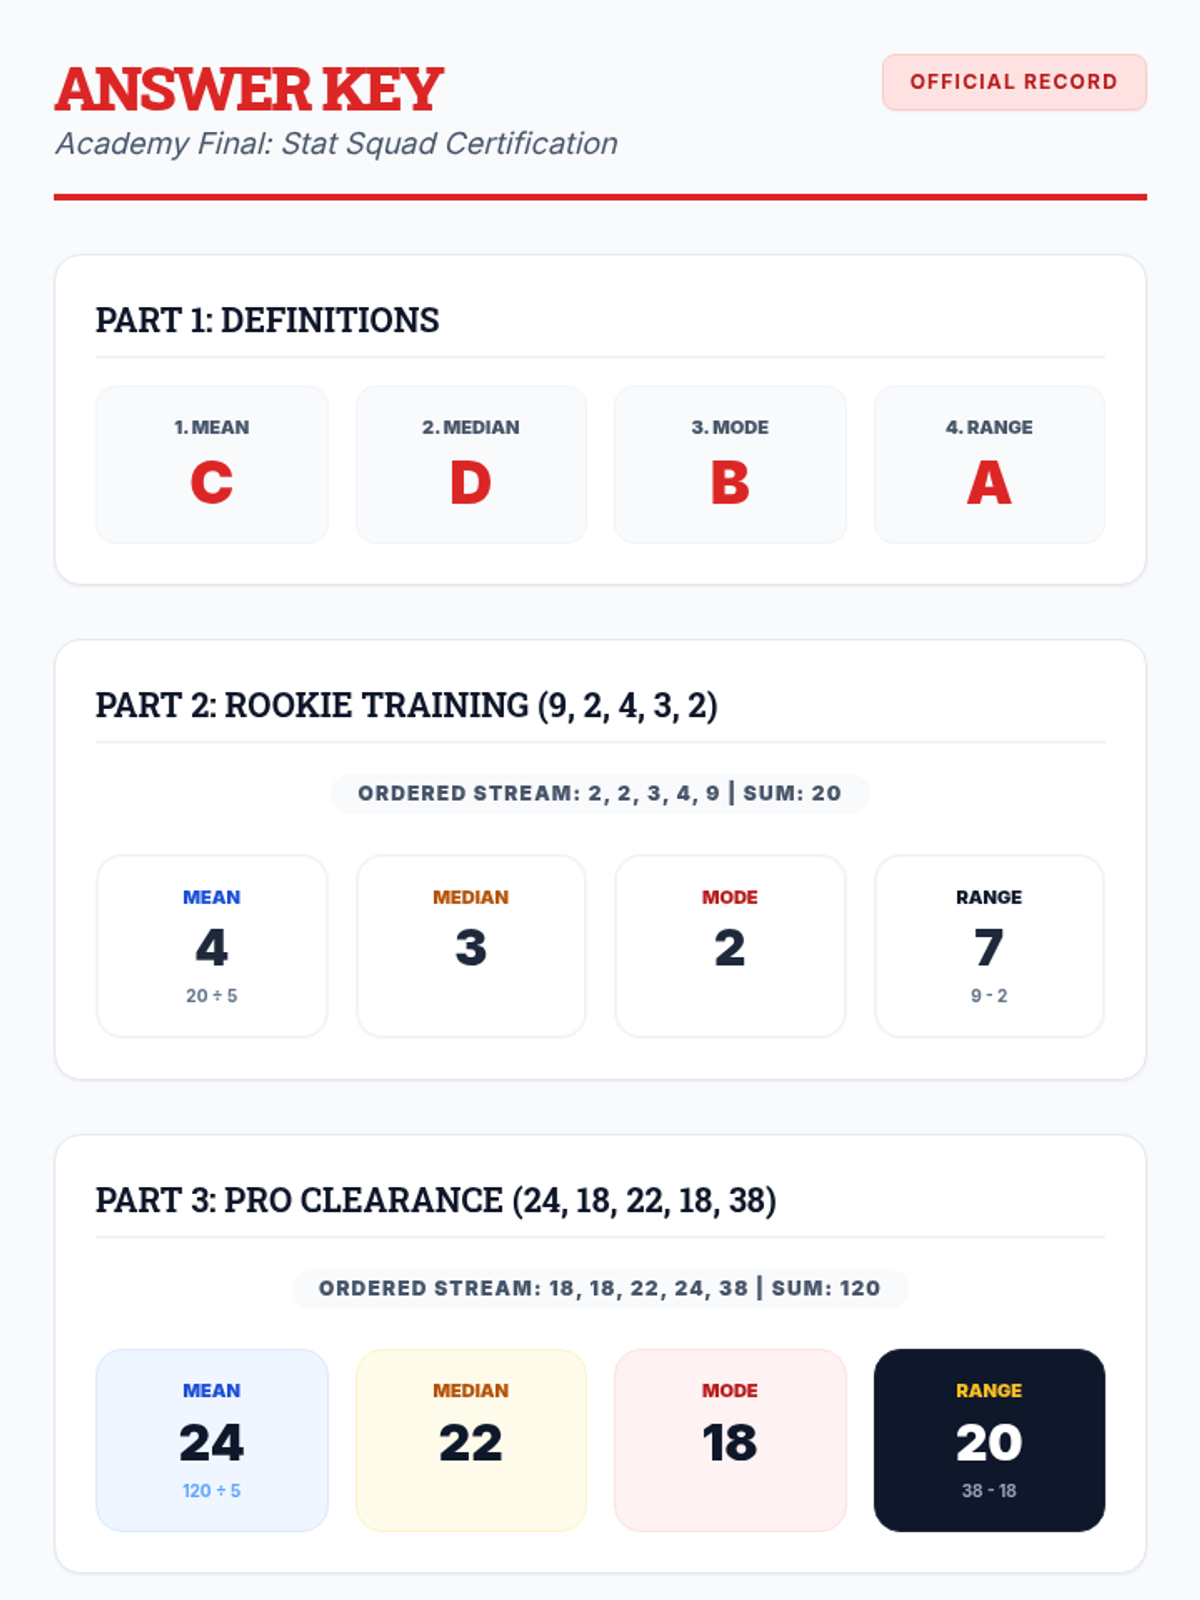
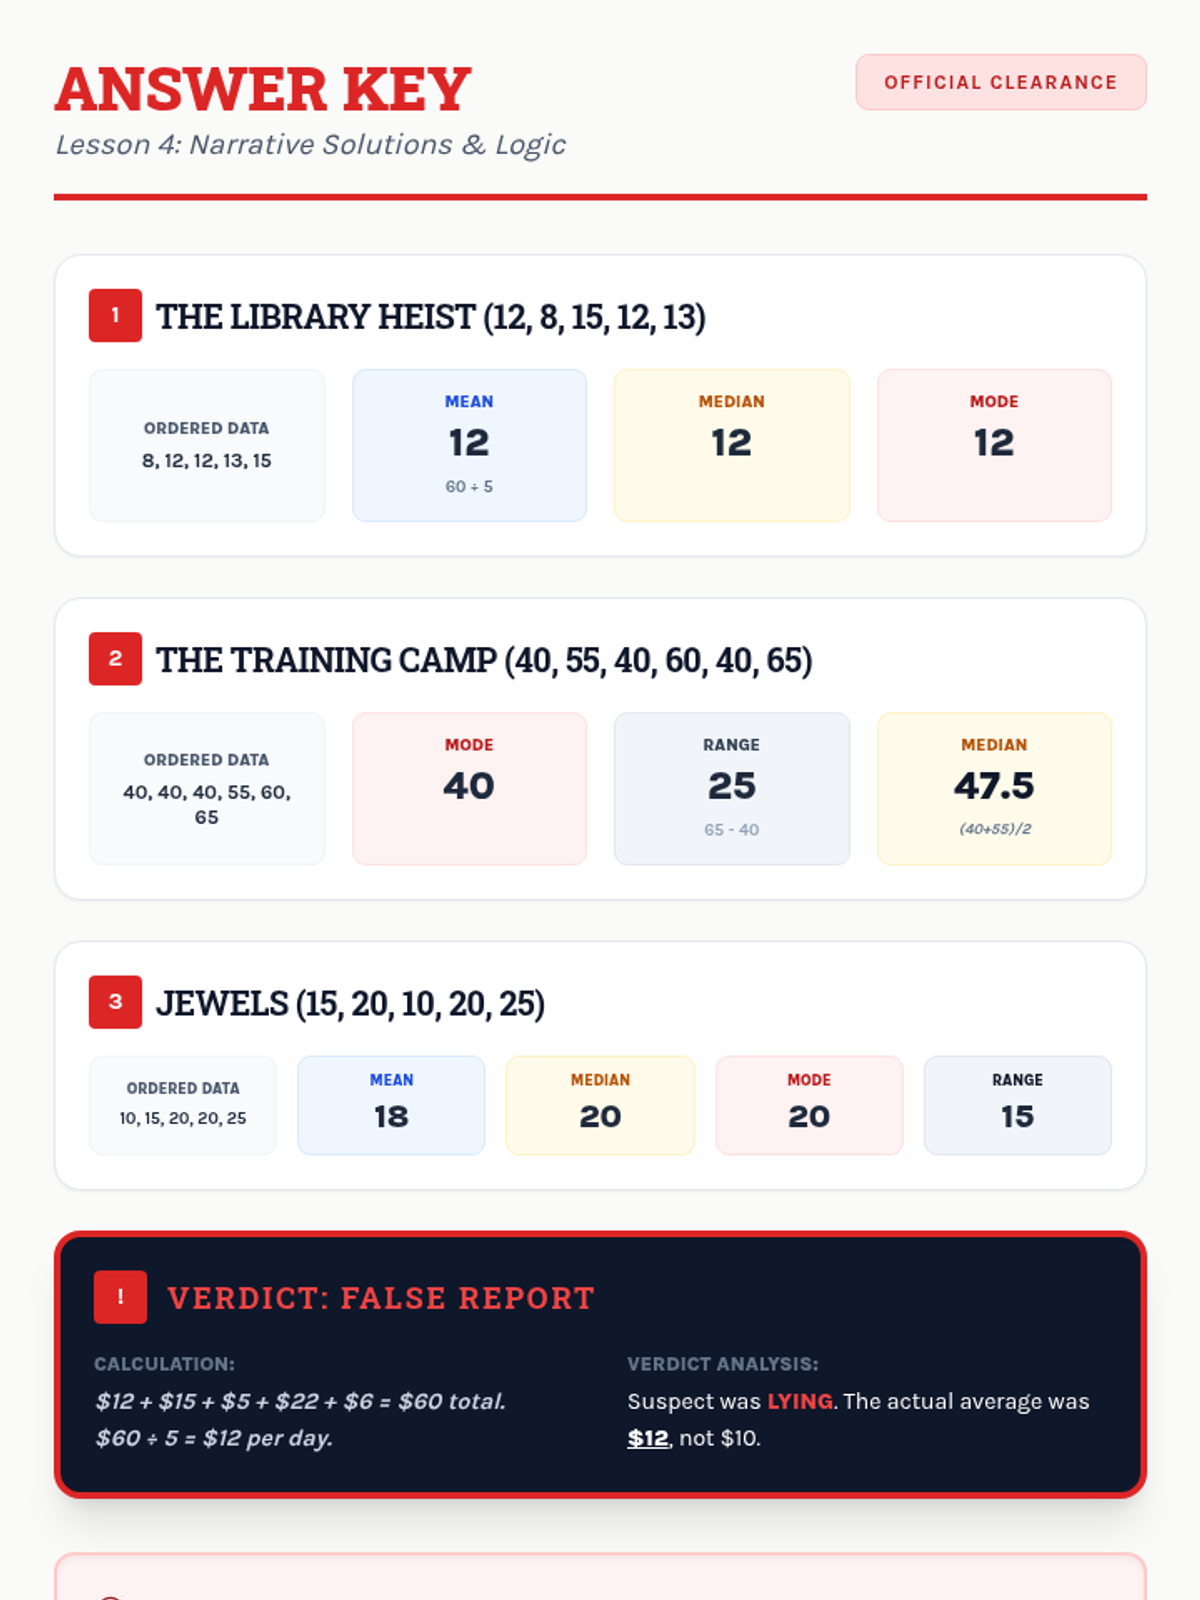
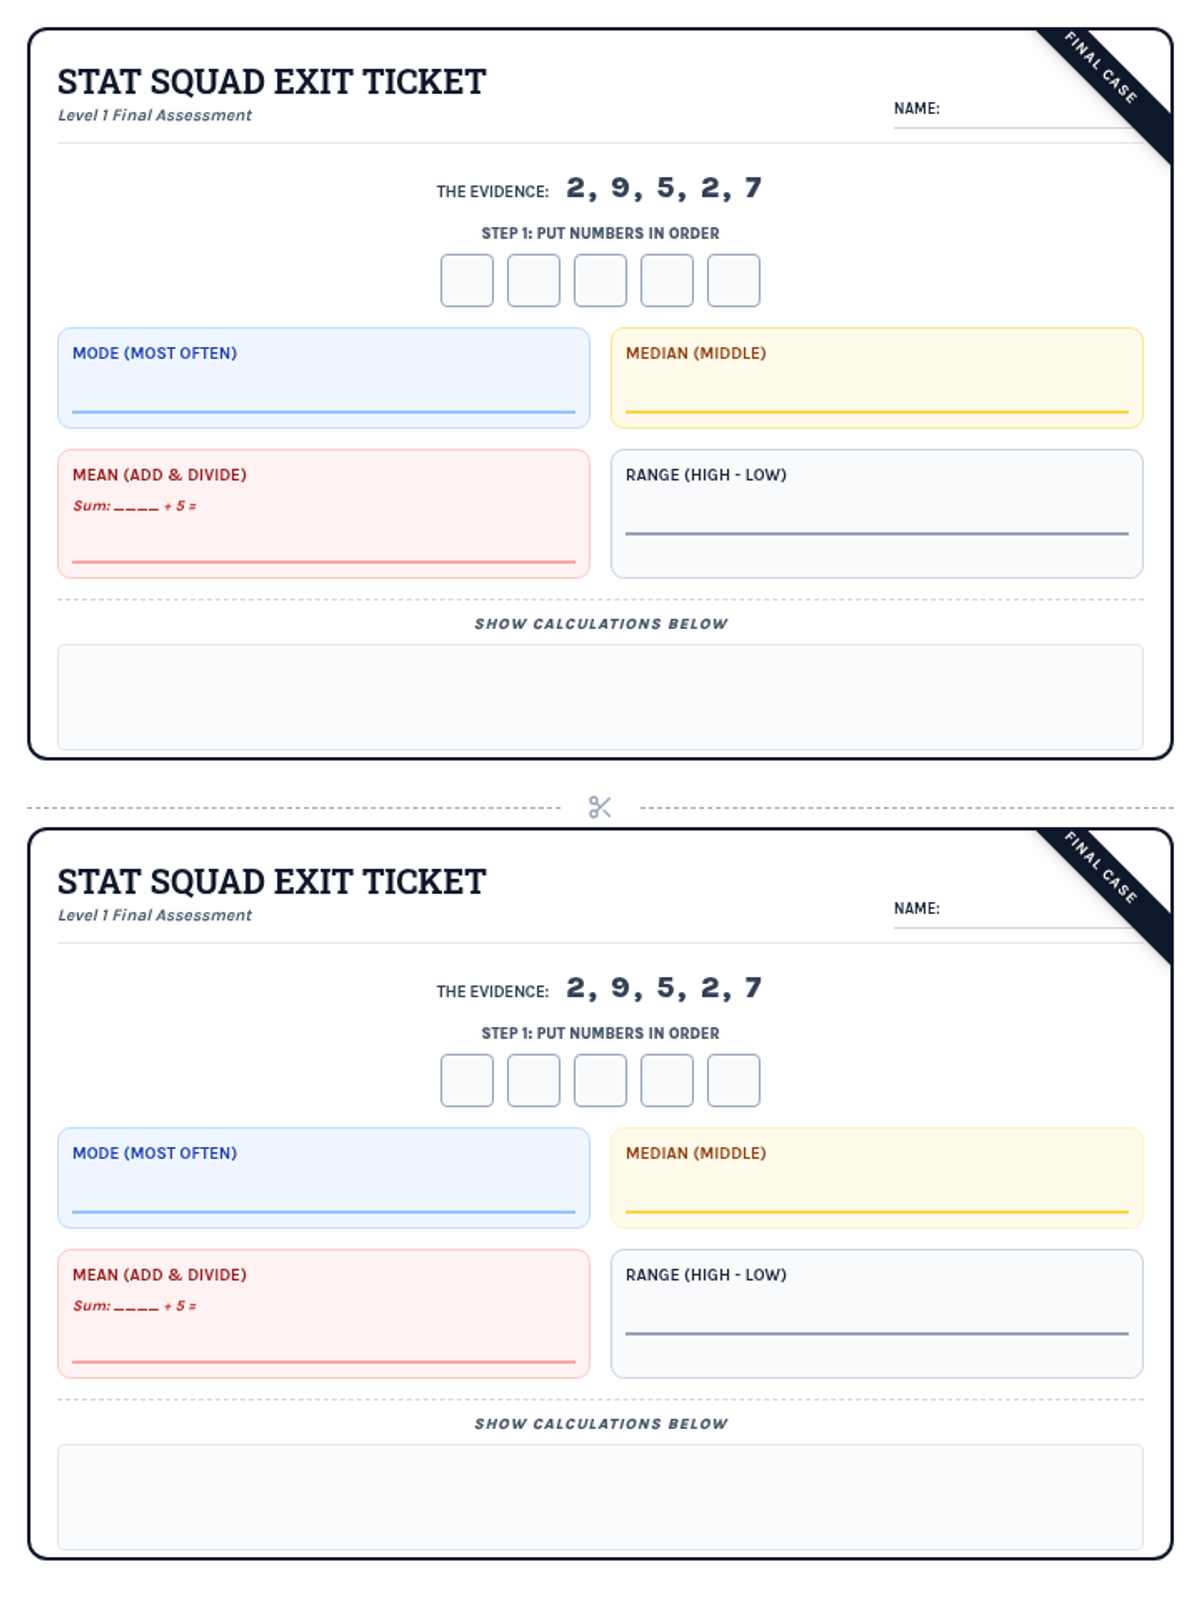
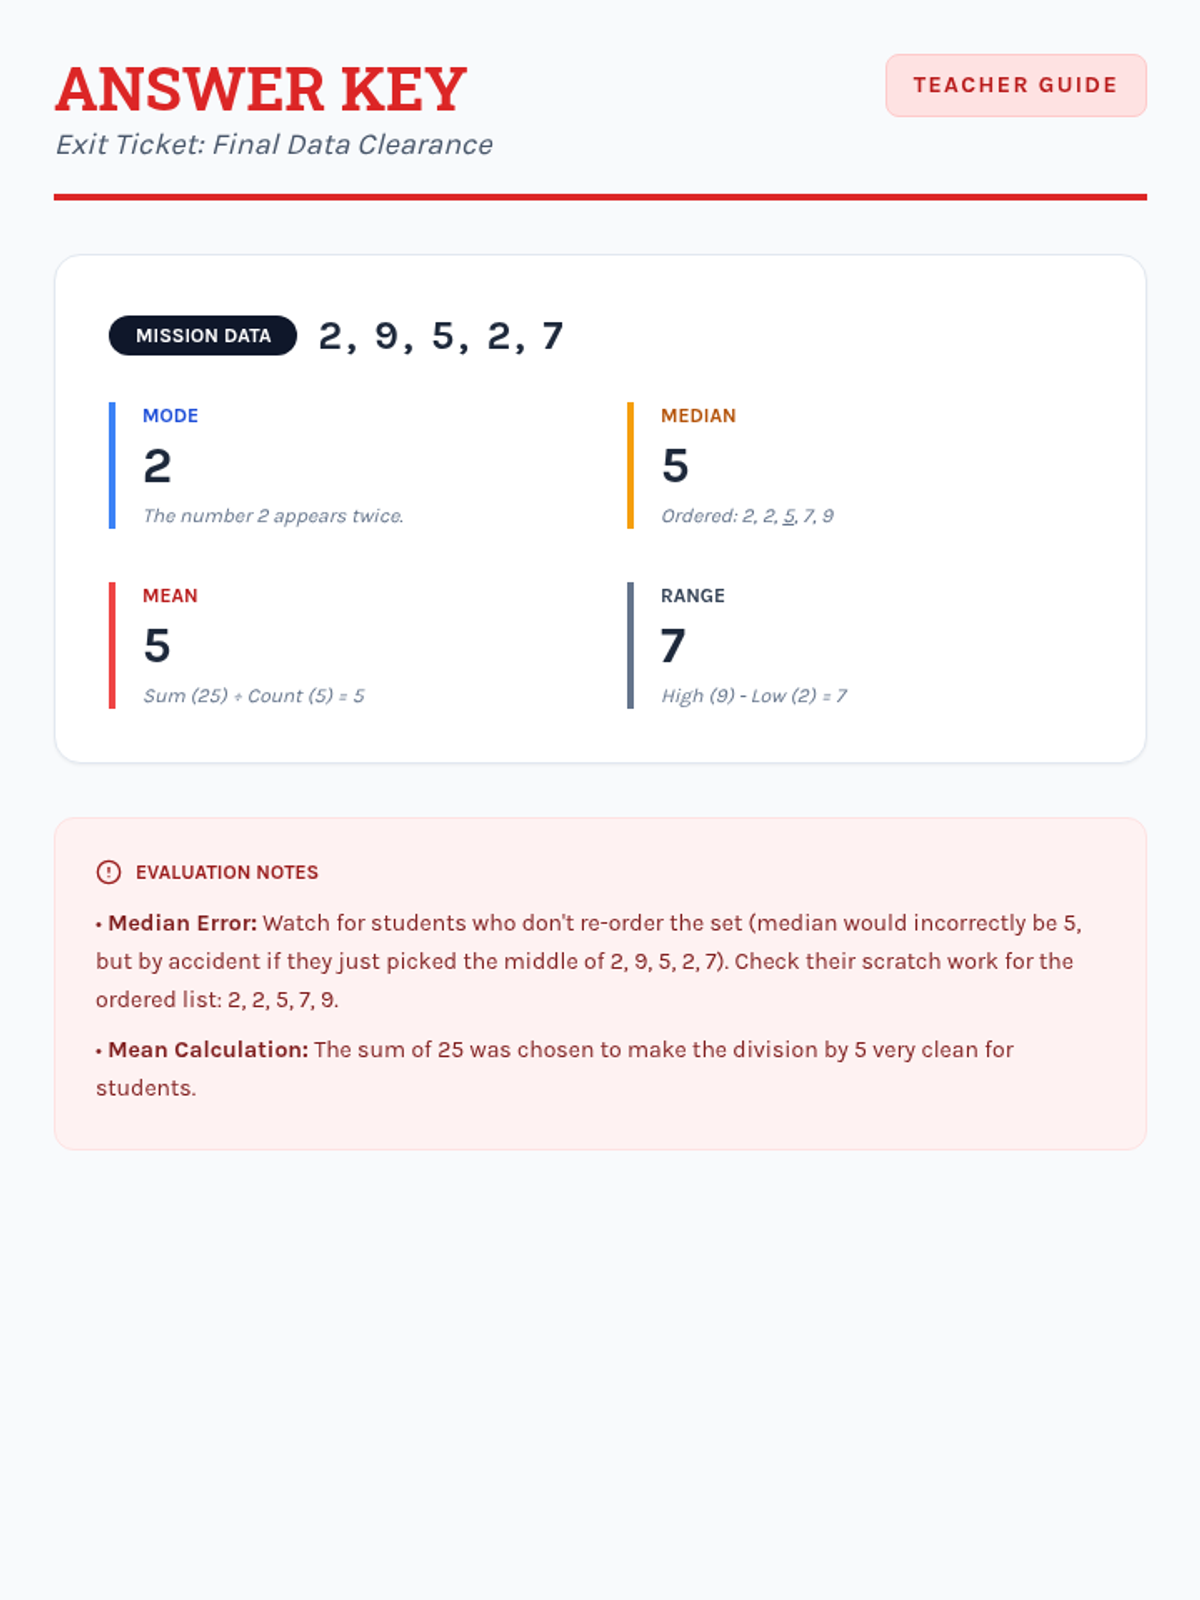
A comprehensive assessment covering Level 1, Level 2, and Level 3 data analysis, designed to evaluate mastery of mean, median, mode, and range in both numerical and narrative contexts.
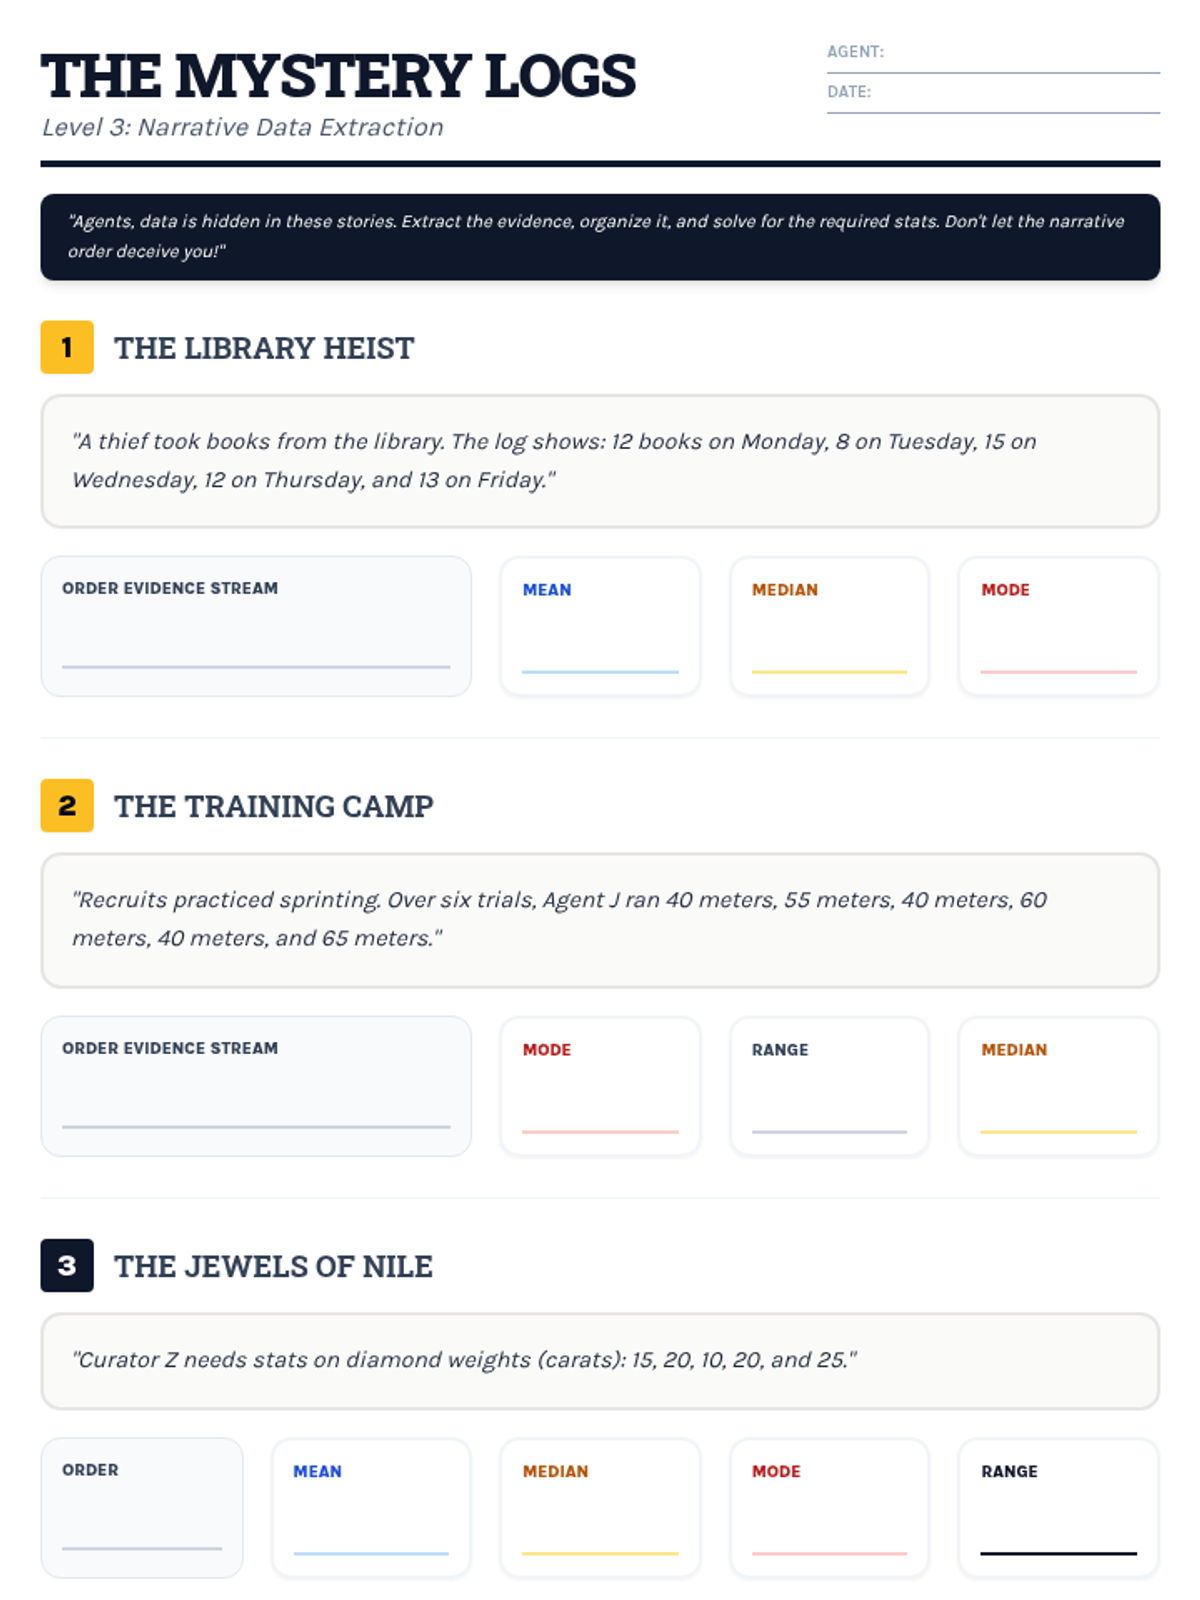
Students interpret and solve word problems involving mean, median, mode, and range, focusing on extracting data from narrative contexts and real-world scenarios.
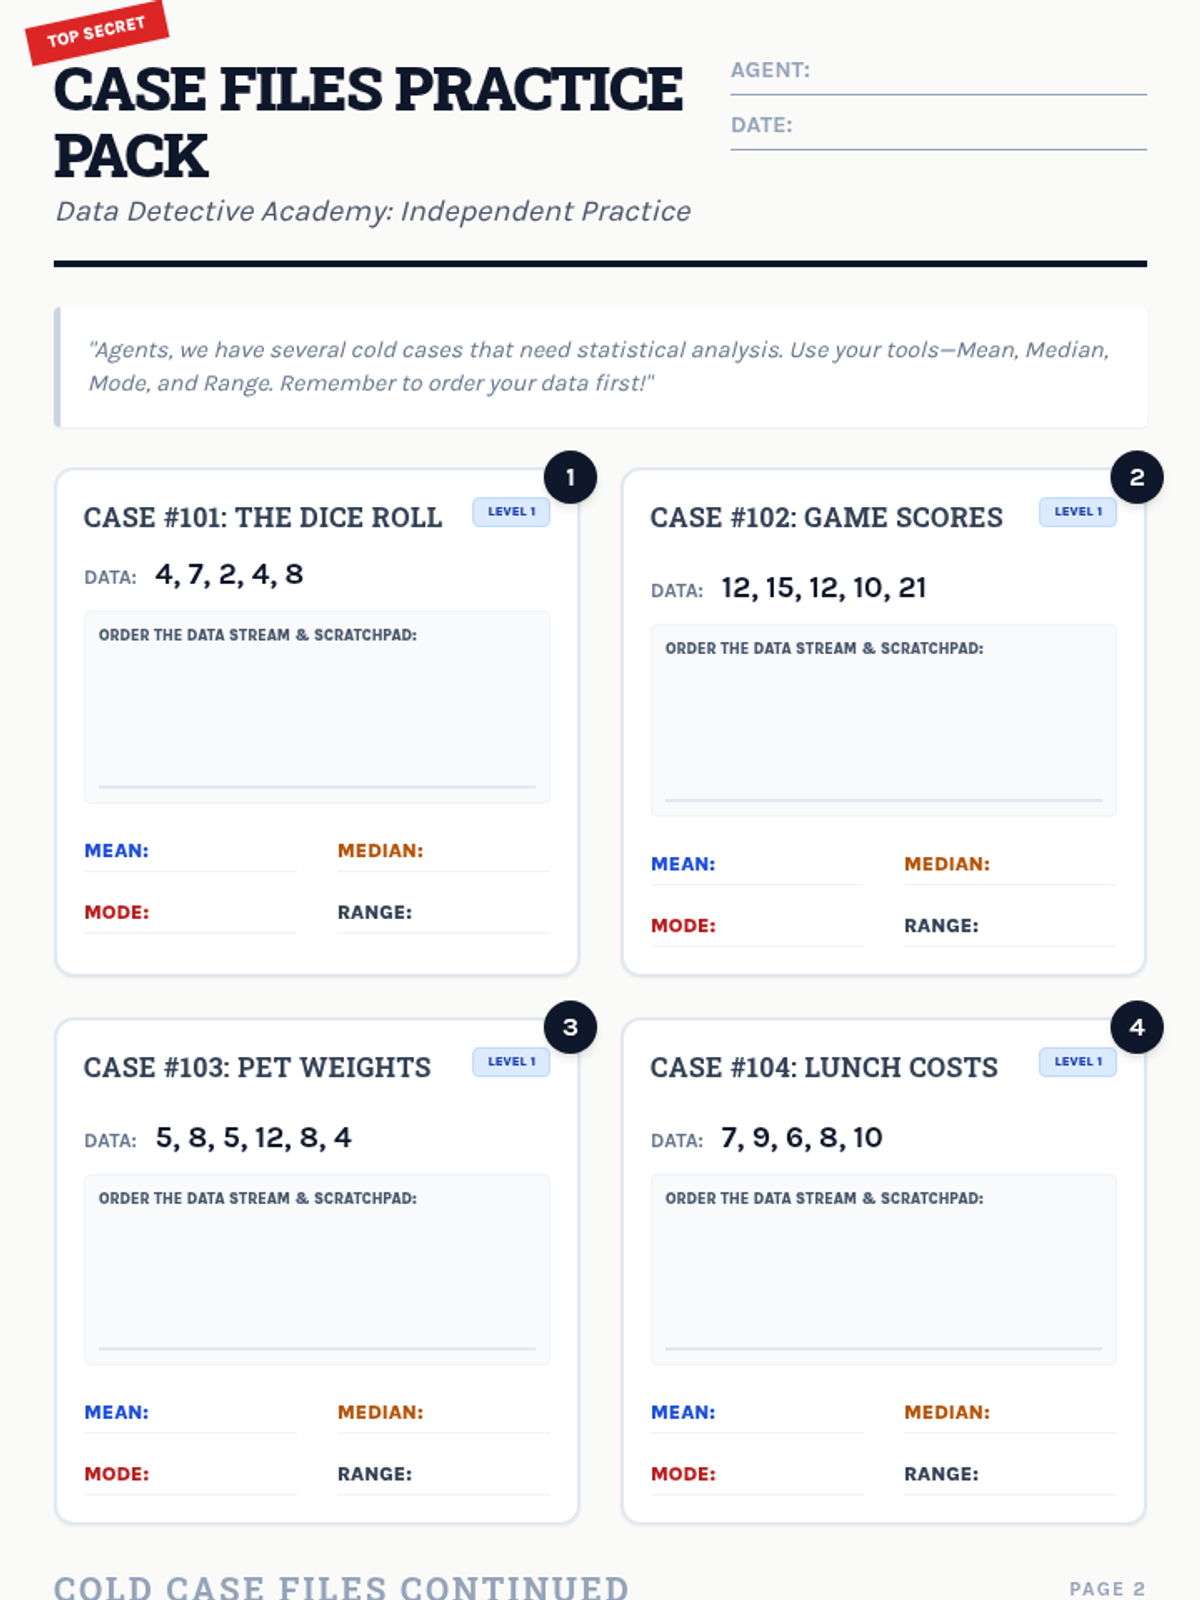
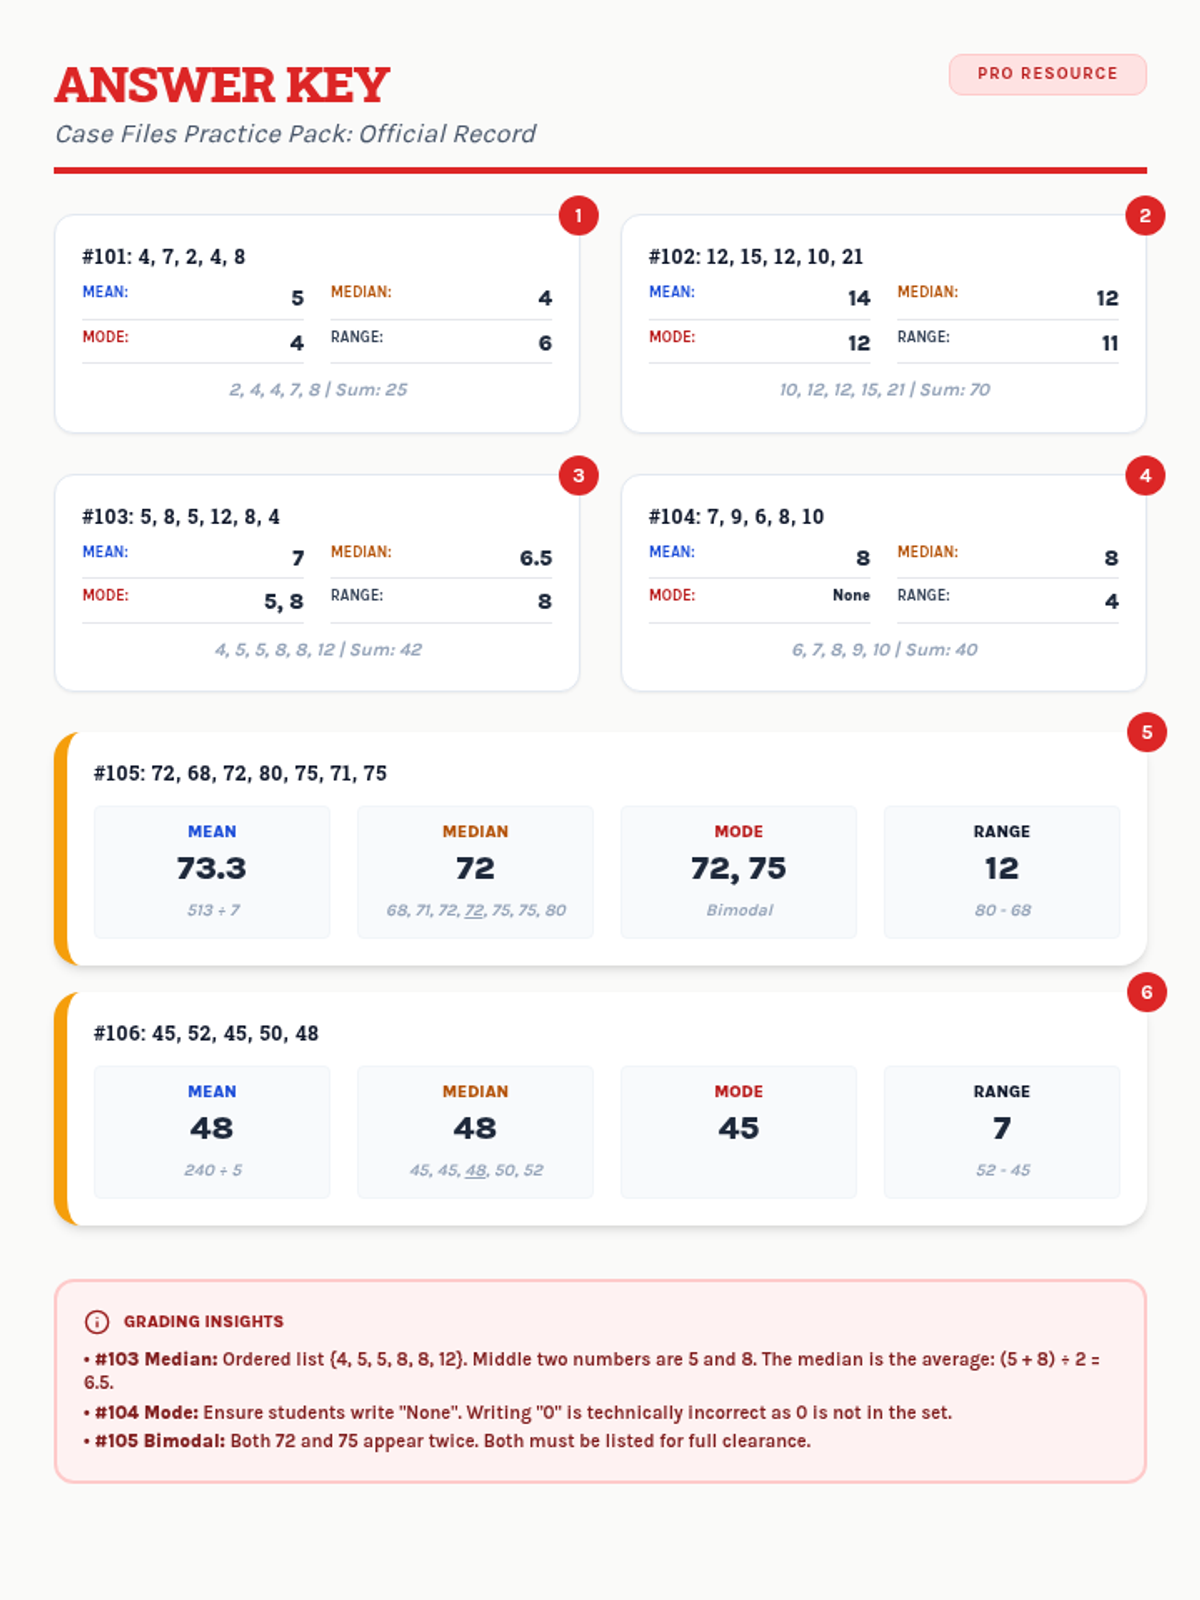
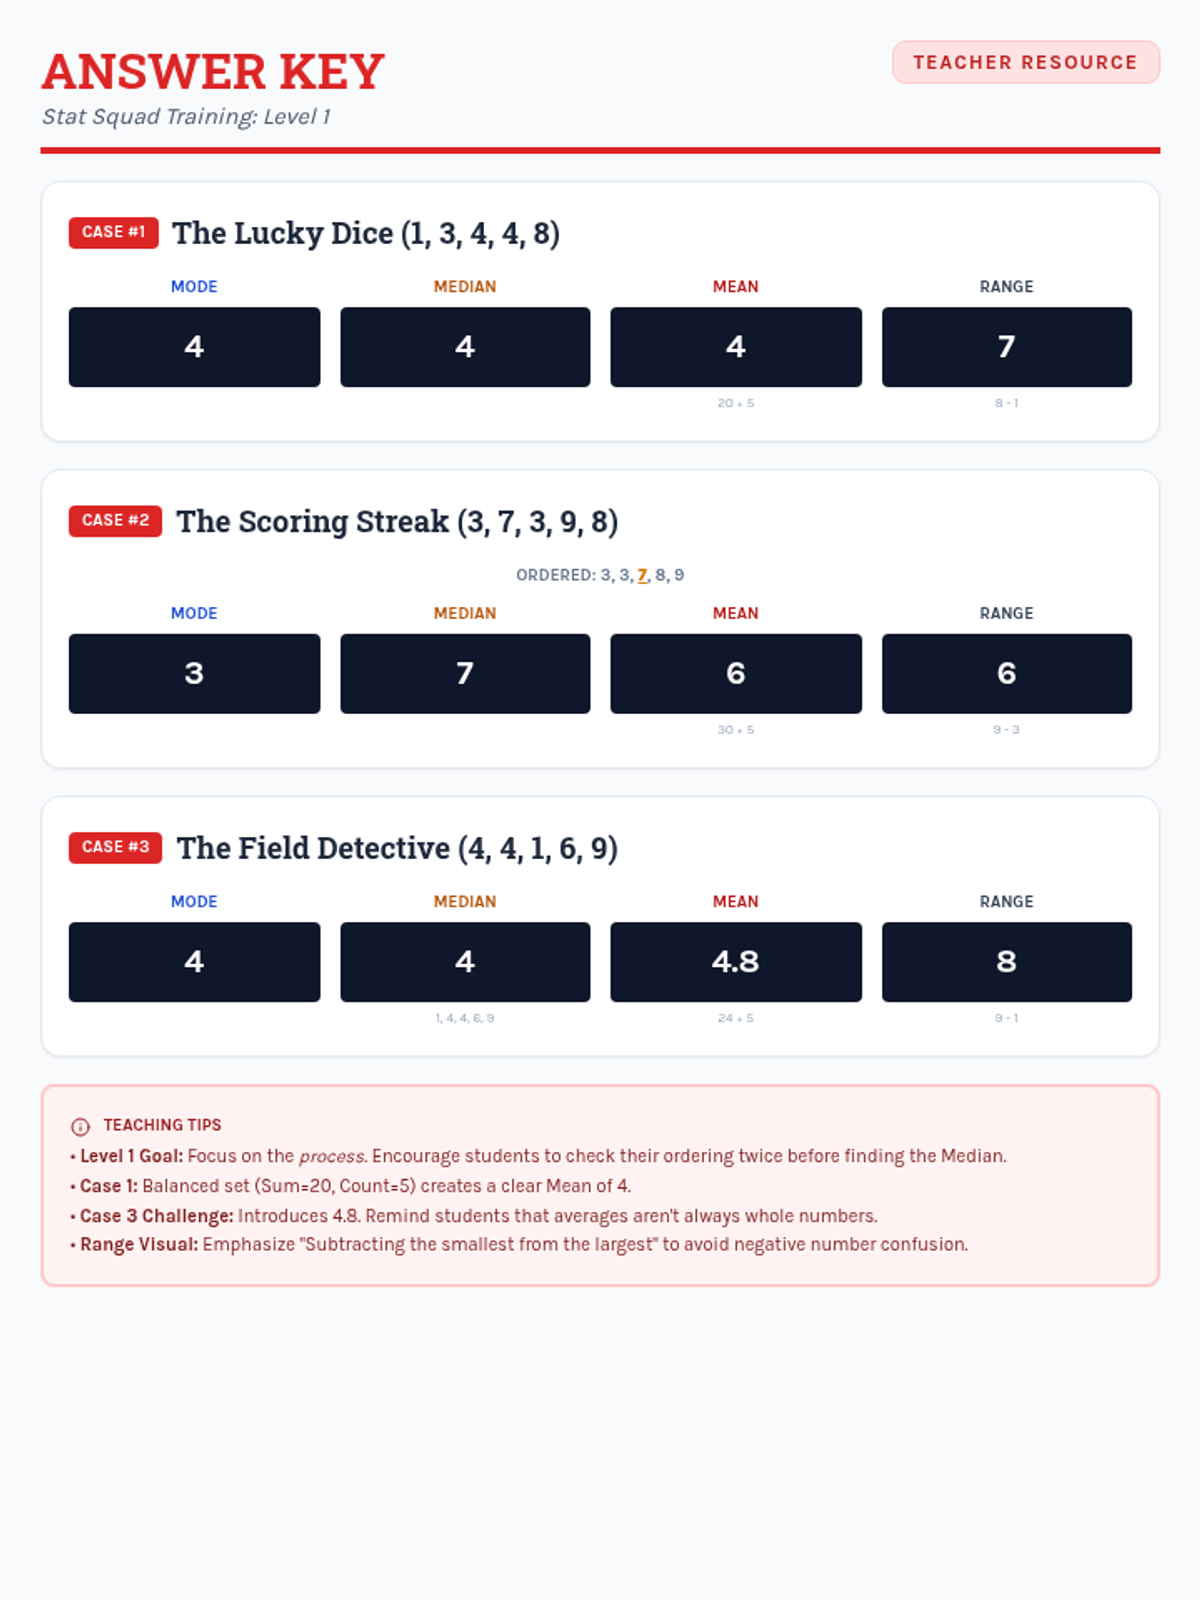
A collection of extra practice cases for mean, median, mode, and range, ranging from single-digit warmups to double-digit challenges, themed as unsolved detective files.
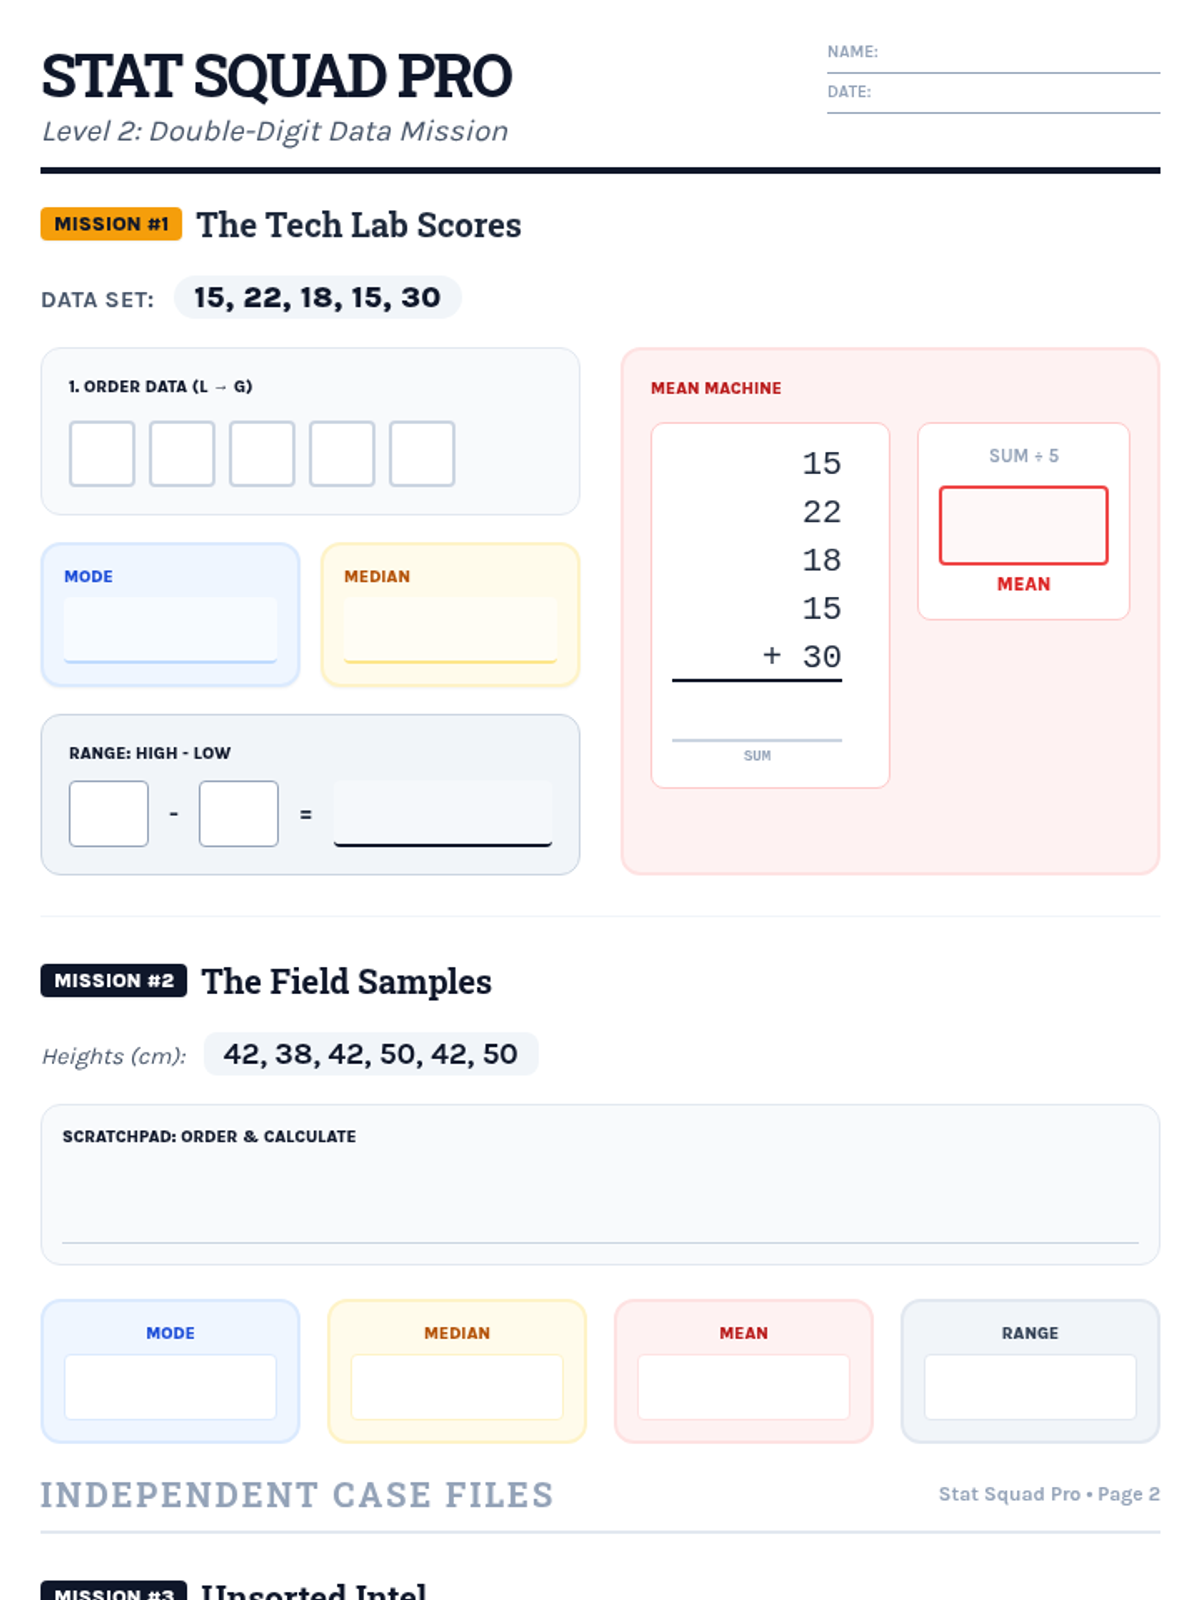
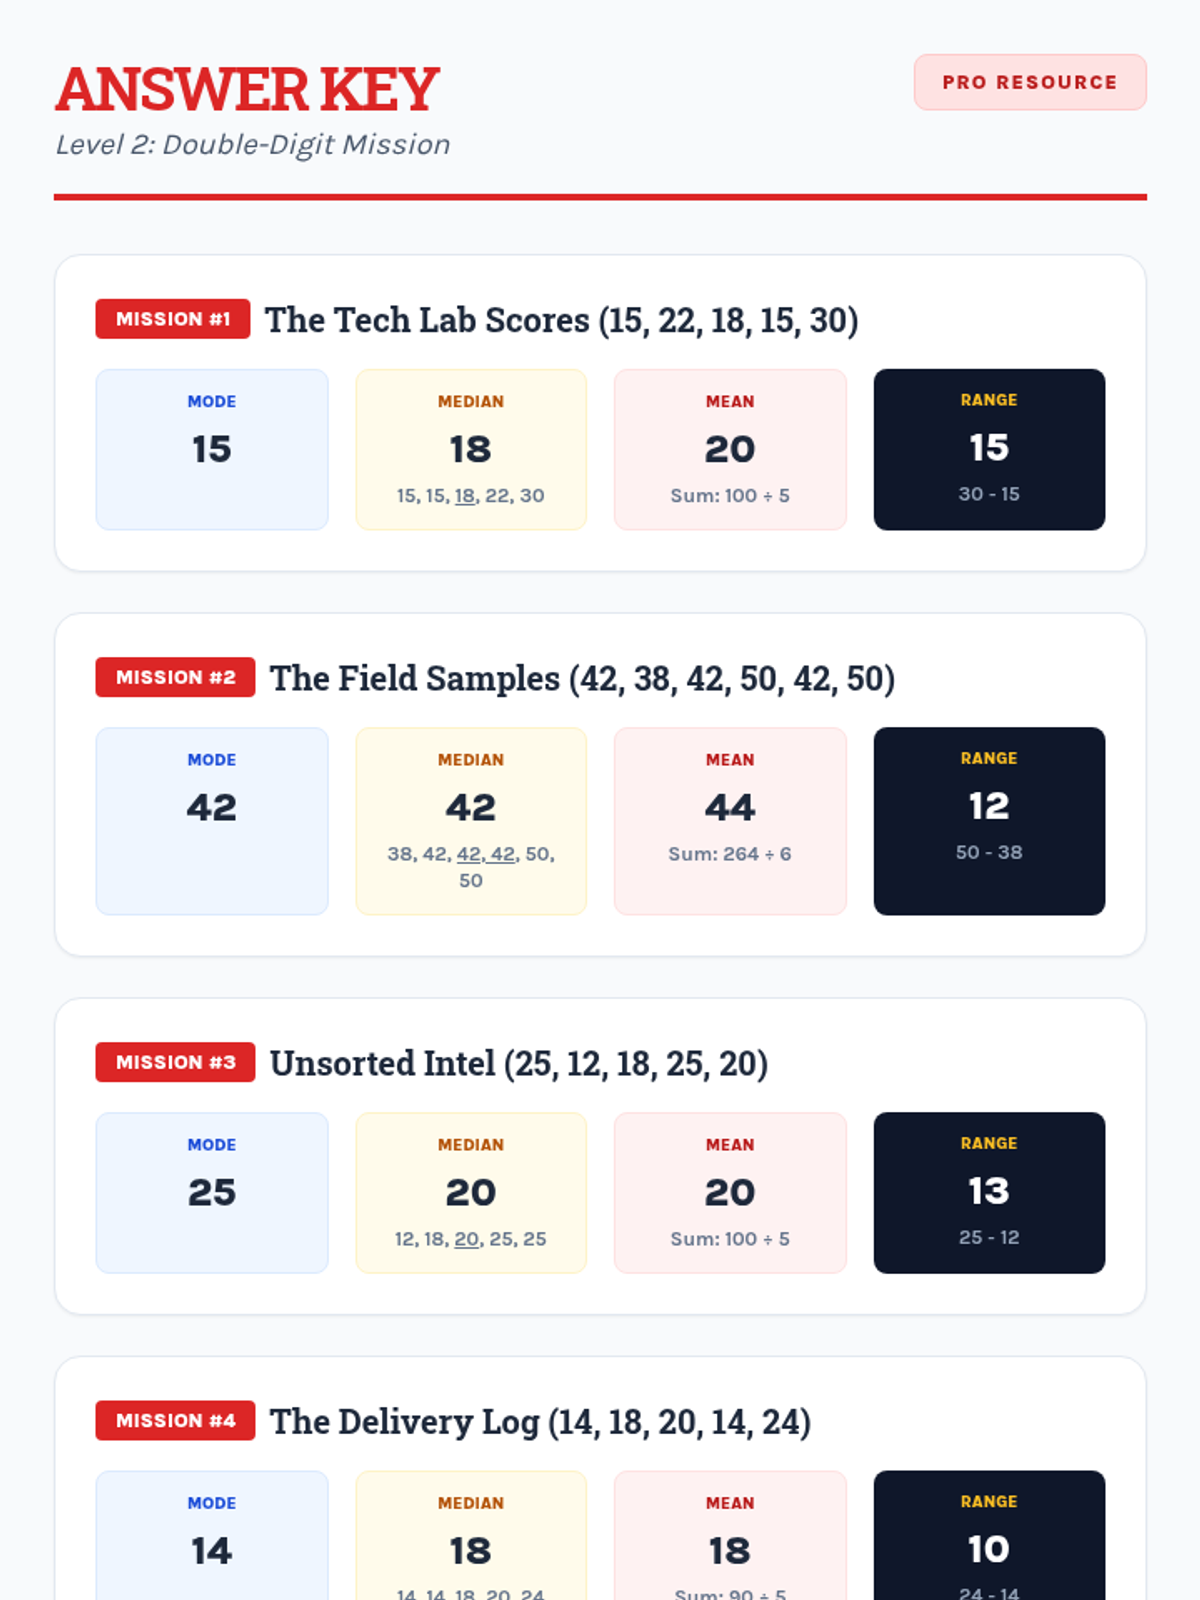
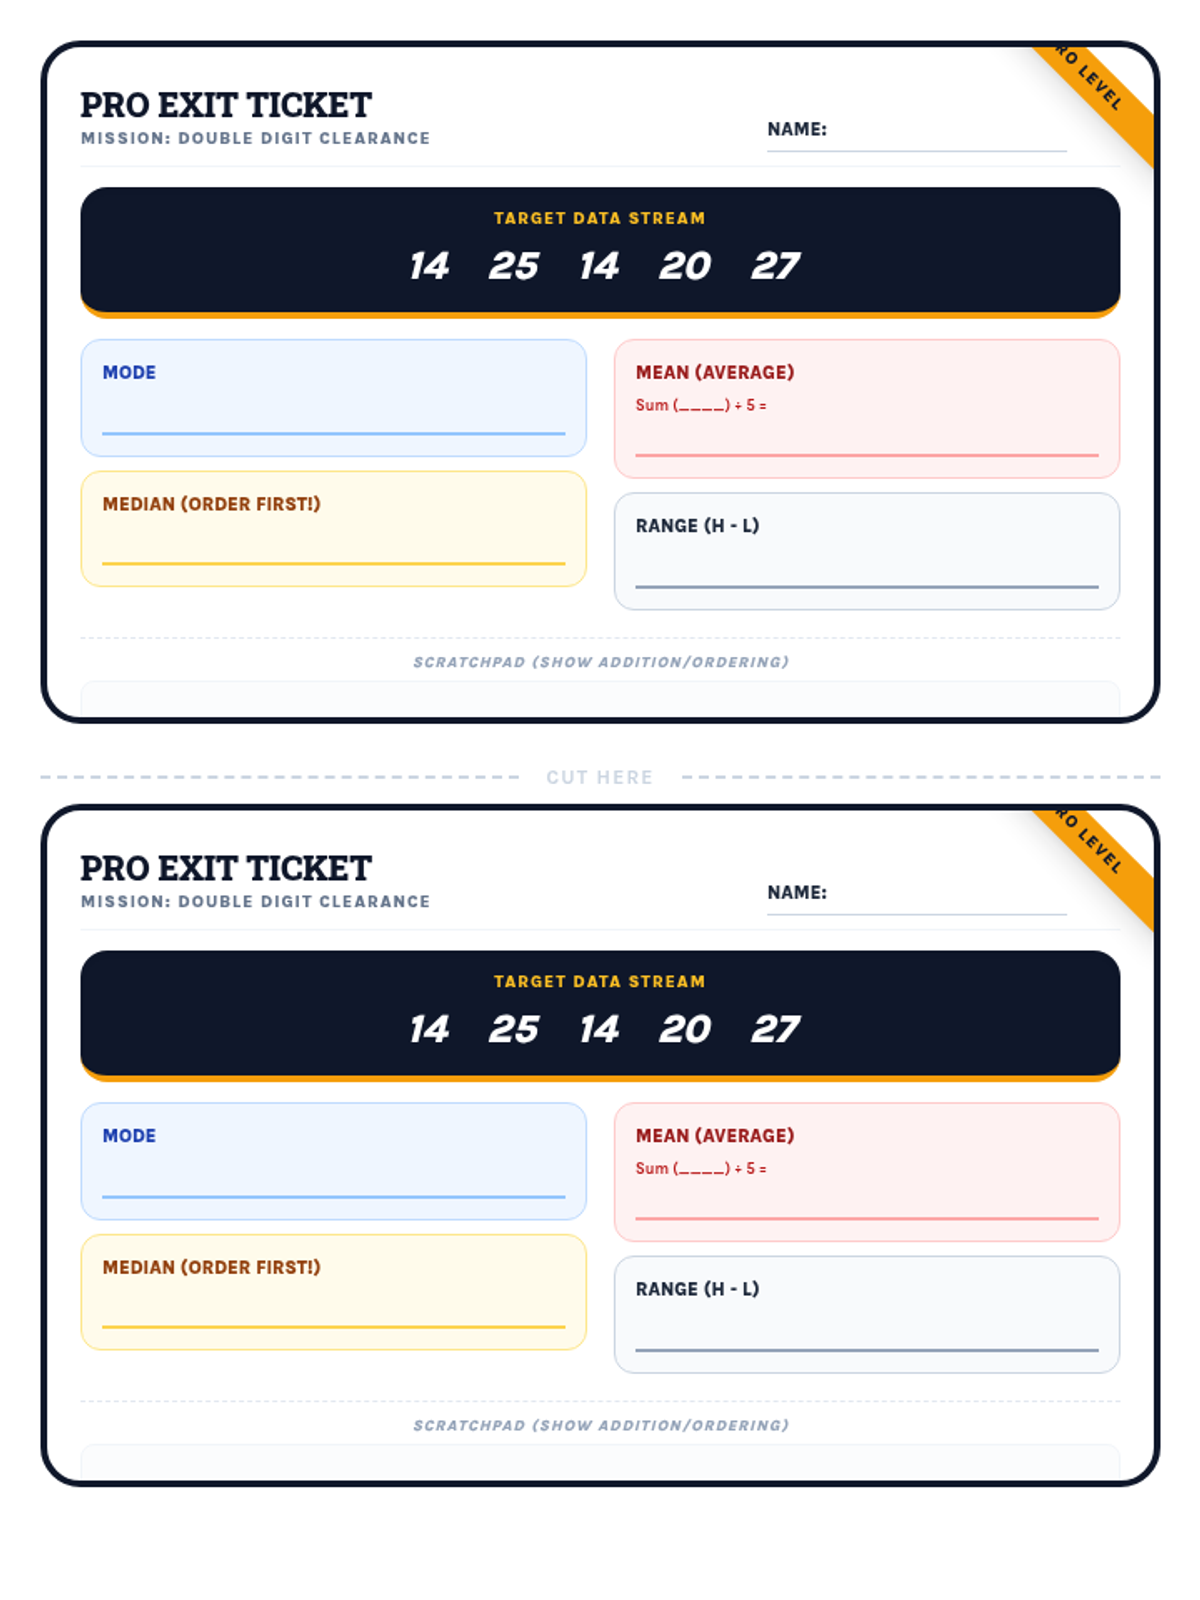
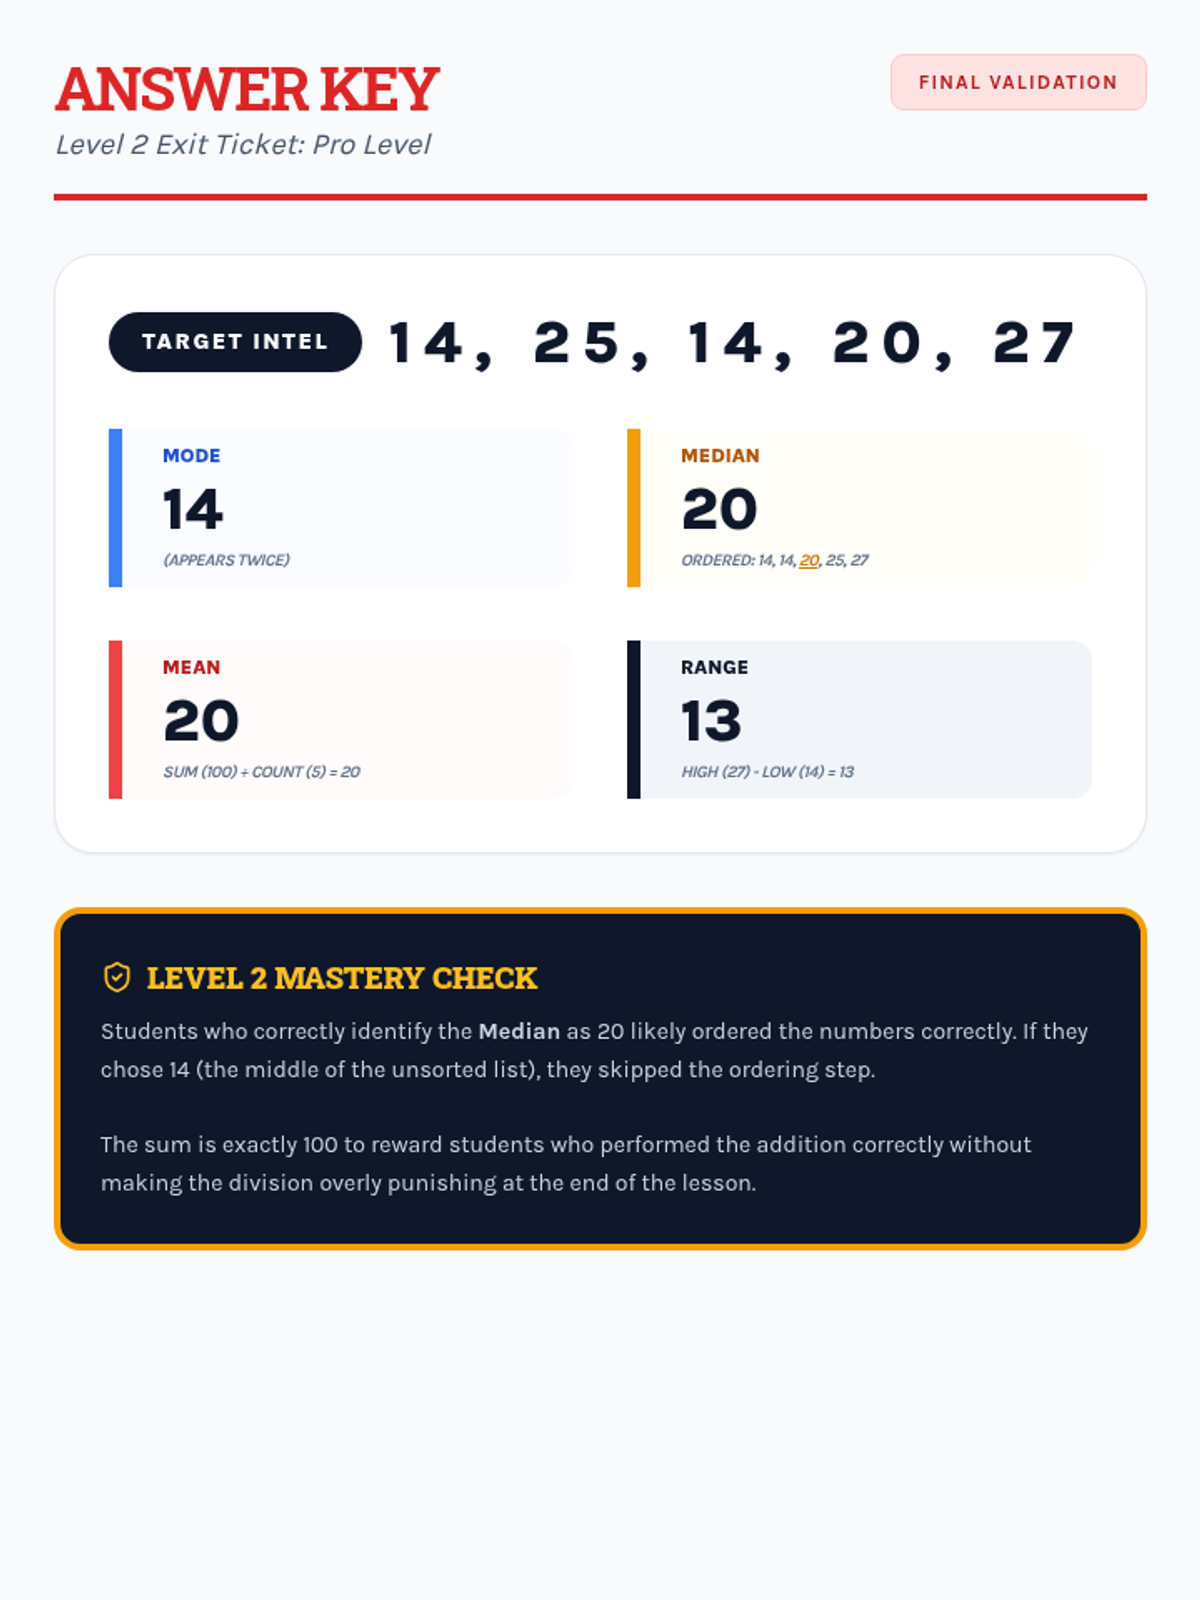
Students apply their knowledge of mean, median, mode, and range to data sets featuring two-digit numbers, focusing on multi-digit addition and division.
A lesson focused on identifying and interpreting outliers in box plot data visualizations, using a forensic detective theme to engage students in data analysis.
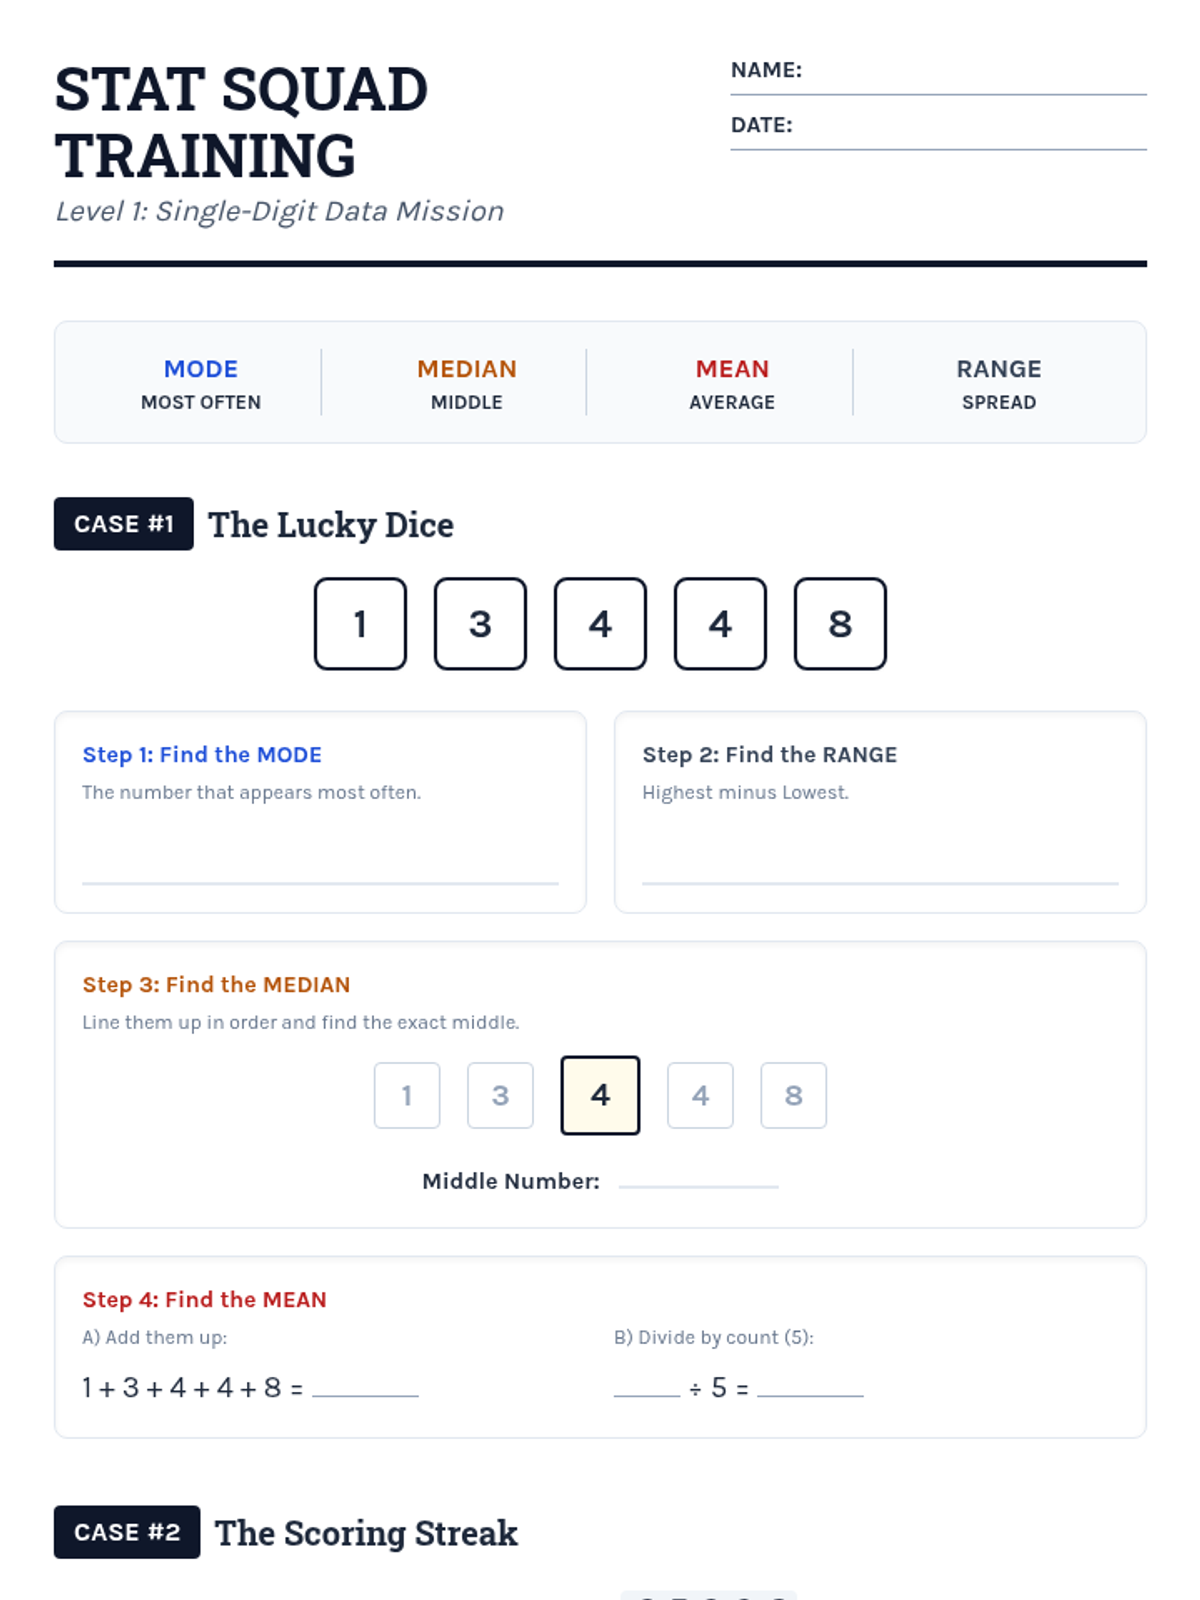
Students learn to calculate mean, median, mode, and range using single-digit data sets through structured, step-by-step guided practice and visual aids.
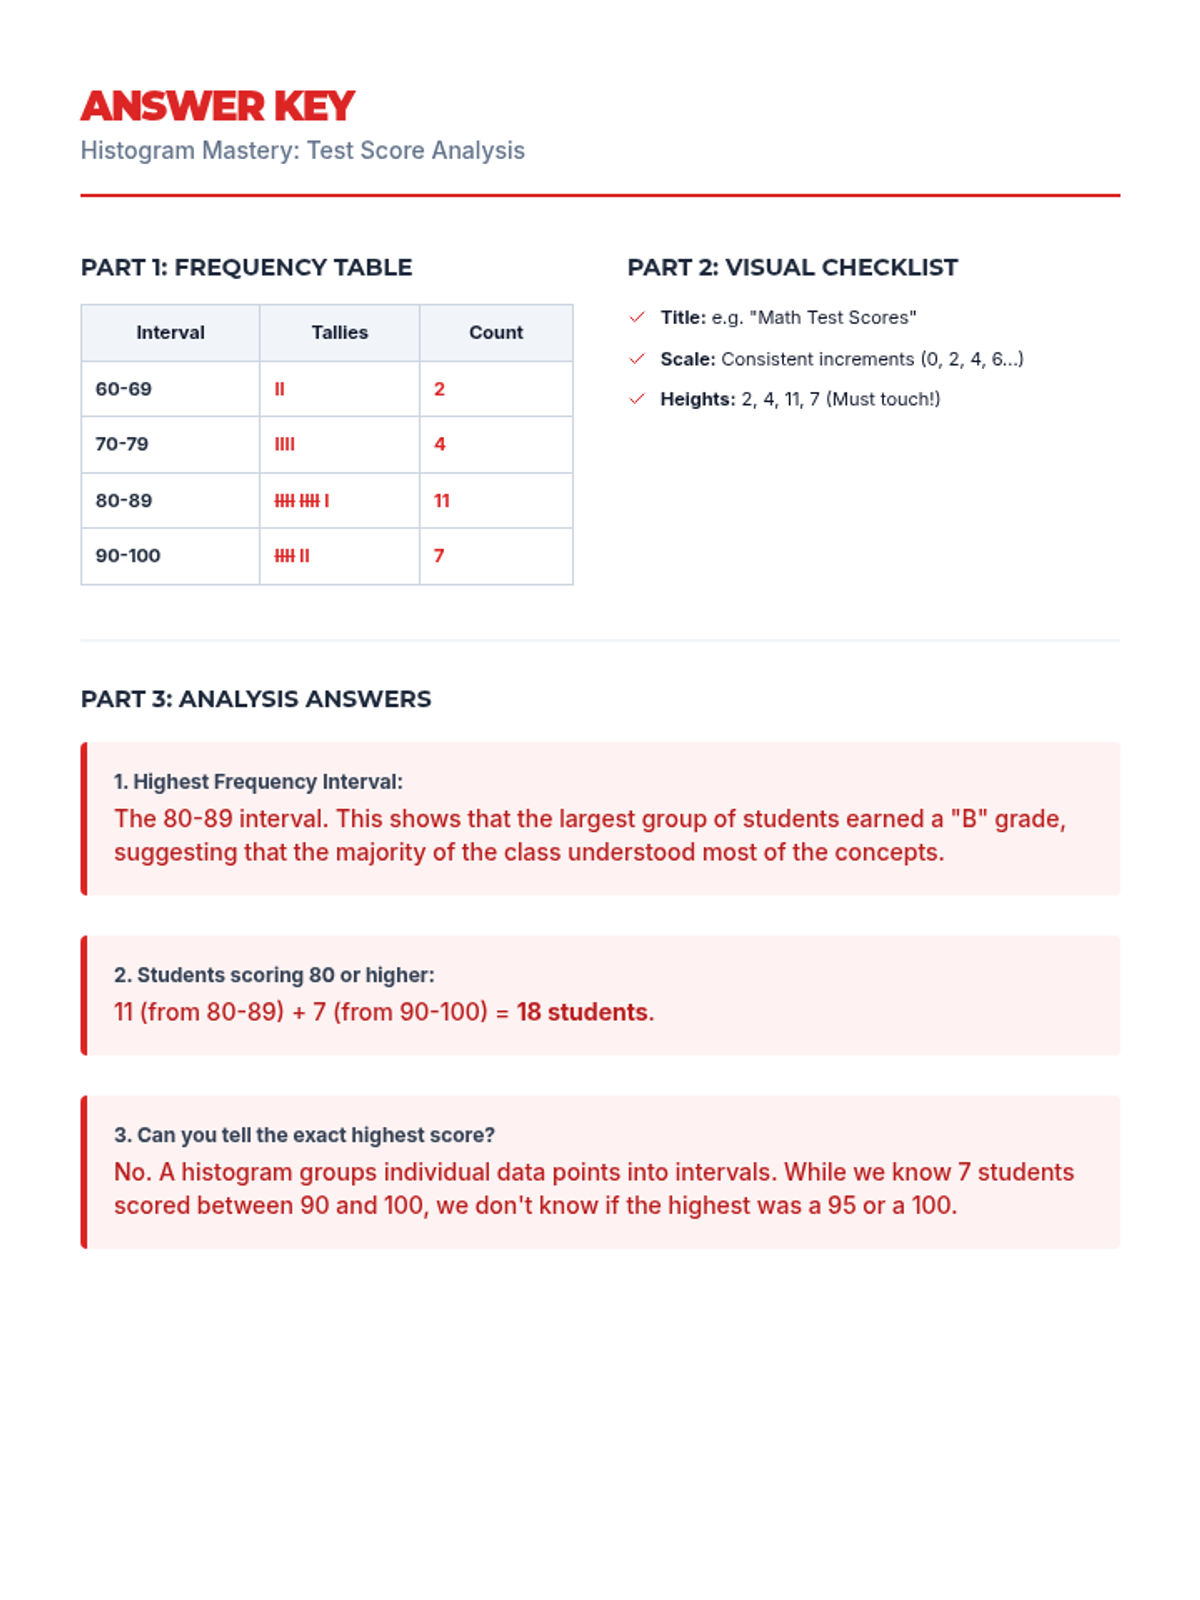
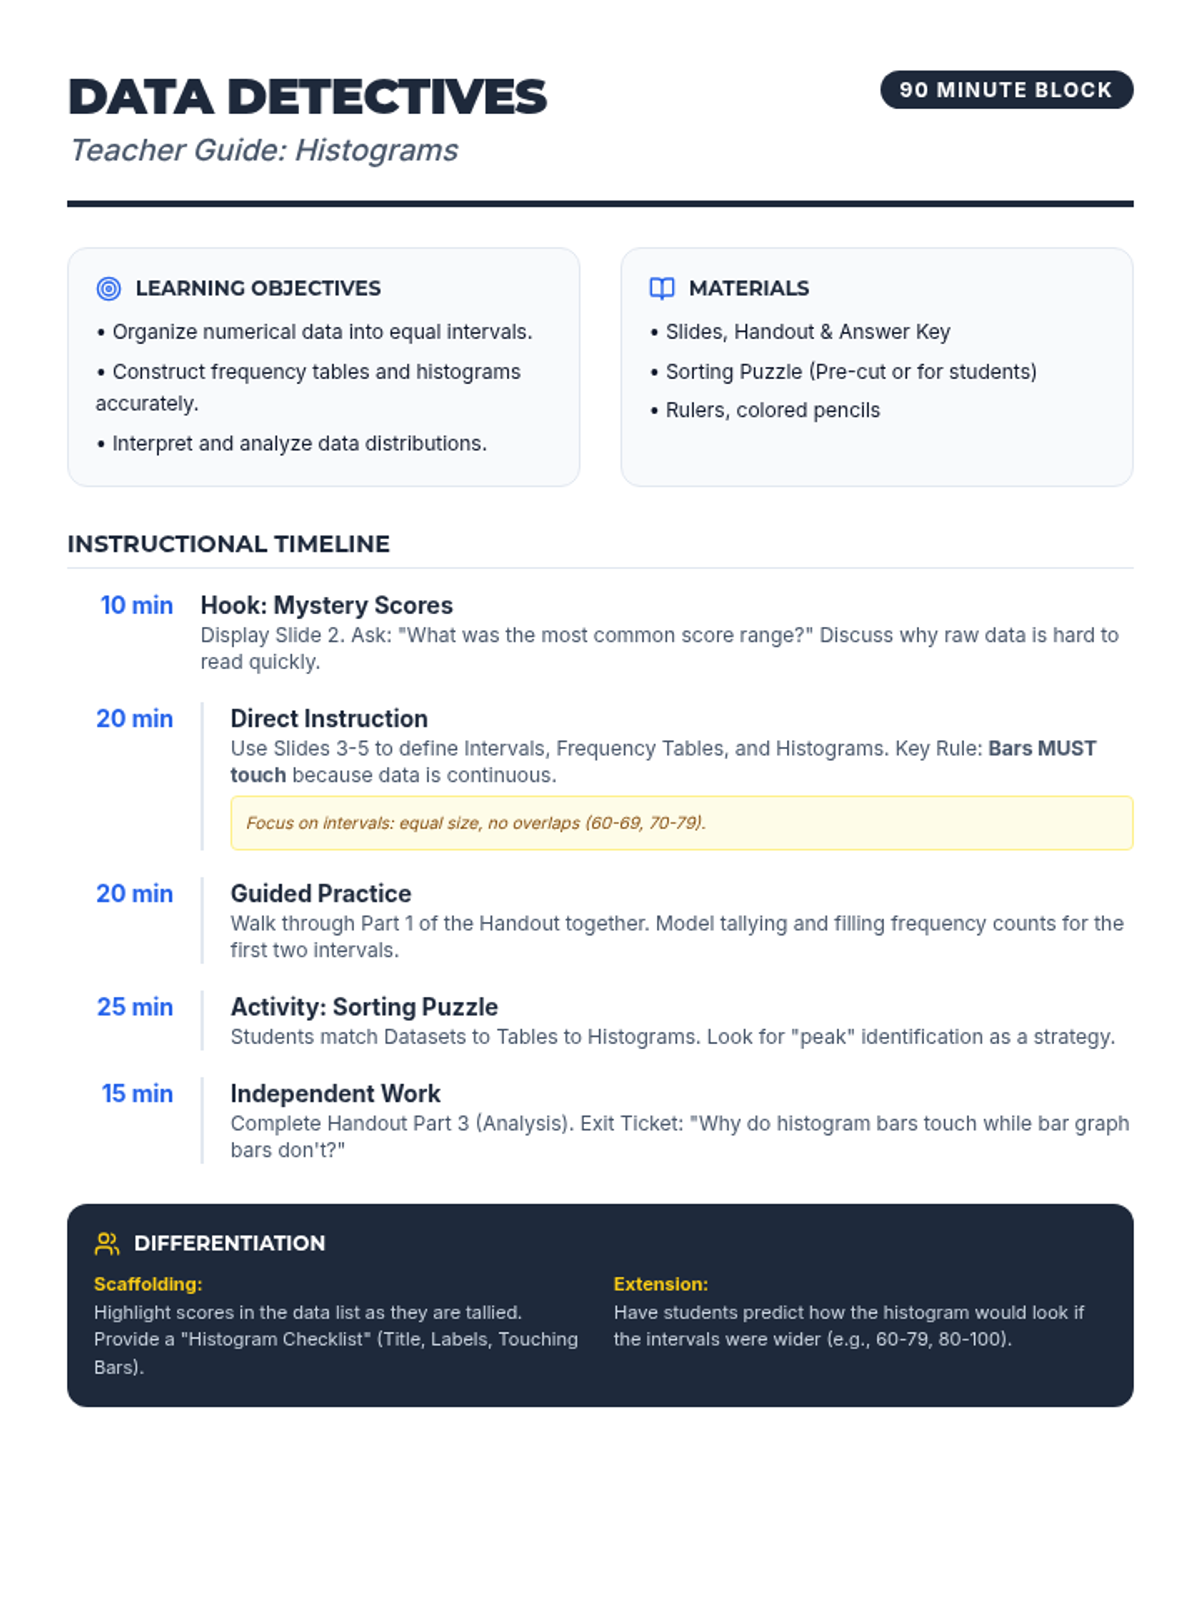
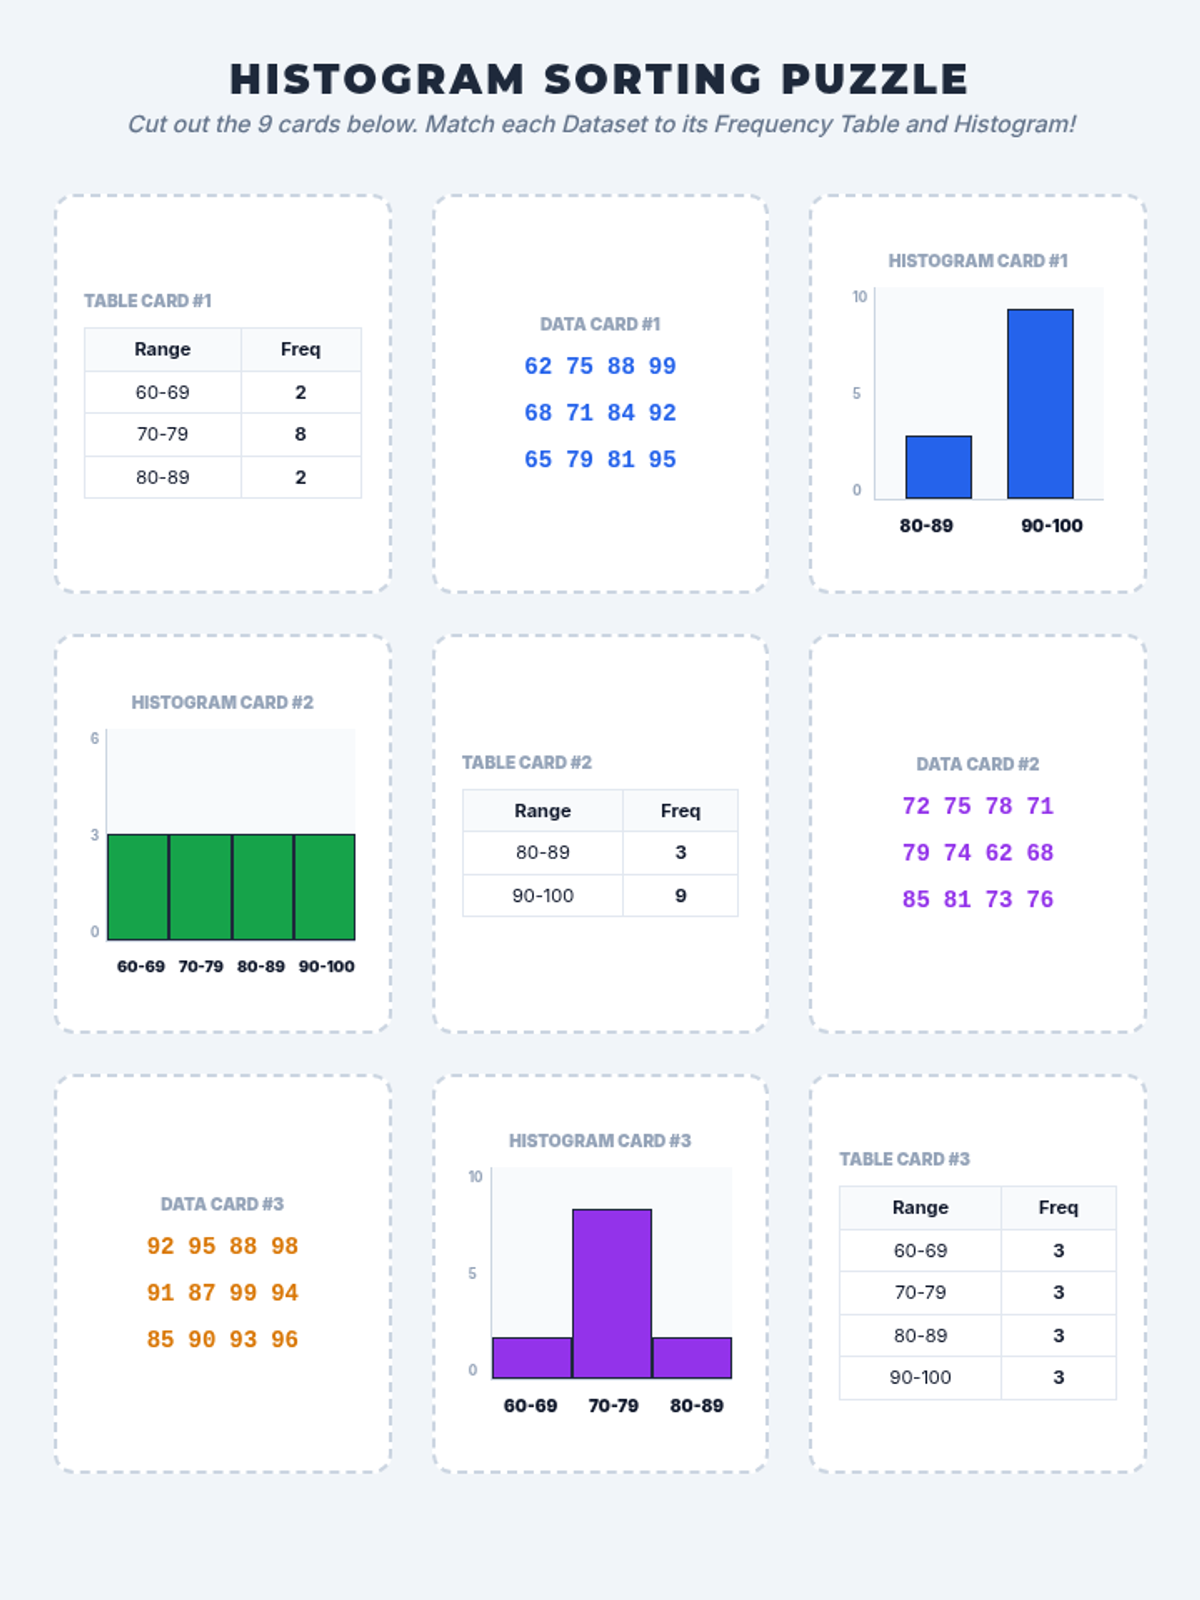
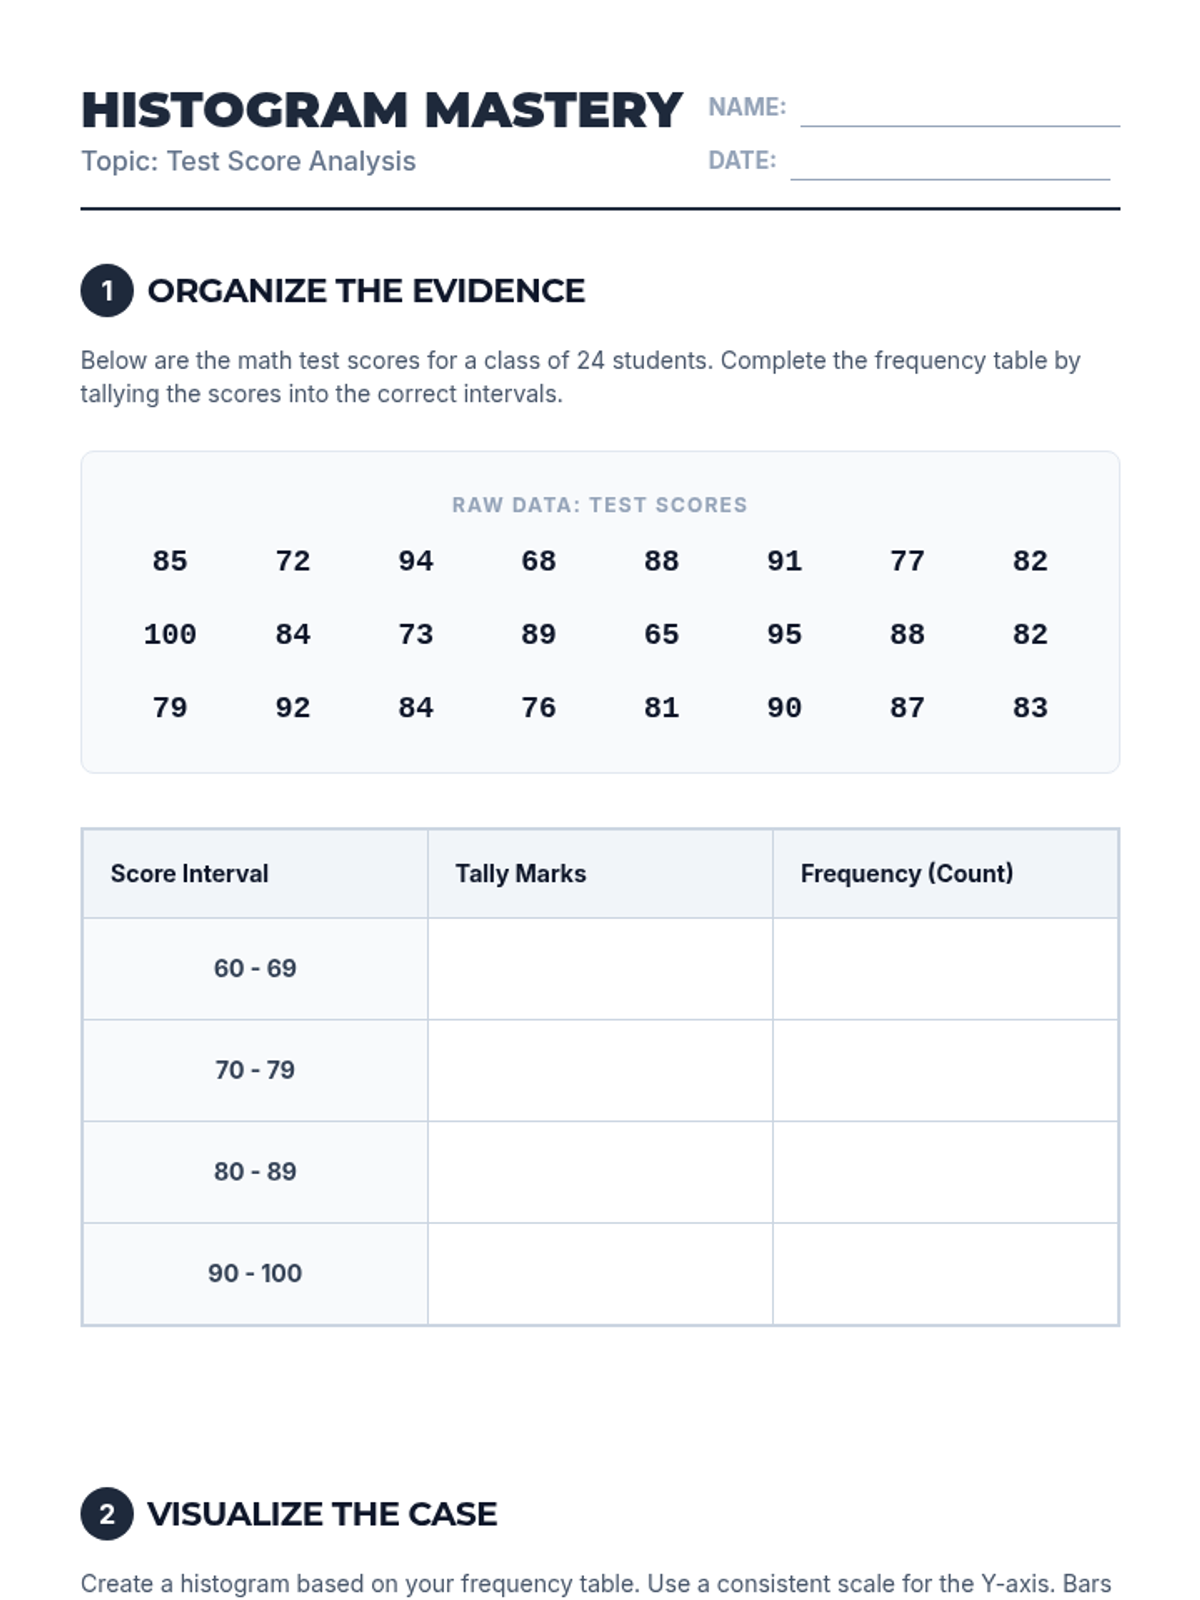
A comprehensive 90-minute math lesson focused on organizing data into intervals and creating/interpreting histograms using test score data. Students act as 'Data Detectives' to uncover trends in numerical information.
An all-in-one review lesson covering the five major 6th-grade math domains. Designed for IEP support with visual scaffolds and simplified 2-option choices.
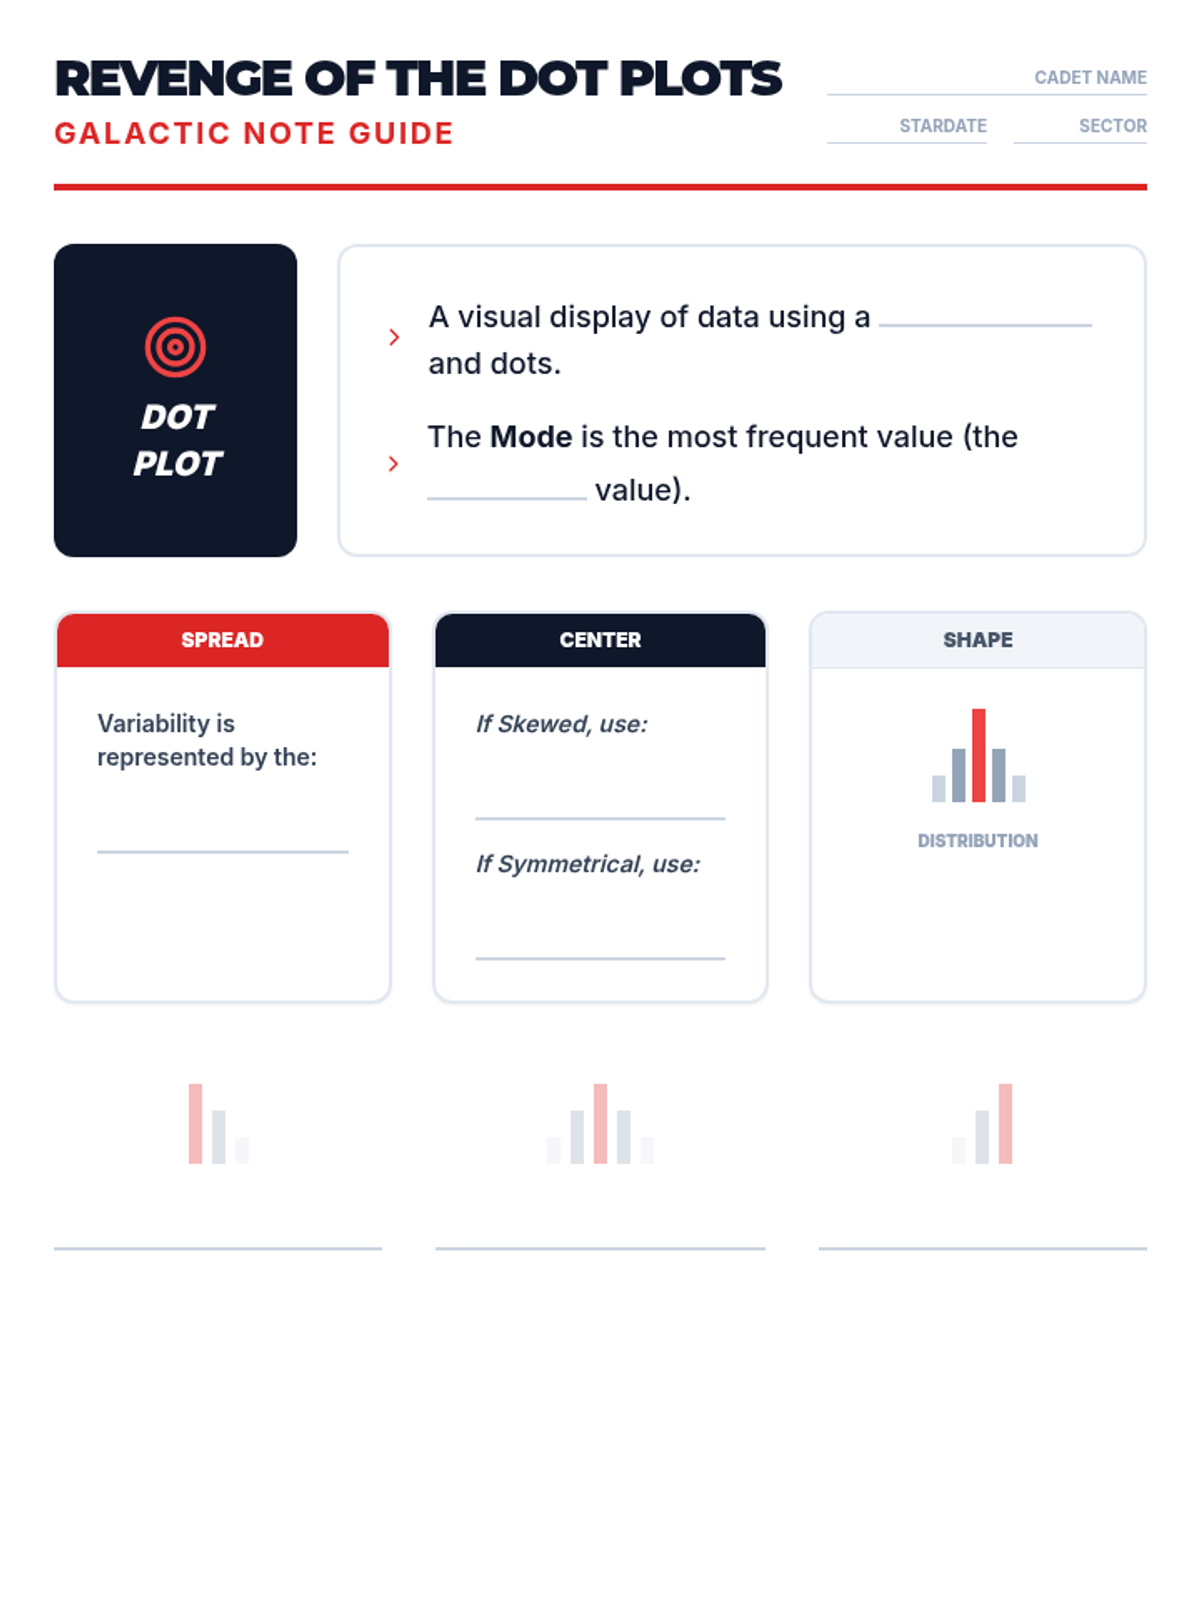
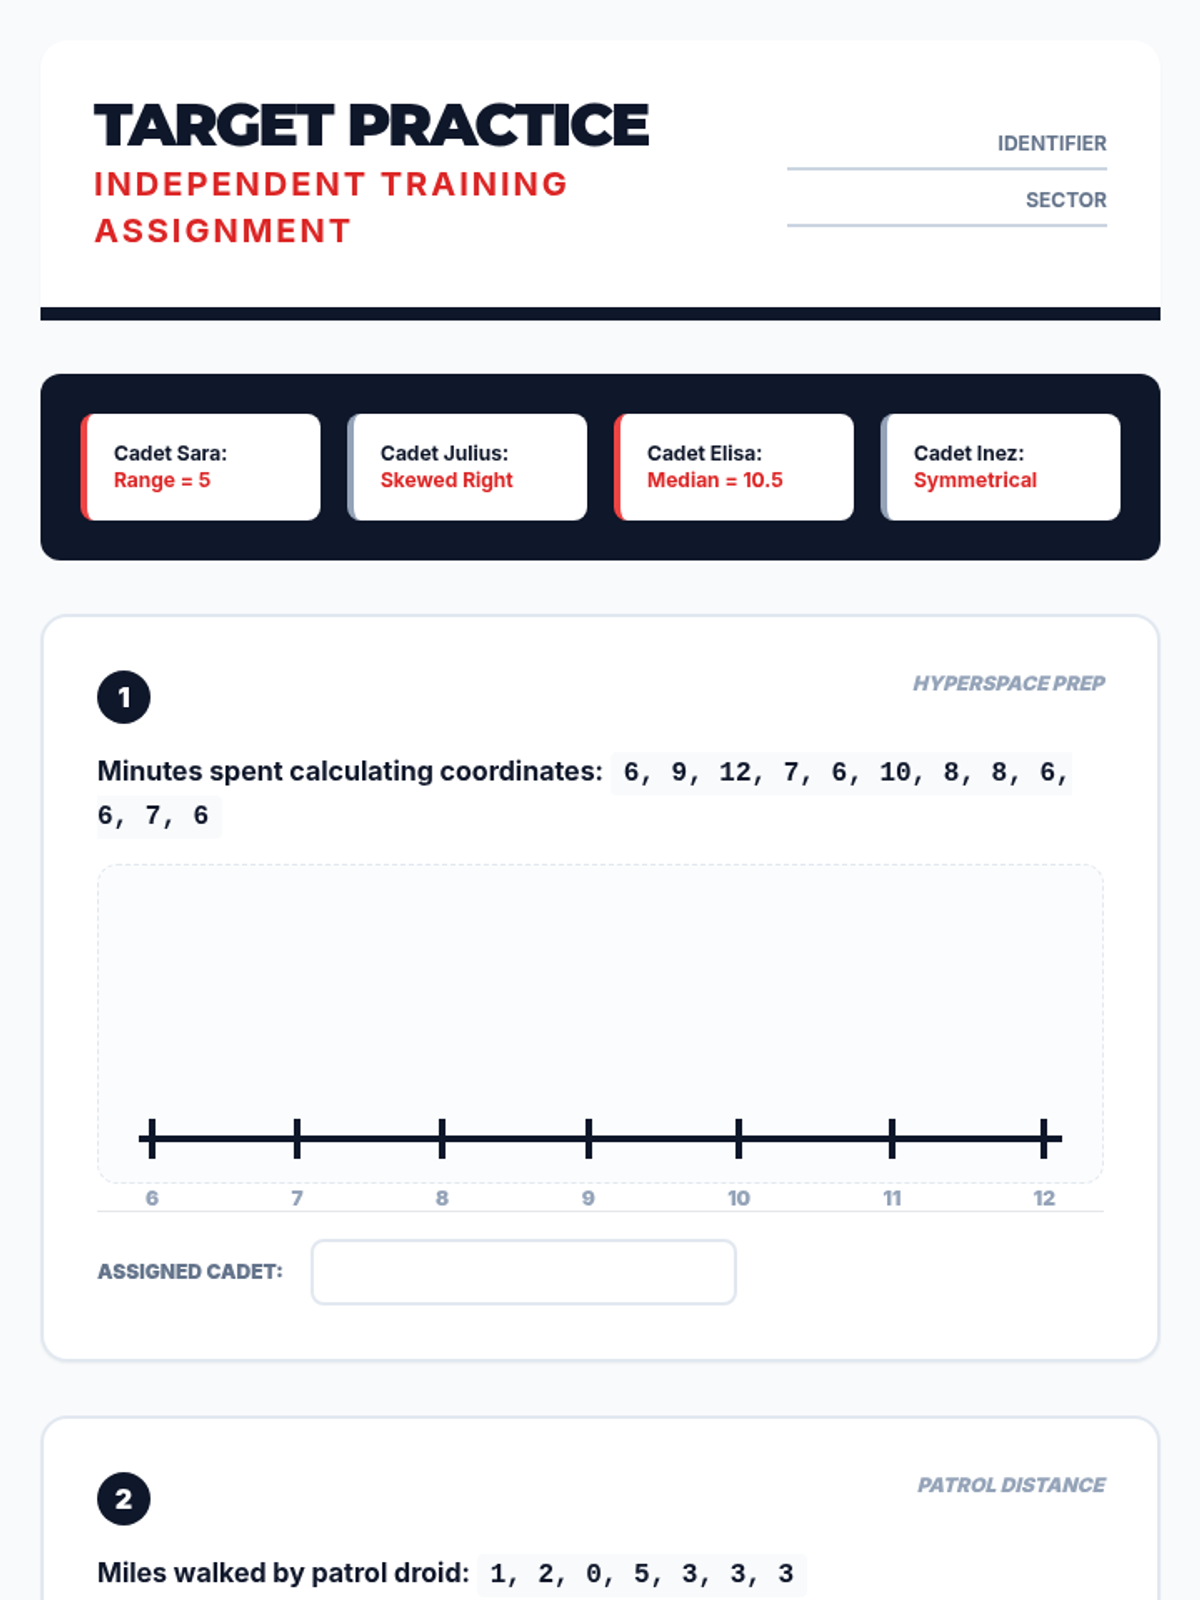
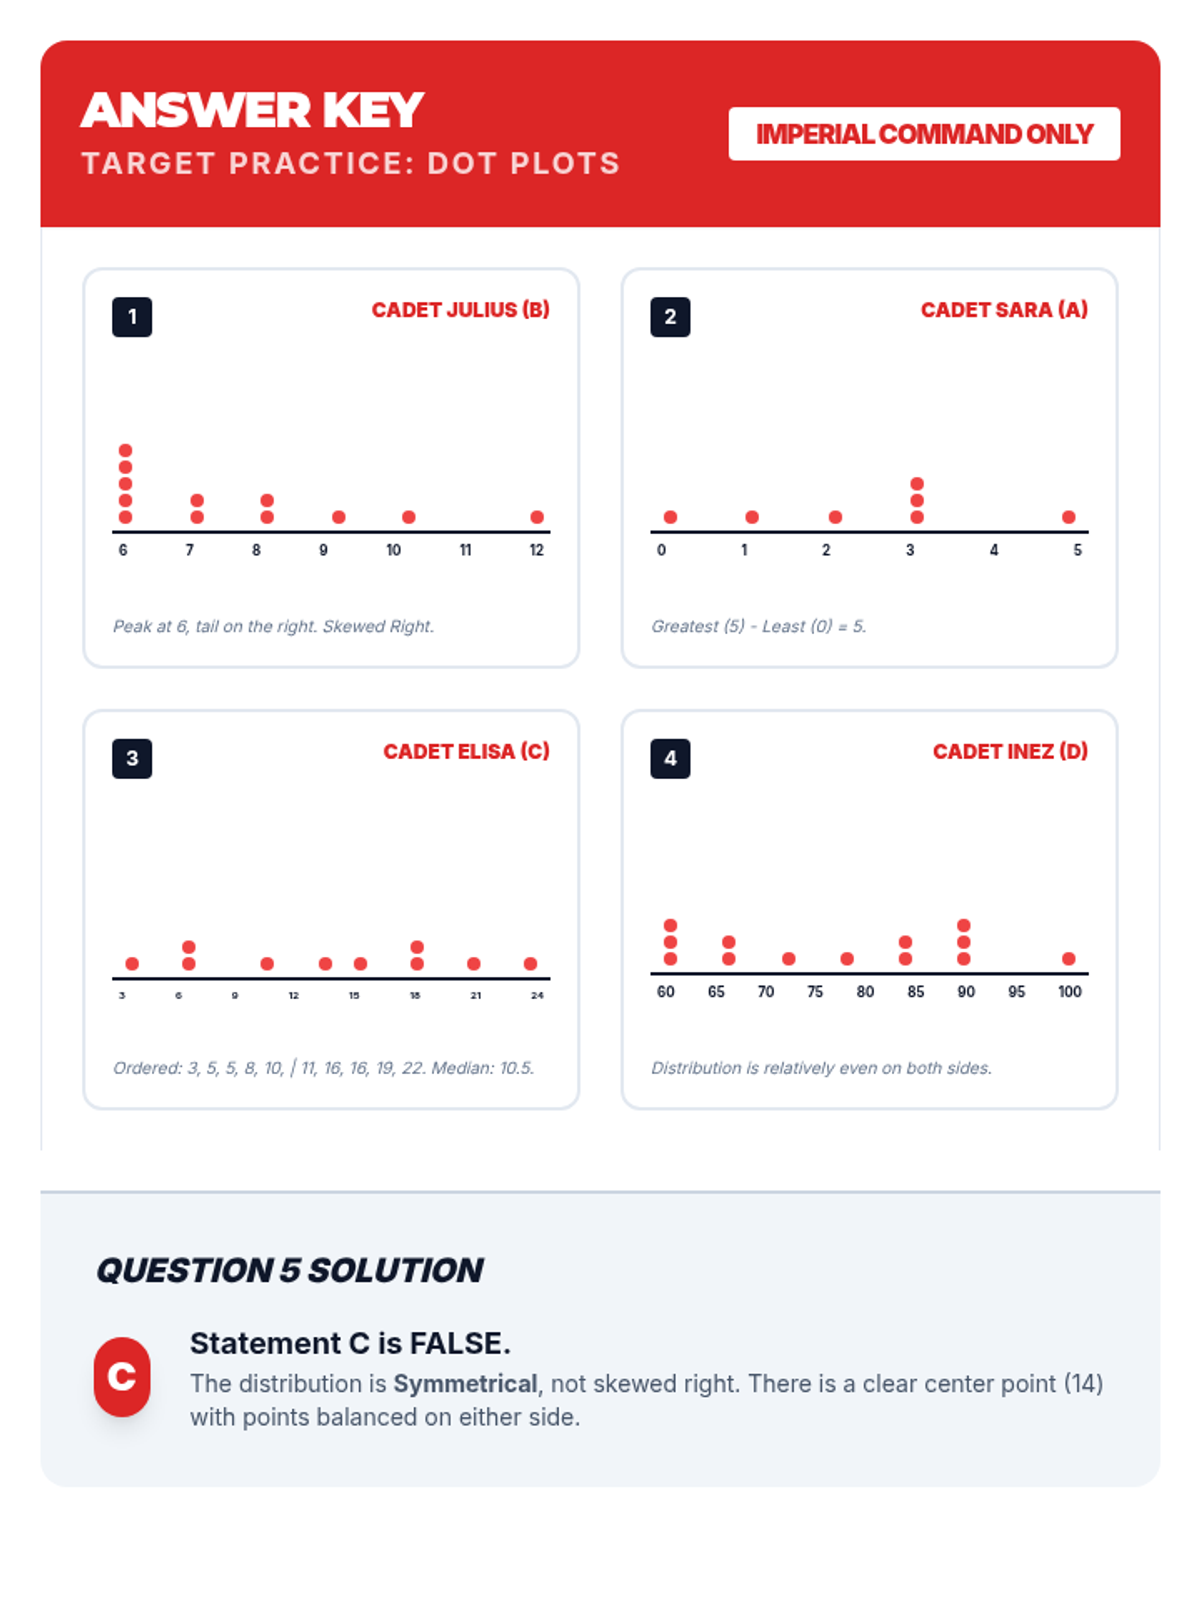
A Star Wars-themed lesson on Data and Statistics focusing on creating and interpreting dot plots, featuring Stormtrooper accuracy data and galactic scenarios.
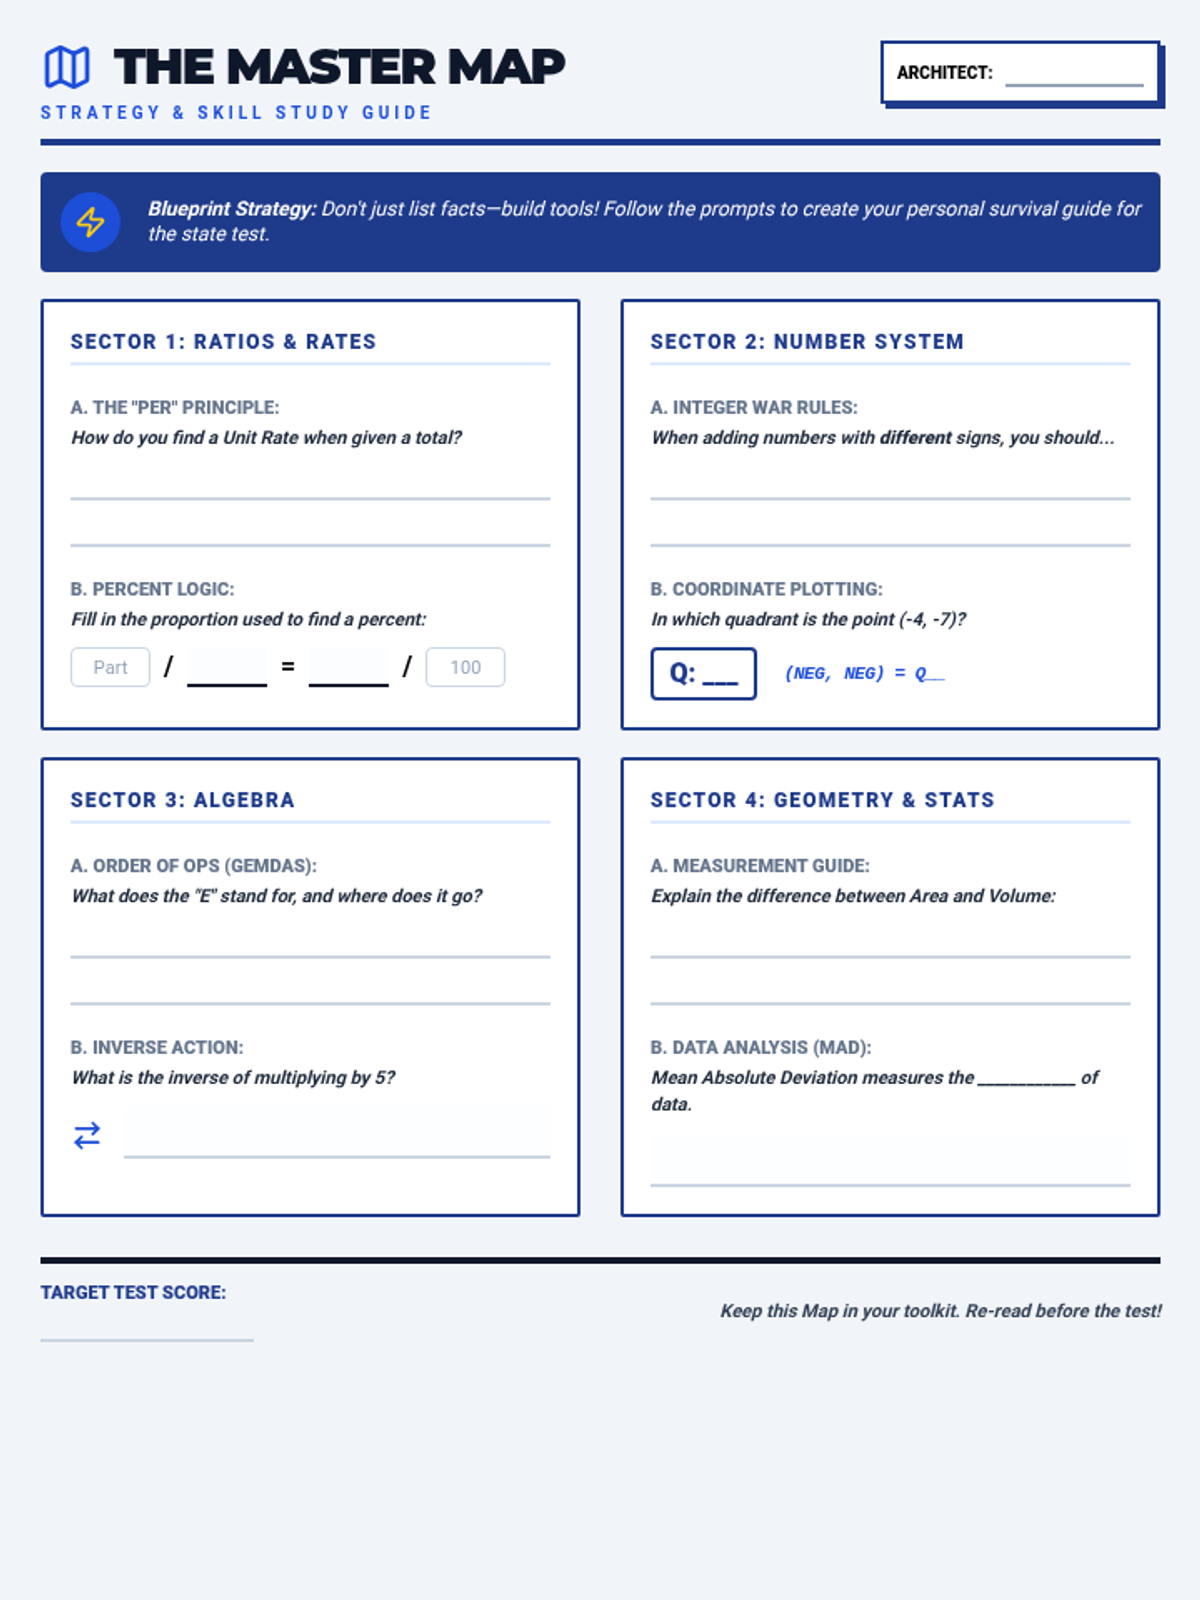
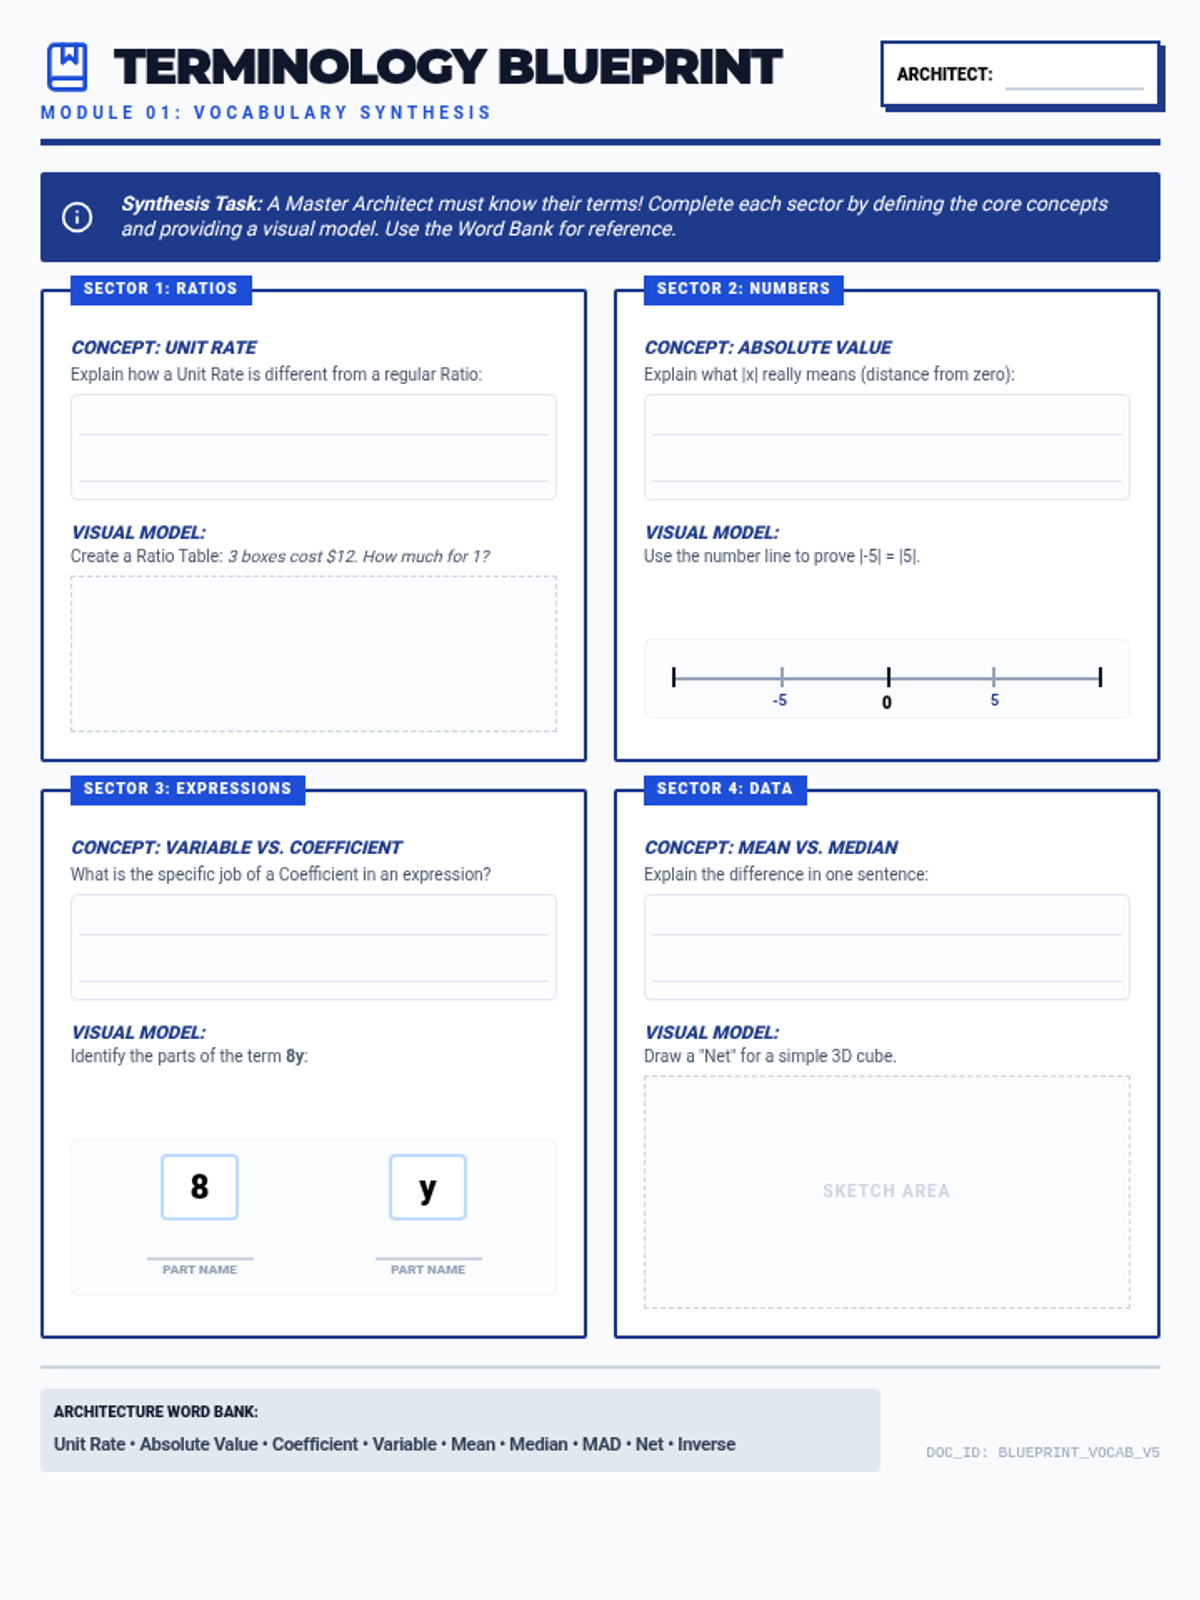
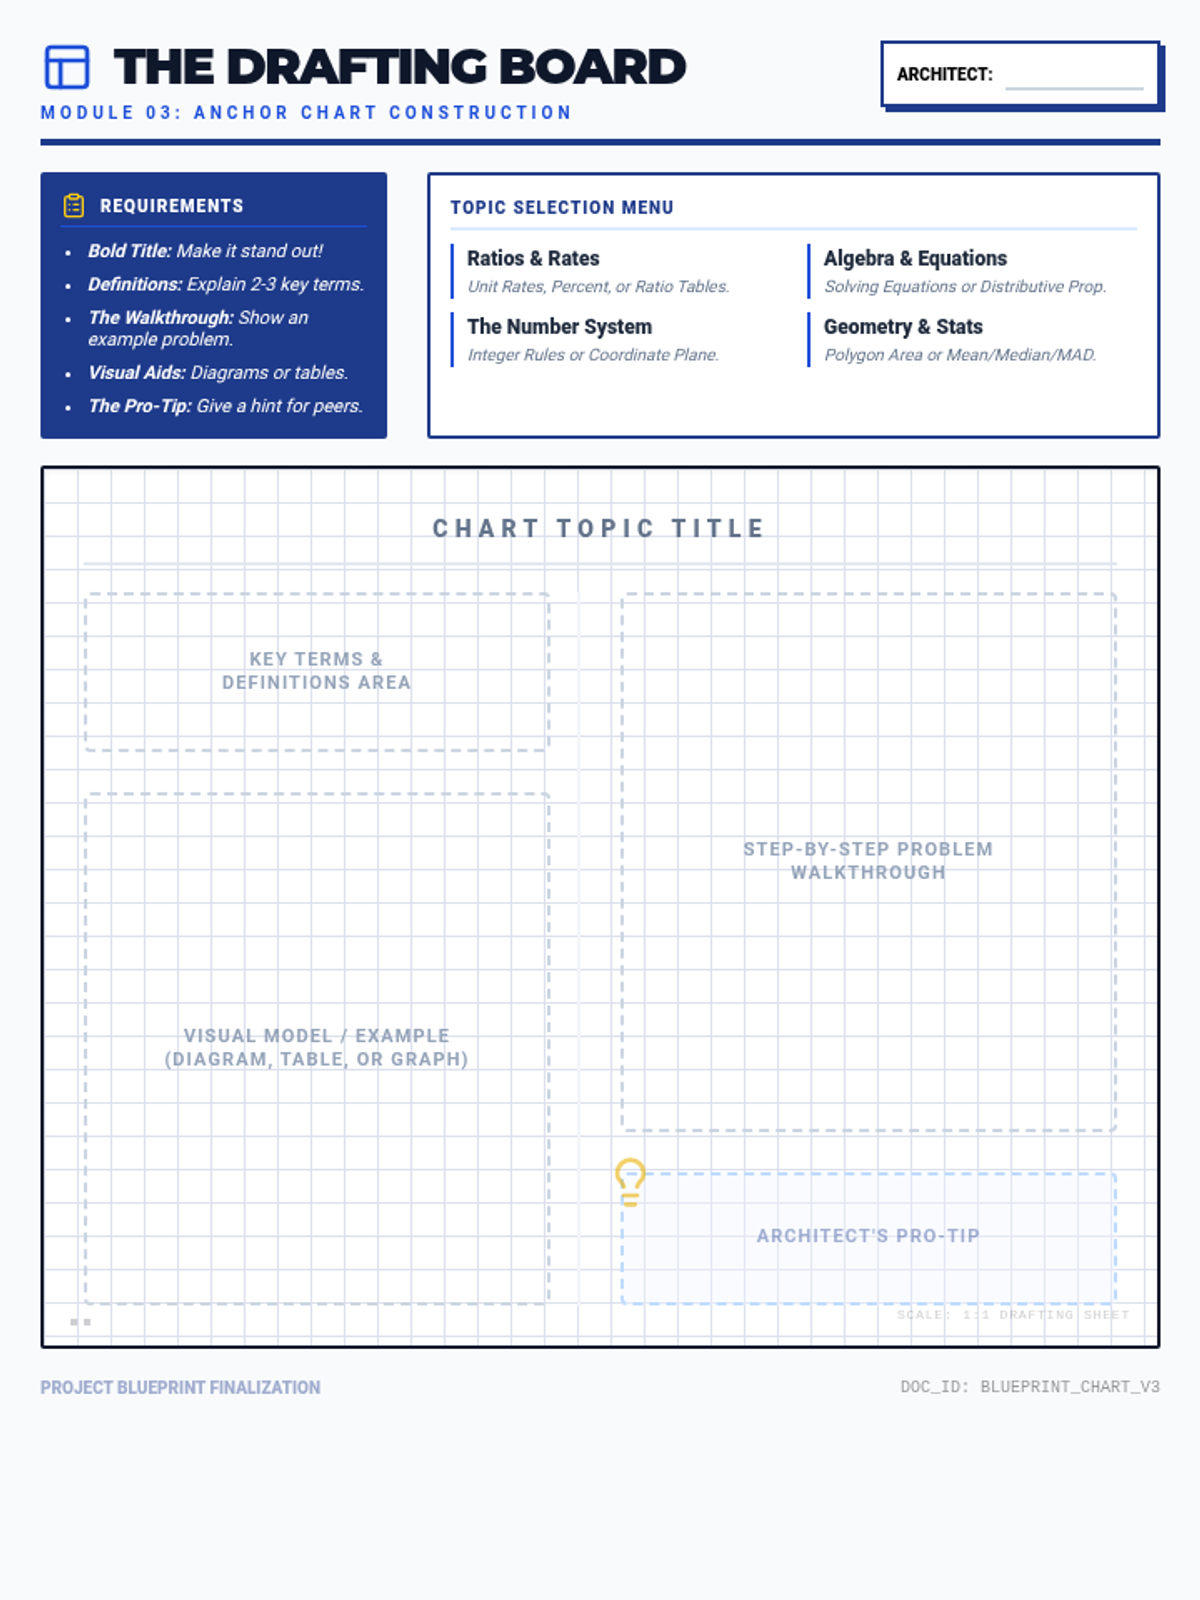
A set of interactive study resources designed to help students review key domains for the NYS Math Test through active creation and synthesis of information.
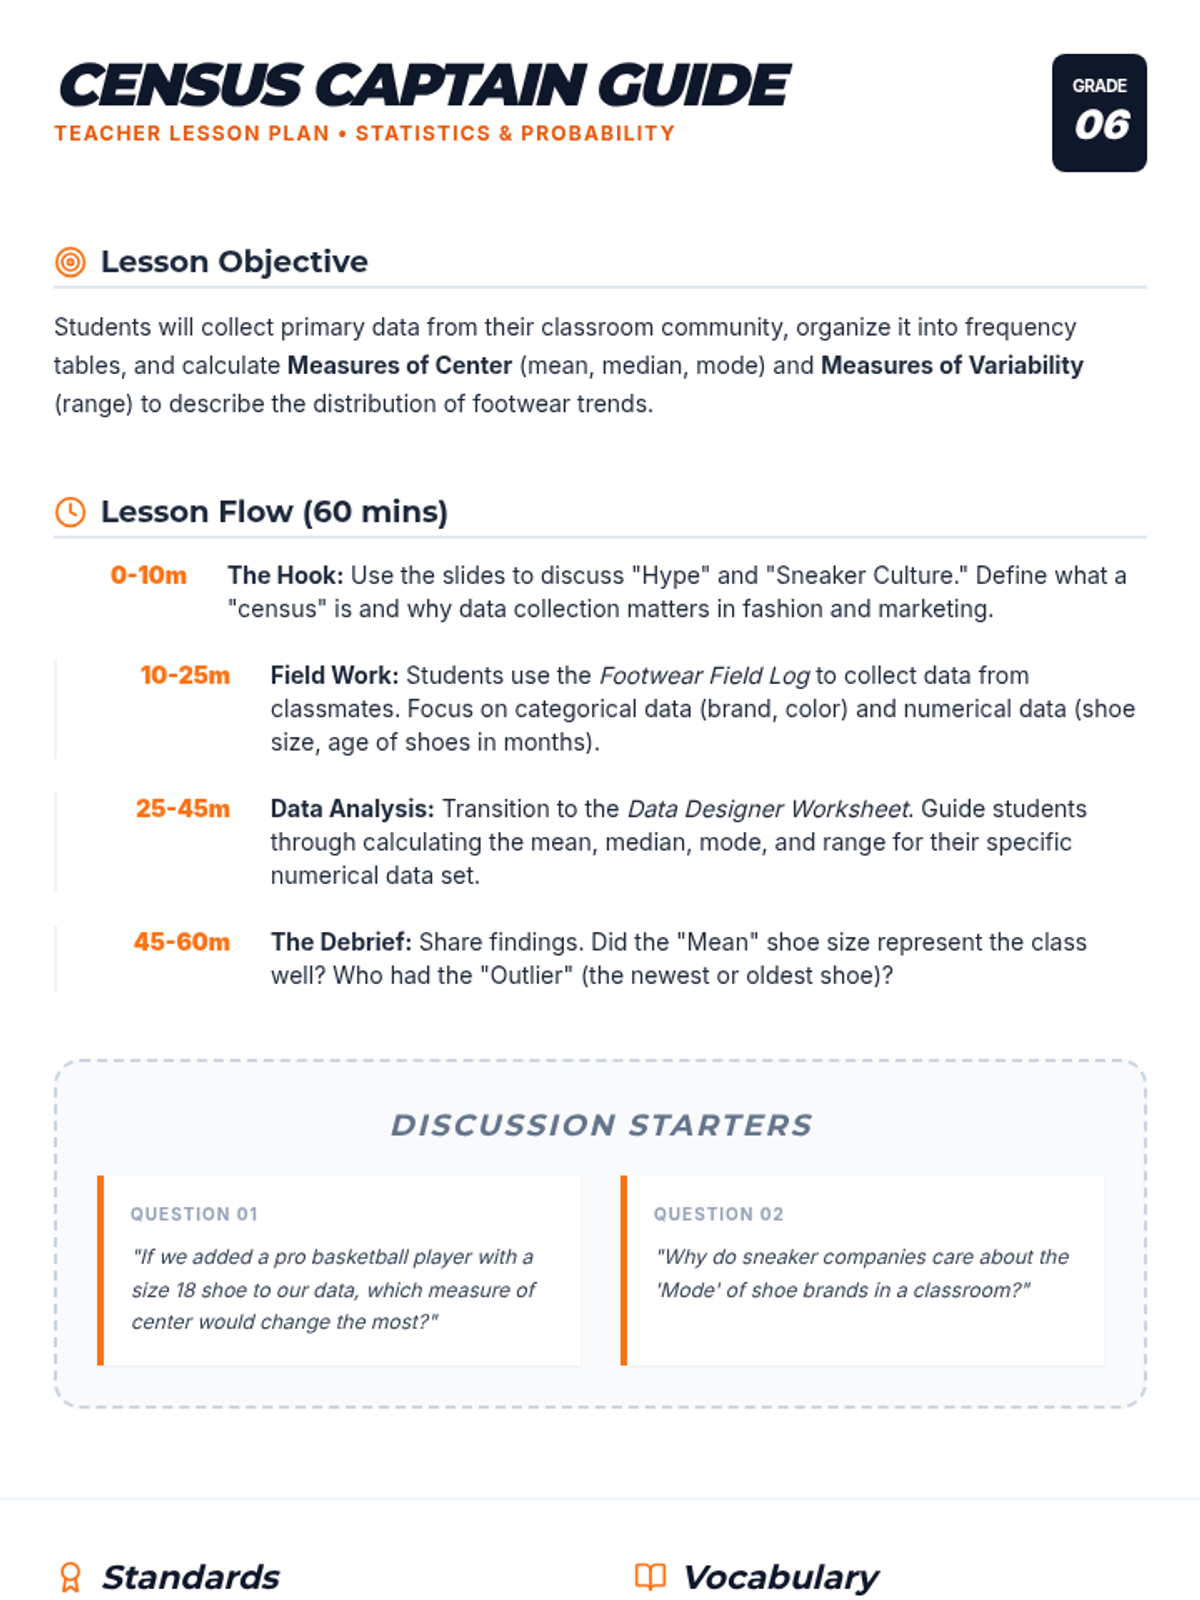
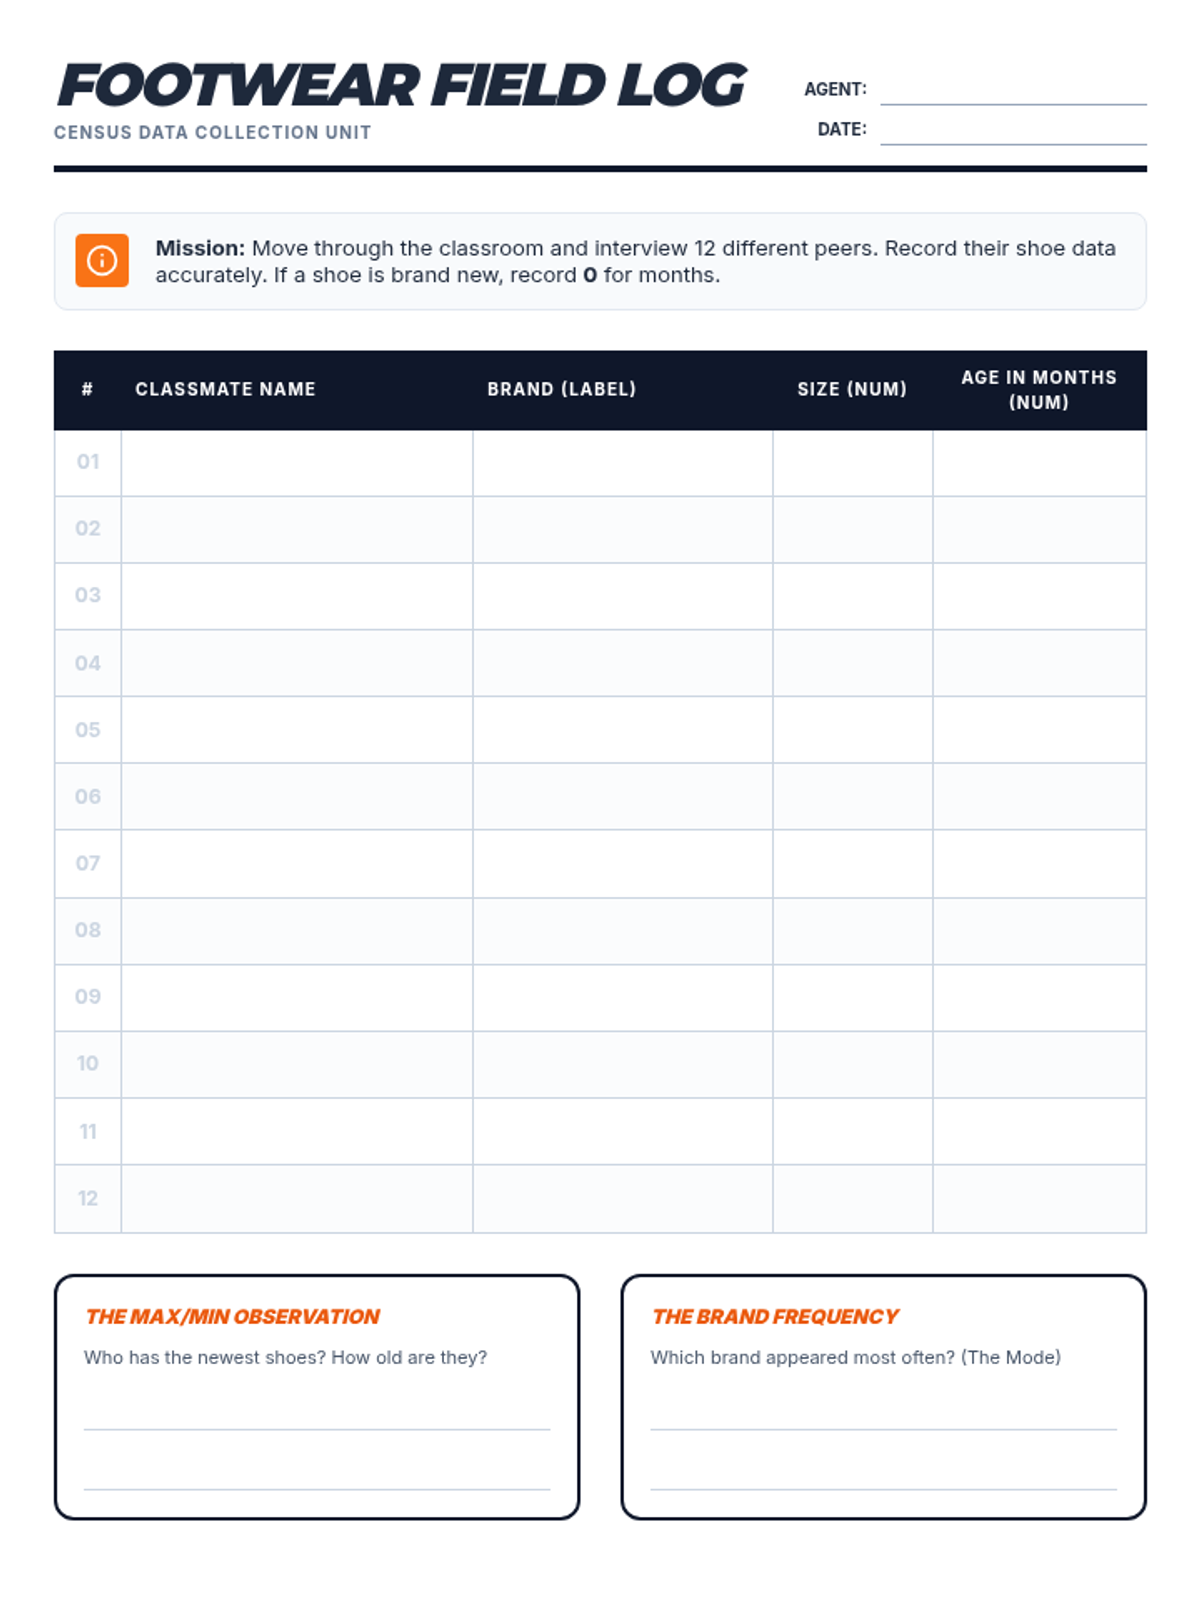
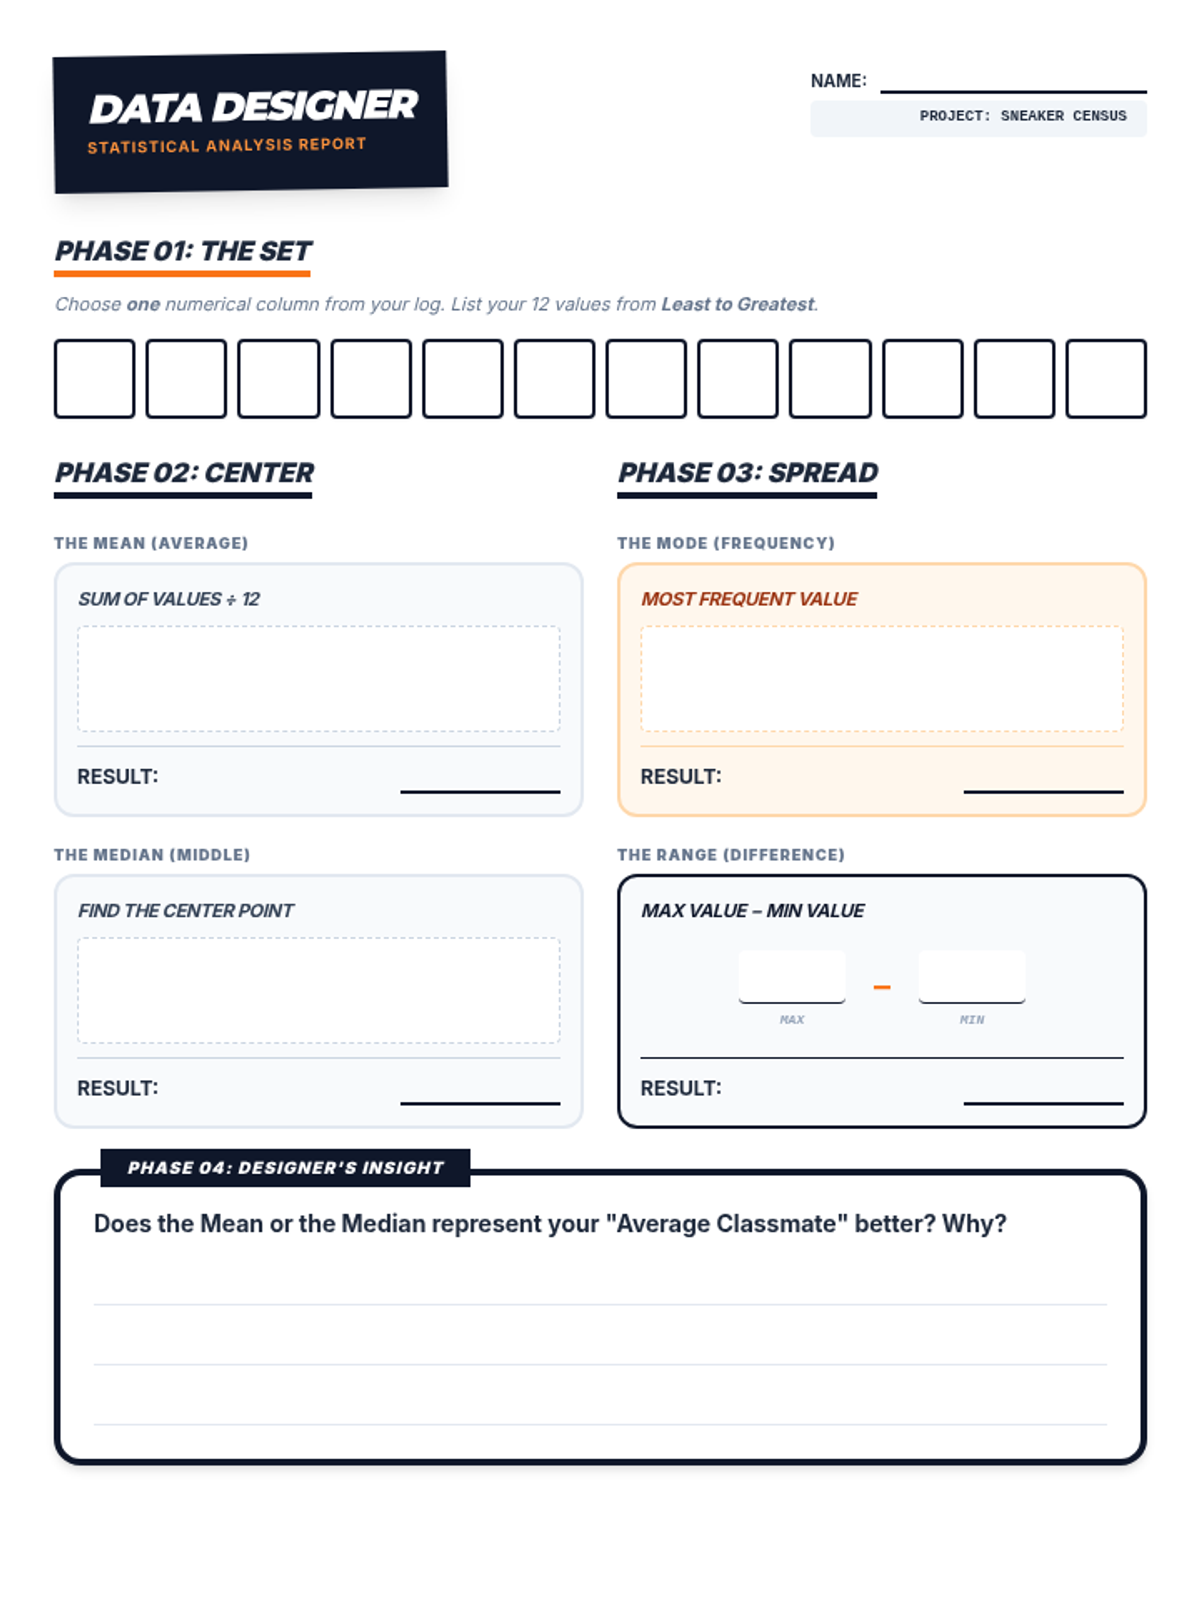
In this hands-on statistics lesson, students conduct a 'census' of their classroom's footwear, then use the resulting data to calculate and interpret measures of center and variability. By connecting abstract concepts like mean, median, and range to their own style choices, students develop a deeper understanding of how data represents real-world populations.
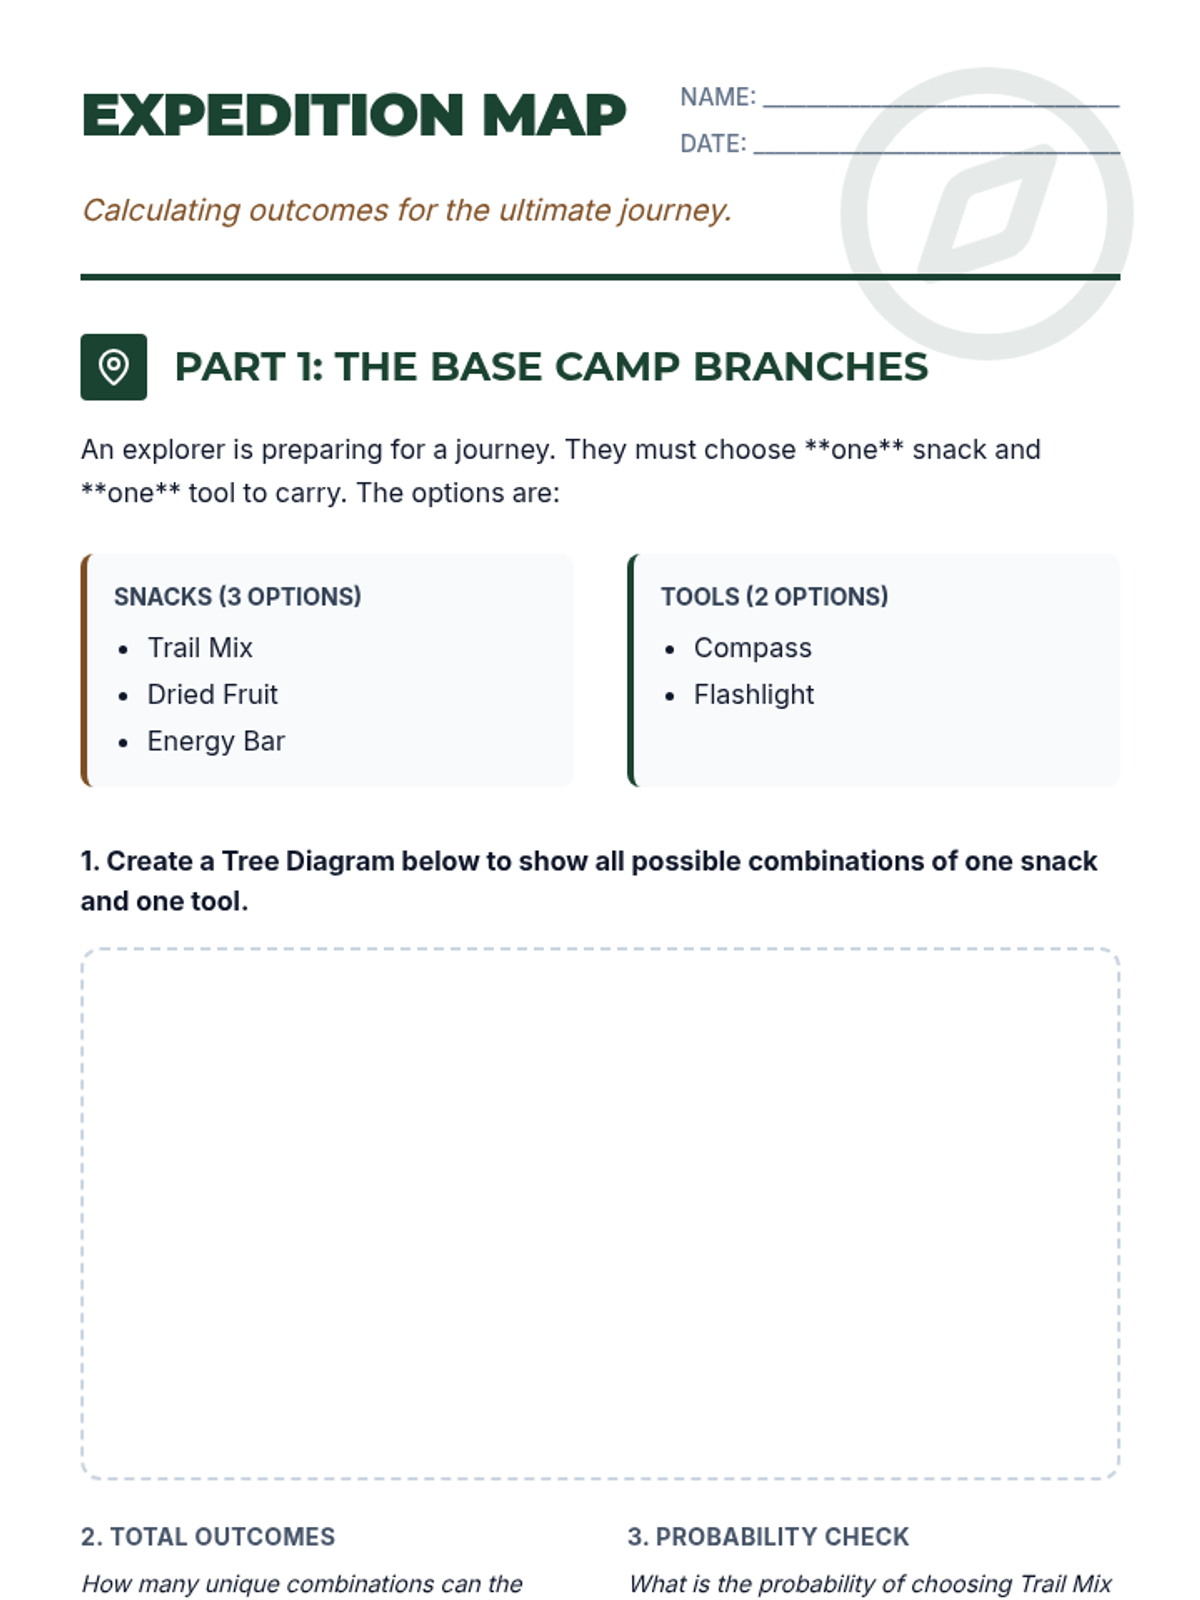
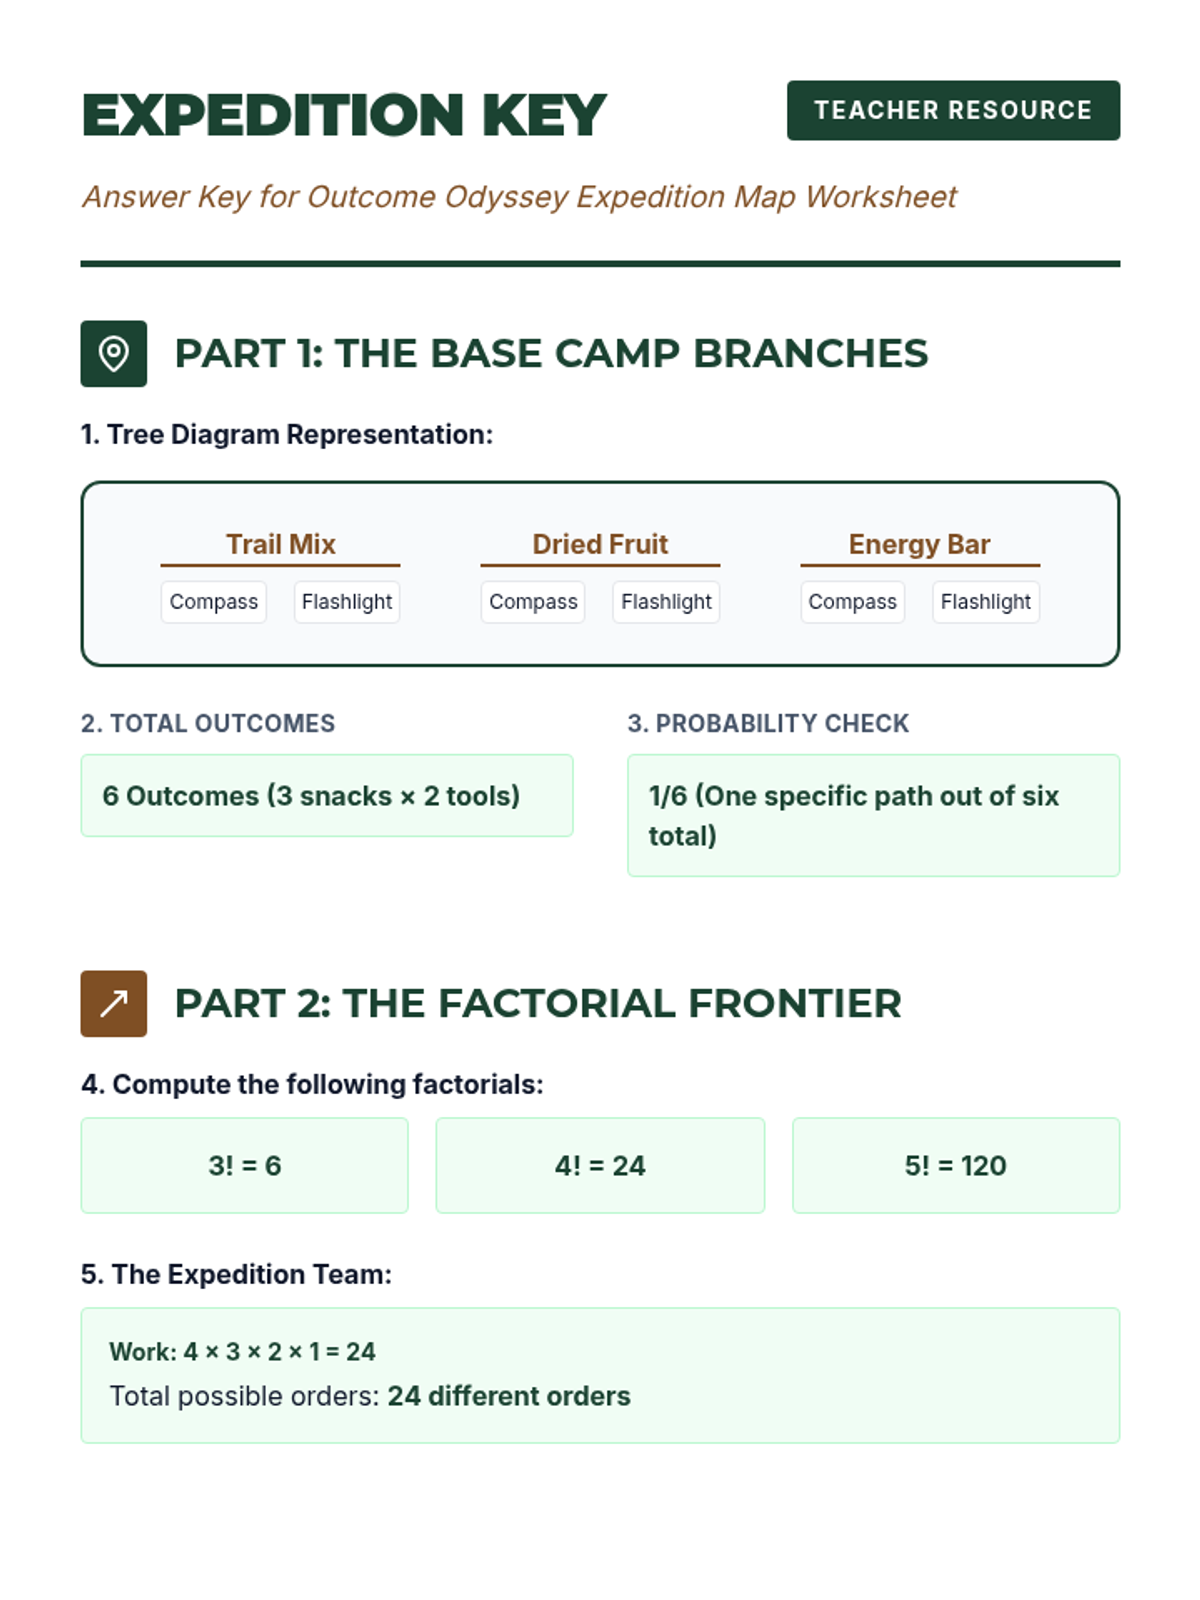
A comprehensive lesson on calculating possible outcomes using tree diagrams and factorials, using an exploration and pathfinding theme.
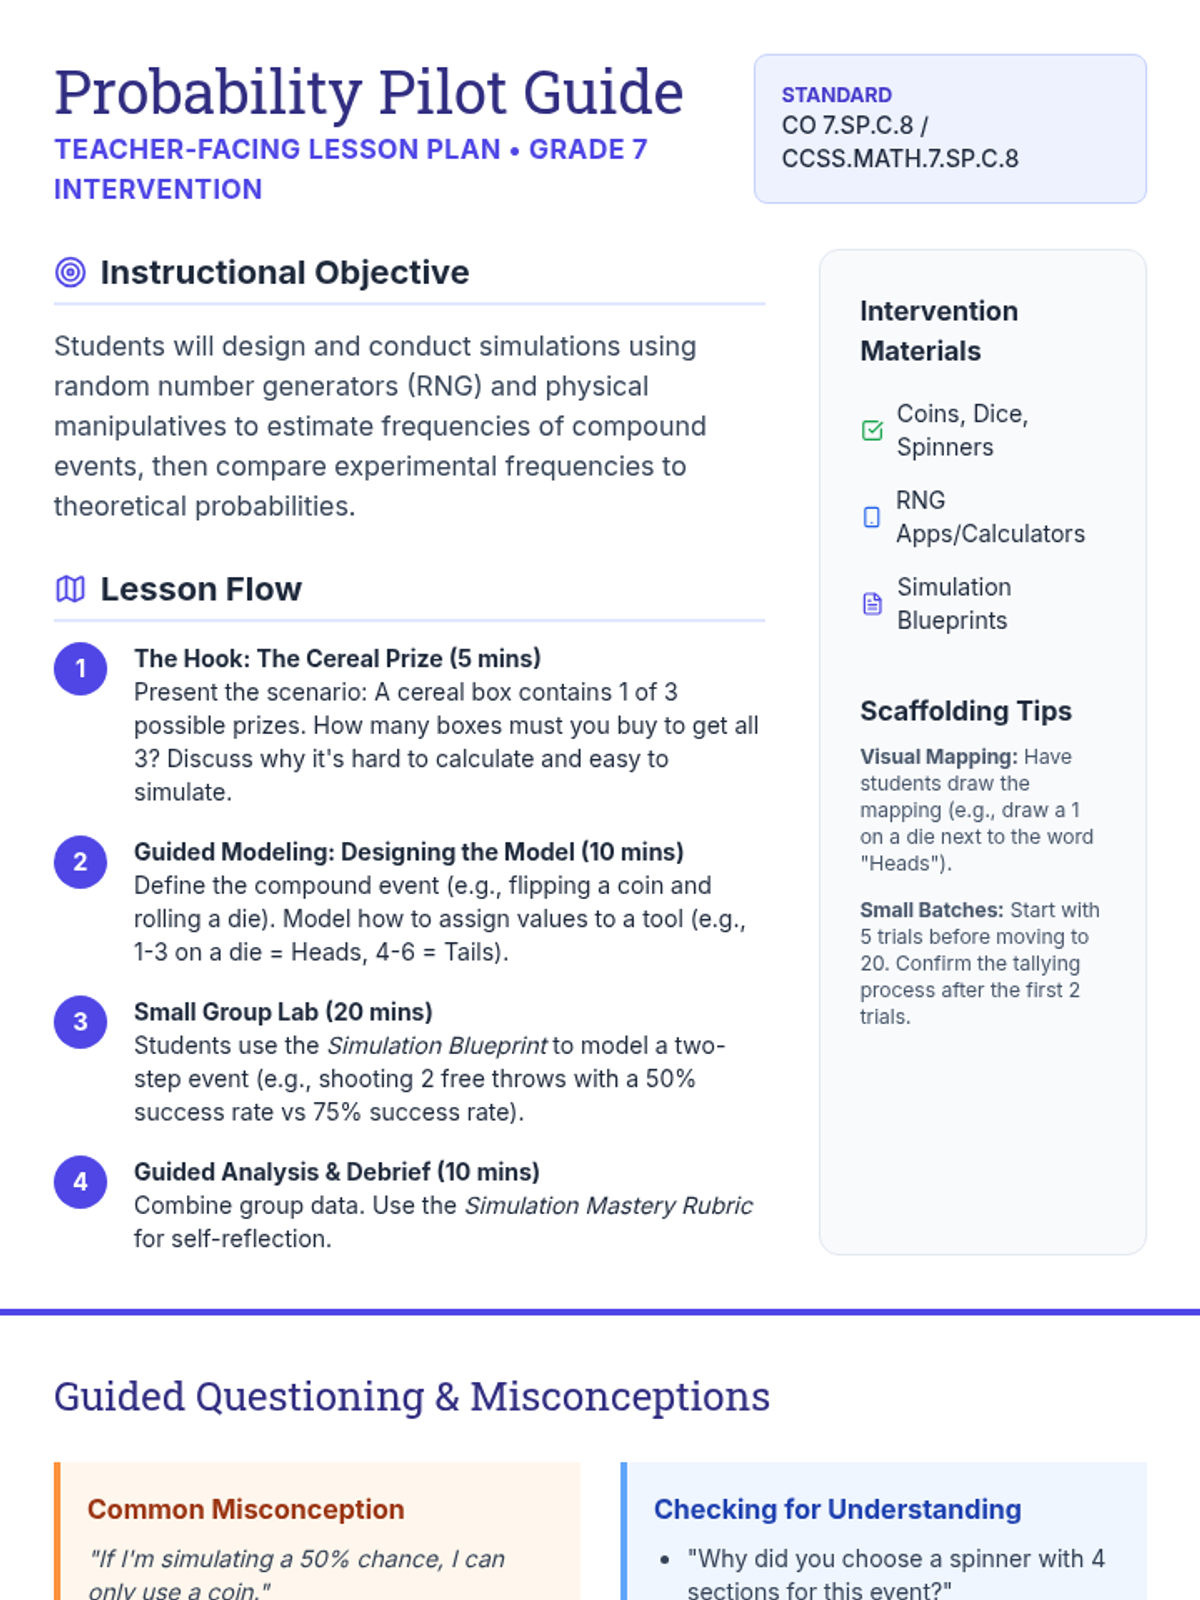
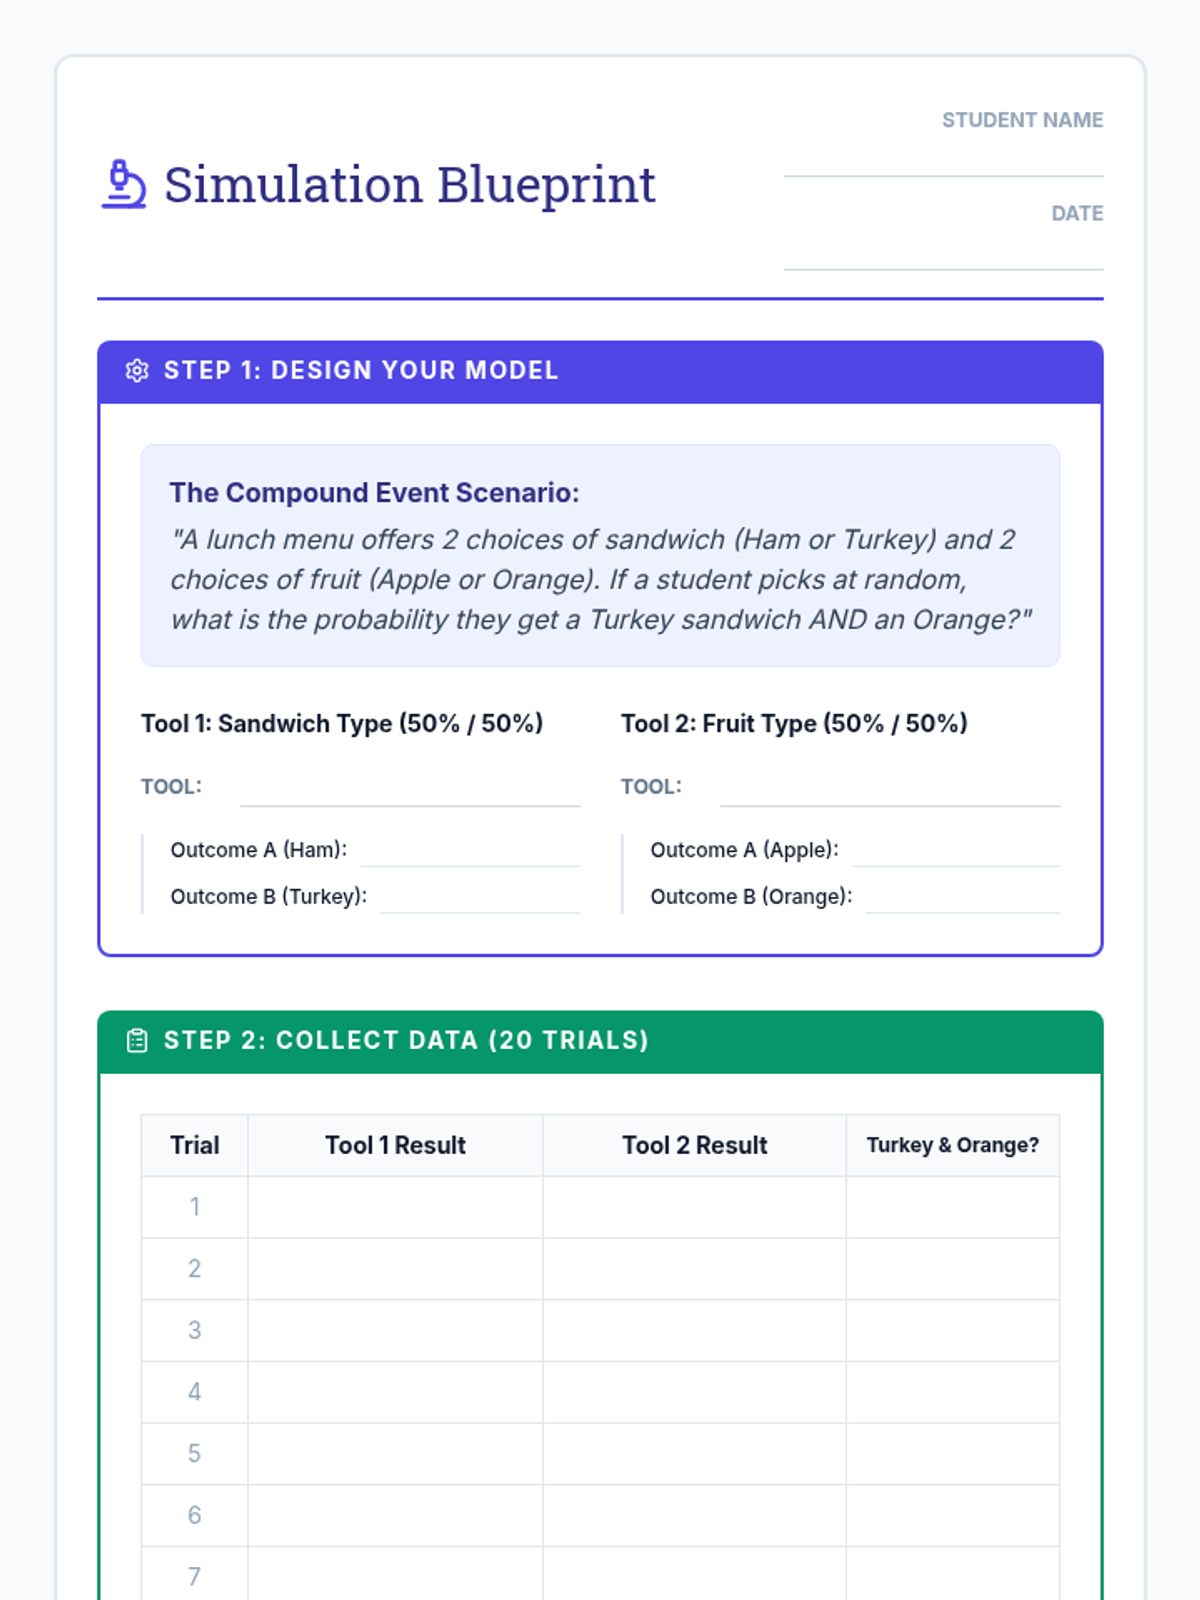
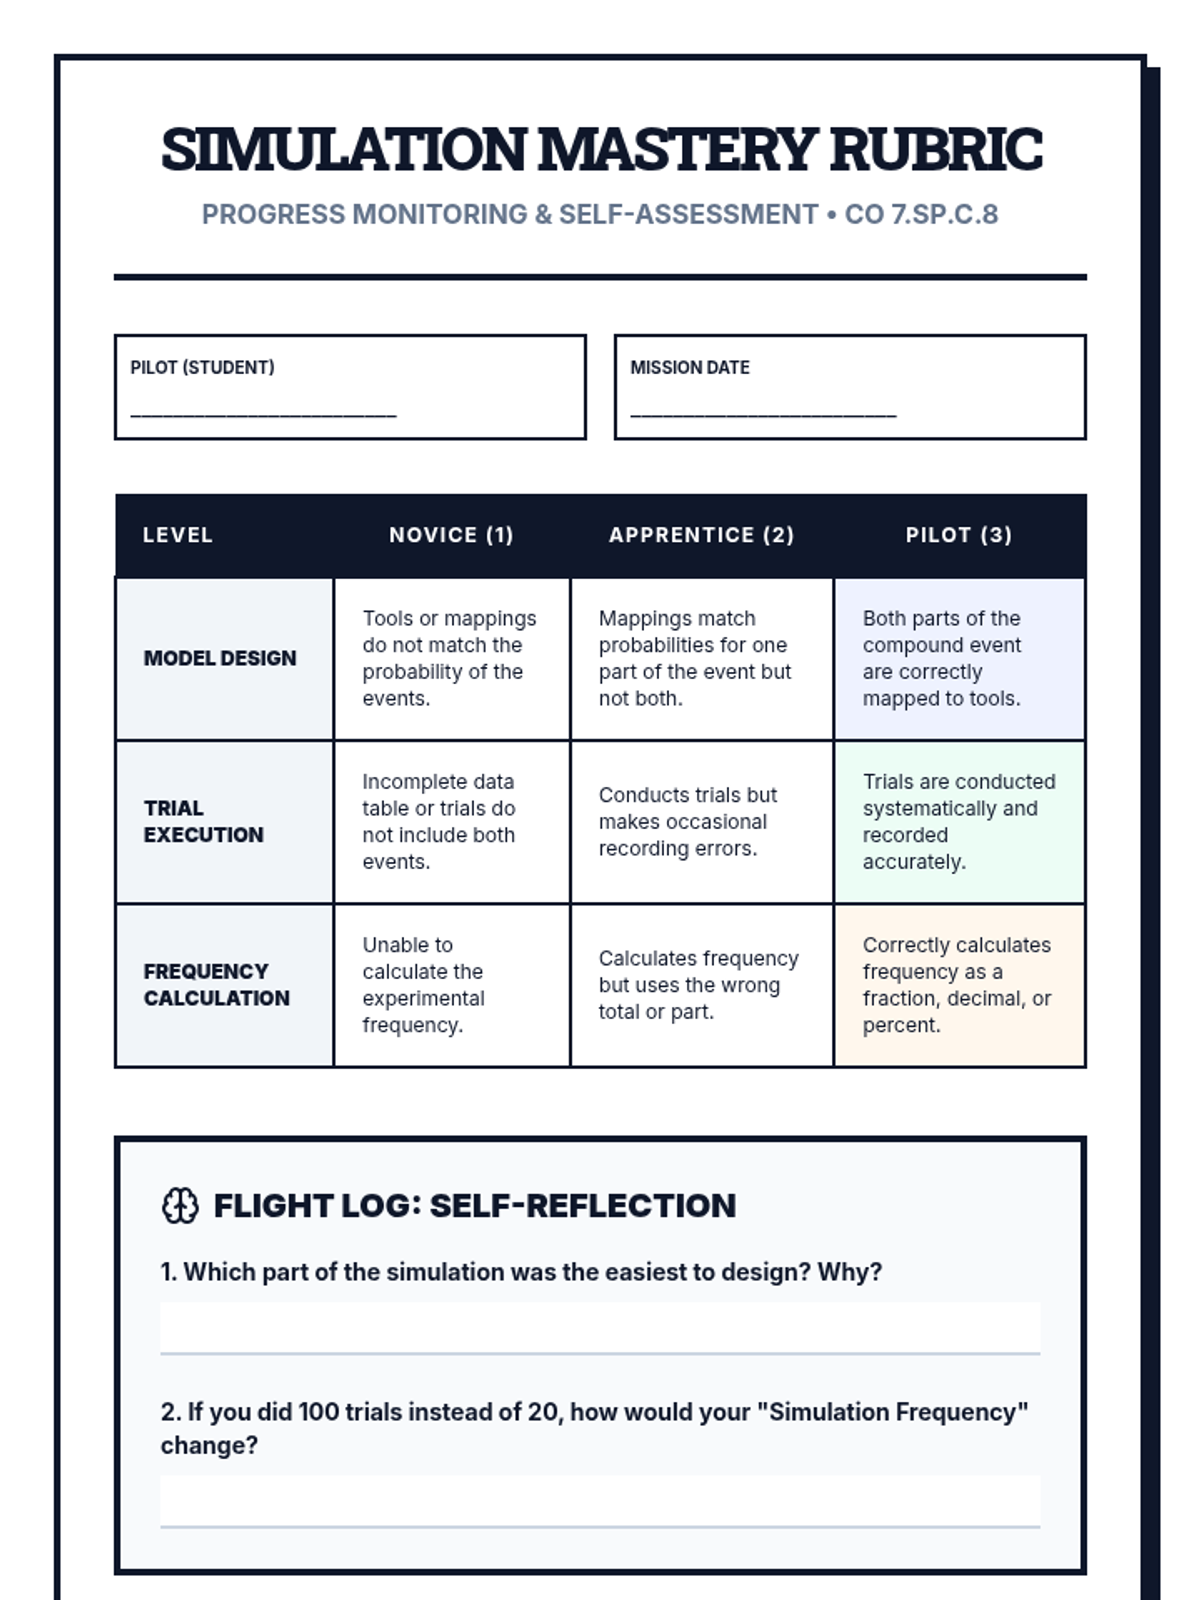
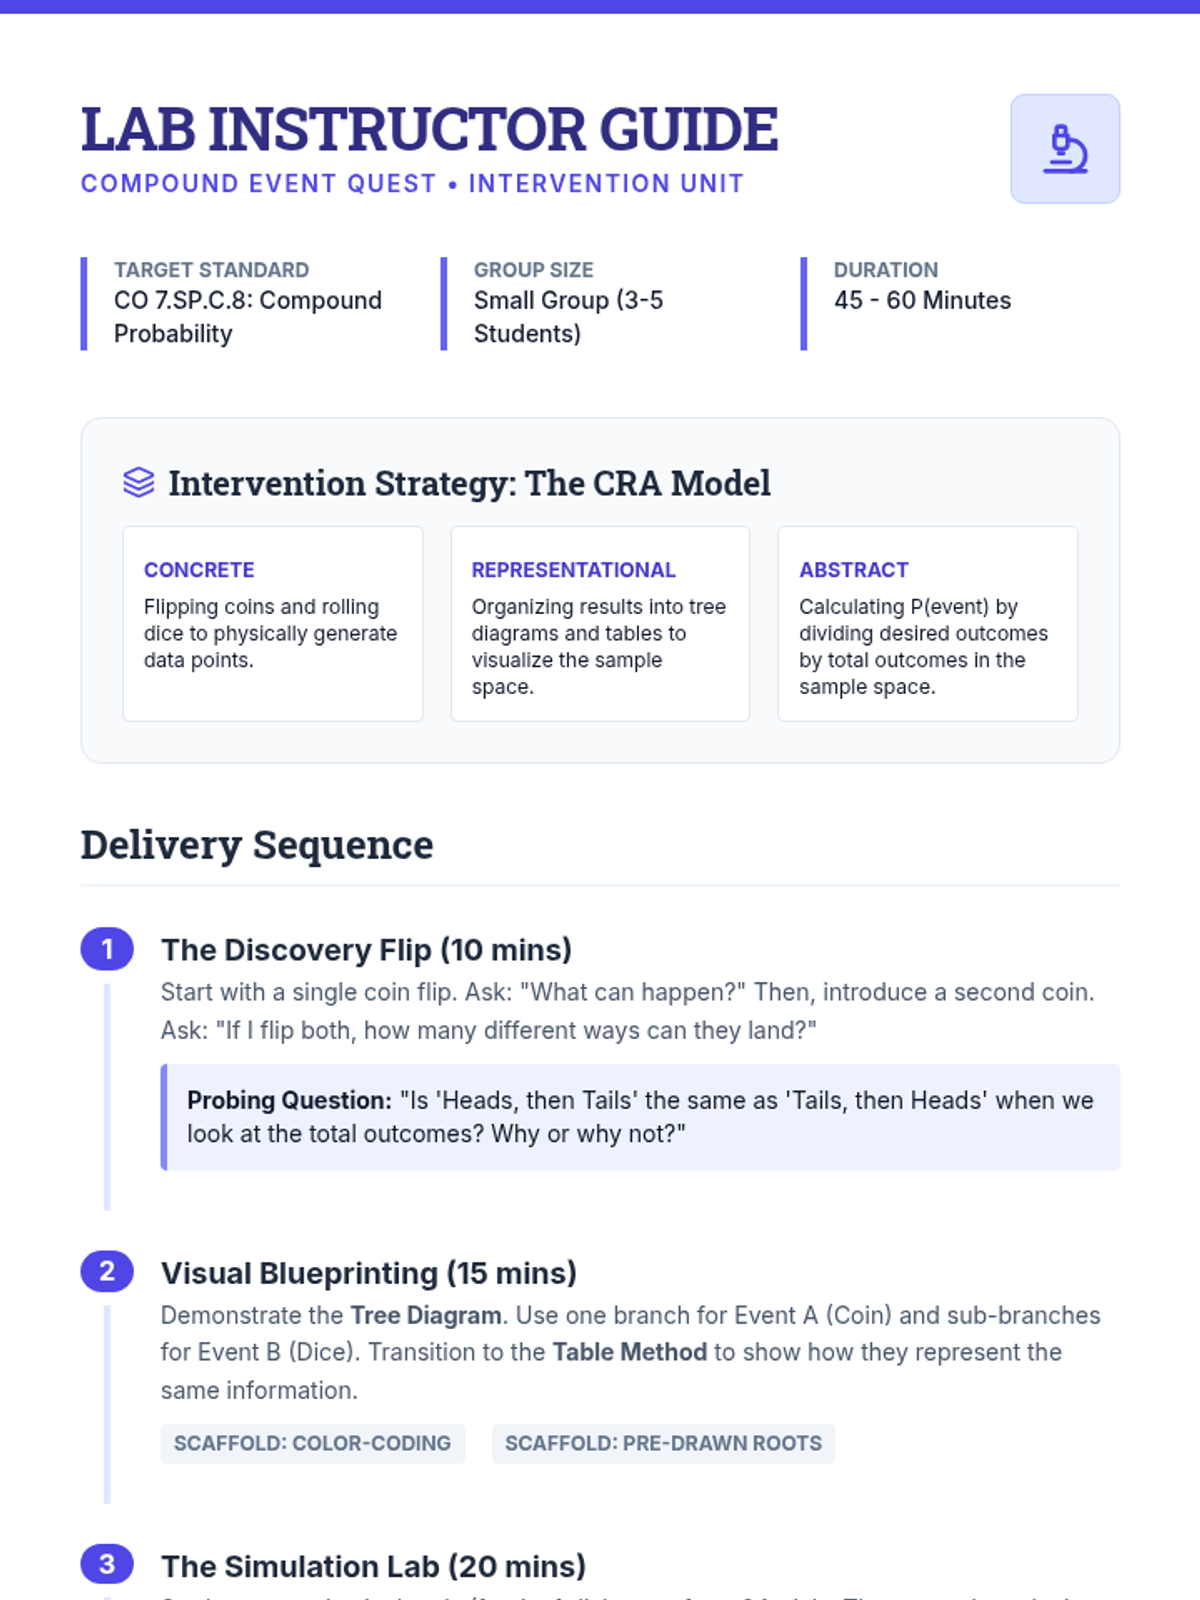
A Tier 2 intervention lesson focused on designing and using simulations to estimate probabilities of compound events. Students use random number generators and physical tools to model real-world scenarios, analyze frequency, and evaluate their designs using a formal rubric.
A scaffolded lesson on finding probabilities of compound events using organized lists, tables, tree diagrams, and simulations.
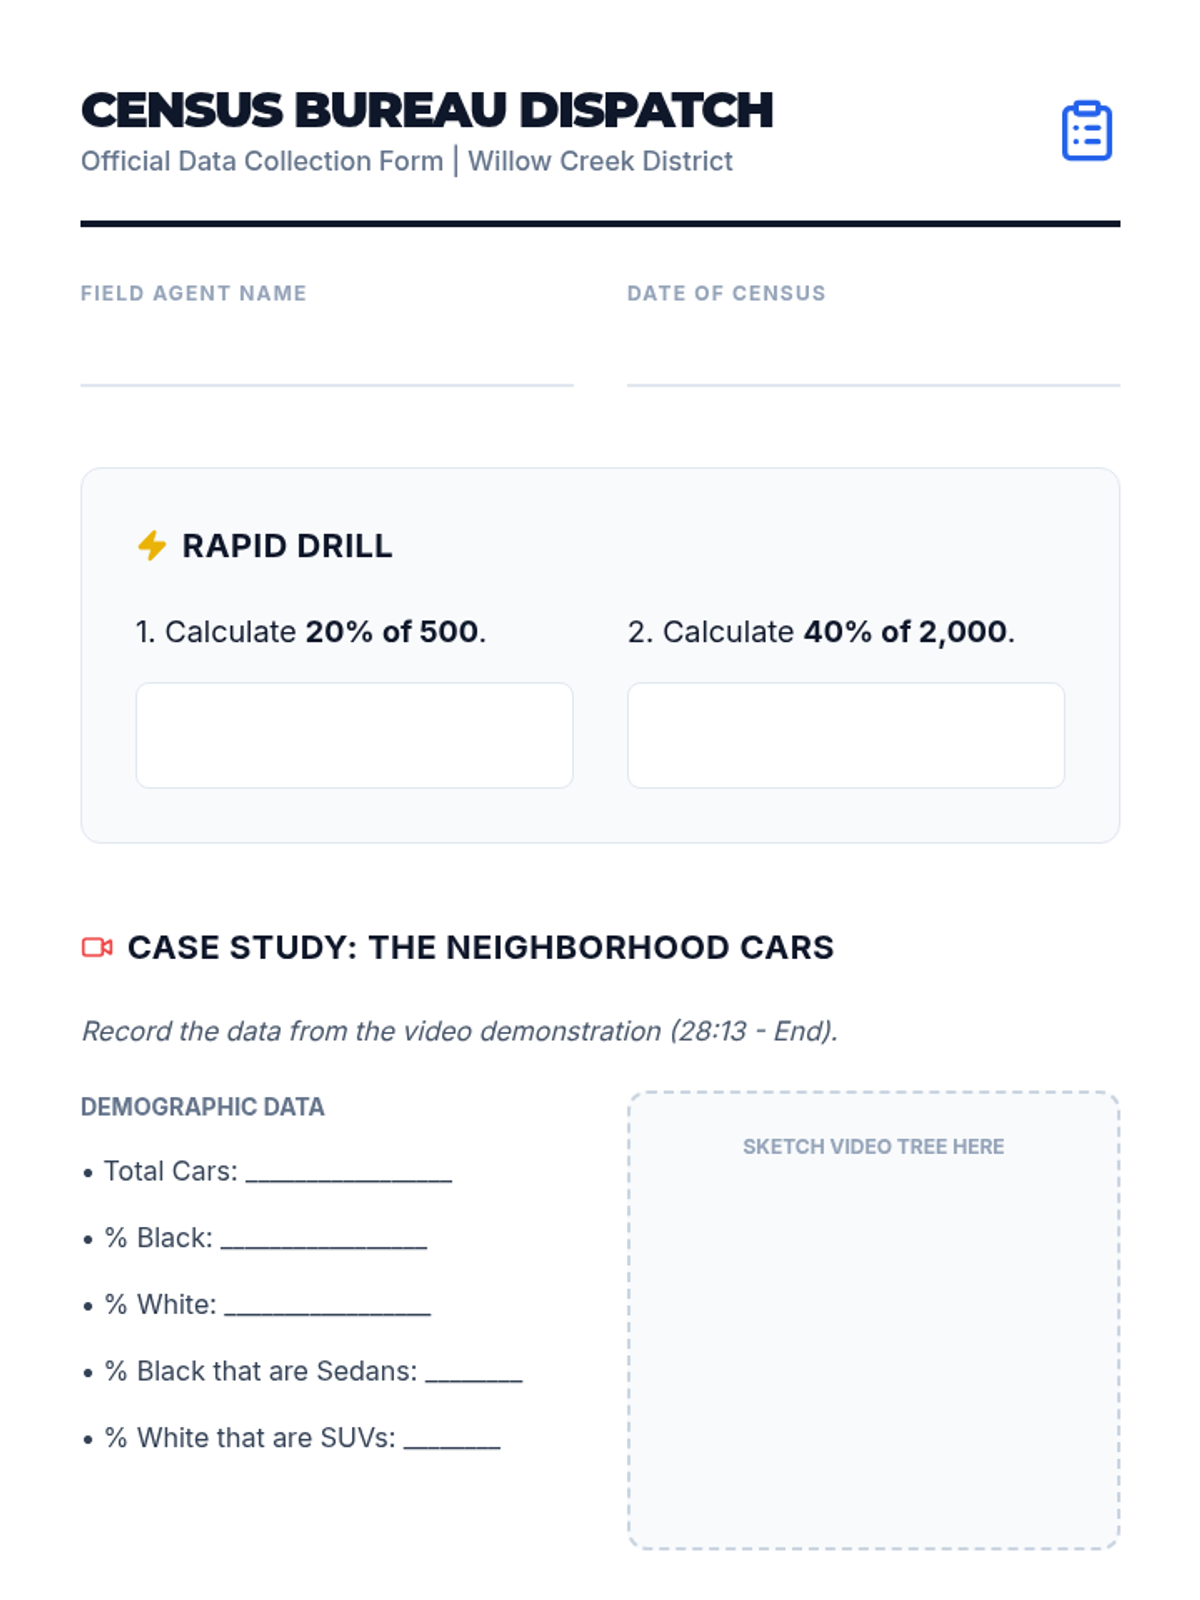
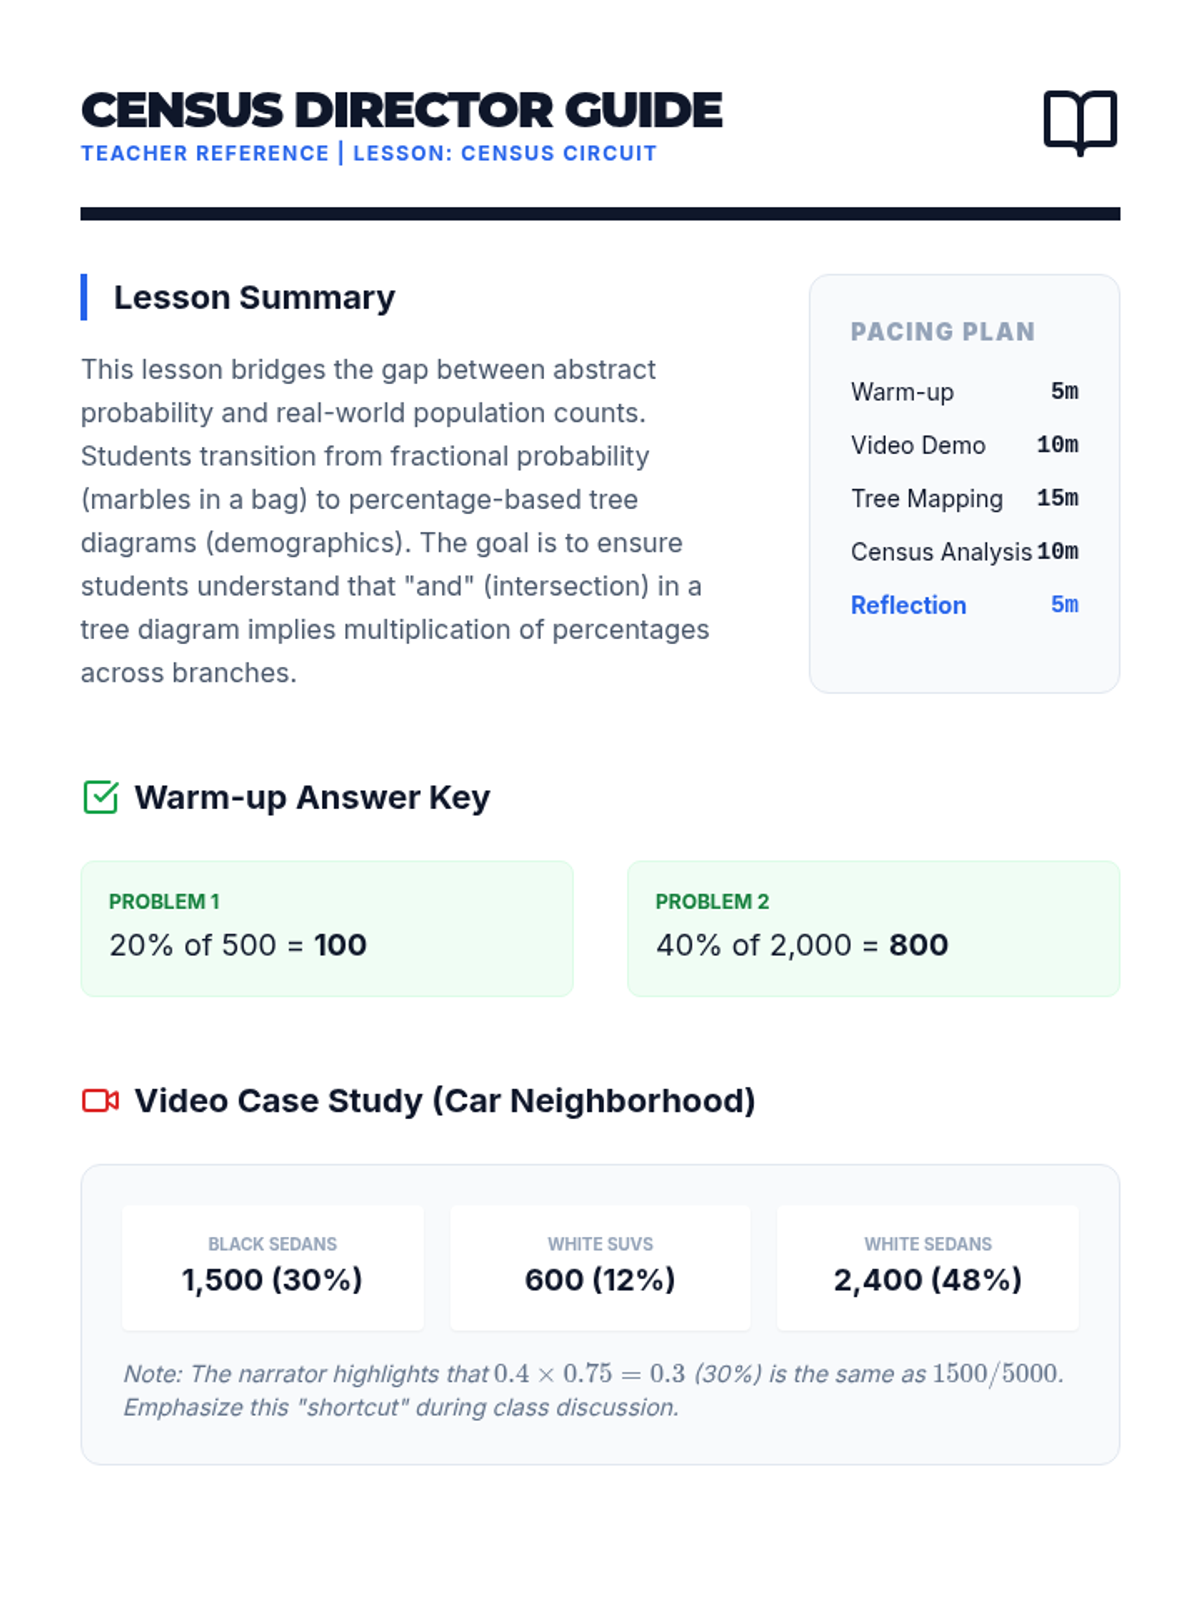
Students learn to construct and interpret probability tree diagrams using percentages and counts, grounded in a real-world census-themed activity. The lesson utilizes a detailed math tutorial video for direct instruction followed by a hands-on data interpretation task.
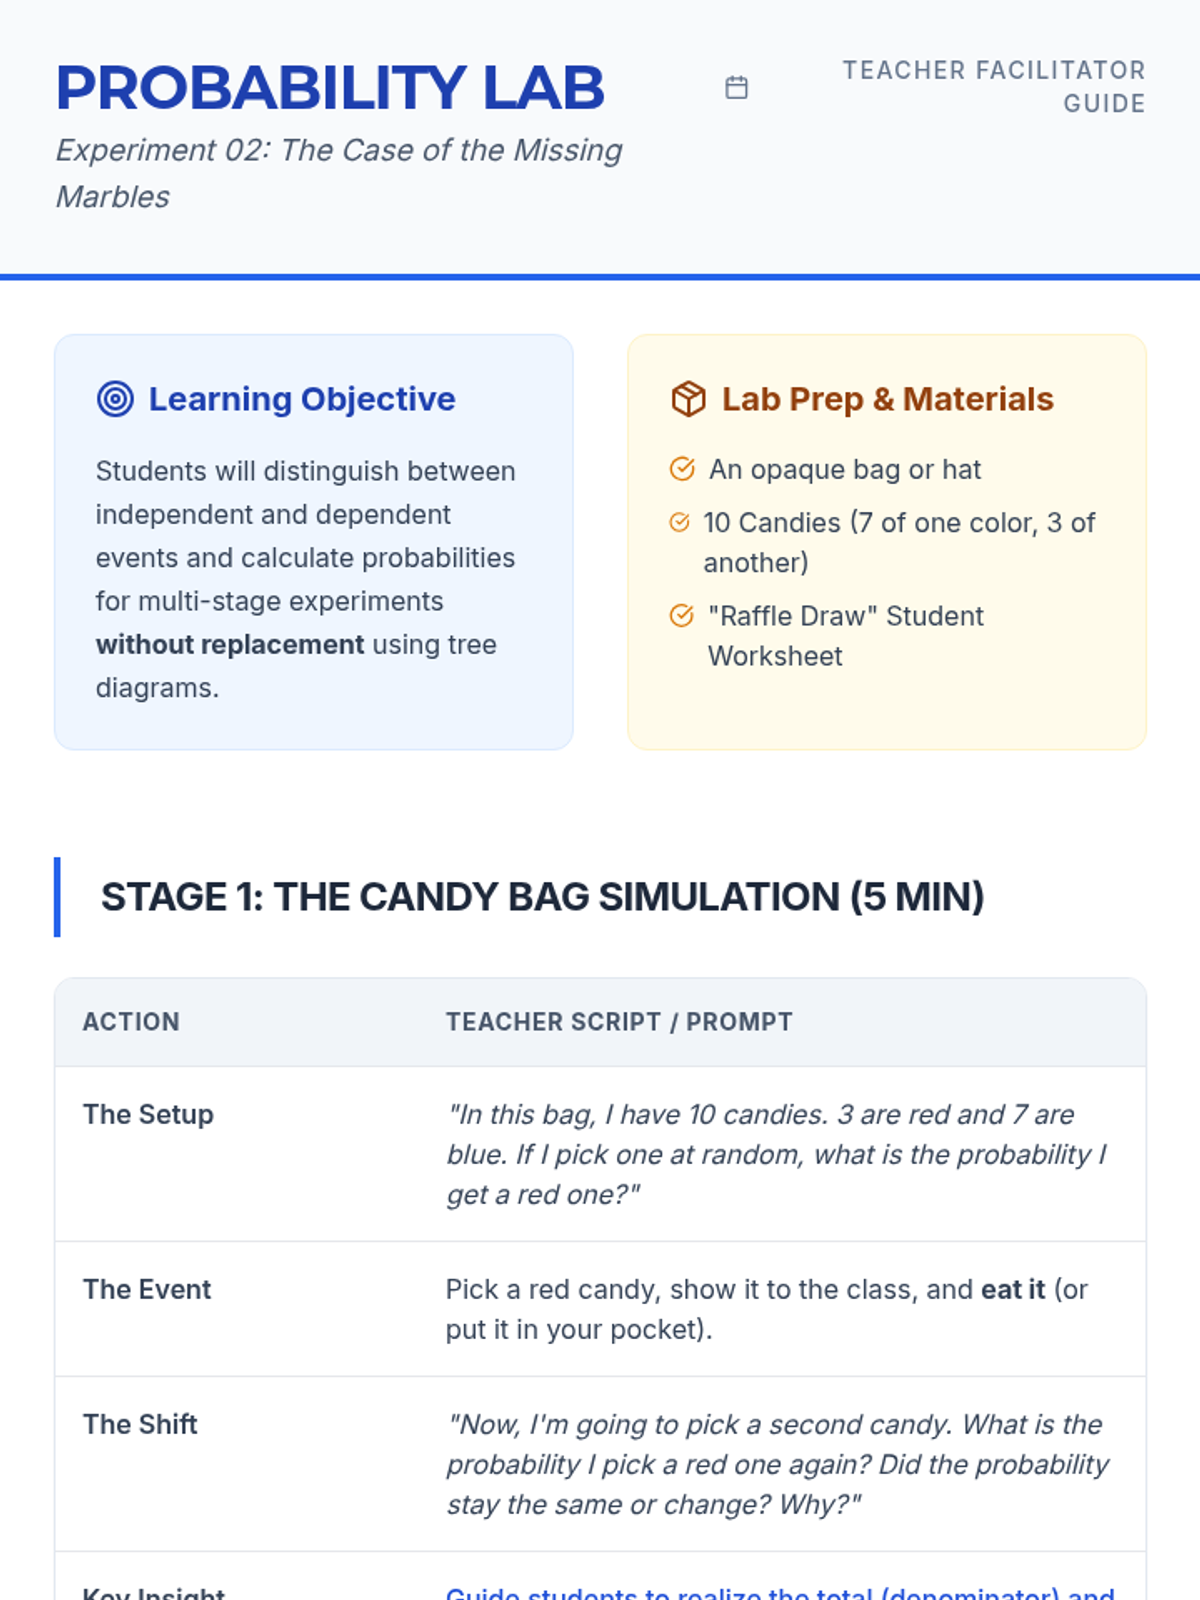
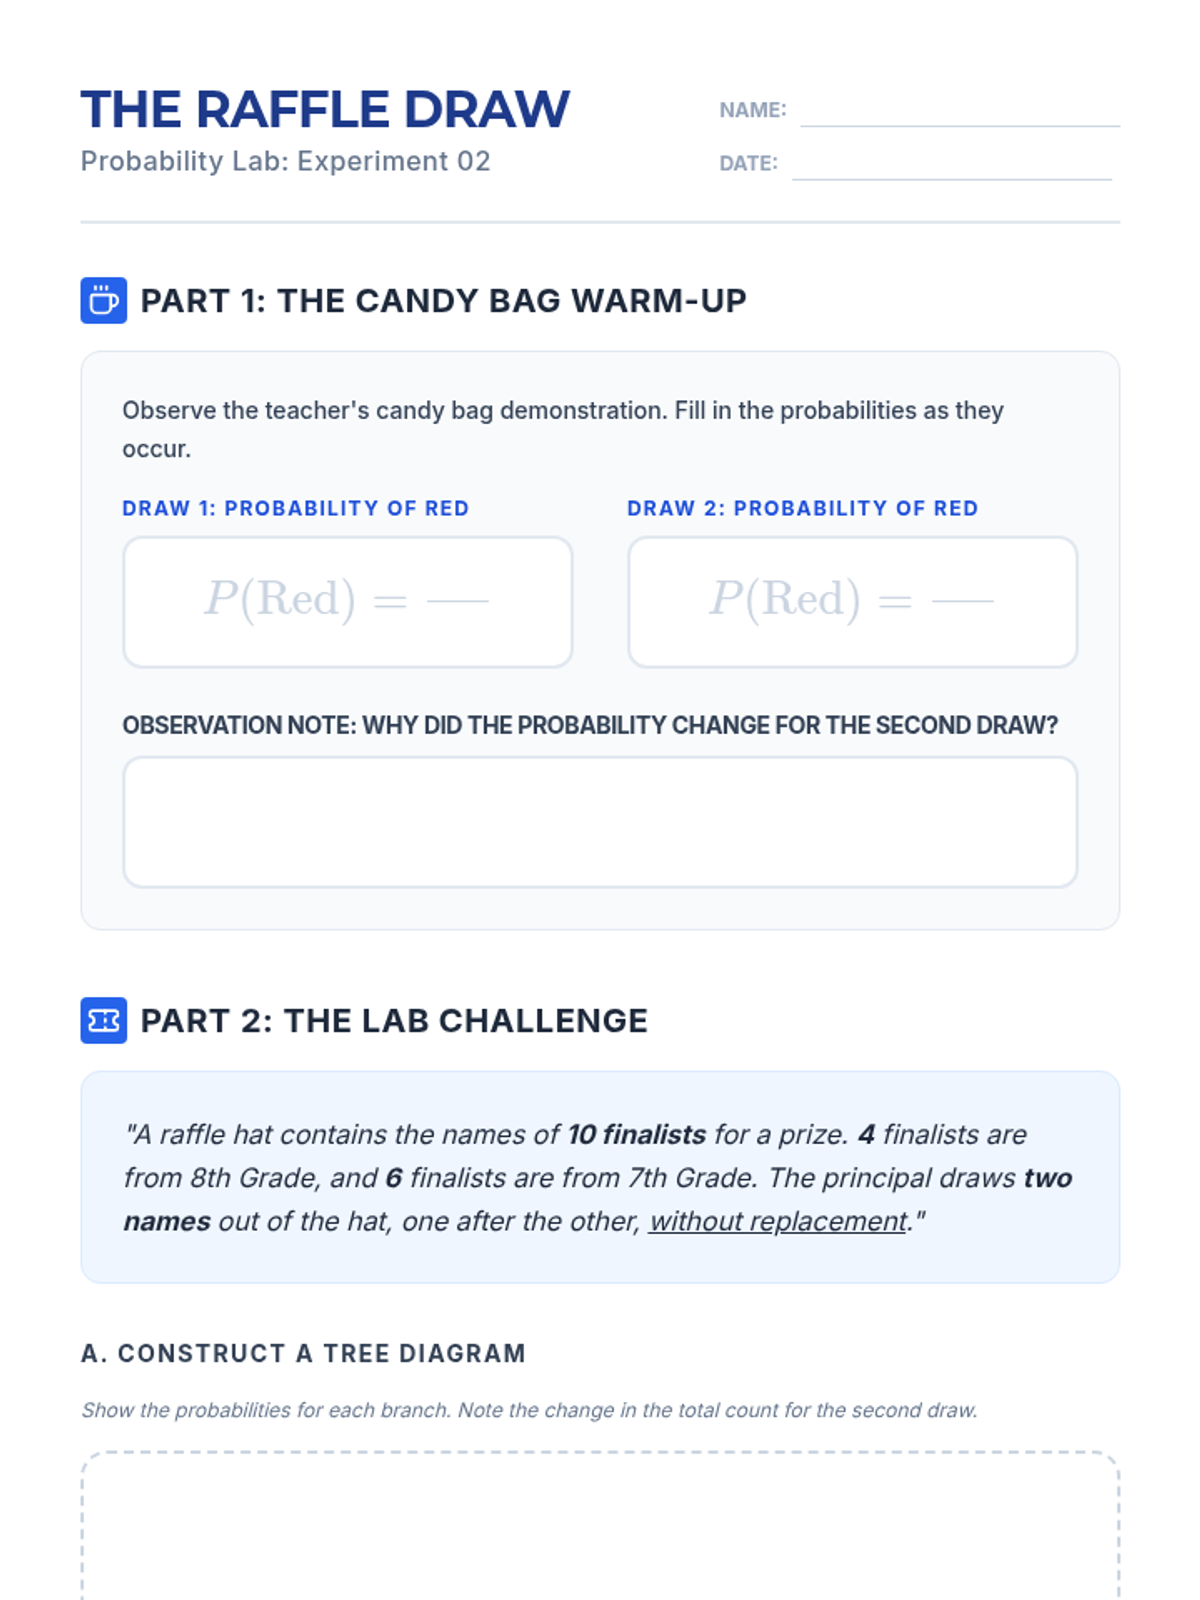
Students will learn to distinguish between independent and dependent events by exploring how probabilities change when items are not replaced, using tree diagrams to visualize outcomes.
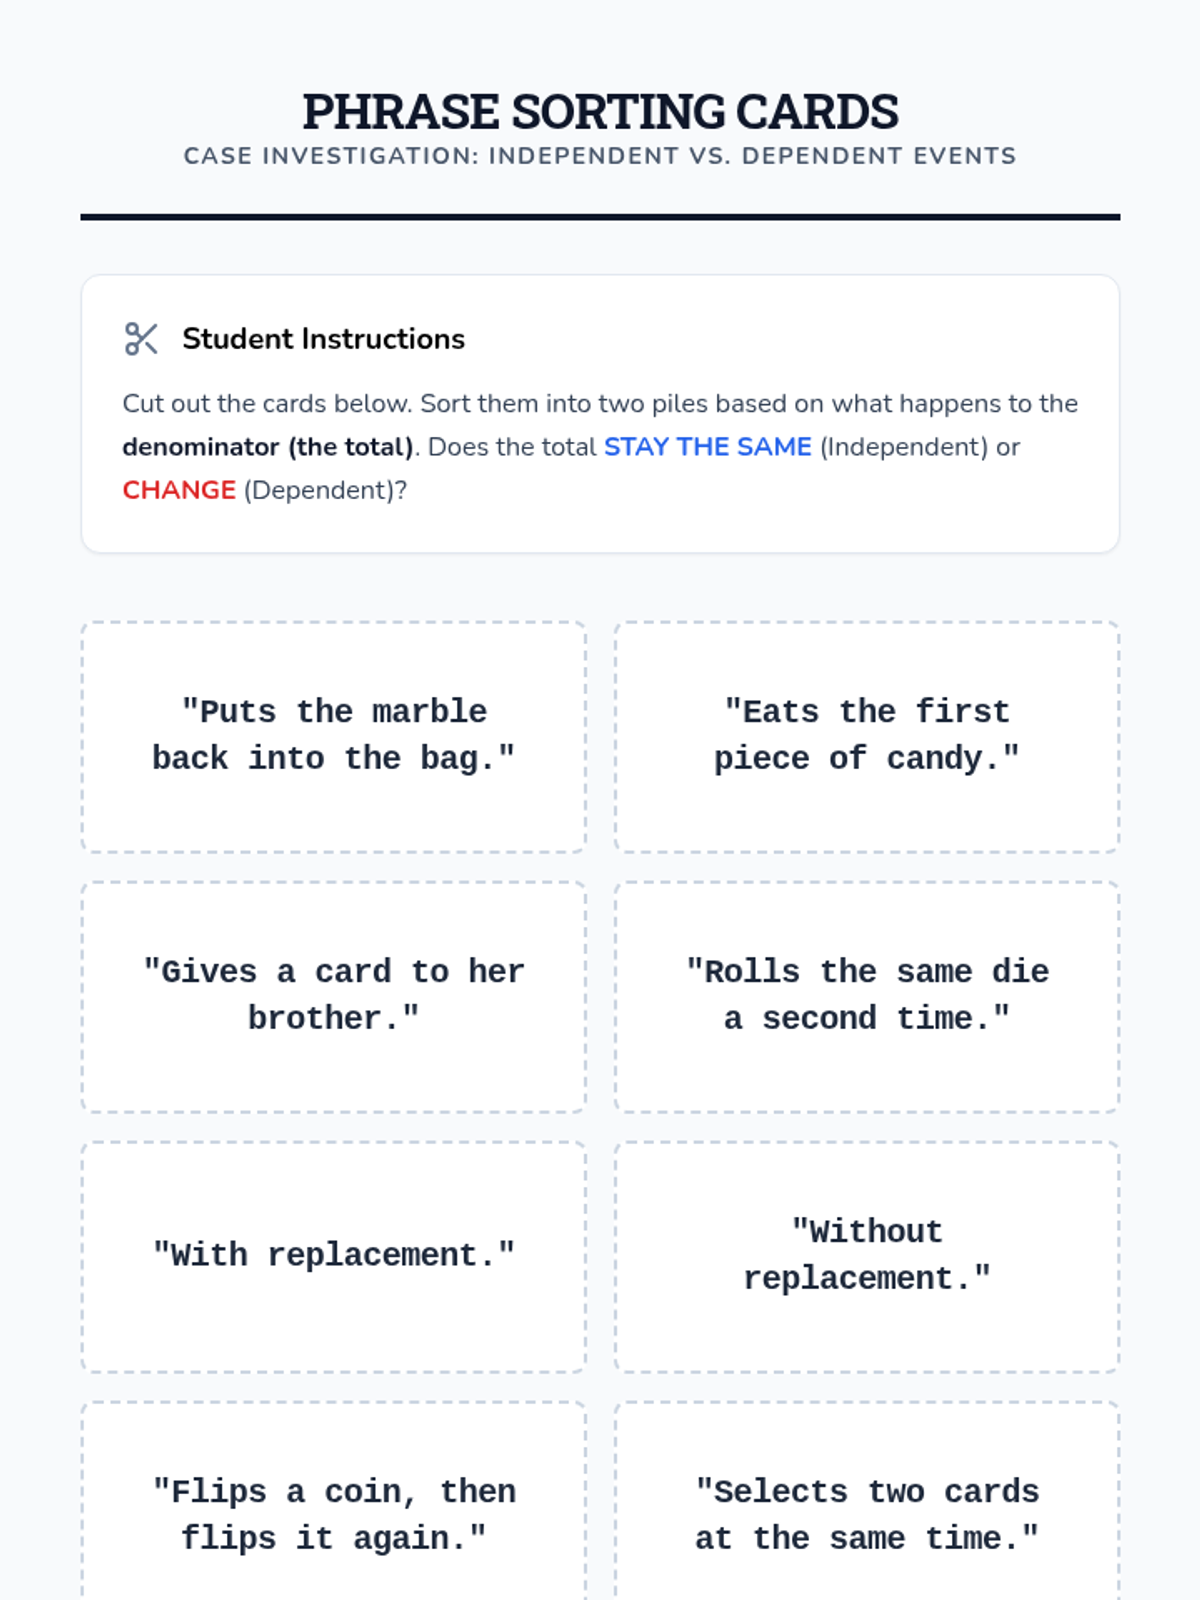
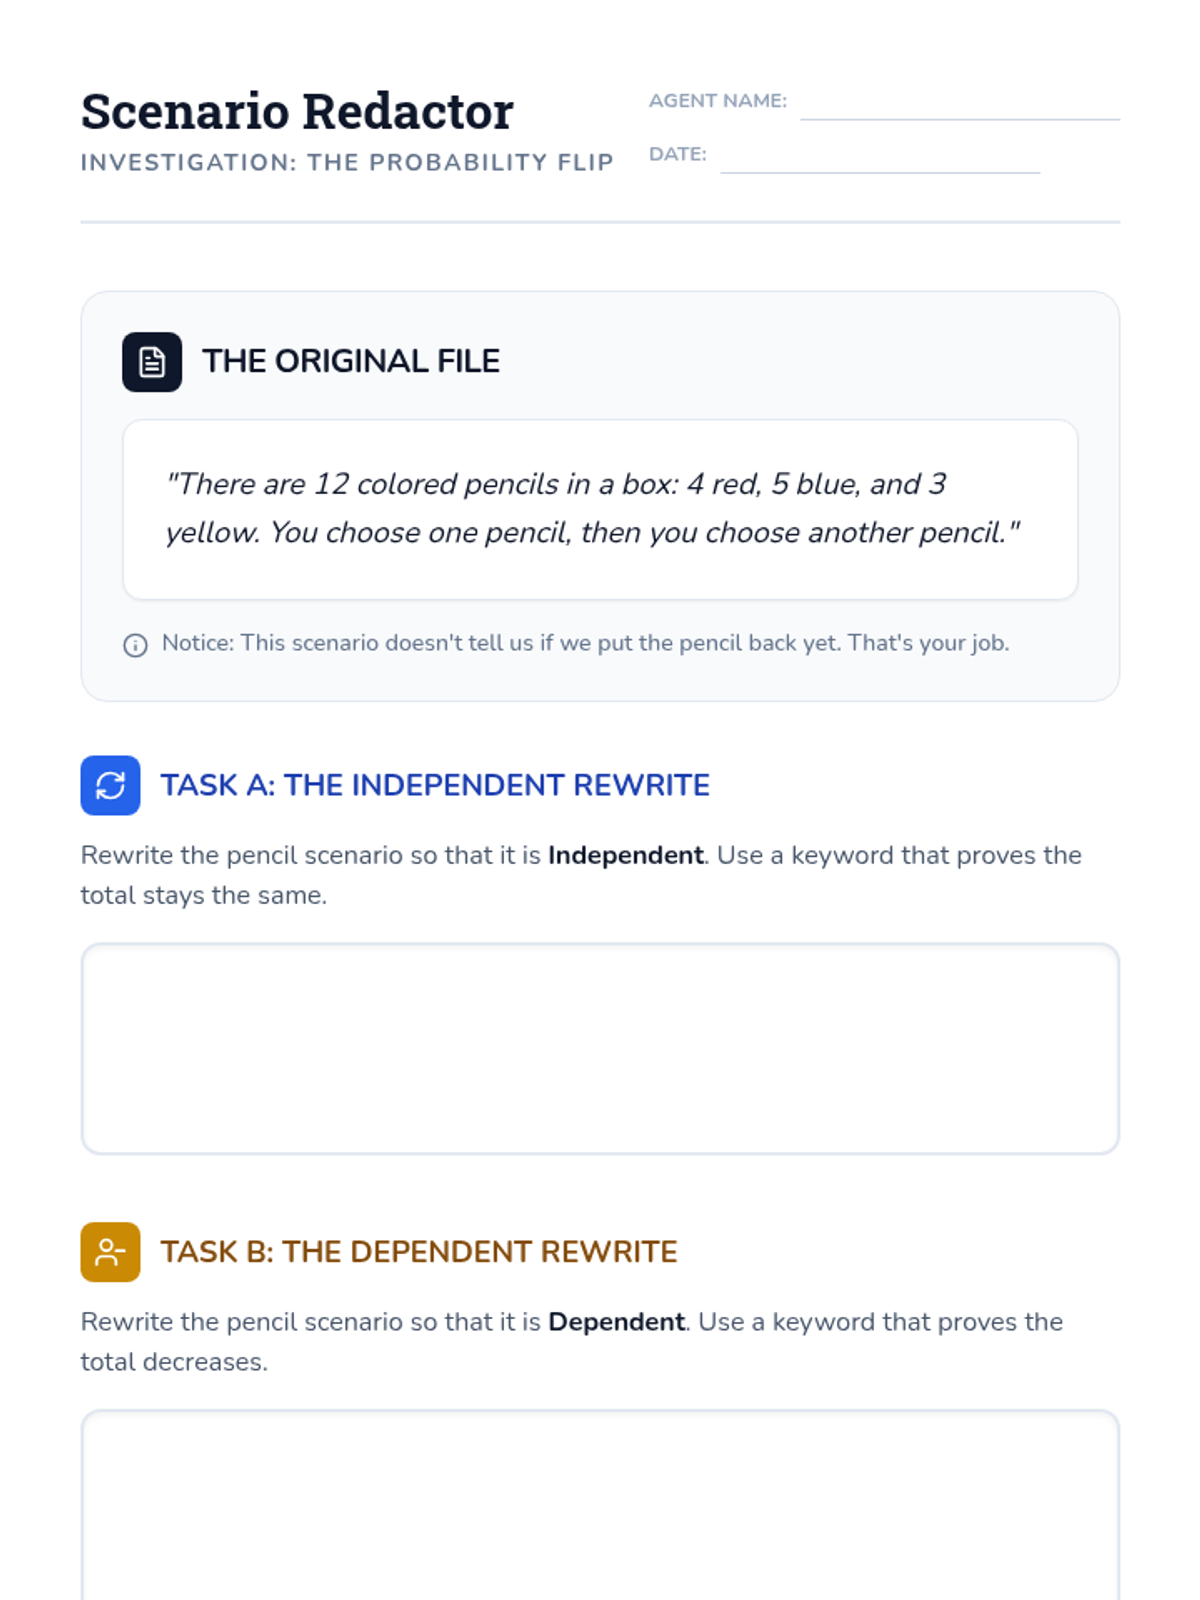
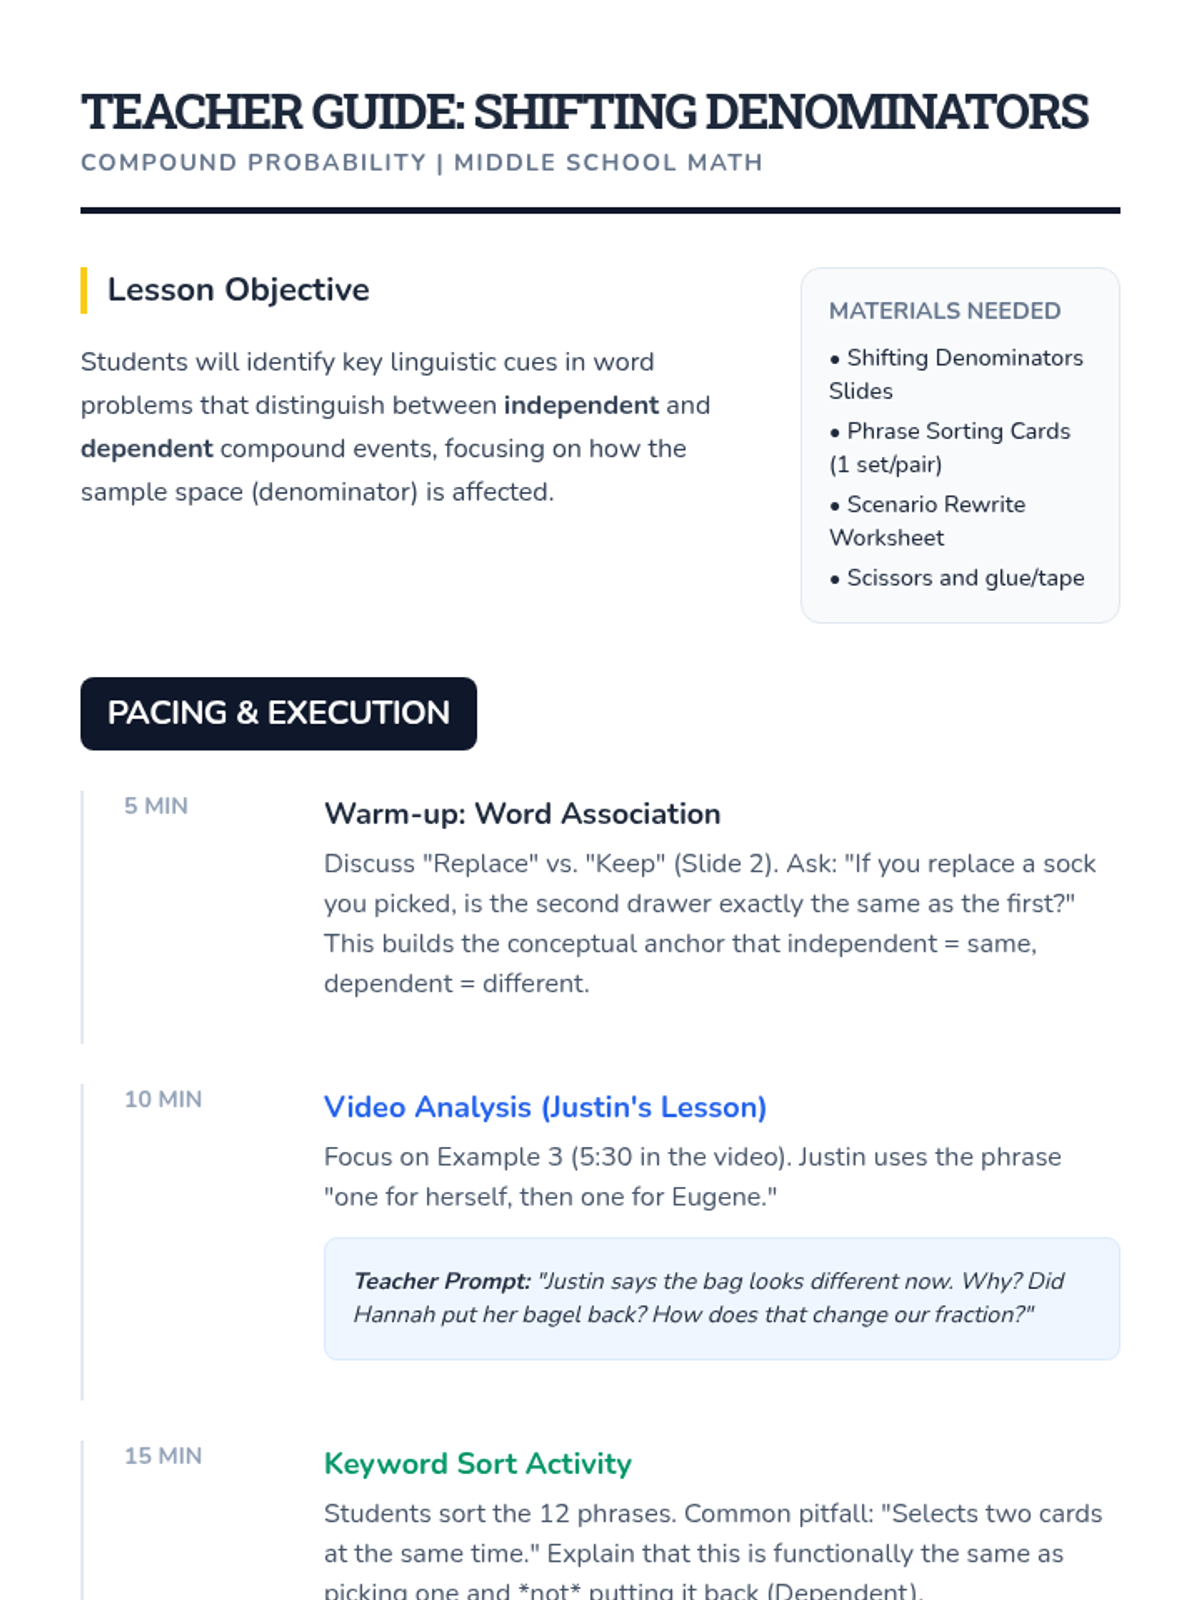
A middle school math lesson focused on identifying the linguistic cues that distinguish independent from dependent compound events in word problems. Students analyze scenarios to see how the sample space changes (or doesn't) based on specific keywords.
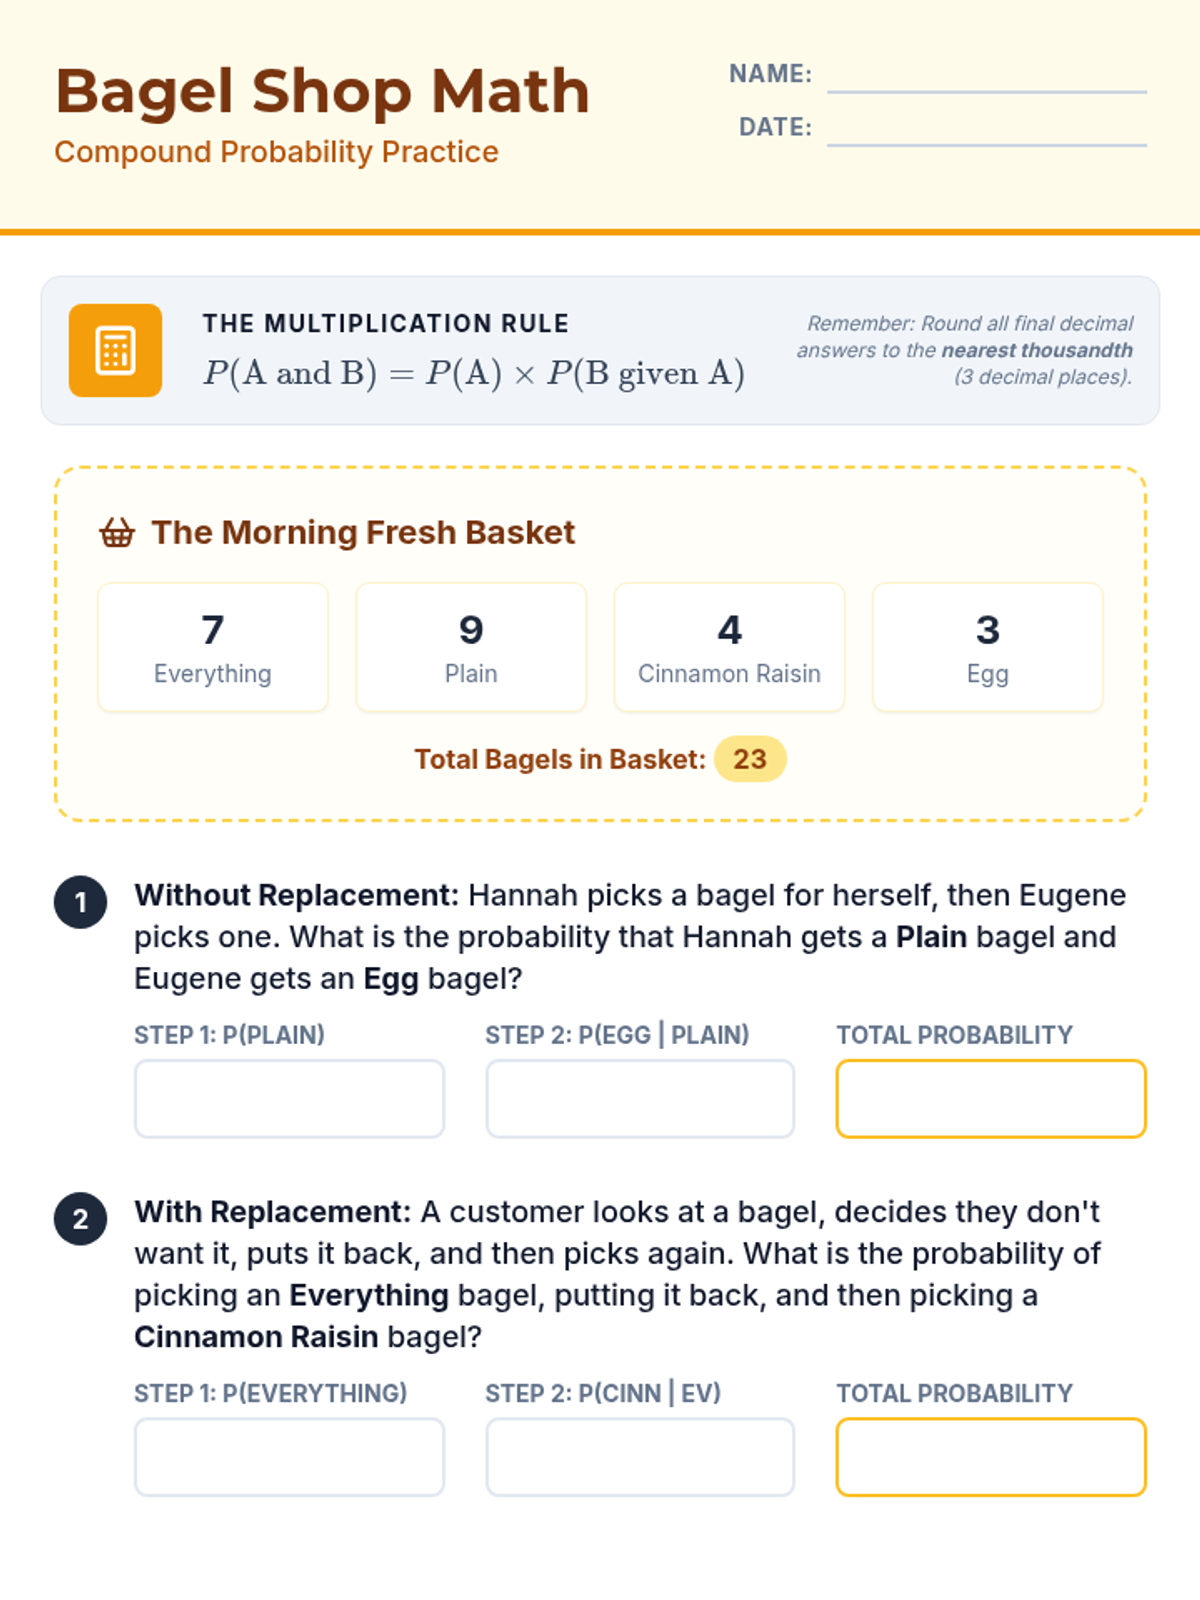
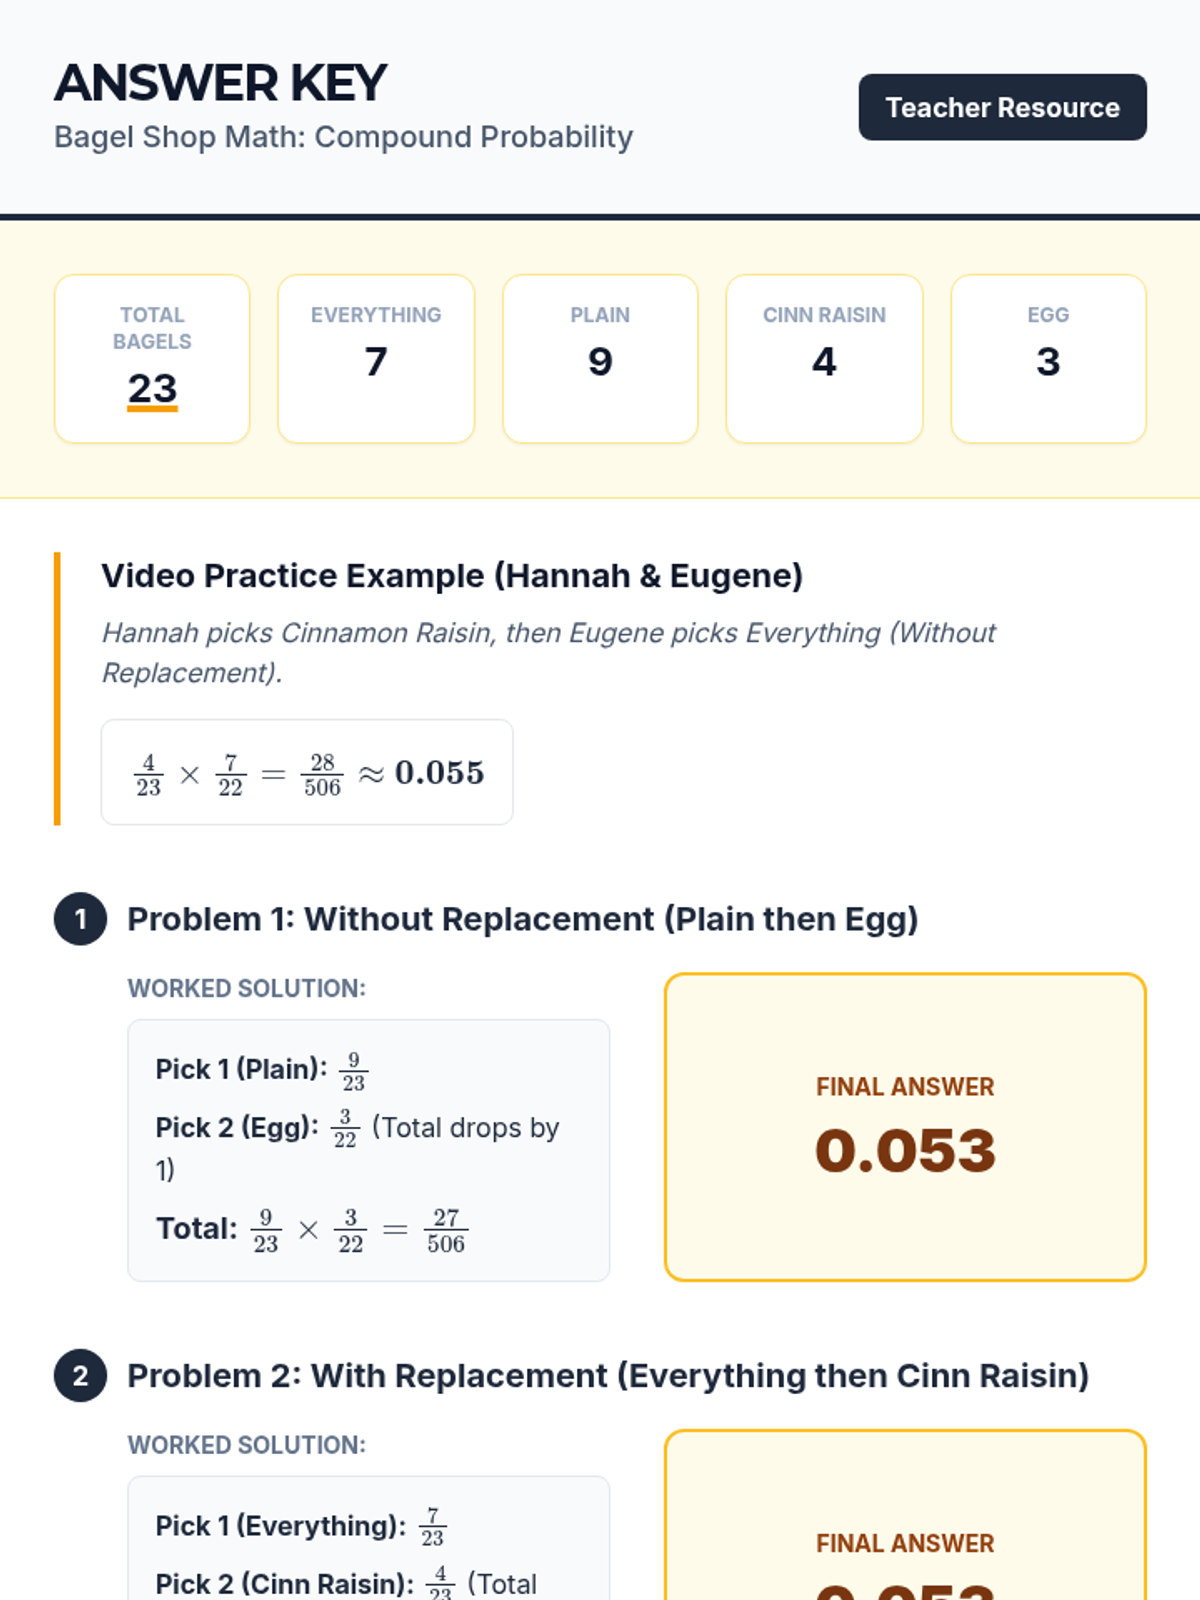
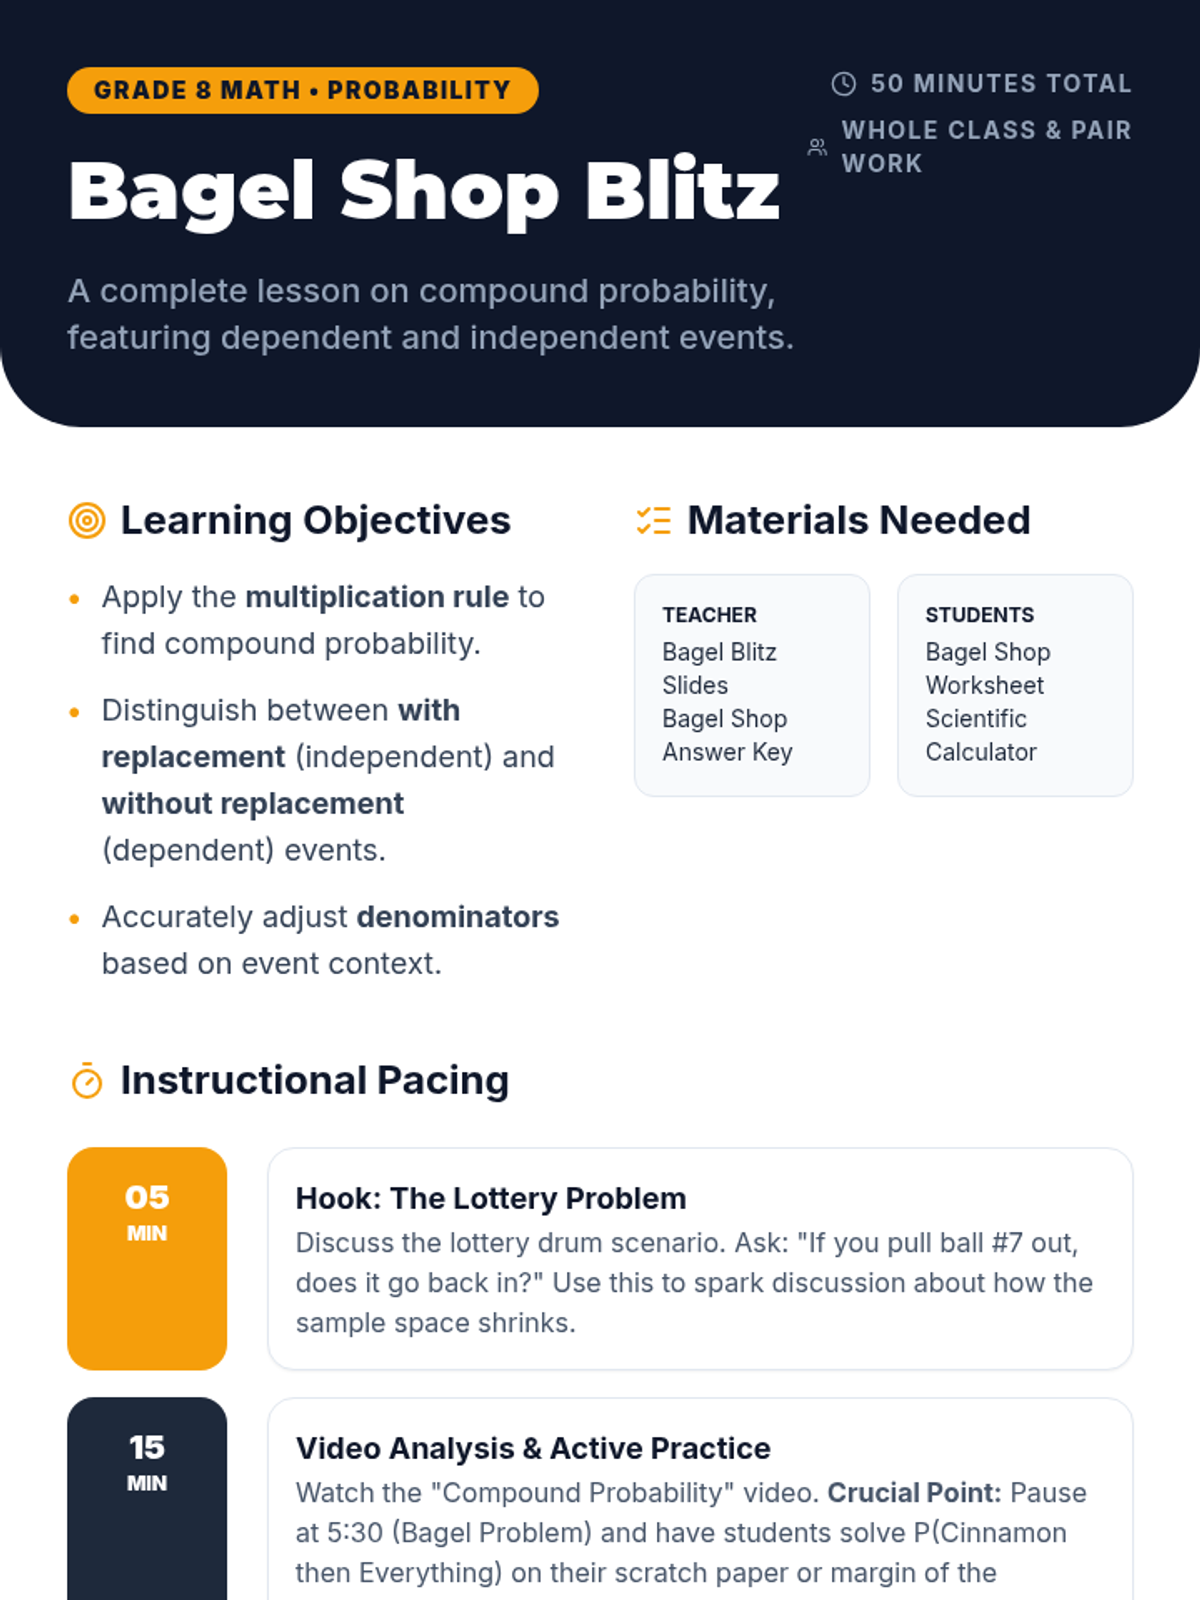
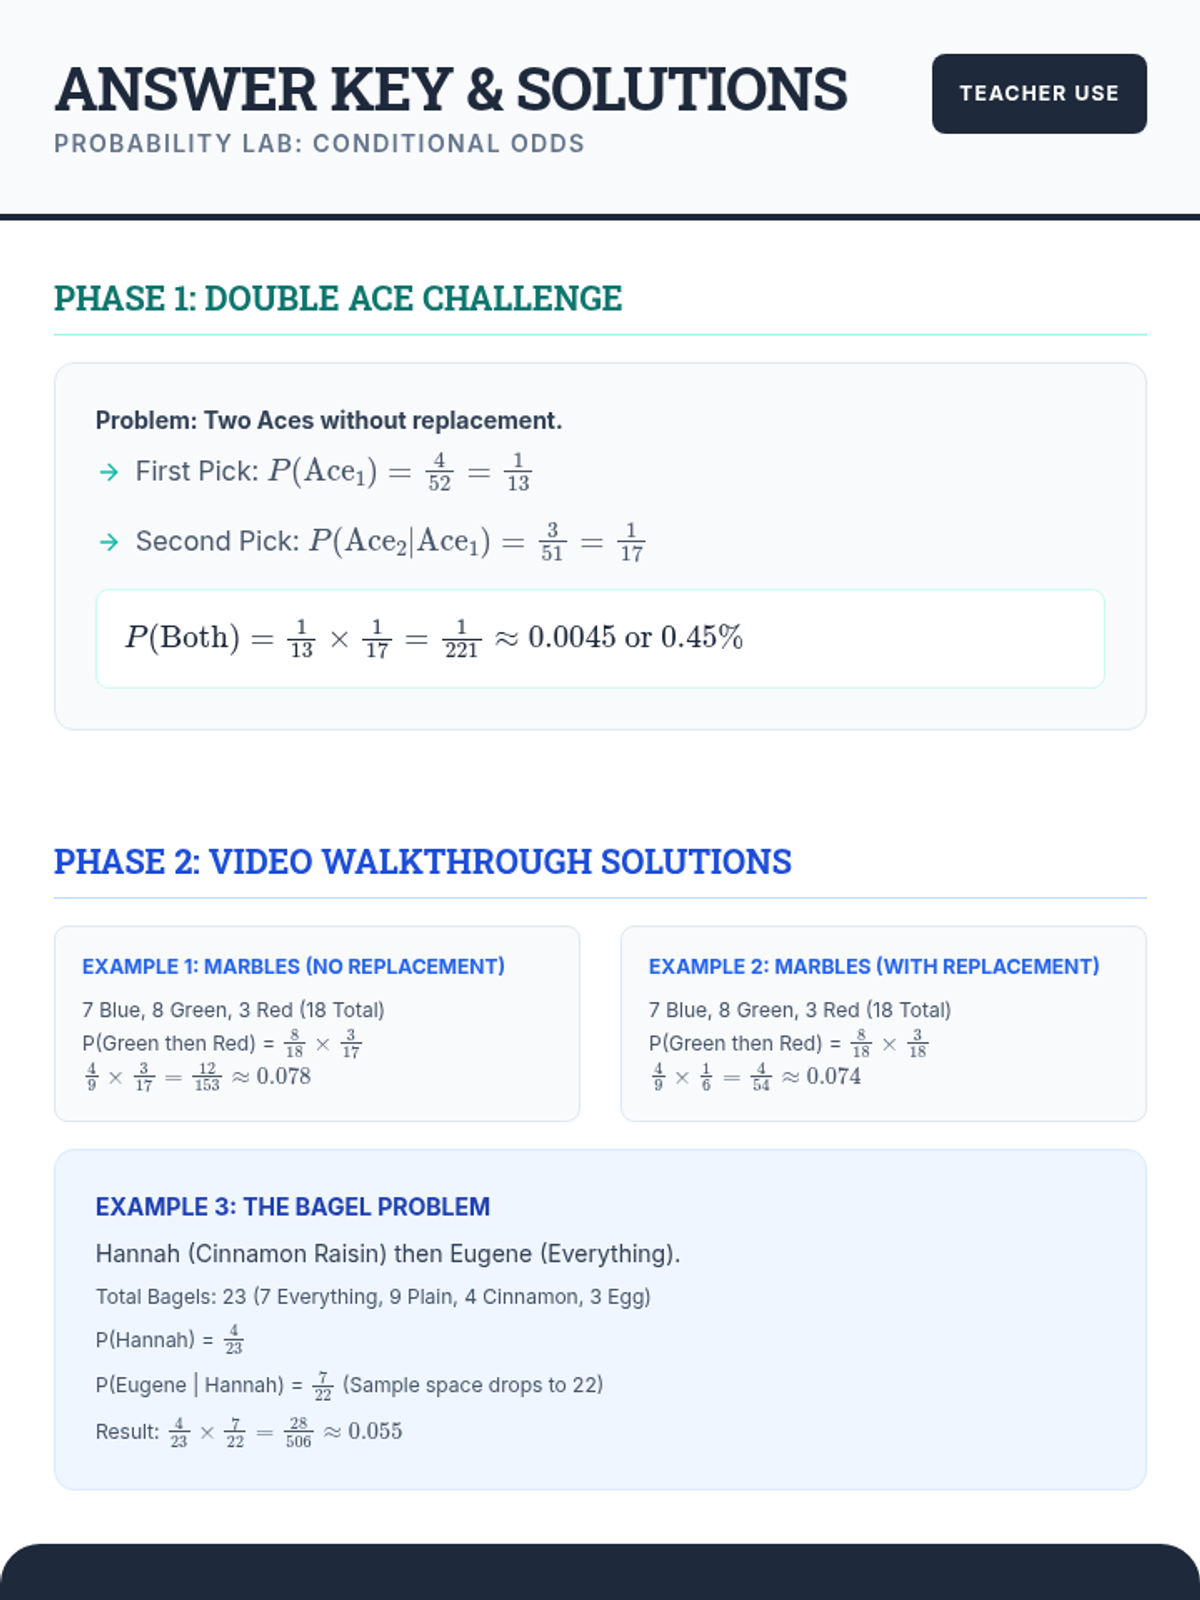
A comprehensive lesson on compound probability where students use the multiplication rule to solve problems involving independent and dependent events, themed around a bagel shop.
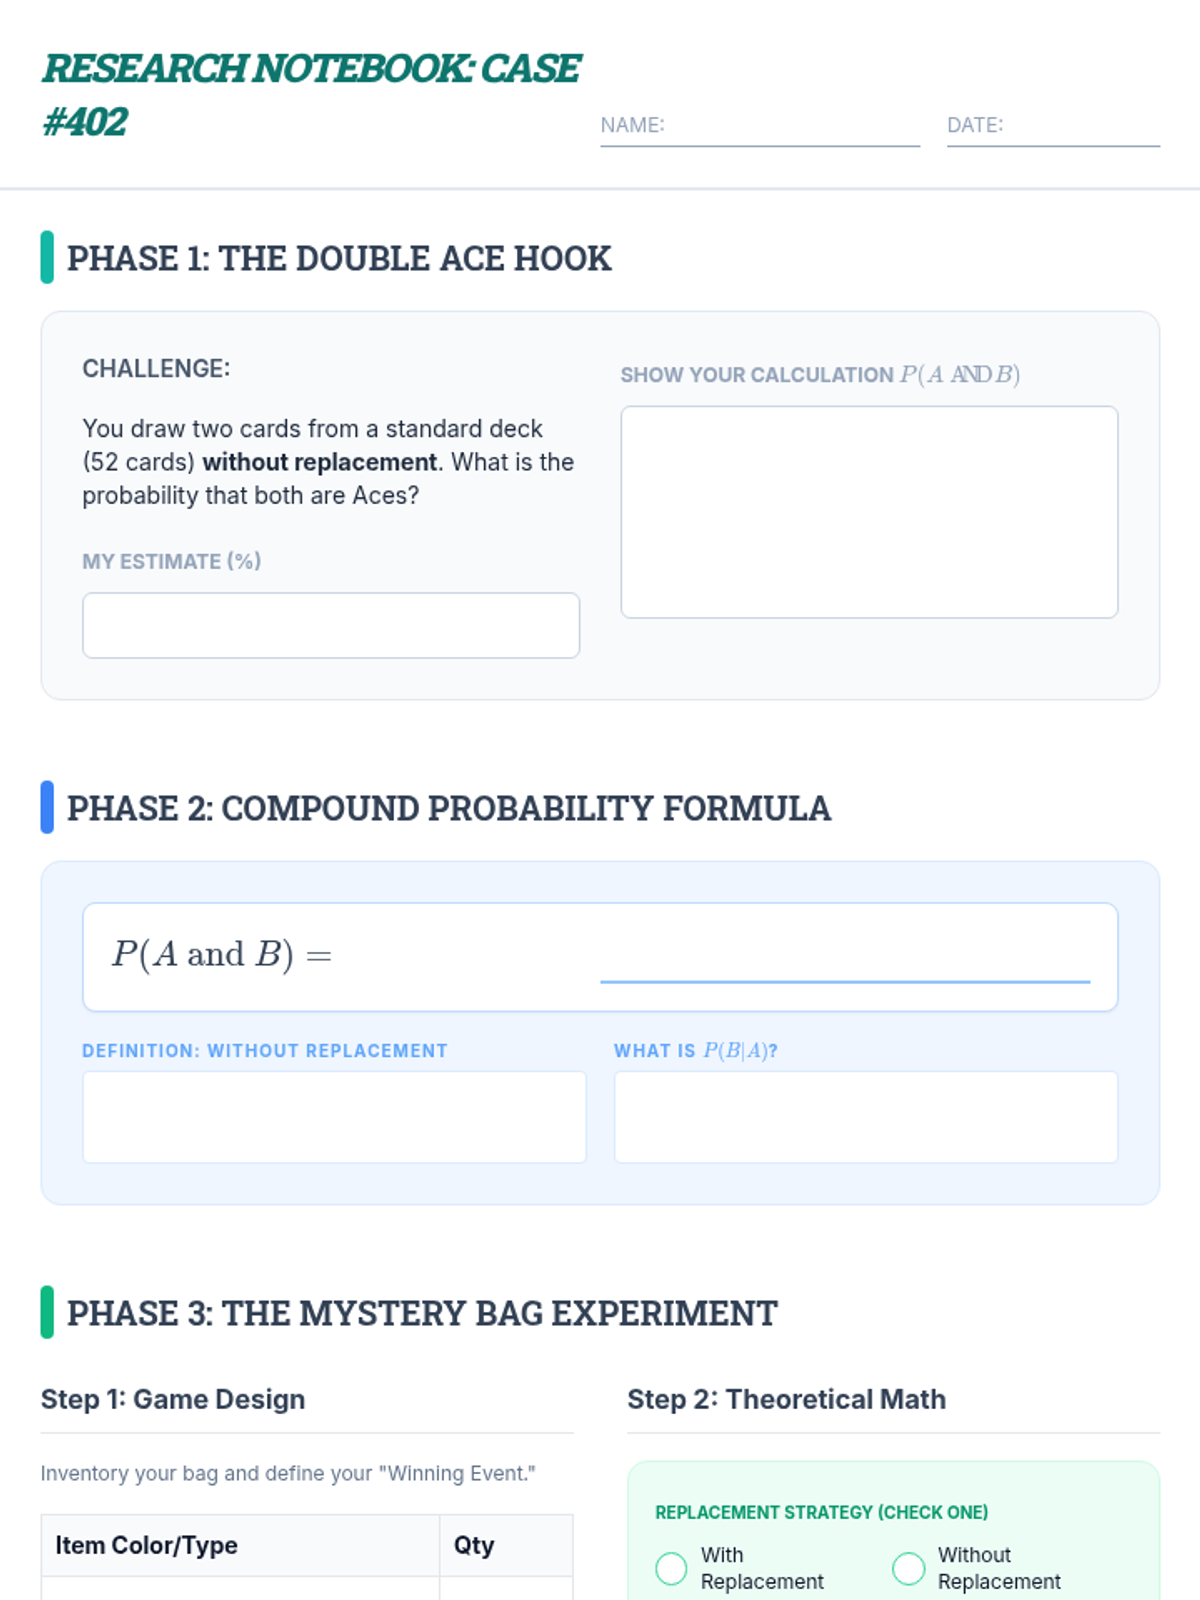
A high-level honors probability lesson where students explore compound events through card challenges, a structured video review, and a hands-on 'Mystery Bag' experiment comparing theoretical models to experimental data.
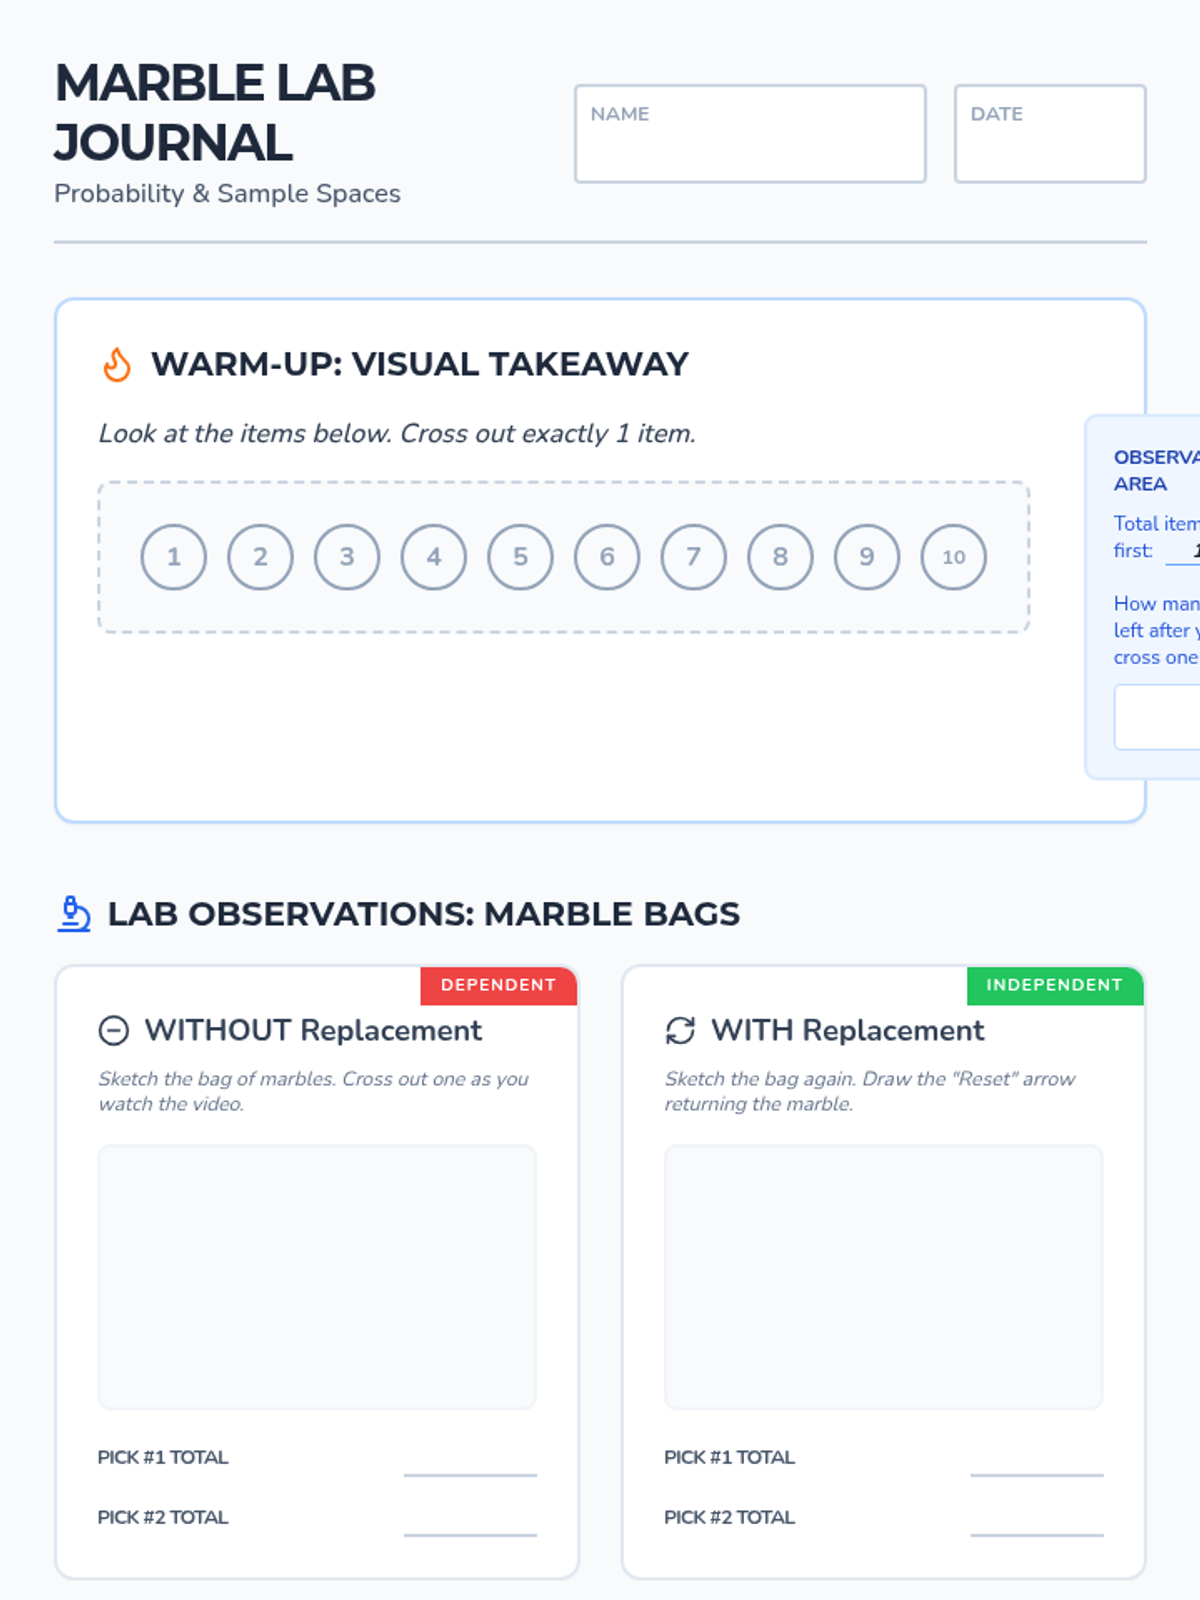
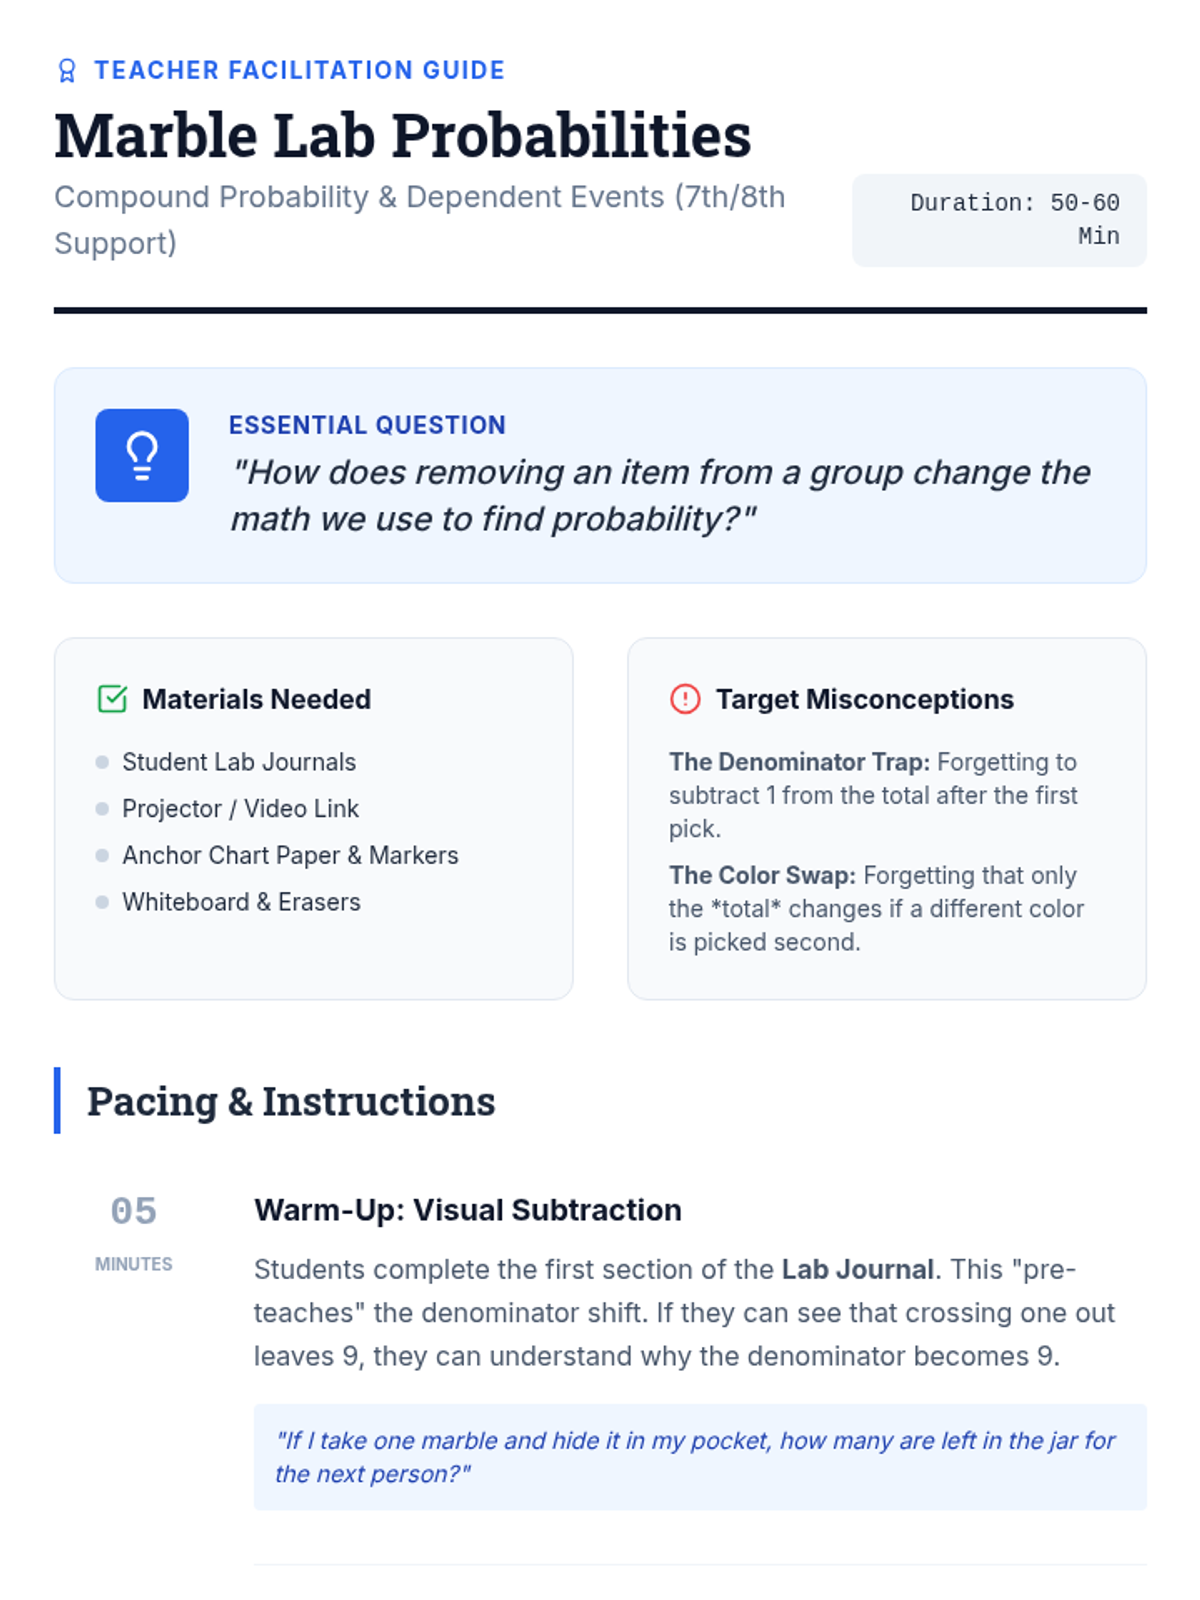
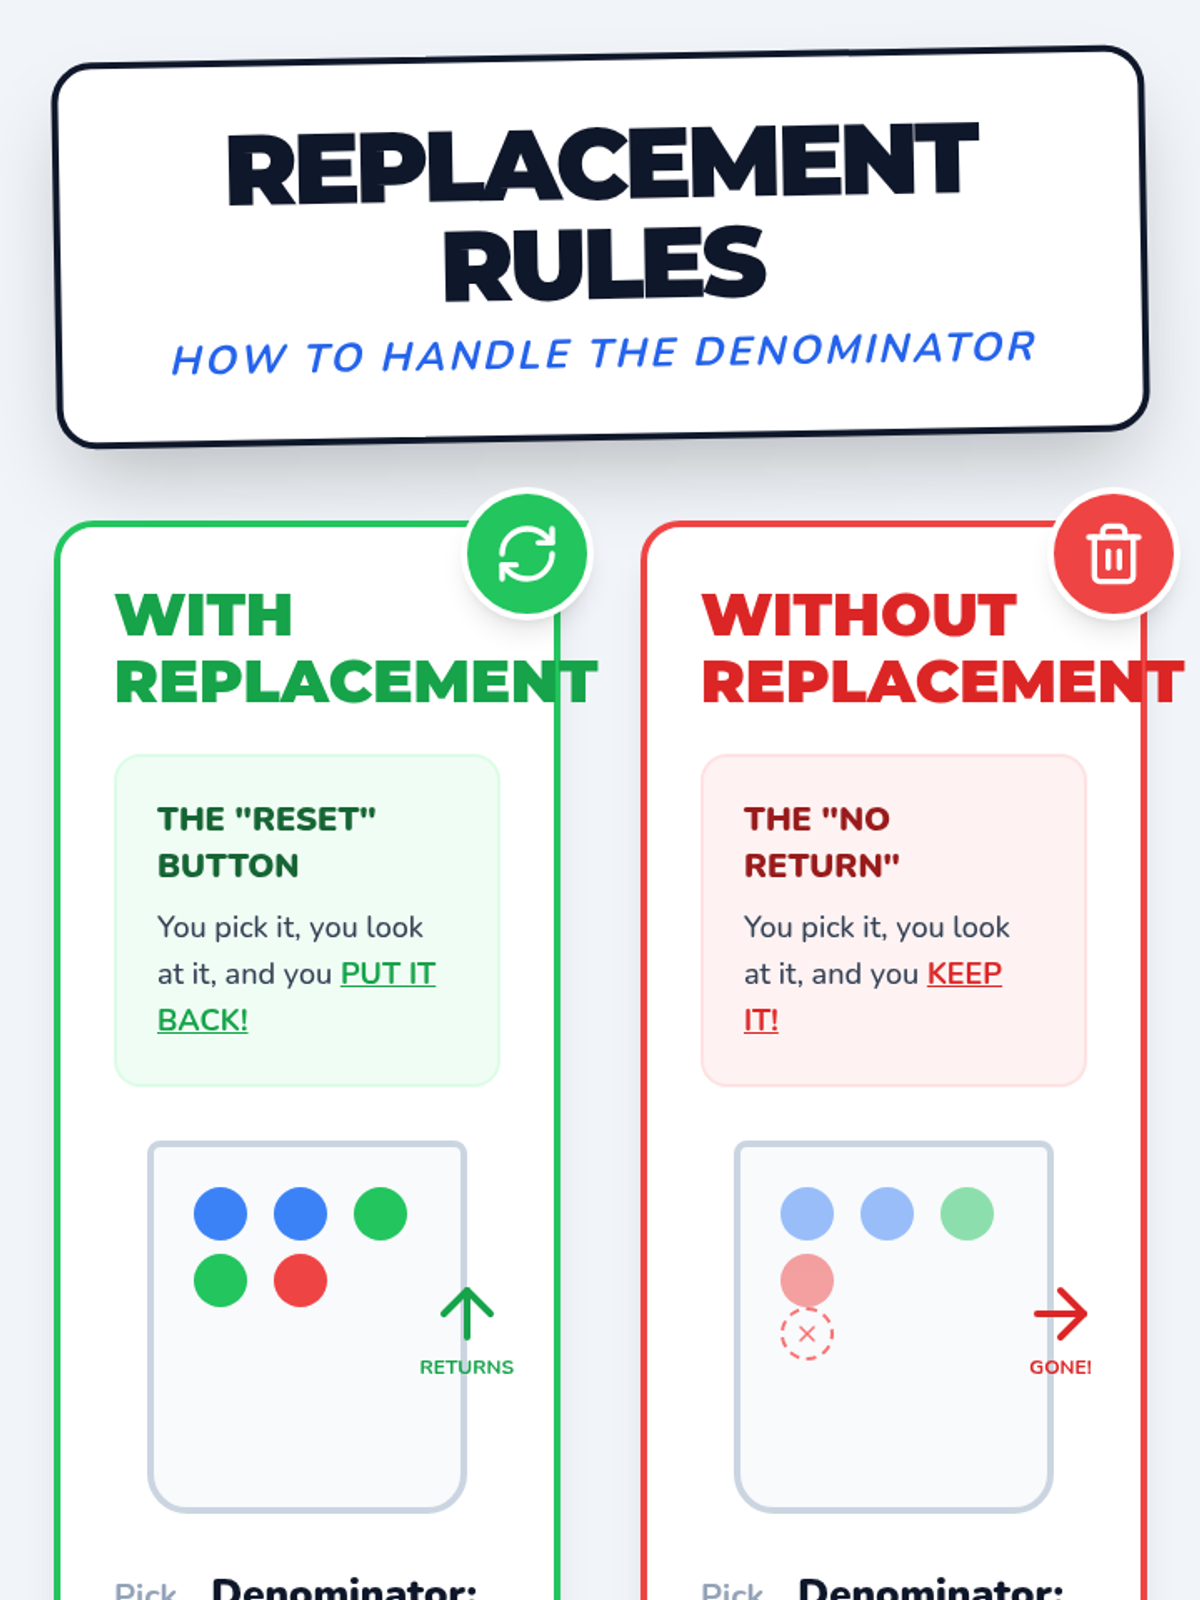
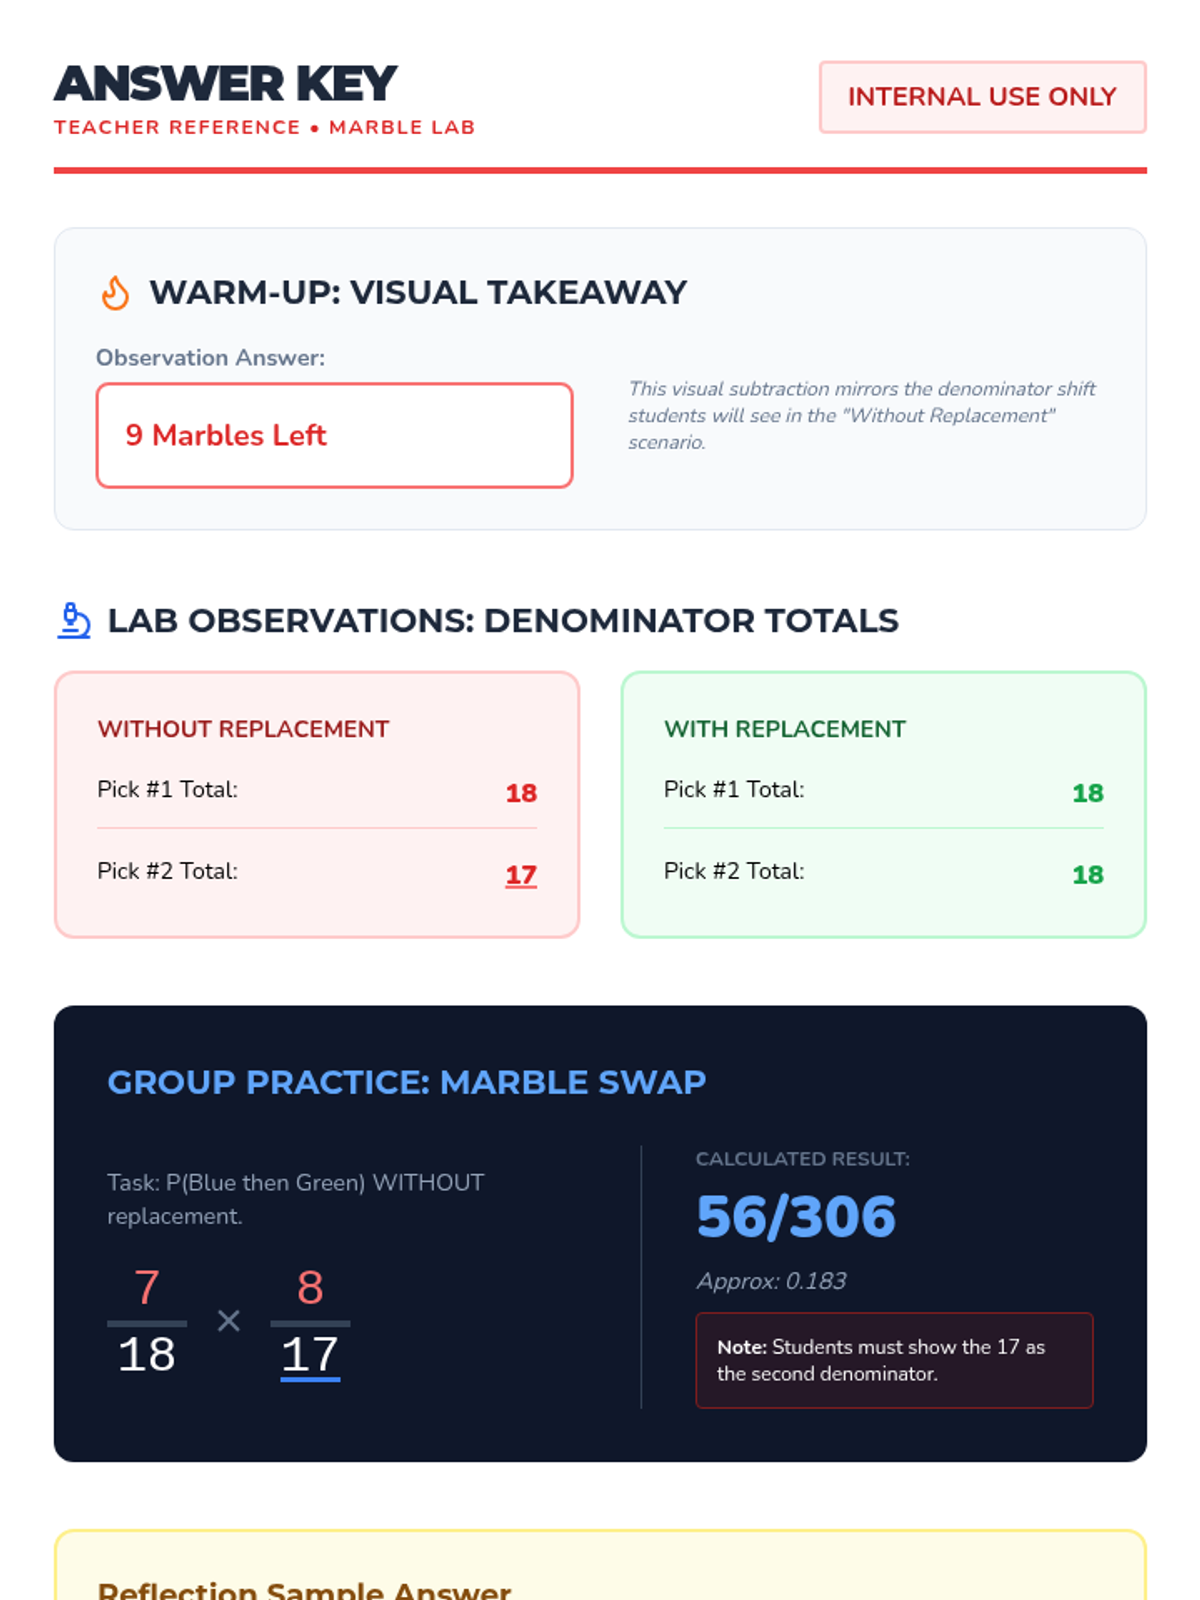
A visual exploration of compound probability, focusing on how 'without replacement' scenarios change the sample space. Students use a marble jar motif to track denominator shifts during a guided video viewing and collaborative practice.
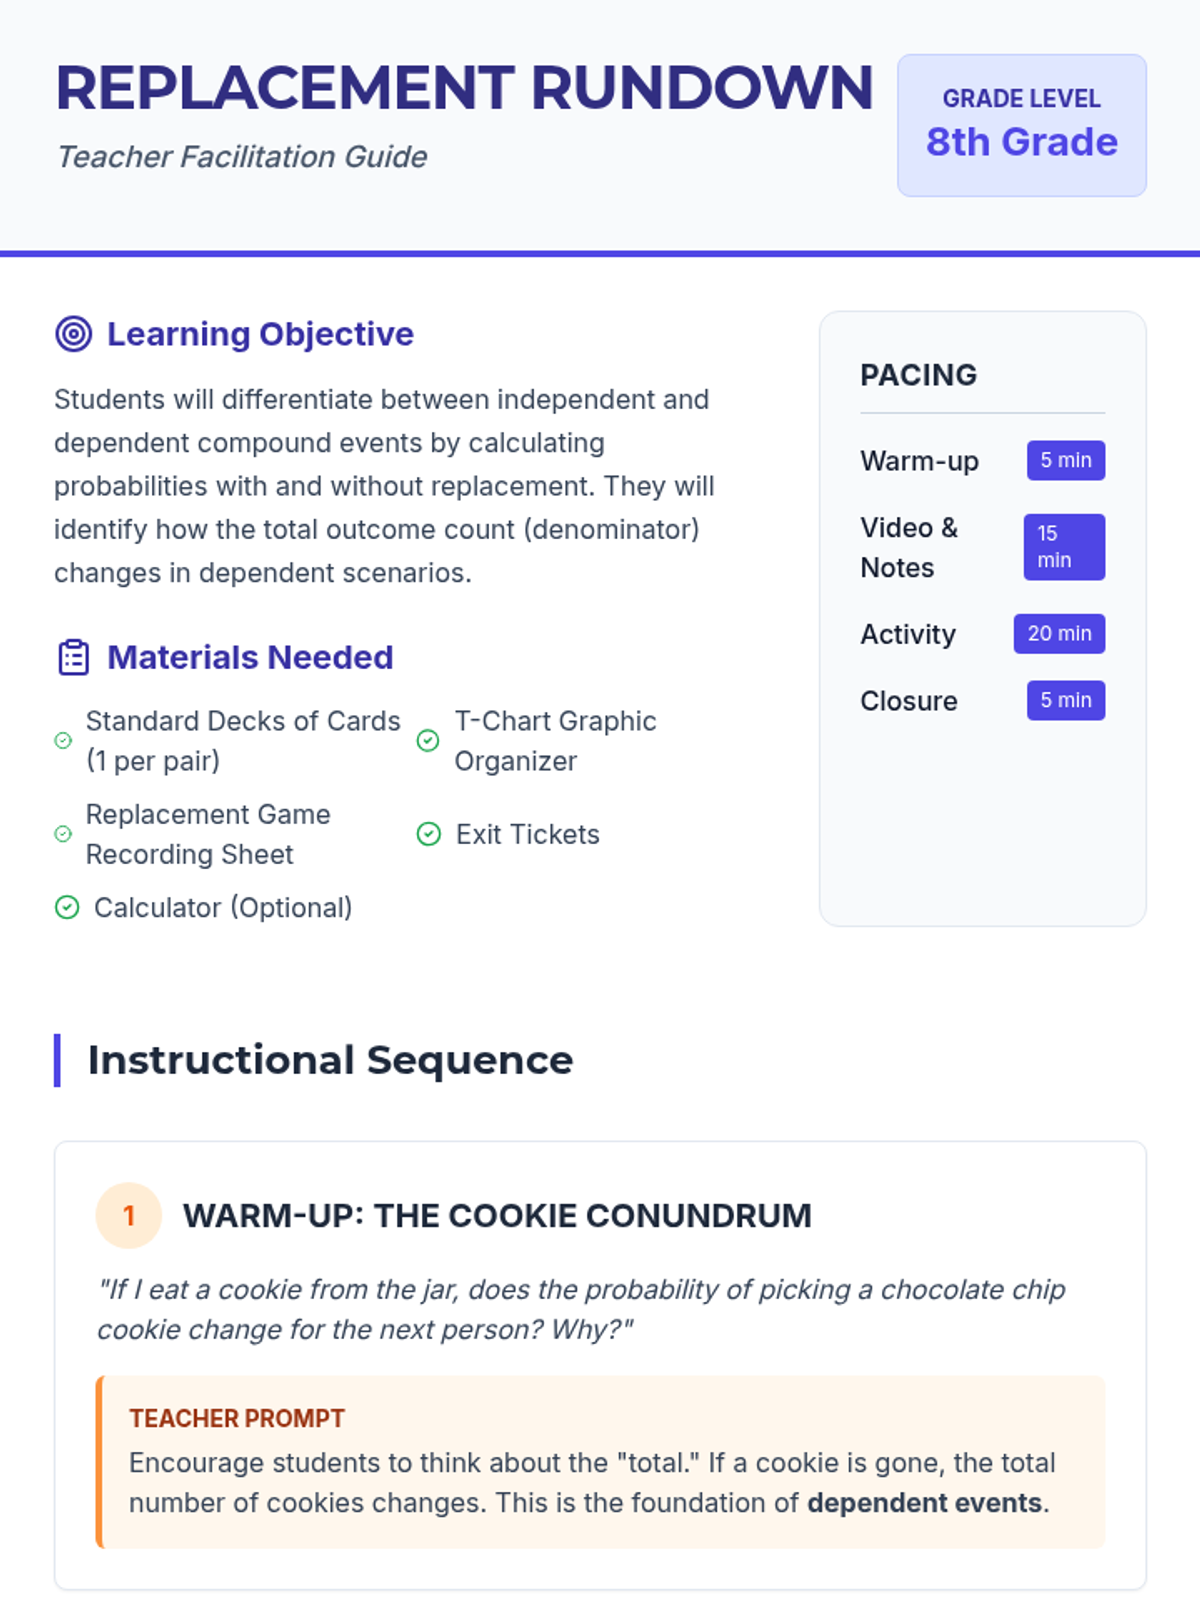
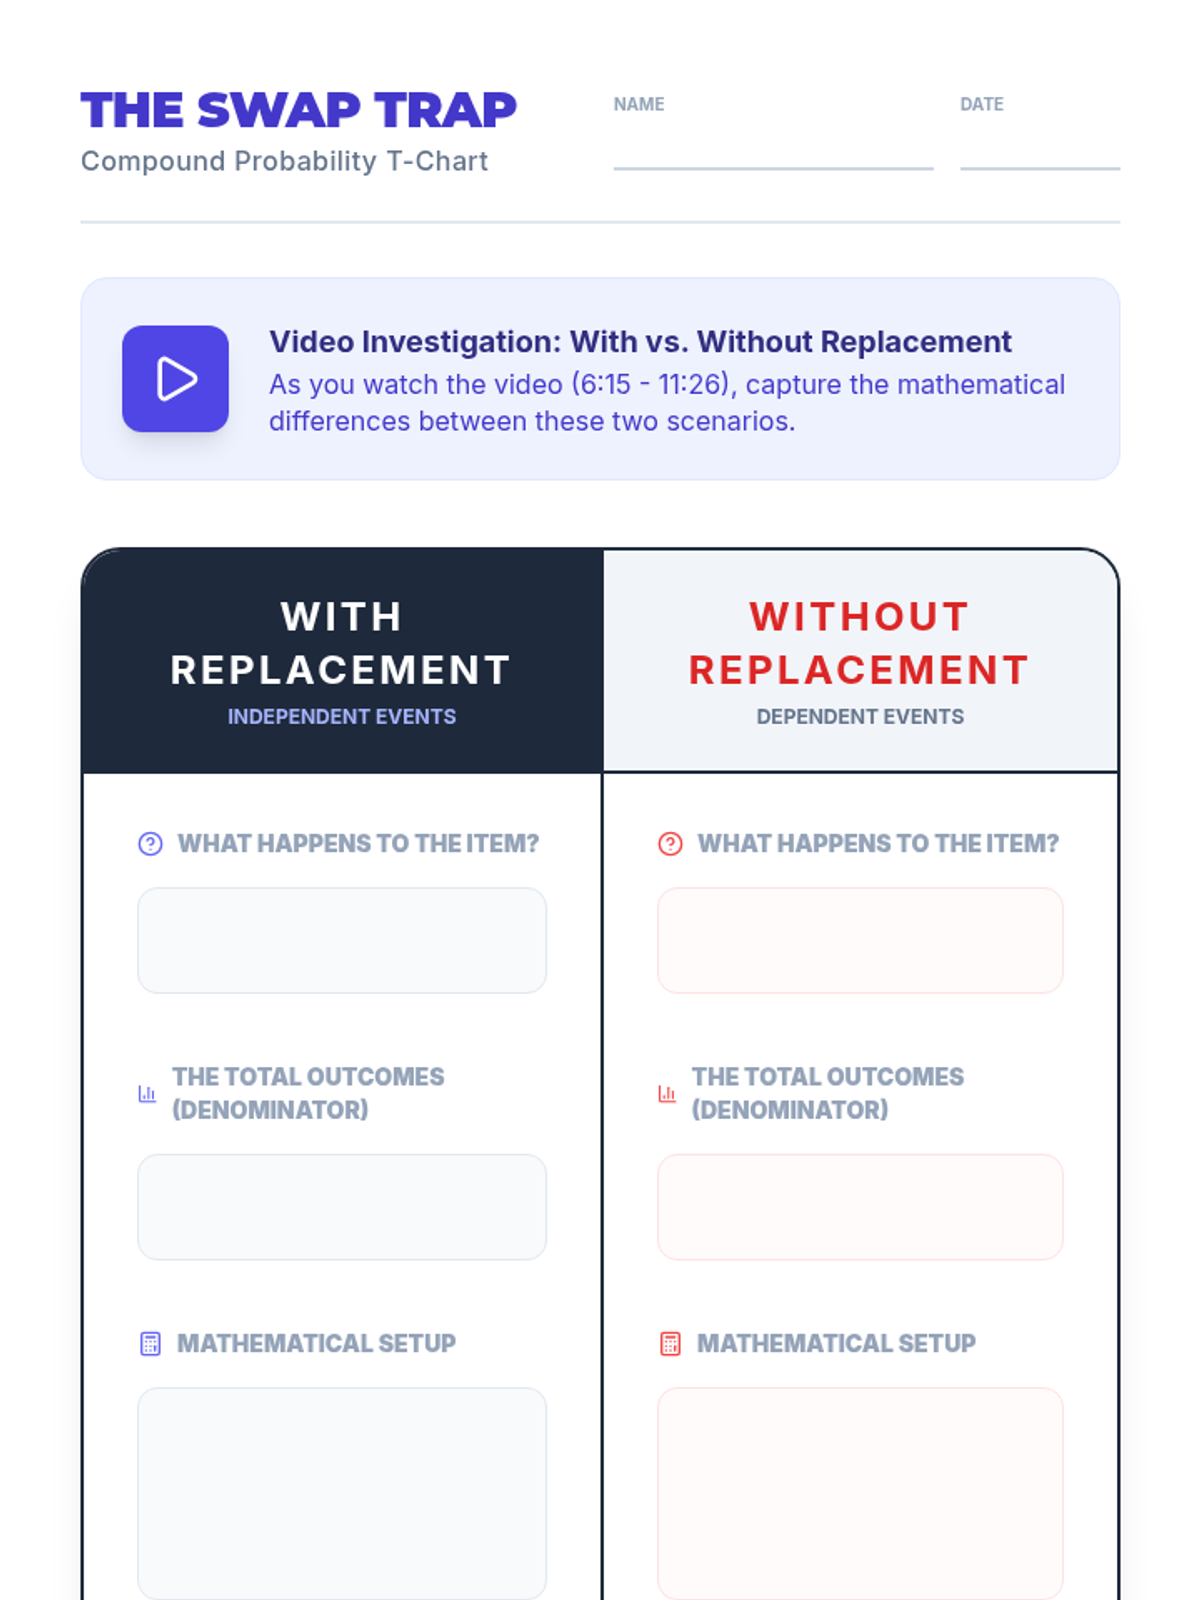
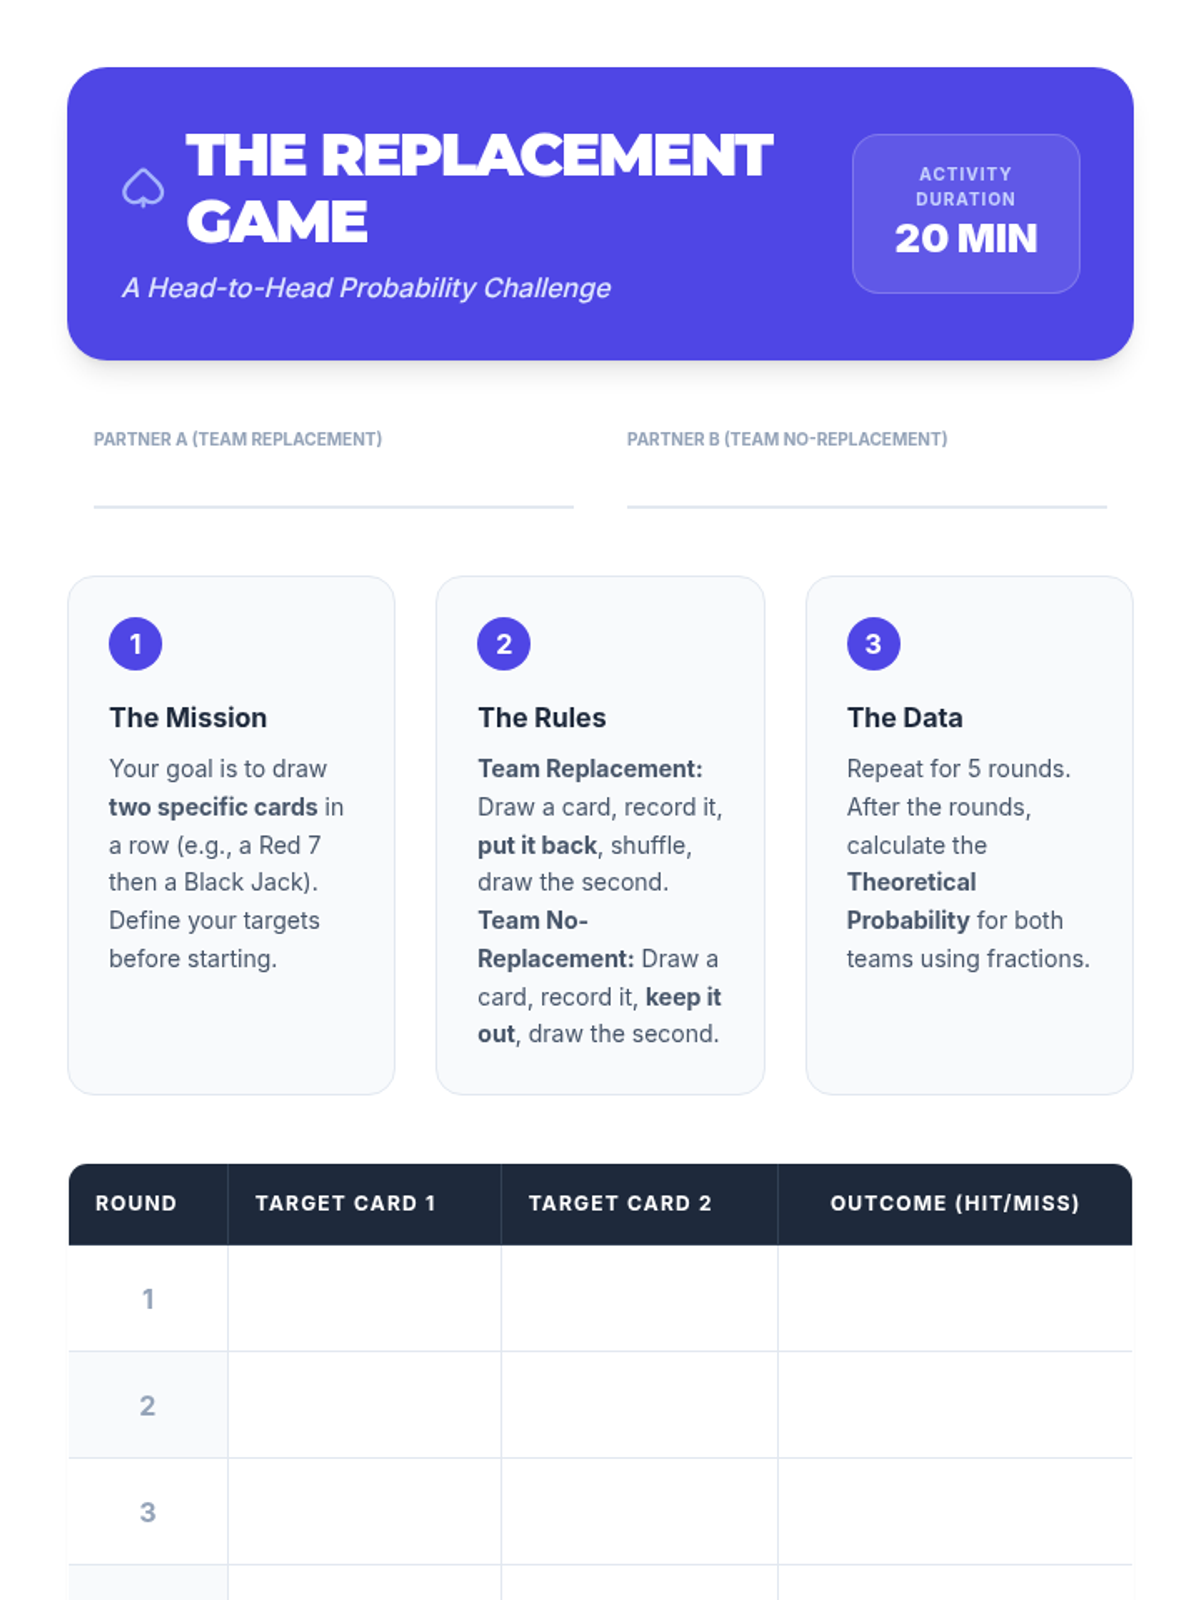
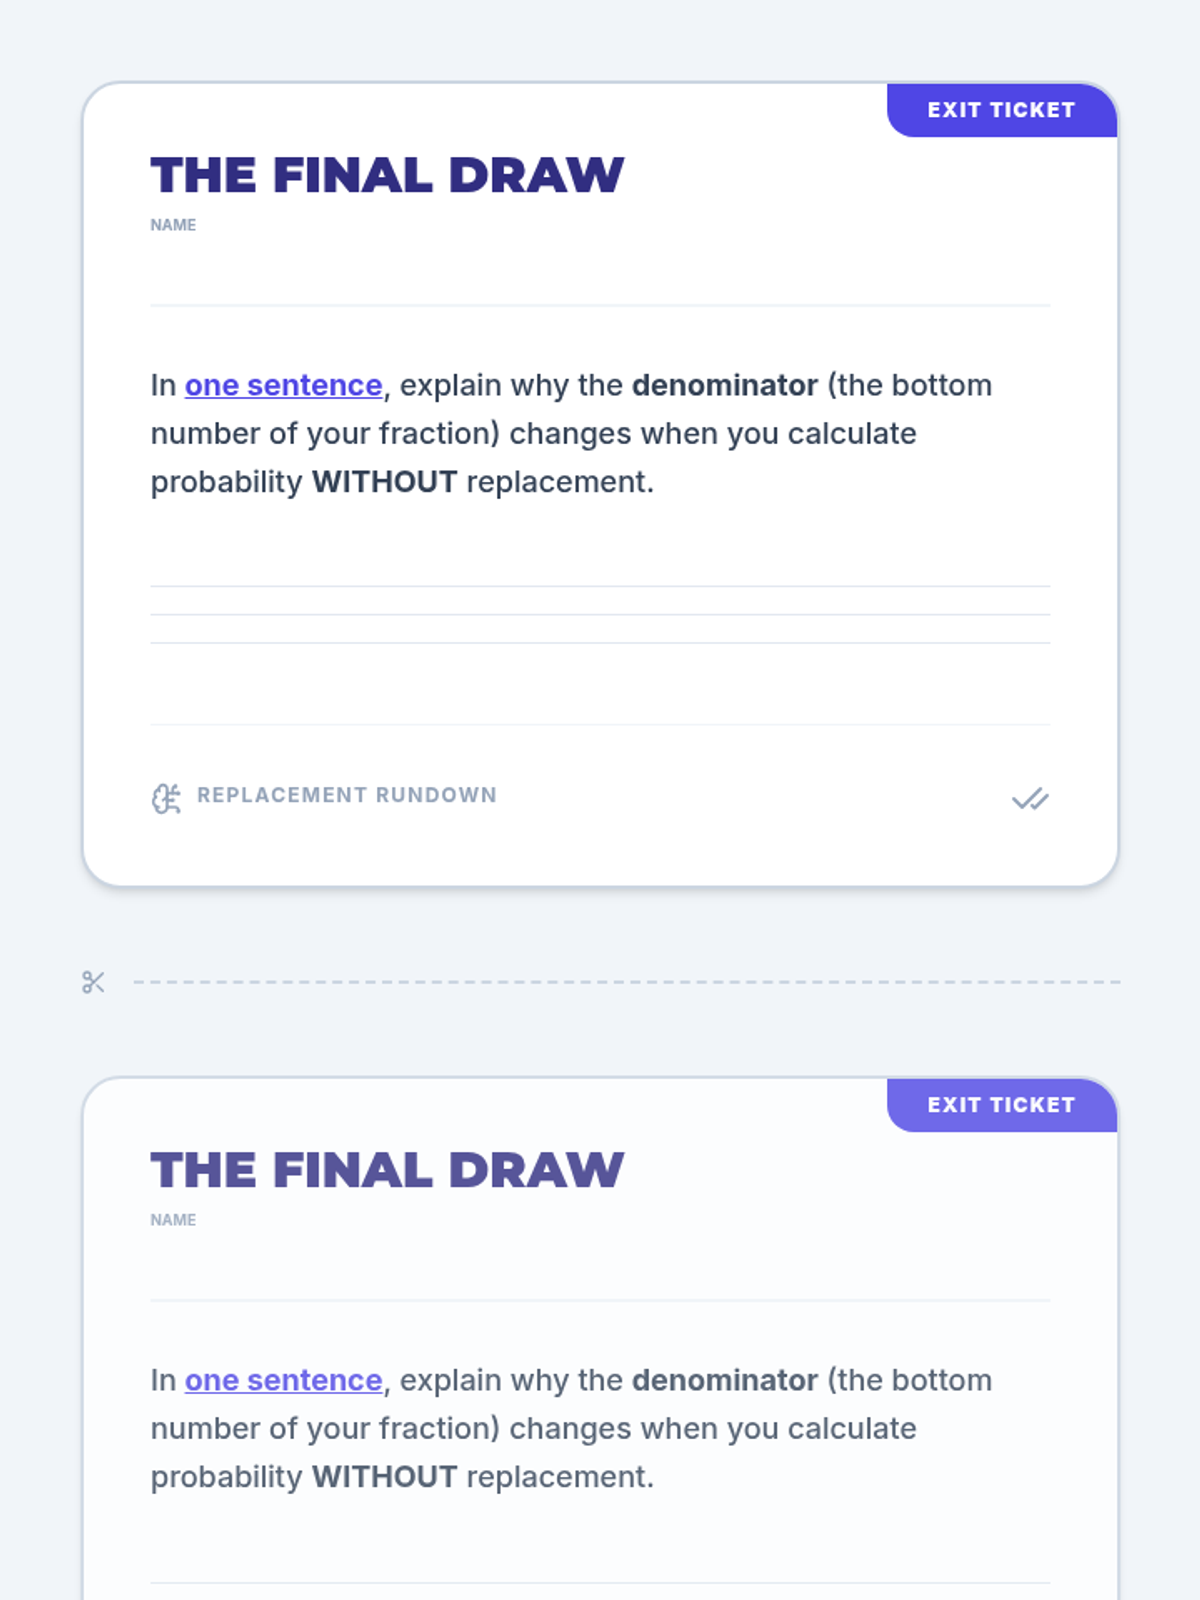
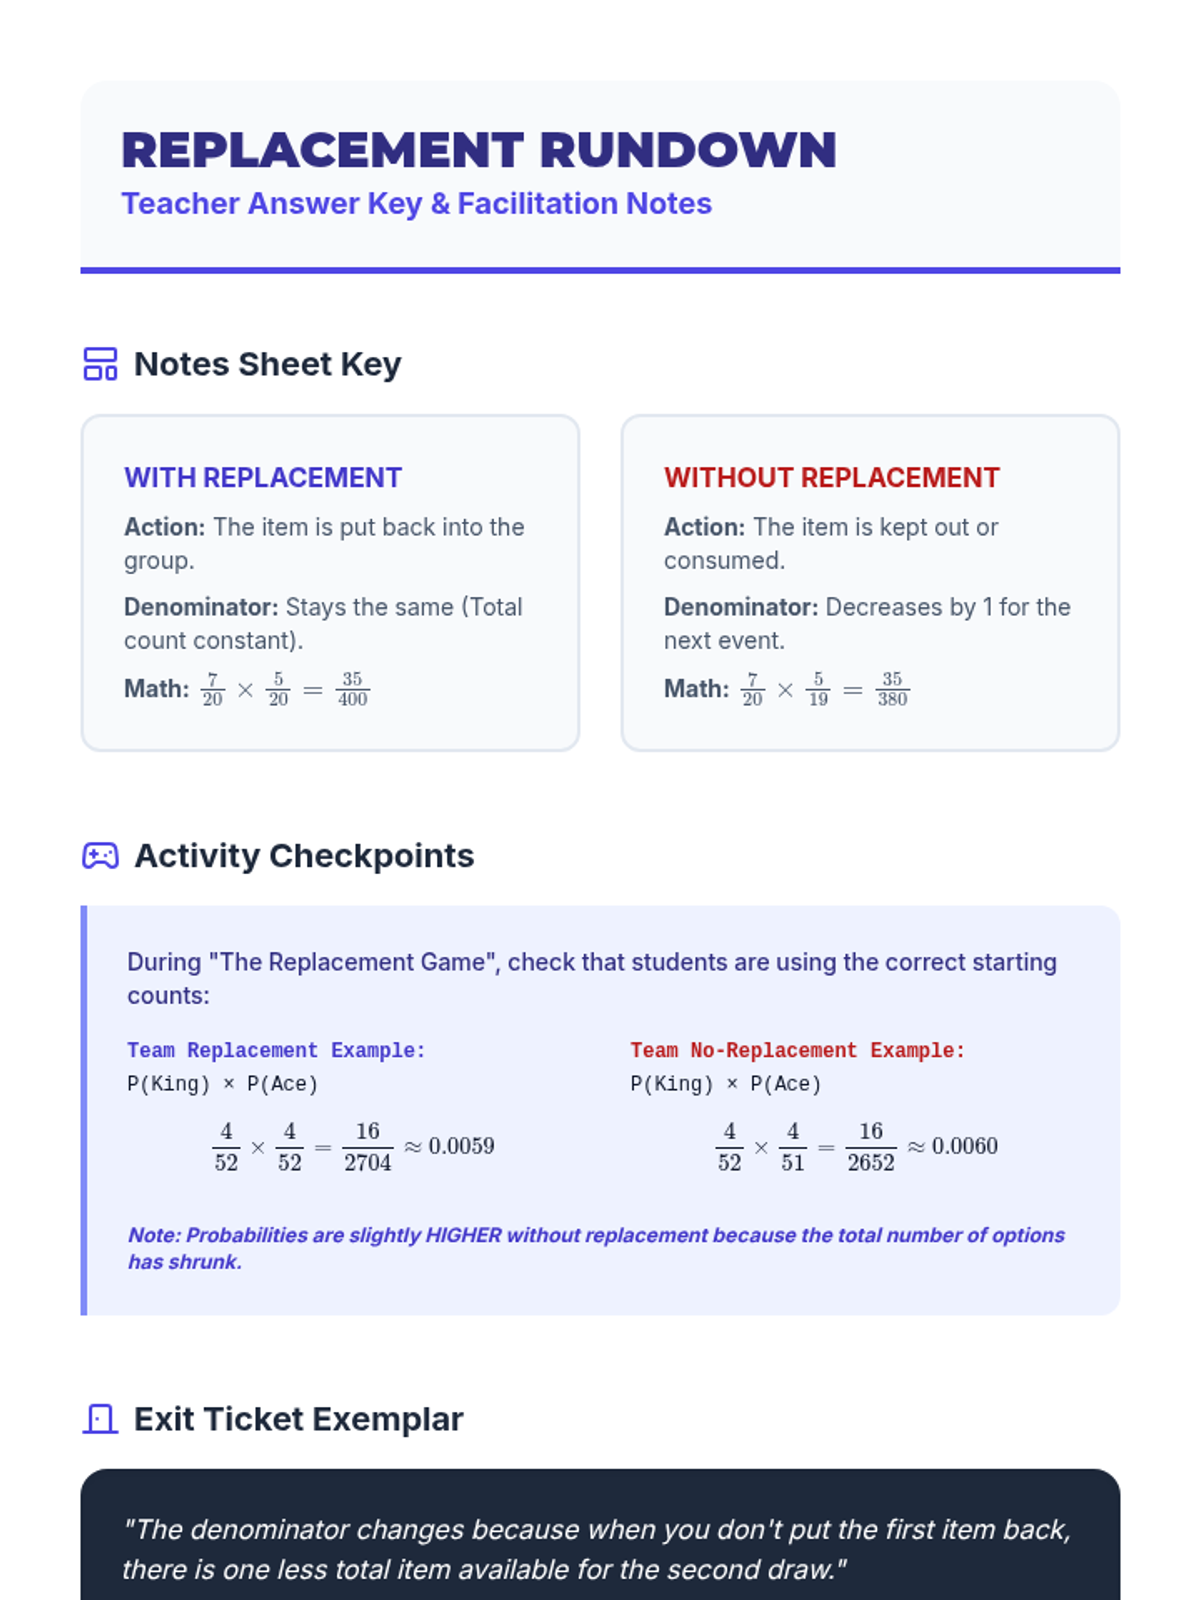
An 8th-grade math lesson focusing on the distinction between independent and dependent events through the lens of replacement. Students explore how the presence or absence of replacement affects probability calculations through video analysis and a hands-on card activity.
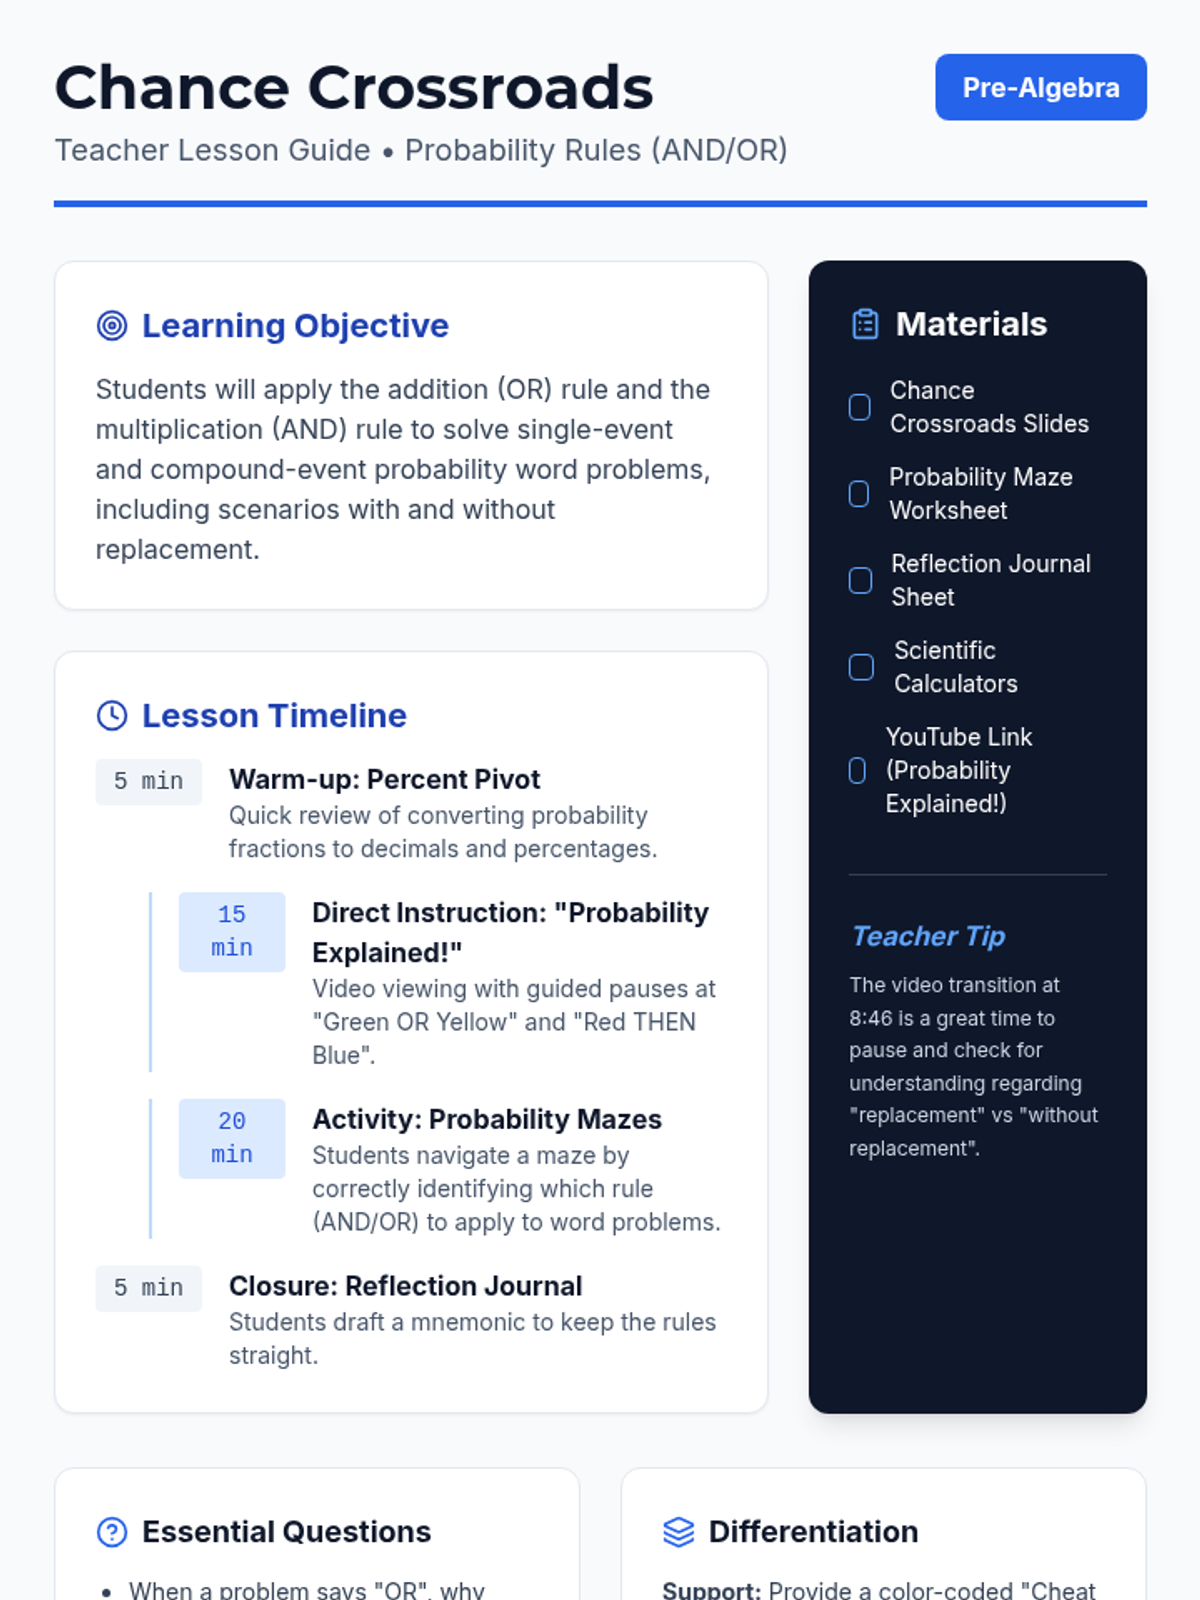
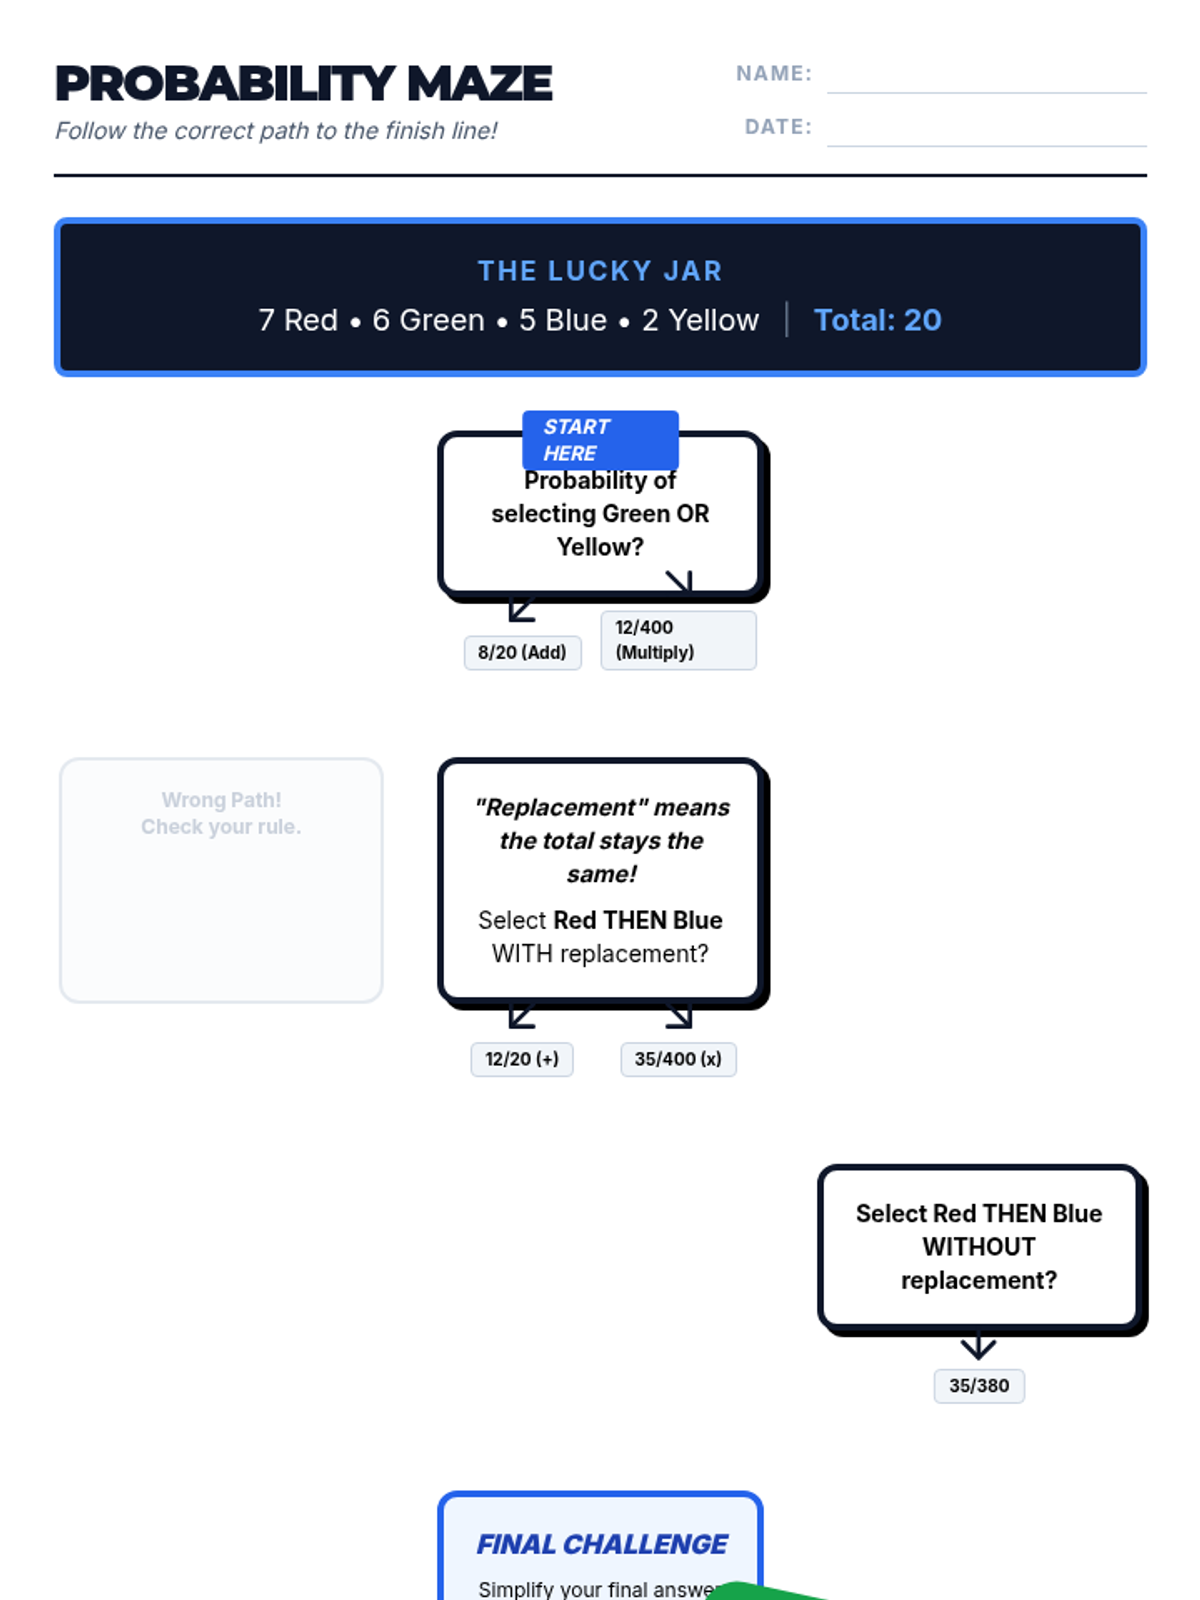
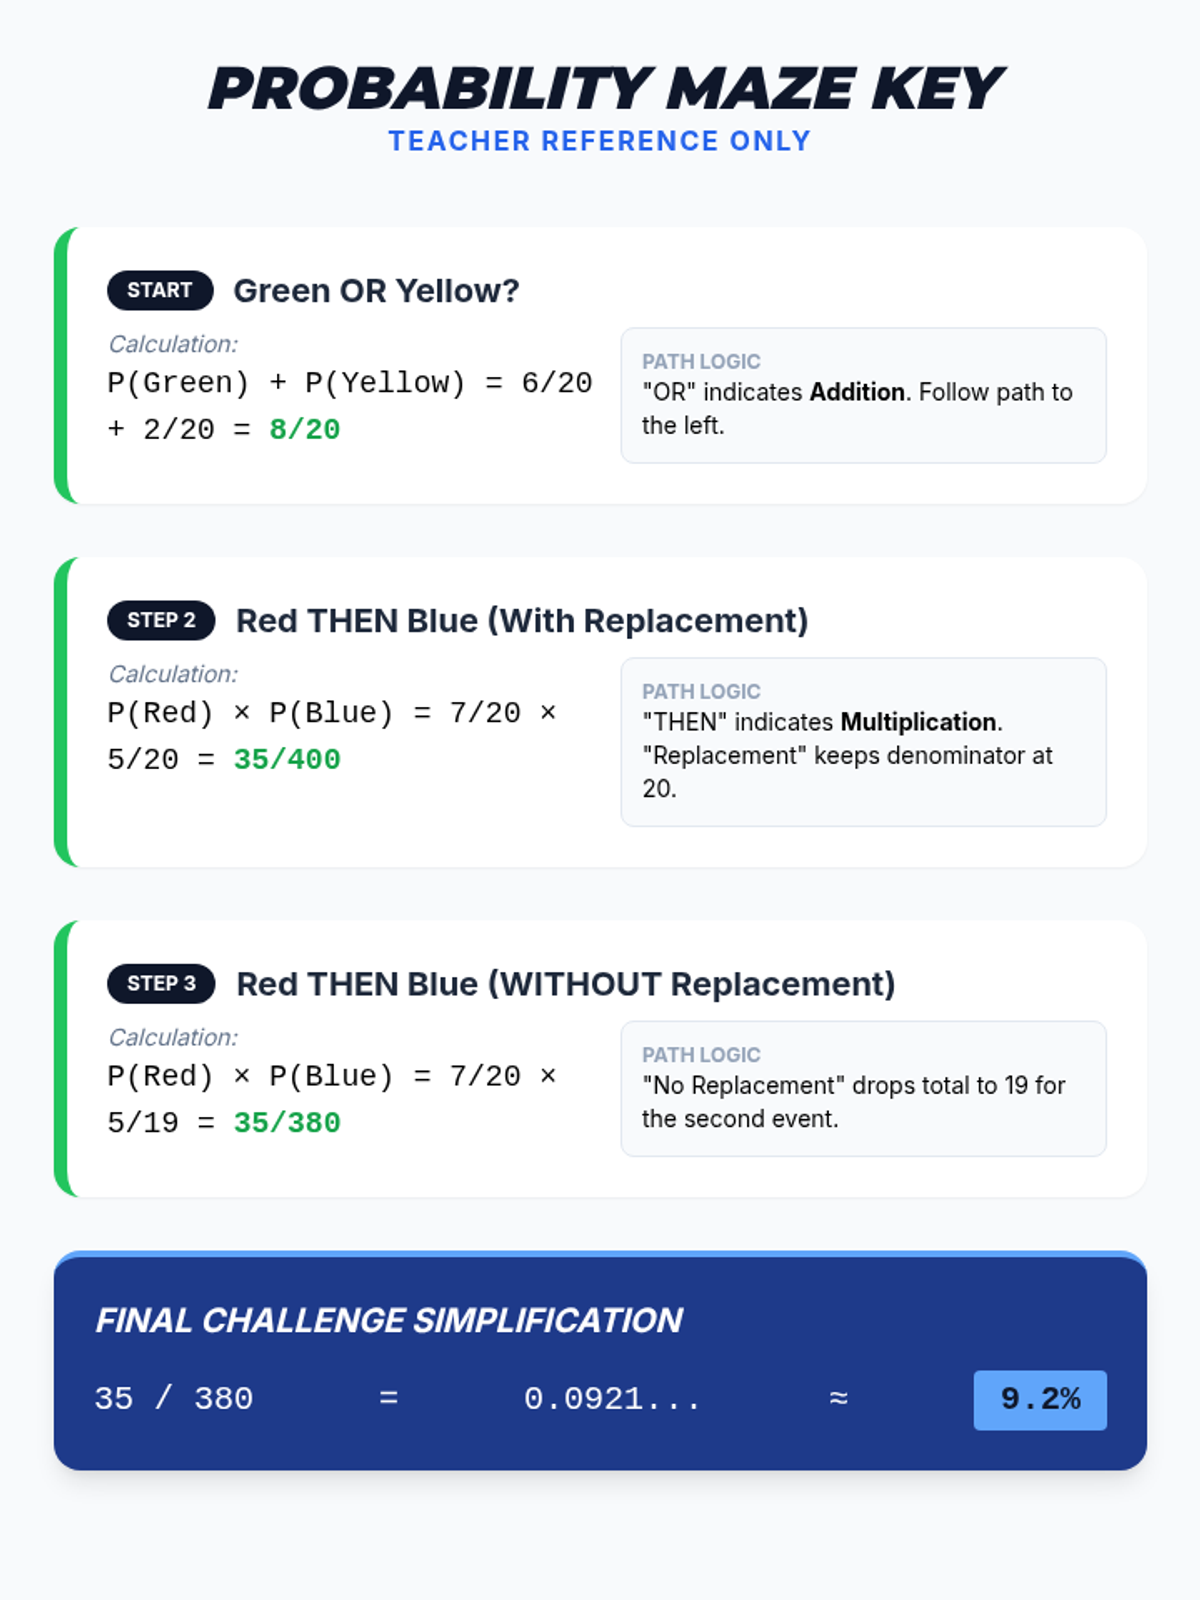
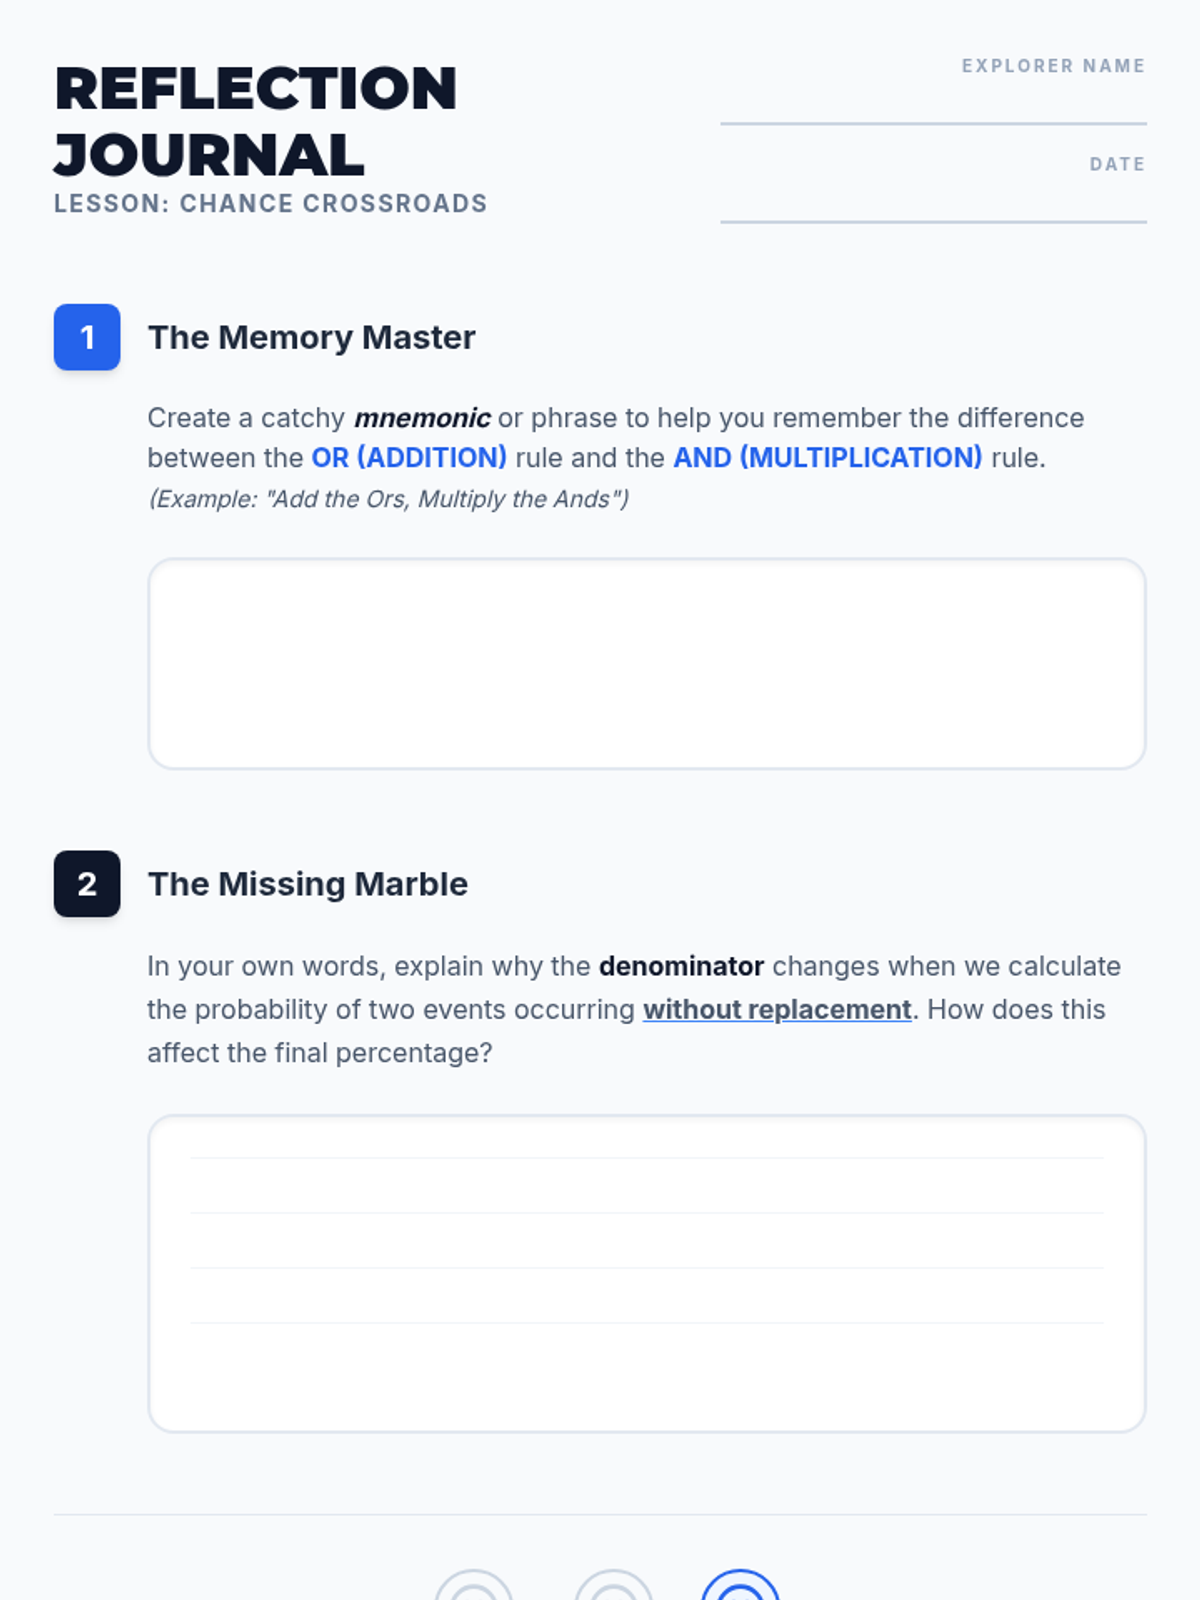
A Pre-Algebra lesson focusing on the addition (OR) and multiplication (AND) rules of probability, featuring a video-based instruction, a probability maze activity, and a reflective journal.
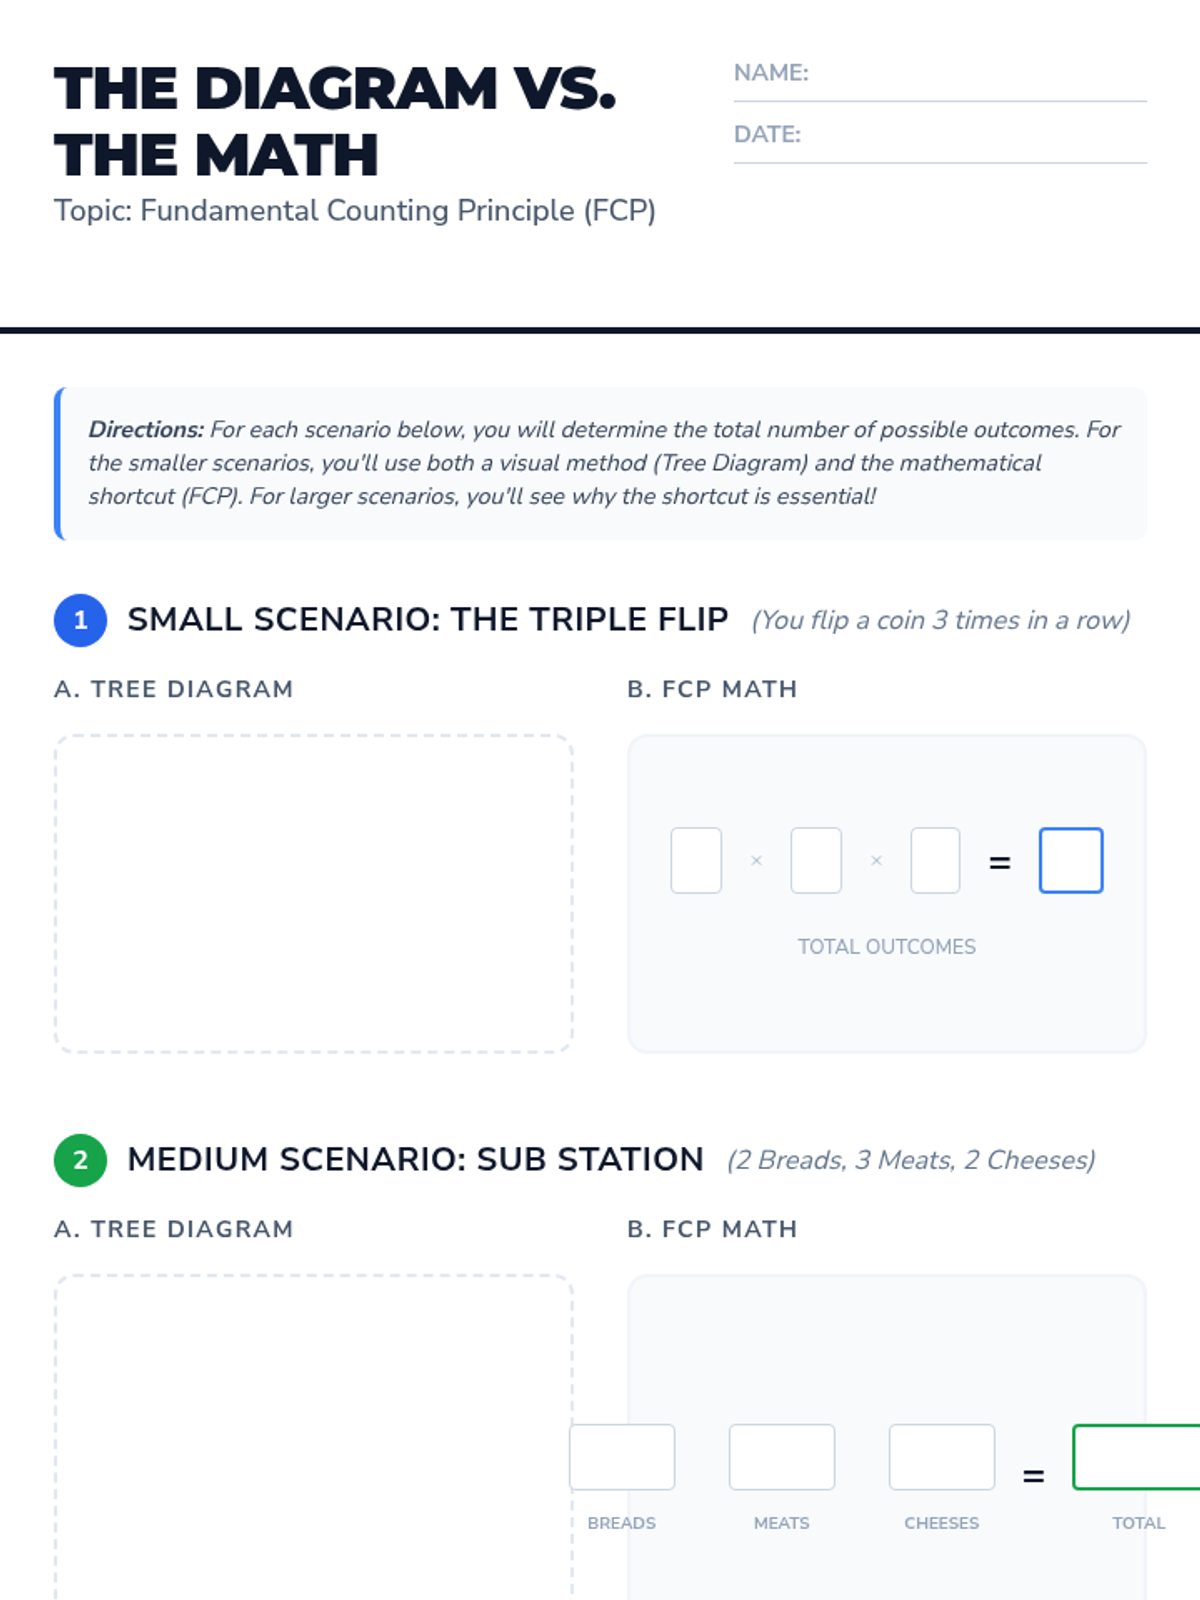
A middle school math lesson that transitions students from visual tree diagrams to the more efficient Fundamental Counting Principle for calculating total outcomes.
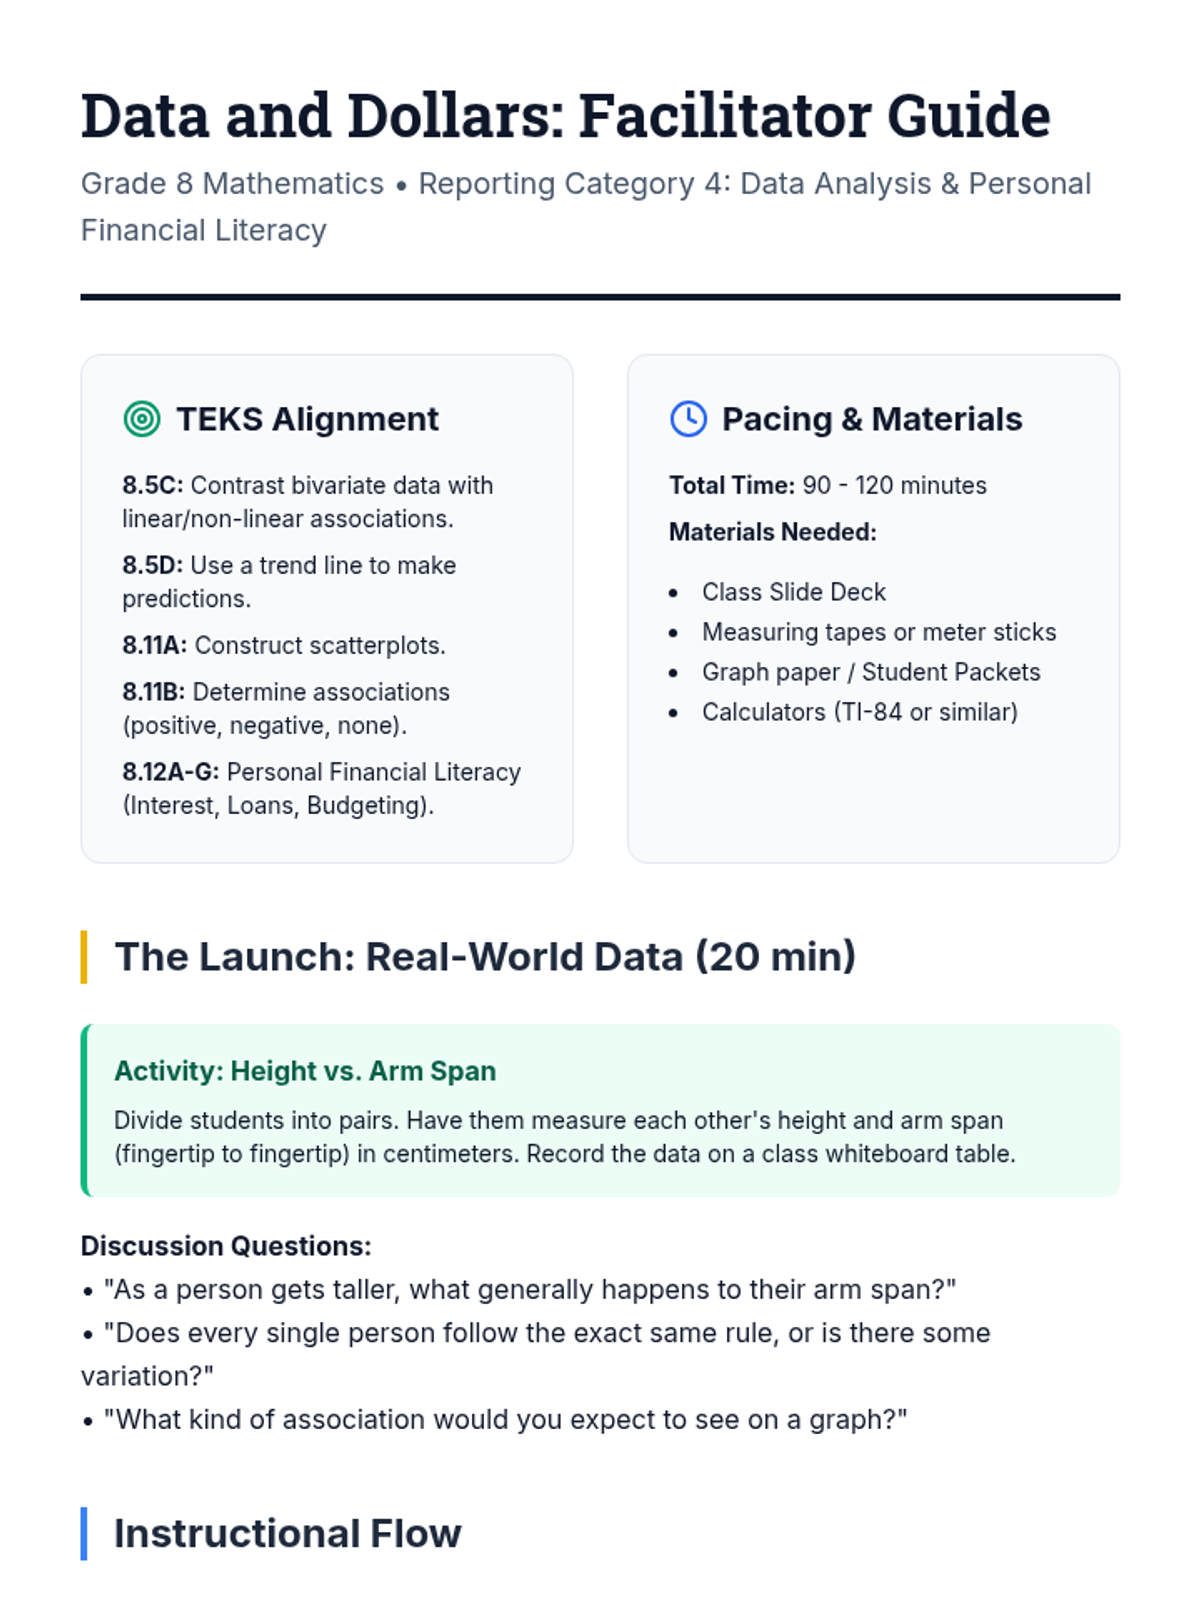
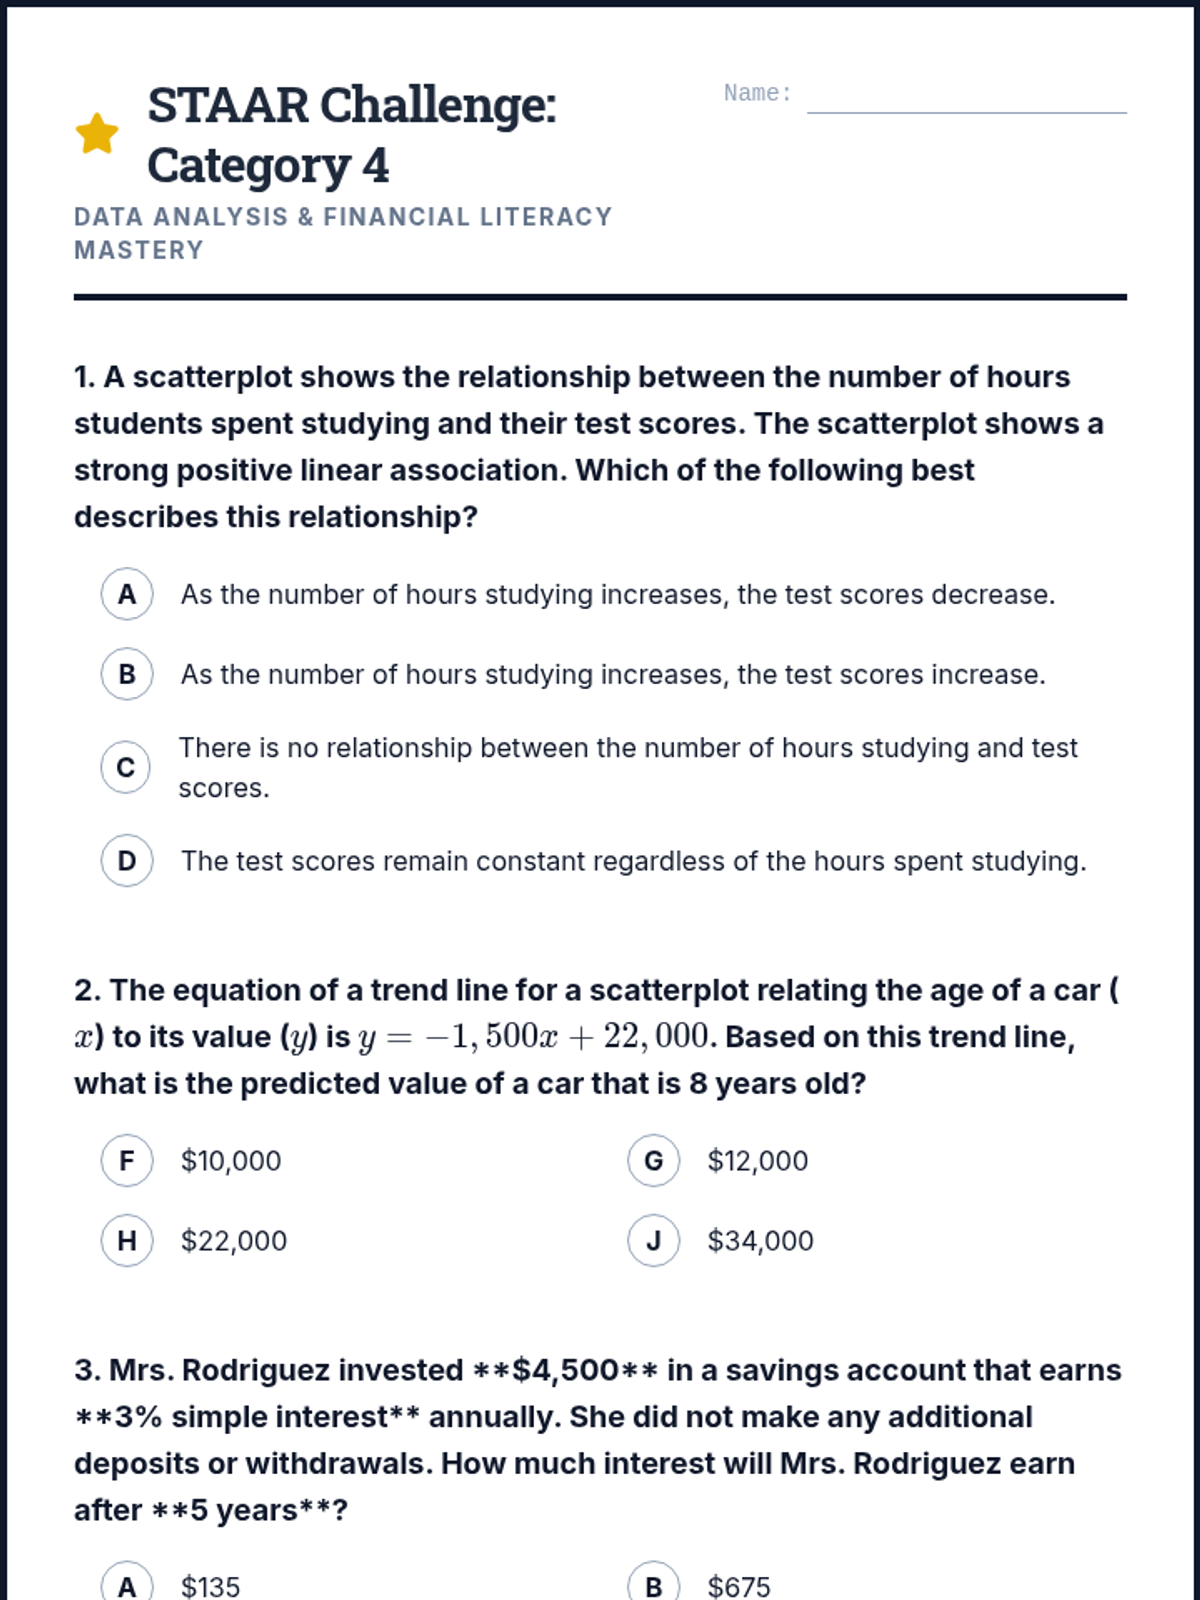
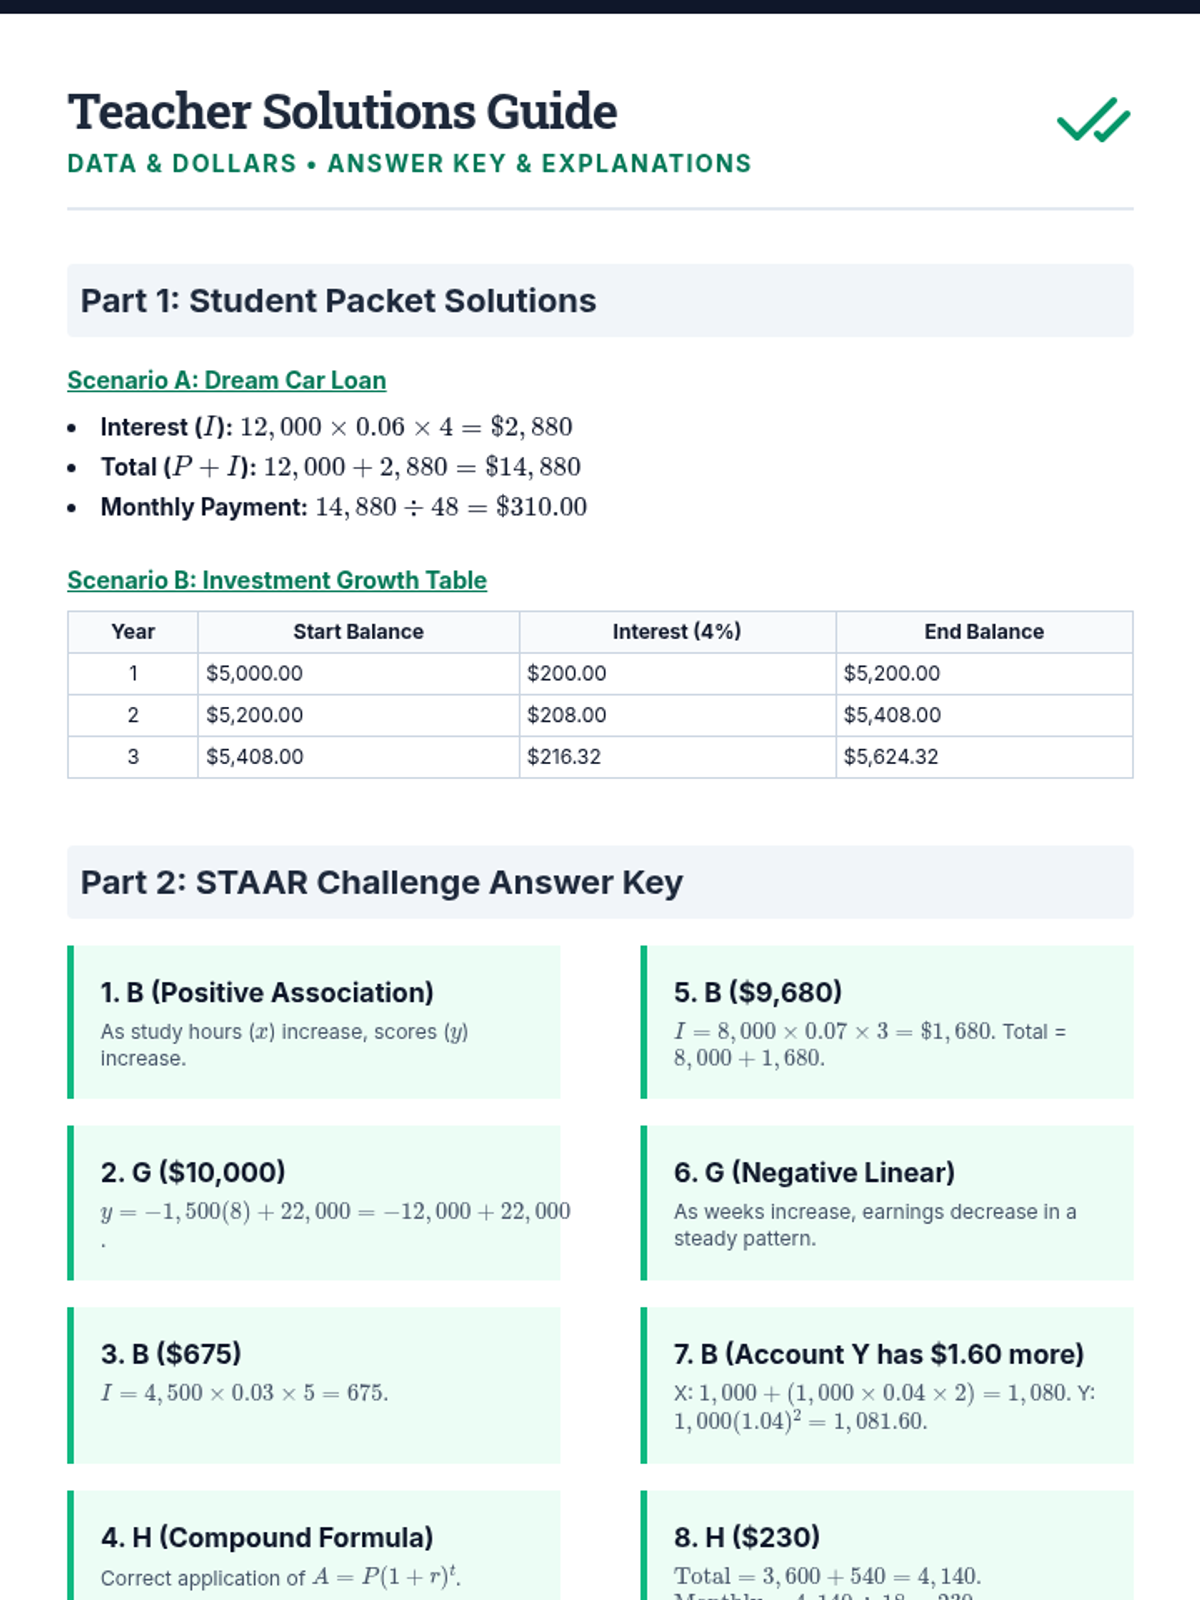
This Grade 8 Mathematics lesson covers TEKS Reporting Category 4, focusing on scatterplots, trend lines, and personal financial literacy. Students will learn to interpret data associations, make predictions using trend lines, and calculate simple vs. compound interest for real-world financial decisions.
A comprehensive lesson on creating and interpreting scatter plots, identifying correlations, and drawing trend lines to make predictions. Students practice plotting real-world data and analyzing relationships between variables.