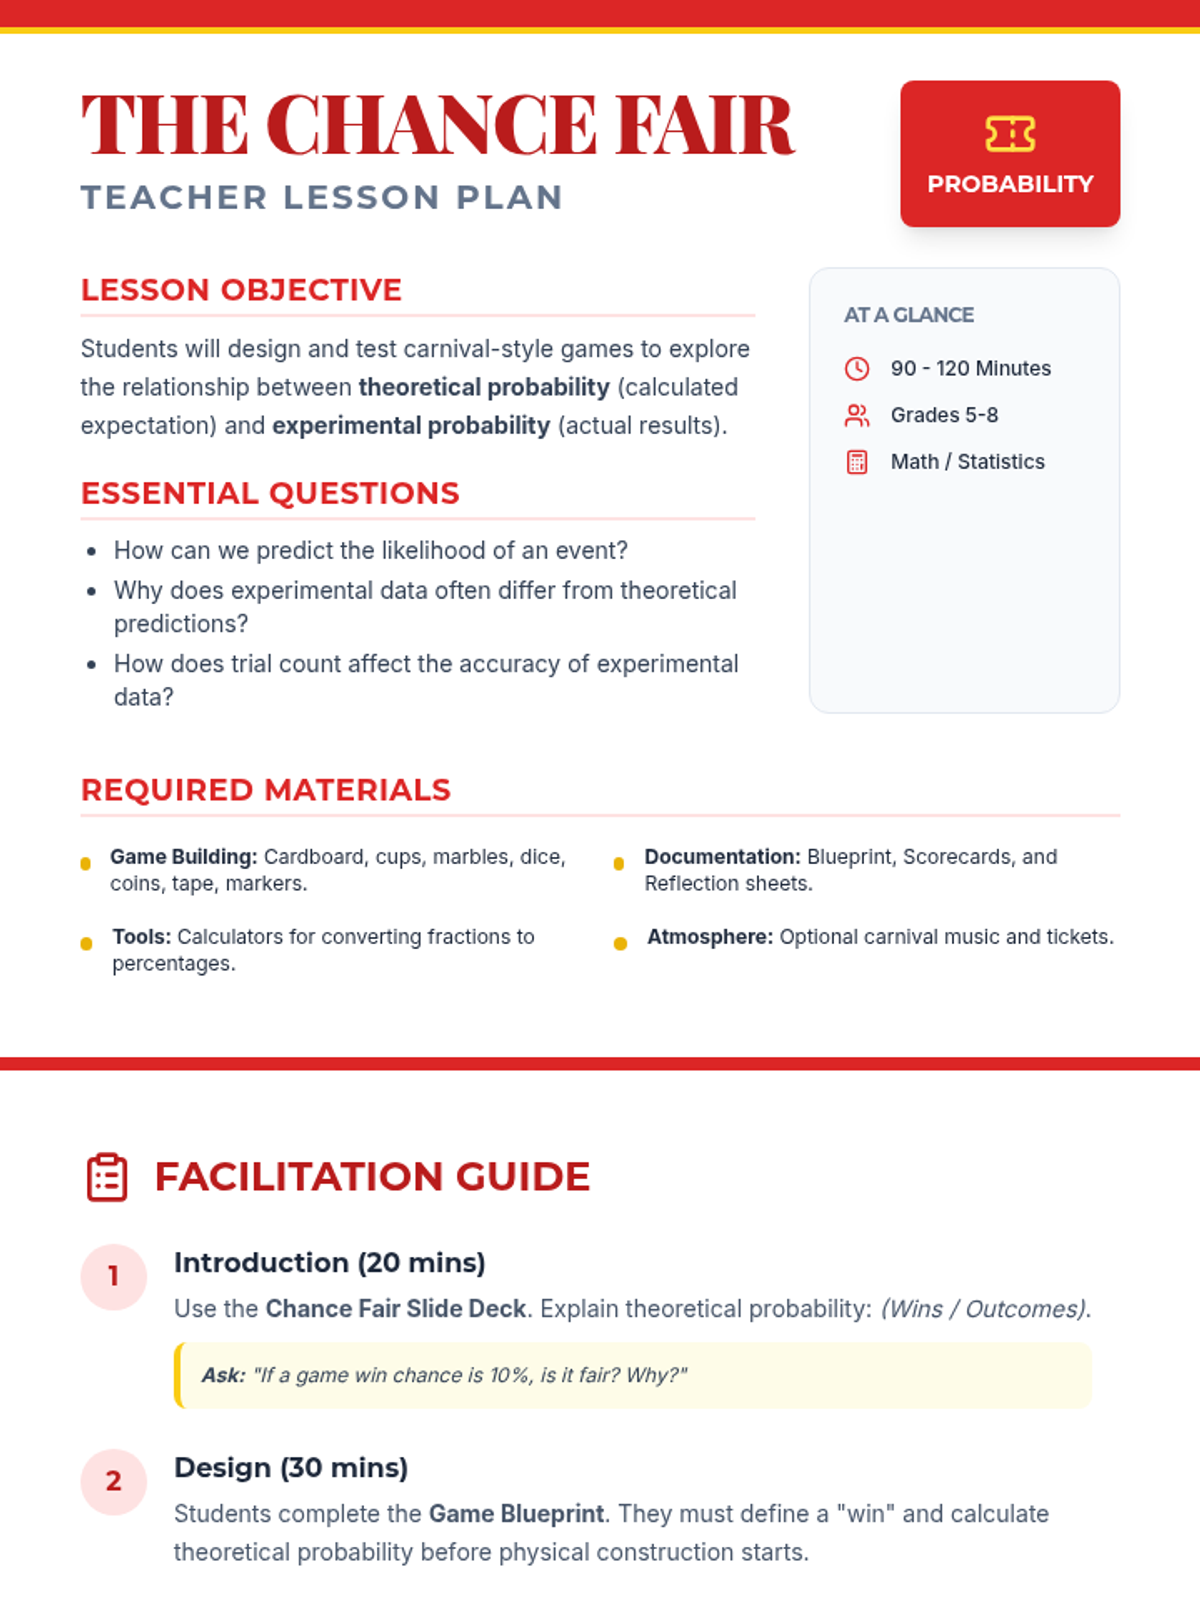
A hands-on math project where students design carnival games to explore theoretical versus experimental probability through data collection and analysis.
A comprehensive guide to analyzing and graphing rational functions, covering all key features from asymptotes to holes.
An advanced look at slope as a rate of change, including calculation from coordinates and understanding special cases like zero and undefined slopes.
A focused lesson on solving one-step addition and subtraction equations using a variety of number types including whole numbers, decimals, and fractions.
A comprehensive assessment lesson focusing on mastering one-step equations involving multiplication, division, and basic addition/subtraction.
A comprehensive lesson on solving one-step equations using addition, subtraction, multiplication, and division, featuring visual models and real-world applications.
A comprehensive lesson on measures of center (mean, median, mode) where students learn to summarize numerical data and find missing values using time, temperature, and group size data.
A comprehensive 7th-grade math lesson on mean, median, mode, and range, themed around a 'Data Detective' investigation. It includes differentiated materials for math, executive functioning, and reading comprehension goals.
A comprehensive lesson on calculating the area of composite figures by decomposing them into simpler shapes like rectangles, triangles, and semi-circles using integer-based measurements.
A focused lesson on calculating area and perimeter of complex rectilinear shapes by determining missing side lengths and applying geometric formulas.
A coordinate plane lesson where students plot integer coordinates in four quadrants to reveal a butterfly. The activity combines math precision with creative coloring for a spring-themed classroom experience.
A comprehensive lesson on calculating and interpreting mean, median, mode, and range using real-world shopping and pricing data. Students will analyze price lists for various items to master basic statistics.
A hands-on probability project where students design, build, and test carnival games. They will calculate theoretical probability, collect experimental data, and analyze the results to understand statistical likelihood.
A lesson focused on mastering addition and subtraction of fractions with unlike denominators using the cross-multiplication (butterfly) method. Students use structured graphic organizers to visualize each step of the process.
A highly scaffolded lesson on angle relationships (vertical, complementary, and supplementary) featuring an architectural blueprint theme. Includes guided notes with exemplars and step-by-step practice materials.
Advanced applications of central tendency and spread, including algebraic problem-solving, weighted means, and the mathematical impact of outliers for high school students.
A comprehensive assessment covering Level 1, Level 2, and Level 3 data analysis, designed to evaluate mastery of mean, median, mode, and range in both numerical and narrative contexts.
In this hands-on geometry exploration, students venture outside to measure the angles of shadows cast by playground equipment and trees at different times of day. They apply their protractor skills to record data and analyze how the sun's position changes angle measurements.
Students interpret and solve word problems involving mean, median, mode, and range, focusing on extracting data from narrative contexts and real-world scenarios.
A foundational lesson designed for SIFE students to understand fractions greater than one using visual models and fraction strips. Focuses on bridging concrete models to number lines with minimal text reliance.
A collection of extra practice cases for mean, median, mode, and range, ranging from single-digit warmups to double-digit challenges, themed as unsolved detective files.
Students apply their knowledge of mean, median, mode, and range to data sets featuring two-digit numbers, focusing on multi-digit addition and division.
A comprehensive lesson on identifying and analyzing outliers within scatter plots using a 'Data Detective' theme. Students will learn to spot anomalous data points and understand their impact on trends.
A lesson focused on identifying and interpreting outliers in box plot data visualizations, using a forensic detective theme to engage students in data analysis.
Students learn to calculate mean, median, mode, and range using single-digit data sets through structured, step-by-step guided practice and visual aids.
A 65-minute 9th-grade mathematics lesson focusing on the practical application of proportions, percentages, and statistical measures to analyze real-world datasets. Students act as data analysts to solve problems related to urban development and global trends.
A high-energy, comprehensive review lesson for 9th-grade math students to synthesize their learning through a competitive team relay challenge covering all major domains.