Data representation, distributions, and statistical variability using sampling and inference techniques. Integrates probability models, compound events, bivariate patterns, and linear models to guide data-driven decision making.
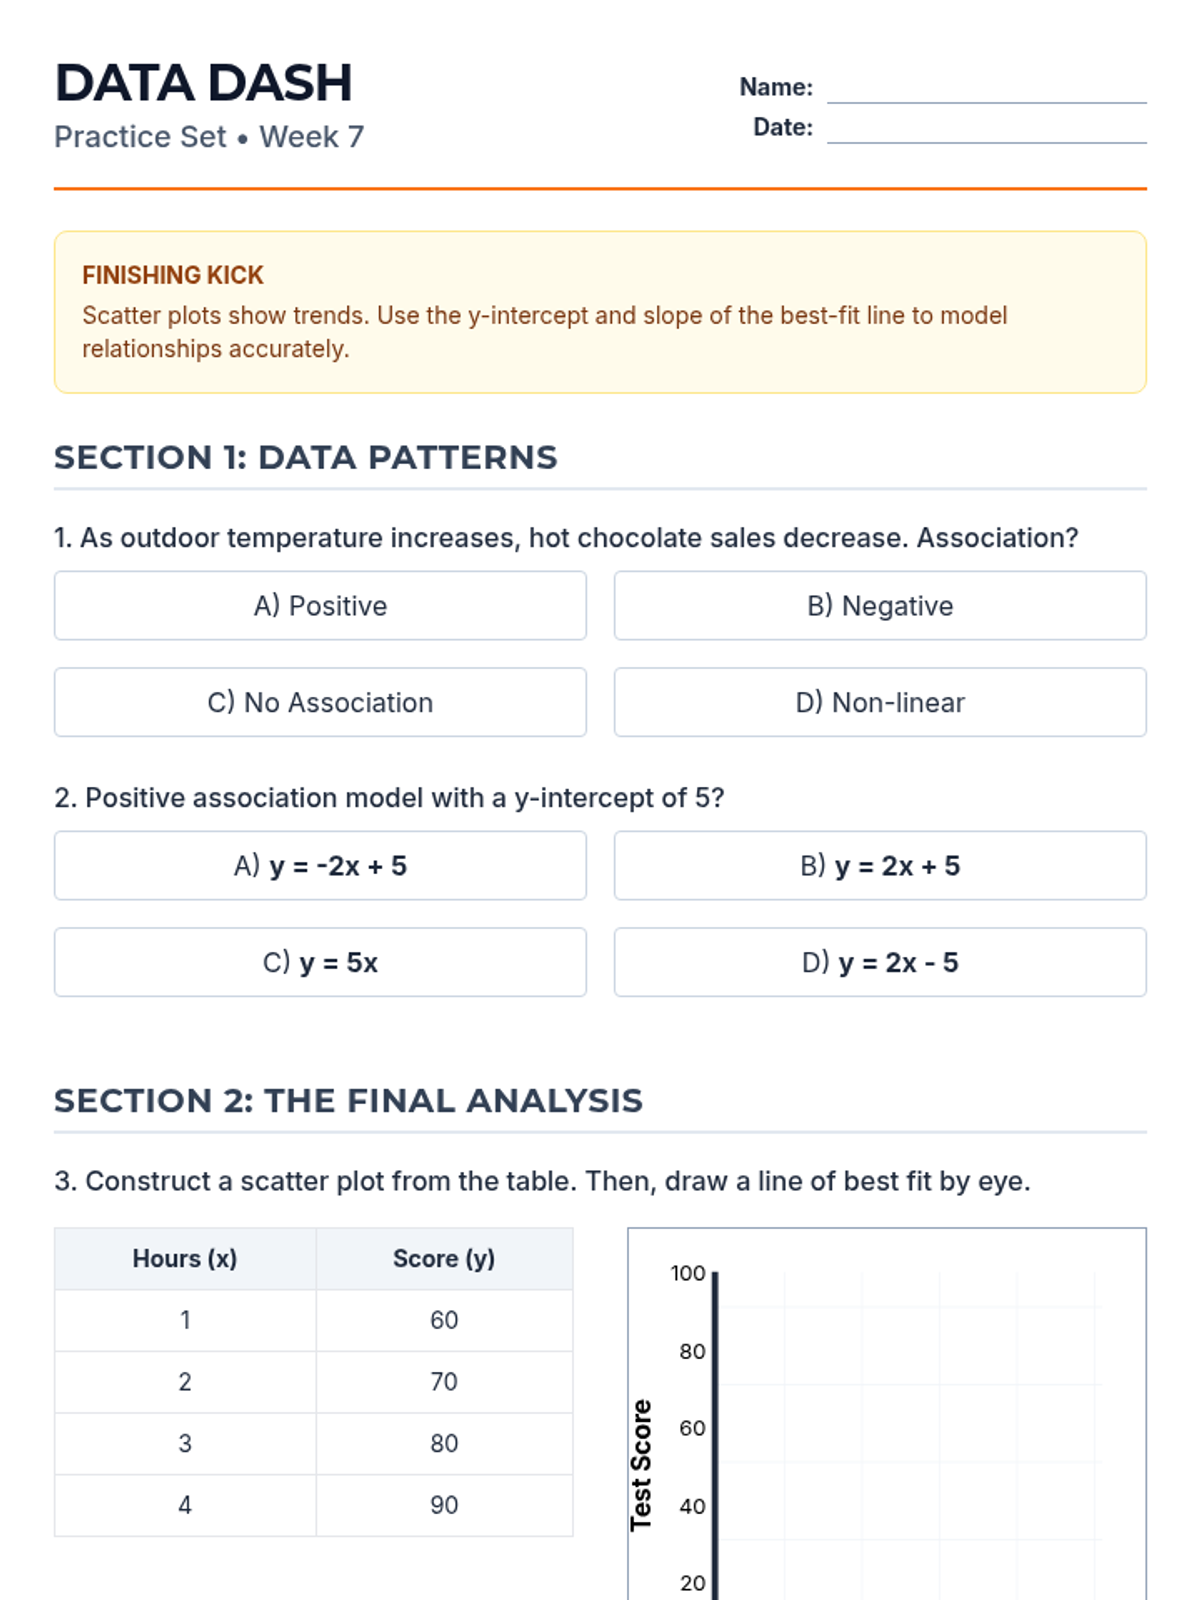
Revised 2-page practice set for Week 7. Fixed scatter plot grid Y-axis labels and tick alignment. Darkened handwriting guides and corrected table variable text for better PDF rendering.
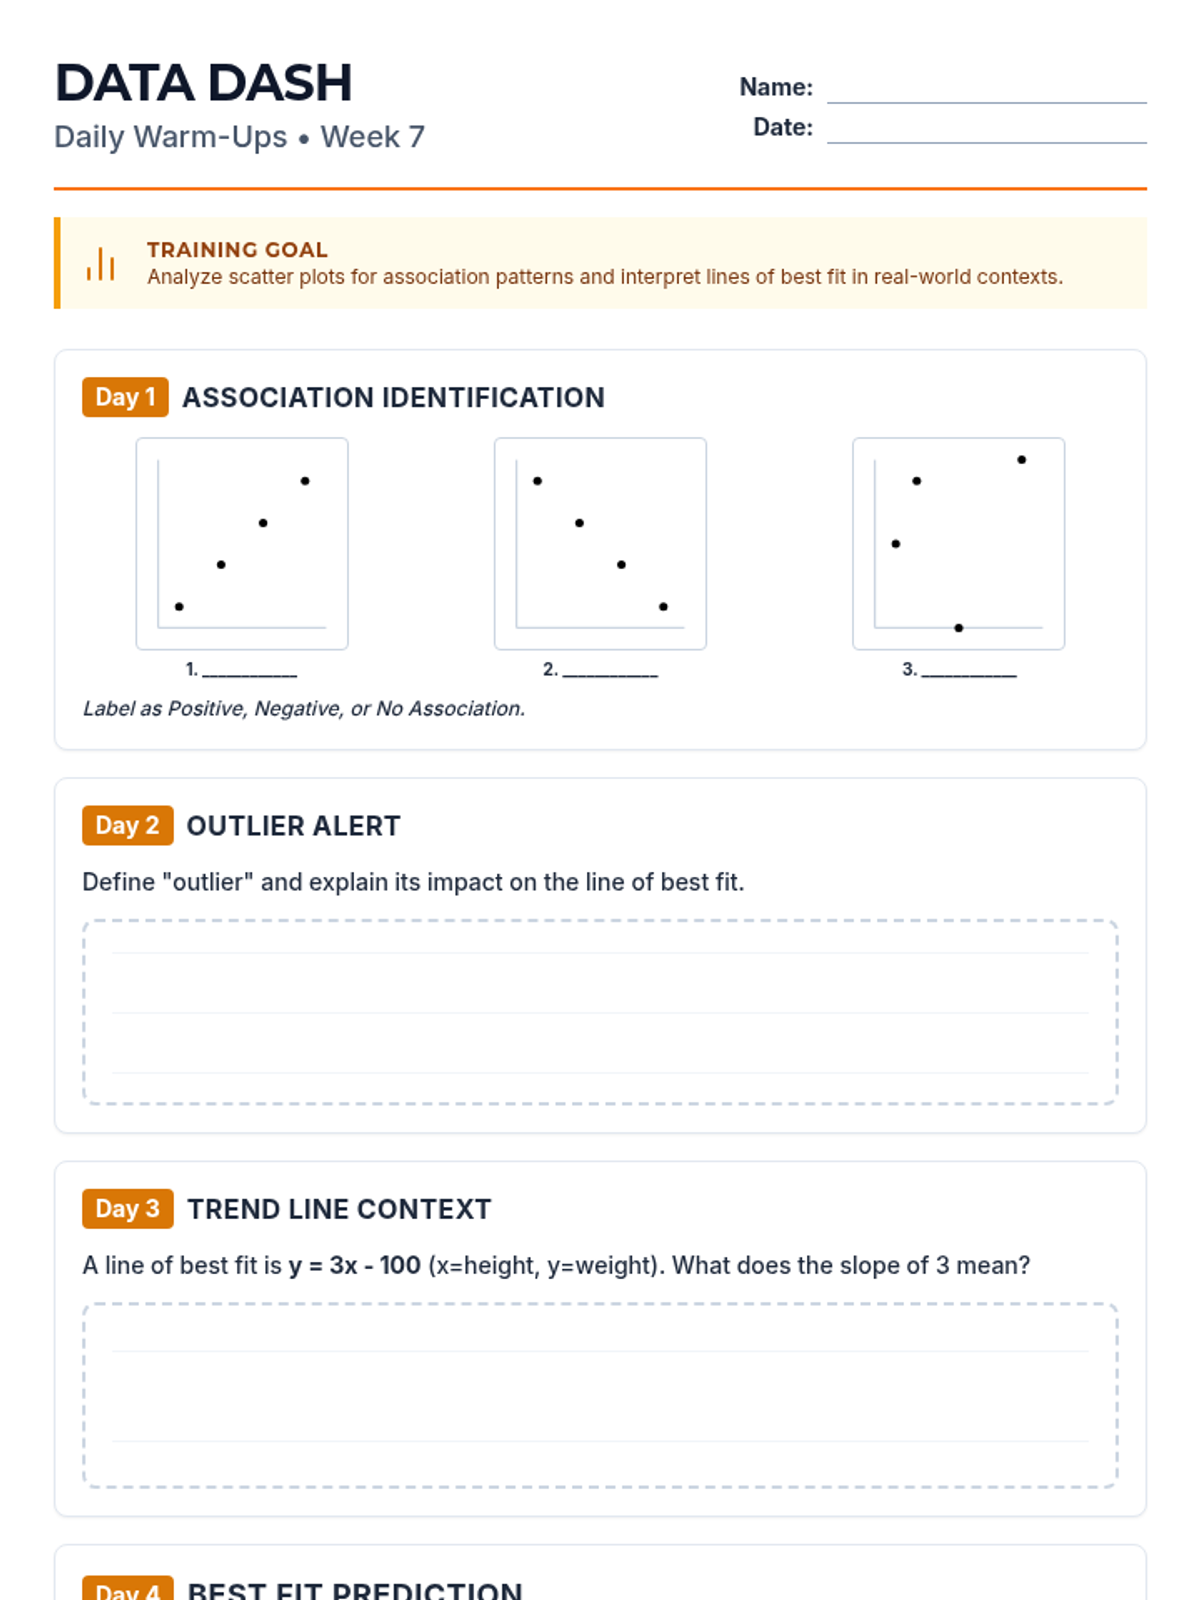
Polished 2-page Warm-Up for Week 7. Replaced MathJax in body text with standard bold for better PDF compatibility, consolidated layout to fit on two pages, and added guided handwriting lines.
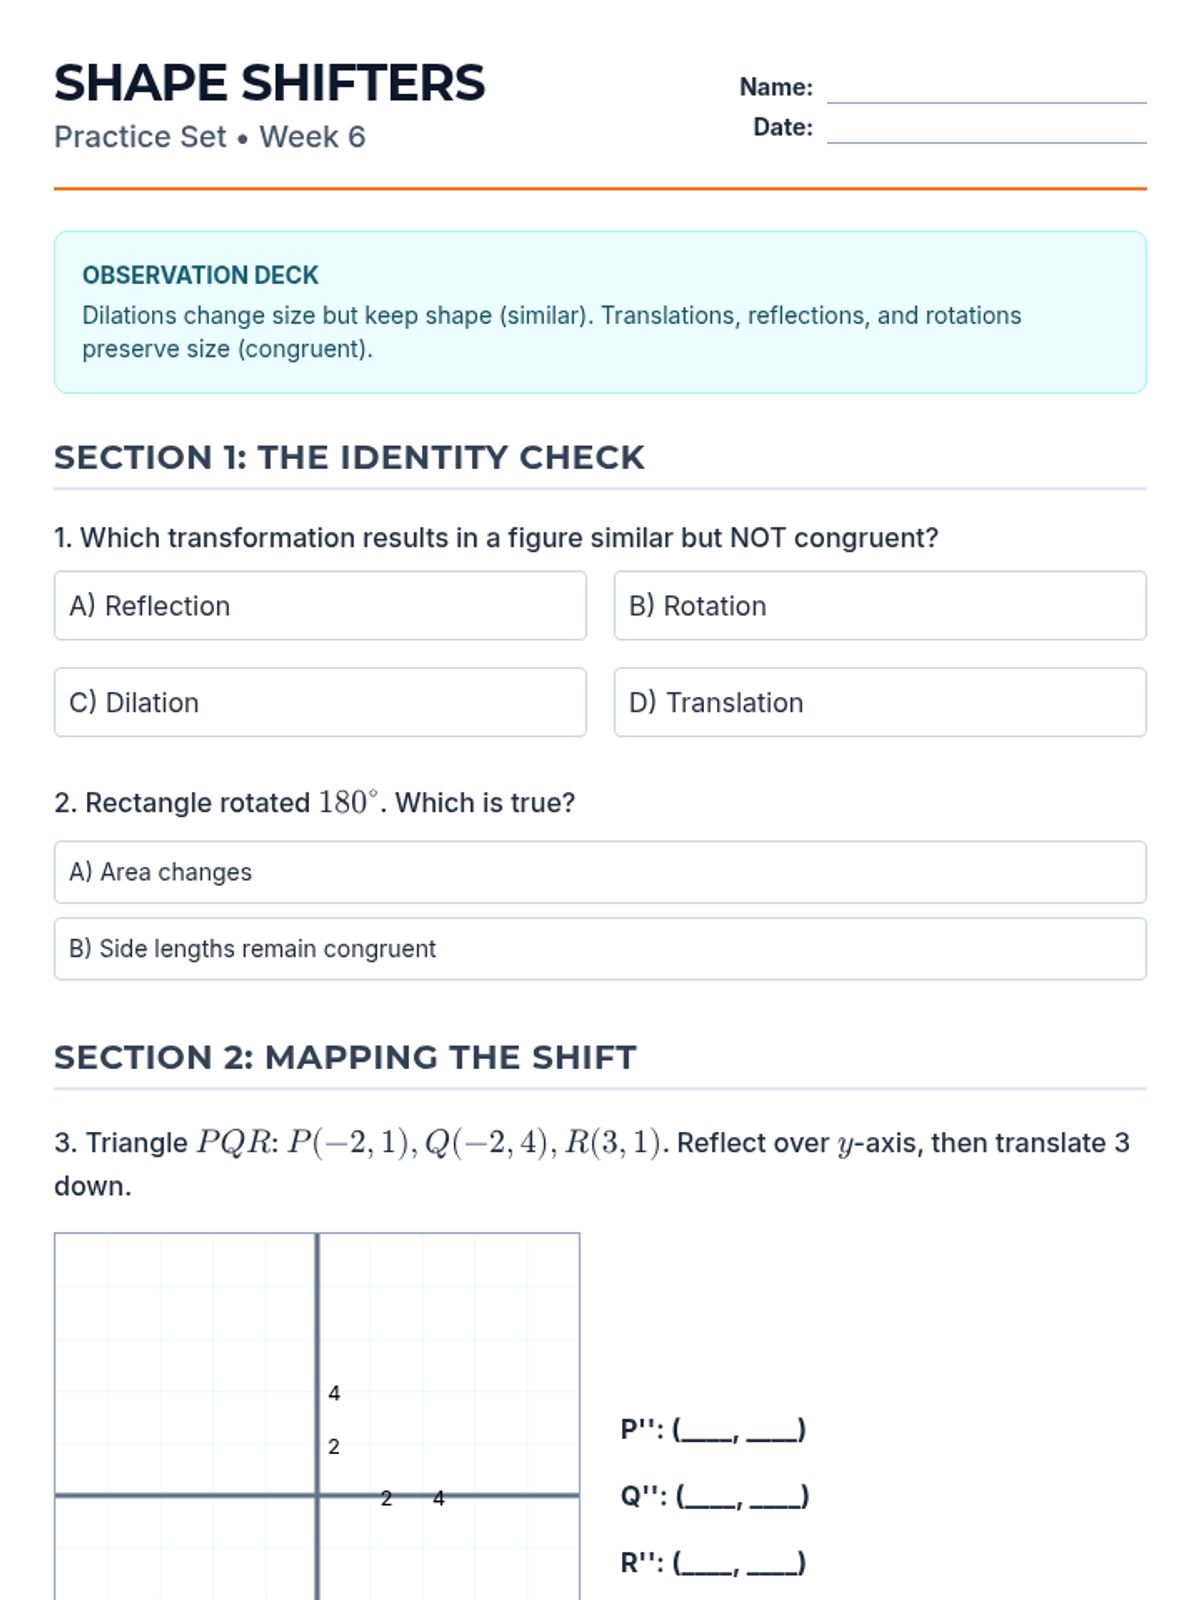
Revised 2-page practice set for Week 6. Added grid and numerical labels to coordinate planes, consolidated layout to avoid orphaned headers, and improved shape comparison workspace.
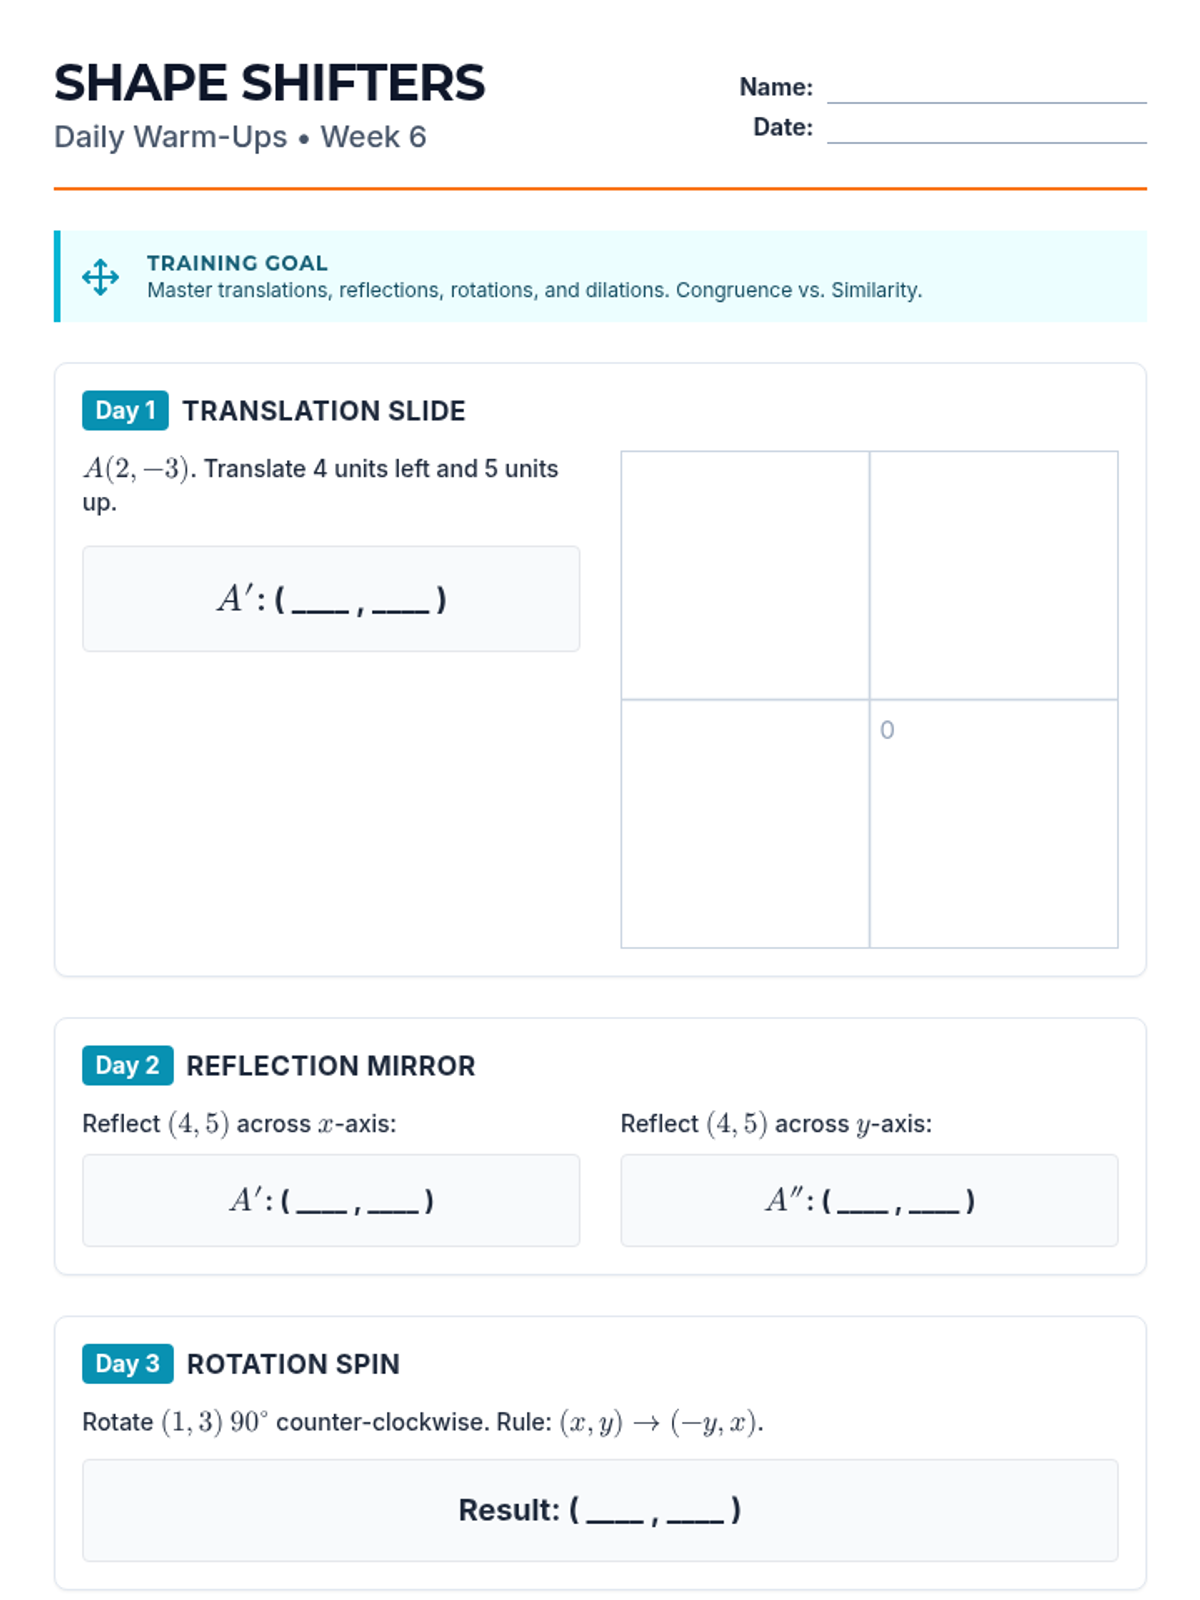
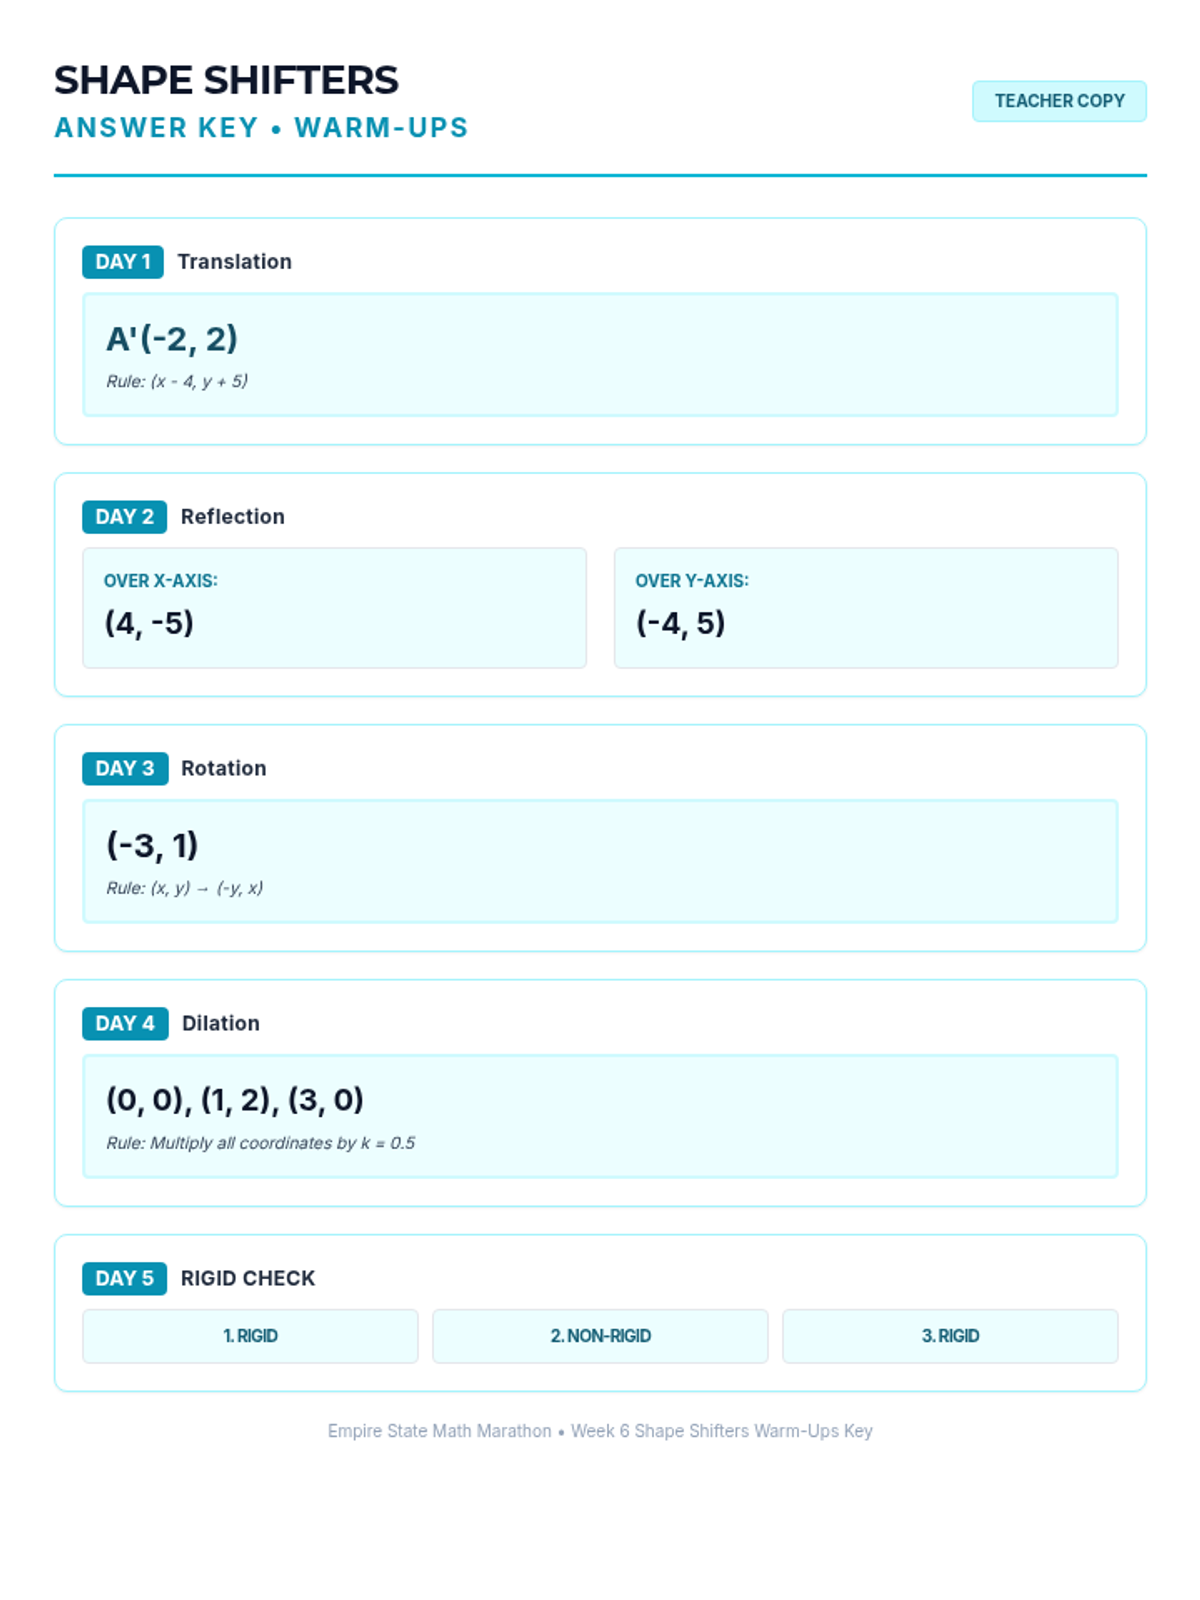
Revised 2-page Warm-Up for Week 6. Fixed overlapping coordinate plane, removed raw markdown asterisks, and consolidated all 5 days onto two pages.
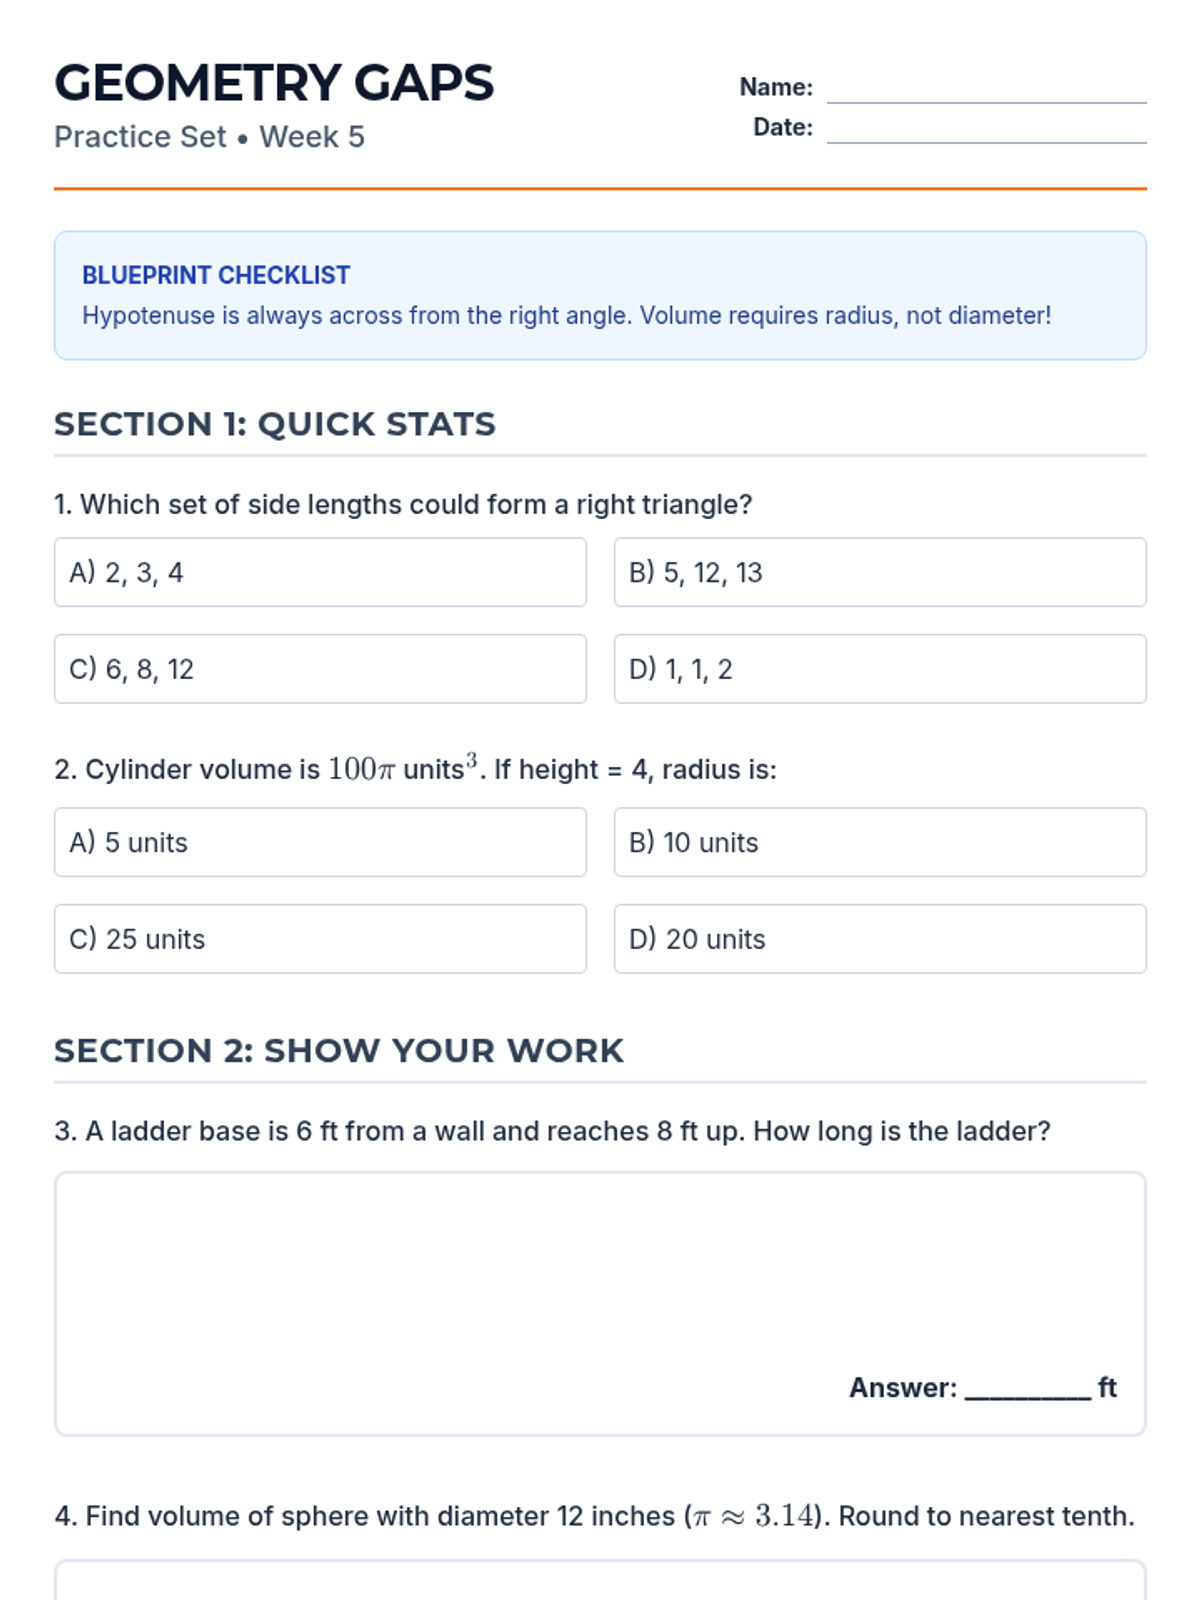
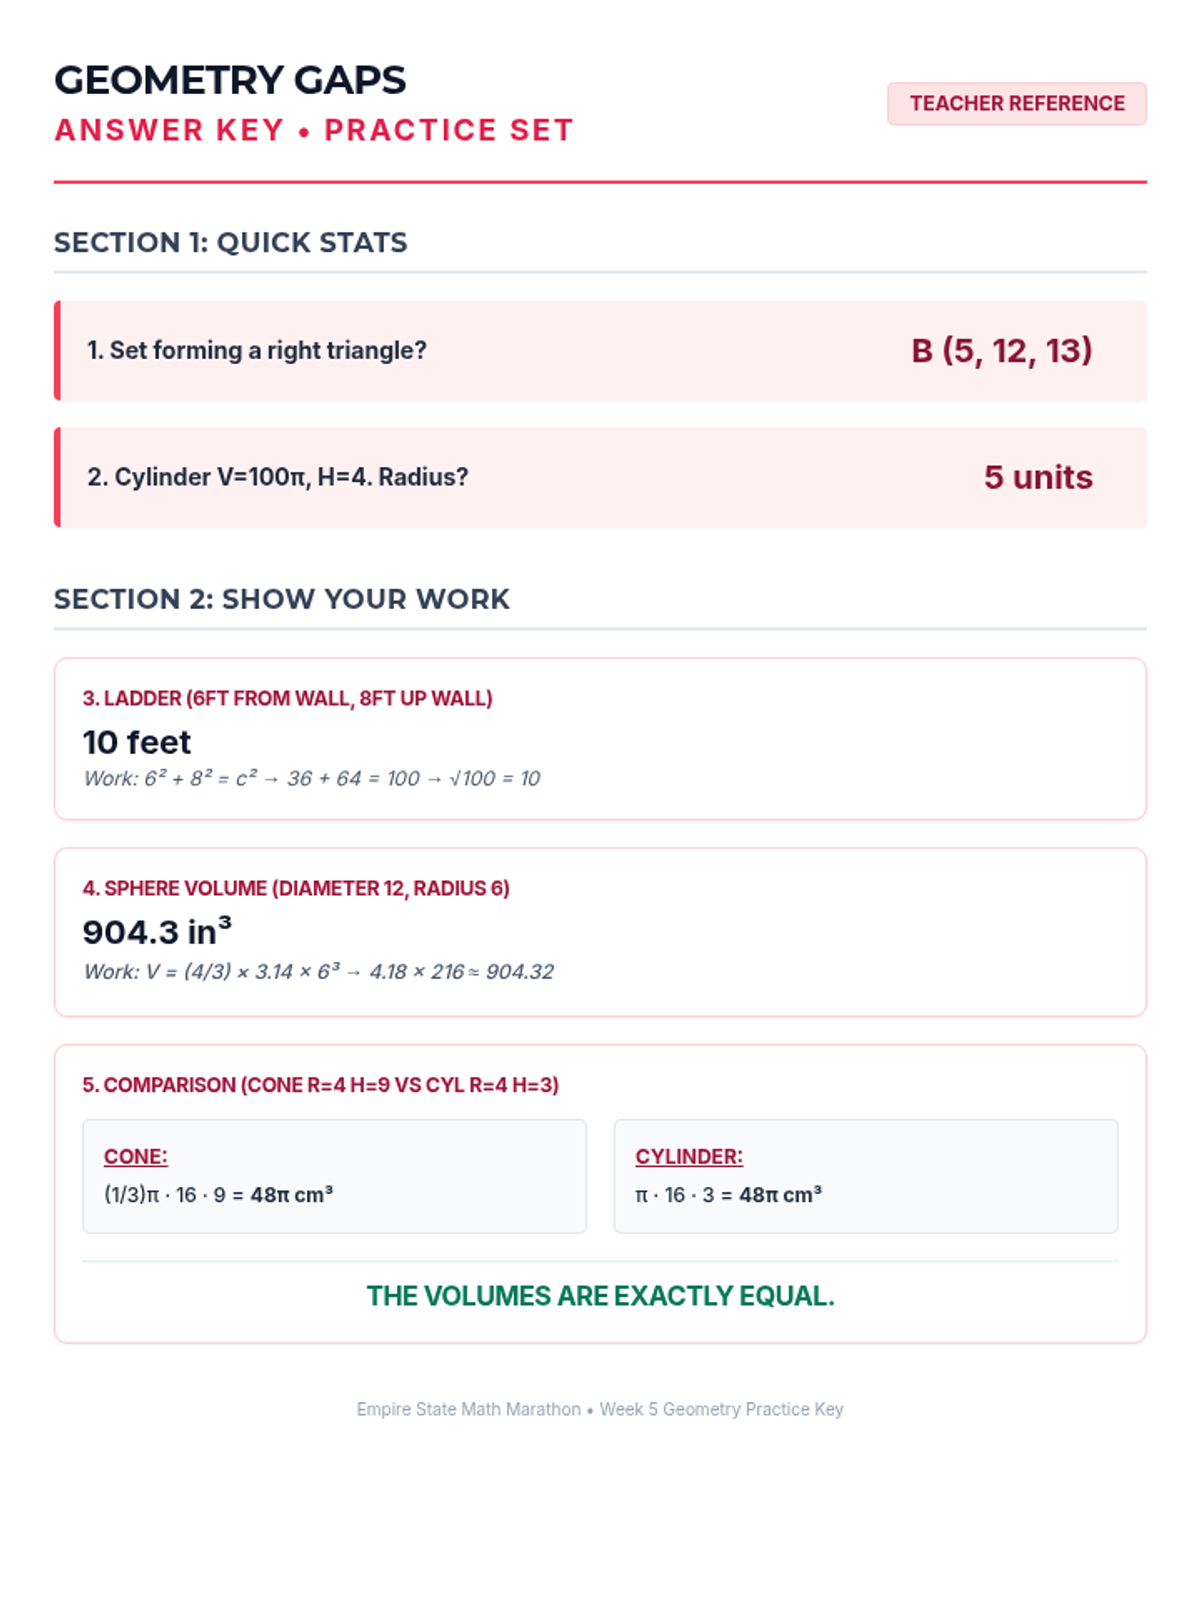
Revised 2-page practice set for Week 5. Corrected LaTeX rendering for exponents, improved shape comparison workspace, and consolidated Section 2 layout.
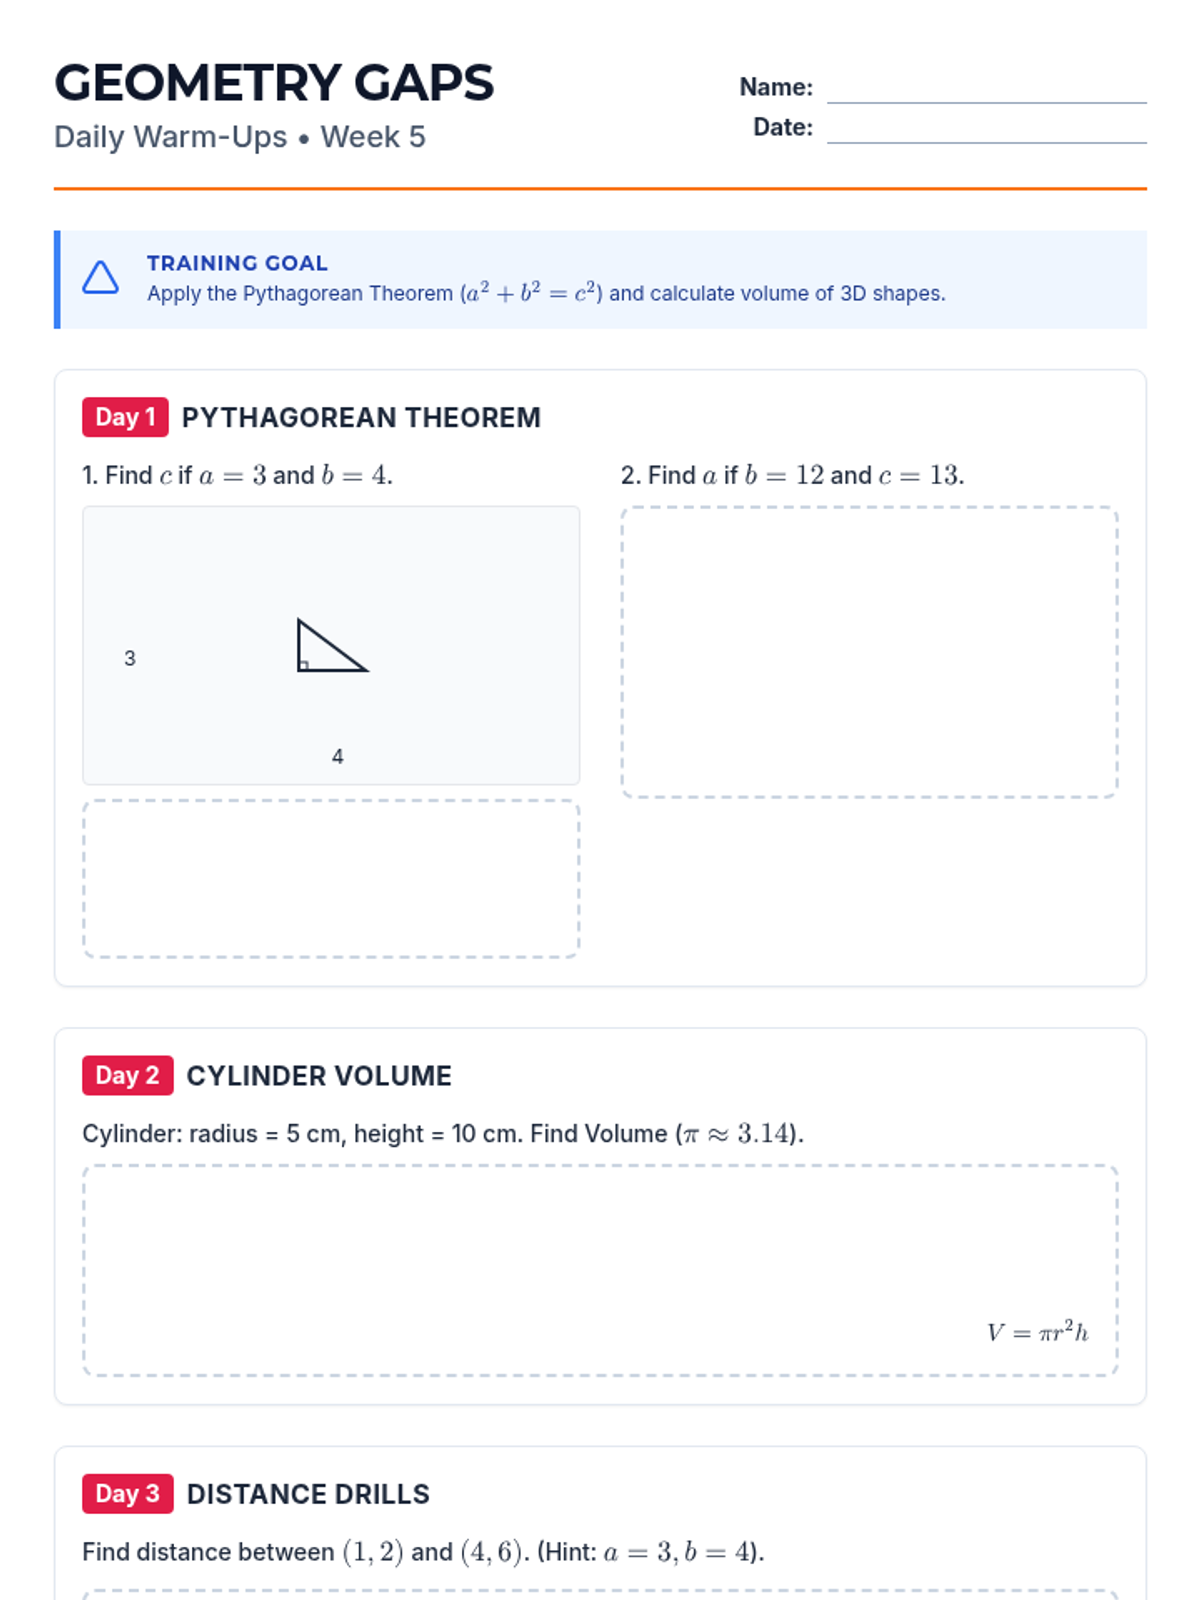
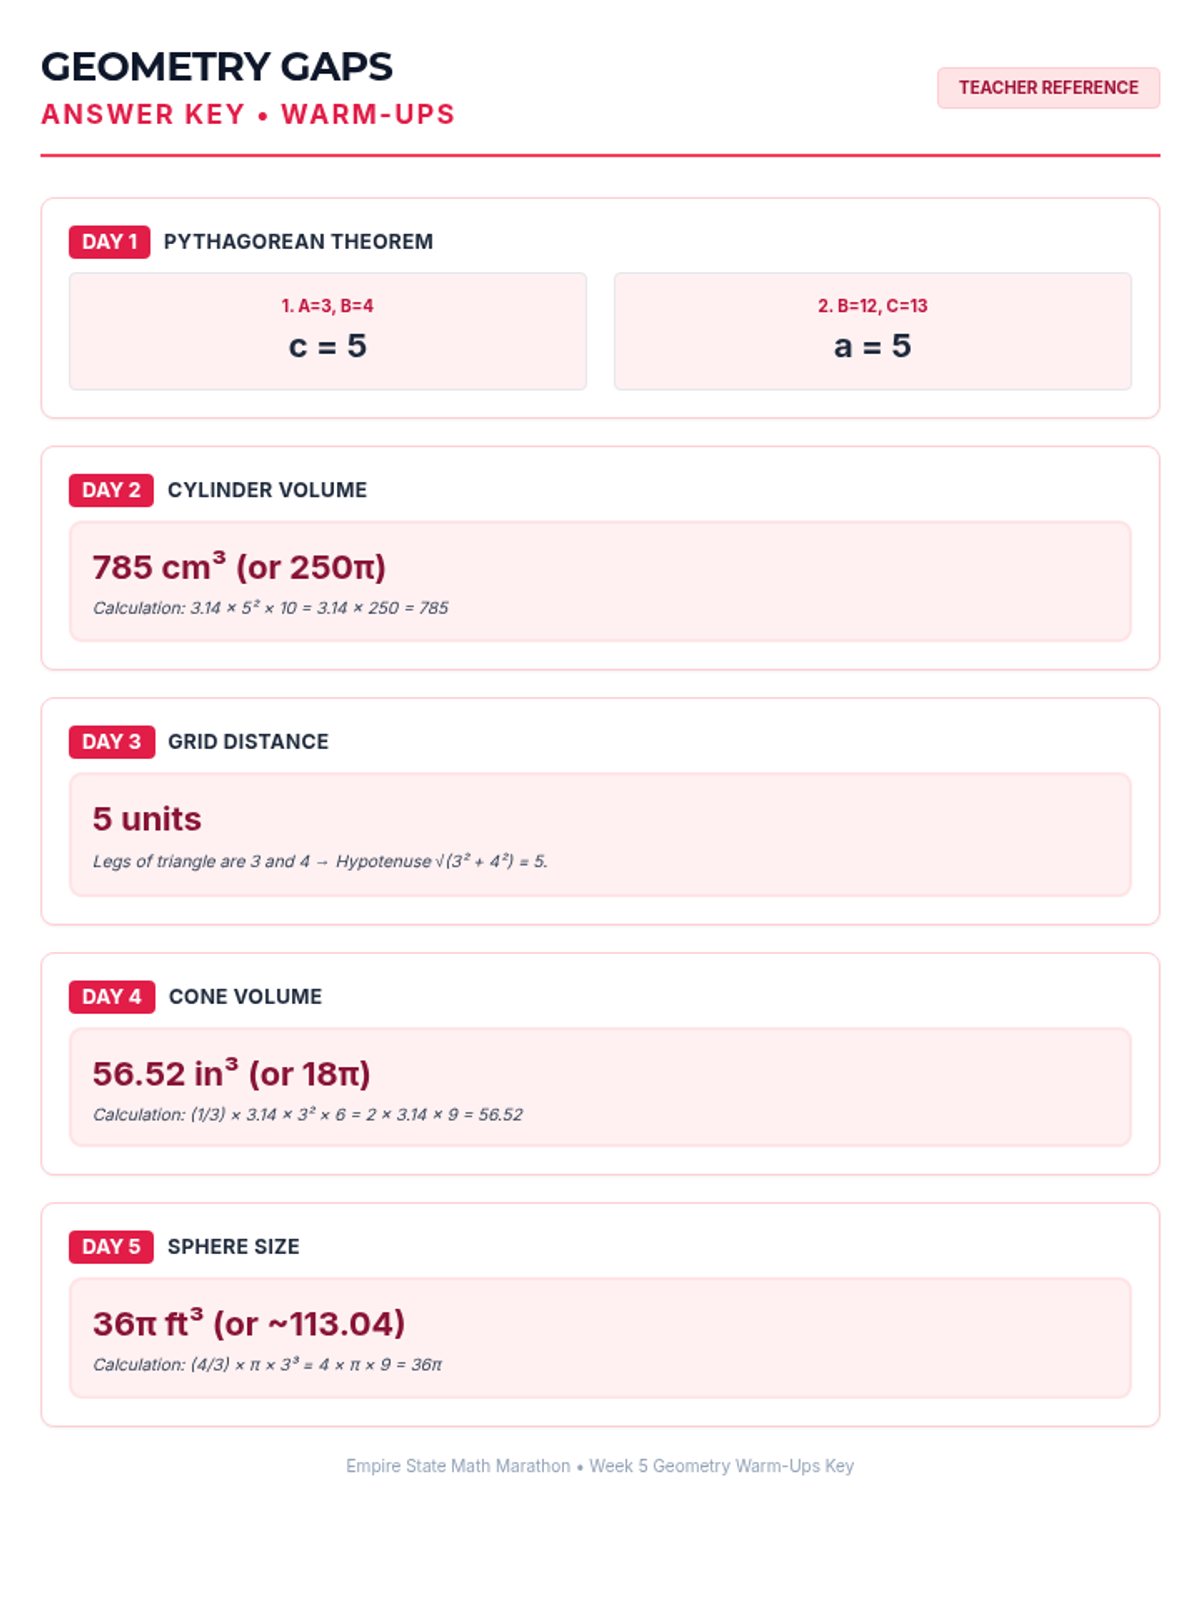
Revised 2-page Warm-Up for Week 5. Fixed LaTeX rendering issues, consolidated layout to fit all days efficiently, and standardized work area heights.
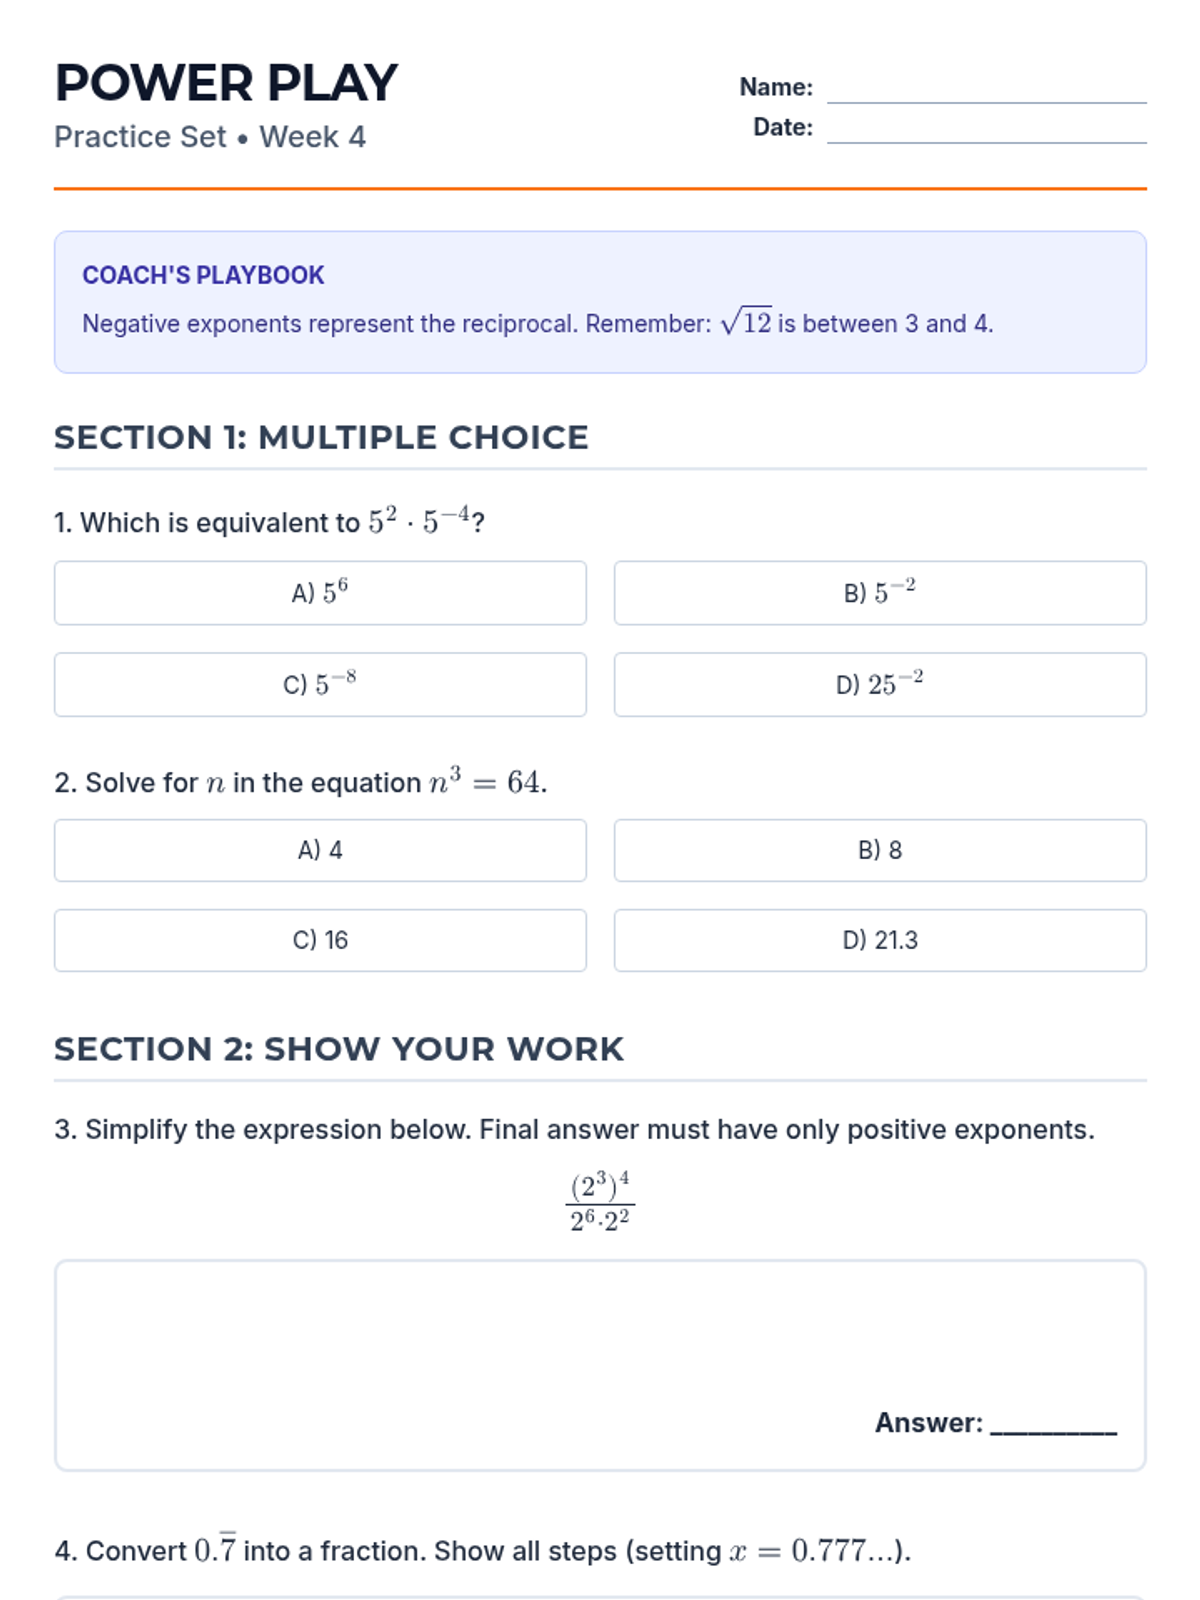
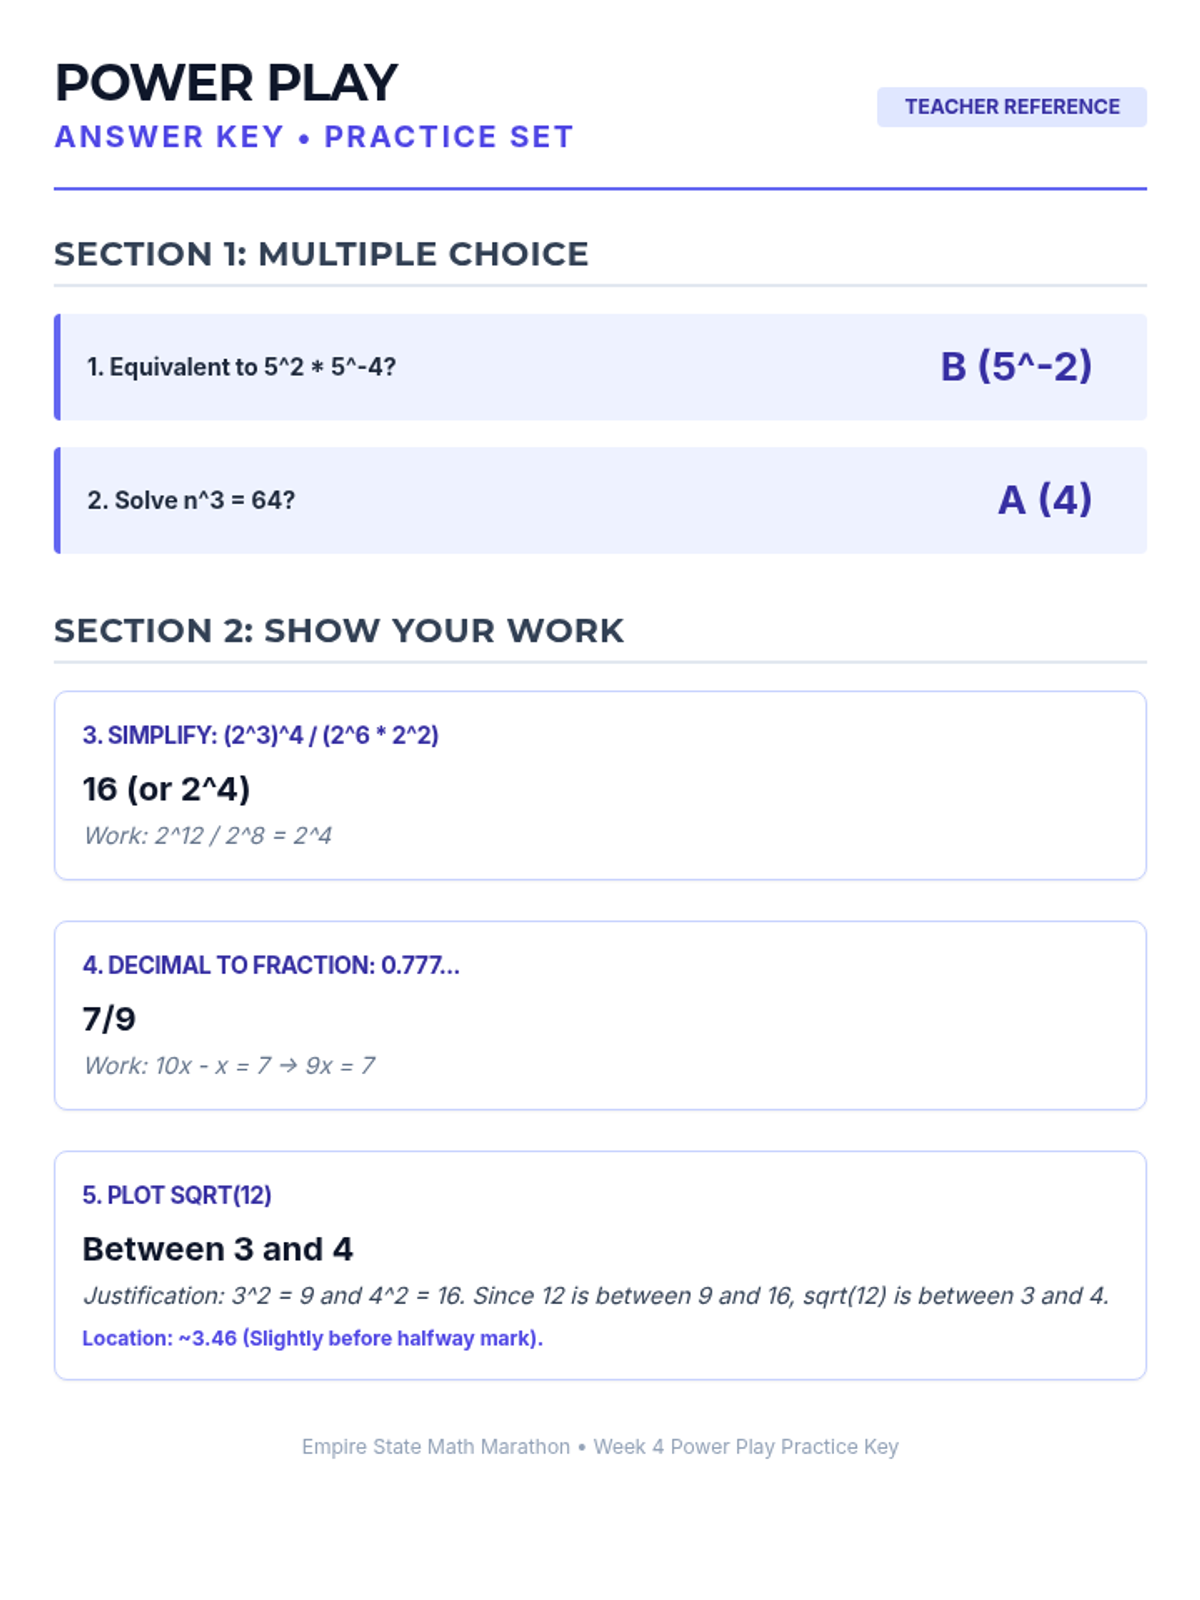
Optimized 2-page practice set for Week 4. Standardized work area heights to fit all content on two pages and improved SVG number line scale and labels.
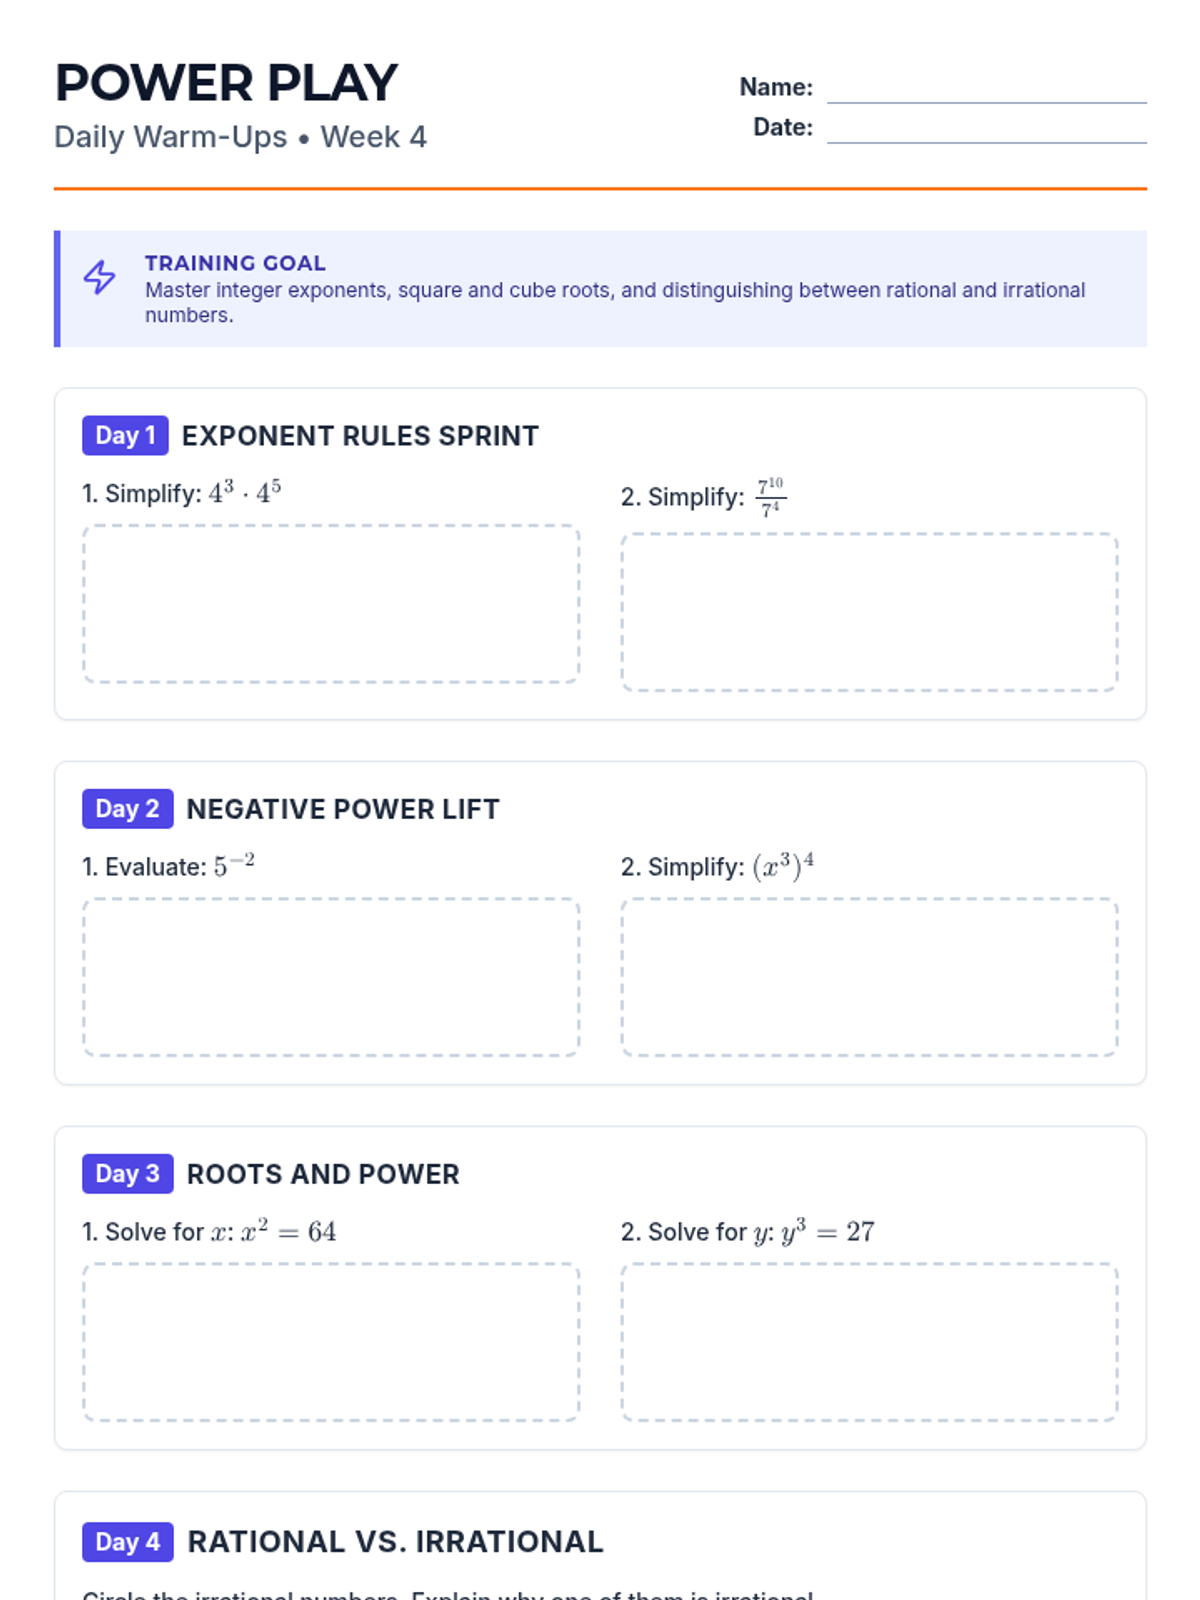
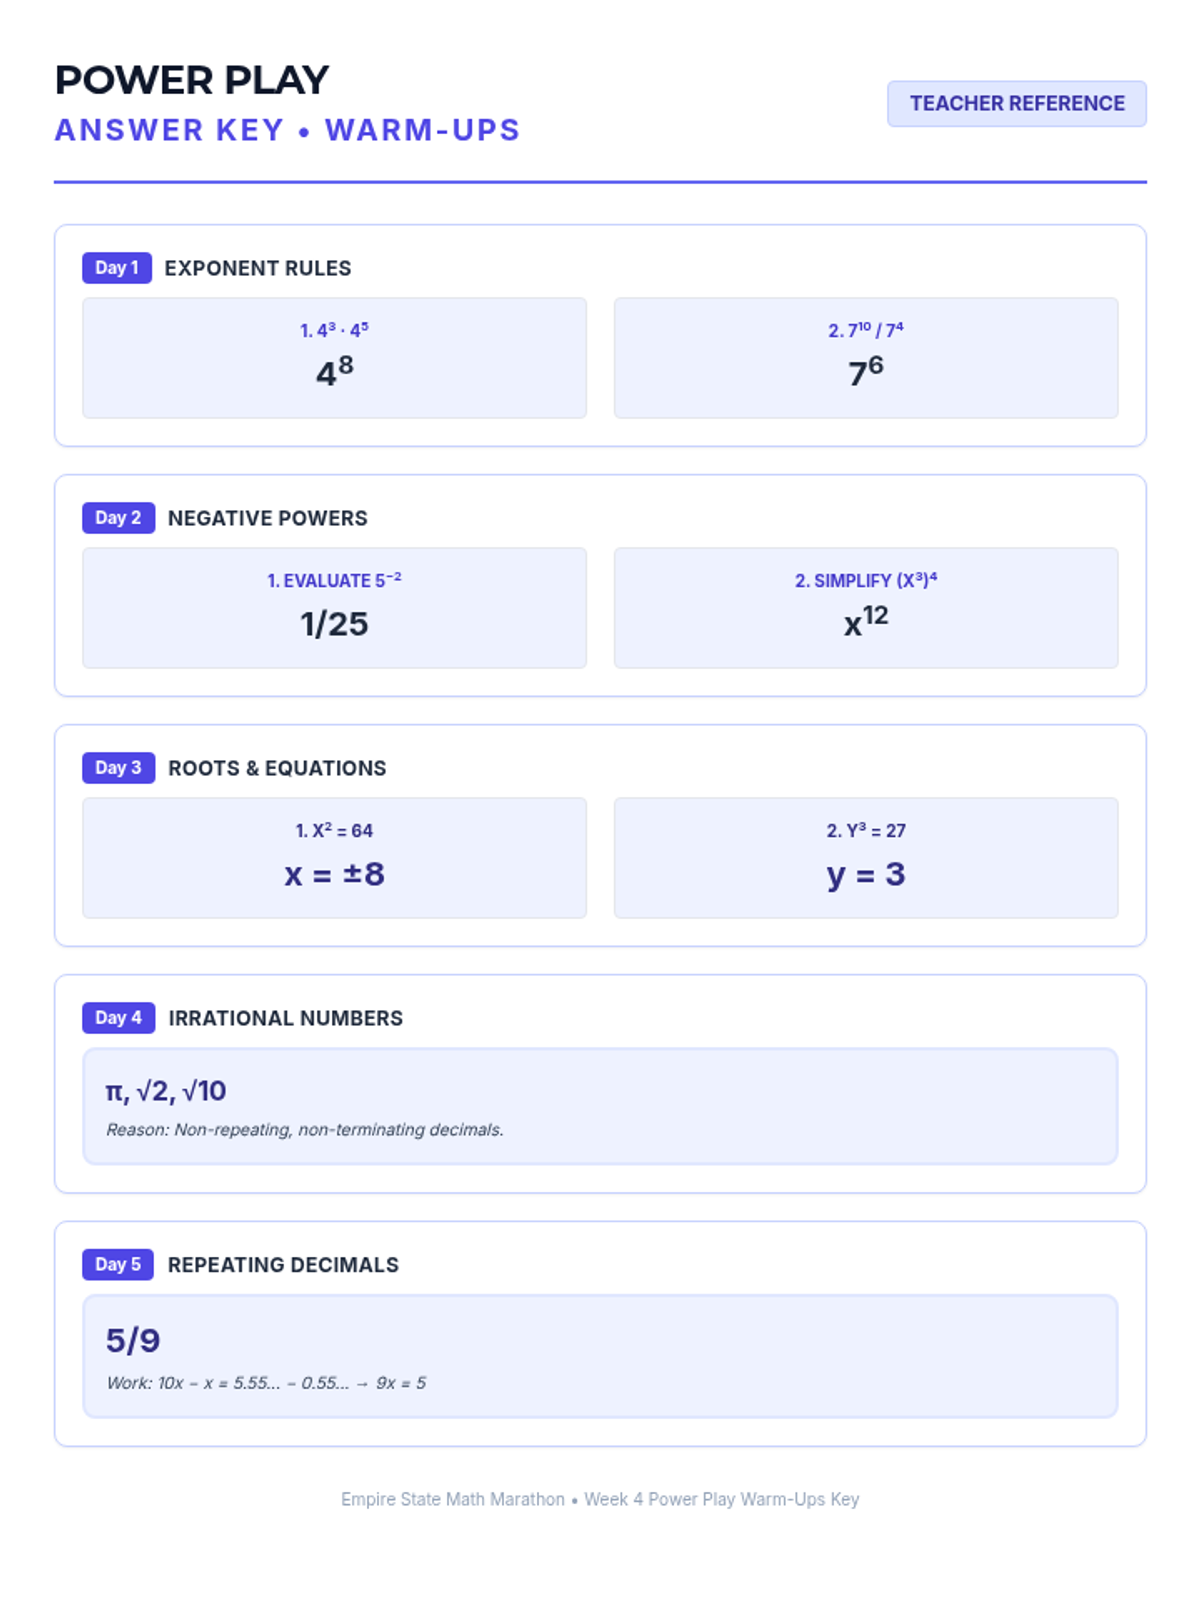
Revised 2-page Warm-Up for Week 4. Replaced scientific notation with square/cube roots and repeating decimal conversions. Improved pagination and font consistency.
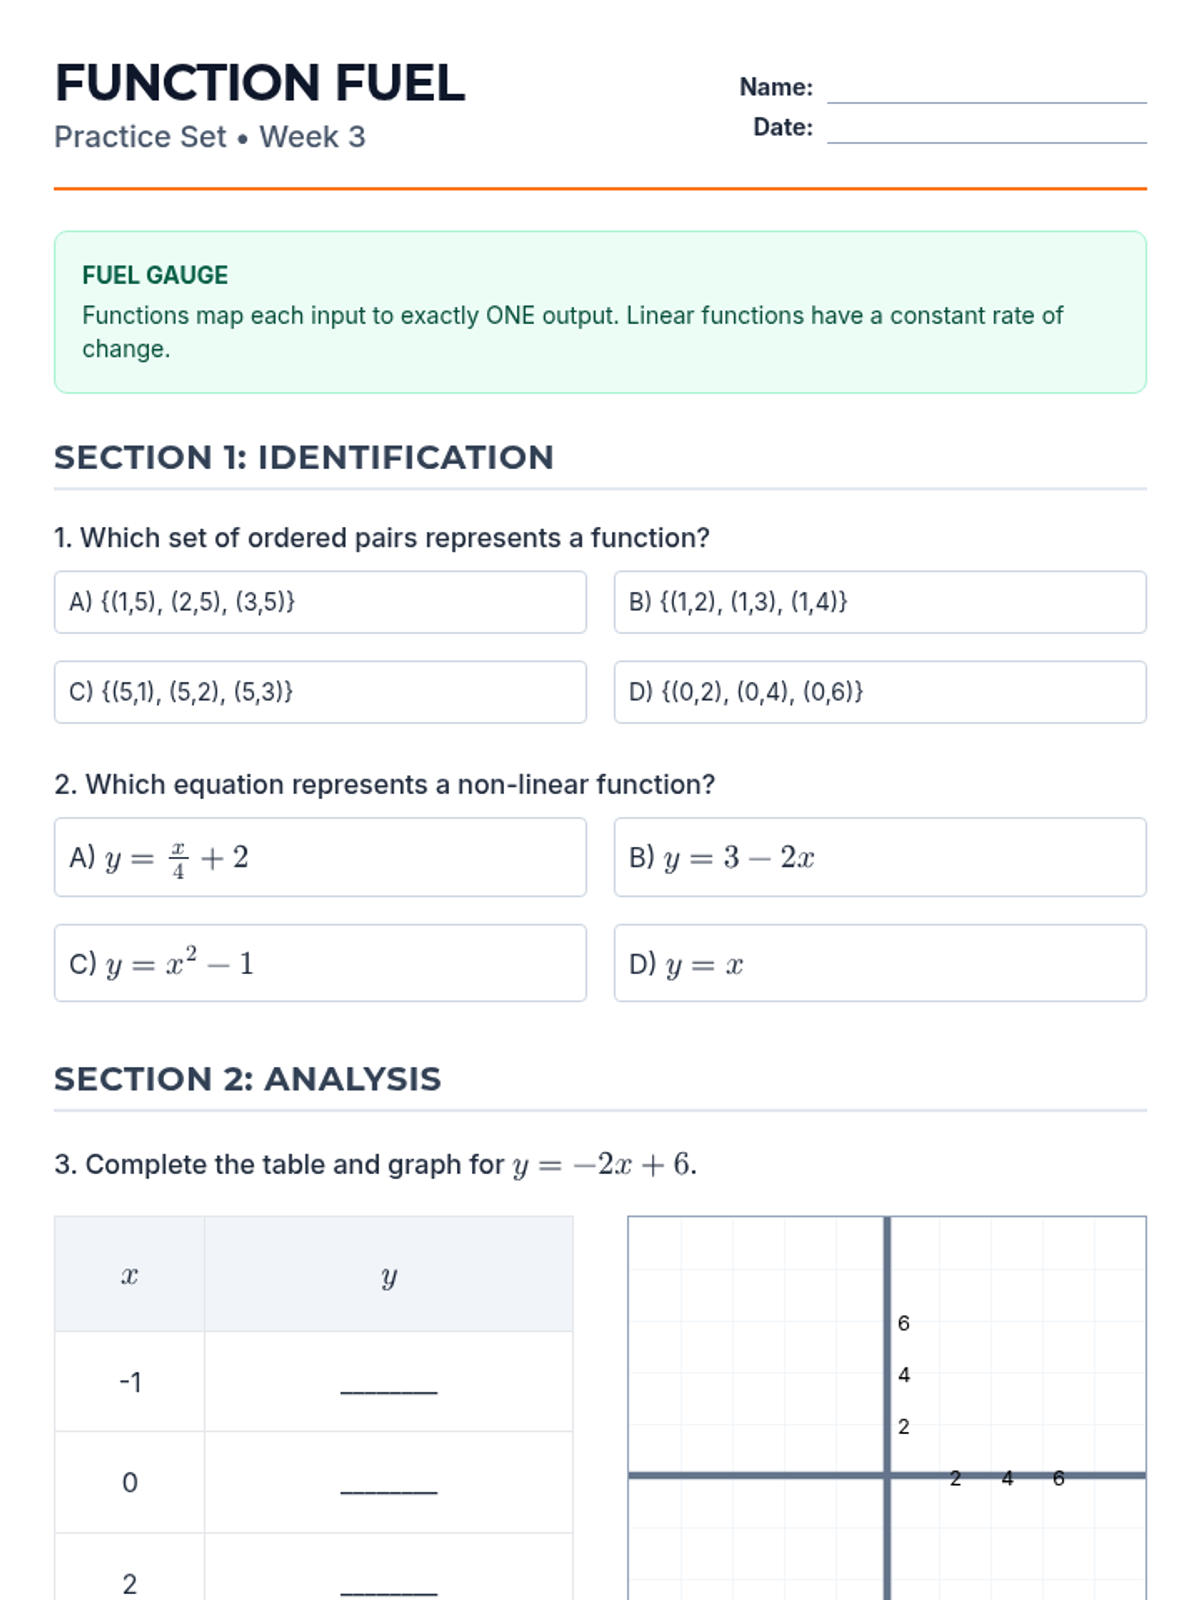
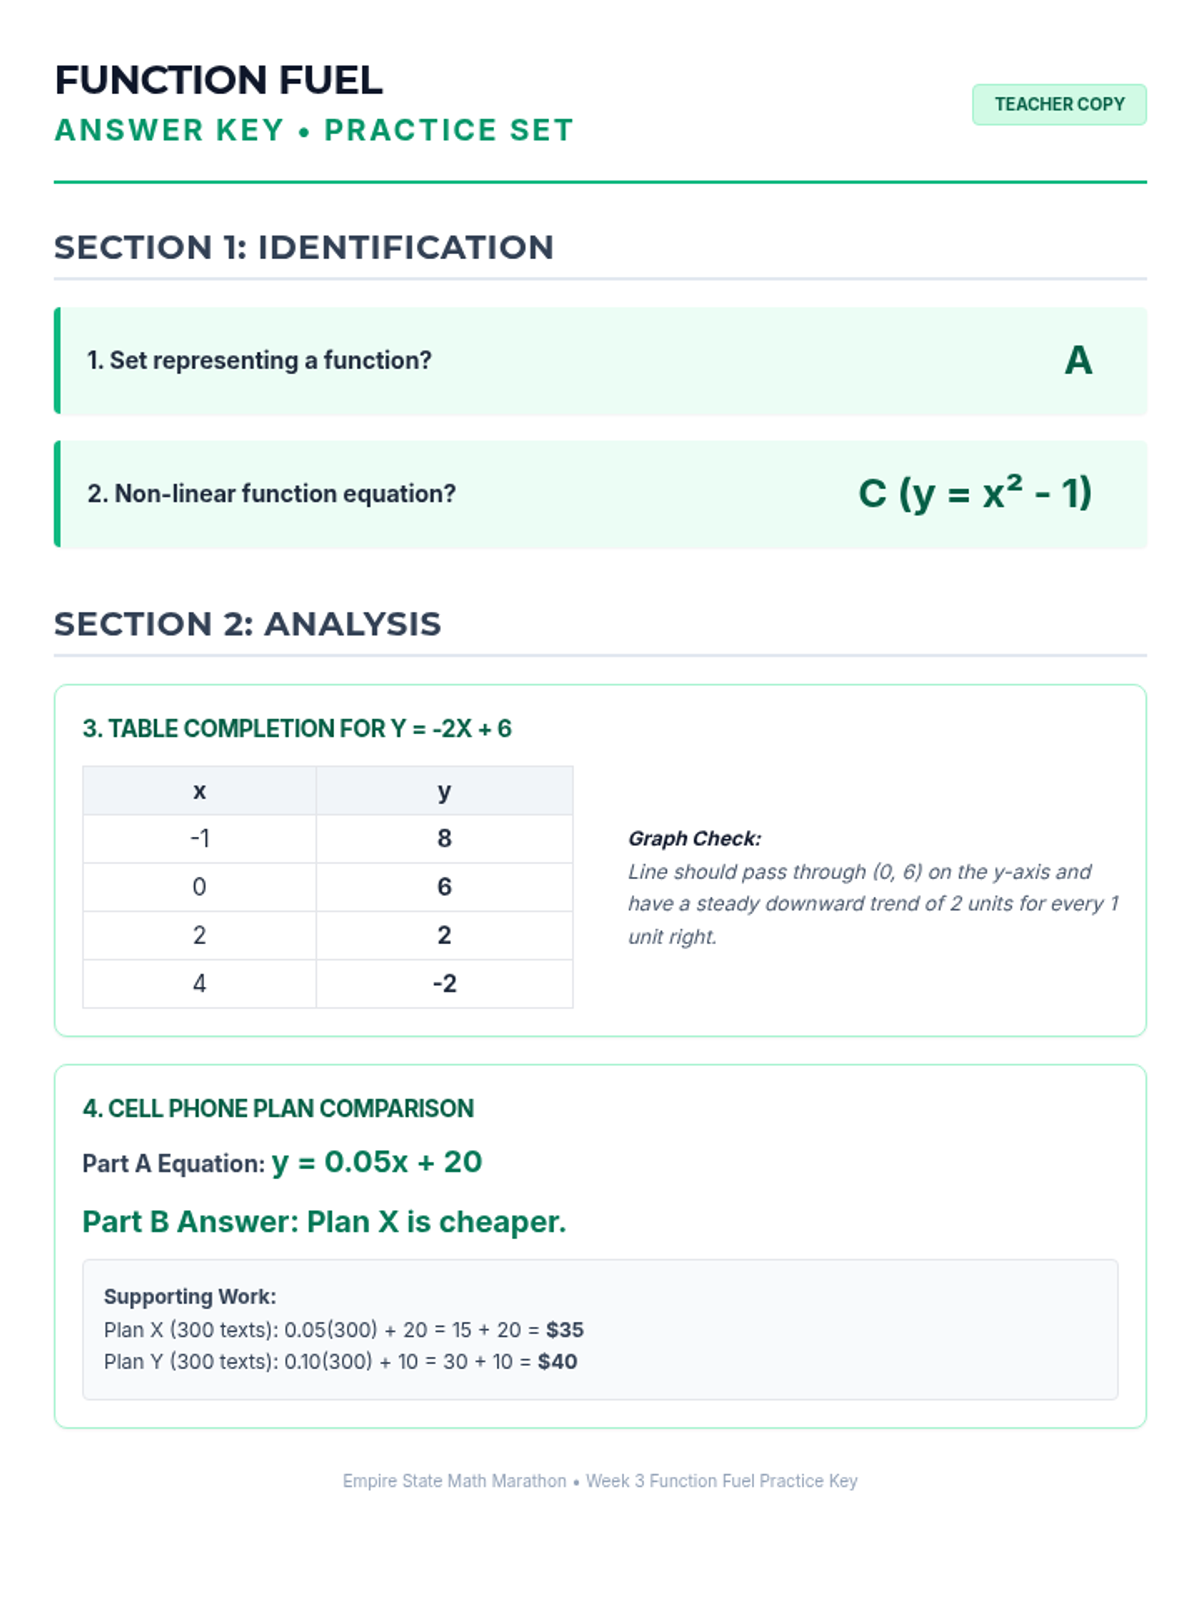
Revised 2-page practice set for Week 3. Improved coordinate plane with numerical labels, corrected font sizes, and consolidated layout.
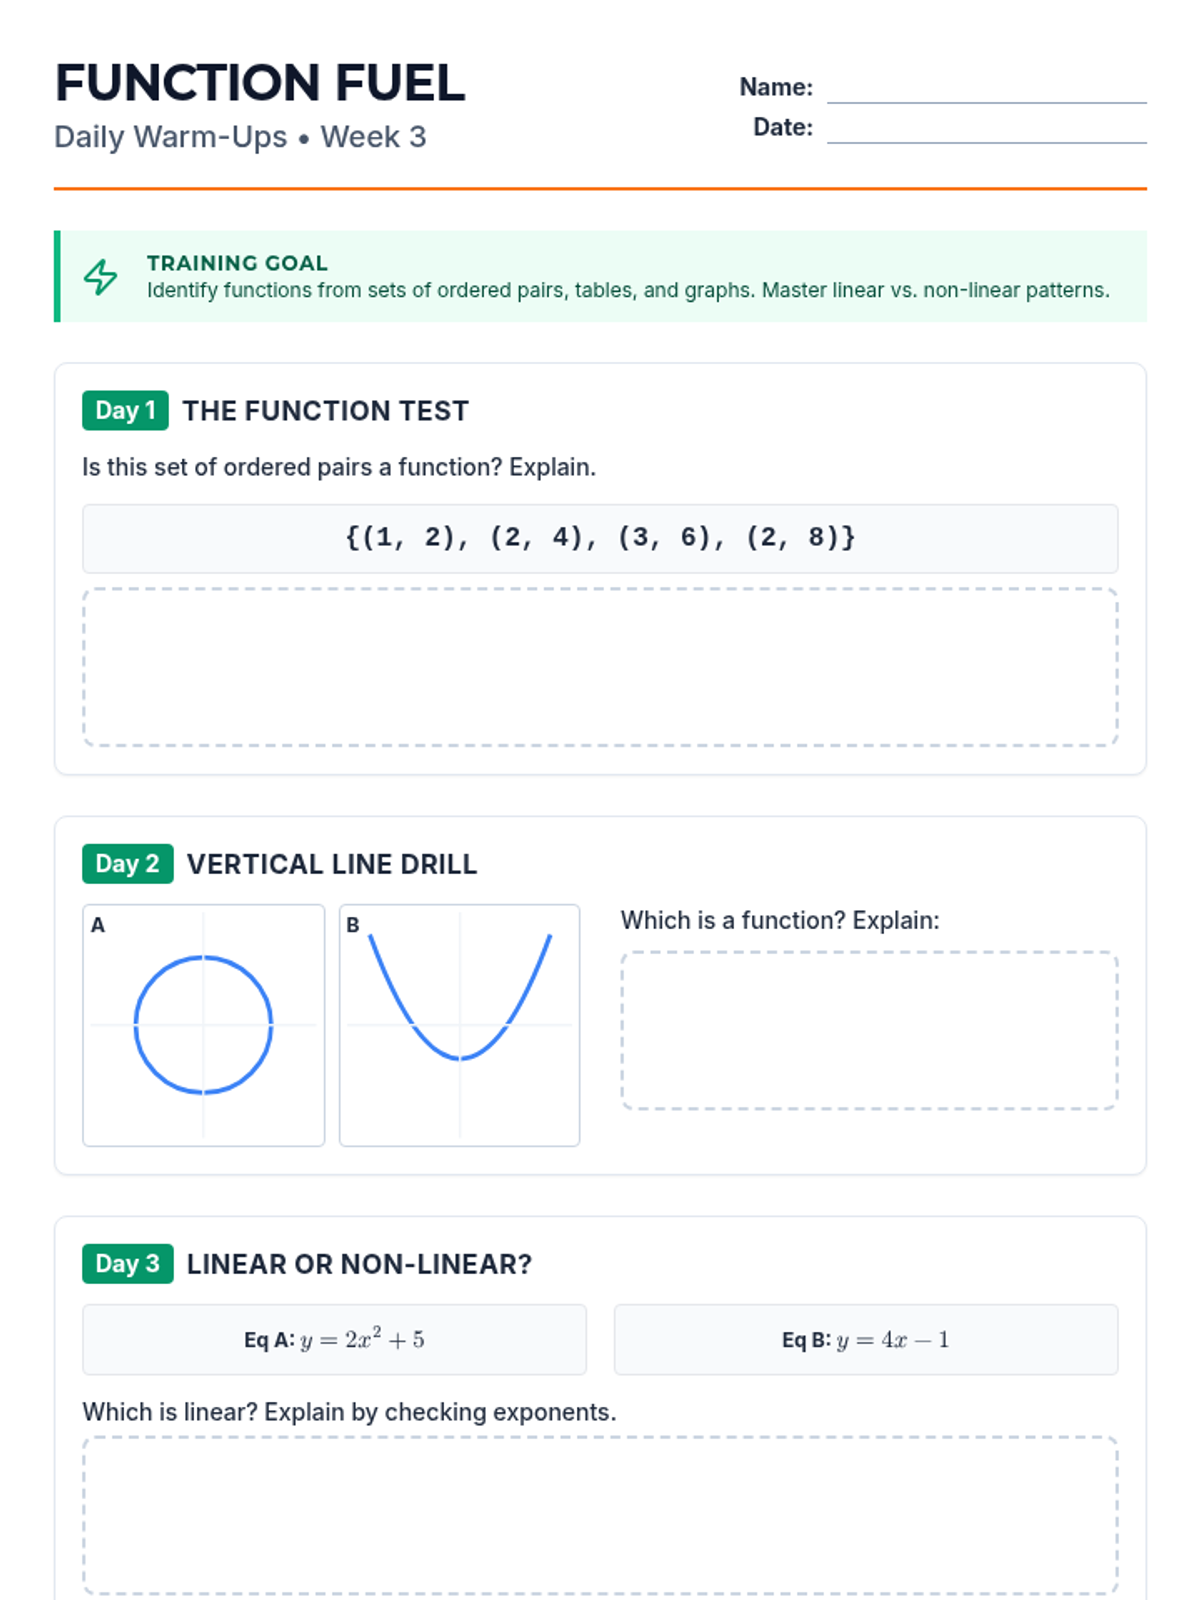
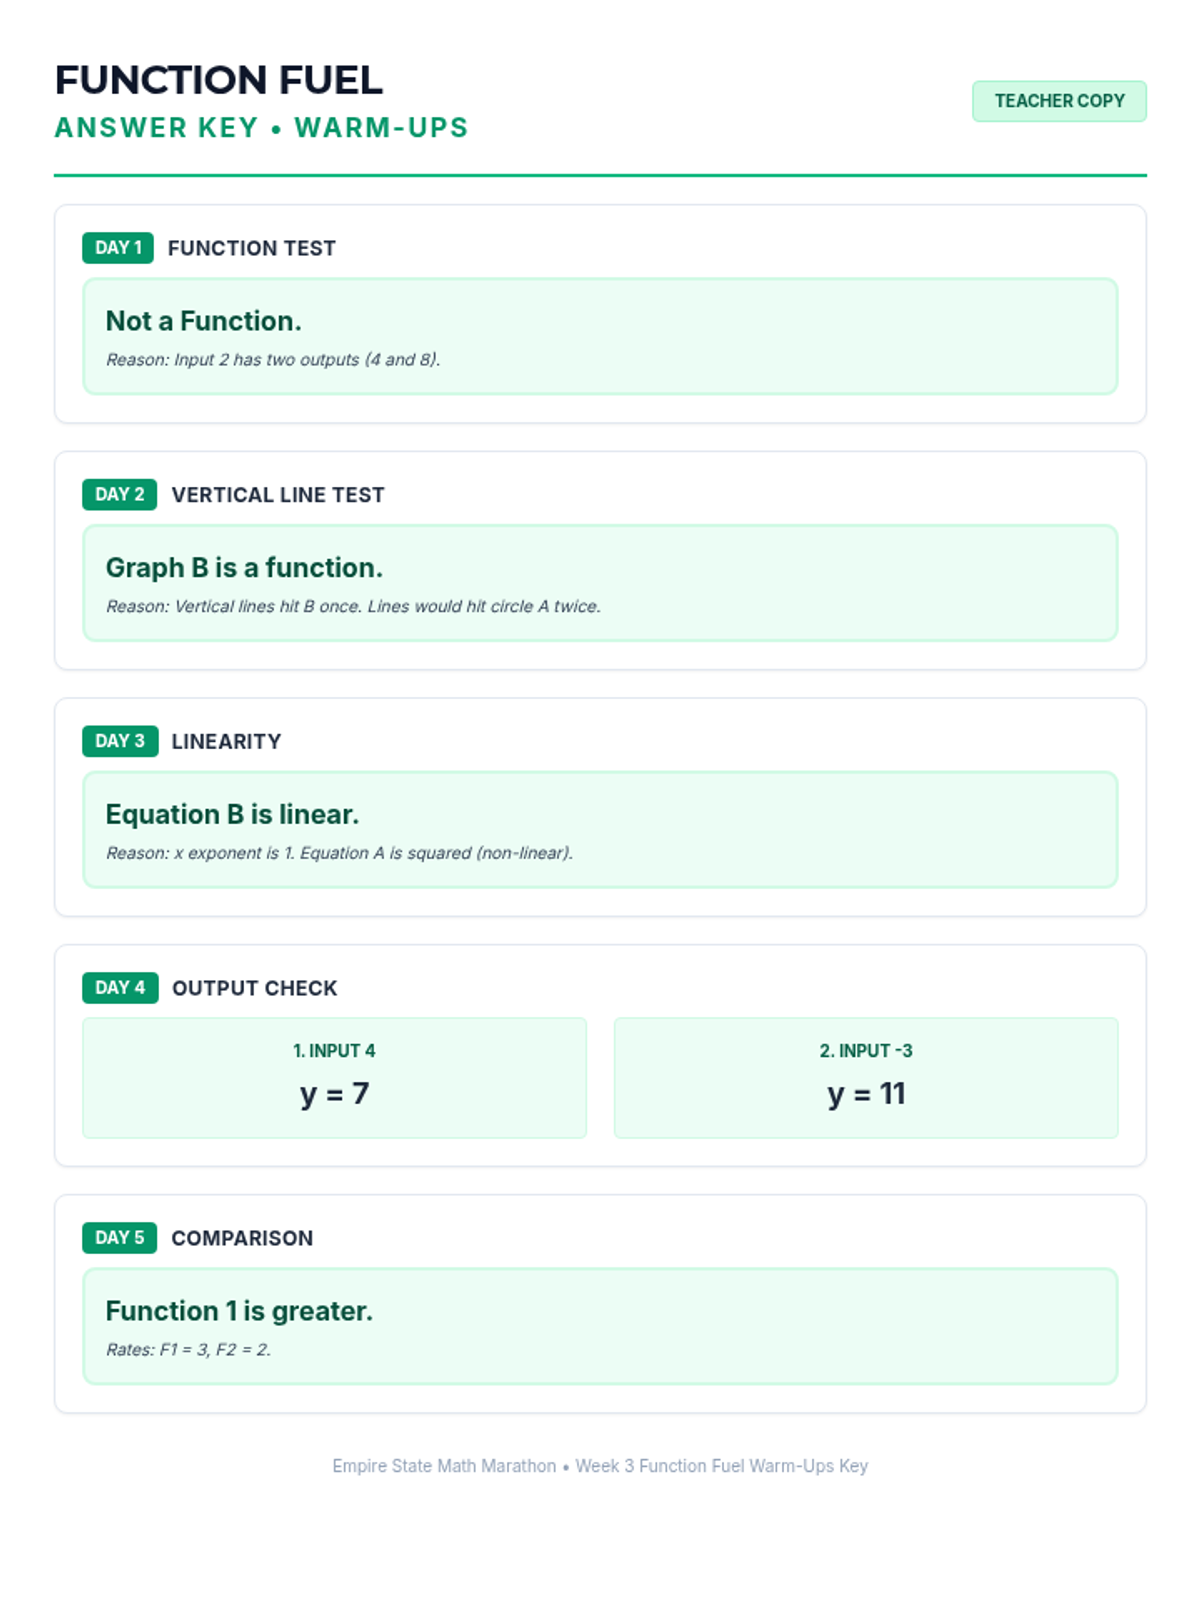
Revised 2-page Warm-Up for Week 3. Consolidated layout, fixed overlapping Day 2 elements, and improved work area contrast for better printing.
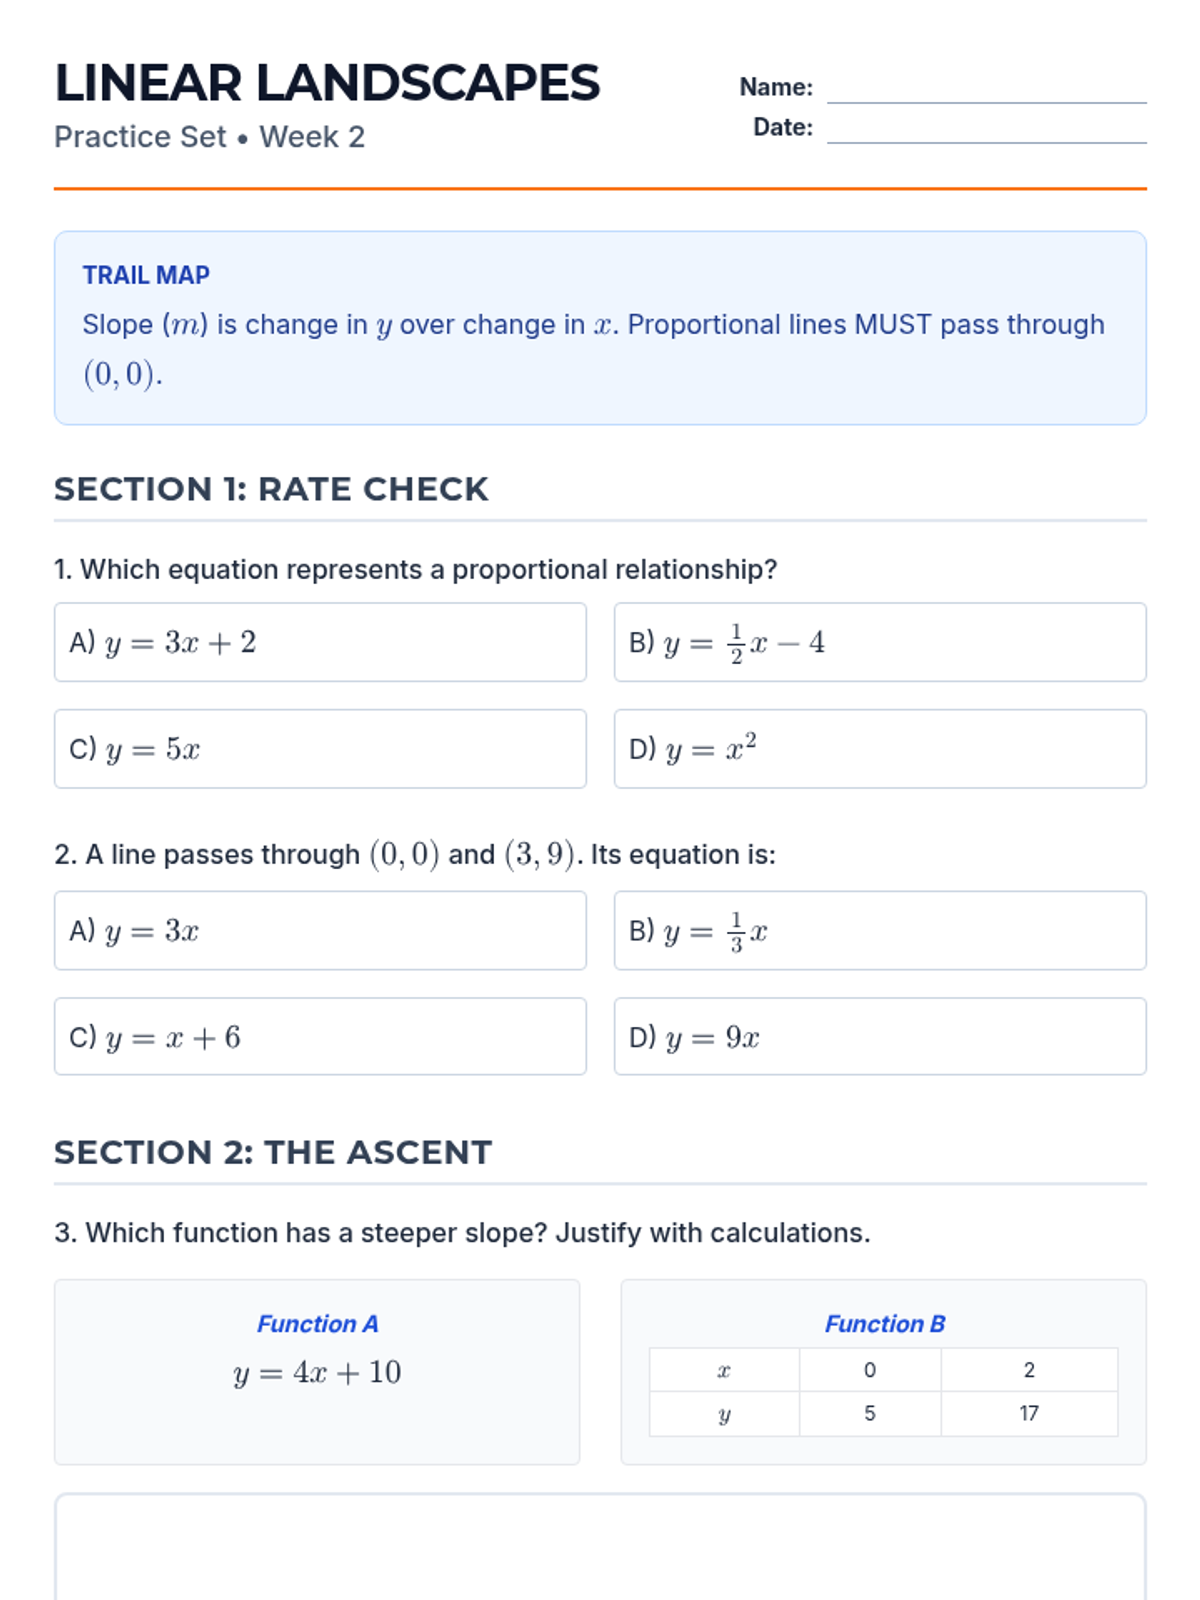
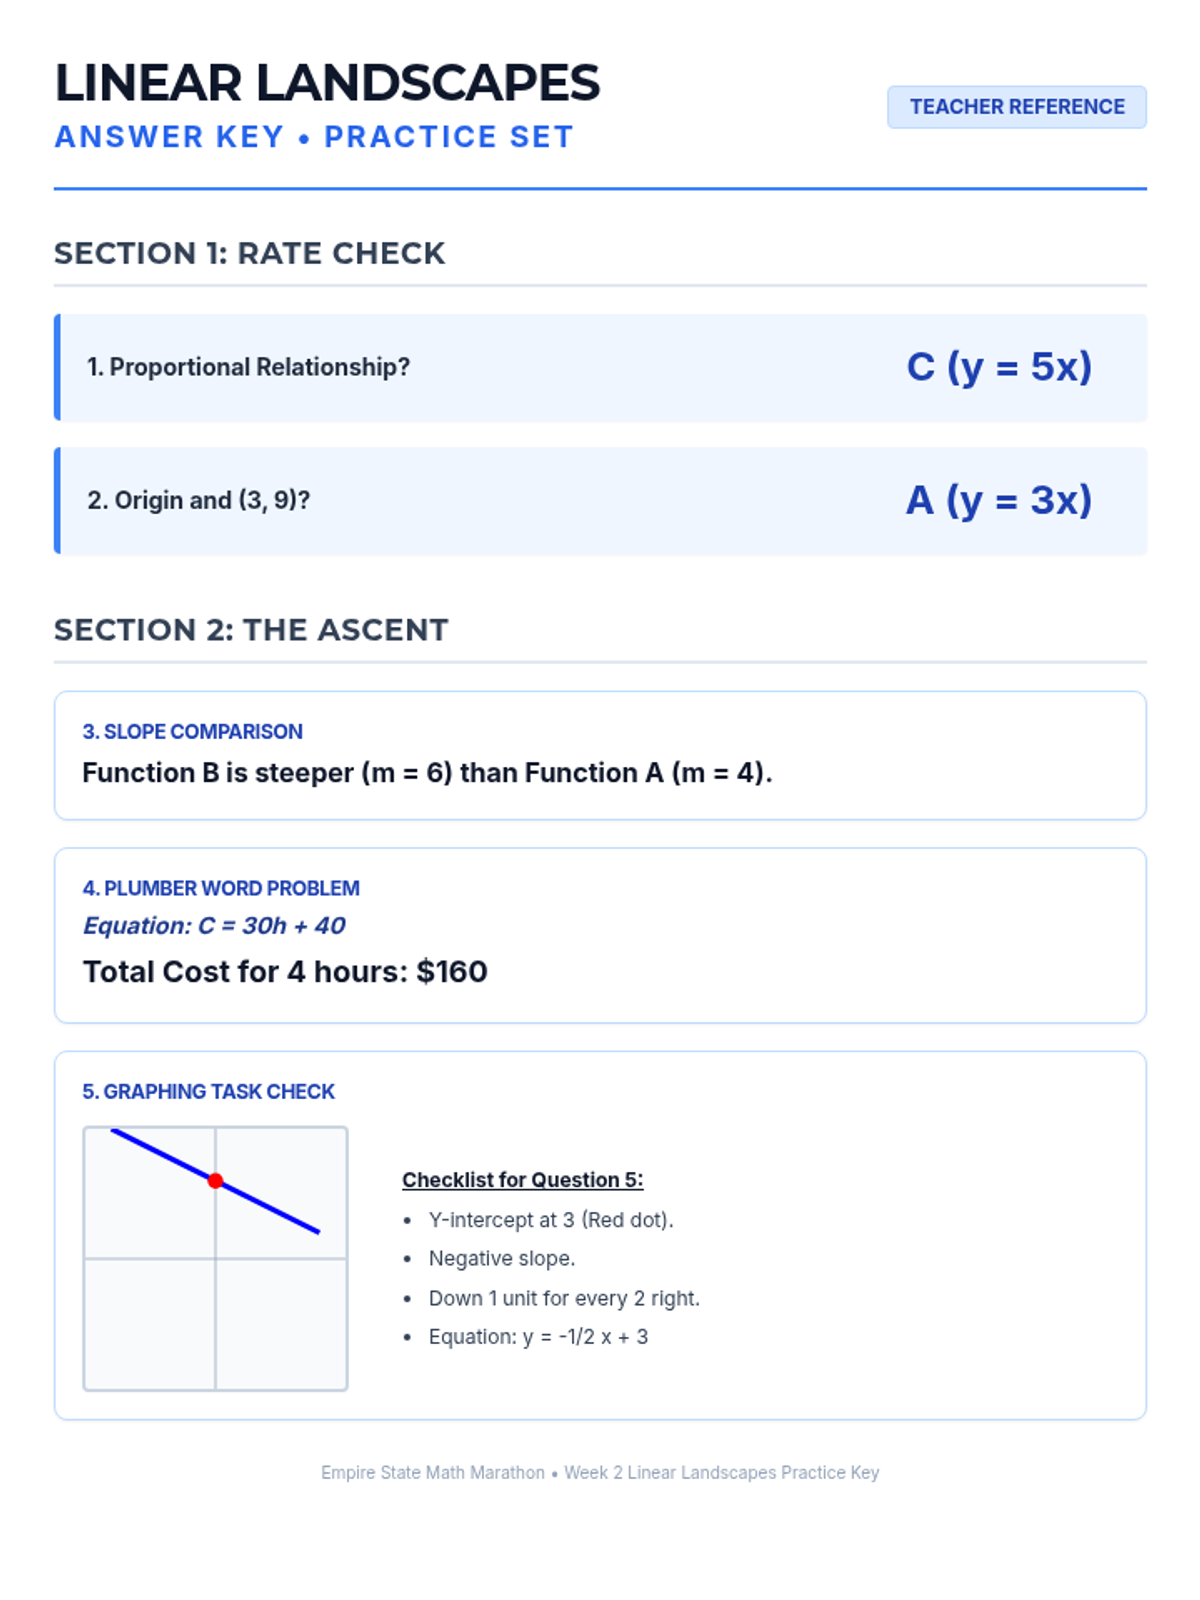
Revised 2-page practice set for Week 2. Fixed pagination, added numerical scale to coordinate plane, and improved the layout of word problems.
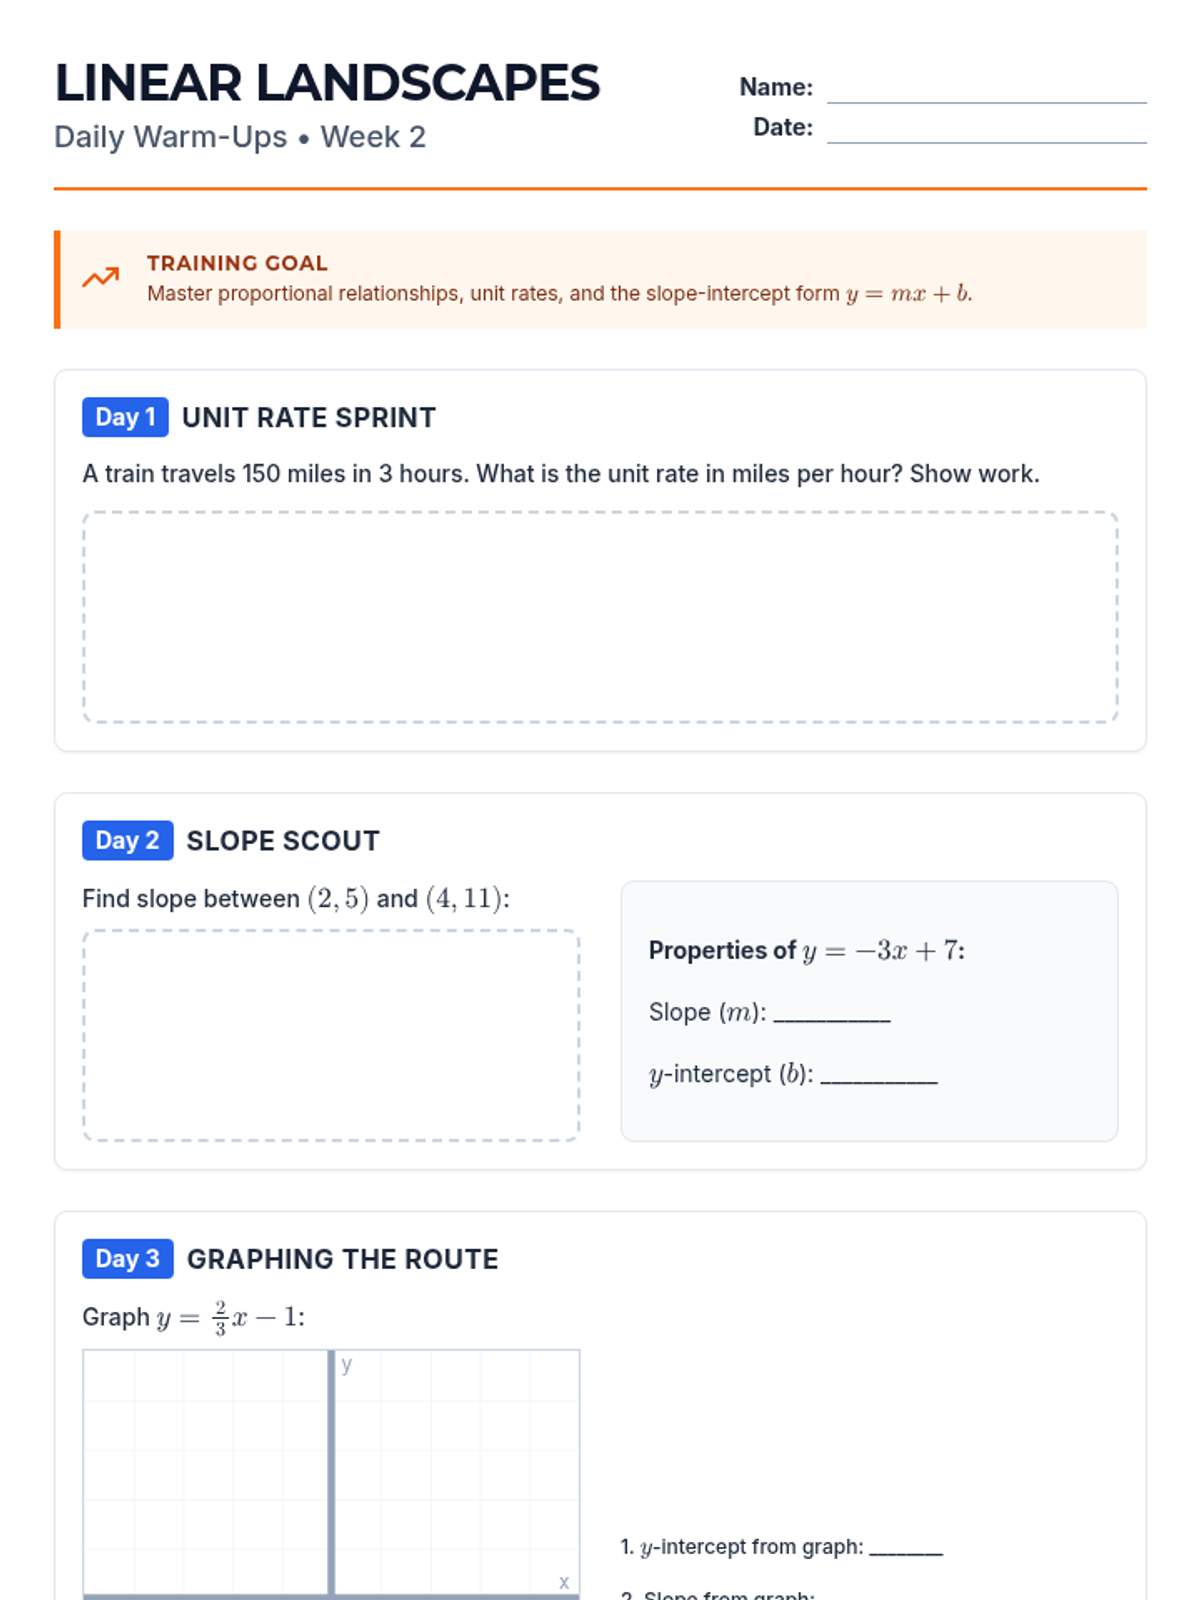
Revised 2-page Warm-Up for Week 2. Fixed pagination, added scale to coordinate plane, and improved the response area for slope identification.
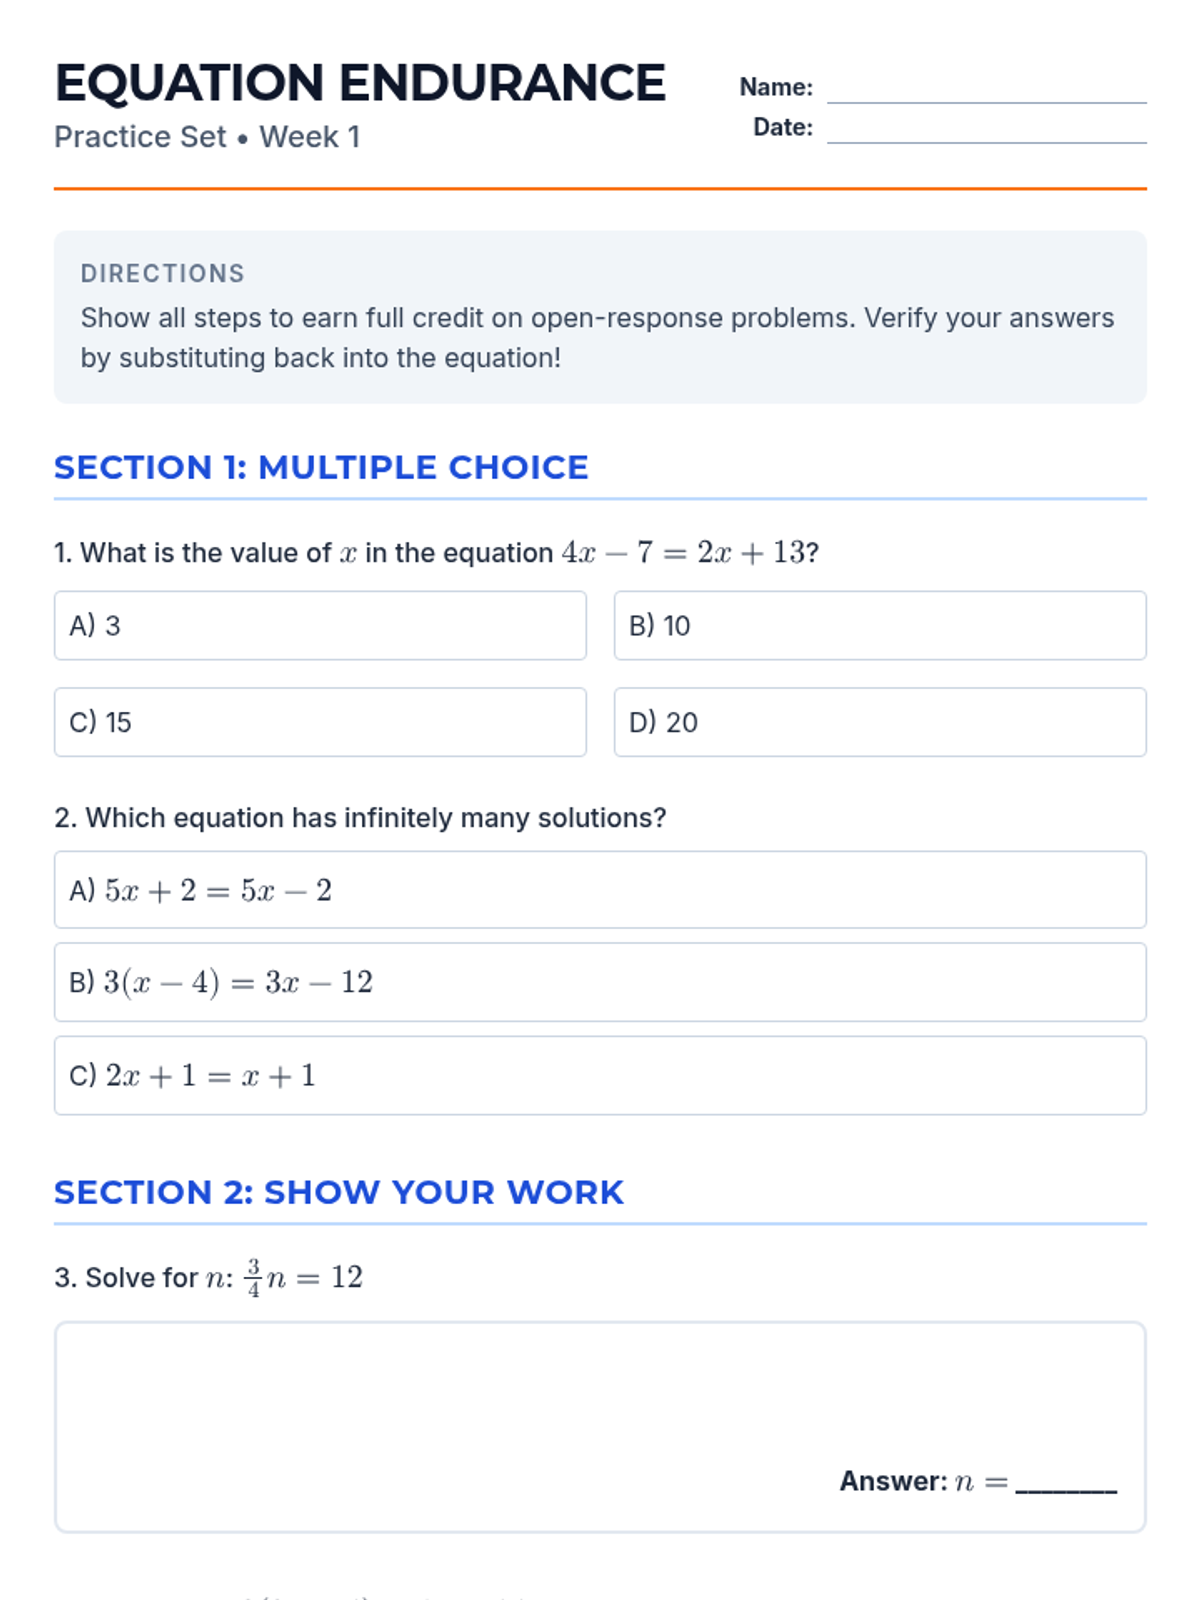
Revised 2-page practice set for Week 1. Consolidated layout to avoid orphaned headers and added specific answer lines.
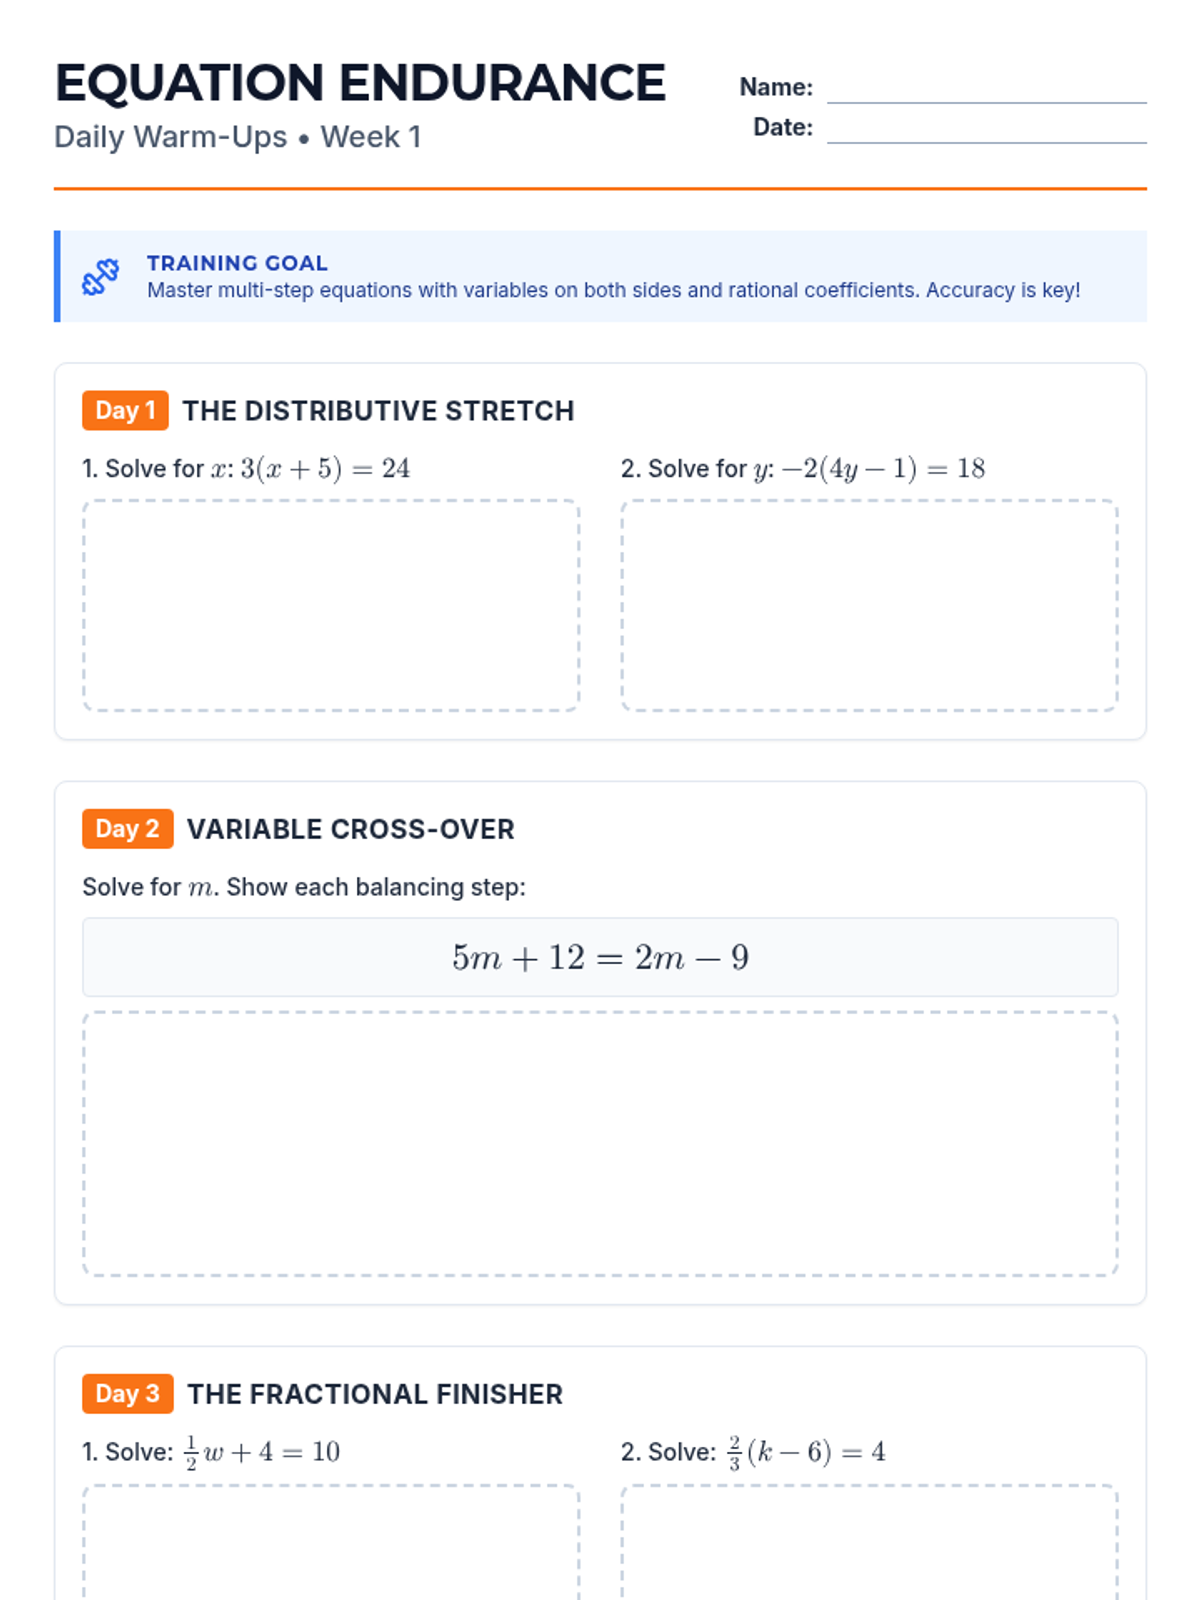
Condensed and polished 2-page Warm-Up for Week 1. Fixed pagination issues and improved work area contrast for printing.
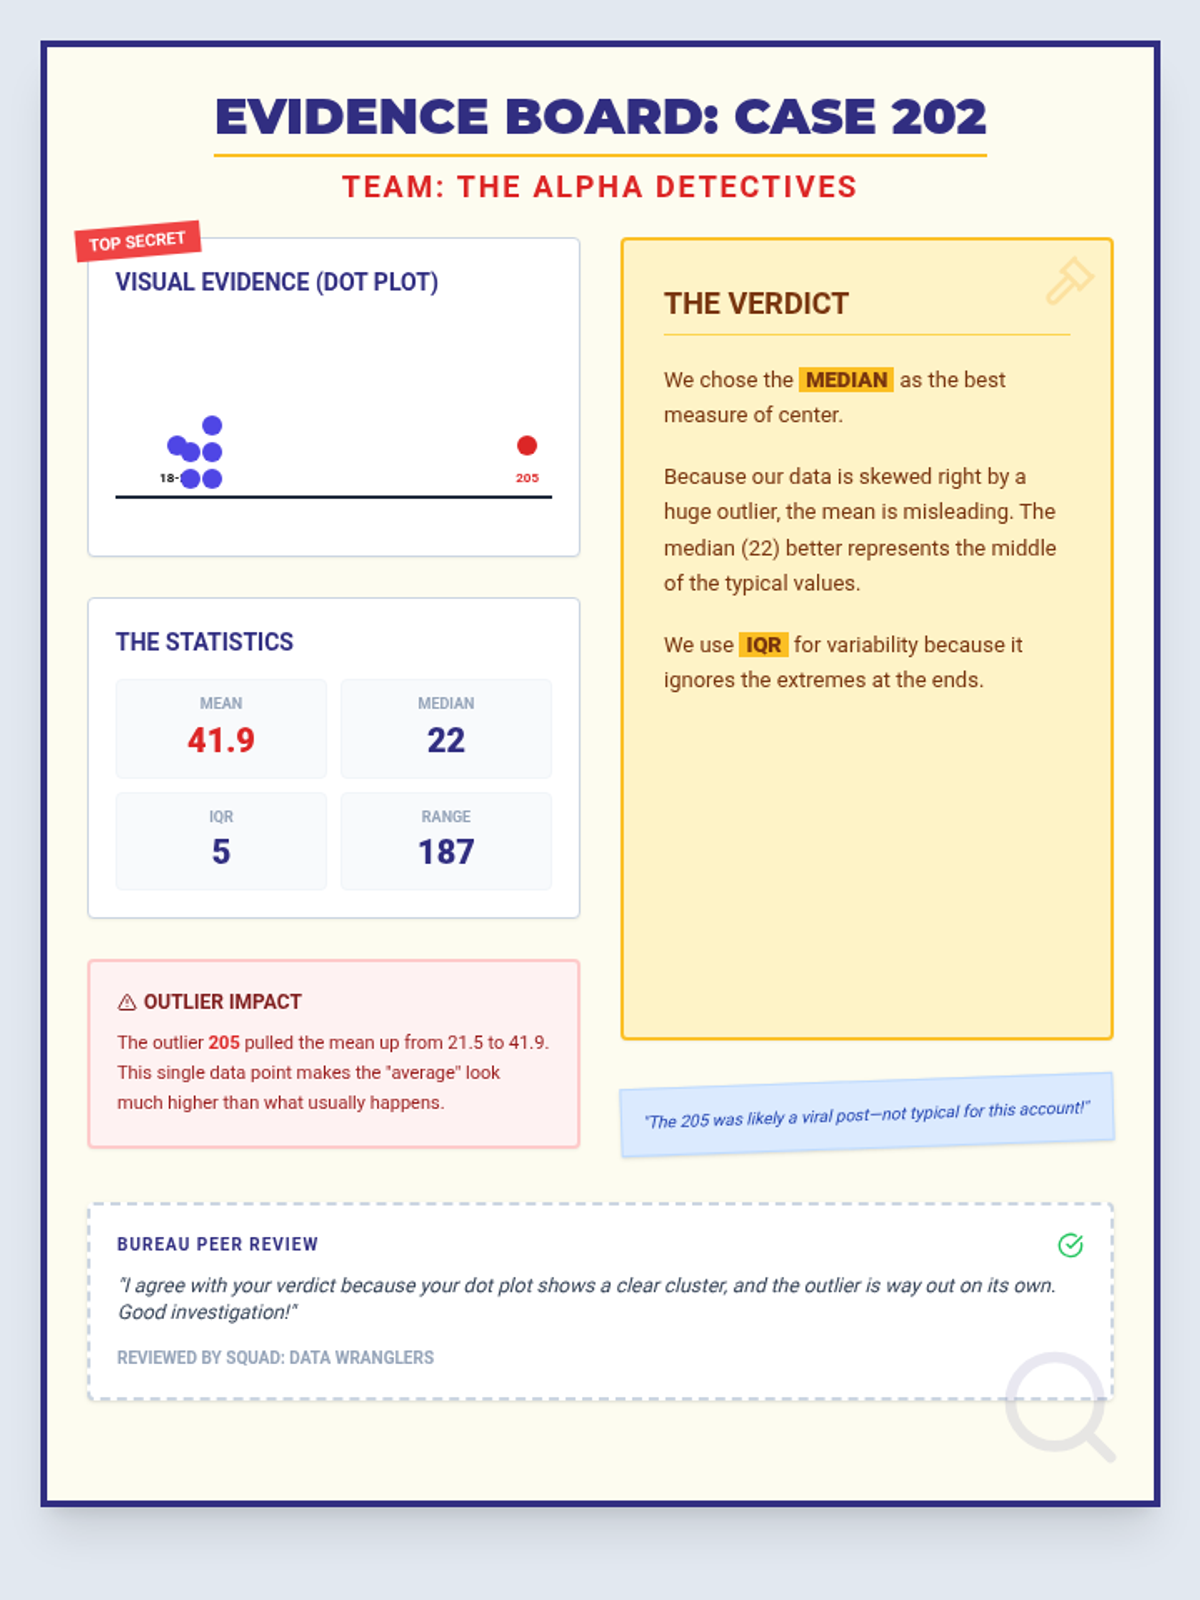
A visual example and mockup of a completed 'Evidence Board' poster for Case 202, demonstrating how students should present their visual plot, statistics, verdict, and outlier analysis. Revised for single-page layout.
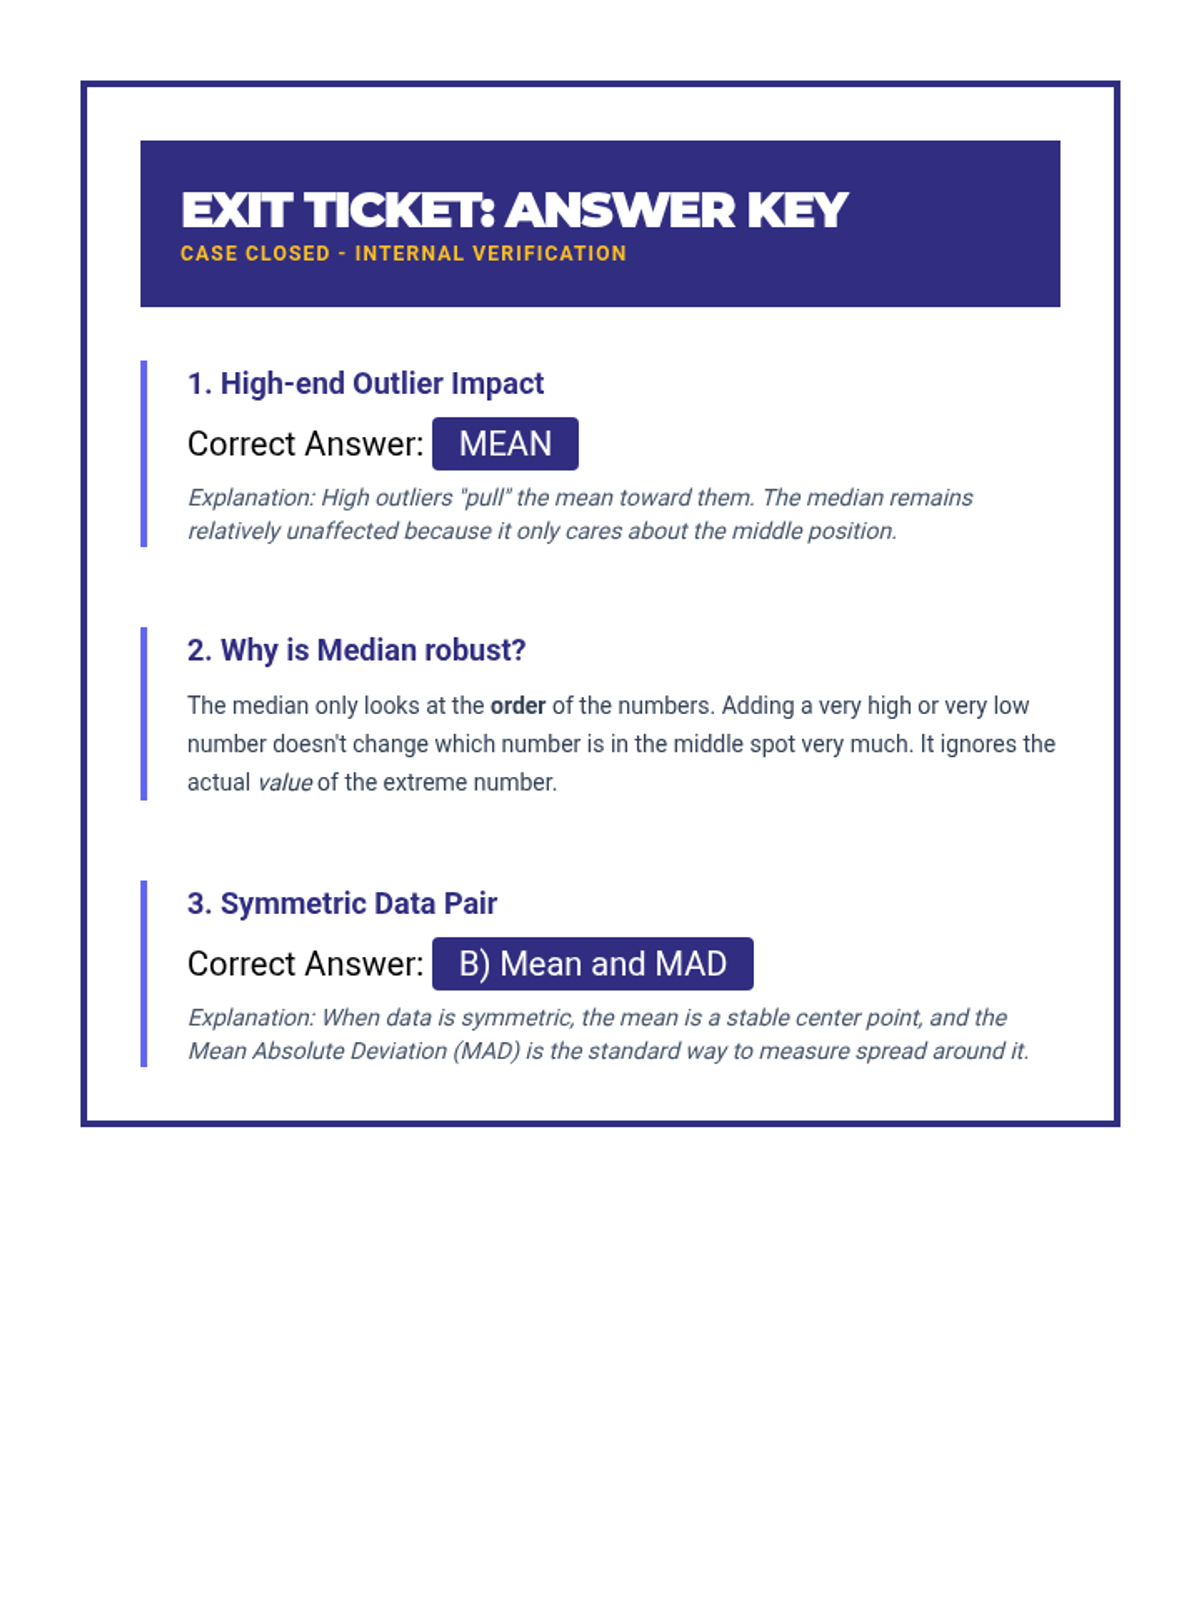
An answer key for the Distribution Debrief Exit Ticket, providing correct answers and brief pedagogical explanations.
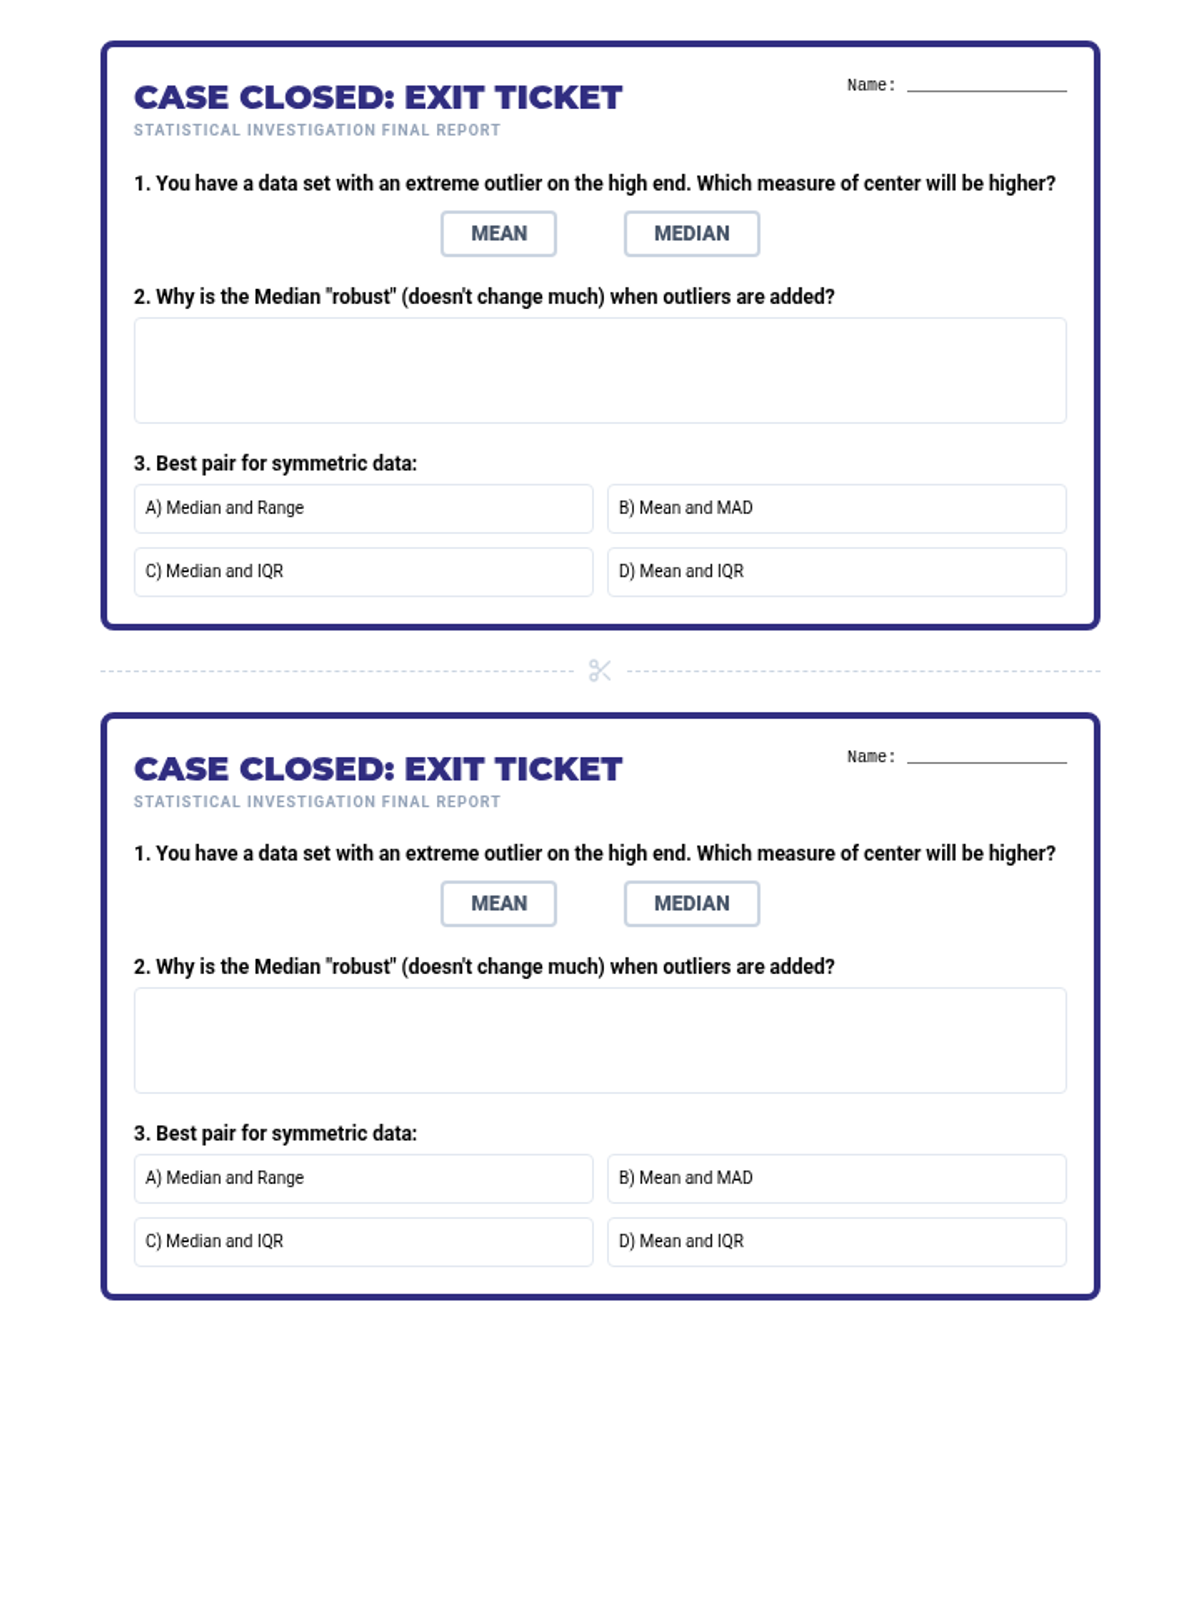
A brief end-of-lesson assessment checking student understanding of how outliers affect mean vs median and when to use specific statistical measures. Two tickets per page for efficient printing. Revised for layout and uniform answer choices.
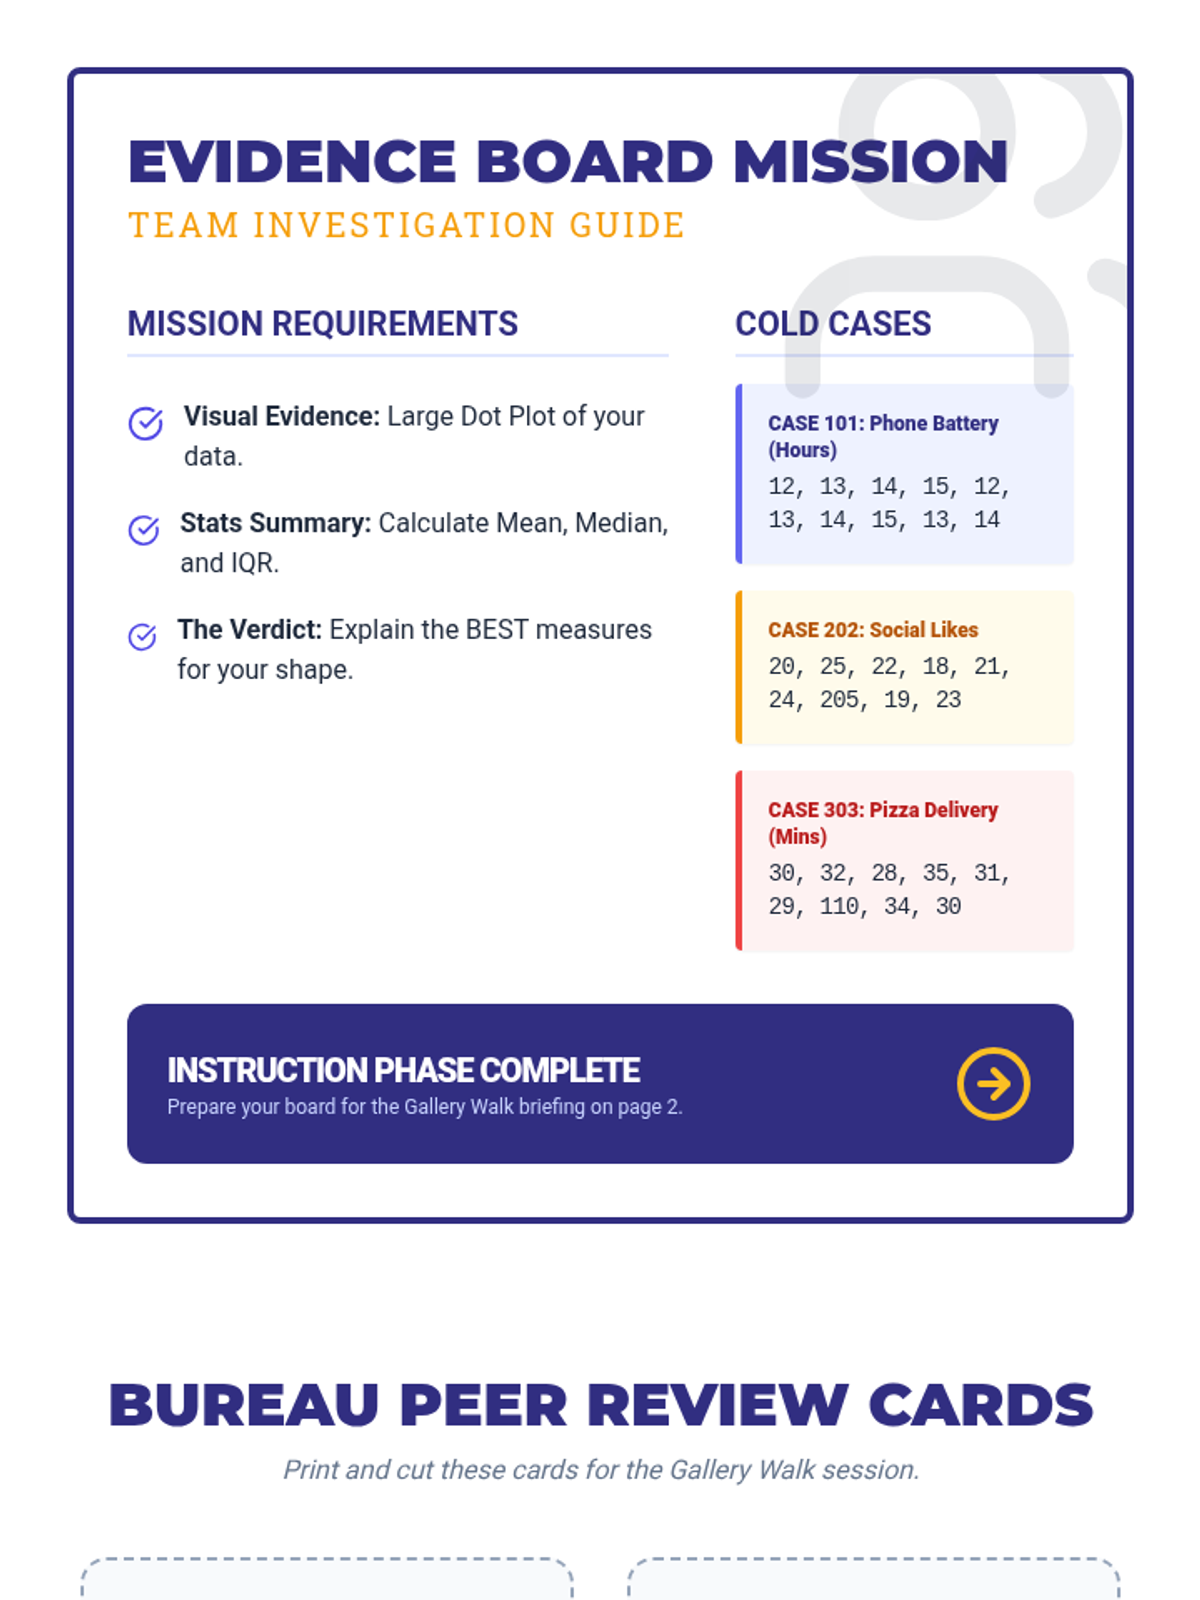
A guide for the collaborative poster activity featuring specific case studies for students to analyze and 'peer review' cards for a gallery walk. Revised with larger peer review cards and better layout.
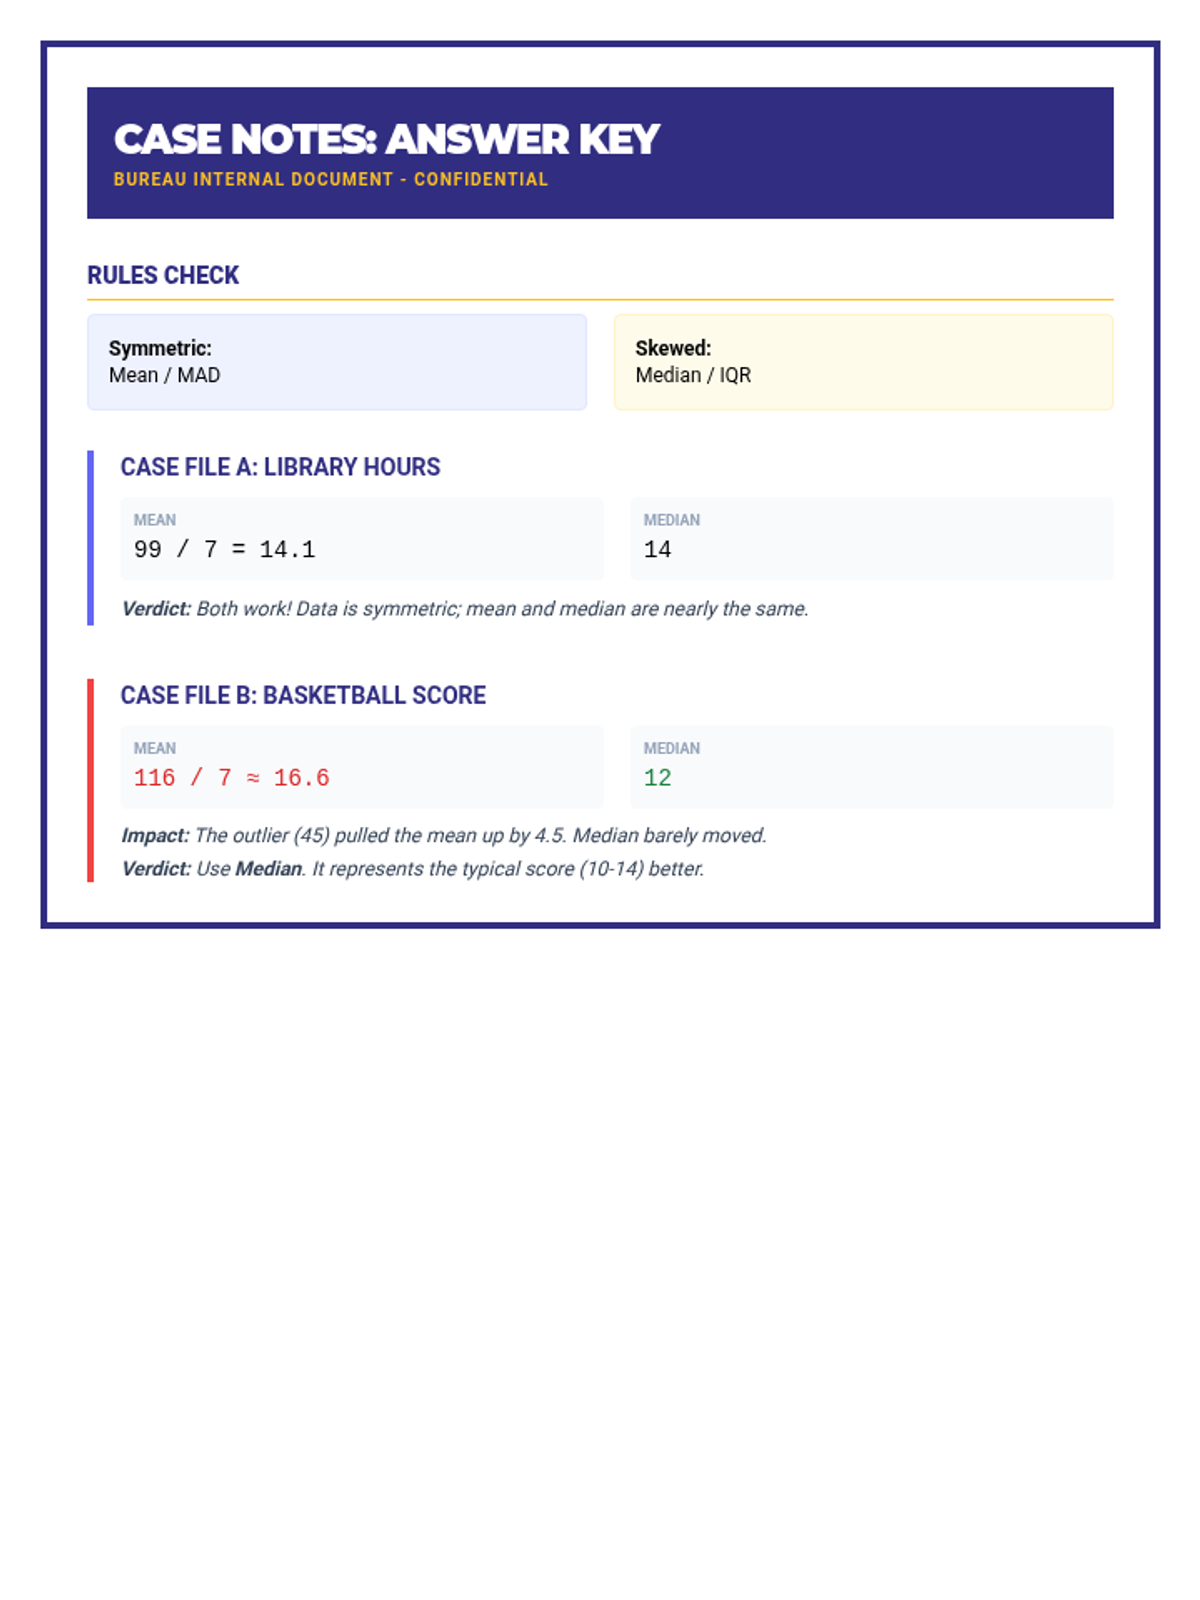
An answer key for the Case Notes handout, providing calculations for mean and median and clear explanations of why certain measures are preferred in symmetric vs skewed data. Revised for layout and clarity.
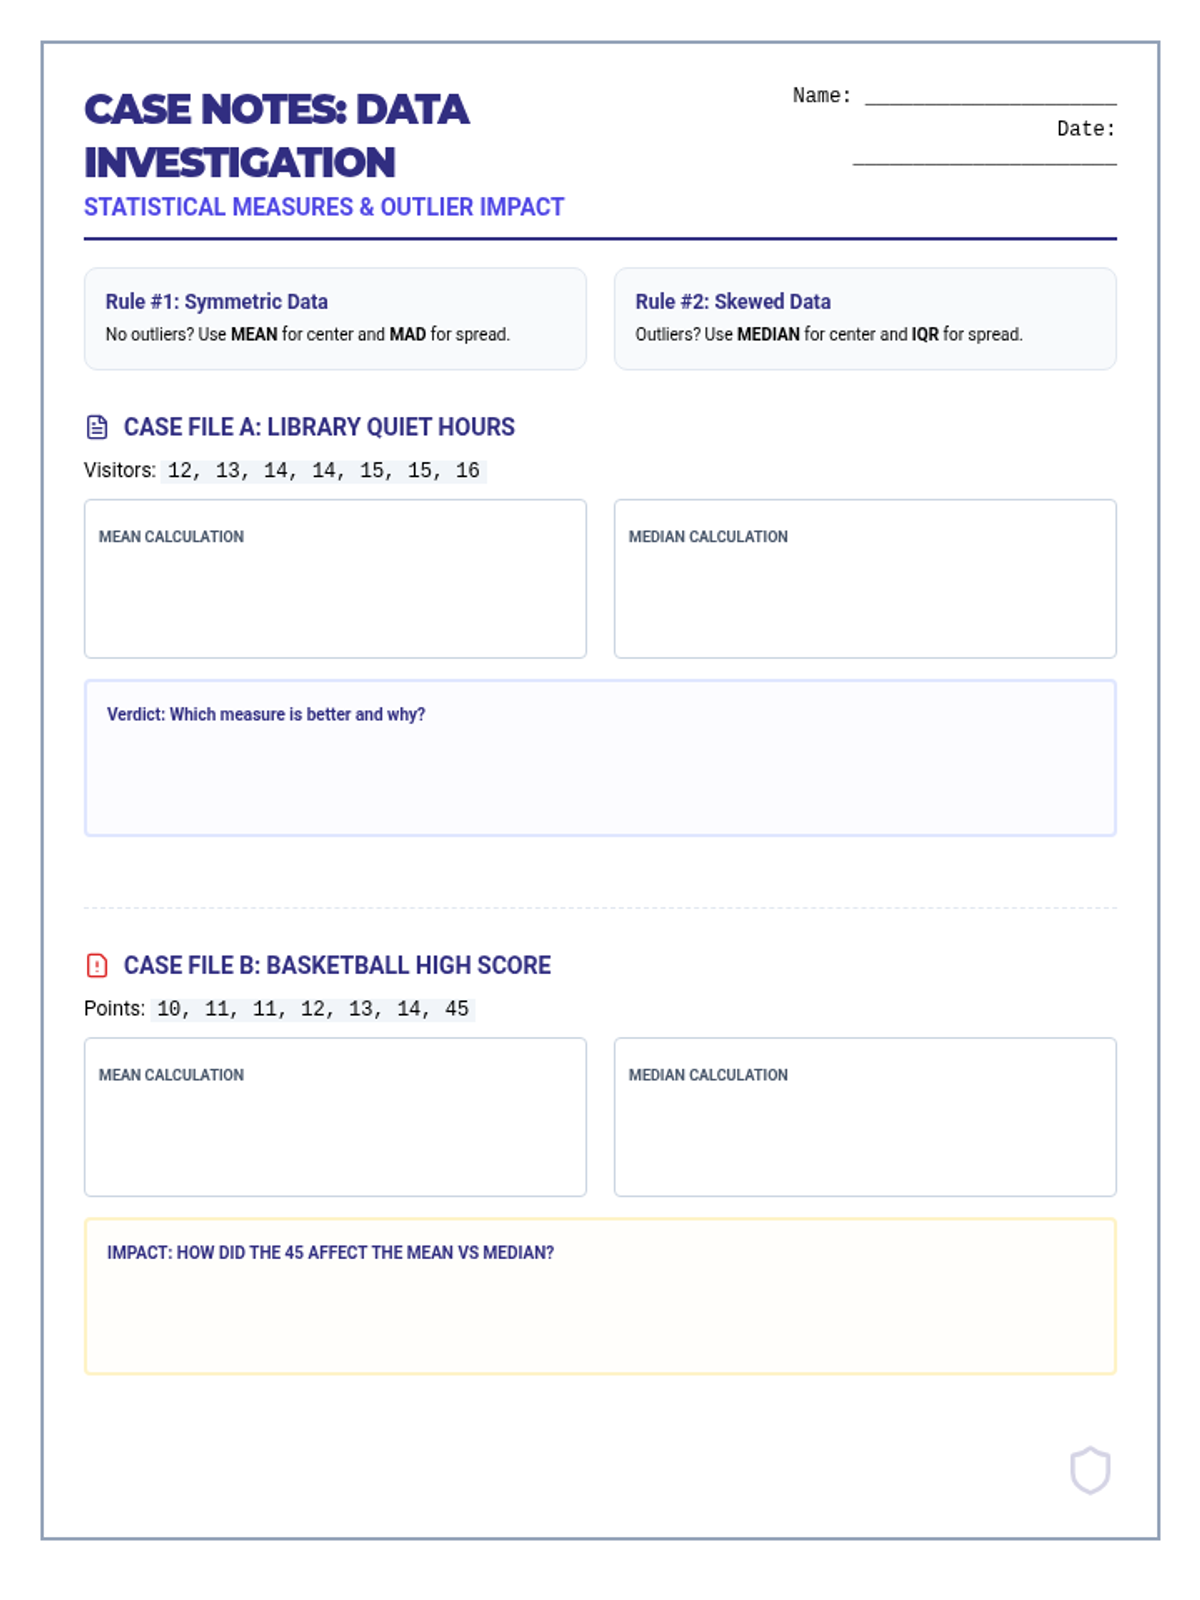
A student practice worksheet with two real-world scenarios comparing symmetric data to data with an outlier, requiring students to calculate measures and justify their selection. Layout optimized for 8.5x11 printing. Revised for single-page fit.
Visual presentation for the lesson including outlier identification, impact on mean vs median, and selection criteria for symmetric vs skewed data.
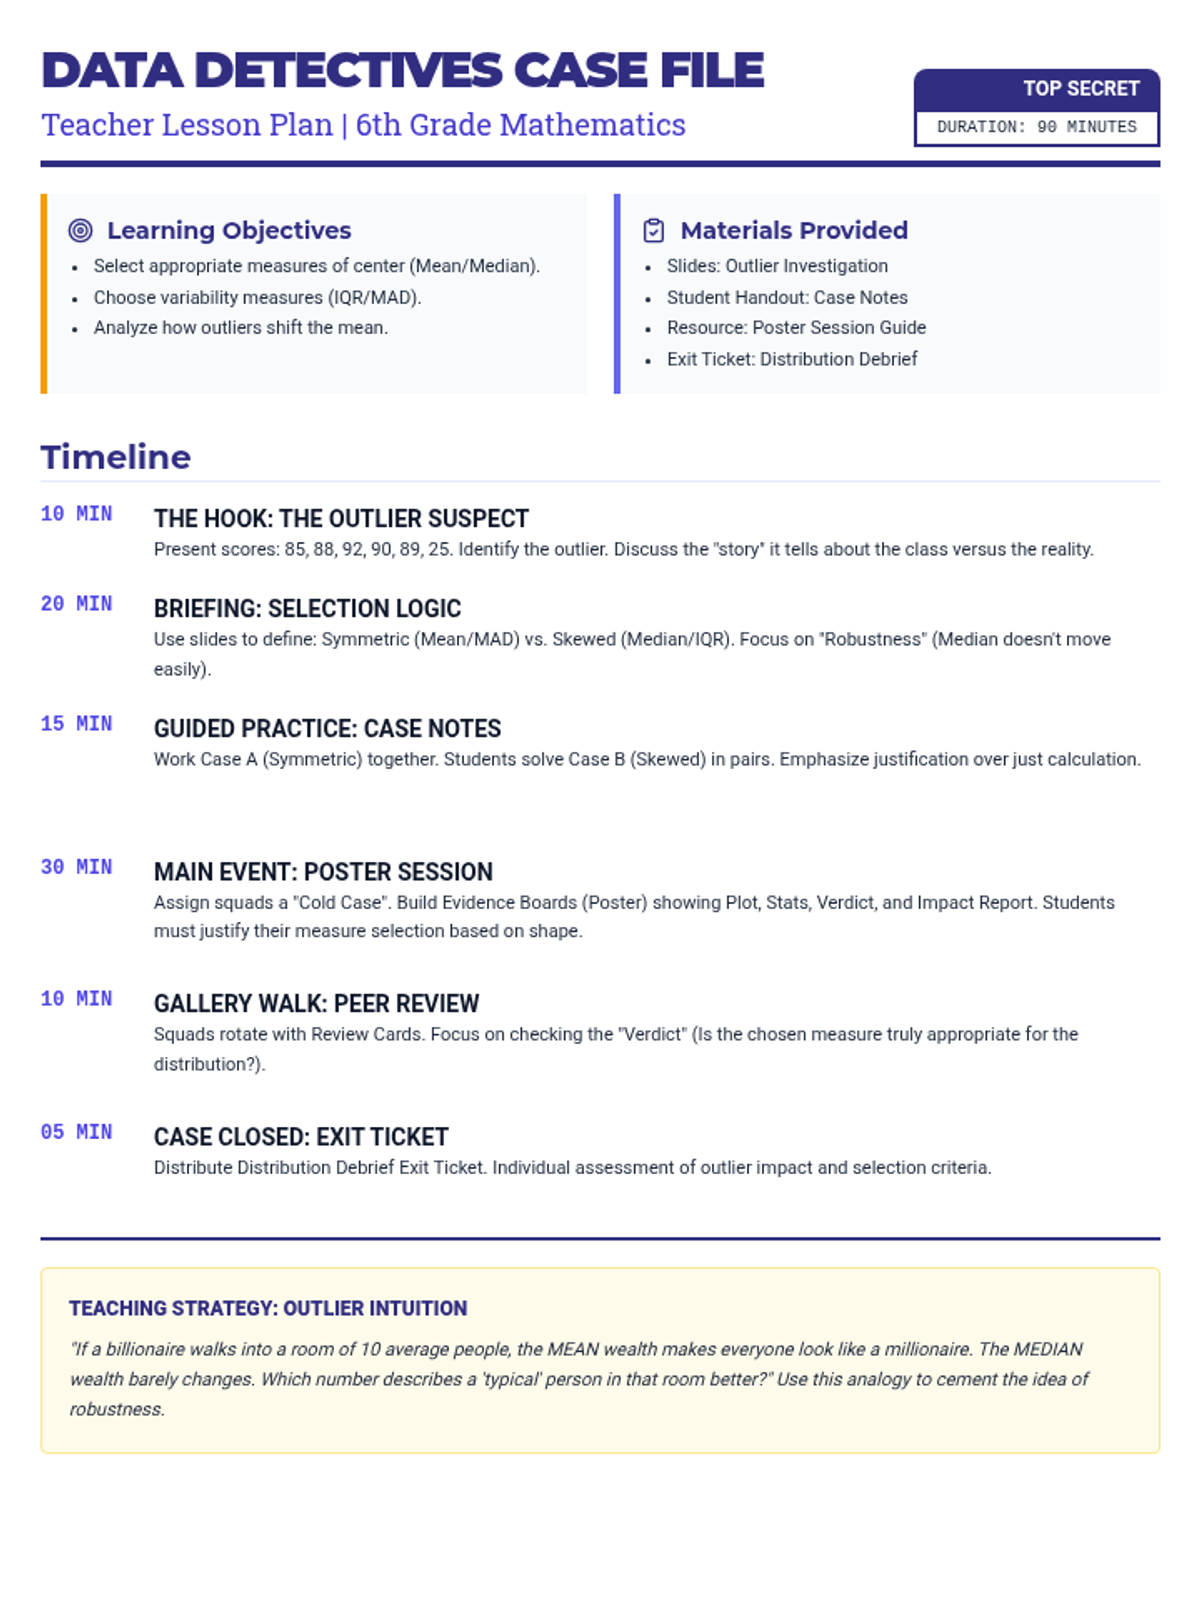
A detailed 90-minute teacher guide for a 6th grade math lesson on statistical measures and outliers, featuring a 'Data Detective' theme with a clear timeline, learning objectives, and teaching tips. Revised for better page breaks.
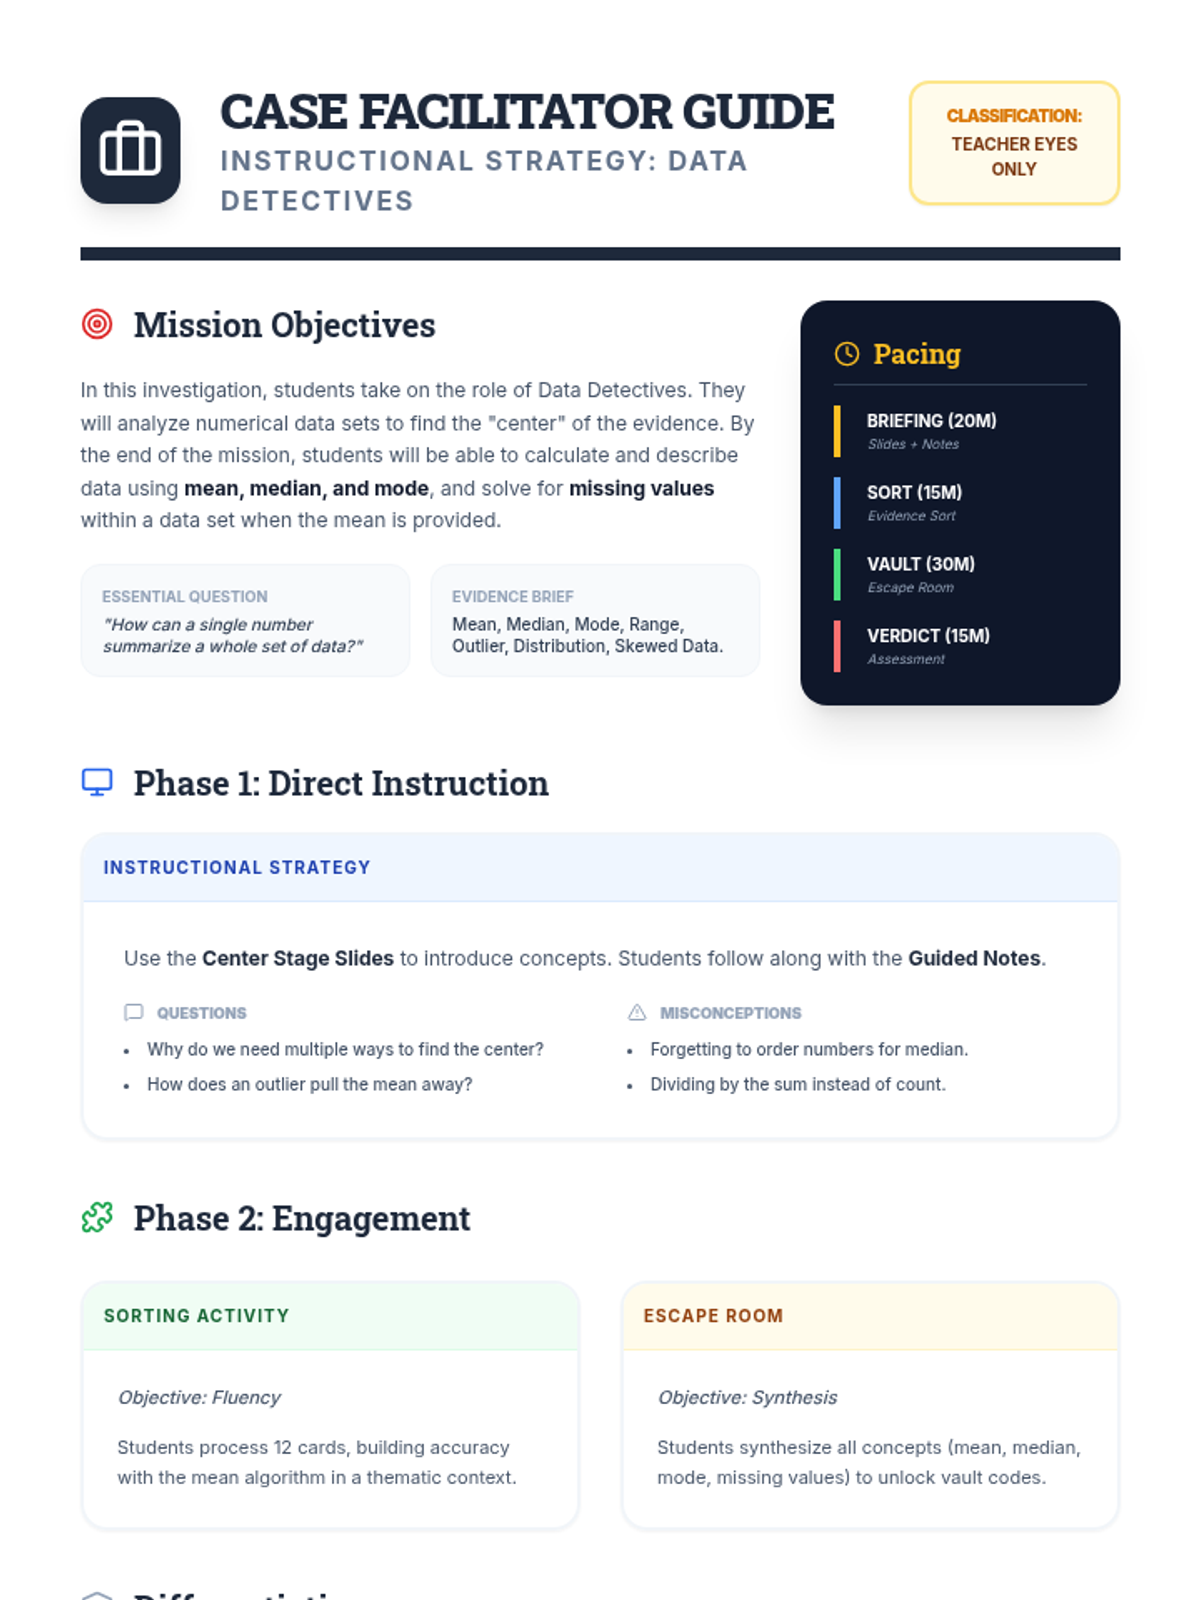
A comprehensive teacher guide for the "Data Detectives" lesson. Includes lesson objectives, a detailed pacing guide, instructional strategies for slides and activities, common misconceptions, and differentiation tips for supporting and challenging students. Revised to fix layout, spacing, and page break issues.
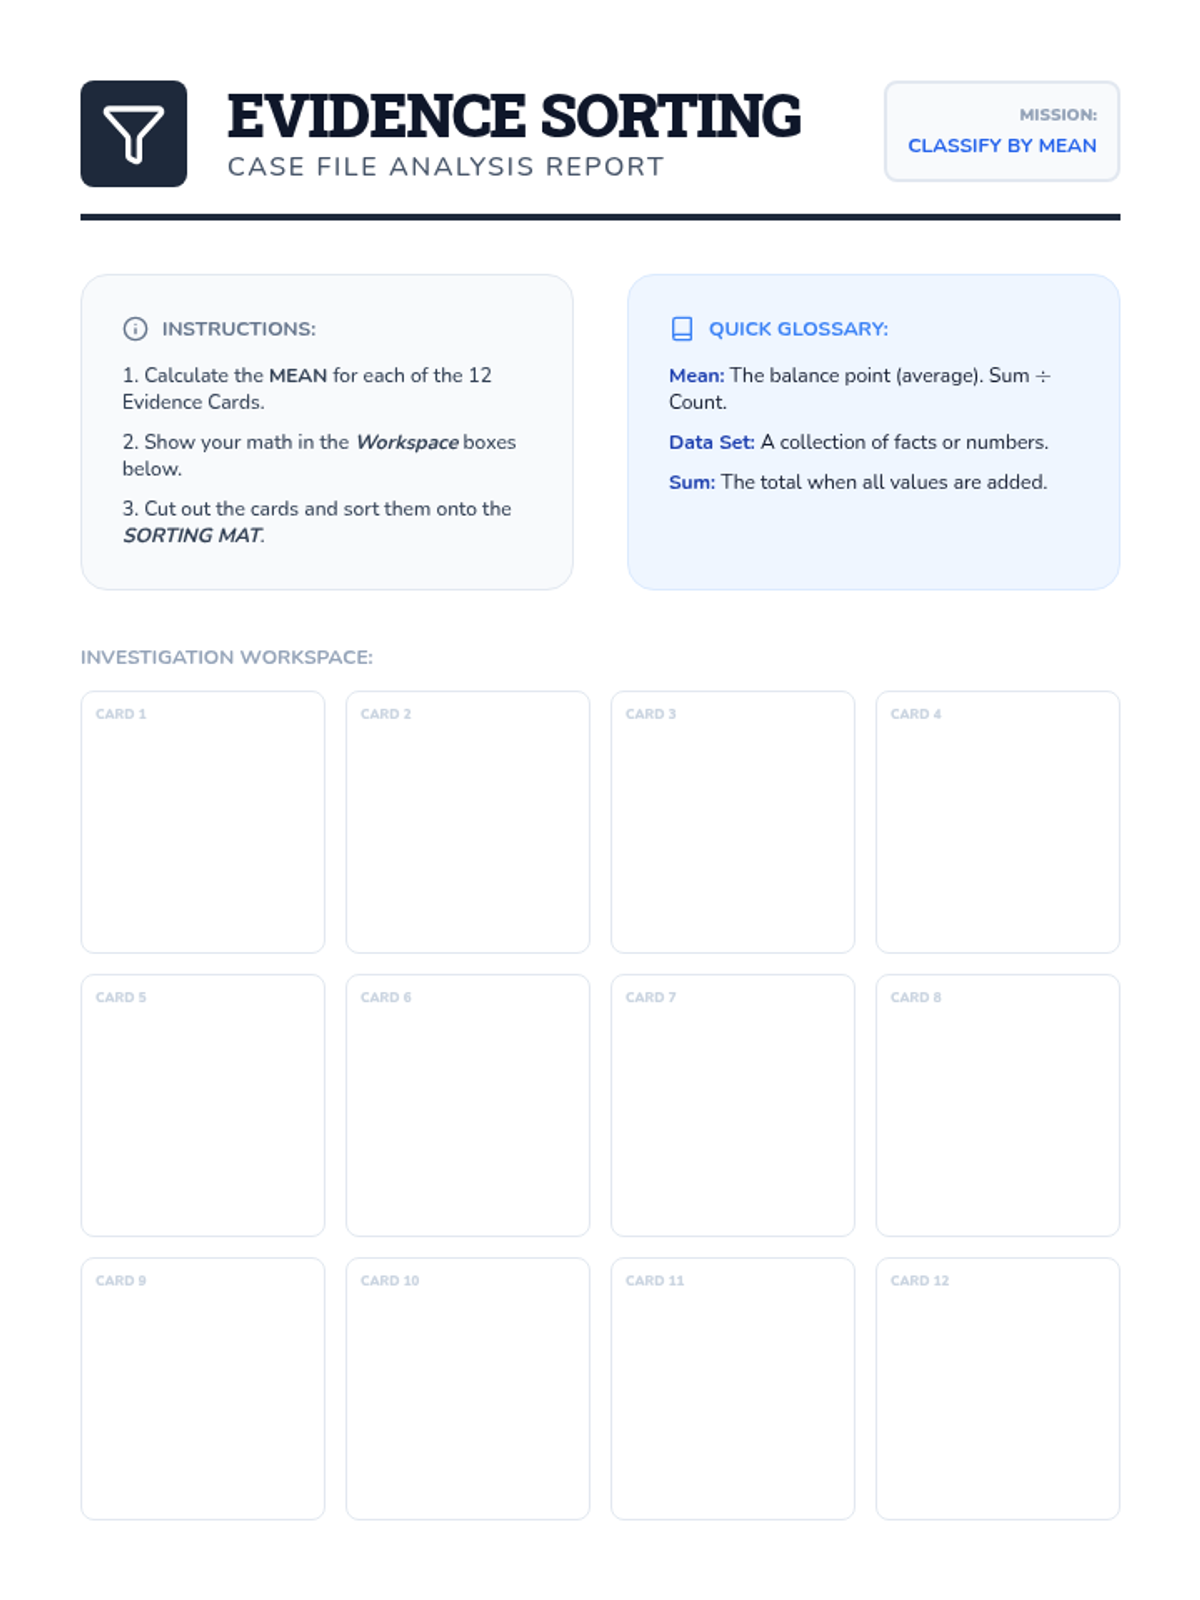
A hands-on sorting activity for measures of center. Students calculate the mean for 12 data cards (Case Files) and sort them into folders based on their values. Includes workspace for calculations and a thematic detective-inspired sorting mat. Revised to fix page breaks and student work area layout.
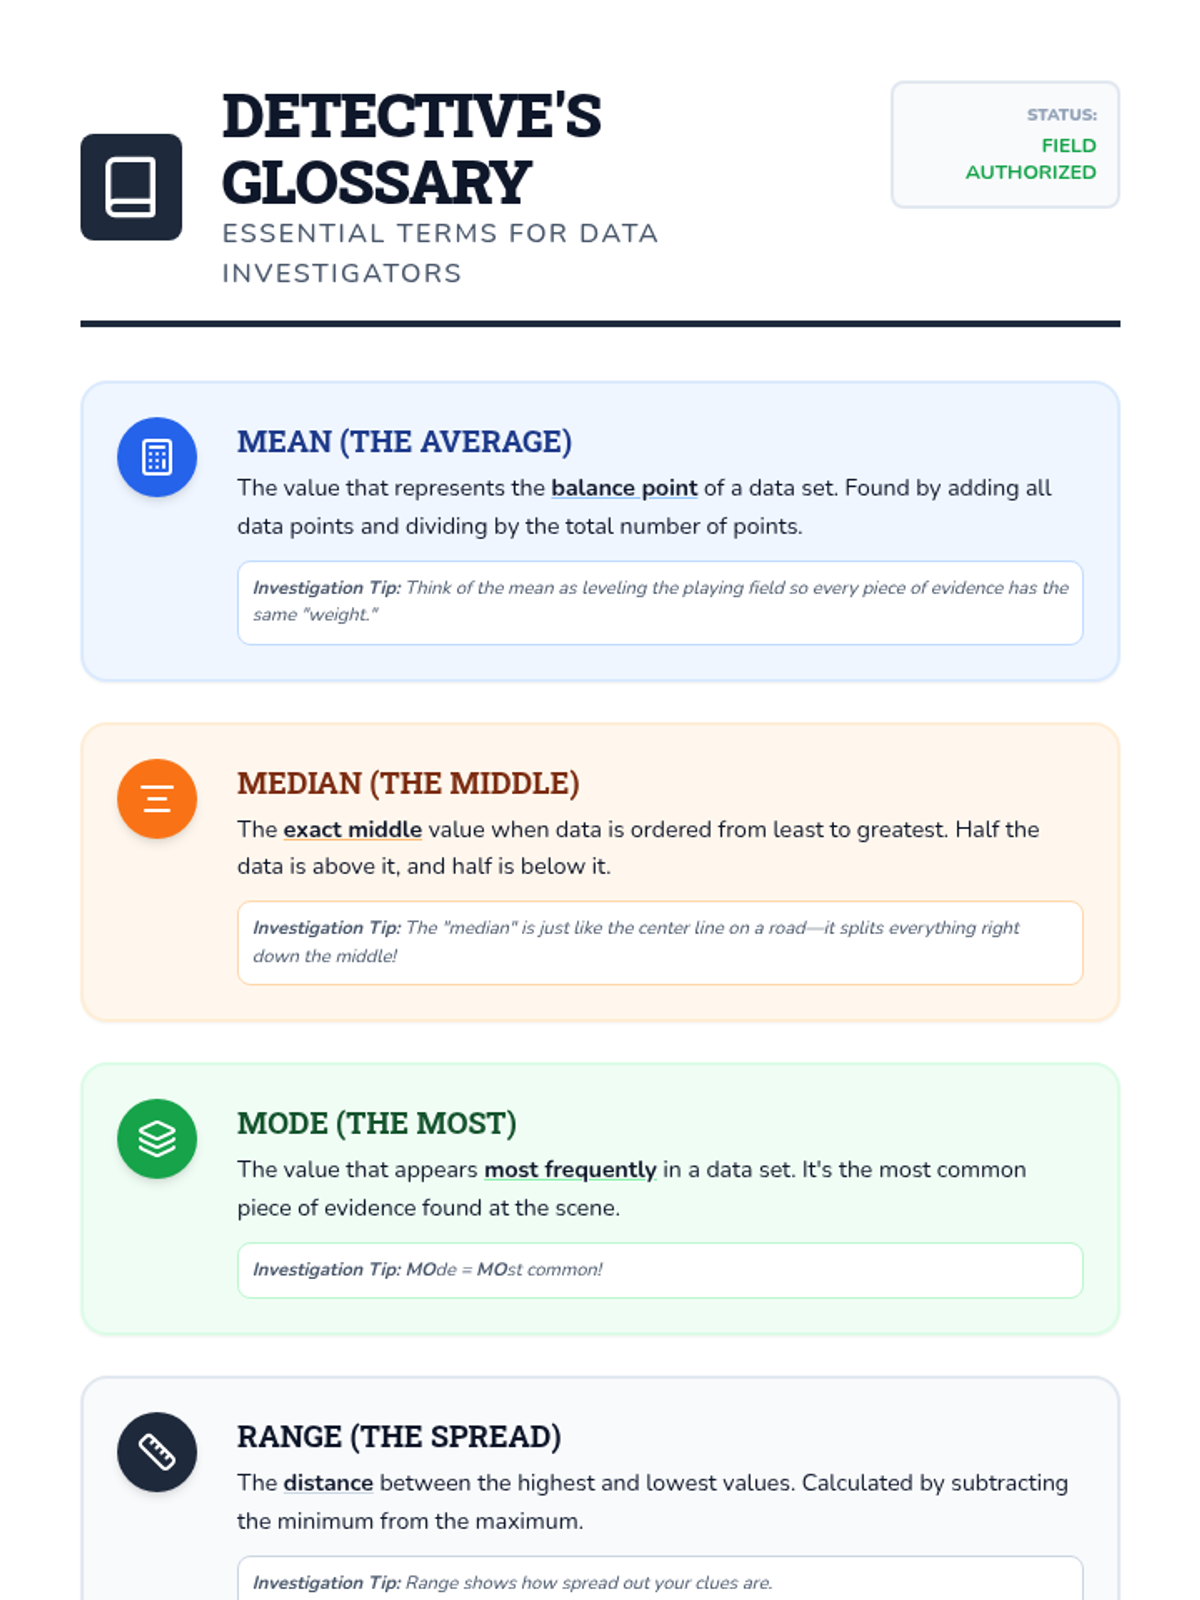
A thematic vocabulary reference sheet for measures of center. Includes clear definitions and "Investigation Tips" for mean, median, mode, and range, along with a dossier of supplementary statistical terms like outliers, distribution, and skewed data. Revised to fix page breaks and include more terms.
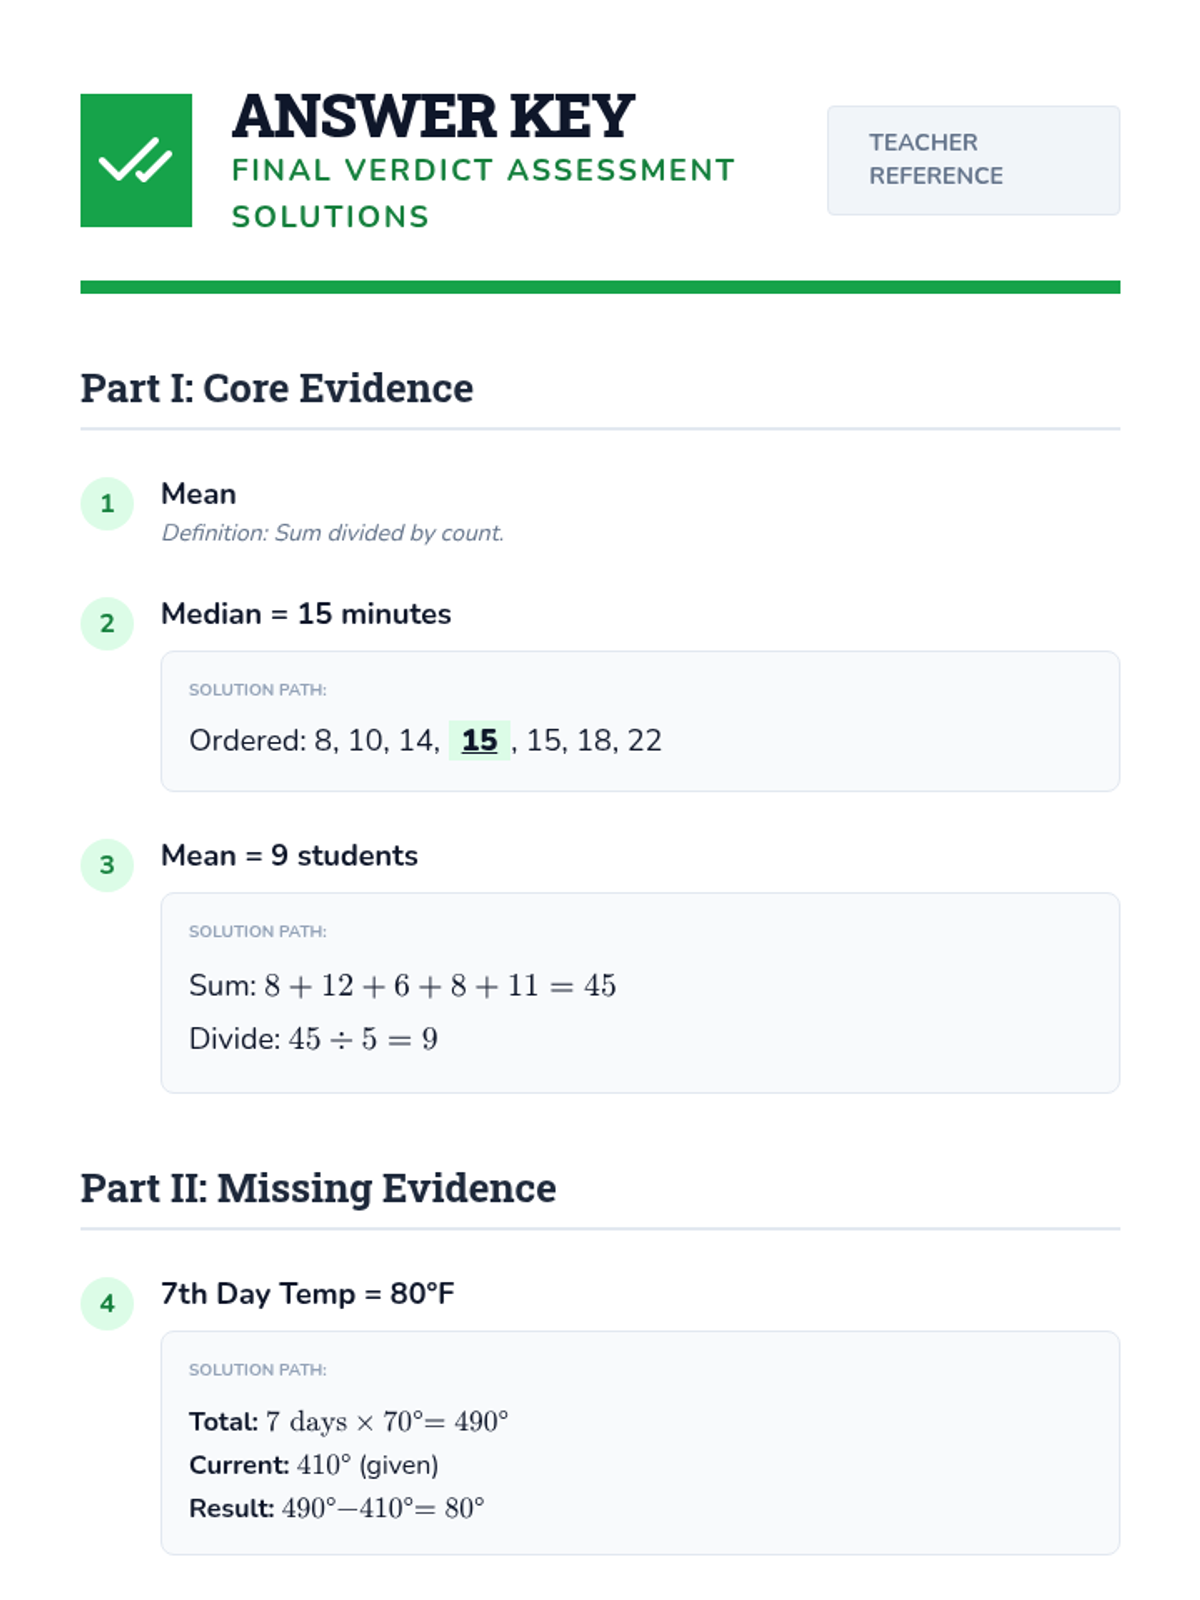
A detailed answer key for the "Final Verdict" assessment and "Case Closed" escape room. Provides step-by-step solution paths for mean, median, and missing value problems. Revised to fix page breaks, degree symbol rendering, and layout consistency.
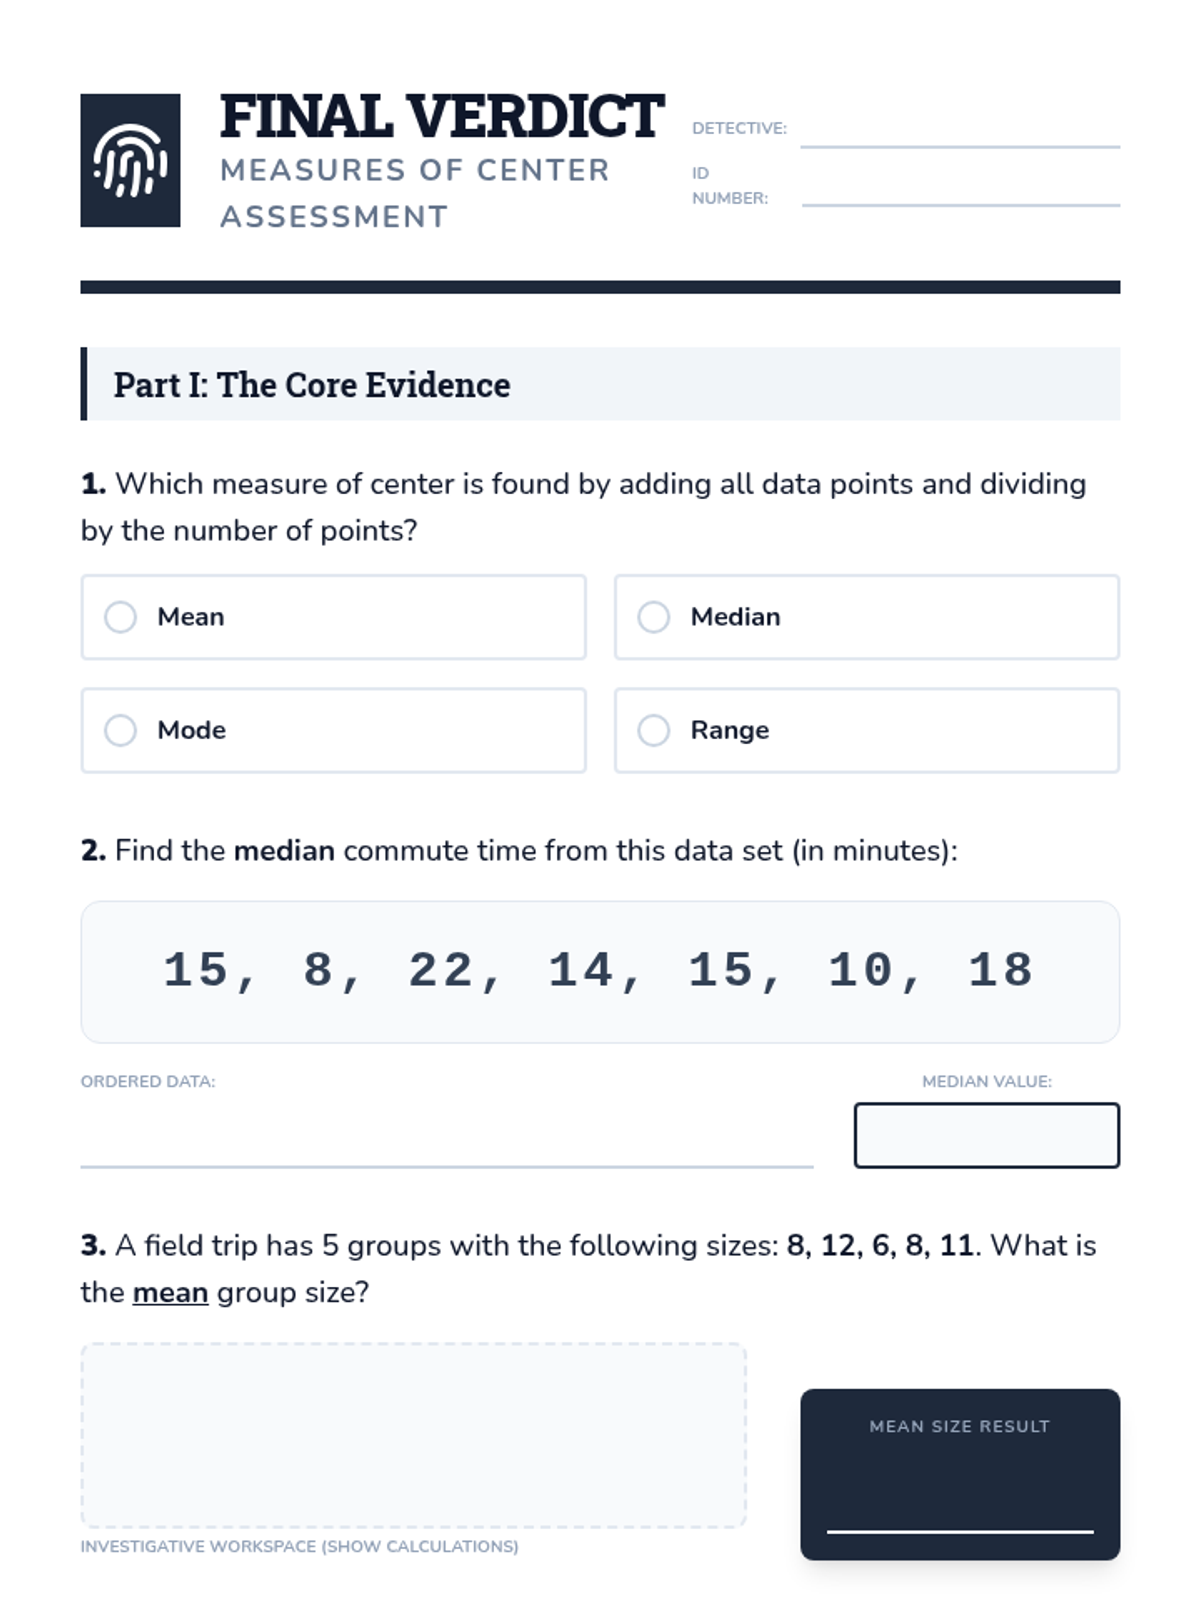
A two-part assessment on measures of center. Part I focuses on summarizing data using mean and median calculations with time and group size contexts. Part II challenges students to find missing data values given the mean. Revised to fix page breaks, footer placement, and work area sizing.
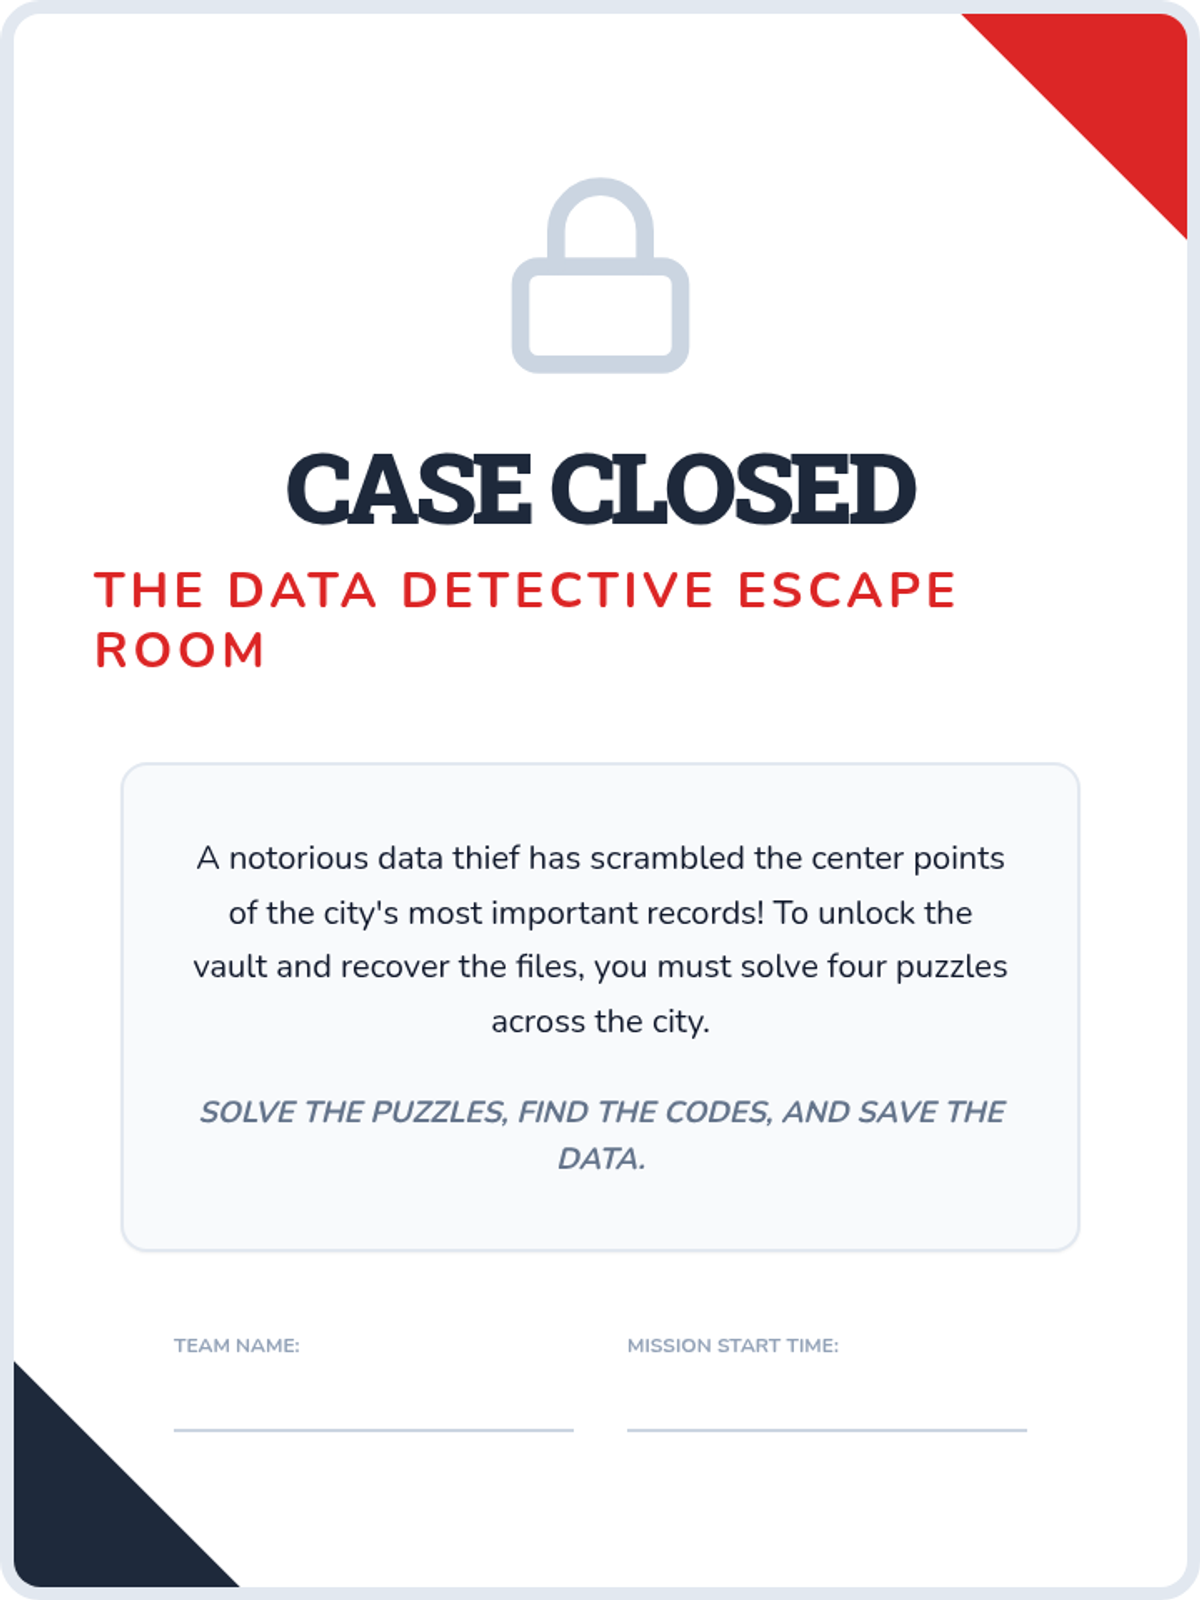
A four-station "Data Detective" escape room activity. Students solve puzzles involving mean (time data), median (negative temperature data), mode (group sizes), and a missing value challenge to unlock "vault codes." Includes workspace for calculations and distinct thematic sections for each puzzle. Revised to fix page breaks, contrast, and box sizing.
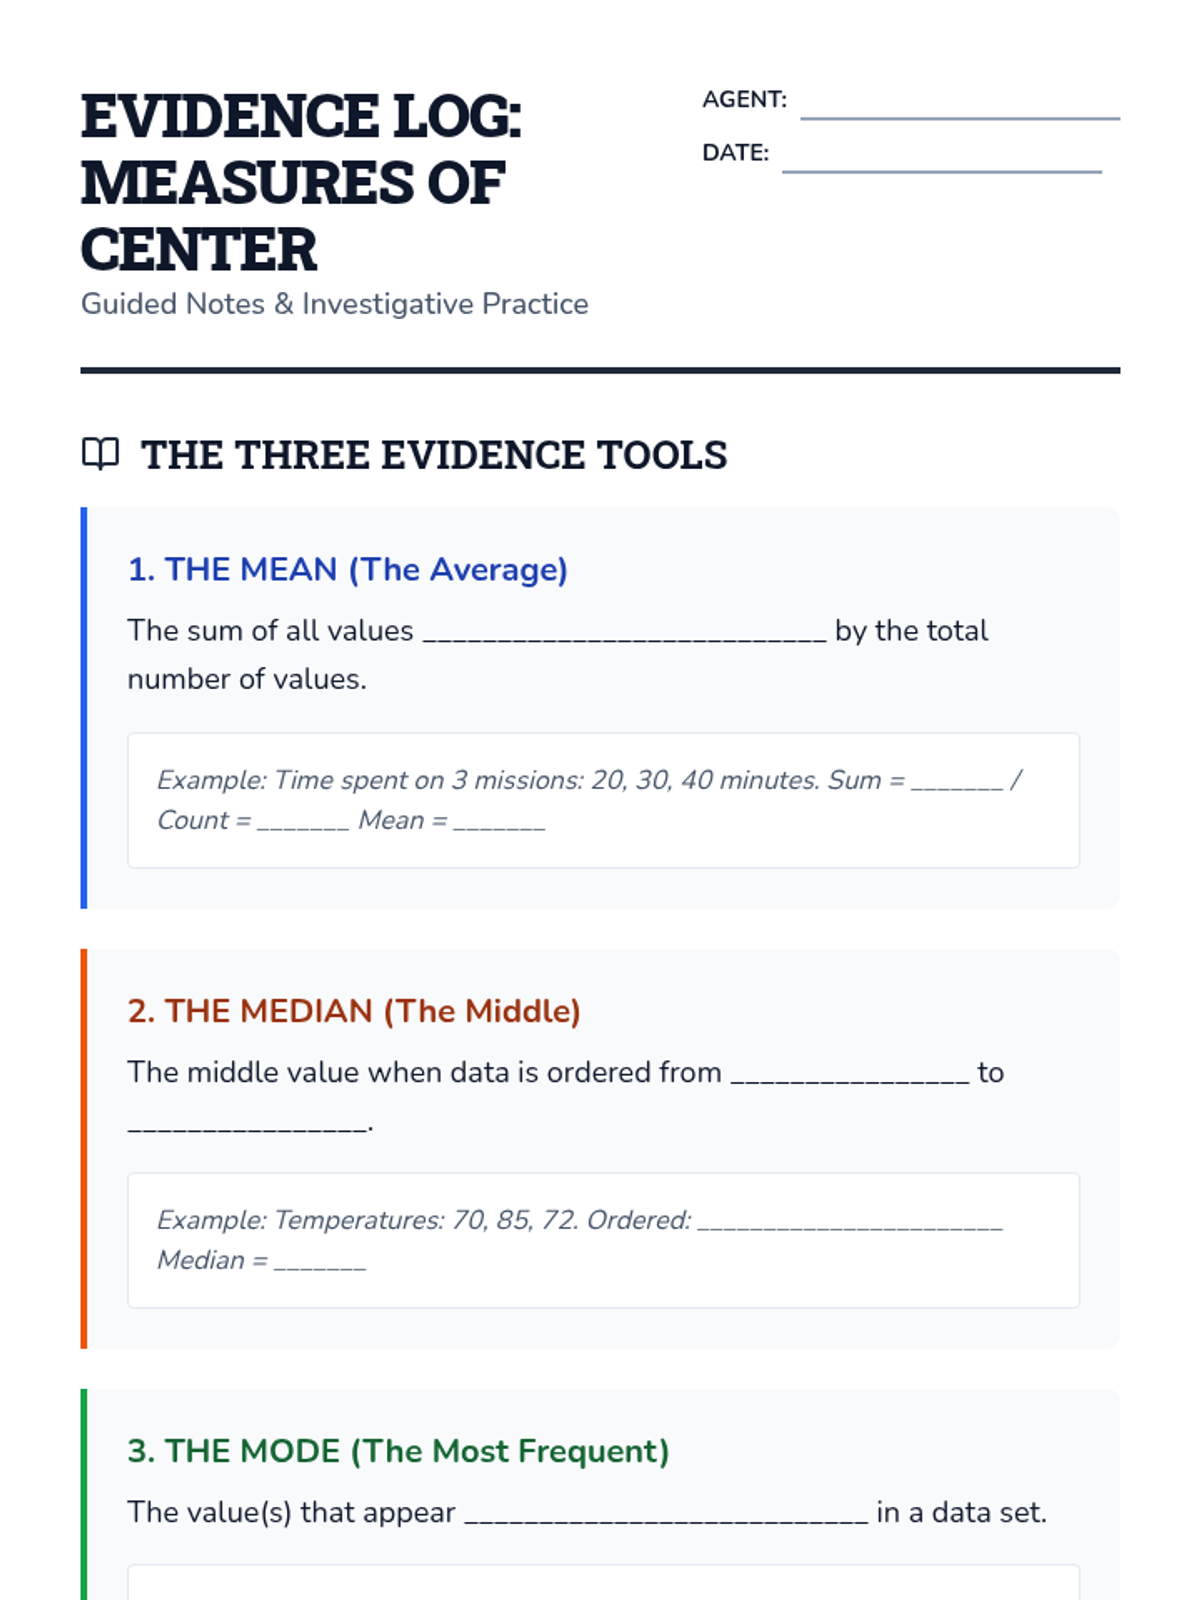
A guided notes document and practice worksheet for measures of center. Features fill-in-the-blank definitions for mean, median, and mode, a step-by-step strategy guide for finding missing data values, and three categorized "Case File" practice problems. Revised to fix page breaks and student work area alignment.
A slide deck introducing measures of center (mean, median, mode) using a detective theme. Includes definitions, step-by-step examples with time, temperature, and group size data, and interactive practice problems. Revised to fix slide overflow and rendering issues.
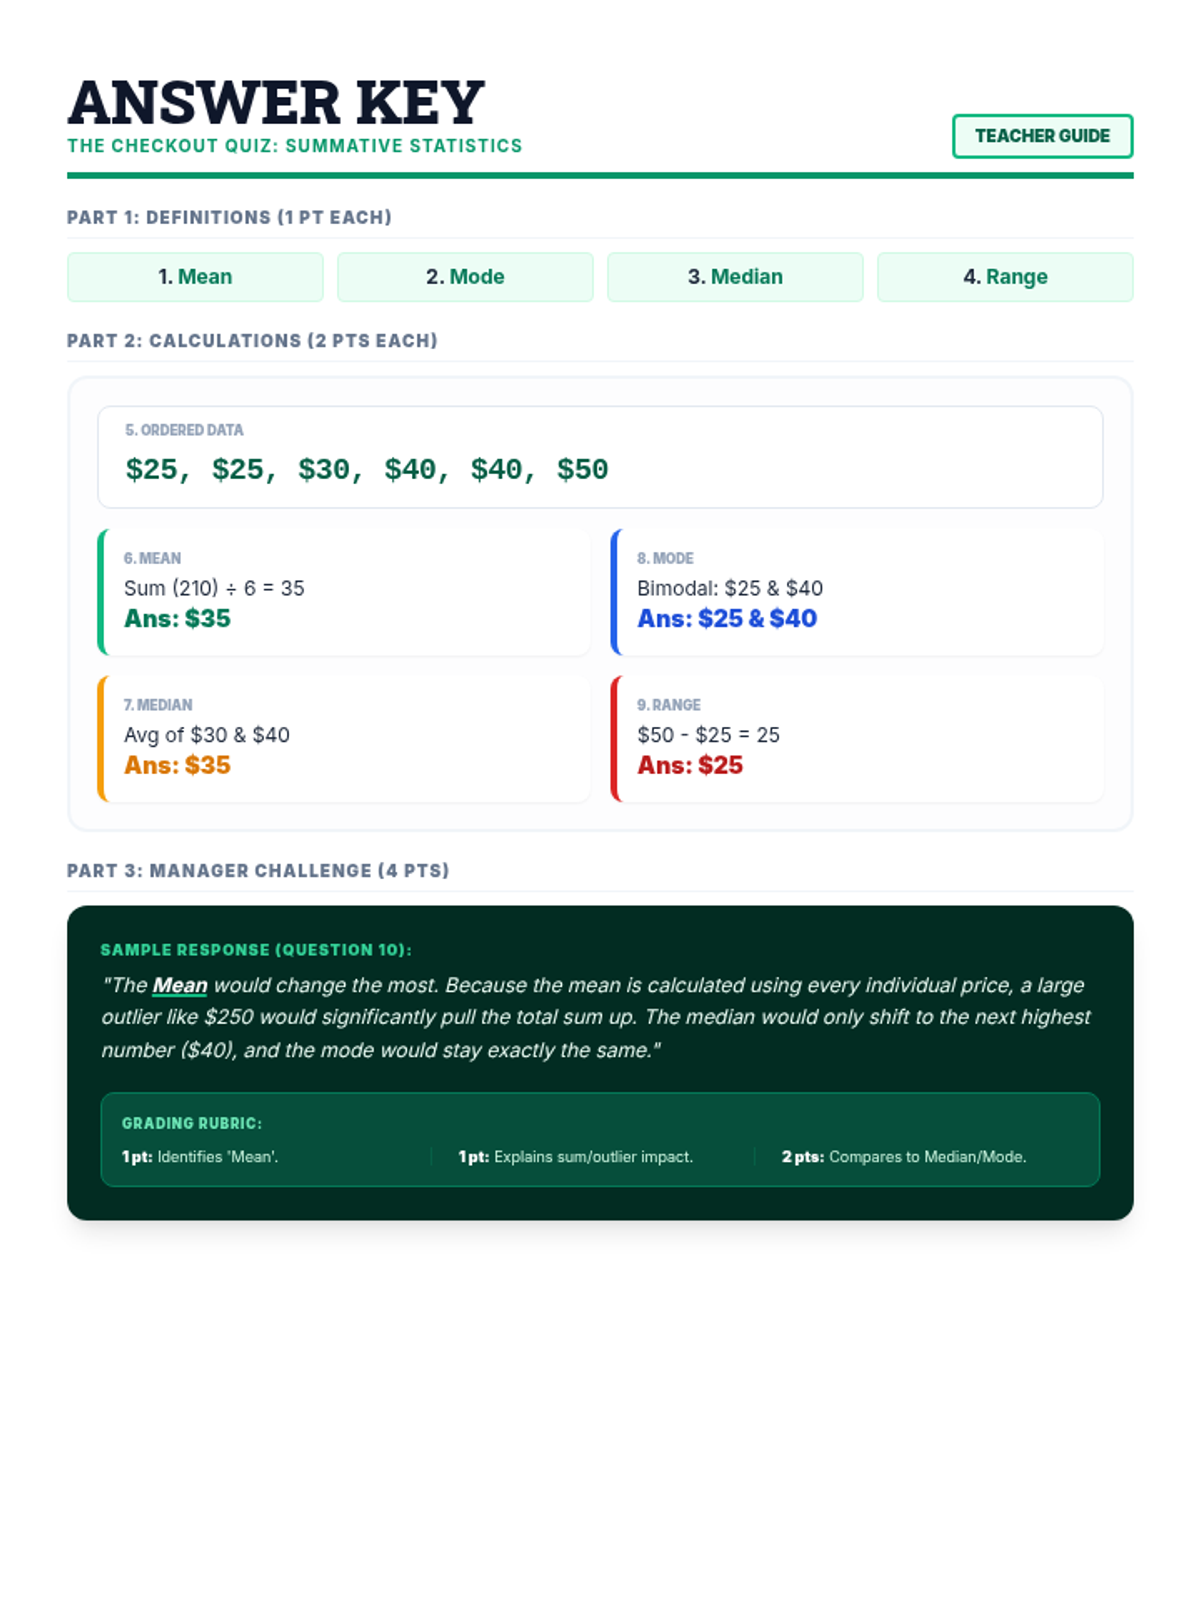
The teacher-facing answer key for the Checkout Quiz Assessment. Revised to fit onto a single page and improve clarity.
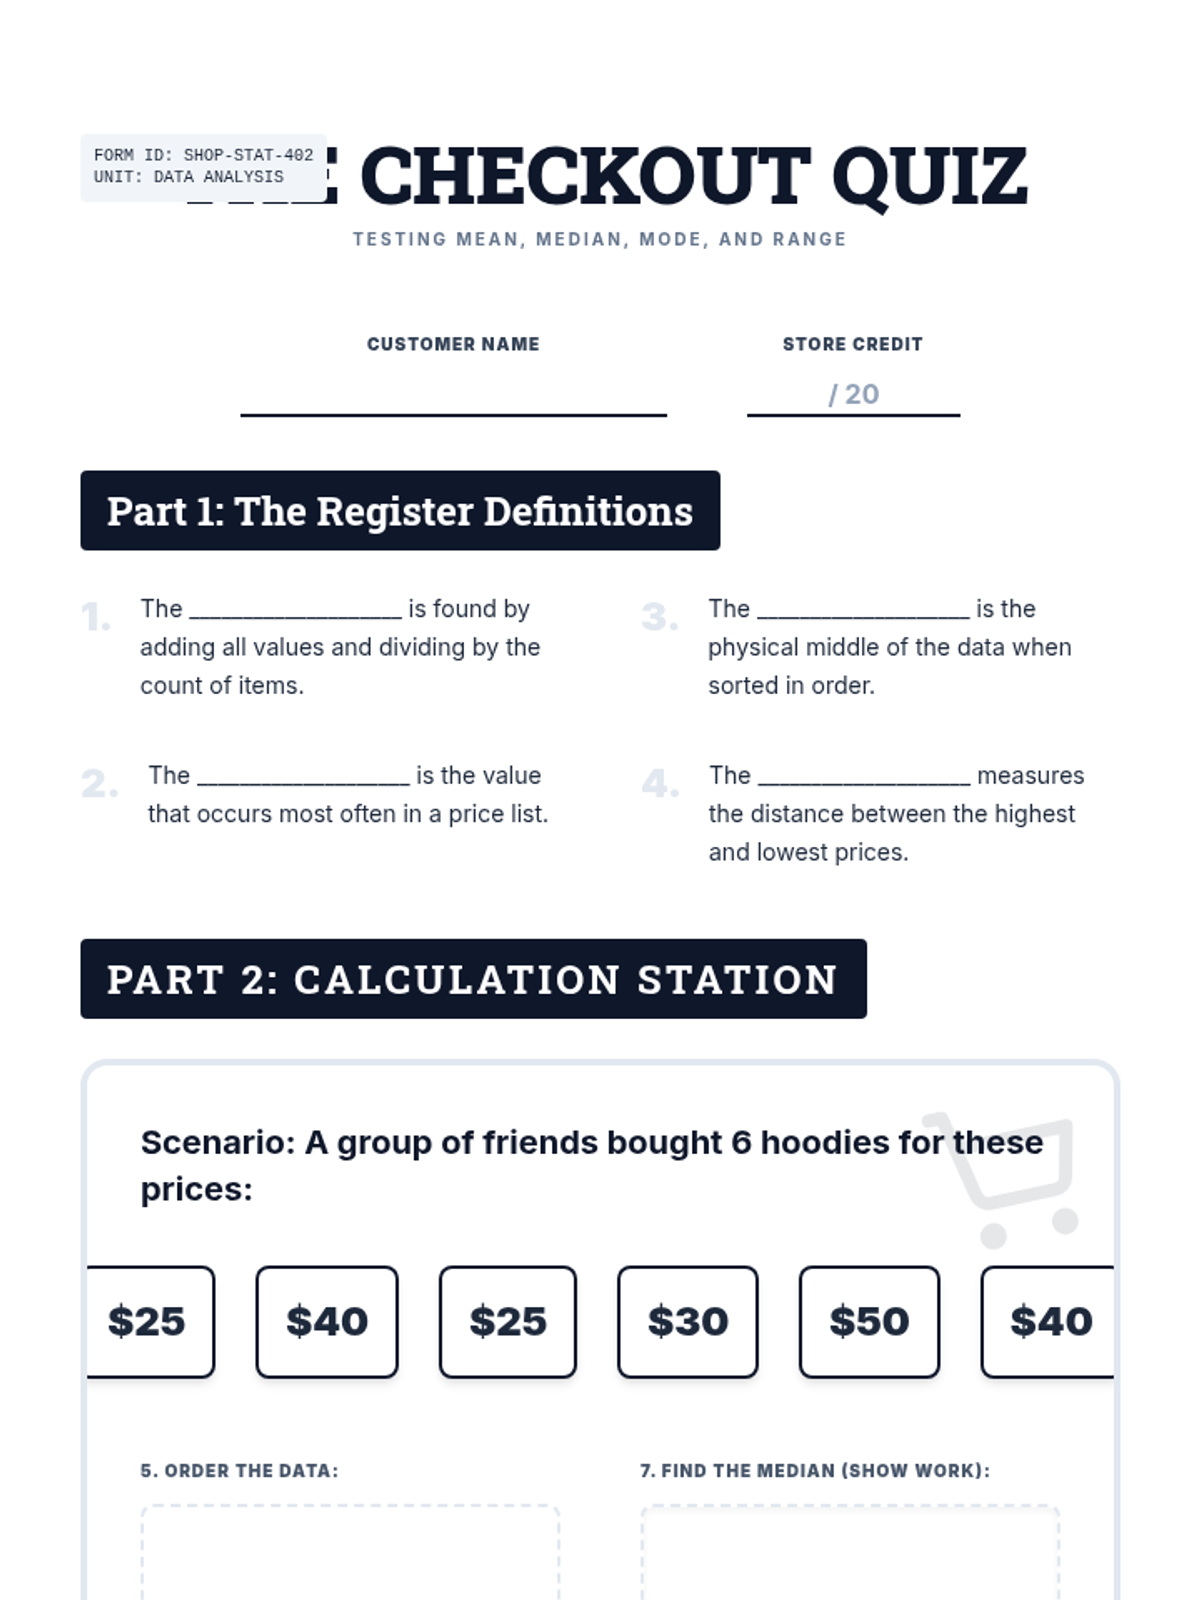
A formal summative assessment on Mean, Median, Mode, and Range. Revised to fix page breaks, improve contrast, and expand student work areas.
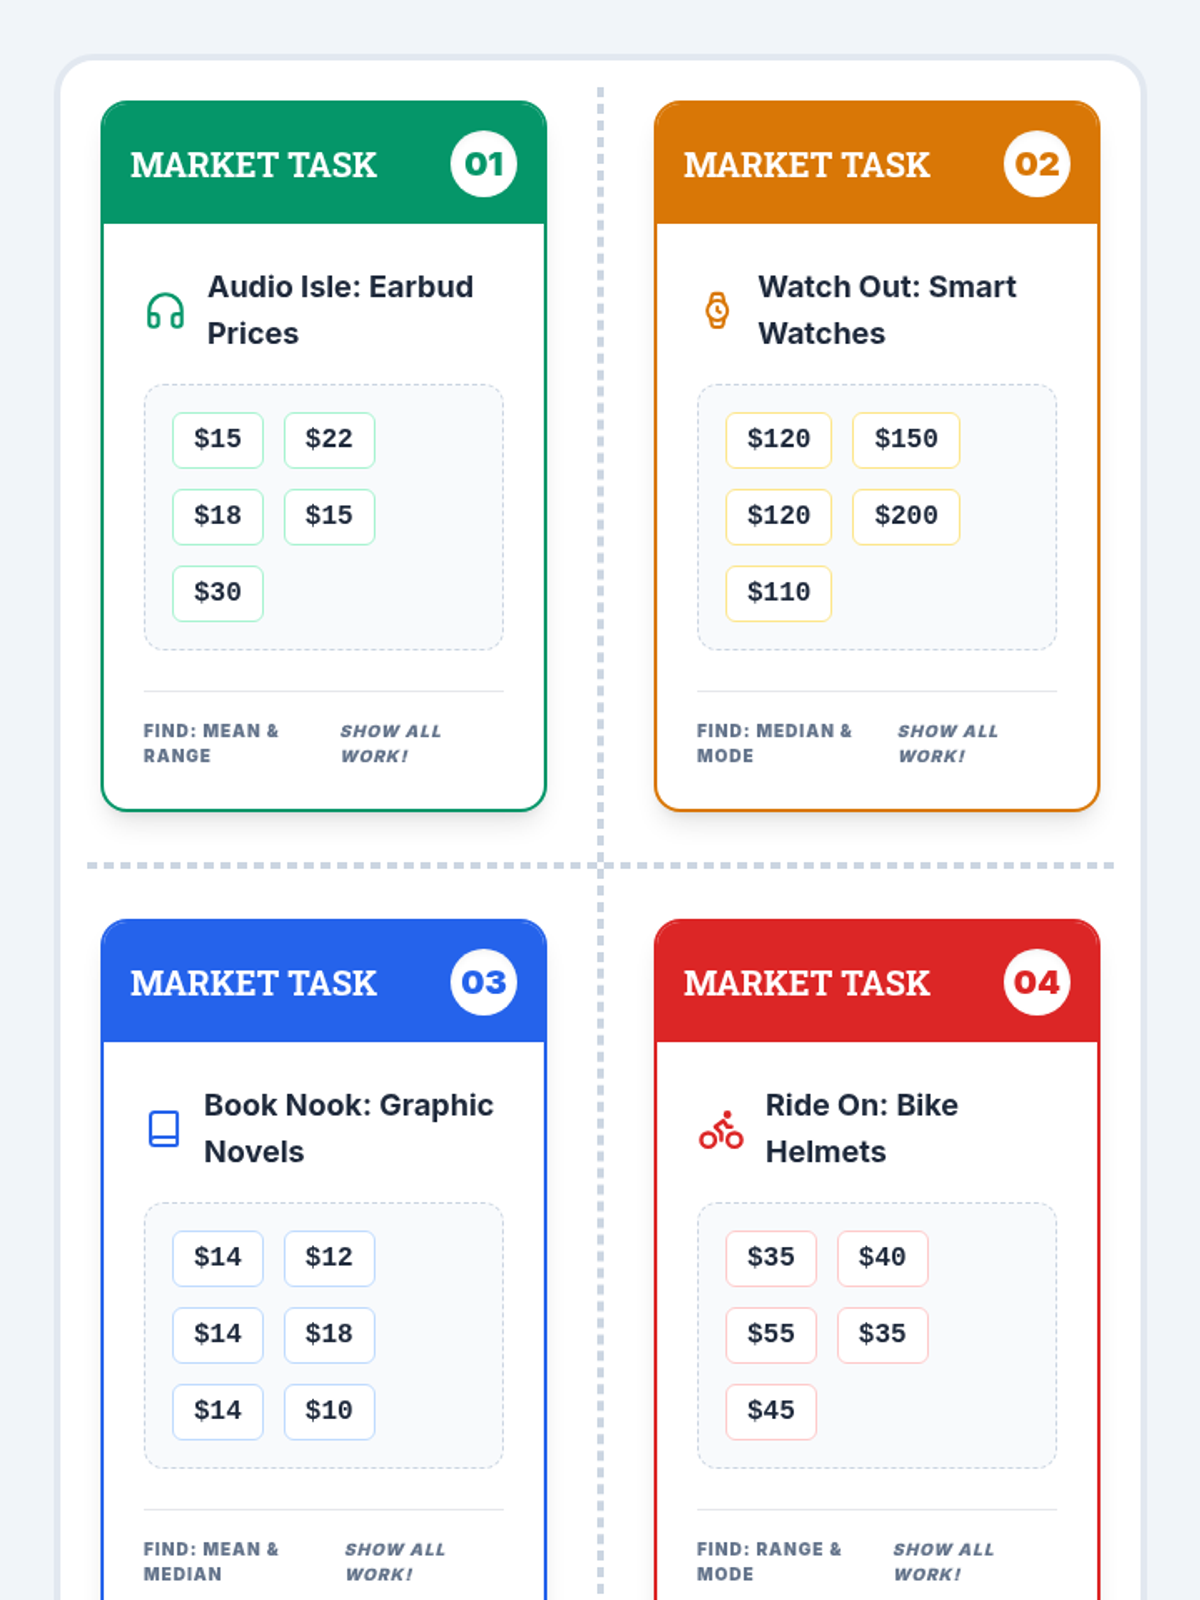
A set of 4 task cards for center activities, revised to include recording areas for all cards, cut lines, and improved legibility.
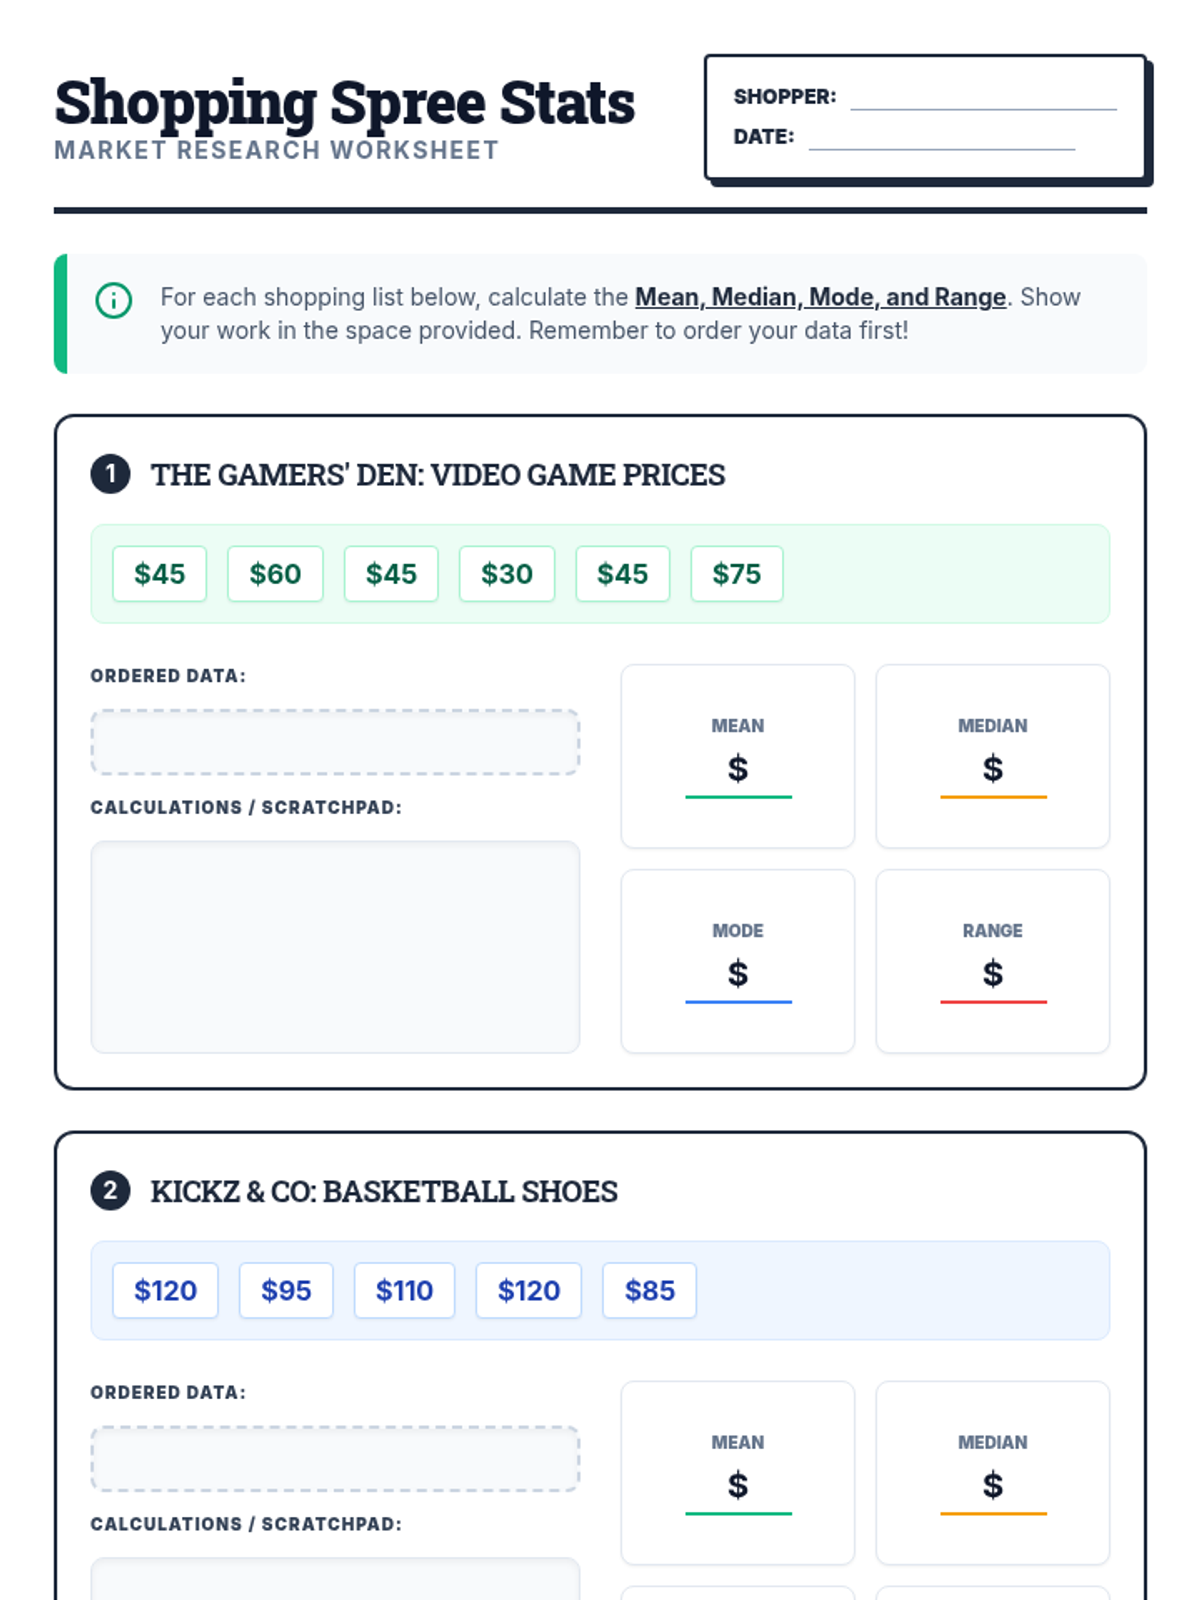
A student practice worksheet featuring three different shopping data sets (video games, sneakers, and smoothies). Revised to fix page breaks, increase work area sizes, and balance white space.
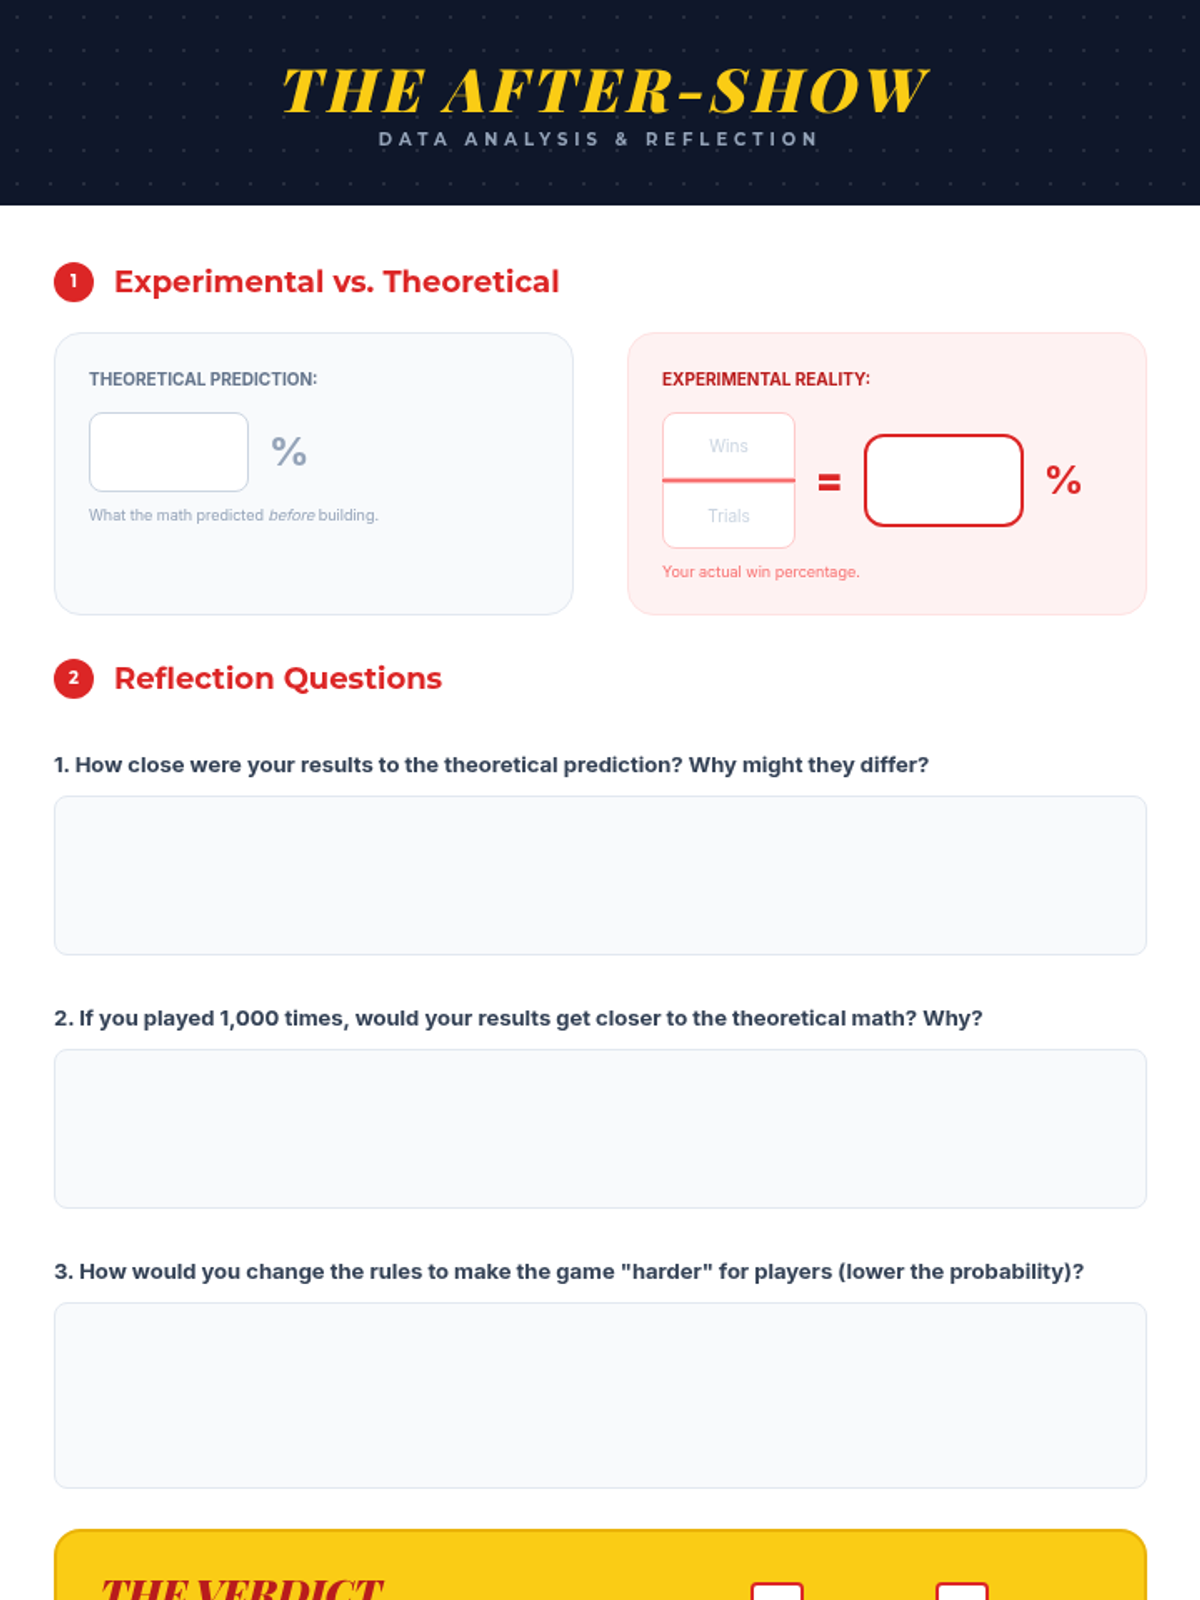
A final reflection activity where students compare their theoretical predictions to experimental results, analyze the difference, and reflect on the fairness of their carnival game.
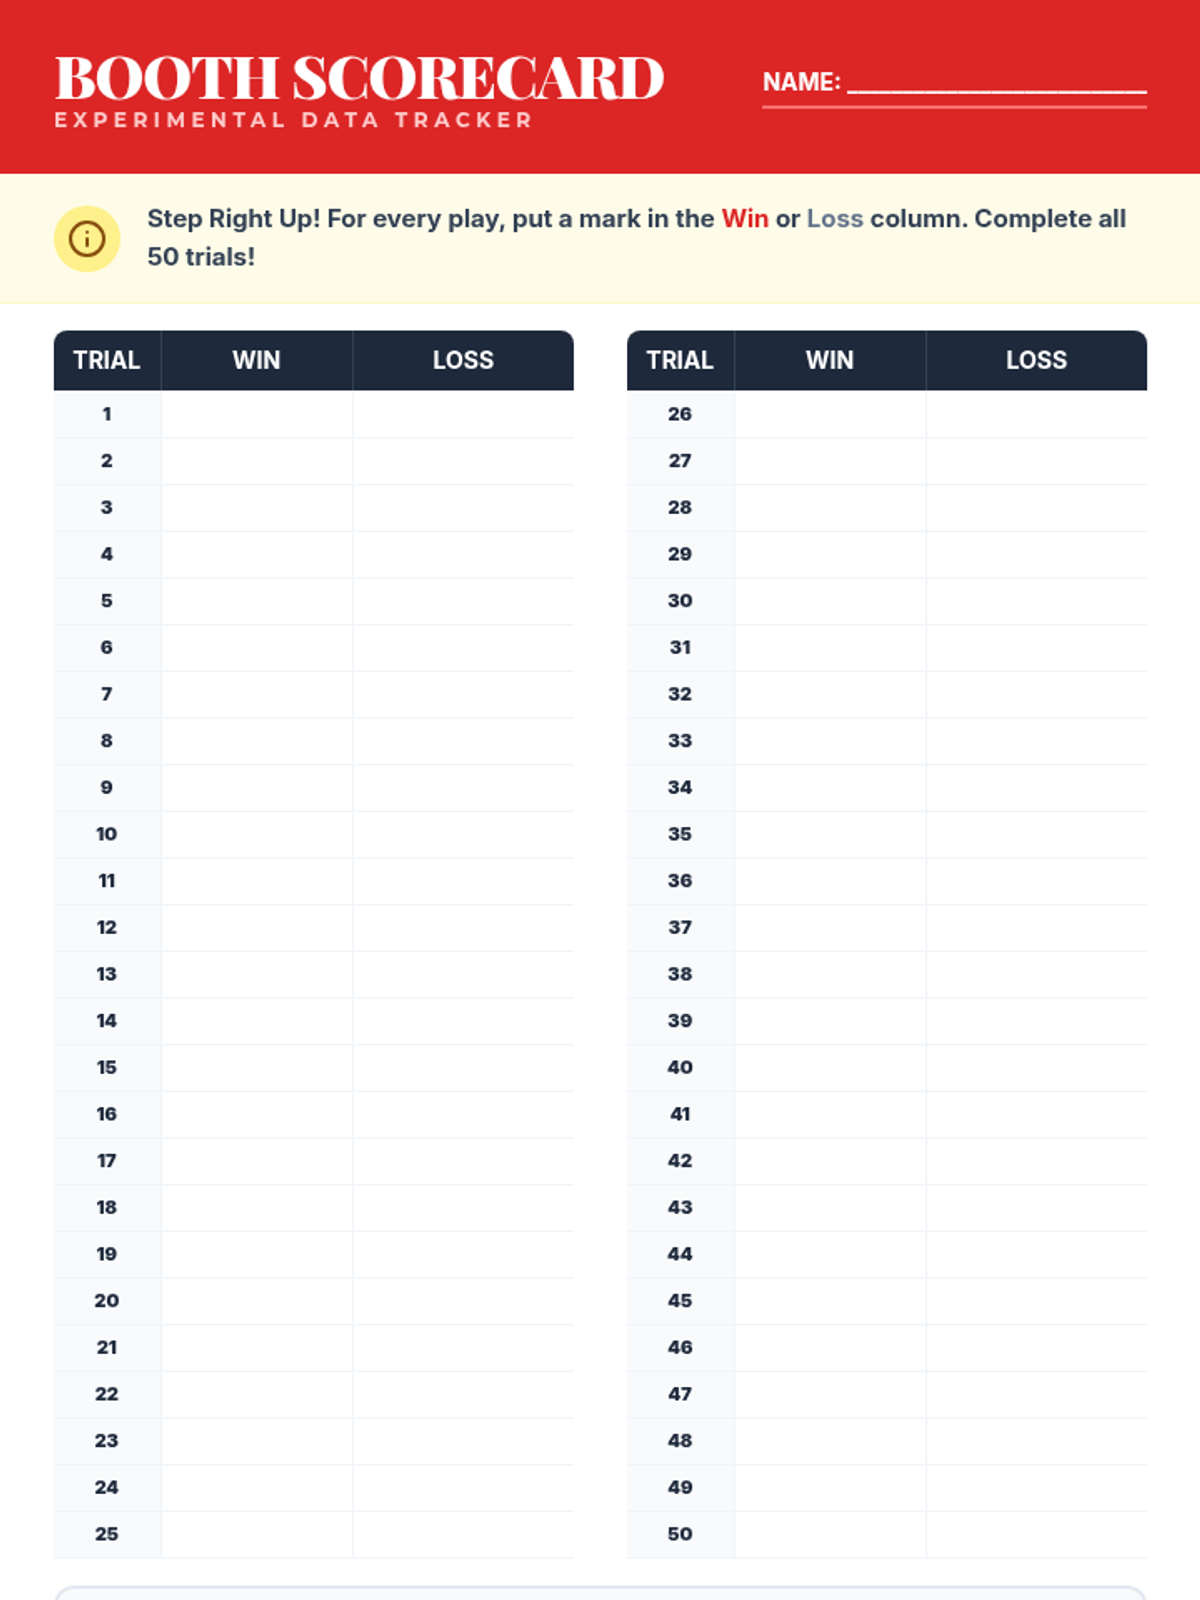
A scorecard worksheet for students to record outcomes (wins vs. losses) during their carnival gameplay, ensuring they collect enough experimental data for analysis.
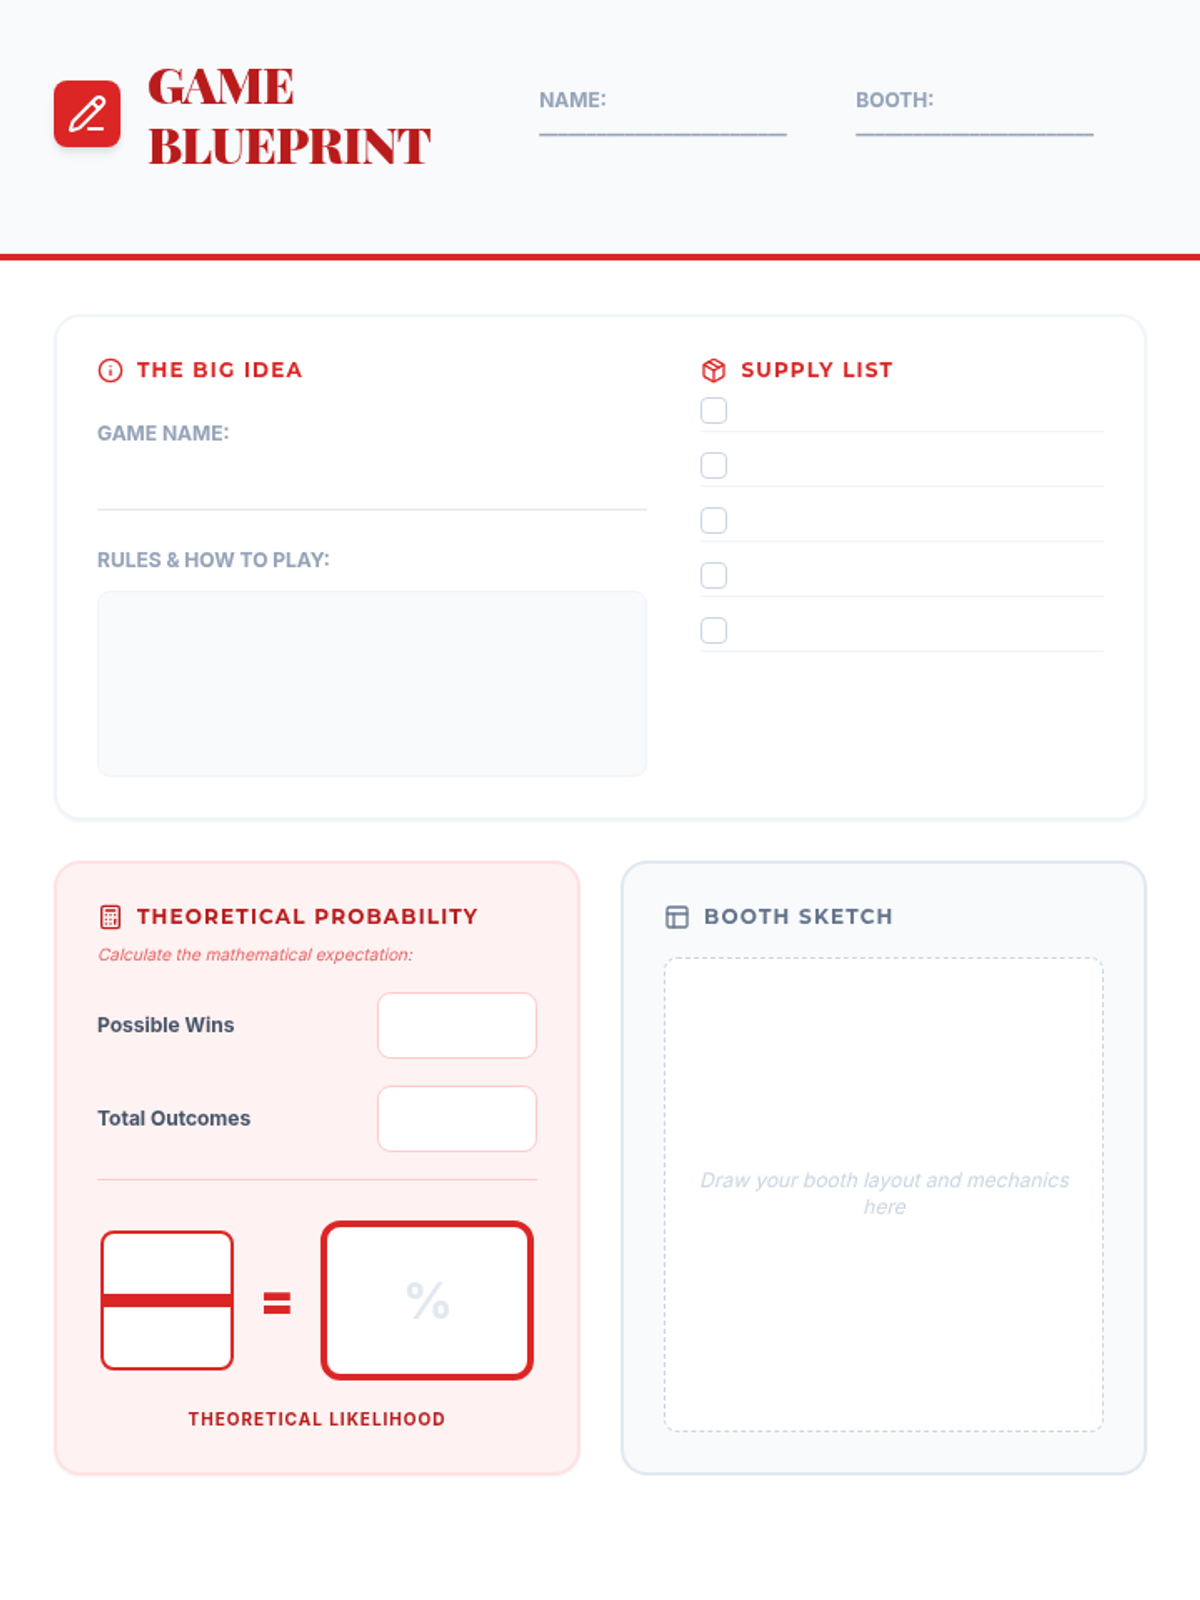
A design activity document where students plan their carnival game, list materials, and calculate the theoretical probability of winning before construction.
An engaging slide deck for 'The Chance Fair' introducing probability concepts, theoretical vs. experimental outcomes, and project rules.
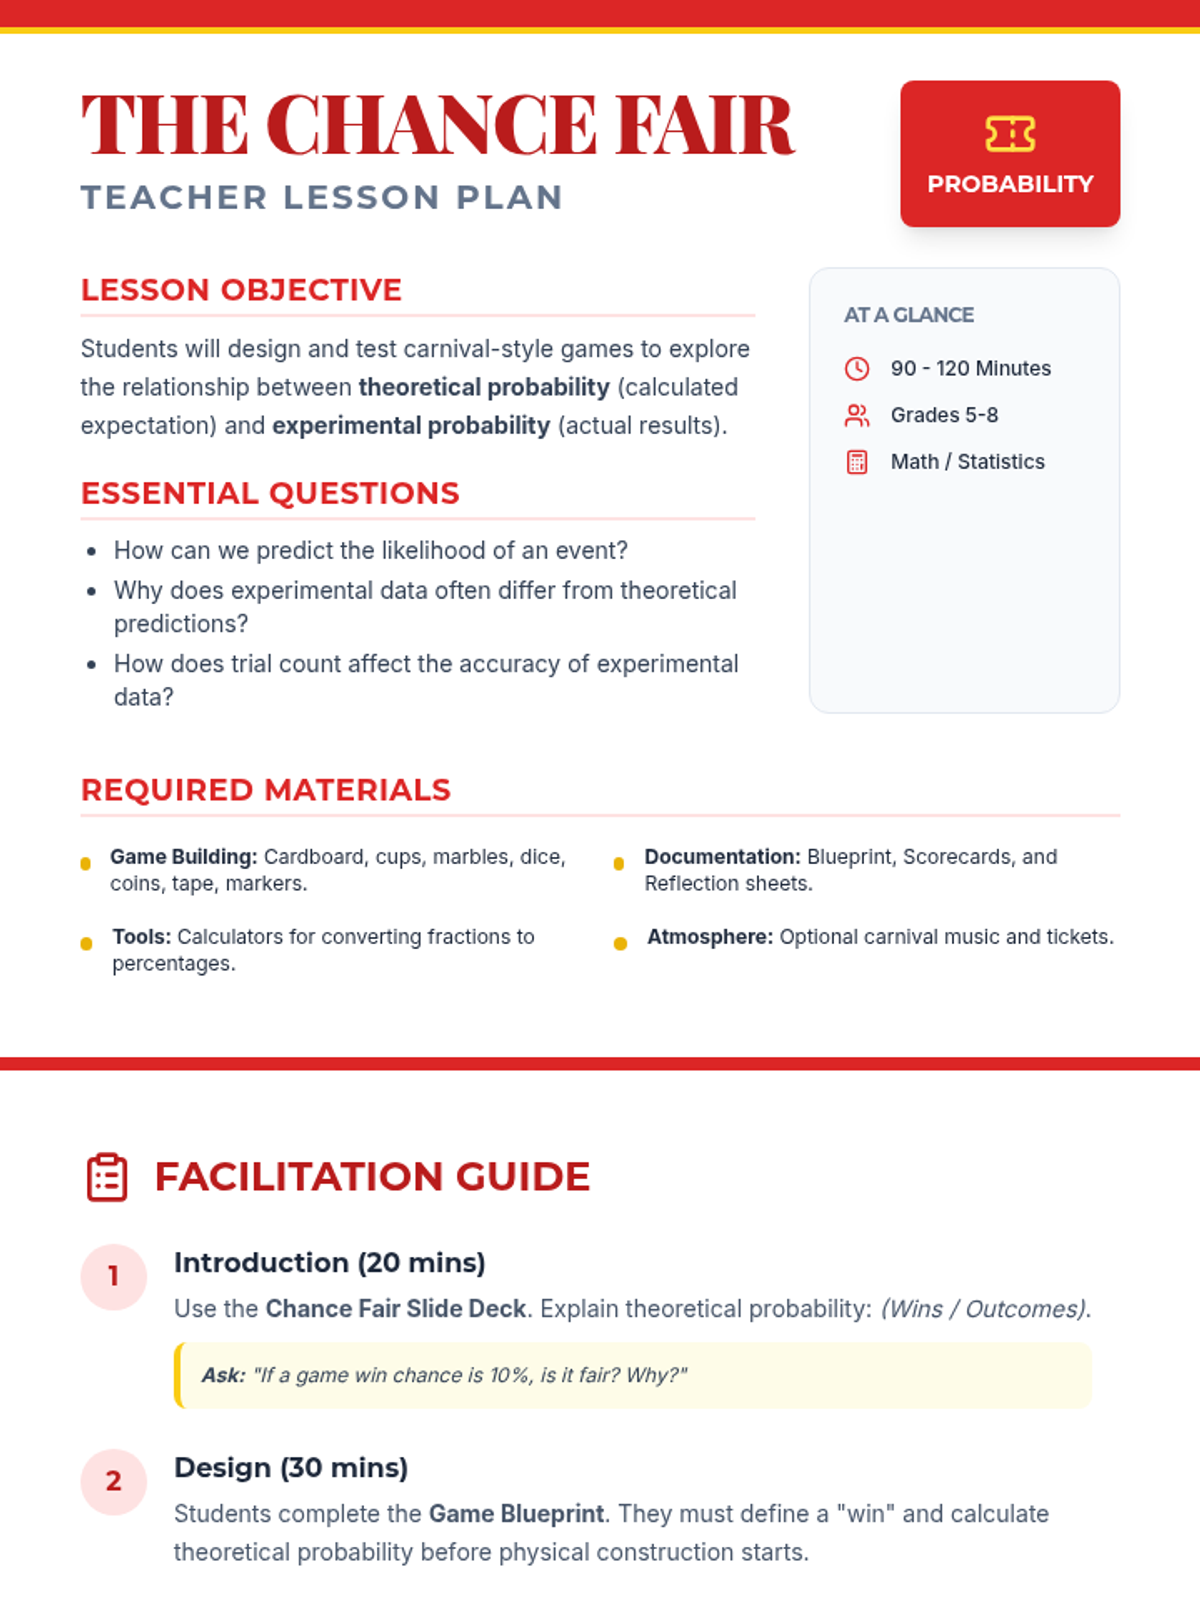
A comprehensive teacher lesson plan for 'The Chance Fair', including learning objectives, required materials, a step-by-step facilitation guide, and differentiation strategies.
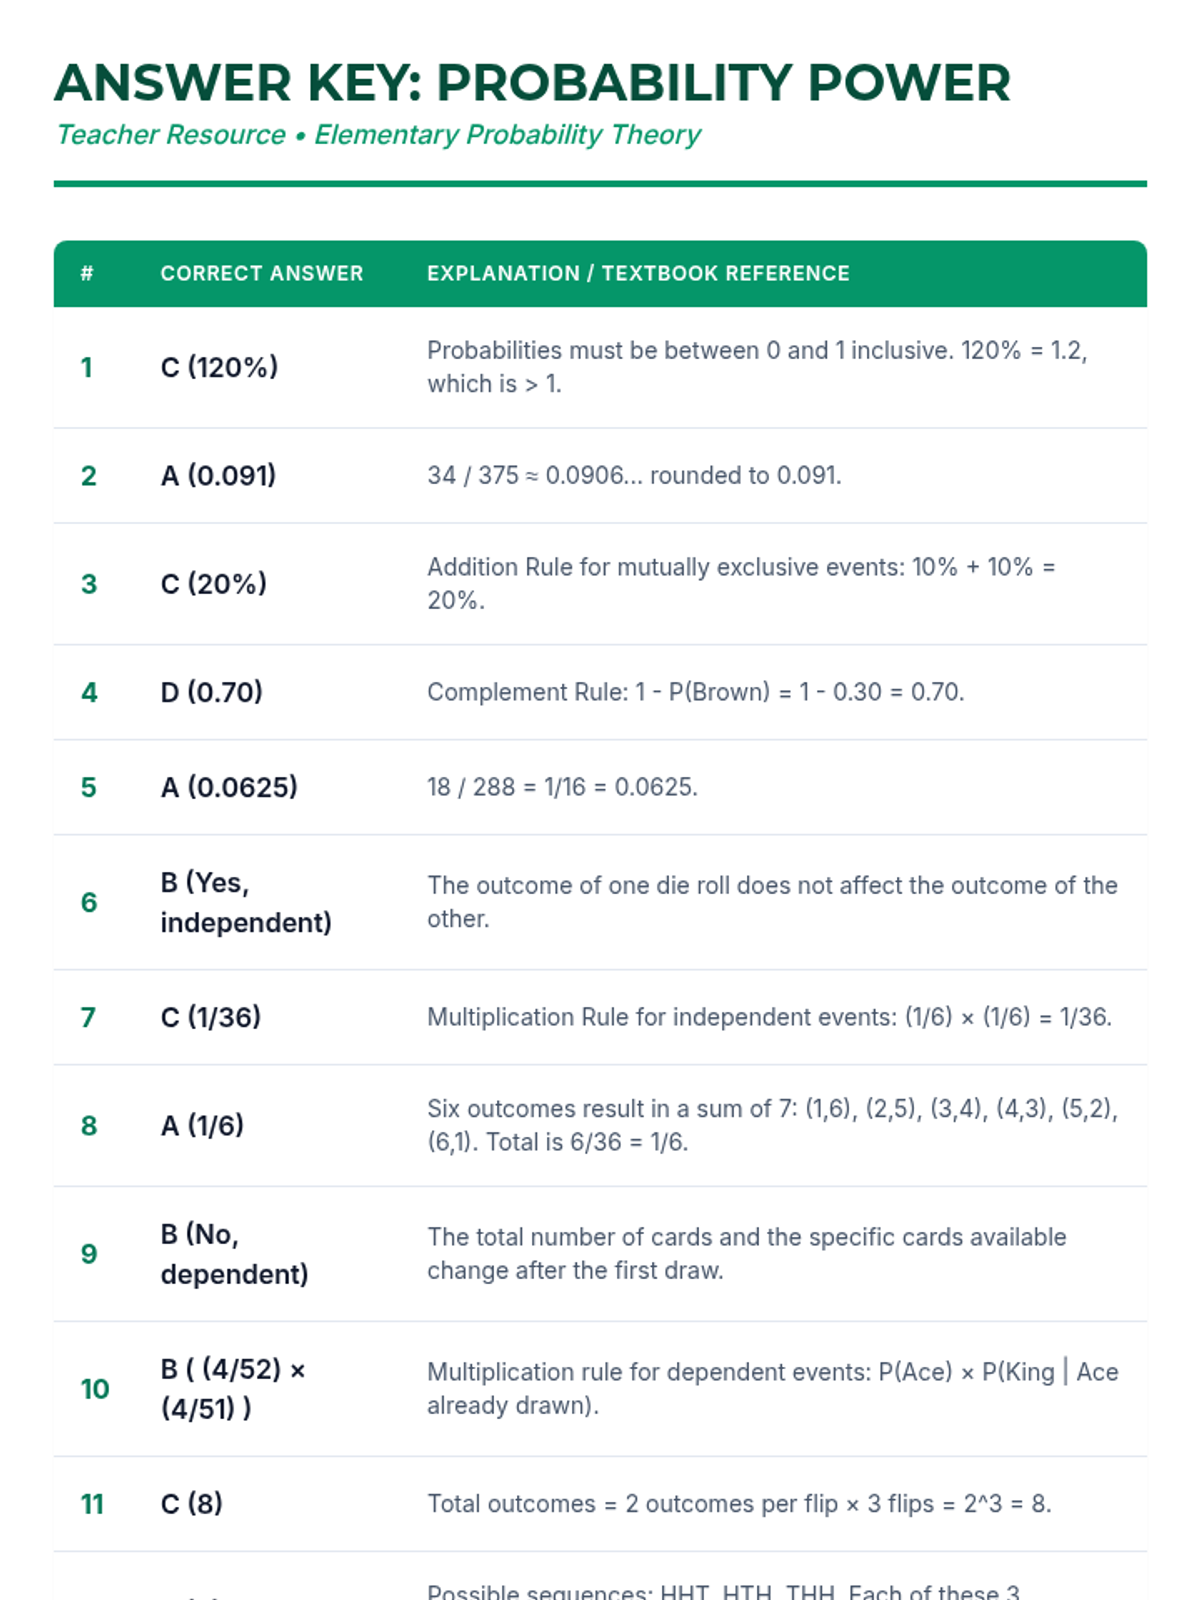
An answer key for the Probability Power Quiz, including detailed explanations and mathematical justifications for each of the 15 questions.
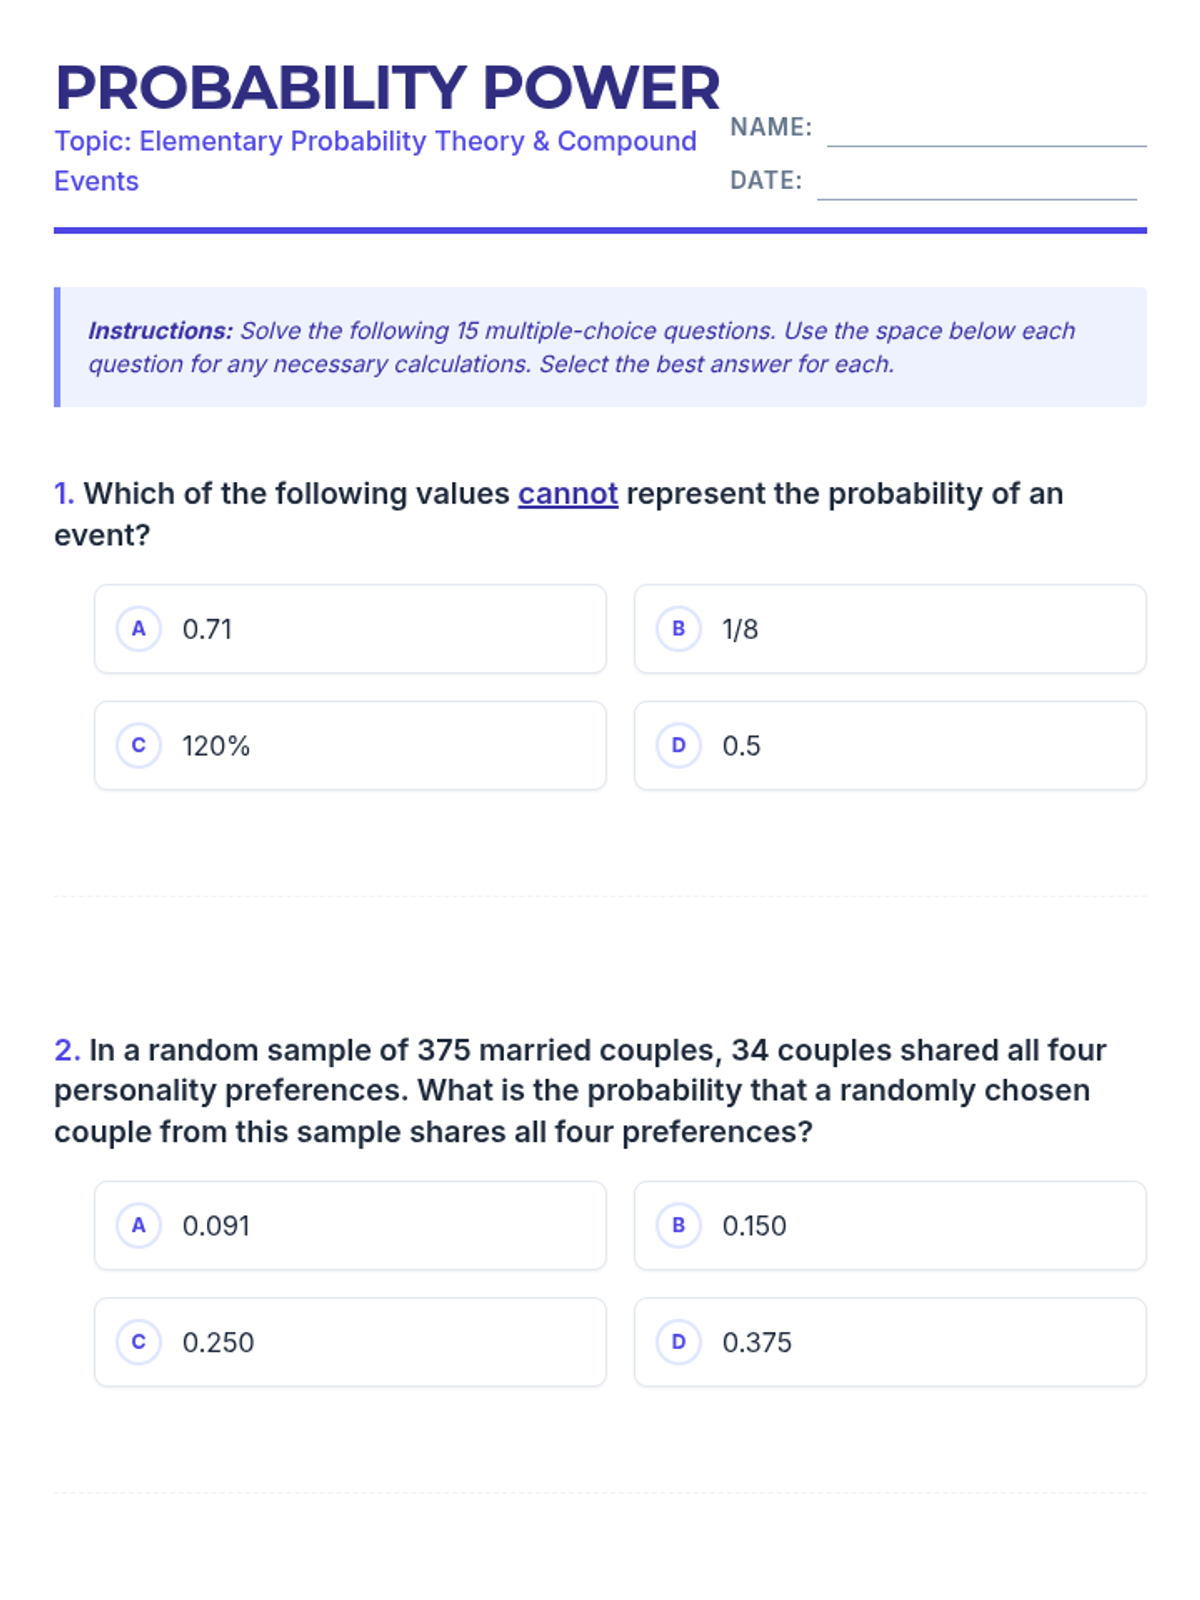
A 15-question multiple-choice worksheet on elementary probability theory. It covers concepts like valid probability ranges, compound events, and tree diagrams based on textbook problems. Includes designated scratch work areas.
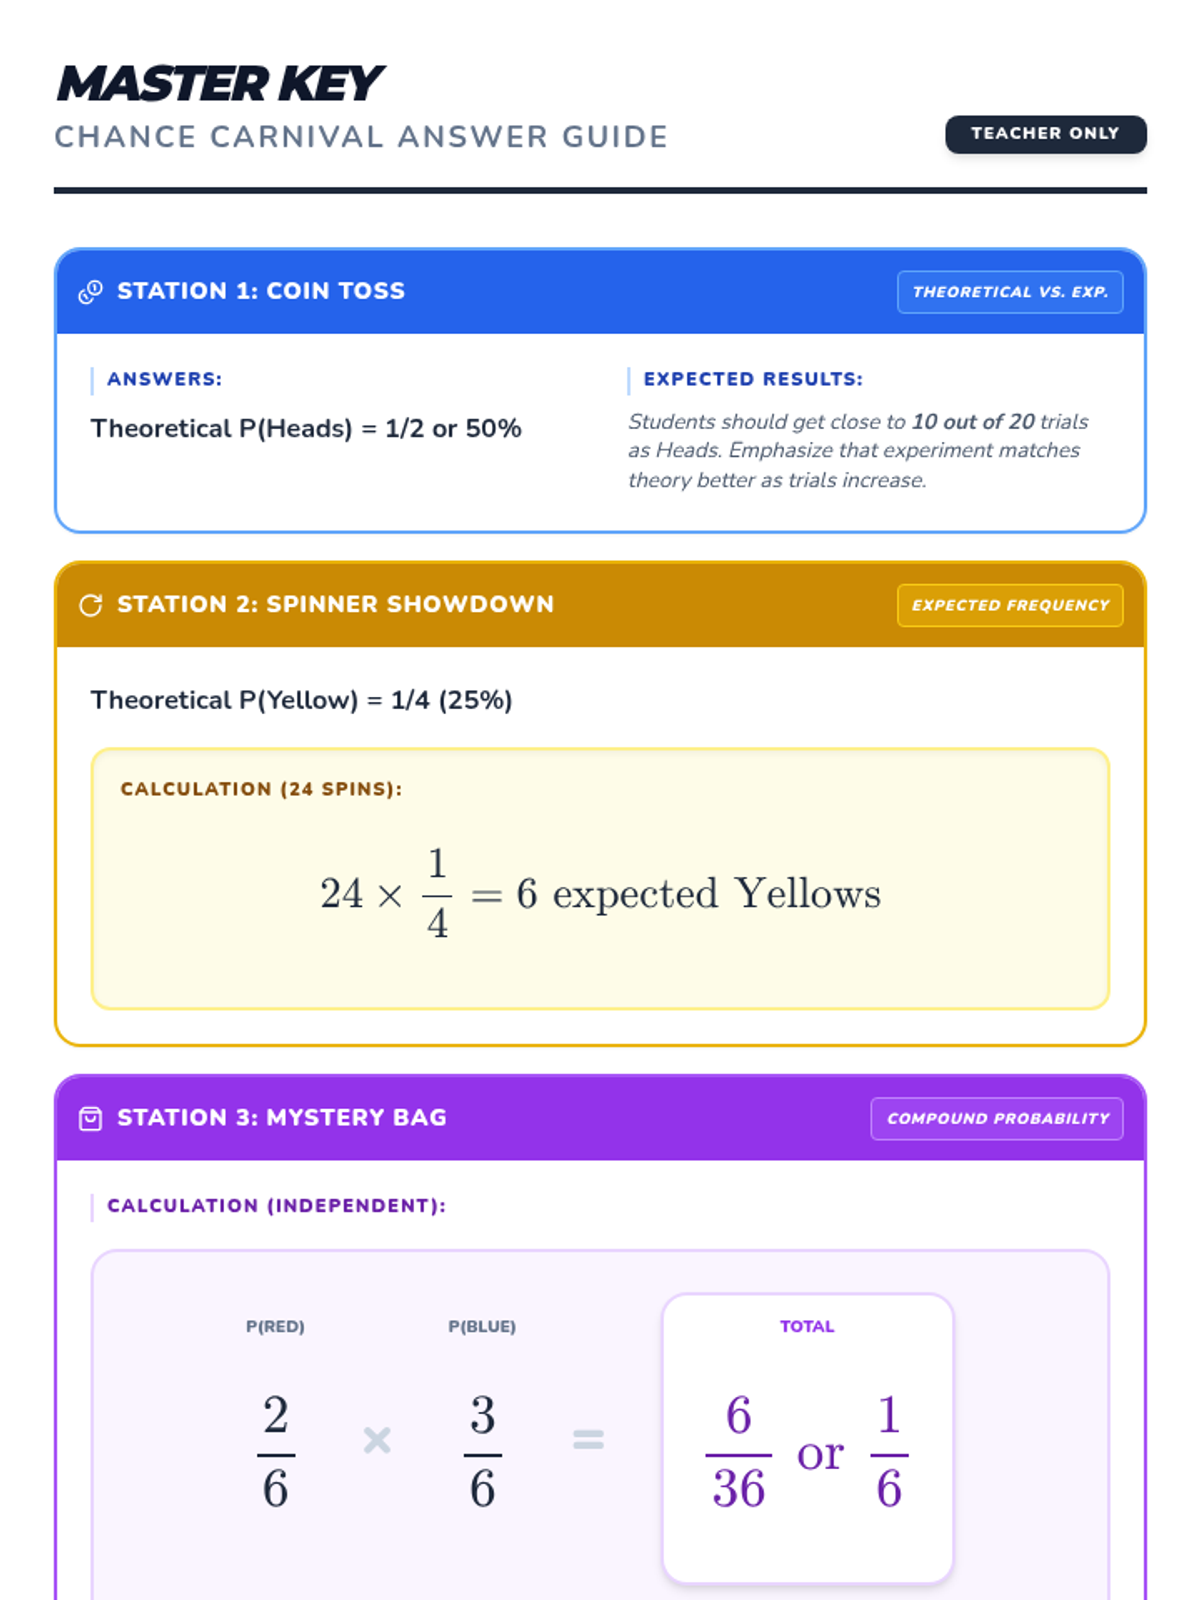
The answer key for the Chance Carnival lab, updated to reflect the change from marbles to colored blocks for Station 3. It provides theoretical probabilities, expected frequencies, and sample space breakdowns for teacher use.
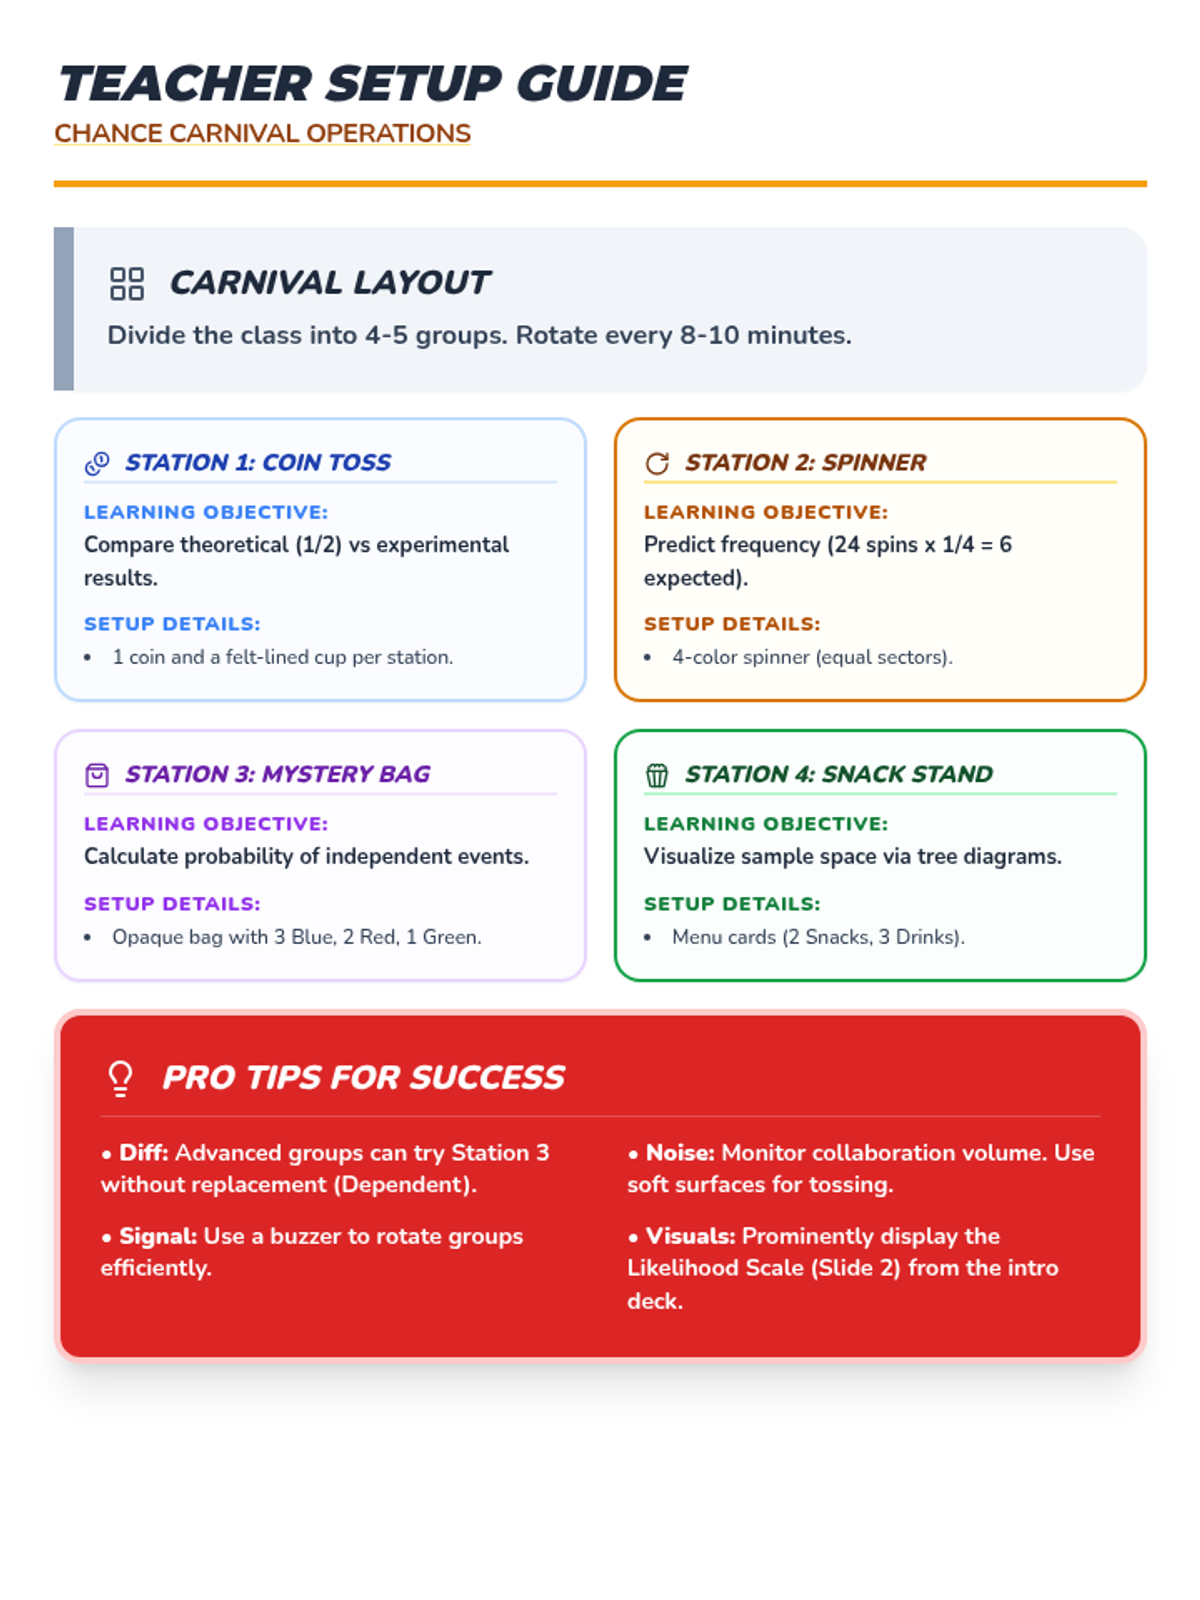
A comprehensive teacher resource providing instructions for setup, learning objectives, and facilitation tips for the probability rotation stations. Updated to reflect the change from marbles to colored blocks for Station 3.
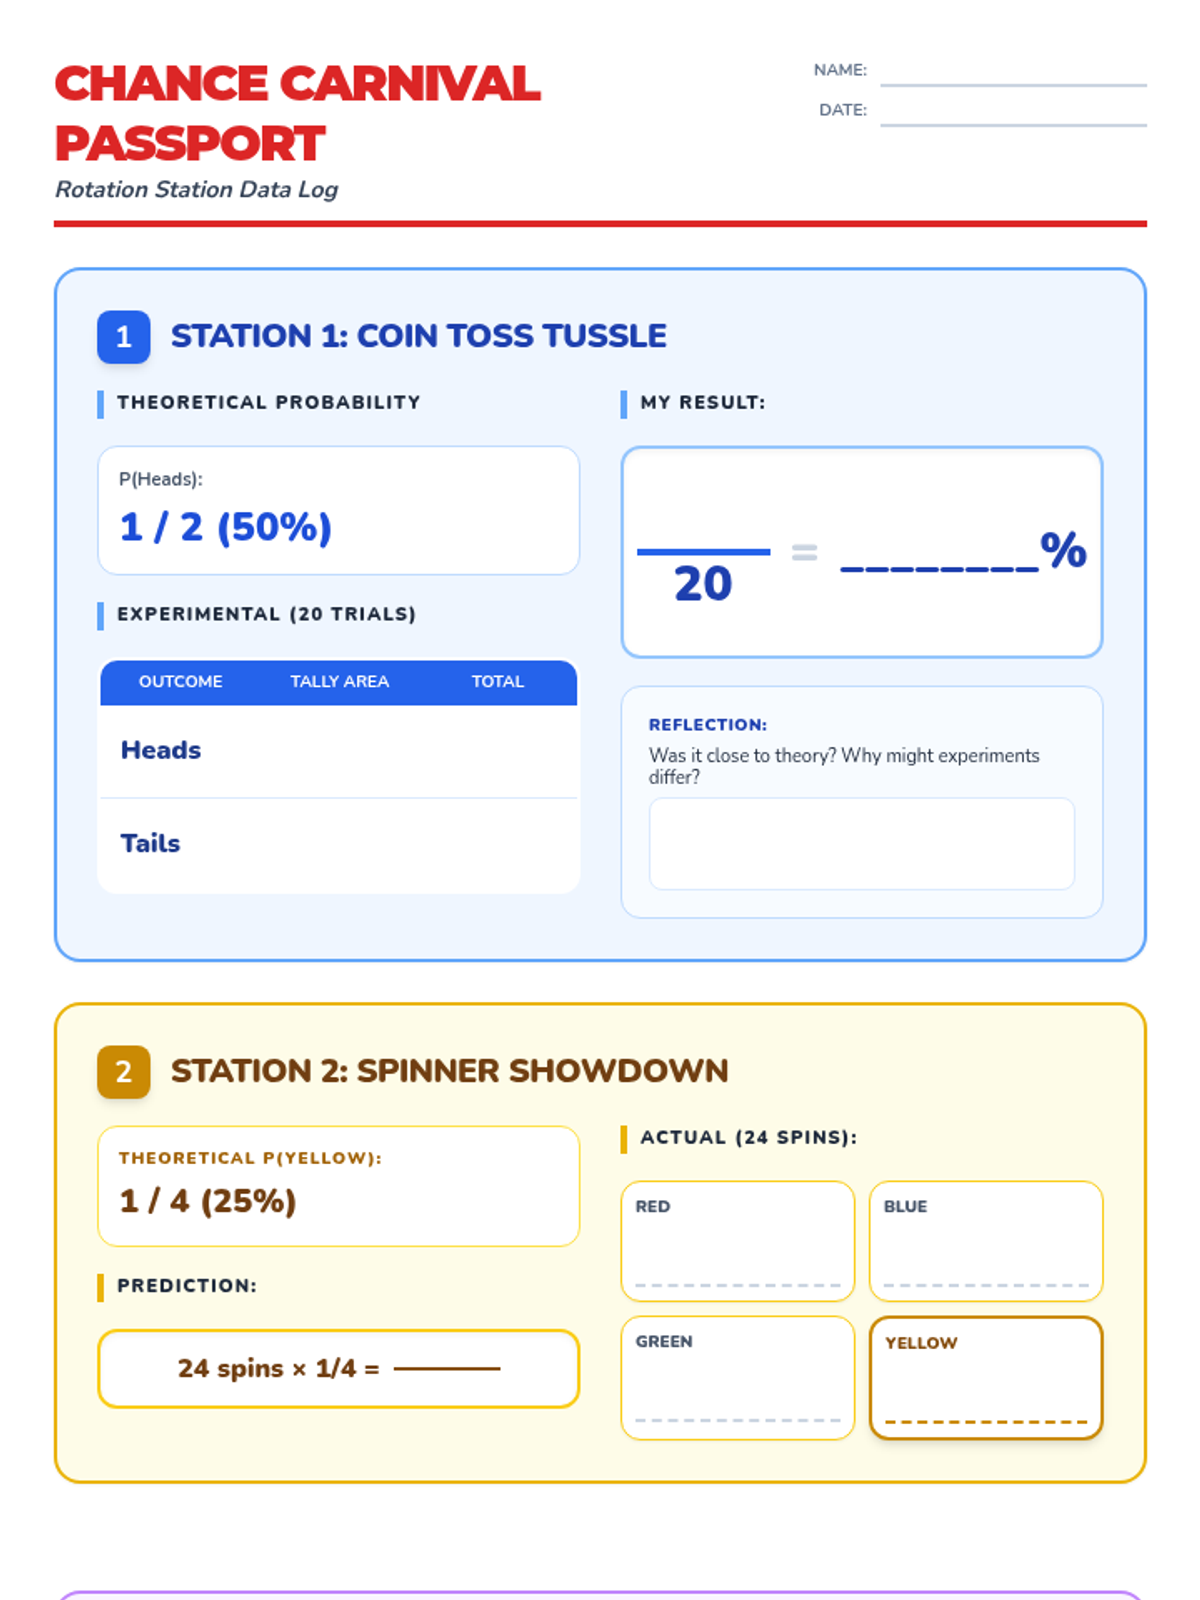
An updated student 'Passport' document where Station 2's tally area has been repurposed as a larger reflection space. Station 4 remains a challenge with no spoilers on outcomes, and Station 3 uses colored blocks with a visual guide. Refined layouts ensure maximum workspace and legibility for all probability rotations.
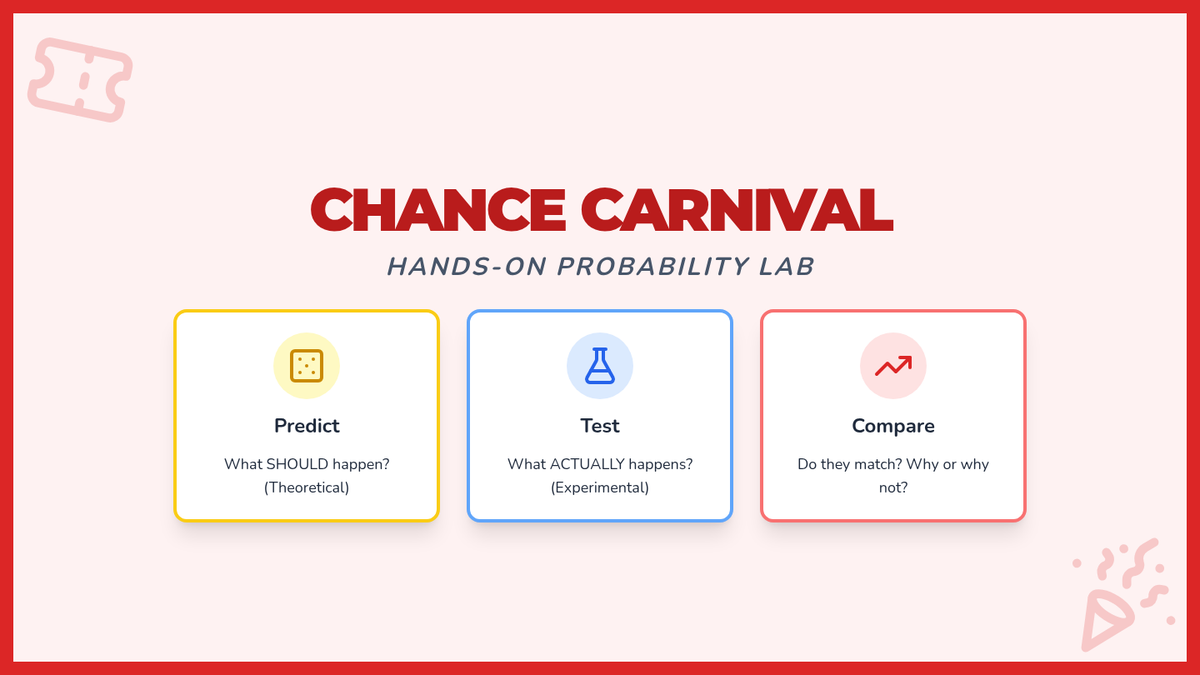
An engaging slide deck to introduce the Chance Carnival hands-on probability stations. Updated to reflect the change from marbles to blocks for Station 3 and the increased complexity of the Station 4 Mega Combo Tree. Includes clear visual aids for likelihood and station rules. Updated Slide 4 to remove outcome counts to match the student worksheet.
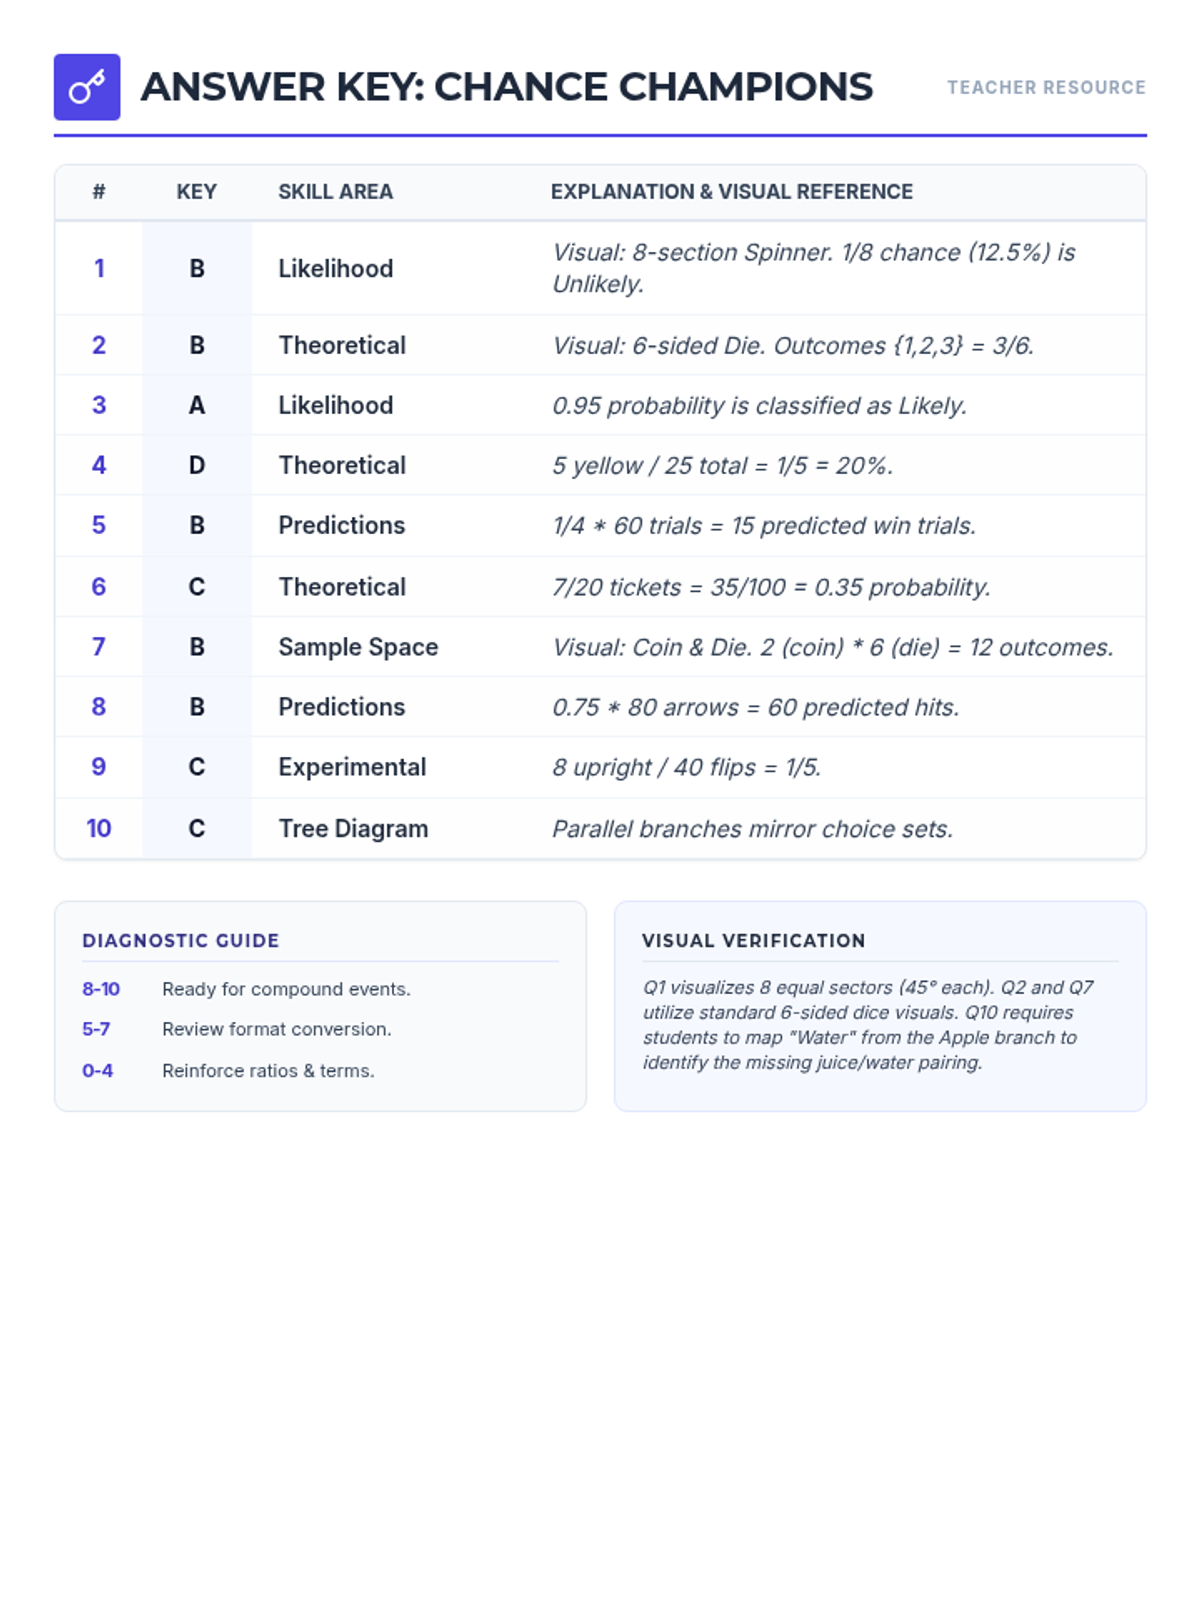
A detailed teacher's answer key for the Chance Champions Pre-test, including skill mapping, step-by-step explanations, and visual references. Optimized for a single-page layout.
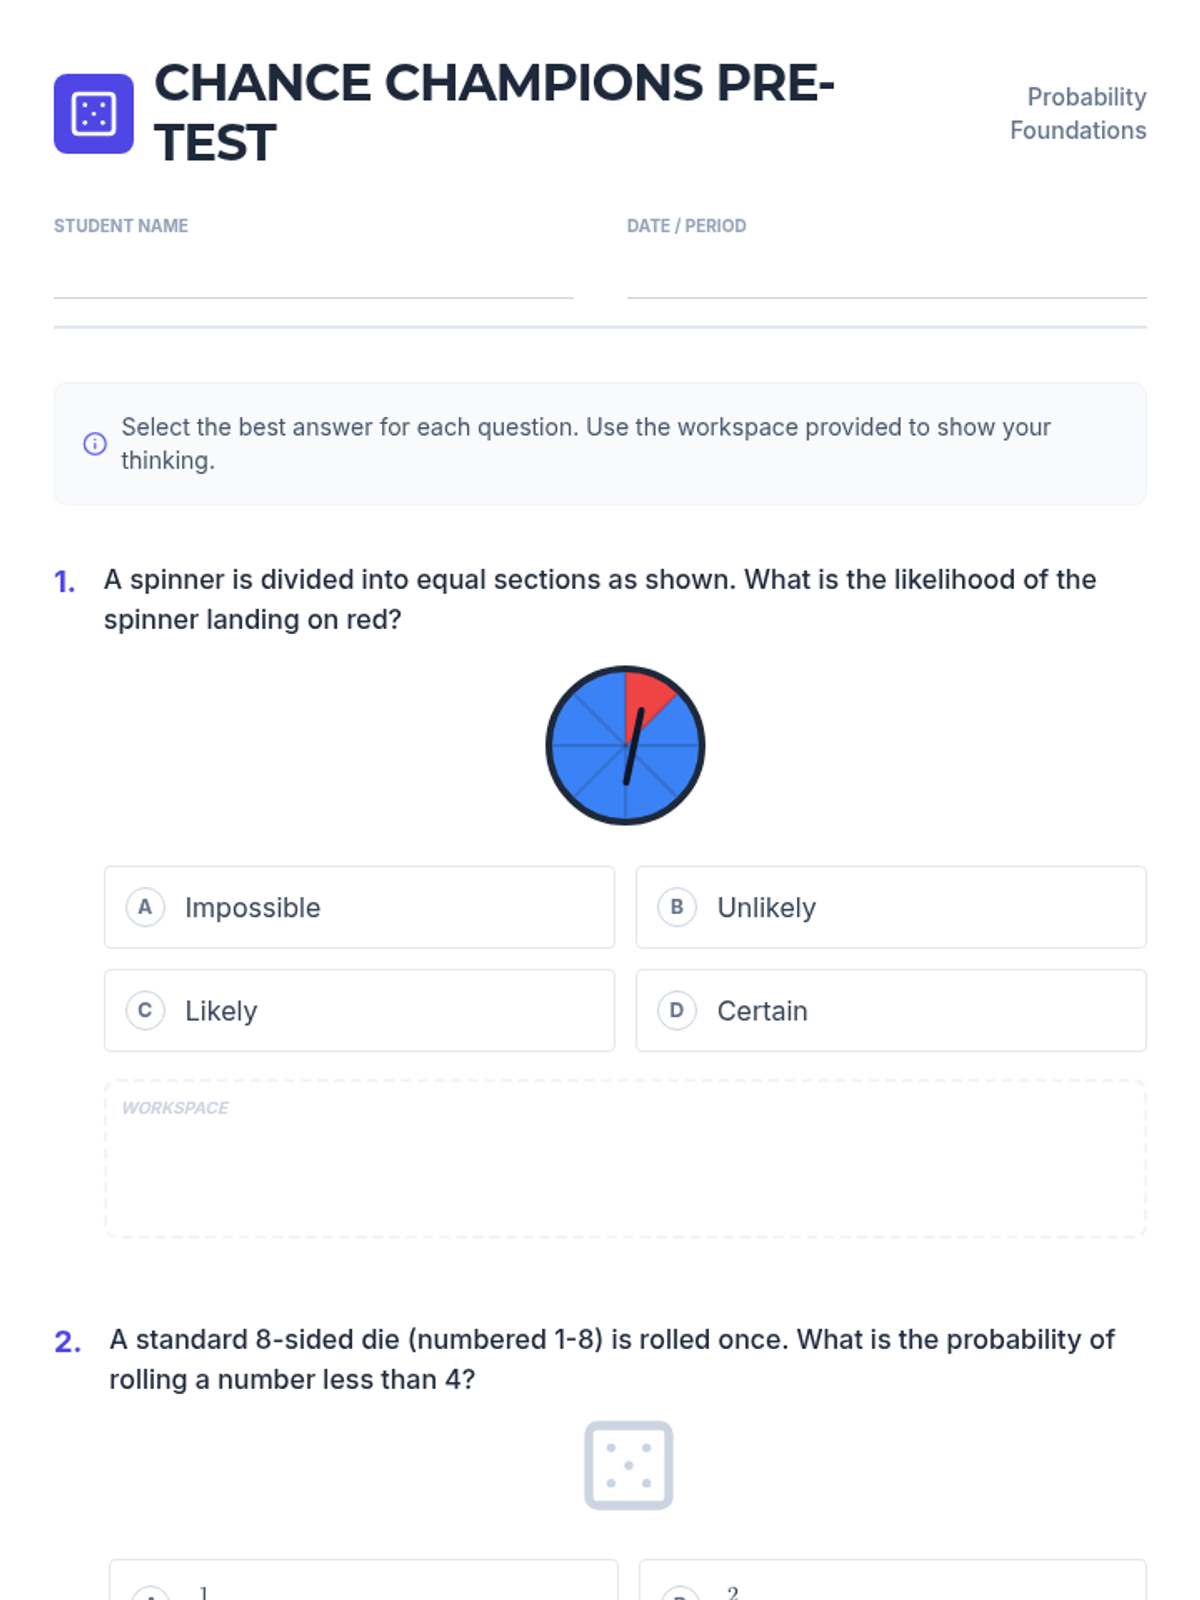
A 10-question probability pre-test covering qualitative likelihood, theoretical probability (fractions, decimals, percentages), predictions, sample spaces, and experimental probability. Includes dedicated workspace and visuals for tables, dice, coins, and tree diagrams.
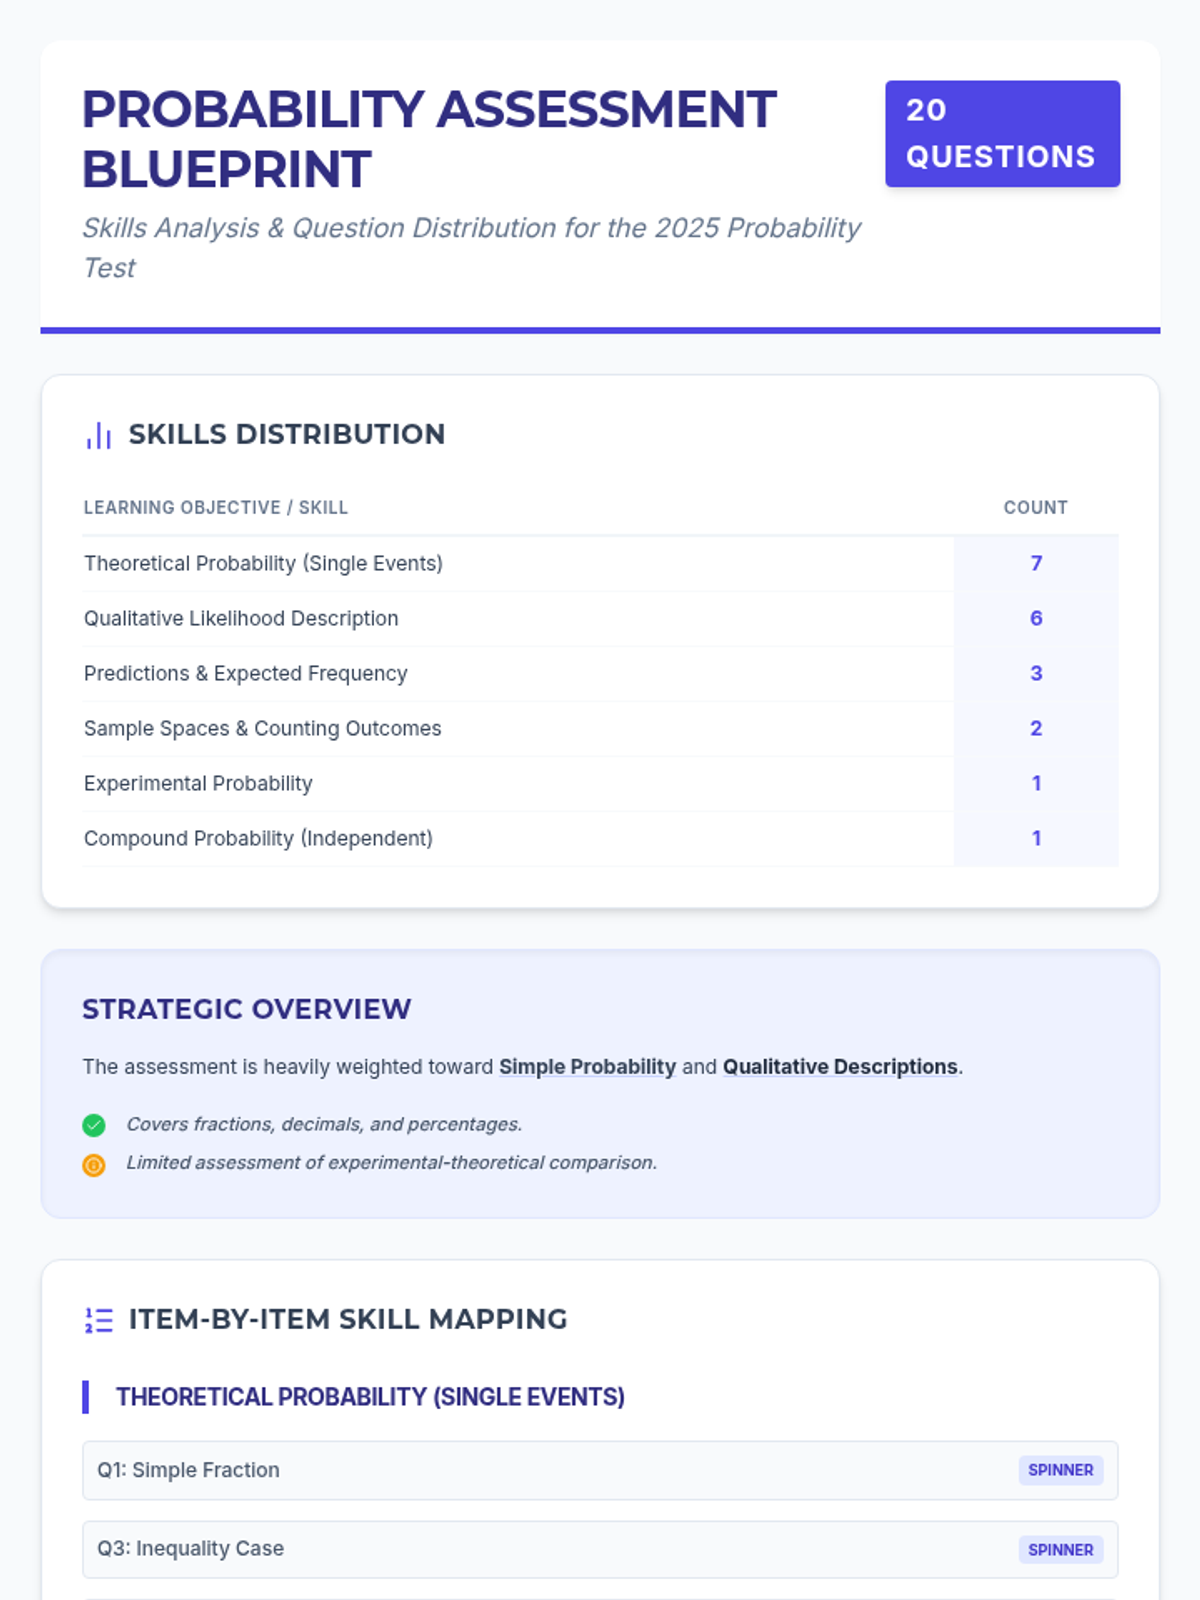
A comprehensive blueprint and skills analysis of the 2025 Probability Test, mapping each question to specific learning objectives and quantifying question distribution.
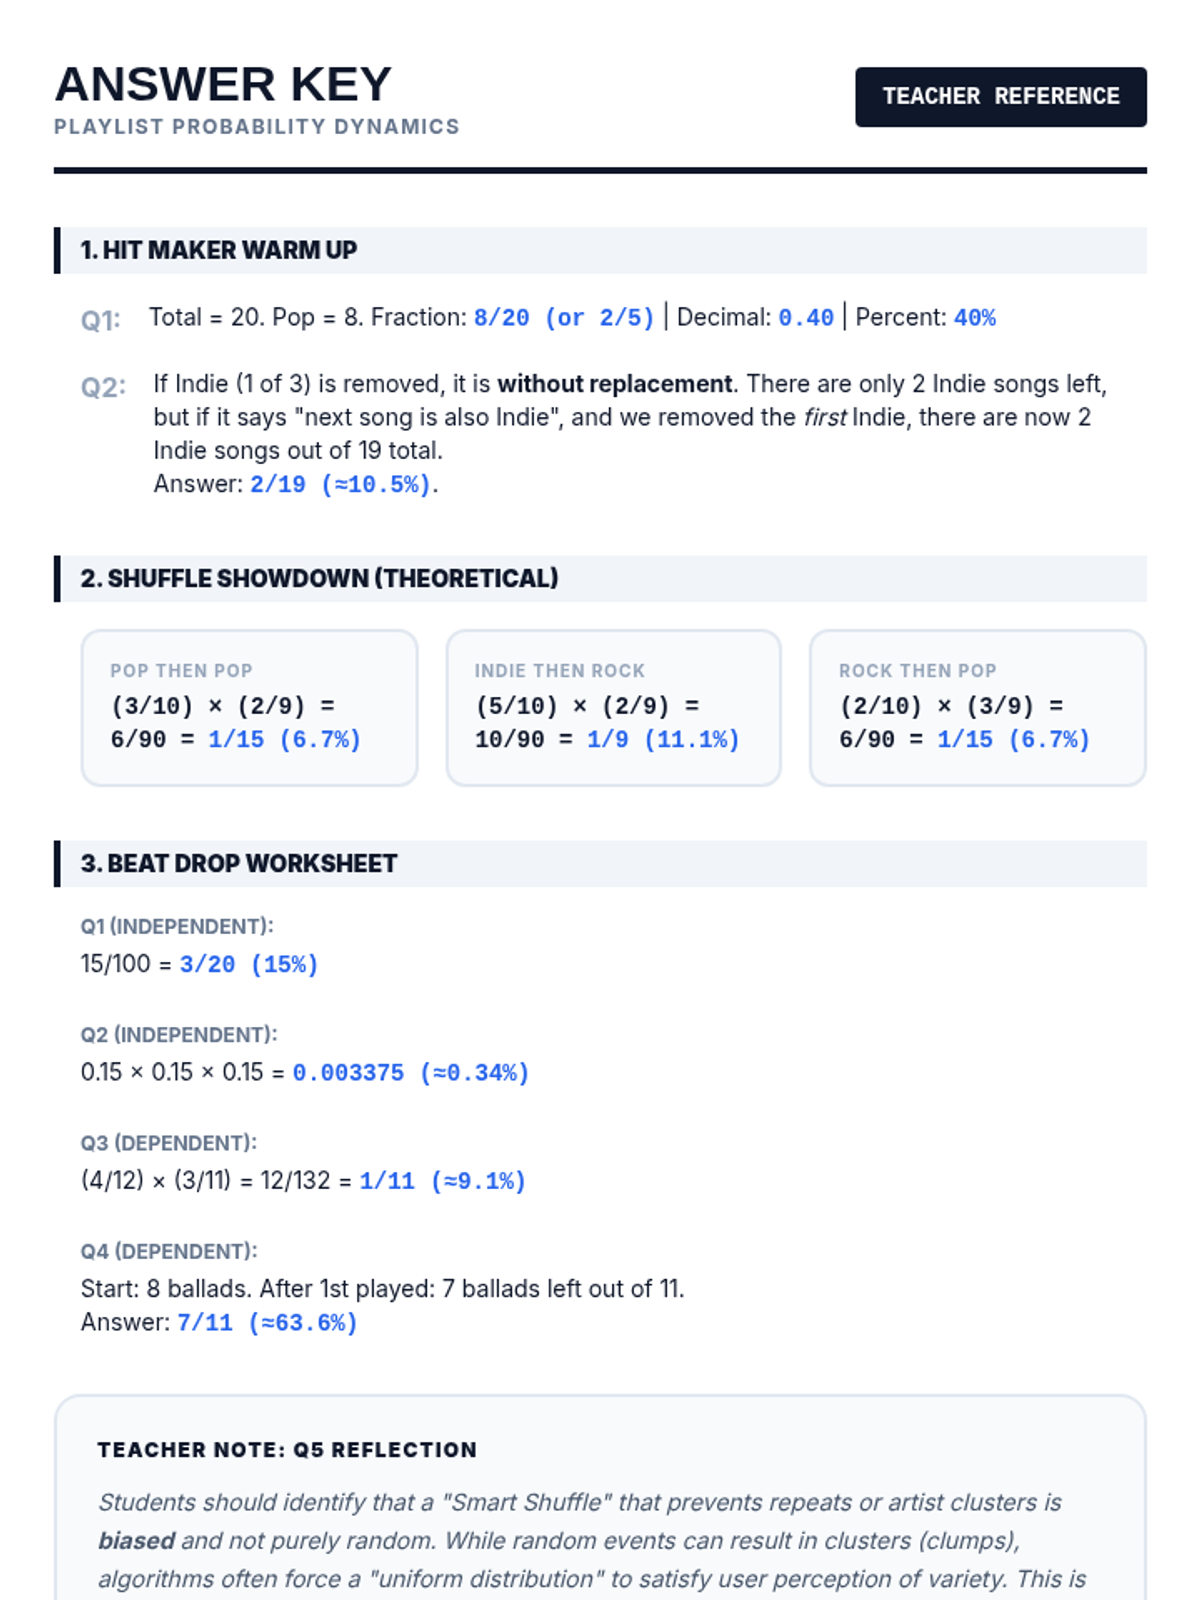
A consolidated answer key for the Playlist Probability Dynamics lesson. Updated with improved header tracking and consolidated layout.
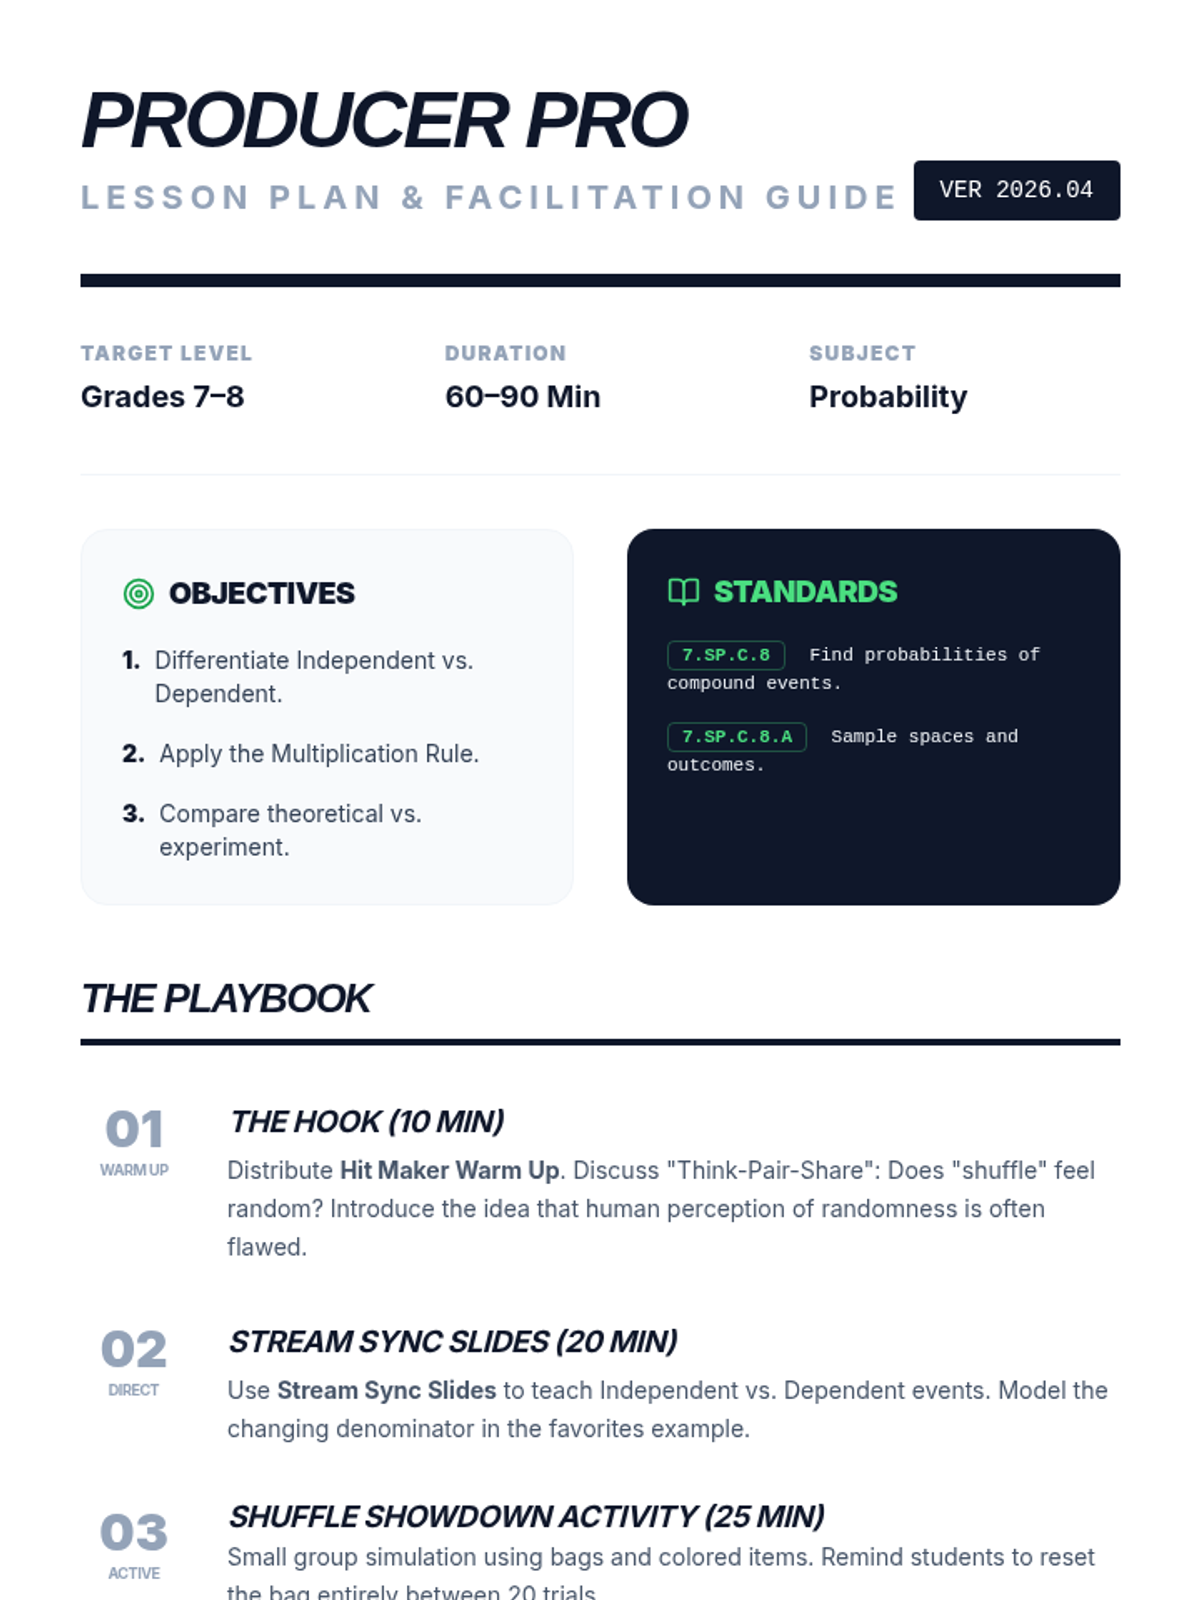
A detailed teacher's guide for the Playlist Probability Dynamics lesson. Updated with improved color contrast for standards and a stable layout for differentiation strategies.
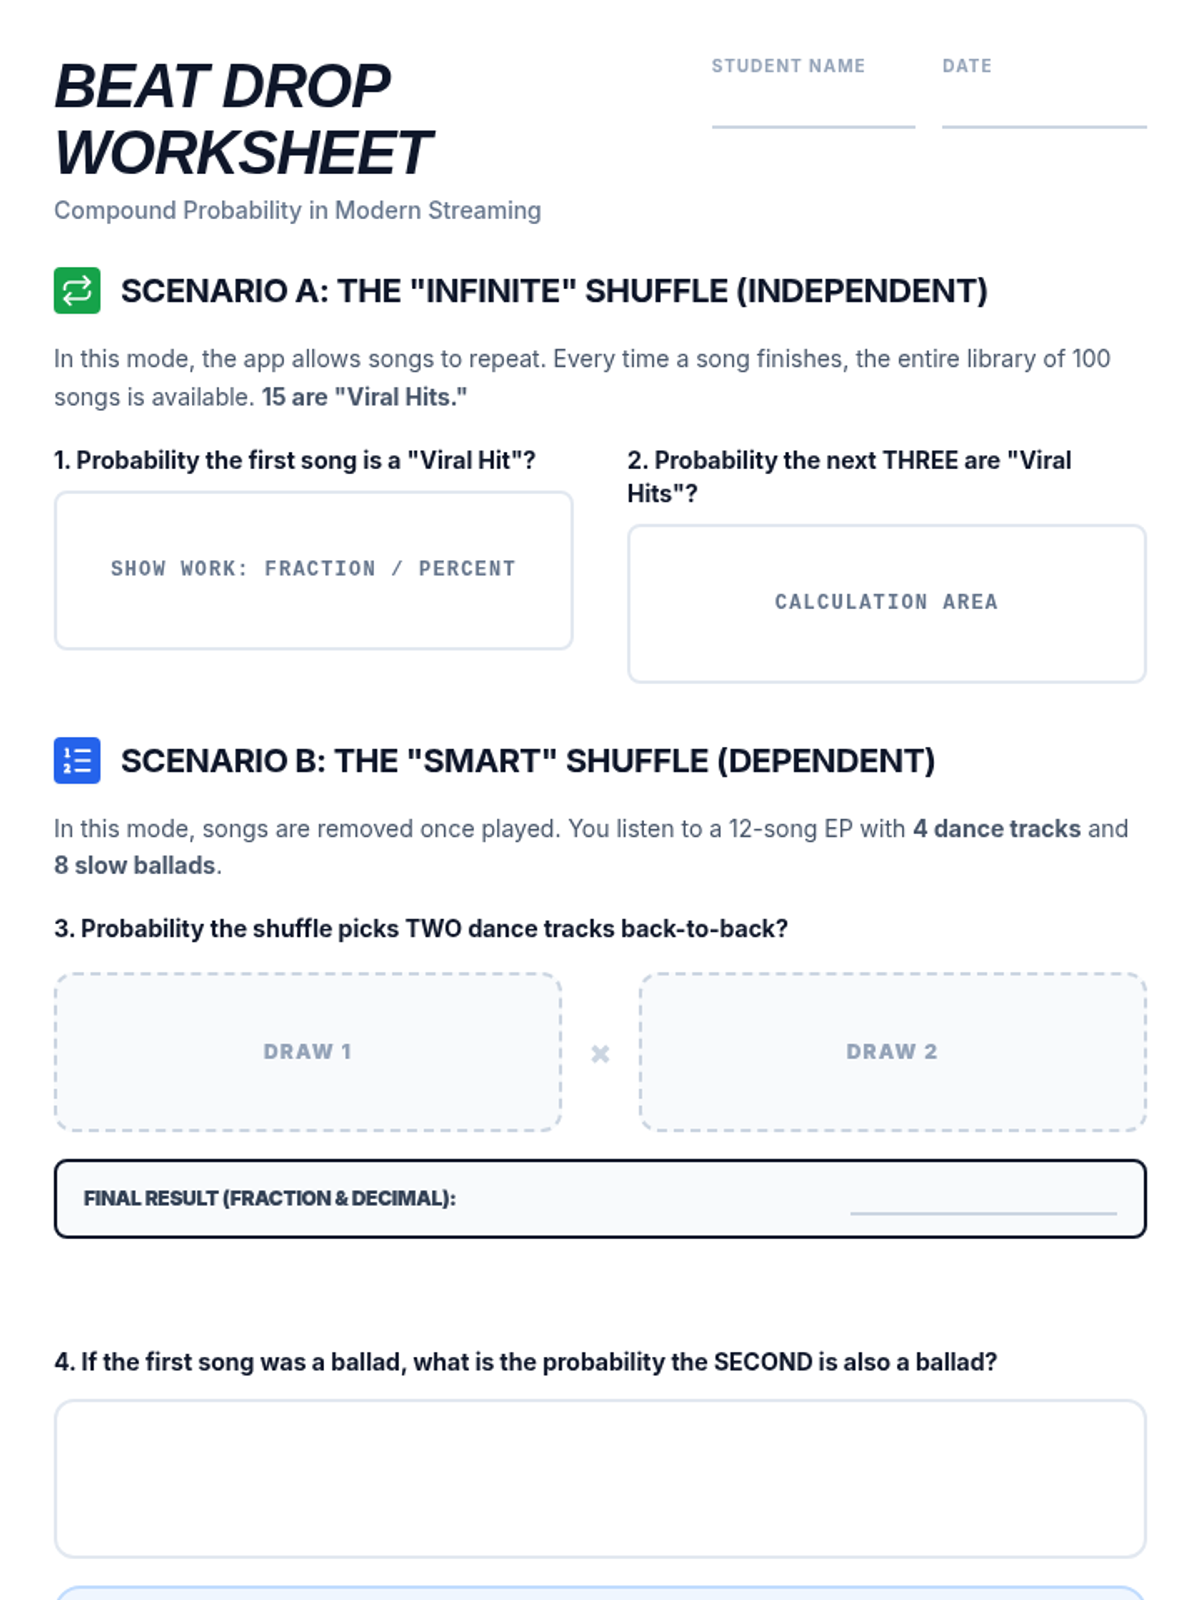
A comprehensive practice worksheet featuring word problems about independent and dependent compound probability. Updated for better page flow and student work area legibility.
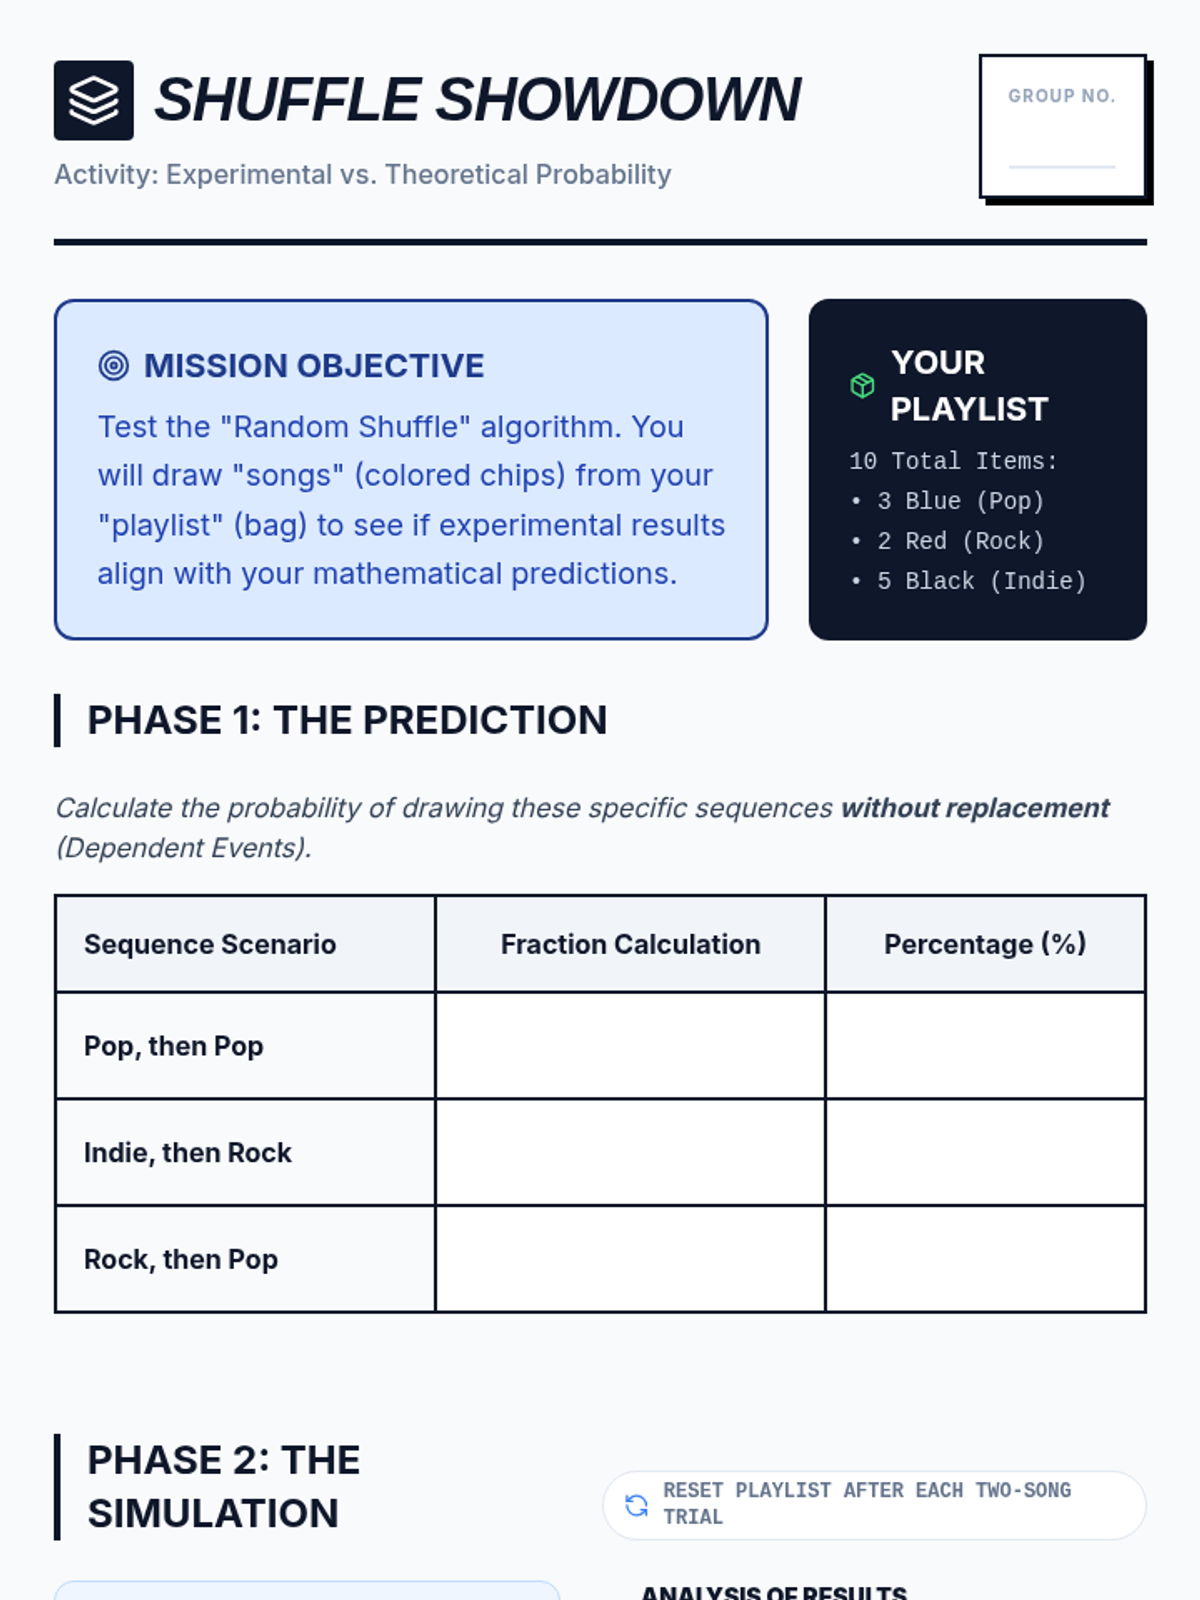
A hands-on activity sheet for students to conduct a shuffle simulation. Updated with clarified simulation rules, improved layout on page 2, and print-friendly input areas.
A high-energy, dark-themed slide deck that introduces compound probability concepts through the lens of music streaming algorithms. Updated with corrected math formulas and improved visual contrast.
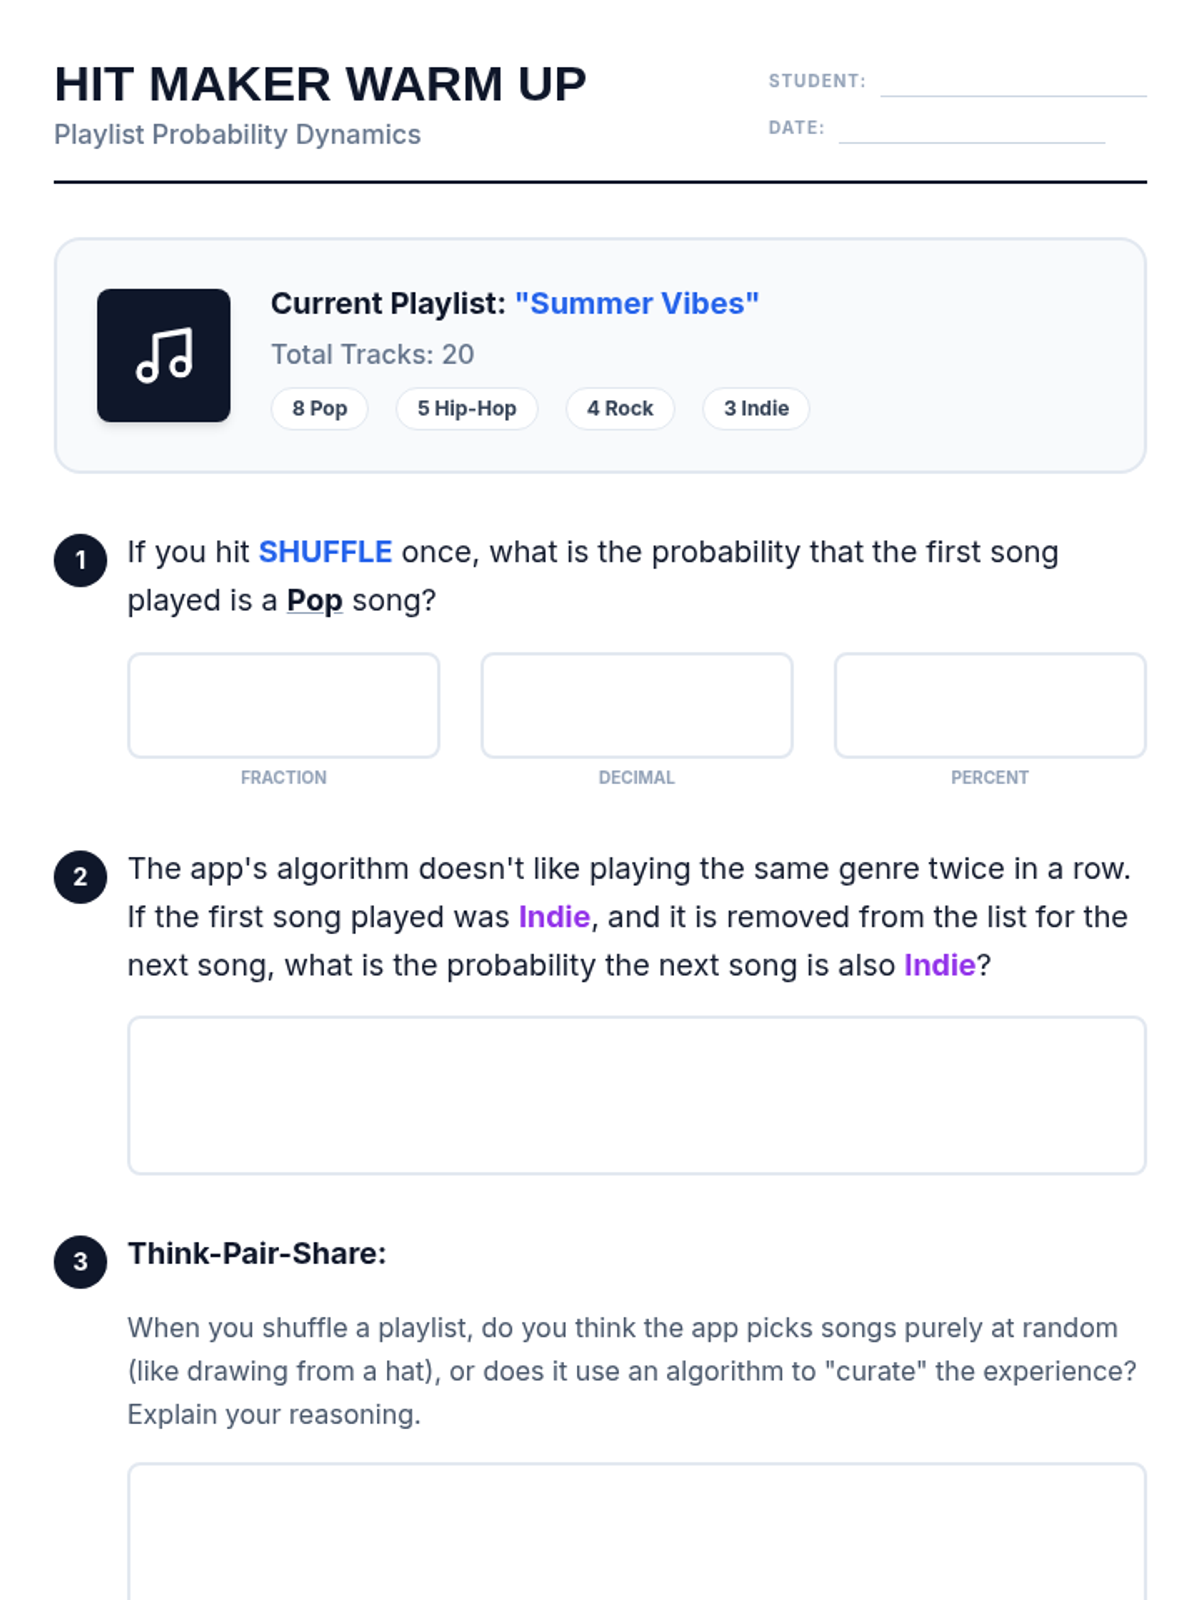
A streaming-themed warm-up worksheet for students to calculate basic probabilities using a fictional playlist and reflect on shuffle algorithms. Updated for better print contrast and layout.
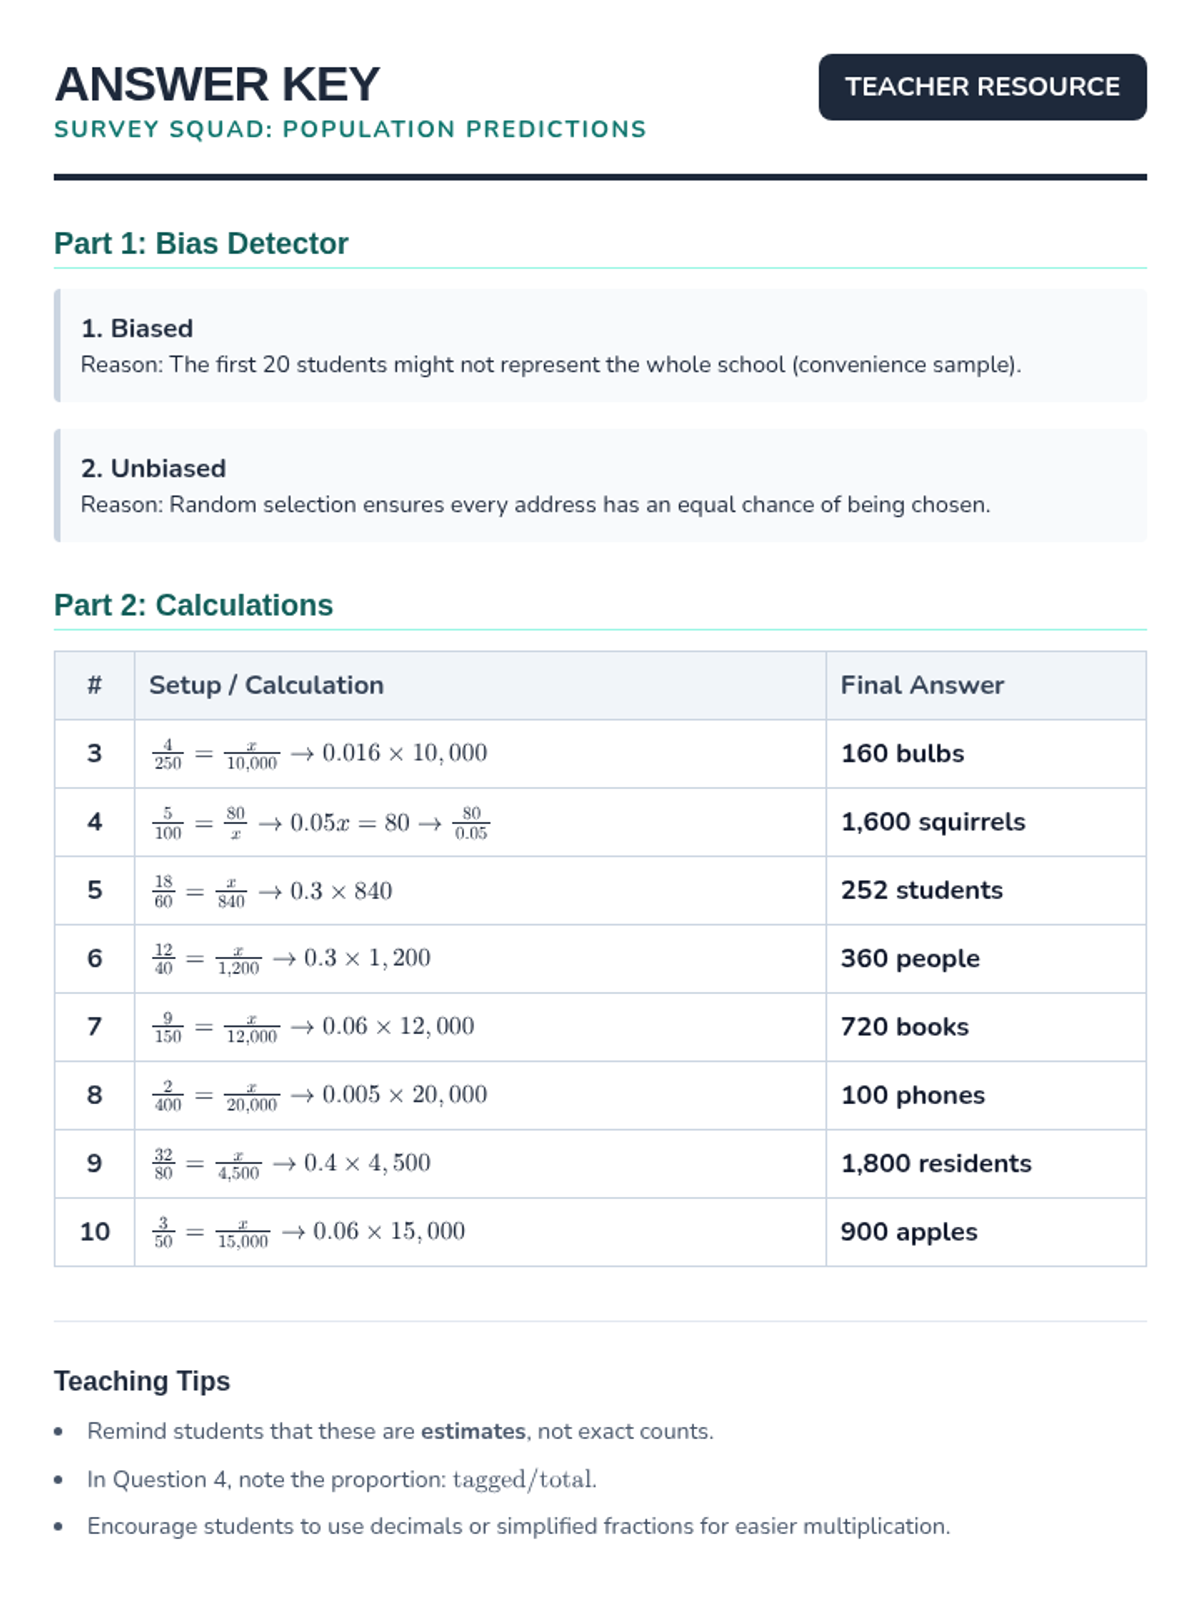
Complete answer key for the Population Predictions Worksheet, including step-by-step setup for calculations and brief explanations for bias questions.
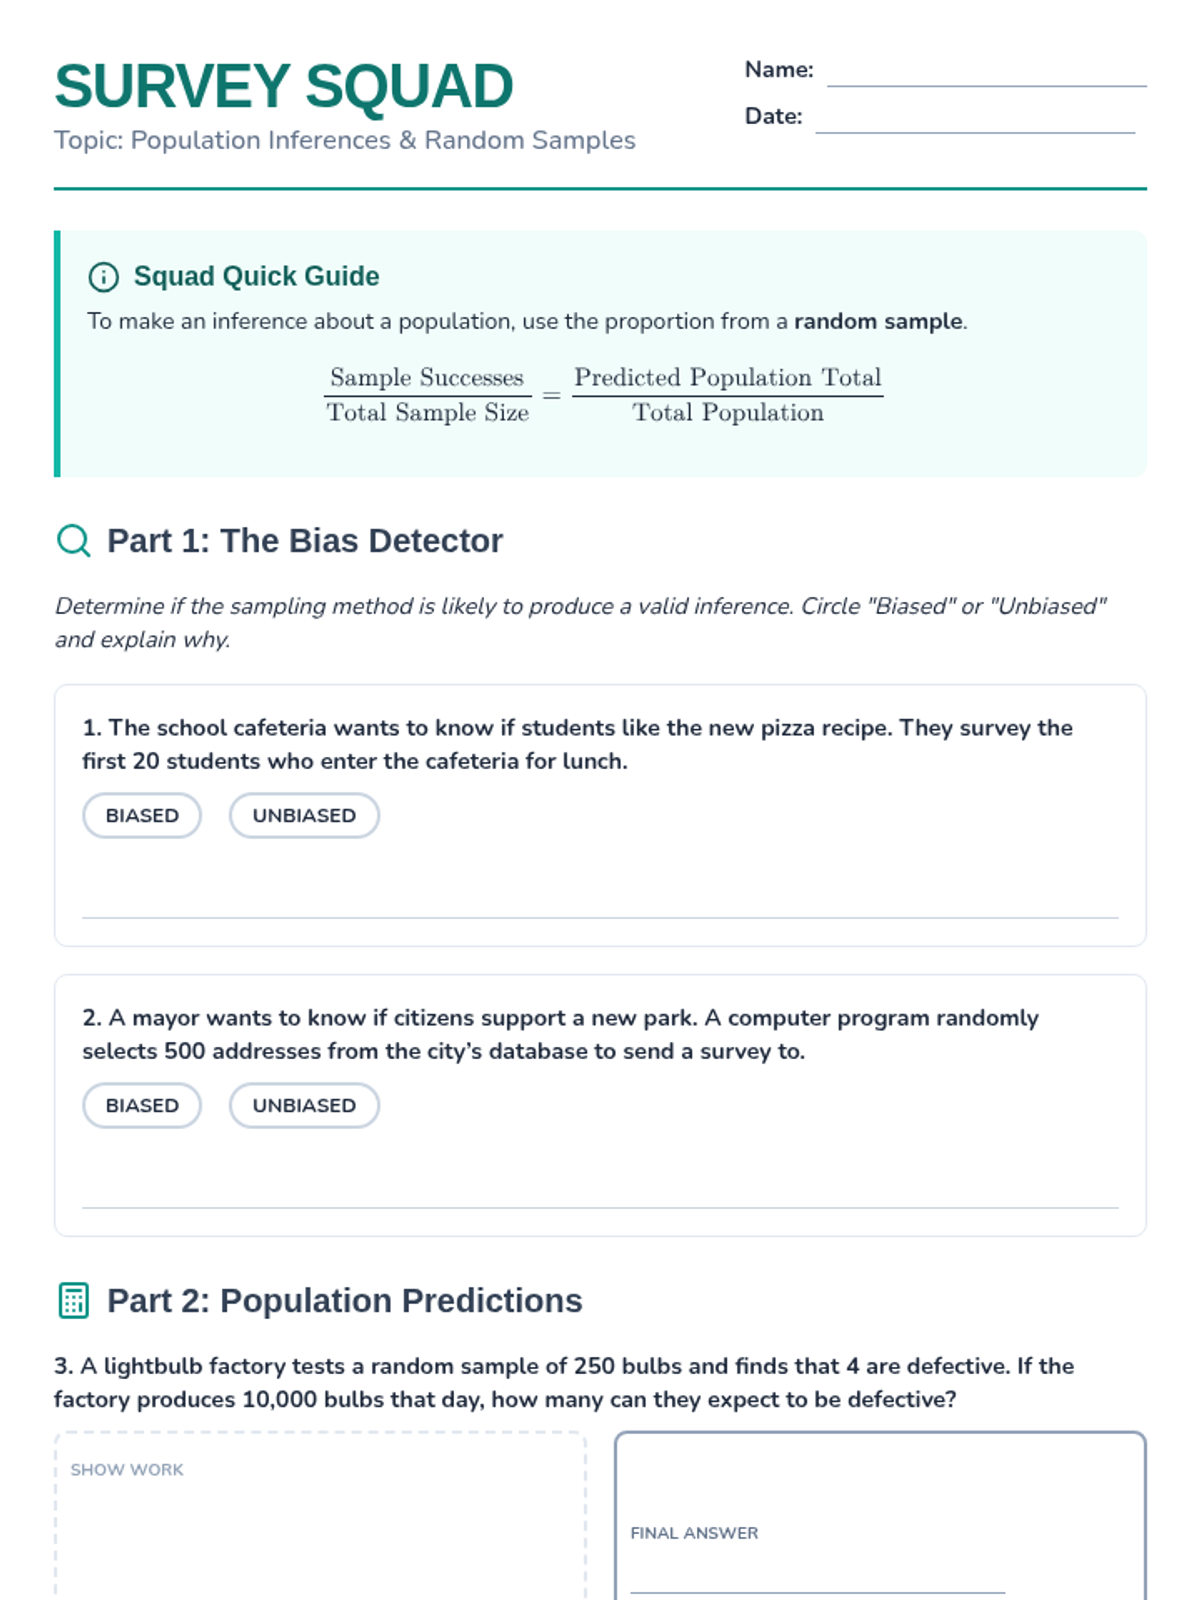
A 10-problem worksheet for students to practice identifying sampling bias and making population inferences using proportions. It includes work areas for calculations and clear sections for different types of problems.
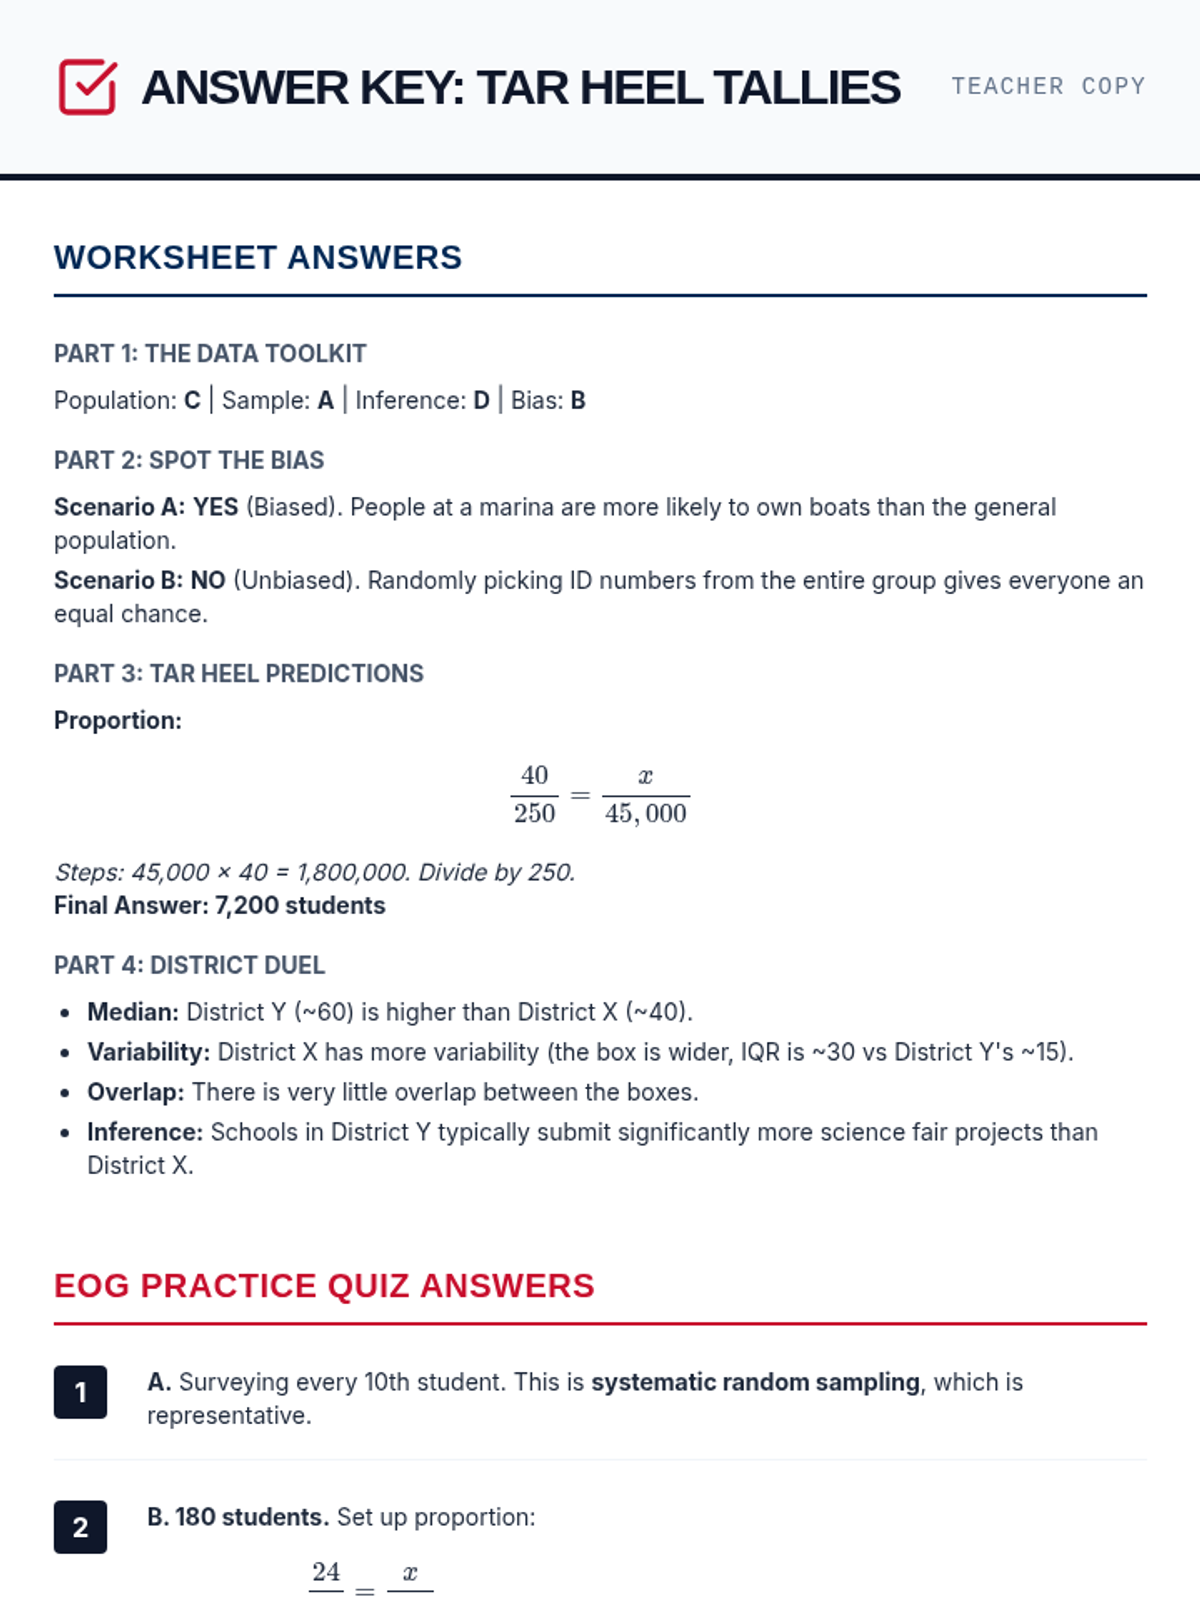
Comprehensive answer key providing solutions for the Tar Heel Tallies Worksheet and detailed explanations for the 8-question Practice Quiz.
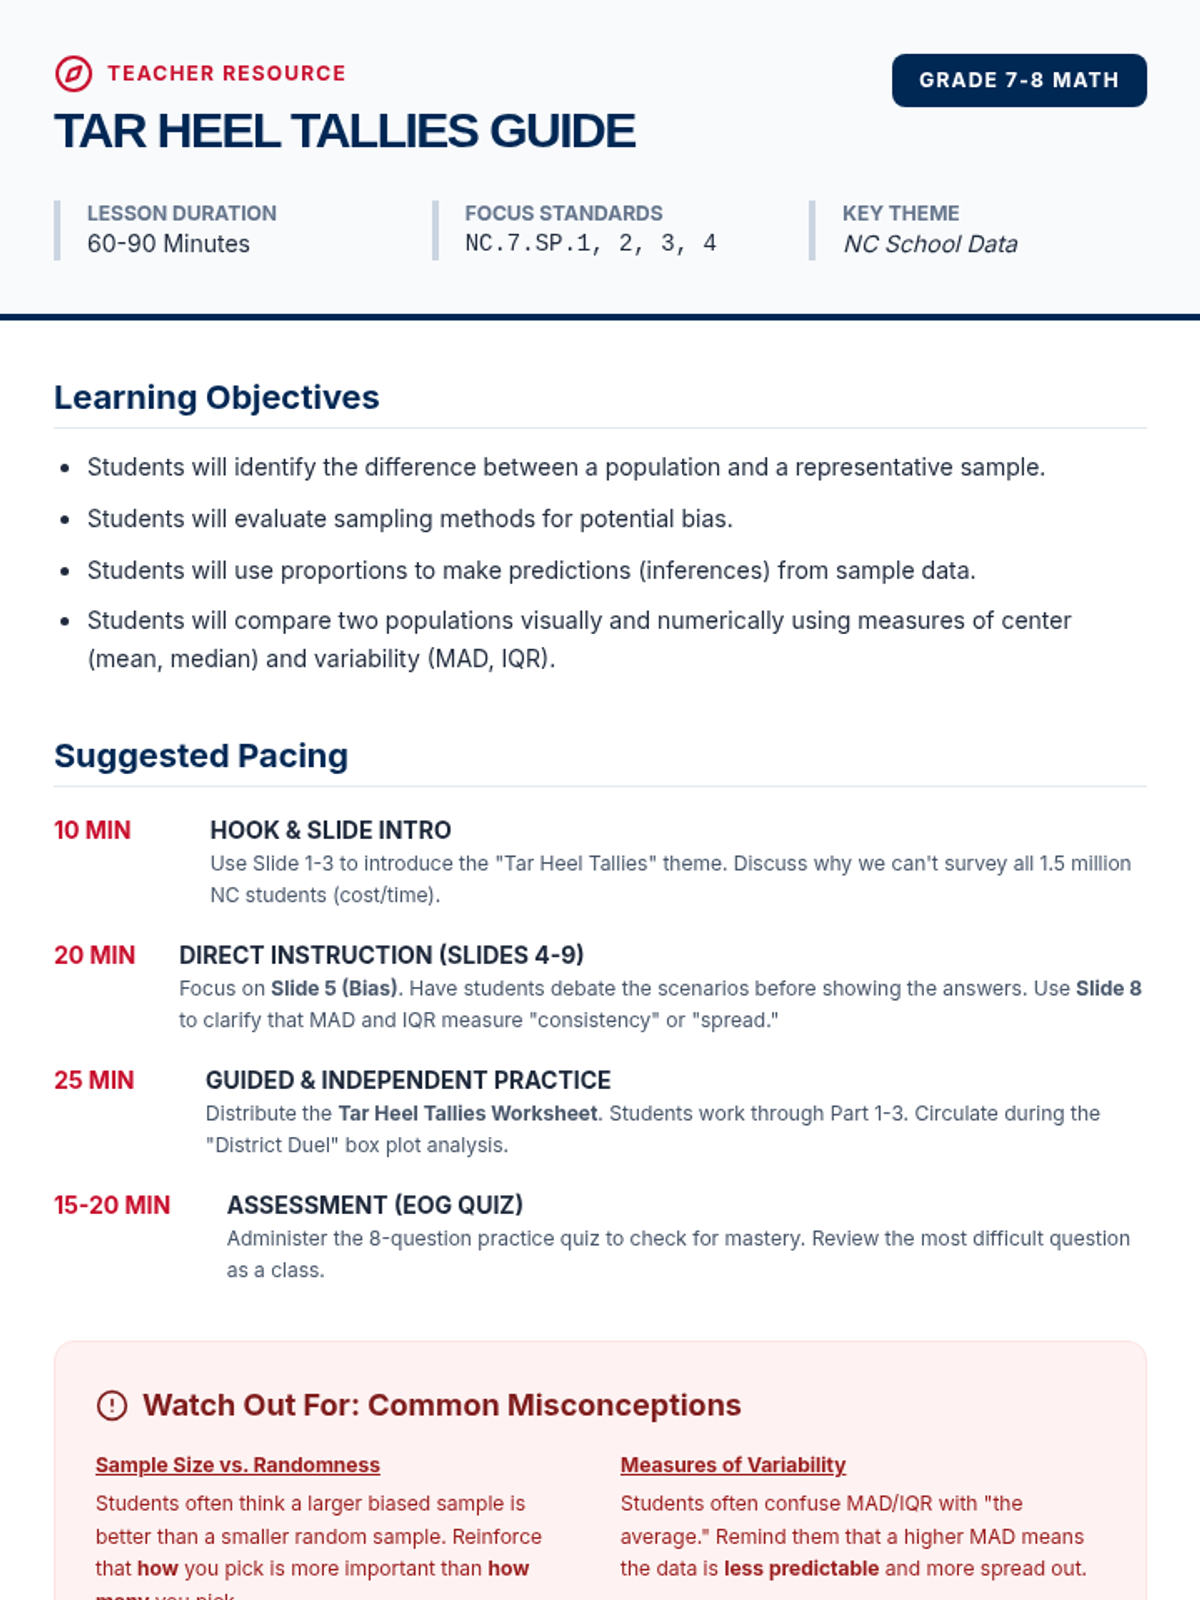
Facilitation guide for teachers including standard alignment, suggested pacing, common misconceptions, and discussion prompts for the Tar Heel Tallies lesson.
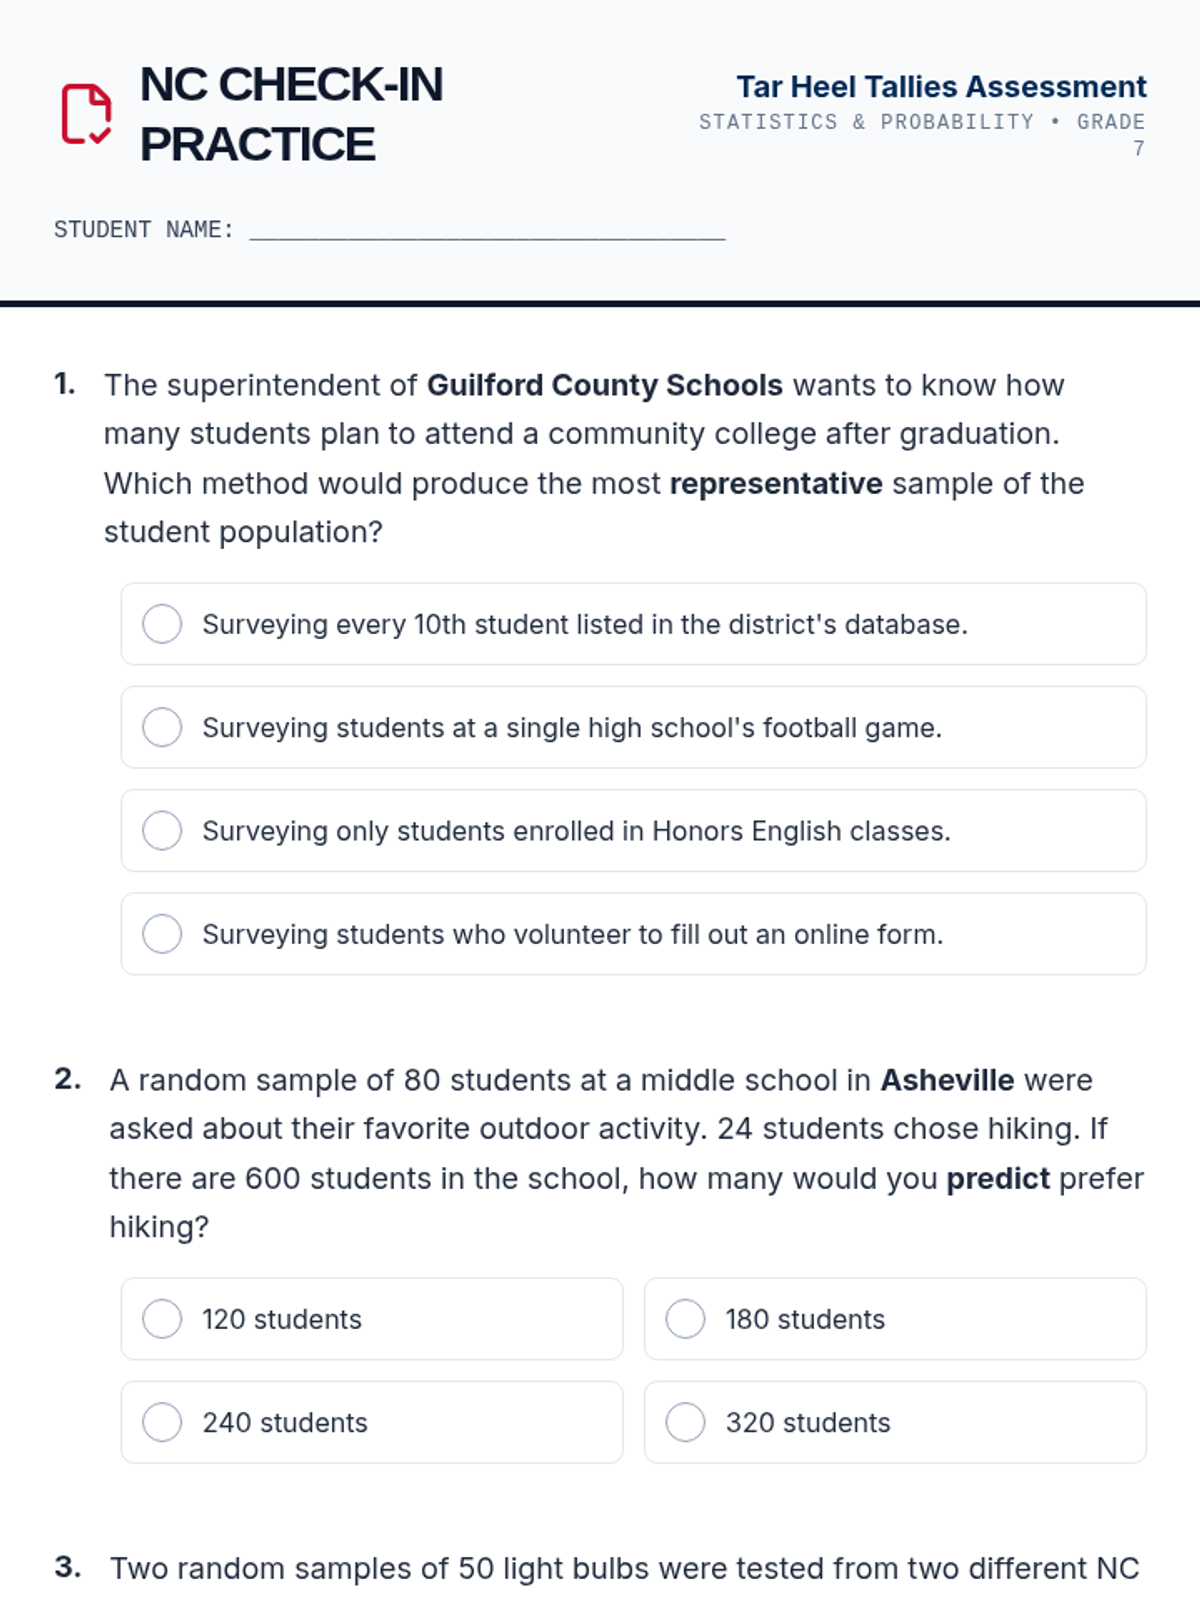
Assessment-style practice document with 8 multiple-choice questions aligned to NC Grade 7-8 math standards on sampling and inferences. Features North Carolina context for each question and consistent answer choice formatting.
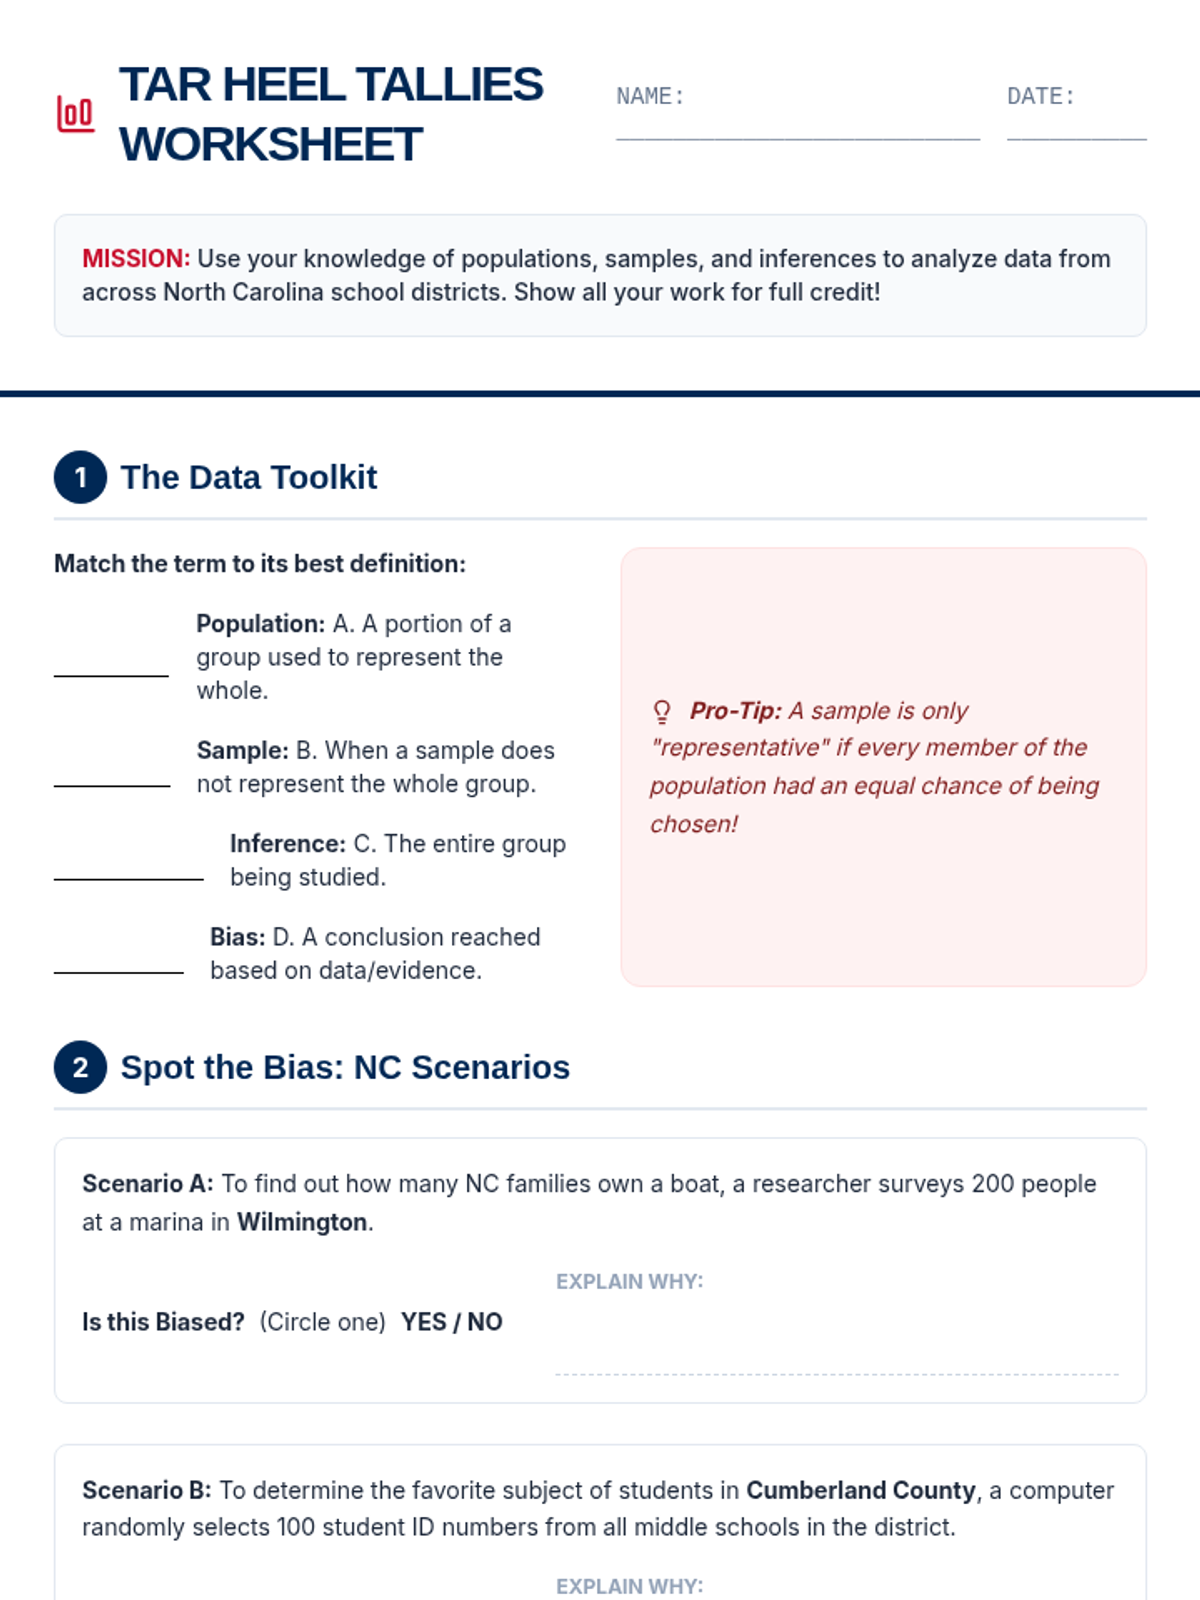
Student activity sheet for practicing sampling identification, inference calculations, and comparative data analysis using North Carolina district-themed scenarios. Includes vocabulary matching, bias detection, and box plot interpretation.
Educational slide deck for Grades 7-8 Mathematics covering sampling methods and making inferences, using a North Carolina school district theme. Features visual representations of population vs. sample, types of random sampling, bias identification, and data comparison using box plots.
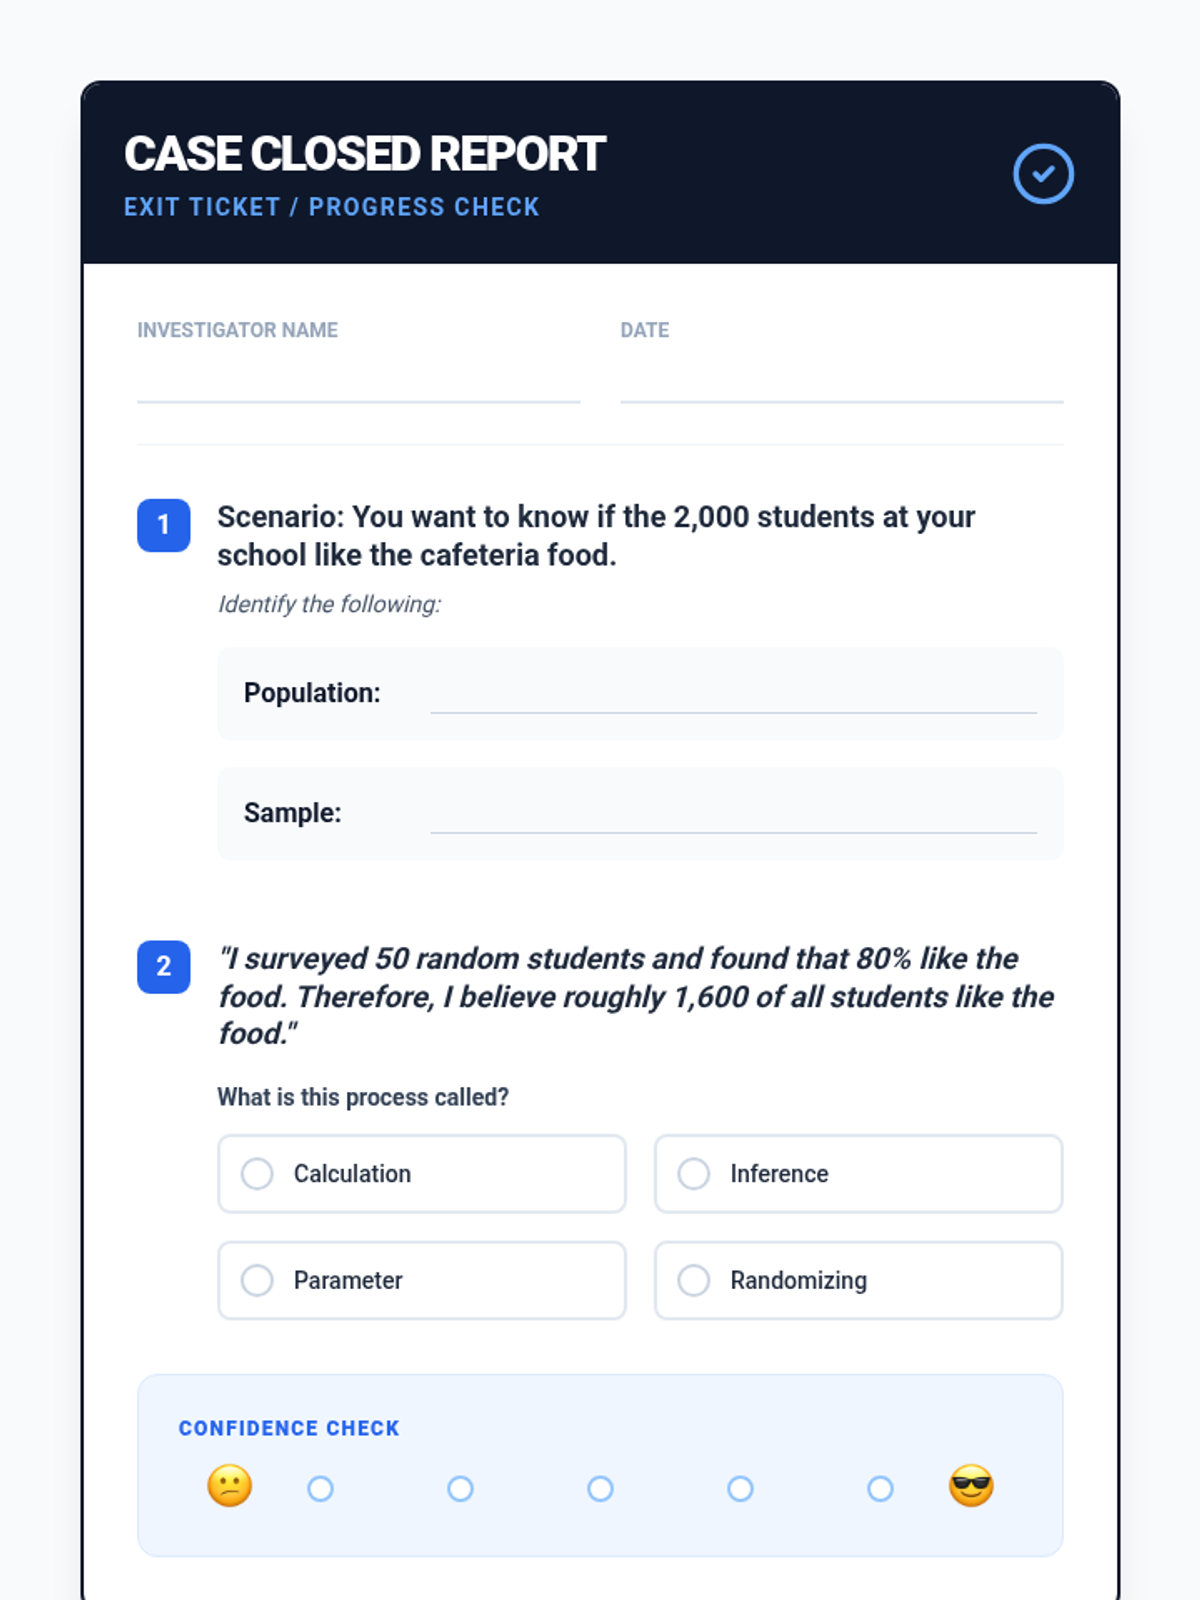
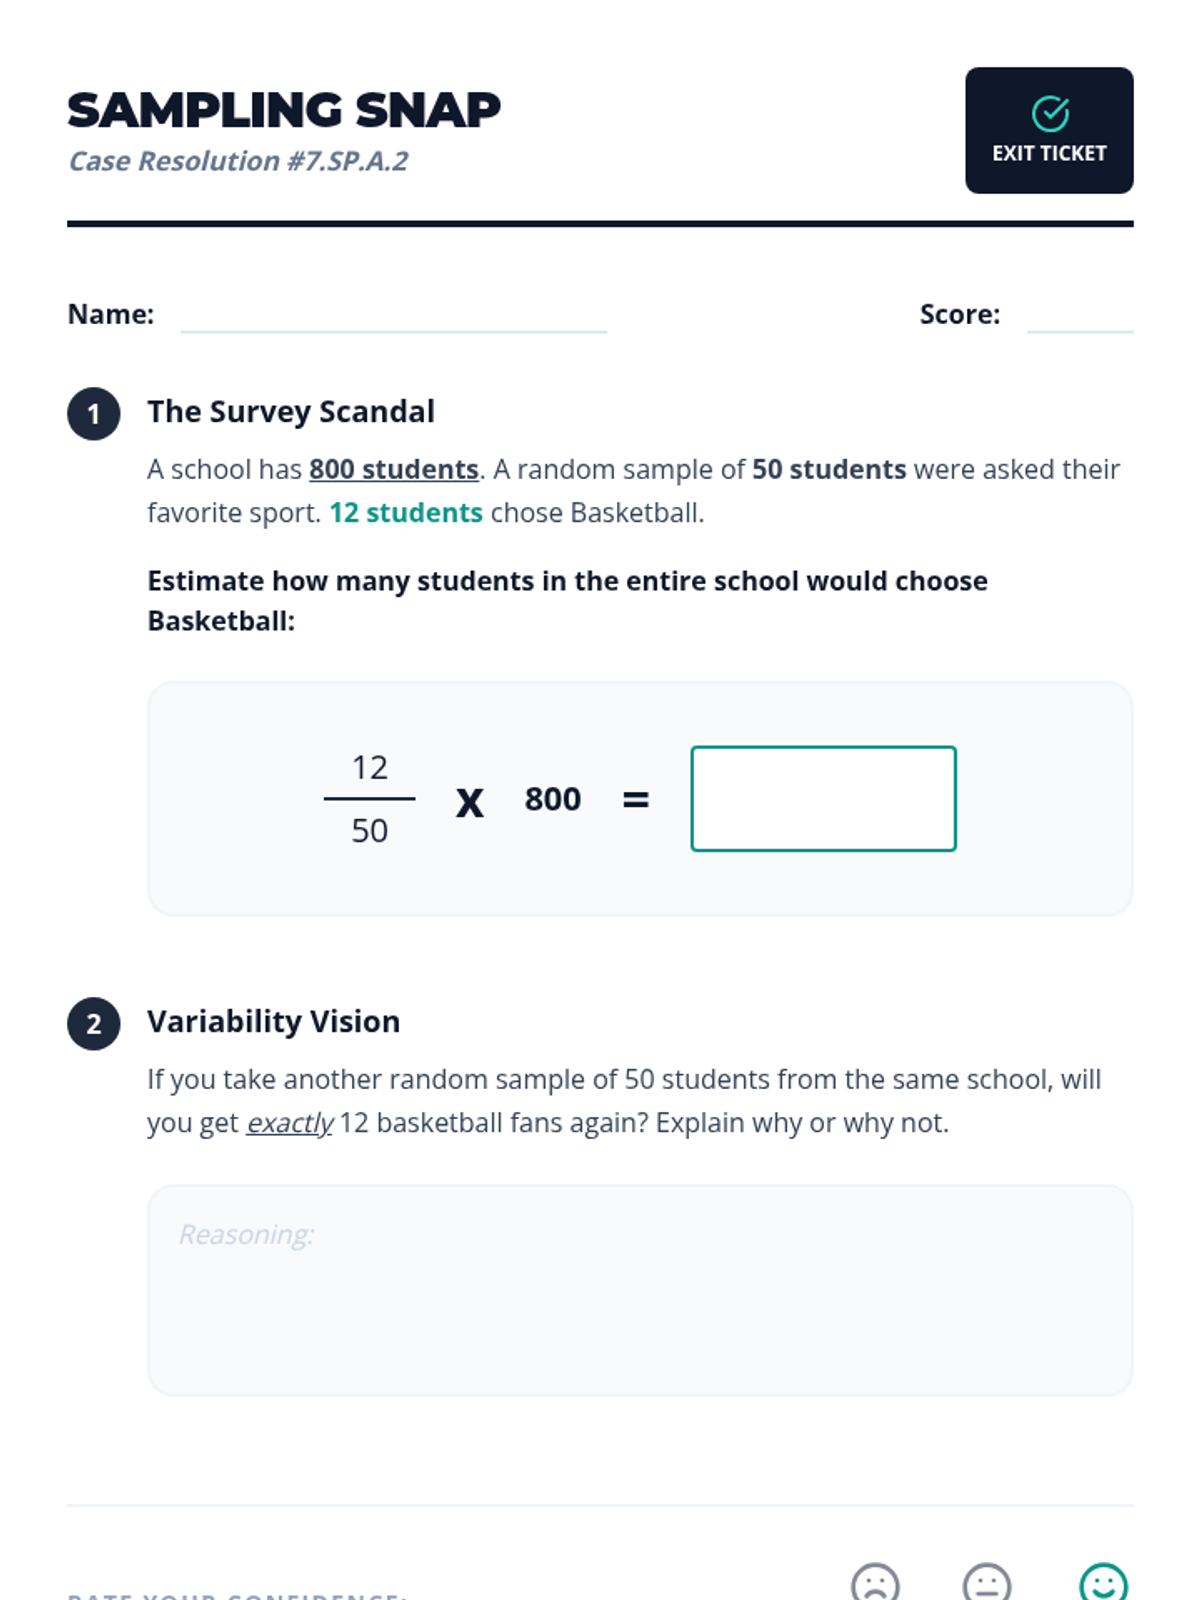
A quick progress monitoring tool to assess student understanding of identifying populations versus samples and the definition of statistical inference.
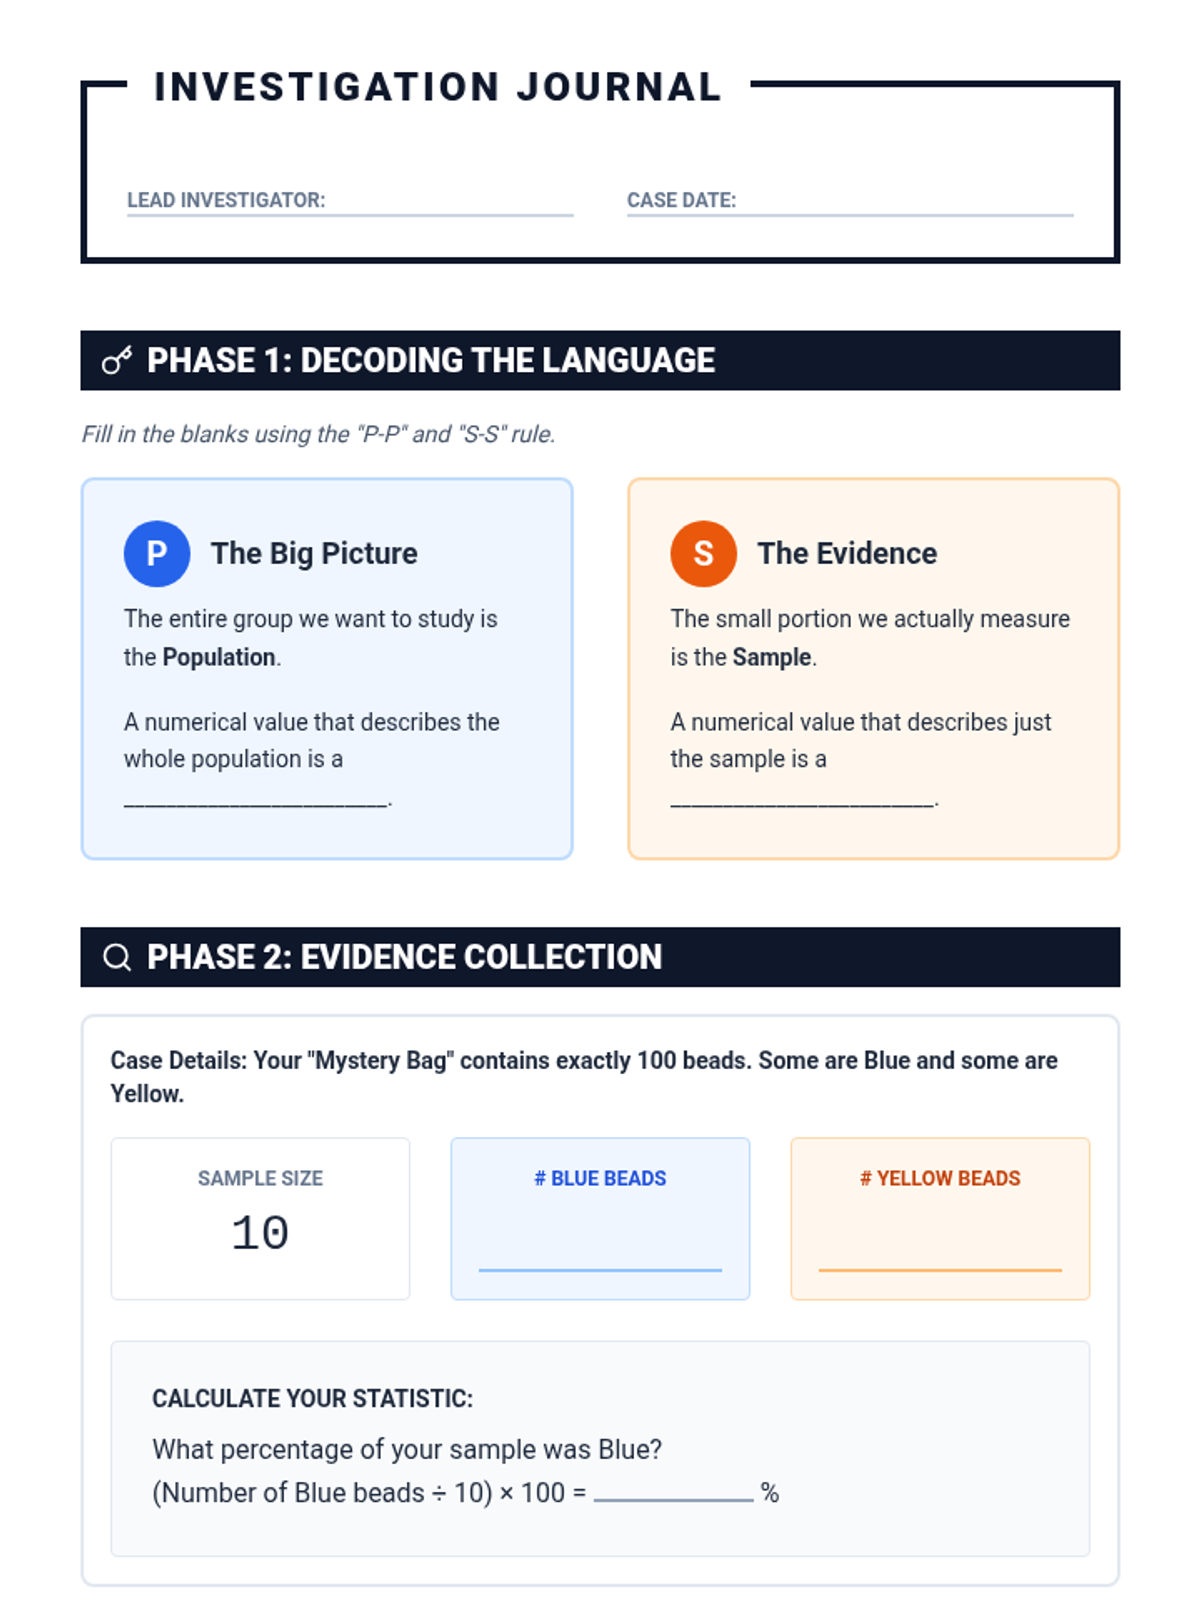
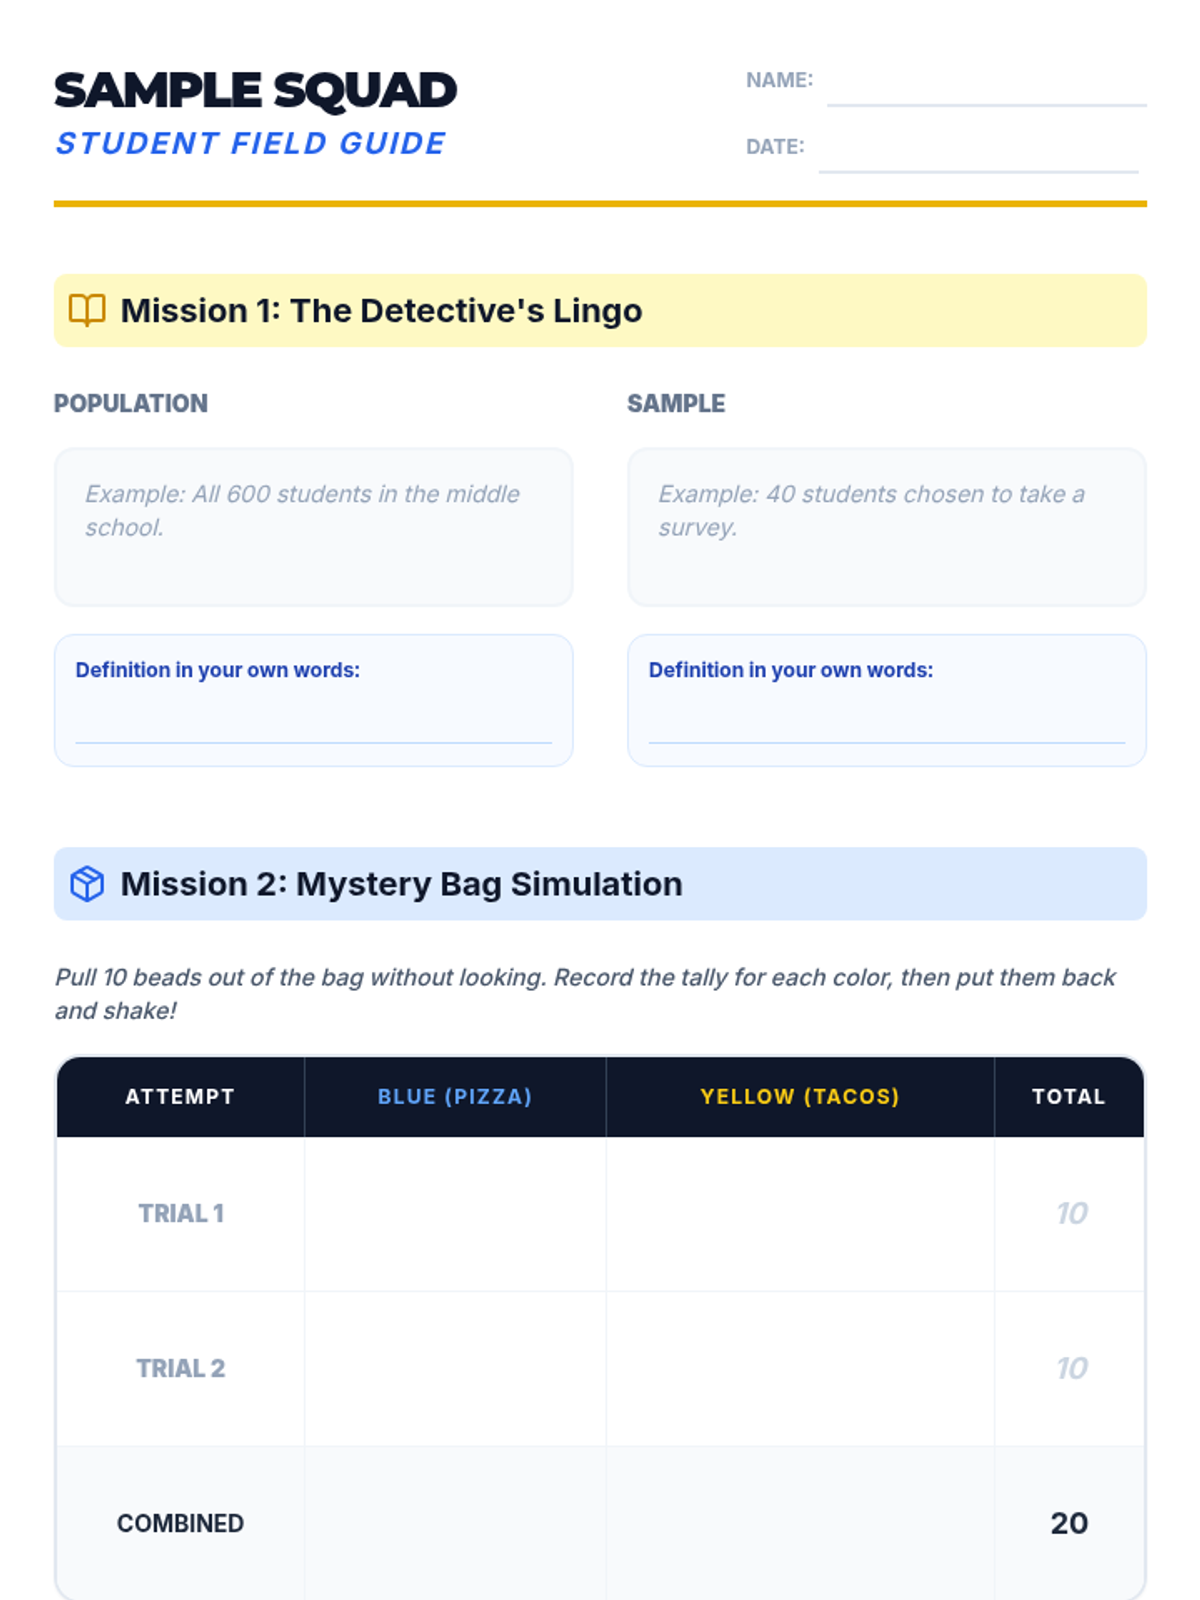
A scaffolded investigation journal for students to record data from a hands-on sampling activity and practice making inferences about a population from a sample statistic.
Visual presentation slides for teaching the concept of population parameters versus sample statistics using an investigative theme. Includes the "Pot of Soup" analogy and "P-P/S-S" mnemonics.
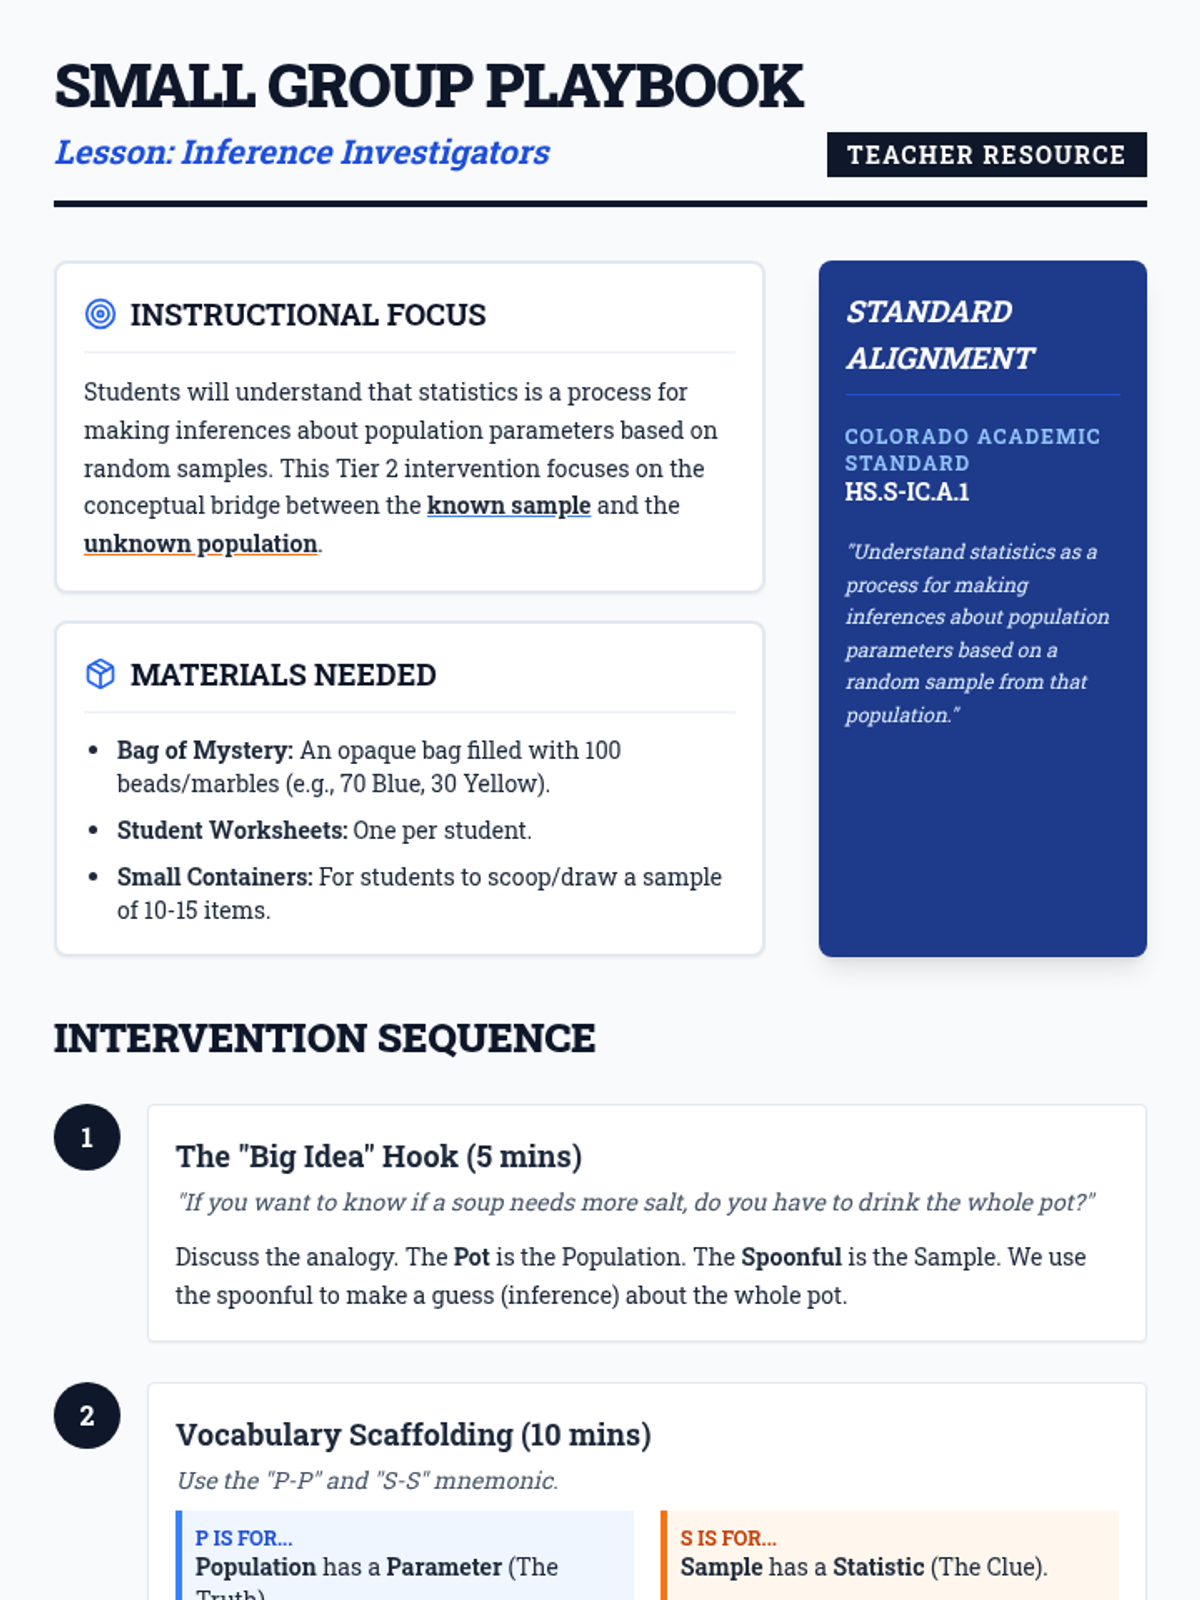
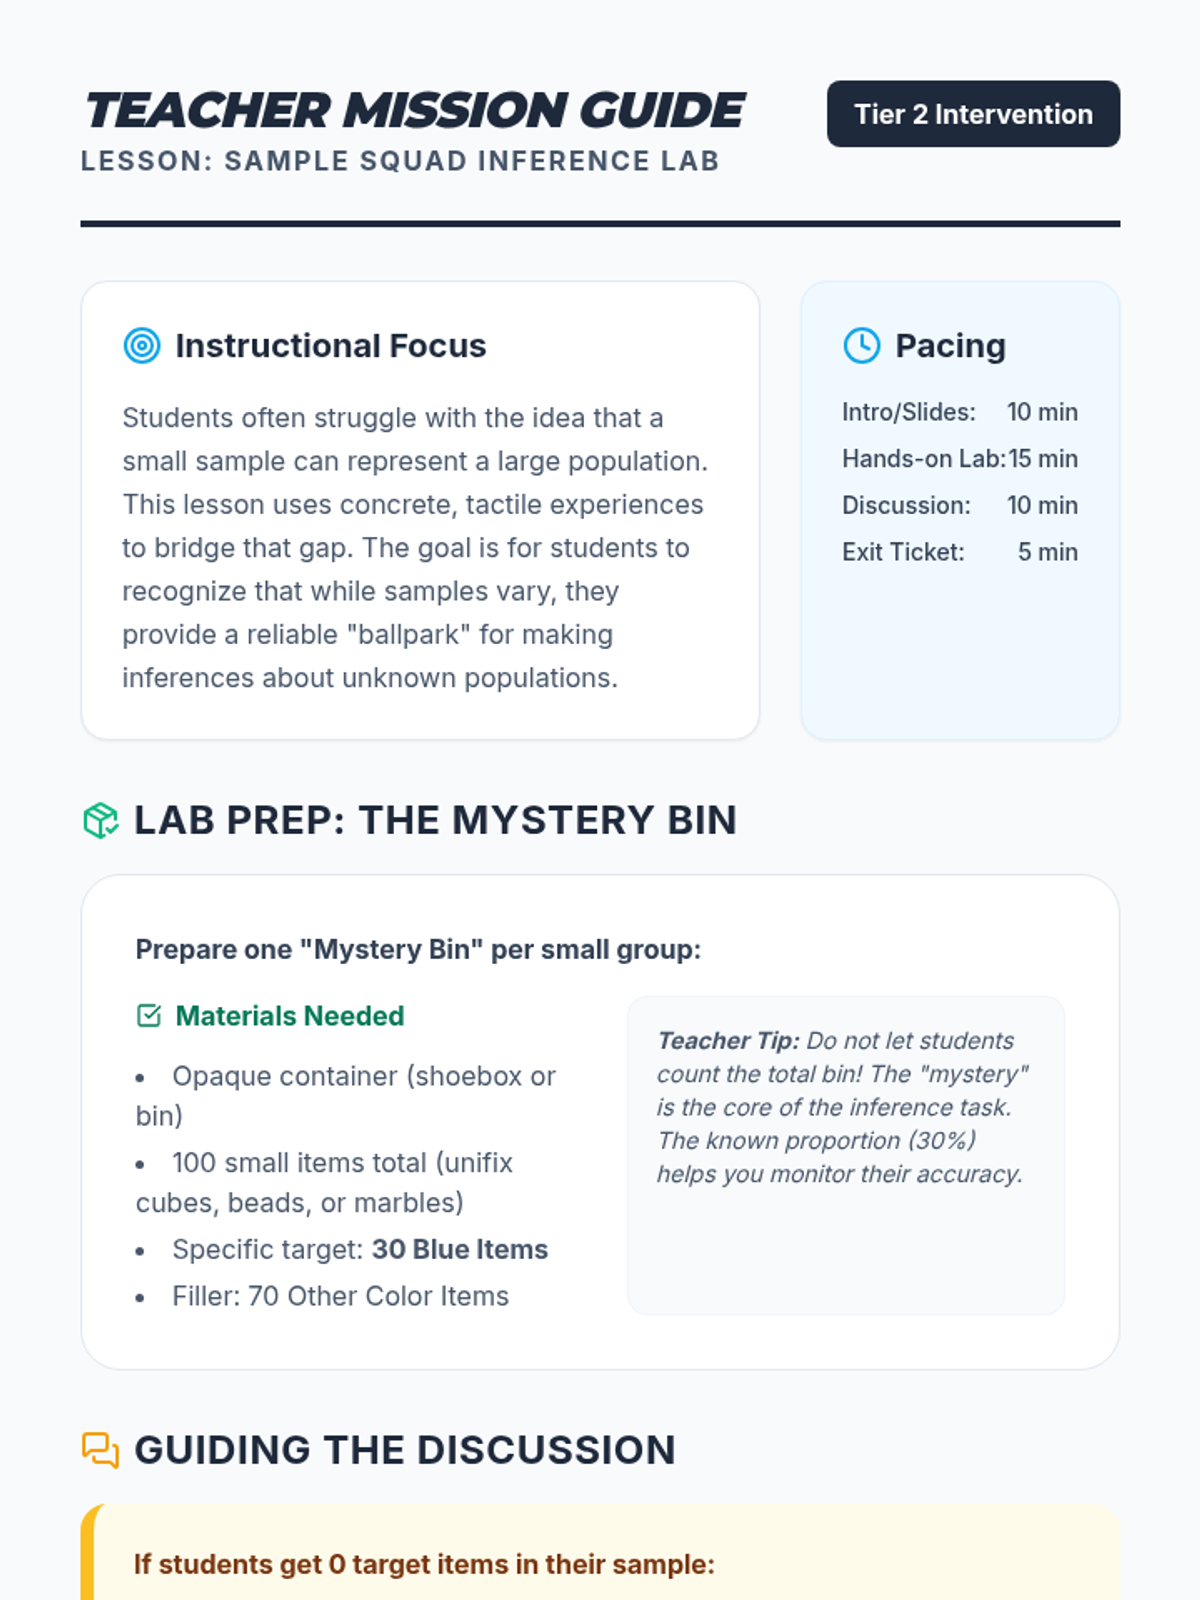
A teacher guide for a Tier 2 intervention lesson on statistical inference, featuring a "Pot of Soup" analogy, mnemonic devices for vocabulary, and a hands-on mystery bag activity.
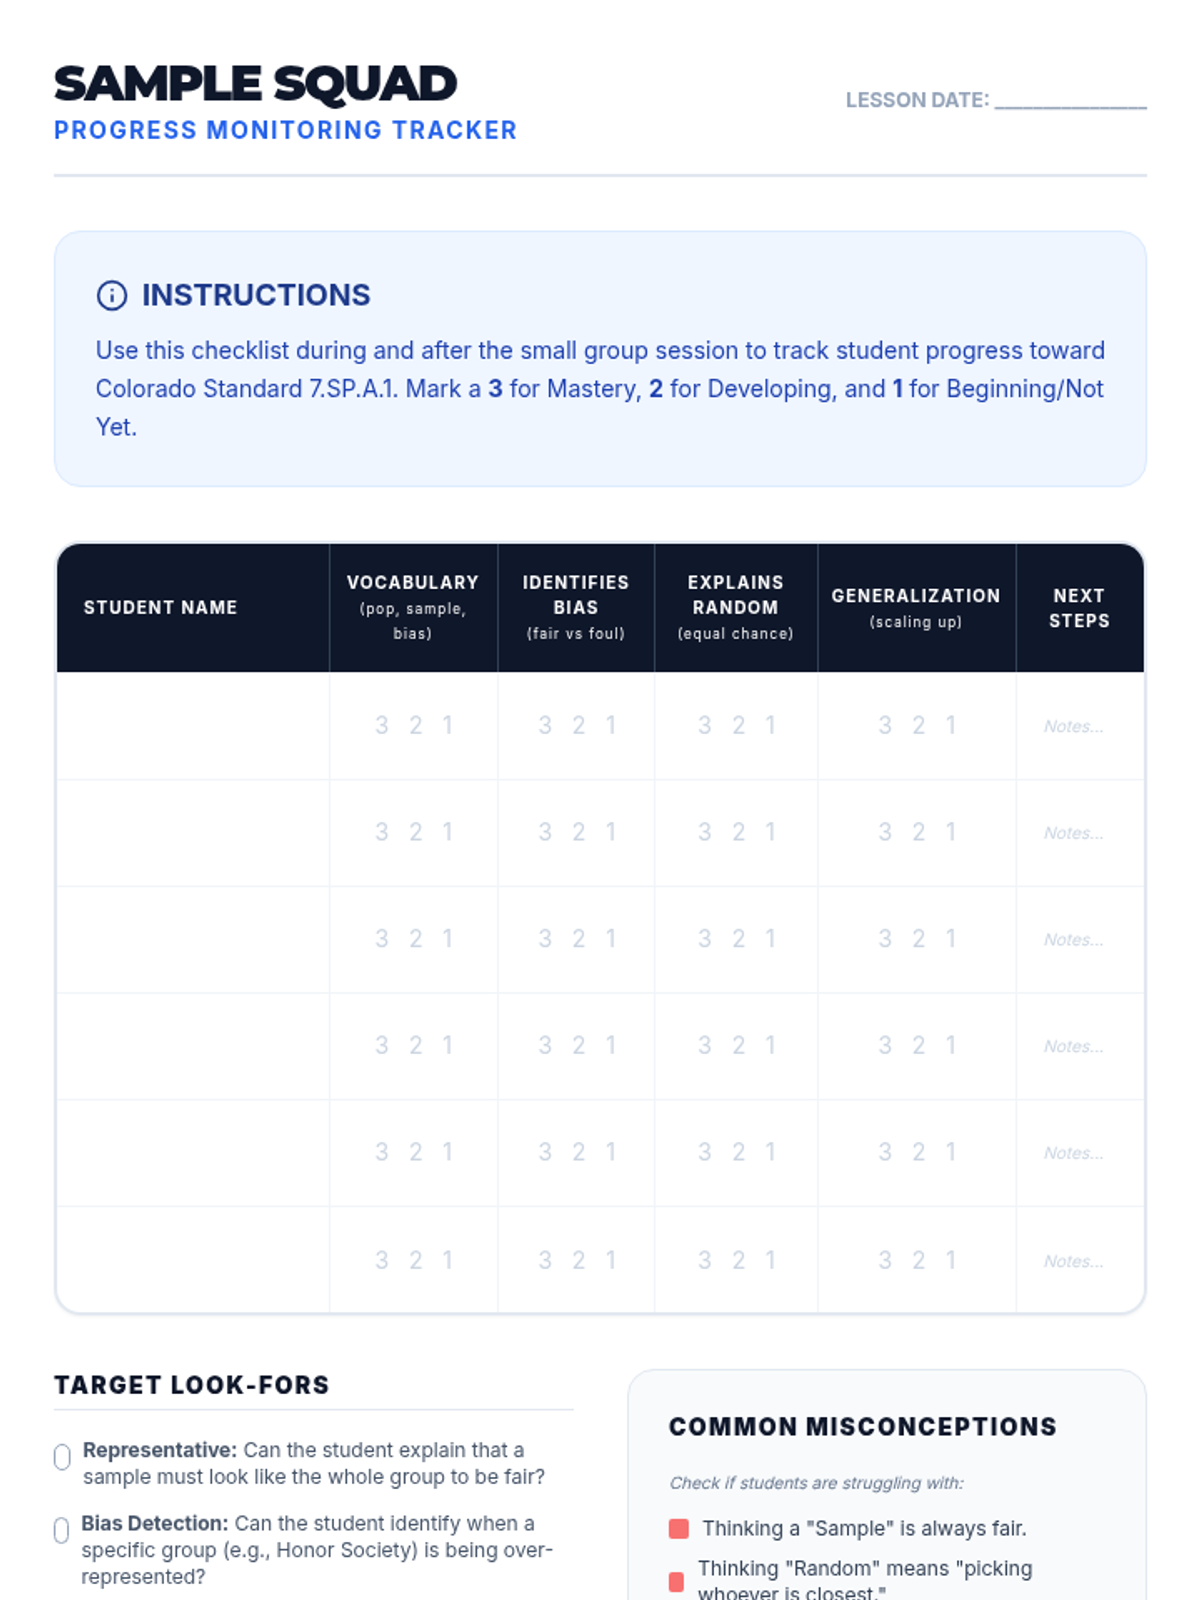
A progress monitoring checklist for teachers to track individual student mastery of sampling vocabulary and concepts during the intervention.
Student activity guide for the Tier 2 intervention, including a vocabulary check, simulation data recording table, bias detection scenarios, and a prediction challenge.
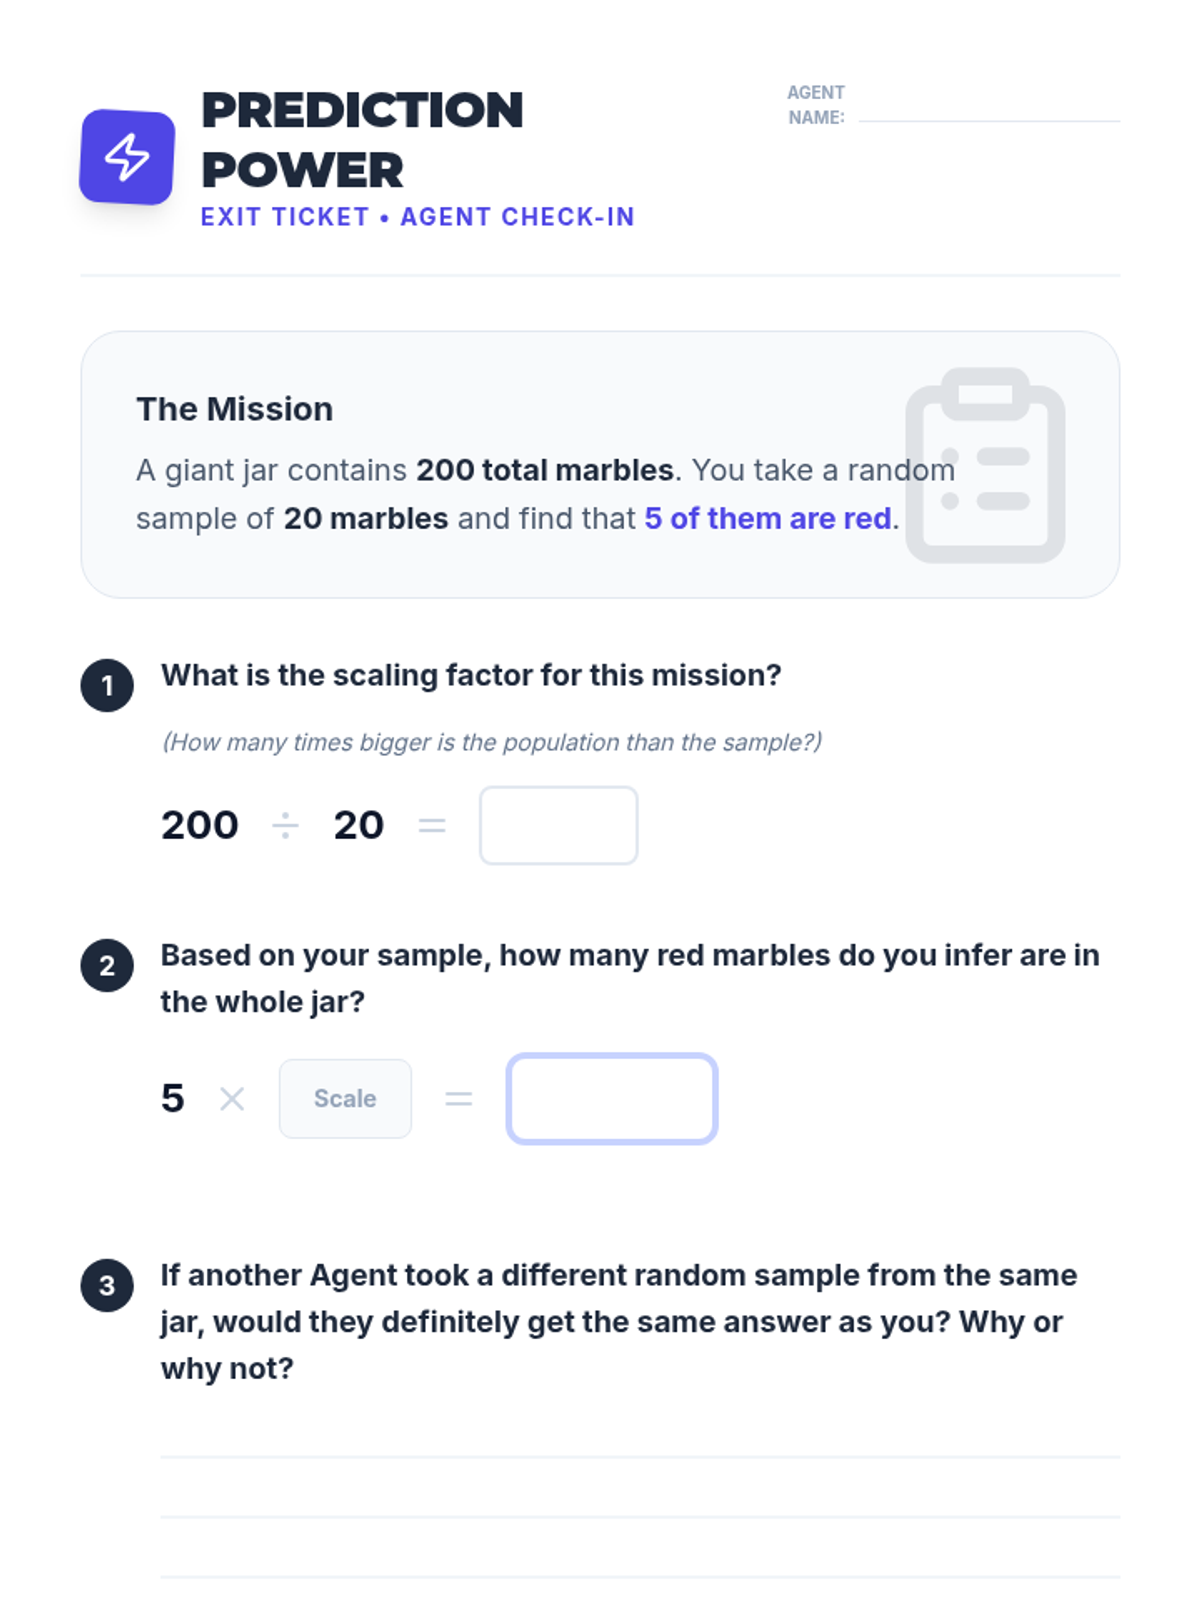
A short progress monitoring task for students to apply their inference skills to a new scenario involving scaling factors and sample variation.
A quick assessment tool for students to demonstrate their ability to scale a sample proportion to a larger population and explain the concept of sampling variability. Includes a calculation area and a reasoning prompt.
Prep instructions, small group facilitation tips, and an answer key/example for the Sample Squad Inference Lab.
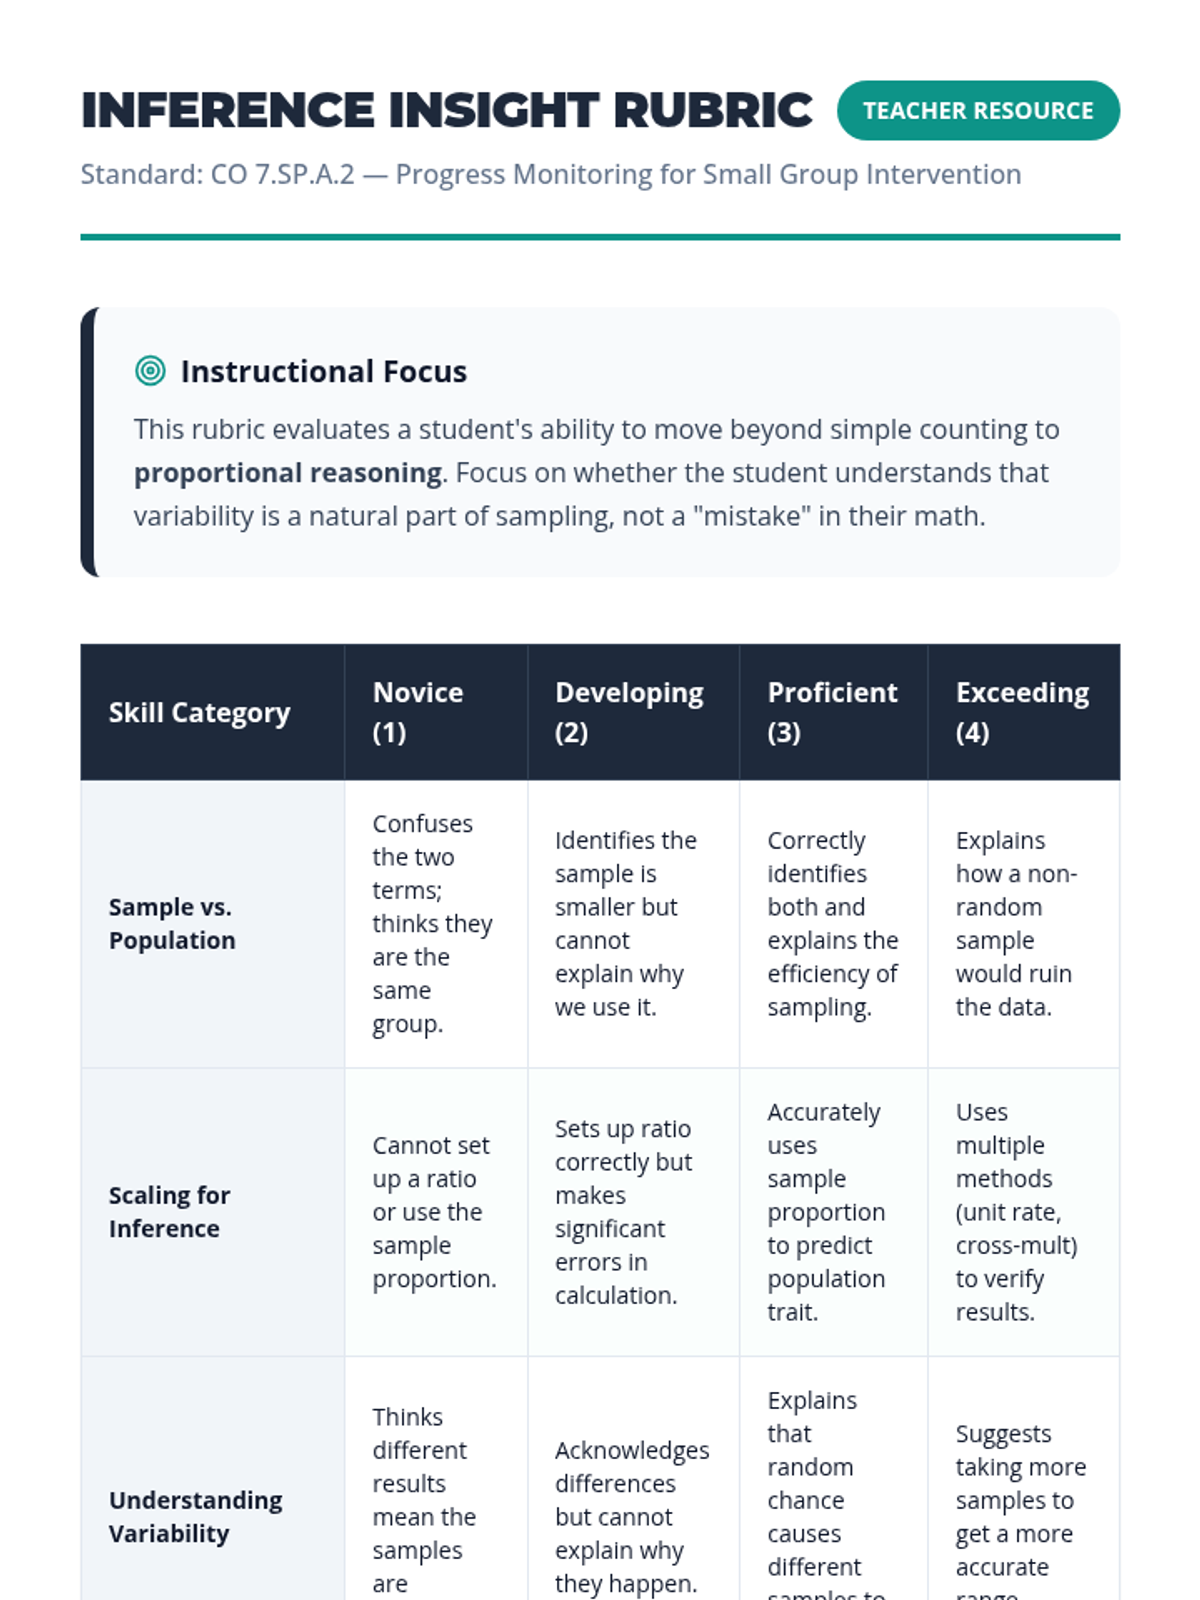
A teacher-facing reasoning rubric and progress monitoring tool for tracking student mastery of random sampling. It includes a 4-point developmental scale for terminology, proportional scaling, and variability, along with an observation log for small group notes.
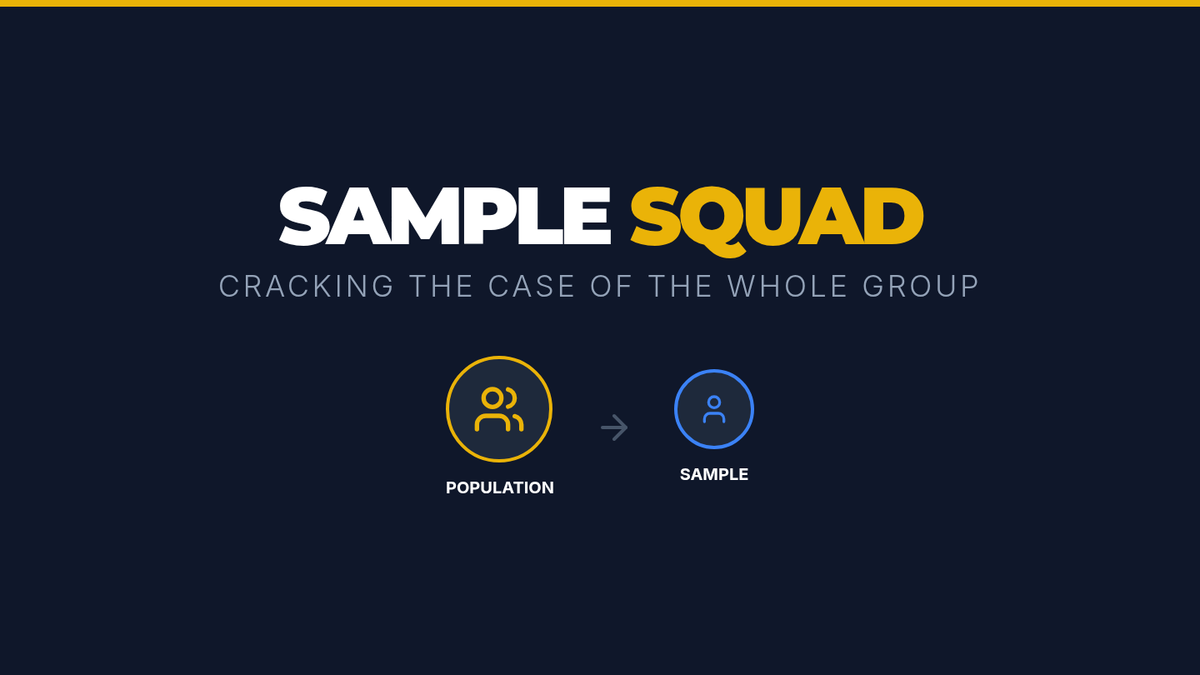
Visual presentation for a Tier 2 intervention lesson on sampling, featuring the soup analogy, term definitions, and interactive scenario challenges.
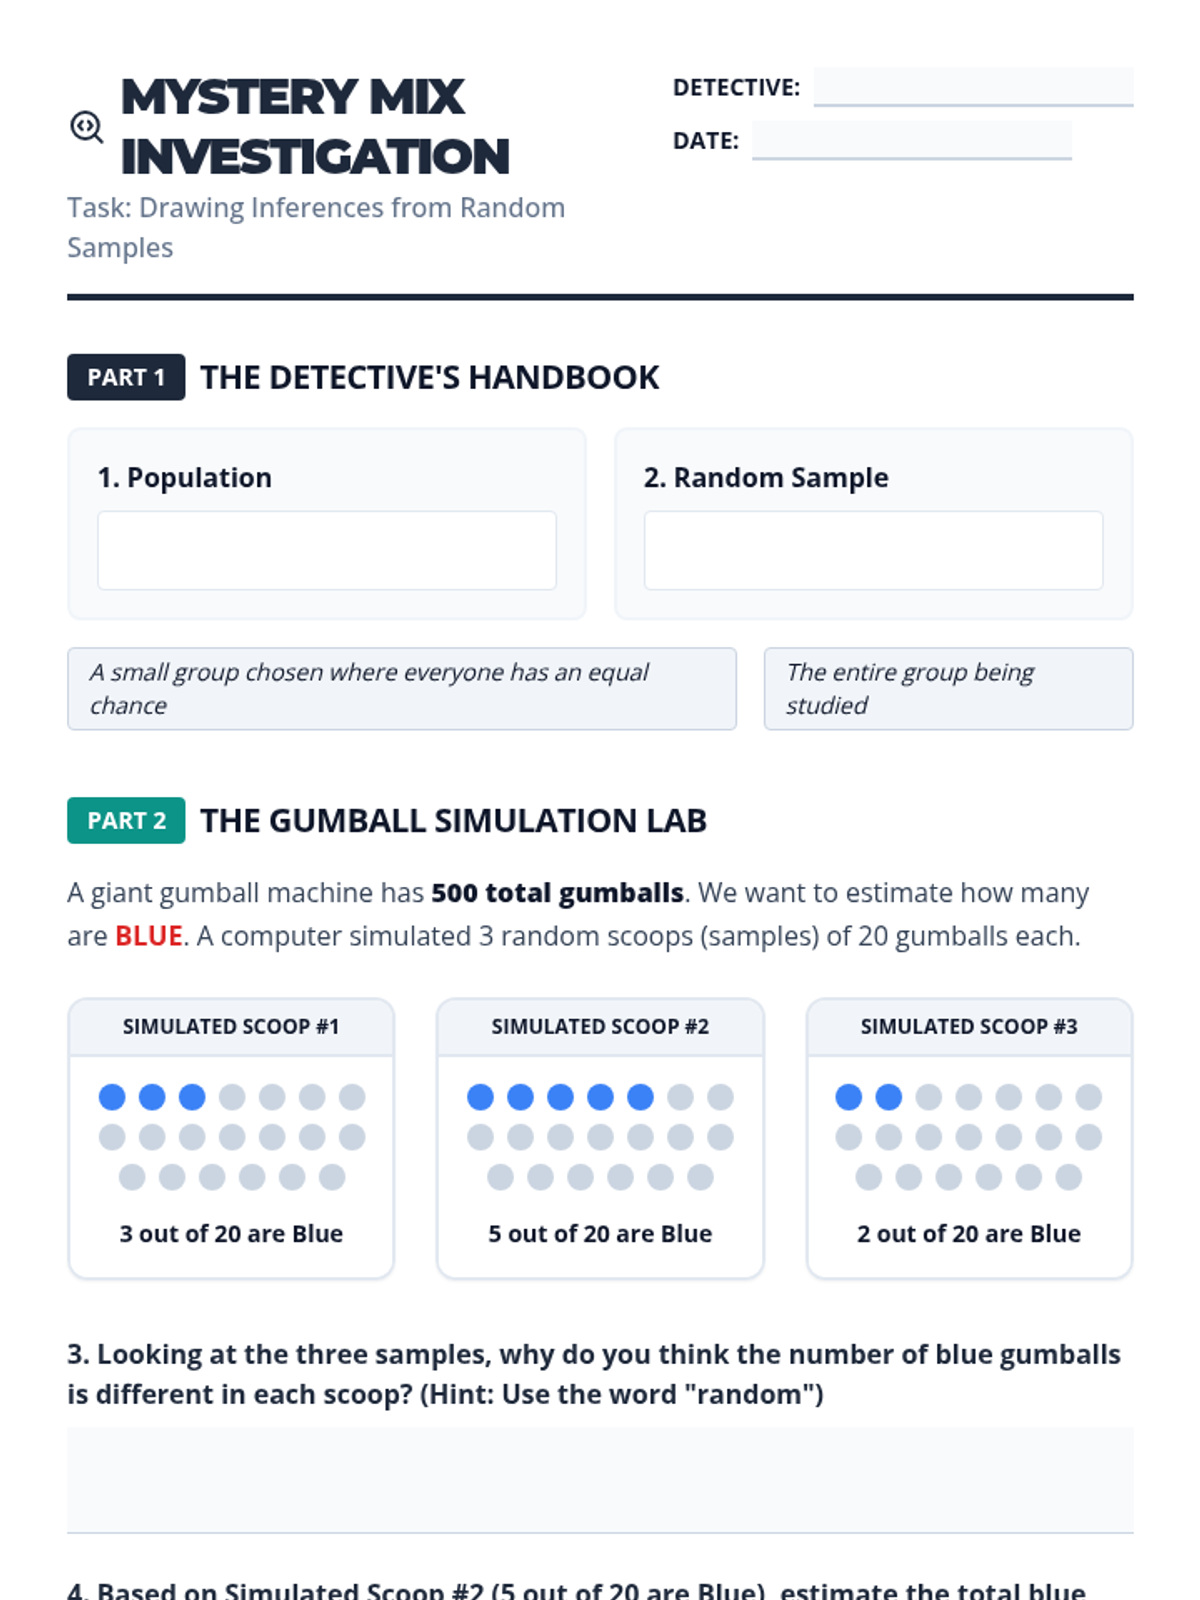
A scaffolded student worksheet for practicing inferences from random samples. It uses a "Gumball Simulation" context with visual data cards, guided proportional reasoning steps, and a data table for comparing different sample estimates to understand variability.
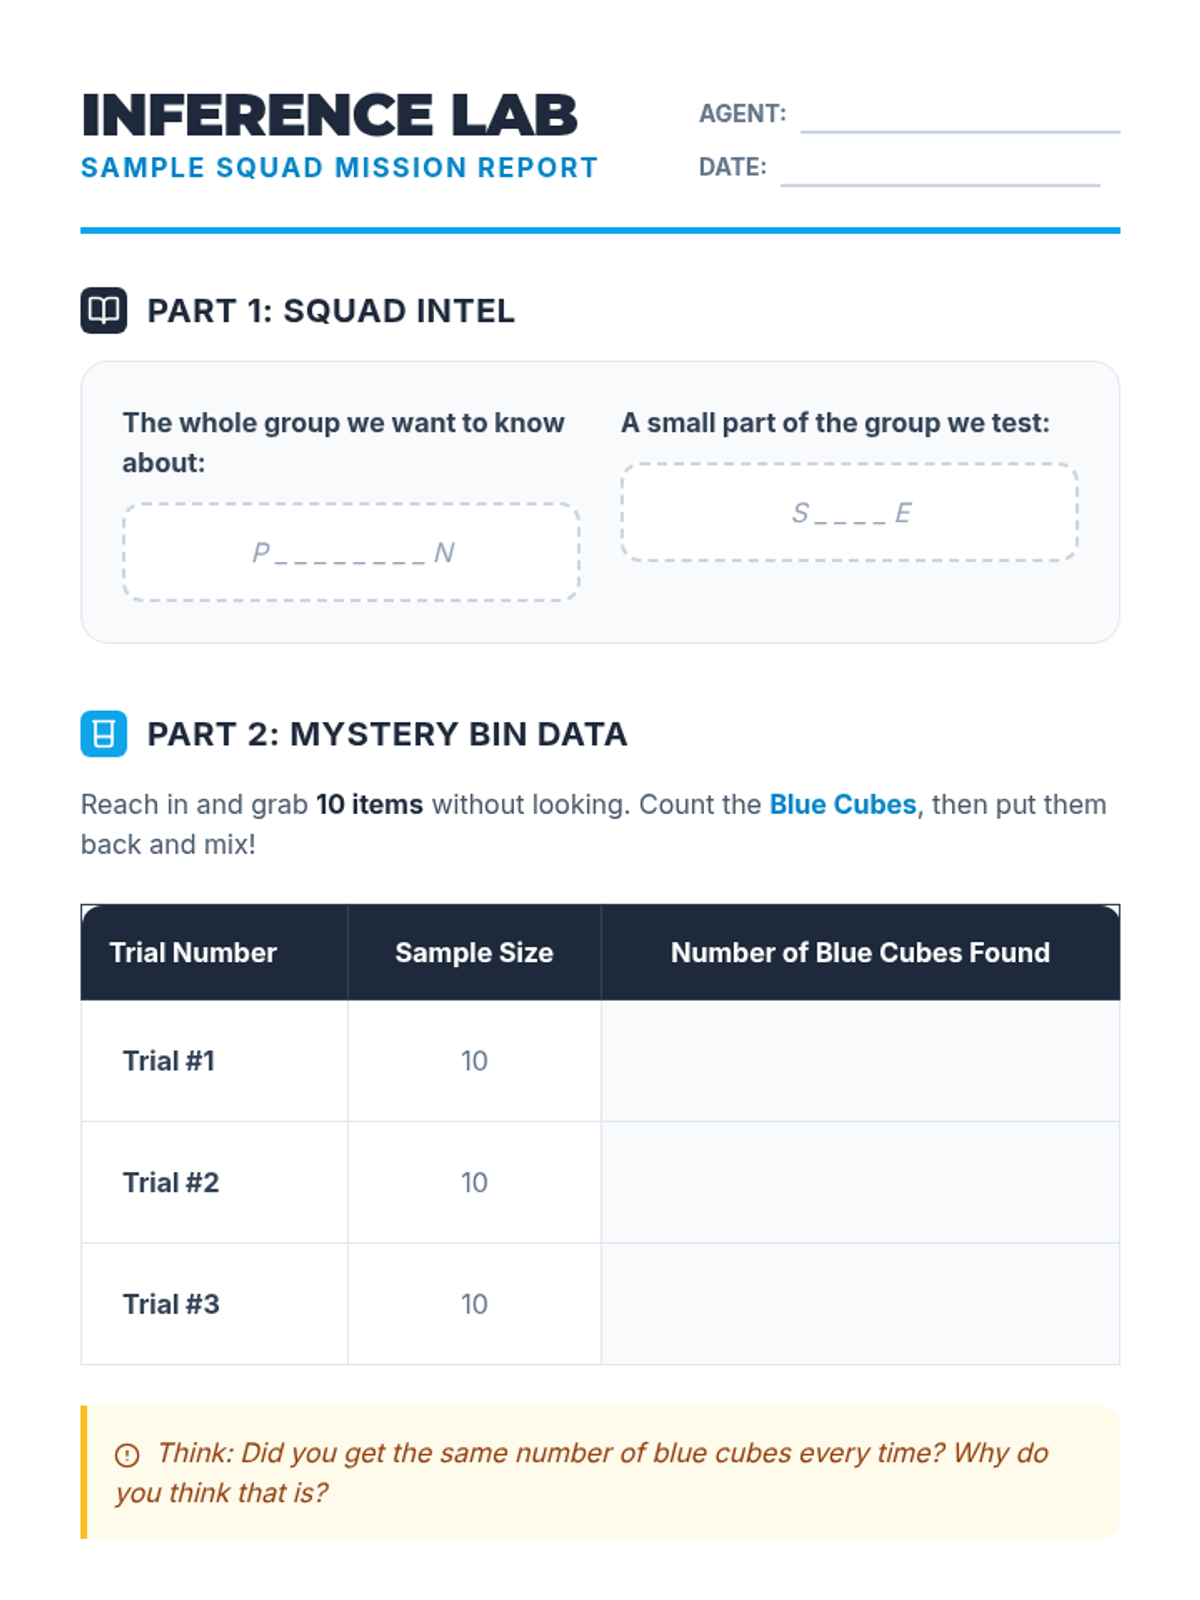
A scaffolded lab worksheet for students to record random sample data from a mystery bin and use scaling factors to make inferences about a population.
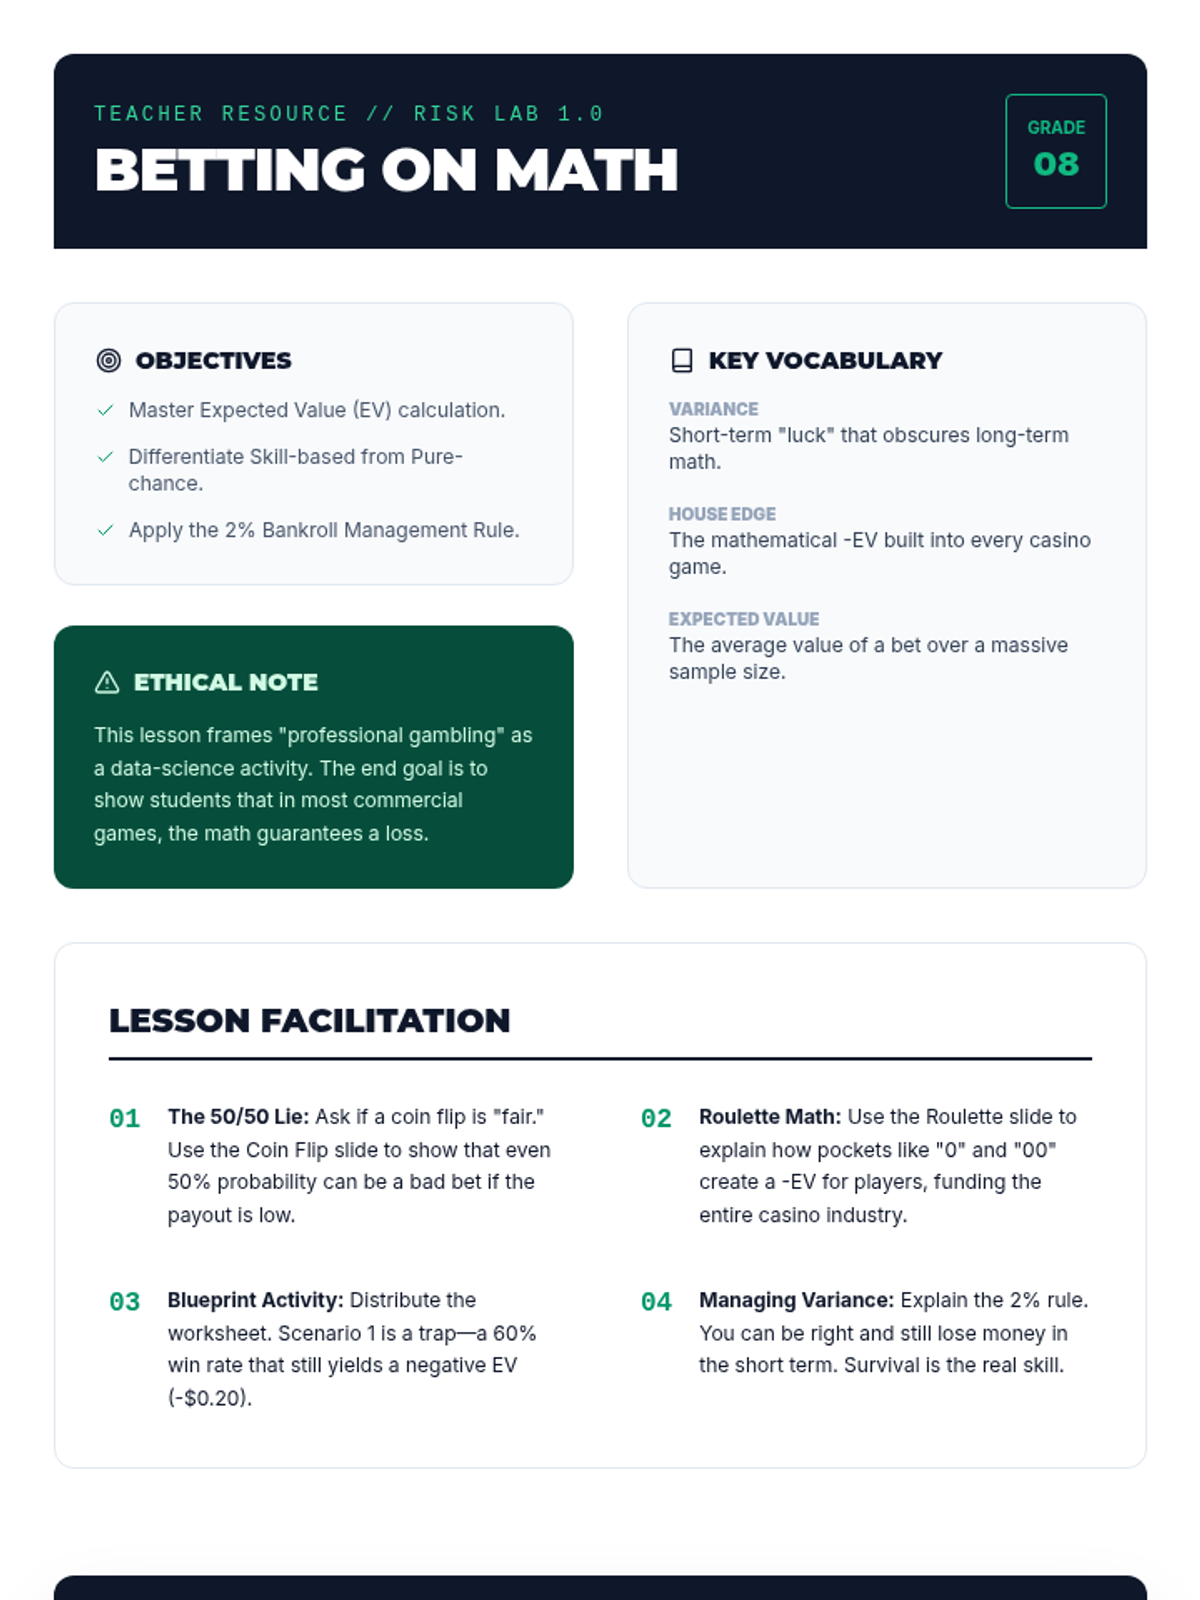
A comprehensive teacher's guide for the Risk Lab lesson, including learning objectives, instructional strategies, and a complete answer key.
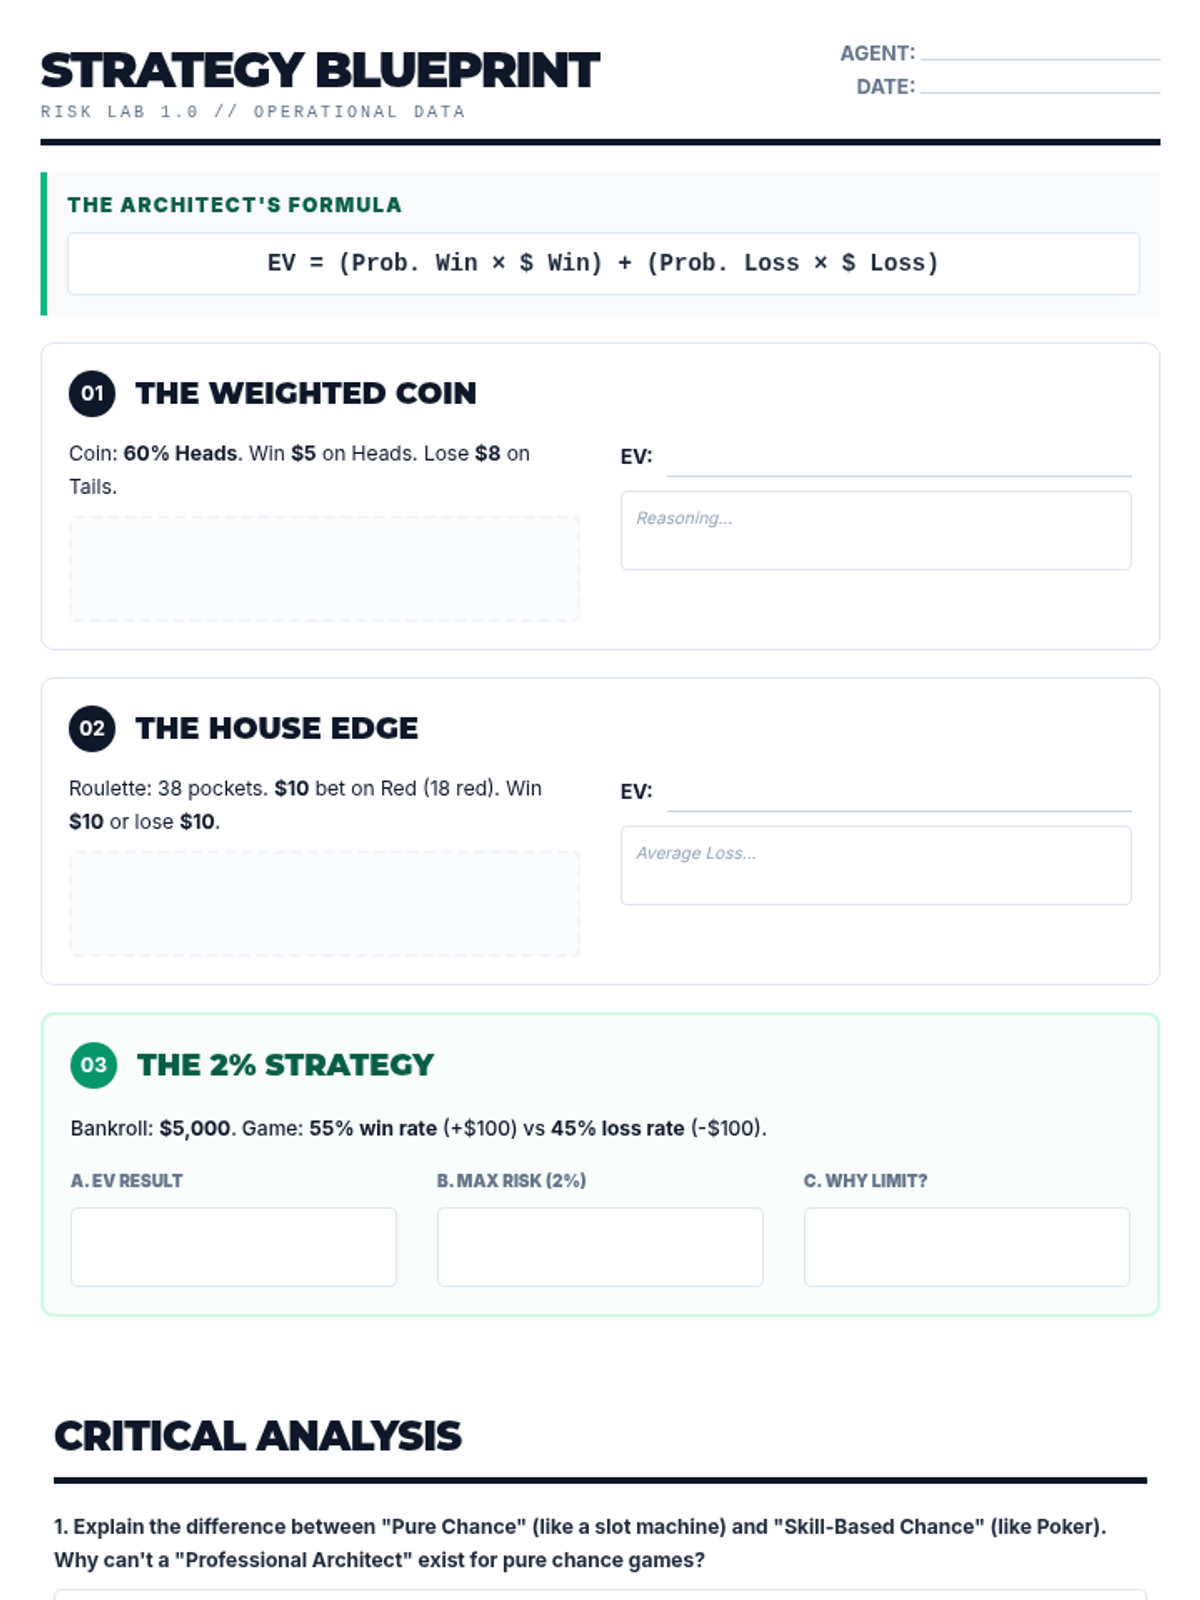
A two-page math worksheet where students calculate expected value and apply risk management strategies to various game scenarios.
A sleek, 16:9 presentation exploring the mathematics of risk, expected value, and the difference between luck and strategy in games of chance.
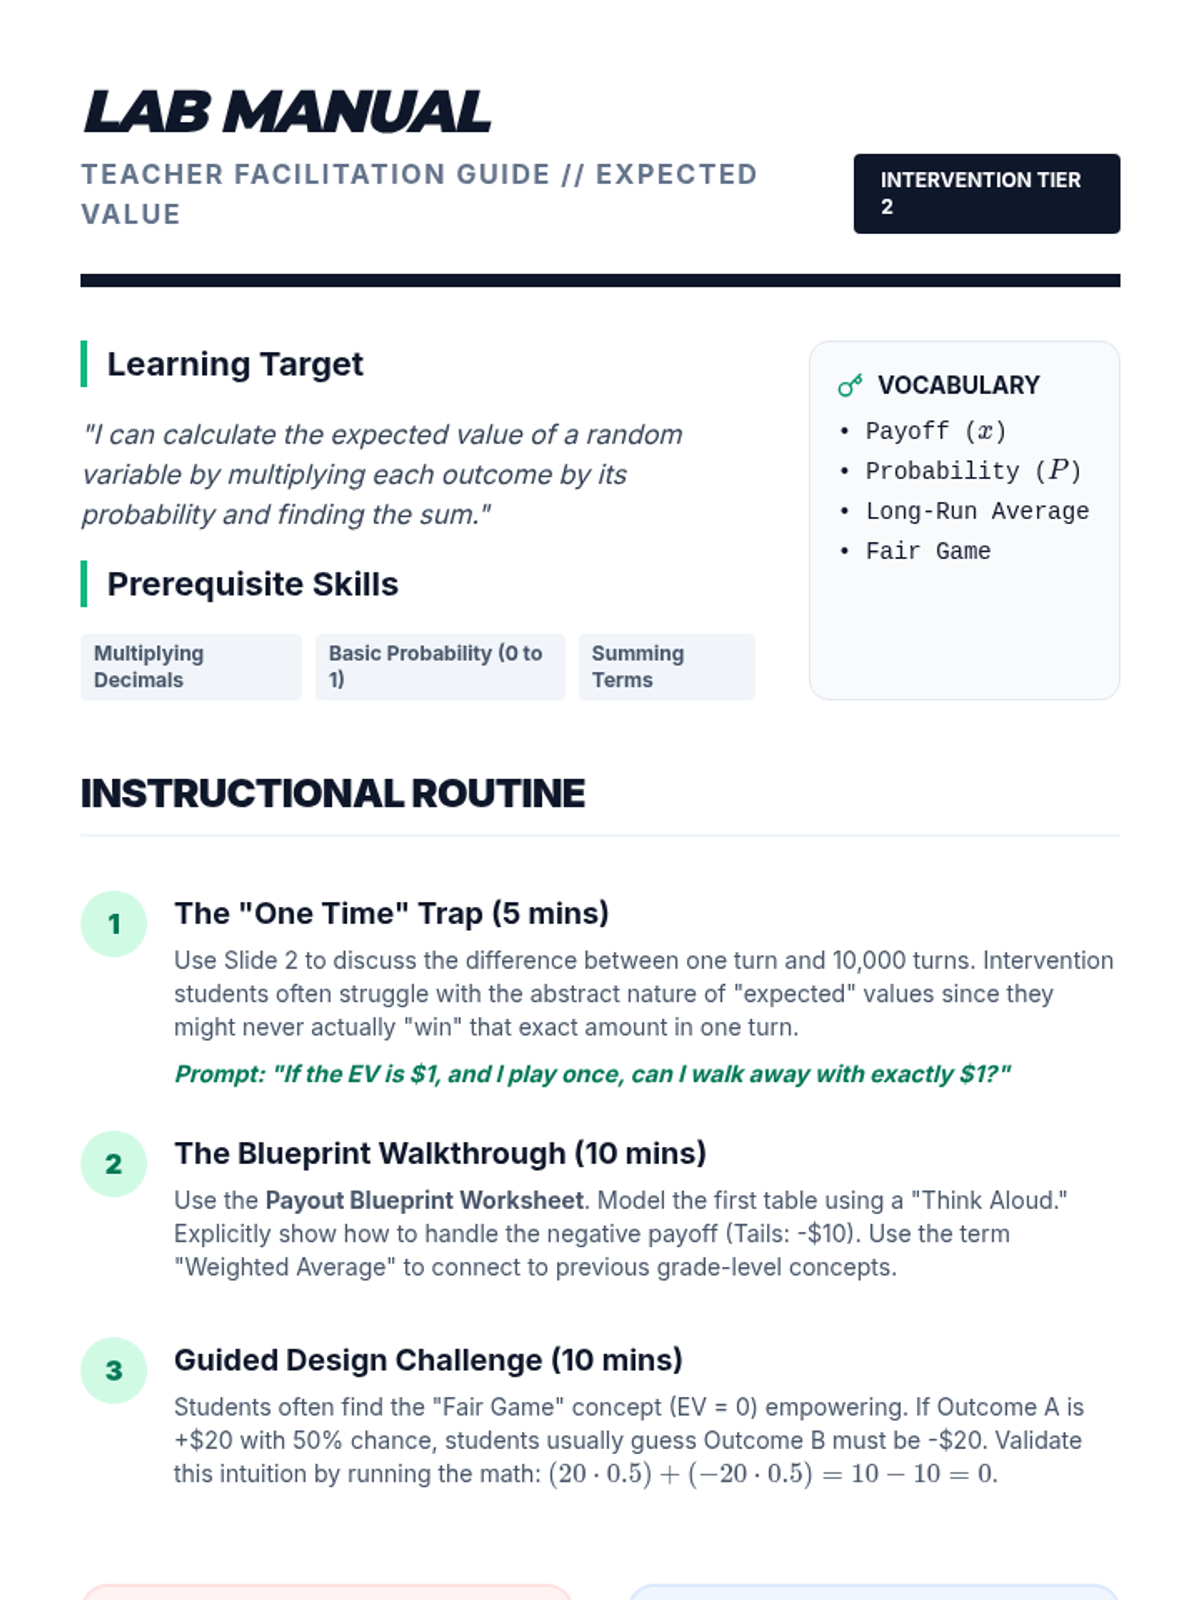
A comprehensive teacher guide for facilitating a Tier 2 intervention lesson on expected value. It includes a scripted instructional routine, common misconceptions, and differentiation strategies to support struggling learners.
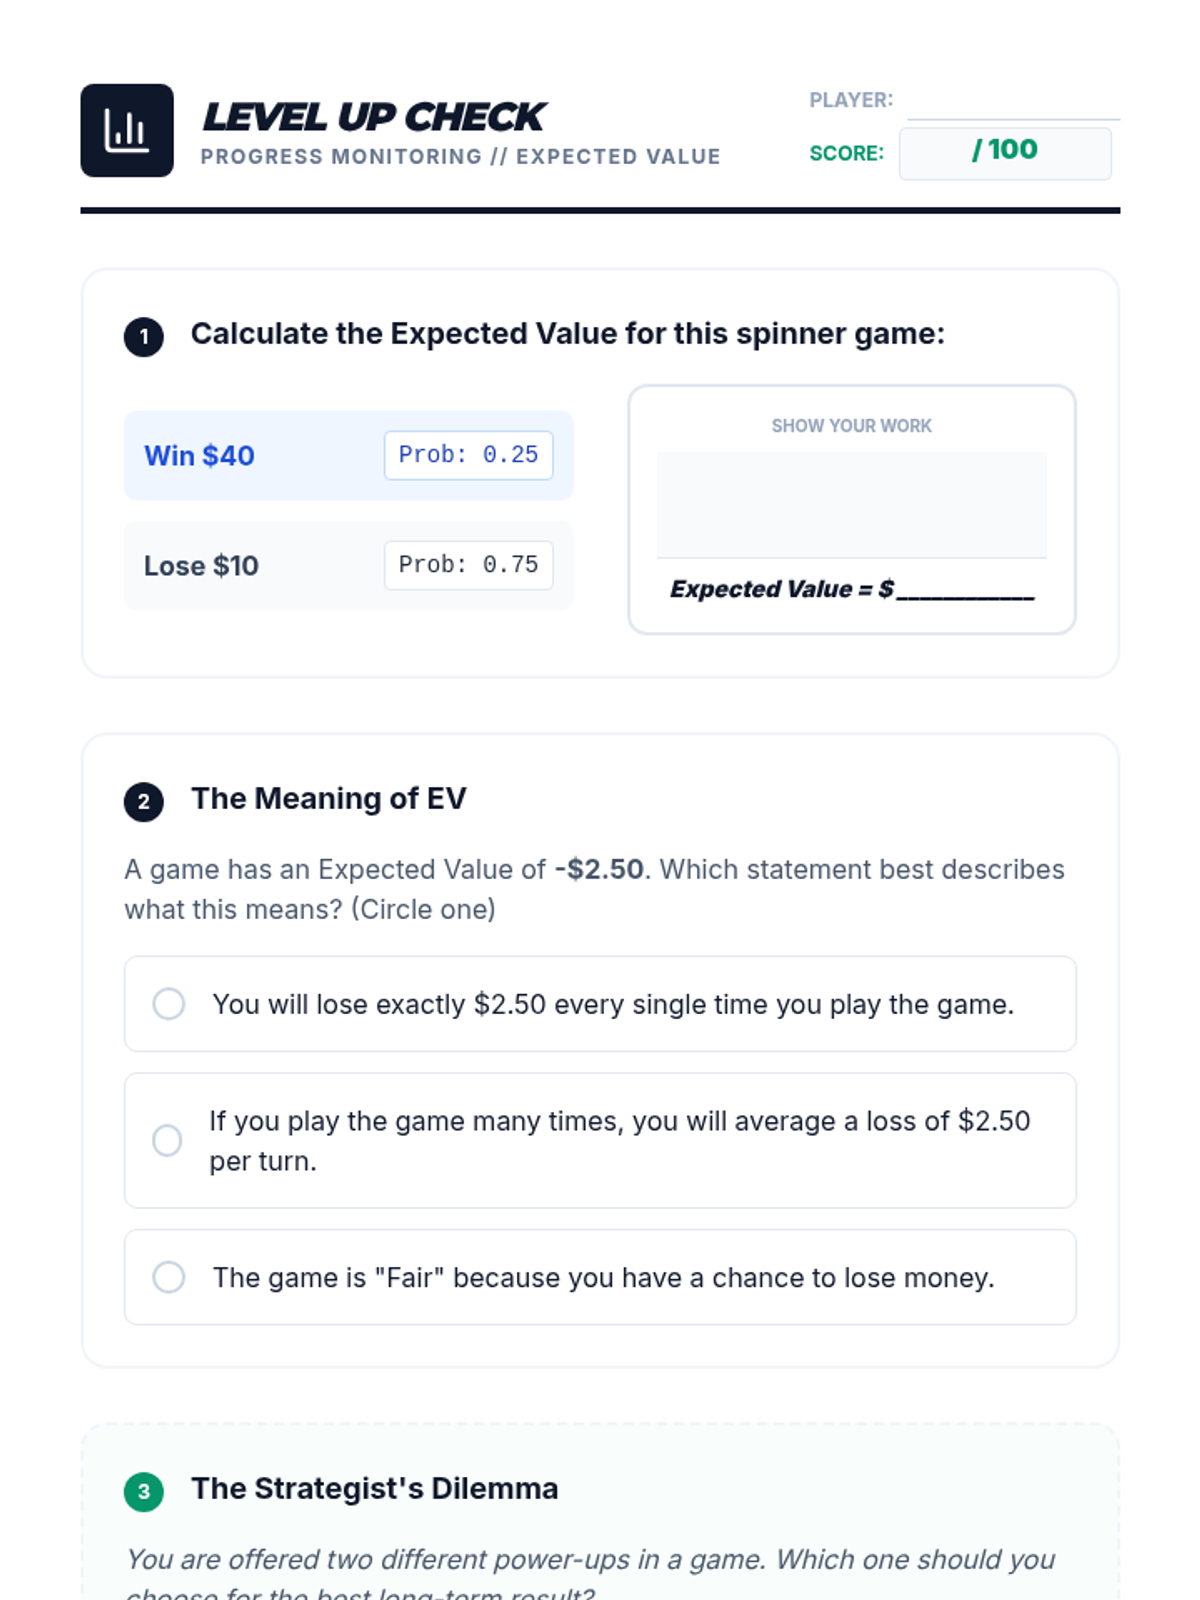
A concise progress monitoring tool designed as an 'exit ticket' to assess student understanding of expected value calculations and conceptual meaning.
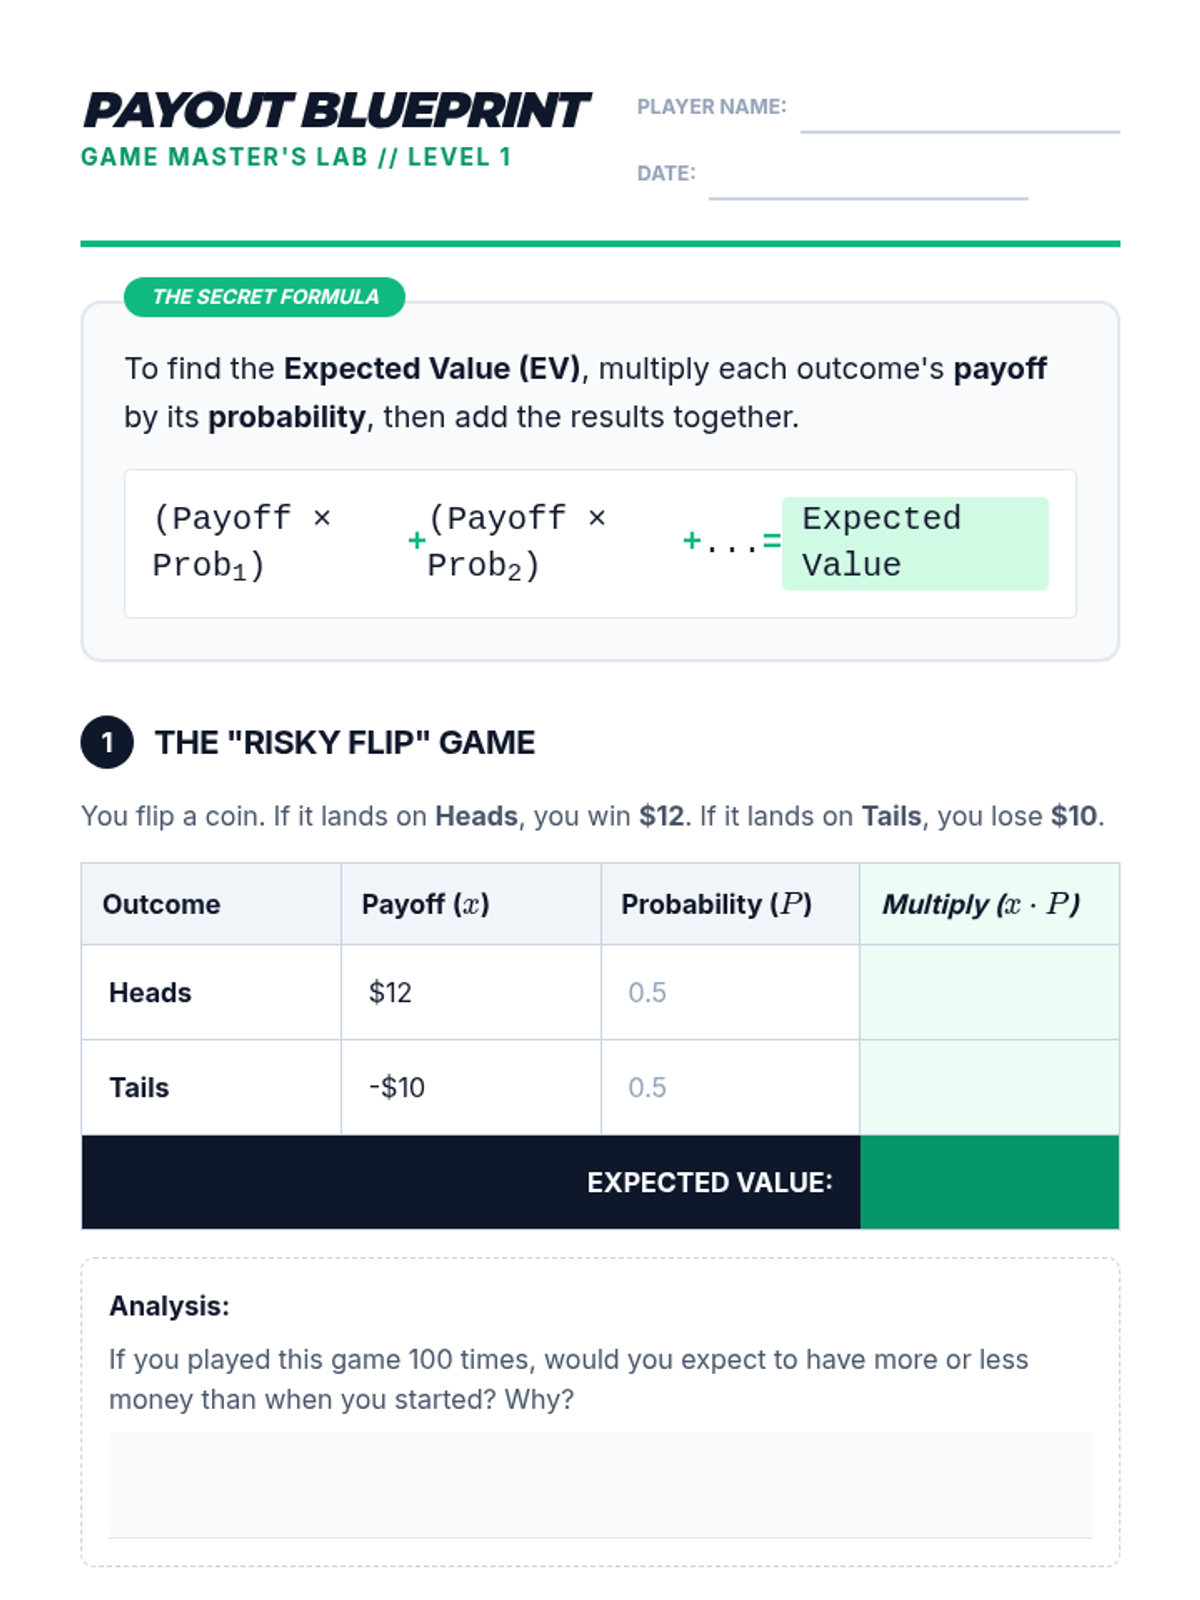
A scaffolded worksheet that guides students through calculating expected value step-by-step using game outcome tables. It includes a progression from basic coin flips to multi-outcome games and a 'fair game' design challenge.
A visual presentation for a small group intervention lesson on expected value, using a game design theme to make the concept of 'long-run average' concrete and engaging.
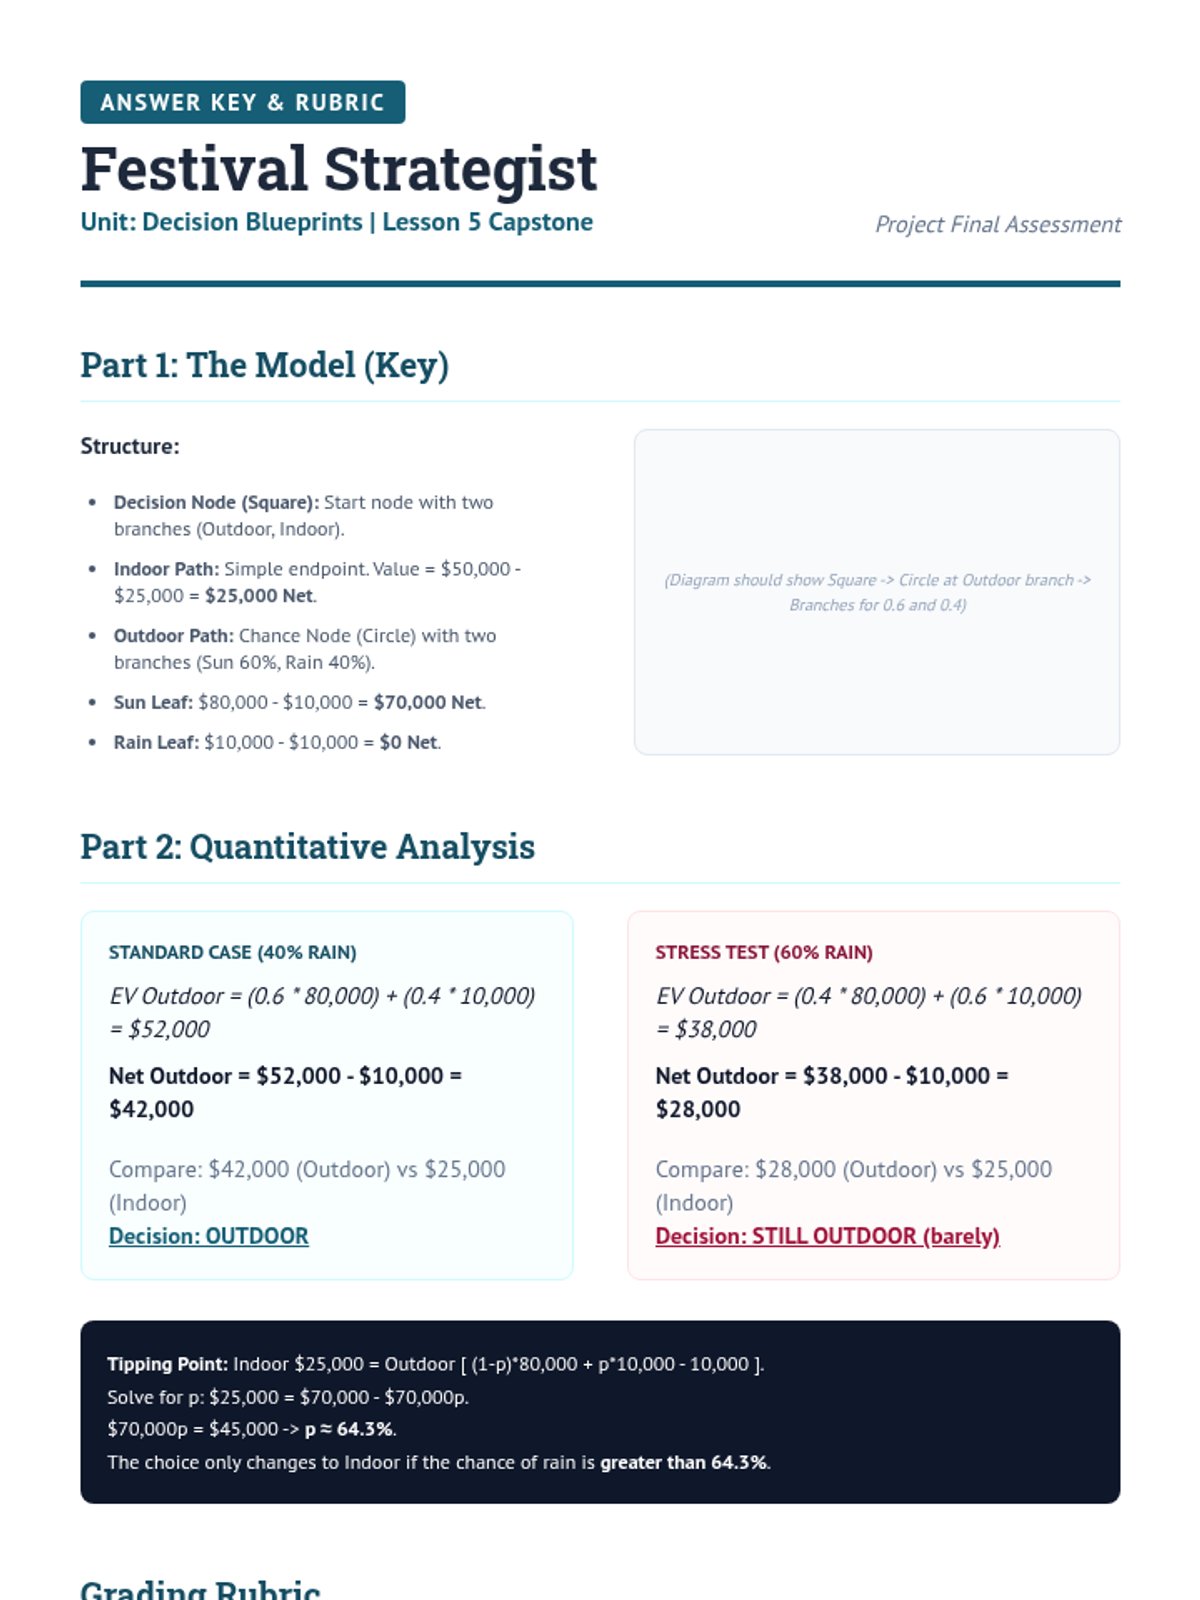
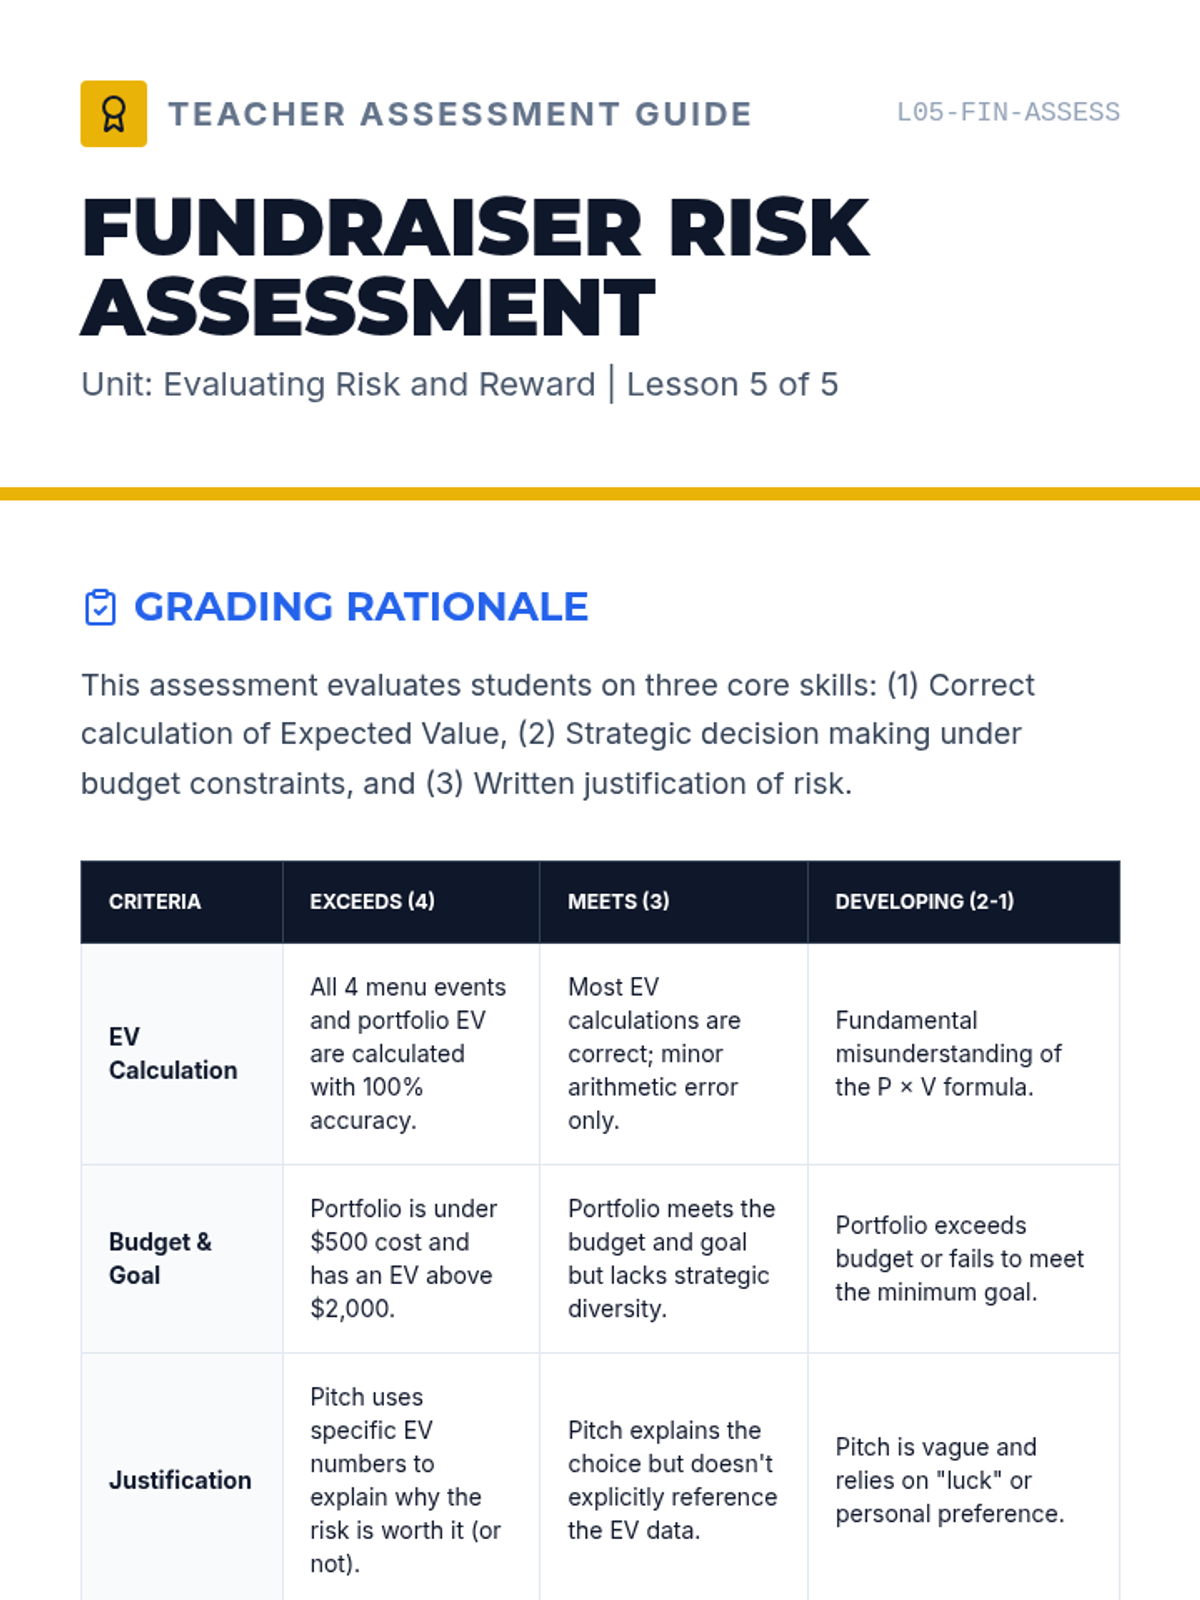
Answer key and grading rubric for the Festival Strategist Capstone project, including the quantitative solution for the tipping point and expected values.
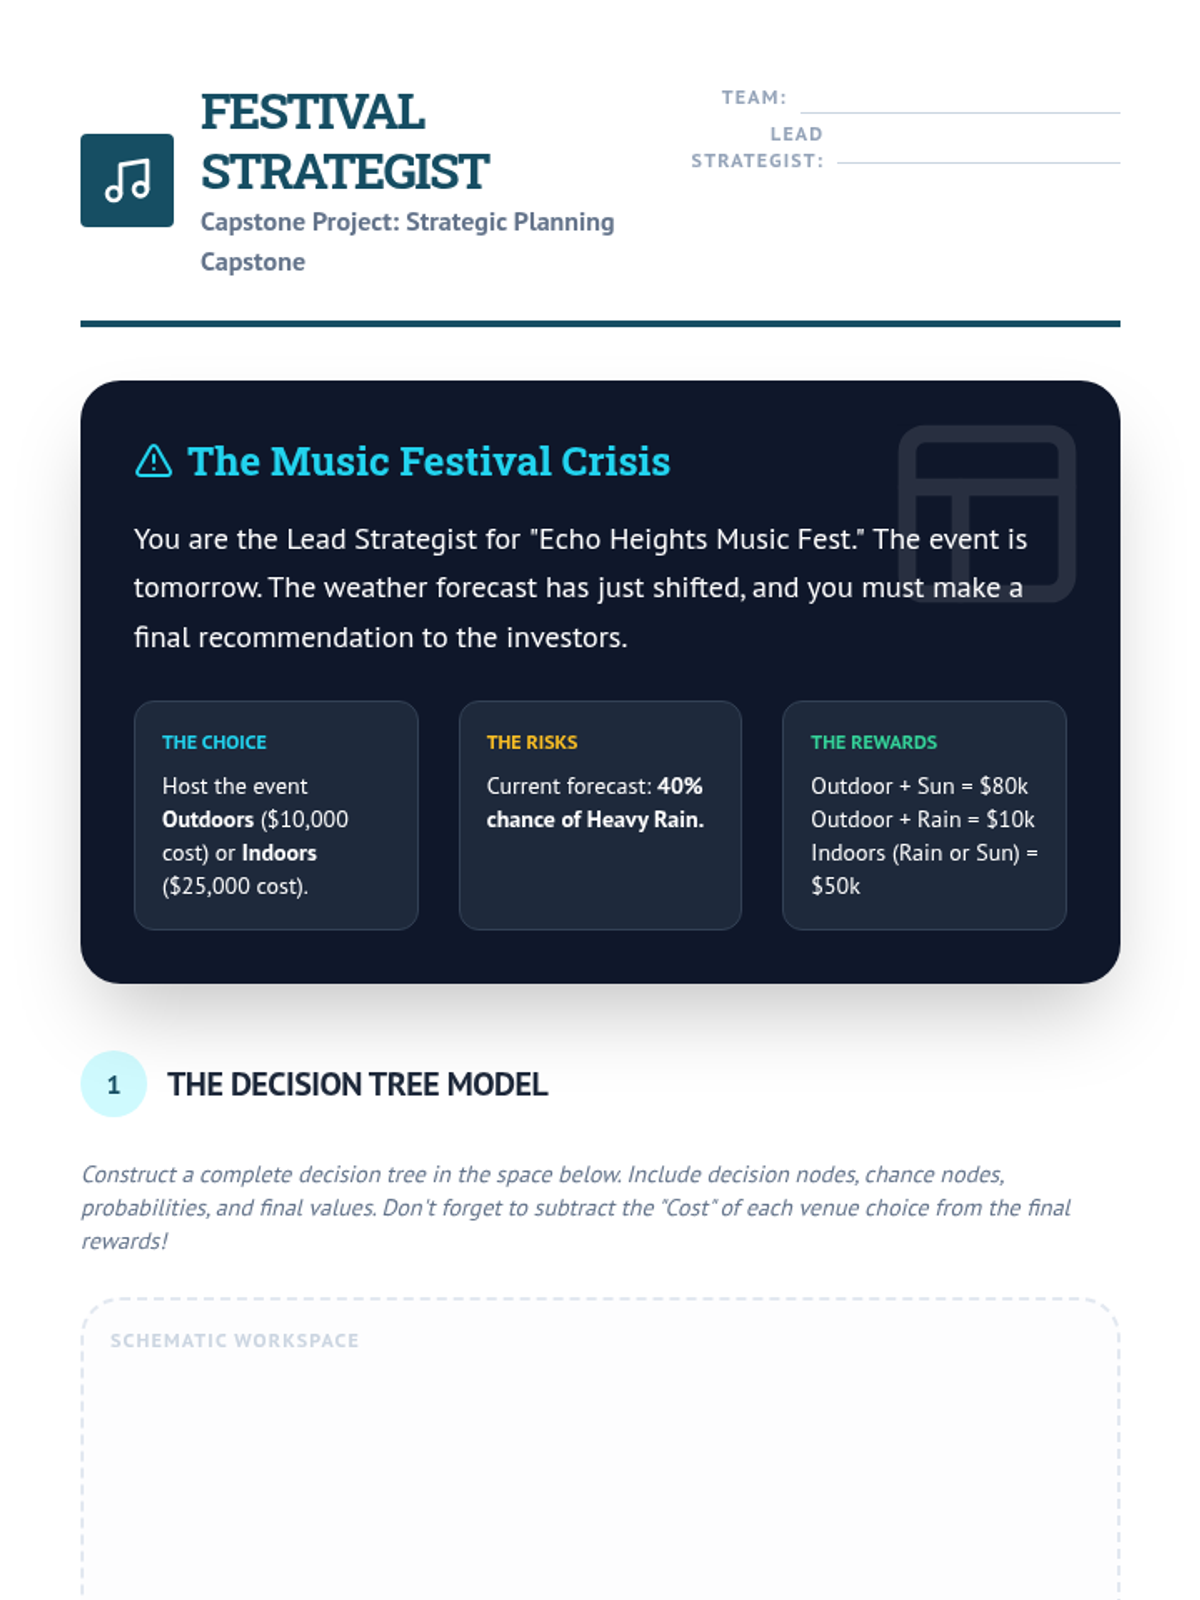
Capstone project for the unit. Students model a complex music festival scenario, calculate net values with backward induction, perform sensitivity analysis, and write a formal recommendation.
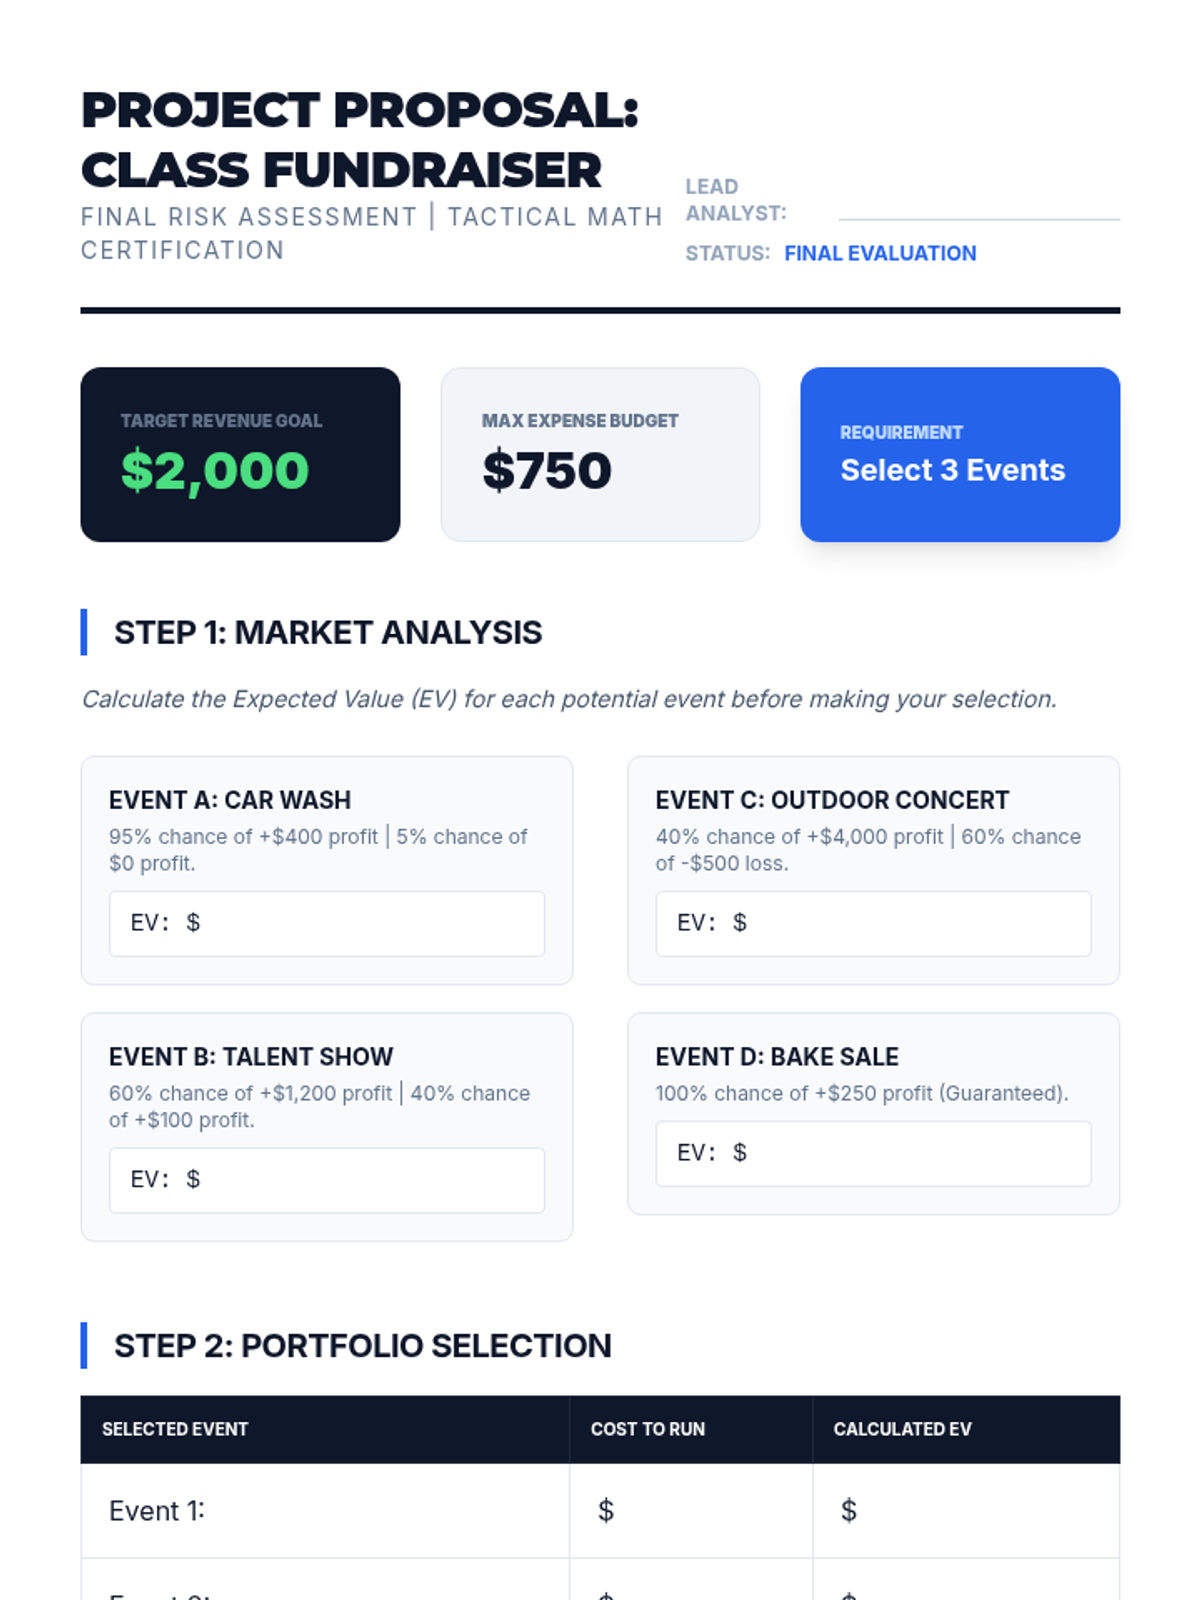
Final assessment worksheet where students evaluate fundraiser options and build a portfolio to maximize expected profit within a budget.
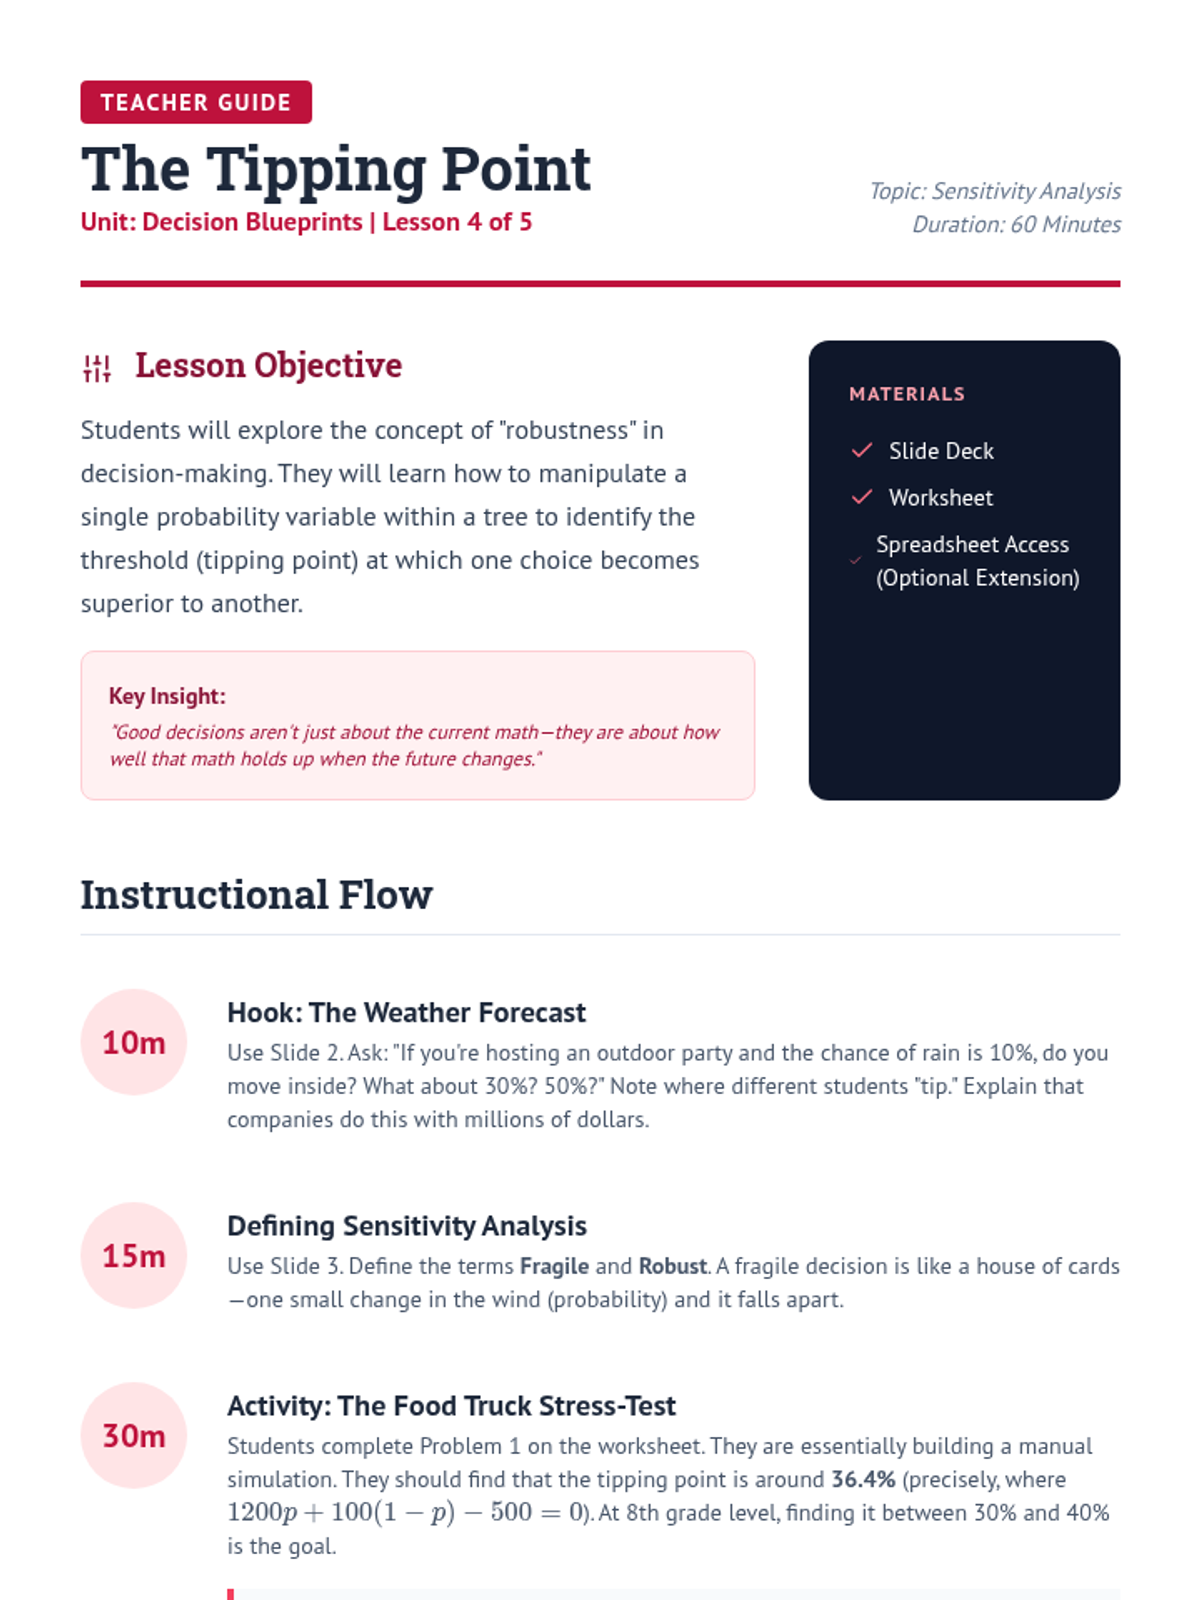
Teacher guide for Lesson 4: The Tipping Point. Focuses on sensitivity analysis, robustness vs. fragility, and identifies thresholds in decision models.
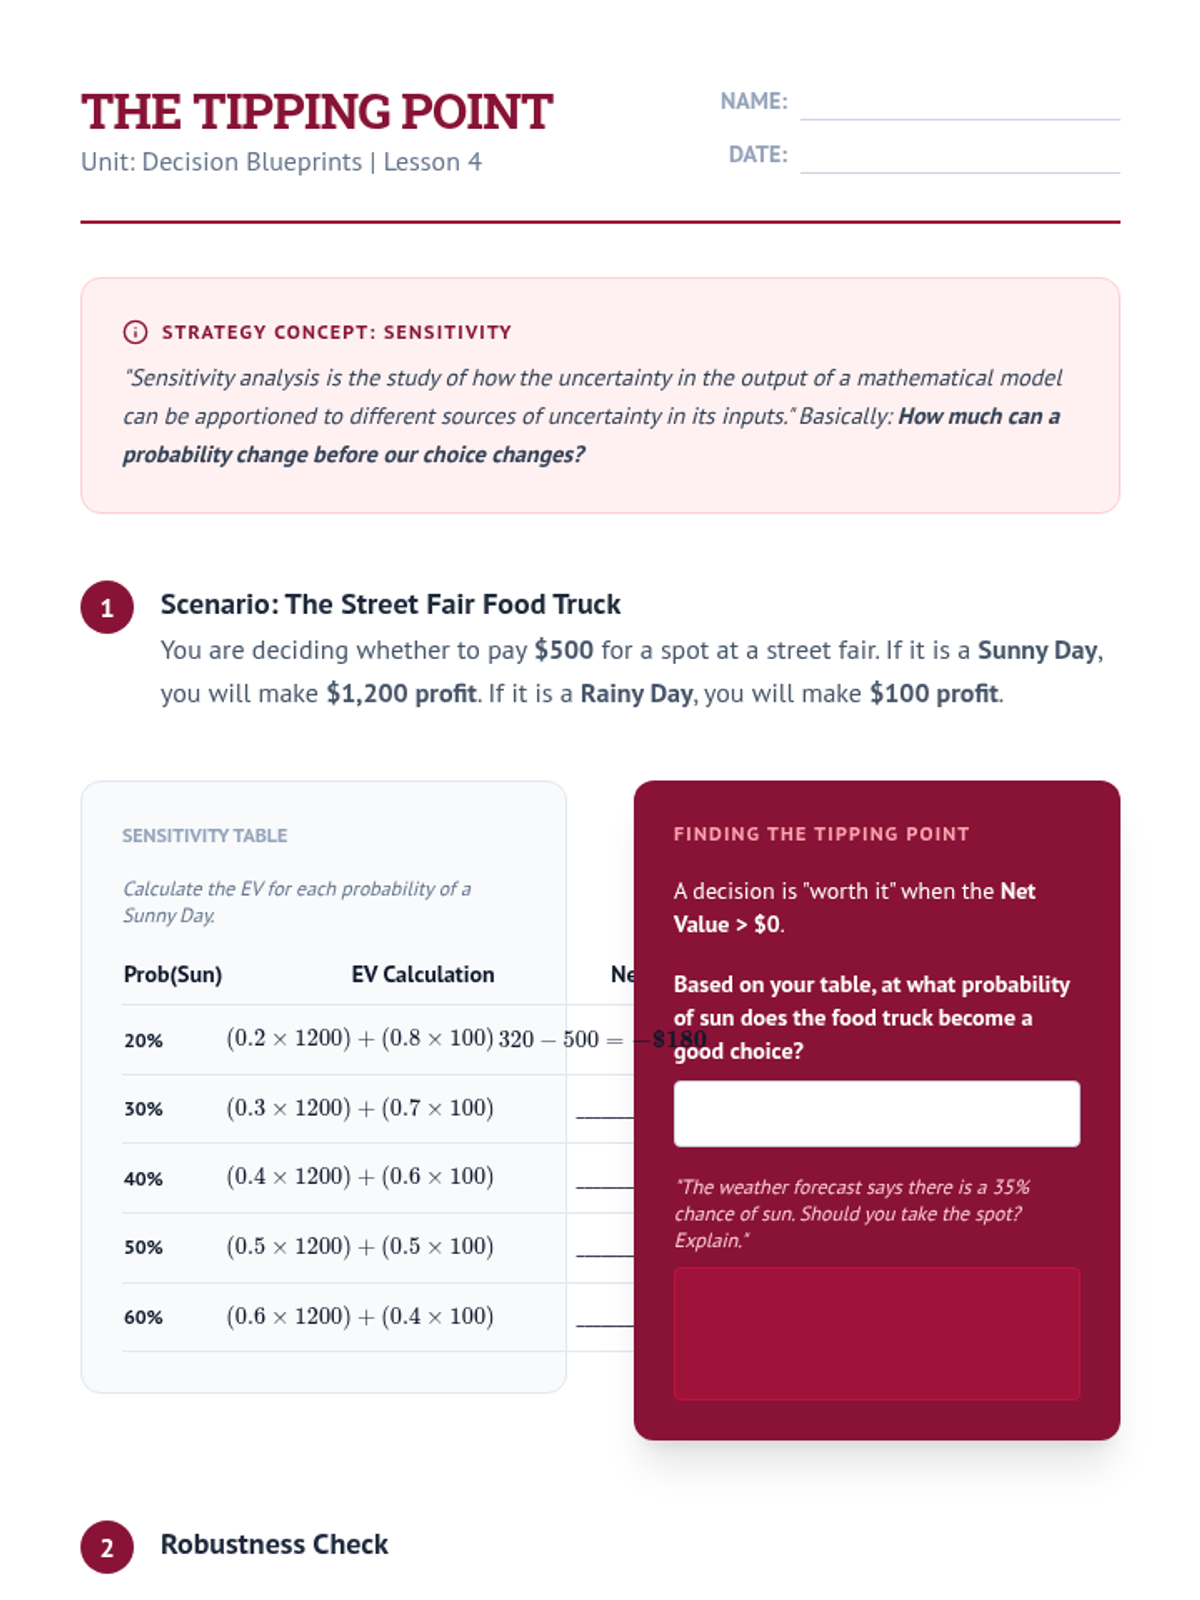
Worksheet for Lesson 4 where students perform sensitivity analysis by calculating expected values across a range of probabilities to find the "tipping point" for a decision.
Teacher facilitation guide for Lesson 5, providing instructional steps for comparing business scenarios using expected value.
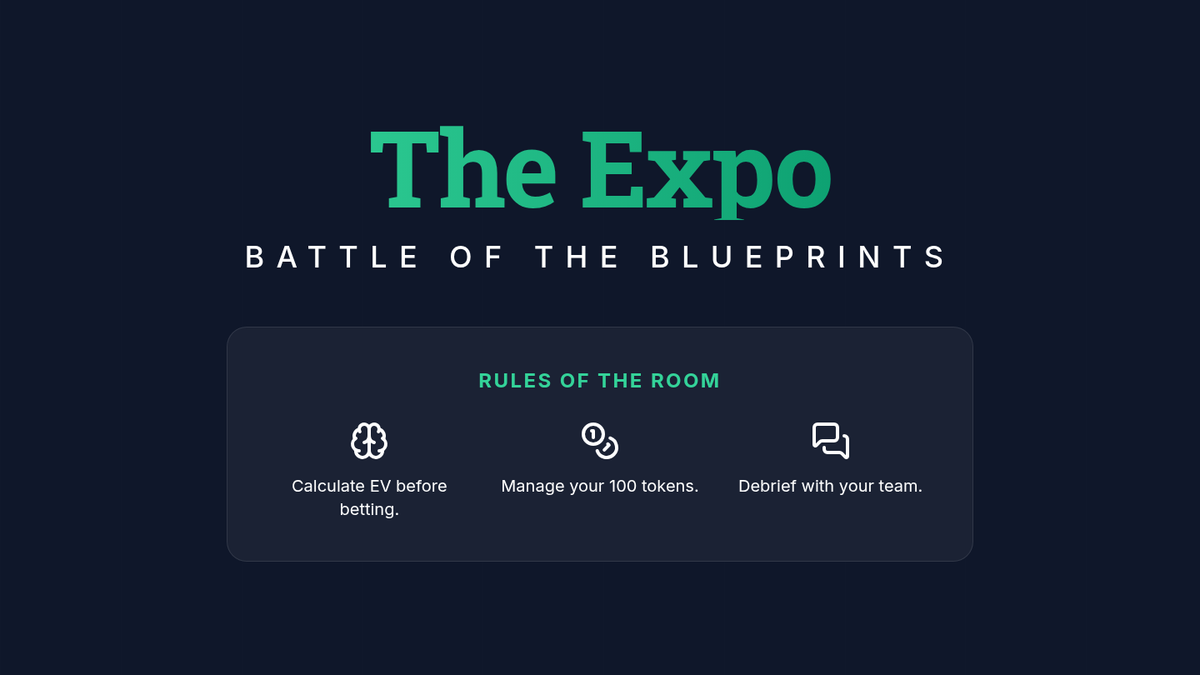
Wrap-up slides for the Probability Expo, featuring a leaderboard and final reflection on the role of math in strategic decision-making.
Slide deck for Lesson 4, introducing sensitivity analysis and the concept of "tipping points" where changes in probability alter the optimal decision.
Final slide deck for the sequence, presenting the fundraiser portfolio challenge and evaluation criteria.
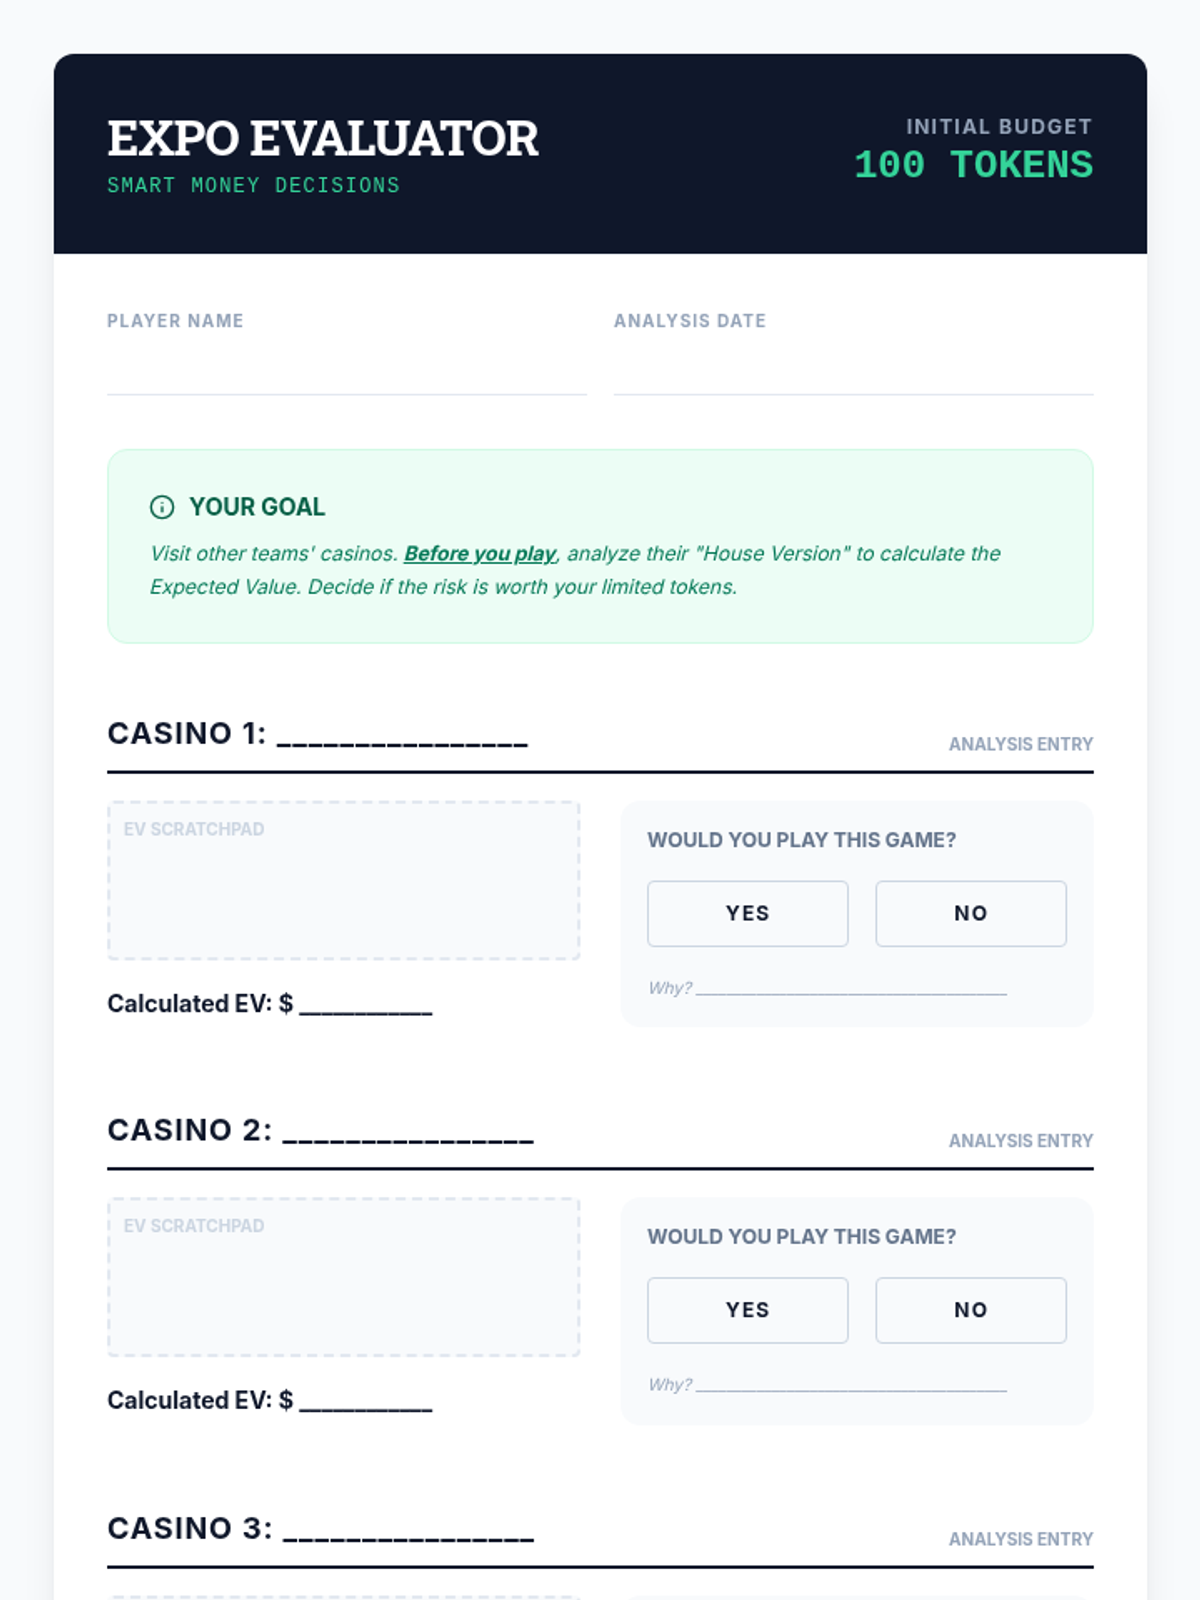
Analysis worksheet for the Probability Expo, allowing students to evaluate and record the expected values of peer-designed games.
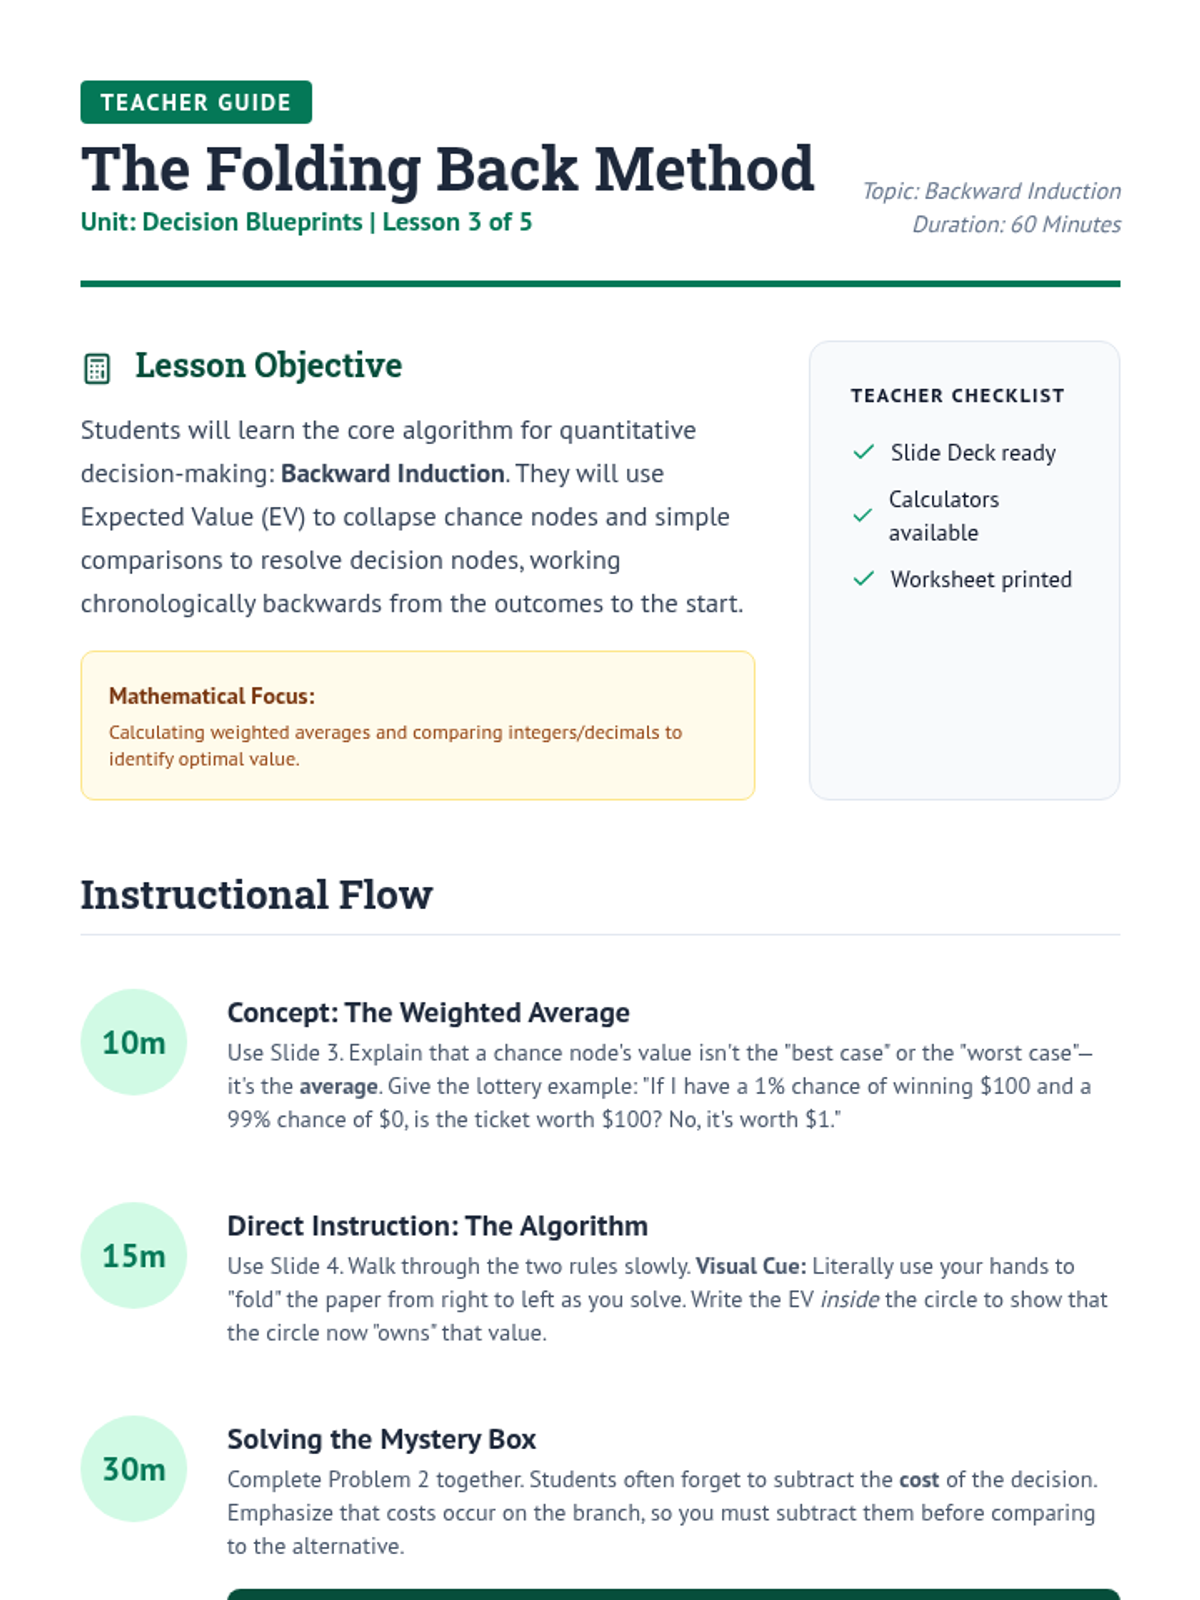
Teacher guide for Lesson 3: The Folding Back Method. Explains backward induction, weighted averages, and how to handle costs in decision models.
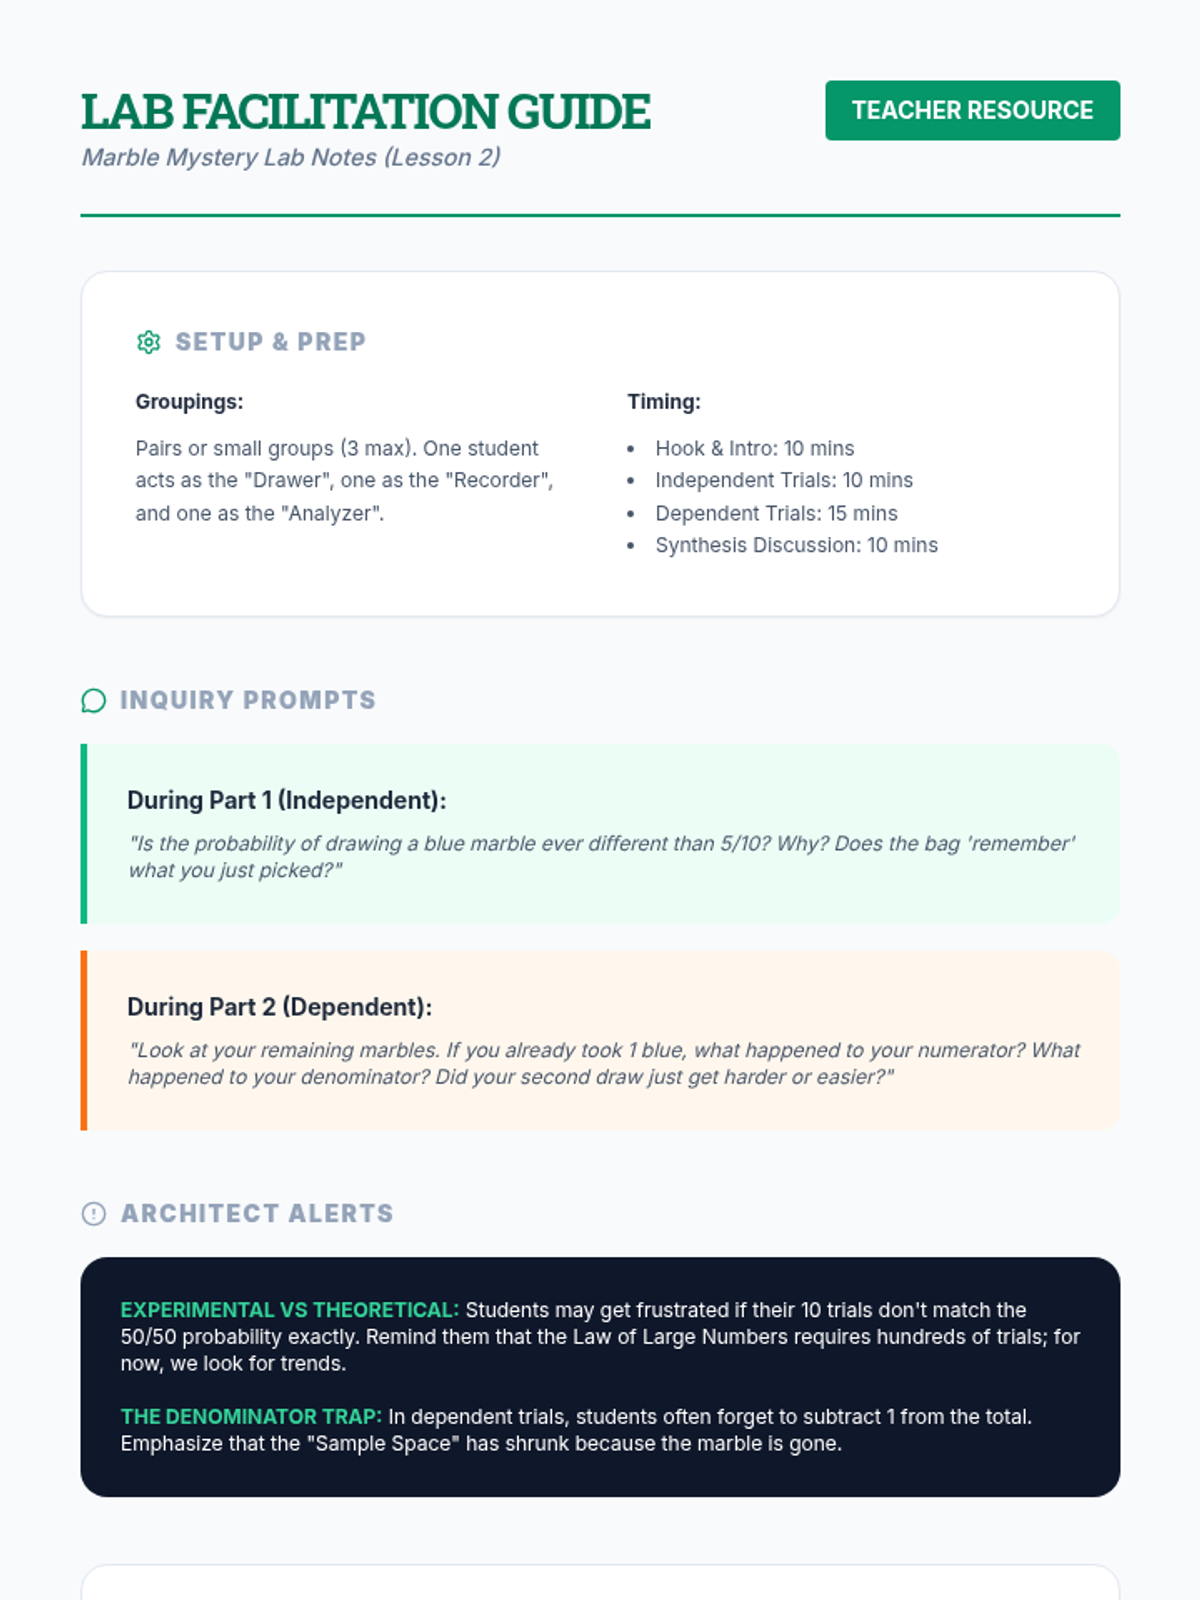
Facilitation guide for the Lesson 2 marble experiment, including setup instructions, inquiry-based discussion prompts, and expected experimental outcomes.
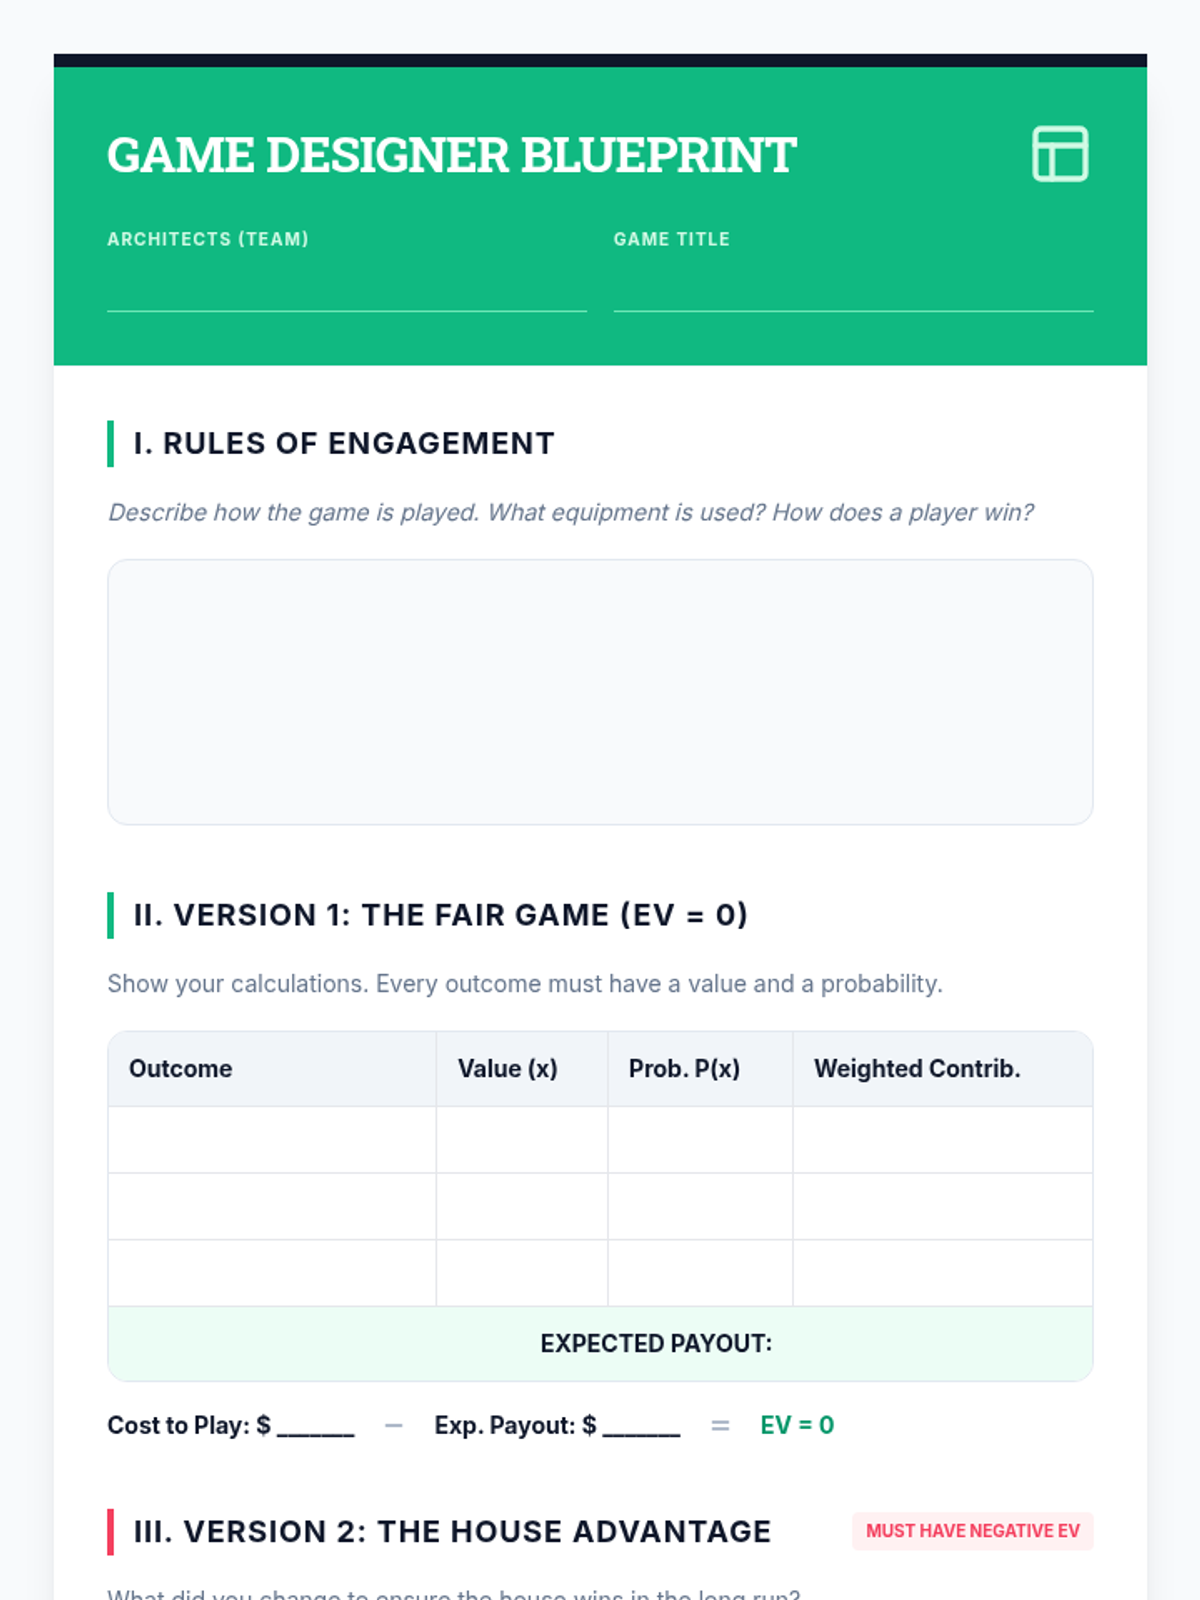
Project planning document for Lesson 4, guiding students through the design and mathematical validation of fair and unfair games.
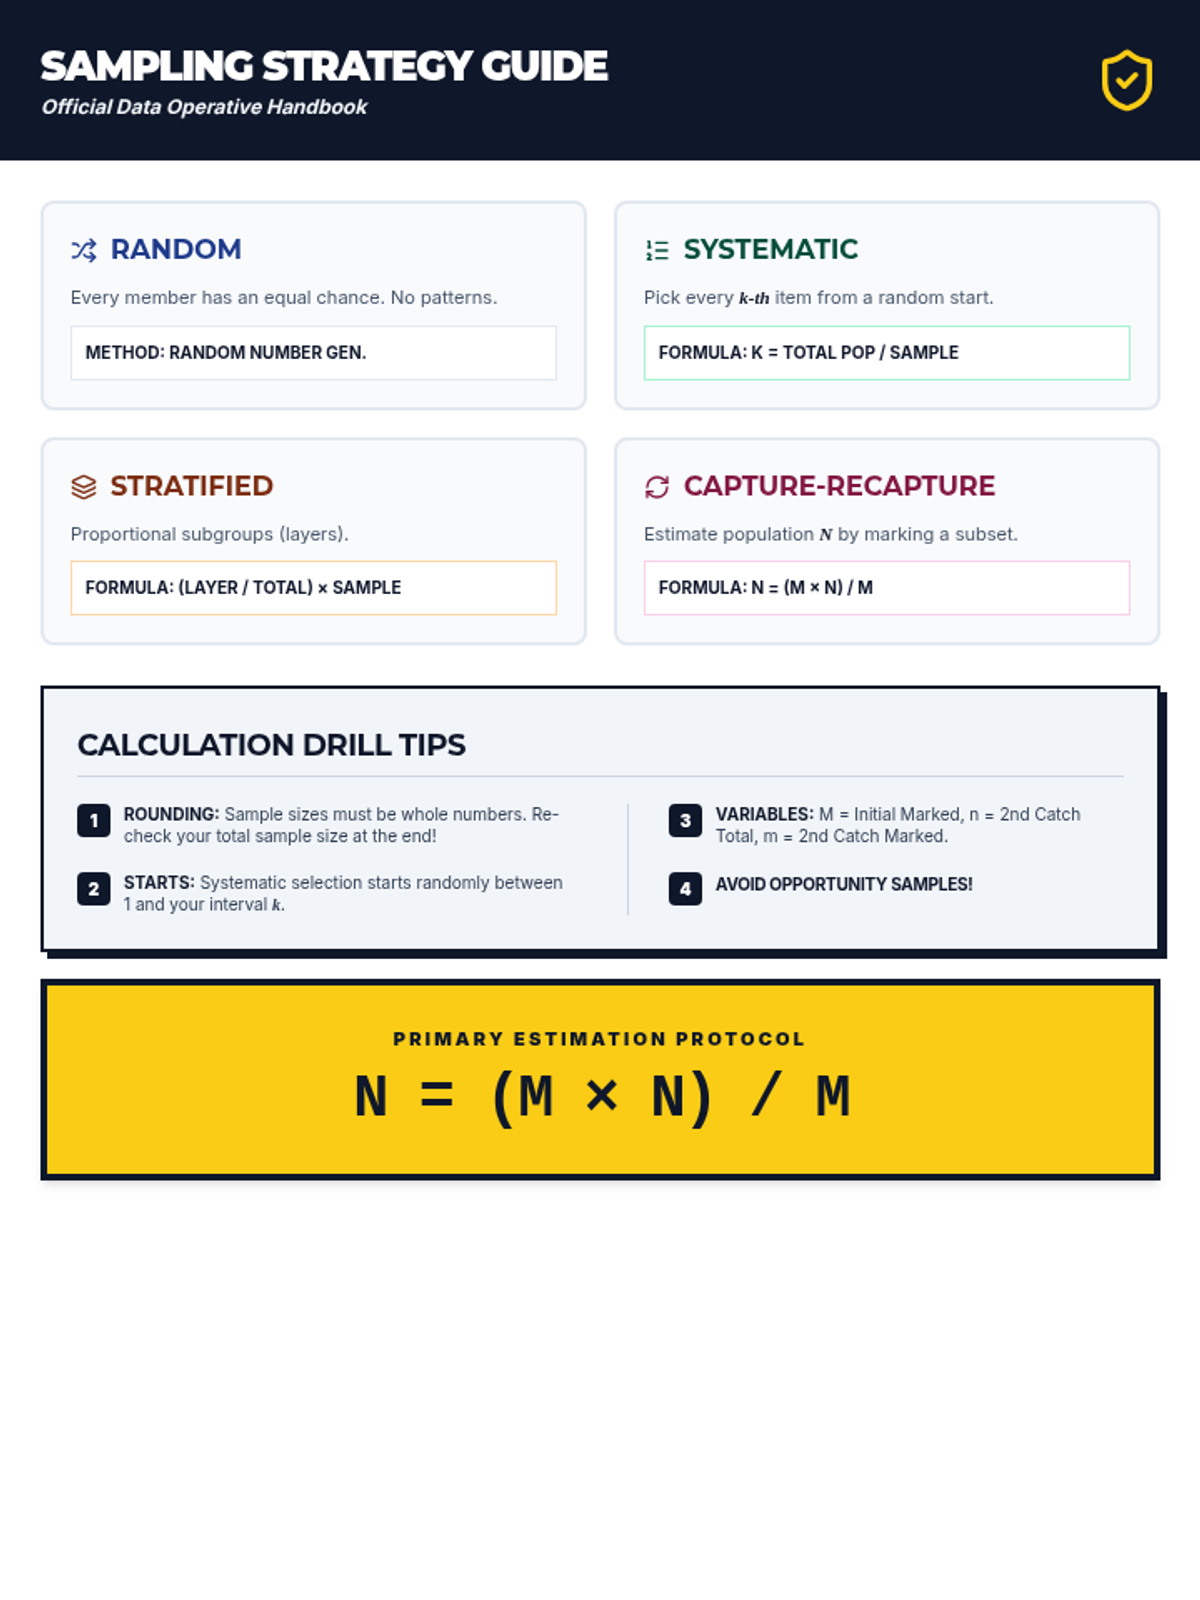
A quick-reference 'cheat sheet' for Year 8 students, summarizing the formulas and methods for random, systematic, stratified, and capture-recapture sampling.
A secret-agent themed slide deck for Year 8 students, explaining the theory and calculation methods for systematic, stratified, and capture-recapture sampling, featuring worked examples.
The answer key for the Sample Size Showdown worksheet, providing full solutions and calculations for all sampling problems.
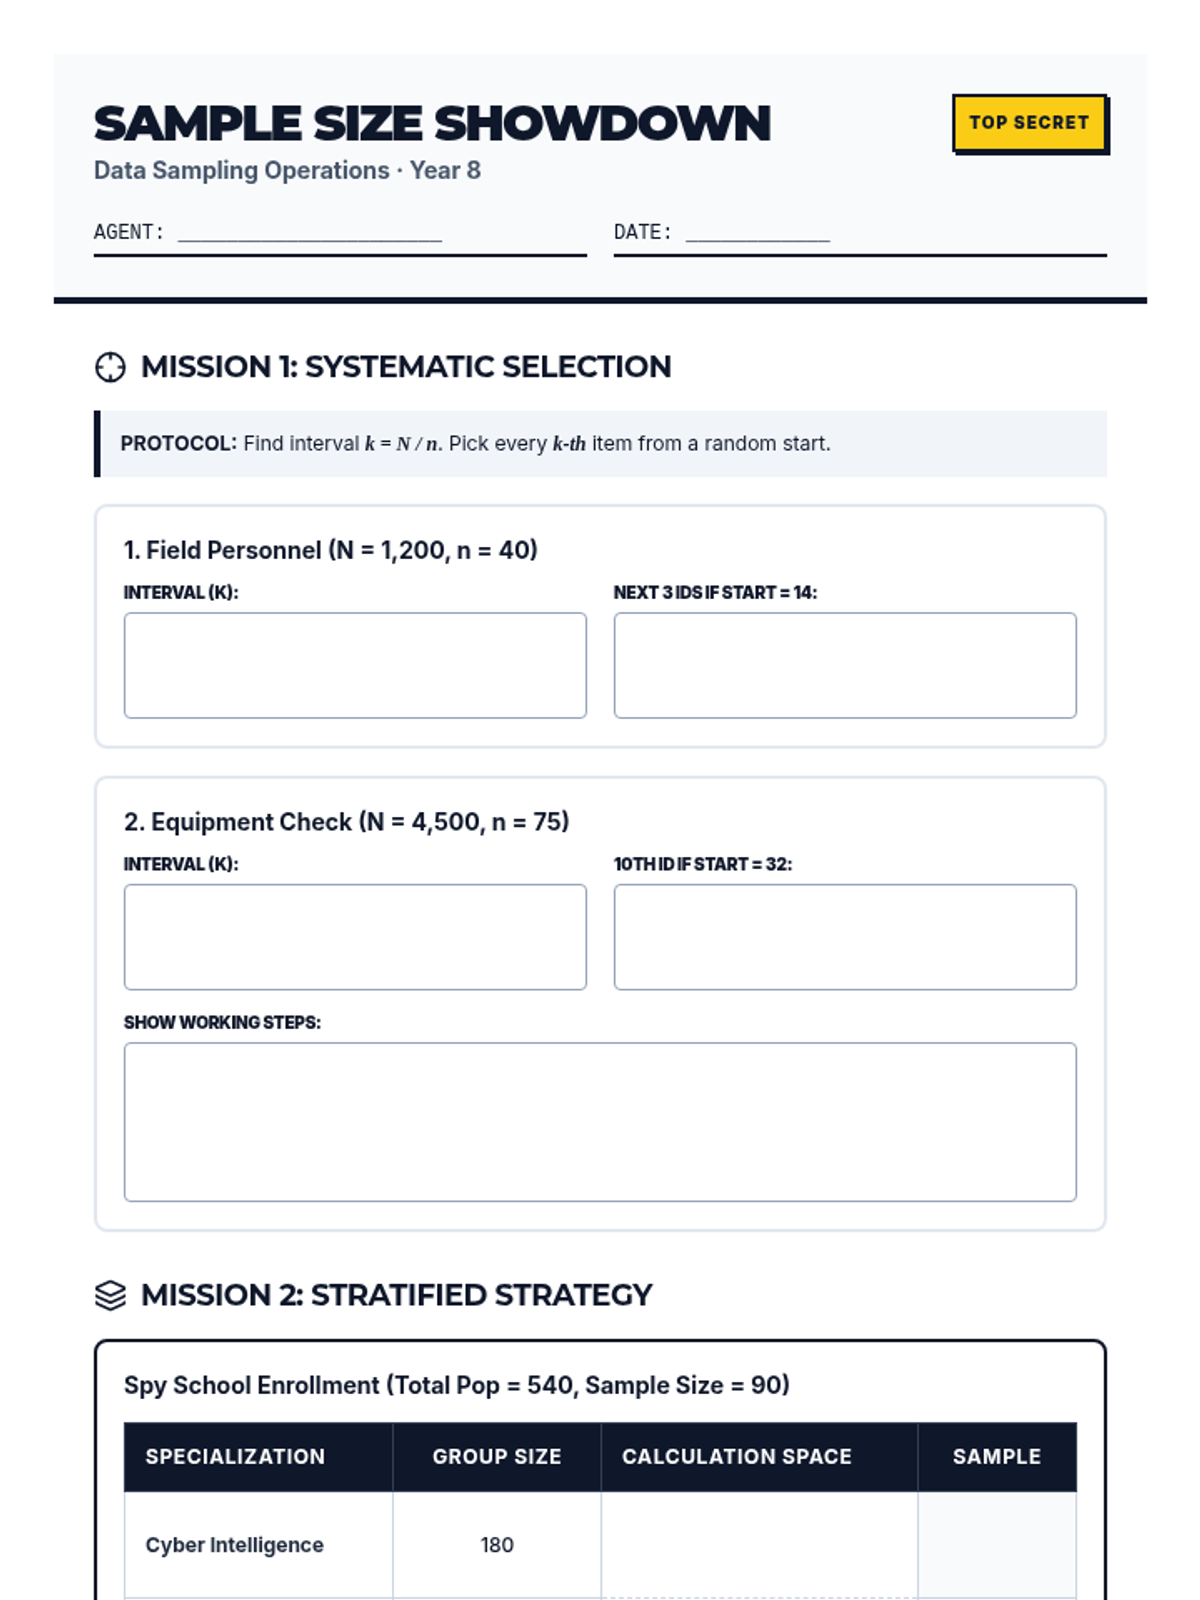
A Year 8 math worksheet titled 'Sample Size Showdown' focused on sampling calculations, including systematic, stratified, and capture-recapture methods, with a secret agent theme.
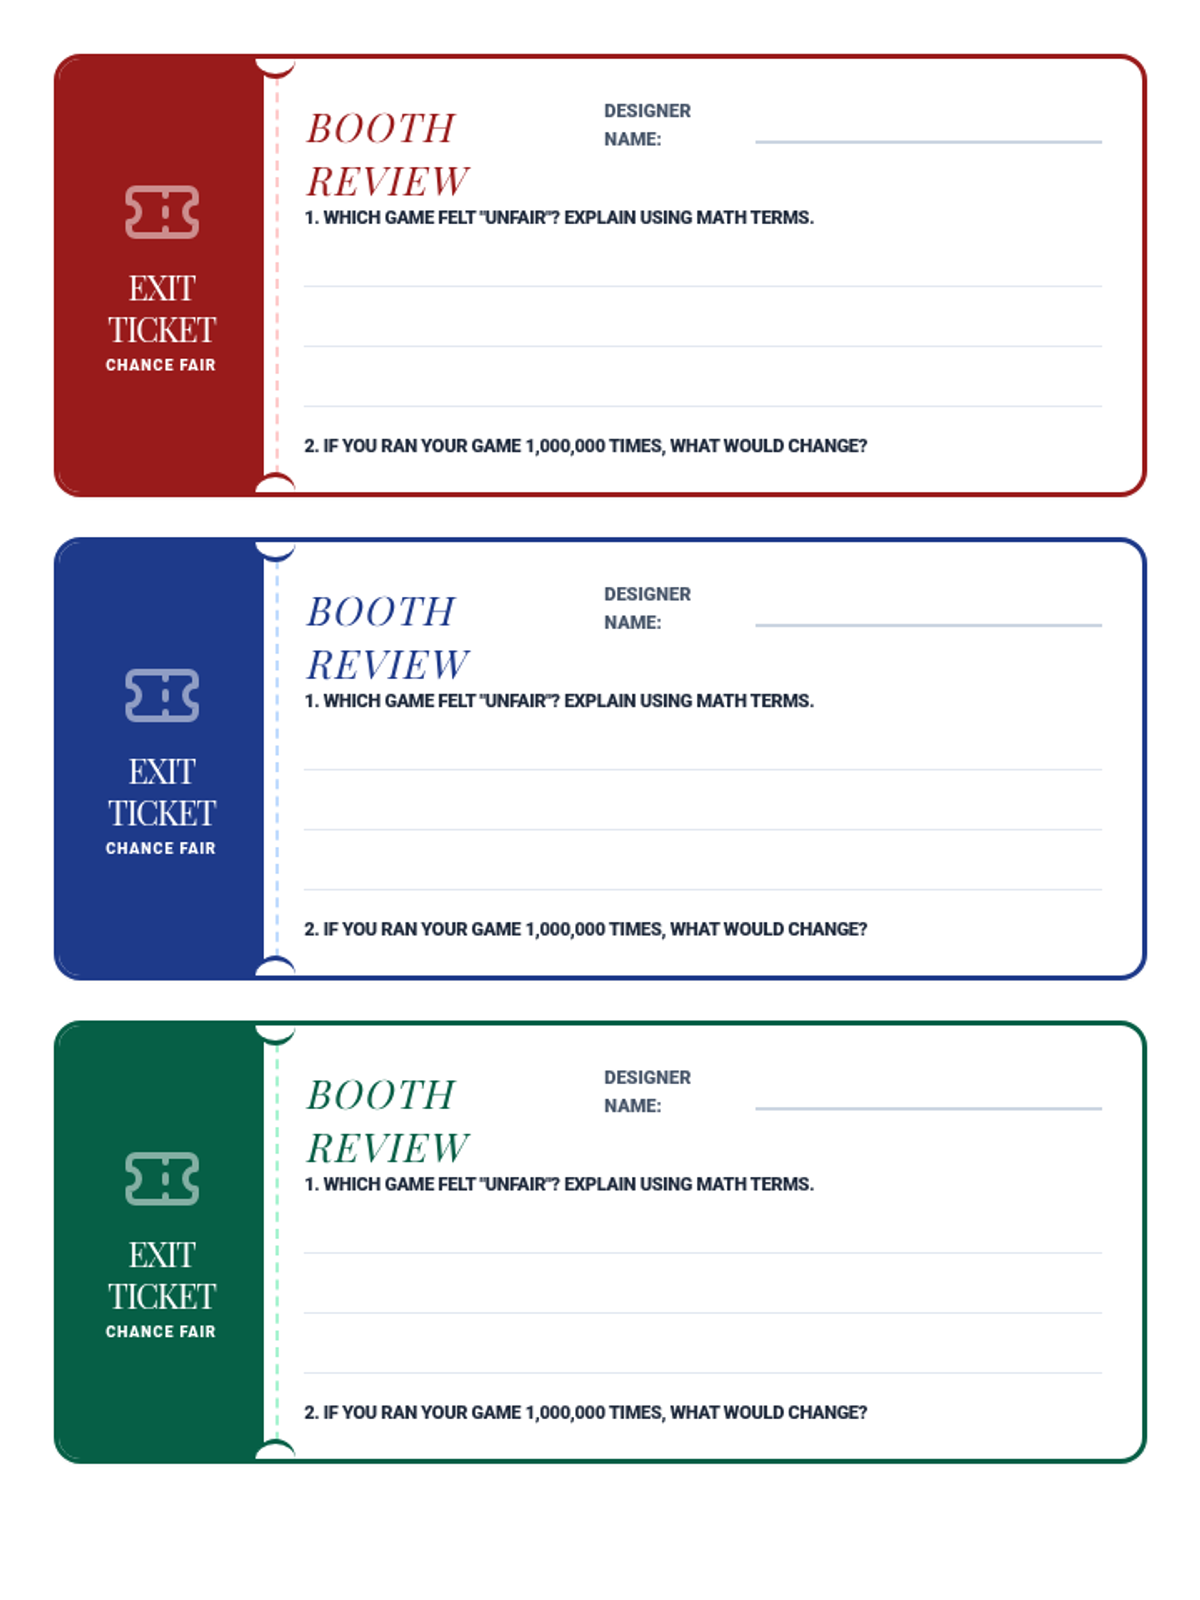
A ticket-themed exit ticket for students to reflect on their learning about fairness, probability, and the Law of Large Numbers following the project.
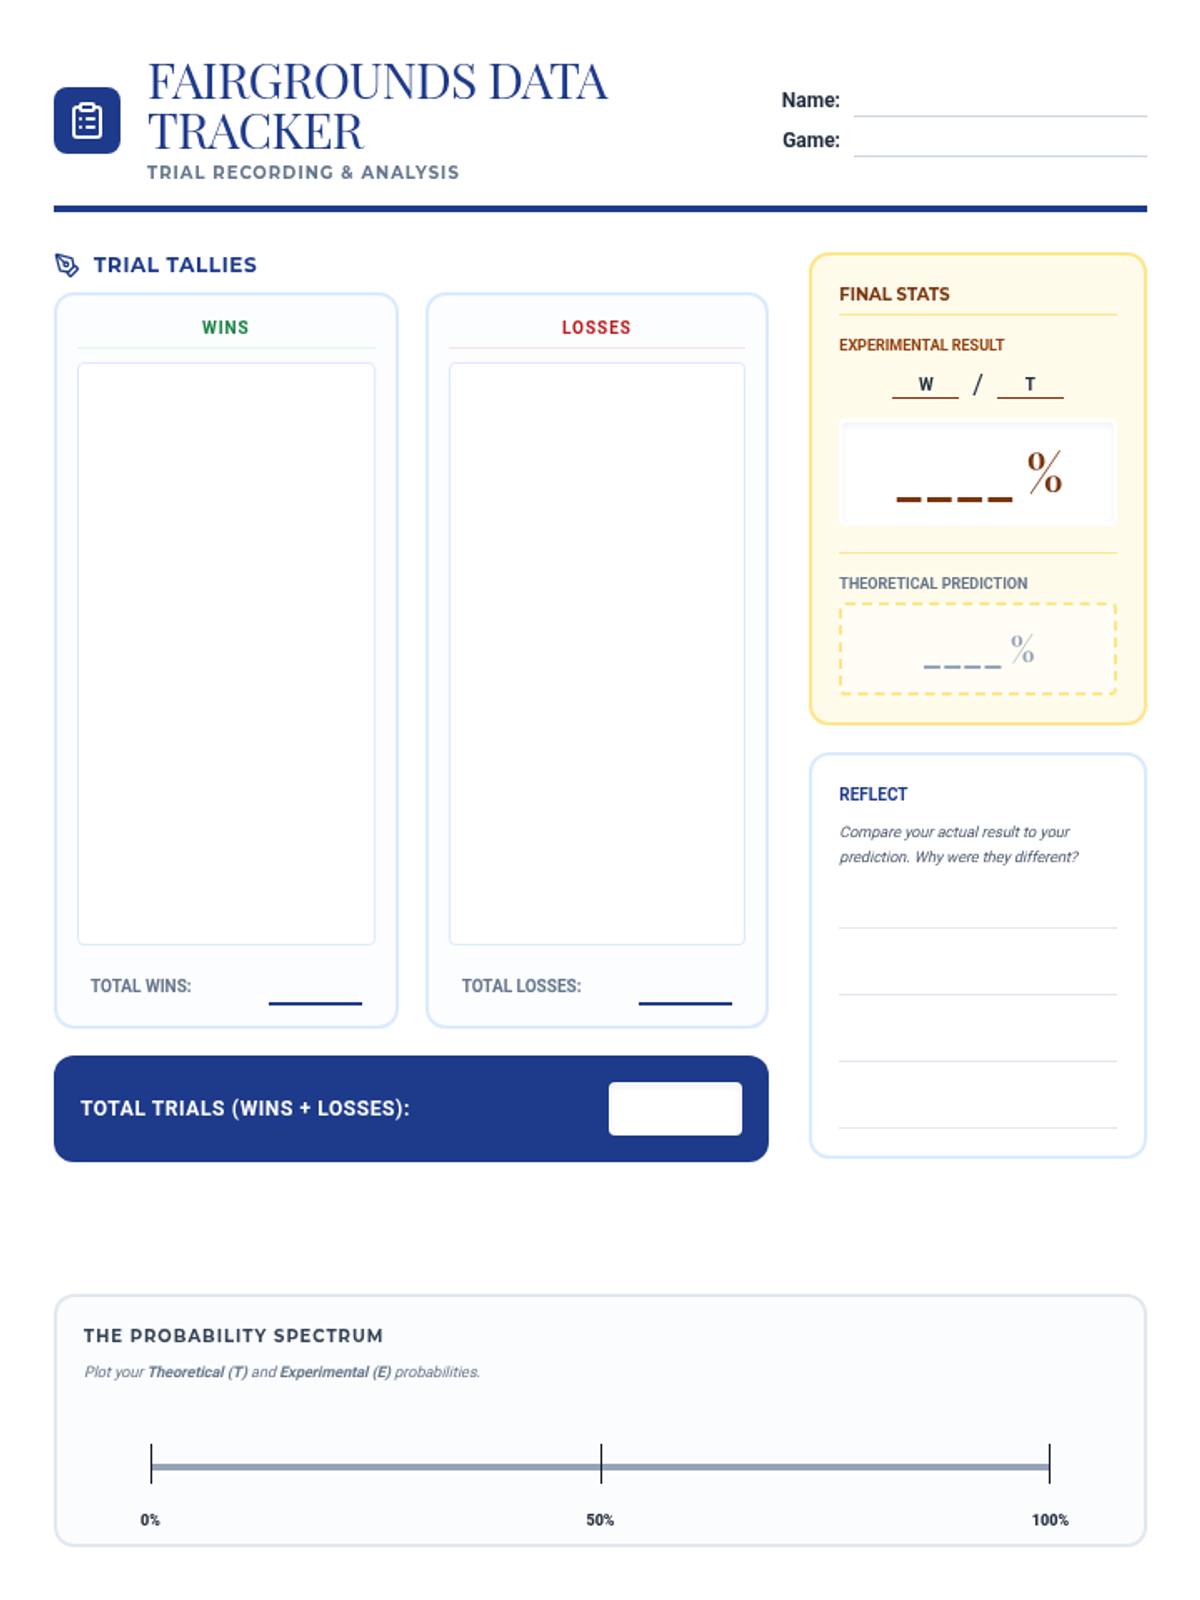
A data recording sheet for students to use during the Chance Fair, featuring tally sections for wins and losses, calculation areas for experimental probability, and a comparison spectrum.
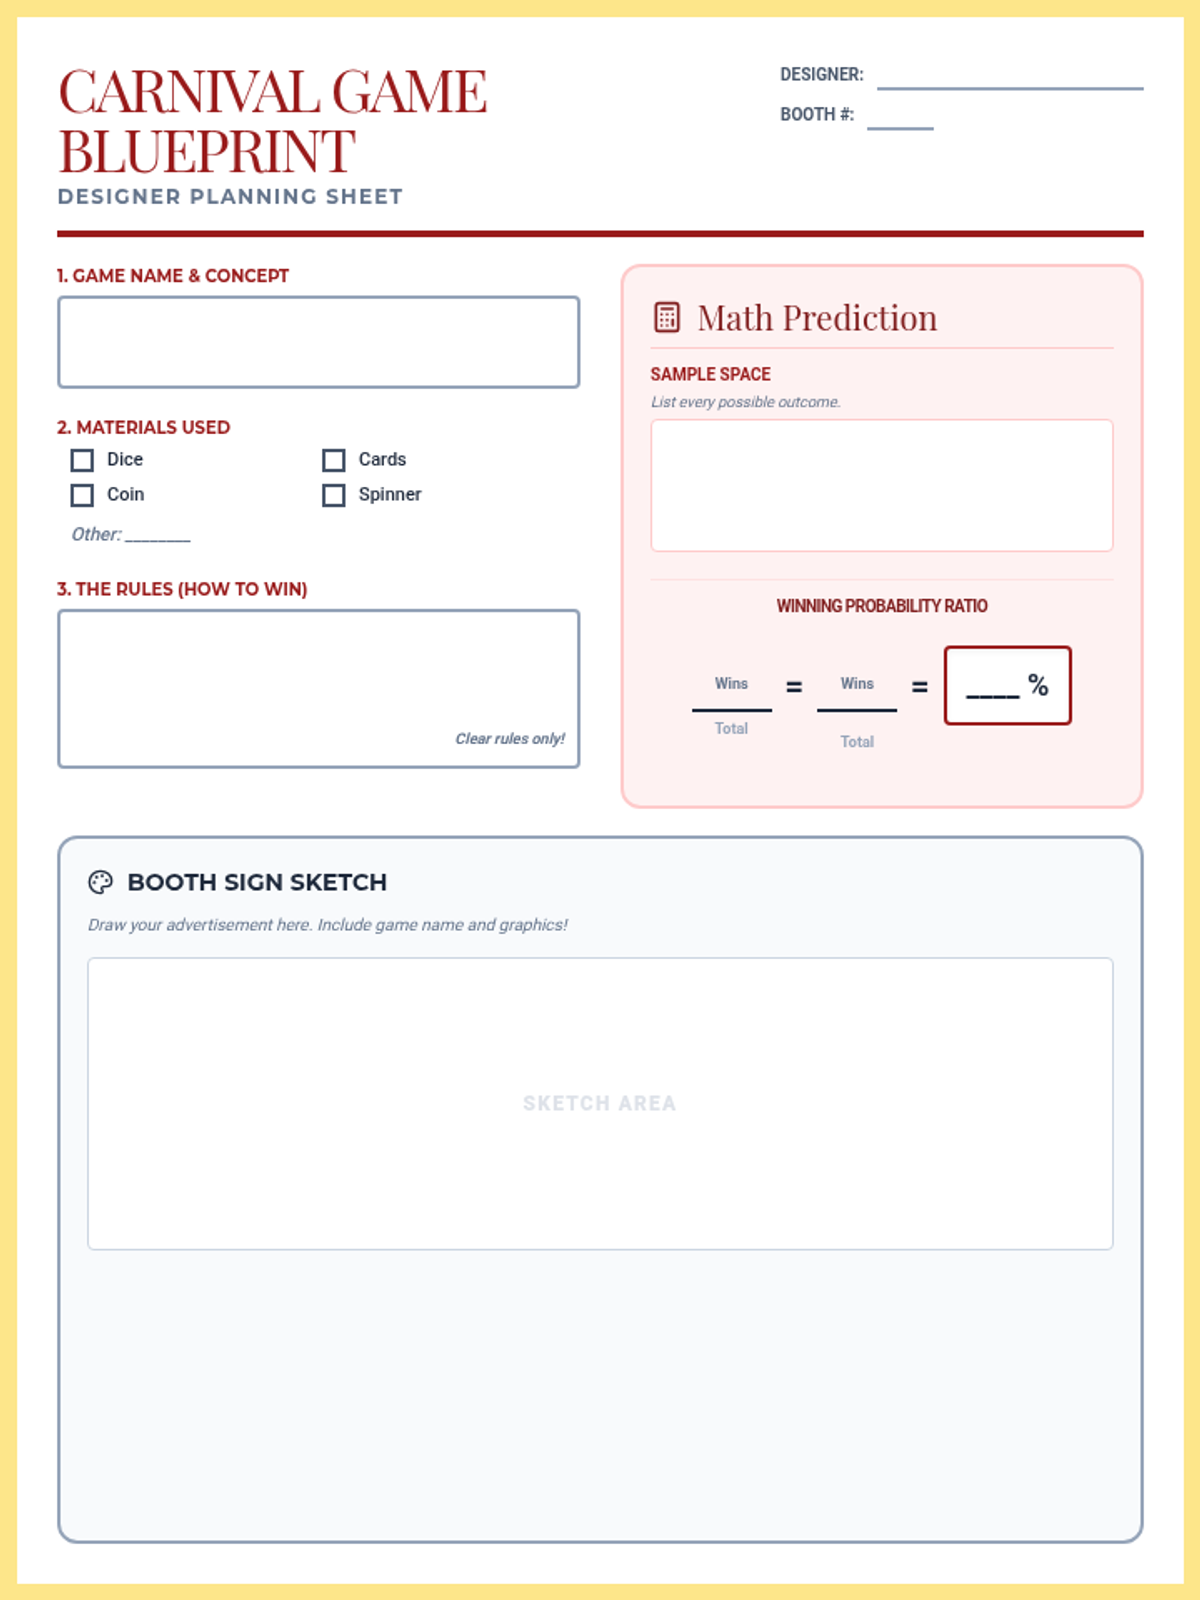
A project blueprint for students to design their carnival game, define rules, and calculate the theoretical probability of winning before testing begins.
An engaging slide deck introducing theoretical versus experimental probability, the Law of Large Numbers, and the Chance Fair project instructions.
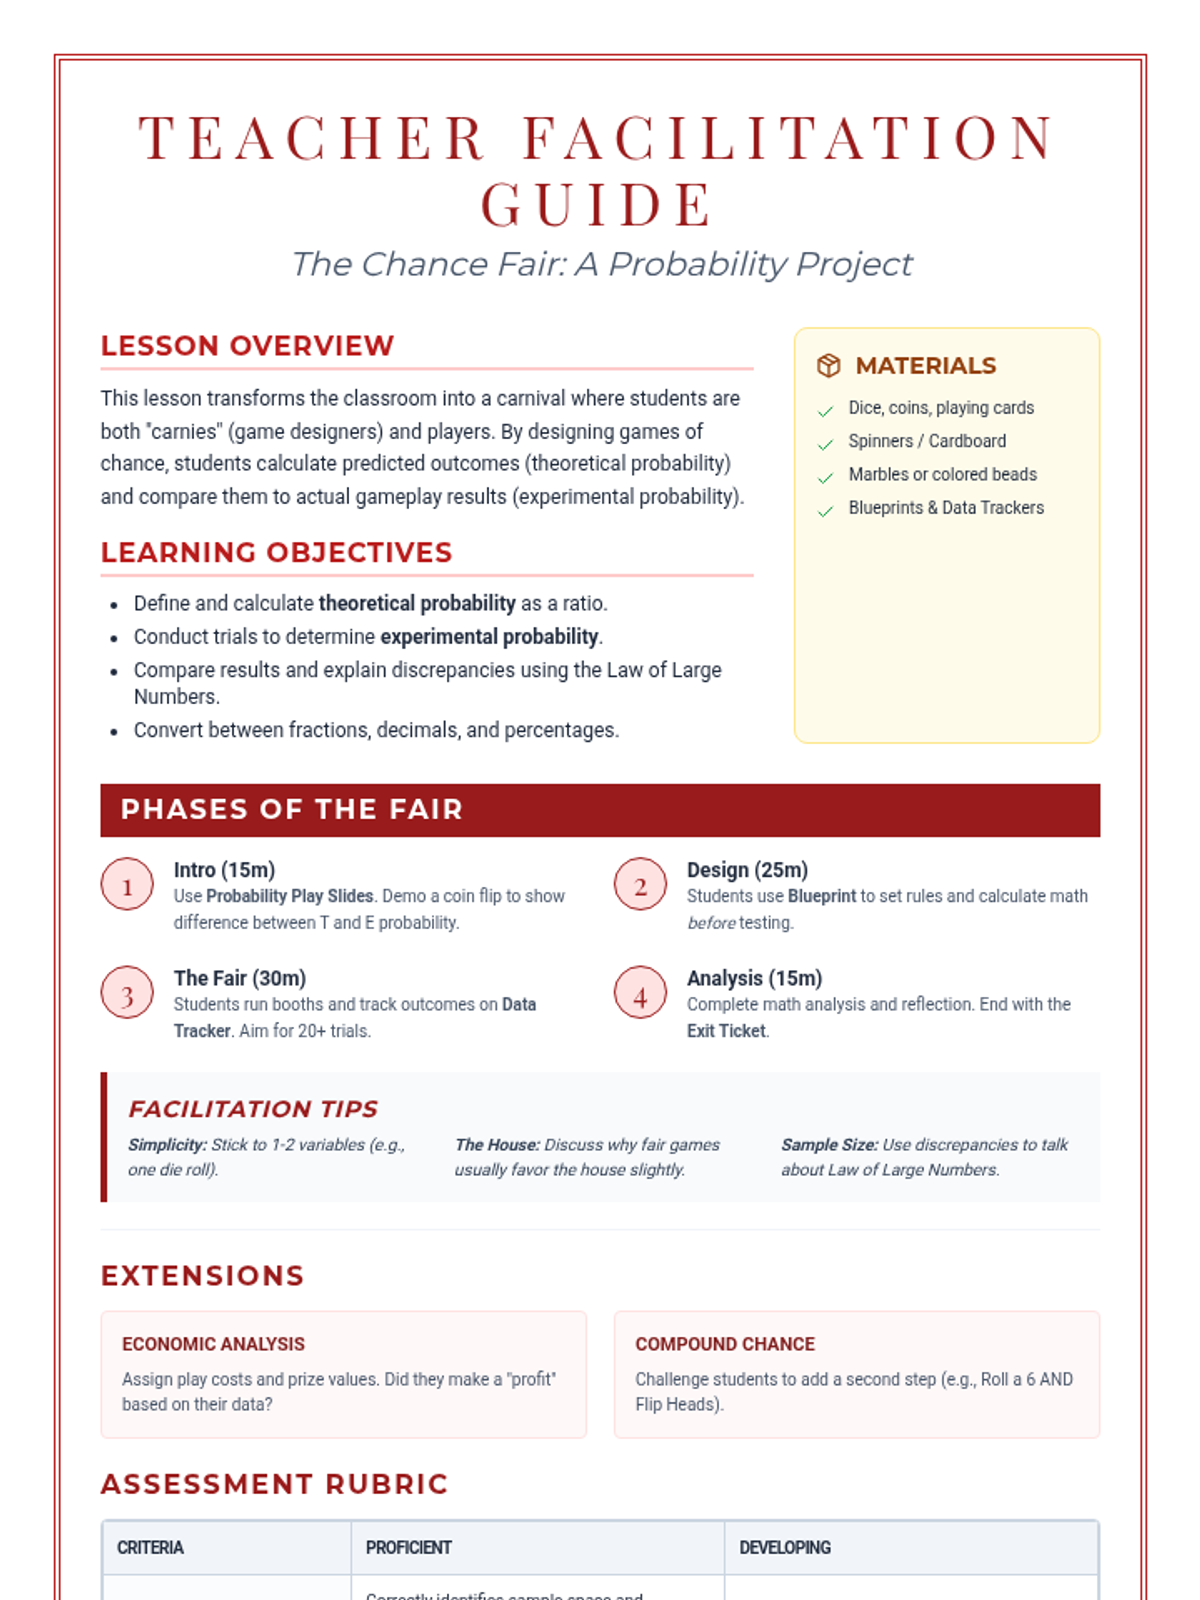
A comprehensive teacher facilitation guide for the Chance Fair project, including learning objectives, materials list, and a step-by-step instructional sequence.
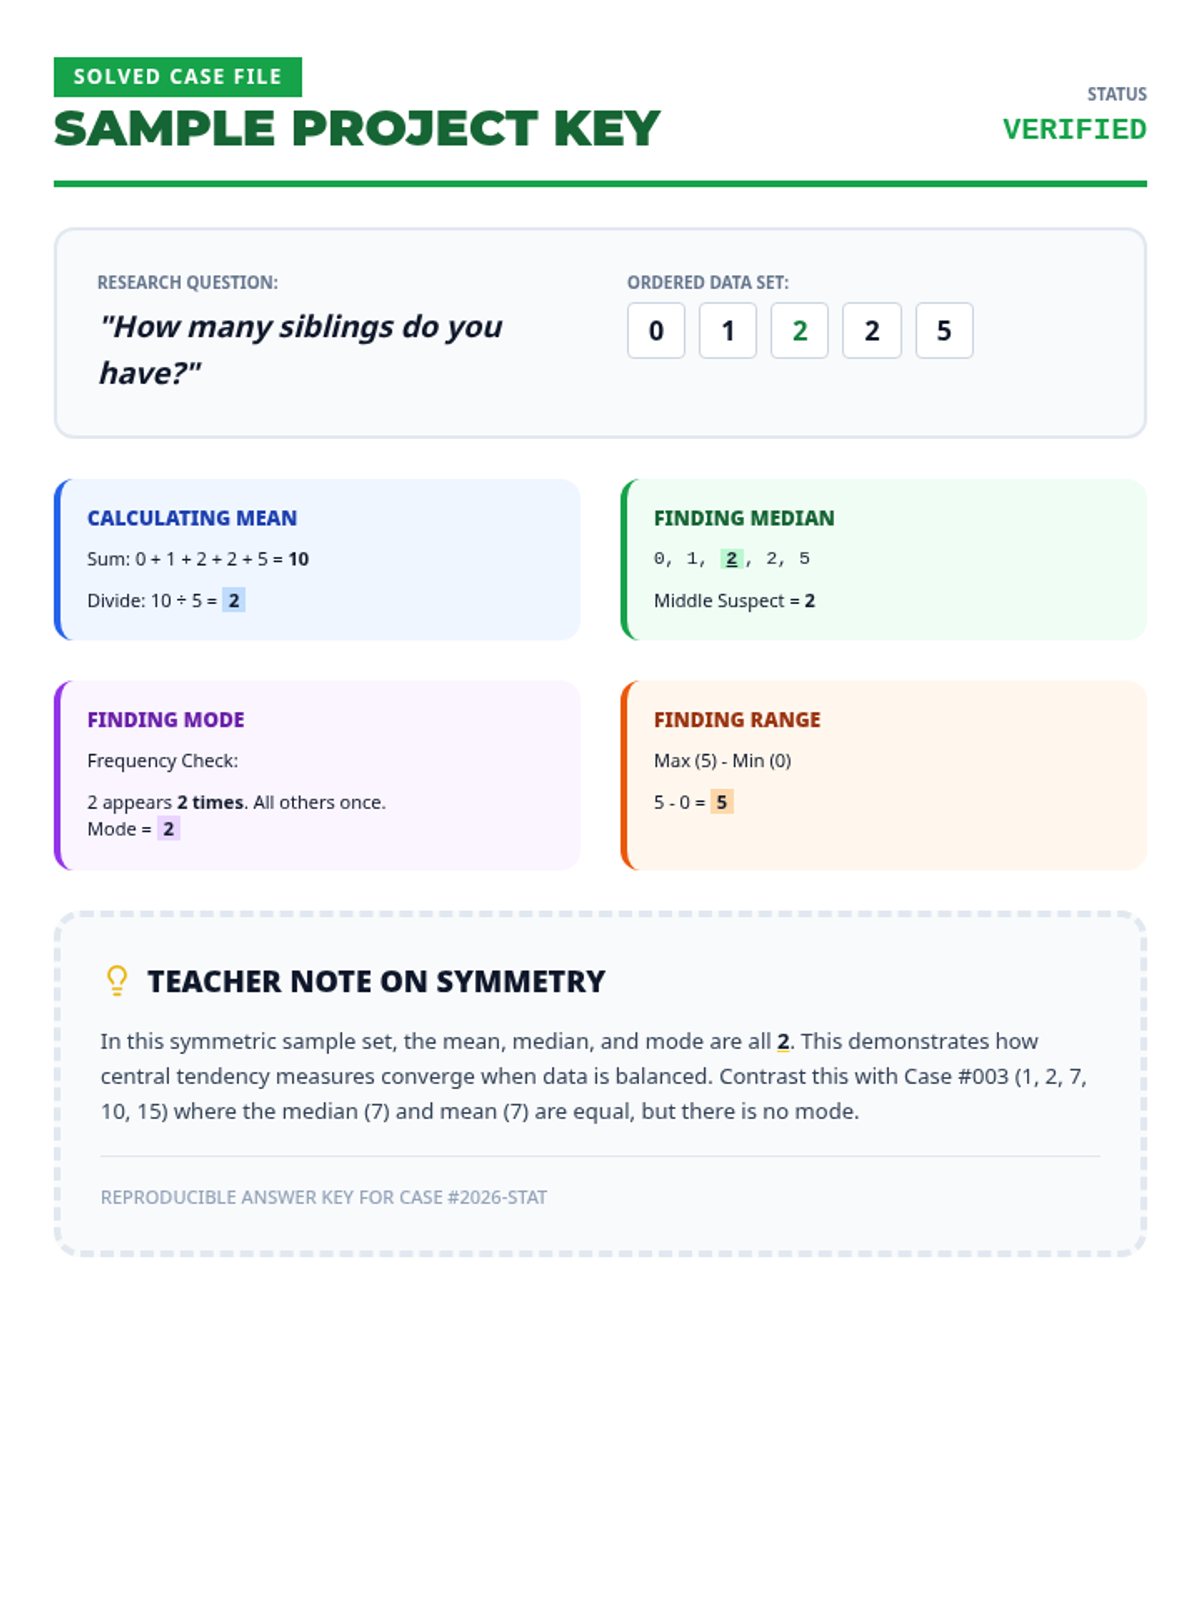
A sample answer key and example project overview showing calculations for Mean, Median, Mode, and Range based on a set of 5 numbers ('siblings' survey). Includes step-by-step reasoning for teacher reference. Unified on one page.
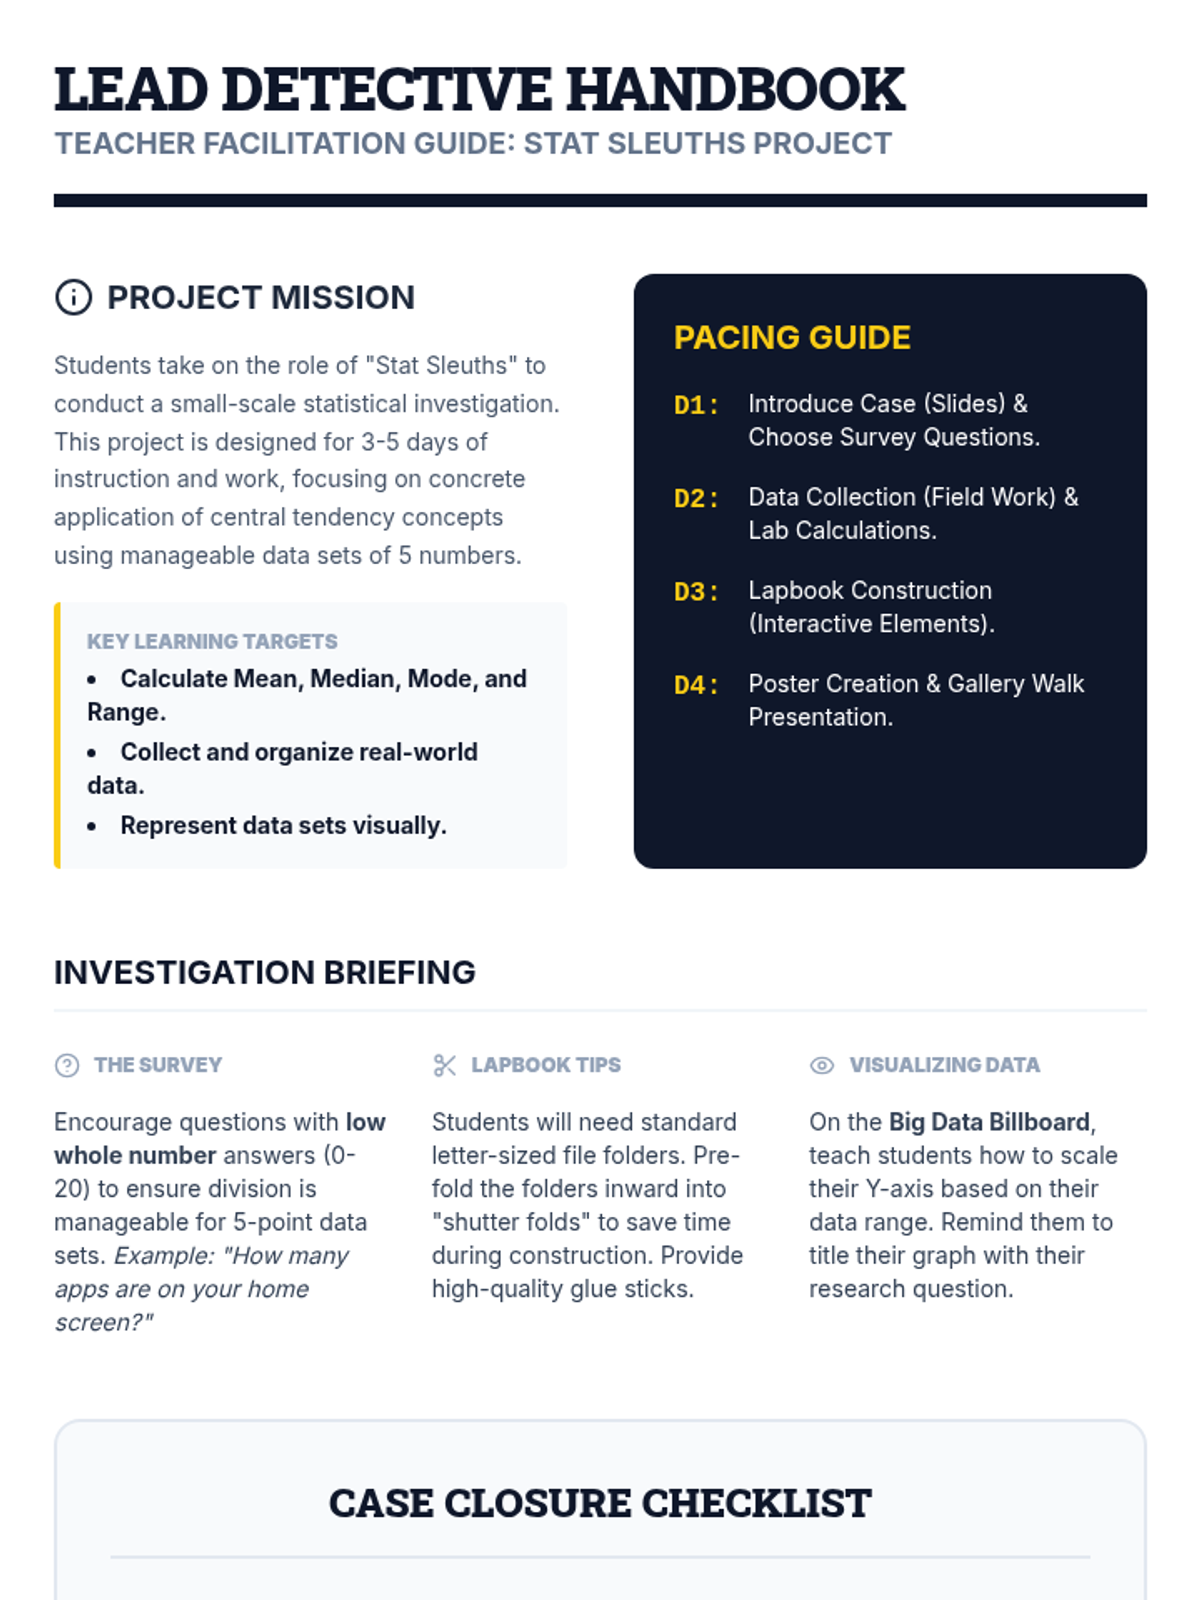
Teacher guide for the Stat Sleuths project, including pacing suggestions, implementation tips for the lapbook and poster, and an assessment checklist for evaluating student work.
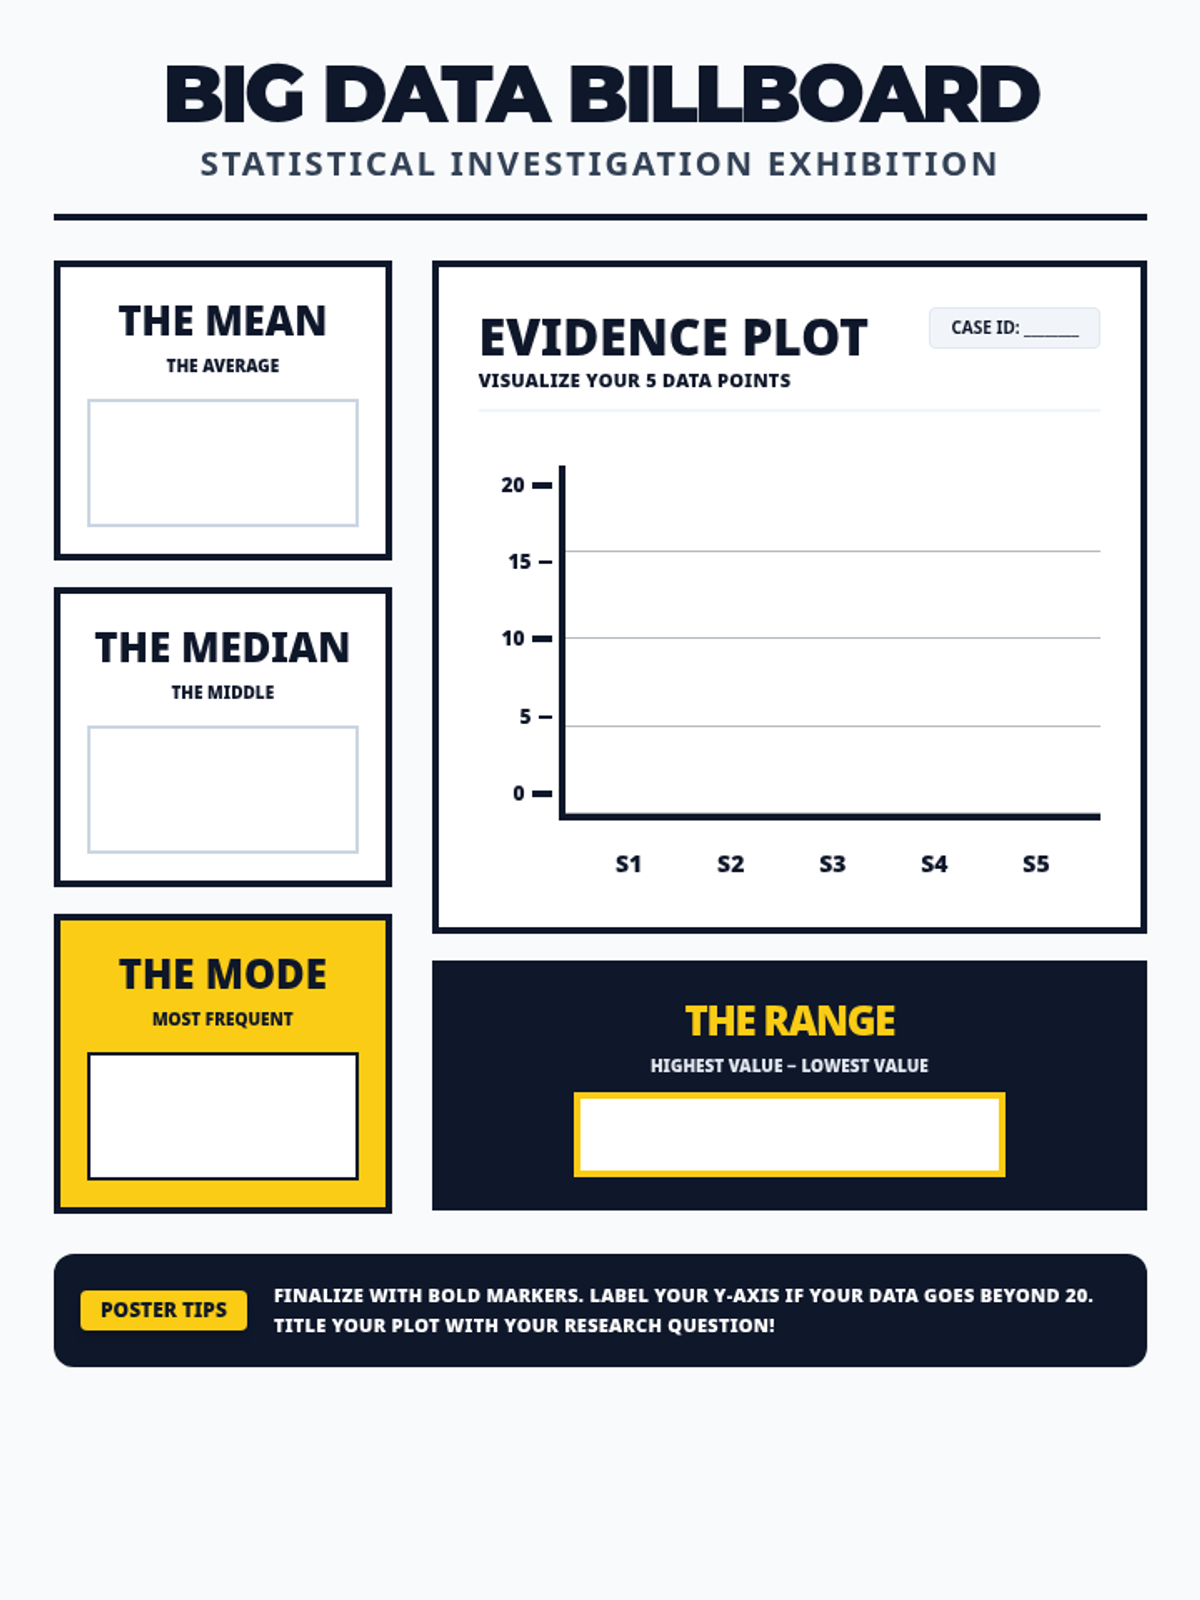
A large-scale visual template for a data collection poster. Includes dedicated zones for the central tendency calculations (Mean, Median, Mode, Range) and a visualization area for a dot plot or bar graph of the 5 data points. y-axis includes tick marks for scale.
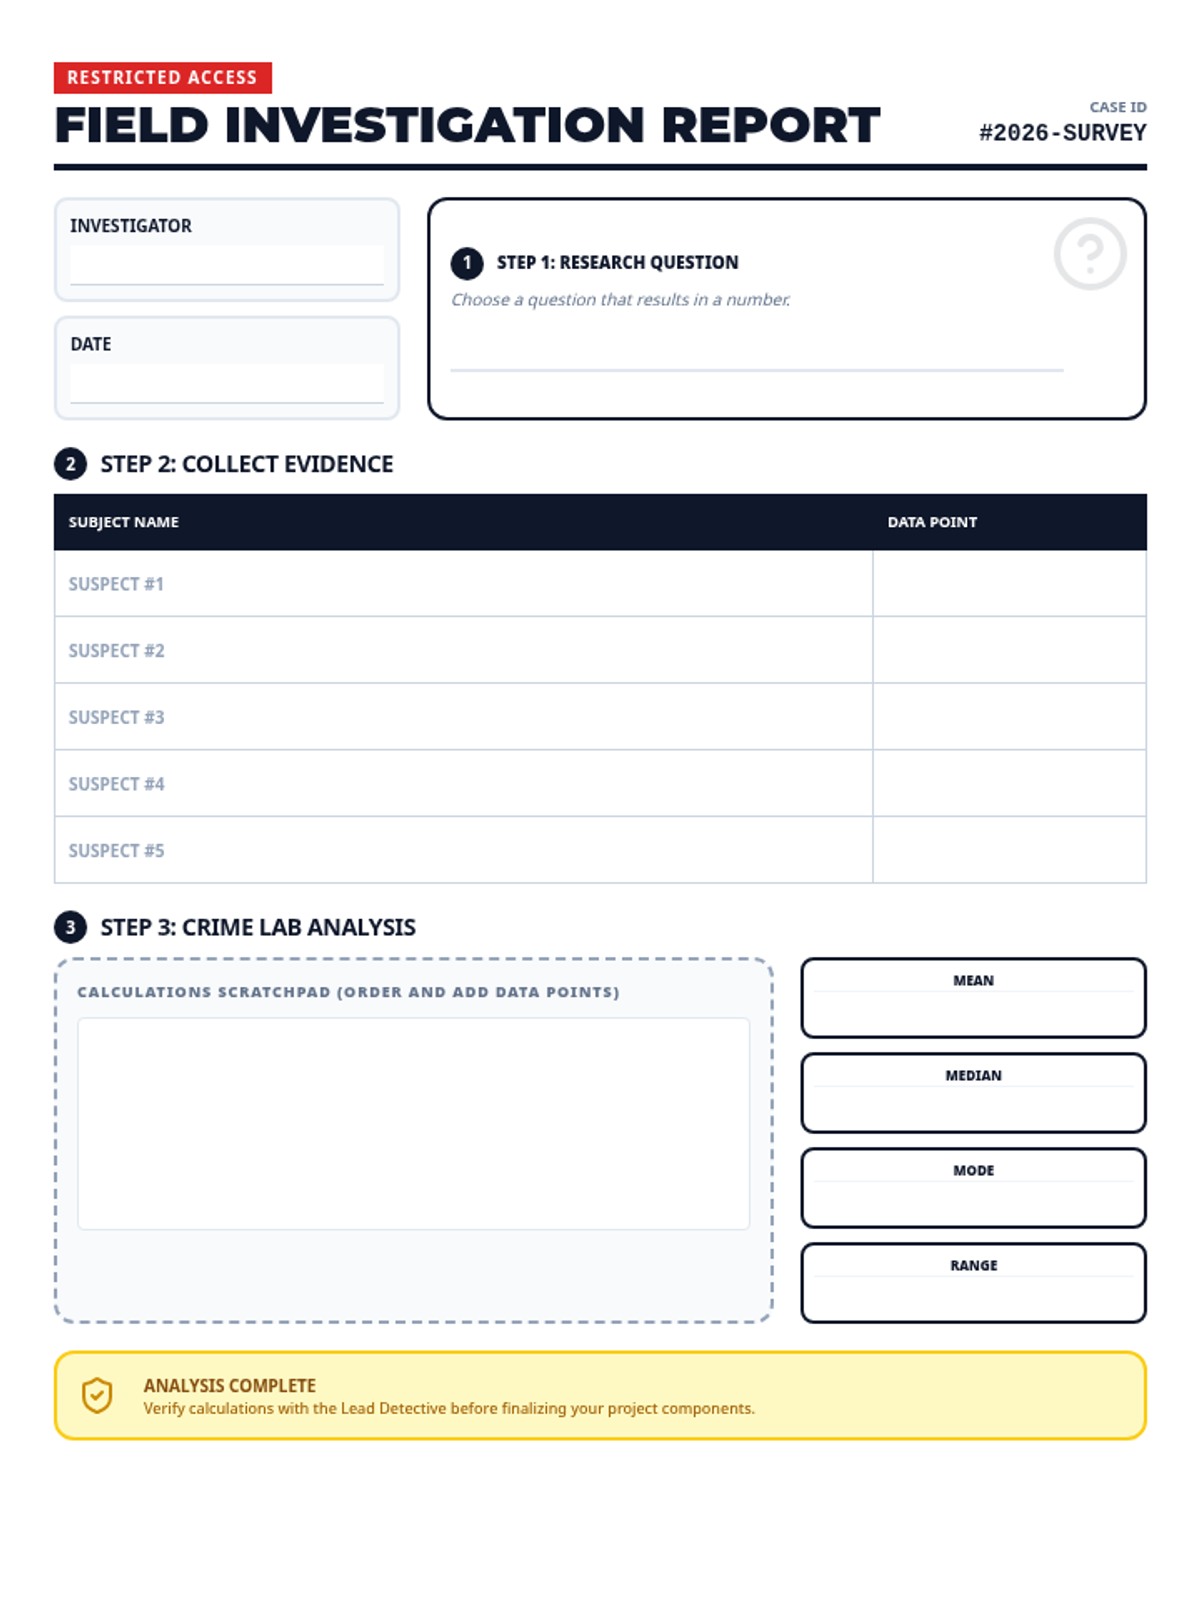
A survey recording sheet and analysis guide for a real-world statistical investigation. Students choose a question, collect 5 data points, and calculate the mean, median, mode, and range. Includes a calculation scratchpad for organizing data.
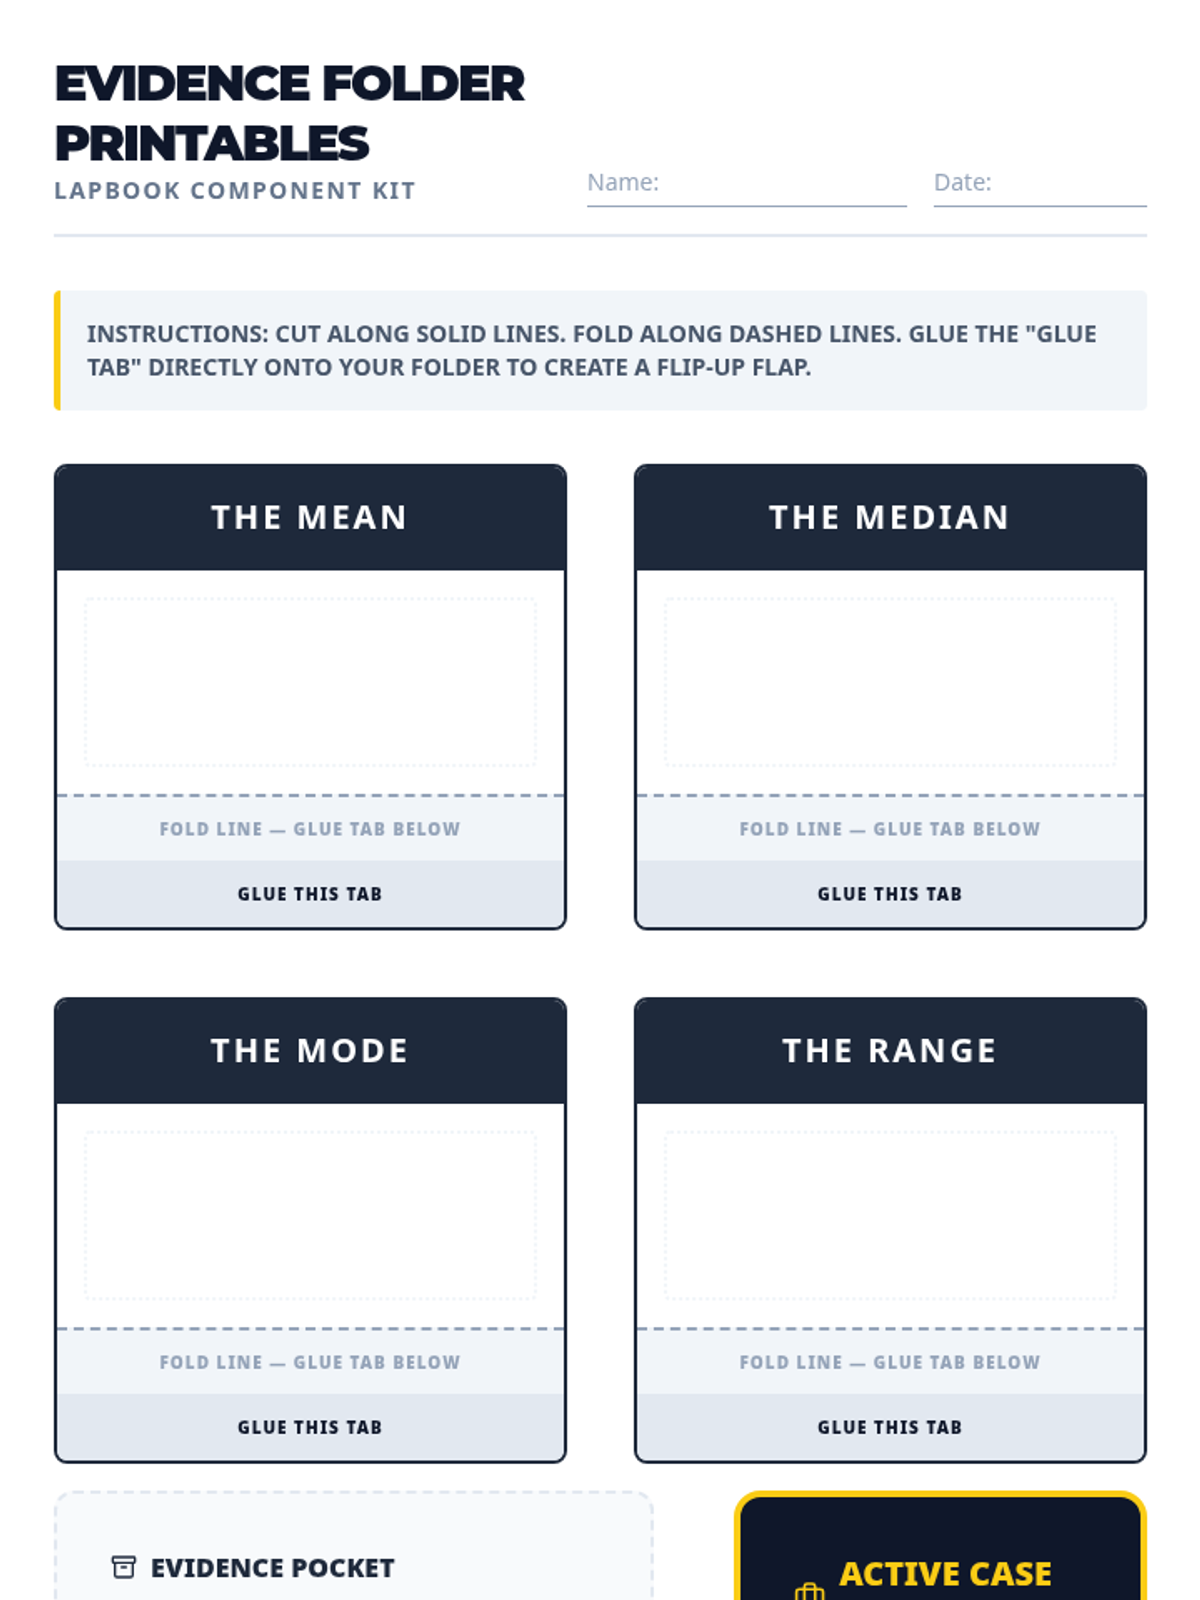
Printable components for an interactive lapbook, including definition flip-flaps for Mean, Median, Mode, and Range, a 'data pocket' for evidence storage, and decorative investigation-themed labels. Now includes sample sets of 5 simple numbers.
An introductory slide deck for the Stat Sleuths project, defining Mean, Median, Mode, and Range using a detective-themed investigation aesthetic. Includes examples with 5-number data sets.
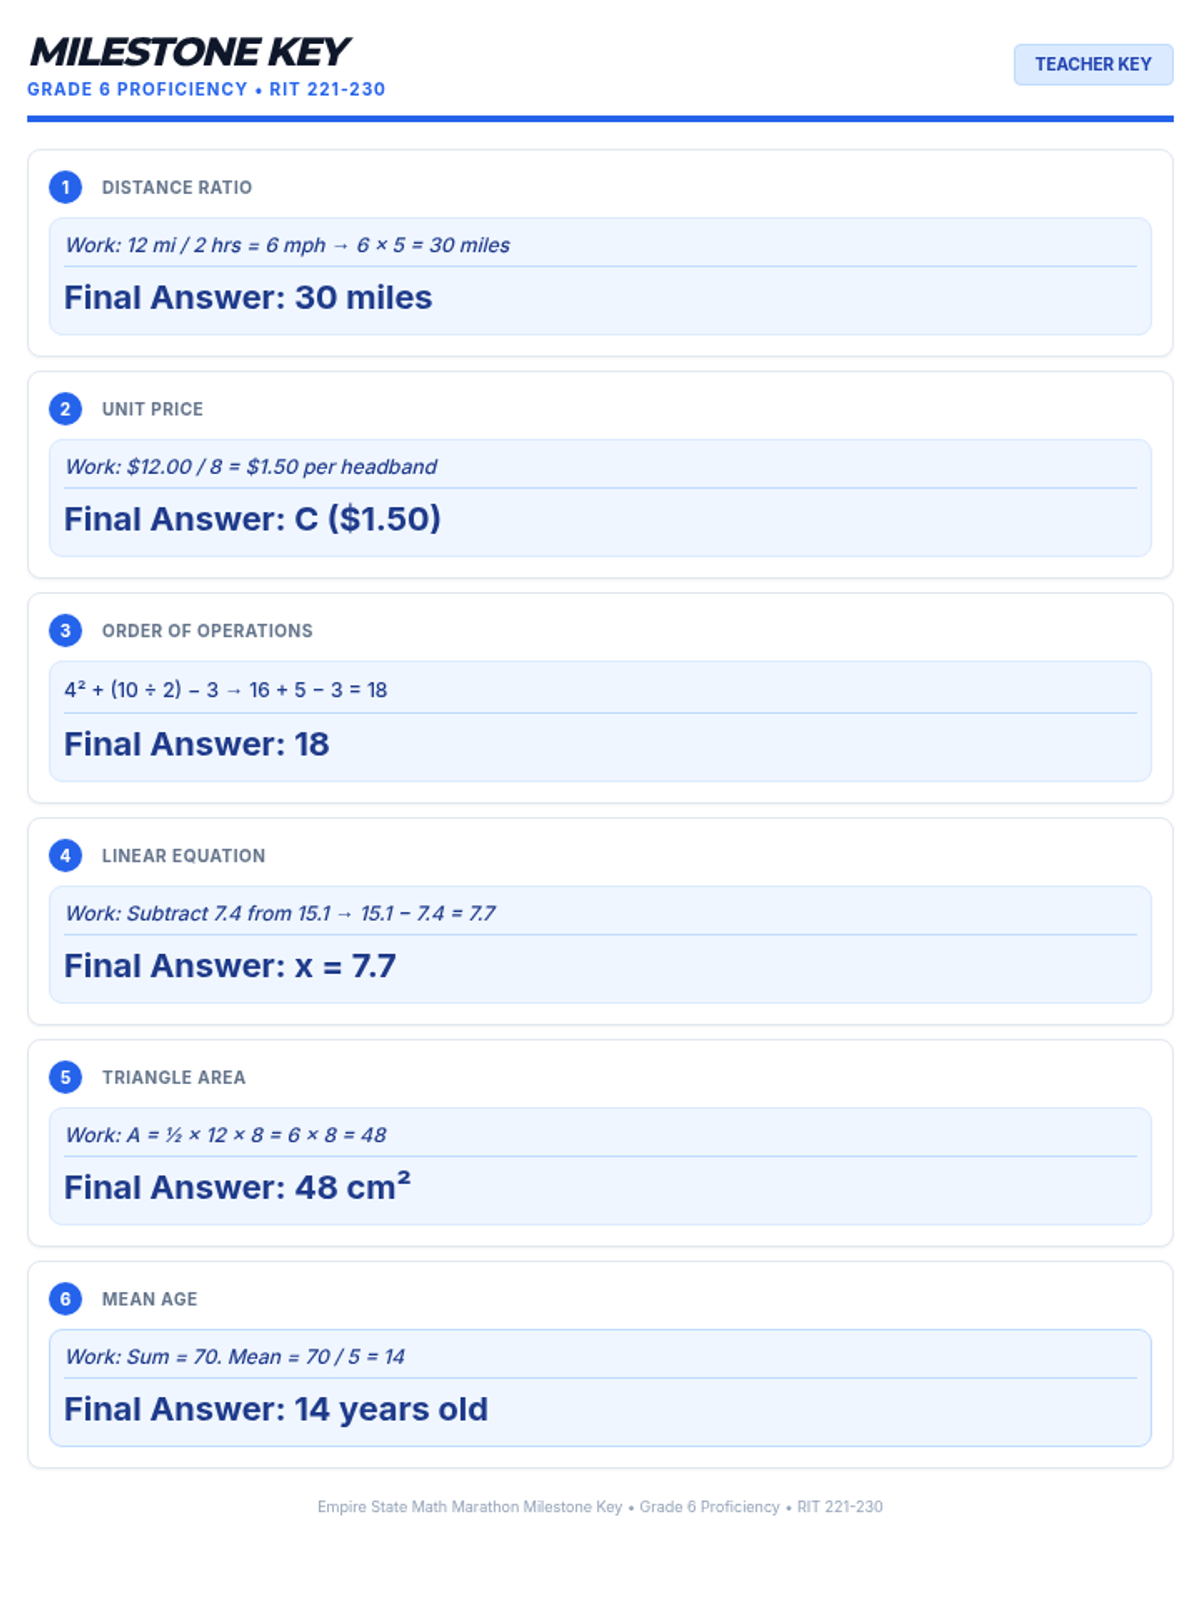
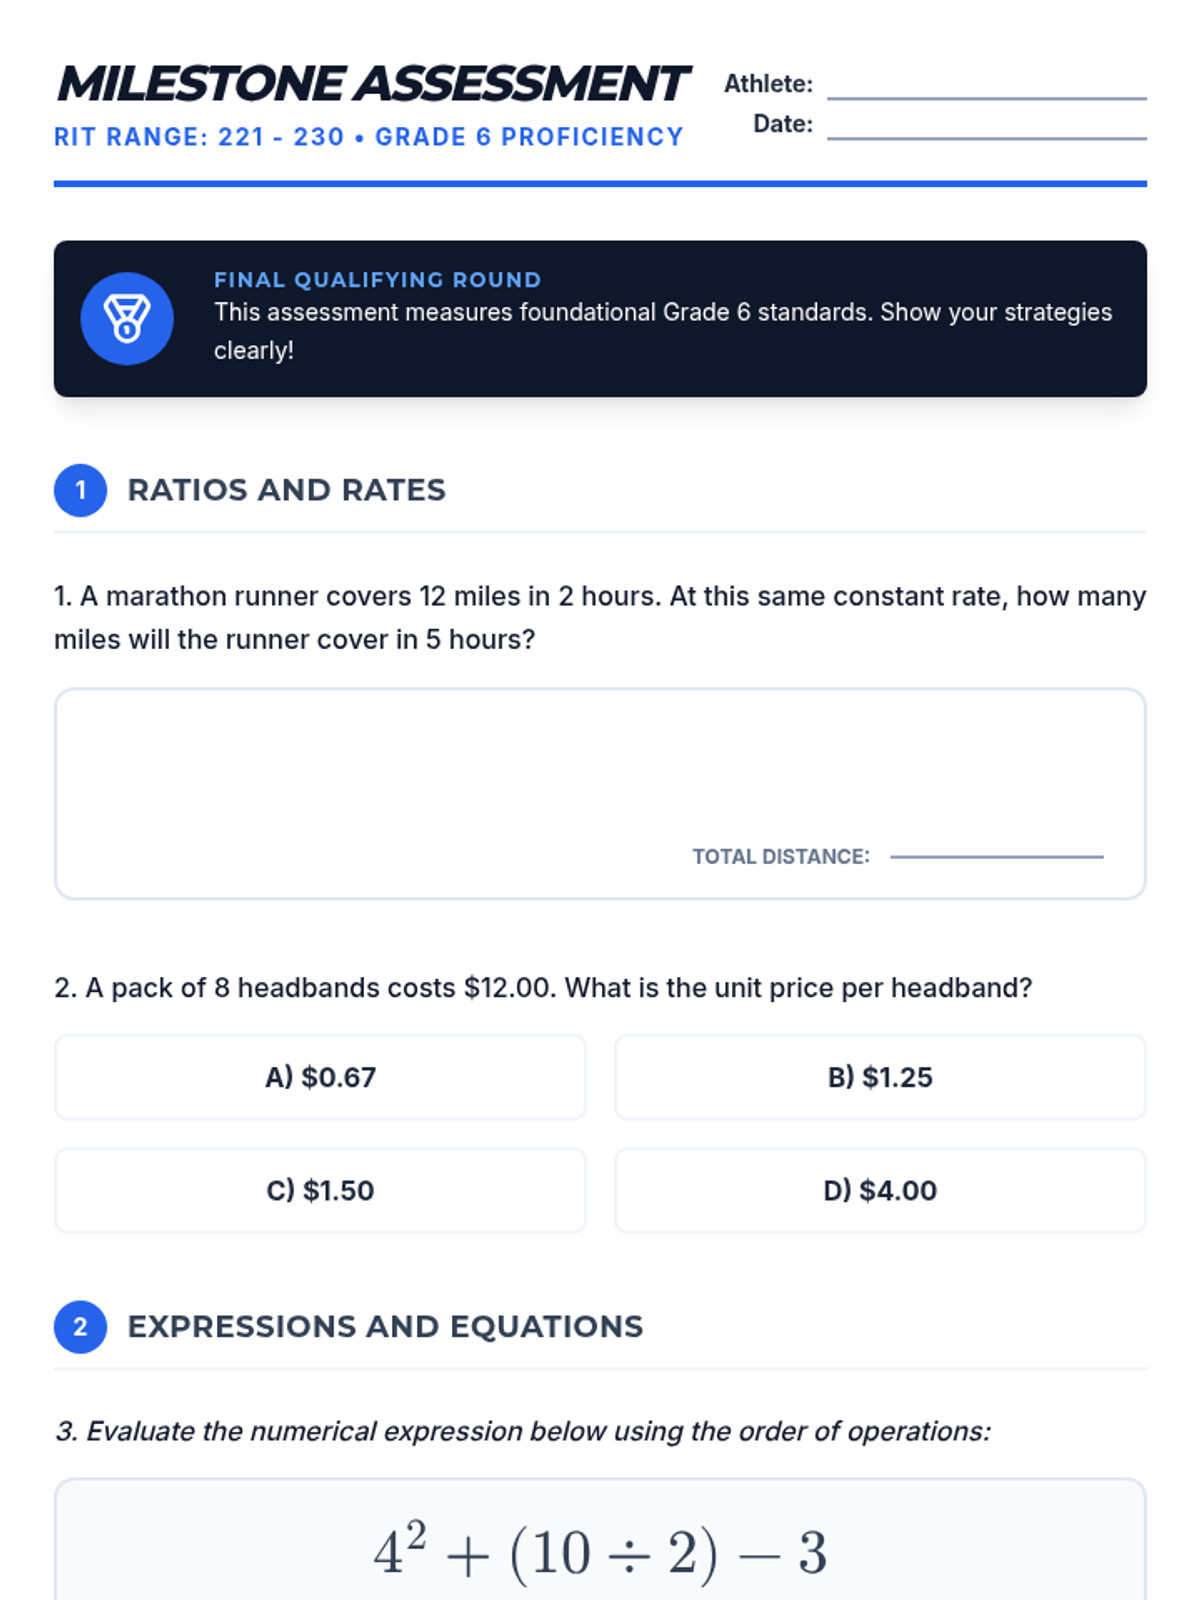
Revised 1-page answer key for the Milestone Assessment. Standardized all layouts to a stacked vertical format with border dividers. Standardized the 'Final Answer' format to text-xl across all six problems and tightened spacing to ensure all content fits on one sheet. Improved math entity rendering.
Revised Milestone Assessment with fixed page breaks (Question 3 kept together). Improved work area labels with higher contrast and better alignment. SVG for triangle area adjusted for perfect visibility. Removed decorative artifacts from work areas.
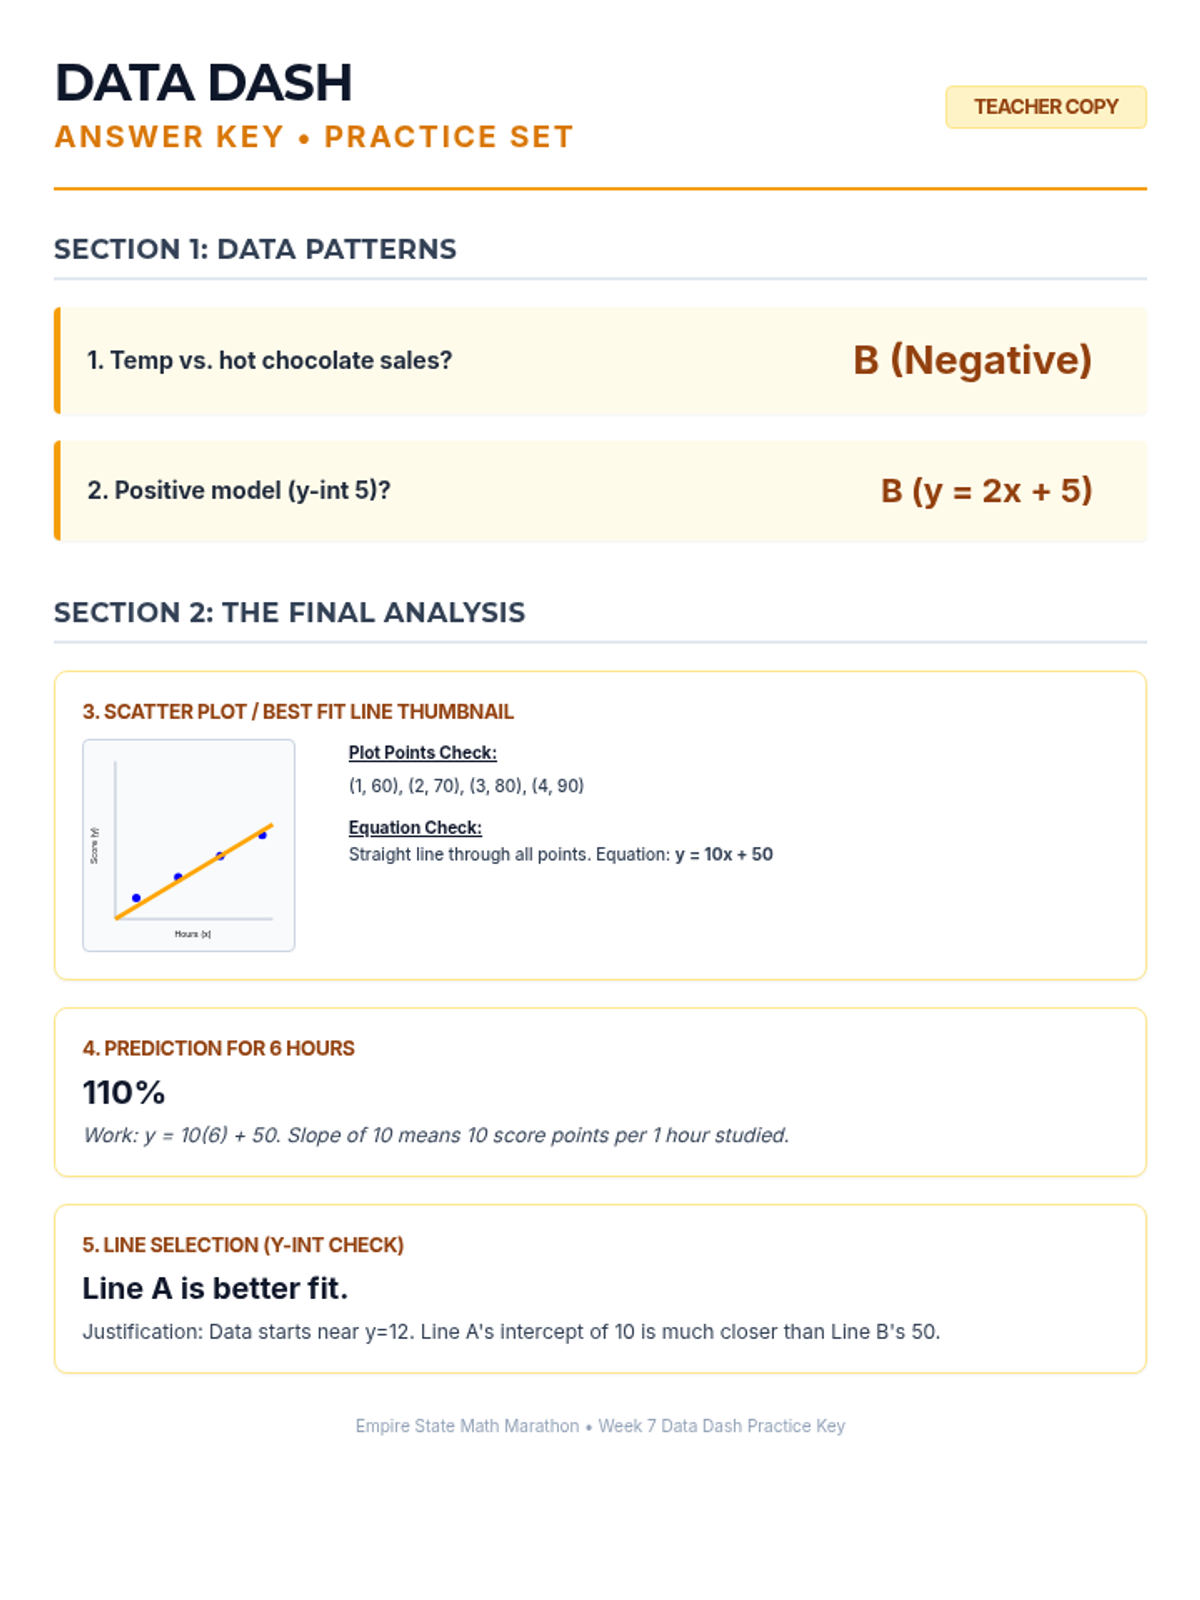
Revised 1-page answer key for Week 7 practice set. Added x/y axis labels to graph thumbnail, consolidated all content onto a single page to avoid orphaned text, and improved math rendering clarity. Badge alignment fixed.
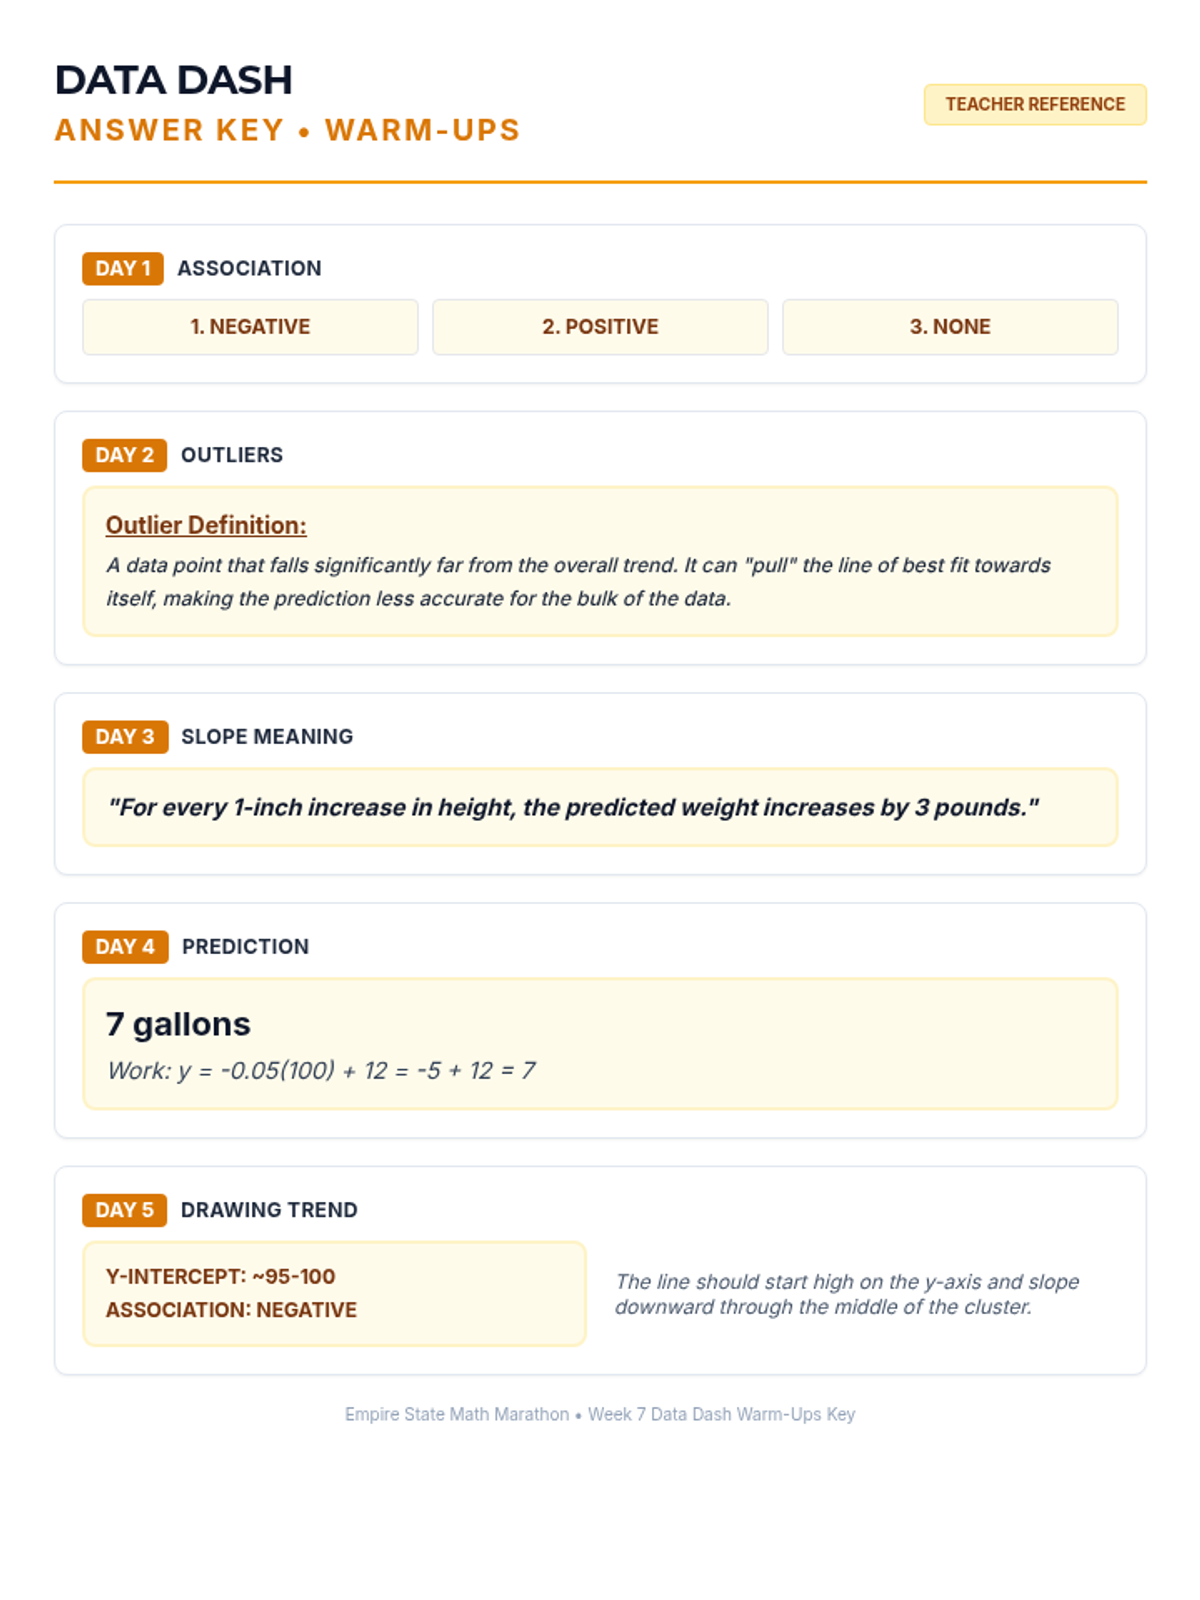
Revised 1-page answer key for Week 7 warm-ups. Standardized capitalization for mathematical terms, increased font size for calculations, and ensured all 5 days fit on one sheet with improved text contrast.
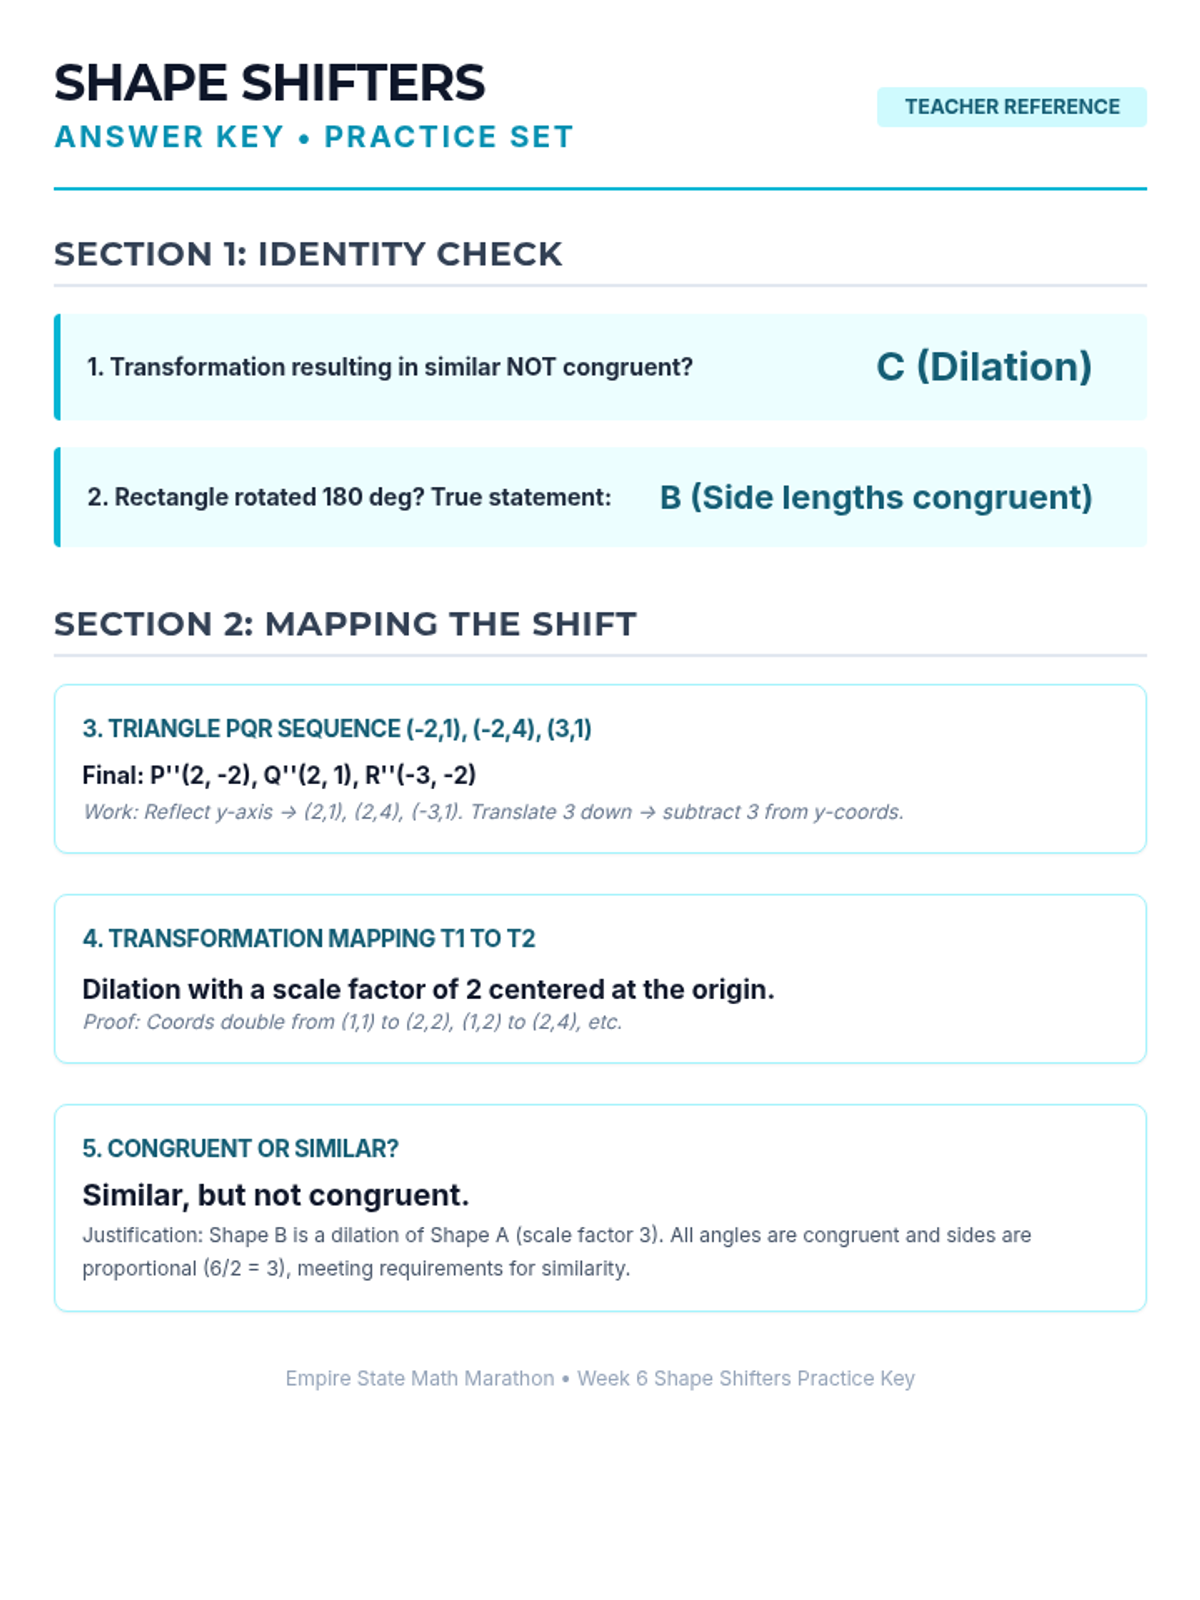
Revised 1-page answer key for Week 6 practice set. Consolidated all solutions onto a single page to avoid wasted space. Improved math notation and provided coordinate proofs for similarity vs. congruence.
Revised 1-page answer key for Week 6 warm-ups. Standardized text for coordinate transformations to ensure clear PDF rendering and consolidated all 5 days onto a single page efficiently. Improved badge alignment.
Revised 1-page answer key for Week 5 practice set. Improved math notation and increased font size for supporting work sections. Fixed bunched text spacing in the final comparison statement and ensured units are consistent.
Revised 1-page answer key for Week 5 warm-ups. Standardized math symbols (HTML entities) to ensure PDF rendering, consolidated all content to fit on a single page, and cleaned up calculation strings. Improved Teacher Reference badge alignment.
Revised 1-page answer key for Week 4 practice set. Consolidated layout to avoid orphaned items on a second page, increased work text size, and provided clear justifications for radical estimation.
Revised 1-page answer key for Week 4 warm-ups. Replaced special font glyphs with standard HTML superscripts (<sup>) to ensure cross-system rendering. Increased Teacher Reference badge size and consolidated layout to a single page.
Revised 1-page answer key for Week 3 practice set. Removed raw markdown symbols, consolidated layout to one page, and improved math rendering clarity by avoiding overlapping LaTeX. Darkened work text for better readability.
Revised 1-page answer key for Week 3 warm-ups. Standardized header utility classes for consistent visual presentation across days and consolidated all content onto a single page to avoid orphaned elements. Improved math clarity.
Revised 1-page answer key for Week 2 practice set. Fixed raw markdown artifacts in the graphing checklist and adjusted Teacher Reference badge alignment. Improved graph thumbnail accuracy.
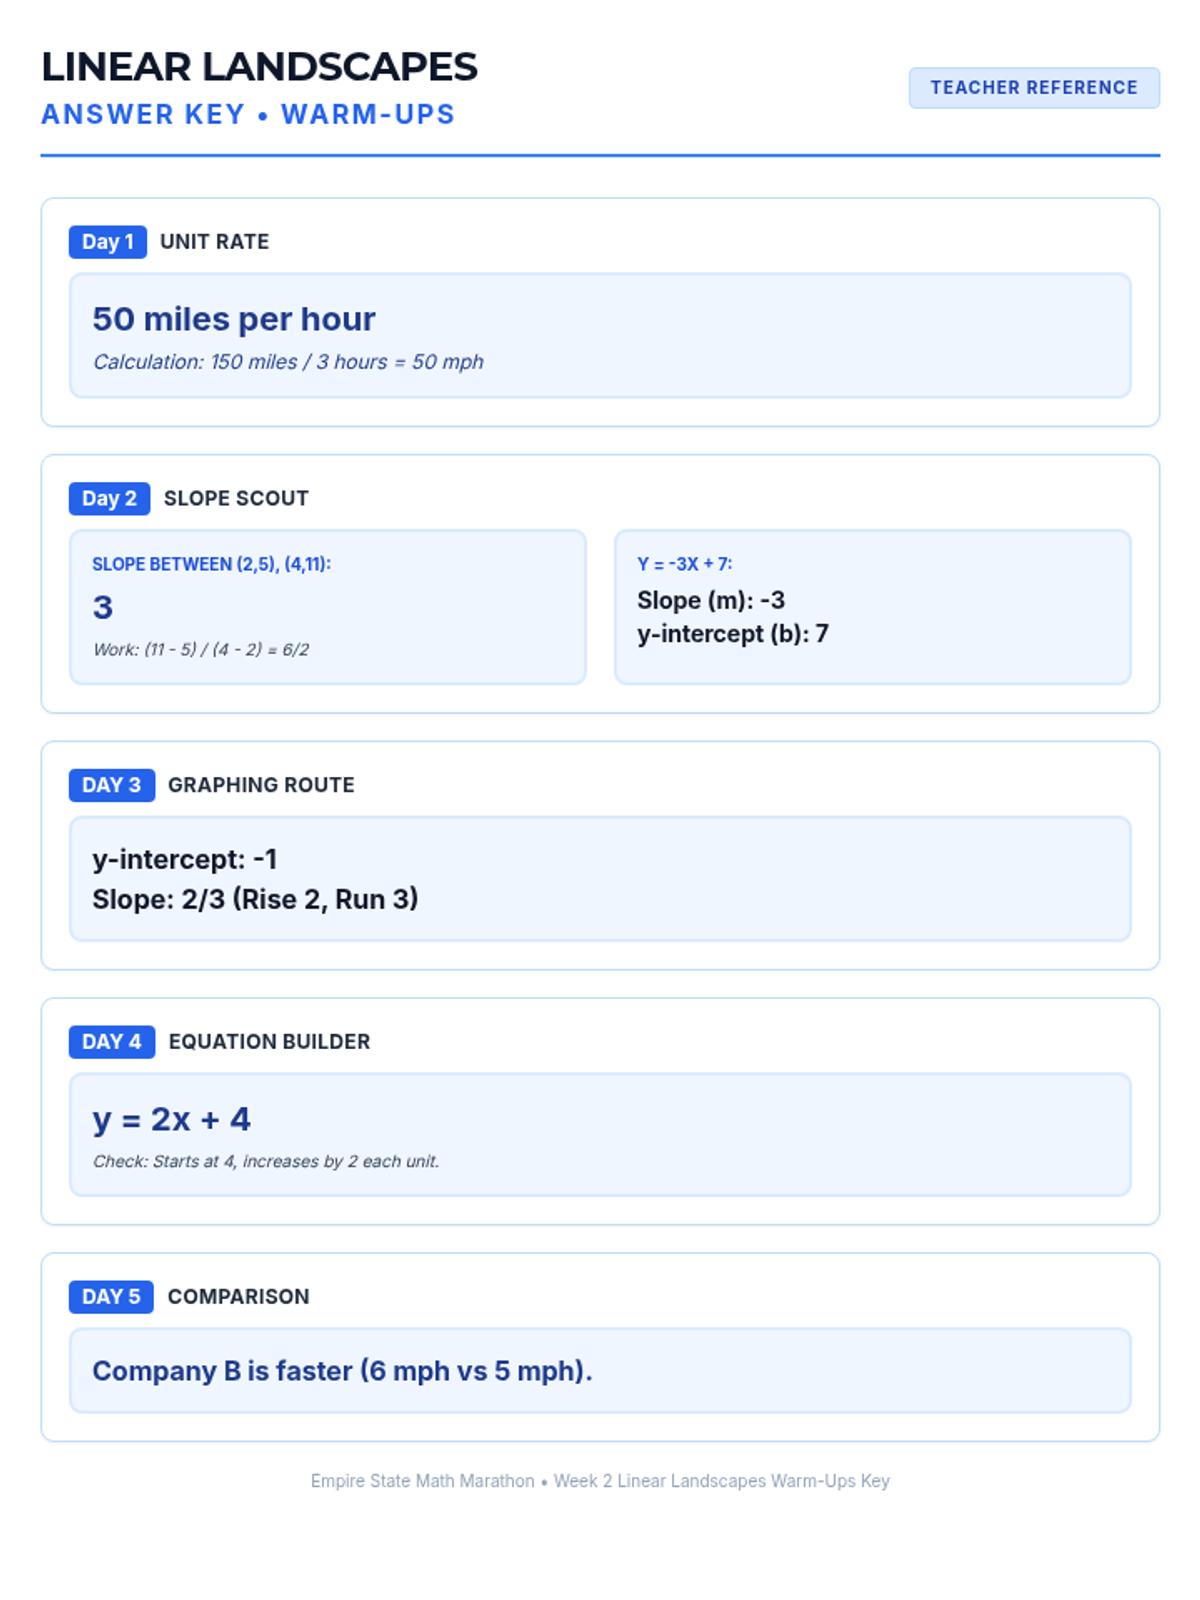
Revised 1-page answer key for Week 2 warm-ups. Standardized text sizes to fix rendering issues and consolidated layout to fit all content on a single page efficiently. Improved text contrast for teacher readability.
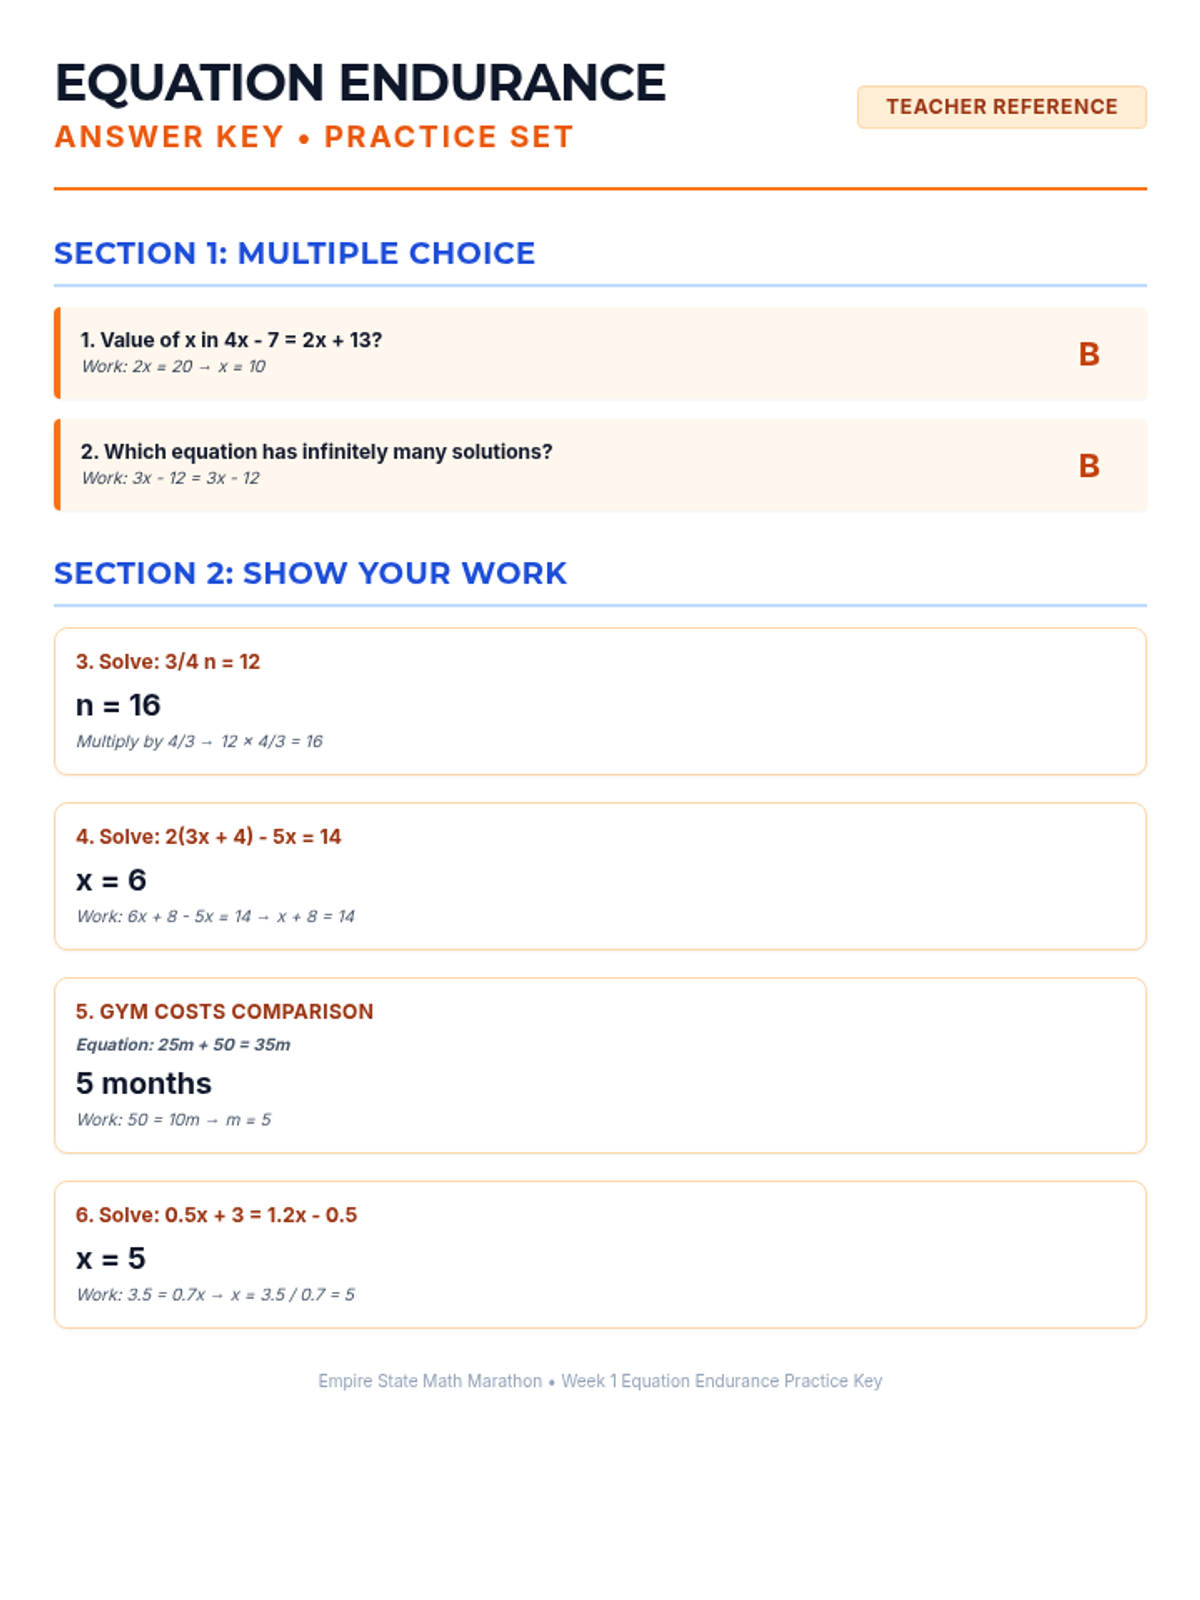
Revised 1-page answer key for Week 1 practice set. Consolidated all problems onto one page, standardized variable casing for consistency, and improved spacing to avoid orphaned footers.
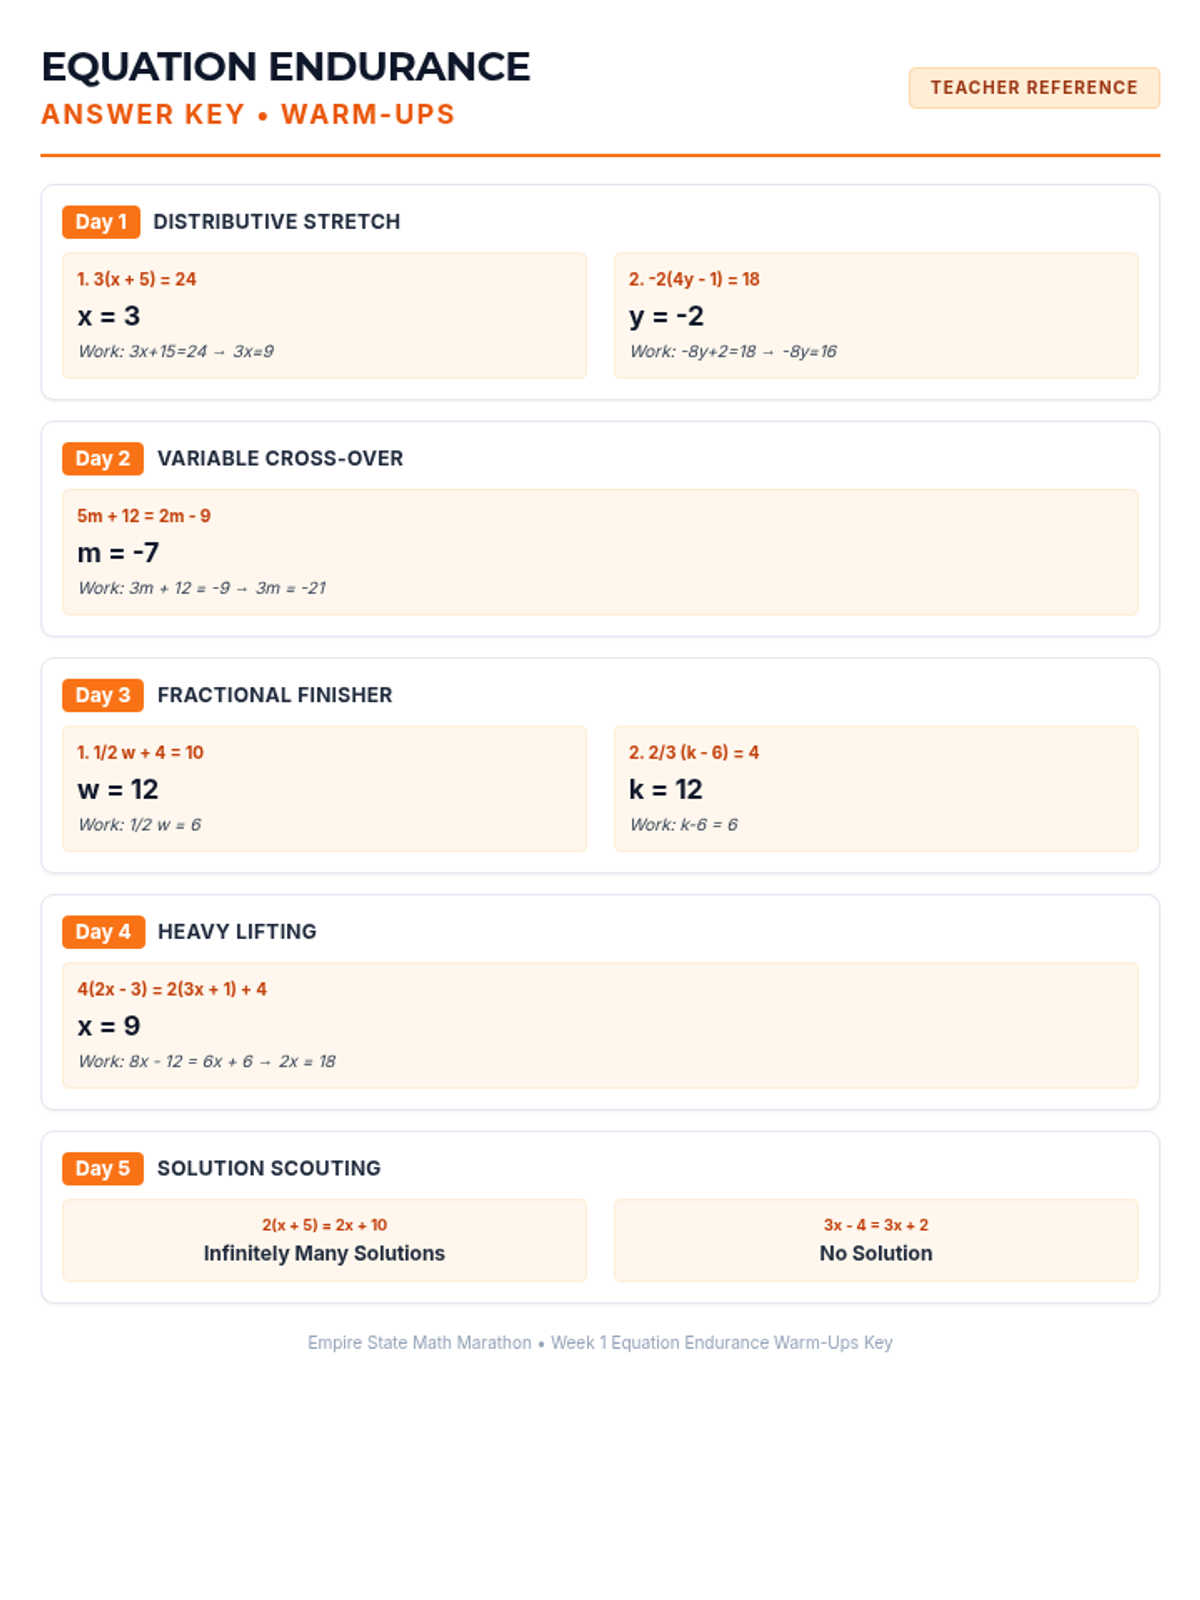
Revised 1-page answer key for Week 1 warm-ups. Consolidated content to fit all 5 days on a single page efficiently, fixing the orphaned Day 5 issue. Improved math clarity and text contrast.
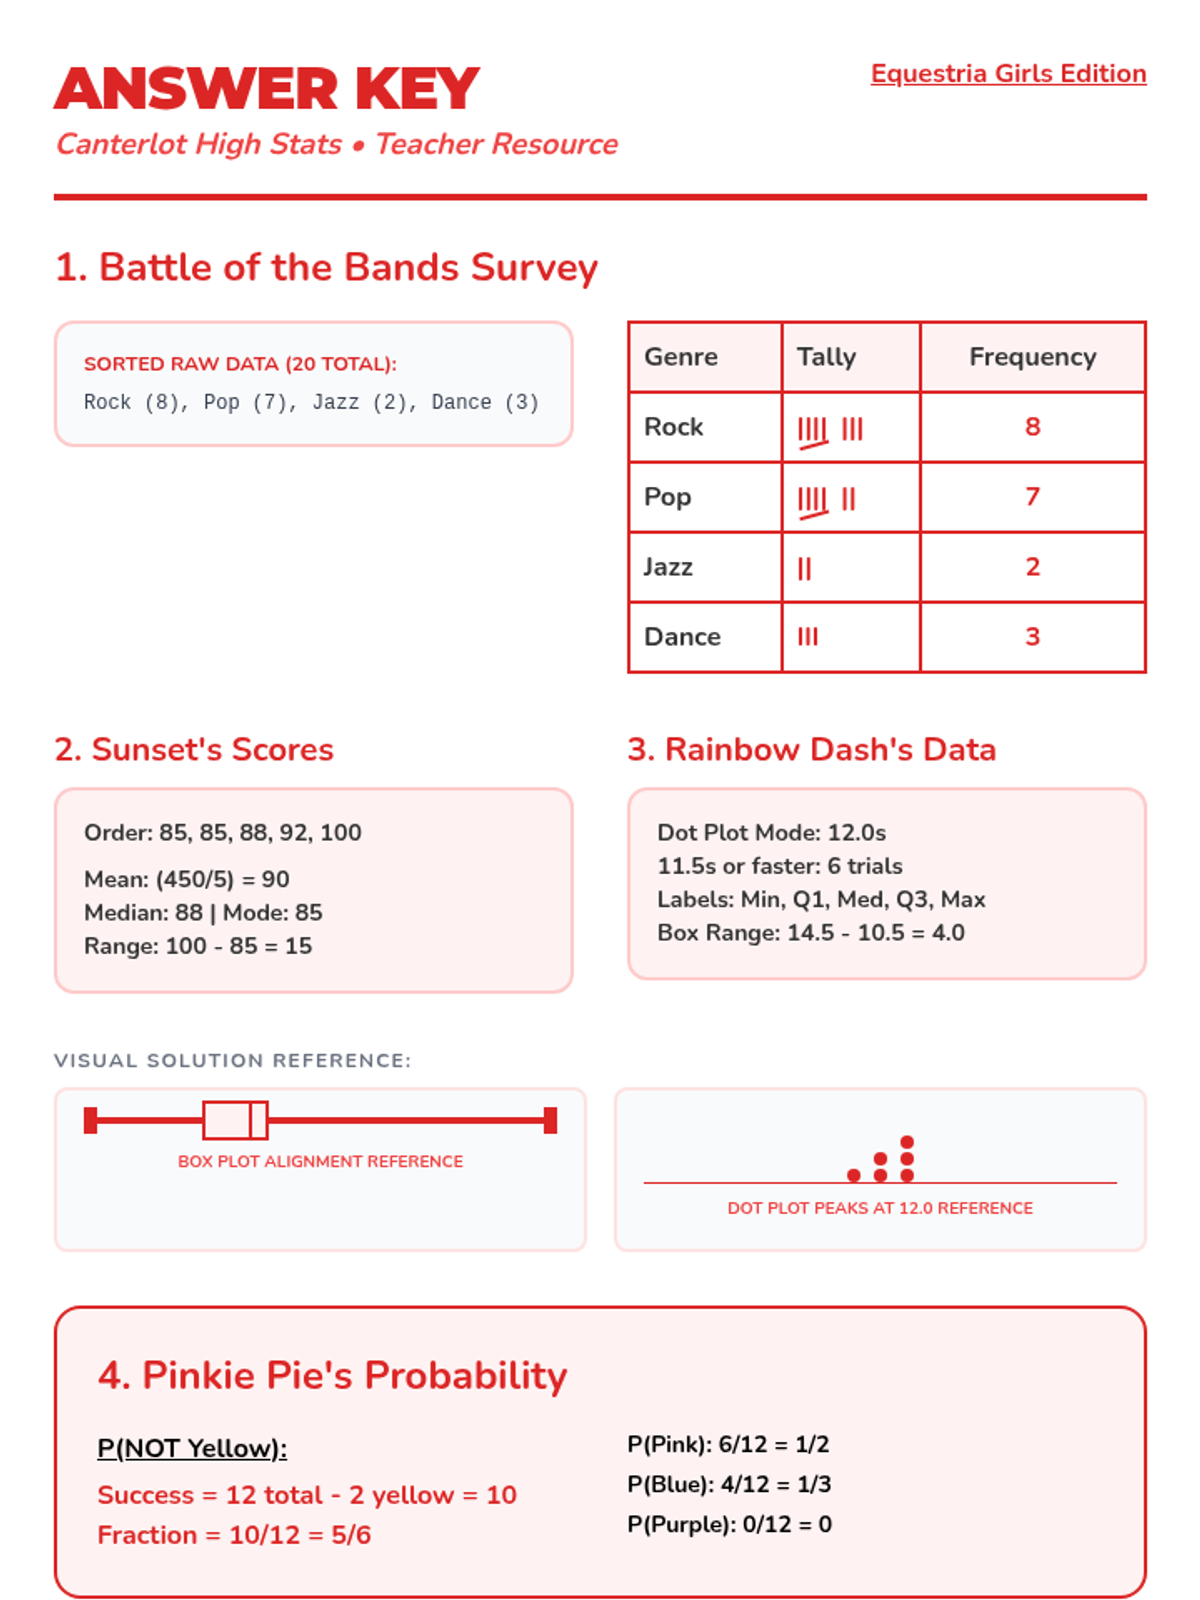
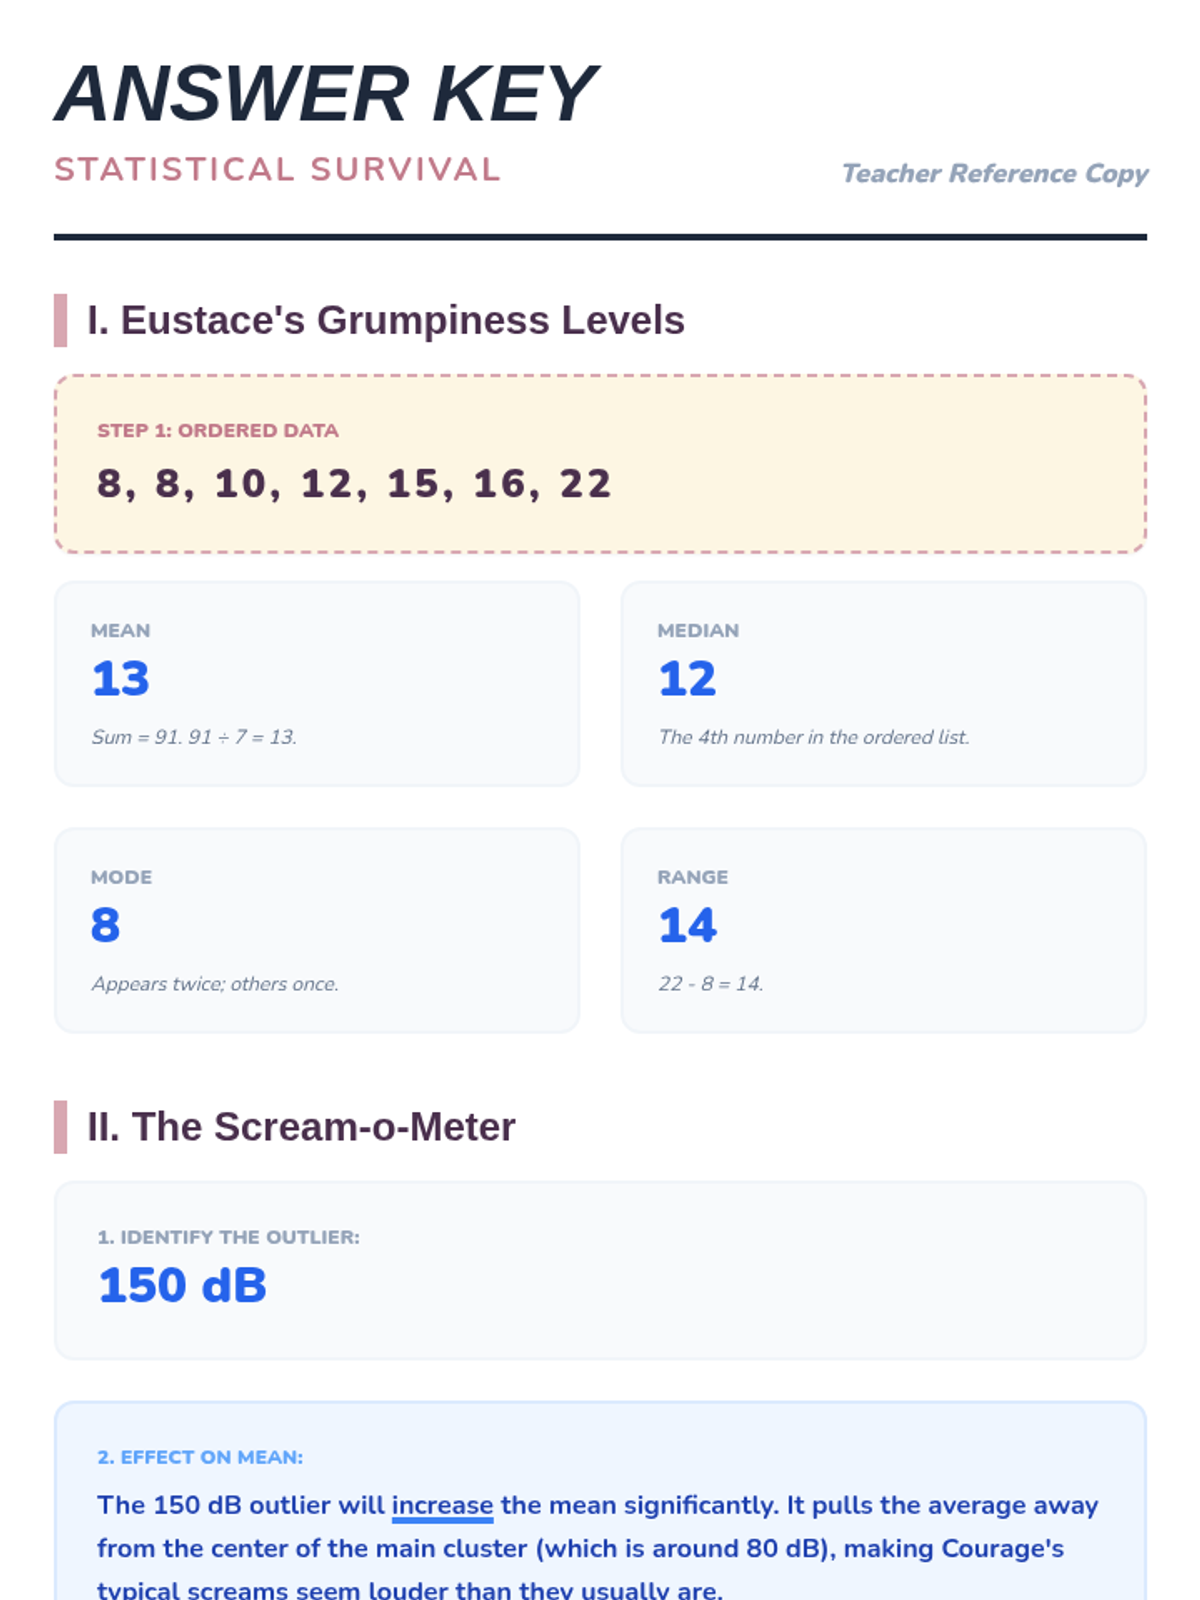
Revised teacher's answer key for the Canterlot High Stats Worksheet. Corrected mathematical frequencies, updated box plot labeling answers, and improved section layout for better page-break balancing.
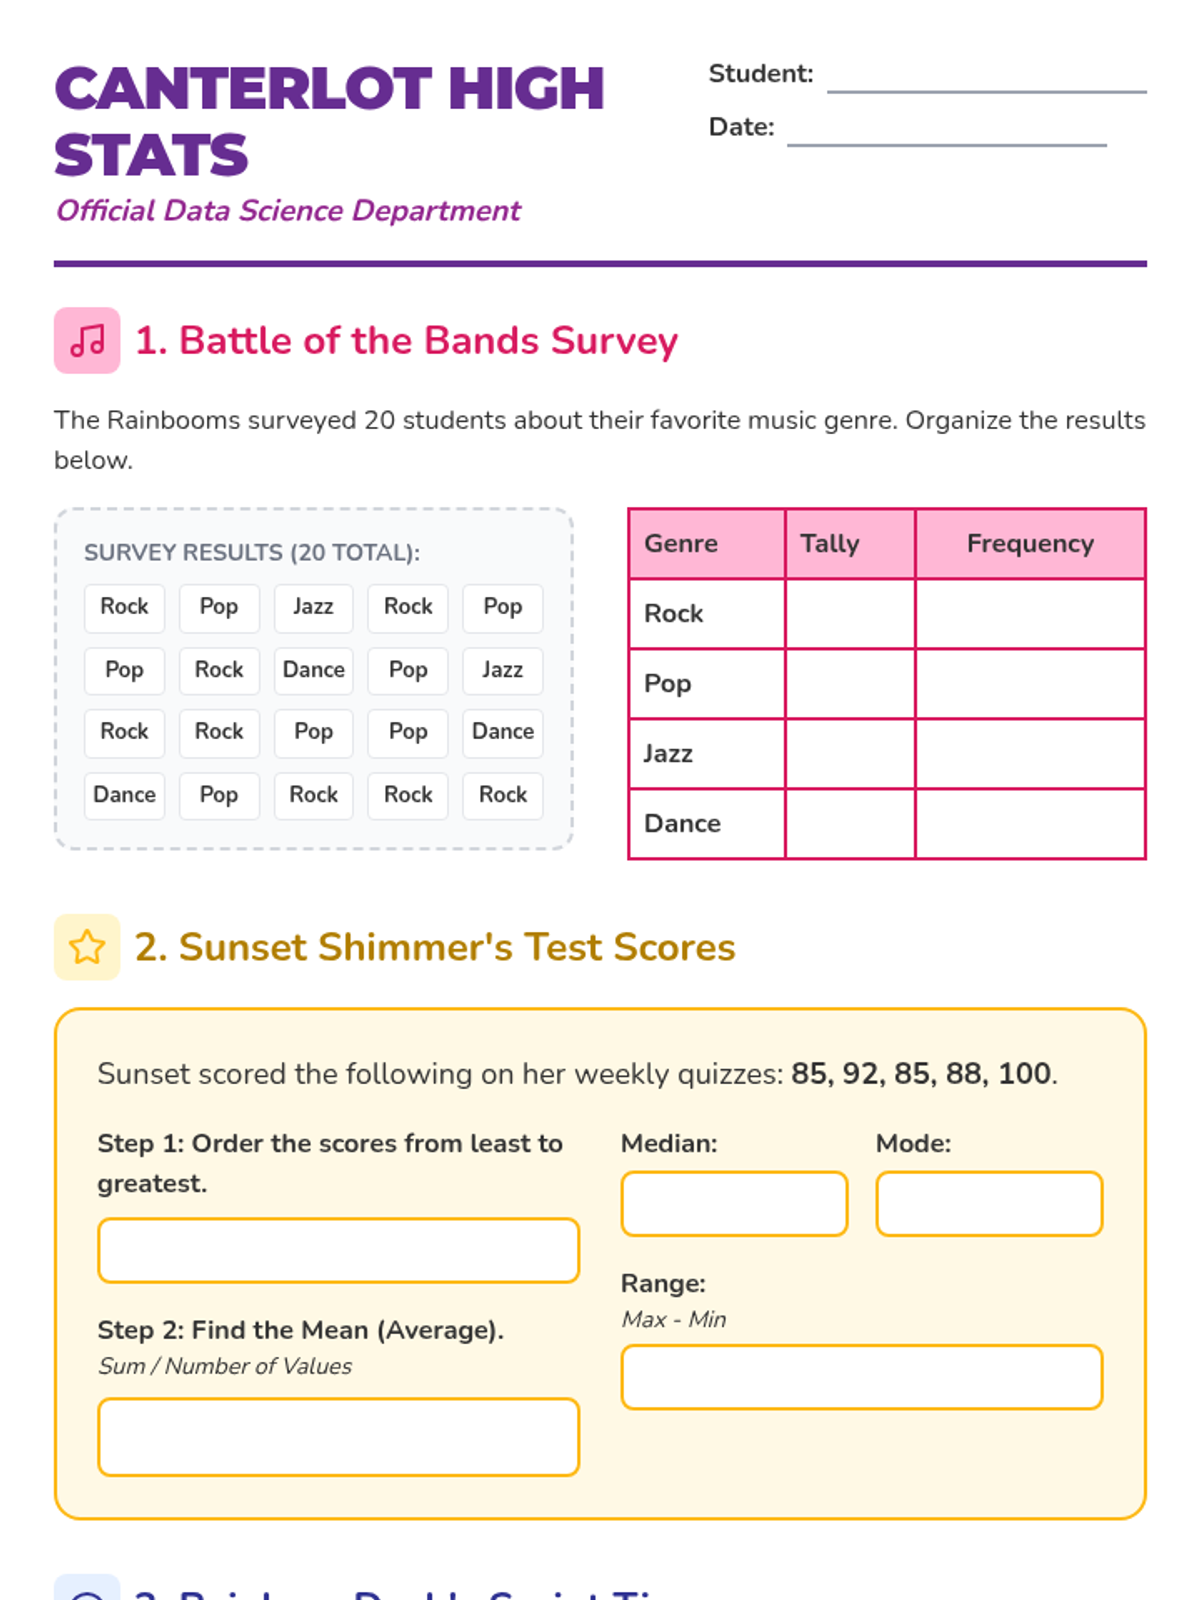
A comprehensive statistics worksheet for high school freshmen, featuring Equestria Girls themed data analysis. Revised to fix page breaks, clarify box plot labeling, and improve visual contrast.
A vibrant slide deck for introducing statistics concepts like mean, median, mode, range, graphs, and probability through the lens of Equestria Girls and Canterlot High. Includes updated bar graph content and clarified examples.
Teacher answer key for the Nowhere News statistics worksheet.