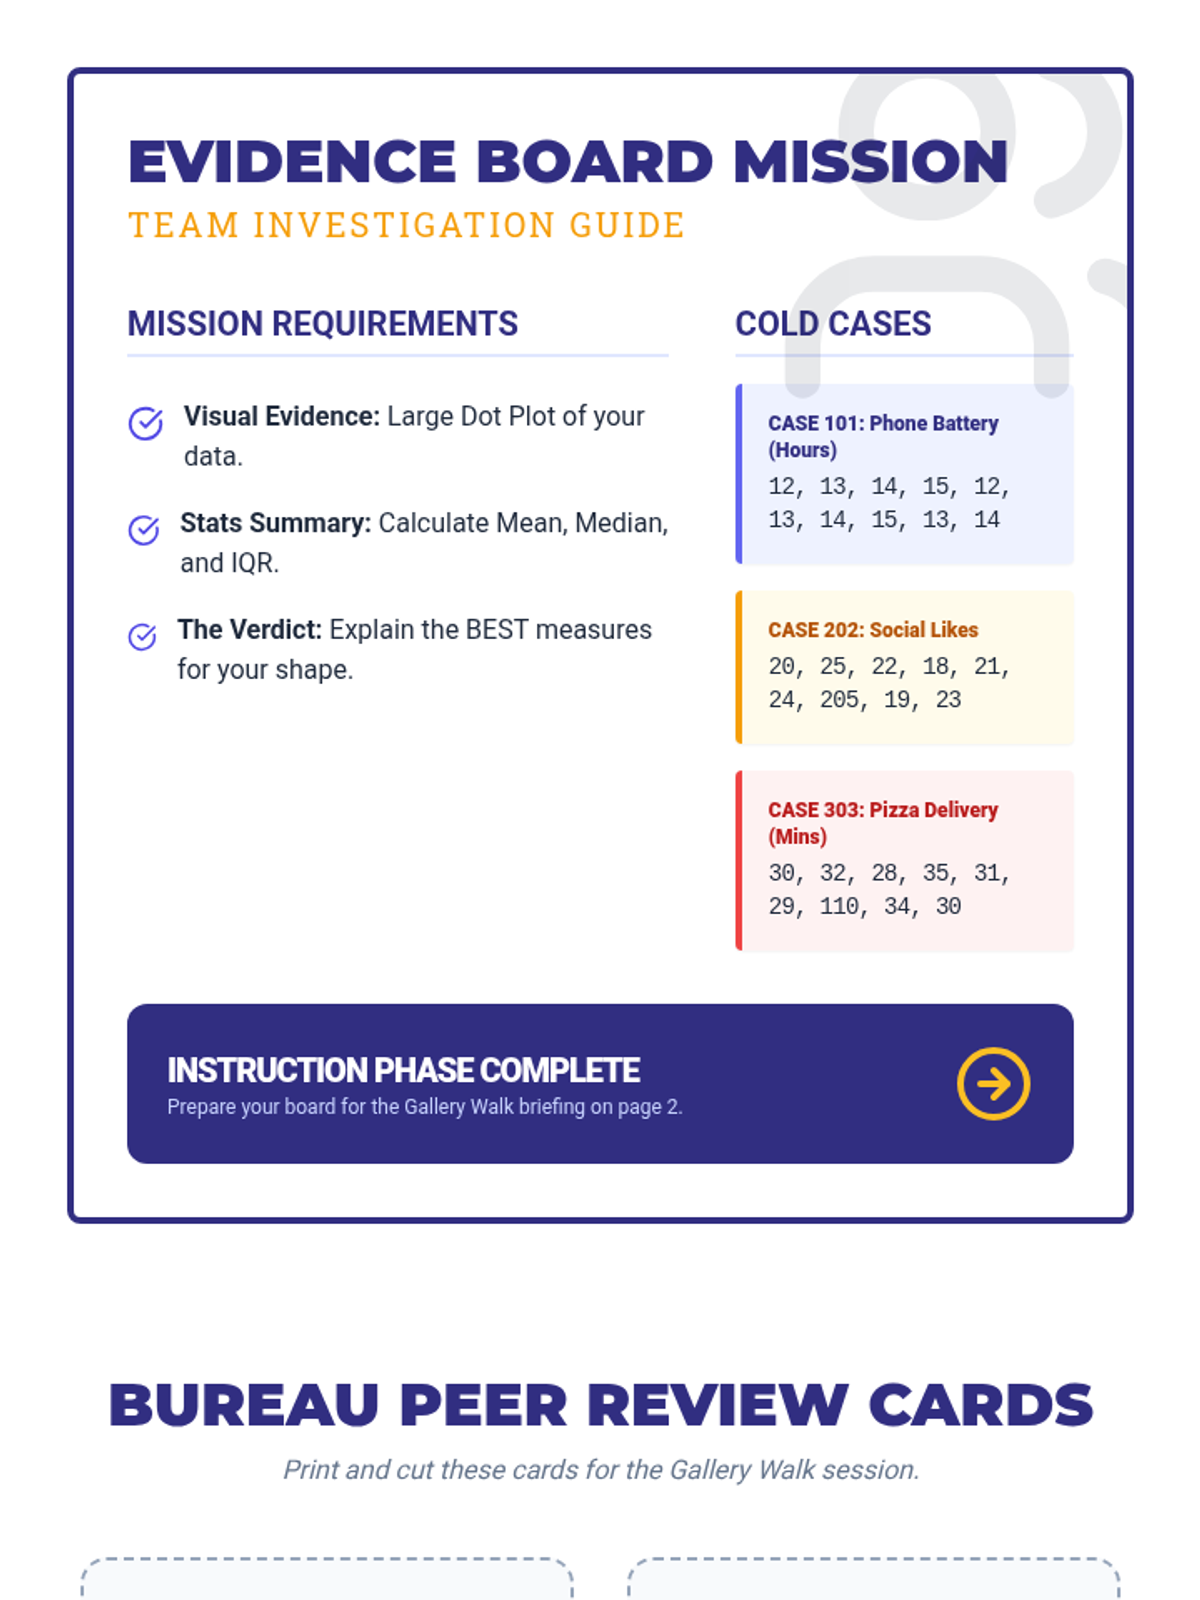
A visual example and mockup of a completed 'Evidence Board' poster for Case 202, demonstrating how students should present their visual plot, statistics, verdict, and outlier analysis. Revised for single-page layout.
An answer key for the Distribution Debrief Exit Ticket, providing correct answers and brief pedagogical explanations.
A brief end-of-lesson assessment checking student understanding of how outliers affect mean vs median and when to use specific statistical measures. Two tickets per page for efficient printing. Revised for layout and uniform answer choices.
A guide for the collaborative poster activity featuring specific case studies for students to analyze and 'peer review' cards for a gallery walk. Revised with larger peer review cards and better layout.
An answer key for the Case Notes handout, providing calculations for mean and median and clear explanations of why certain measures are preferred in symmetric vs skewed data. Revised for layout and clarity.
A student practice worksheet with two real-world scenarios comparing symmetric data to data with an outlier, requiring students to calculate measures and justify their selection. Layout optimized for 8.5x11 printing. Revised for single-page fit.
Visual presentation for the lesson including outlier identification, impact on mean vs median, and selection criteria for symmetric vs skewed data.
A detailed 90-minute teacher guide for a 6th grade math lesson on statistical measures and outliers, featuring a 'Data Detective' theme with a clear timeline, learning objectives, and teaching tips. Revised for better page breaks.
Teacher-facing answer key for the summative assessment. Refined to align with the single-column parabola analysis and updated problem layouts.
Teacher-facing answer key for the review worksheet. Updated to match the refined single-column parabola analysis items.
A formal summative assessment with 6 items, evaluating student proficiency in solving quadratic equations through graphing analysis, algebraic factoring, and guided quadratic formula steps. Graphing items feature single-column layouts and explicitly displayed equations. Fixes layout bugs in the formula section.
A 12-question comprehensive review worksheet covering quadratic equations via graphing, factoring, and the quadratic formula, styled with a professional 'blueprint' aesthetic. This version features single-column graph layouts, explicitly displayed equations, and refined formula templates.
Set of unique, pre-filled randomized Bingo cards for the Stat Squad activity. Each card features 24 numbers from the evidence pool and a free space. Optimized for 8.5 x 11 printing. Card set IDs #001 to #030.
Bingo activity presentation for calling variability problems in class. Features large, readable data sets and distinct case numbers to match the teacher's calling guide. Includes step-by-step solution slides.
Teacher Calling Sheet for Stat Squad Bingo. Features a complete answer key for Case #01 through #27, facilitation tips, and an Evidence Pool reference.