Mapping relationships through notation, algebraic representations, and growth rate comparisons. Equips learners to transform functions, model contextual data, and solve exponential equations.
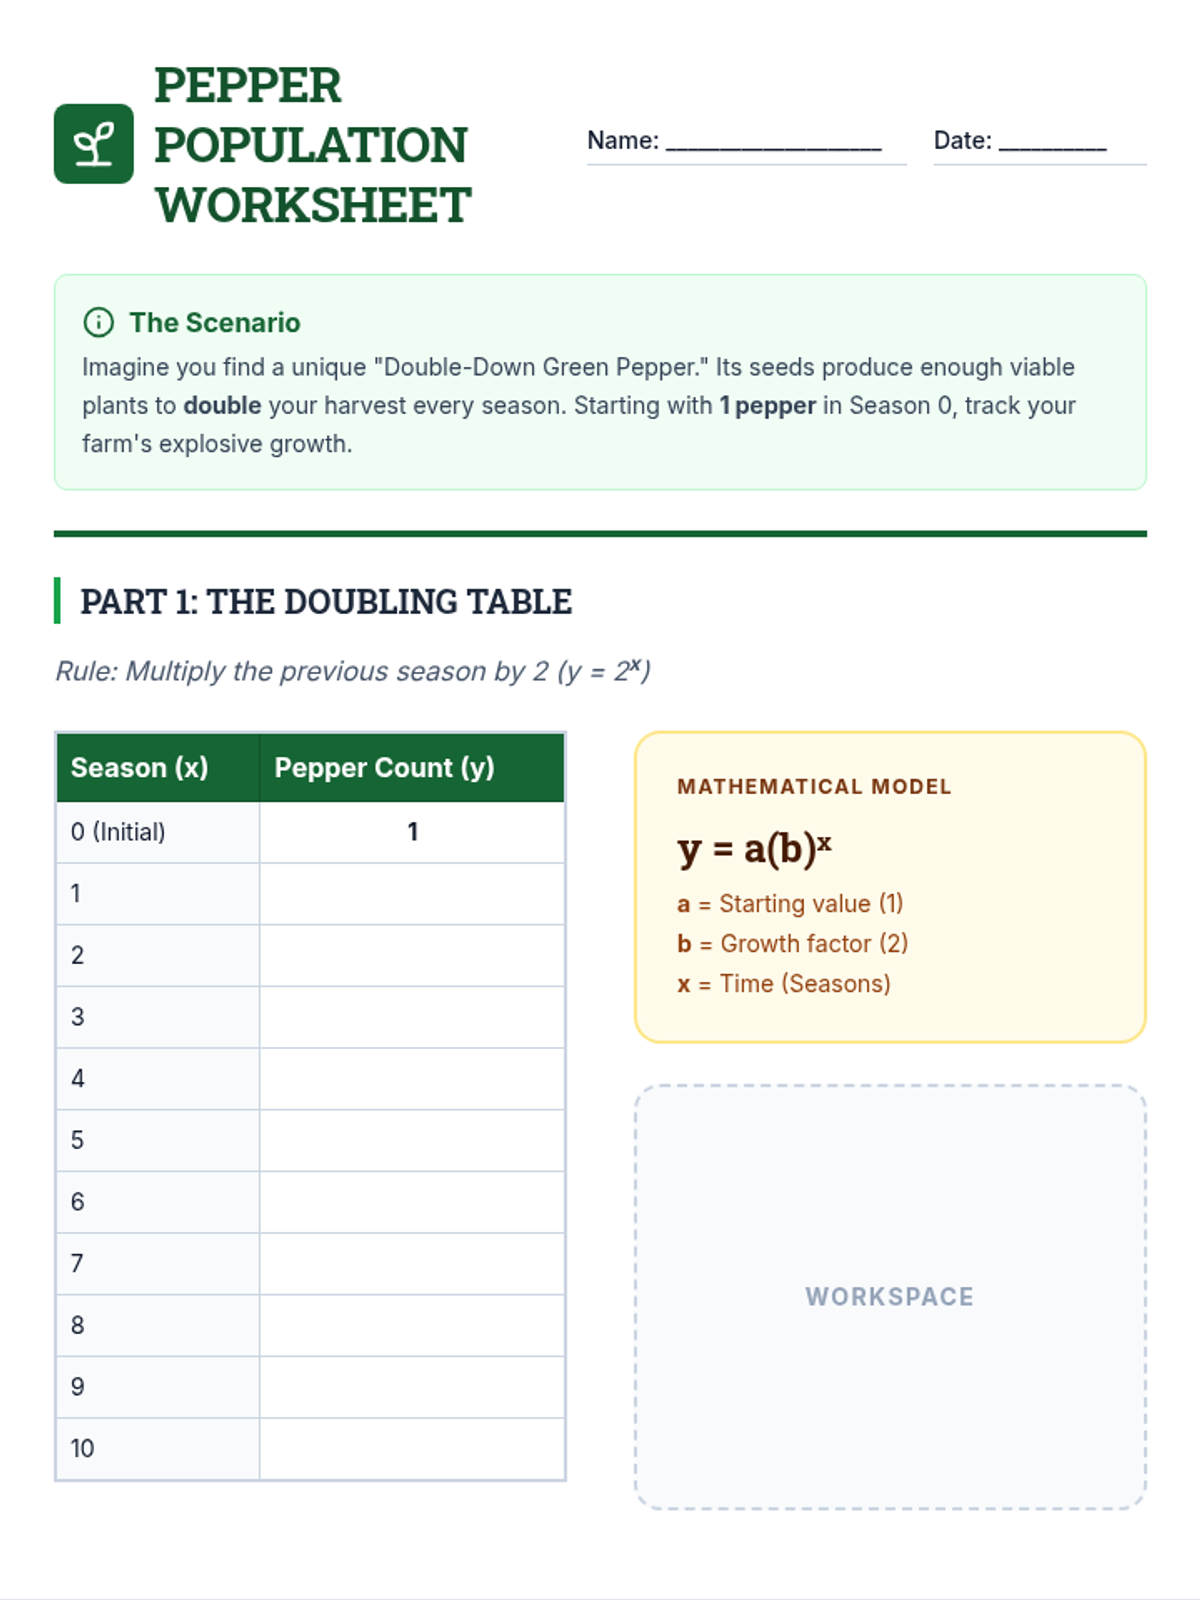
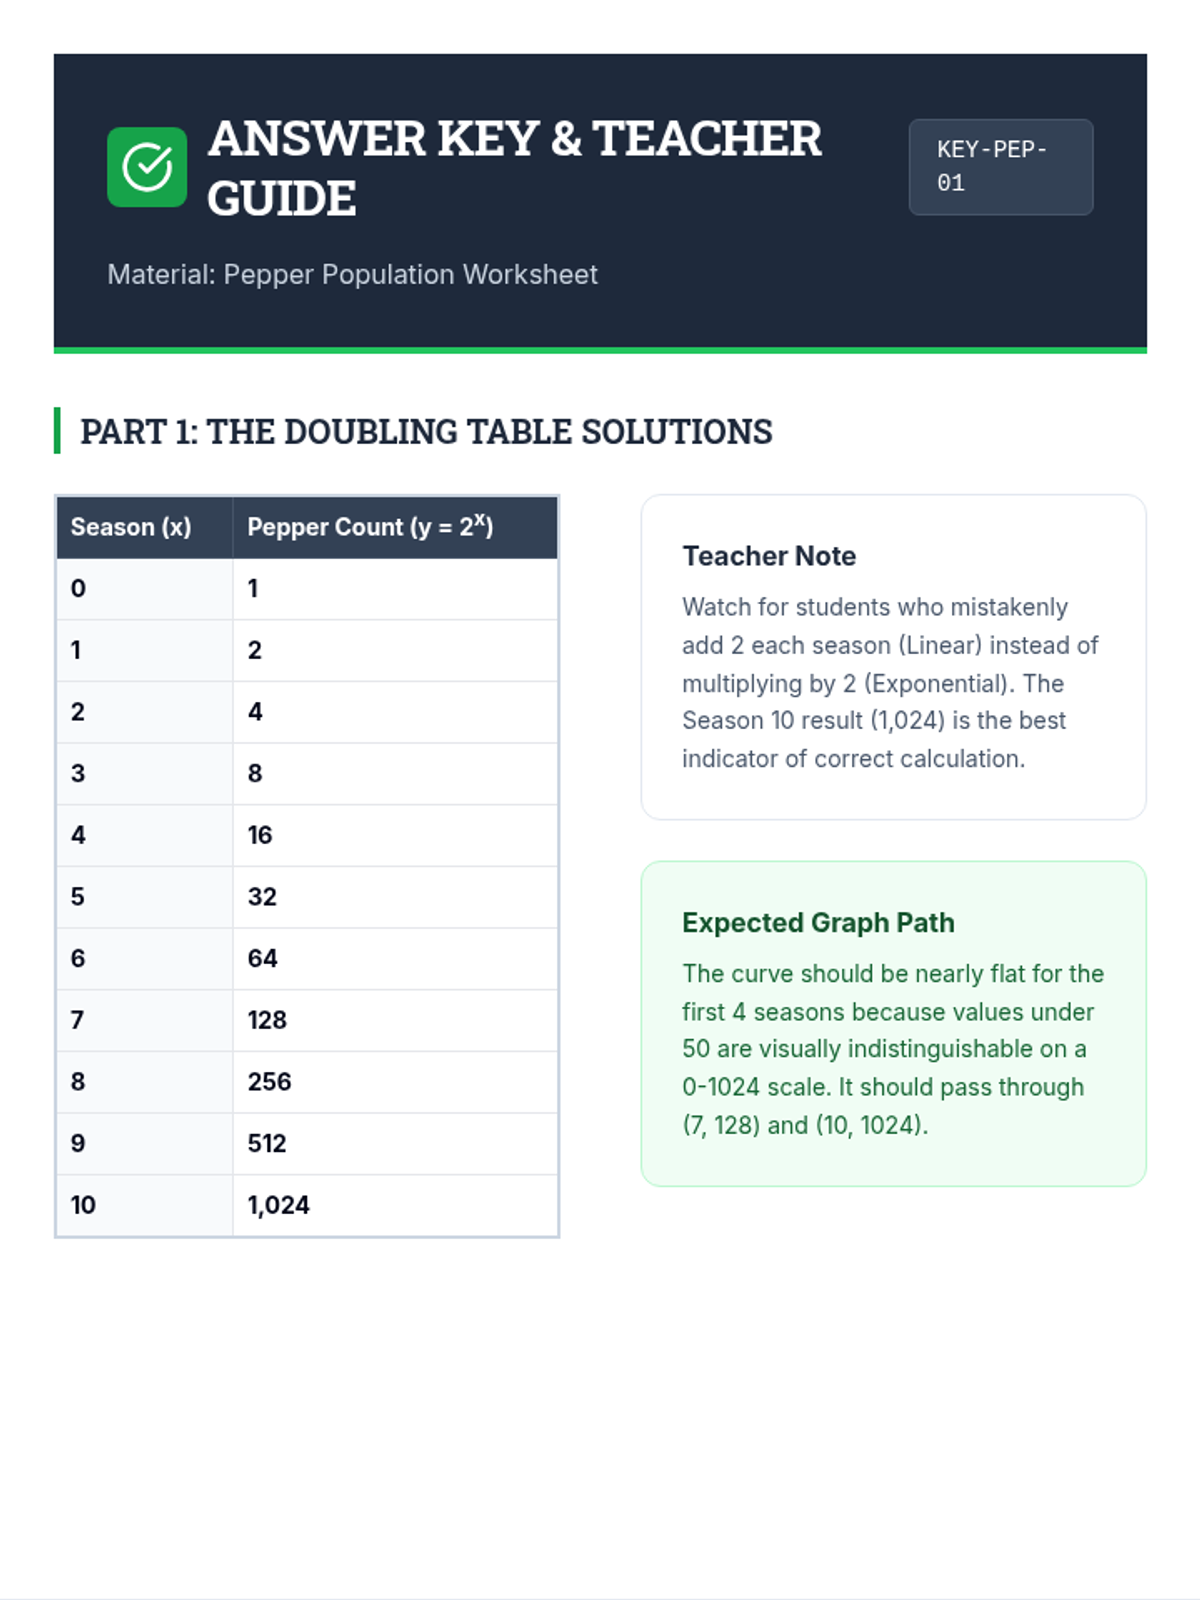
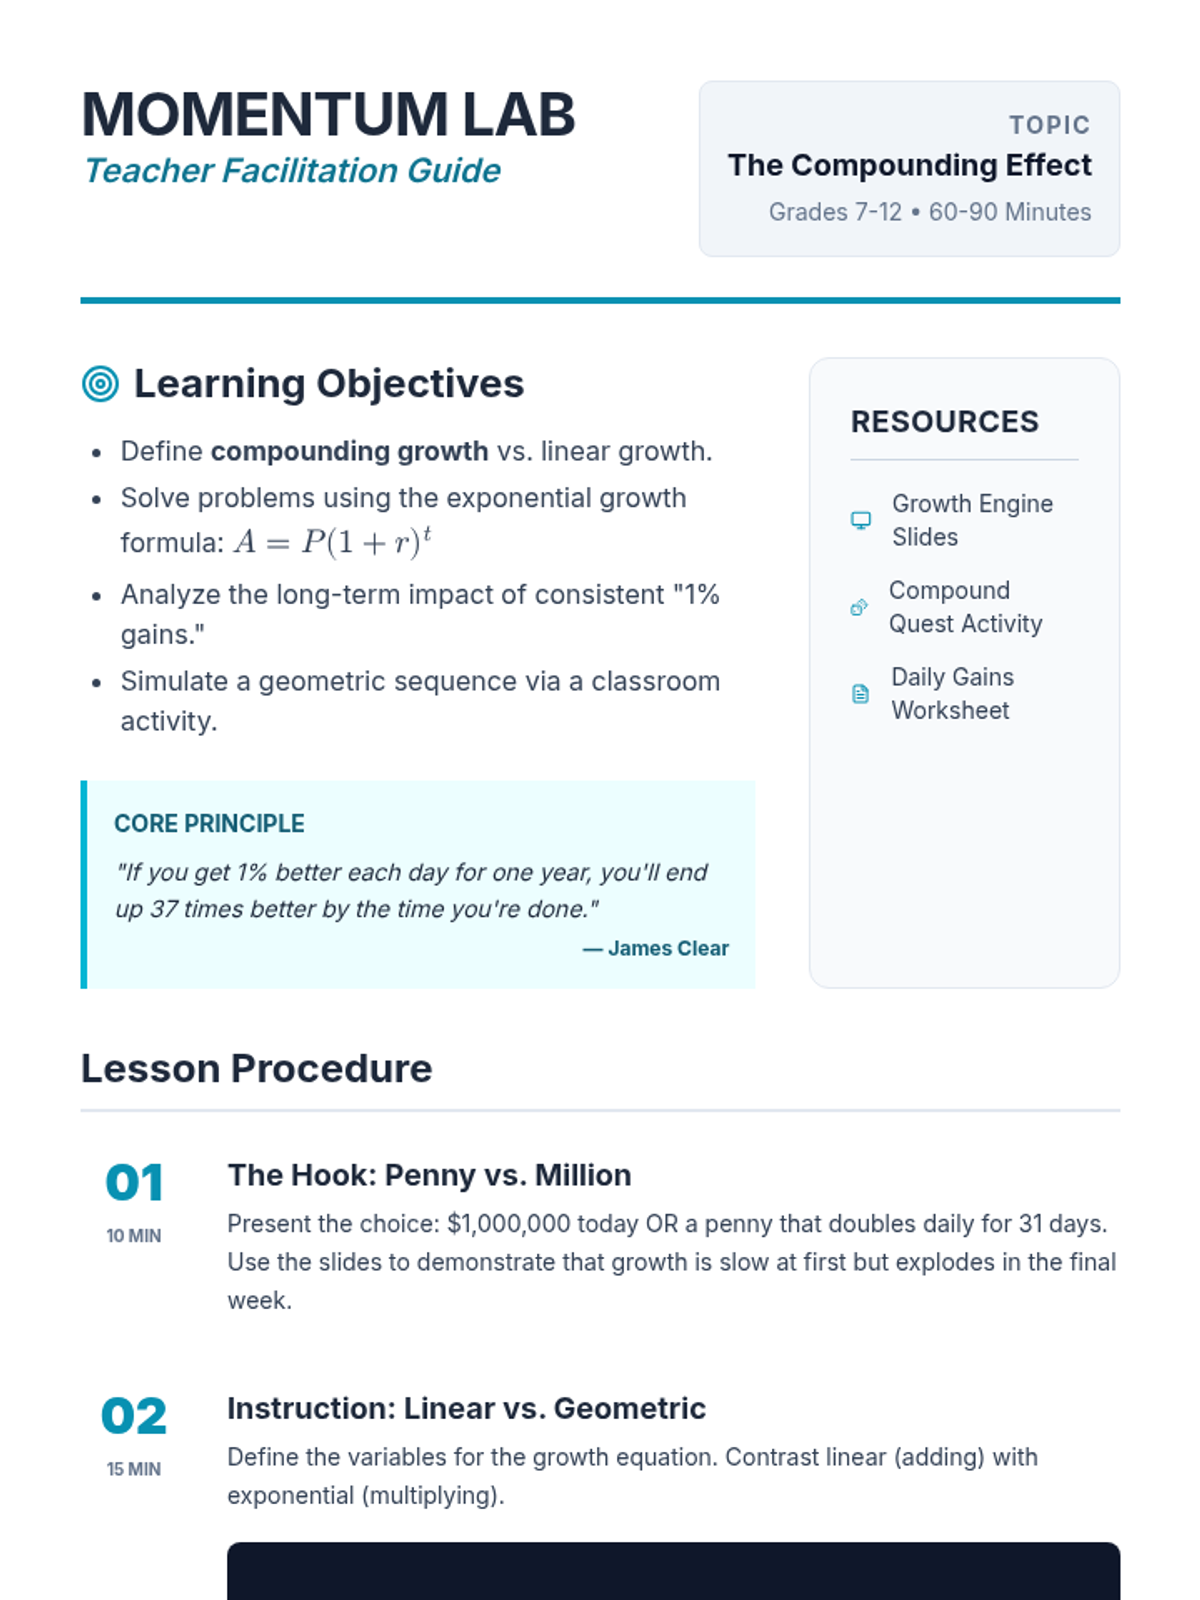
Students will model the exponential growth of a pepper population, starting from one pepper and doubling every season, to understand the power of geometric growth.
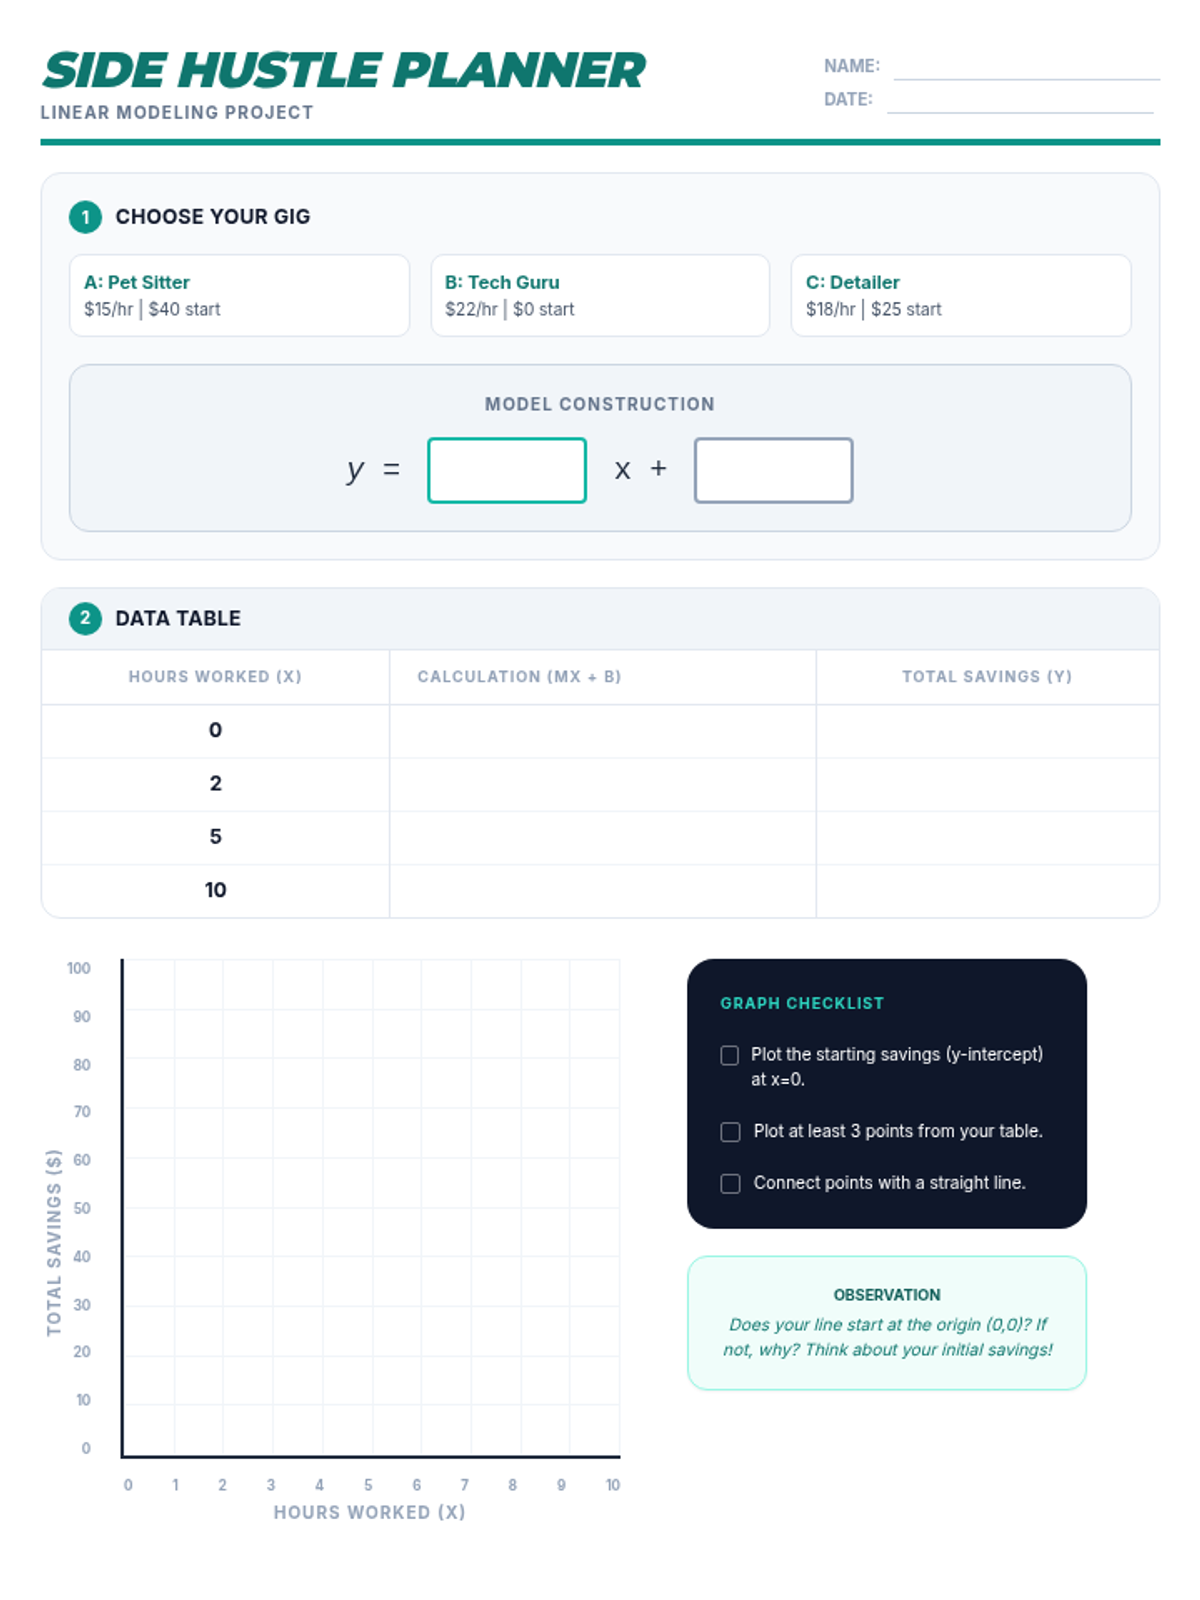
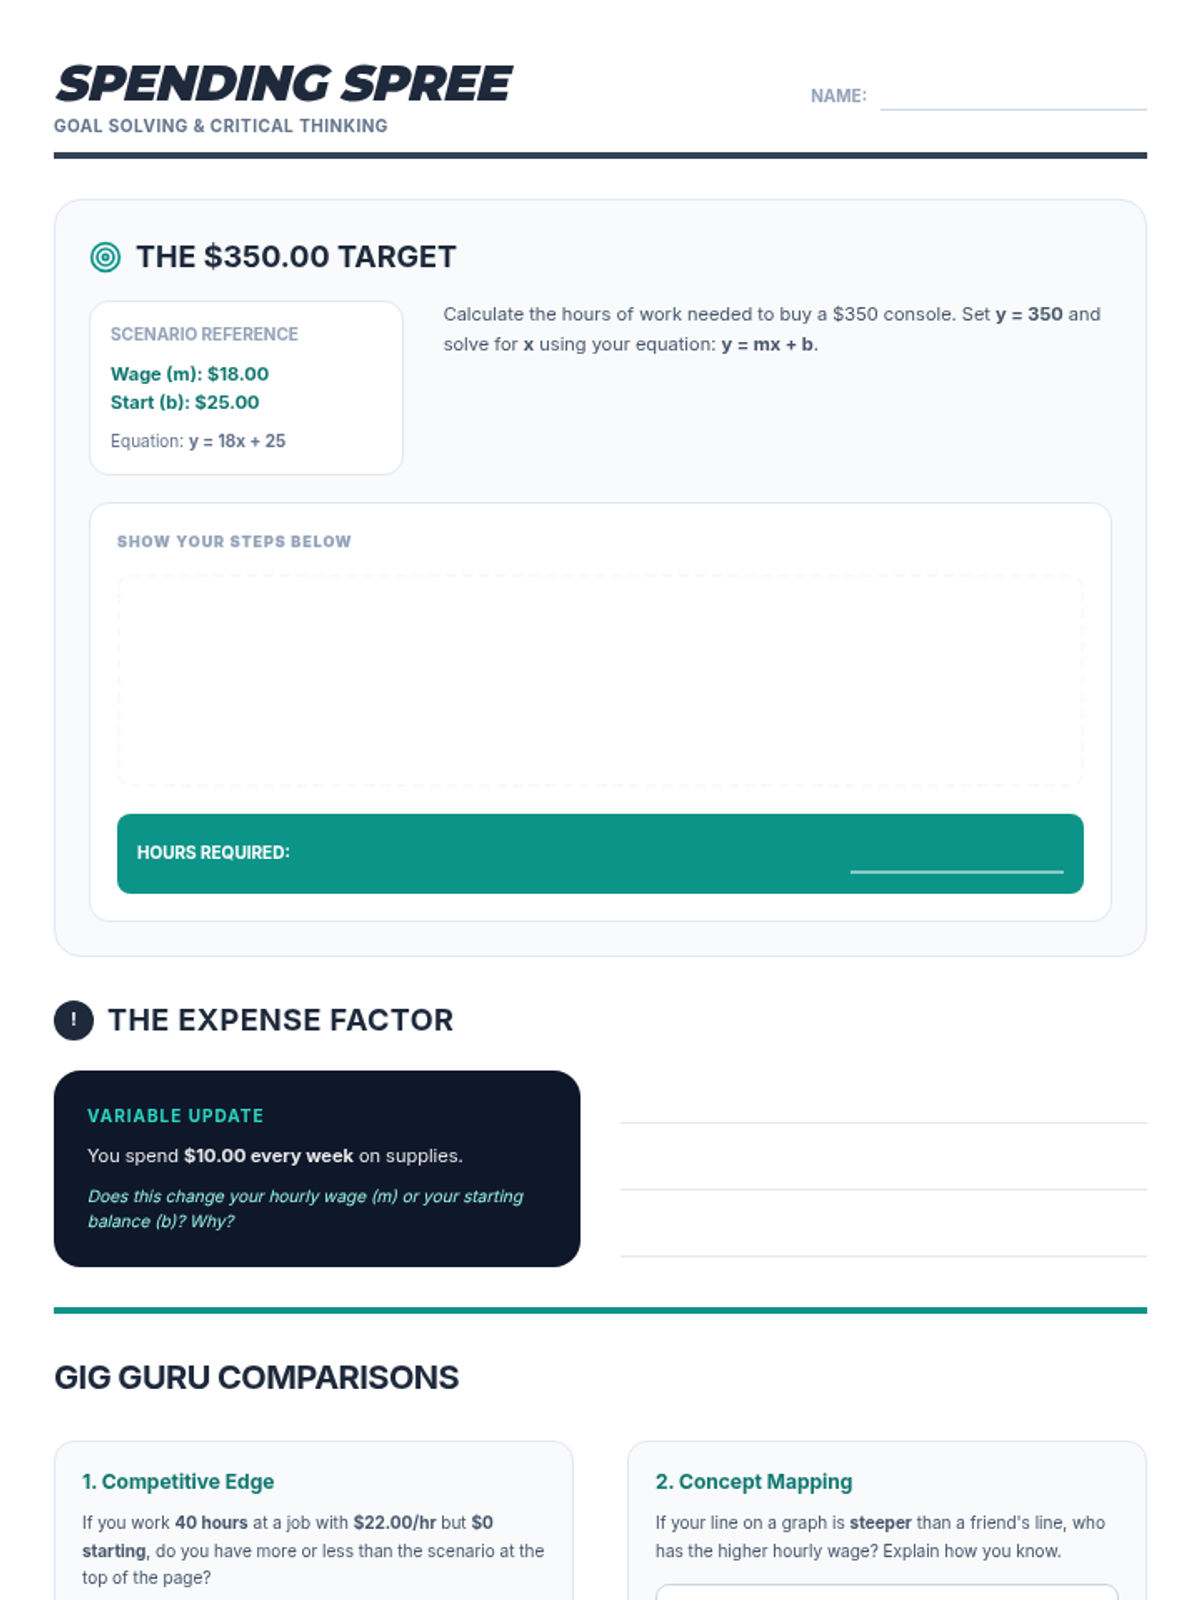
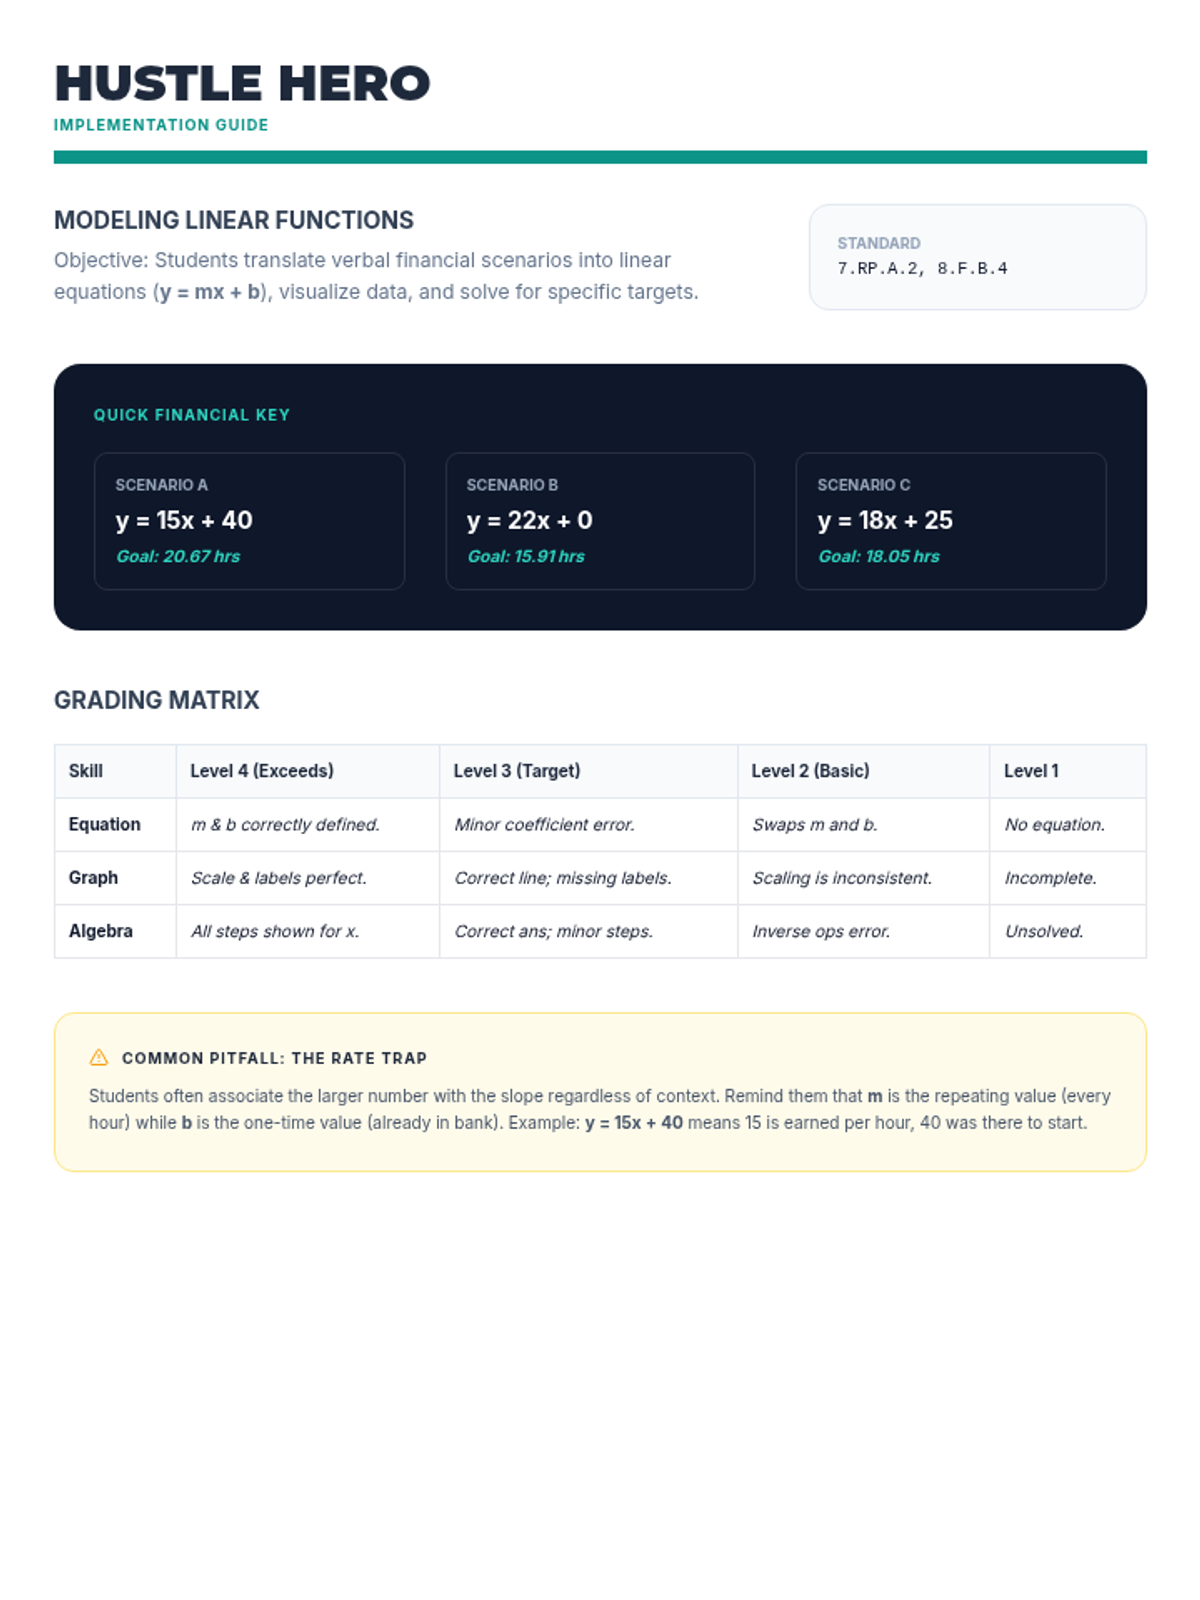
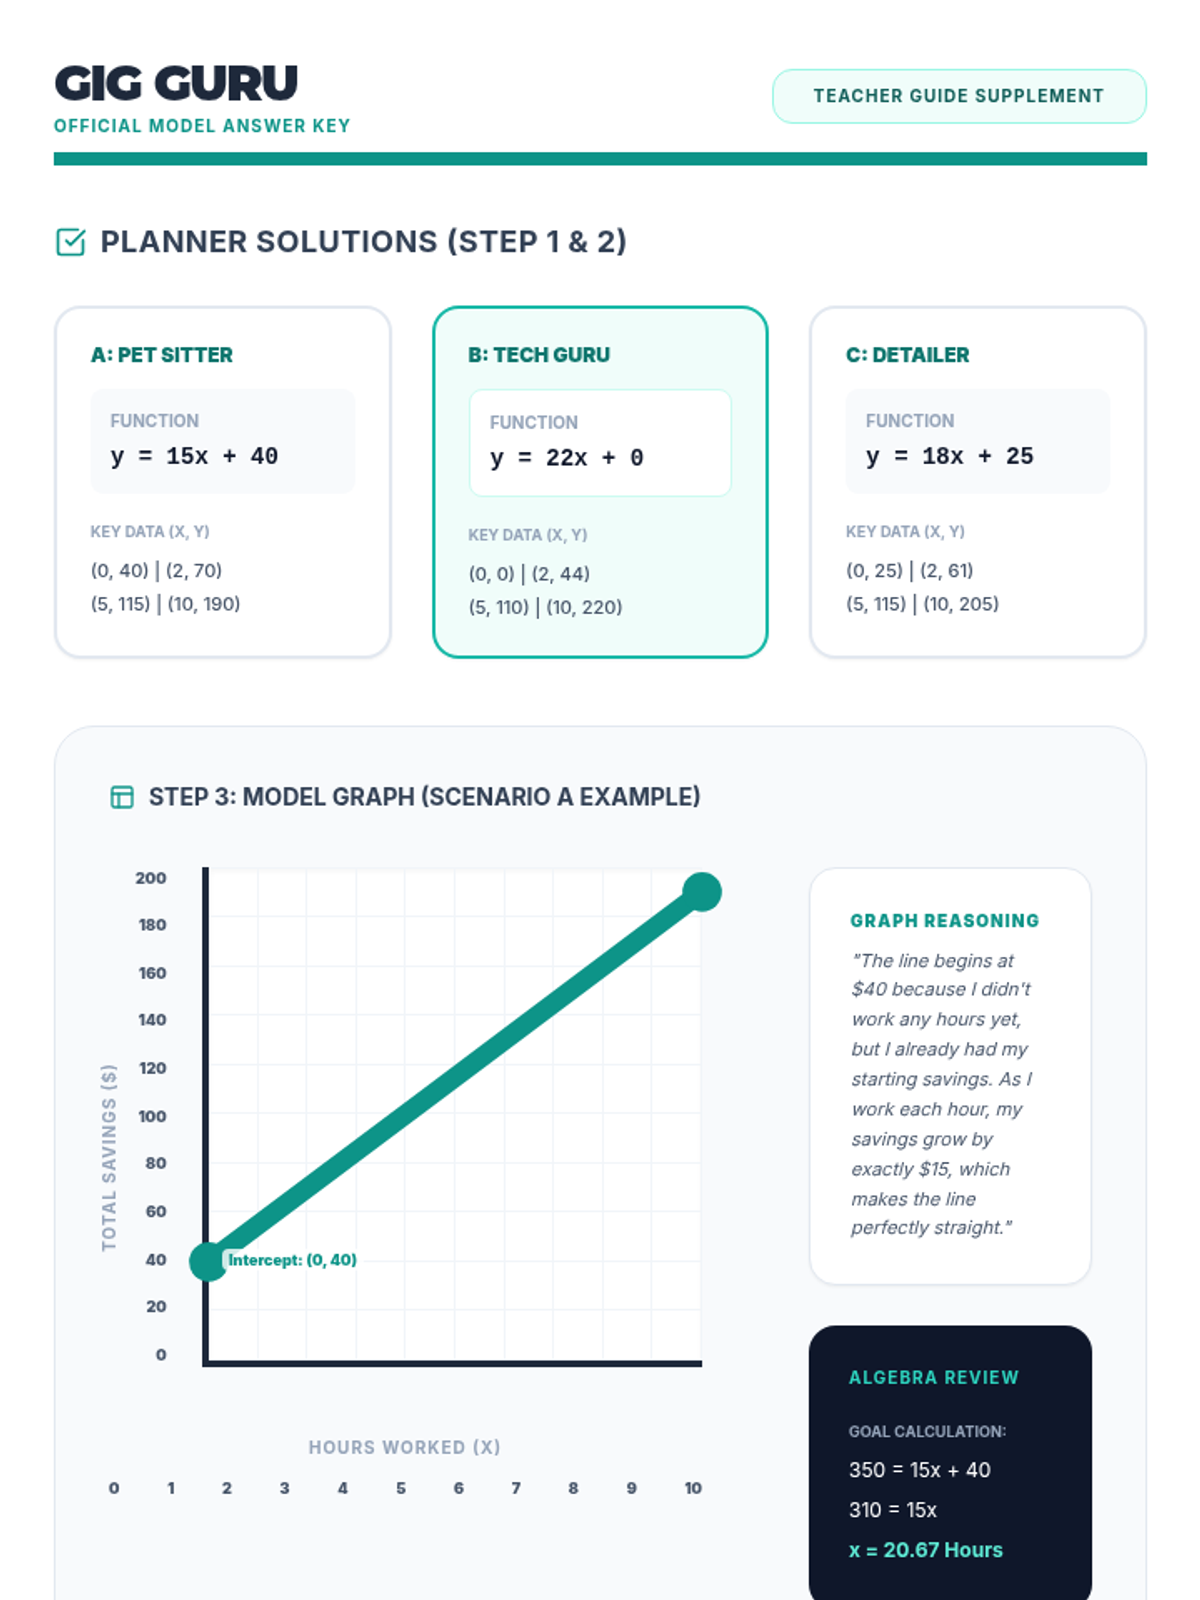
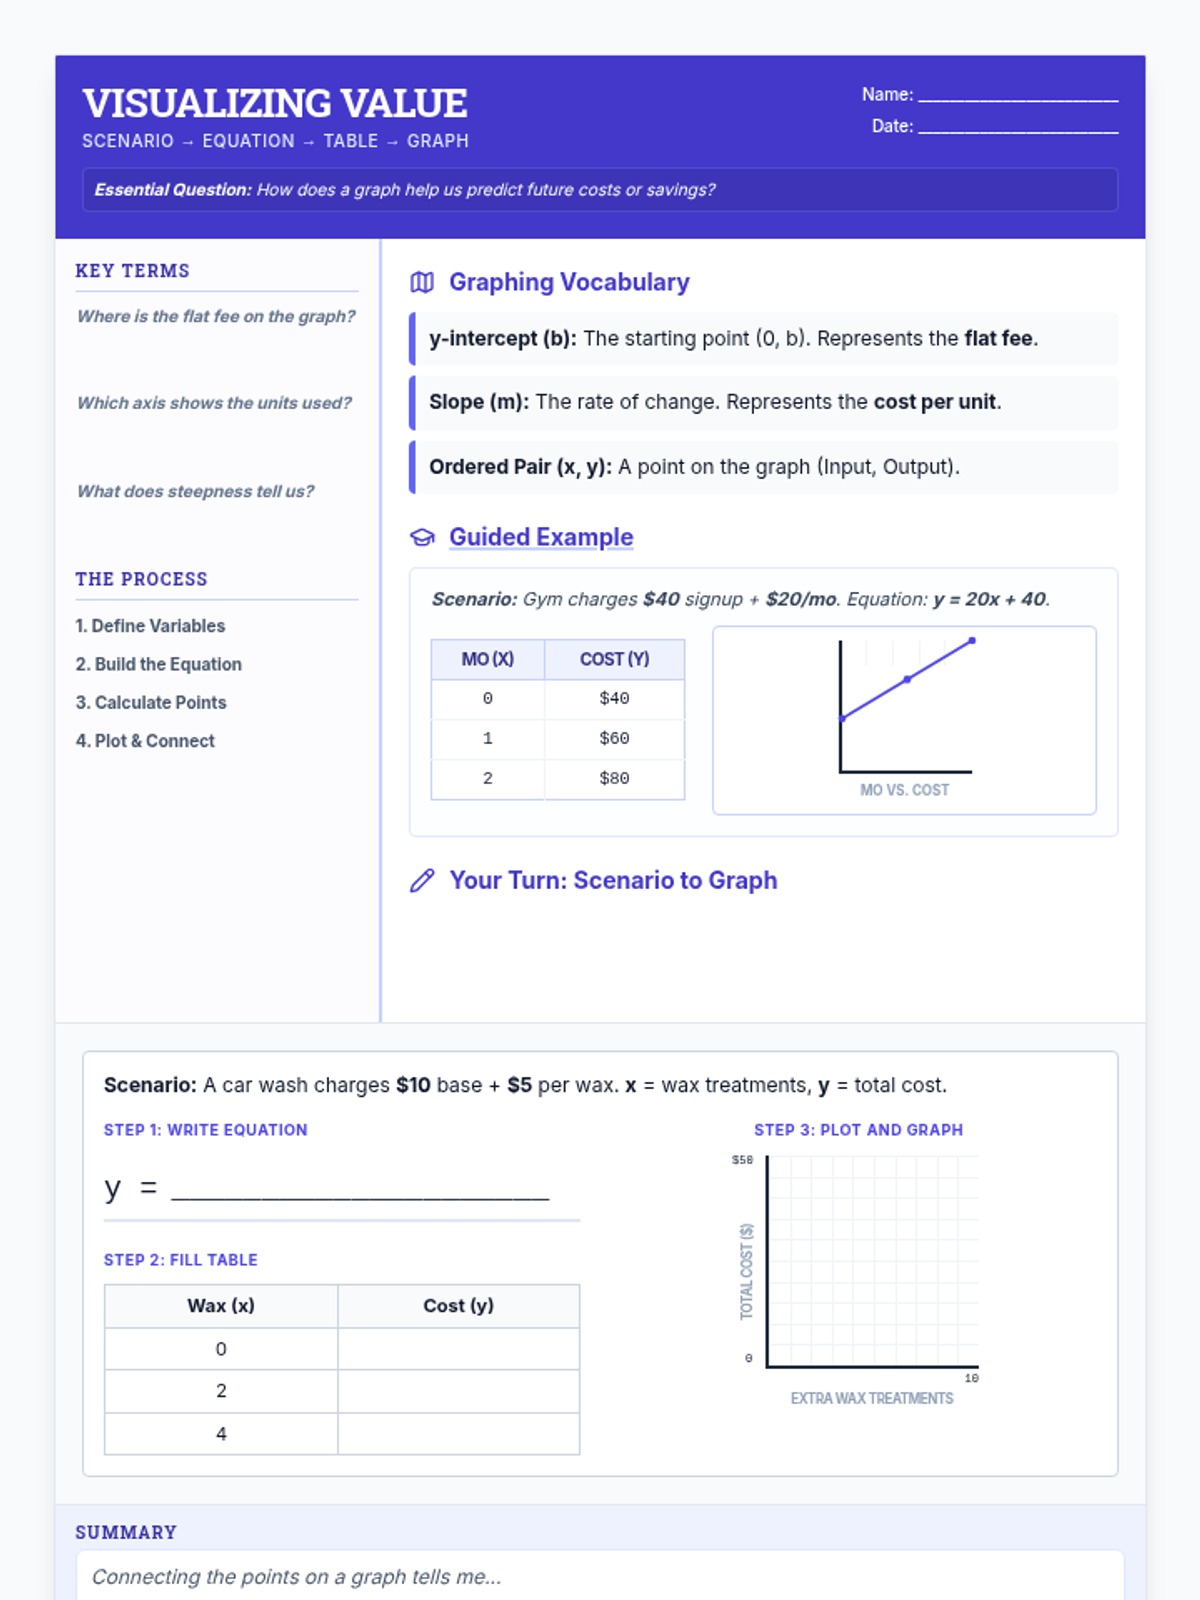
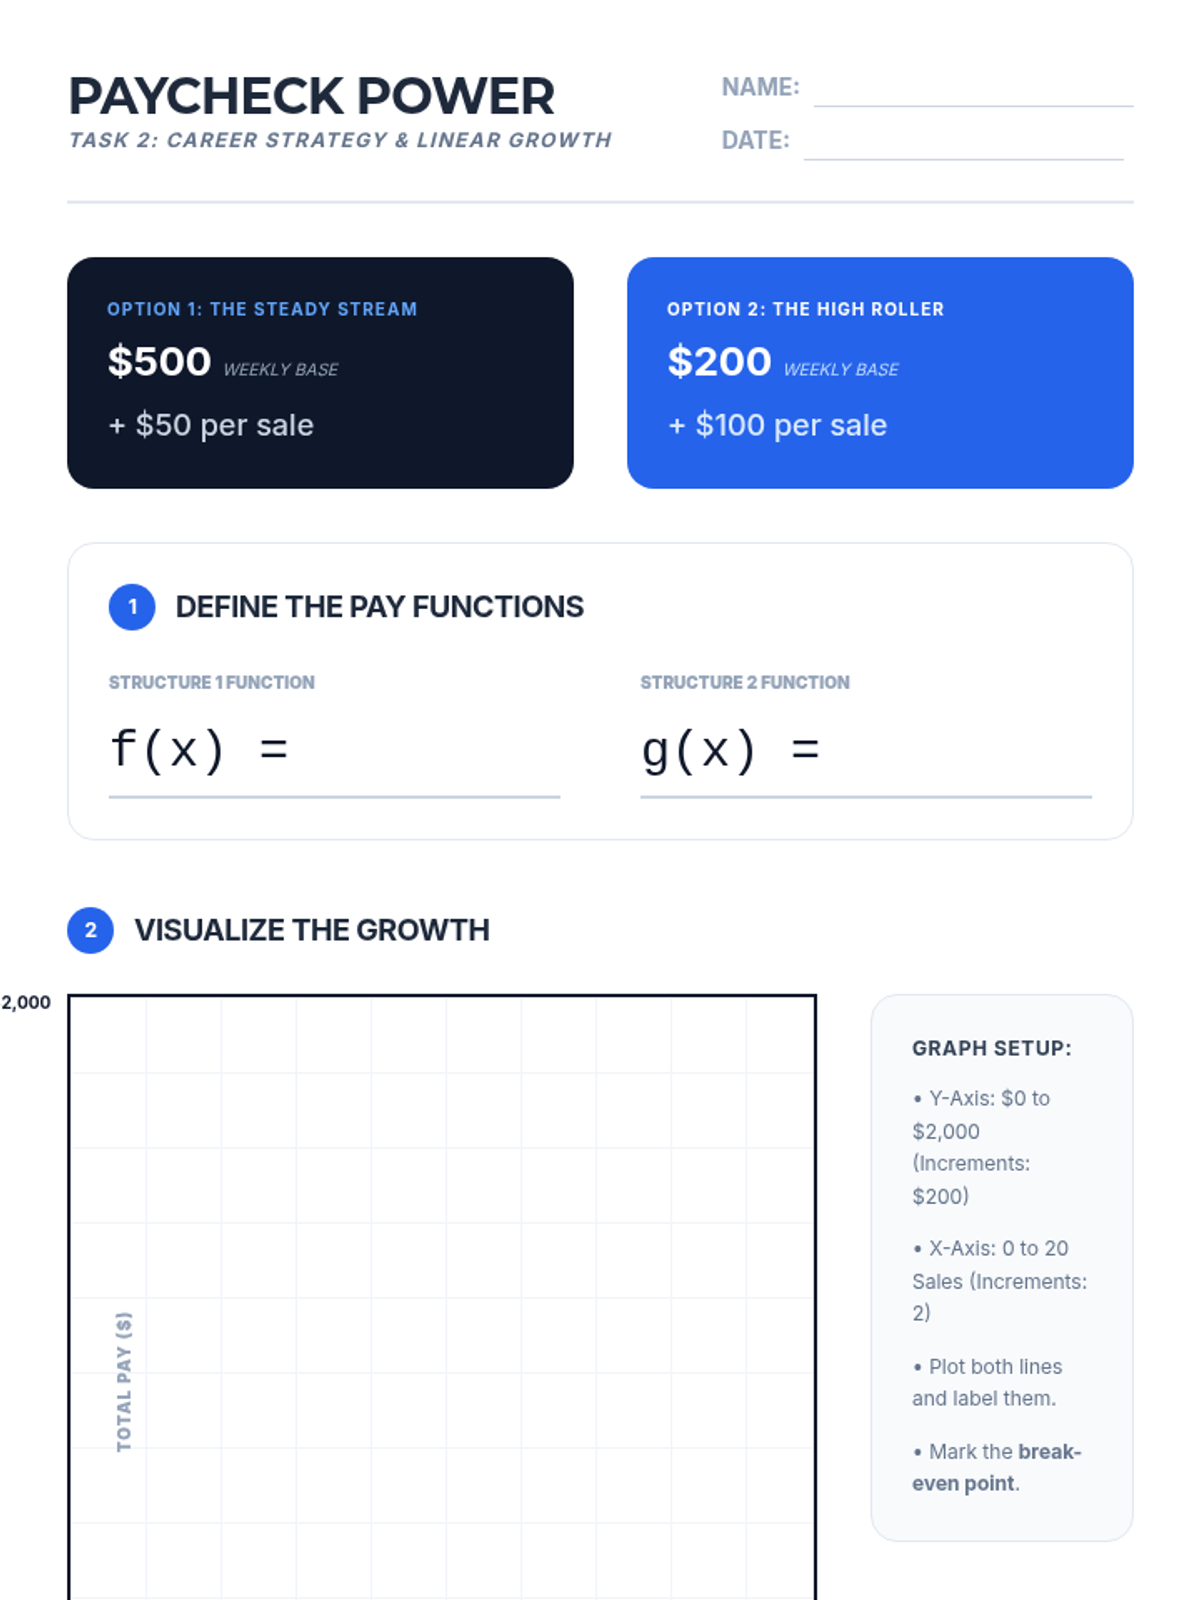
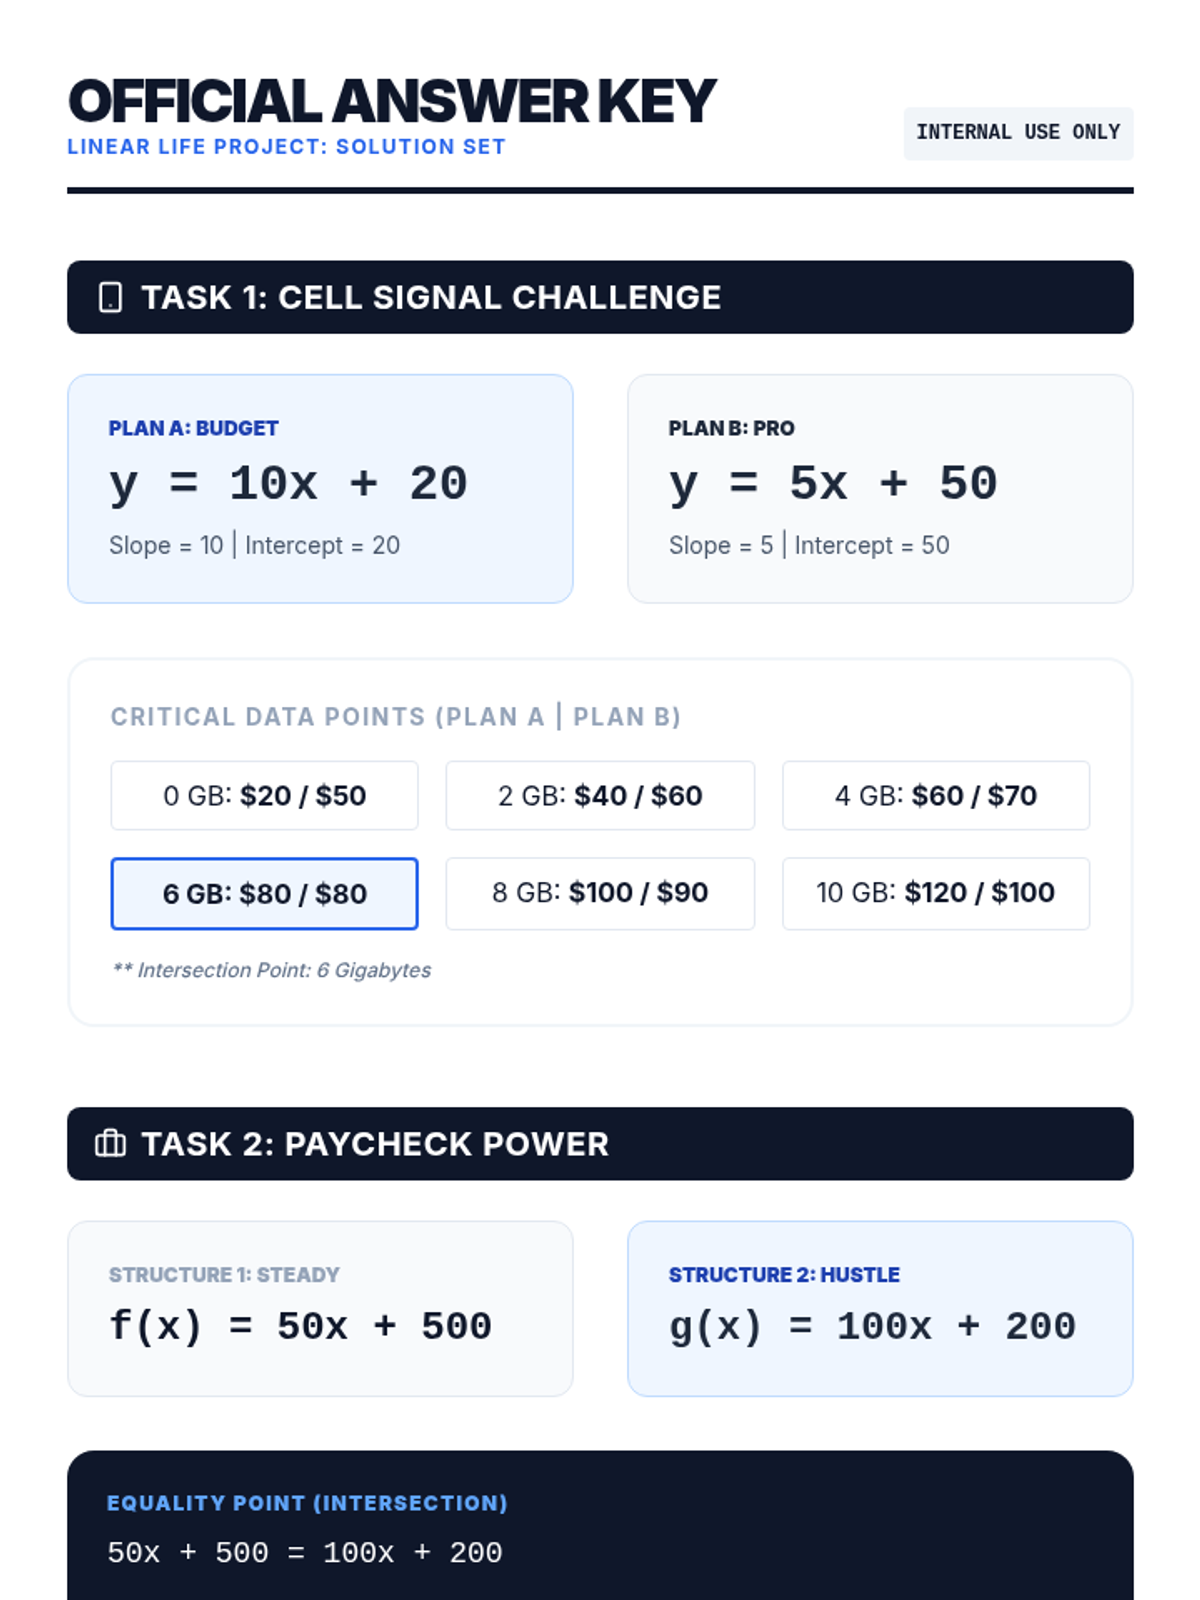
Students apply linear function concepts to model a real-world income and expense scenario. They will calculate rates of change, identify initial values, and visualize their budget through graphing.
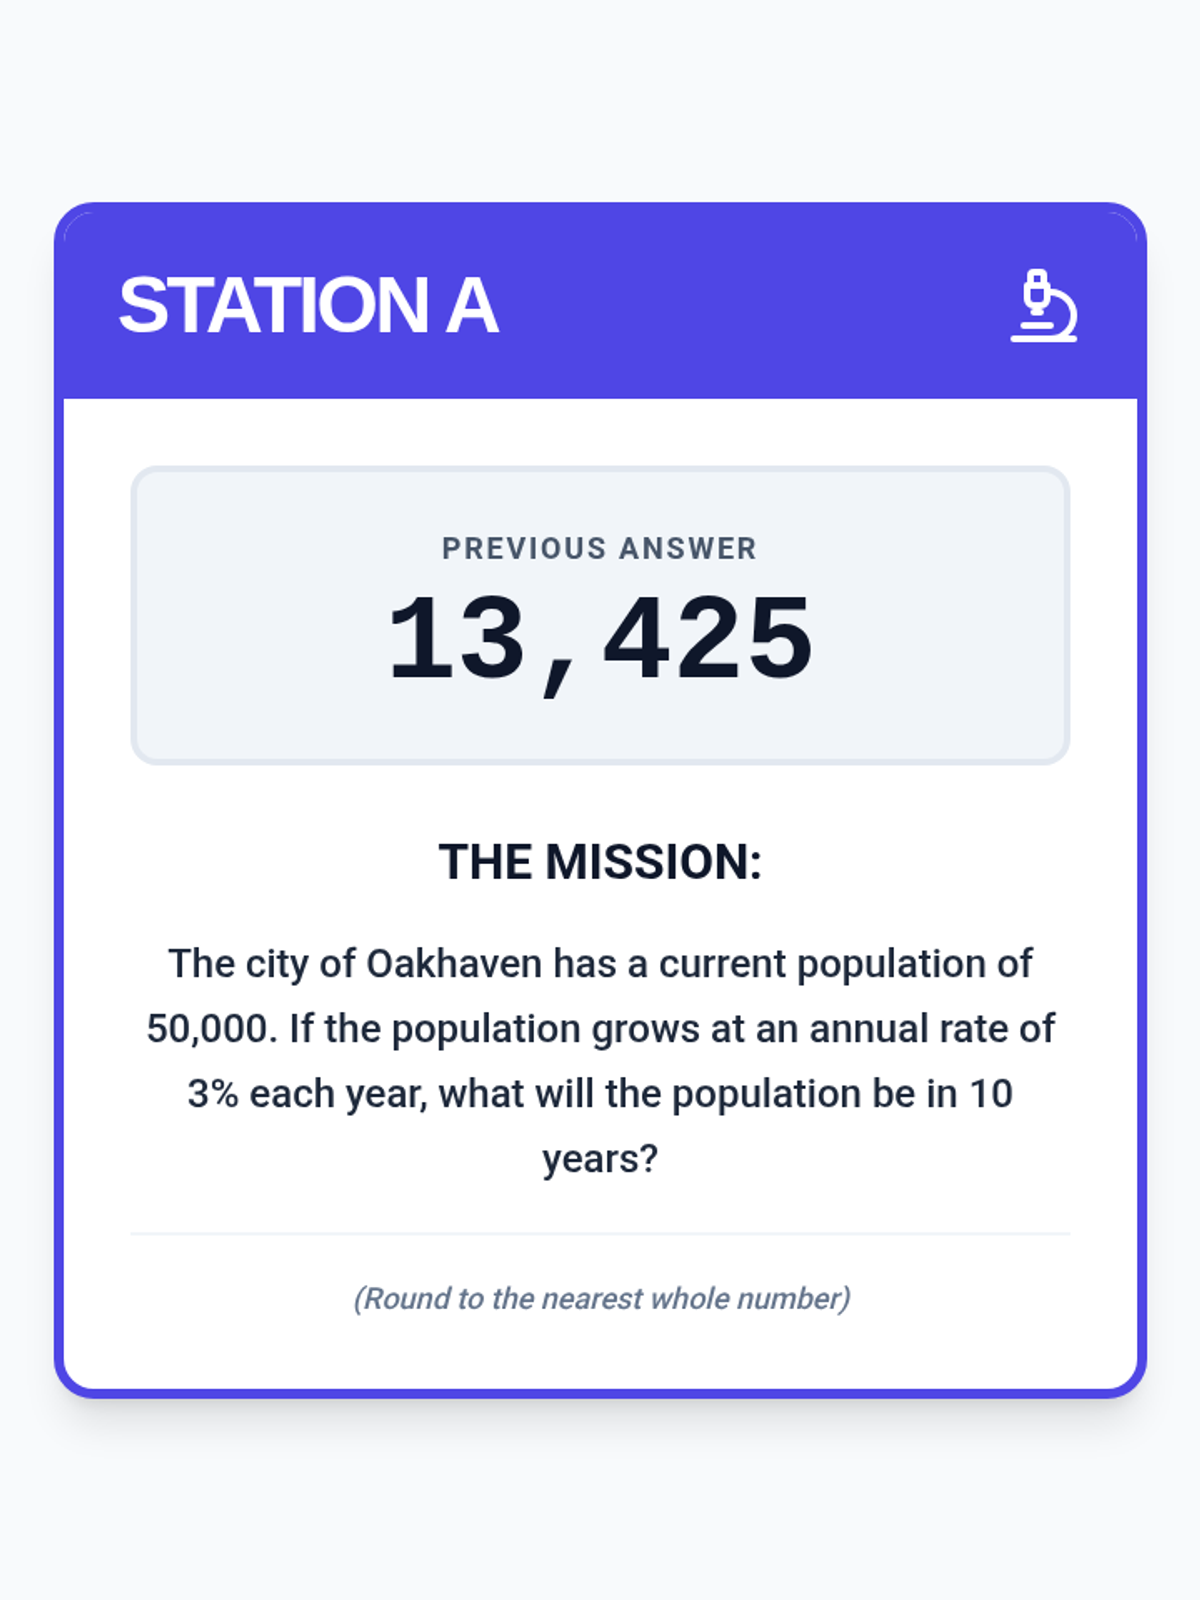
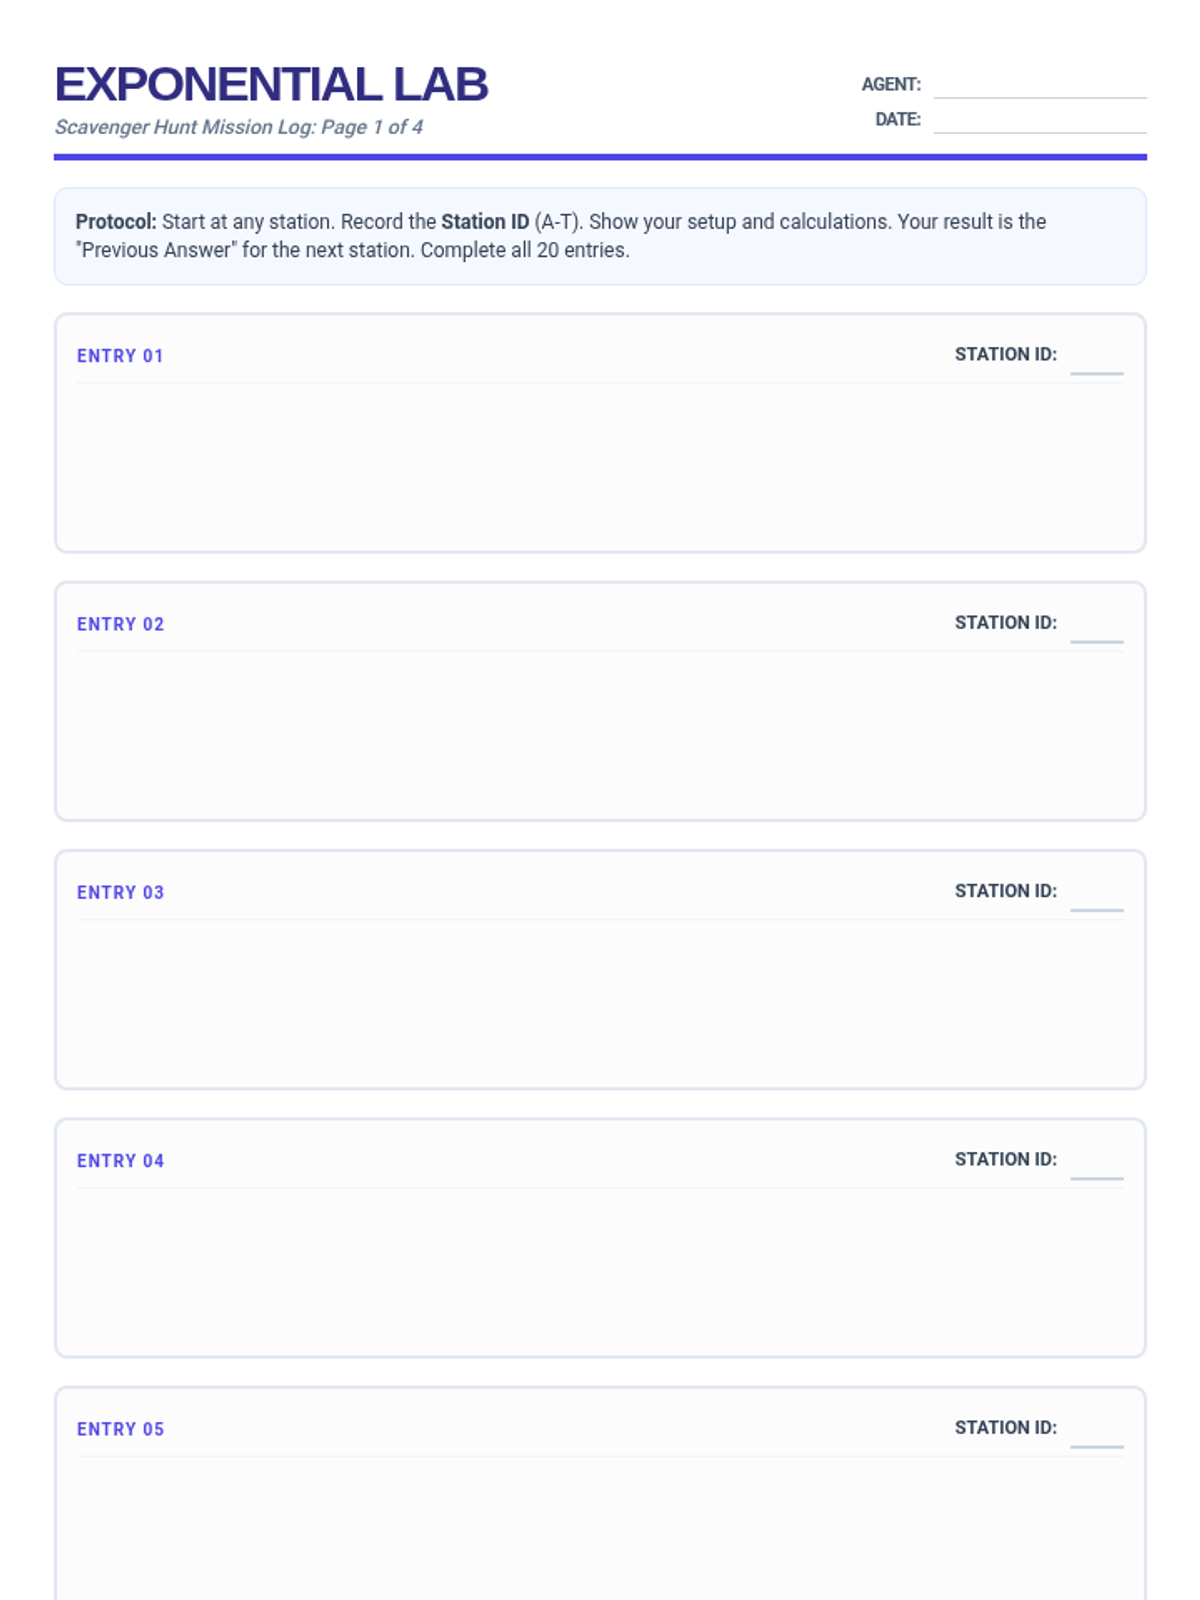
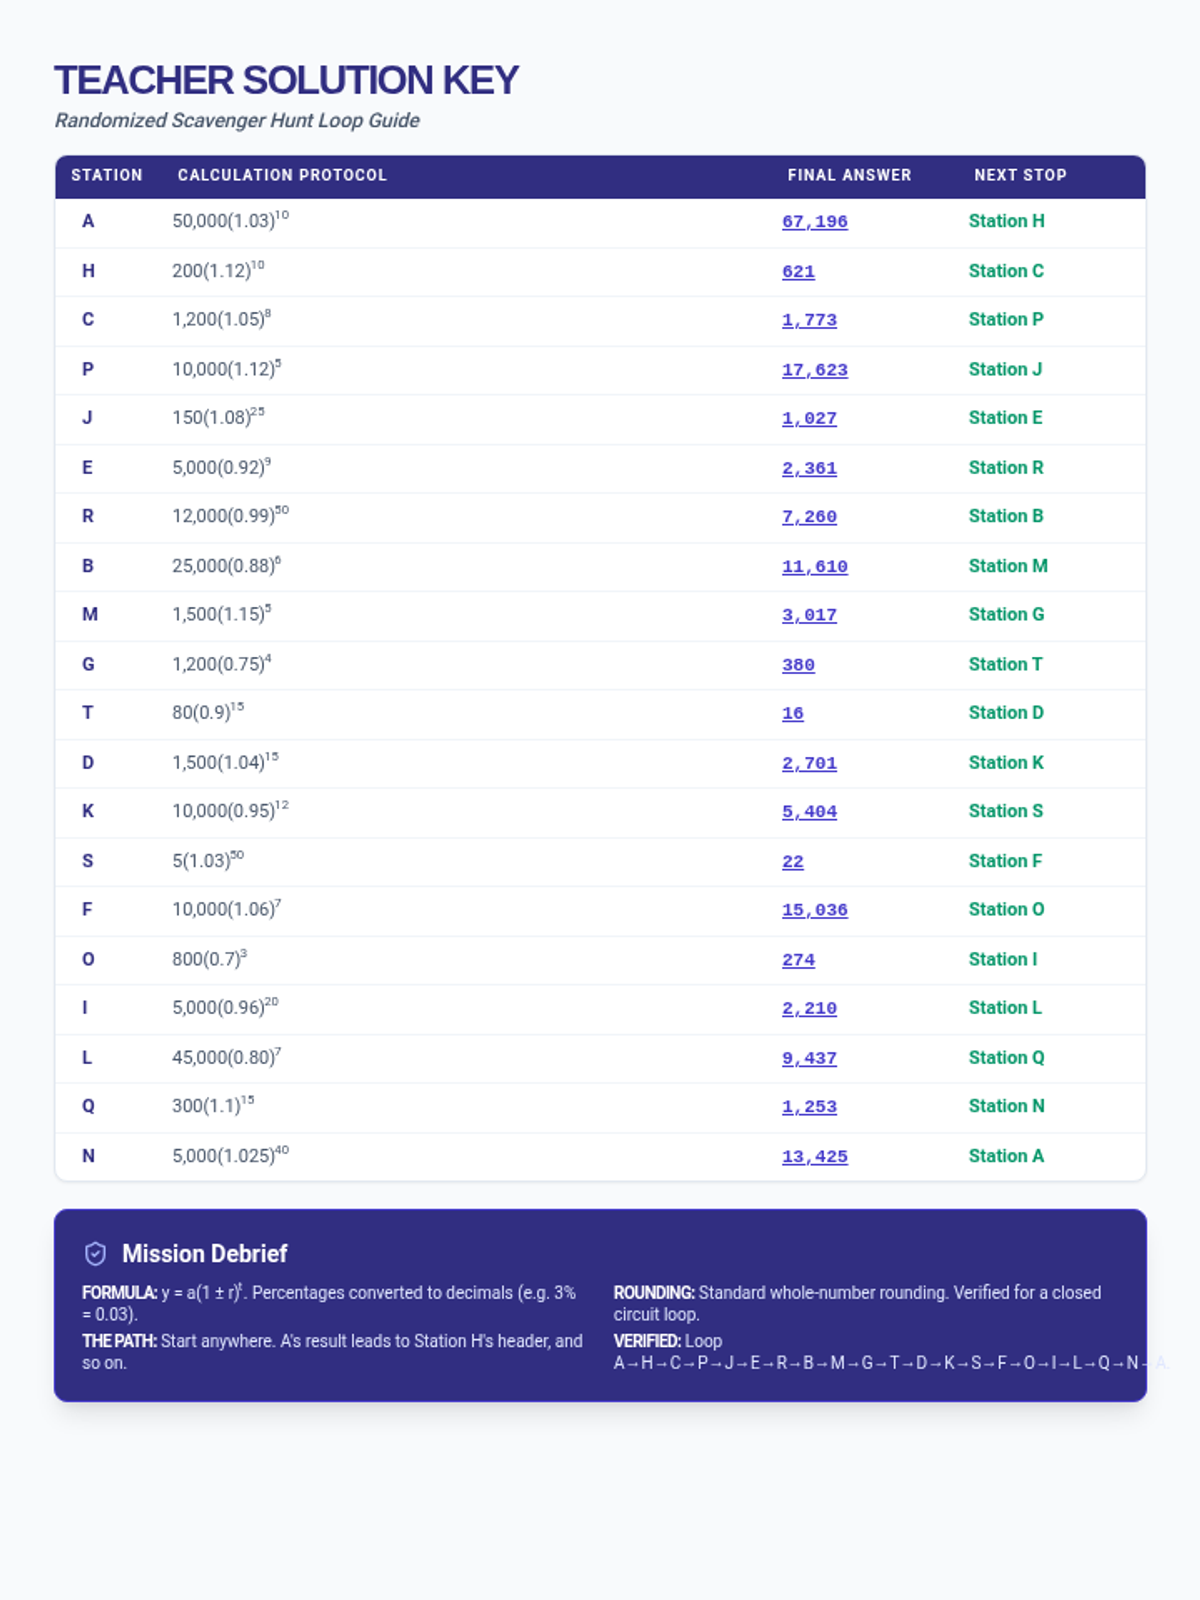
In this lesson, students will apply their knowledge of exponential growth and decay formulas to solve 20 real-world scenarios. They will move through stations in a self-correcting loop, reinforcing their understanding of interest, half-life, population growth, and depreciation.
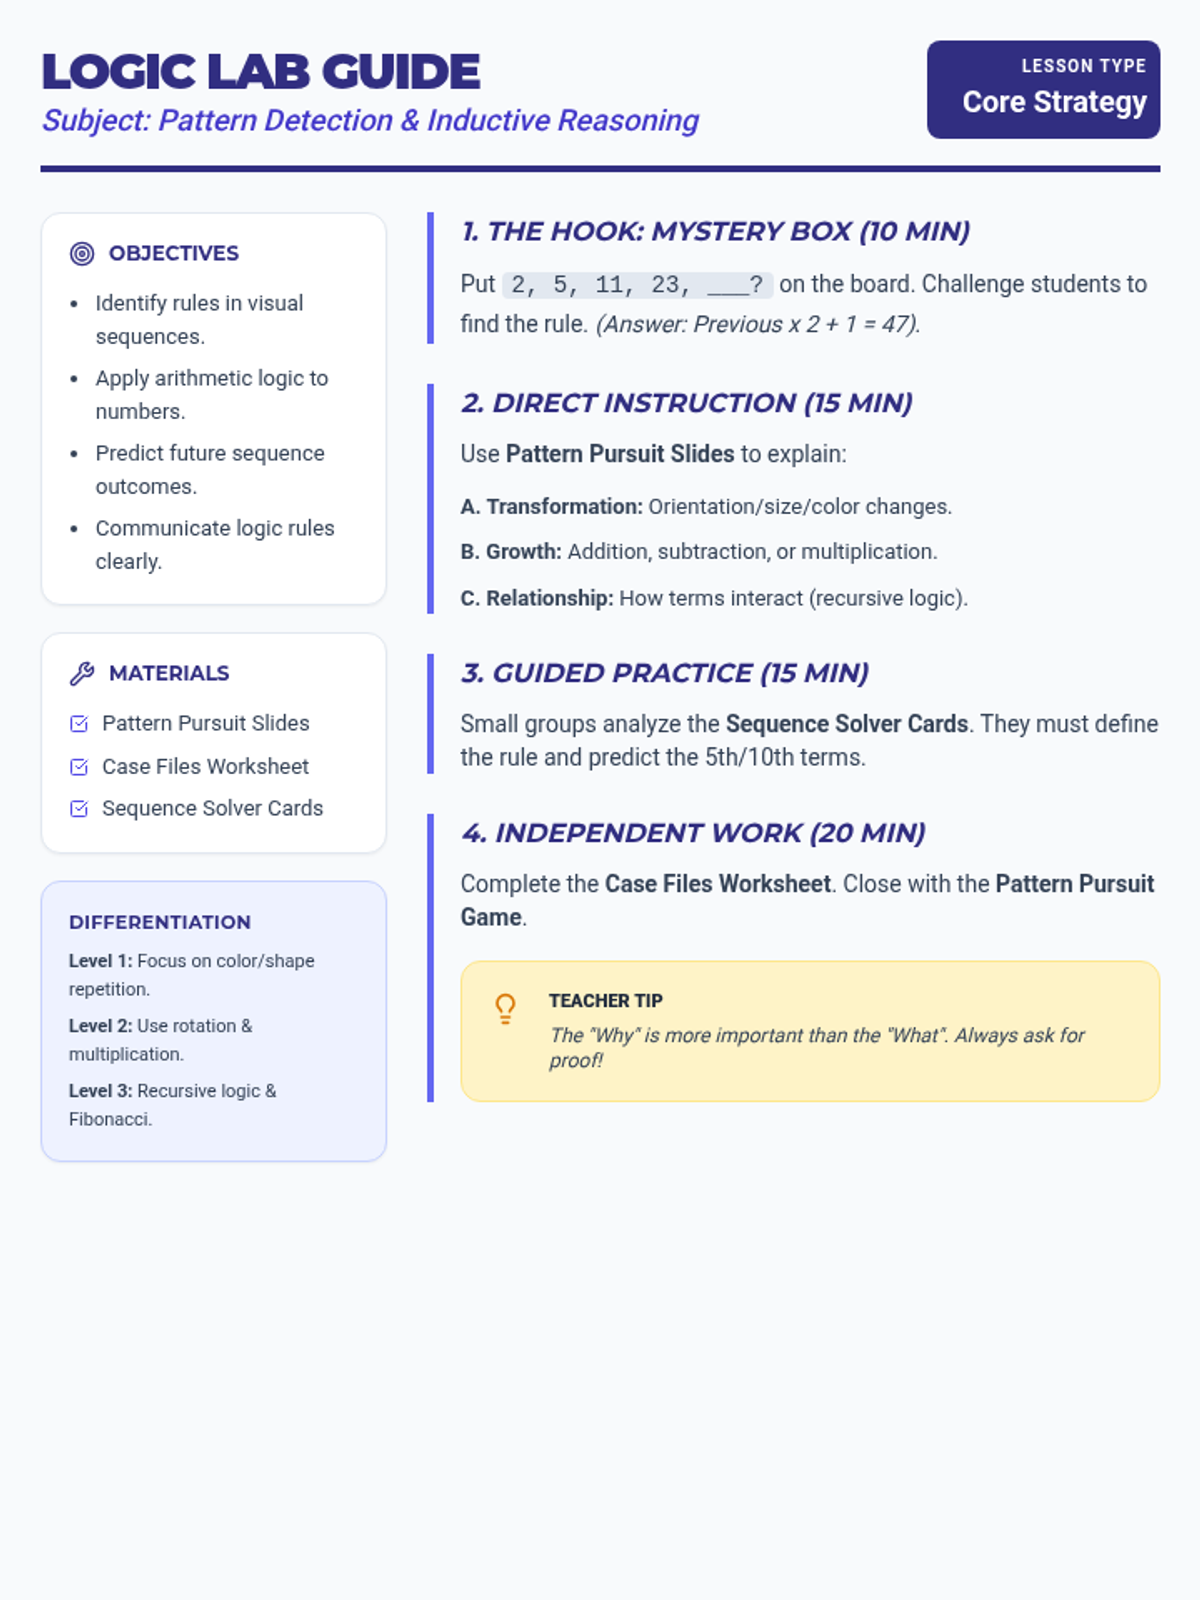
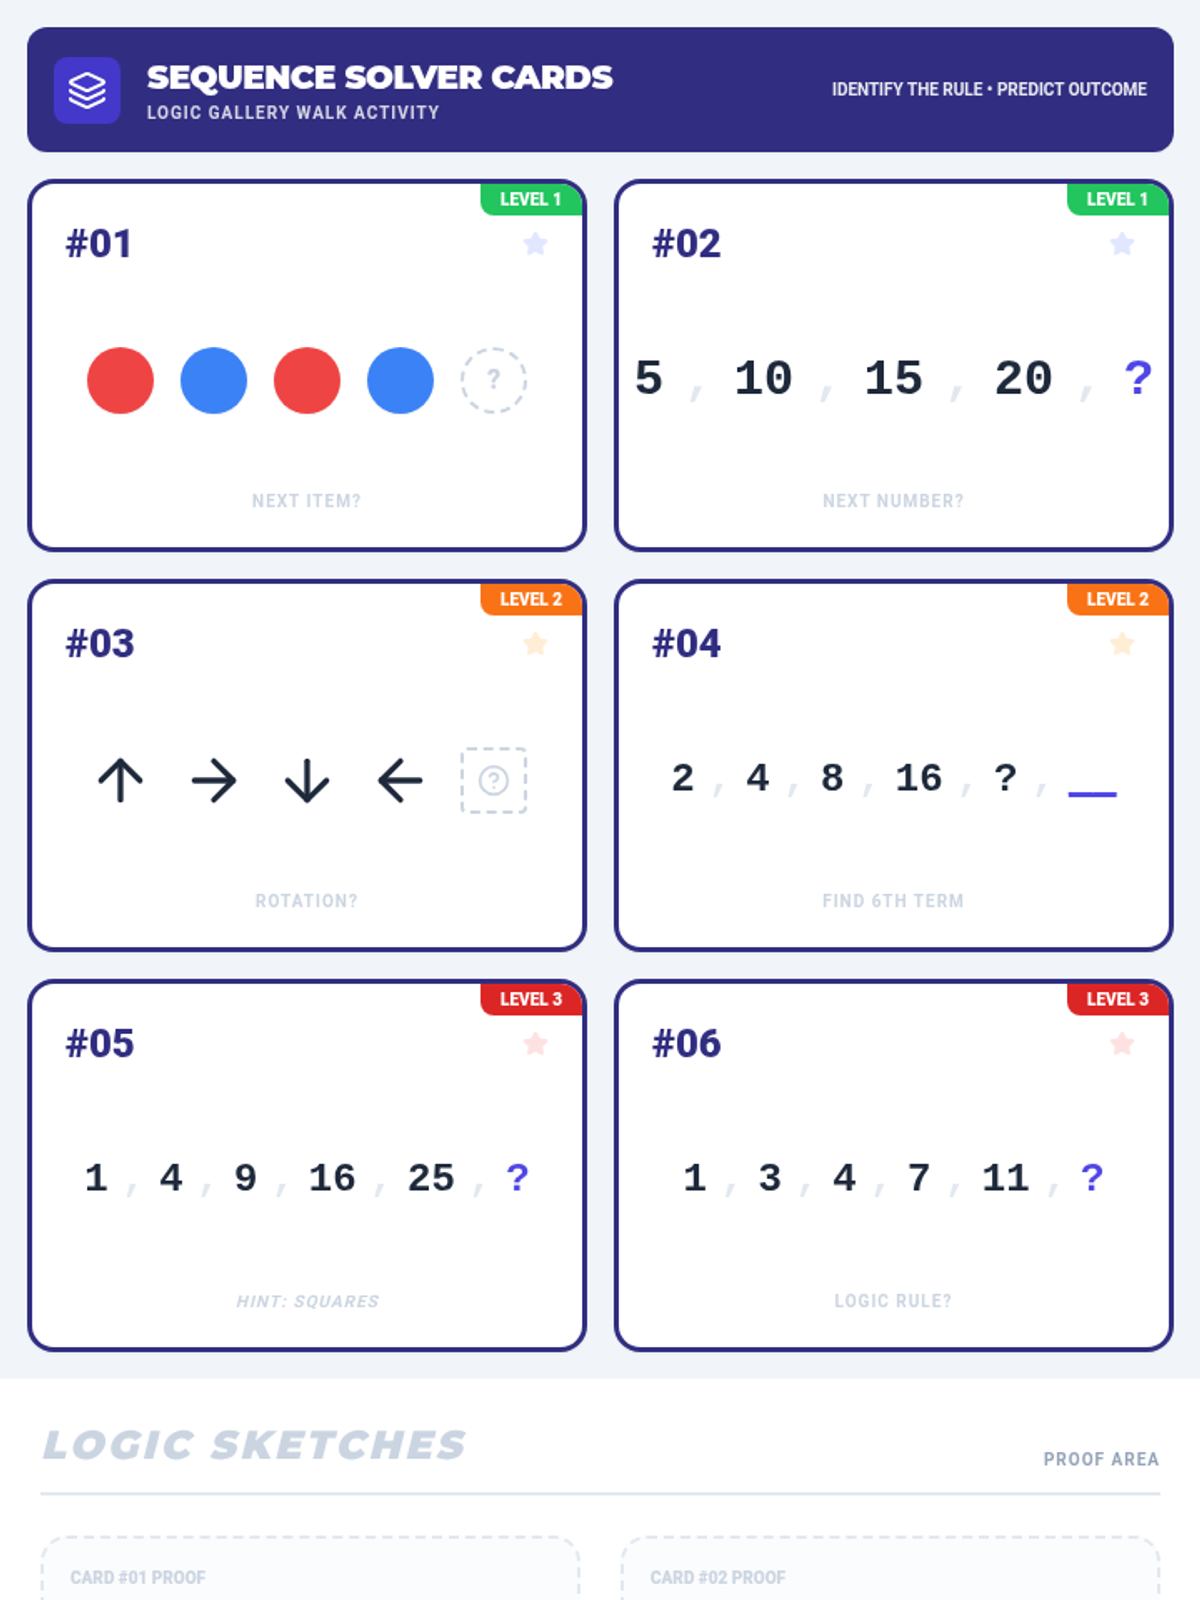
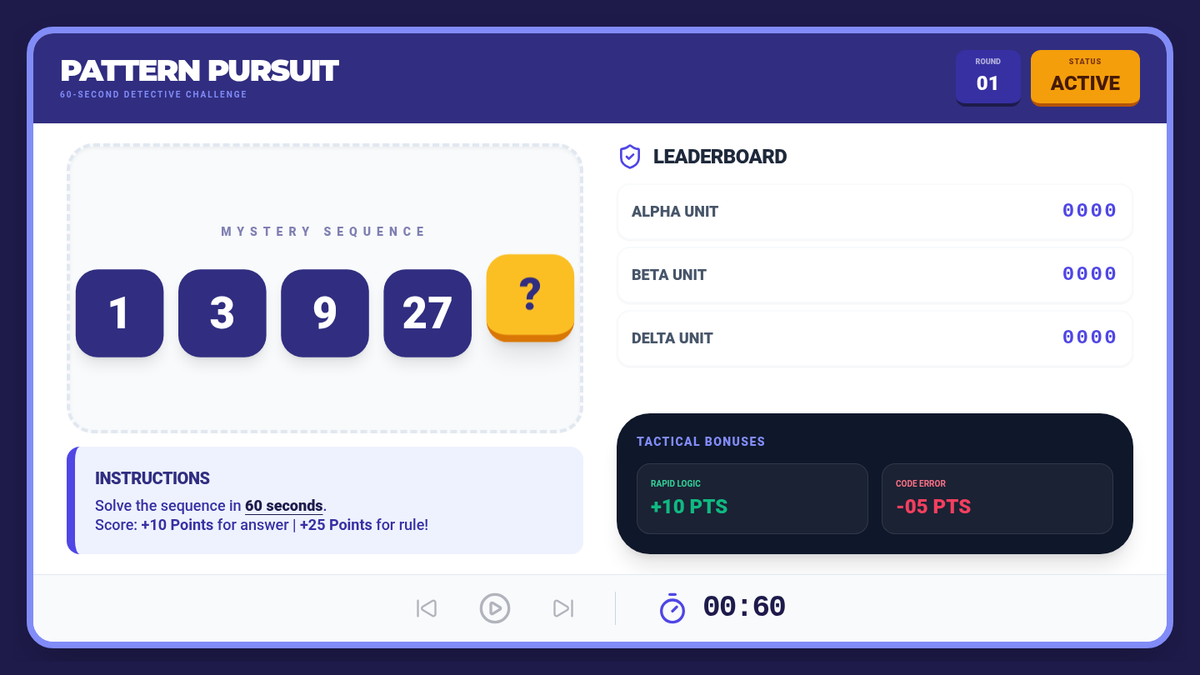
A comprehensive logic lesson where students act as detectives to identify rules in visual and numerical sequences, building inductive reasoning and prediction skills.
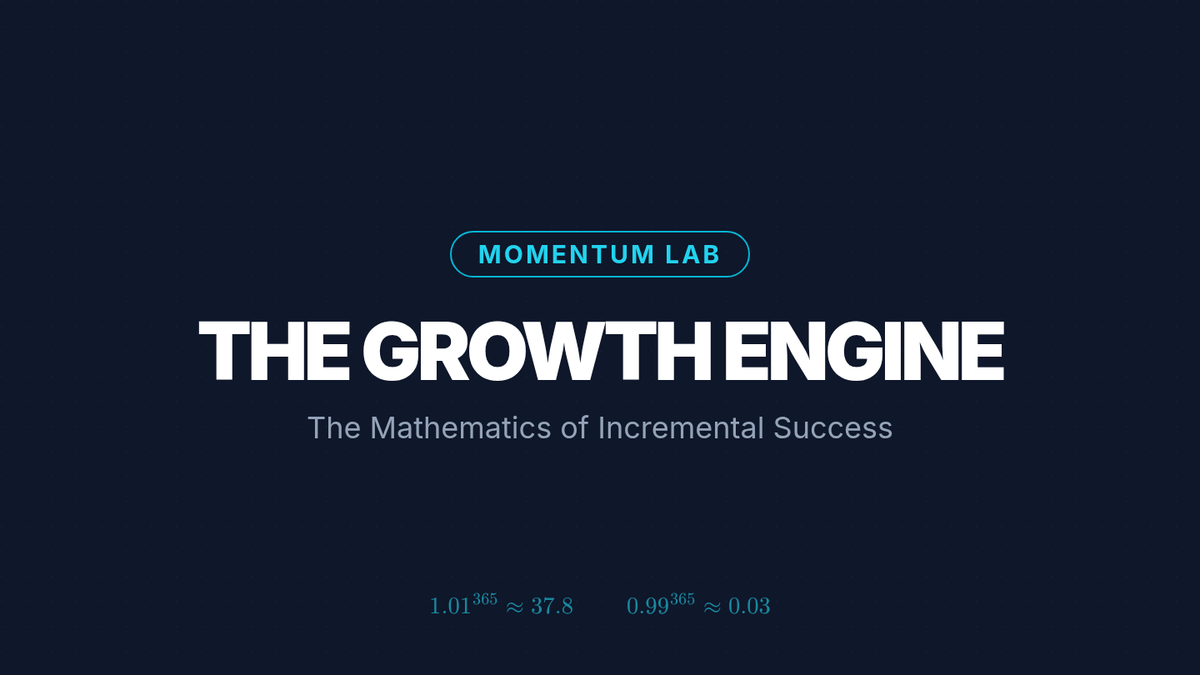
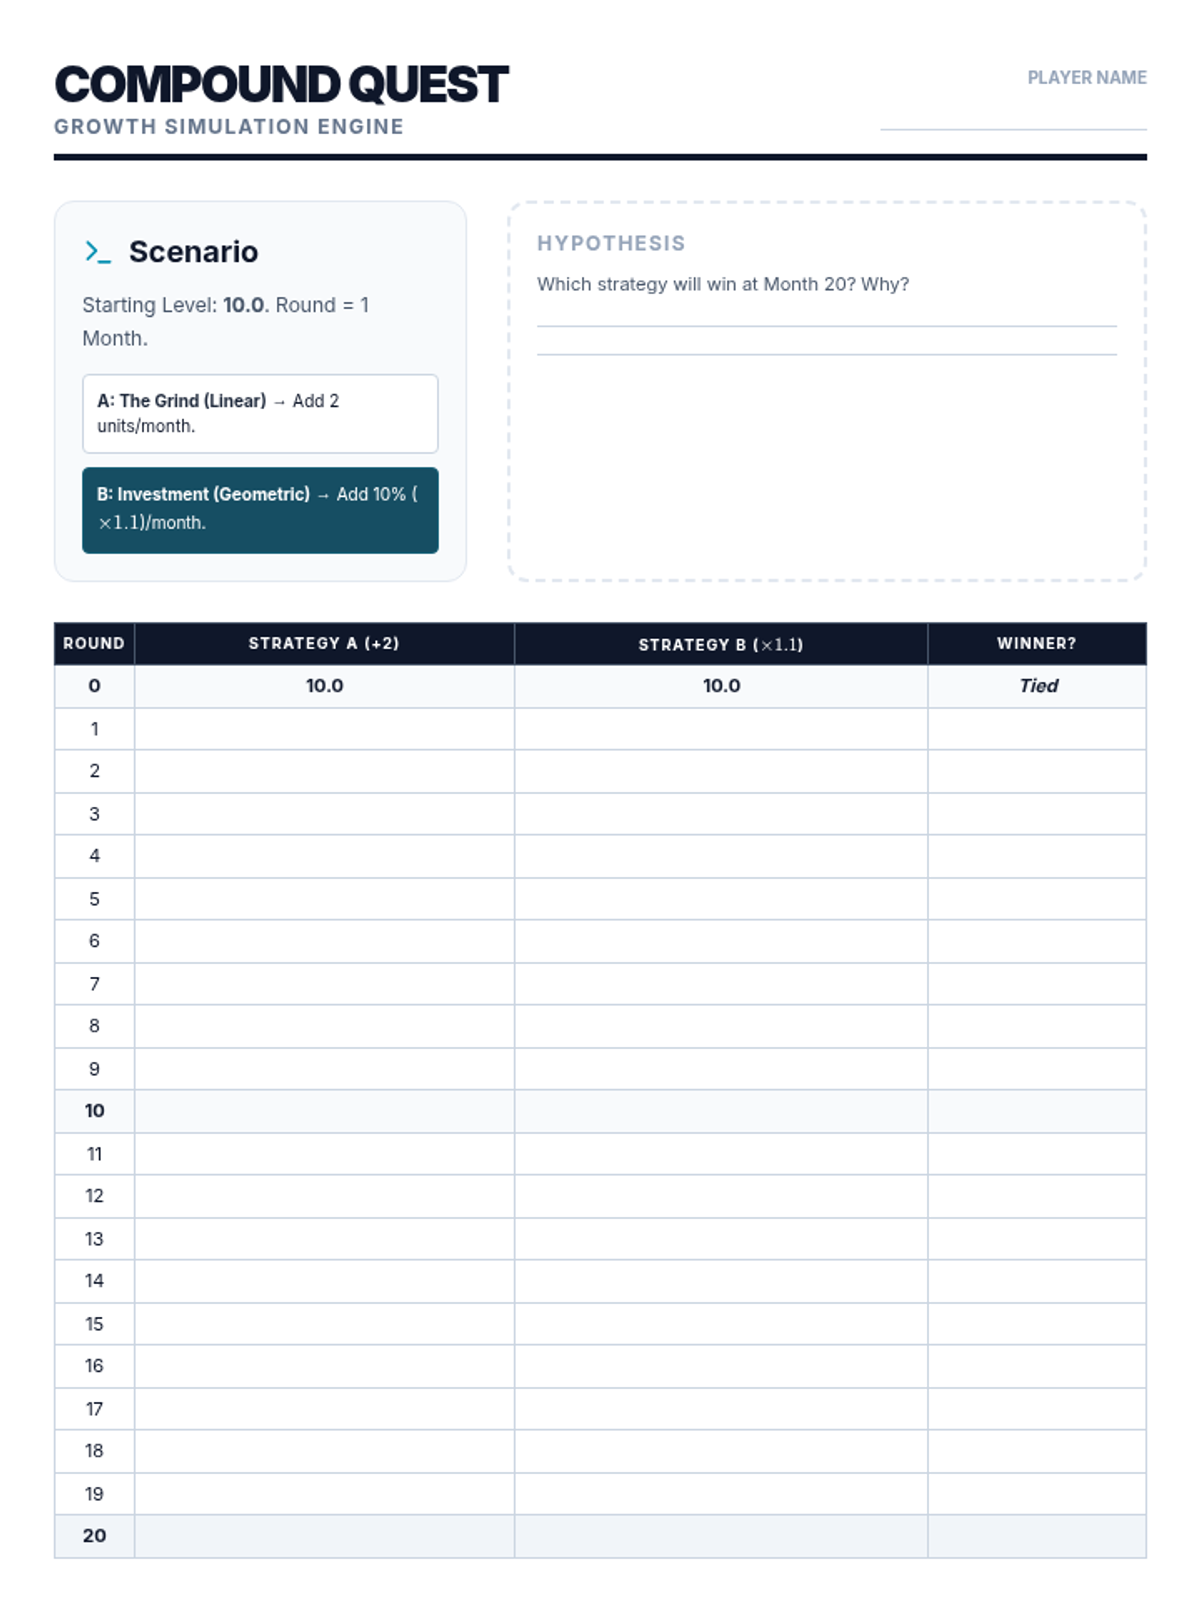
An exploration of geometric growth and the power of incremental habits for grades 7-12, combining mathematical modeling with behavioral science.
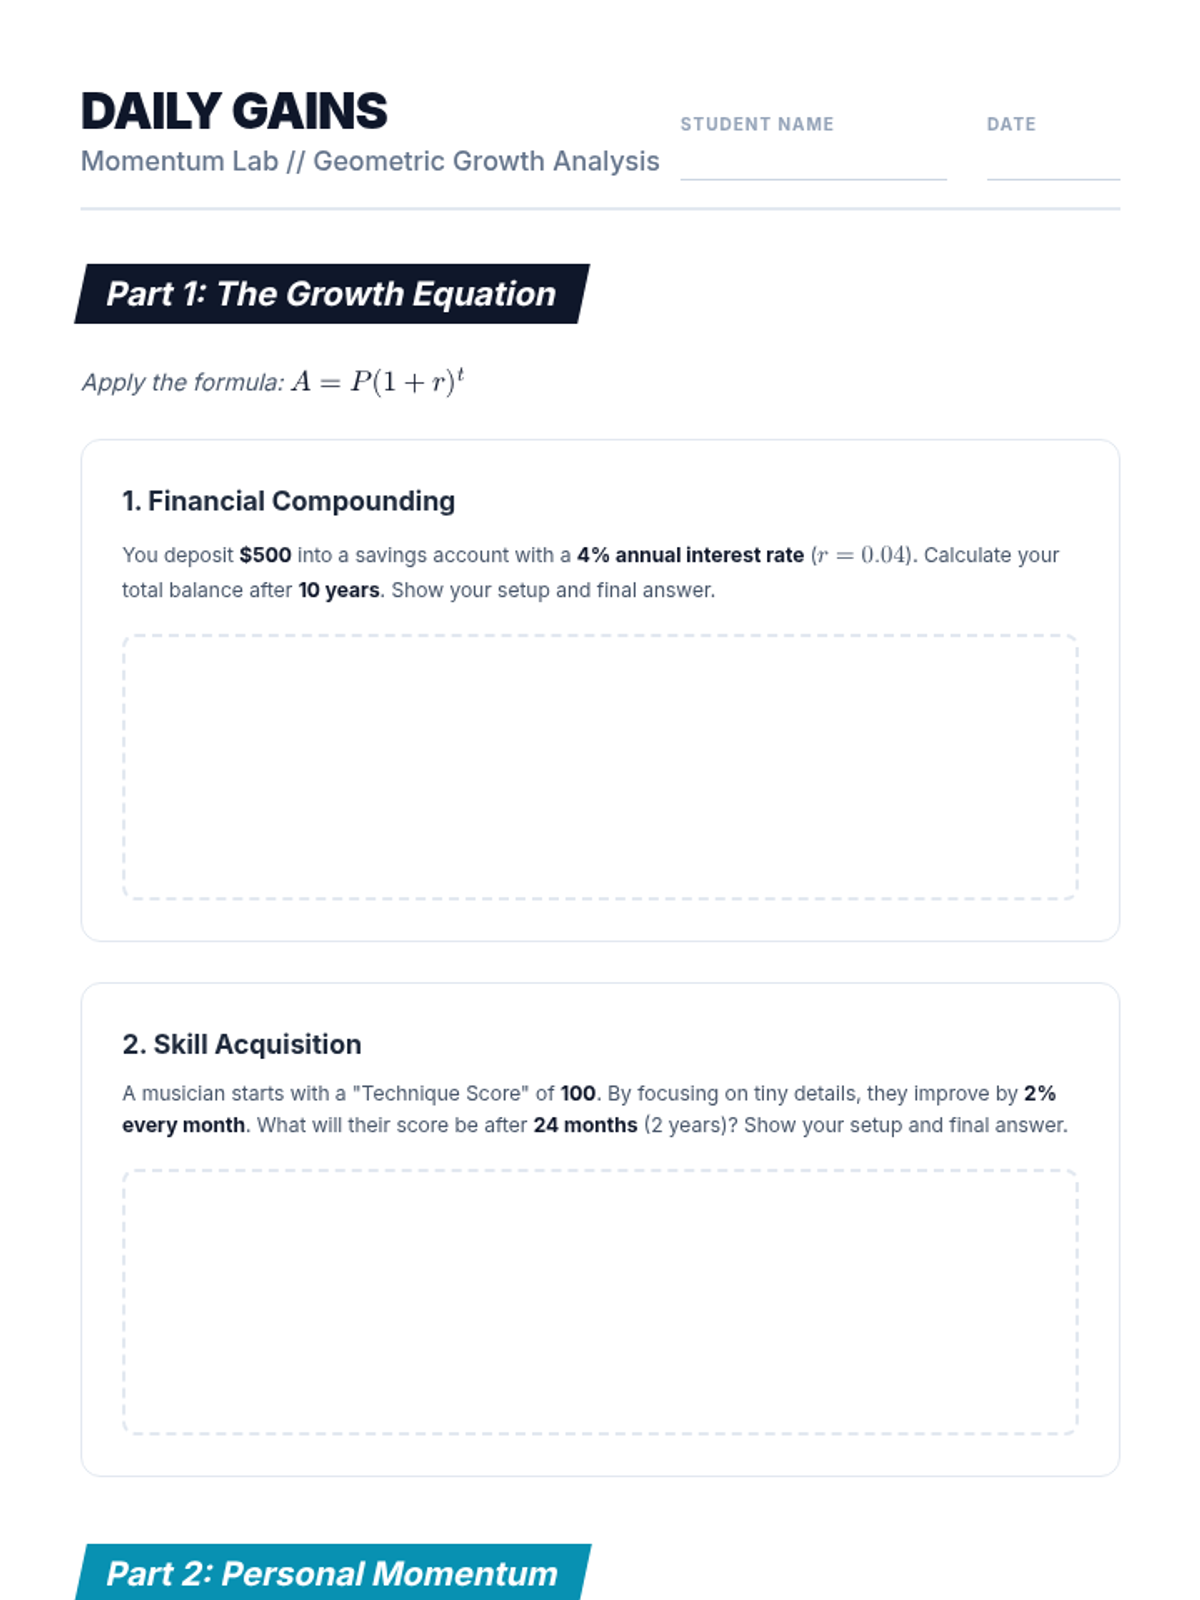
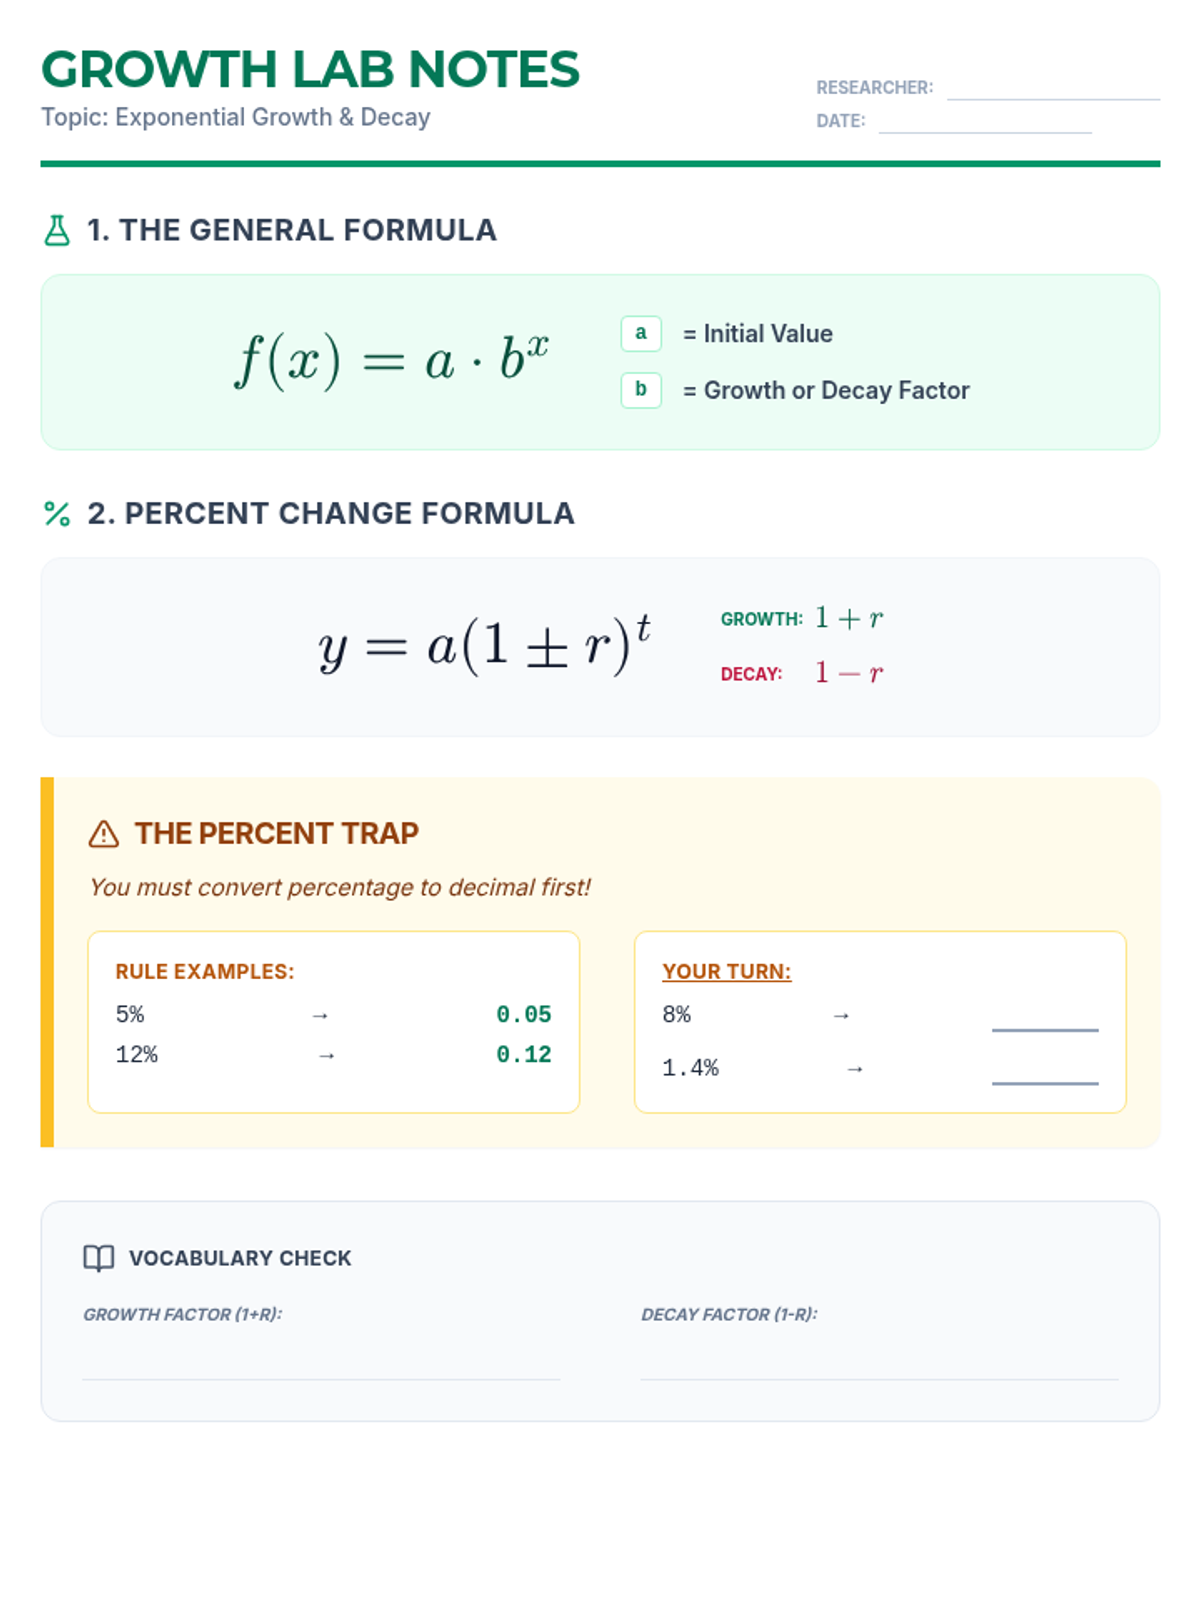
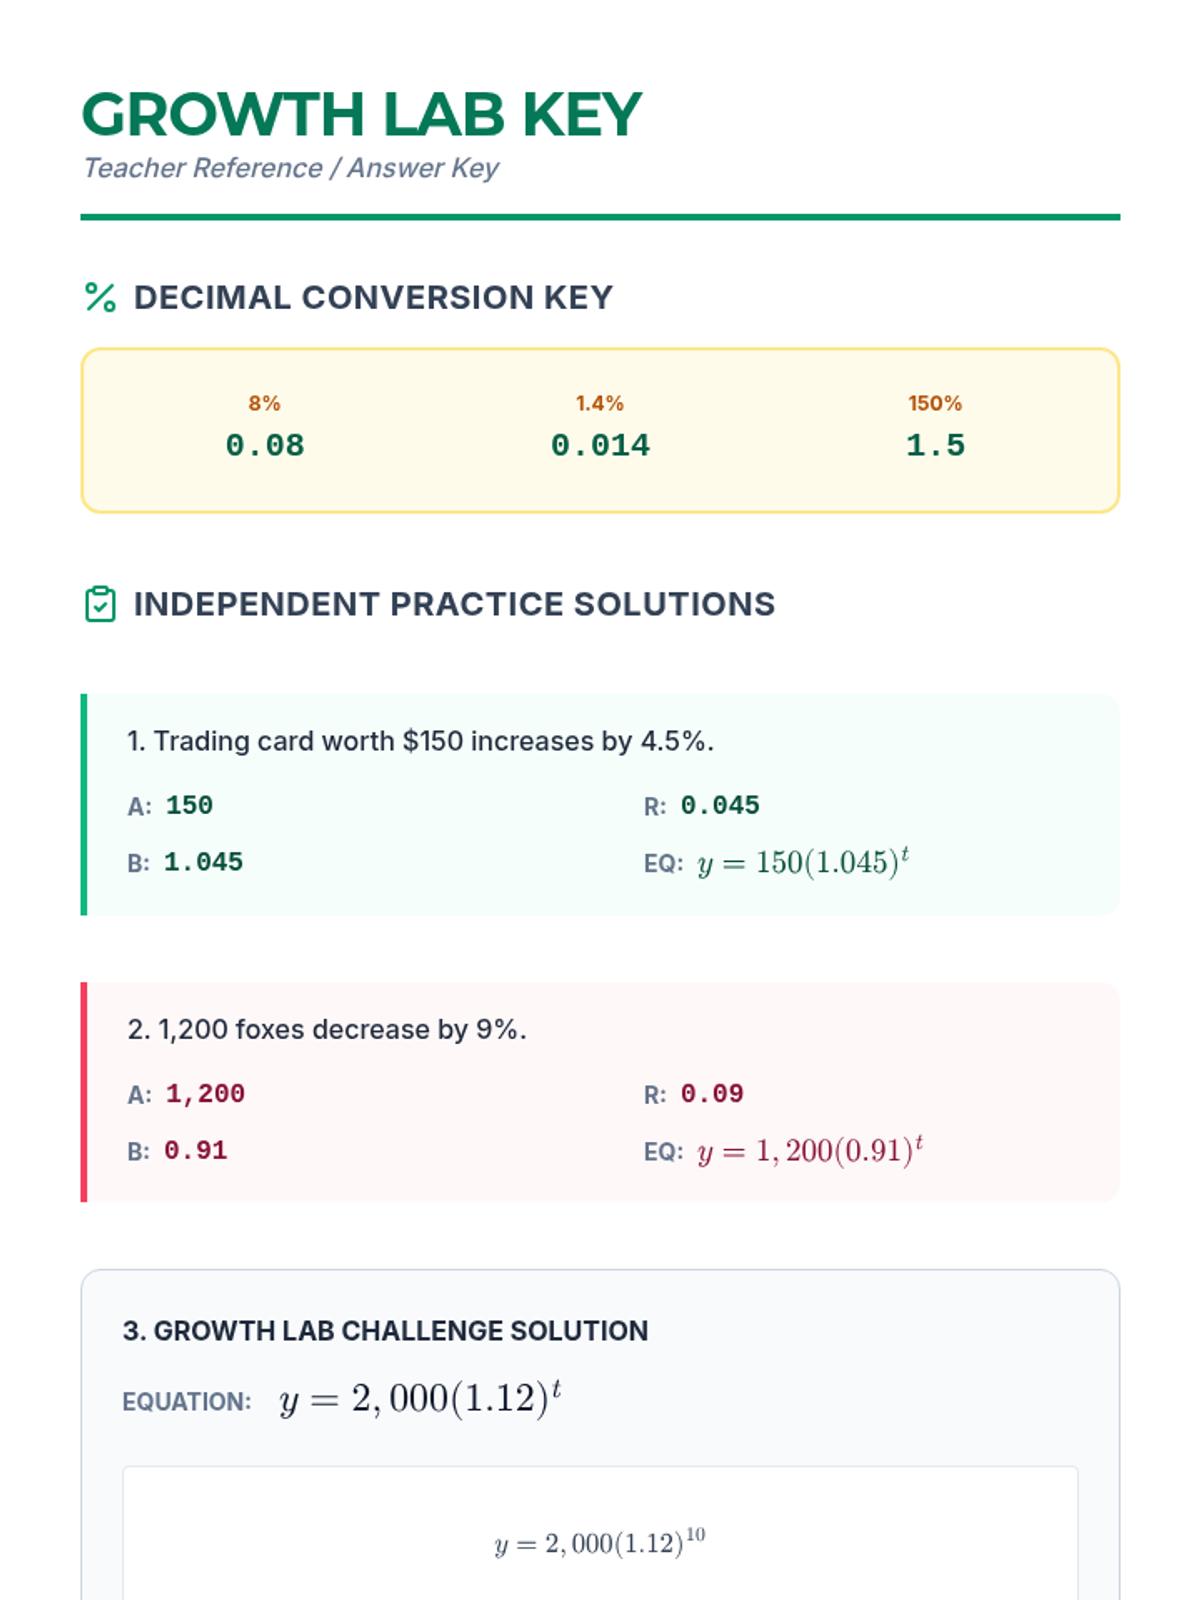
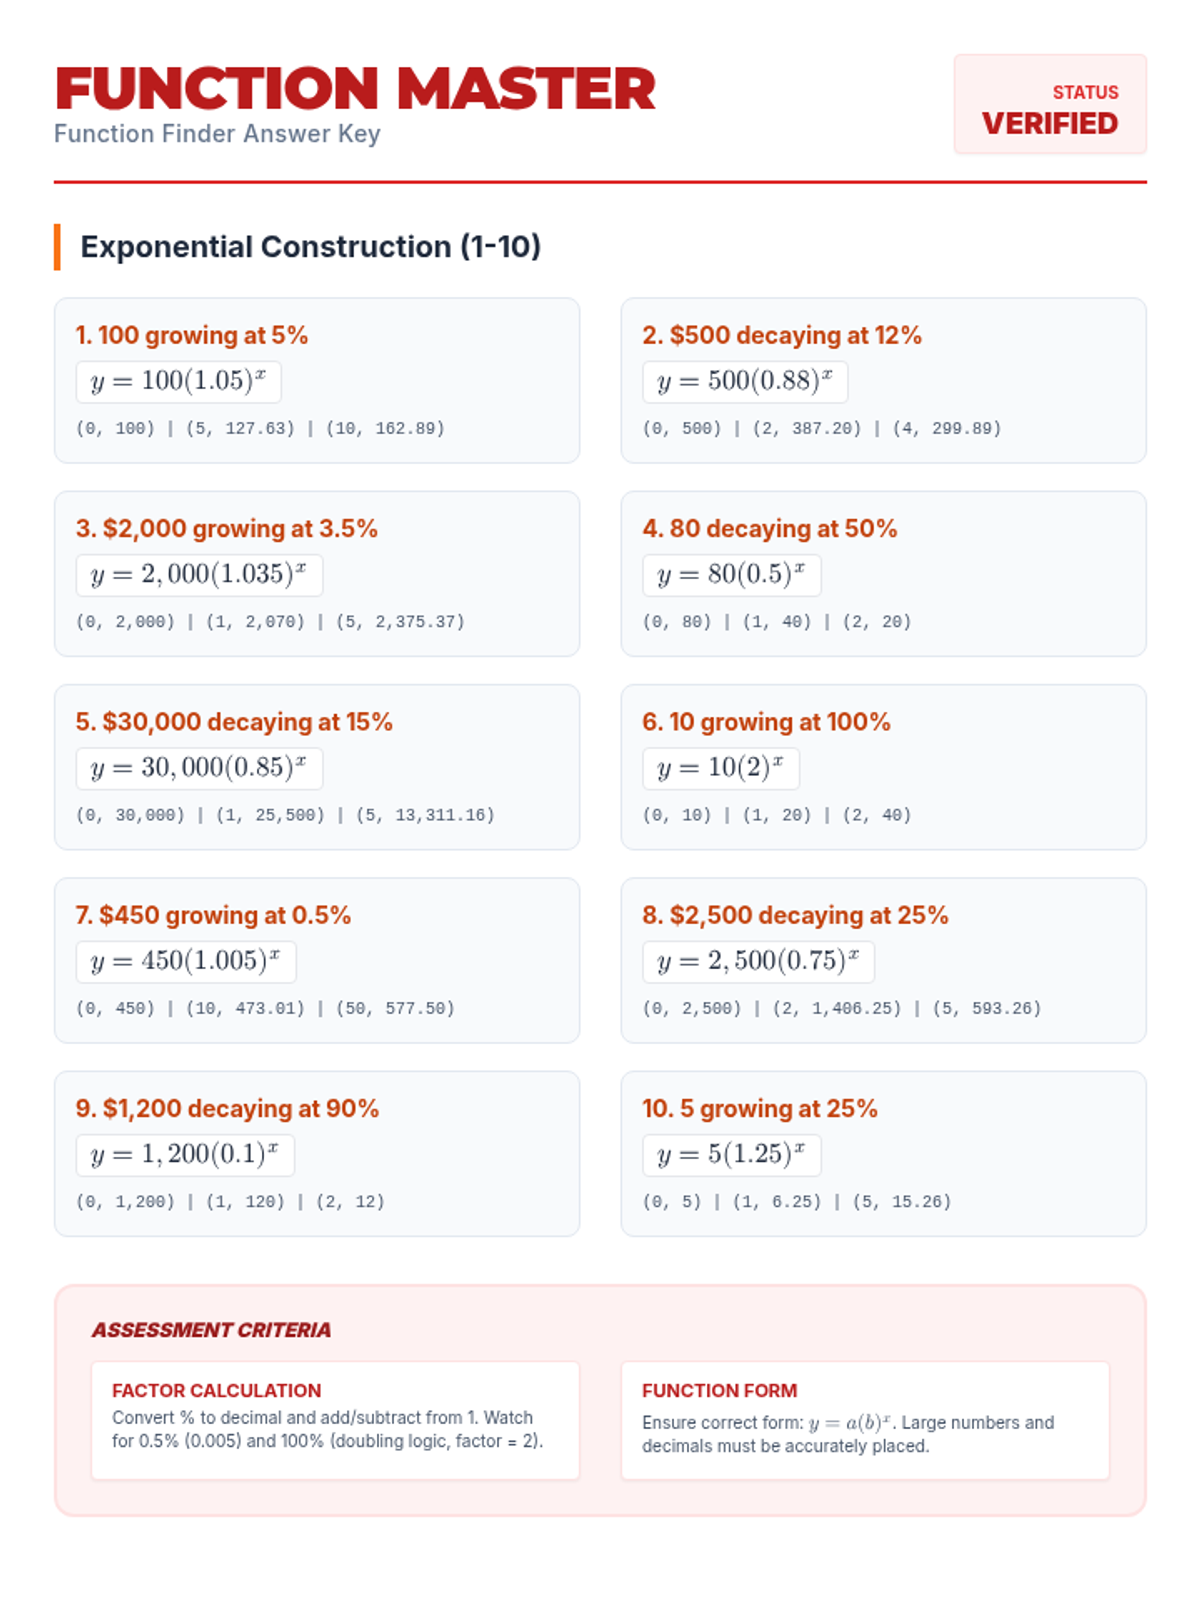
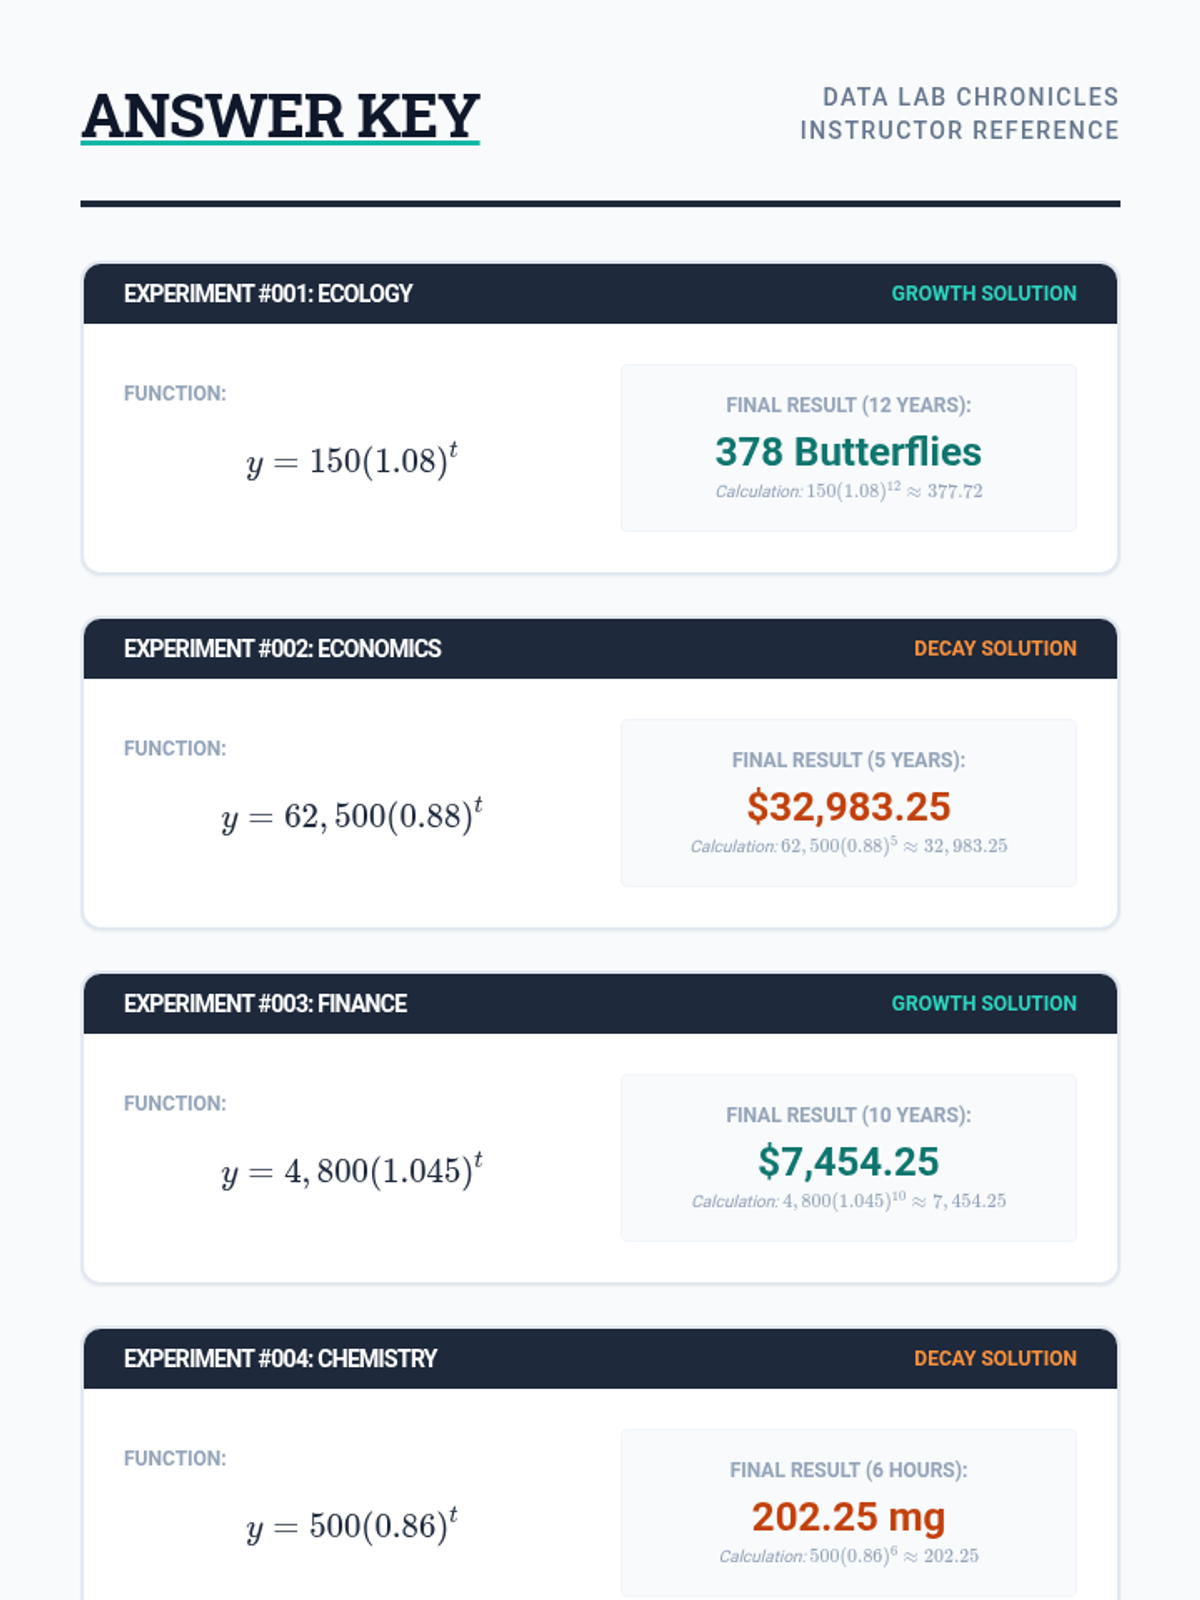
A lesson exploring the mathematics of exponential growth and decay through real-world scenarios, focusing on formula mastery and percentage-to-decimal conversion.
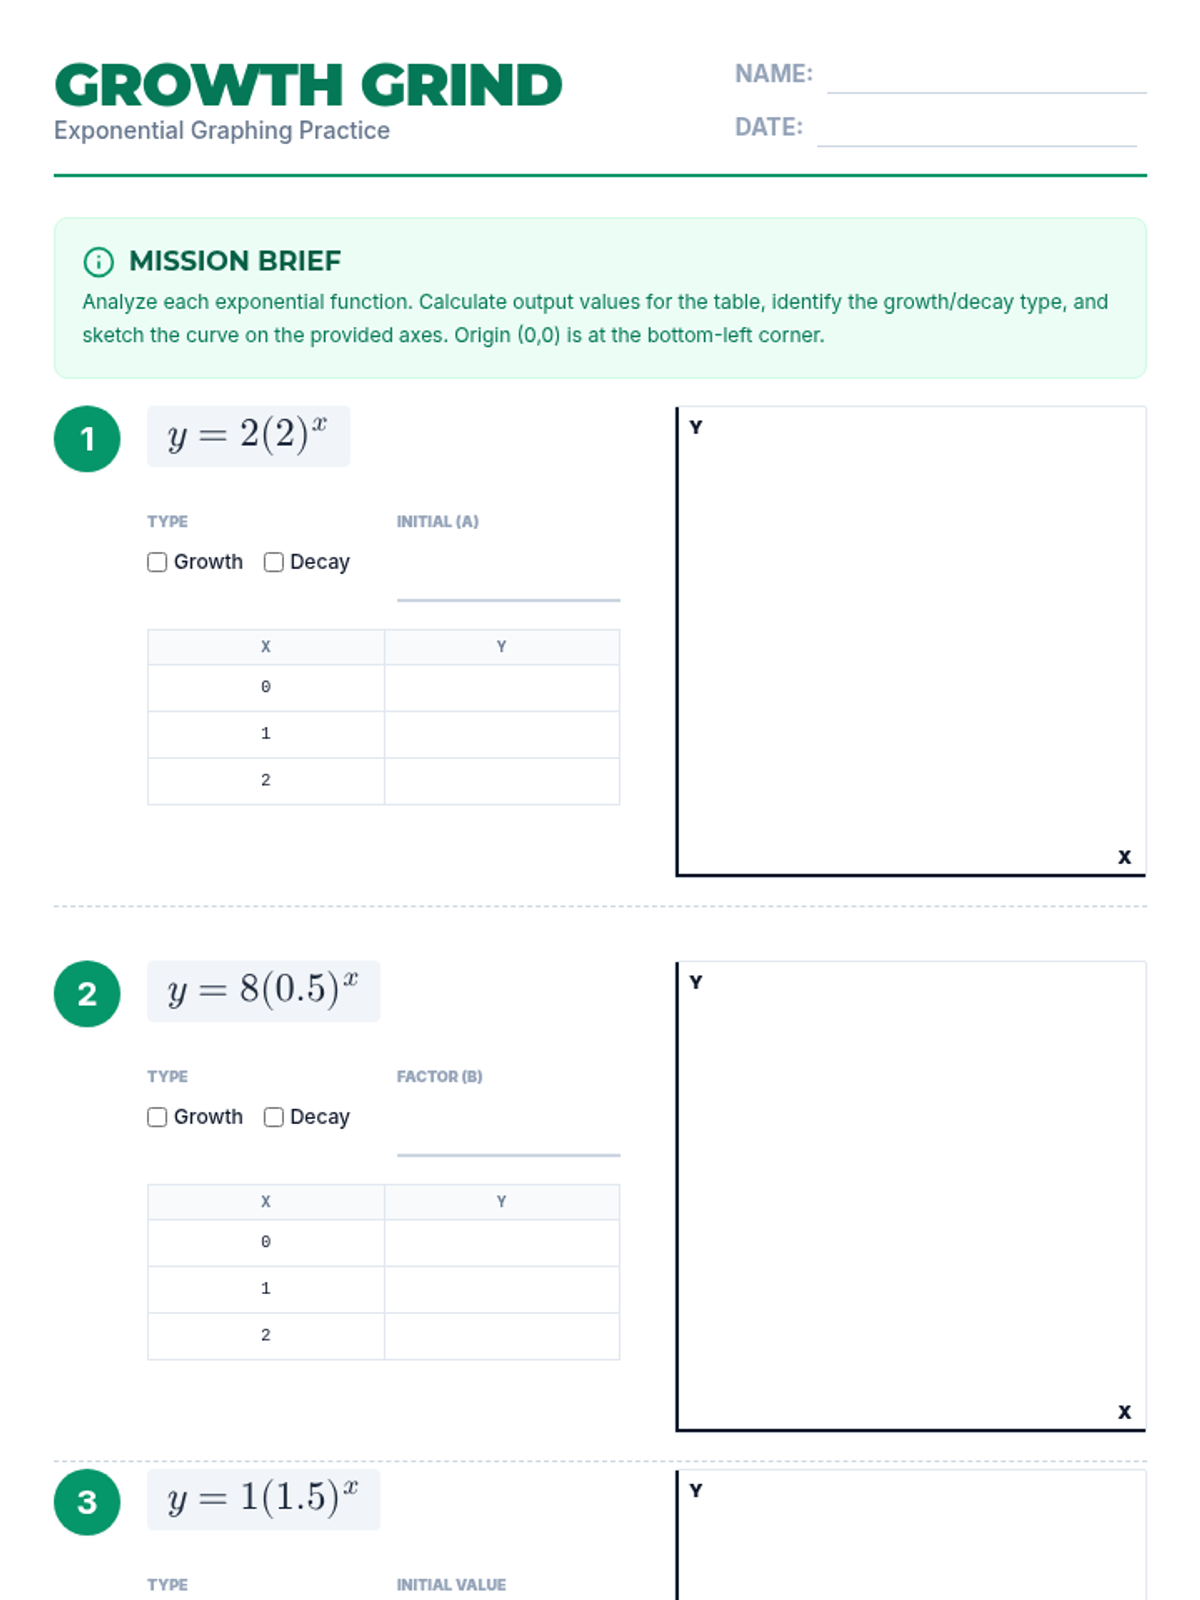
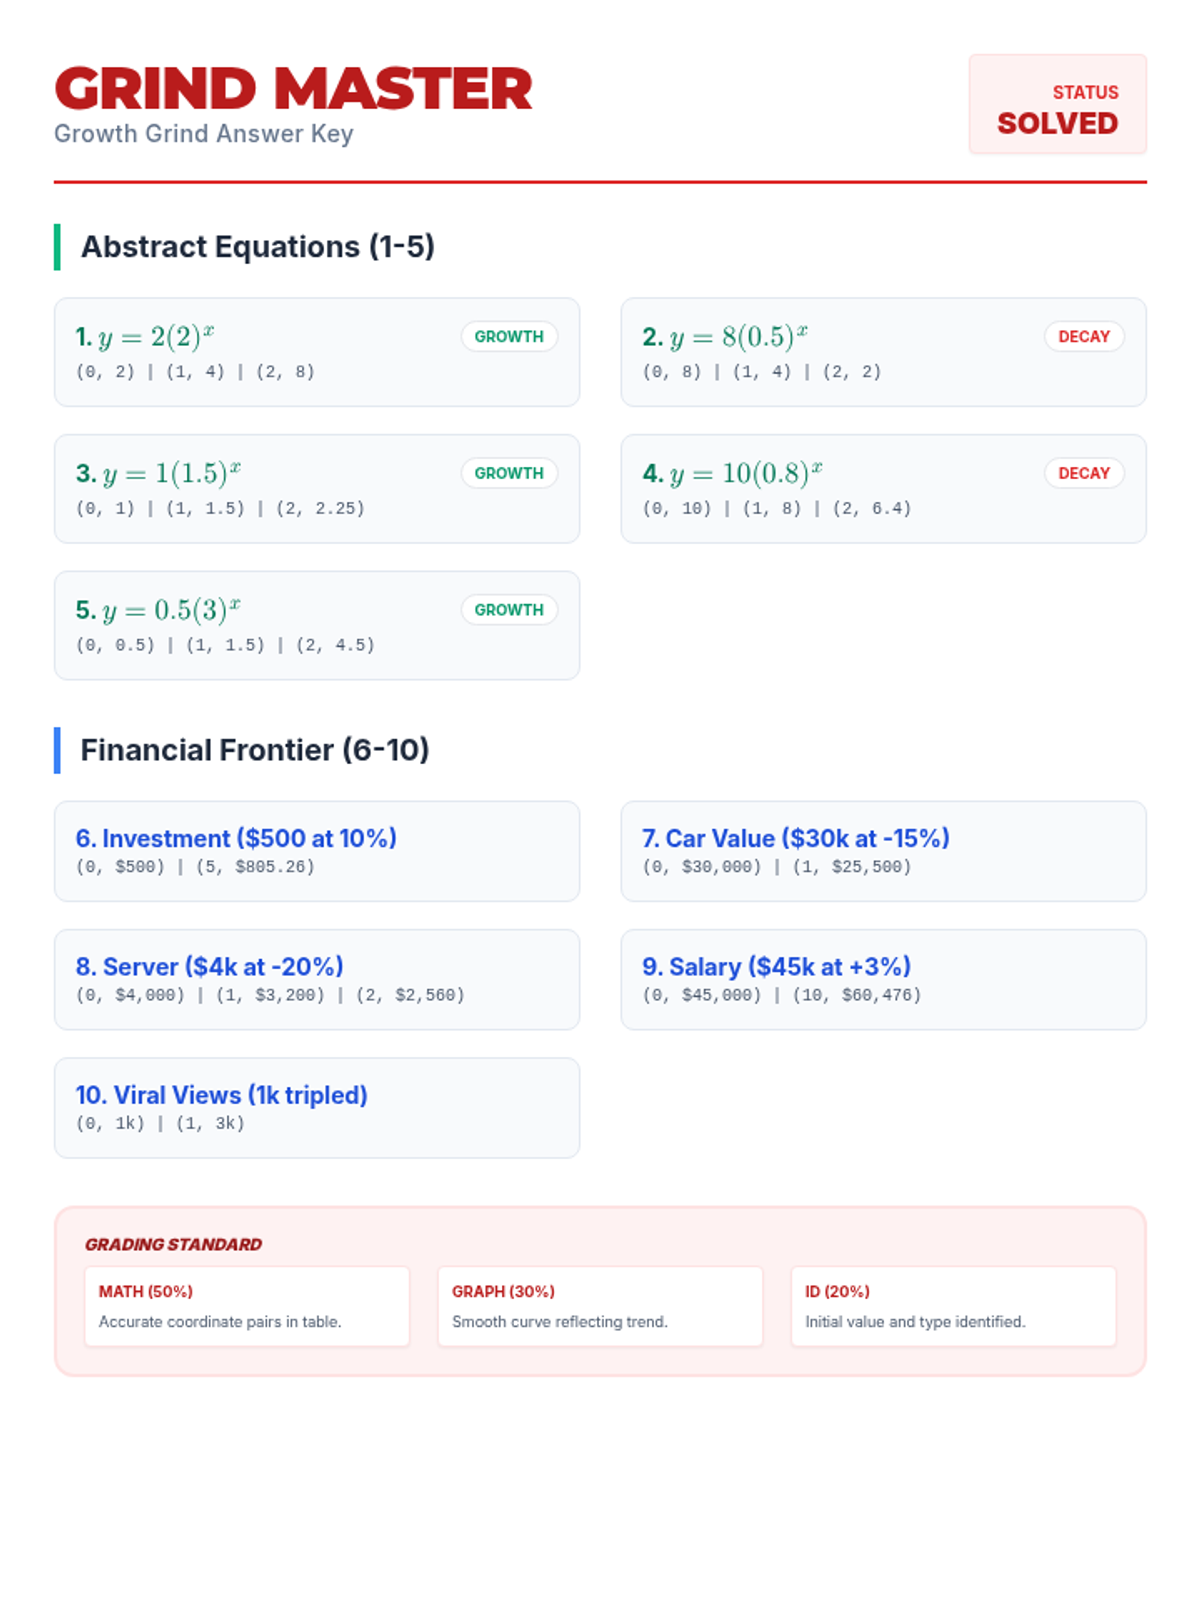
A fast-paced exploration of exponential growth and decay through abstract equations and real-world financial scenarios. Students practice graphing curves and calculating data points to visualize rapid change.
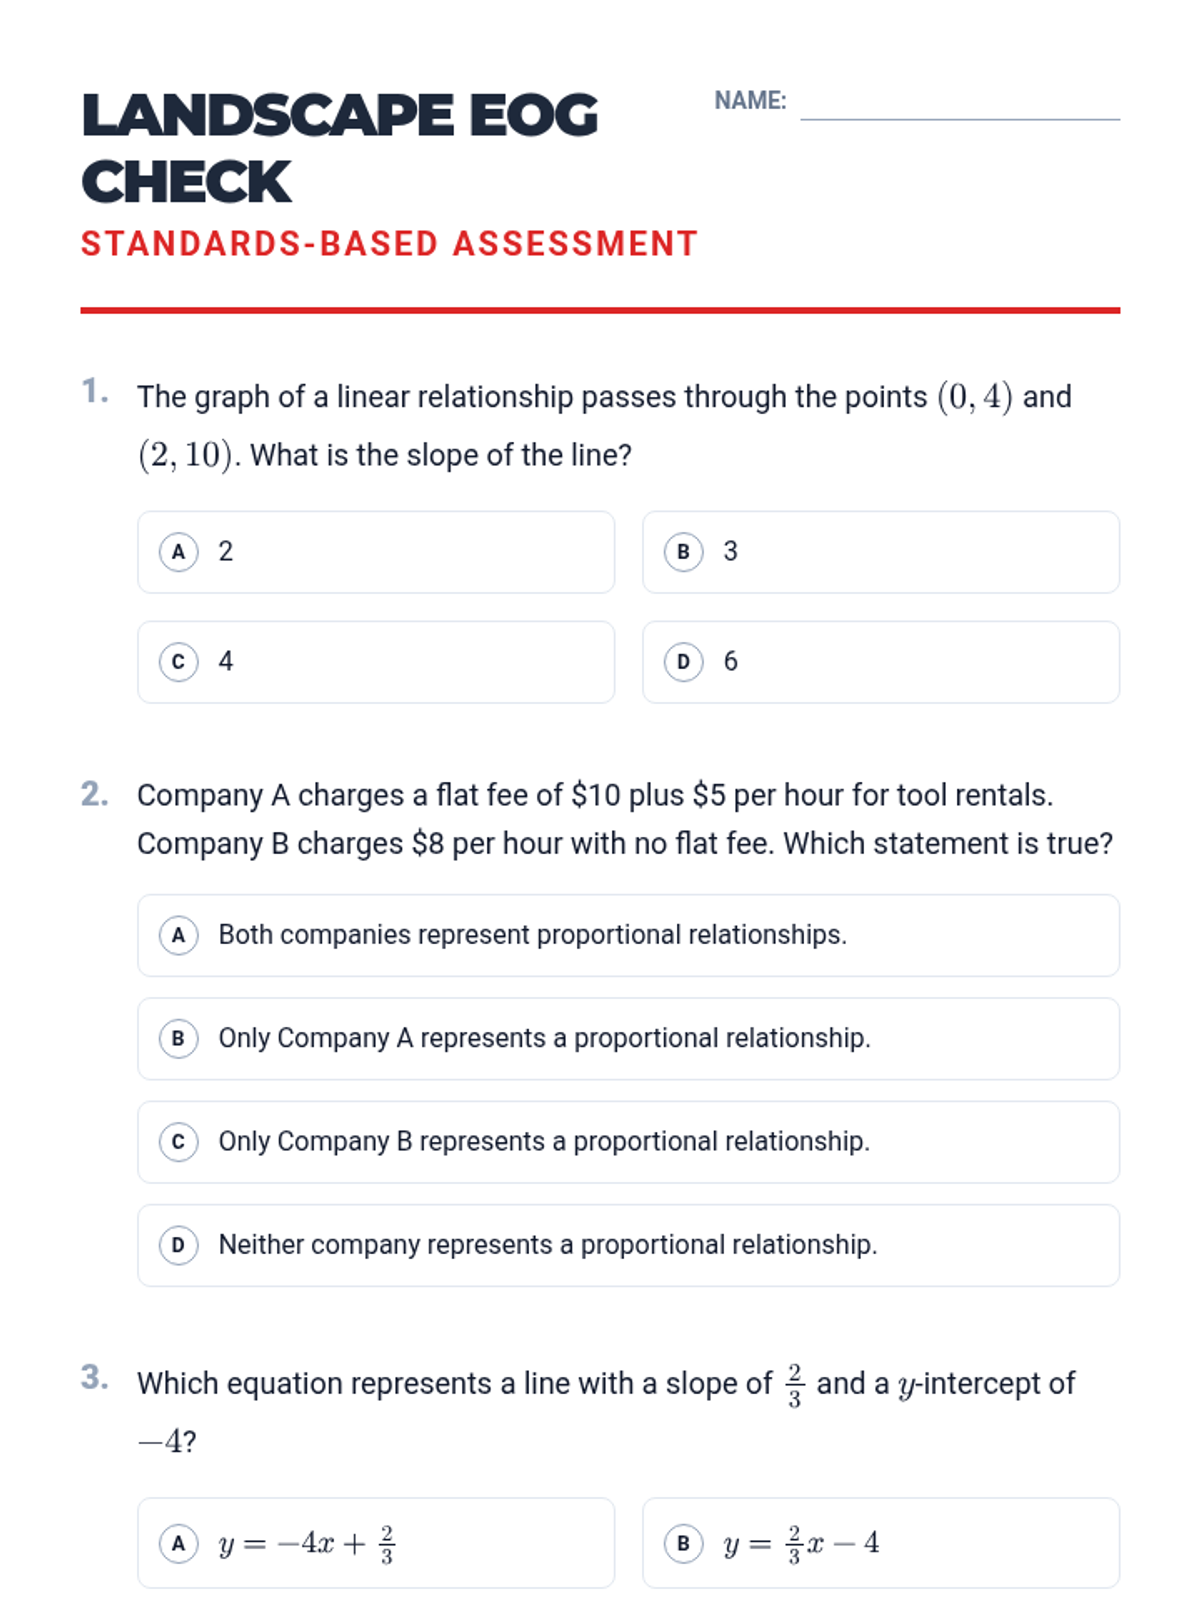
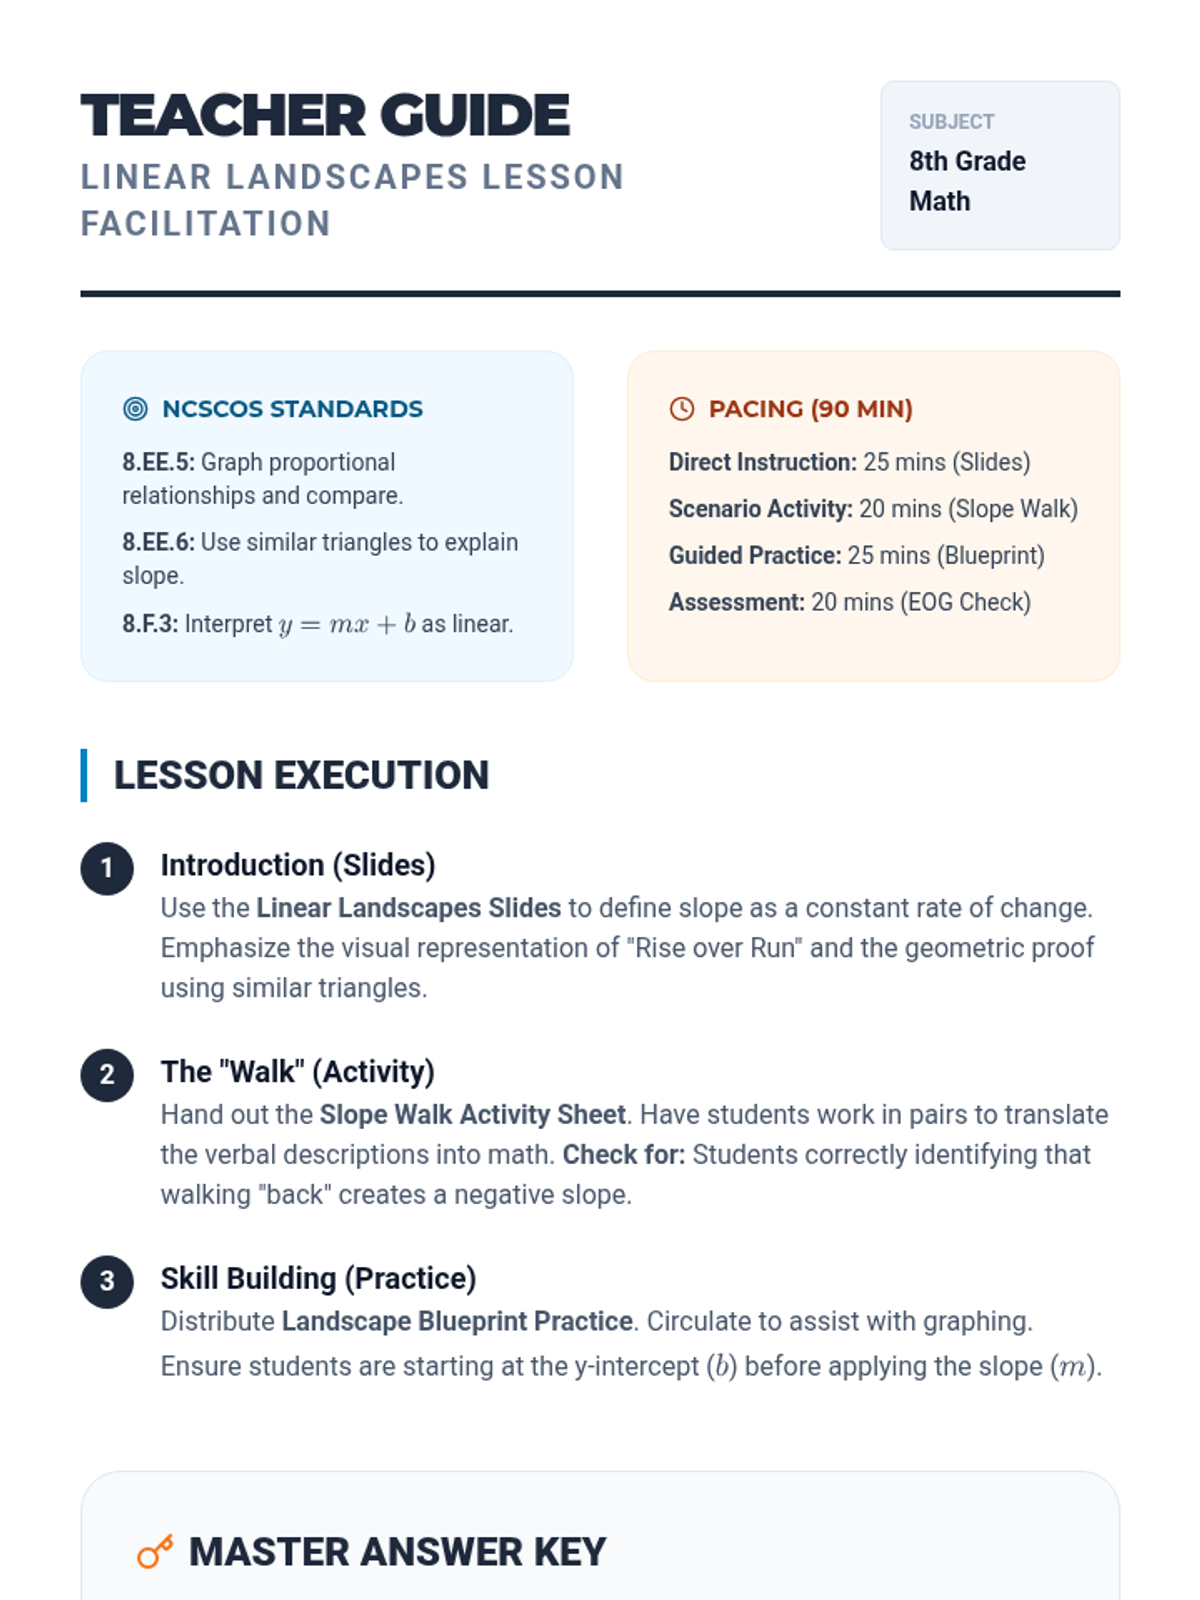
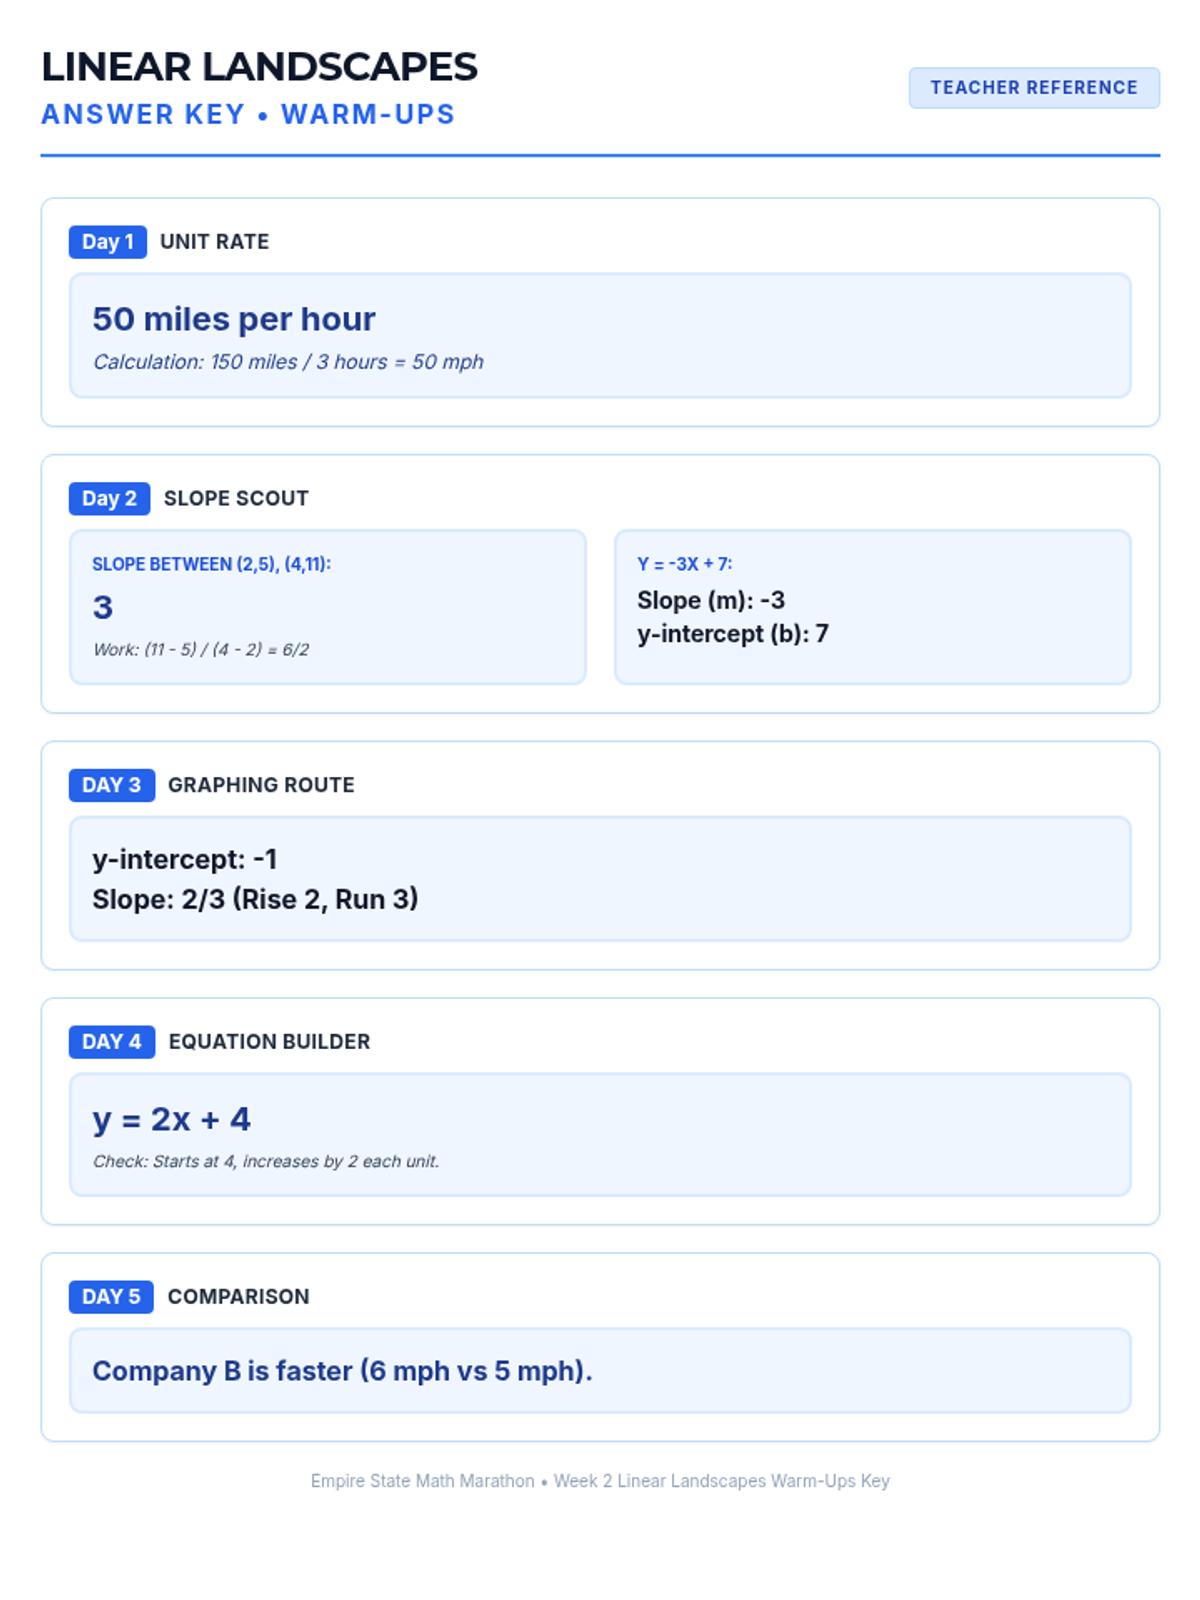
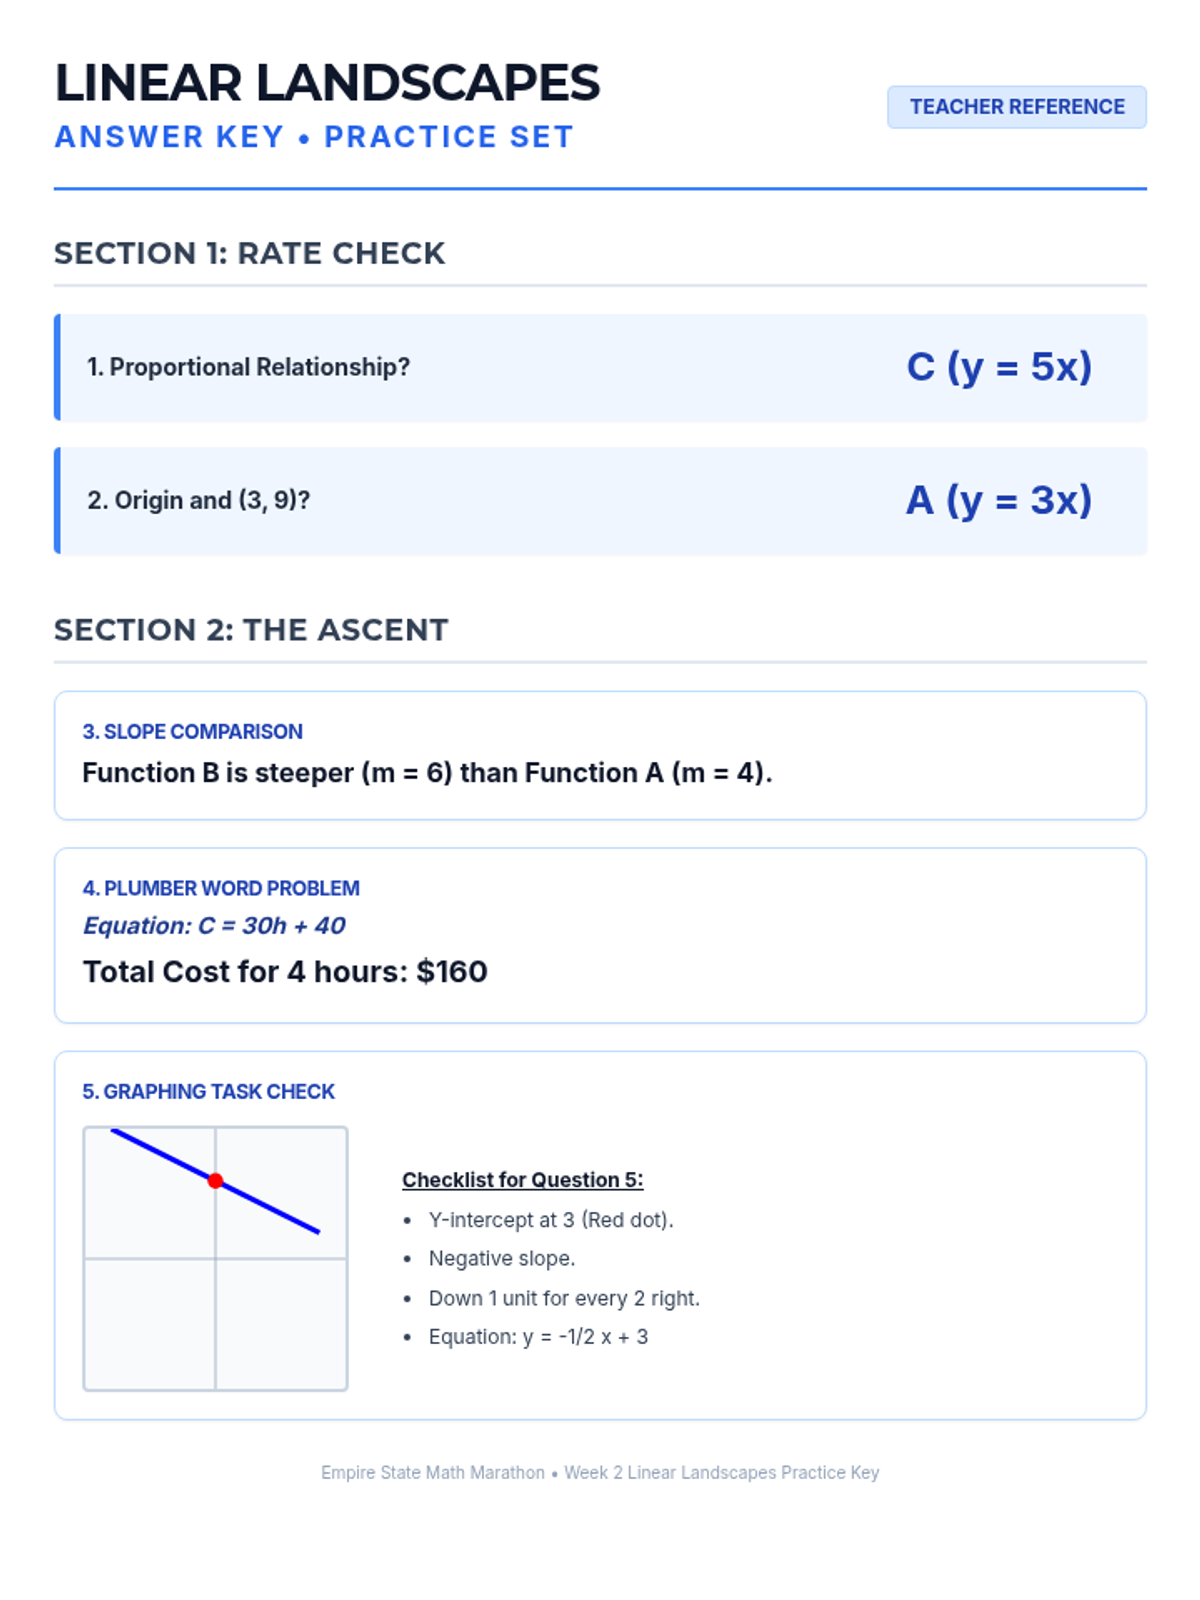
A comprehensive Grade 8 math lesson on linear relationships, covering slope, y-intercept, and graphing equations in slope-intercept form, aligned to NCSCOS standards.
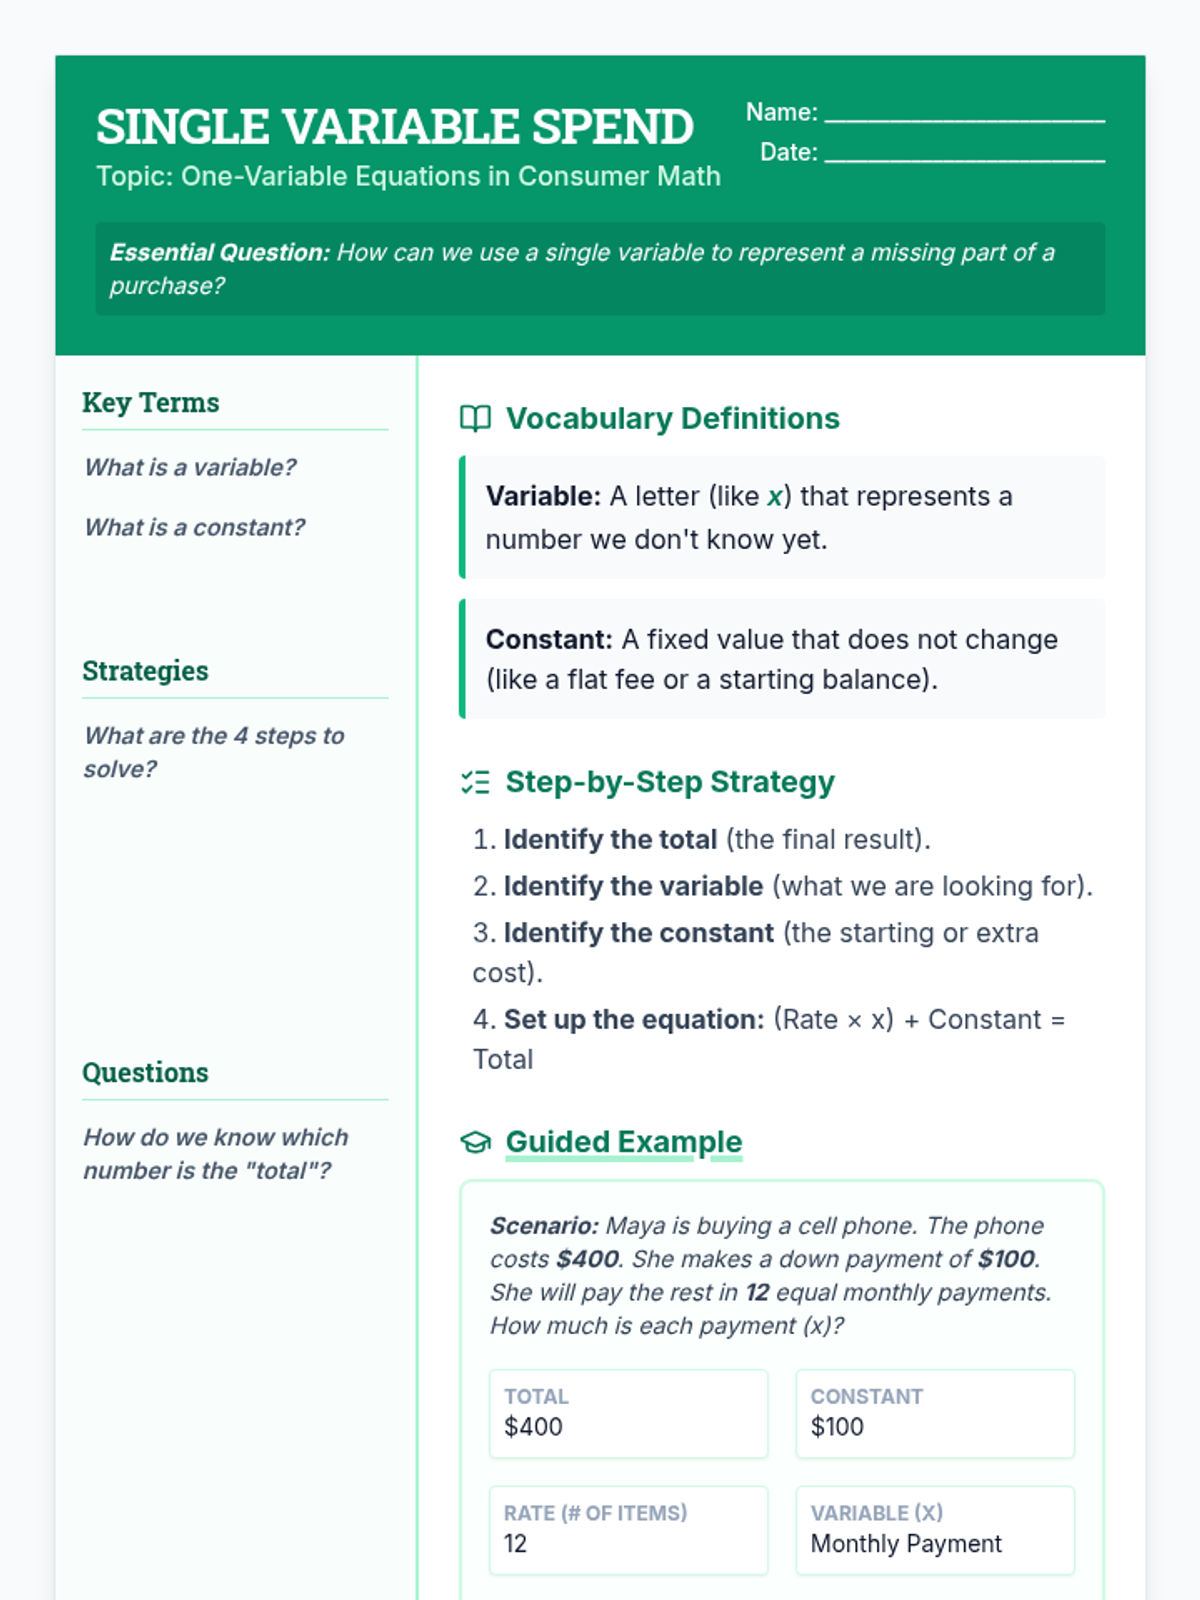
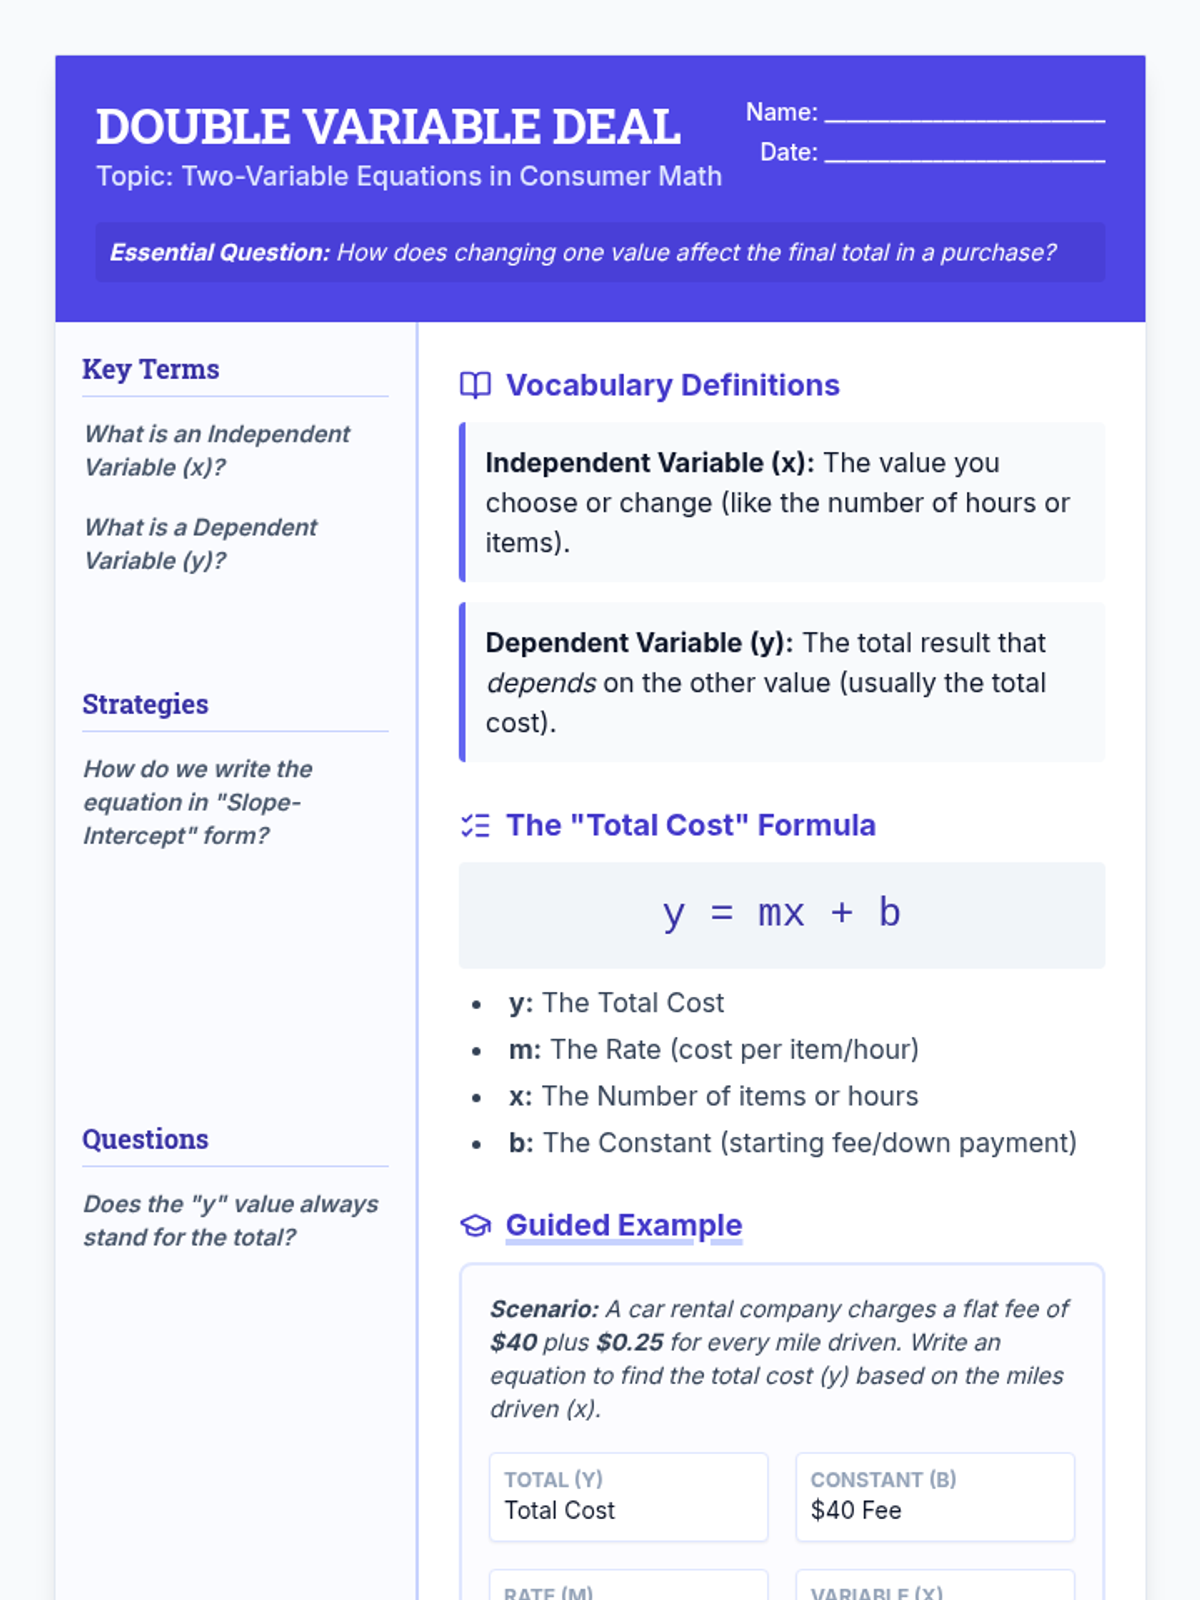
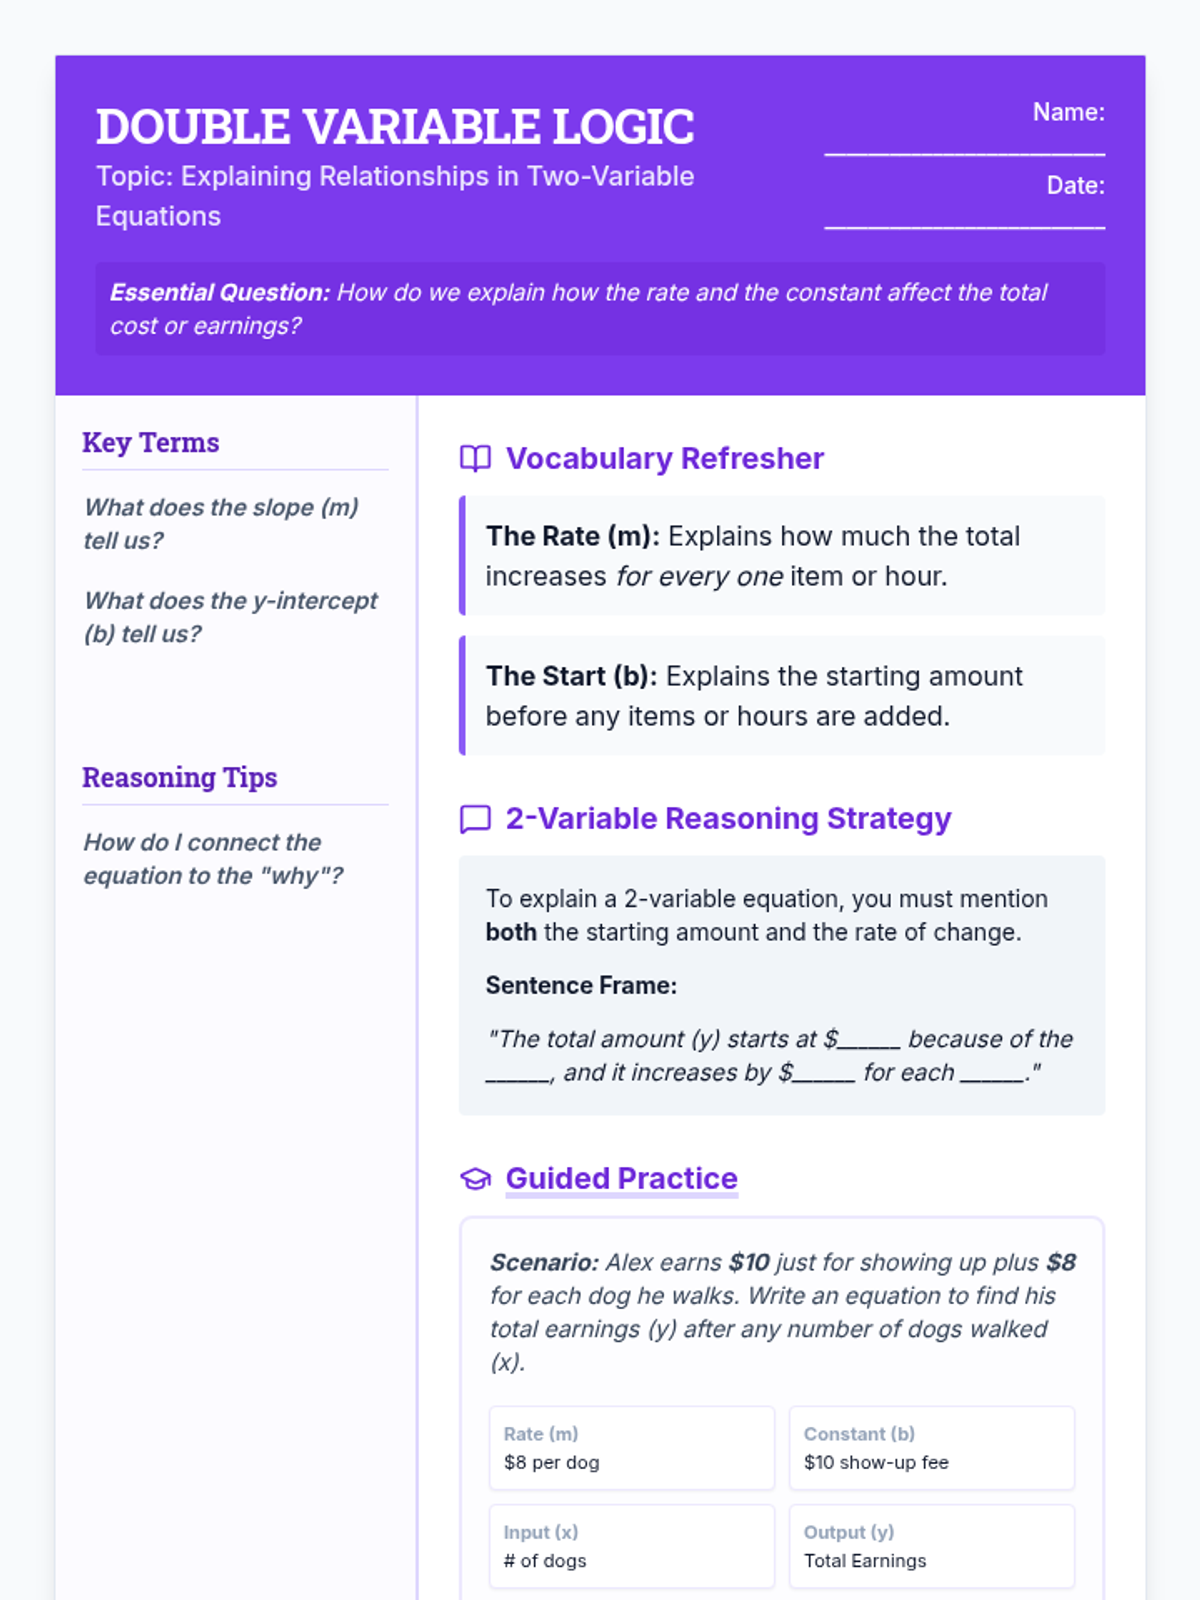
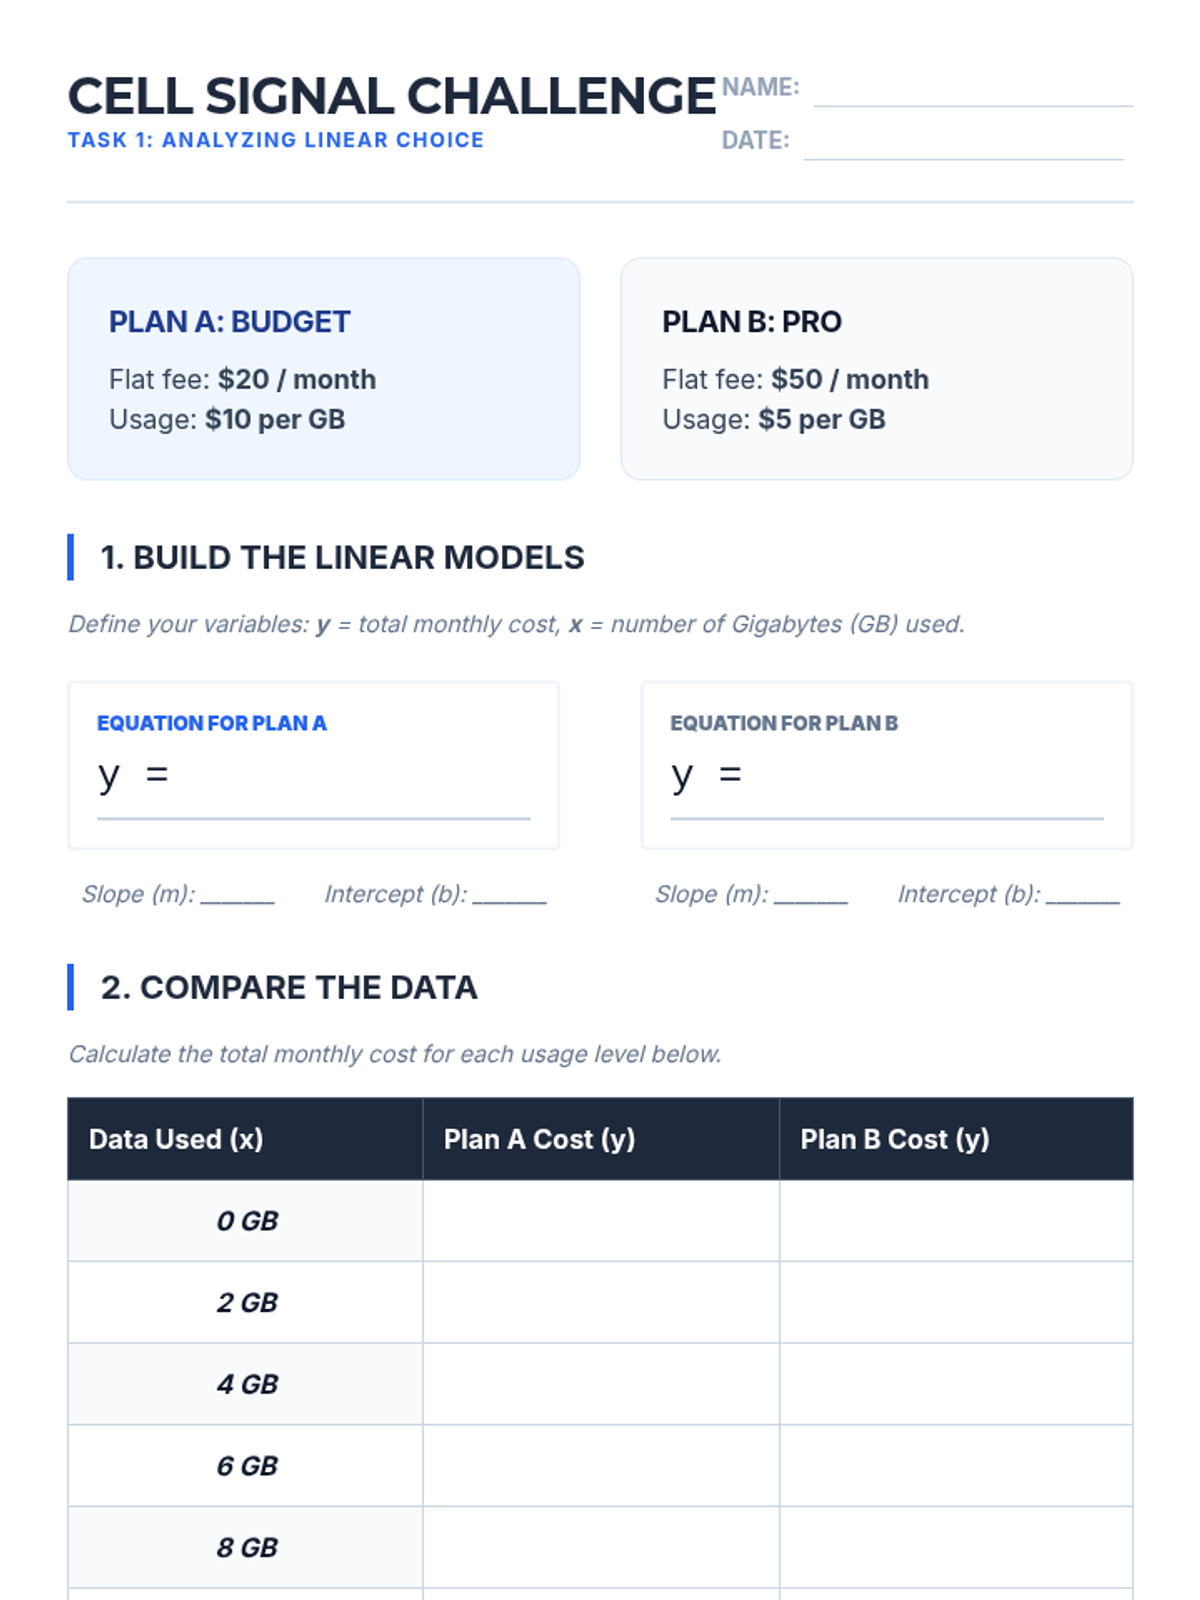
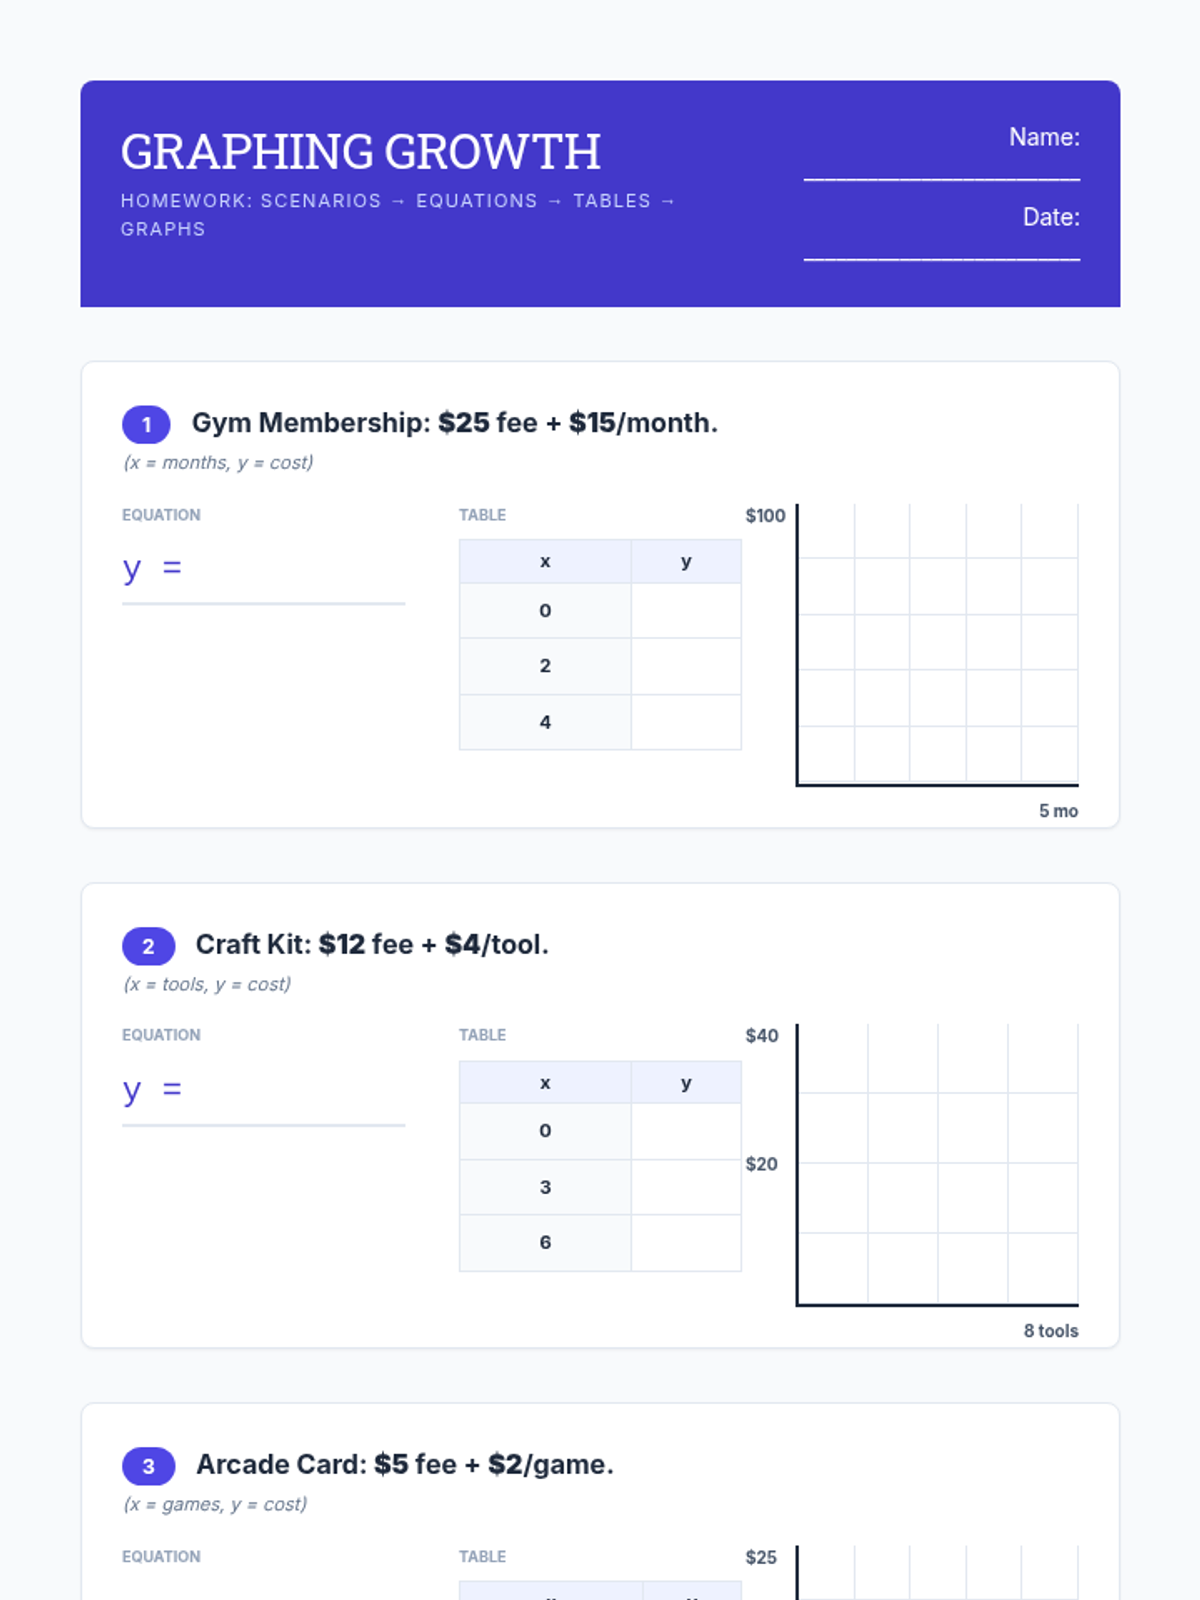
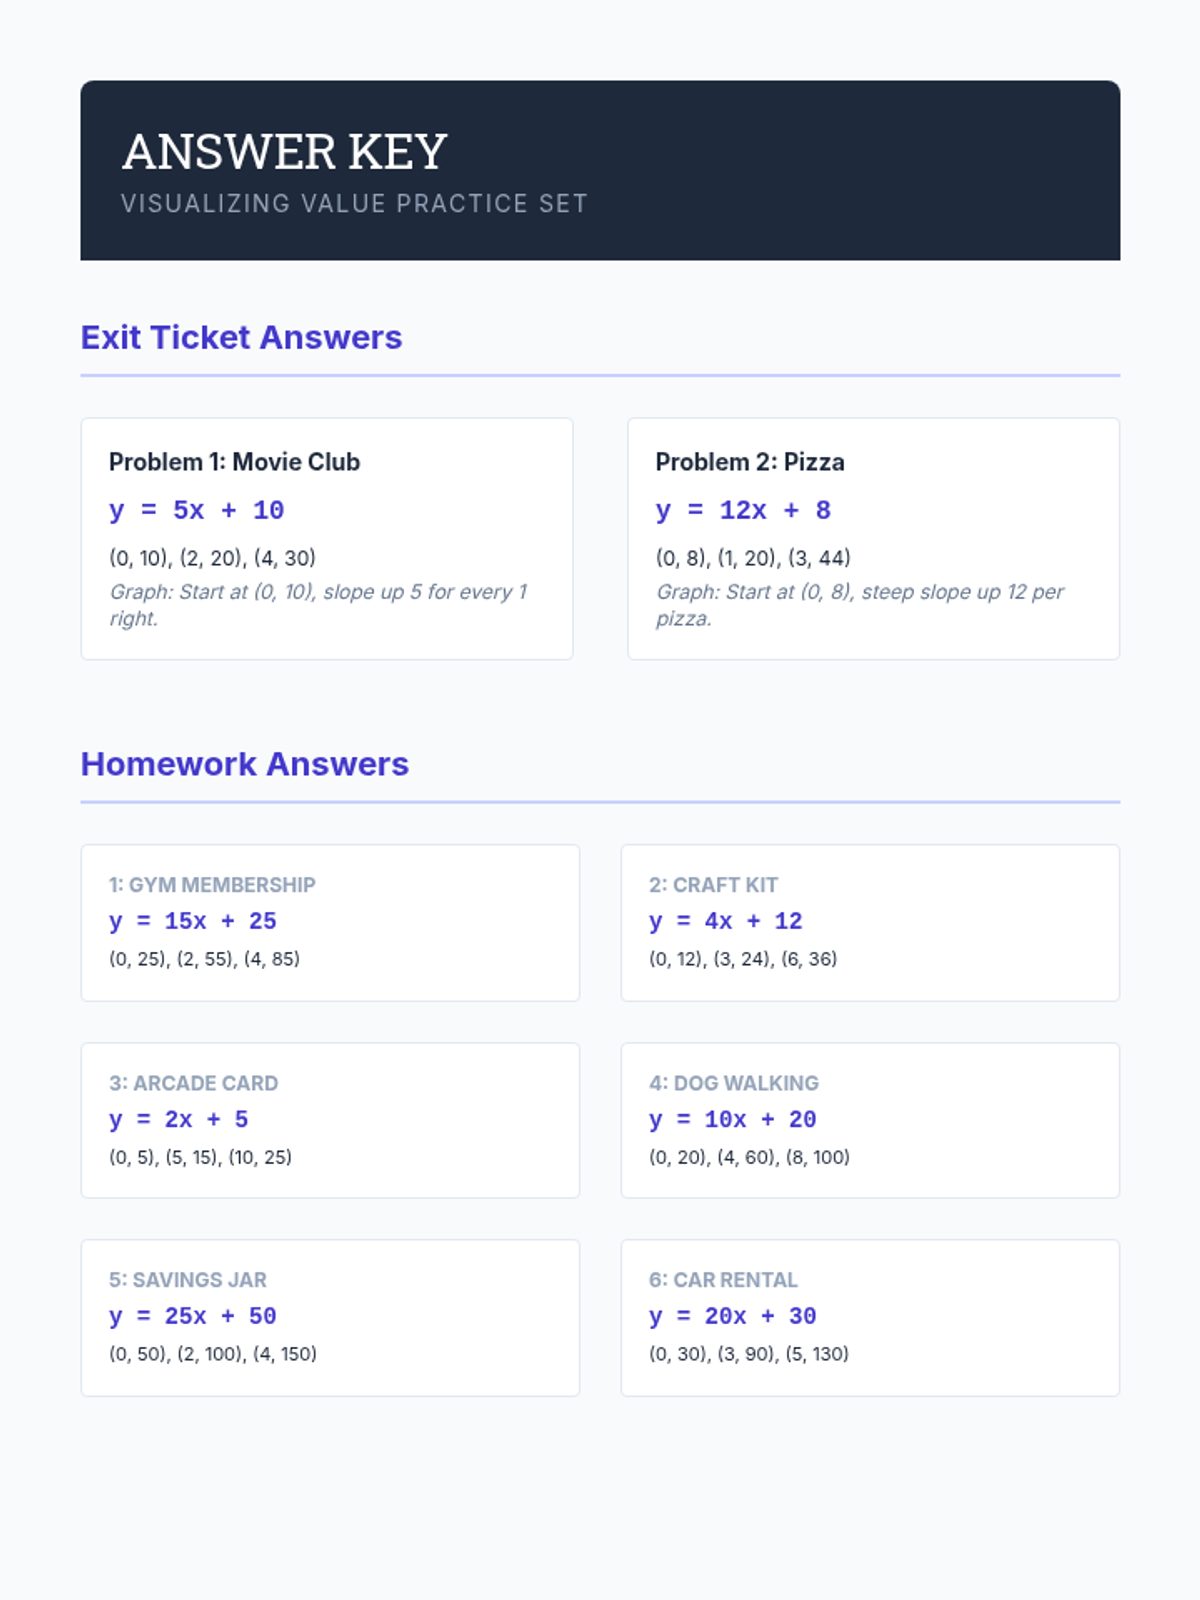
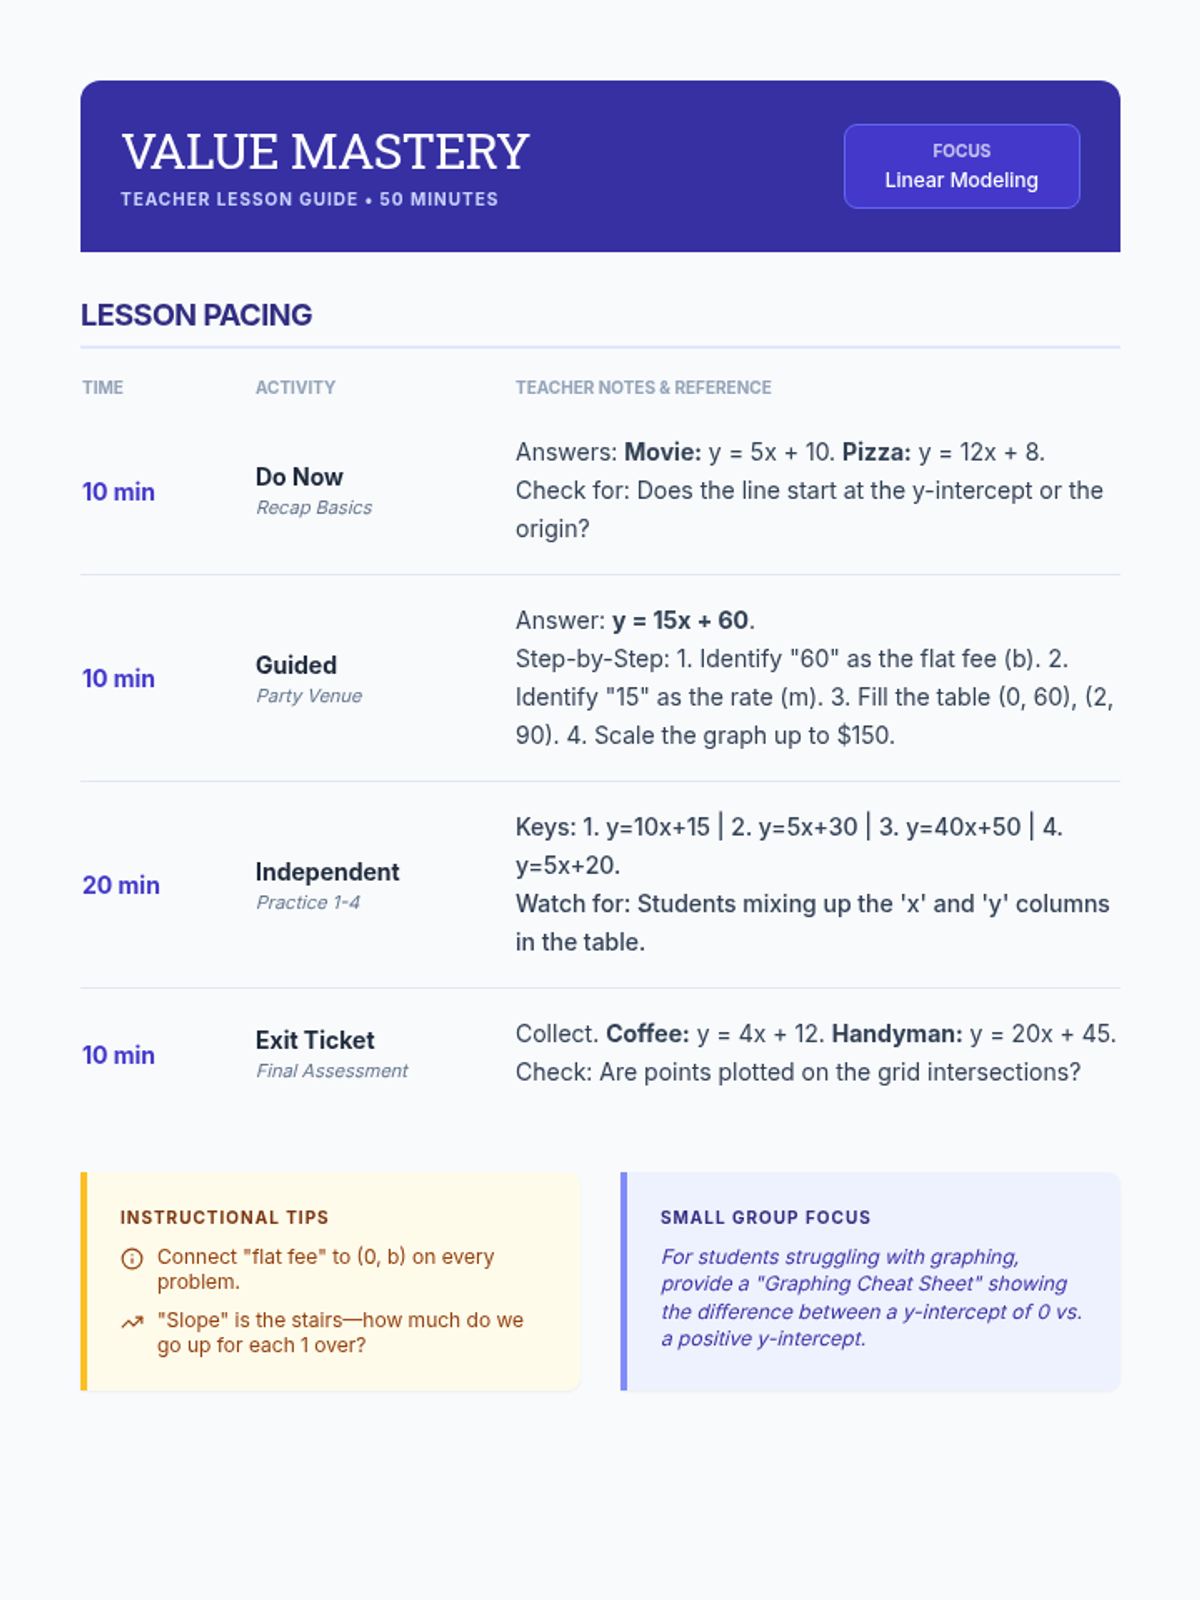
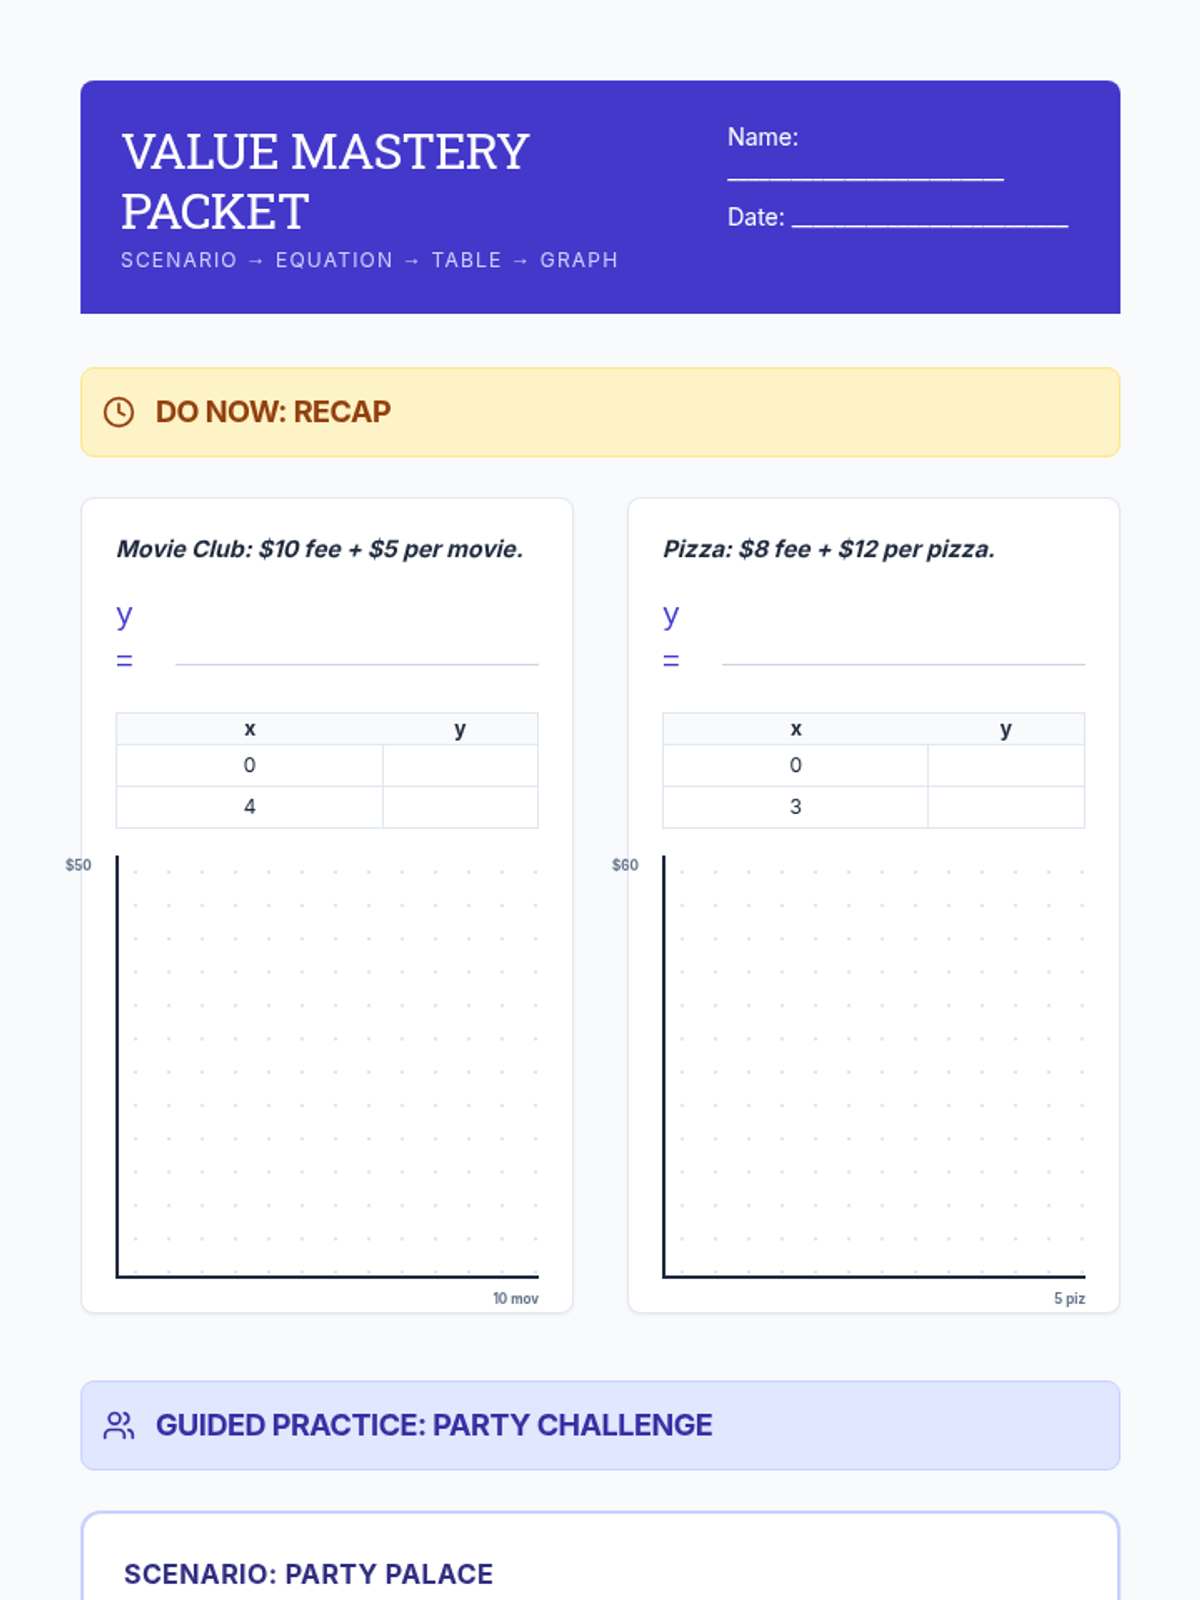
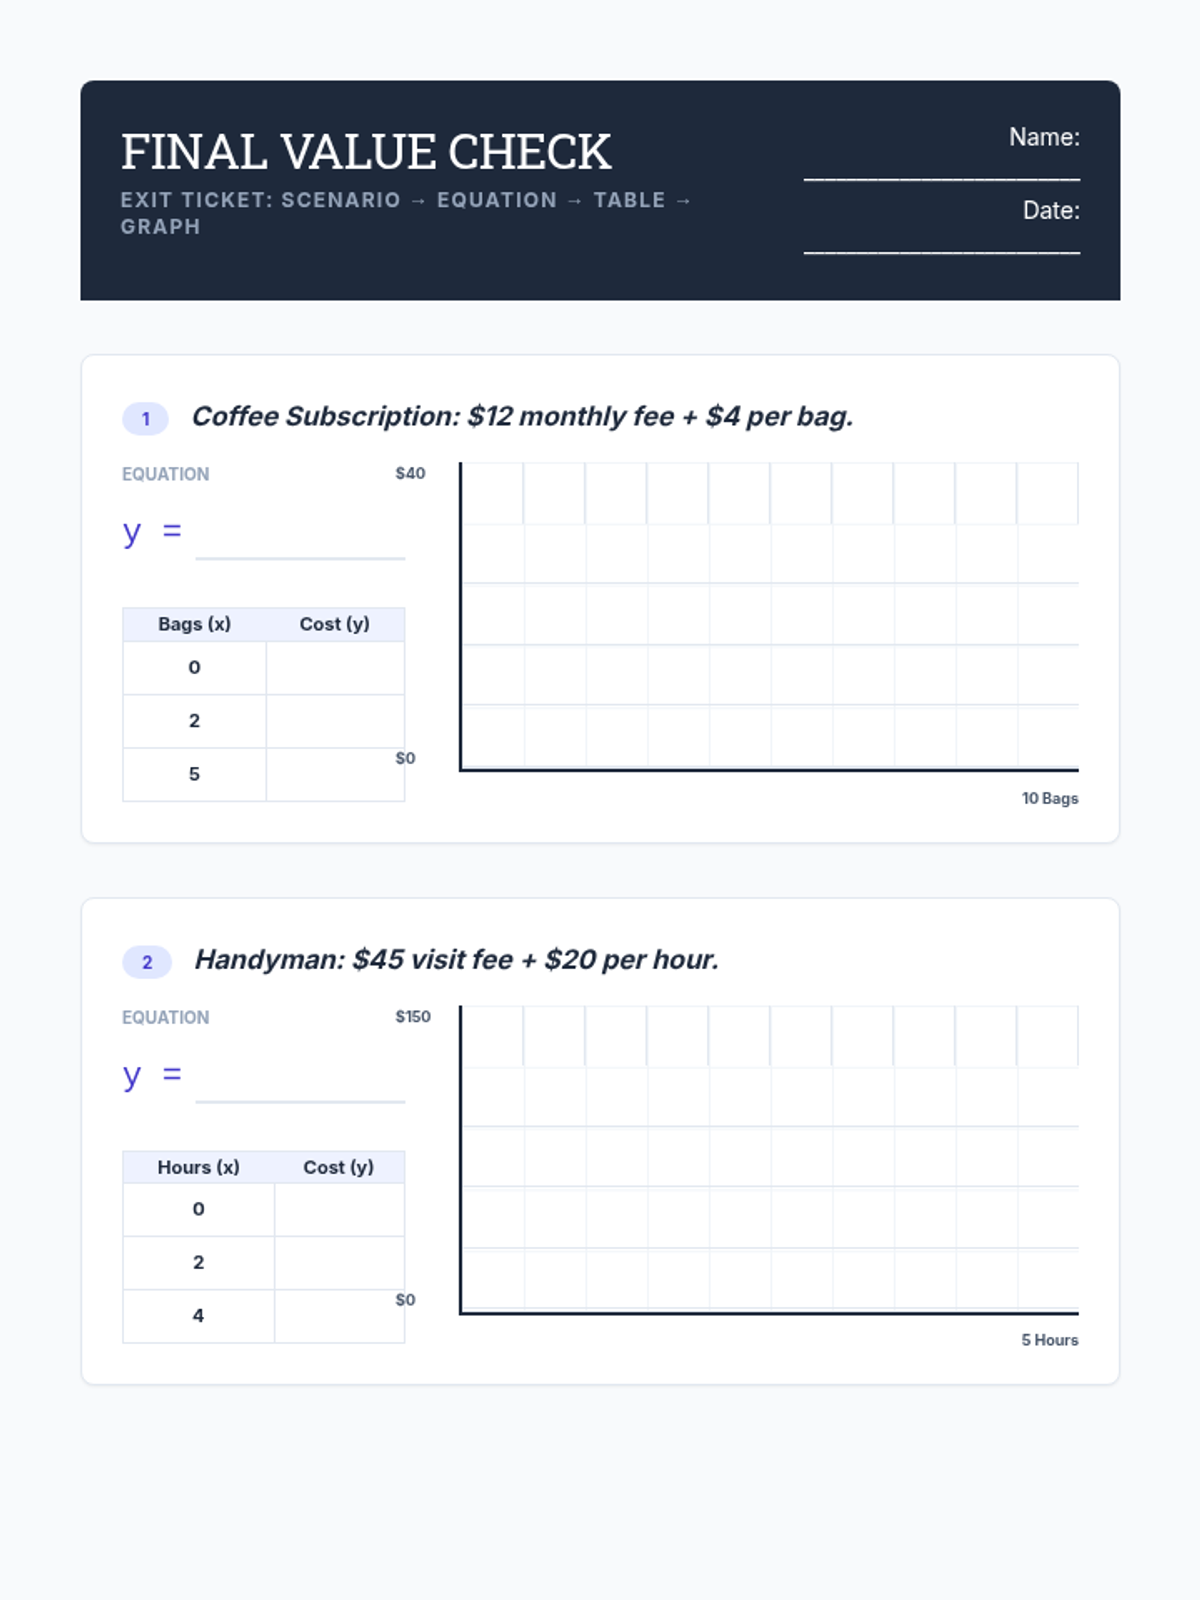
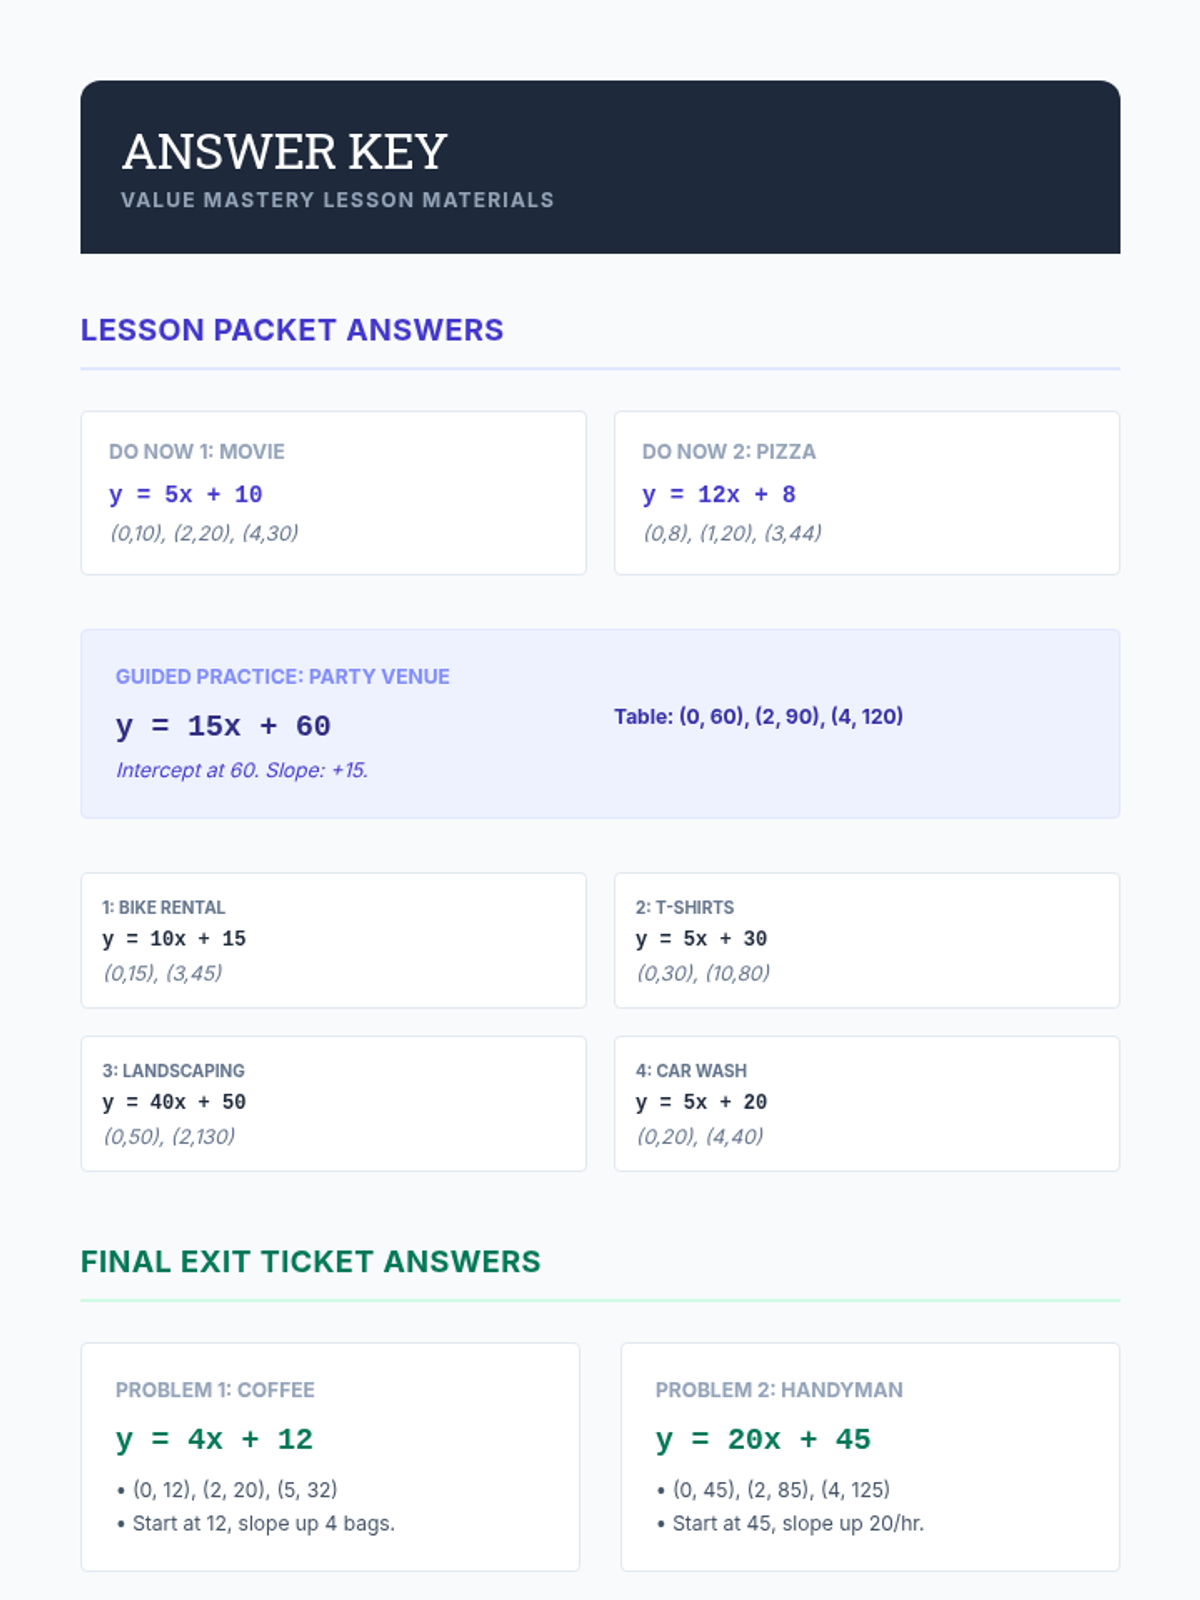
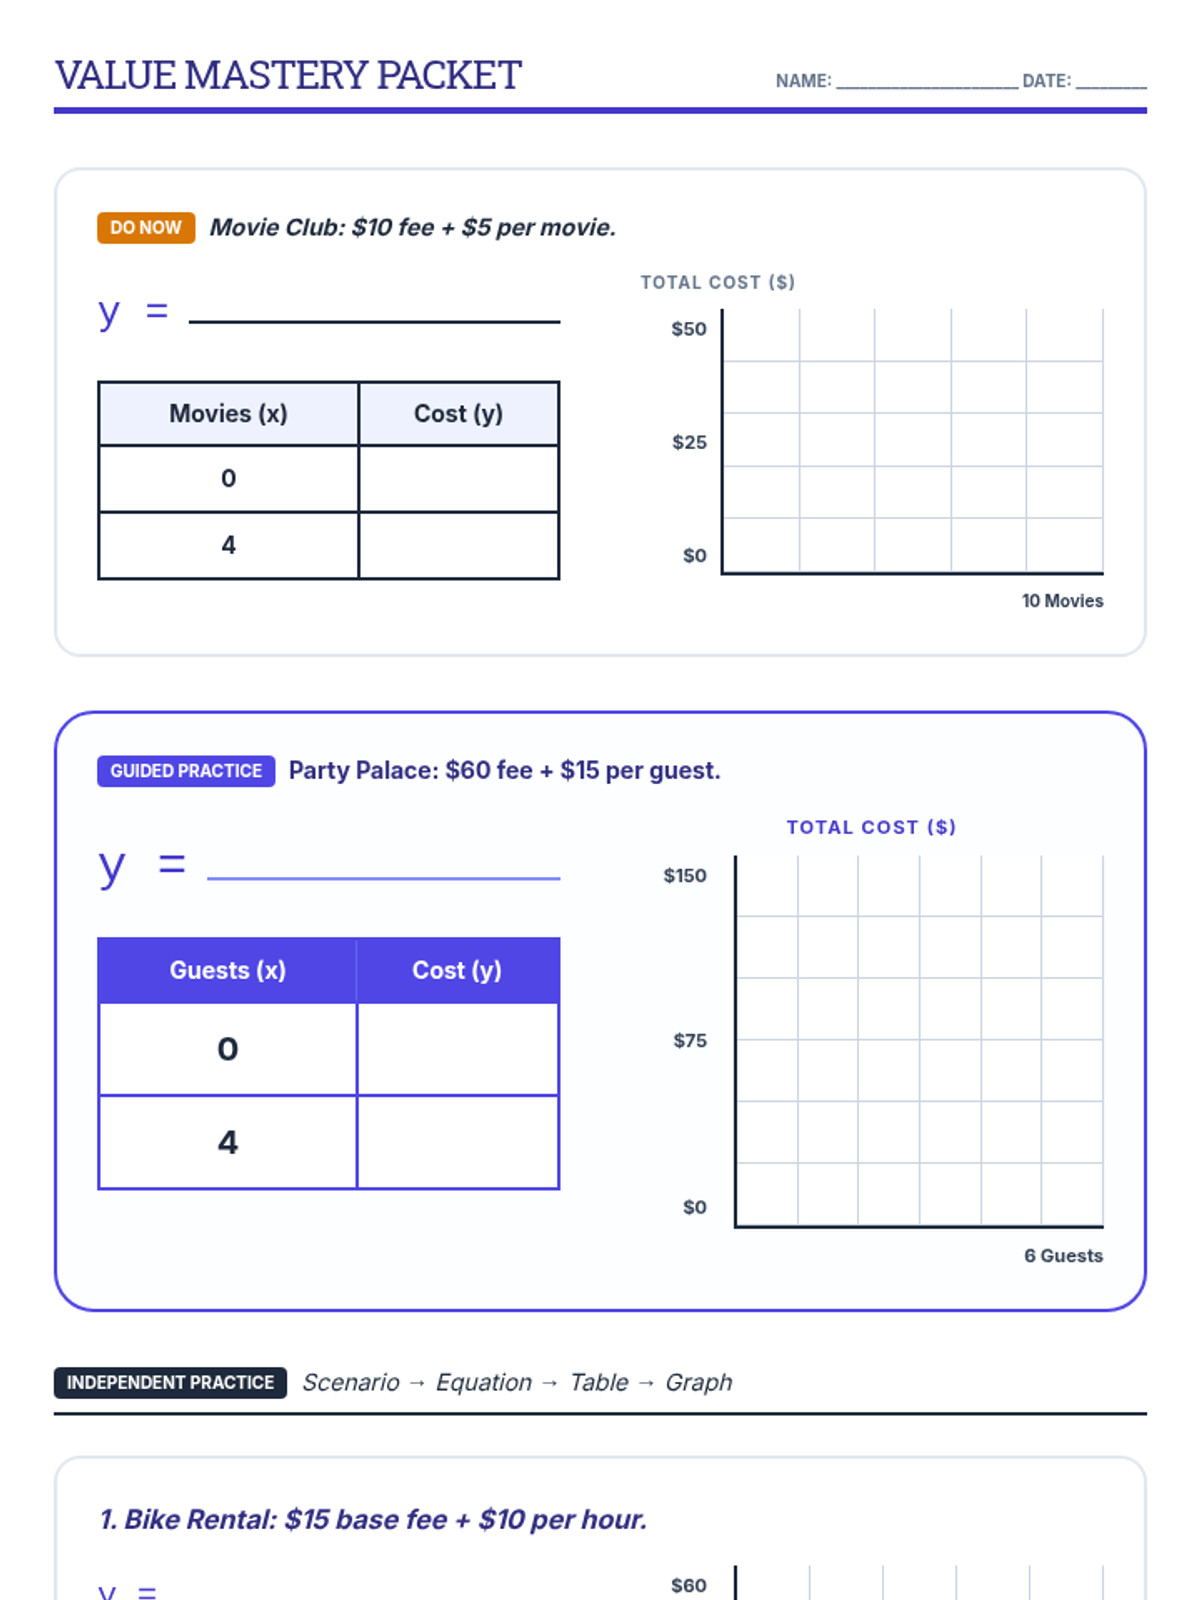
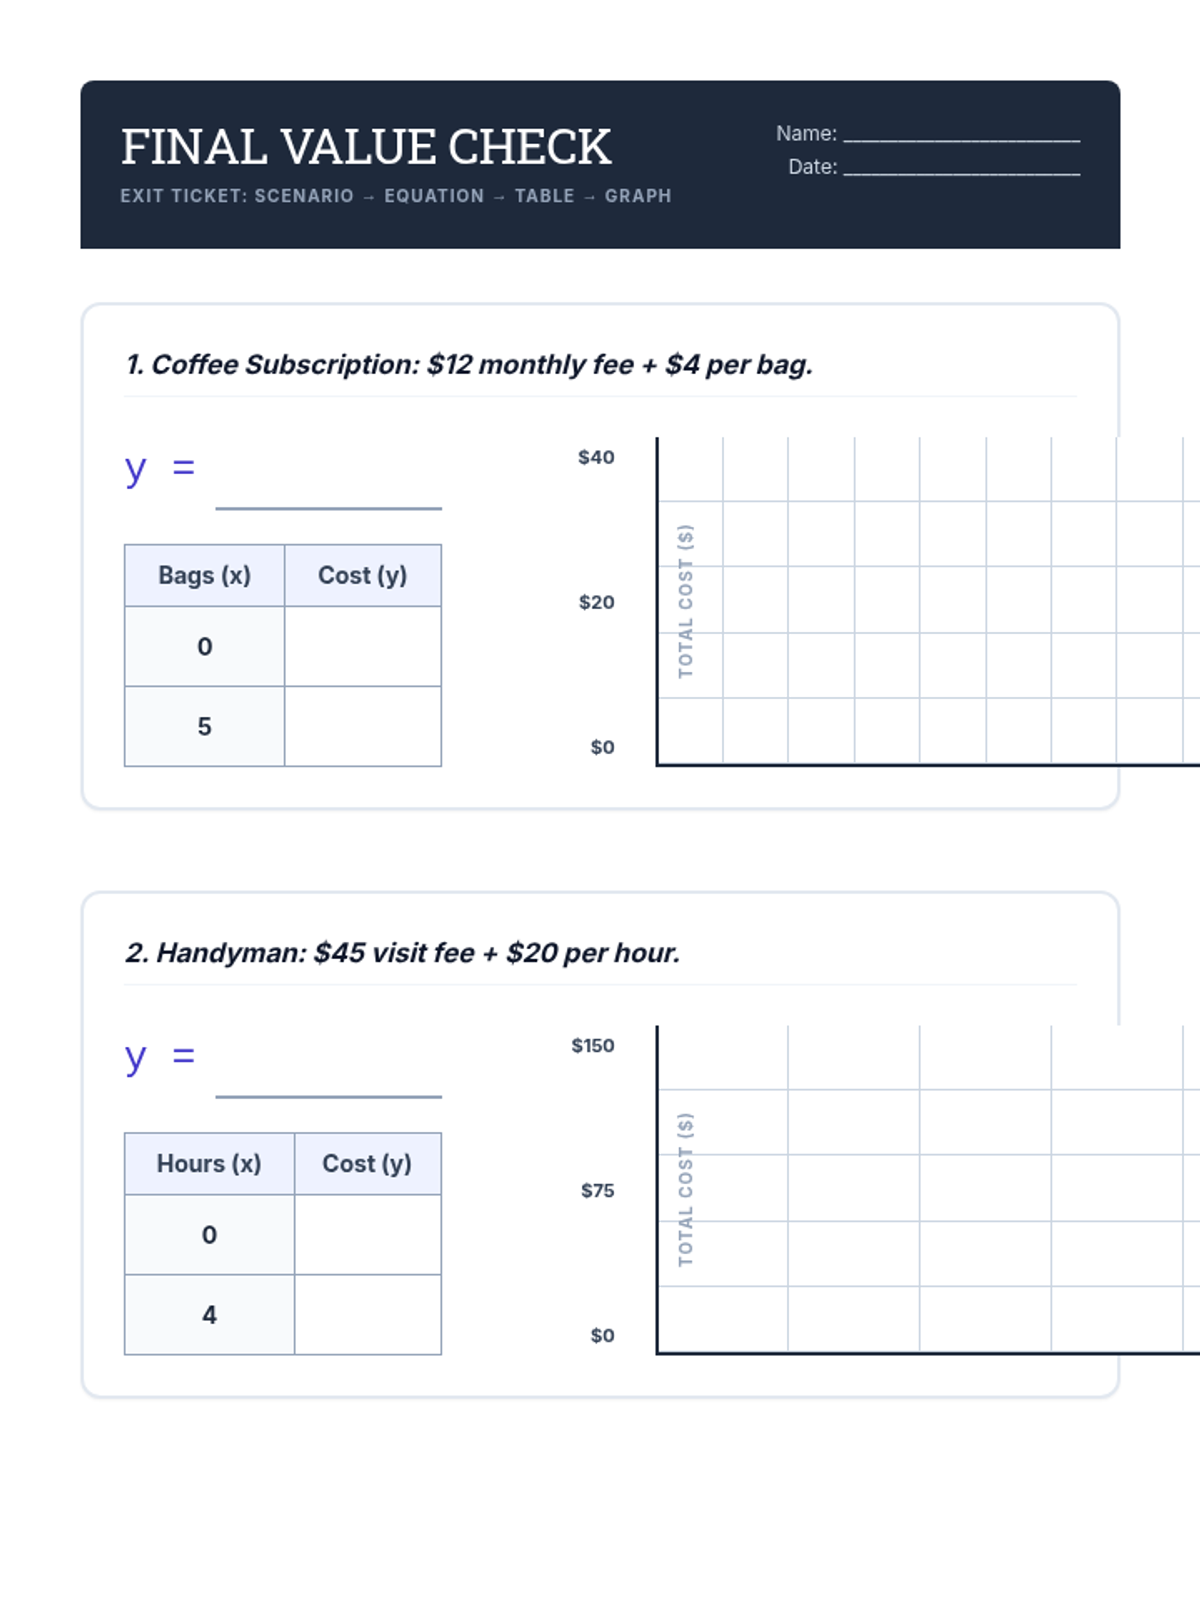
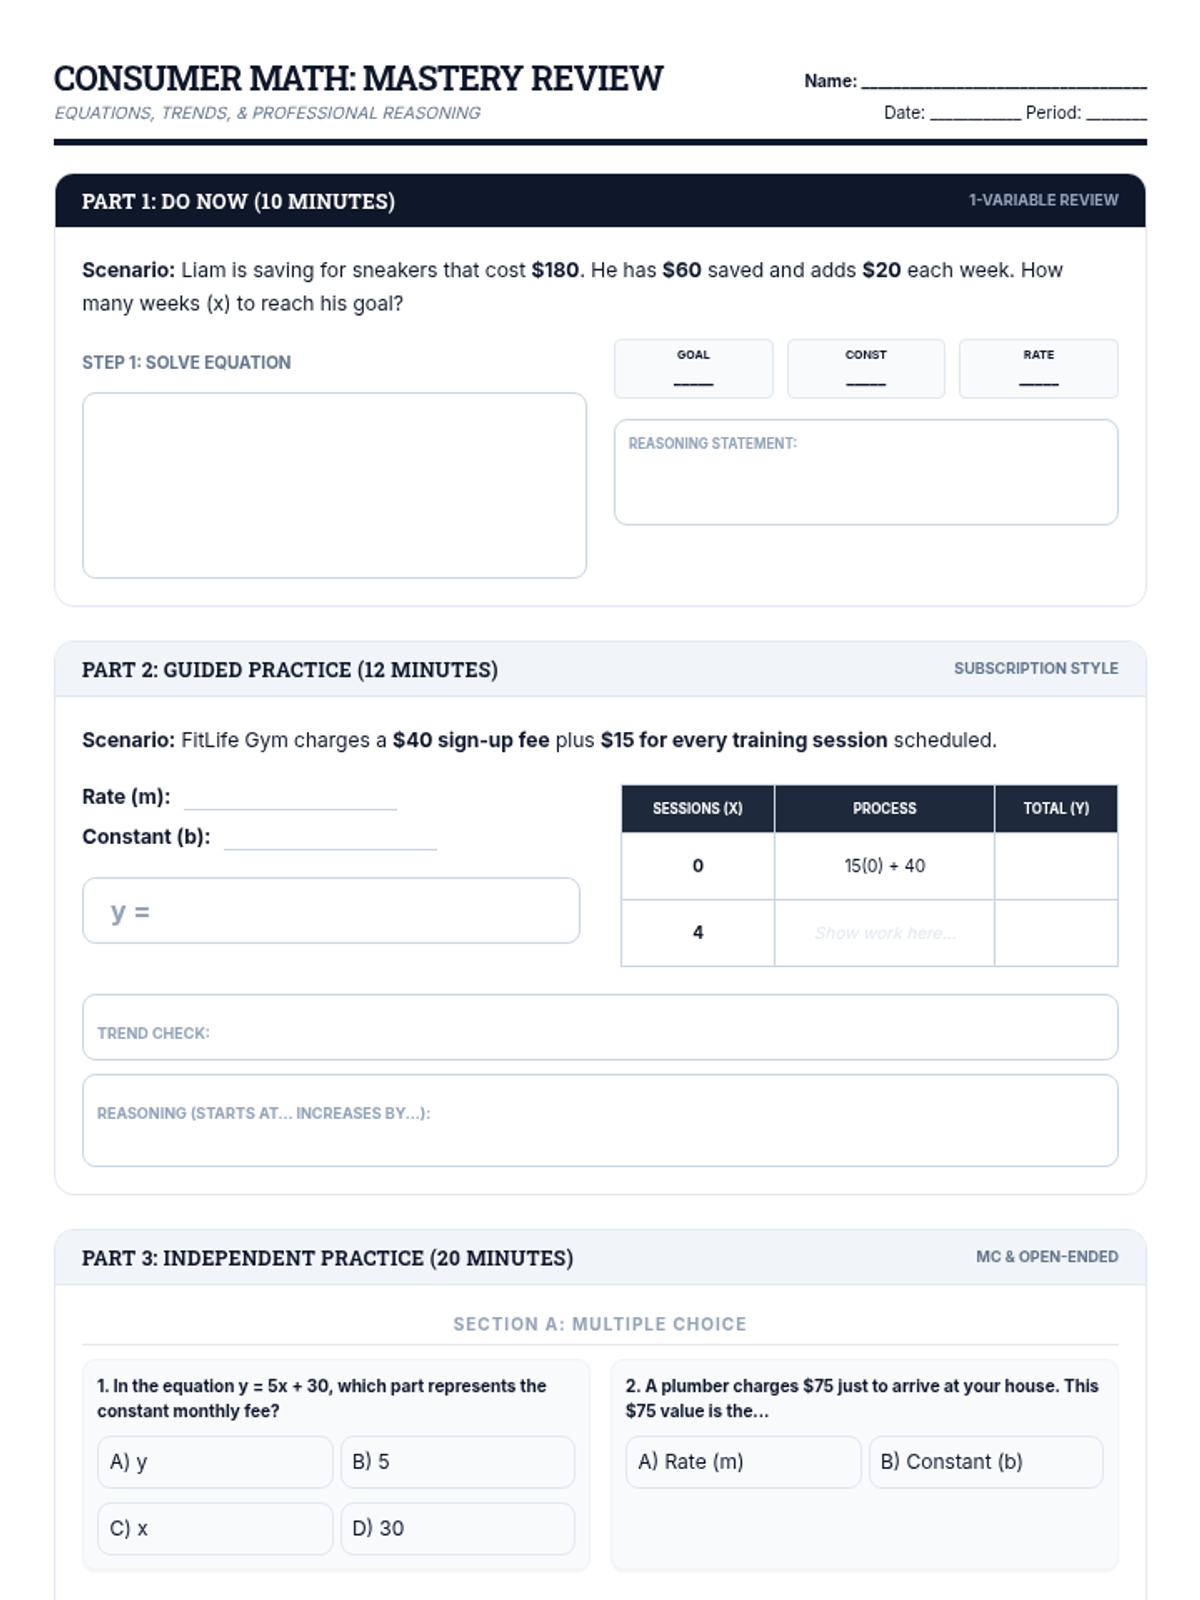
This lesson covers the fundamentals of algebraic modeling in consumer contexts, focusing on translating real-world financial scenarios into equations and tables. Students will practice identifying variables, constants, and rates to make informed financial decisions.
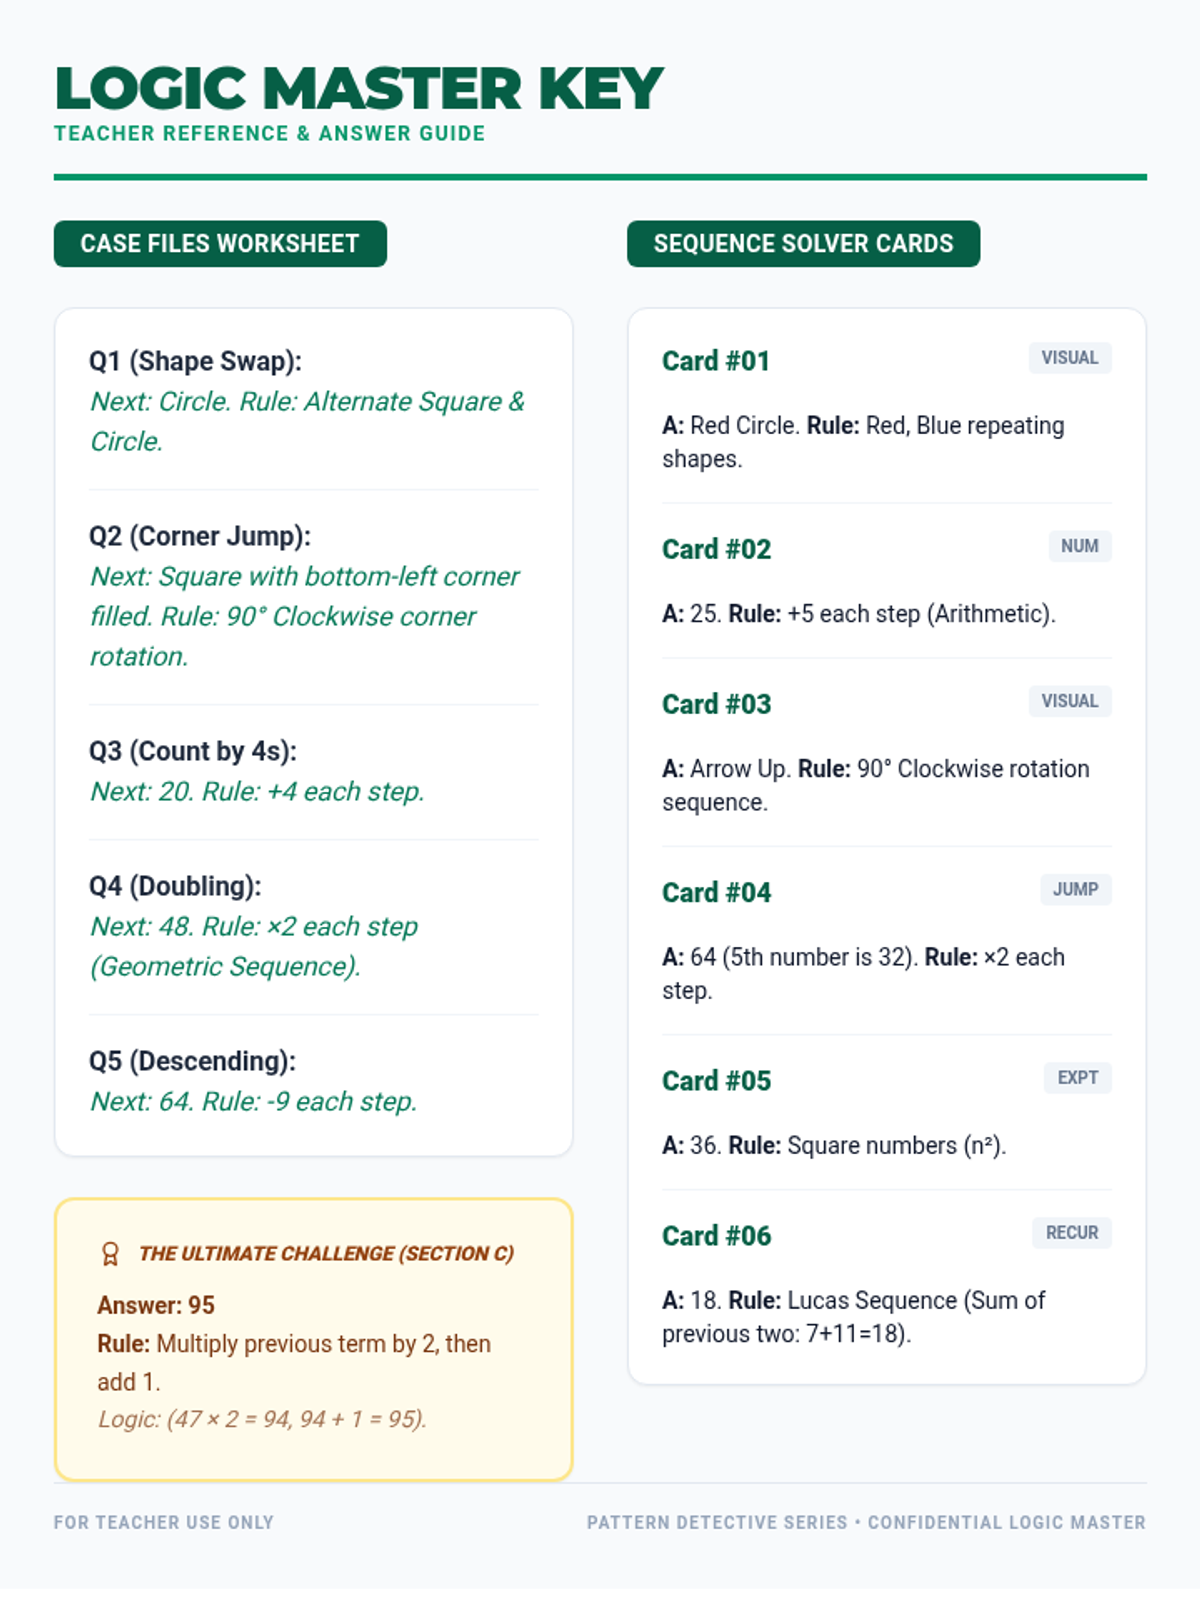
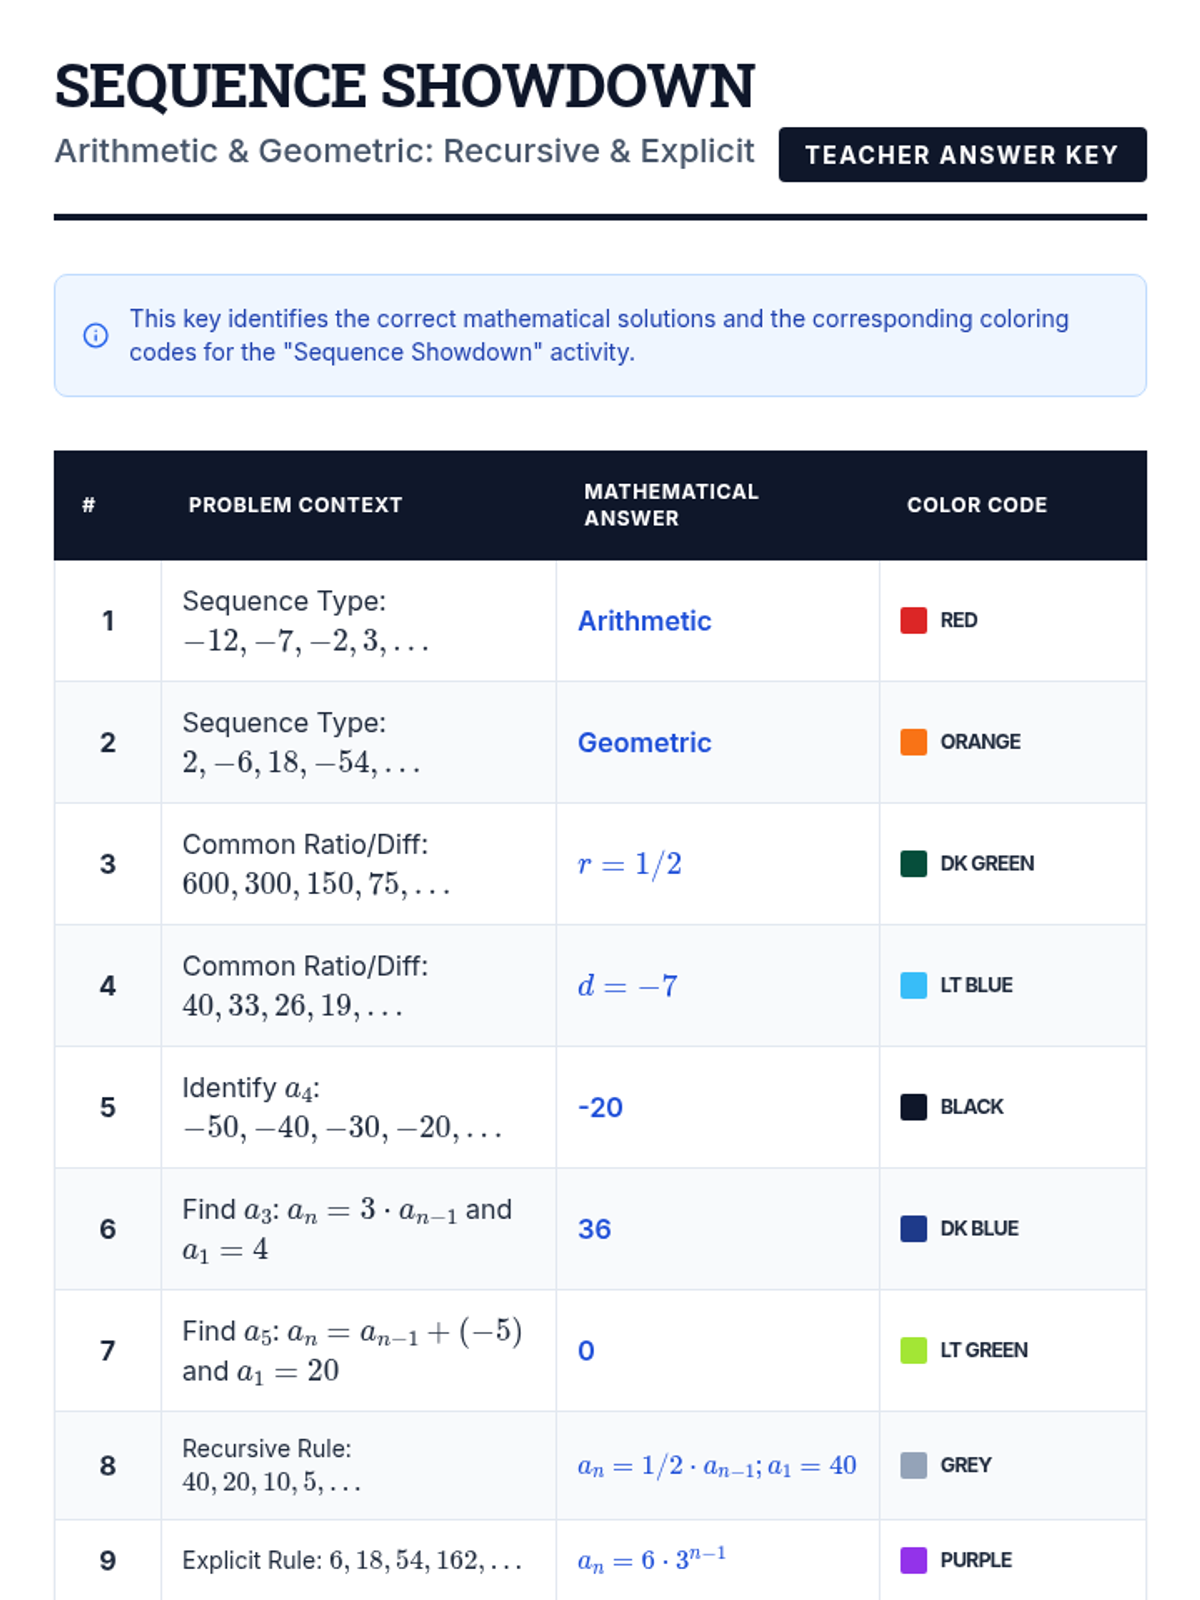
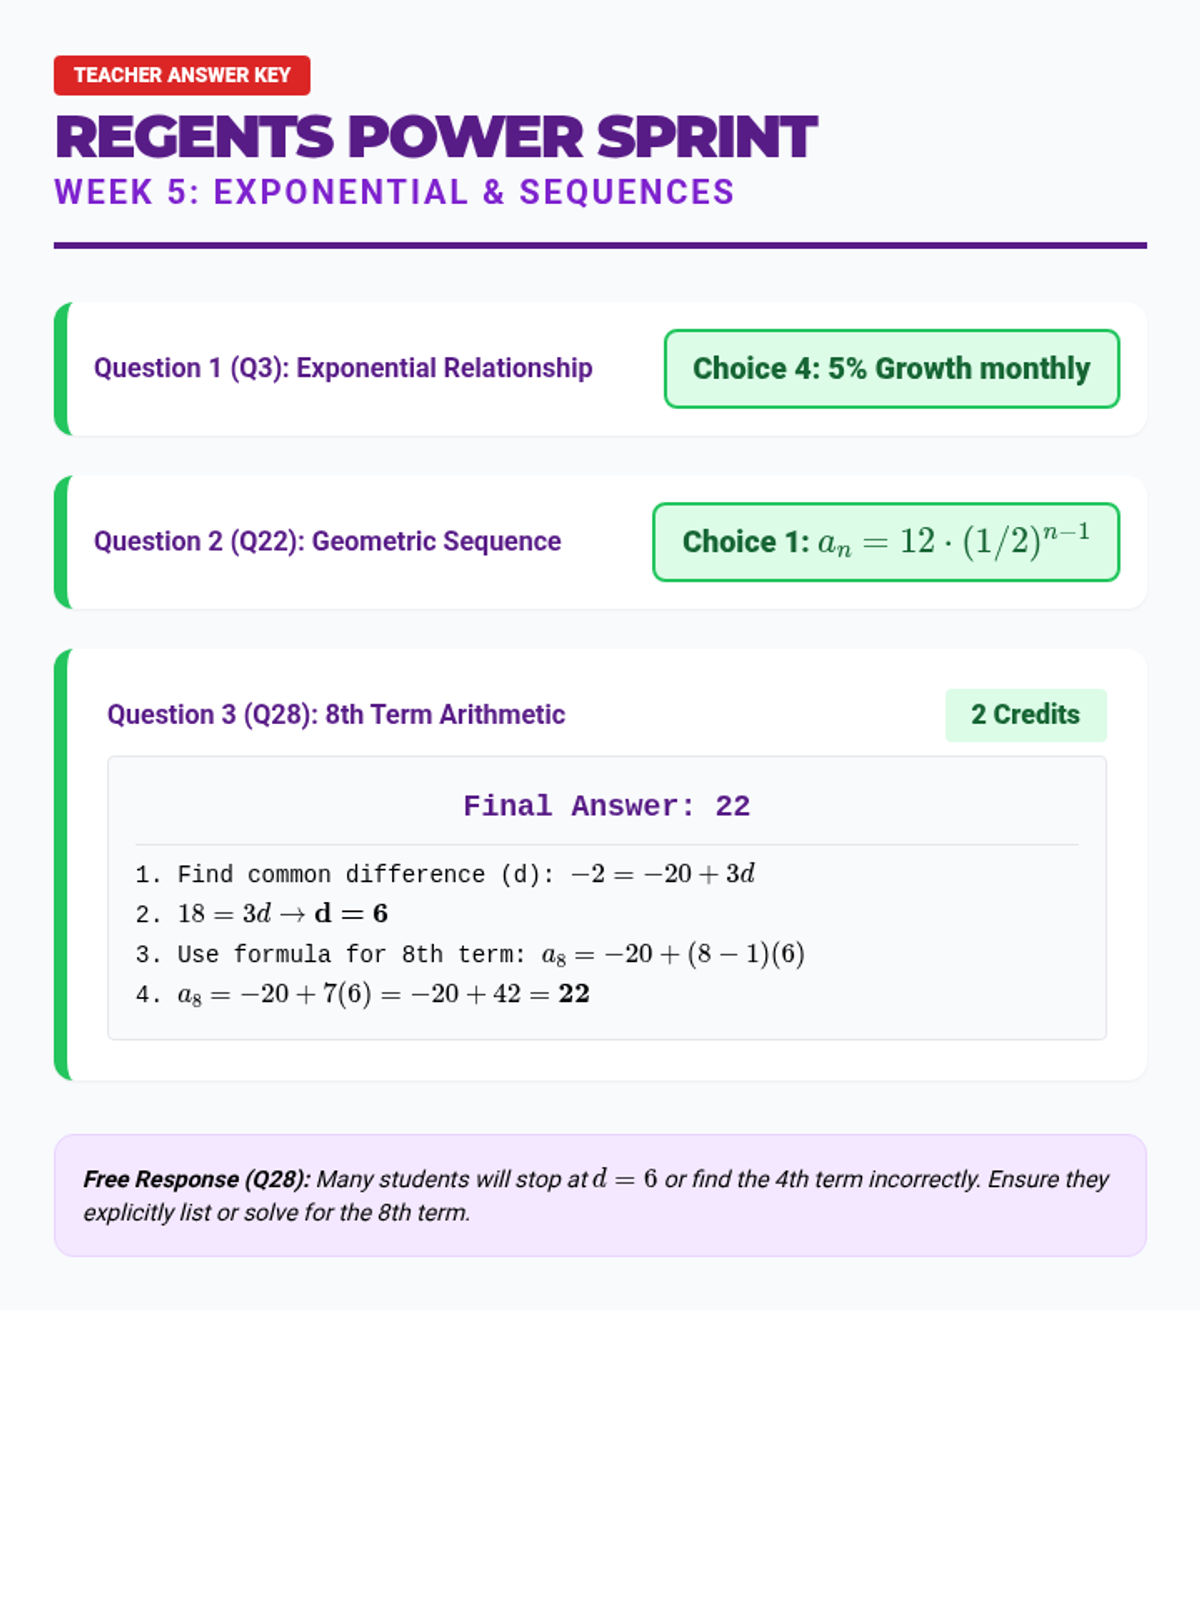
A comprehensive guide to arithmetic and geometric sequences, covering recursive and explicit formulas with a focused answer key for assessment.
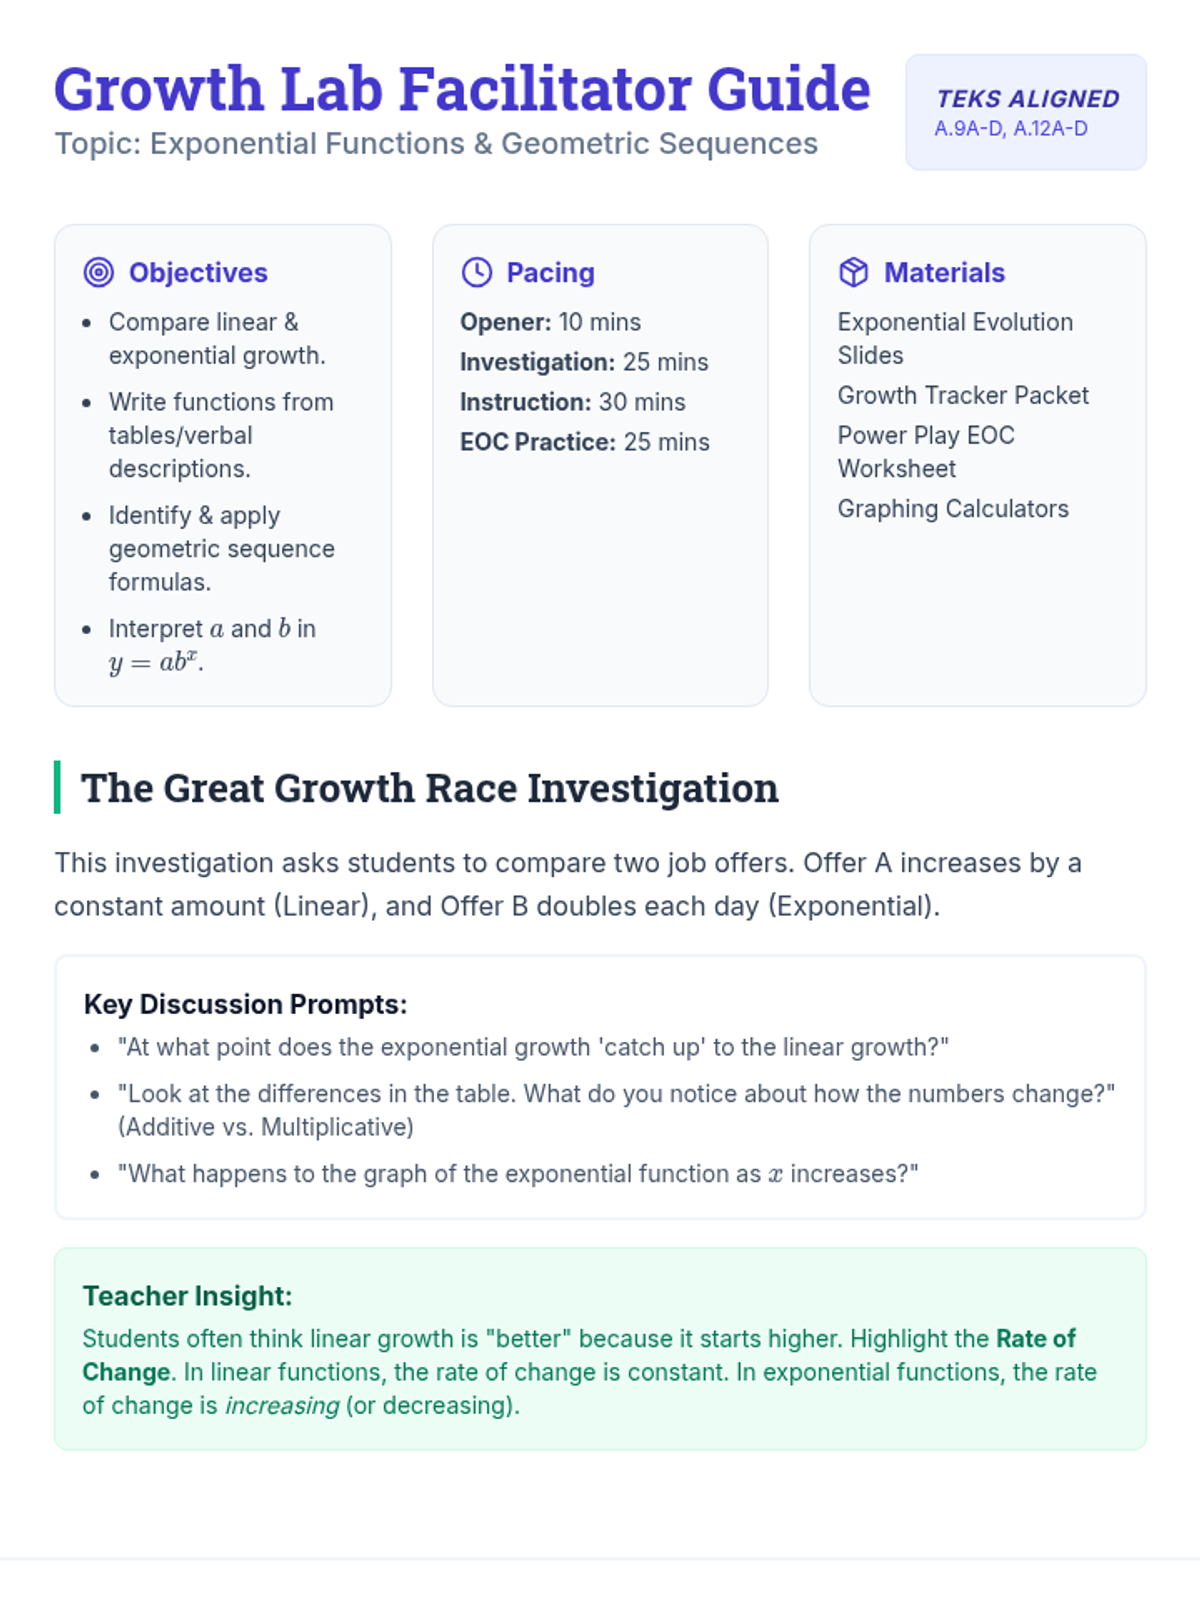
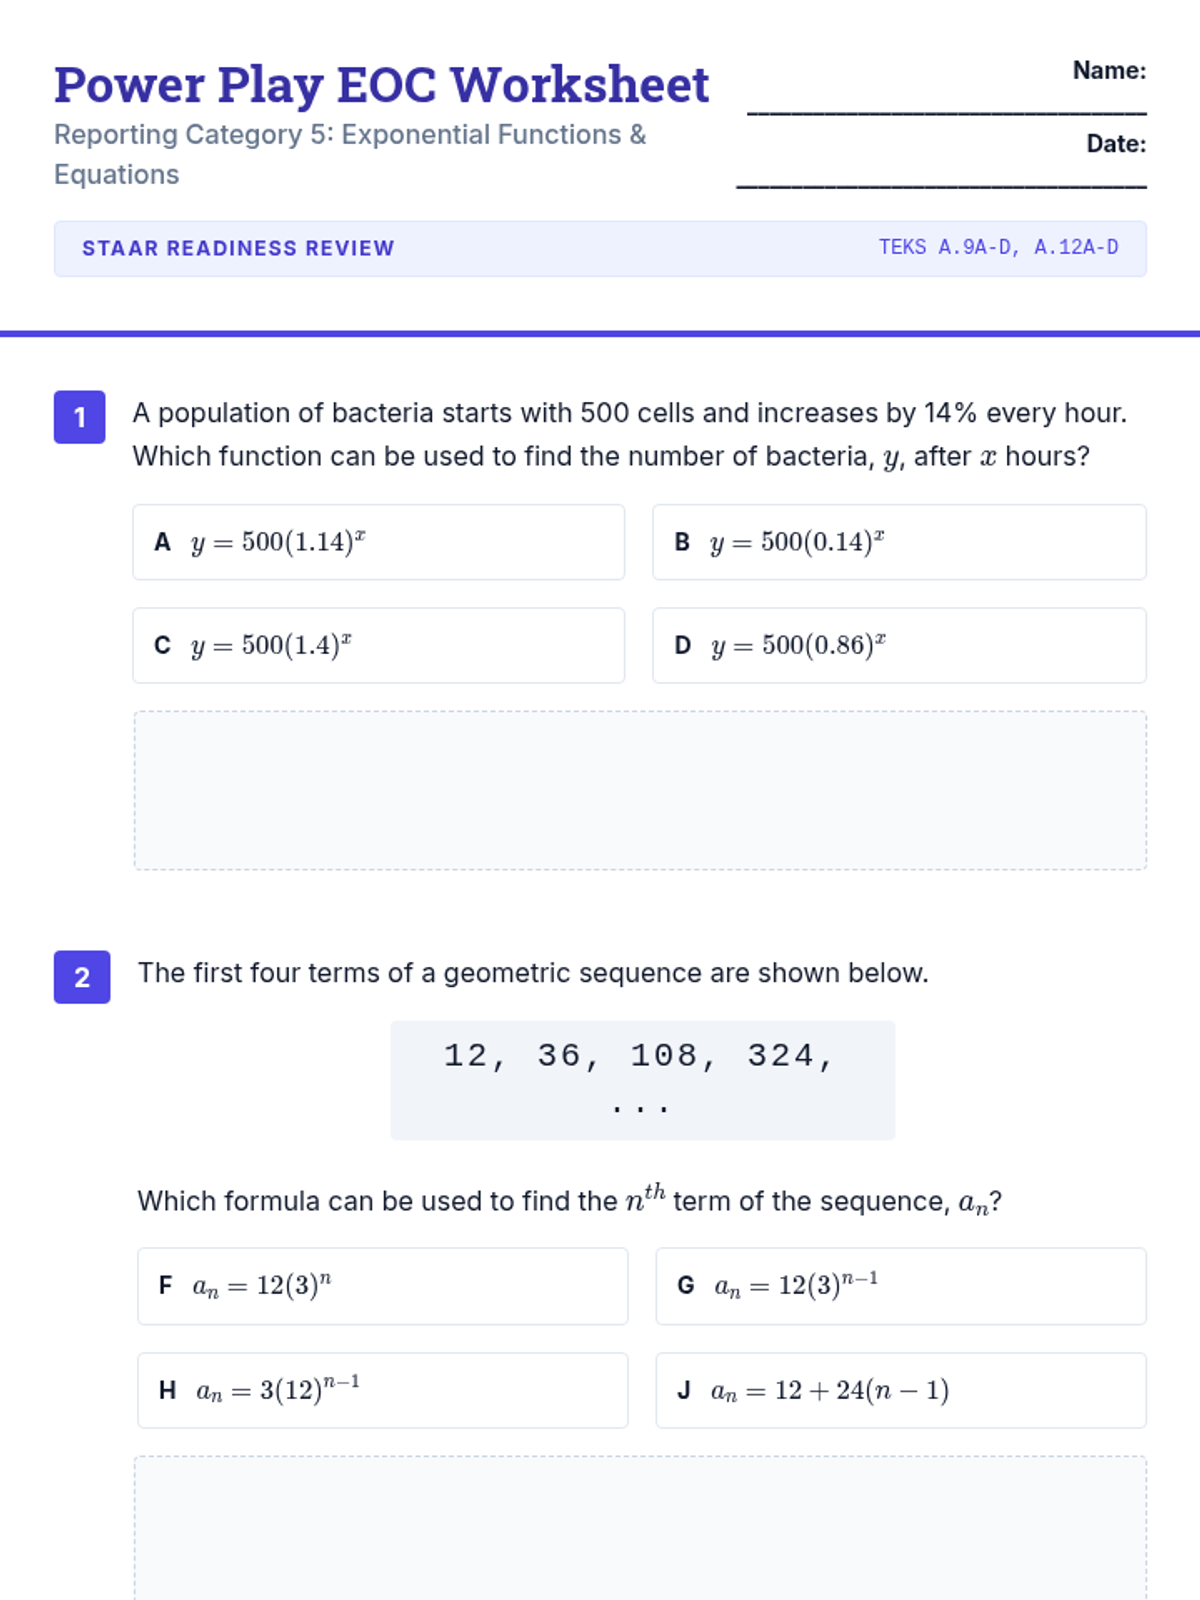
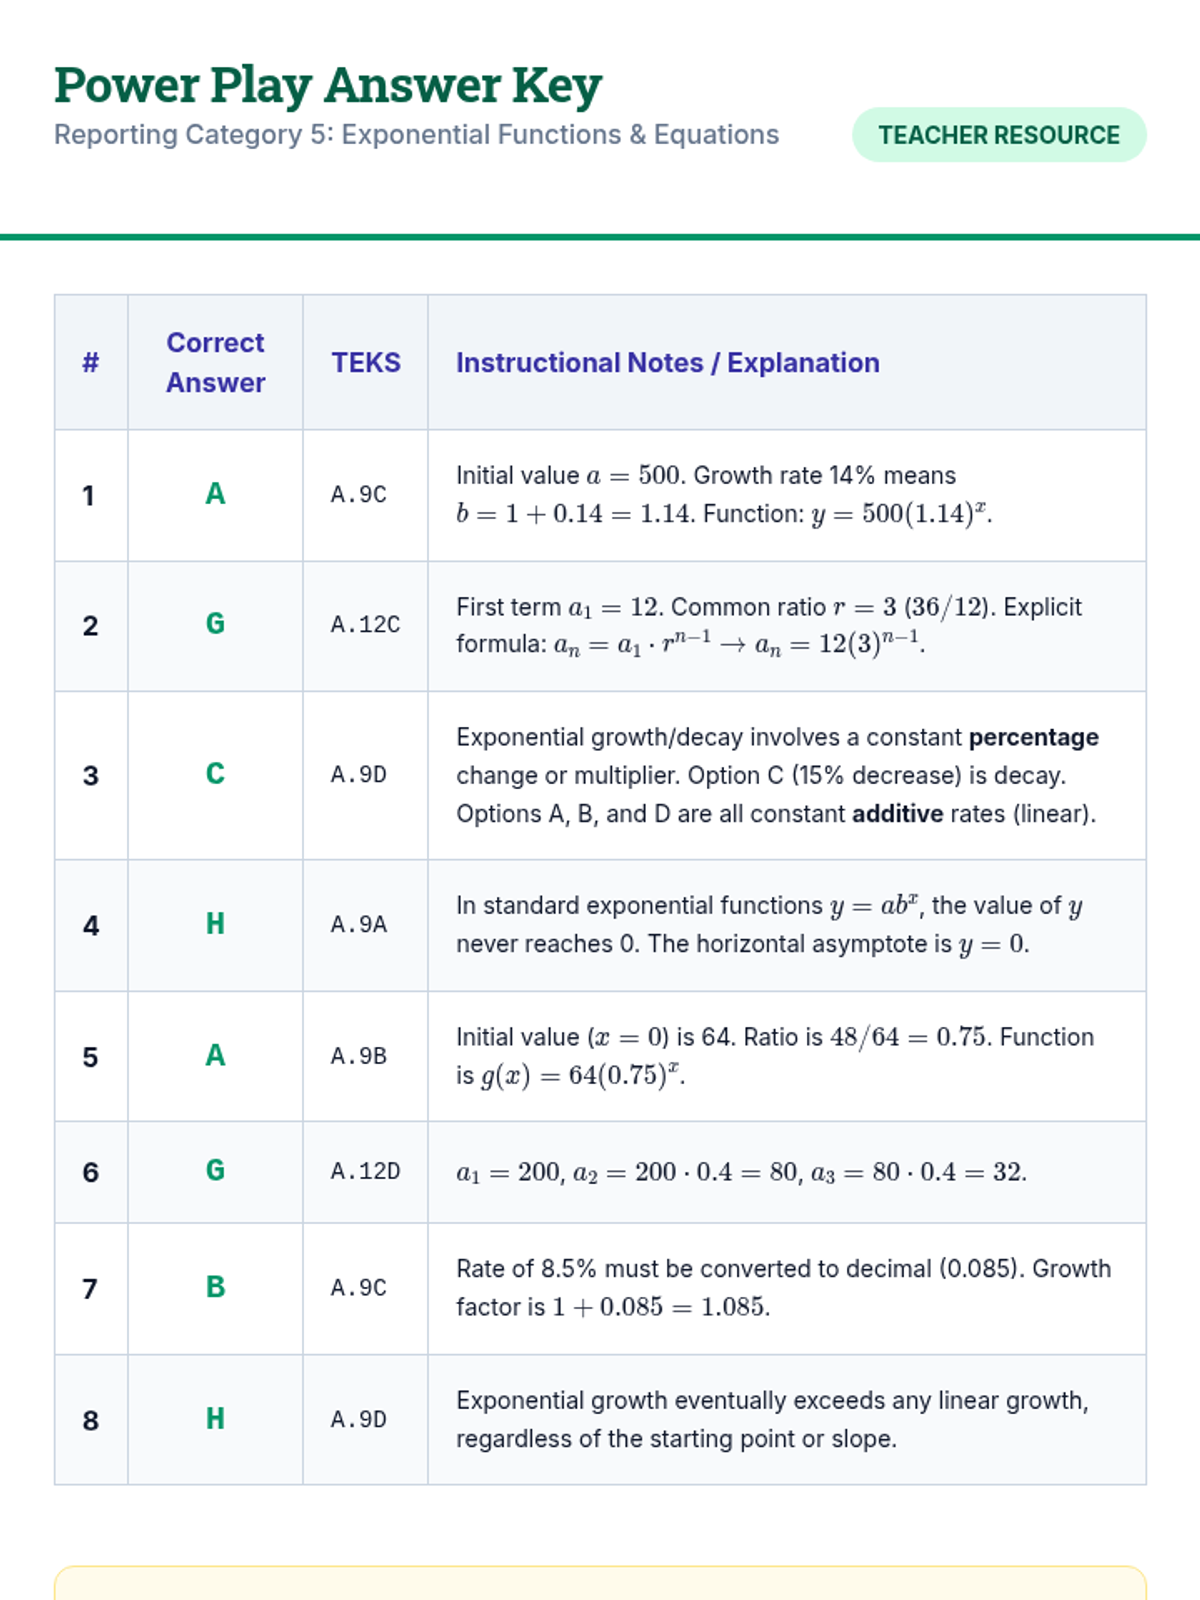
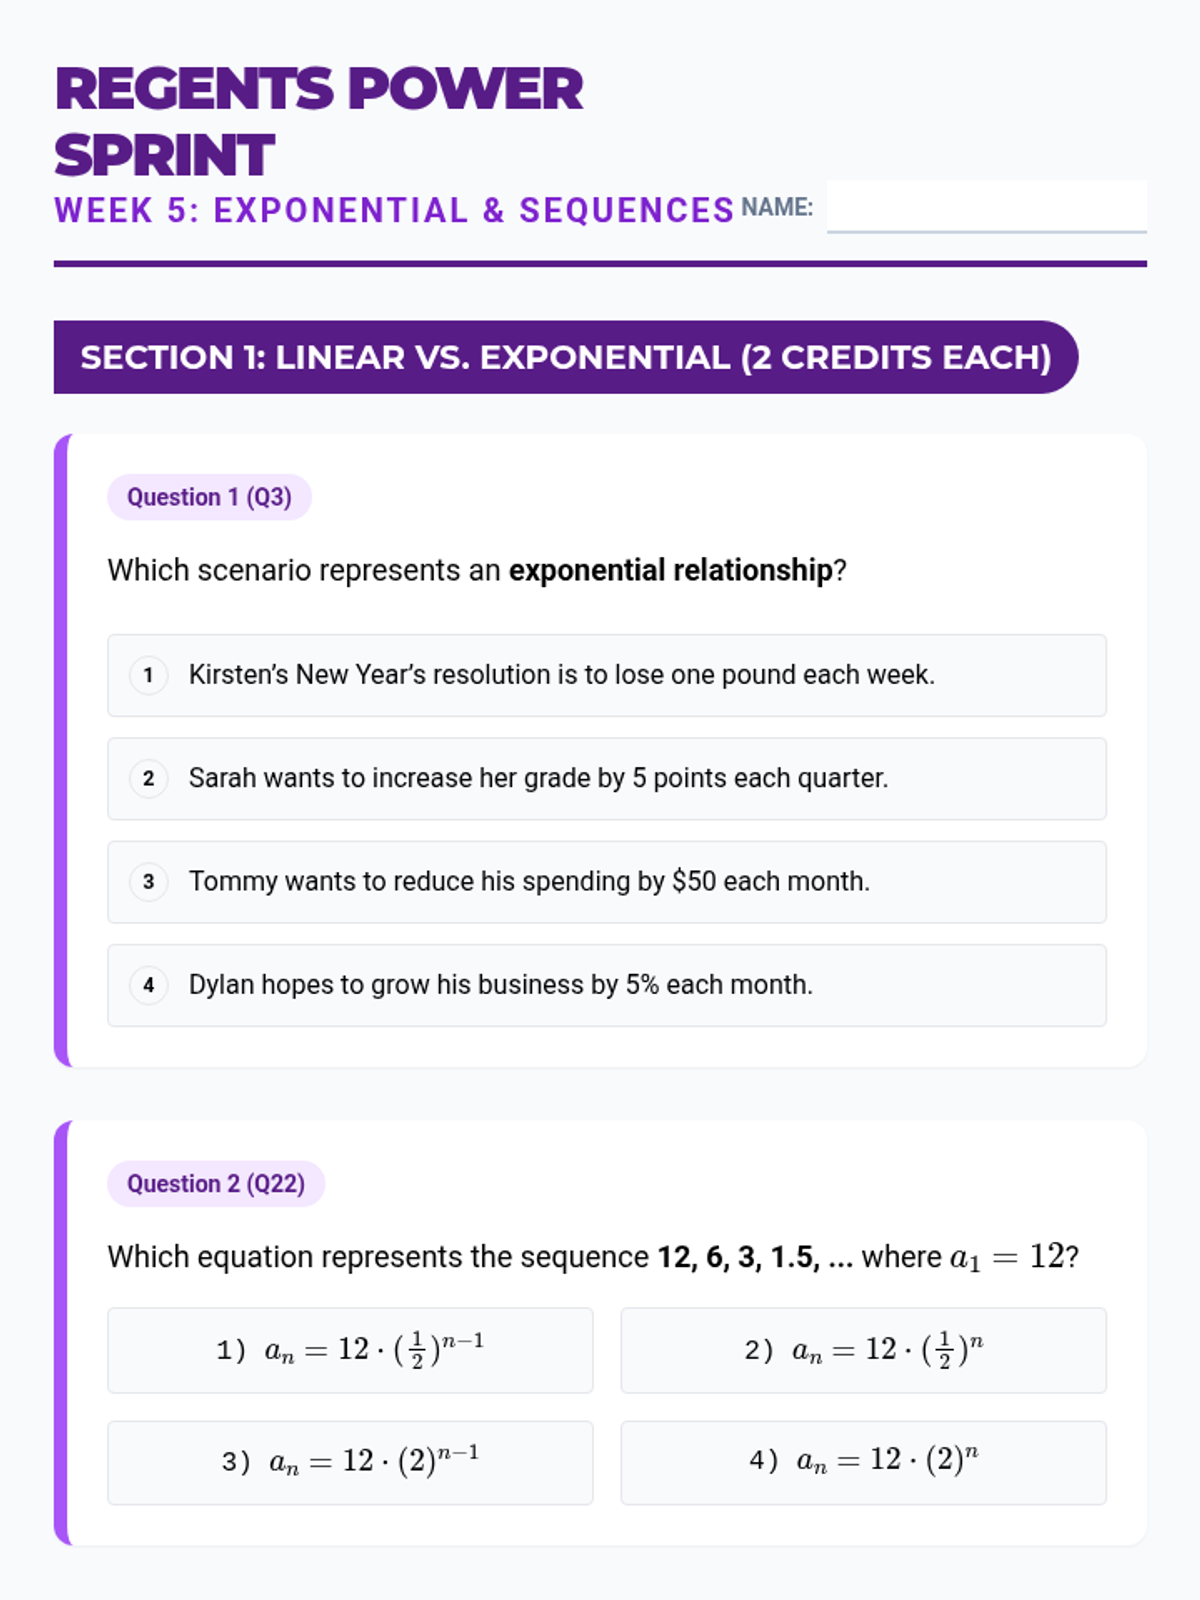
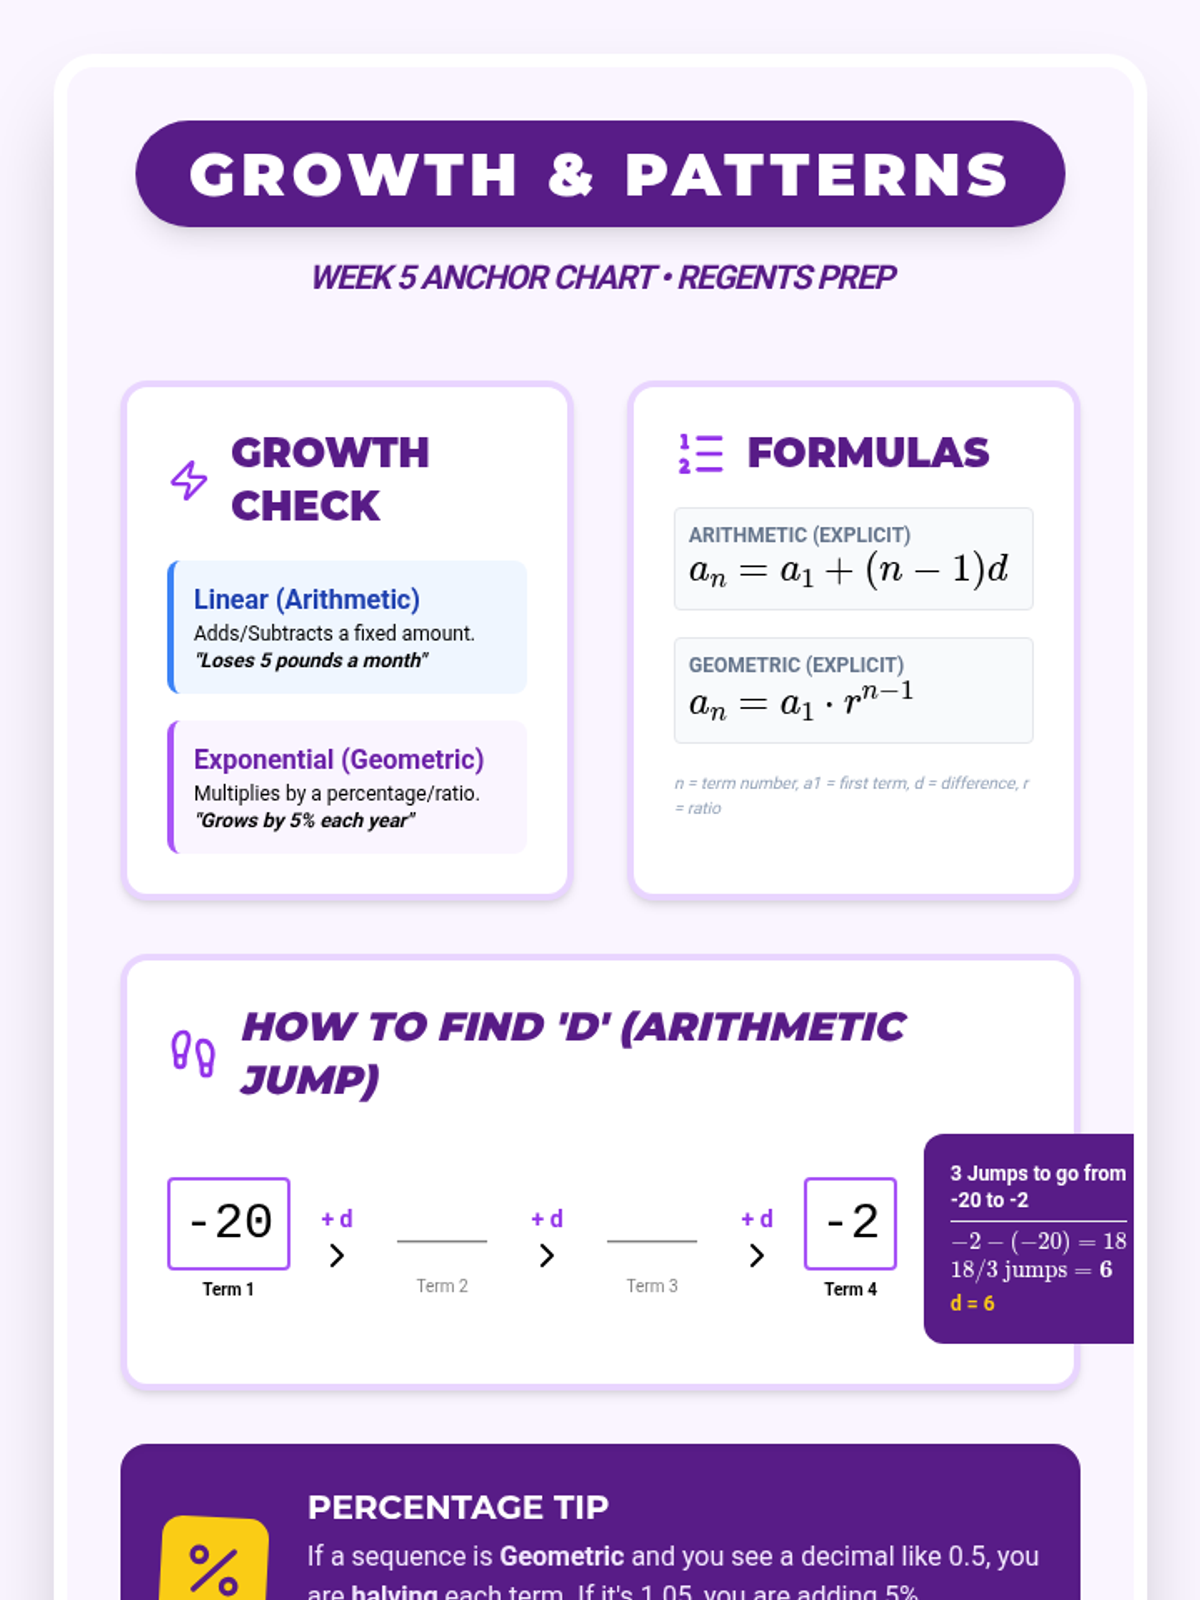
A comprehensive lesson on exponential functions and geometric sequences, covering TEKS A.9A-D and A.12A-D, with a focus on STAAR EOC preparation. Students investigate linear vs. exponential growth, model real-world scenarios, and master sequence formulas.
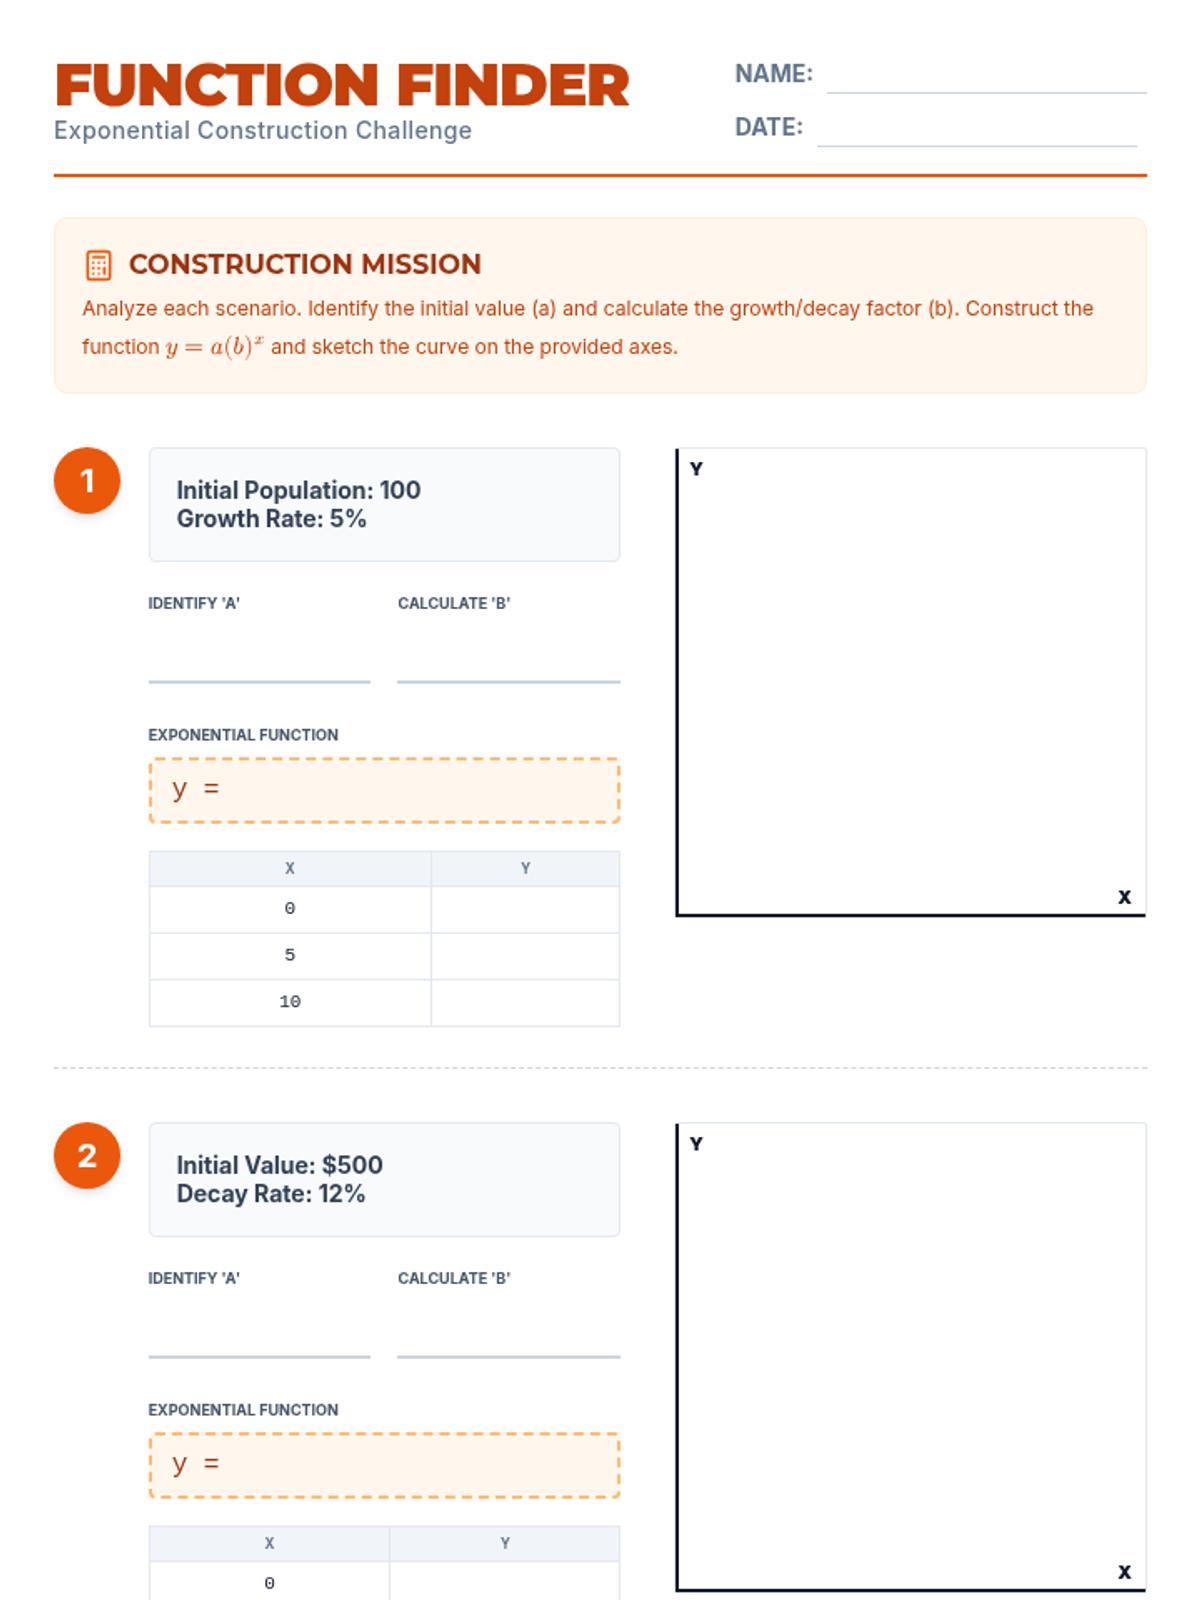
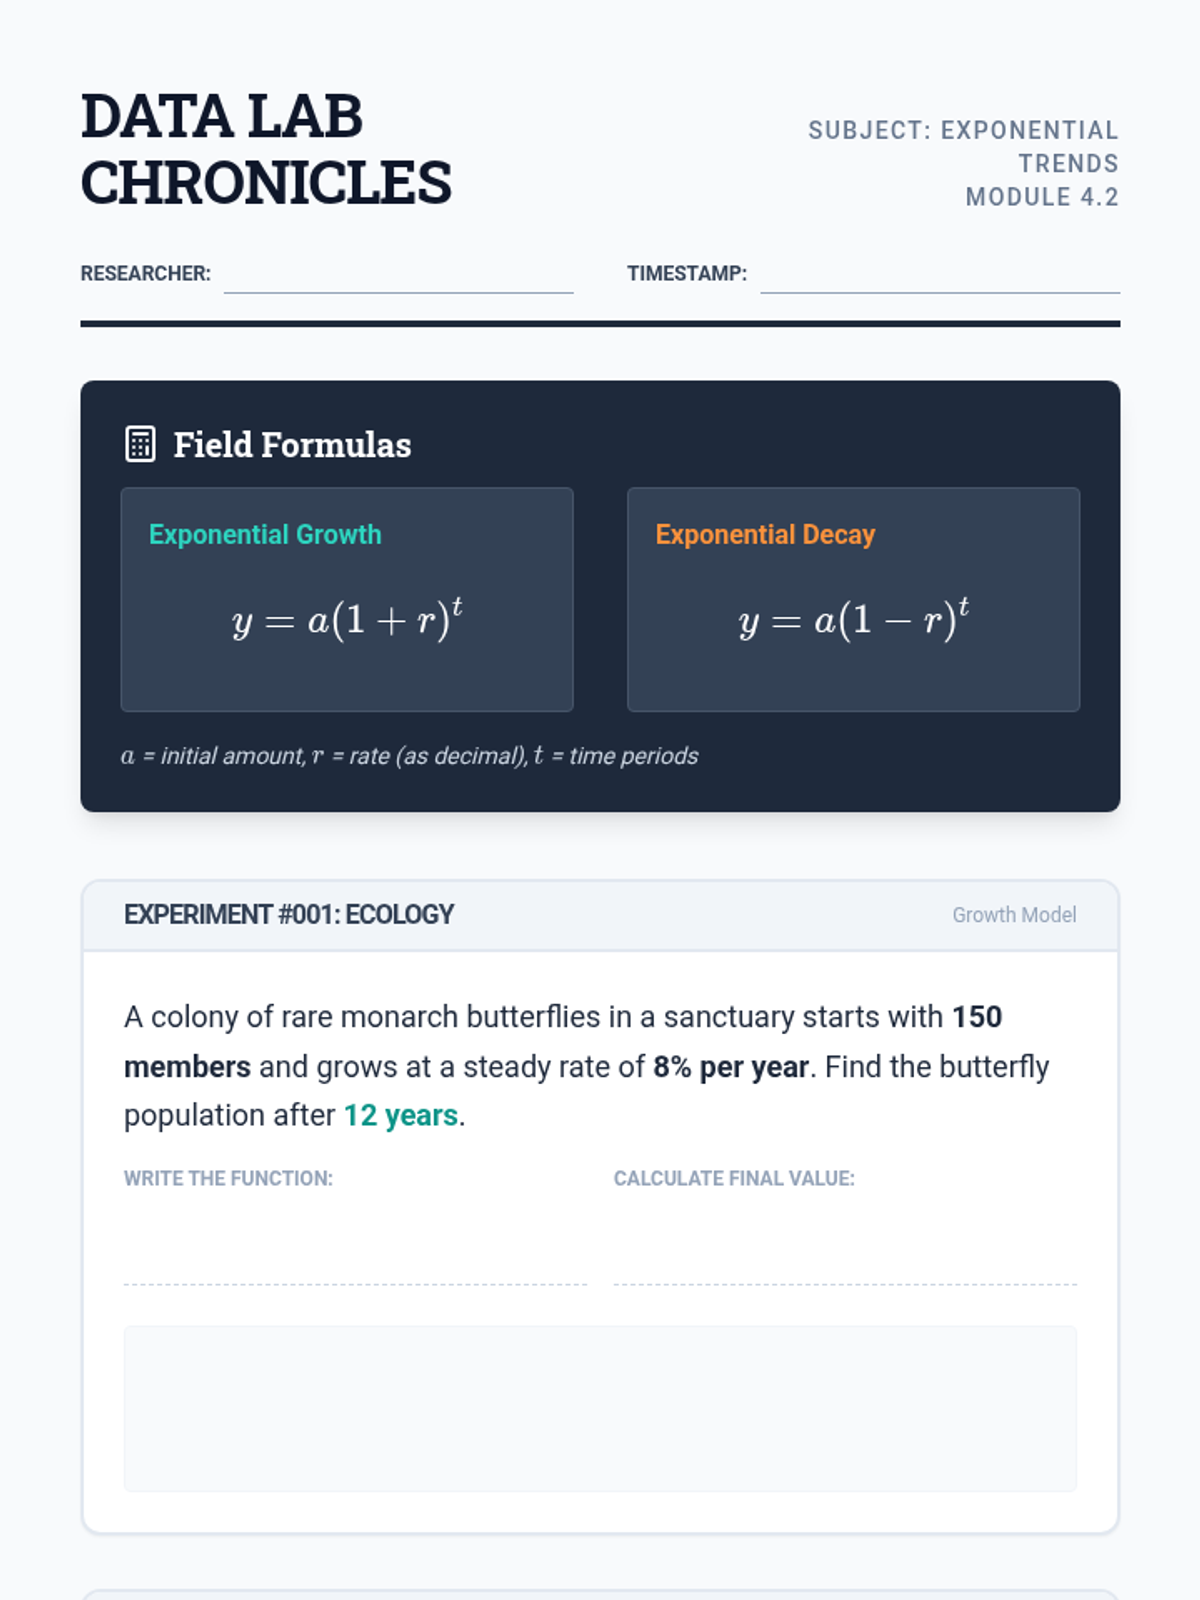
A lesson focused on modeling real-world situations using exponential growth and decay functions, calculating future values over time.
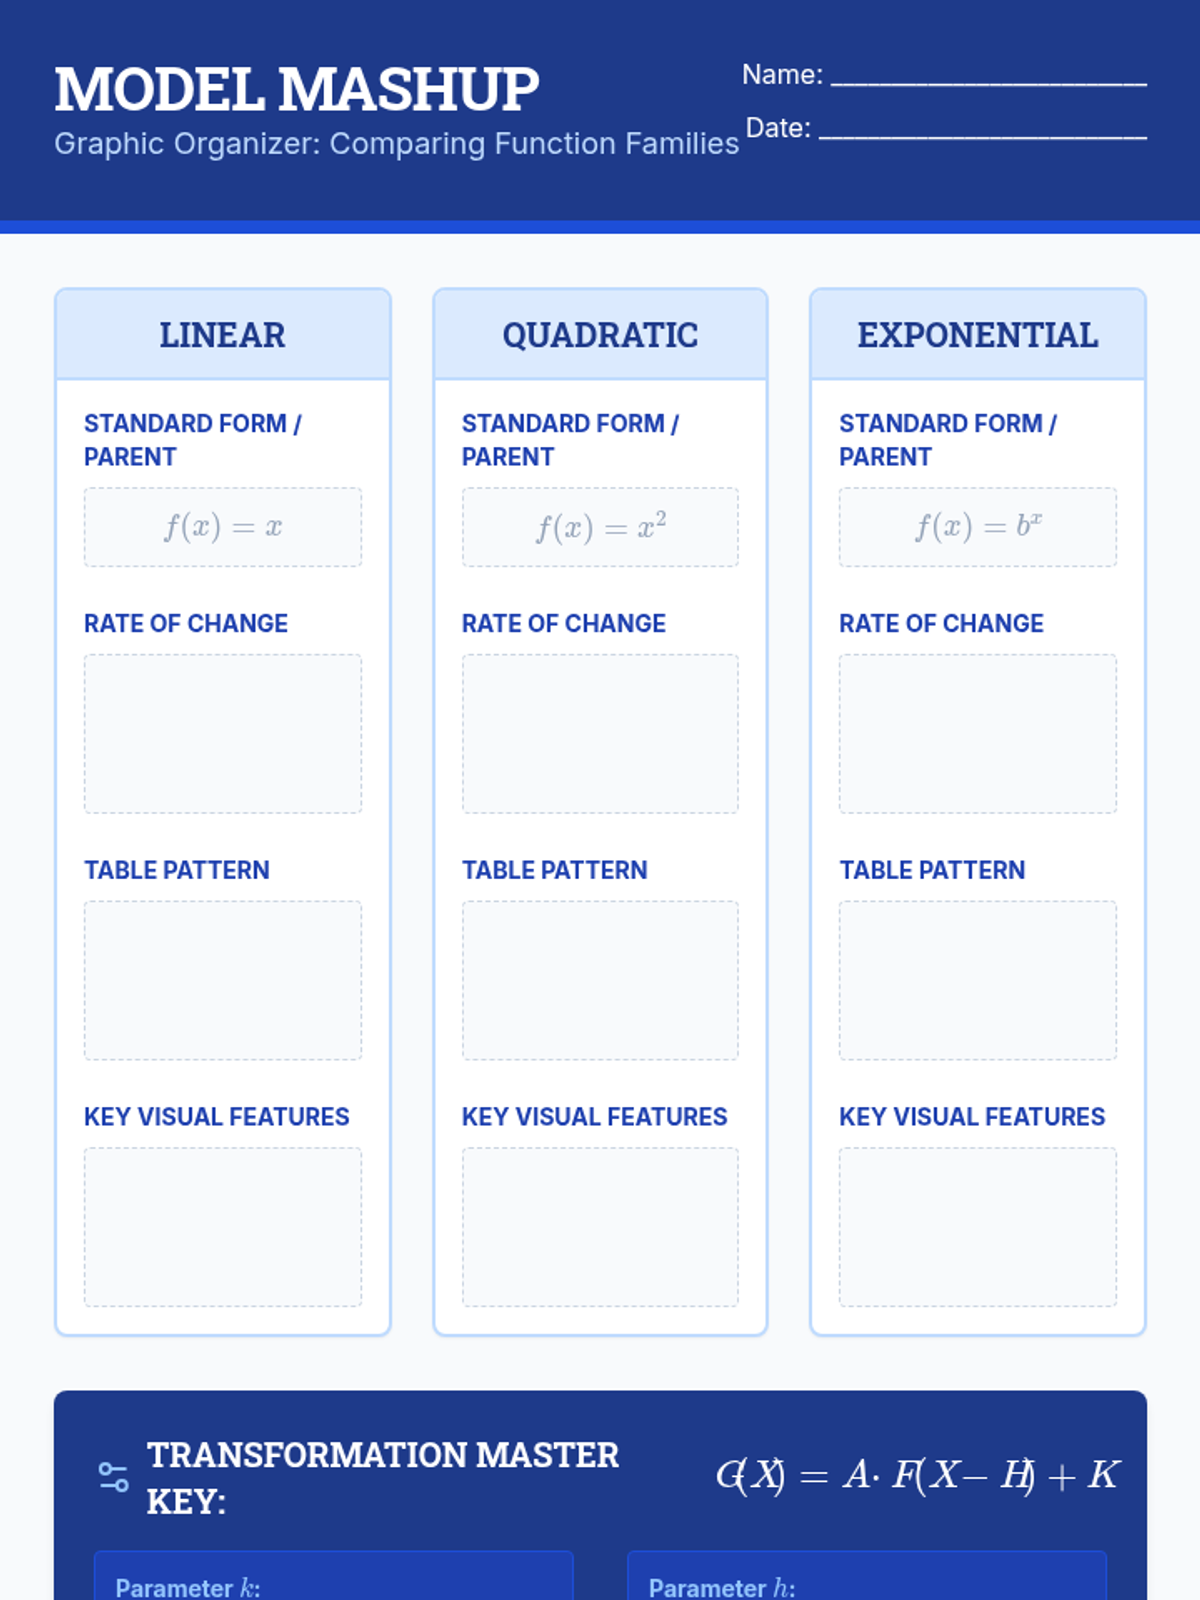
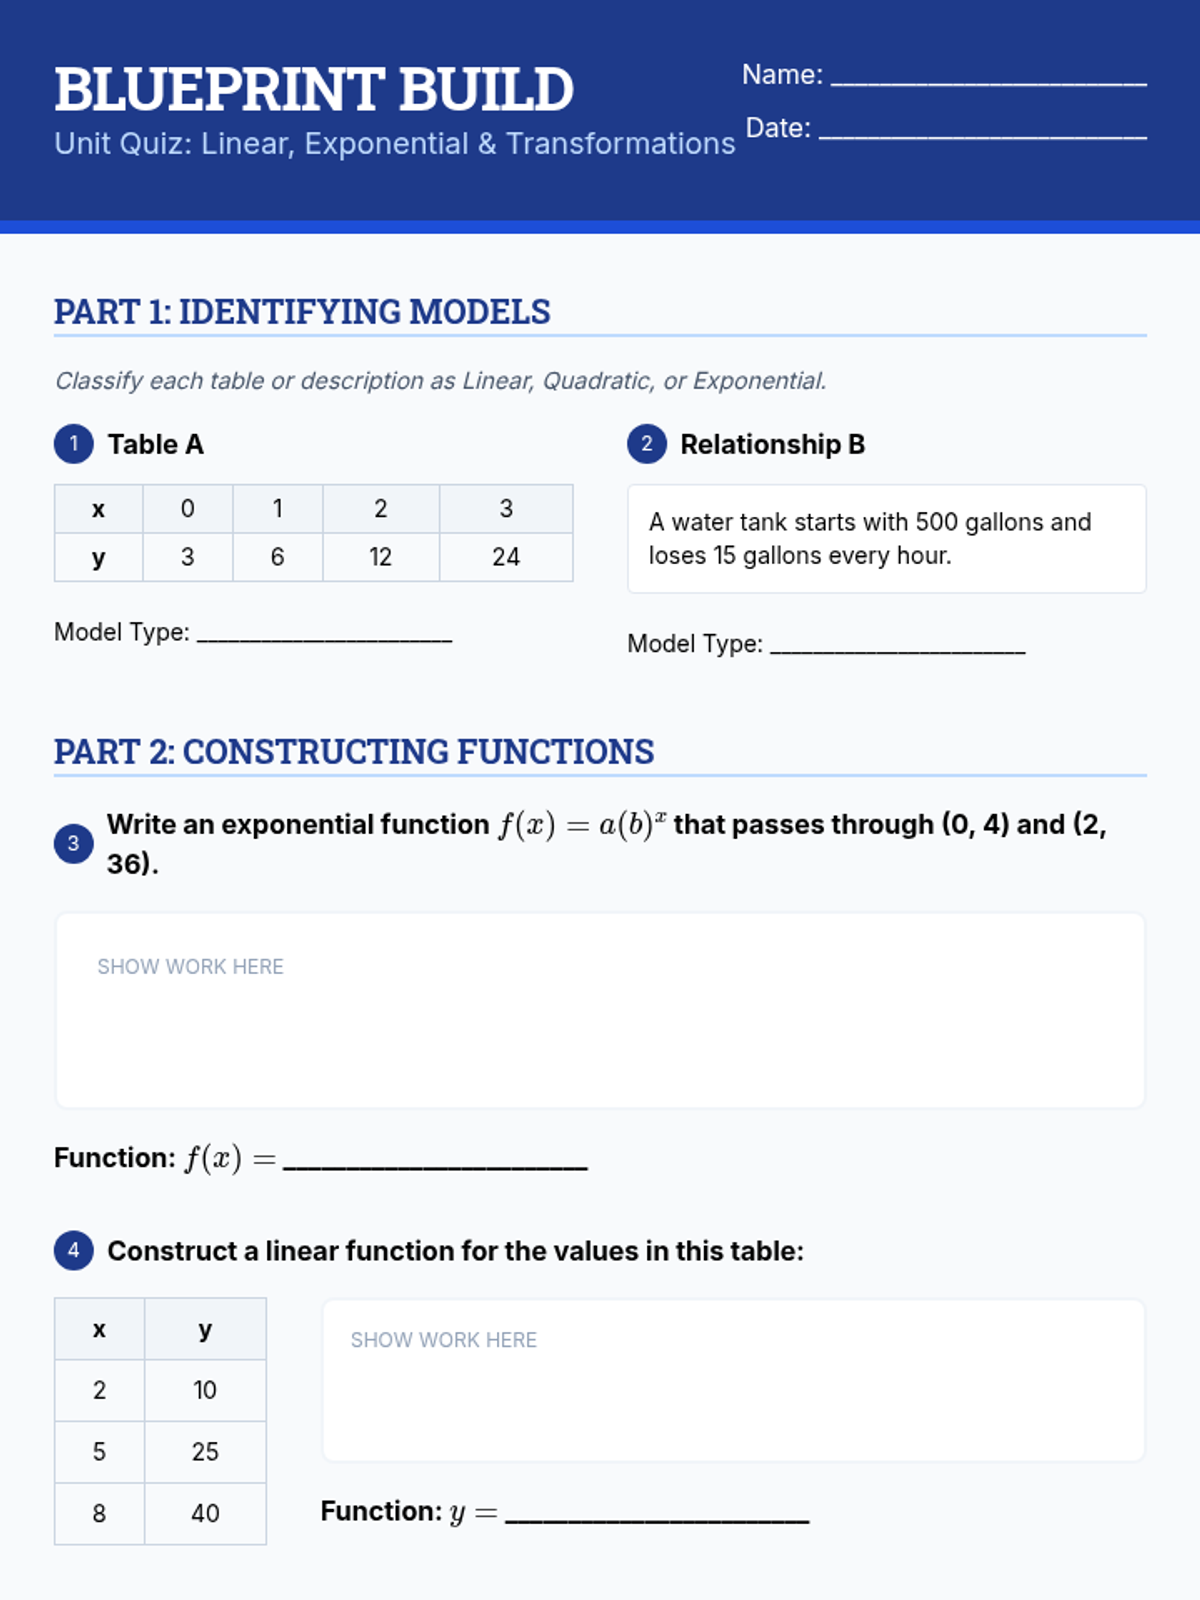
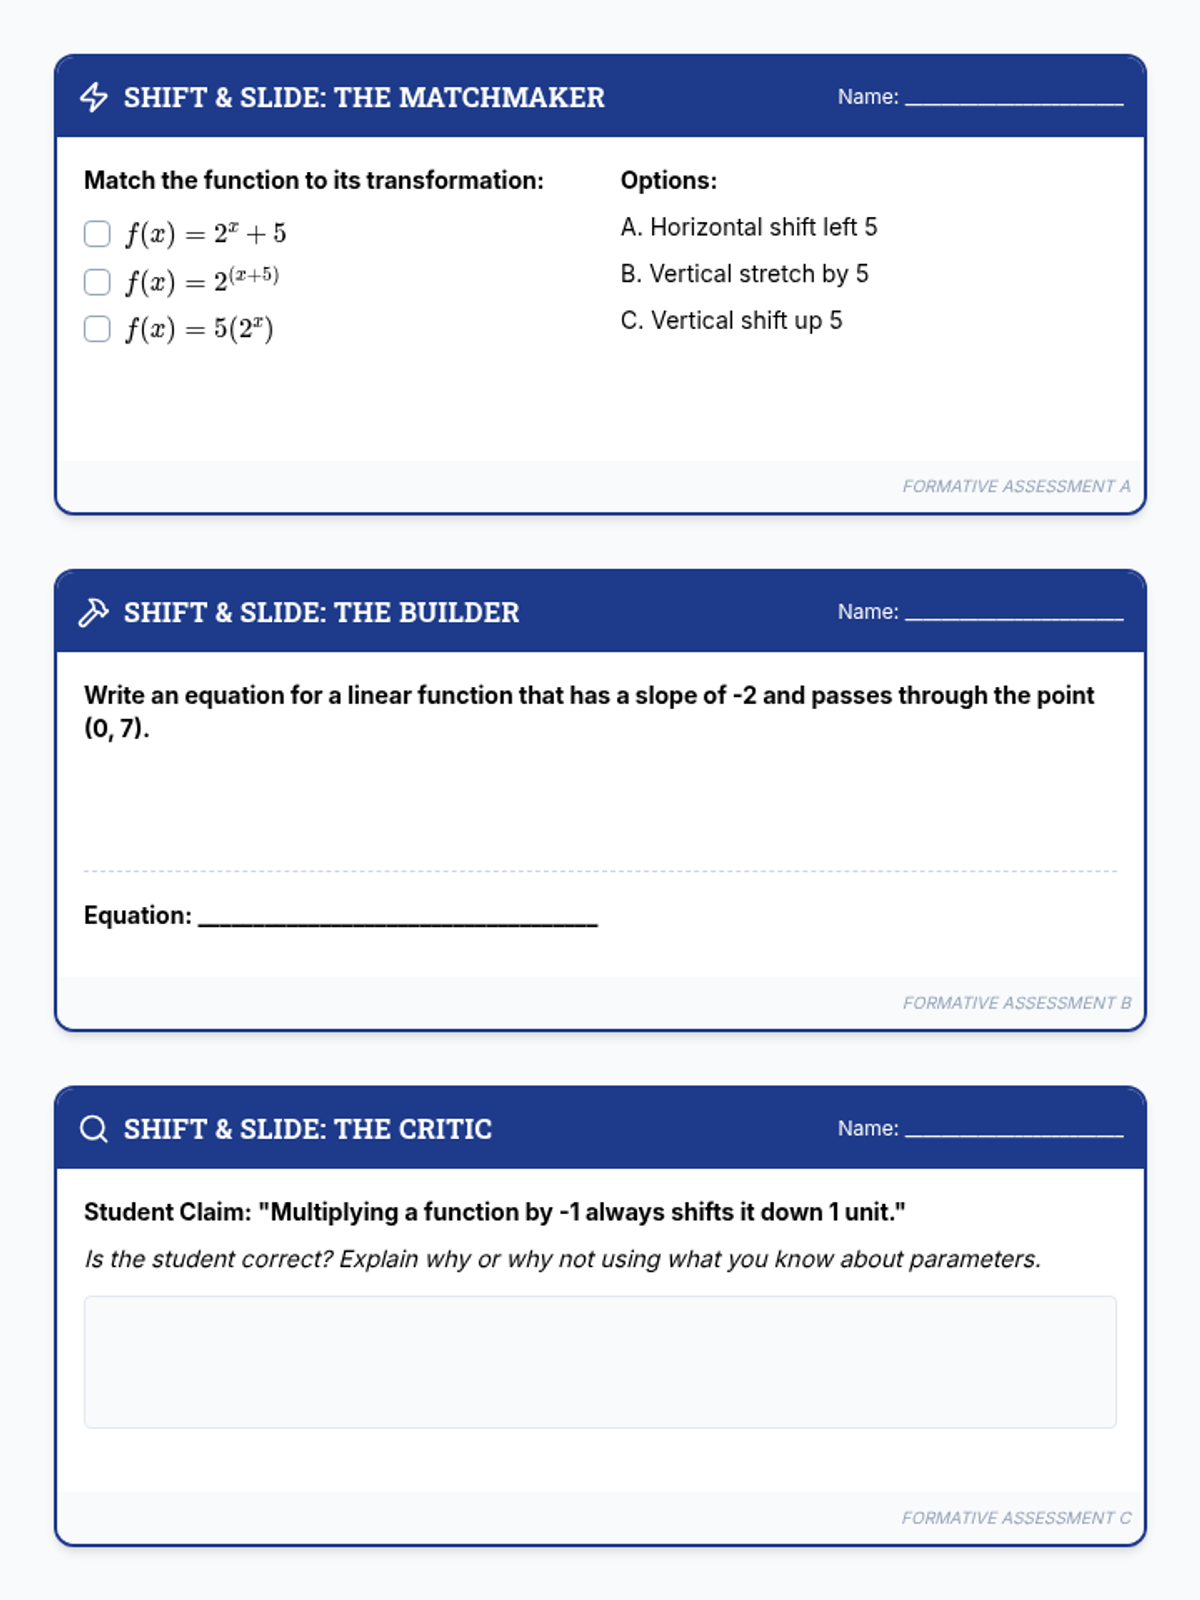
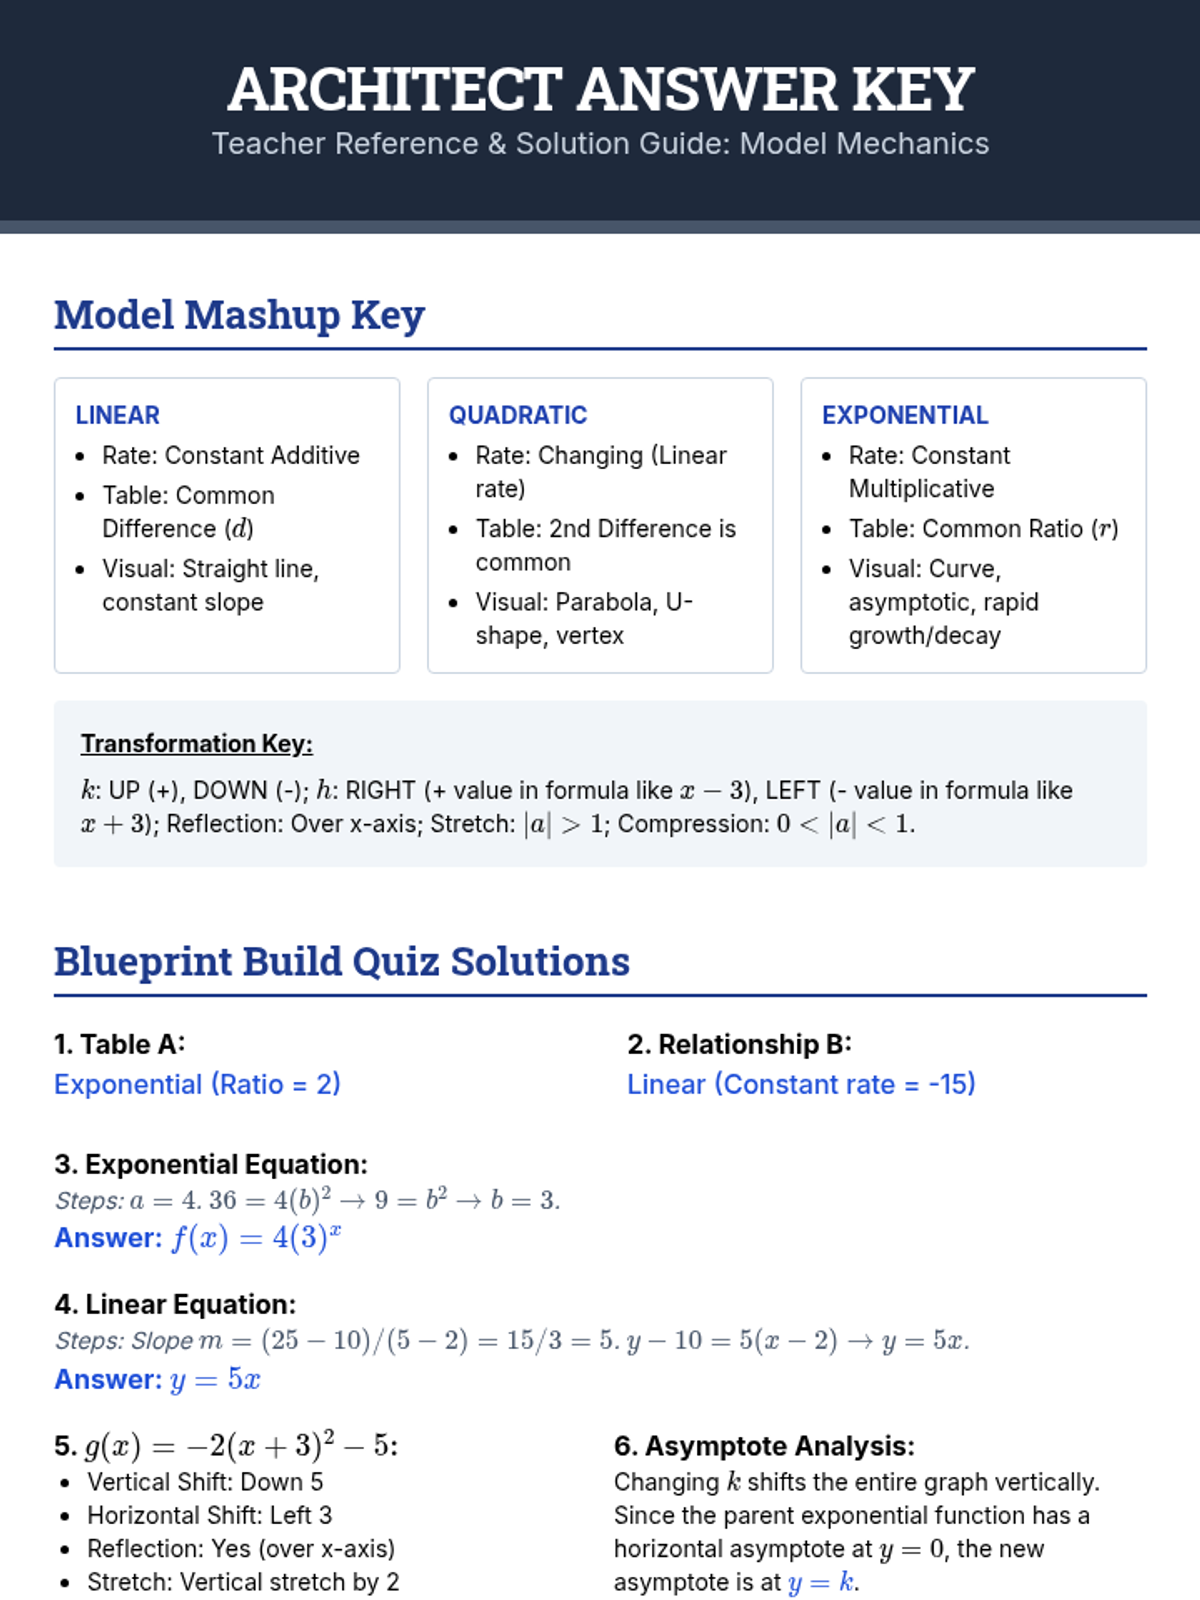
A comprehensive lesson focusing on constructing linear and exponential models and analyzing function transformations. Students will compare function families and evaluate how parameters shift and stretch graphs.
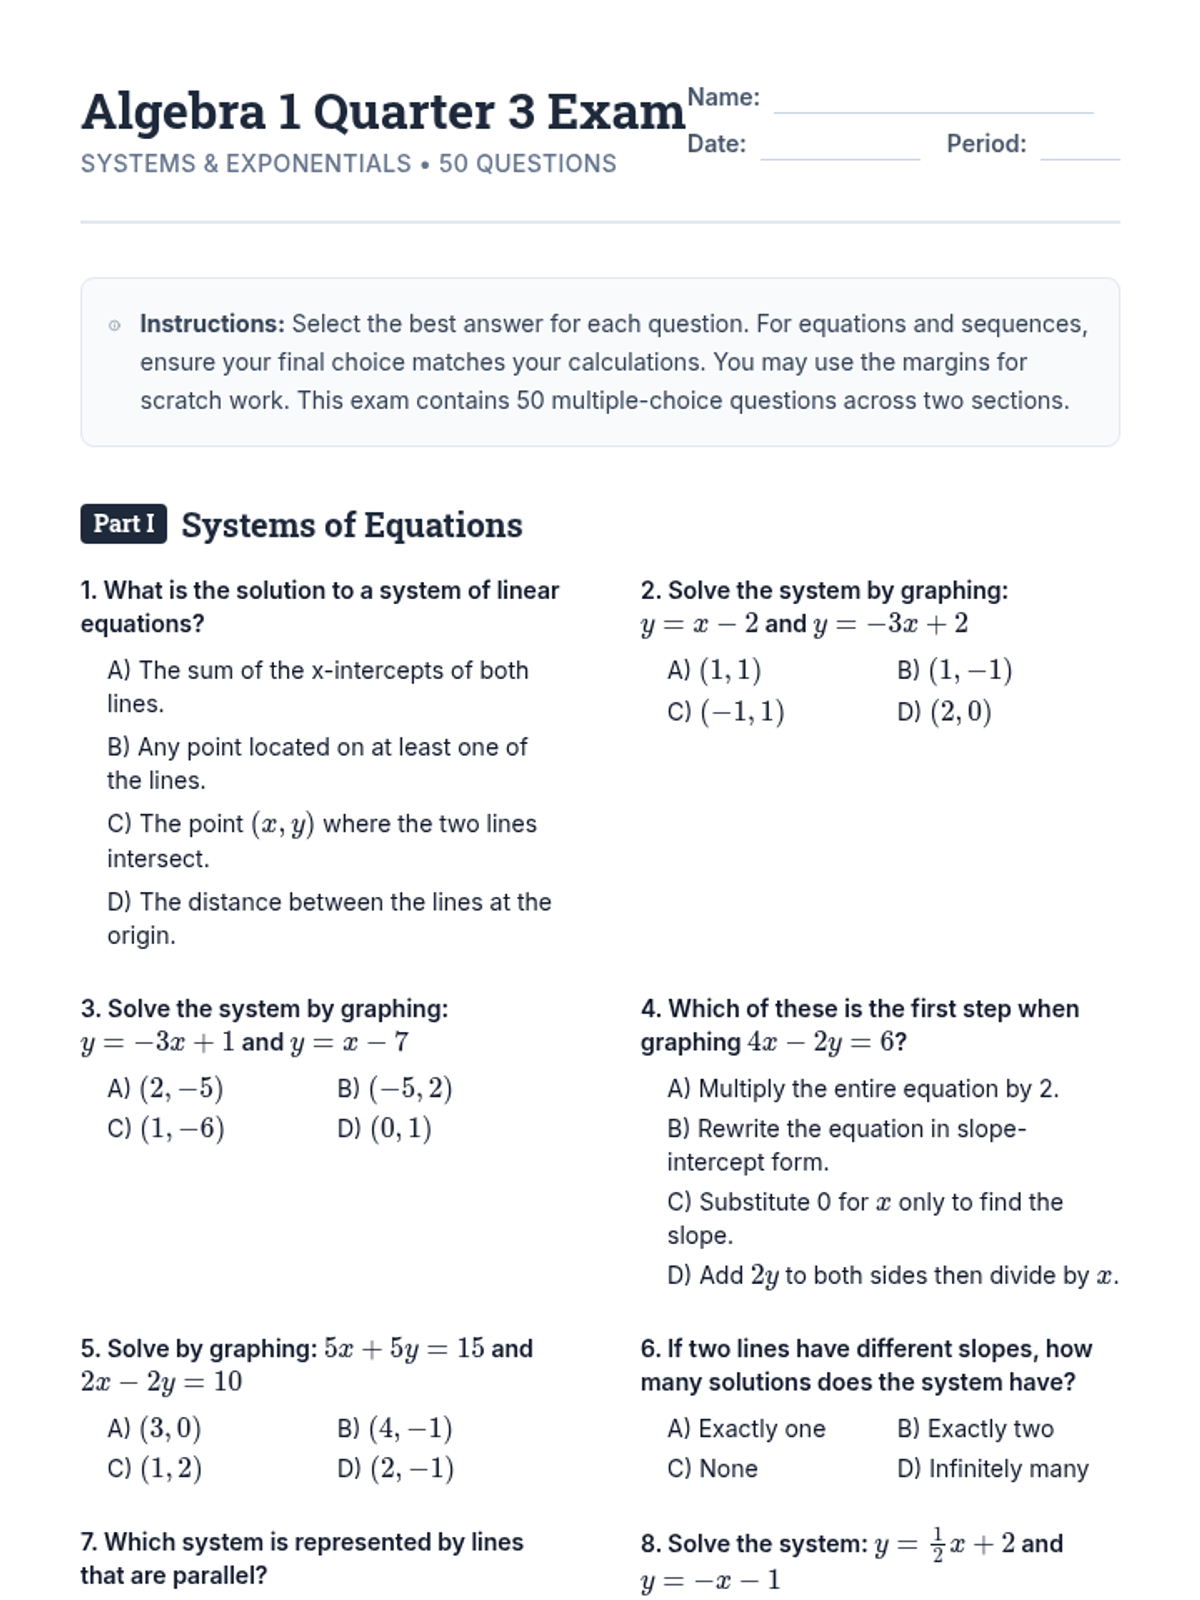
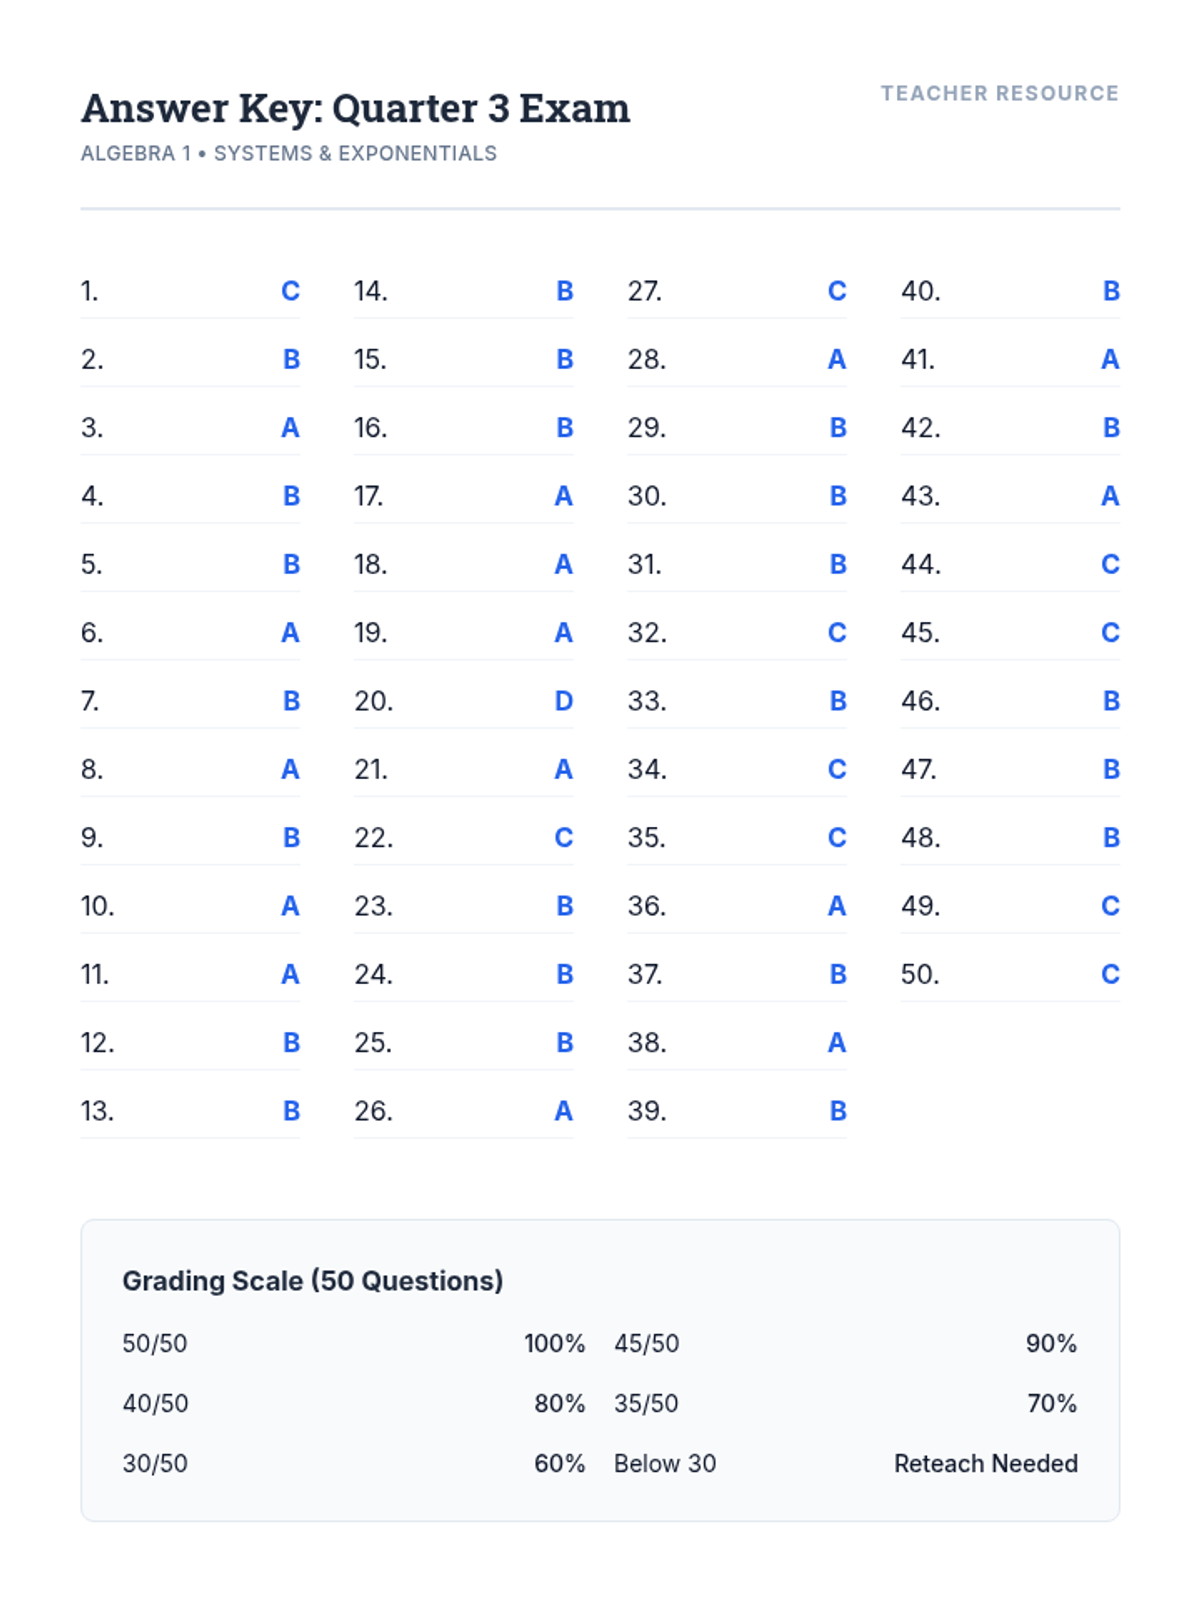
A comprehensive assessment covering Systems of Equations and Exponential Functions for Algebra 1 students in their 3rd Quarter.
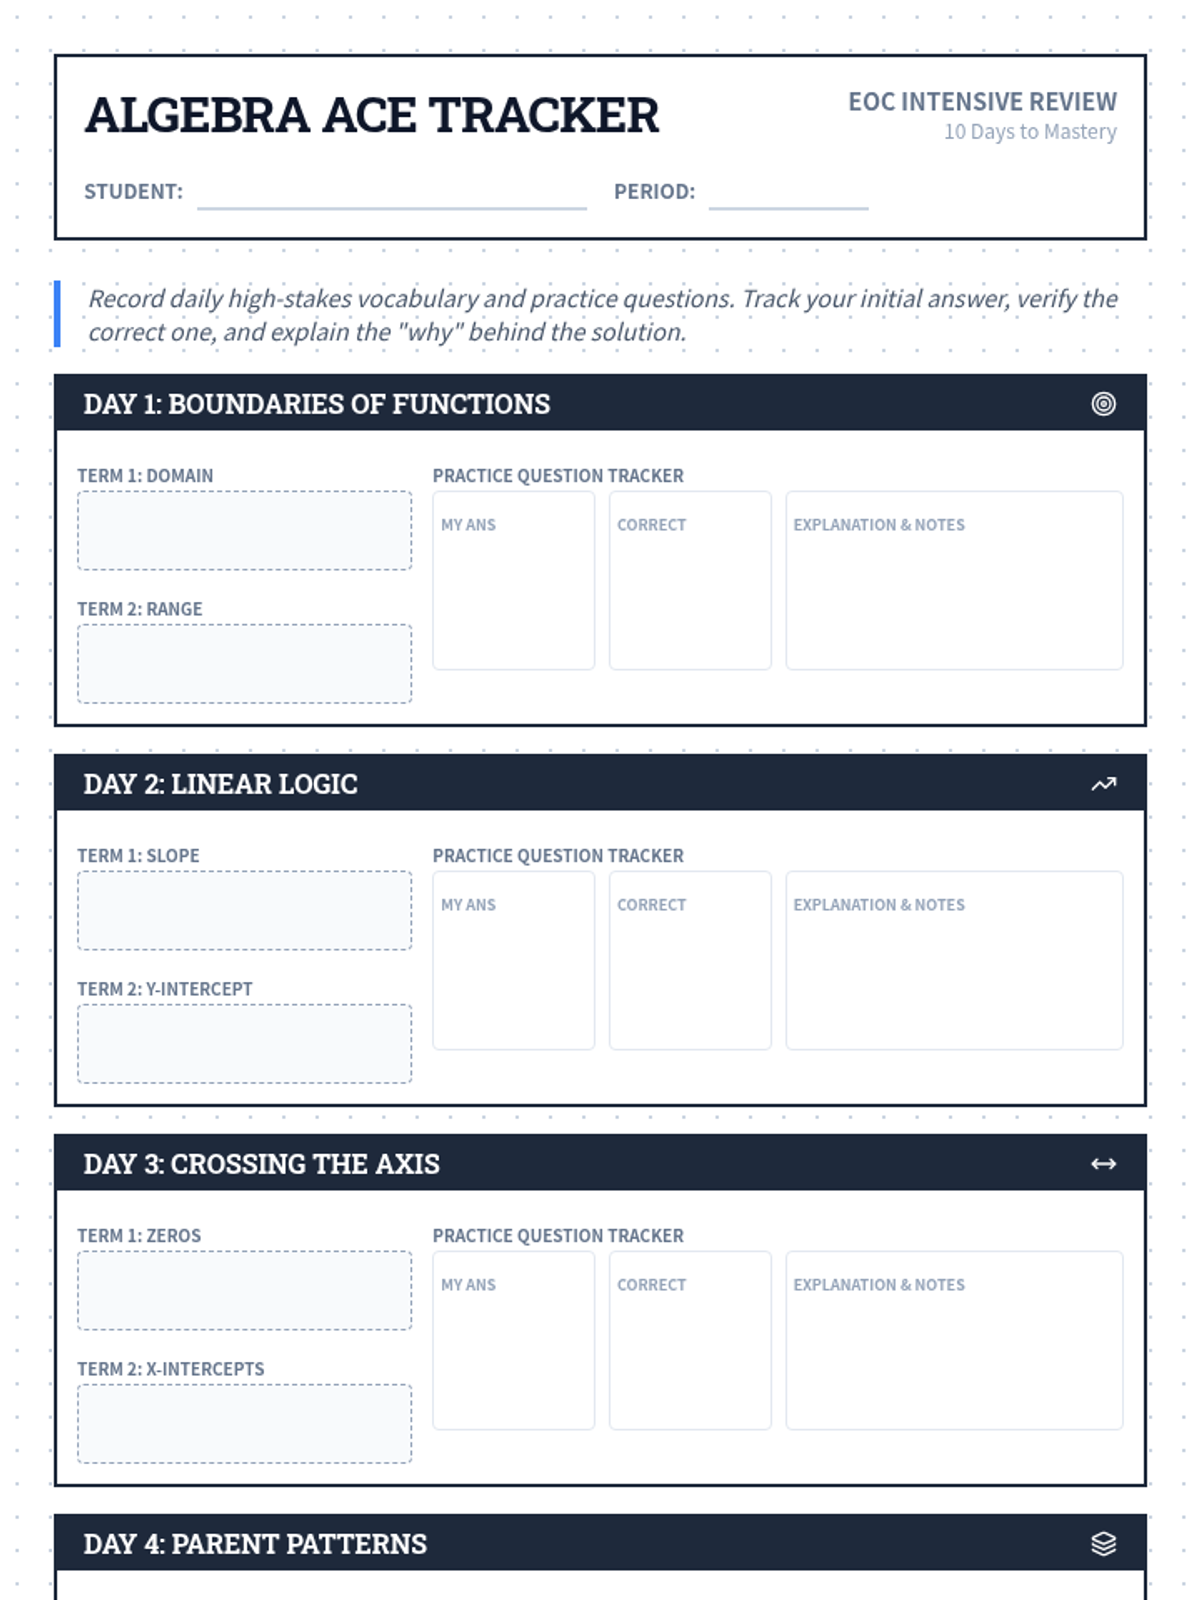
Day 1 of the EOC review focusing on the fundamental concepts of Domain and Range.
Comprehensive review of high-frequency question types and unit conversions.
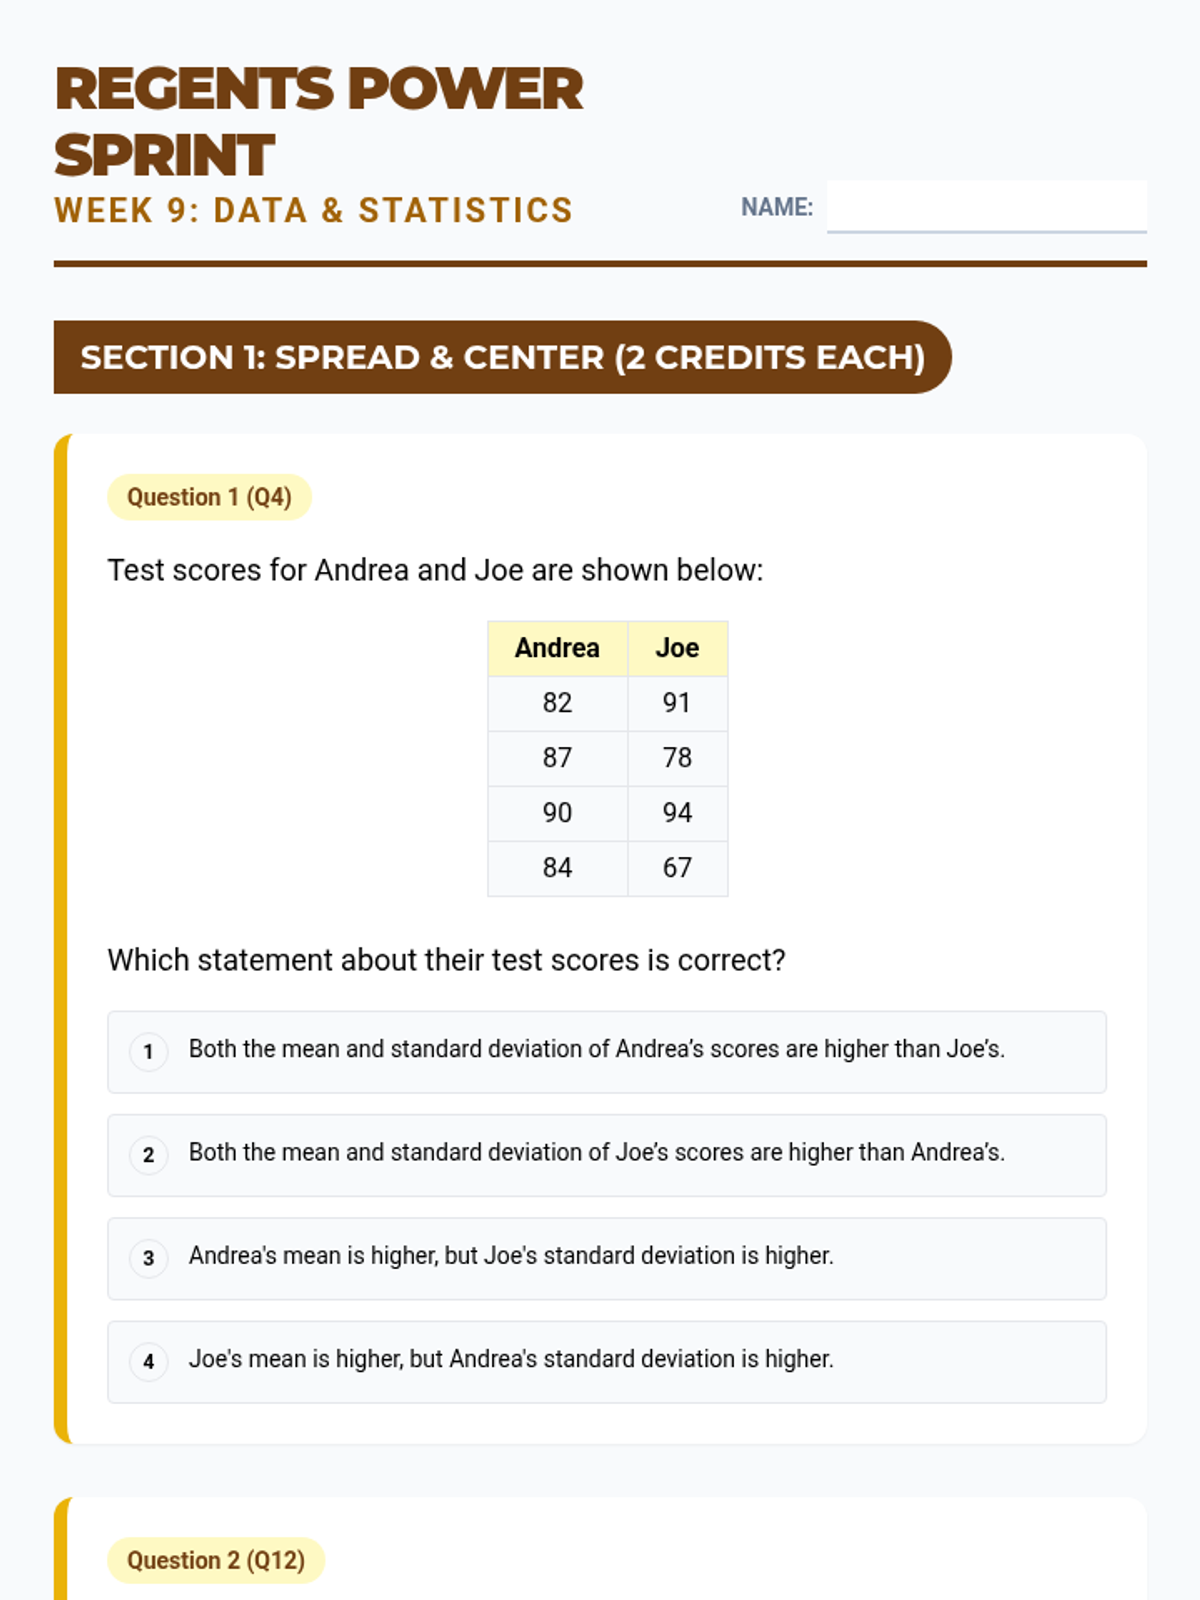
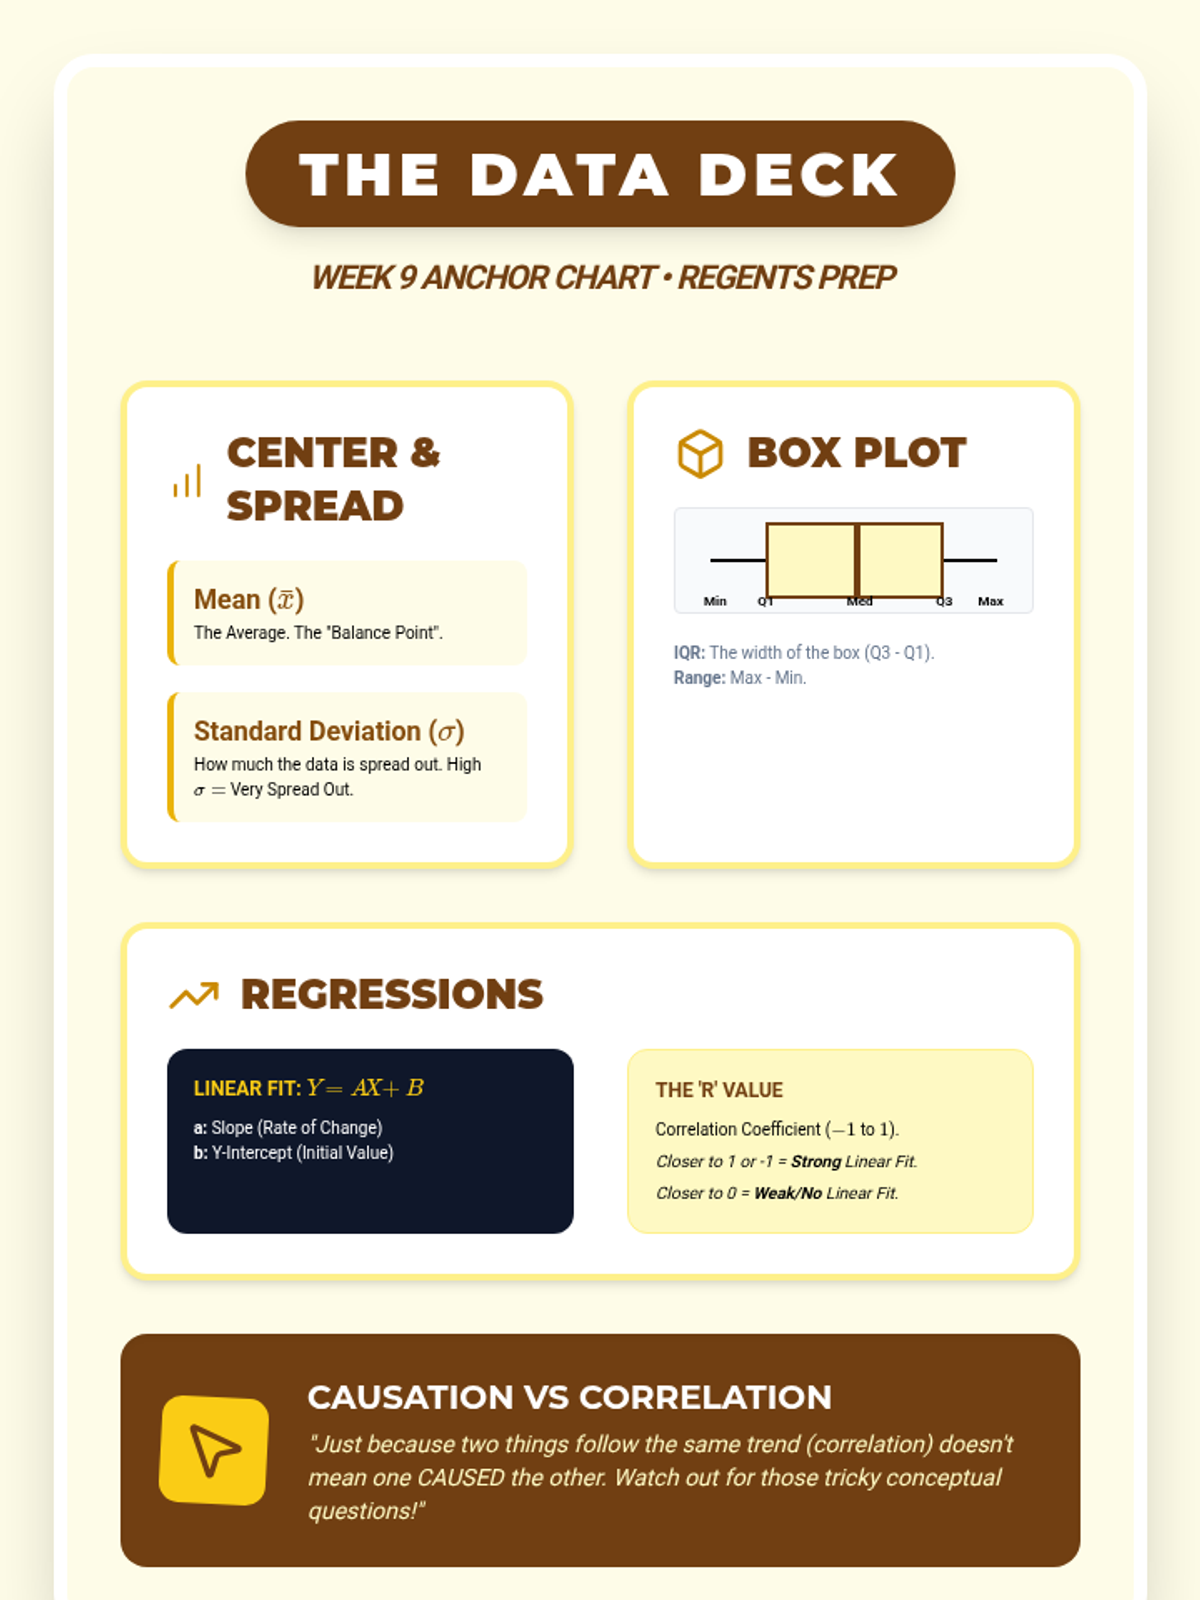
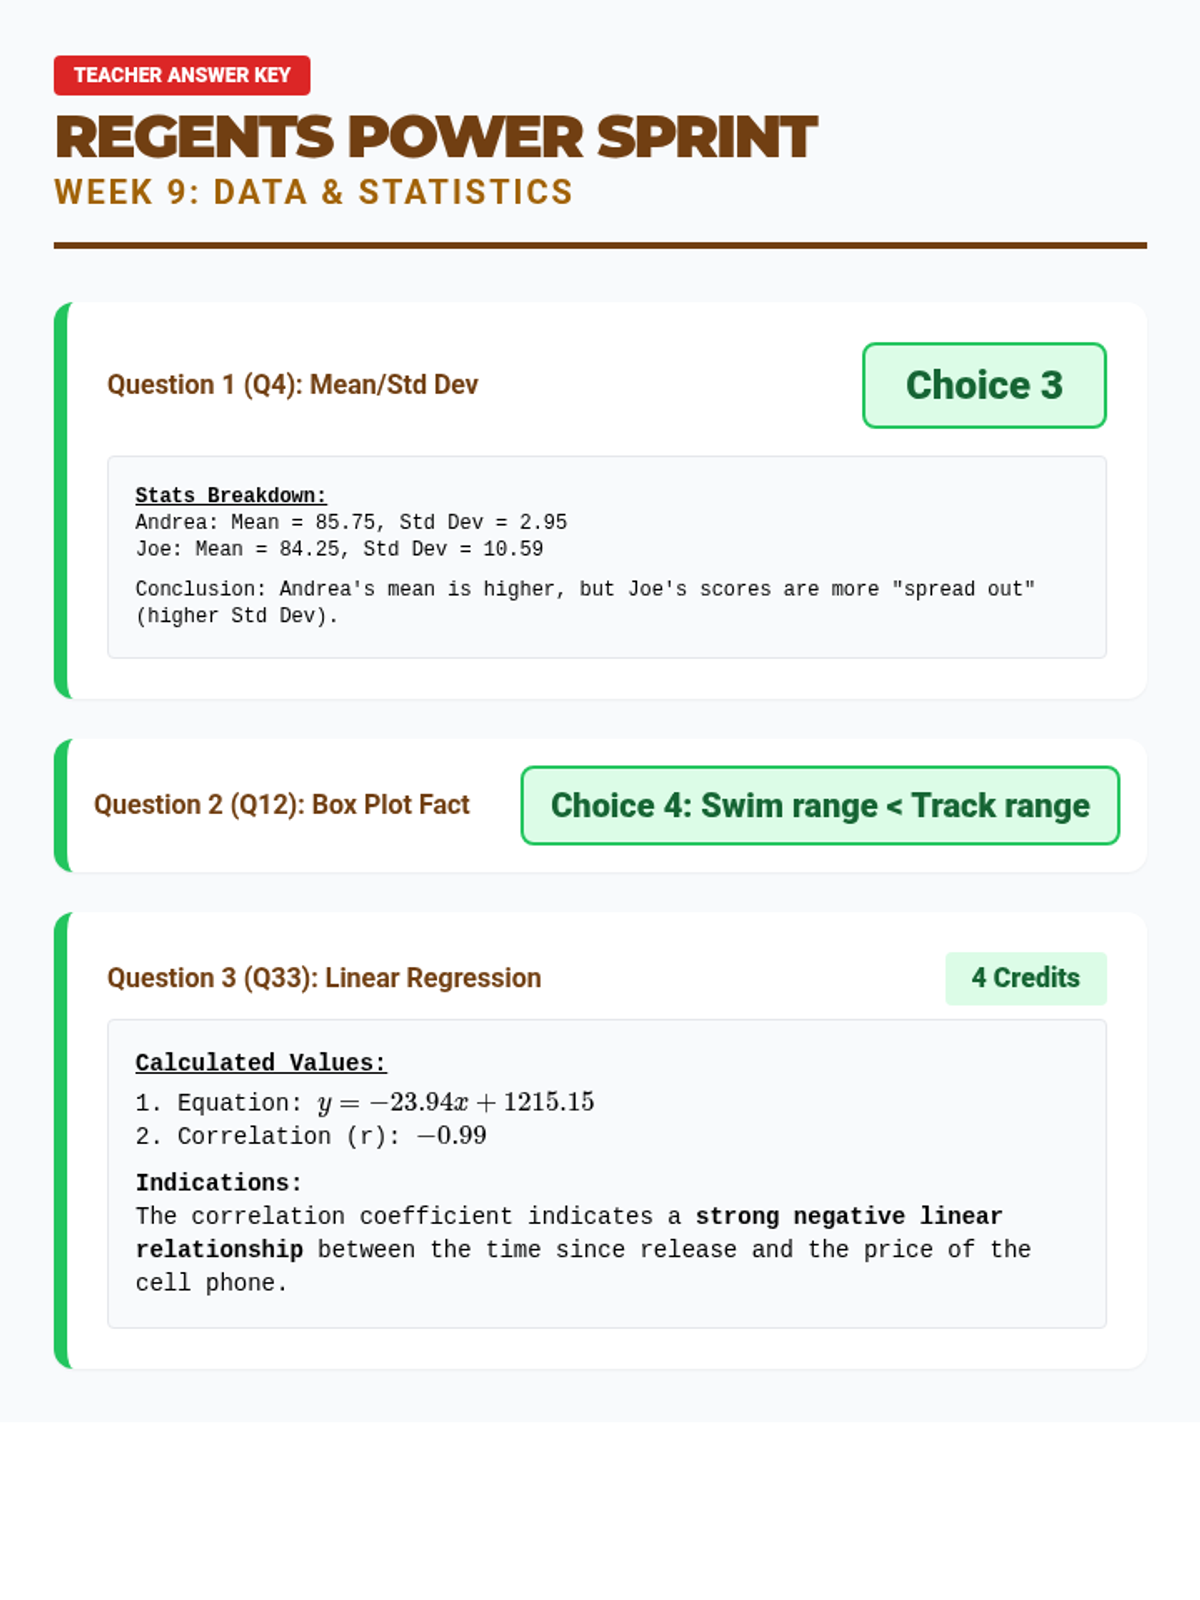
Focus on interpreting box plots, mean/standard deviation, and linear regression with correlation coefficients.
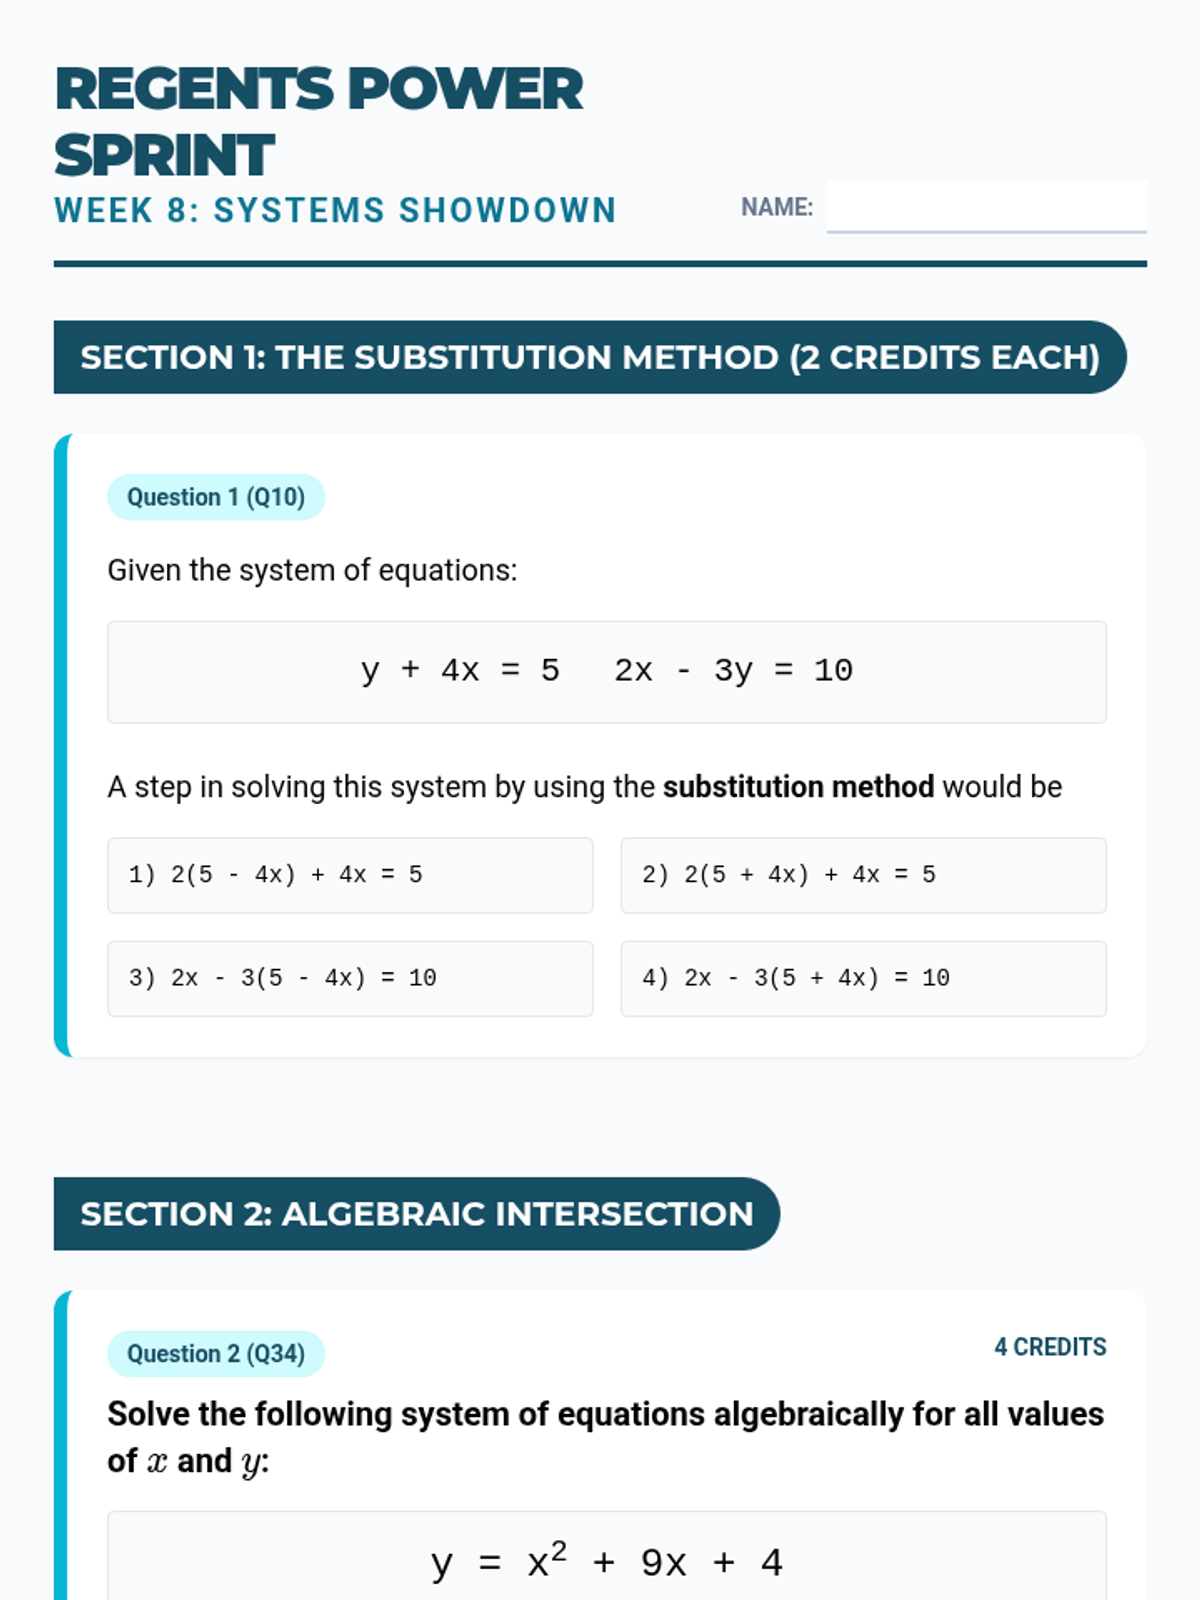
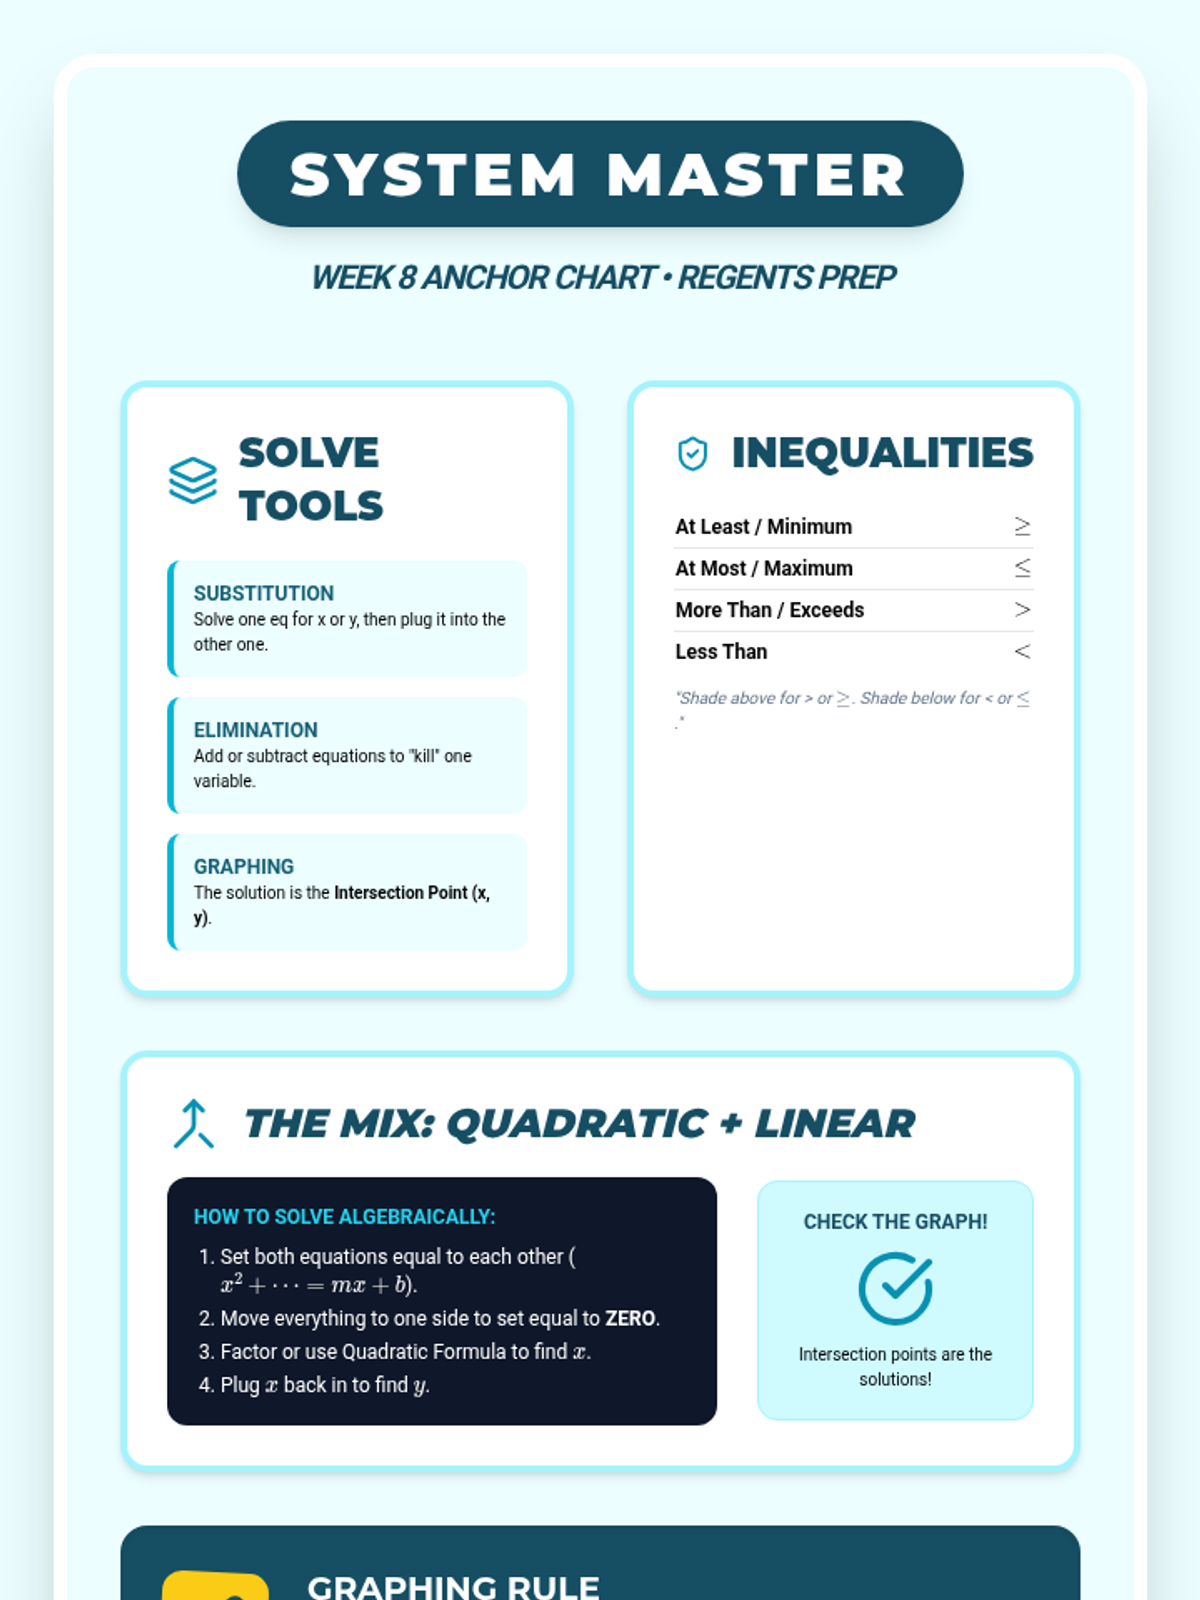
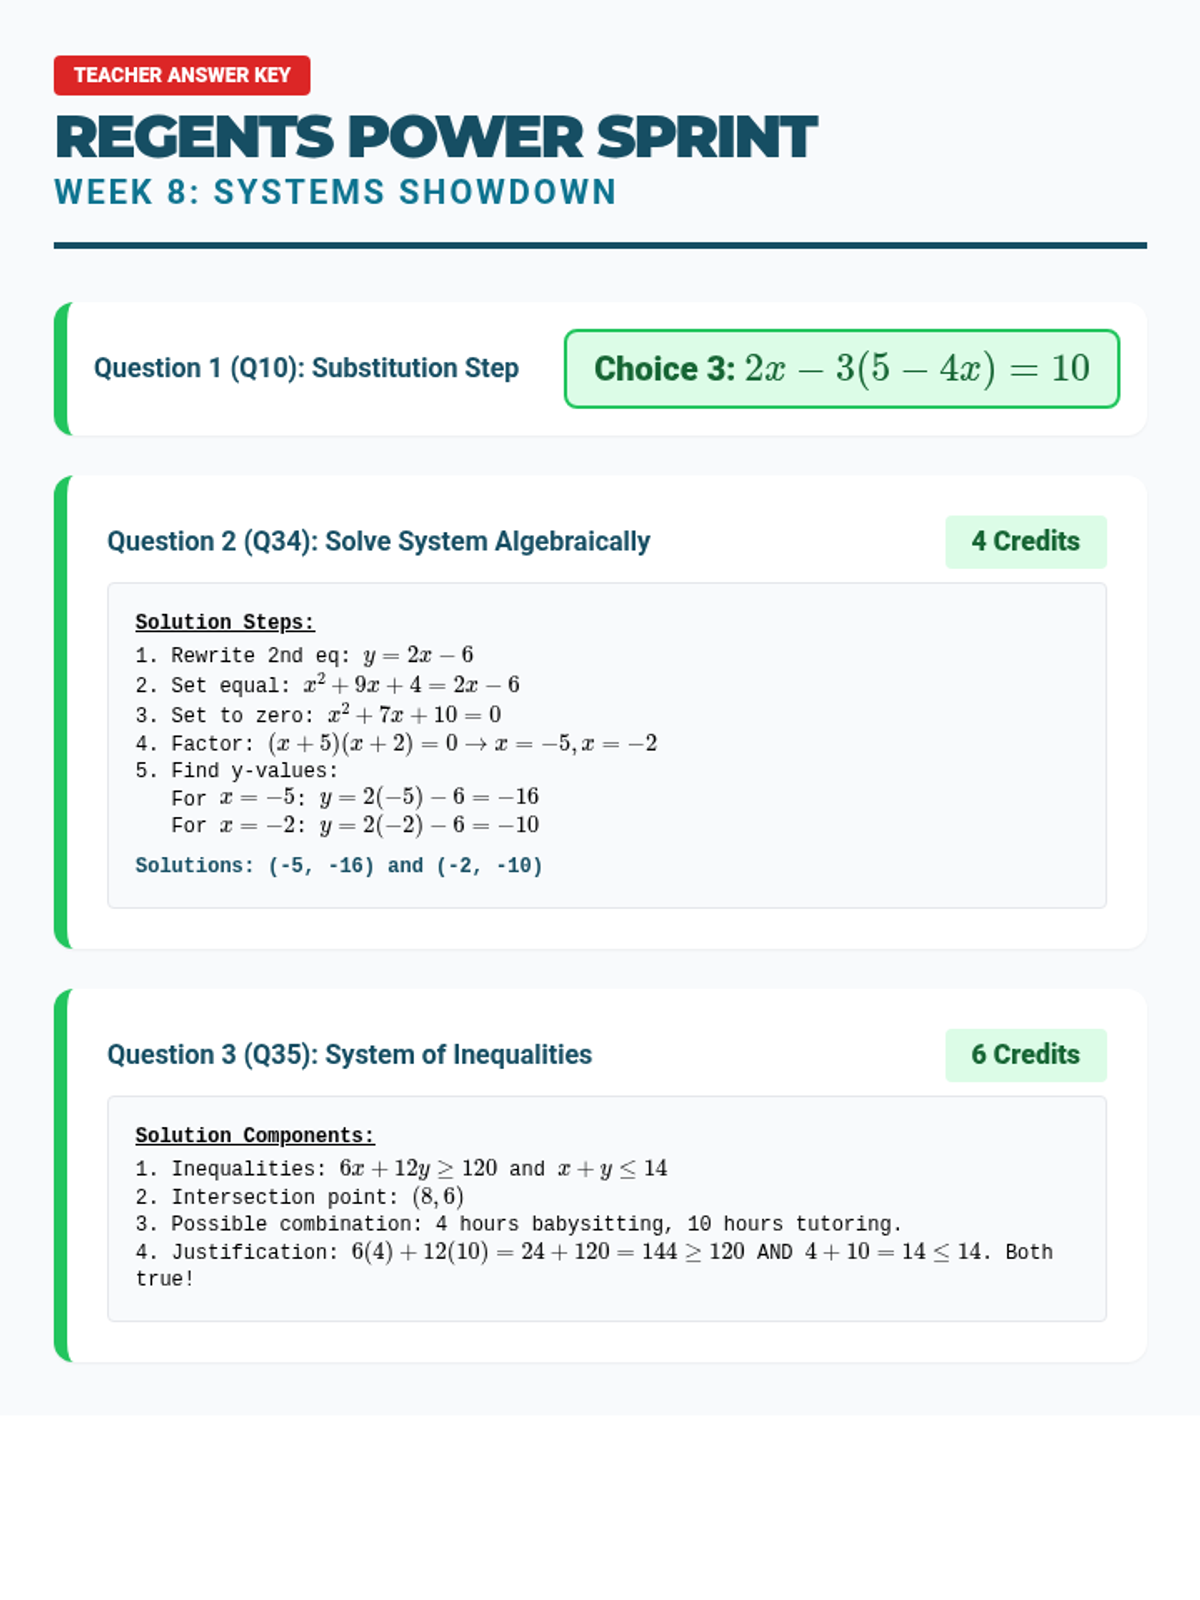
Focus on solving systems of equations algebraically and graphing systems of linear inequalities.
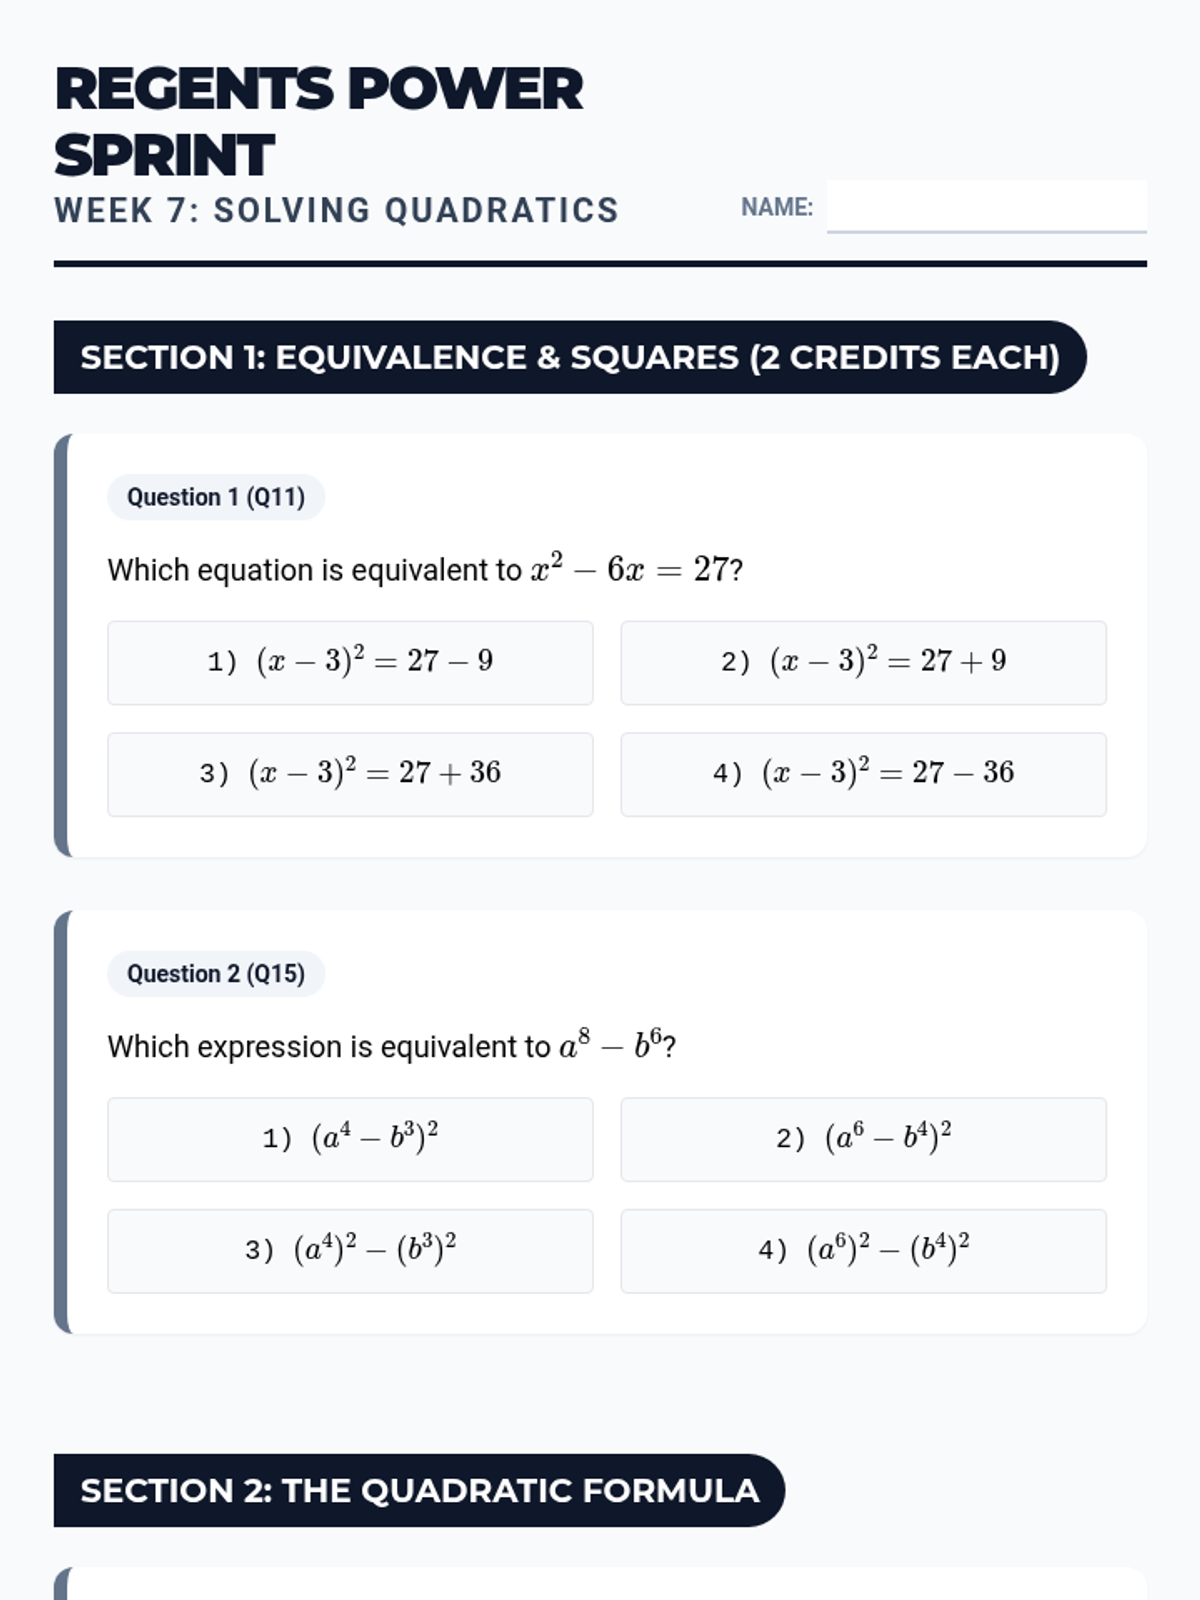
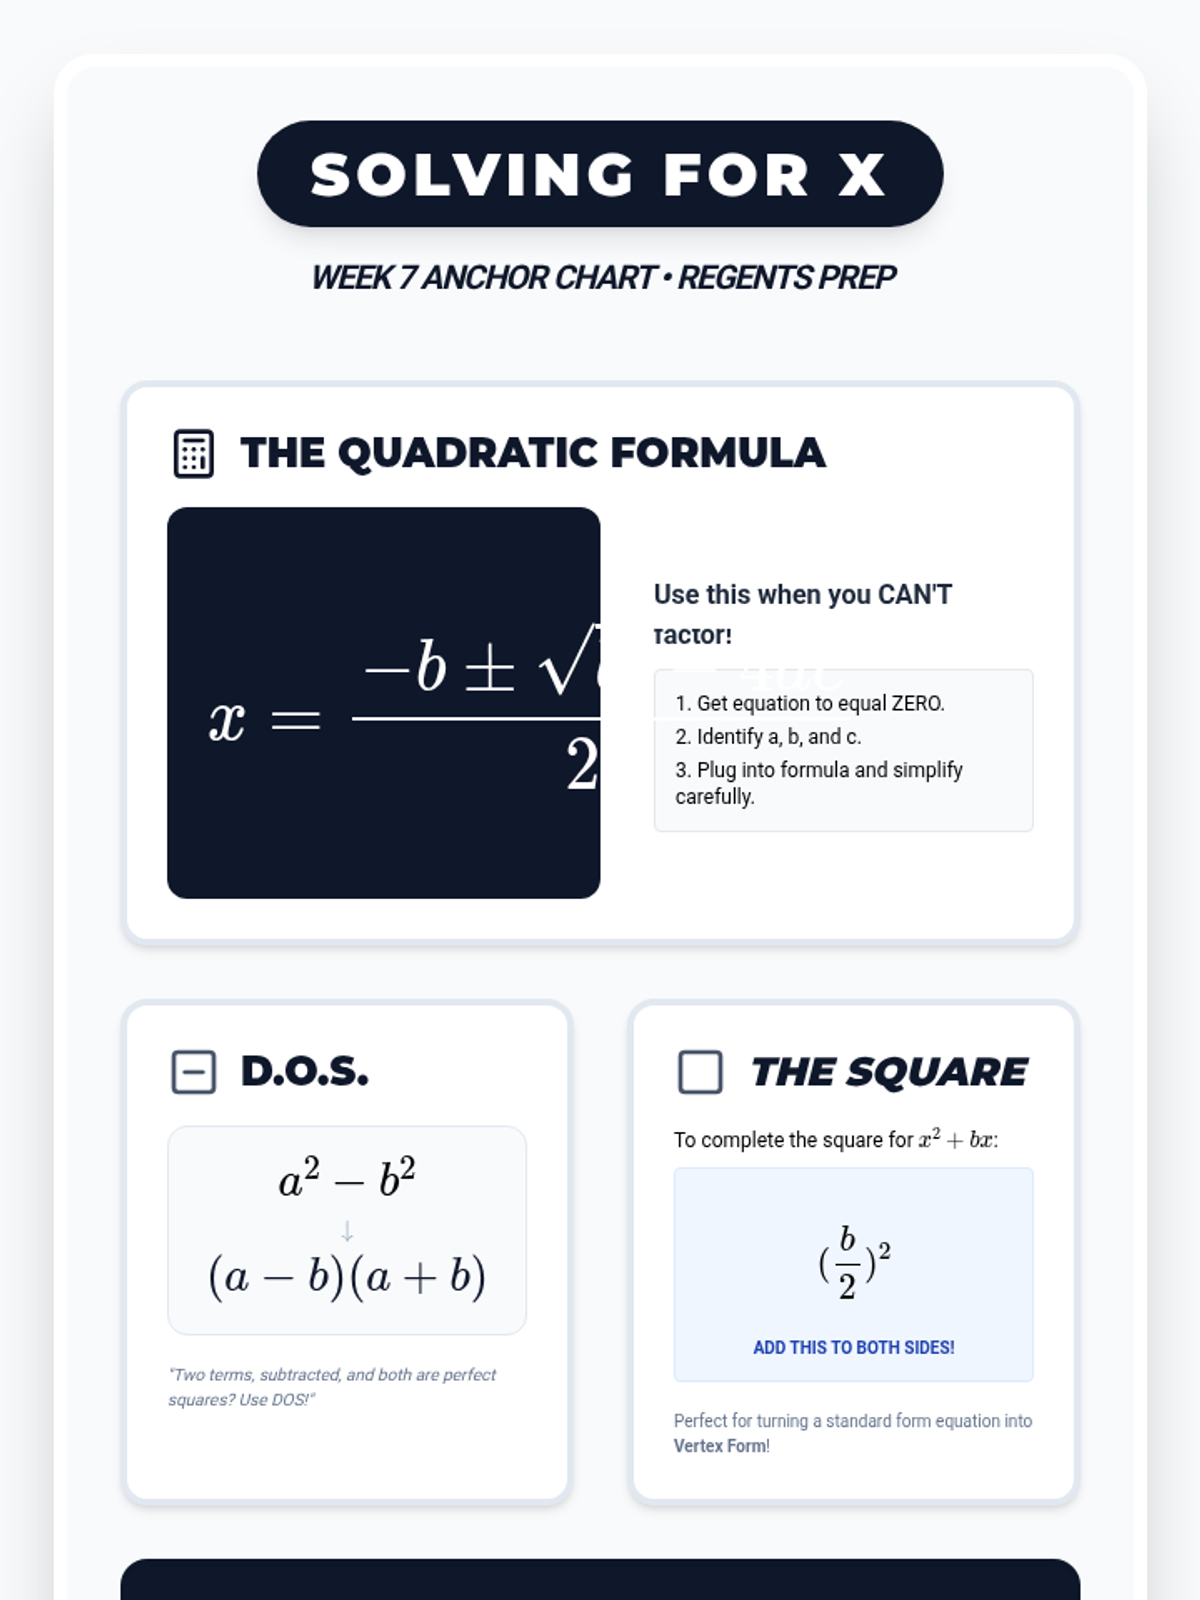
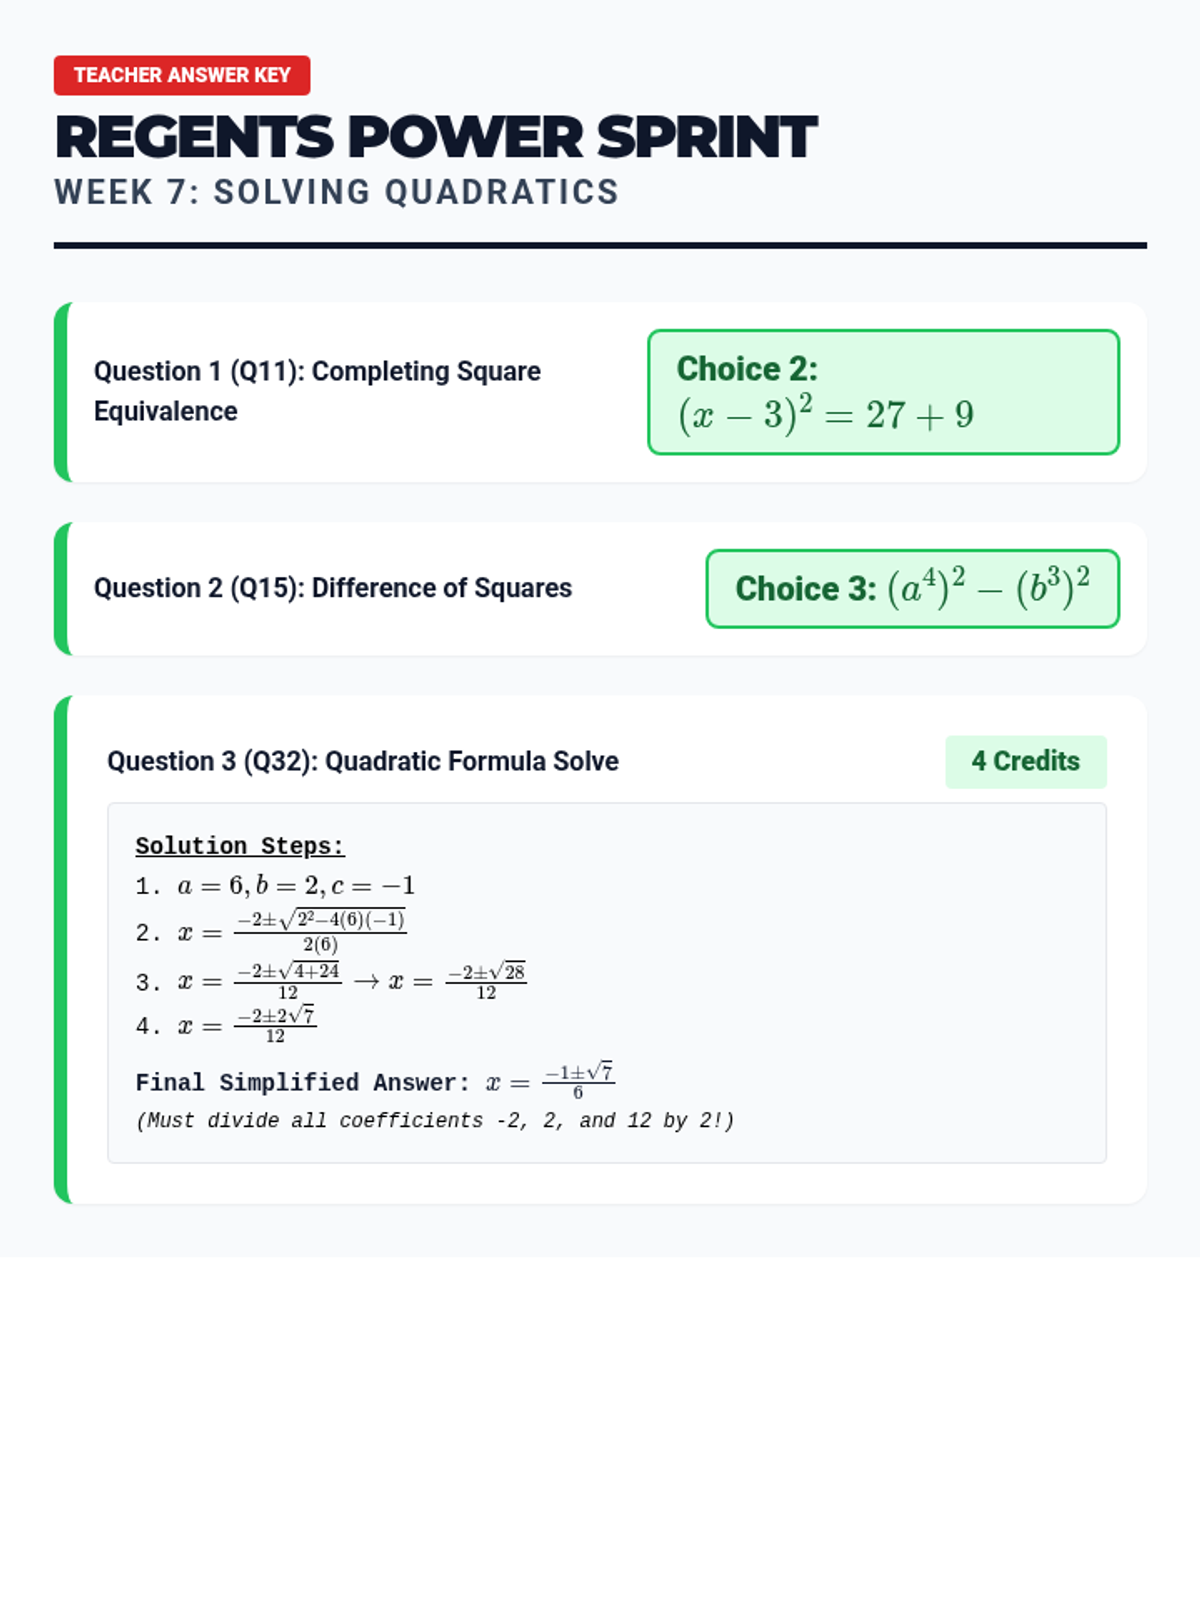
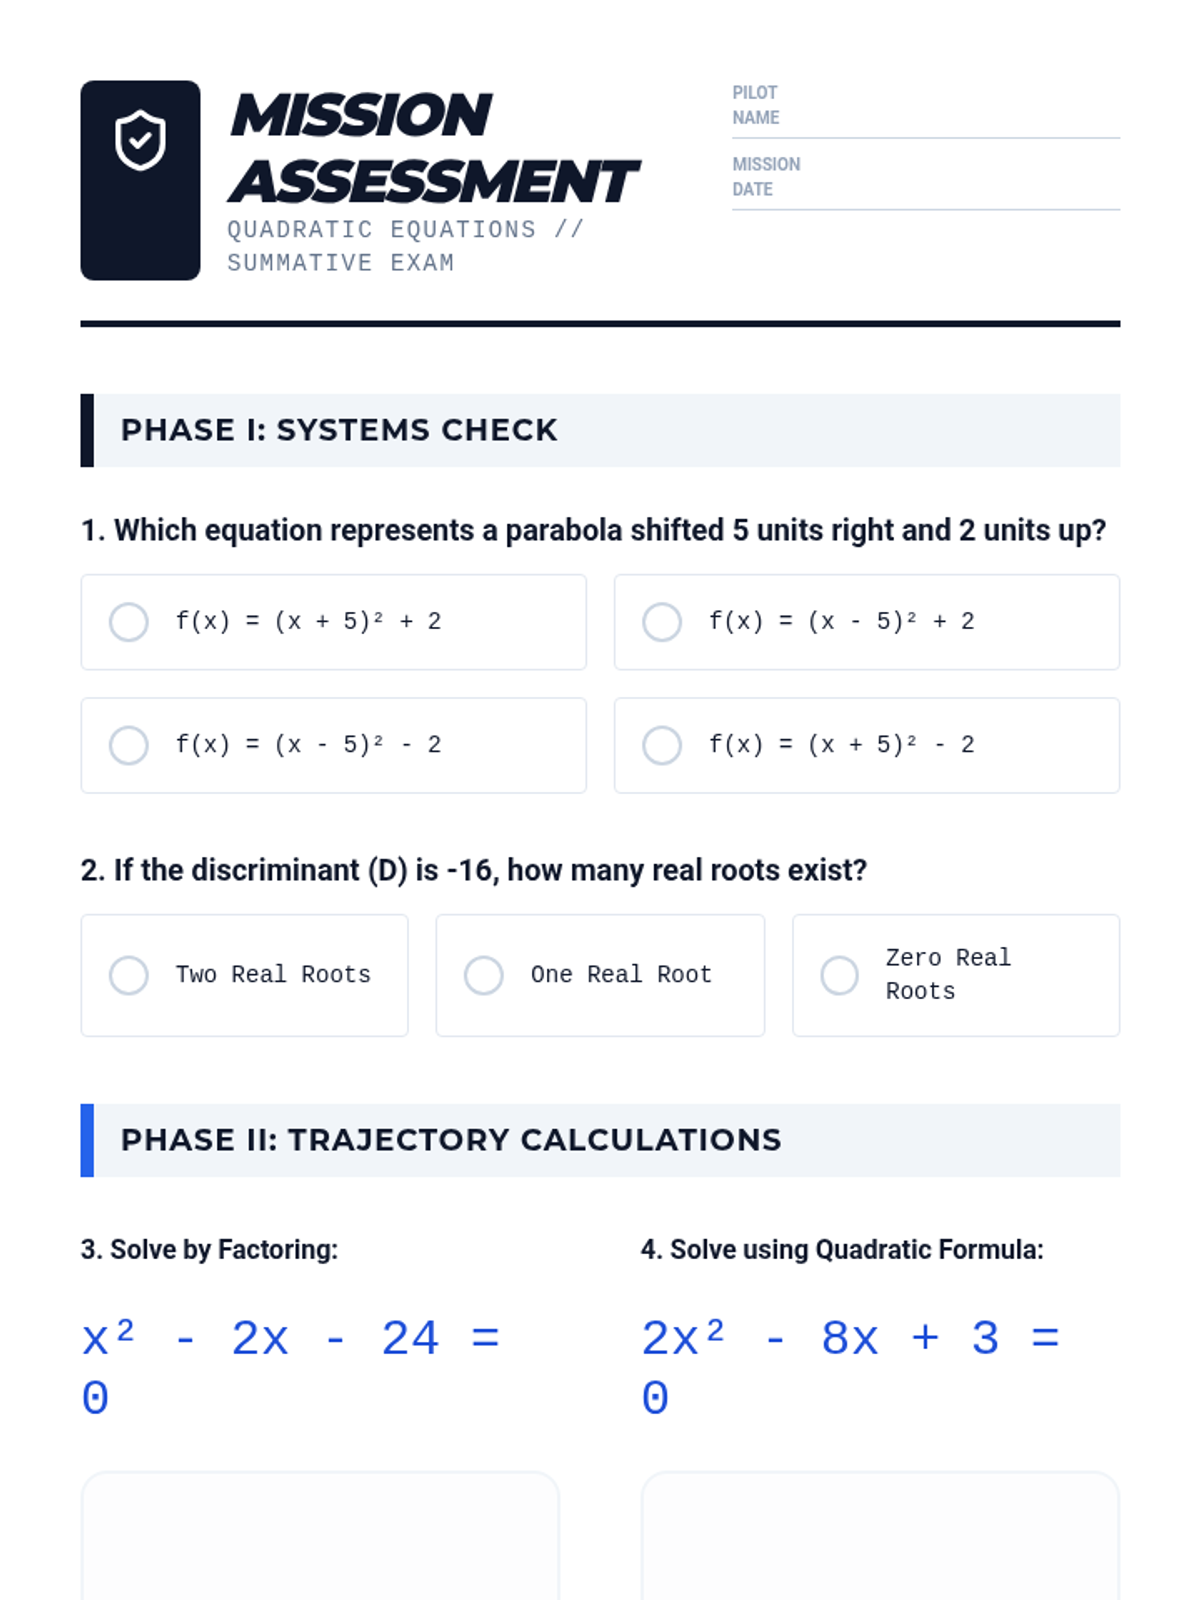
Focus on solving quadratic equations using the quadratic formula and factoring.
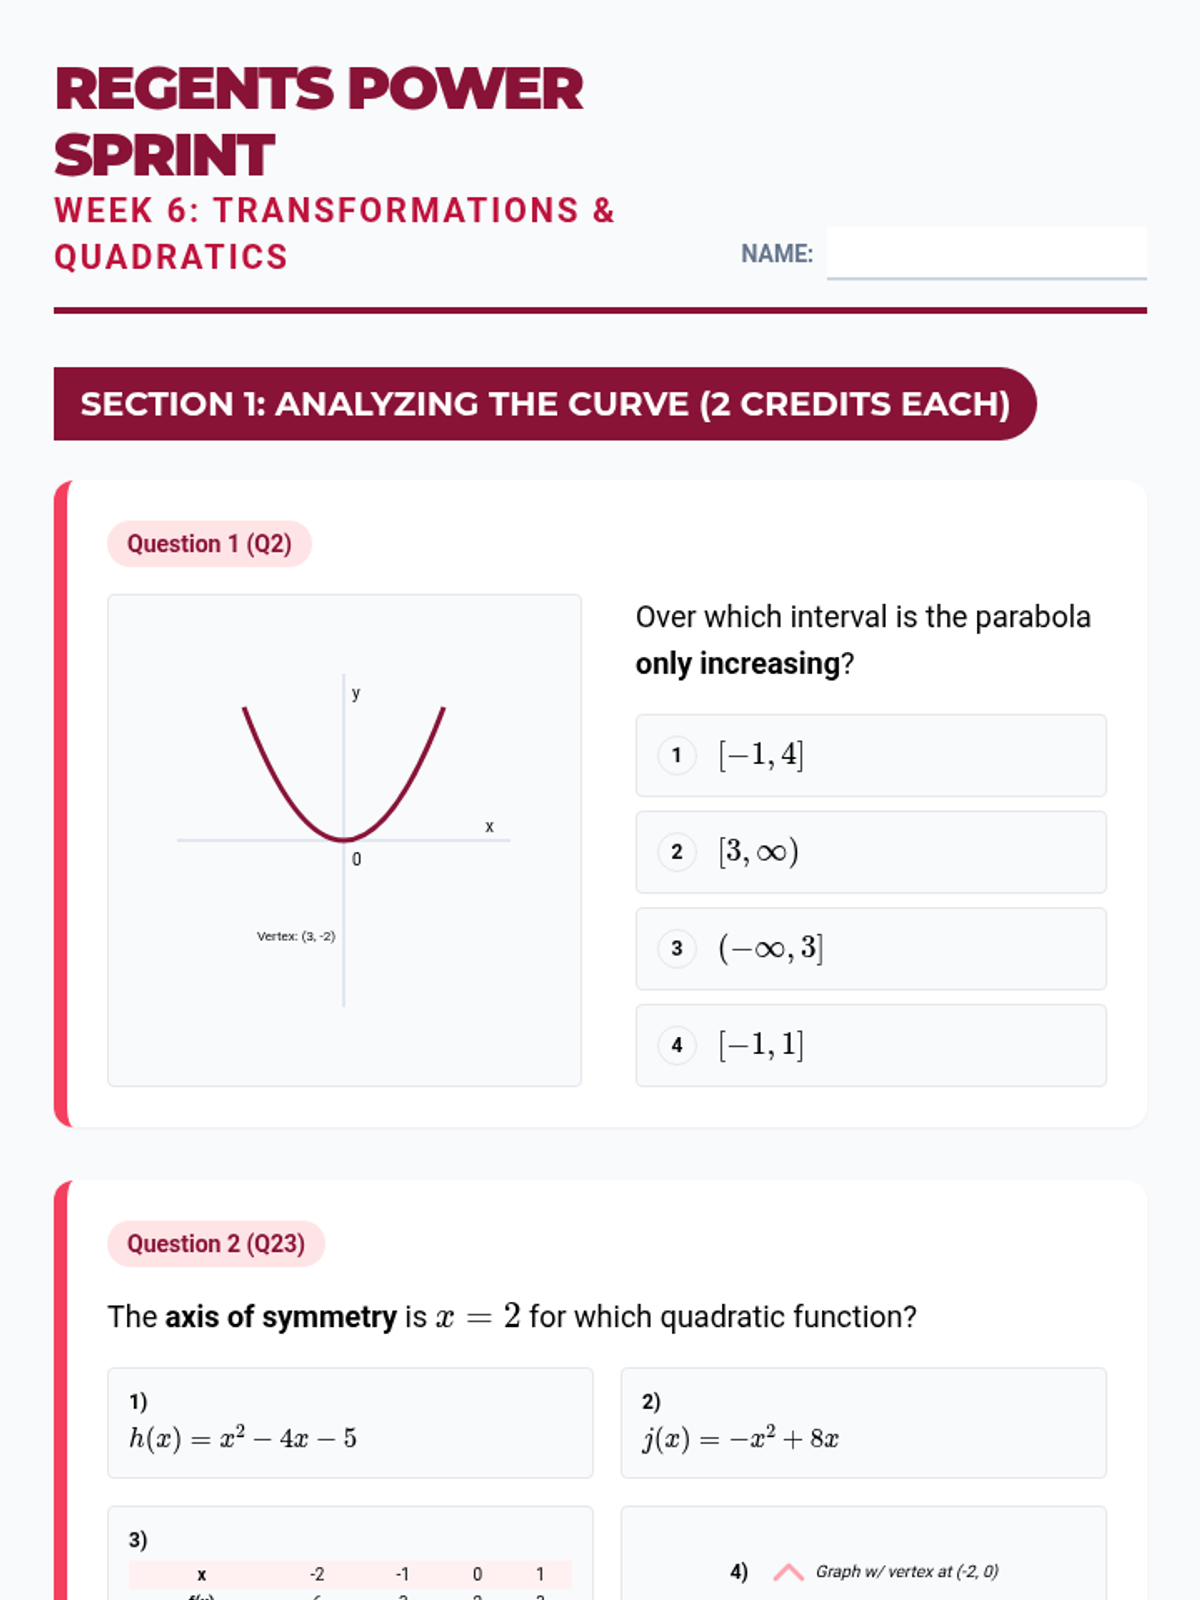
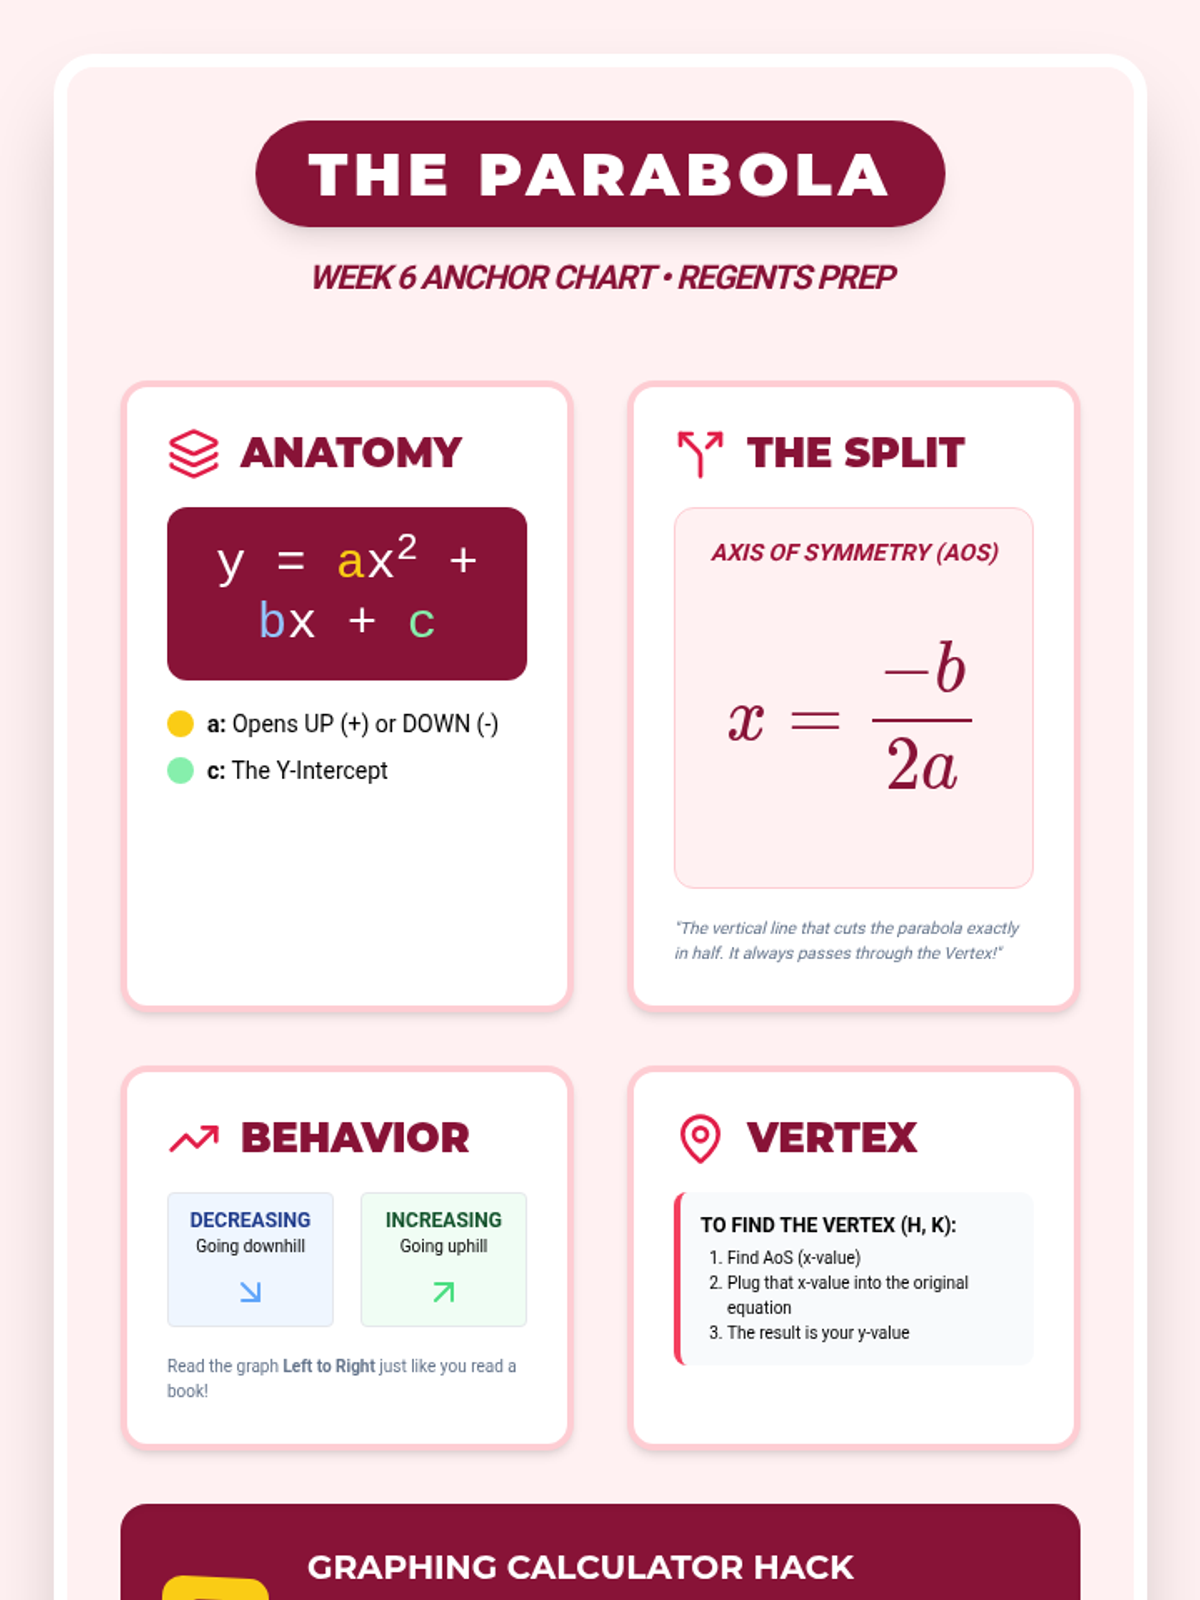
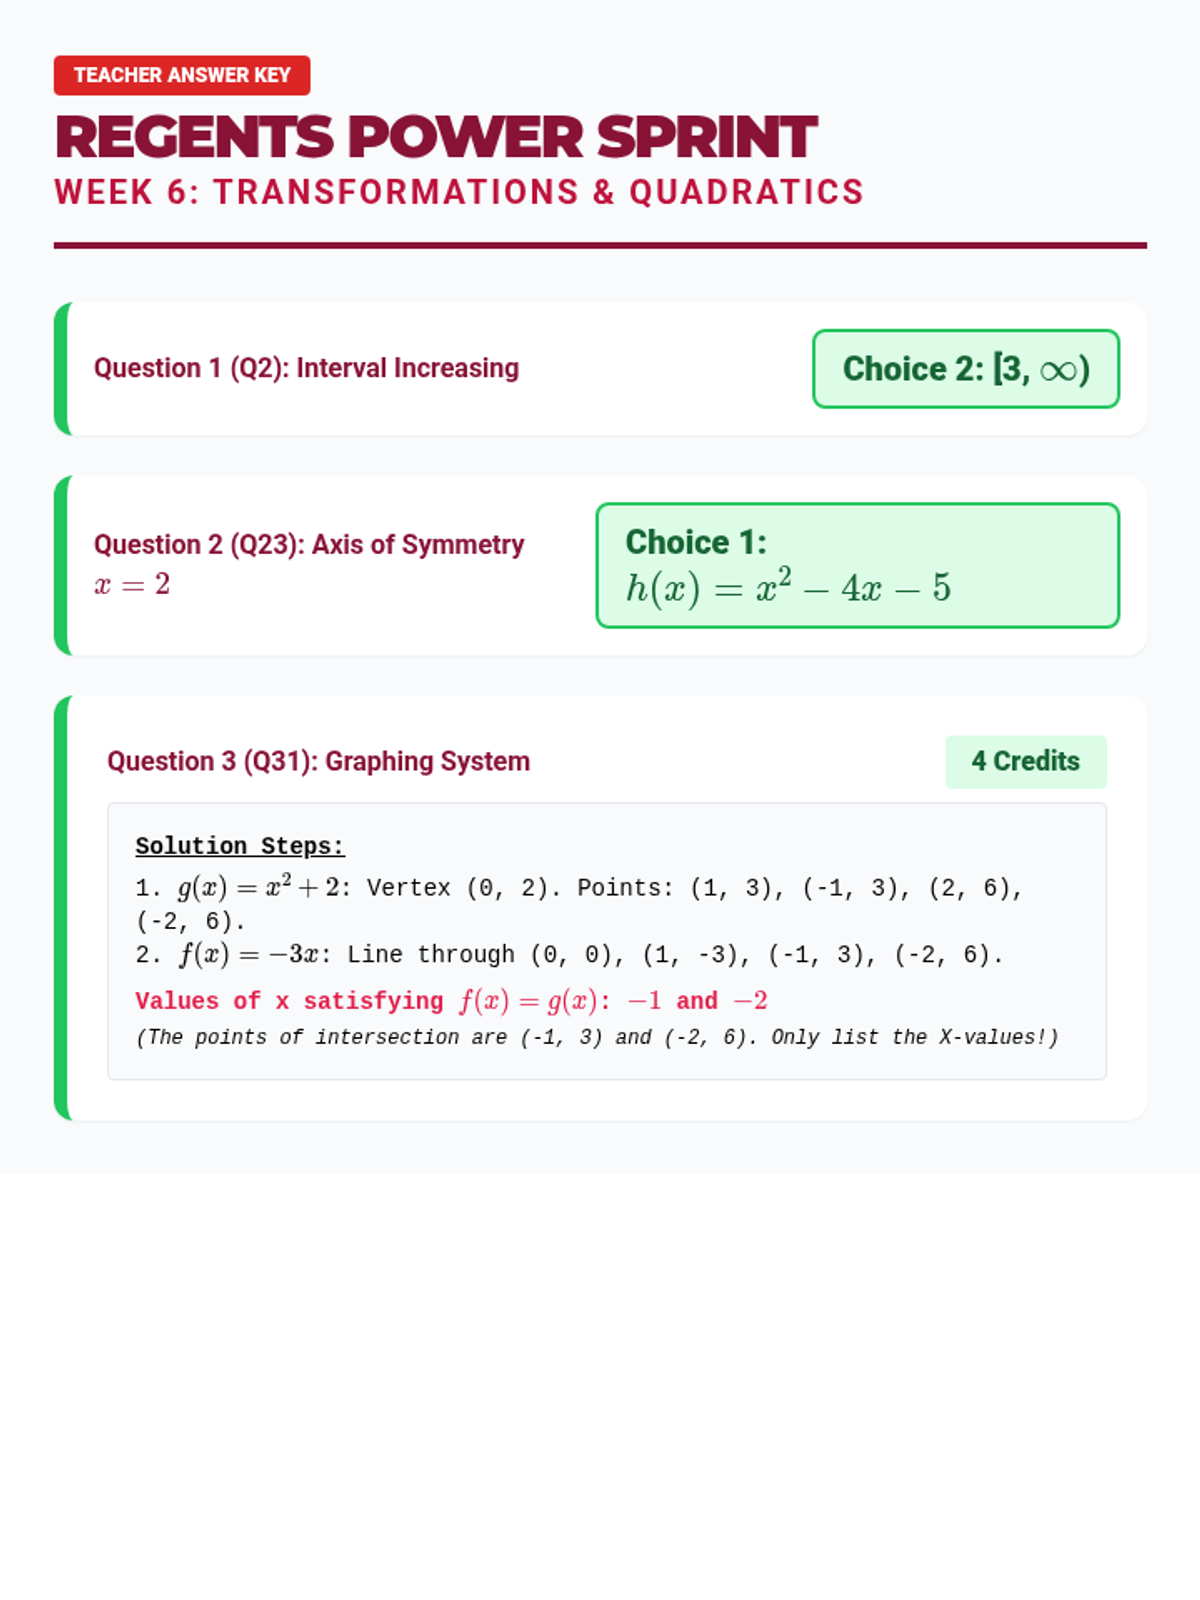
Focus on graphing absolute value and quadratic functions, including transformations and the axis of symmetry.
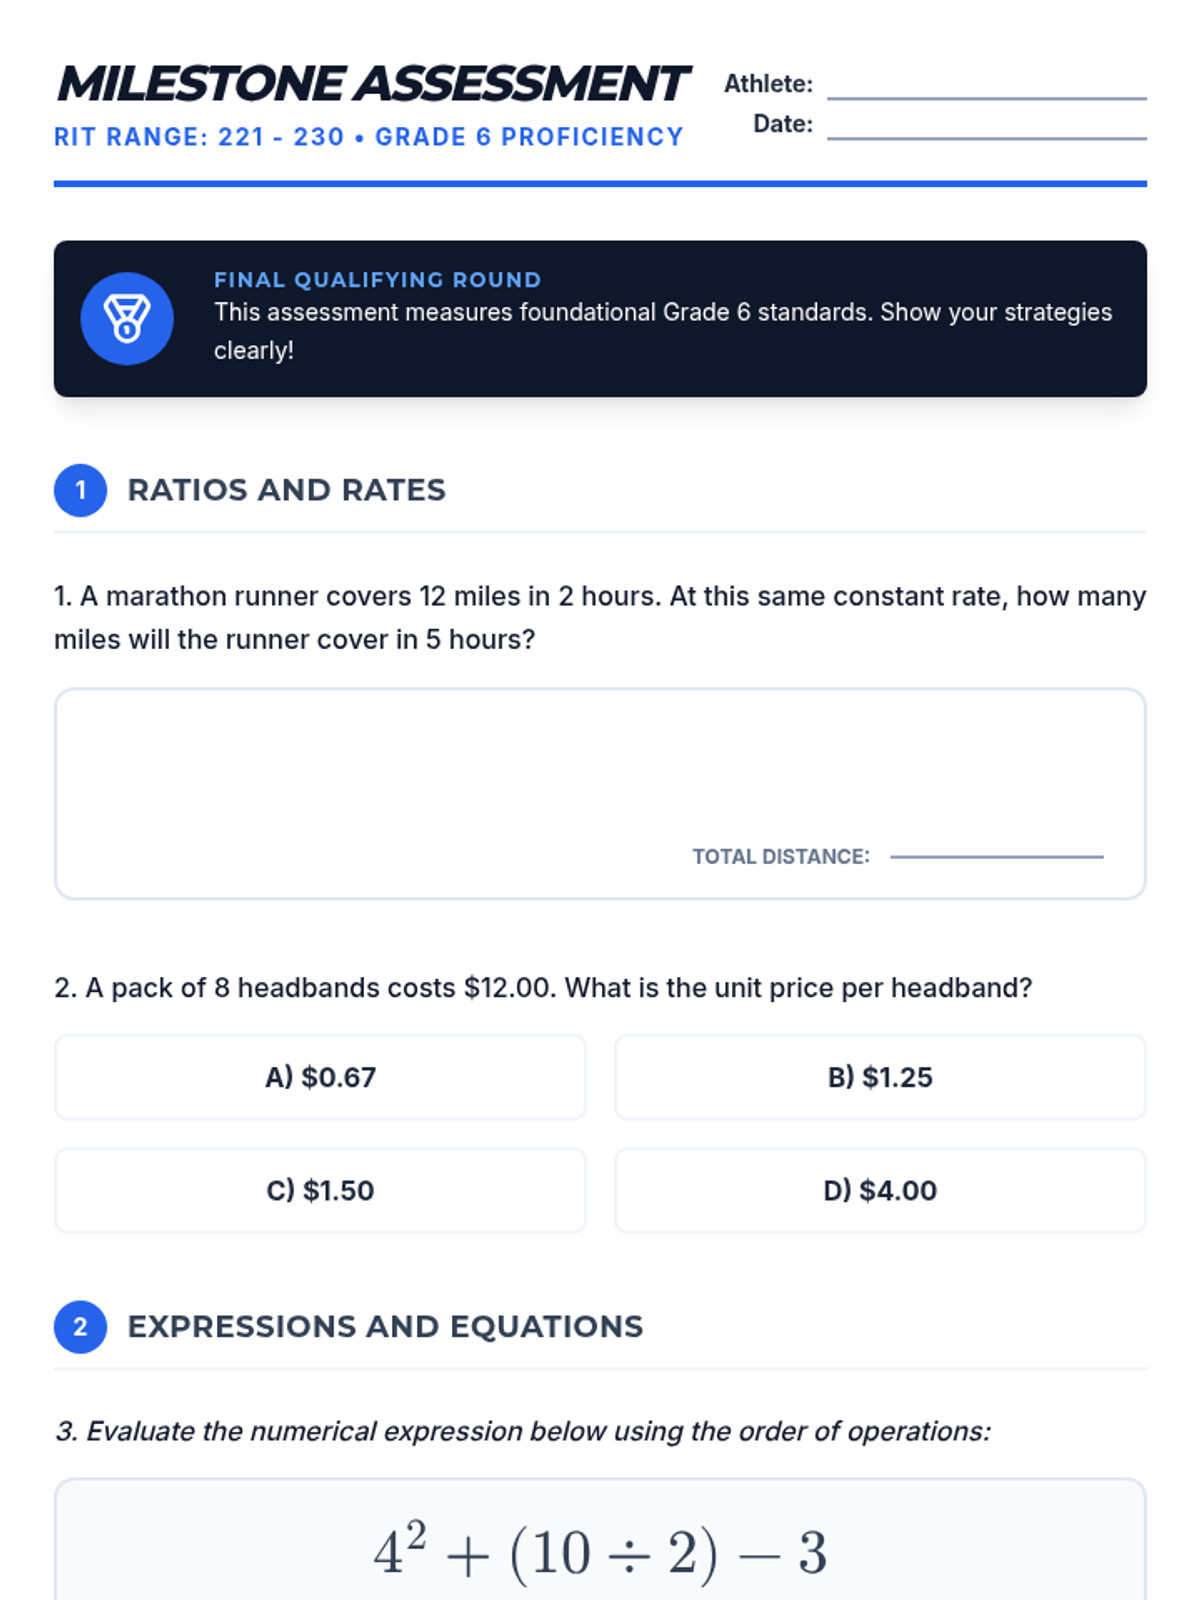
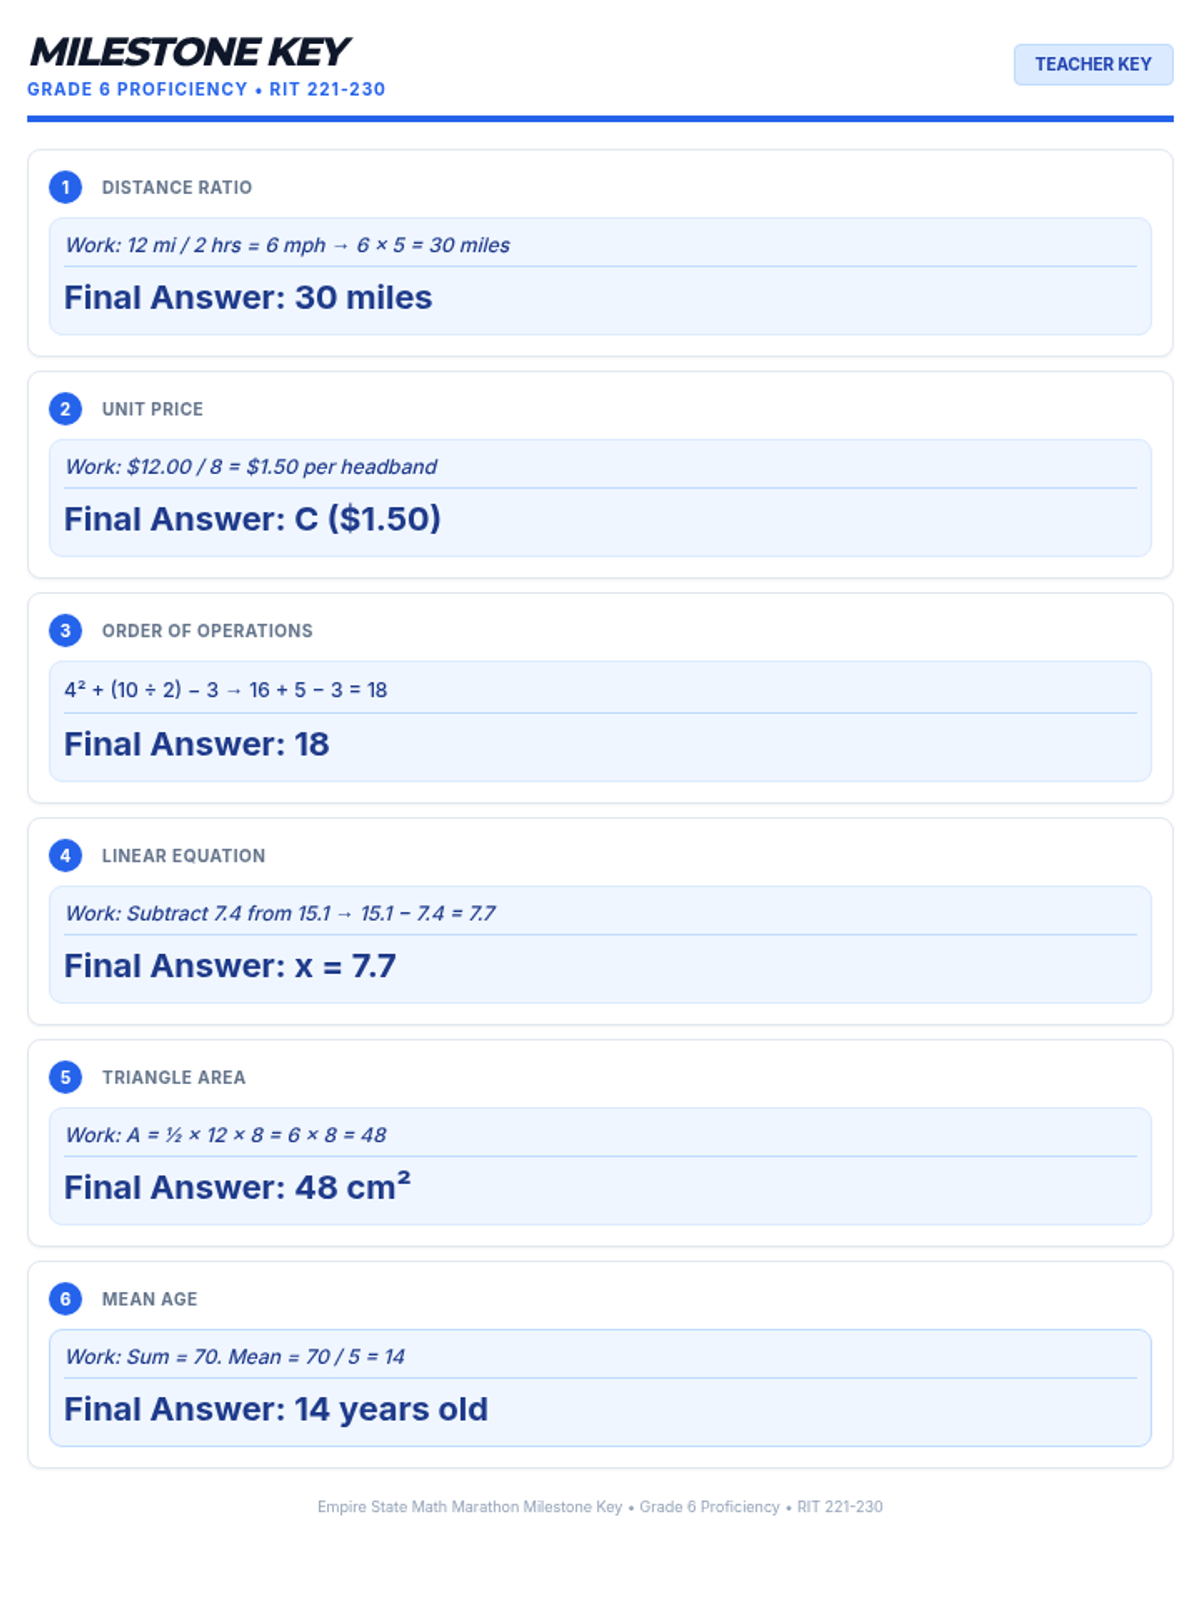
A cumulative milestone assessment designed for students at Grade 6 proficiency (RIT 221-230). This assessment checks foundational understanding of ratios, expressions, and geometry needed for 8th-grade success.
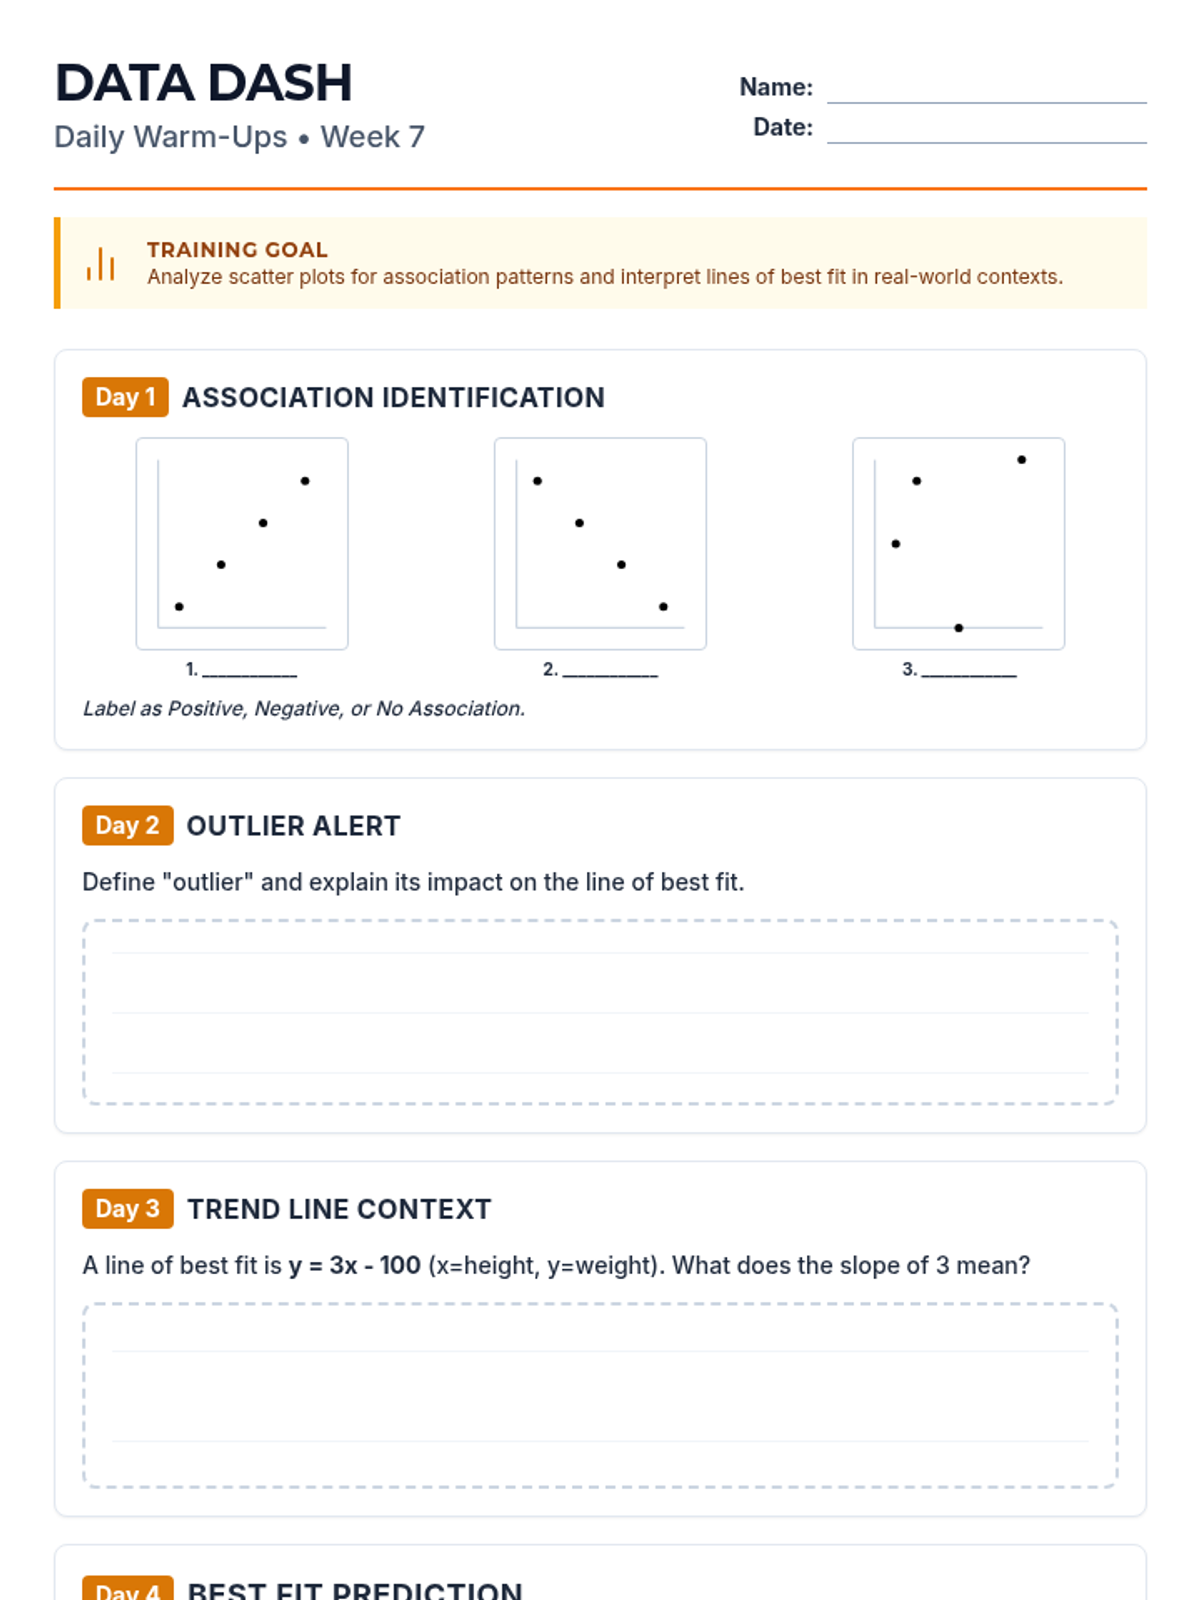
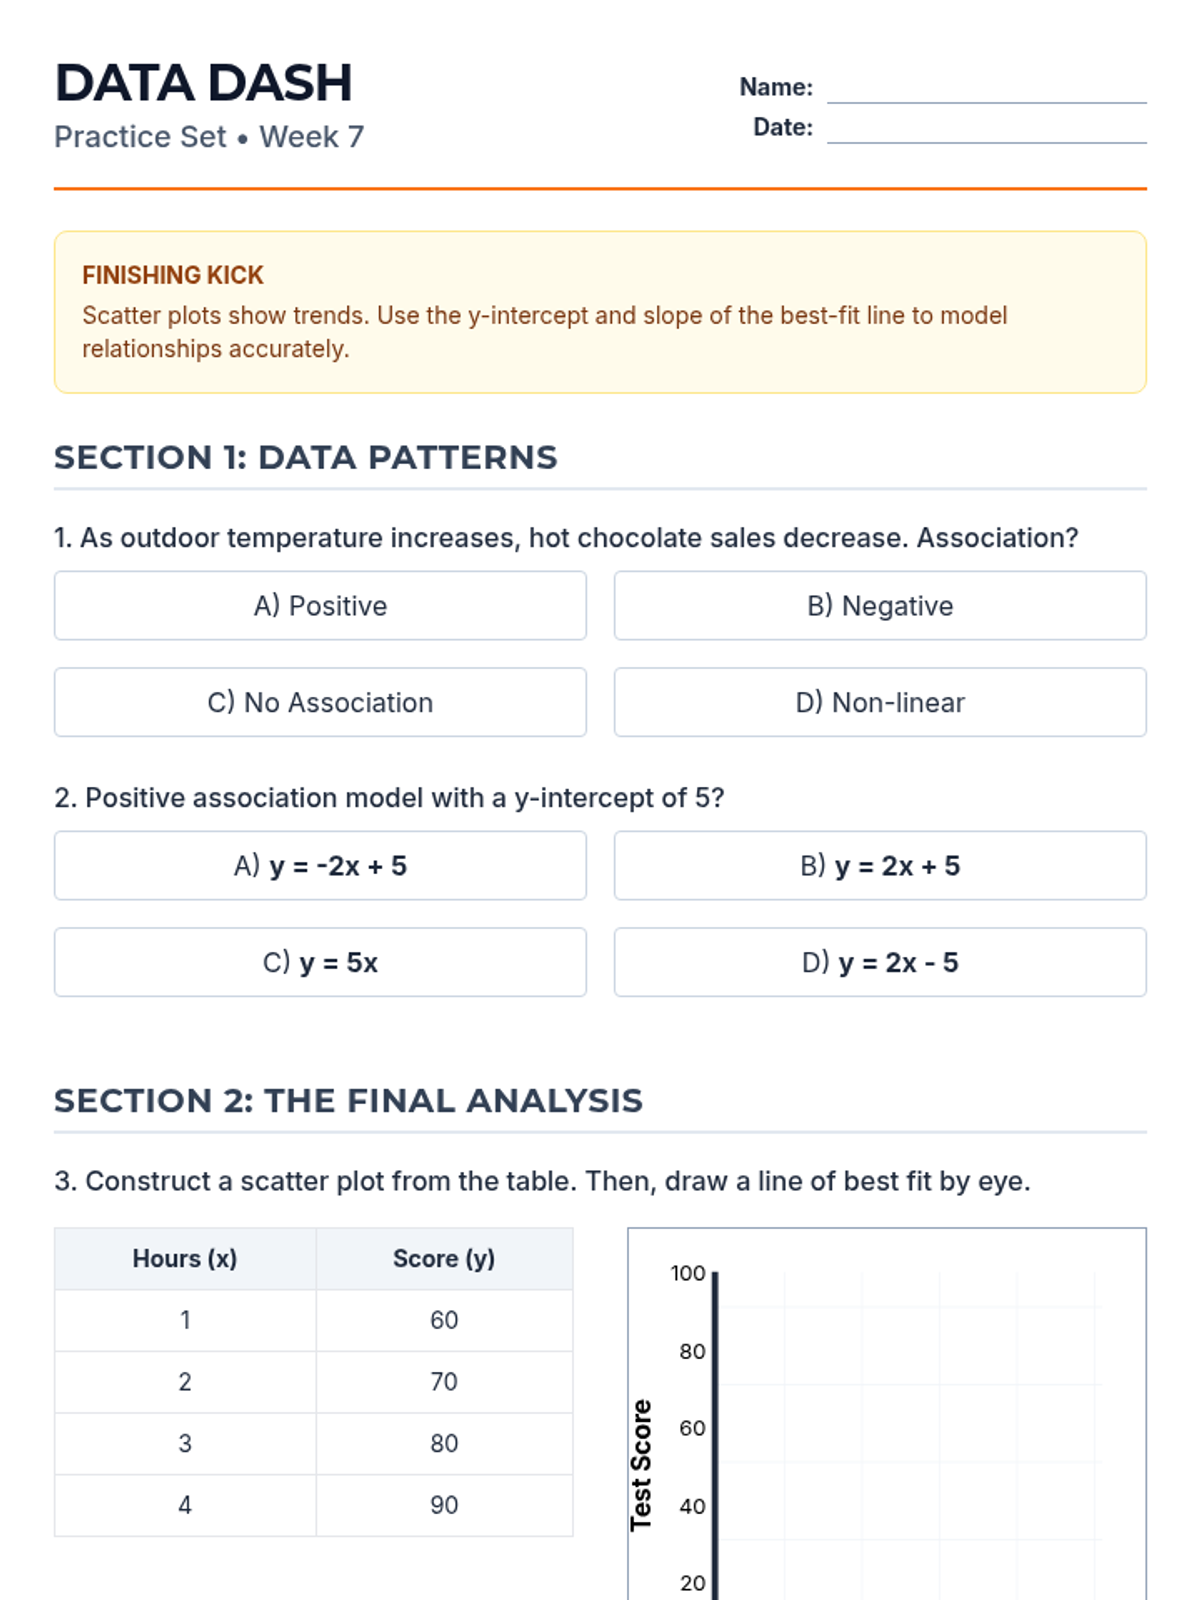
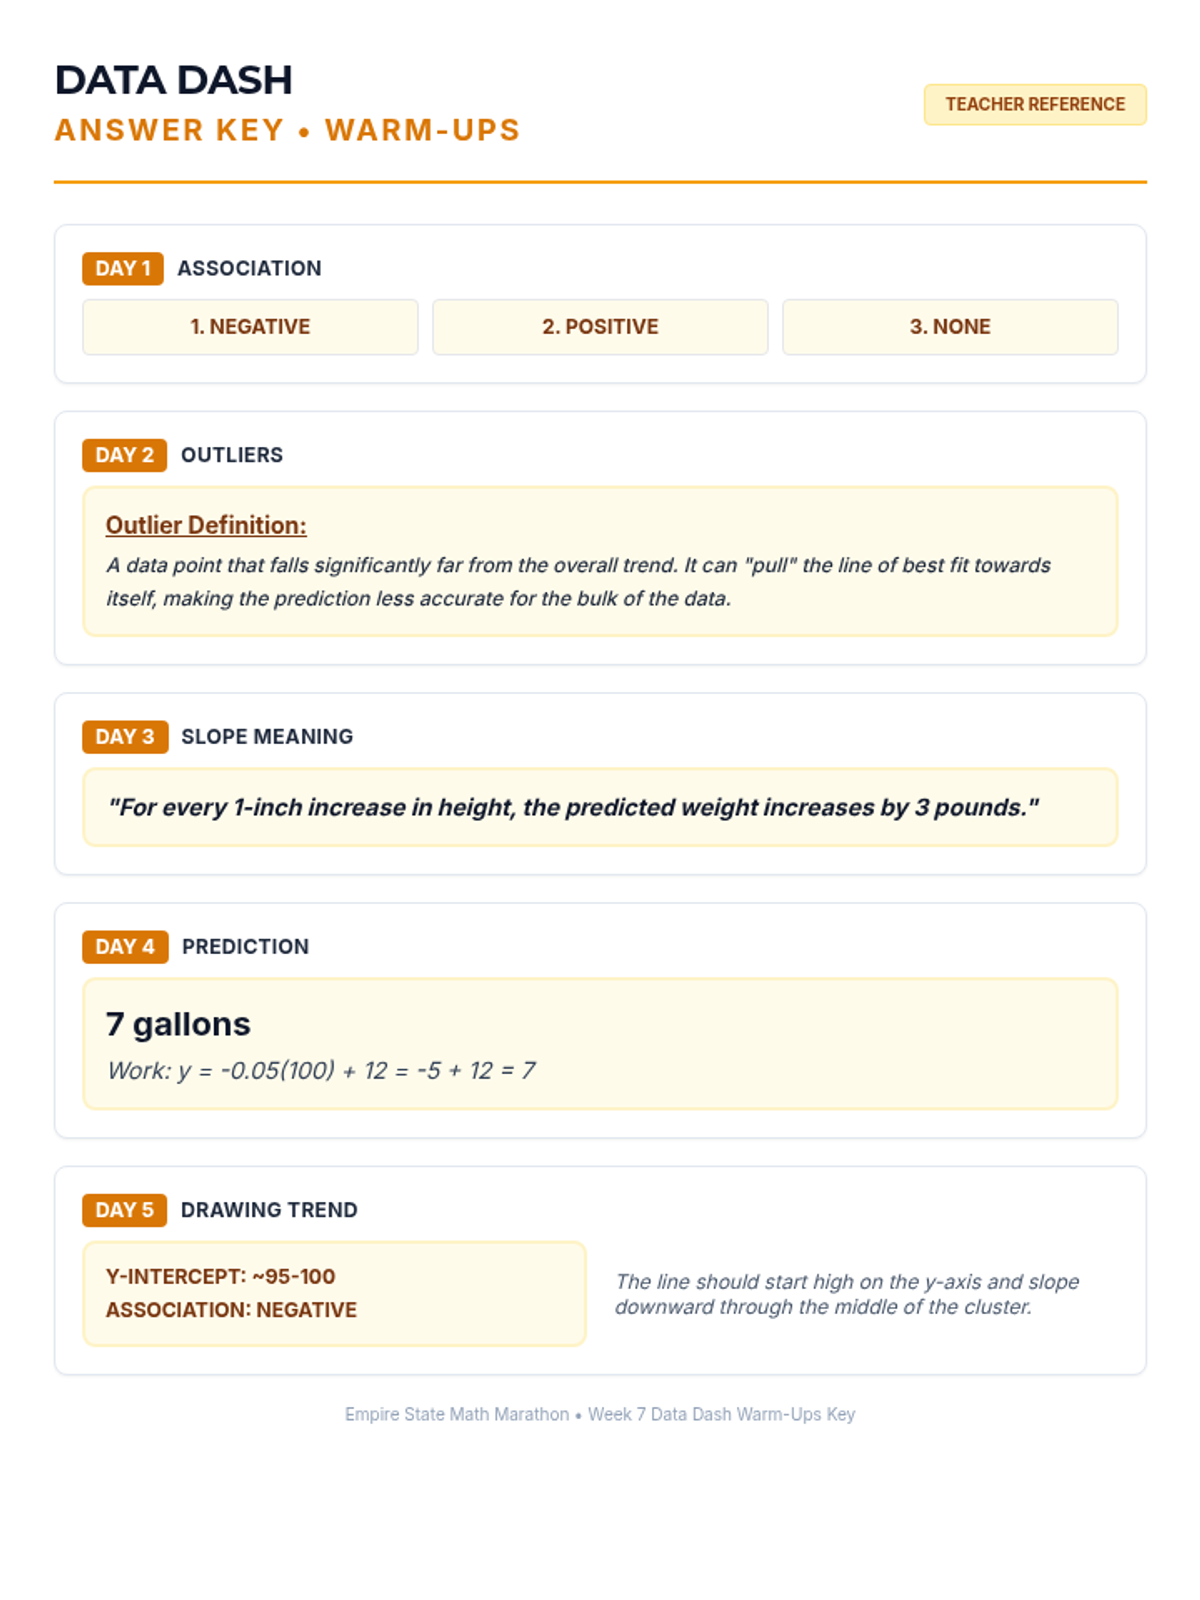
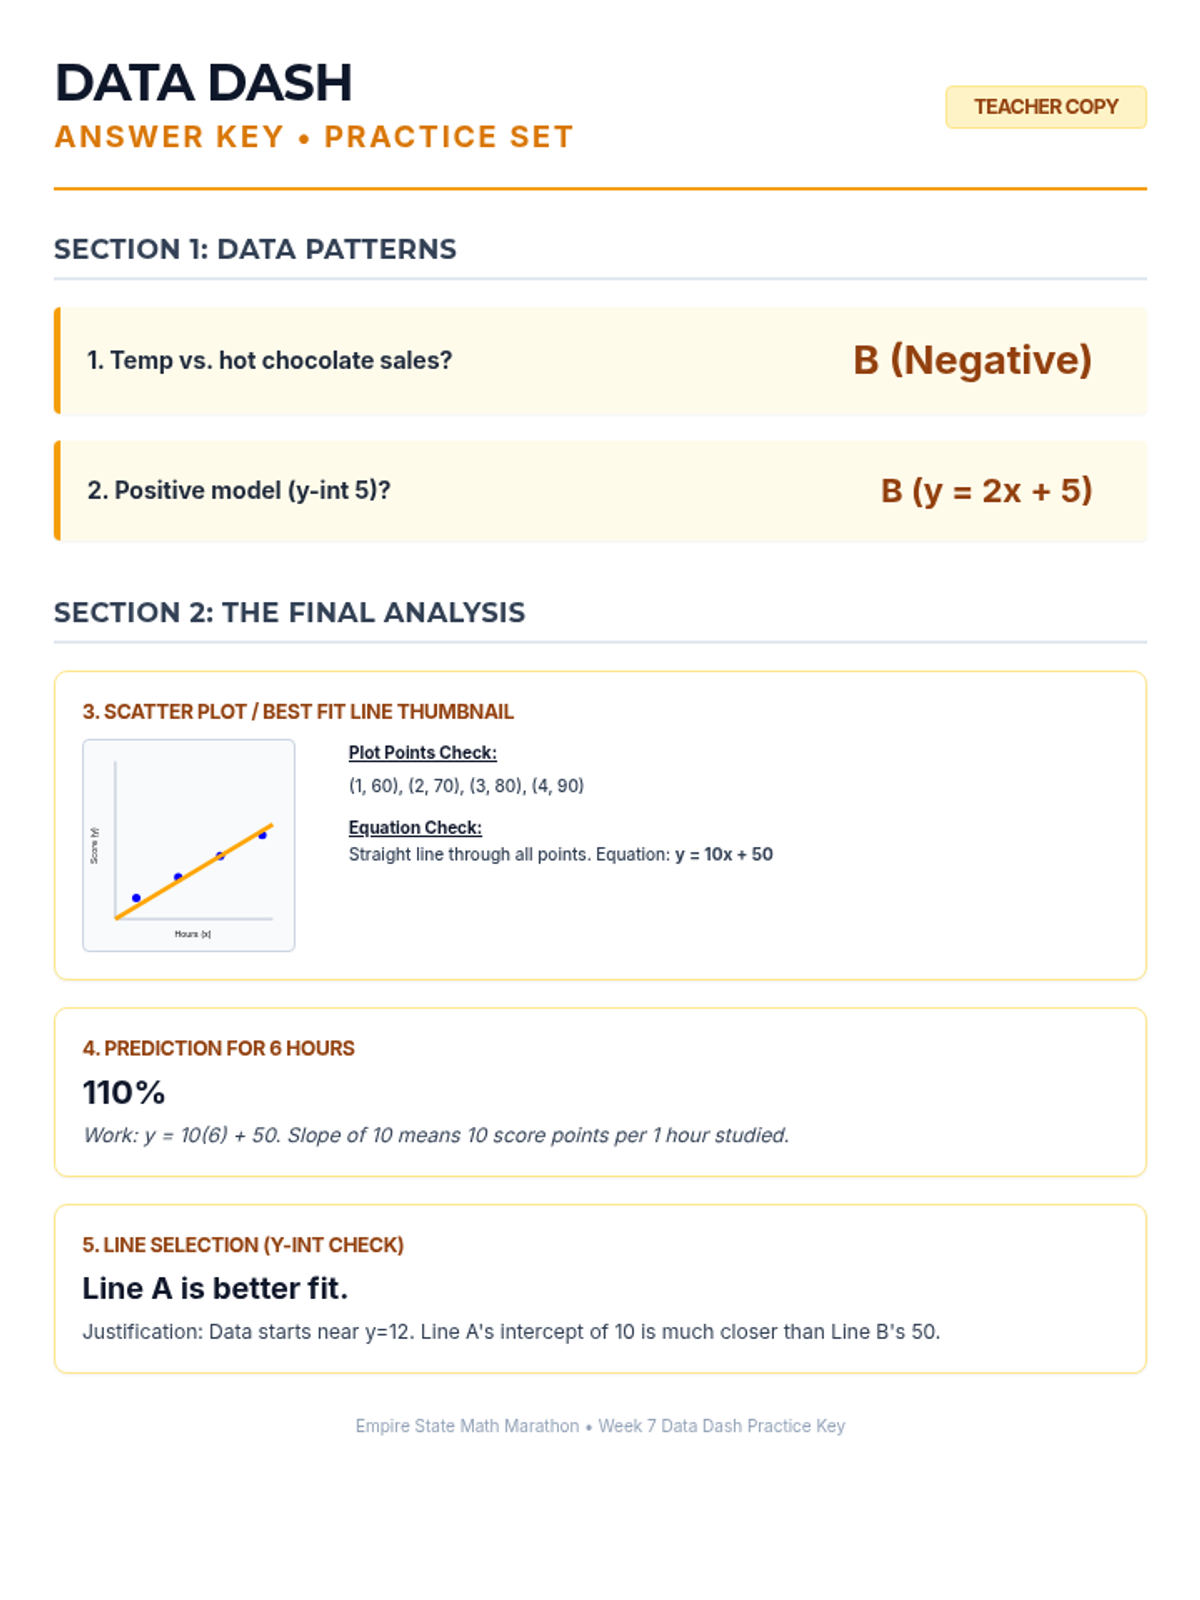
Week 7 analyzes bivariate data through scatter plots, interpreting lines of best fit, and using linear models to make predictions.
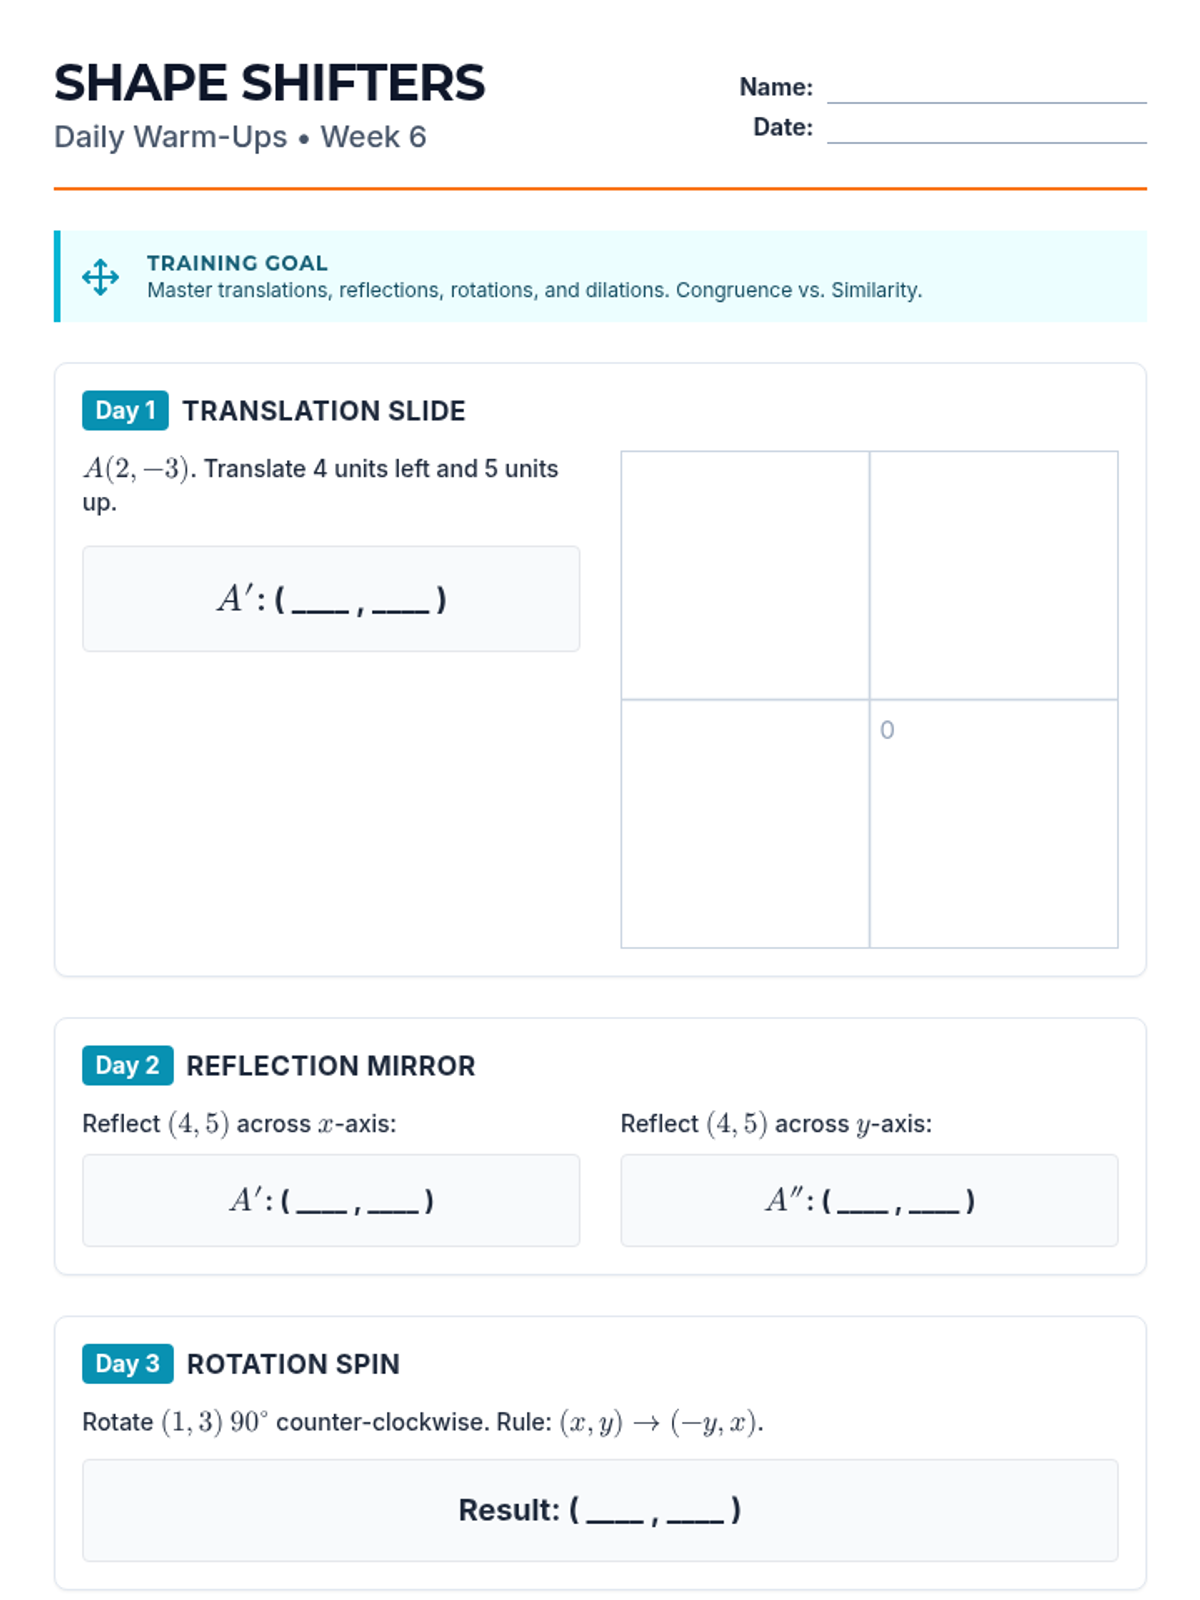
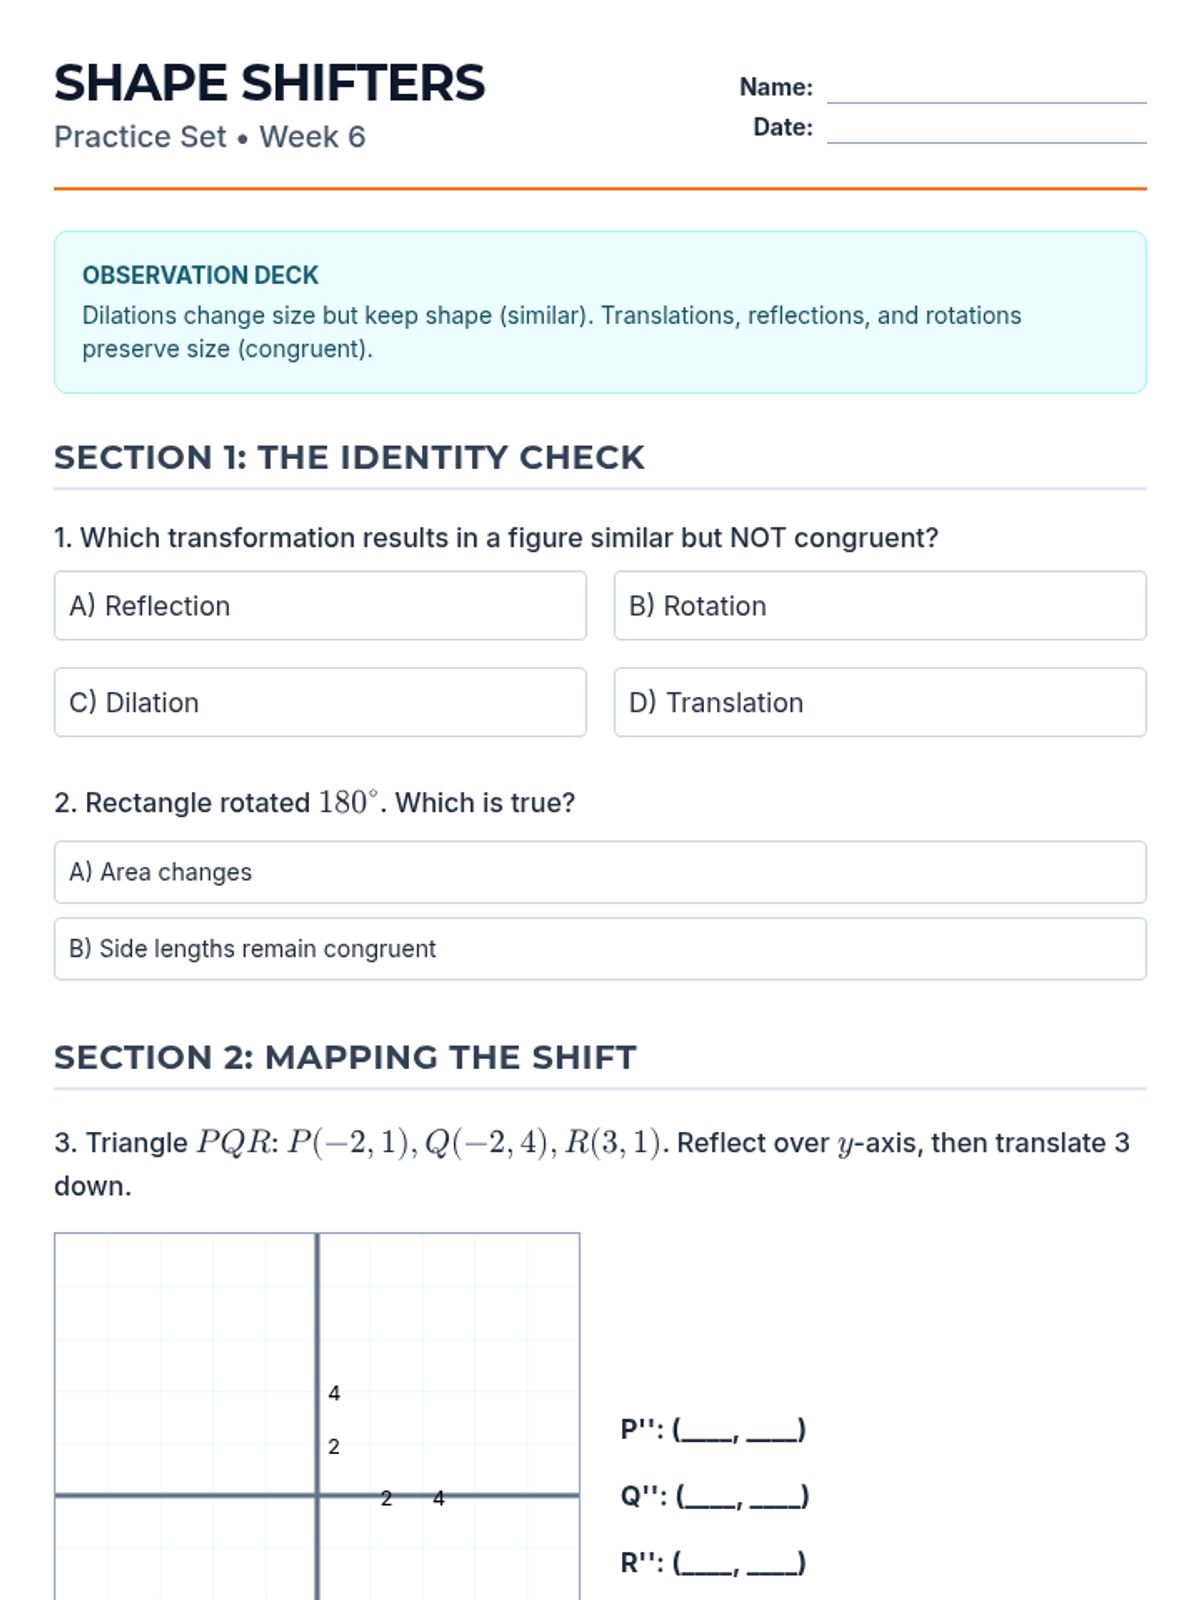
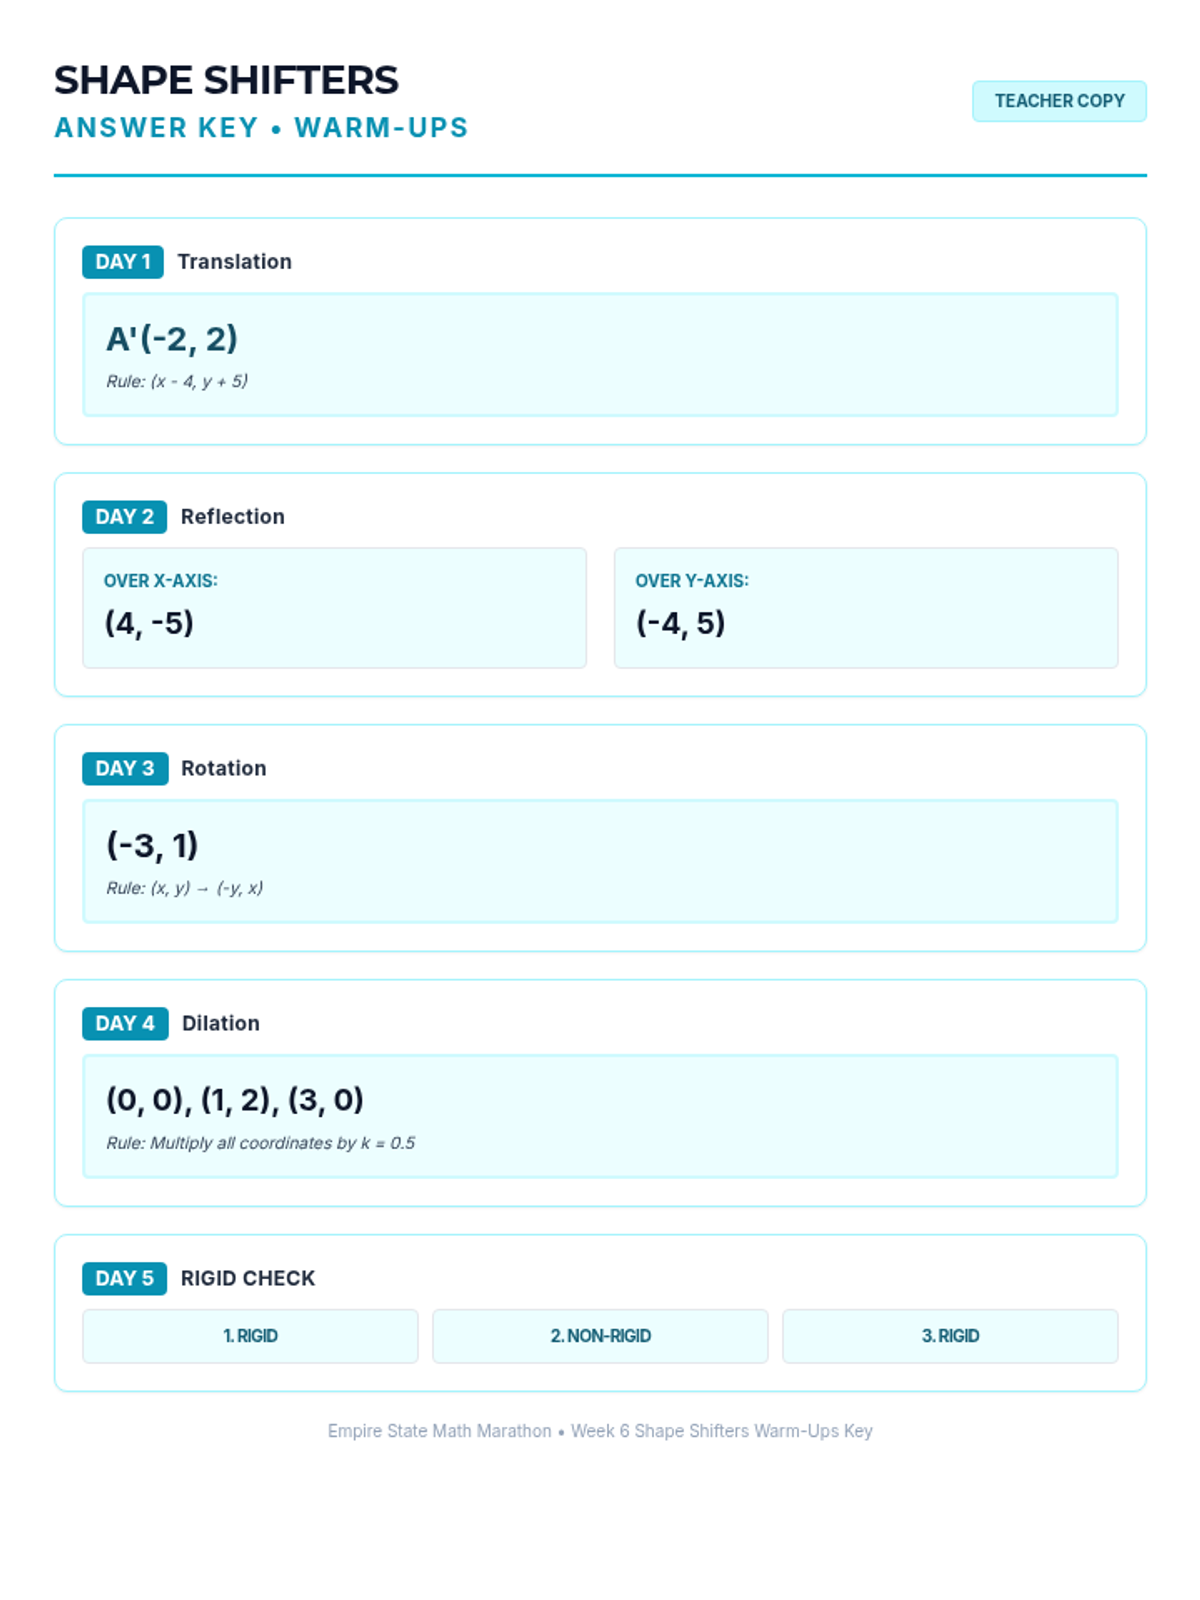
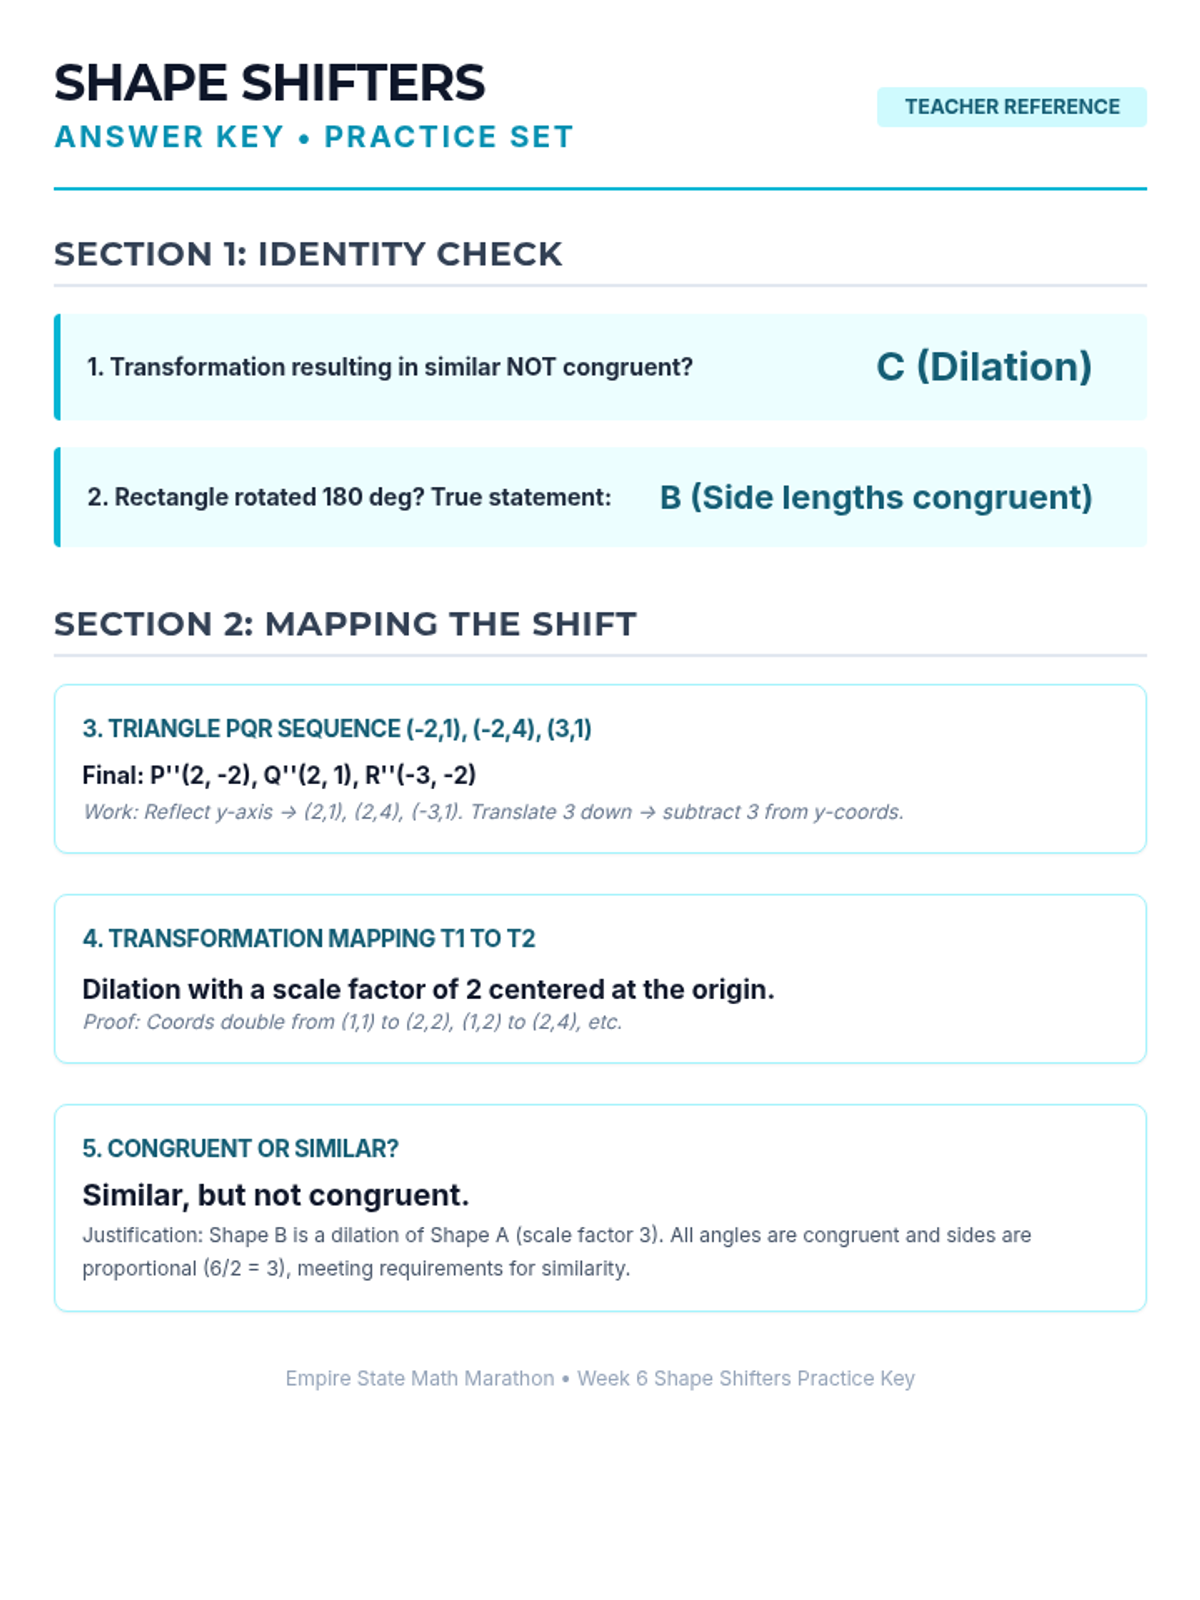
Week 6 focuses on rigid transformations (translations, reflections, rotations) and similarity transformations (dilations).
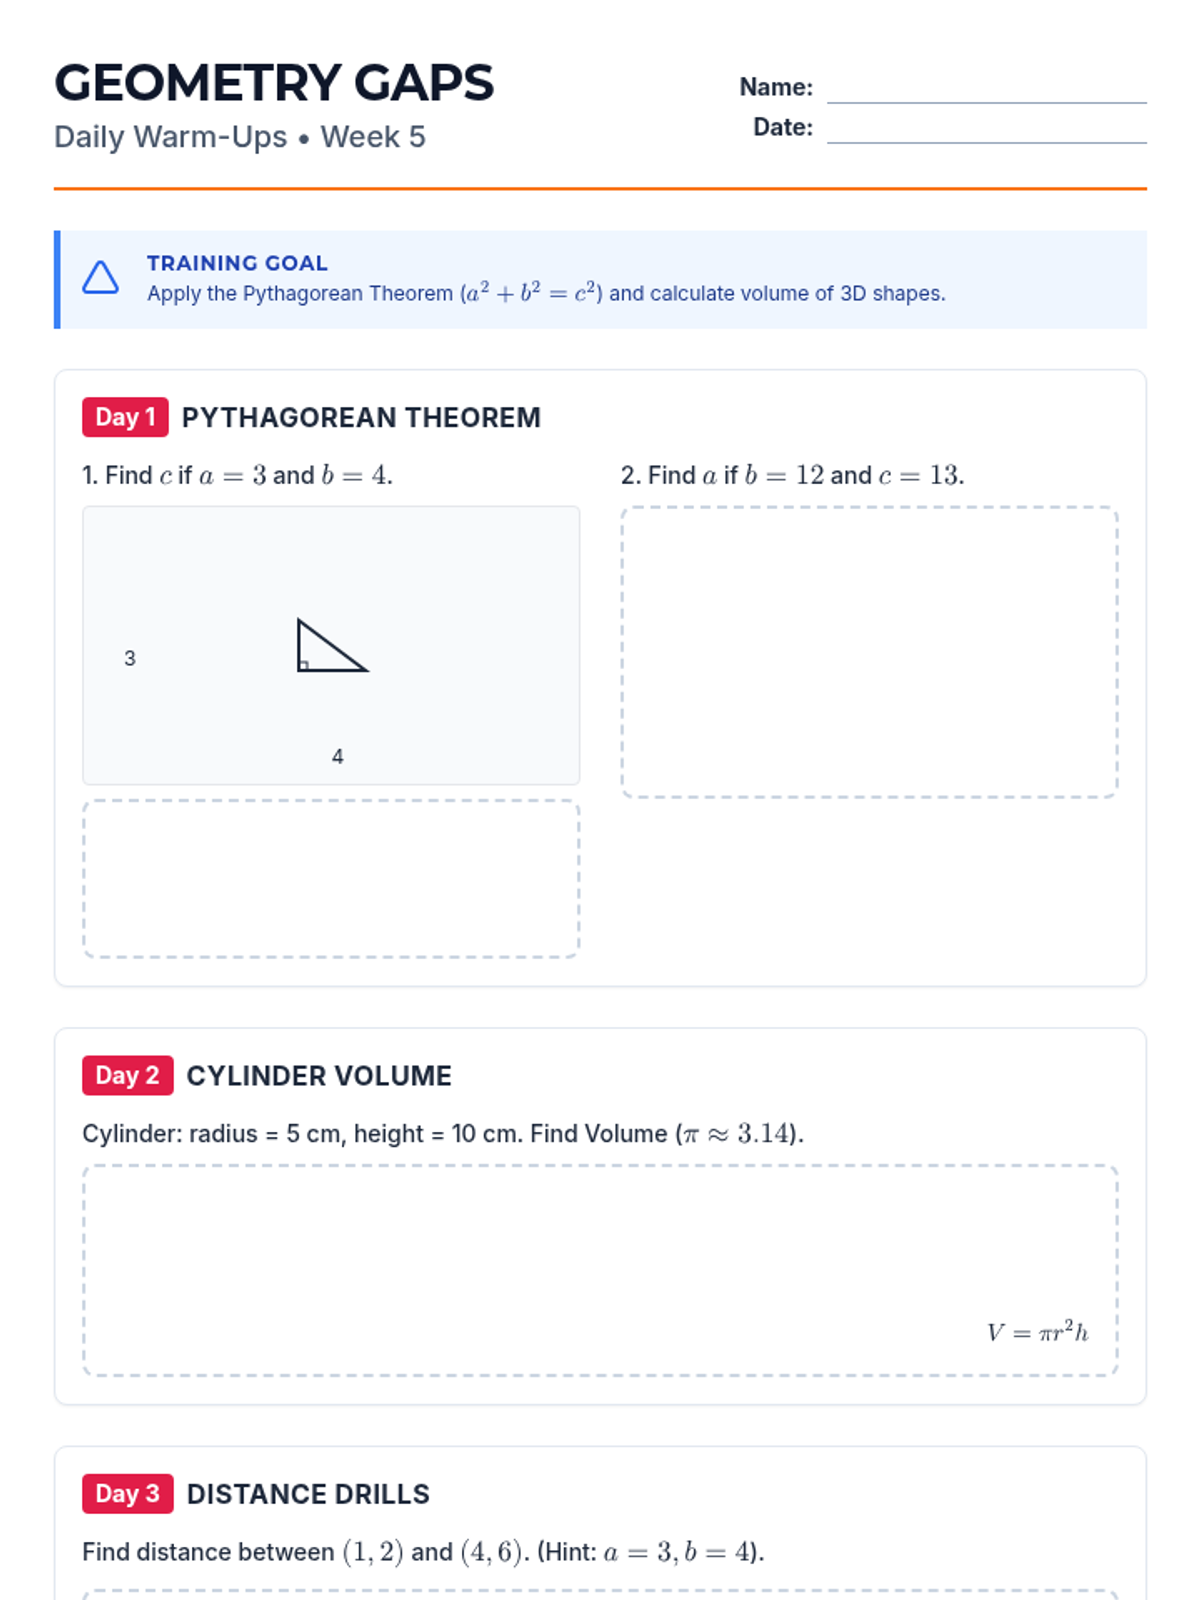
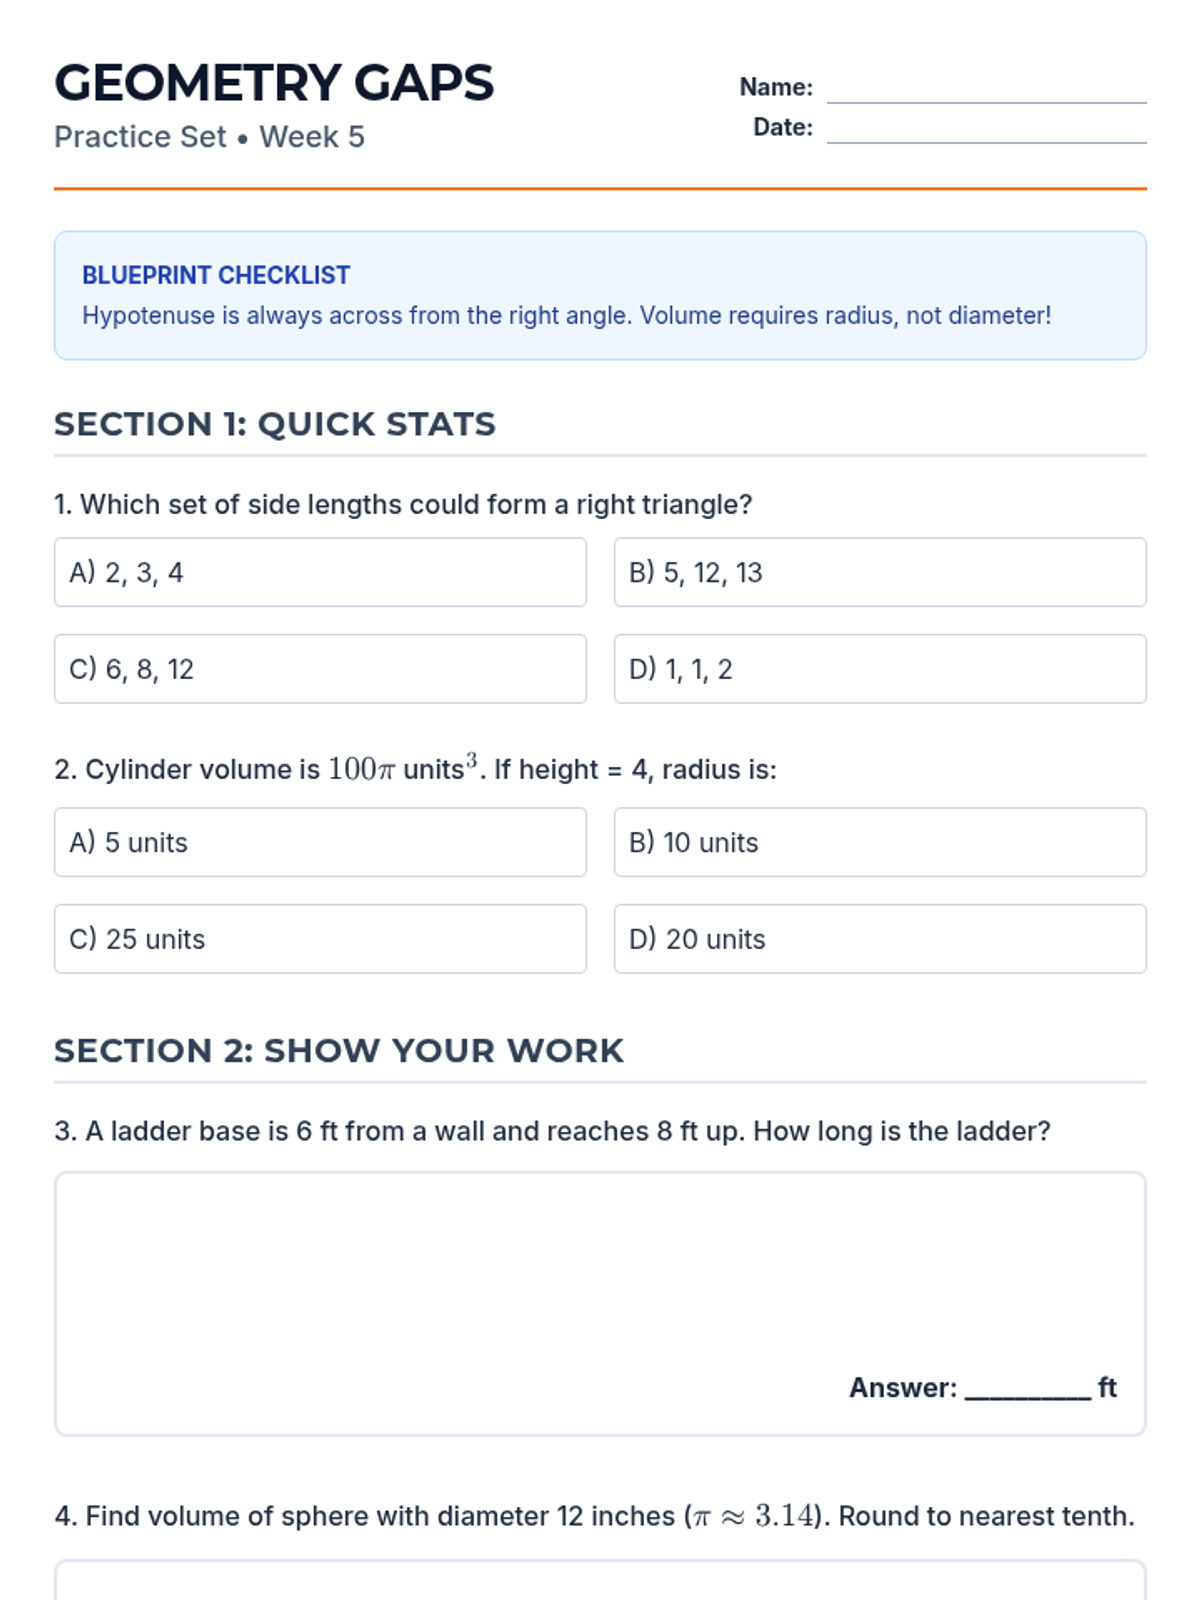
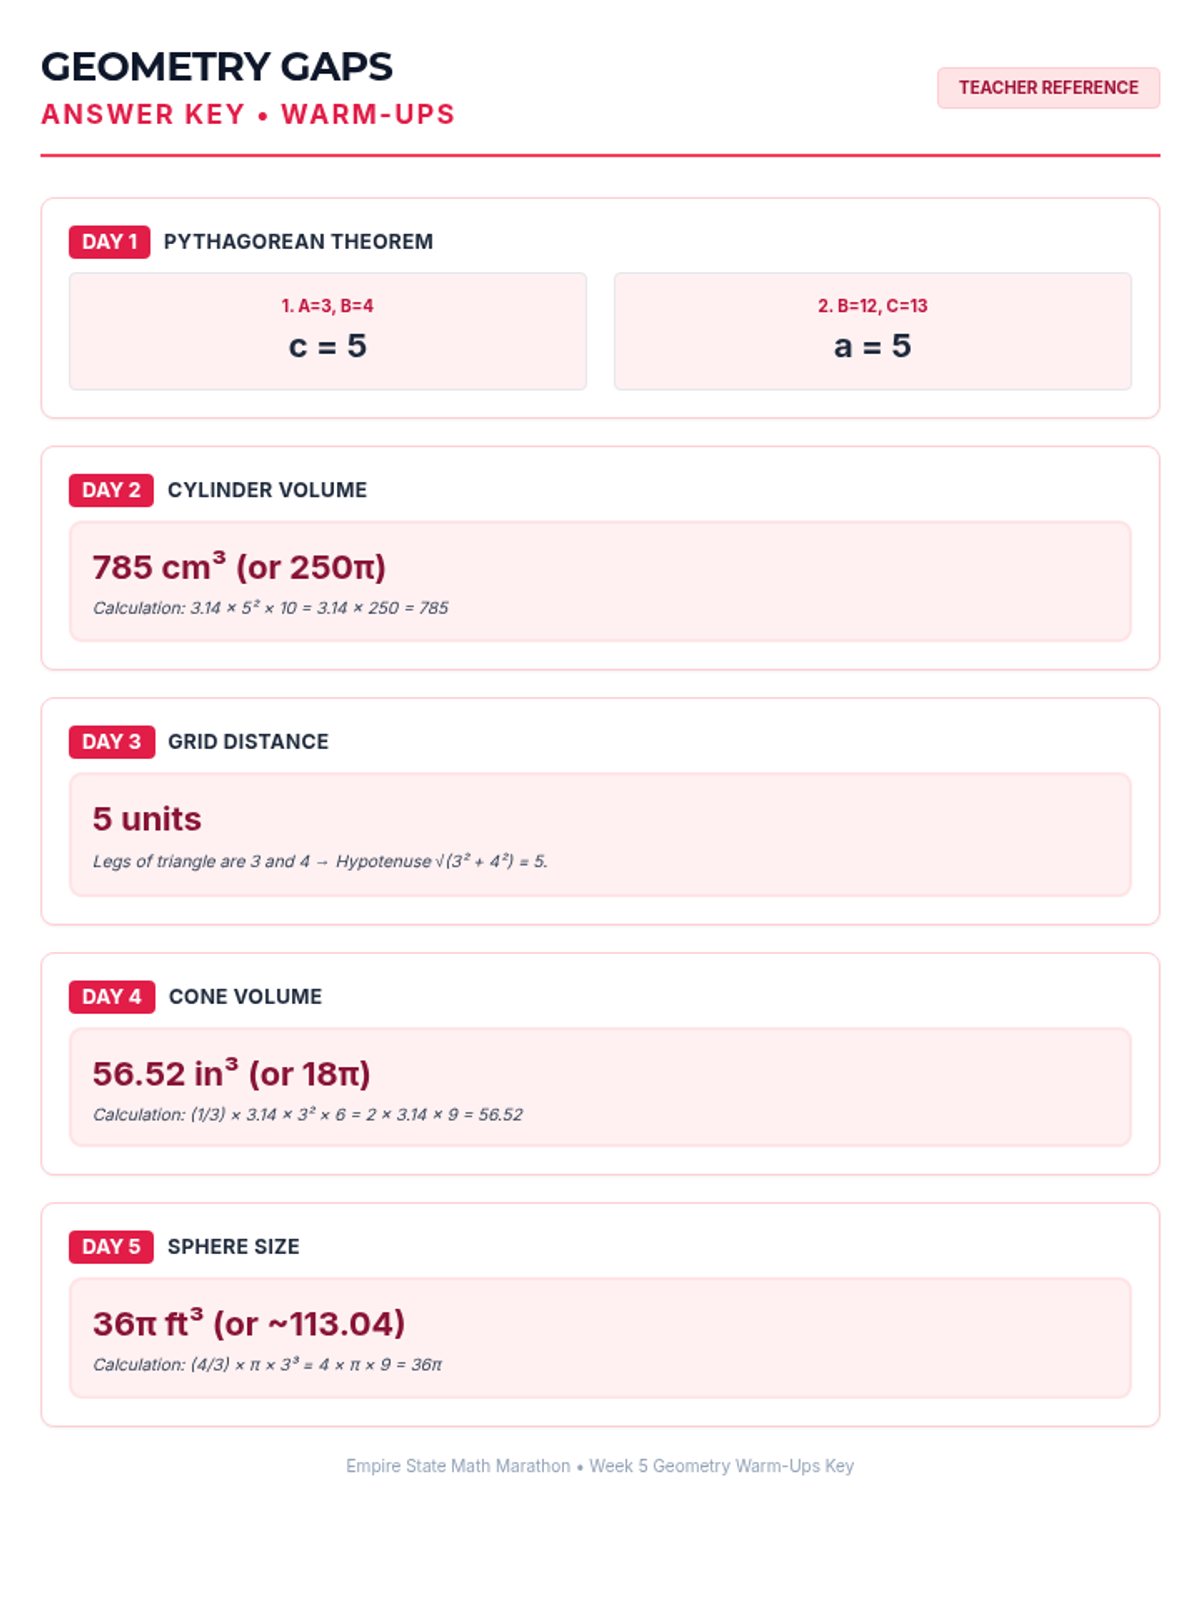
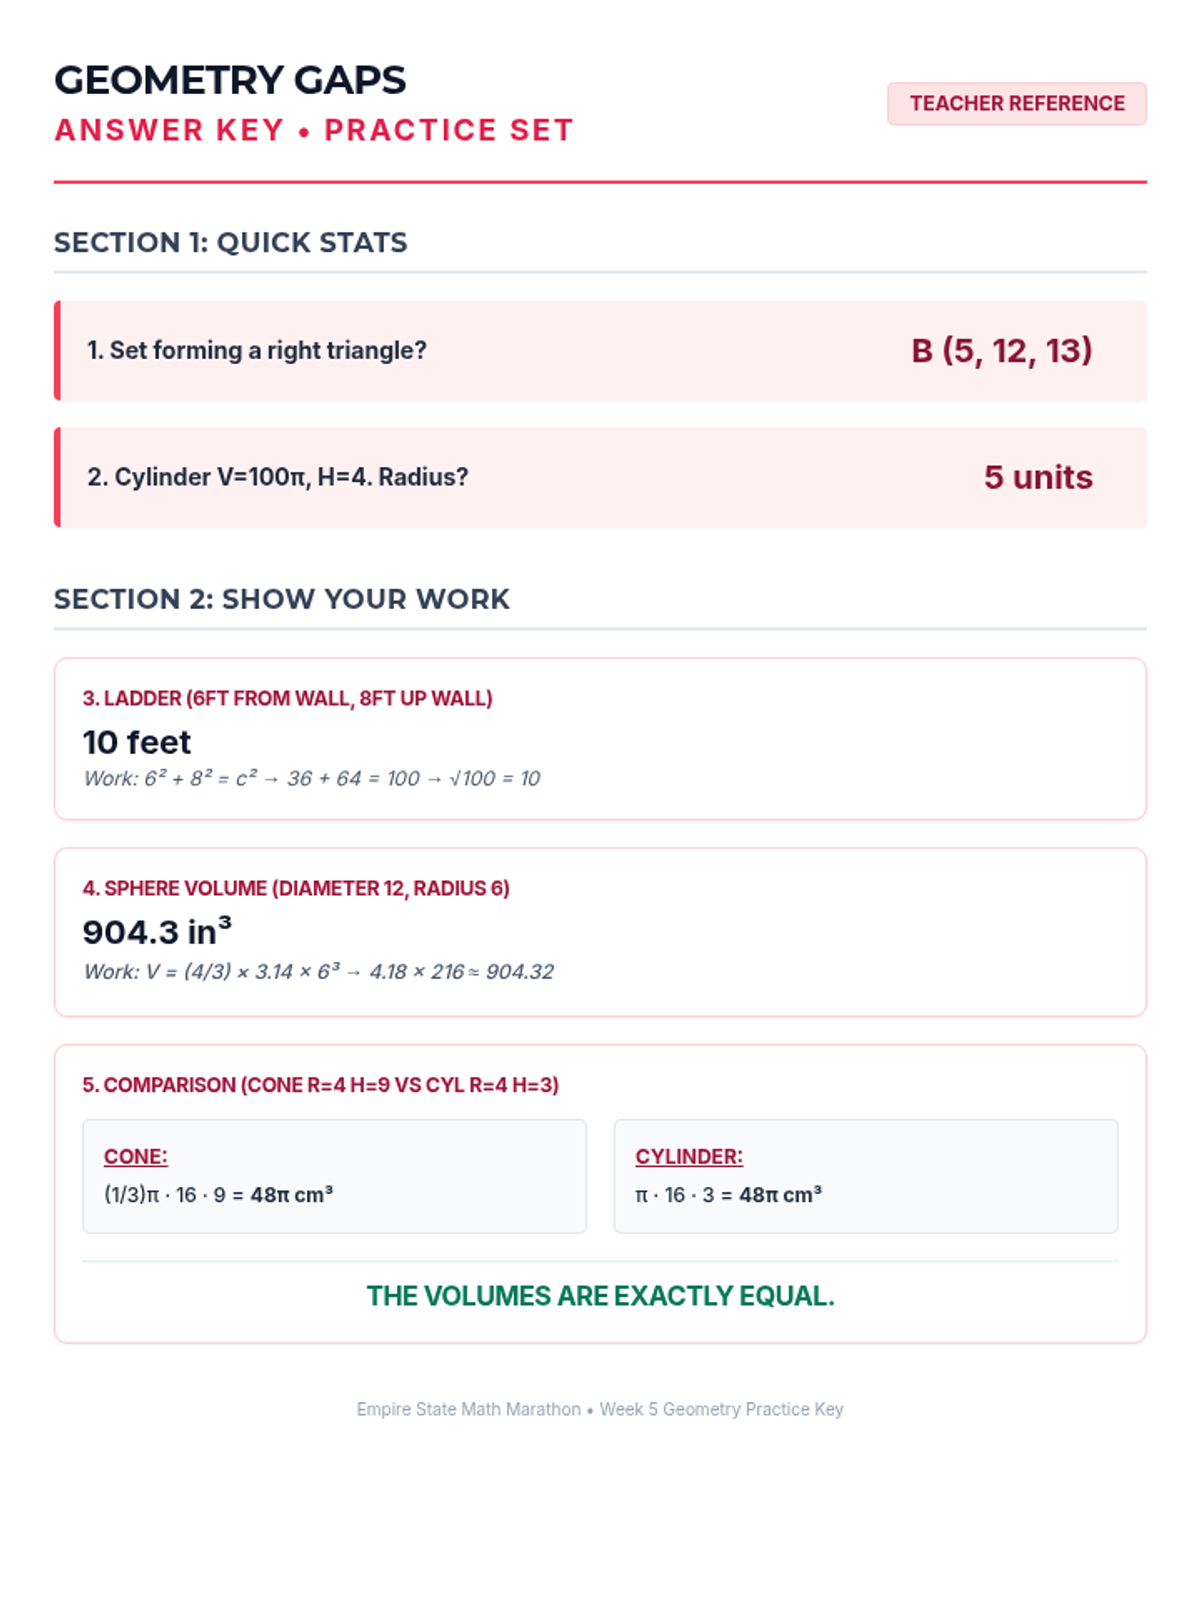
Week 5 reviews the Pythagorean Theorem and volume formulas for cylinders, cones, and spheres.
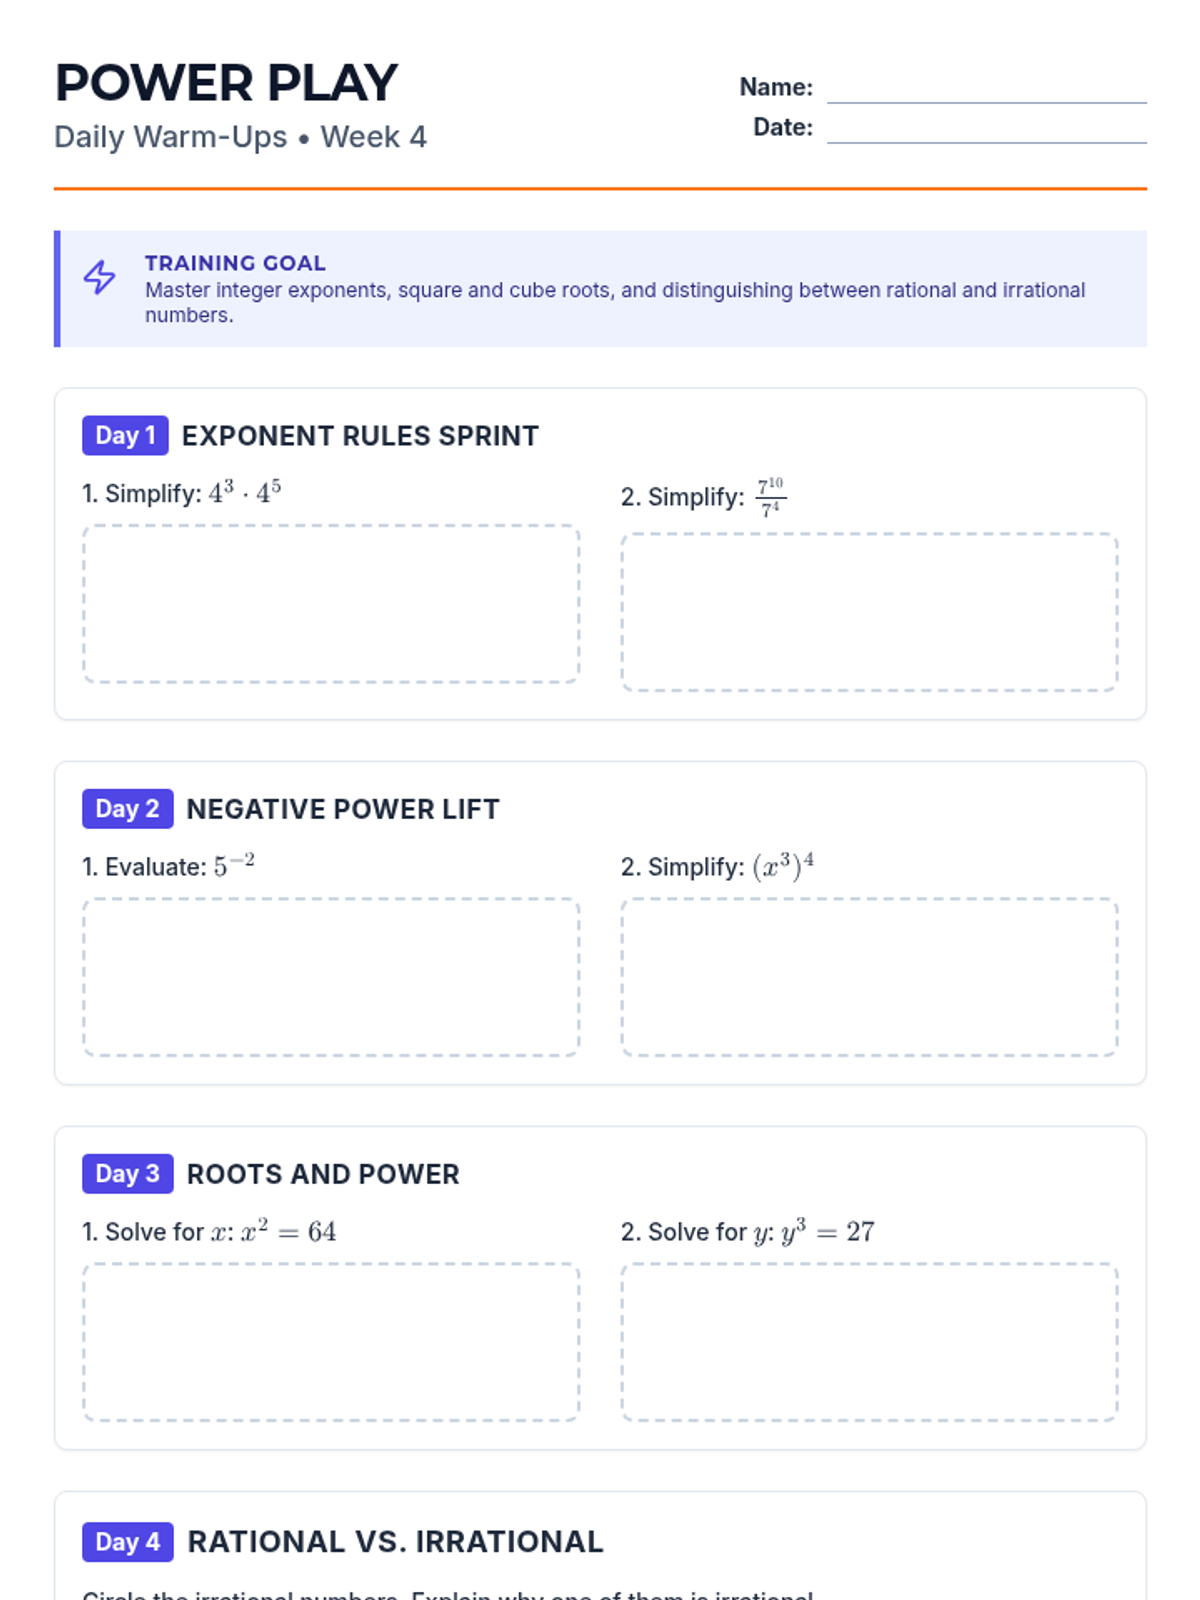
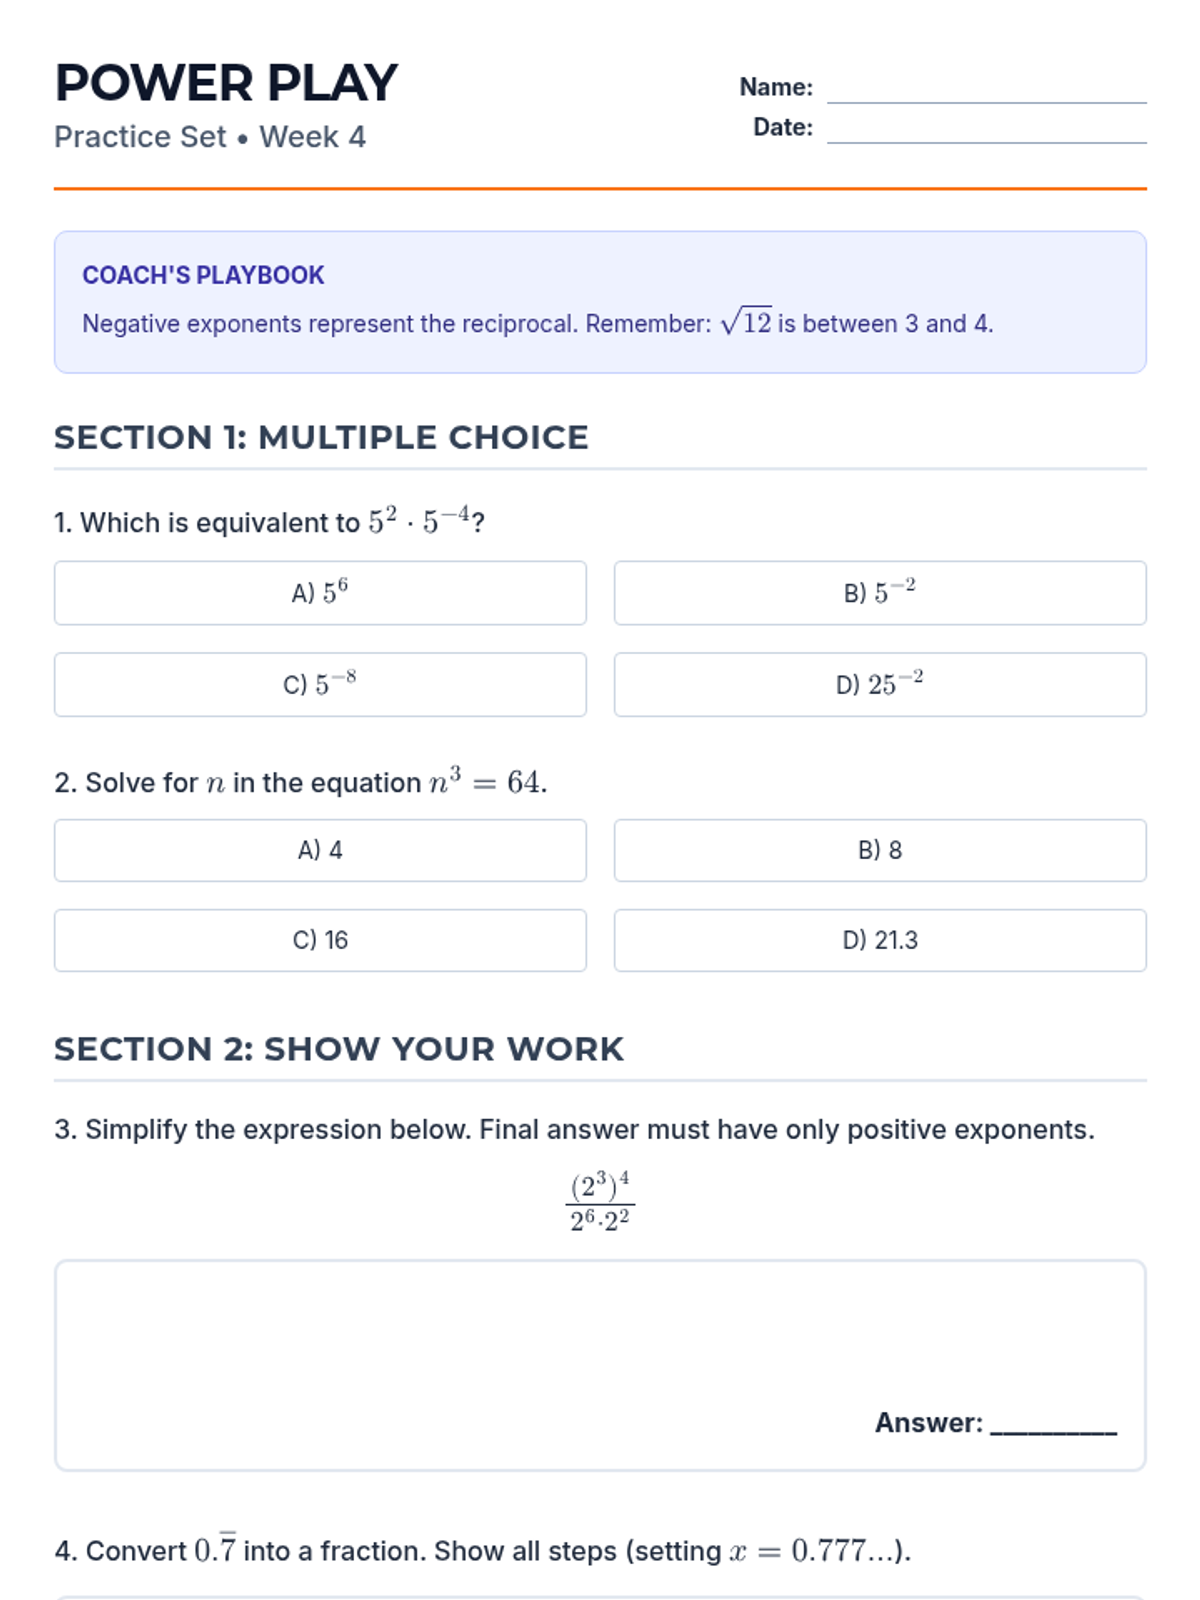
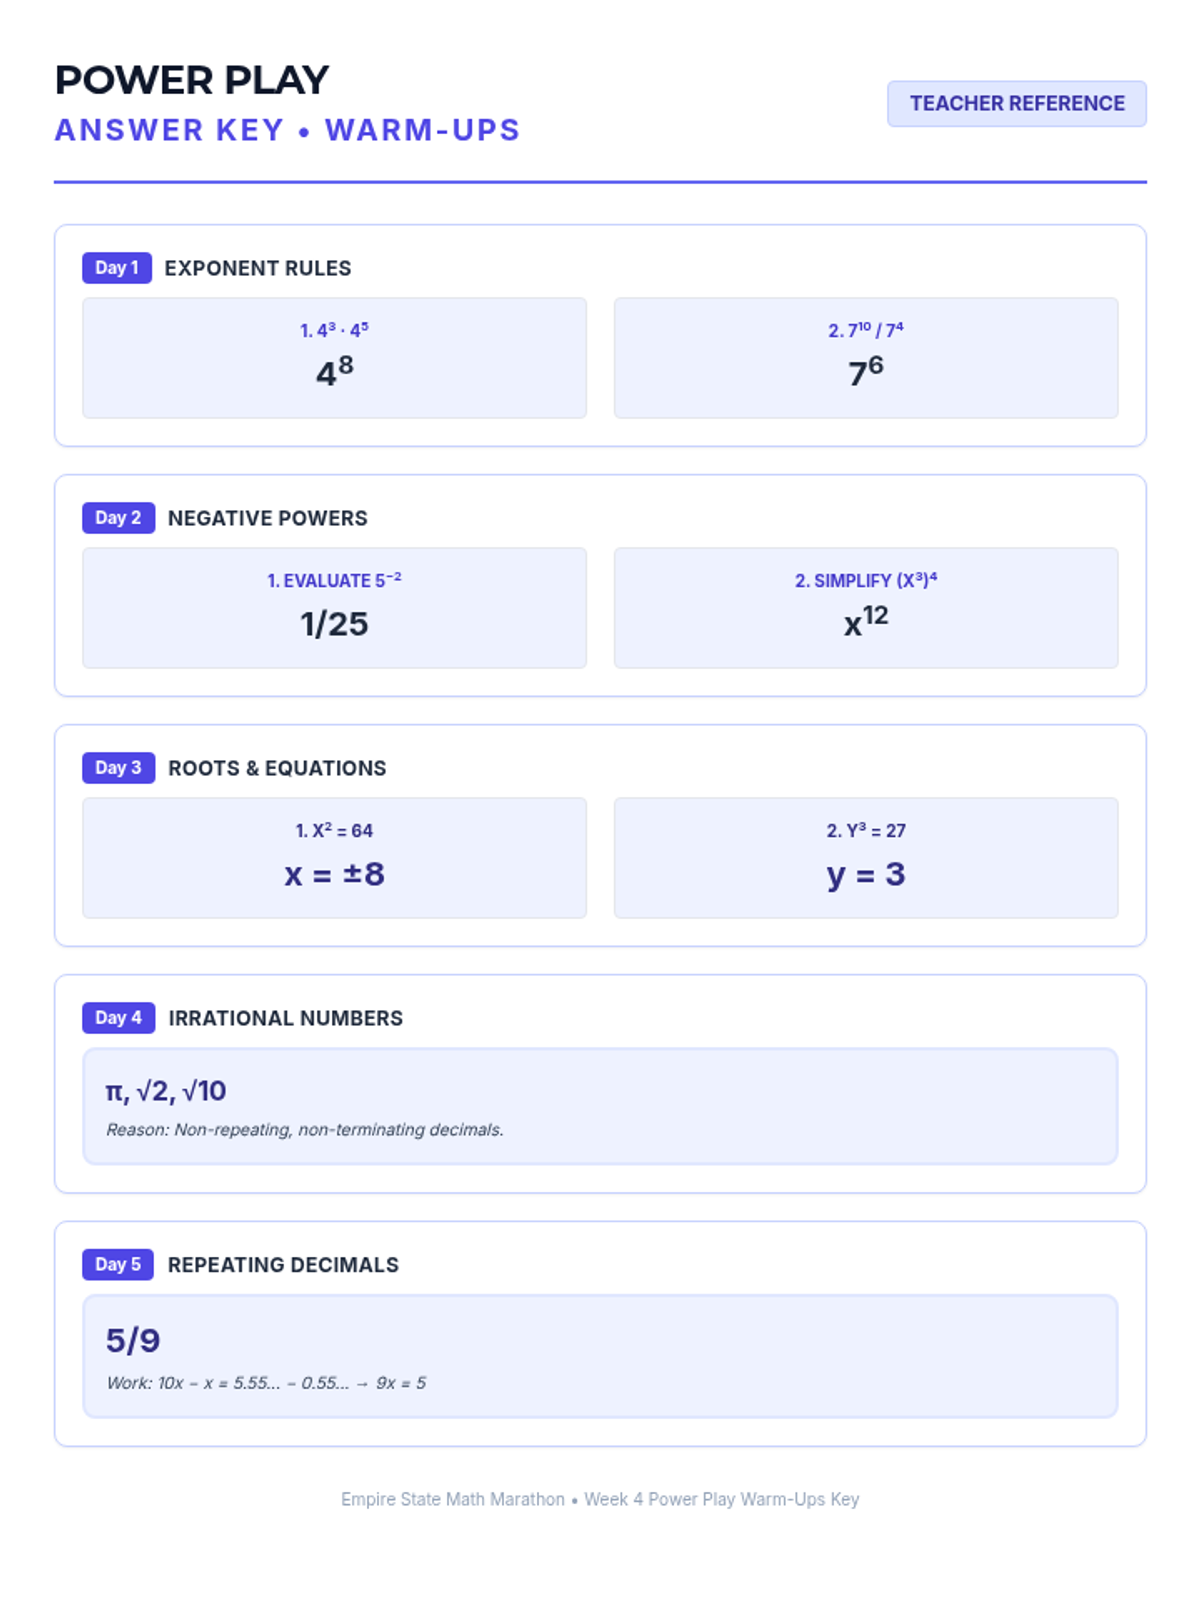
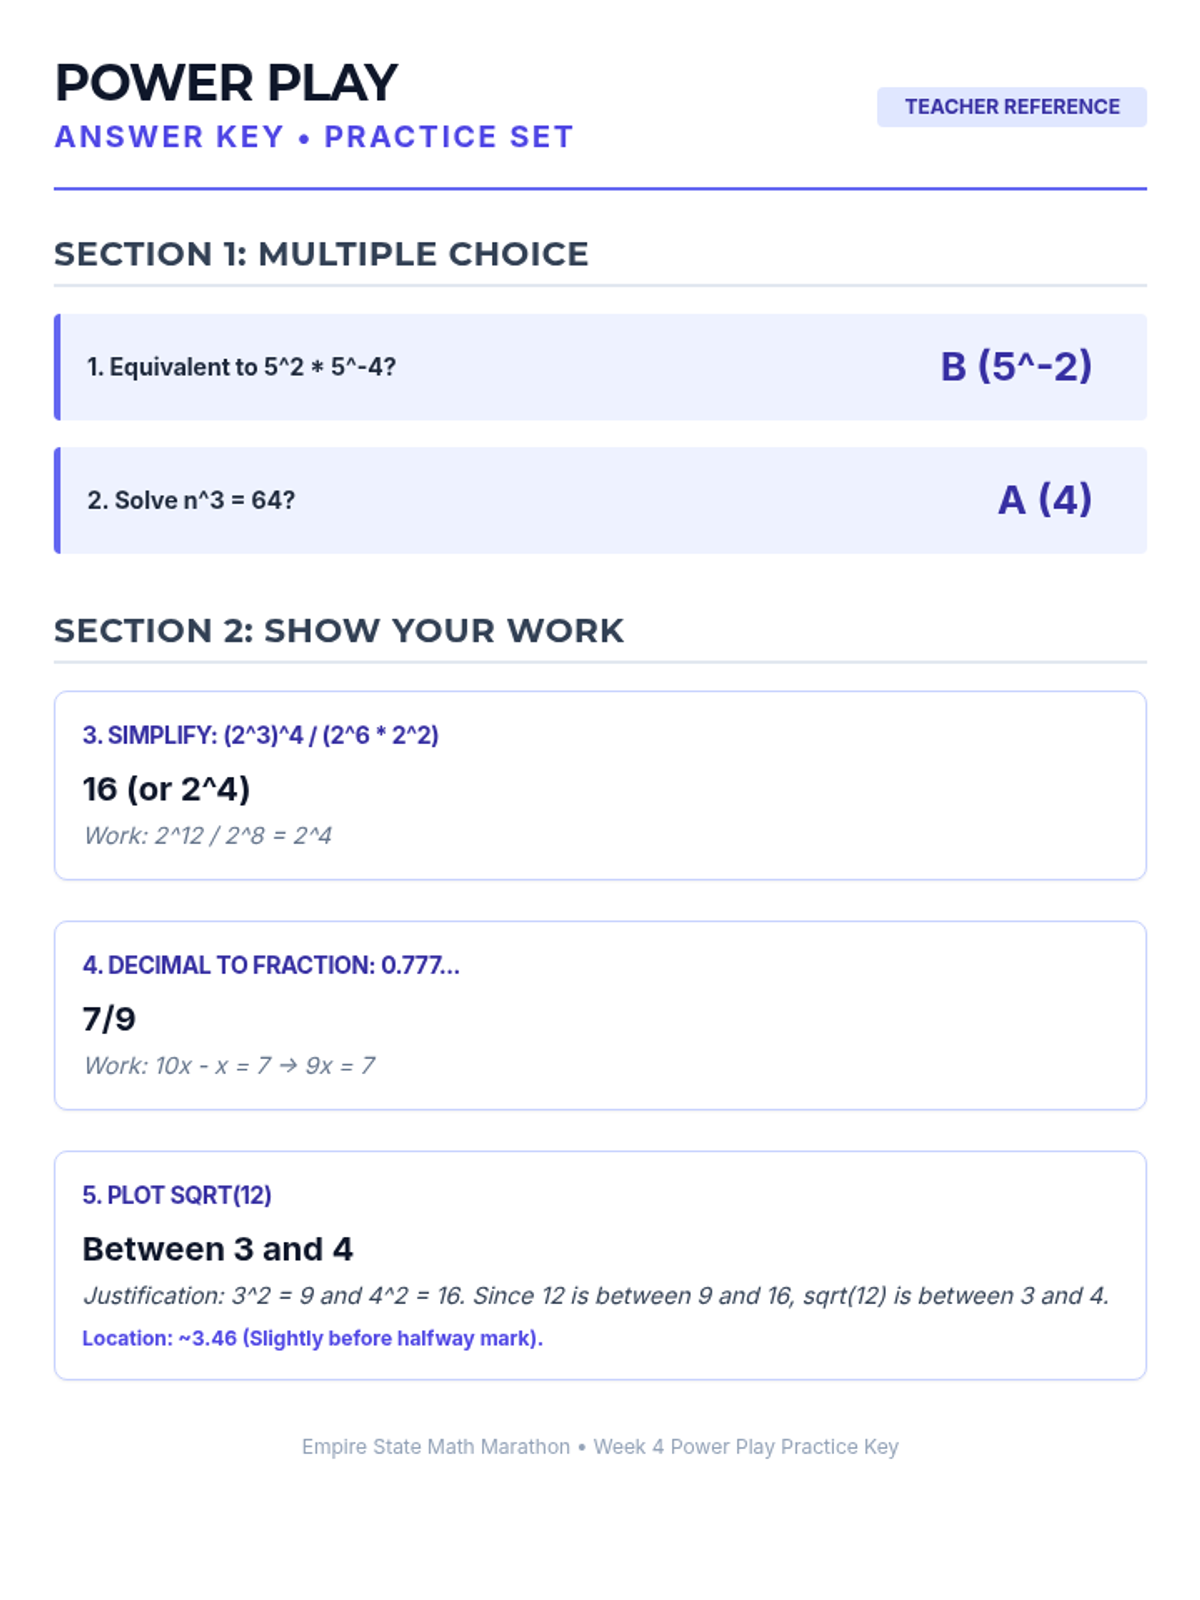
Week 4 explores integer exponent rules, perfect squares and cubes, and distinguishing between rational and irrational numbers.
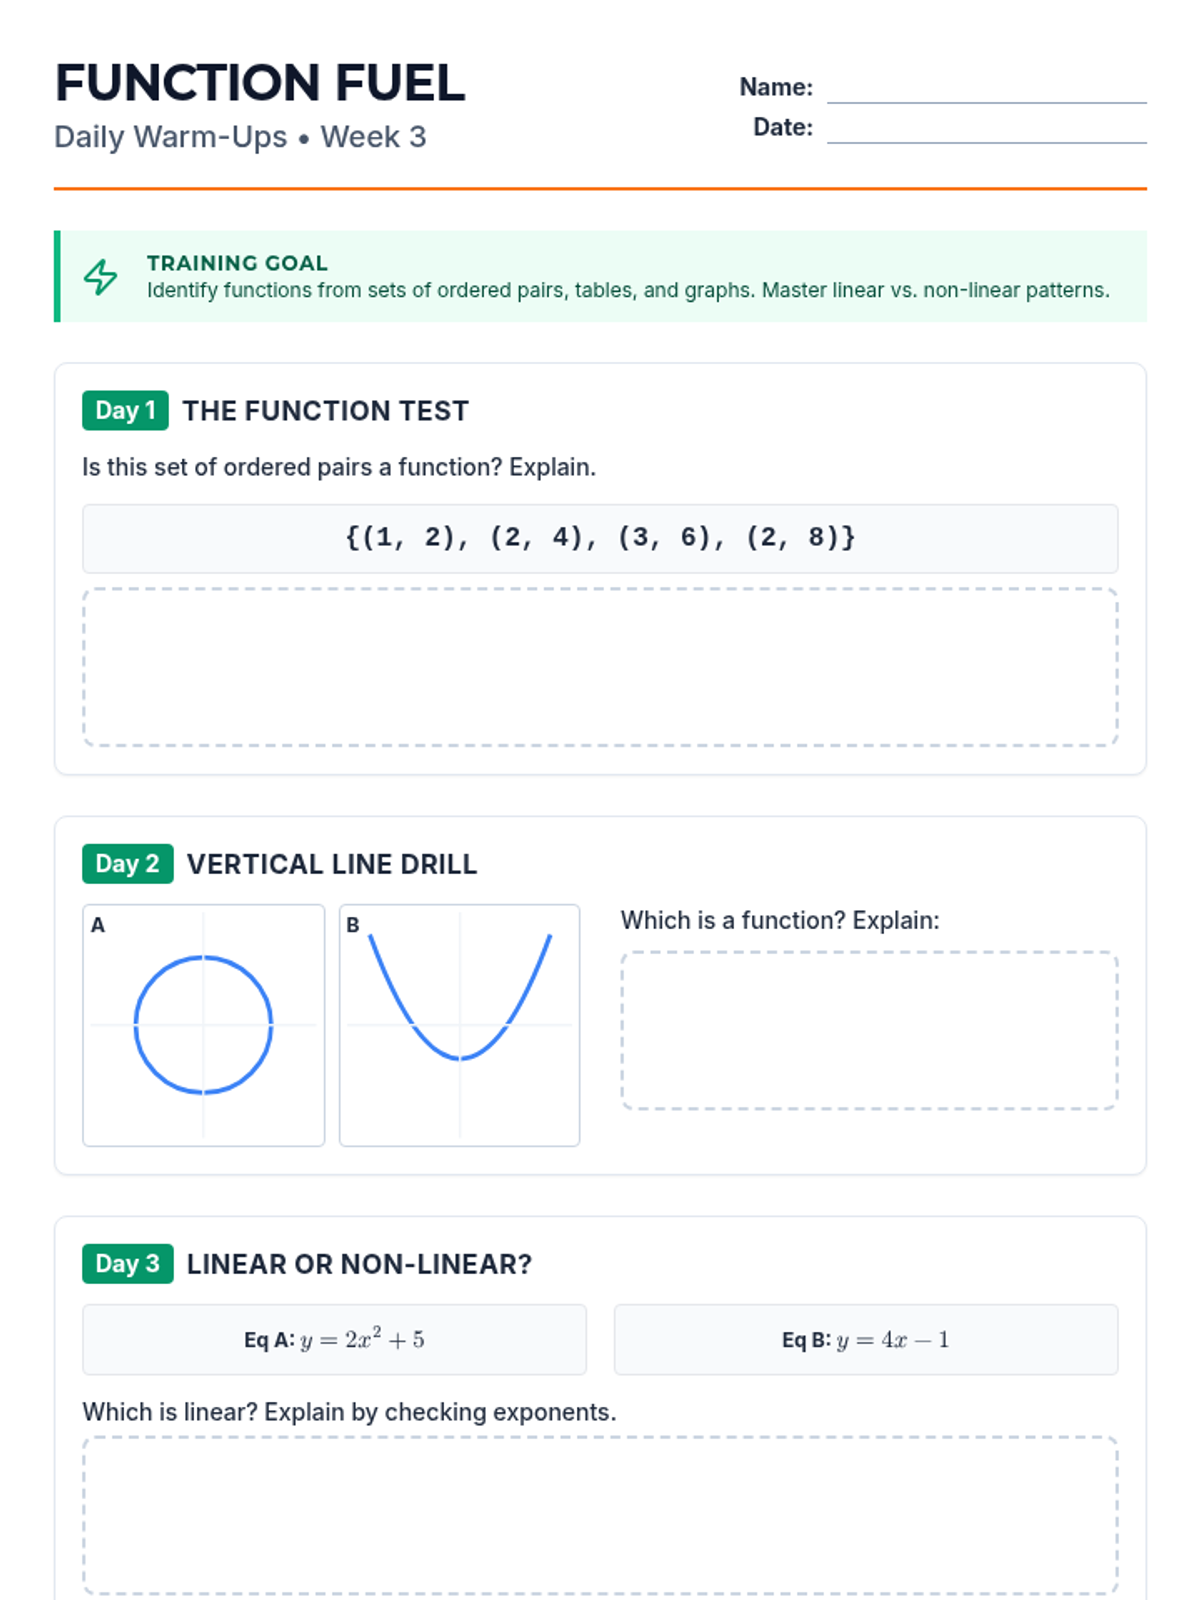
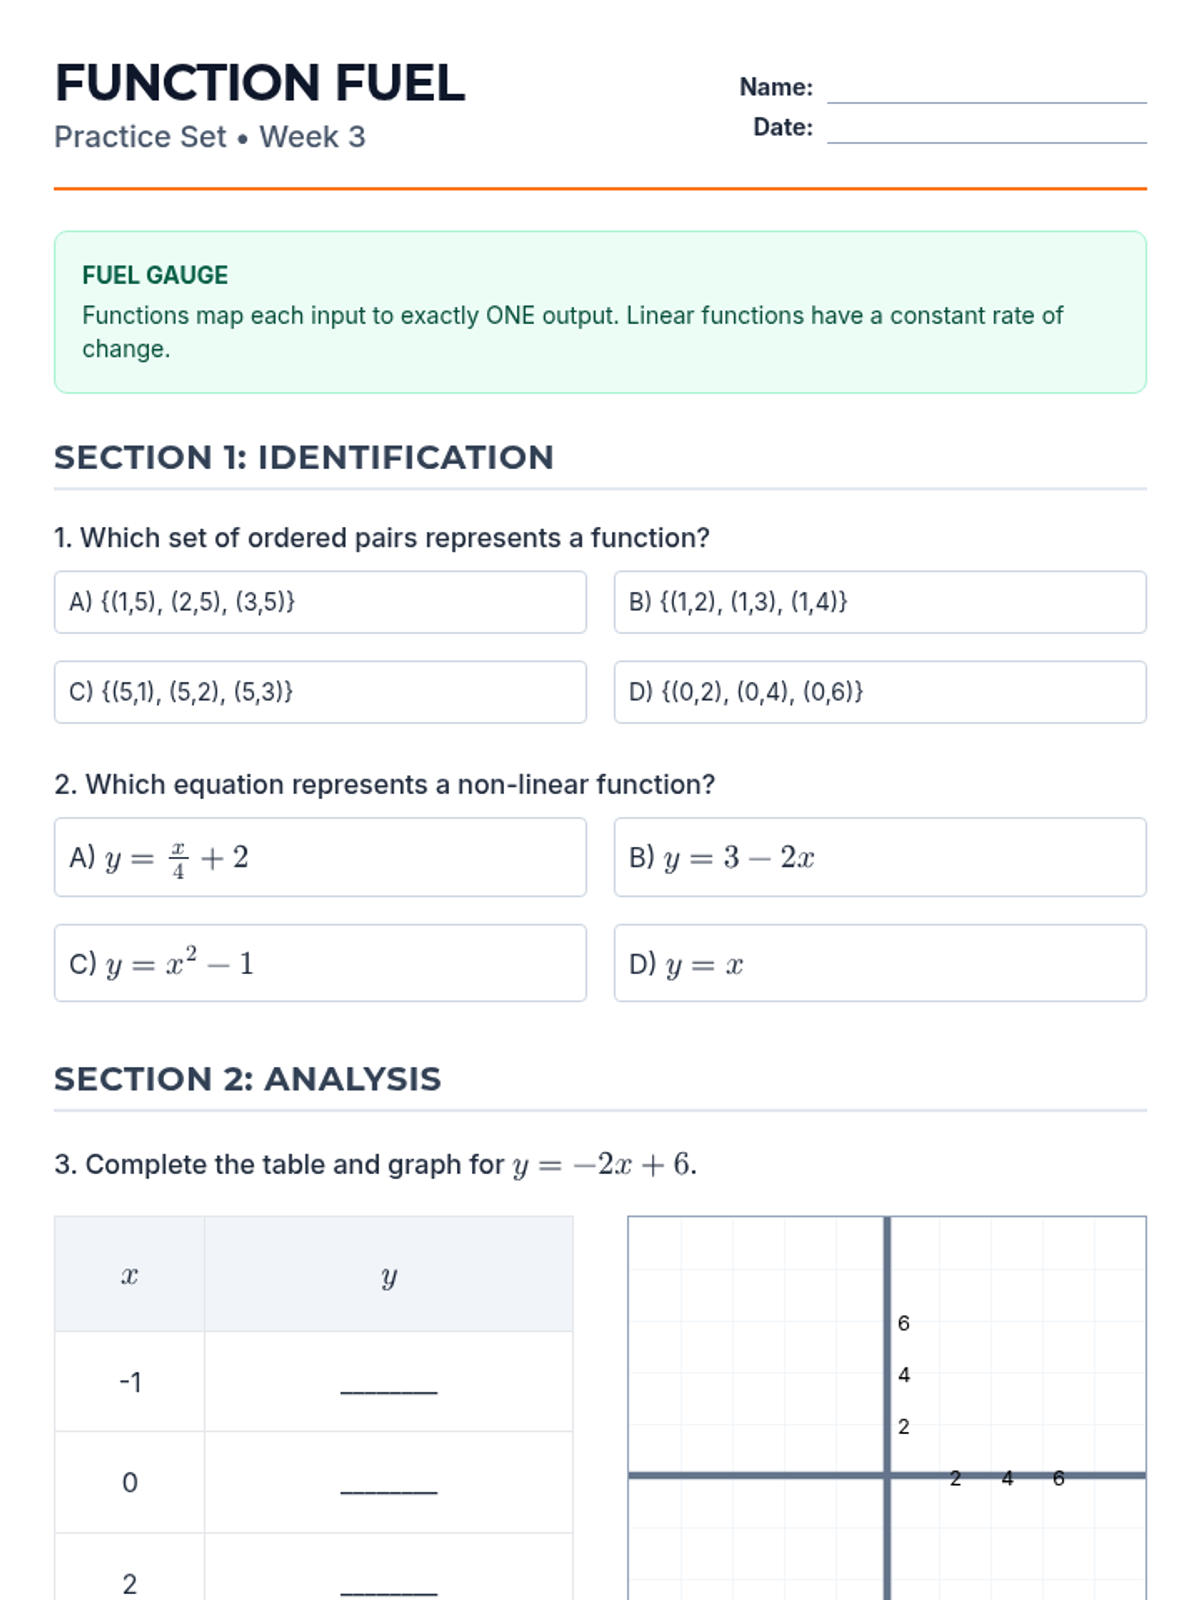
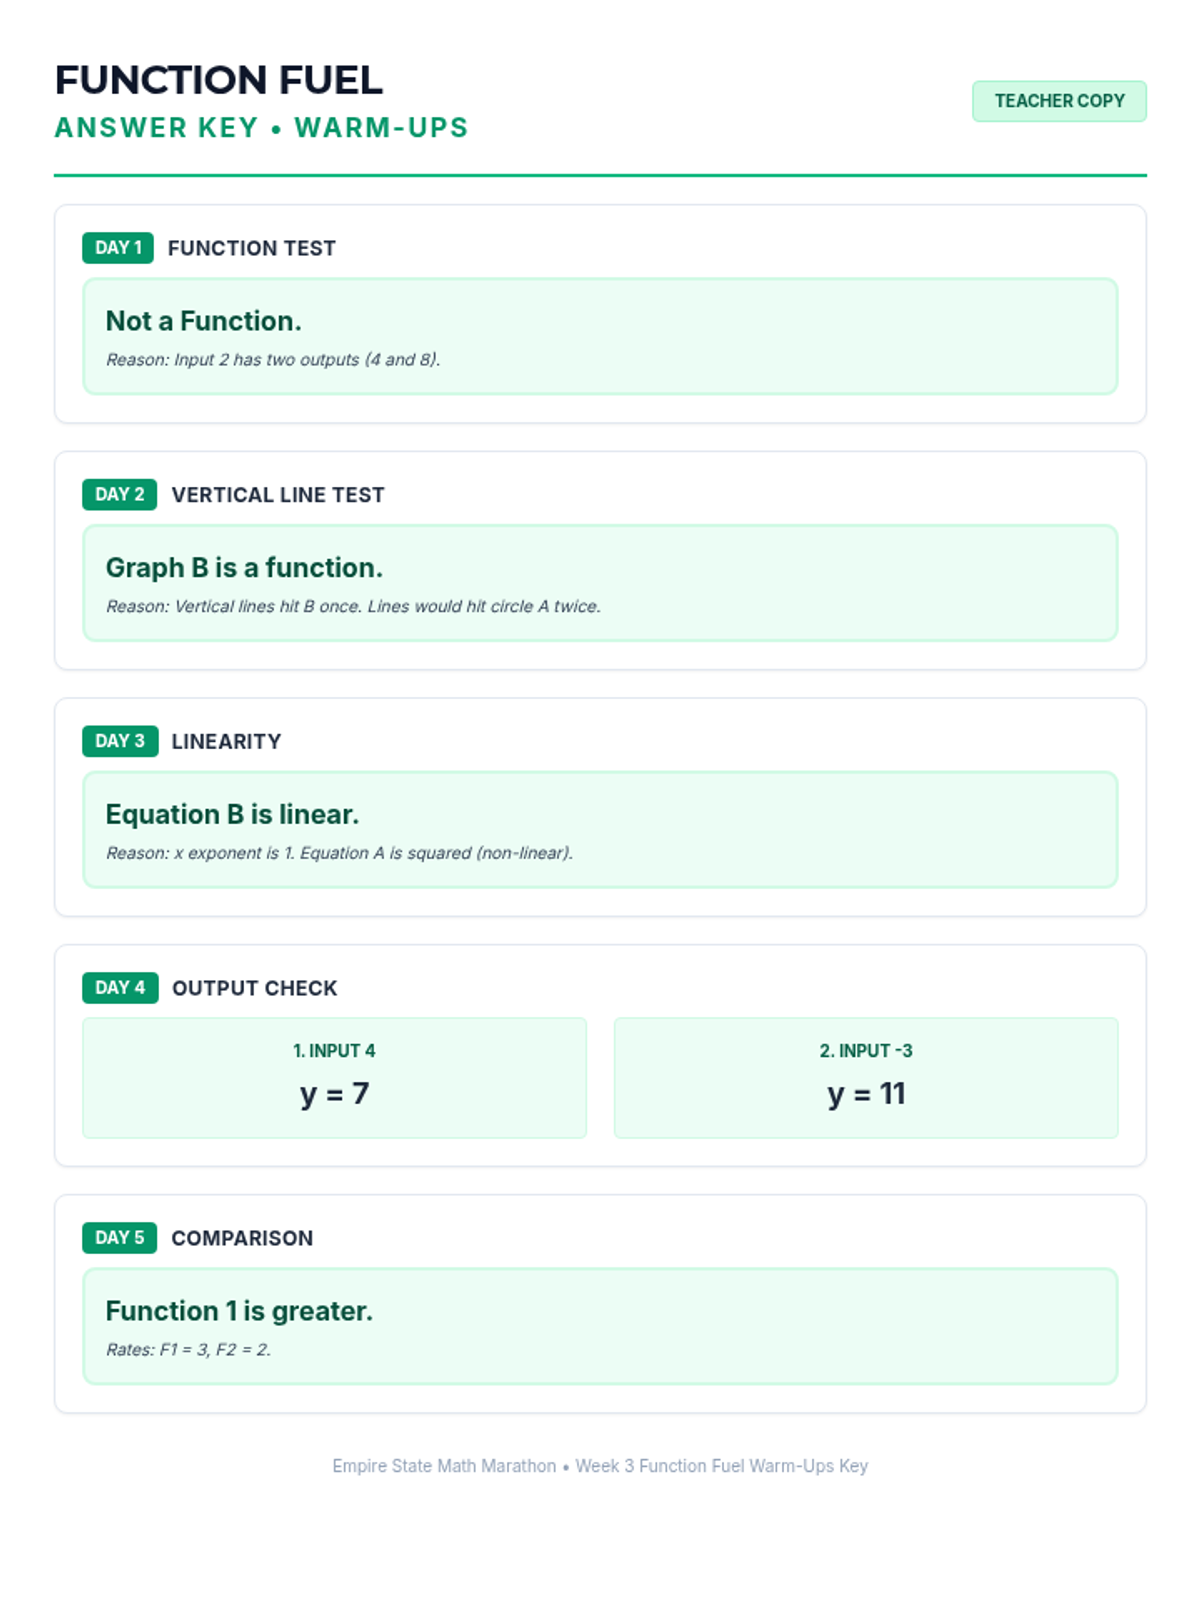
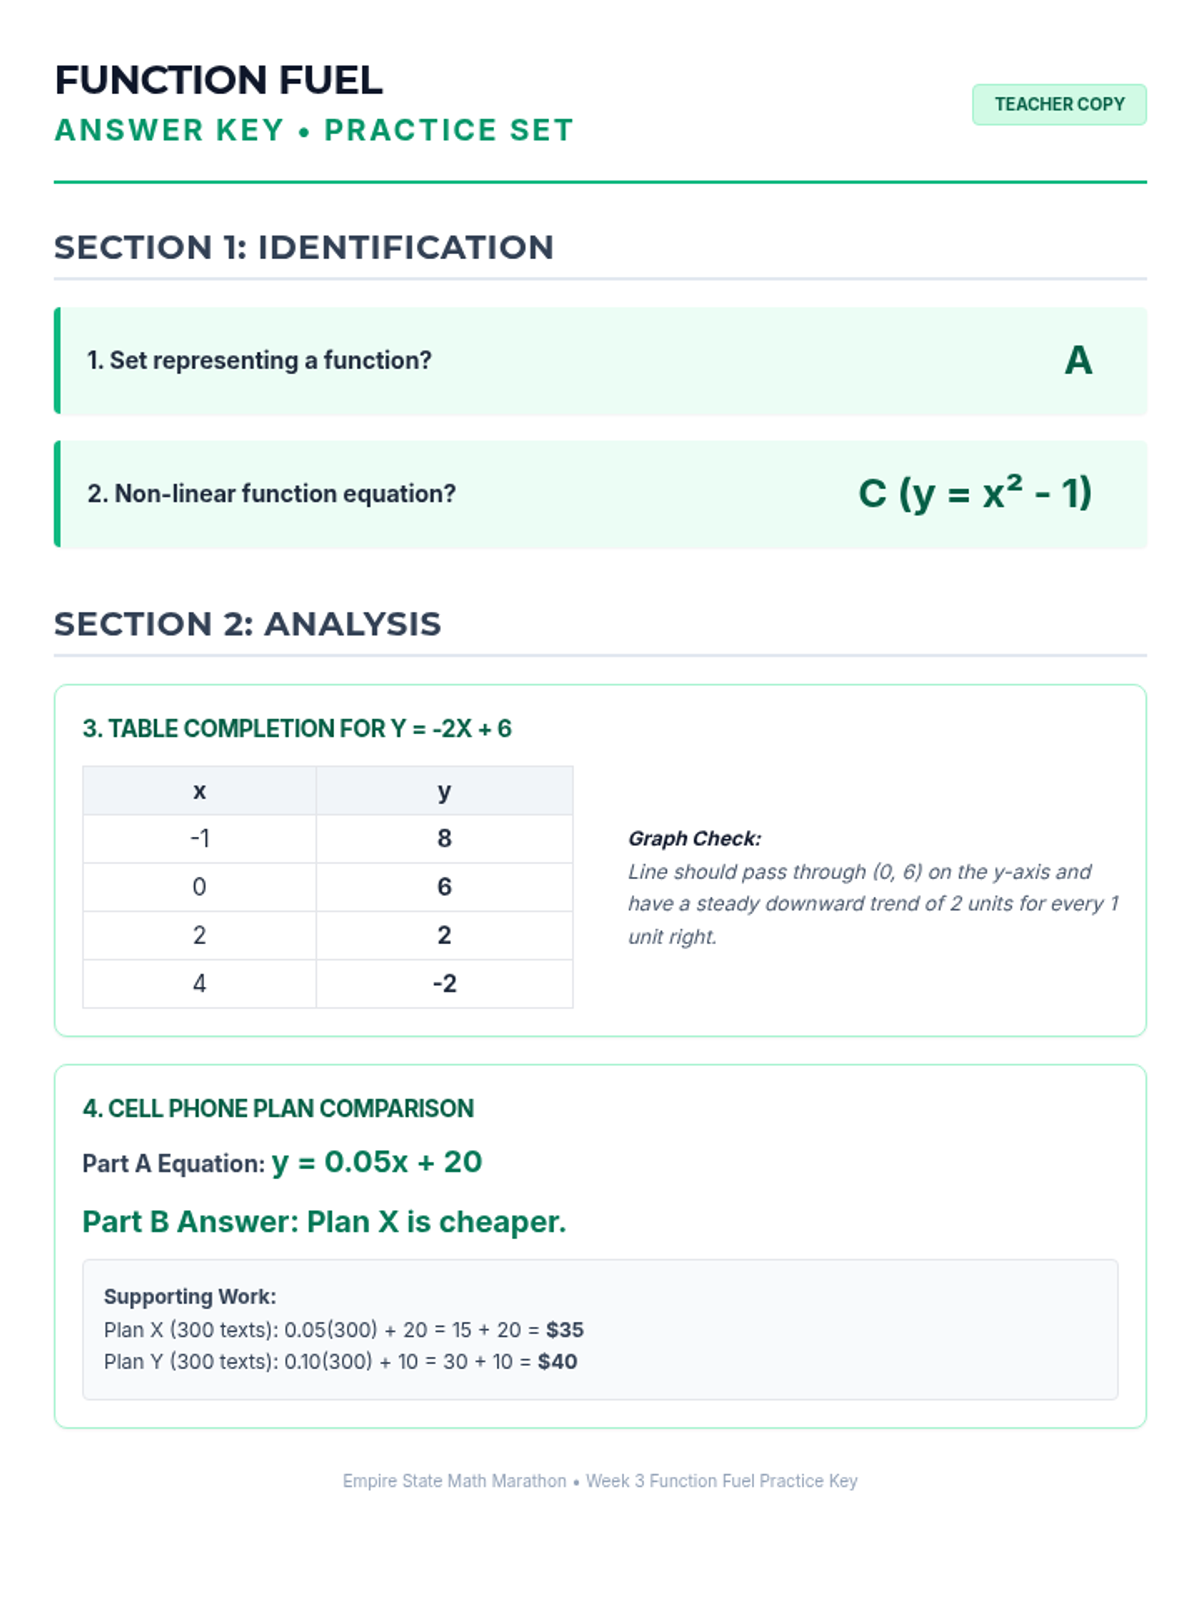
Week 3 defines, evaluates, and compares functions represented in different ways (tables, graphs, equations).
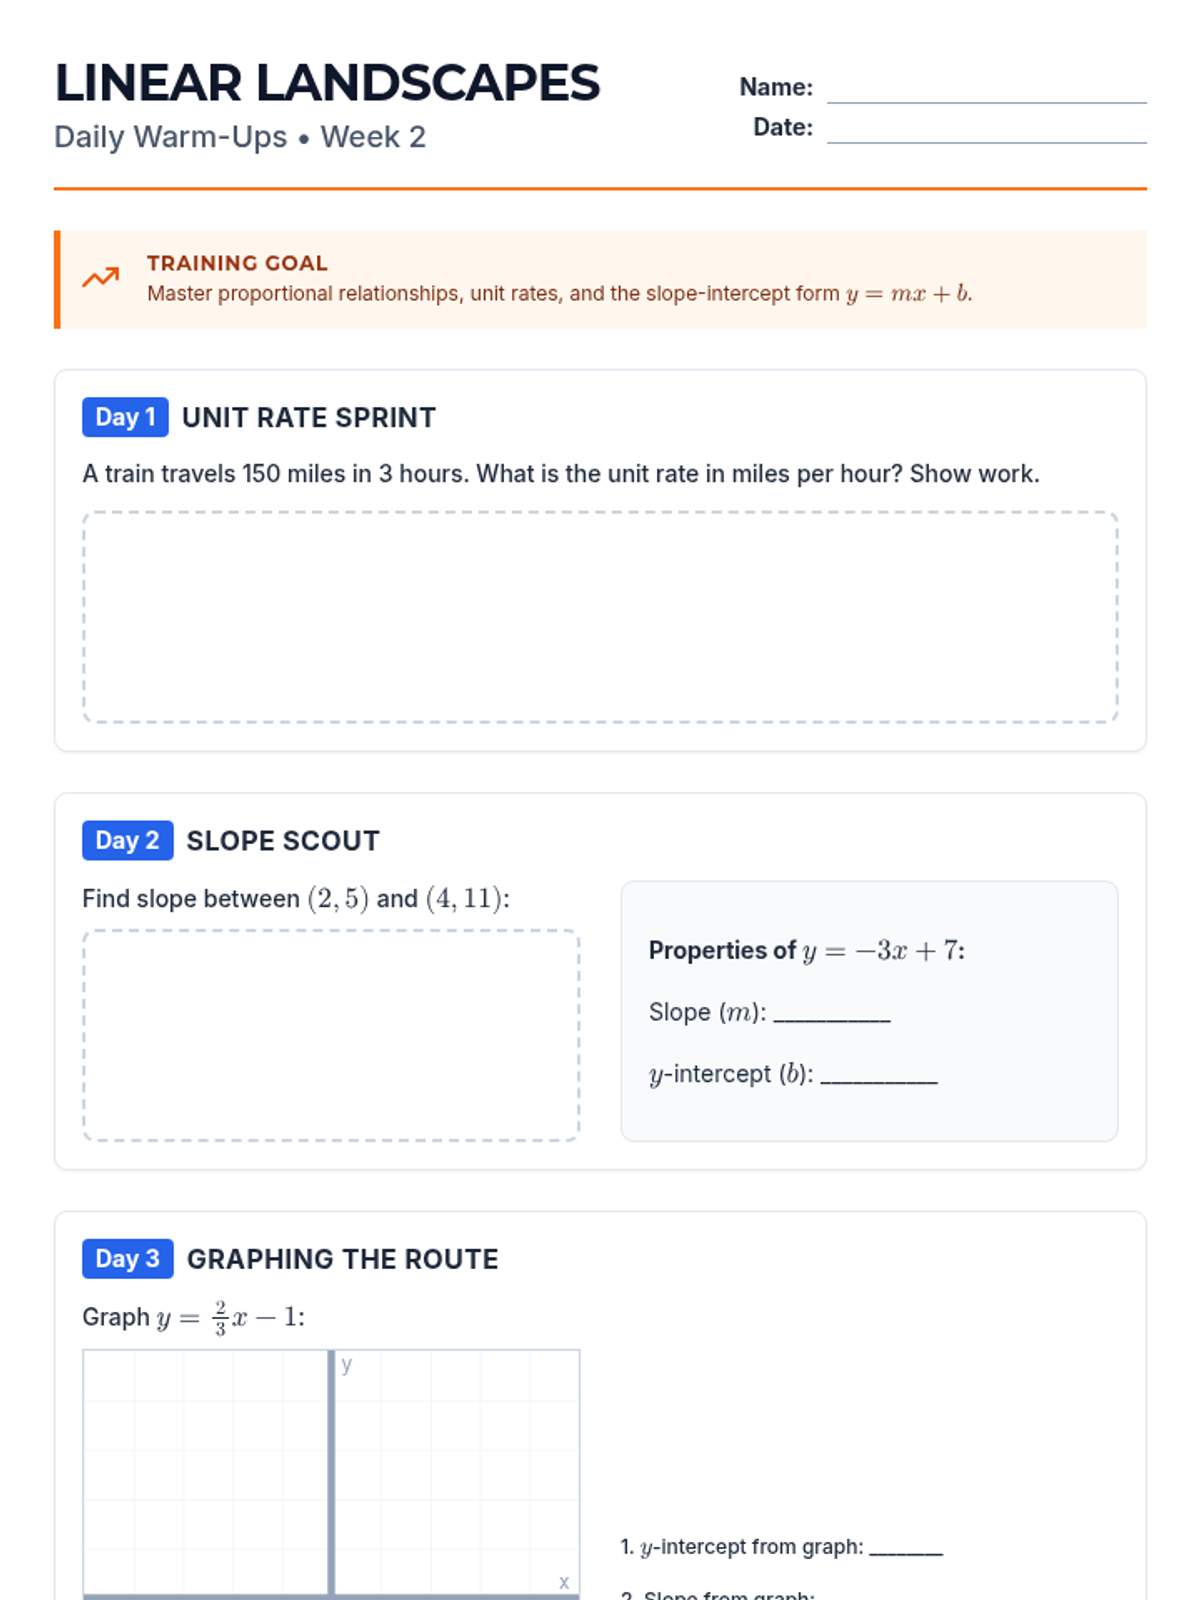
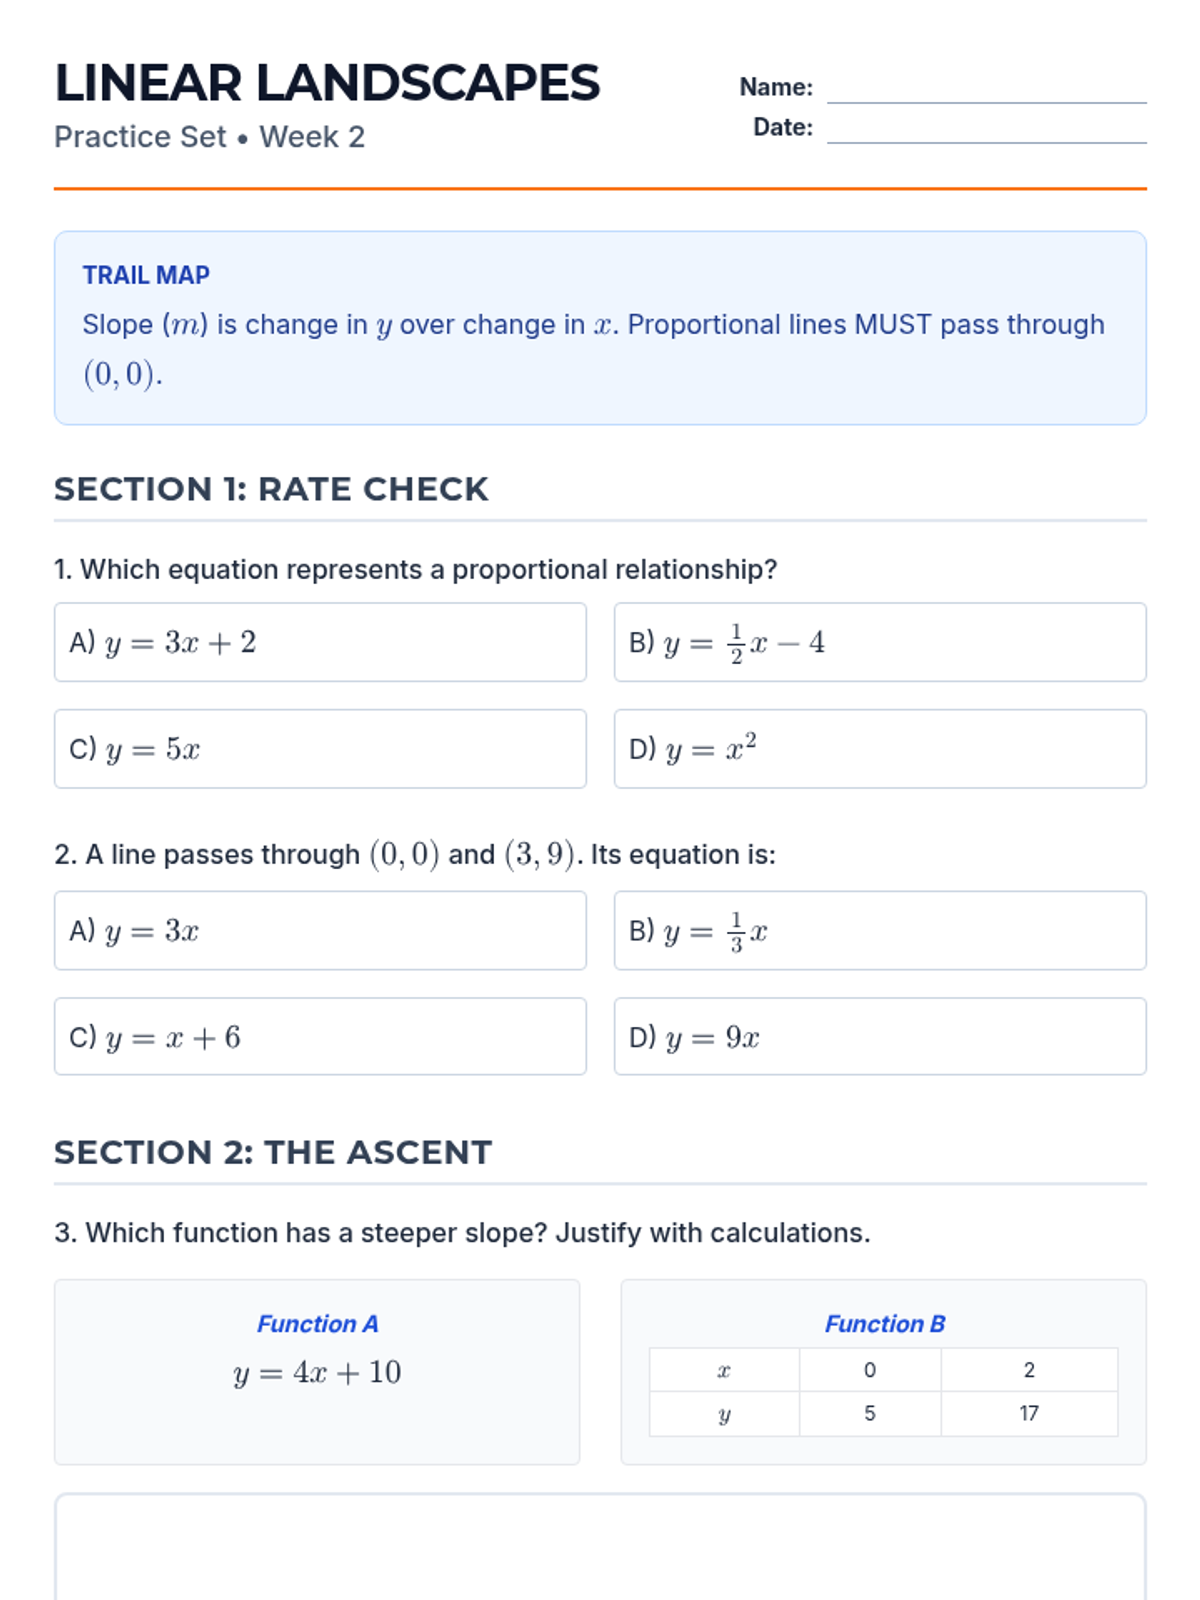
Week 2 covers proportional relationships, unit rates, and the slope-intercept form of linear equations.
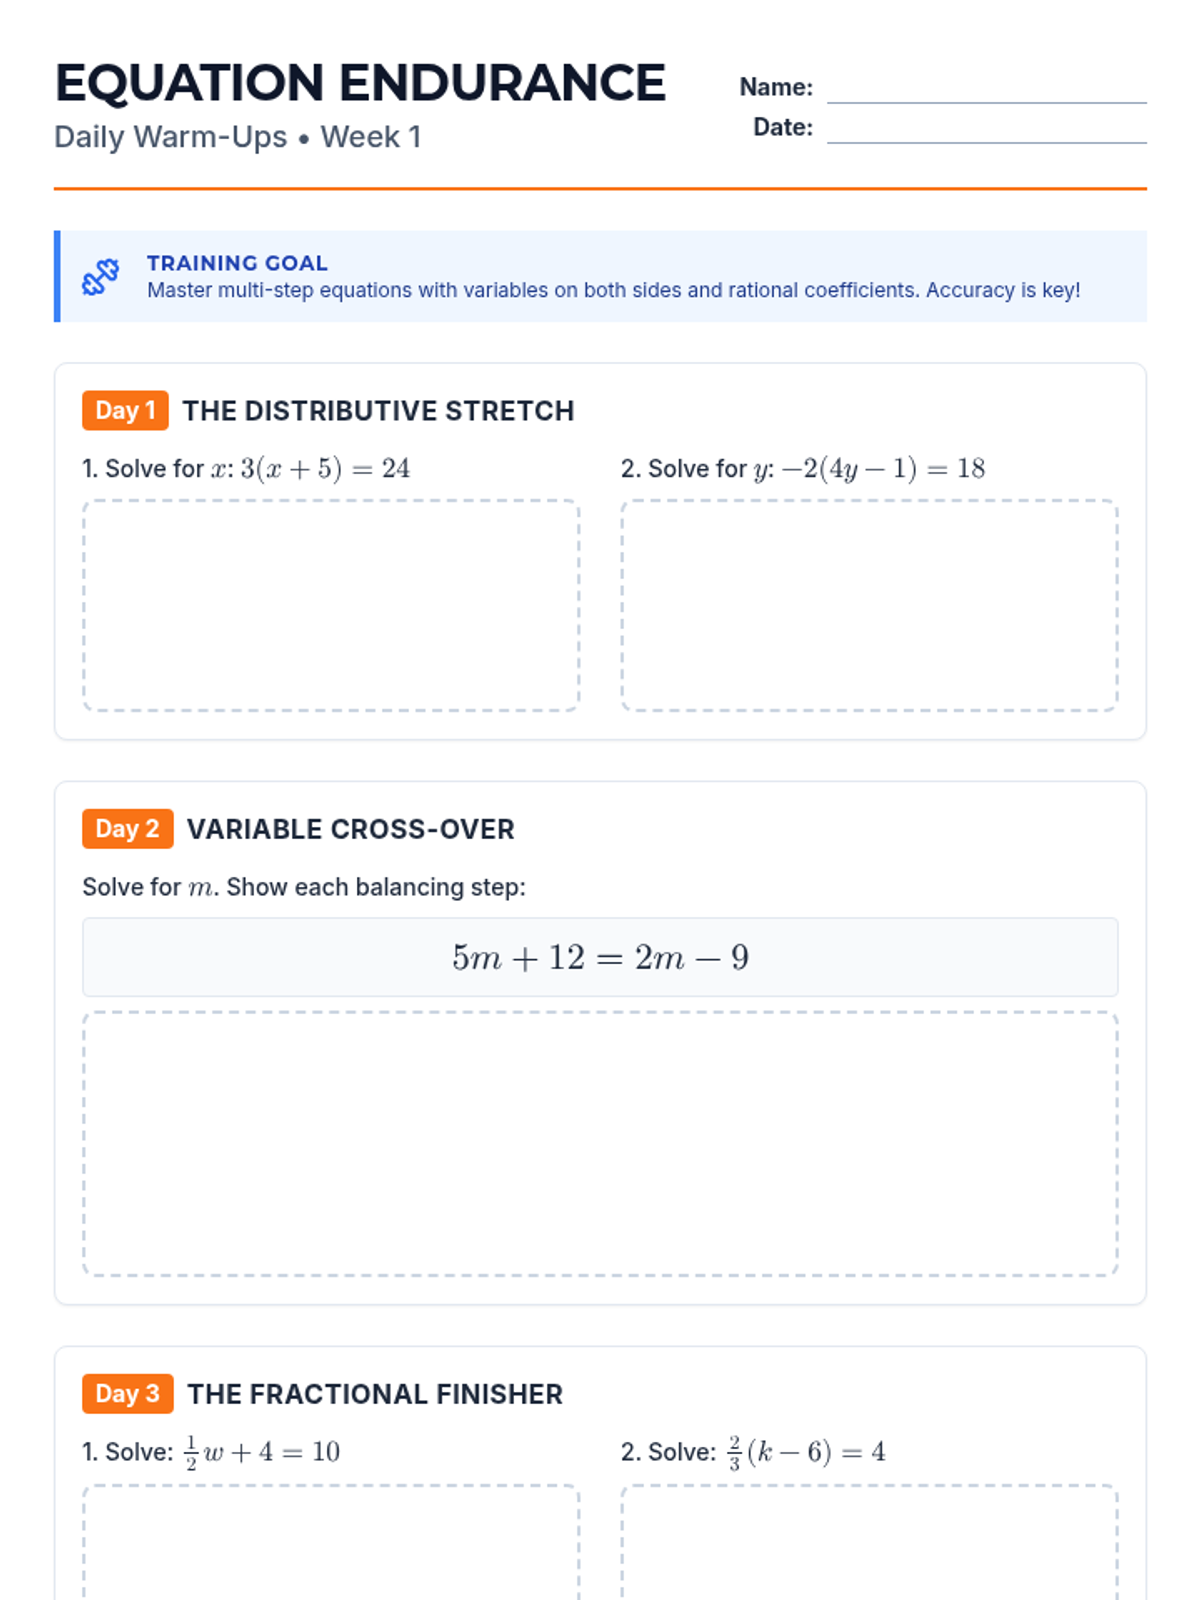
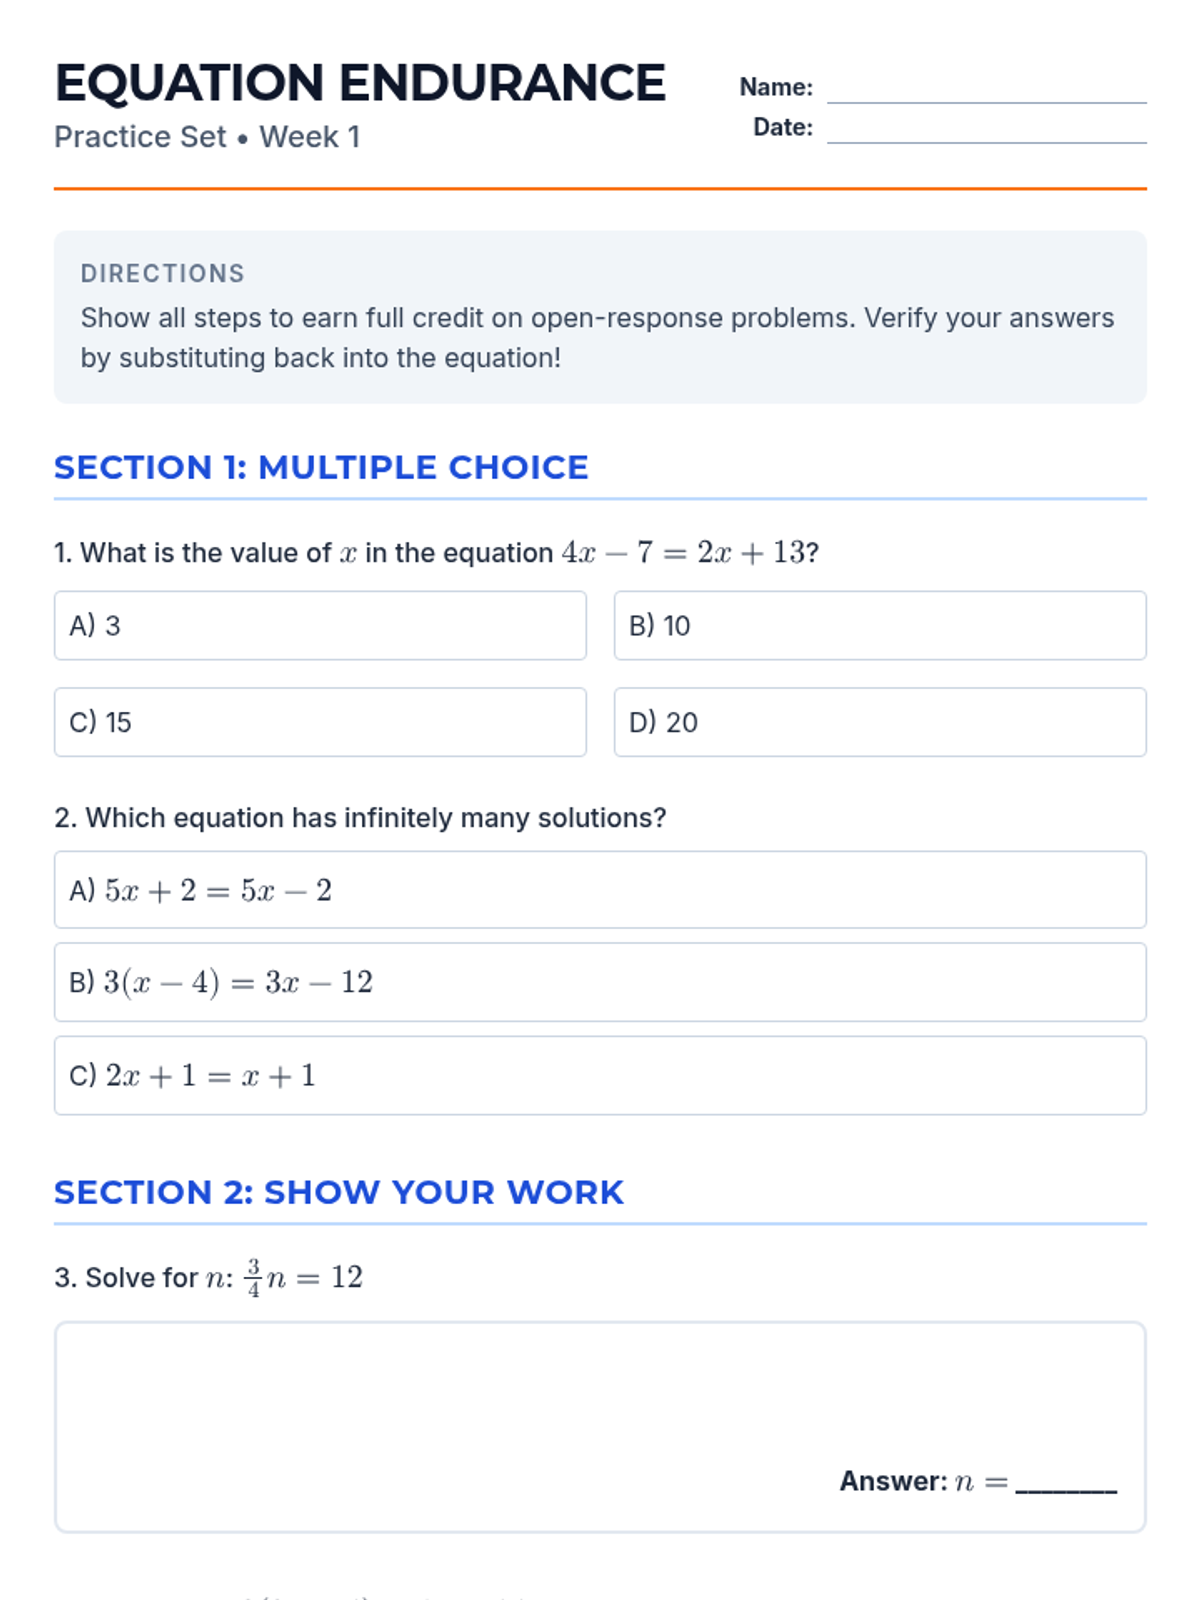
Week 1 focuses on solving multi-step equations, including those with variables on both sides, rational coefficients, and checking solutions.
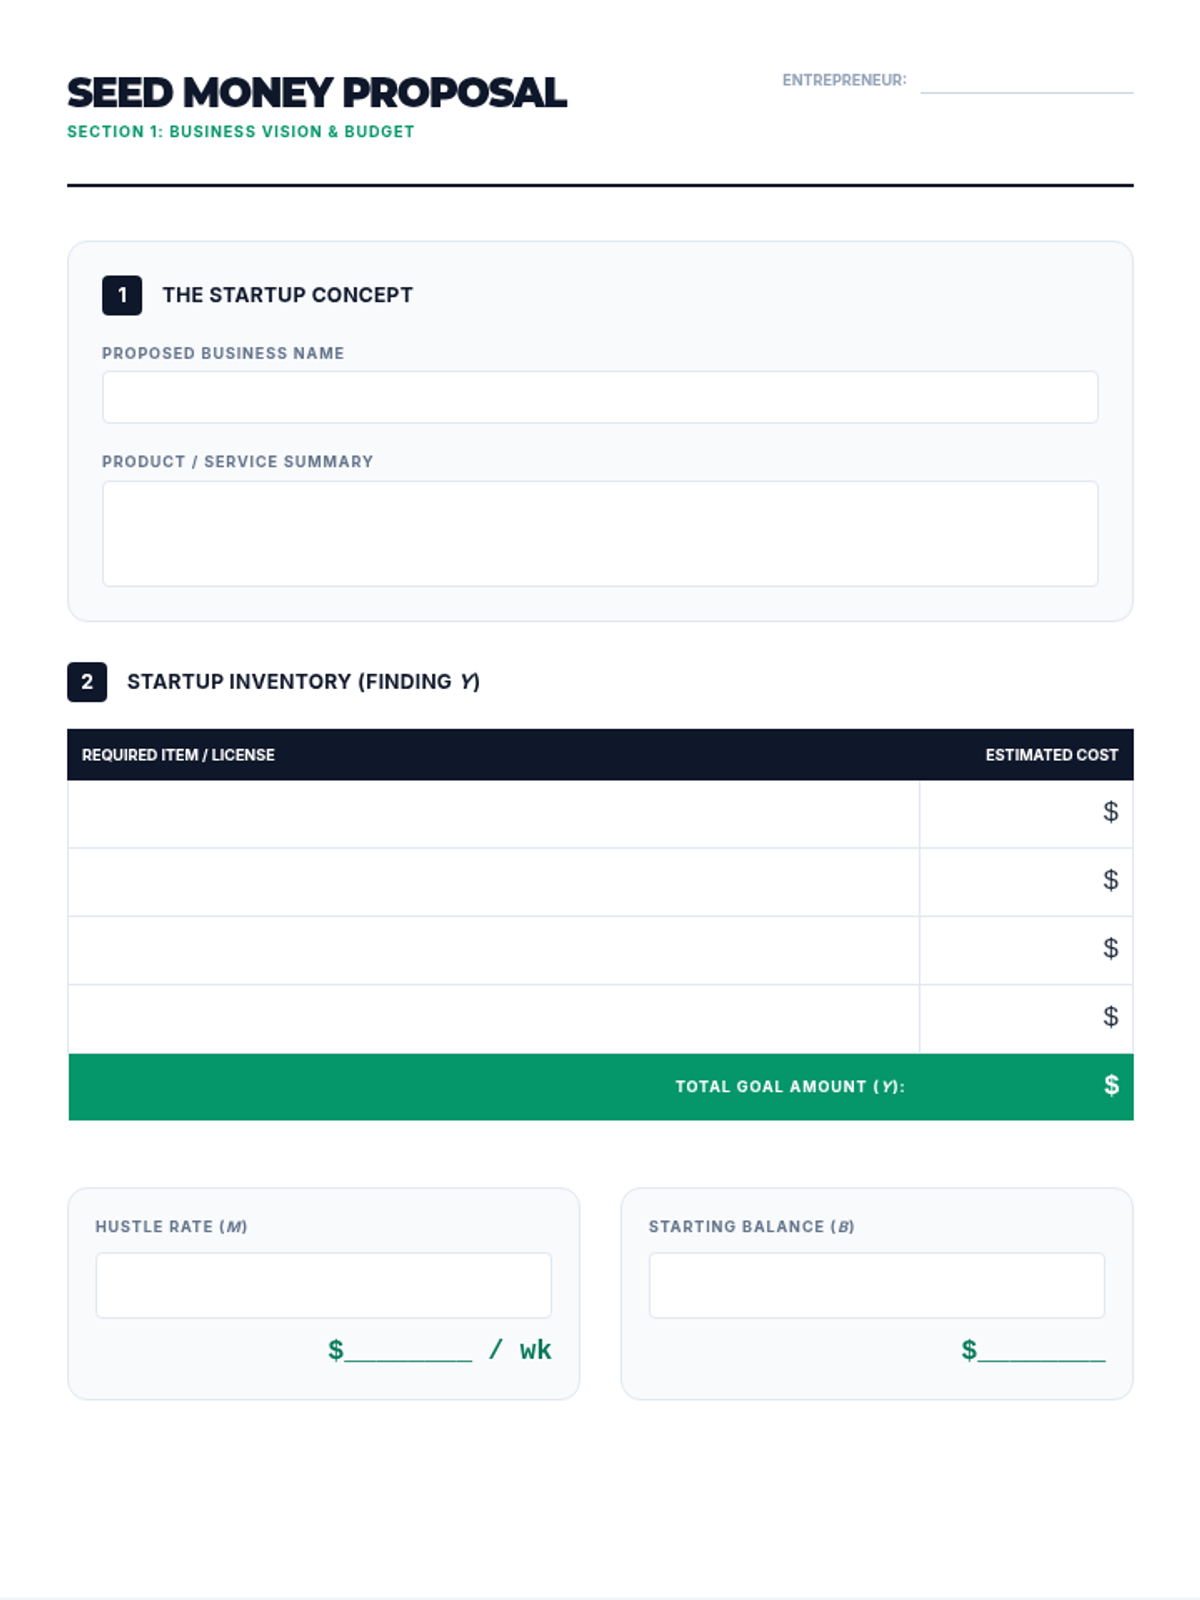
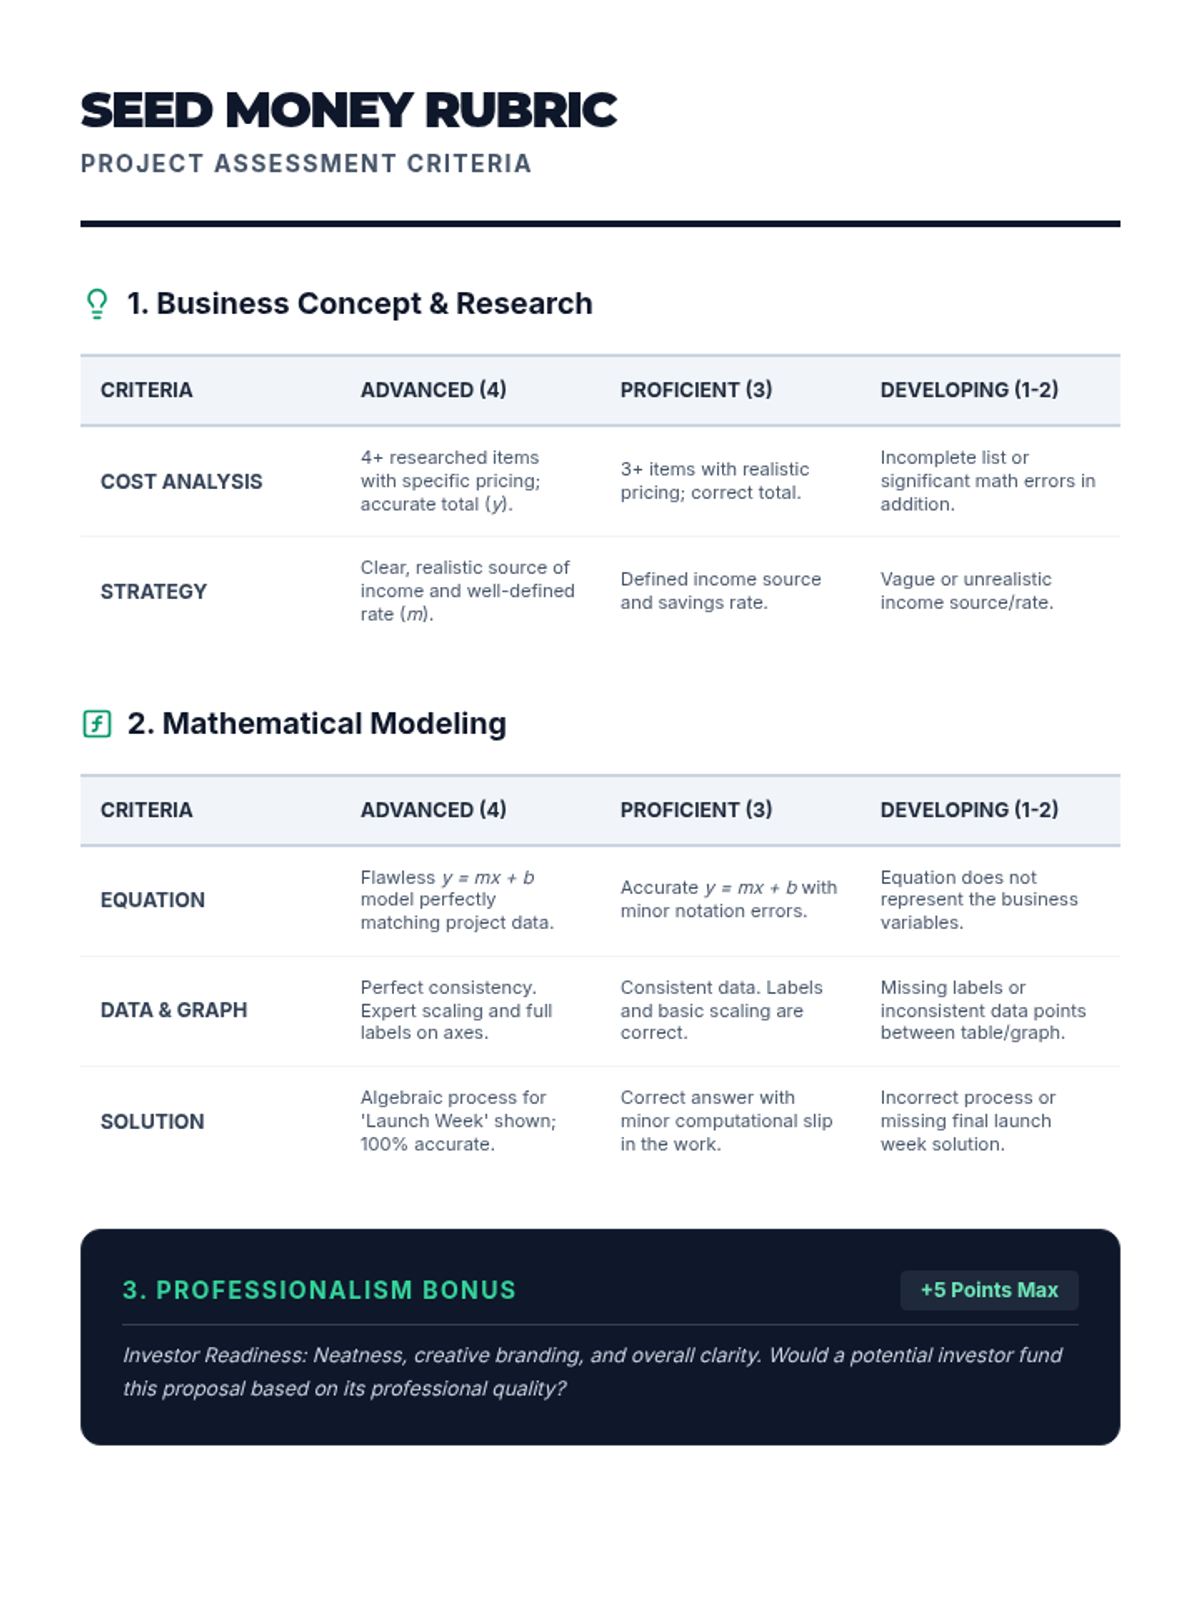
A comprehensive project where students apply linear functions to model real-life savings goals for a startup business. Students will calculate startup costs, determine savings rates, and project their business launch date using algebraic models.
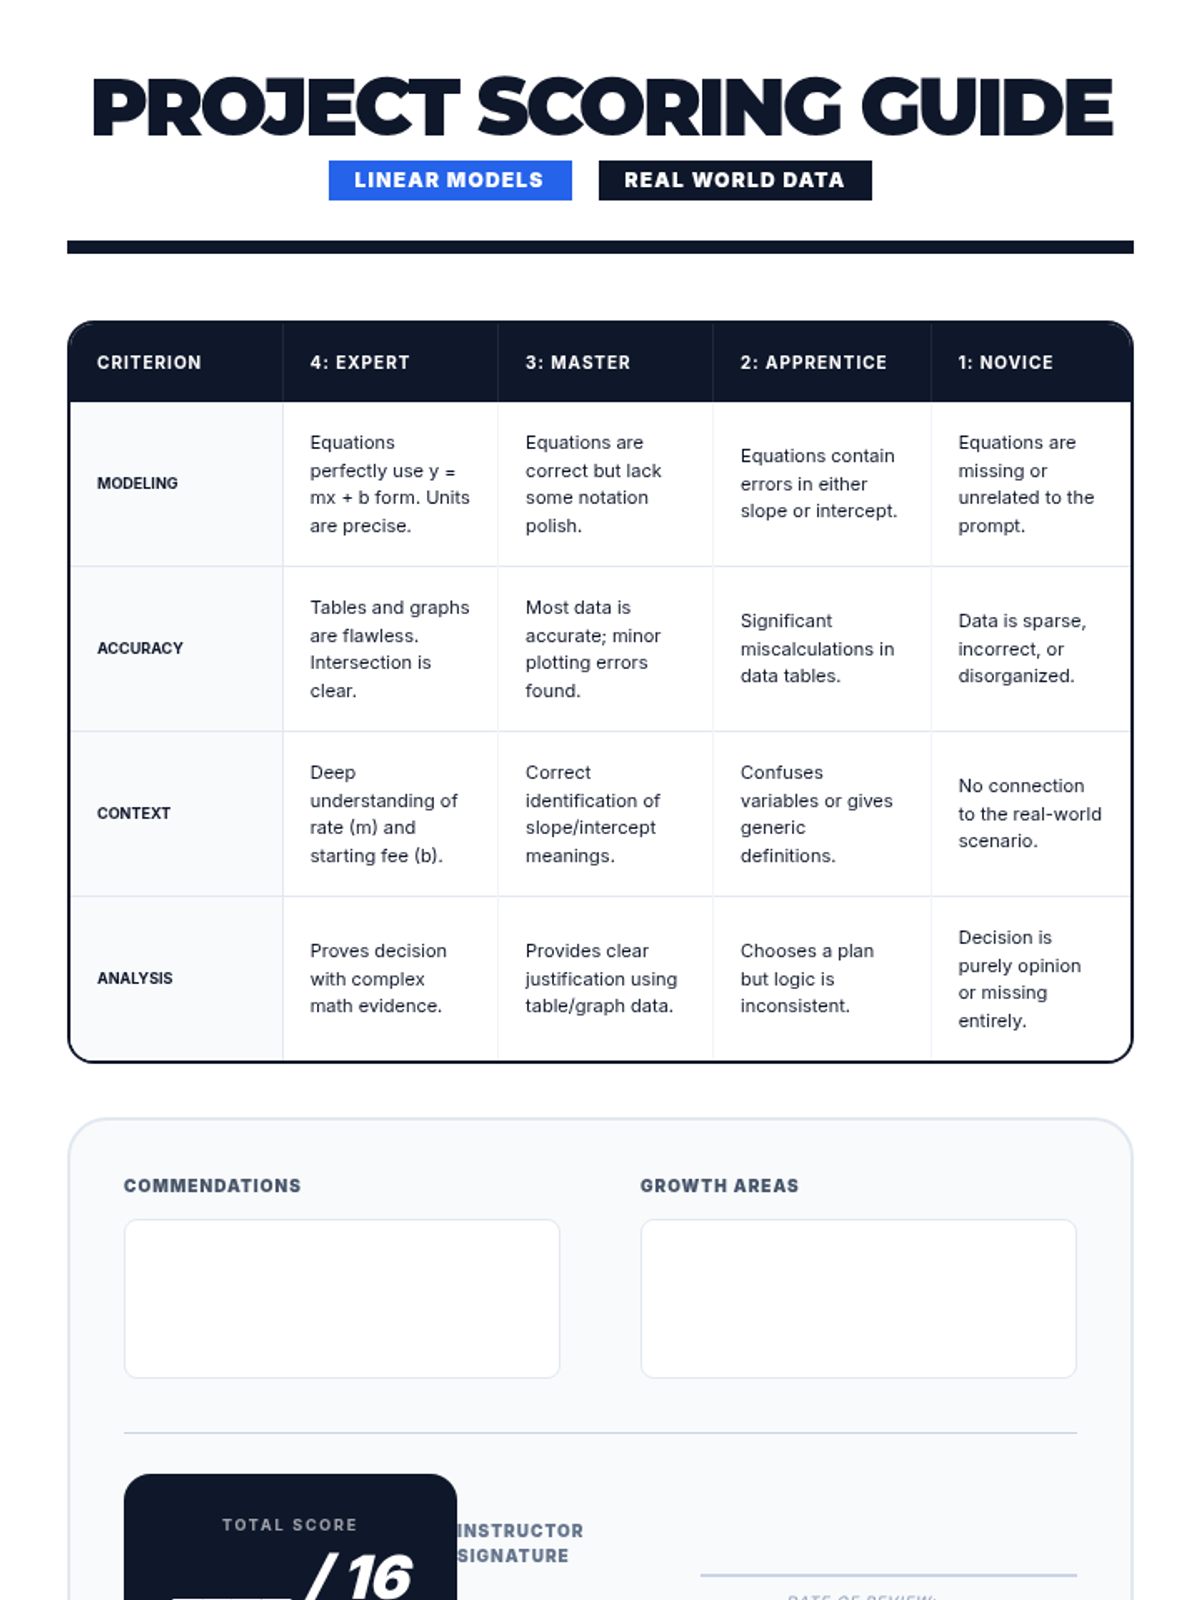
A real-world project exploring linear functions through cell phone plans and career earnings. Students analyze slope as a rate of change and the y-intercept as a starting value.
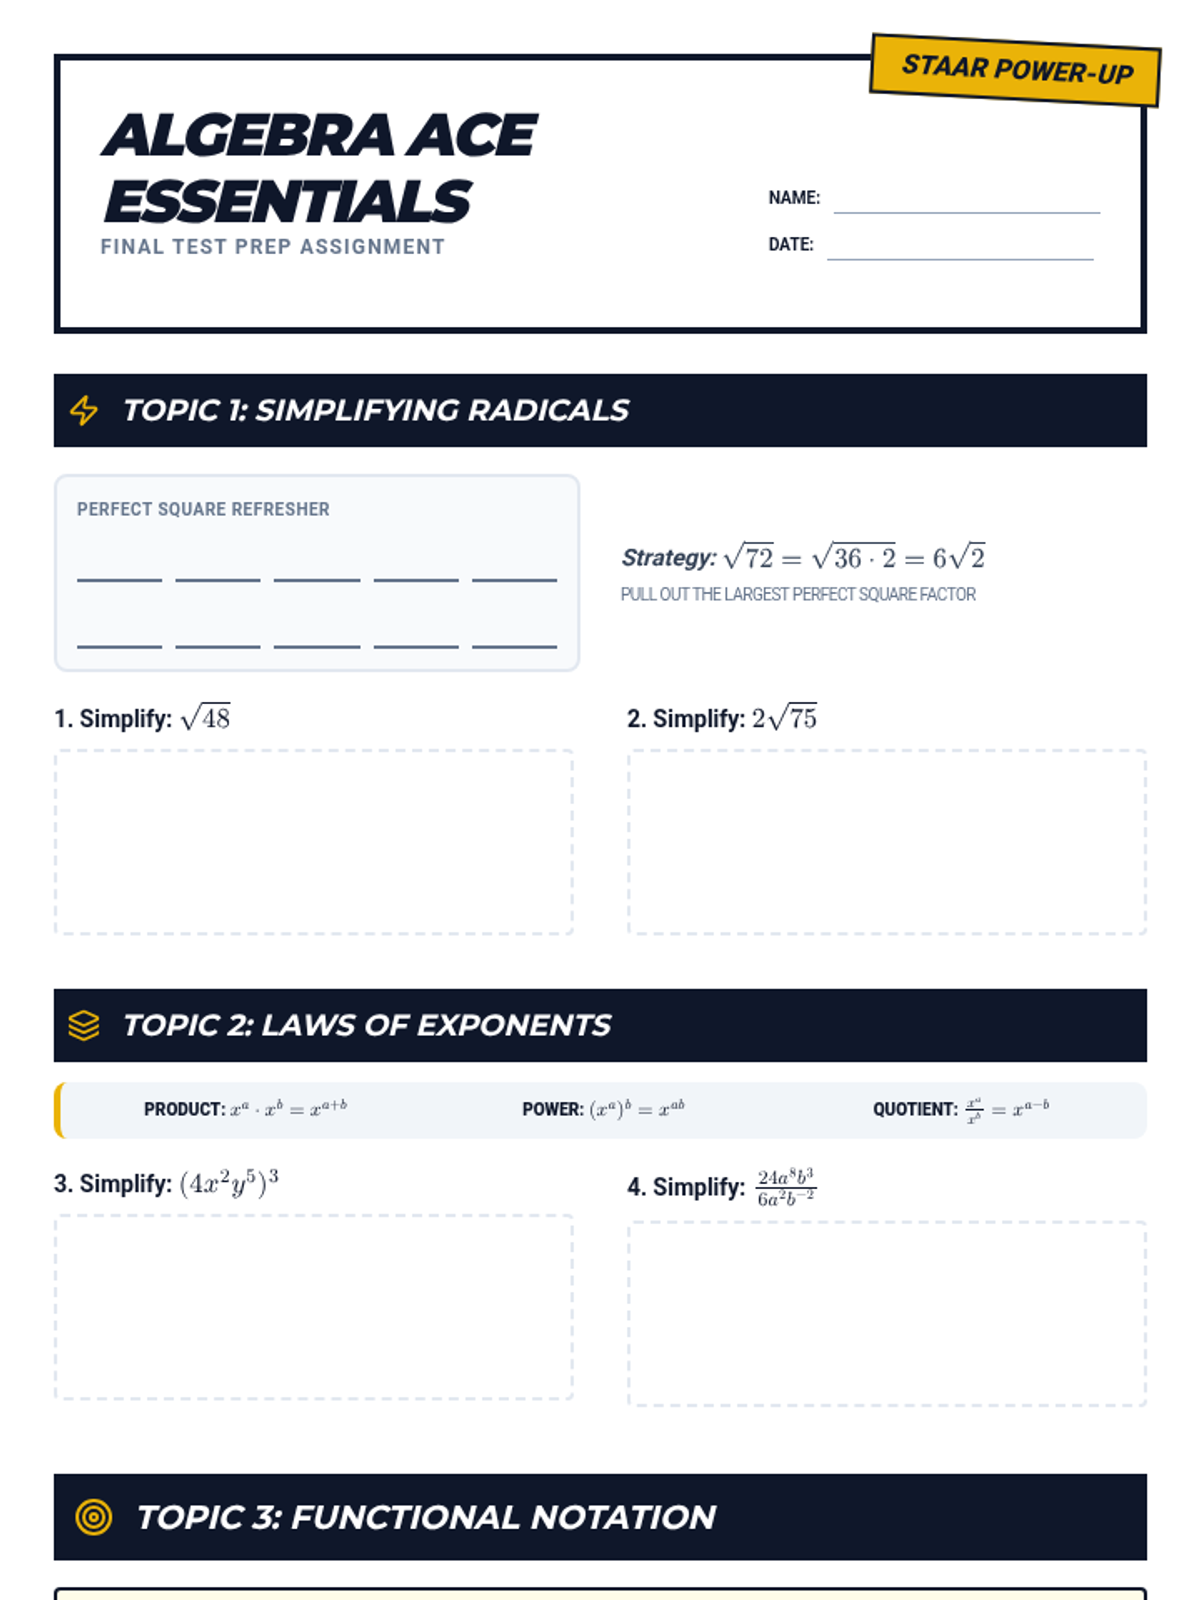
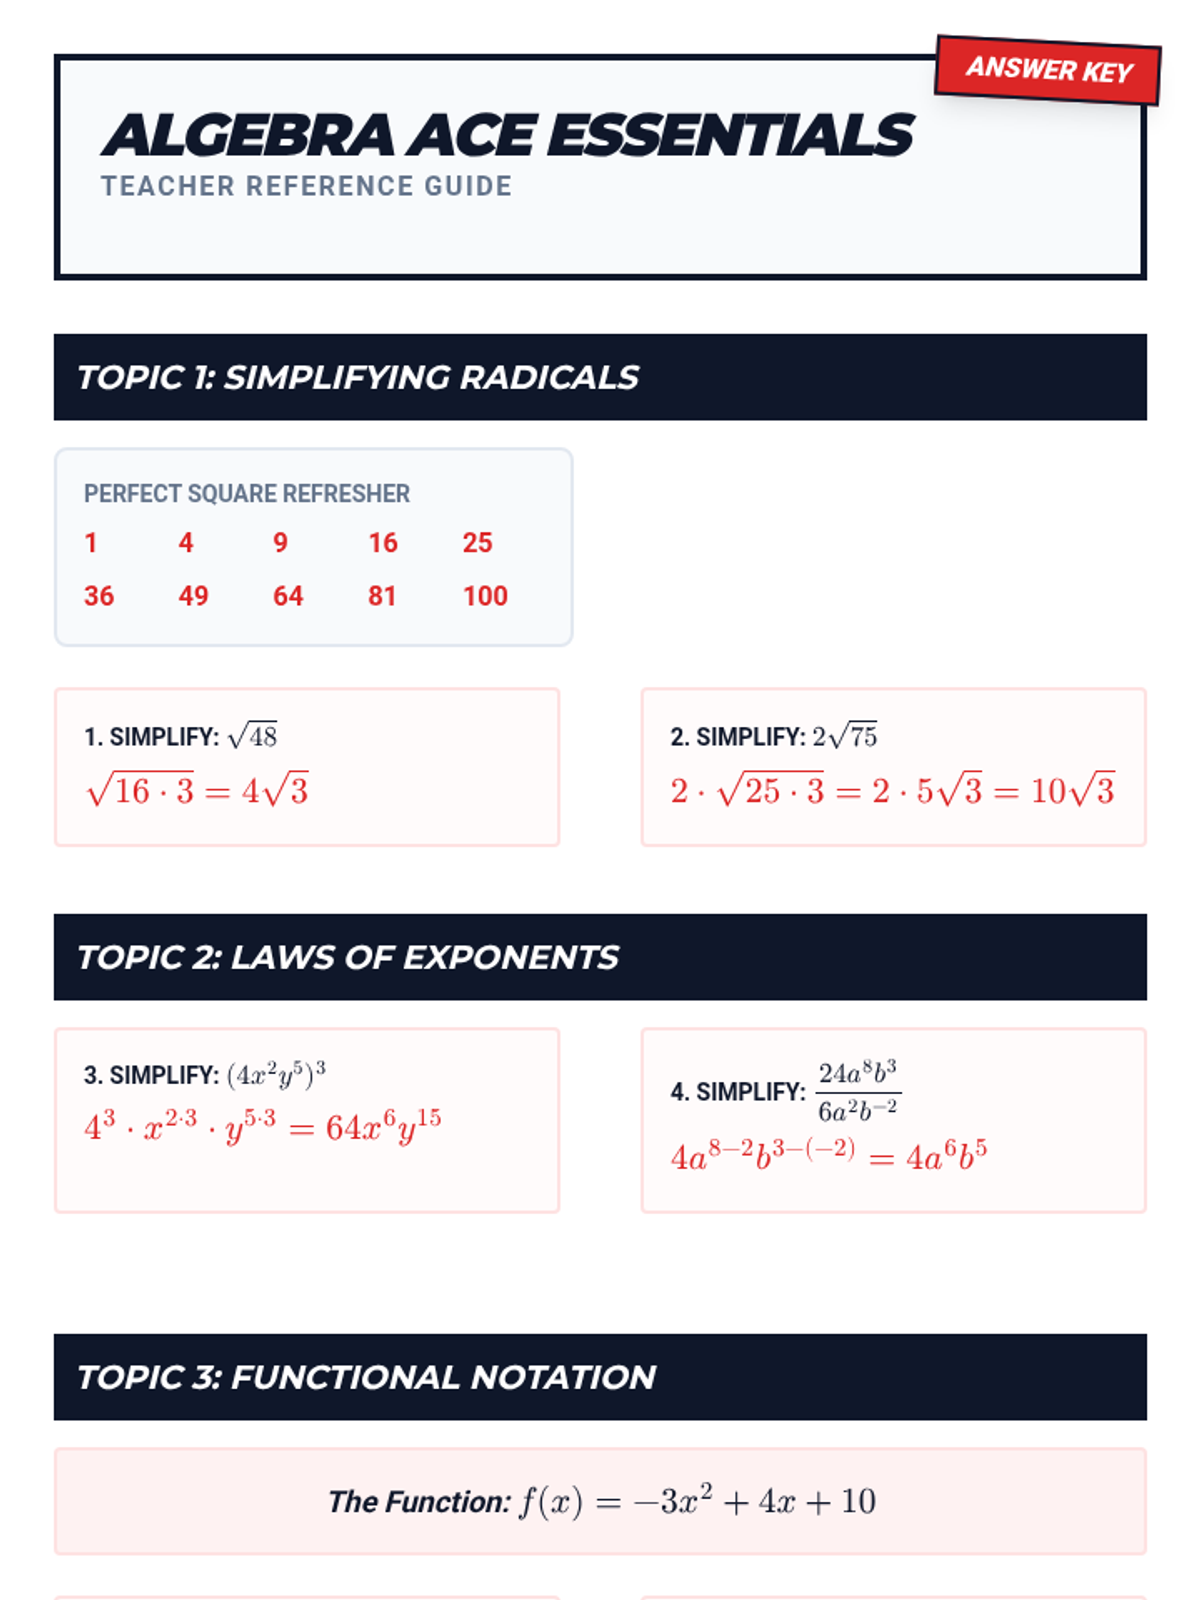
A comprehensive STAAR review lesson covering radicals, exponents, functions, and data modeling designed for high-impact Algebra 1 test prep.
A comprehensive practice module for high school Algebra 1 students focusing on slope, point-slope form, and slope-intercept form. Designed with scaffolding and visual aids specifically for special education support.
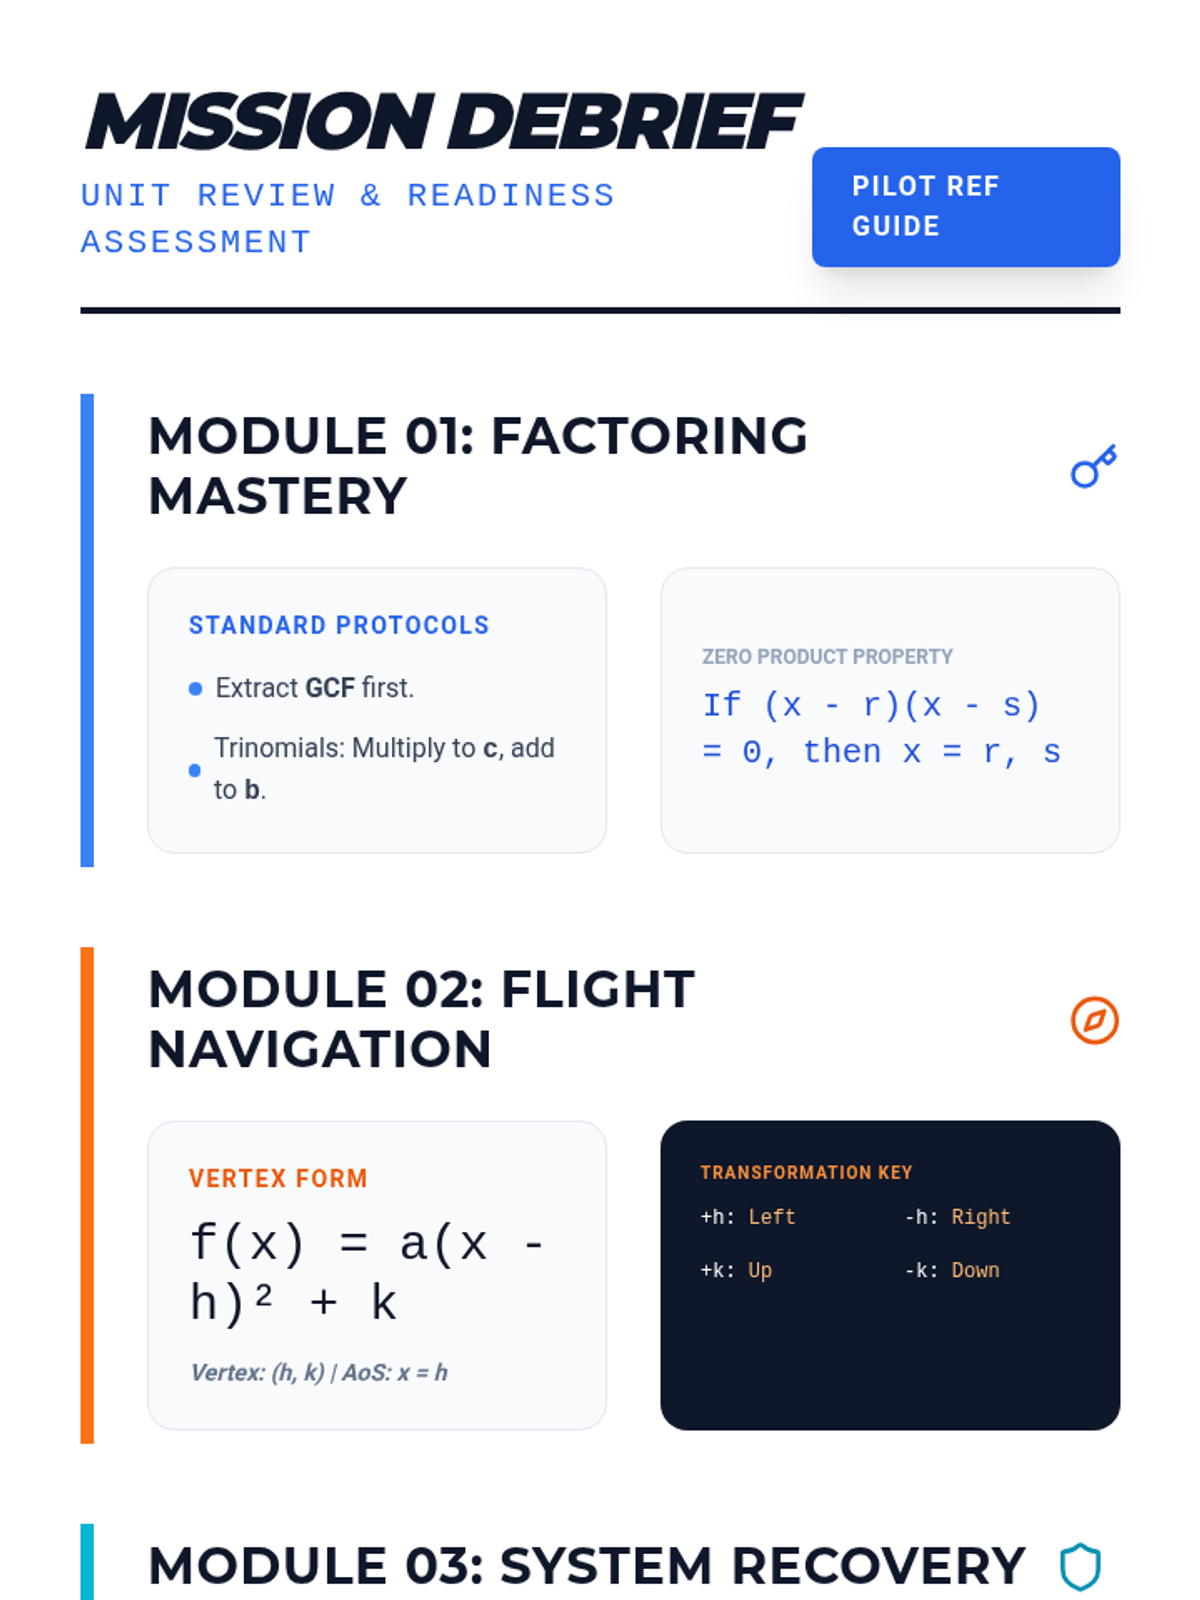
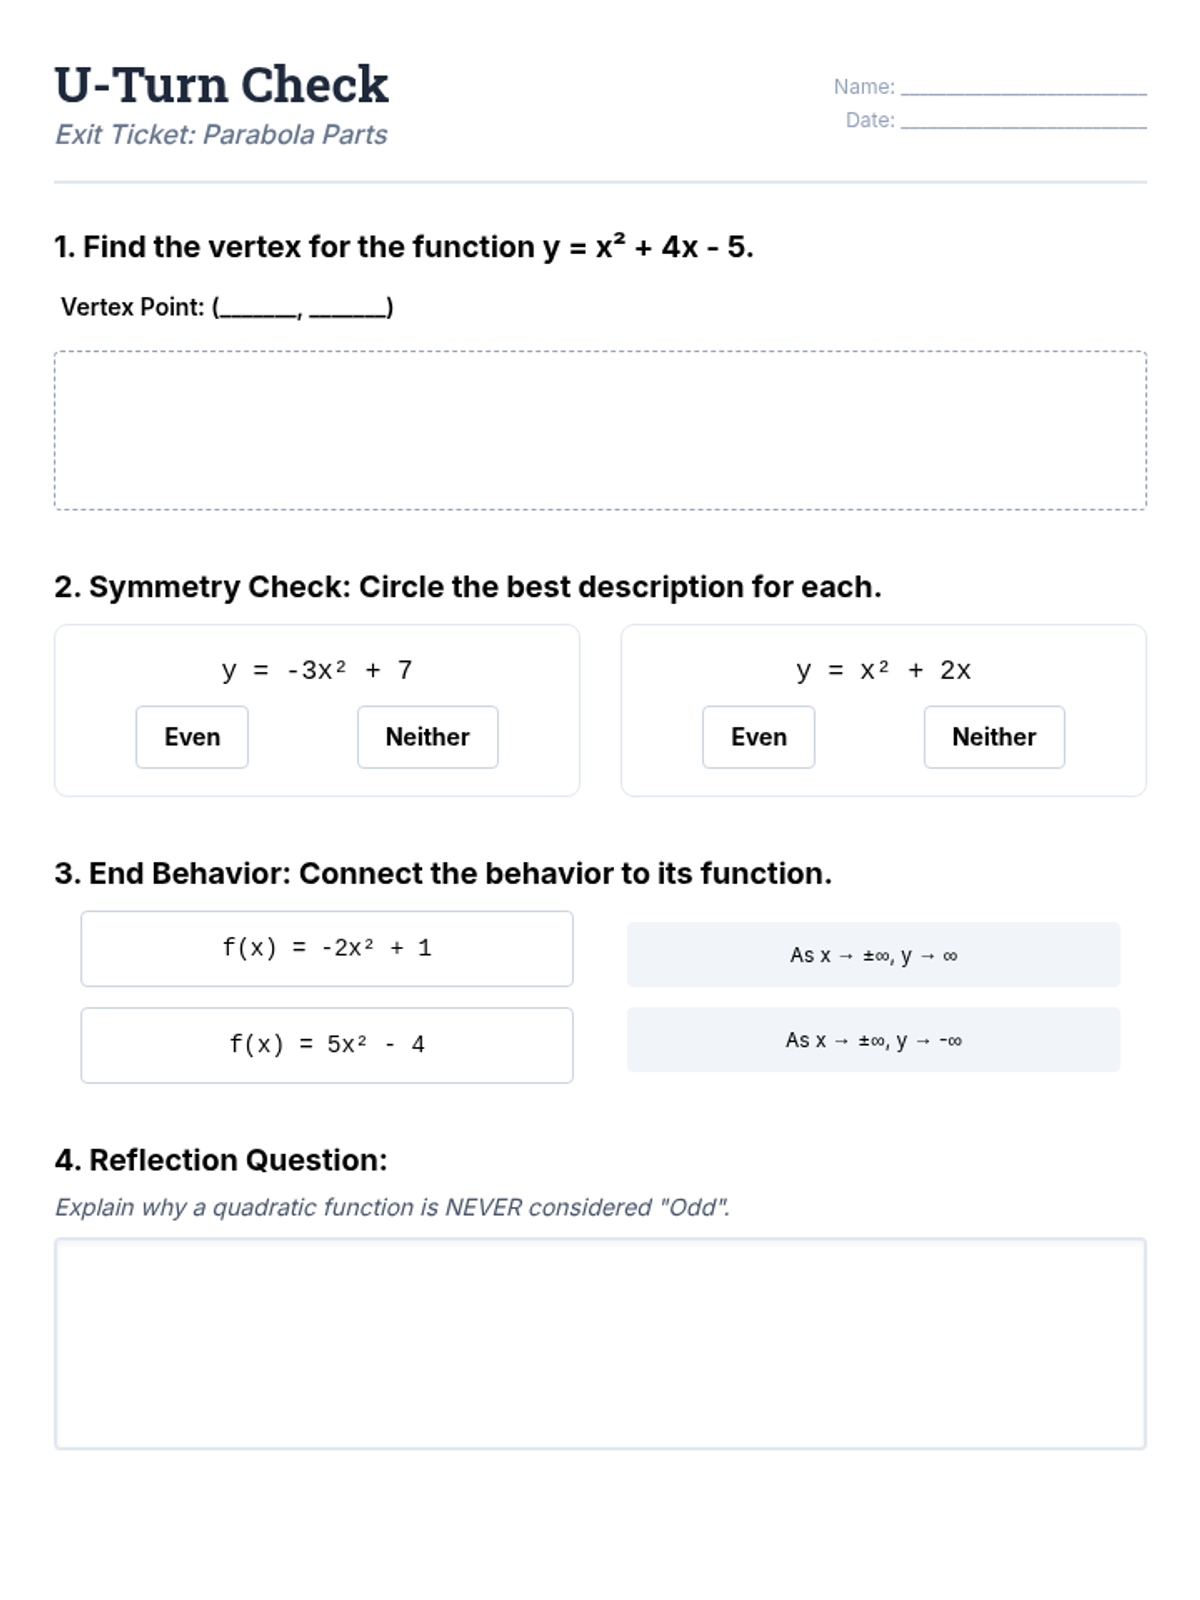
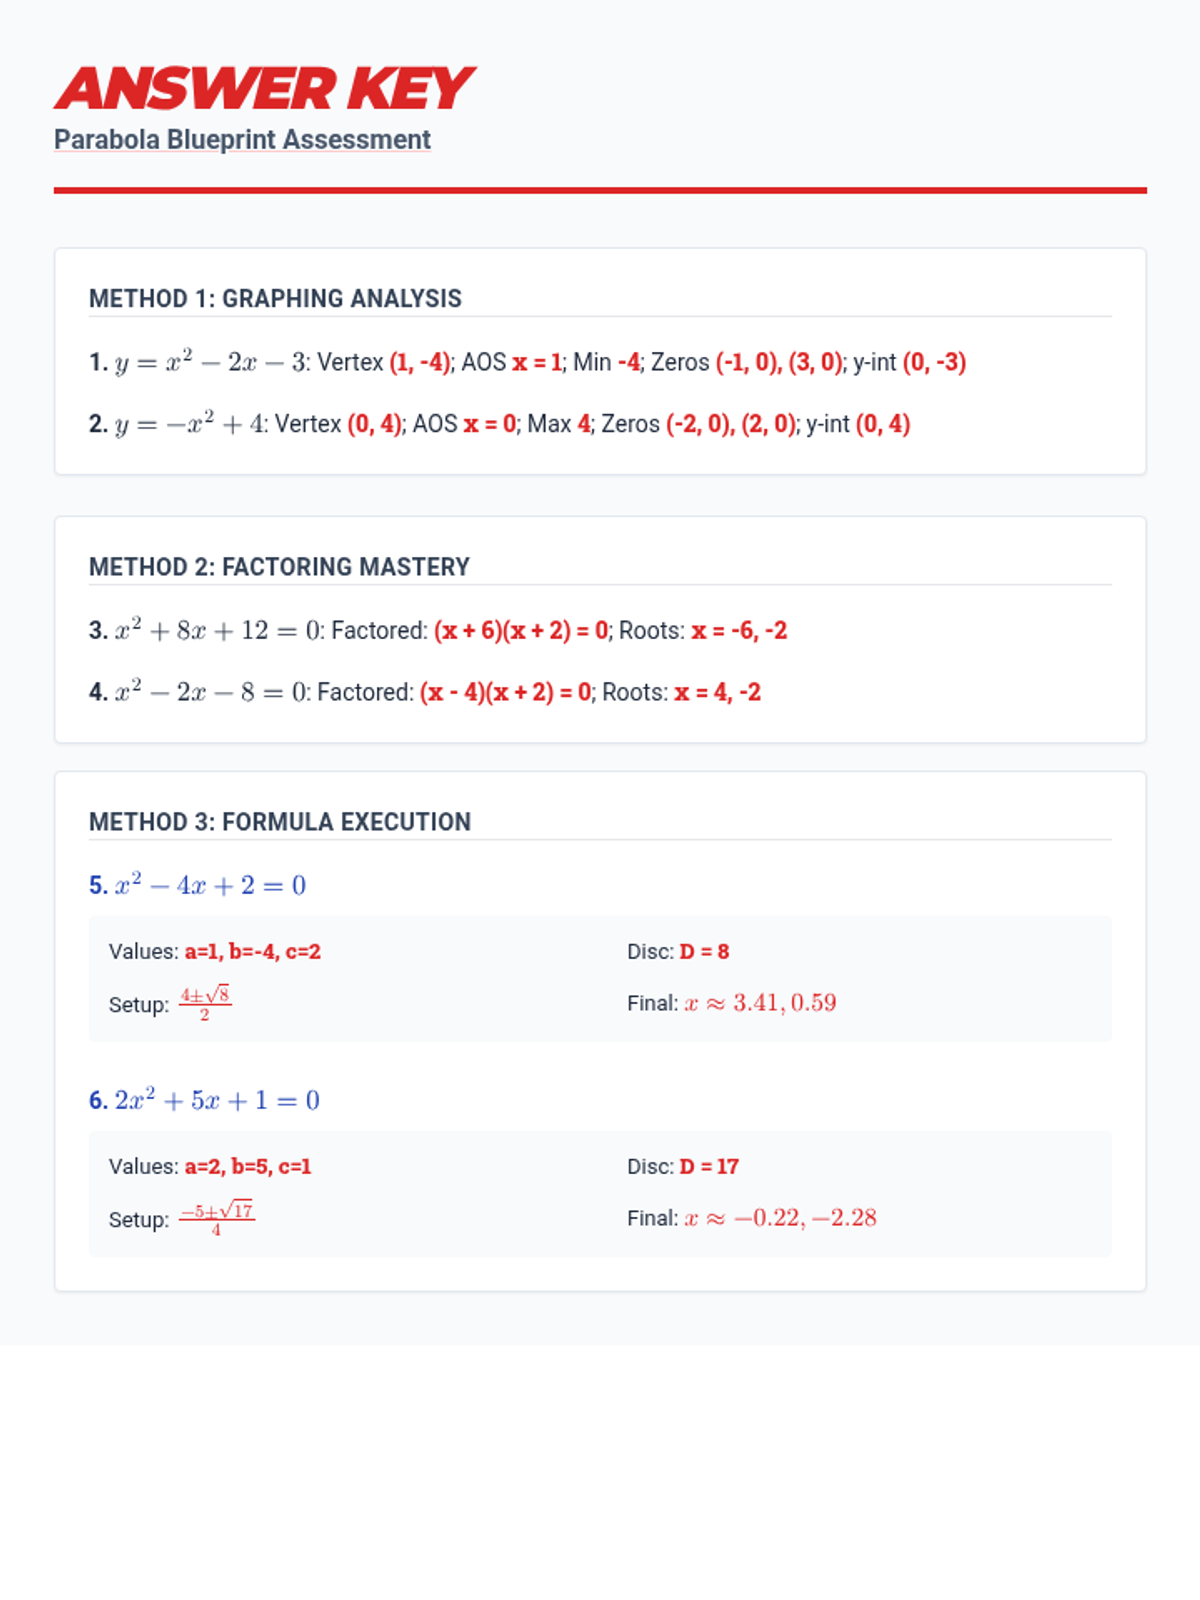
Final mission debrief including a comprehensive review and a summative assessment of quadratic mastery.
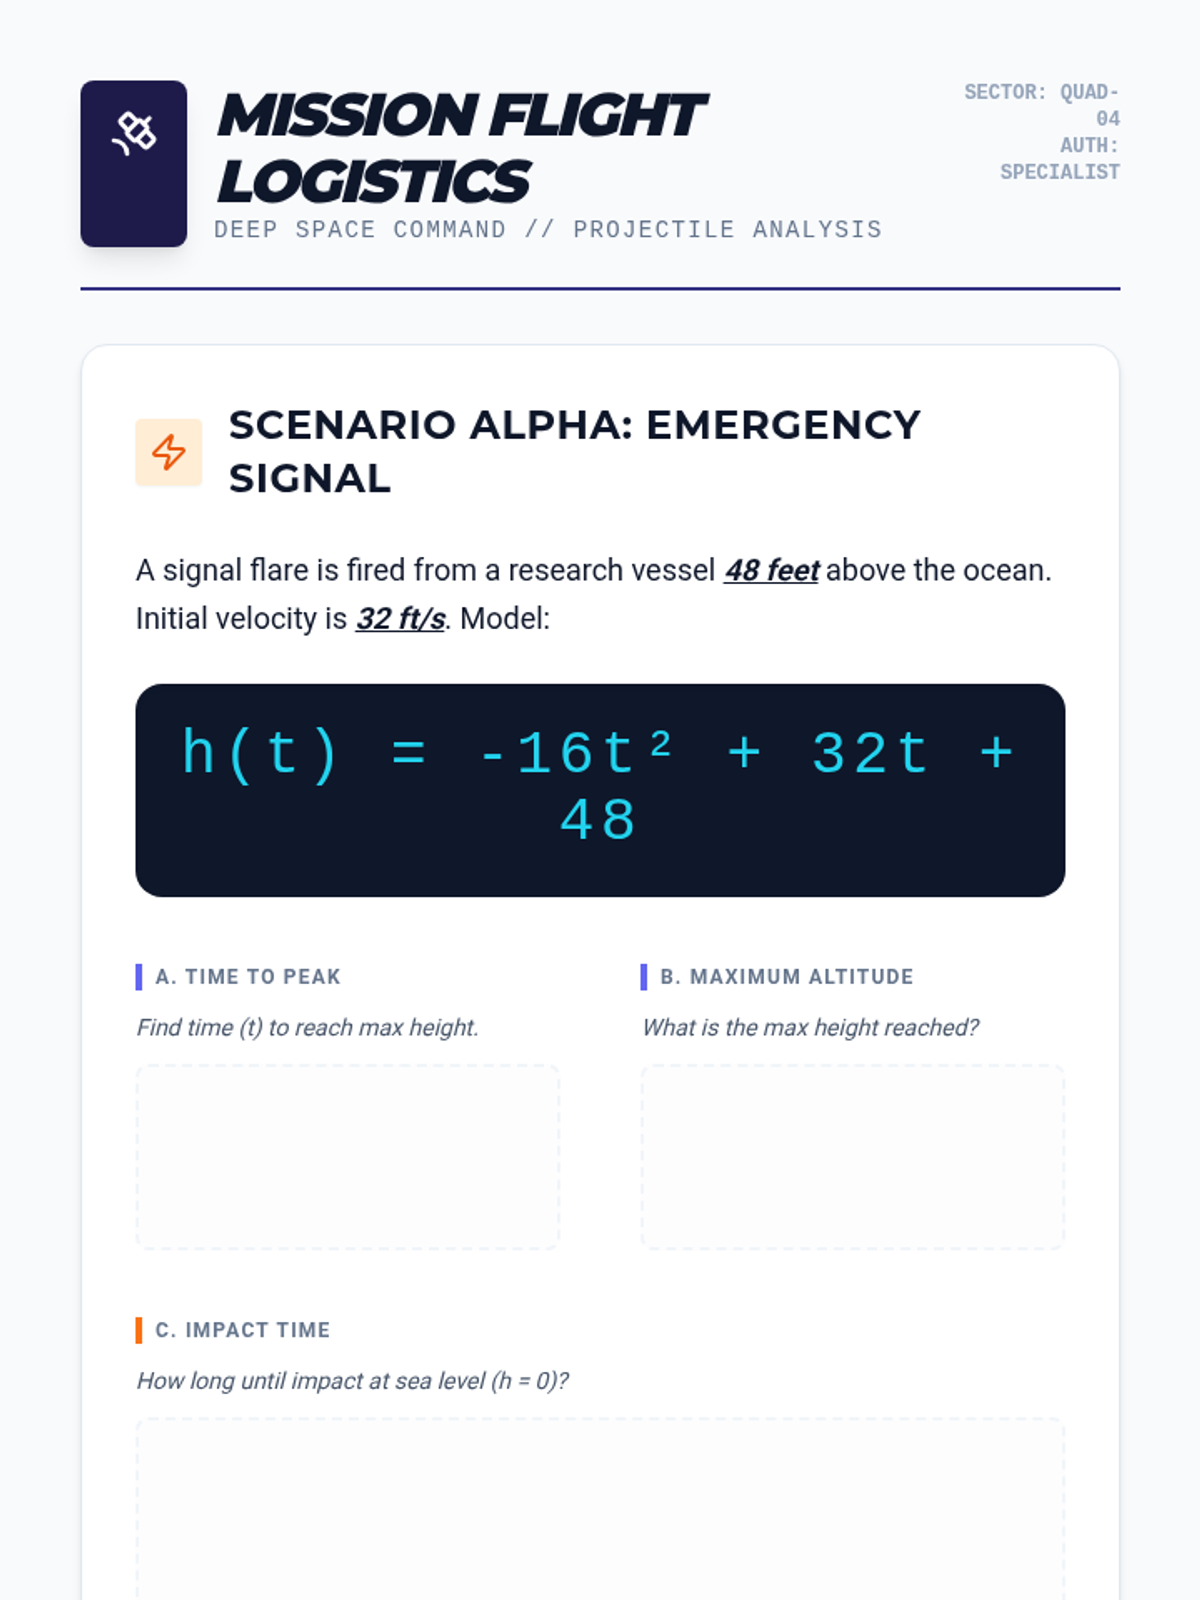
Applying quadratic models to real-world projectile motion, calculating maximum height, flight time, and landing coordinates.
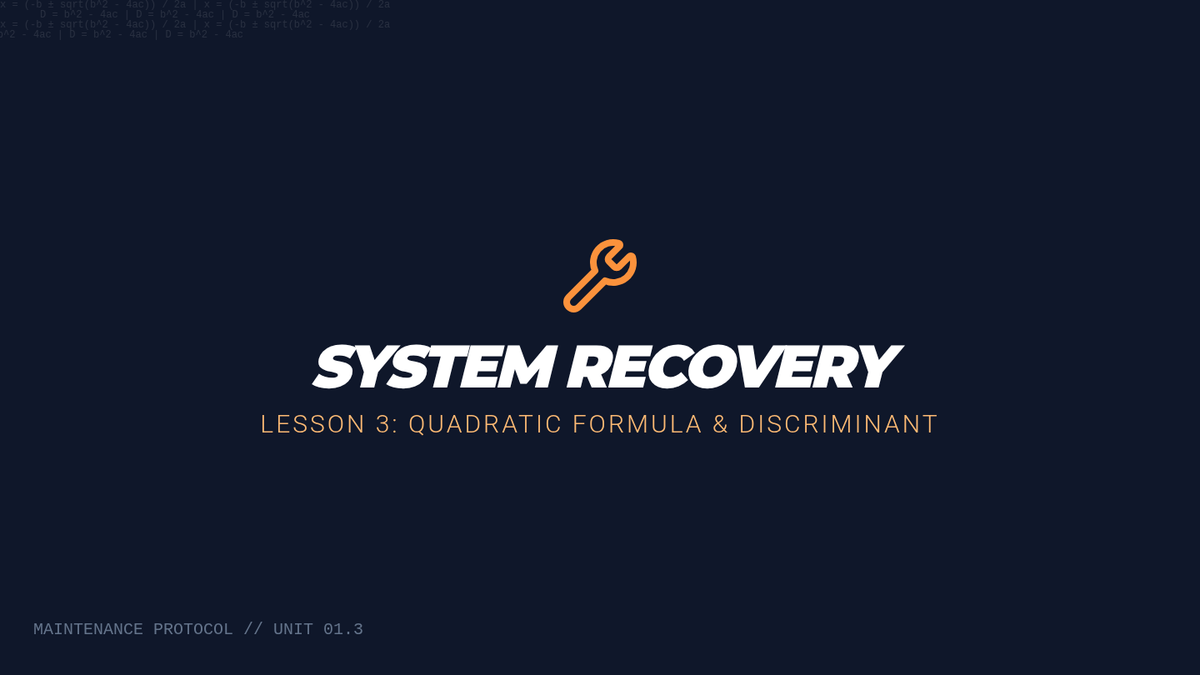
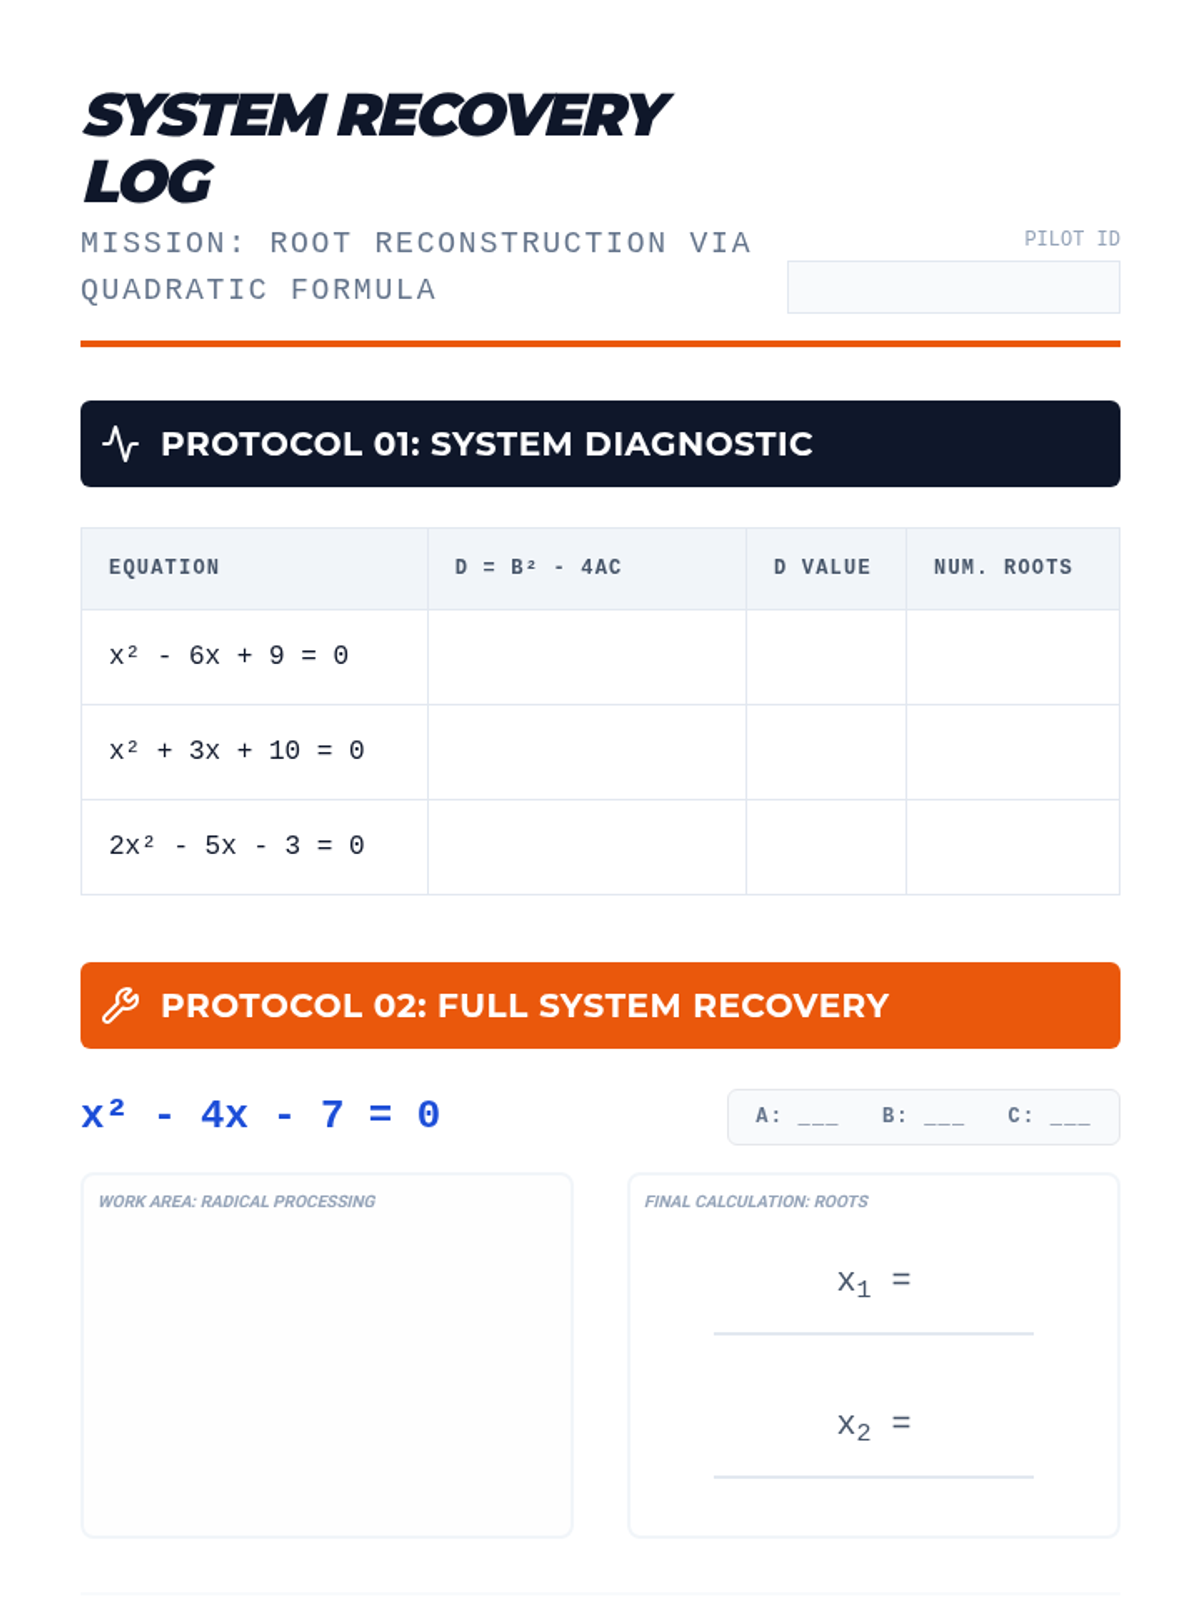
Using the Quadratic Formula and Discriminant as a universal system recovery tool to solve any quadratic equation.
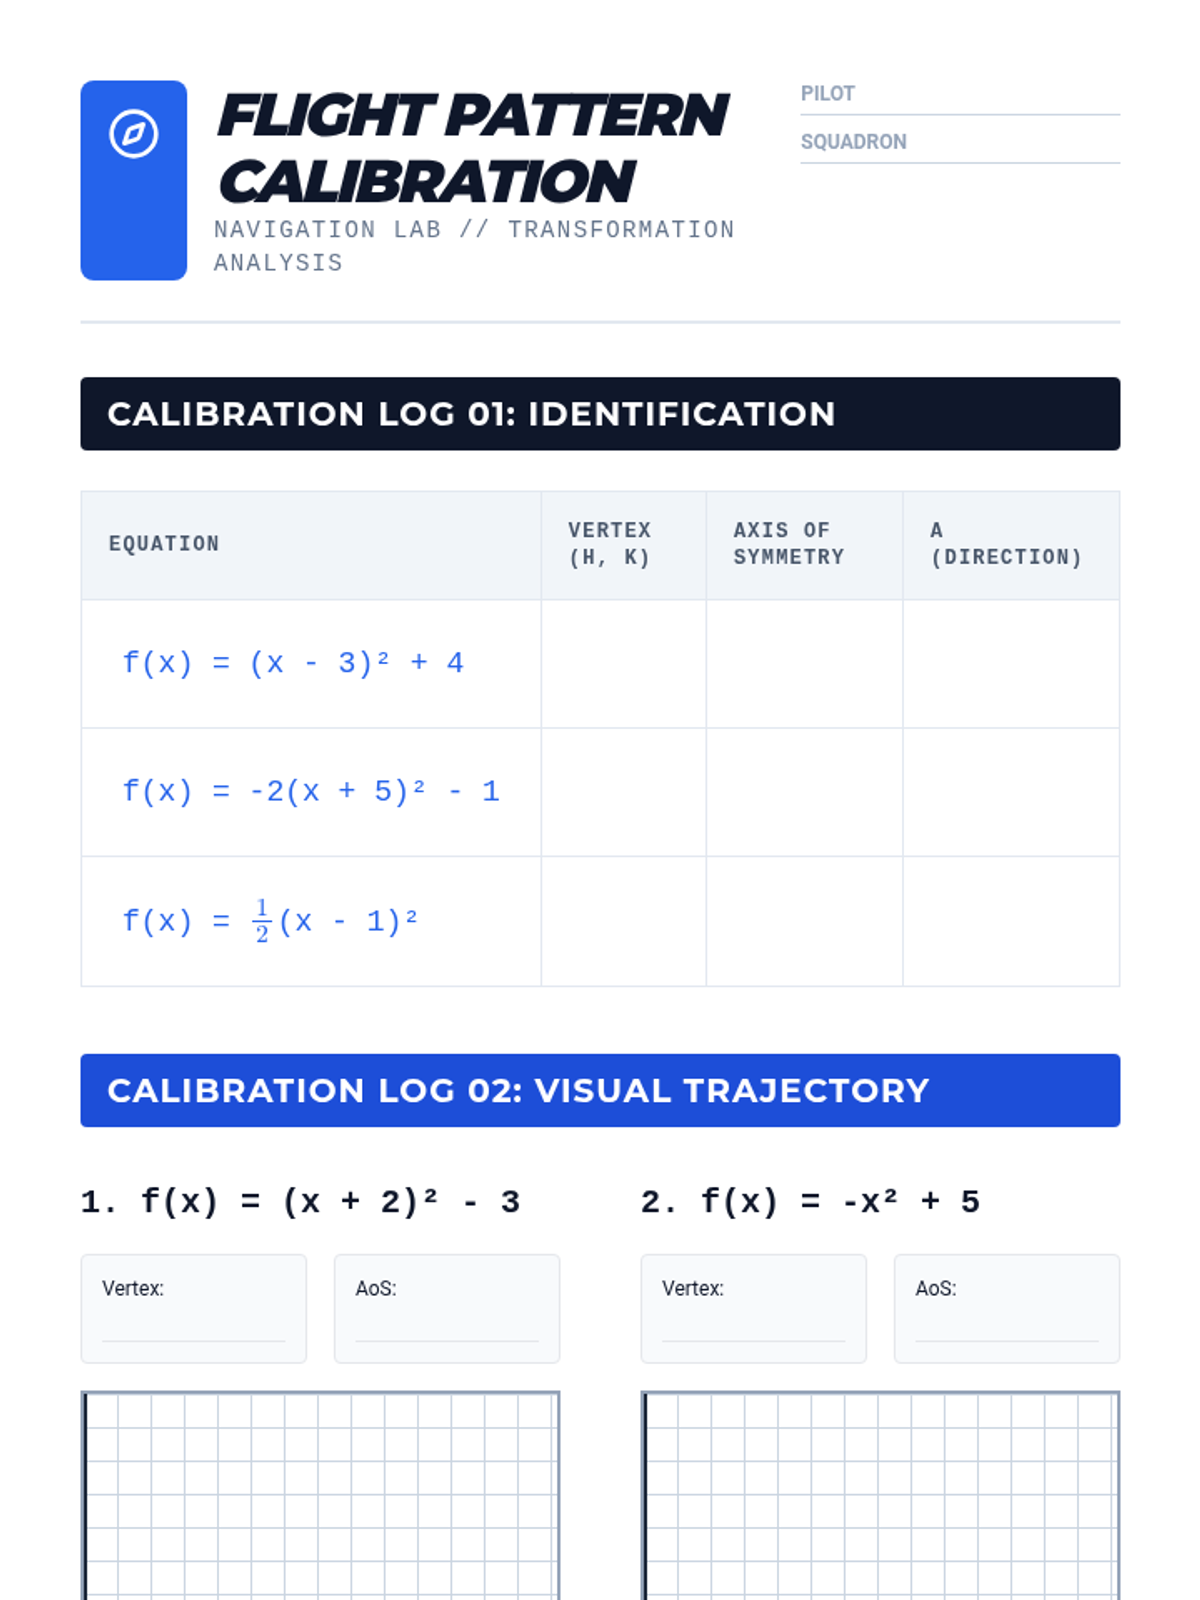
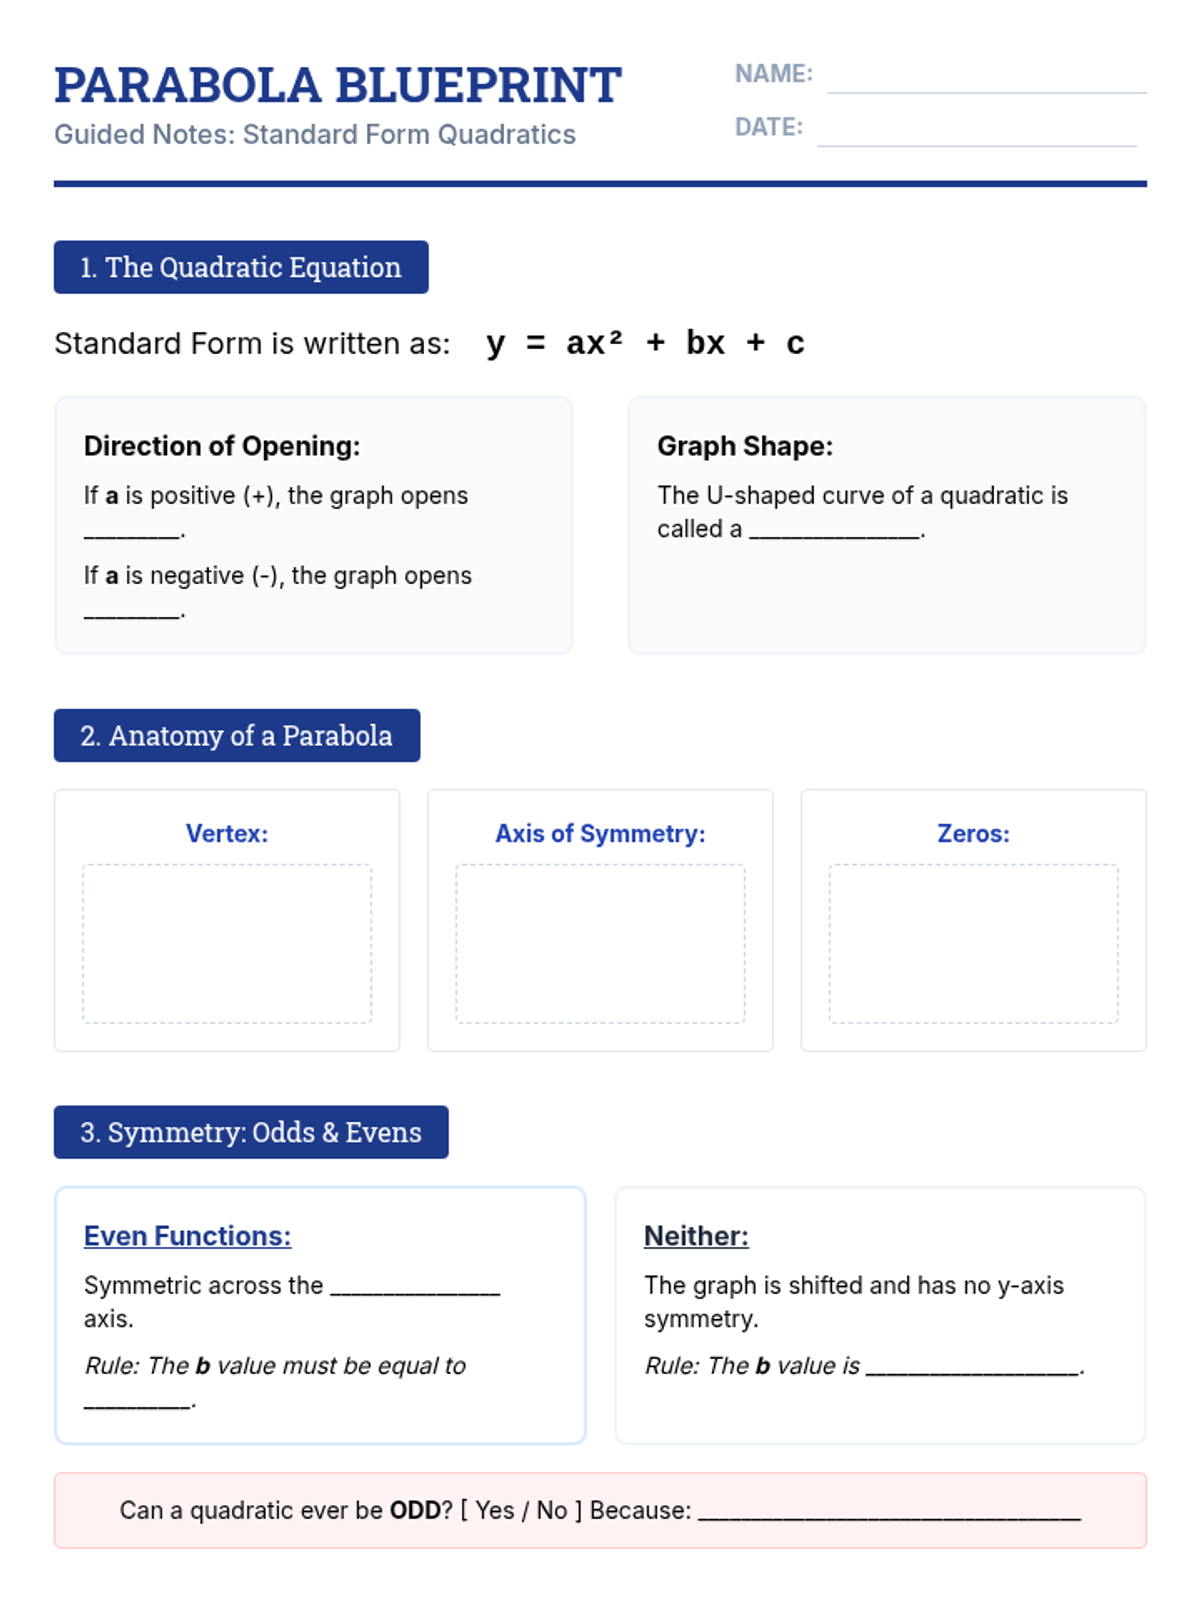
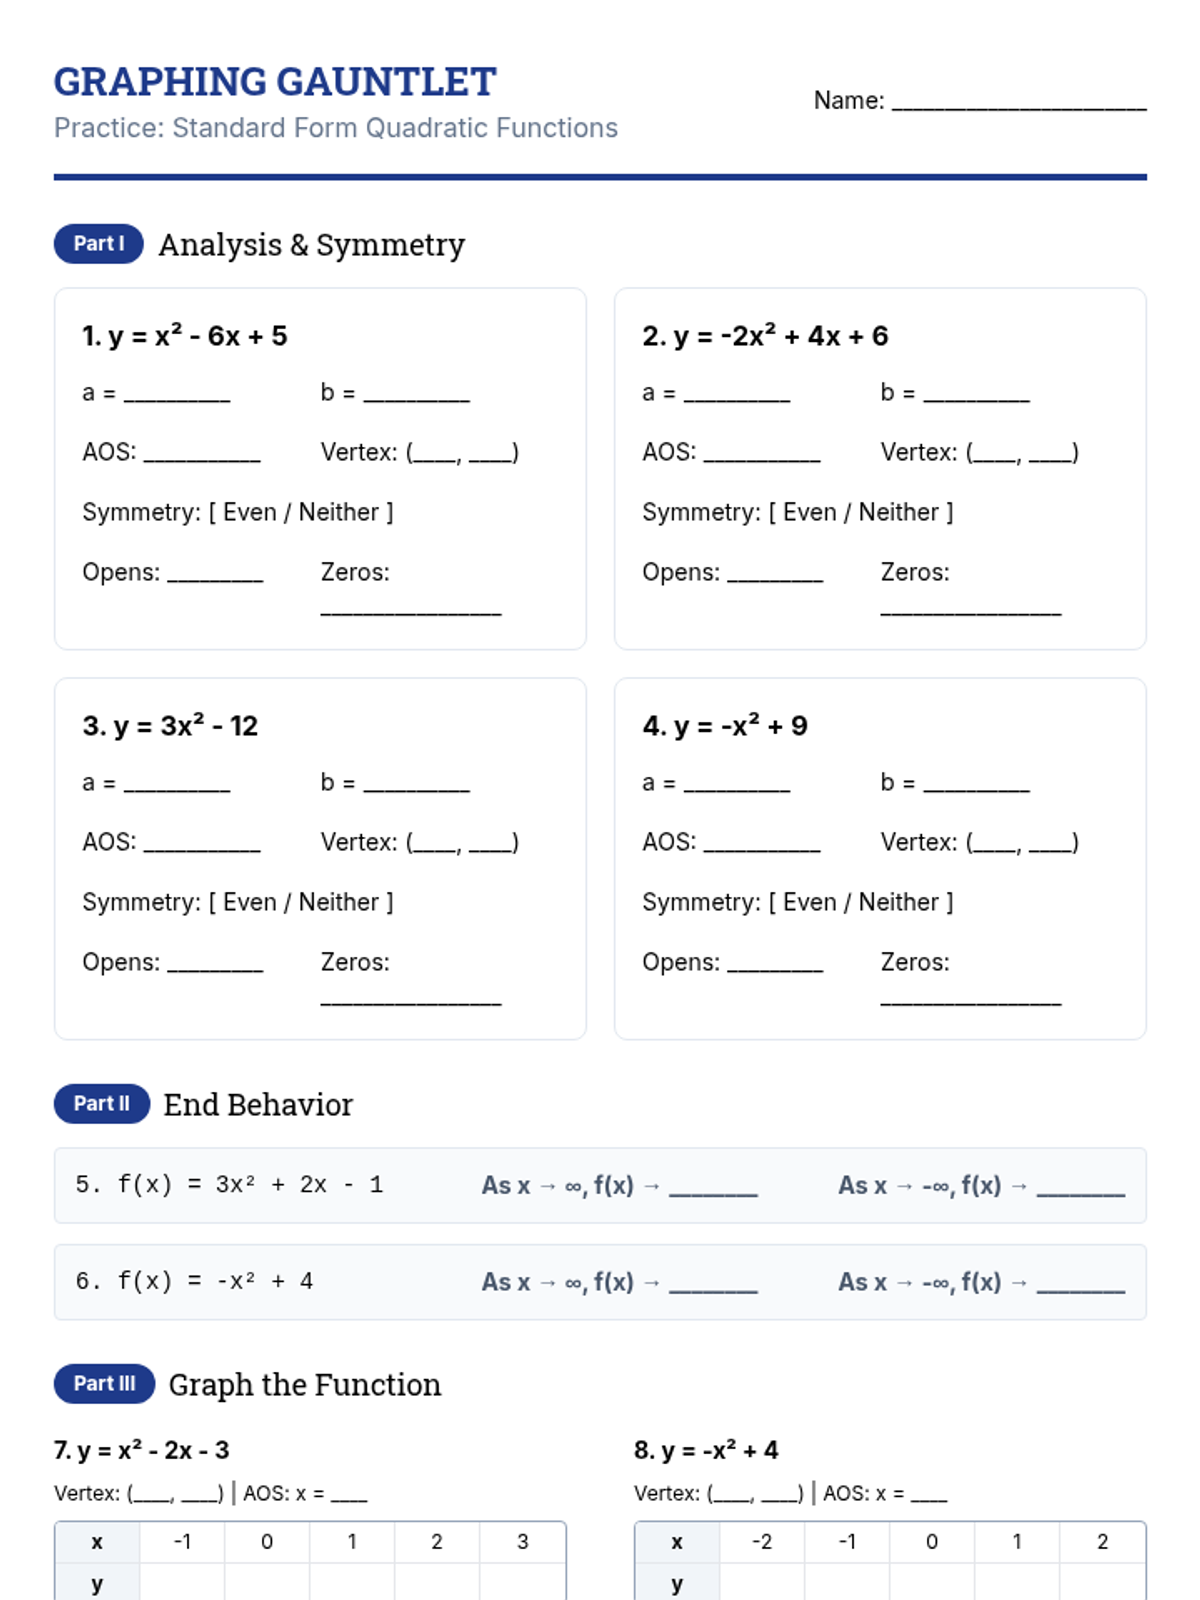
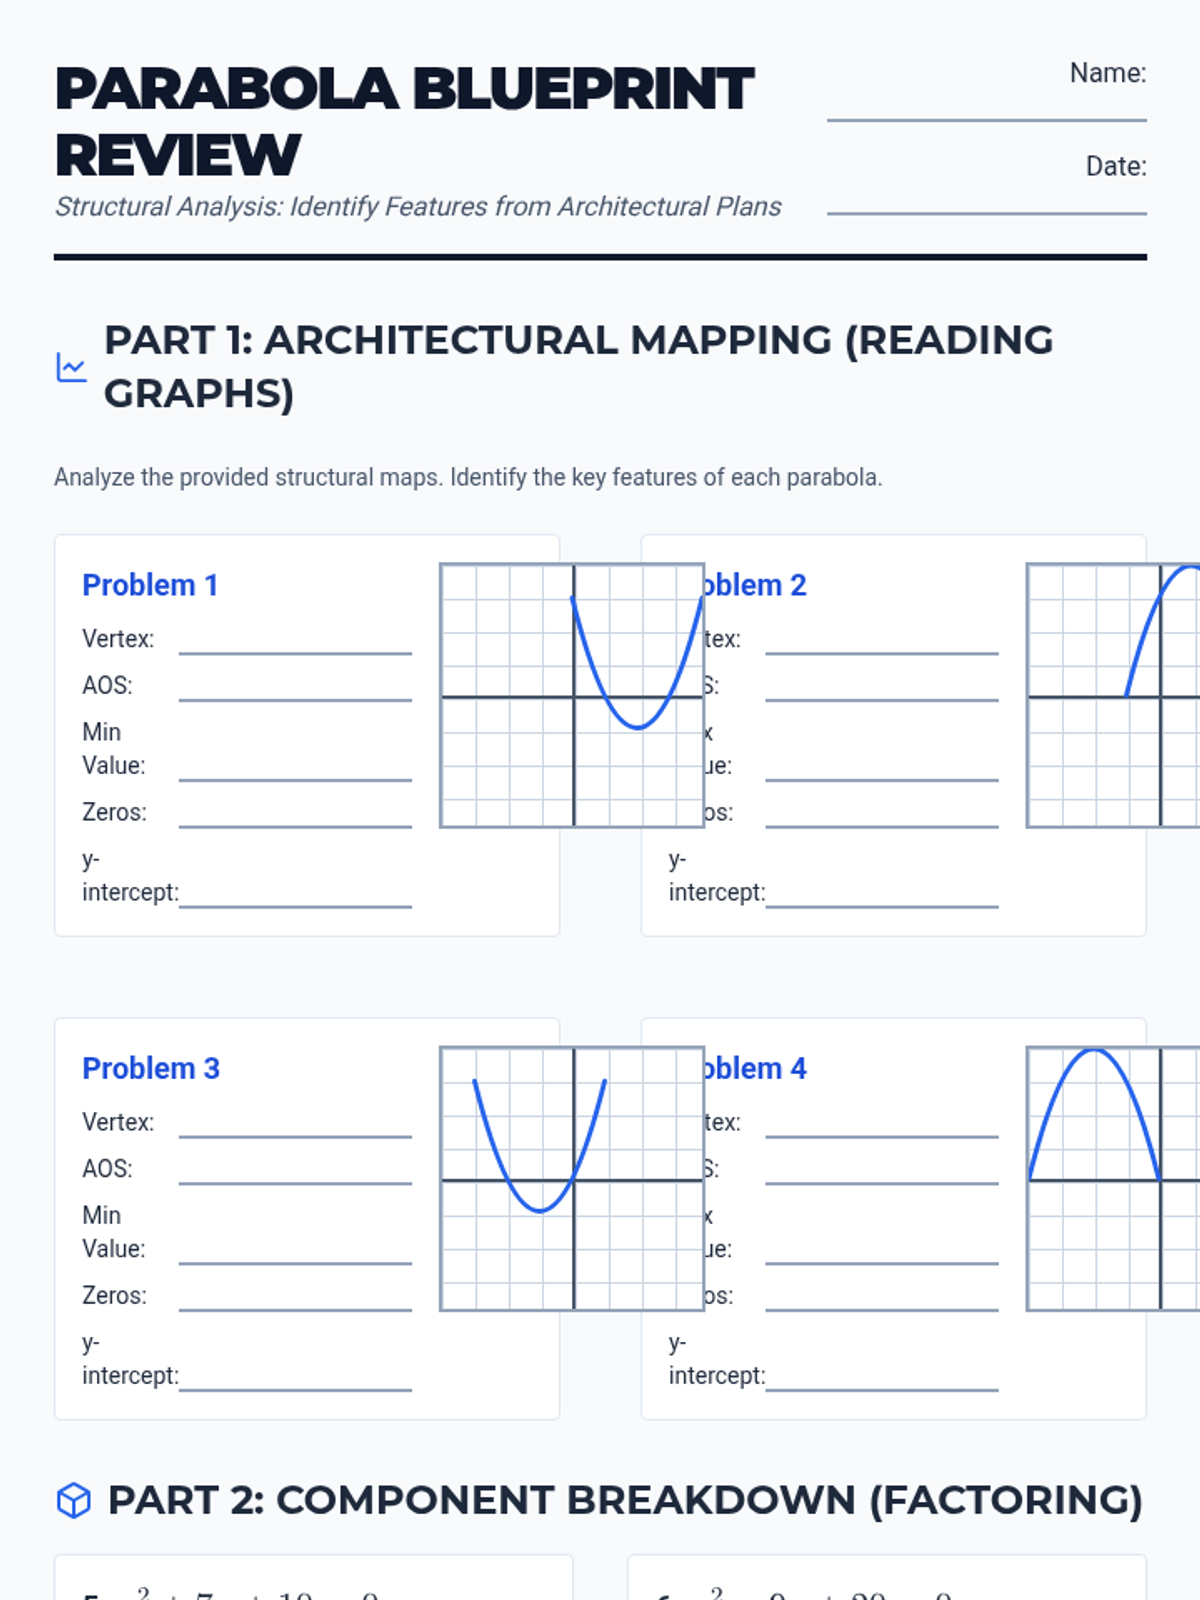
Exploring how transformations affect the flight path of a parabola and learning to graph from vertex and standard forms.
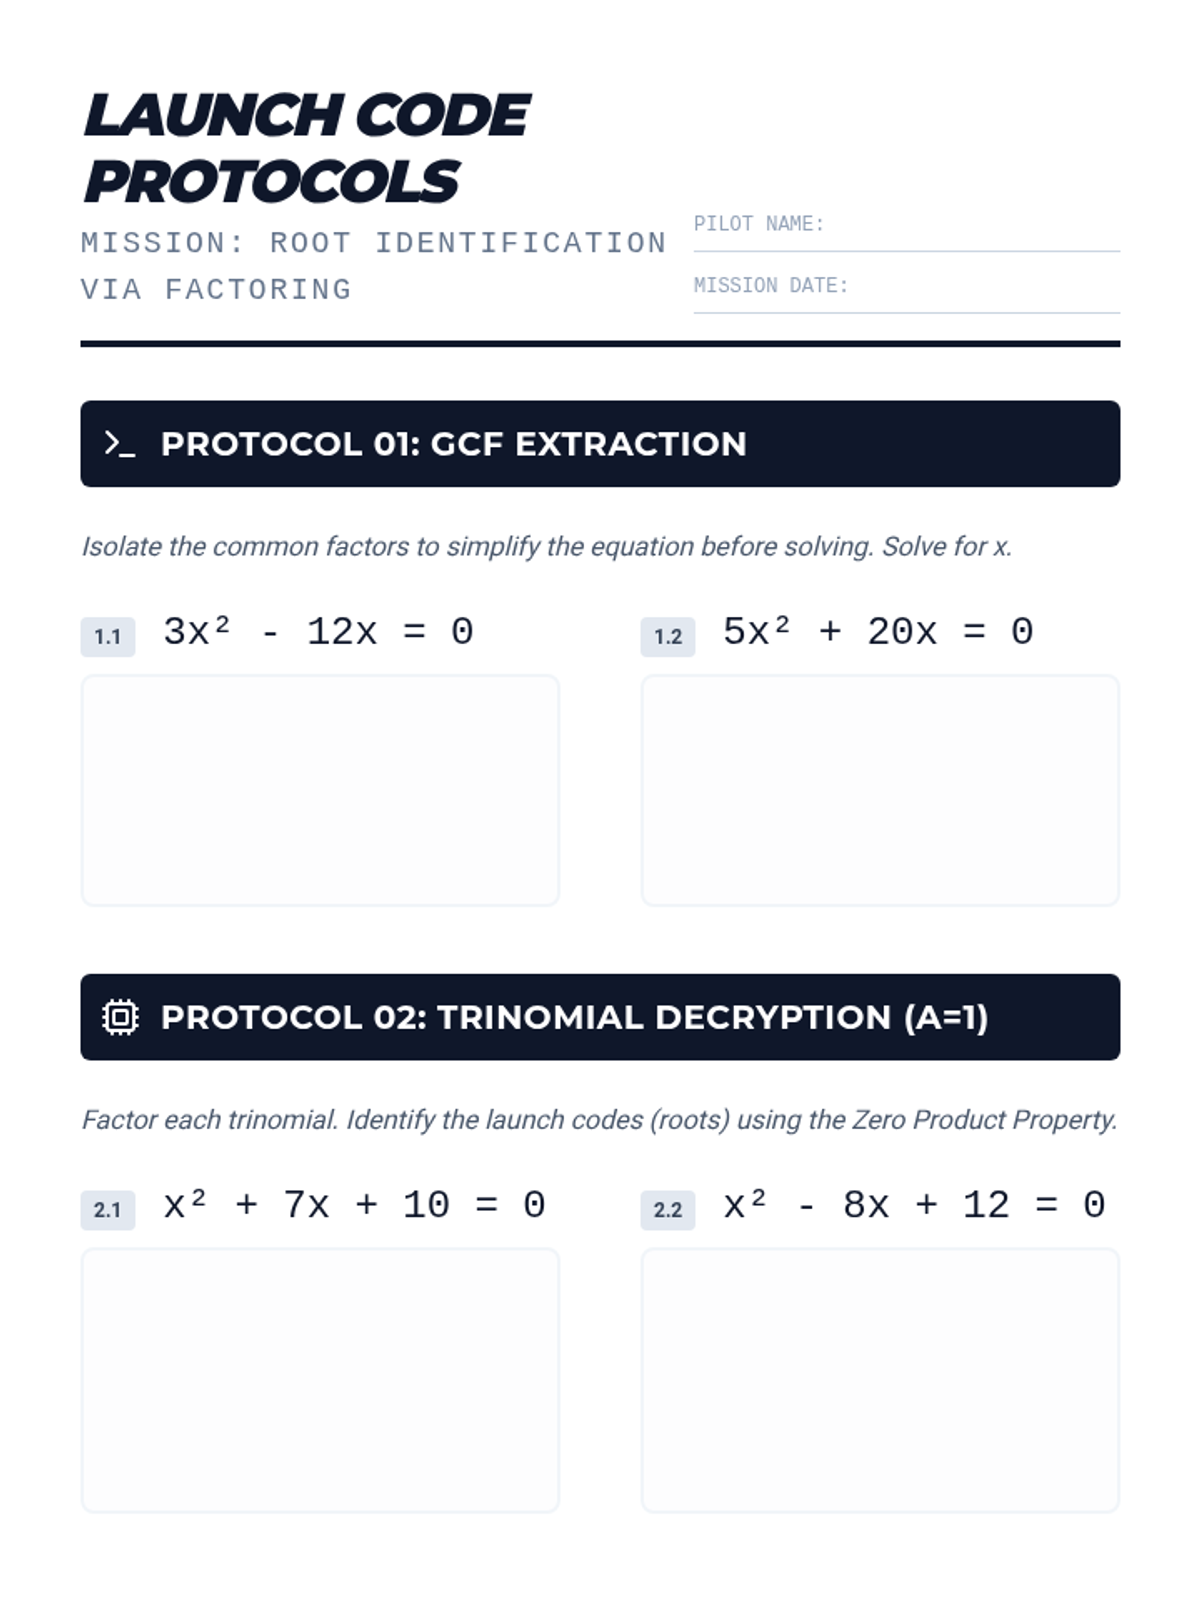
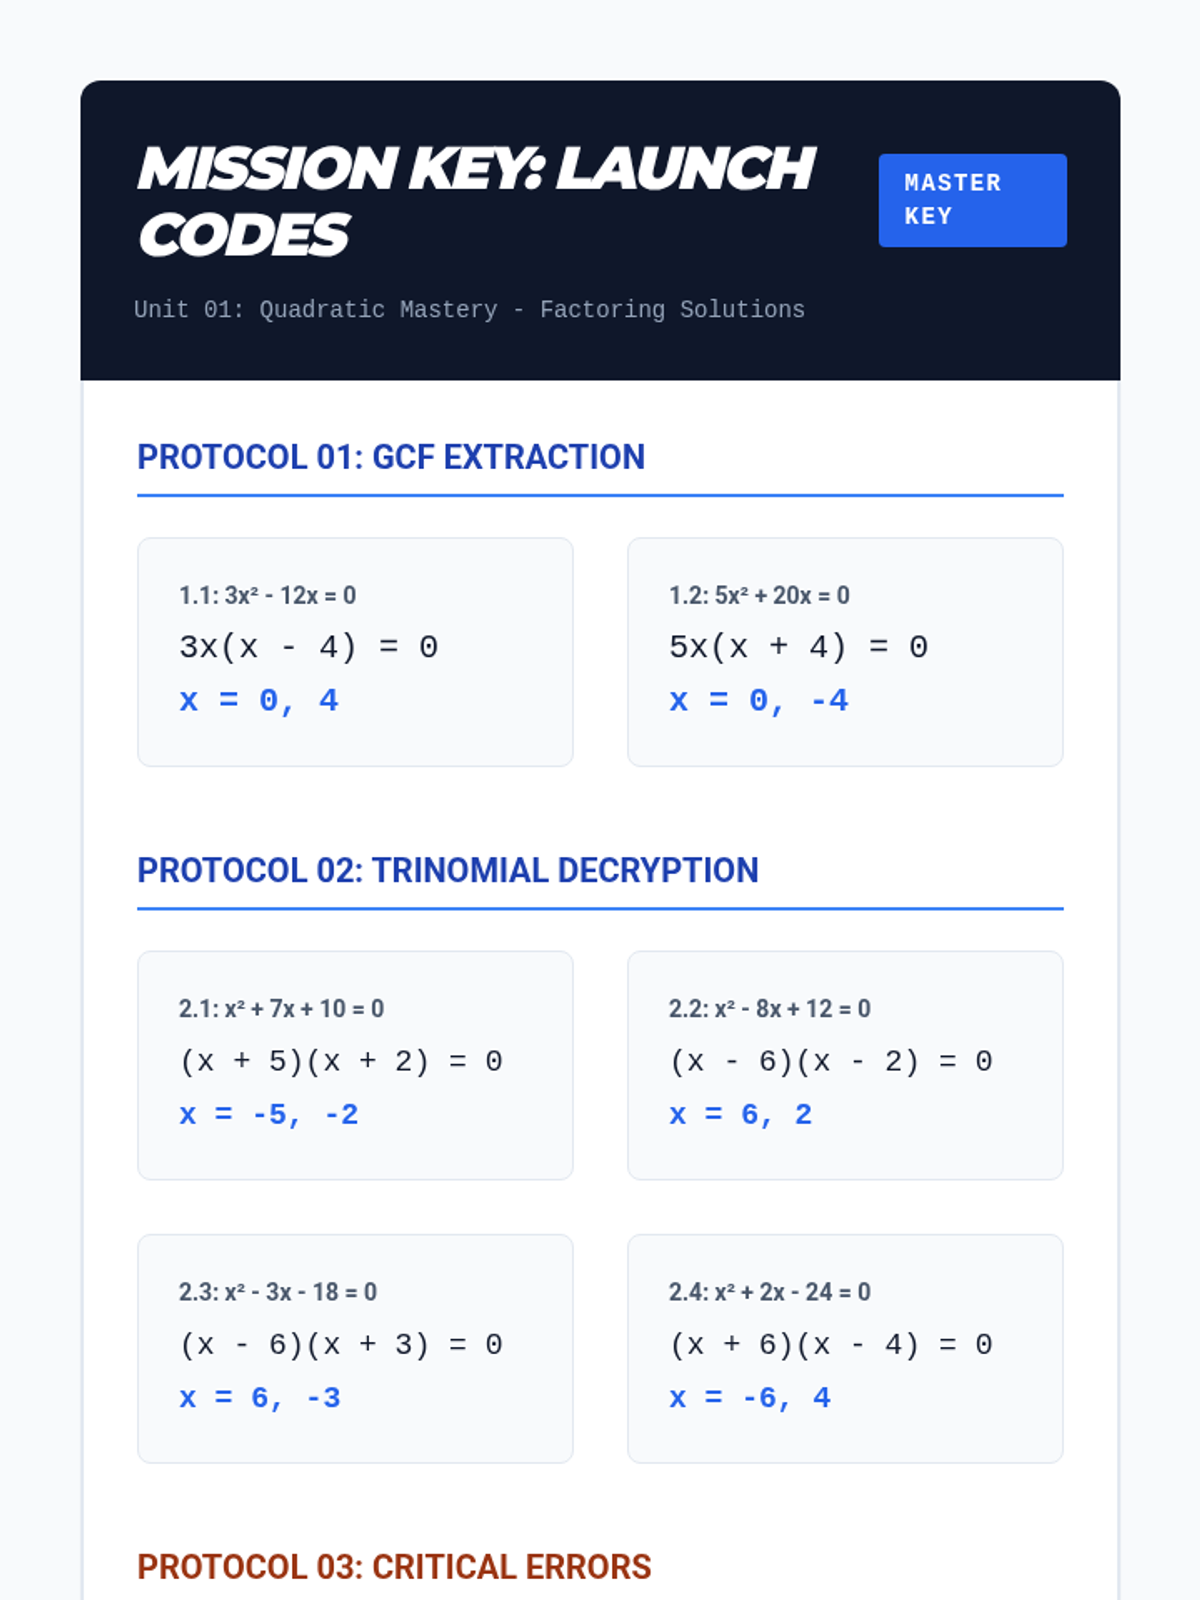
Mastering the art of factoring trinomials and using the Zero Product Property to find the 'launch codes' (roots) of quadratic equations.
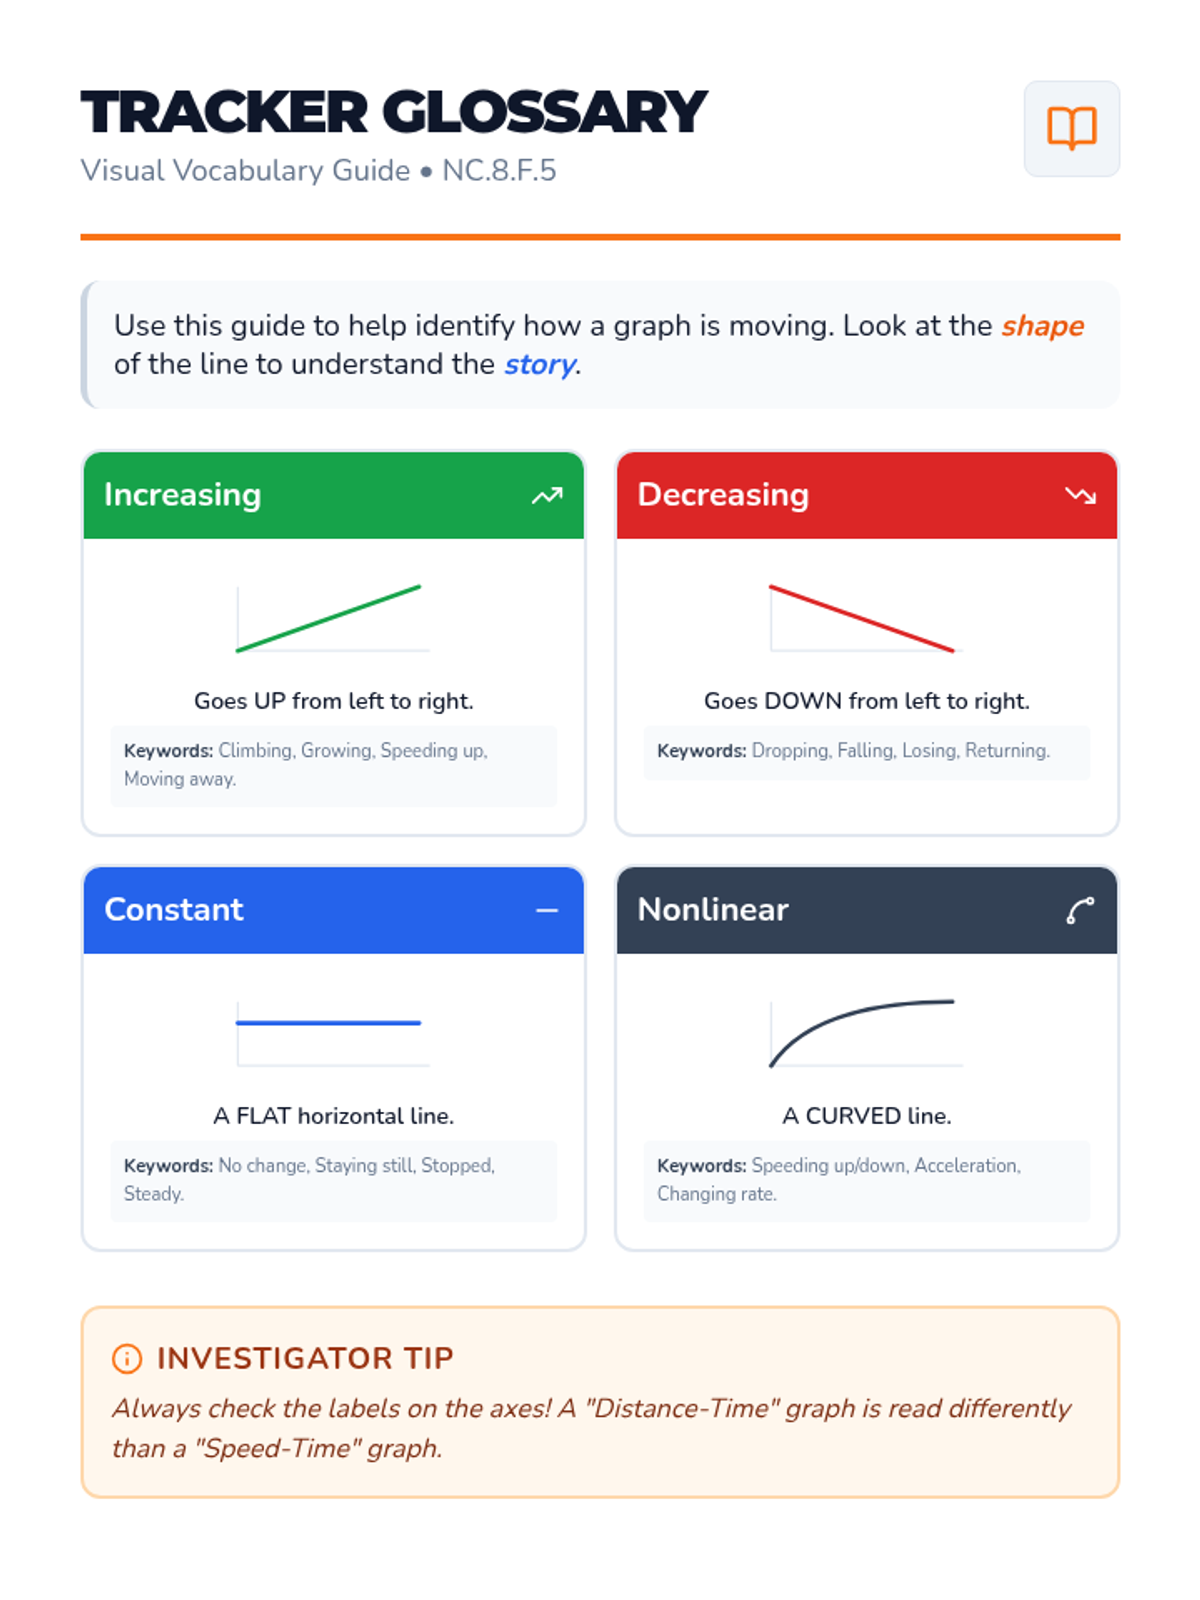
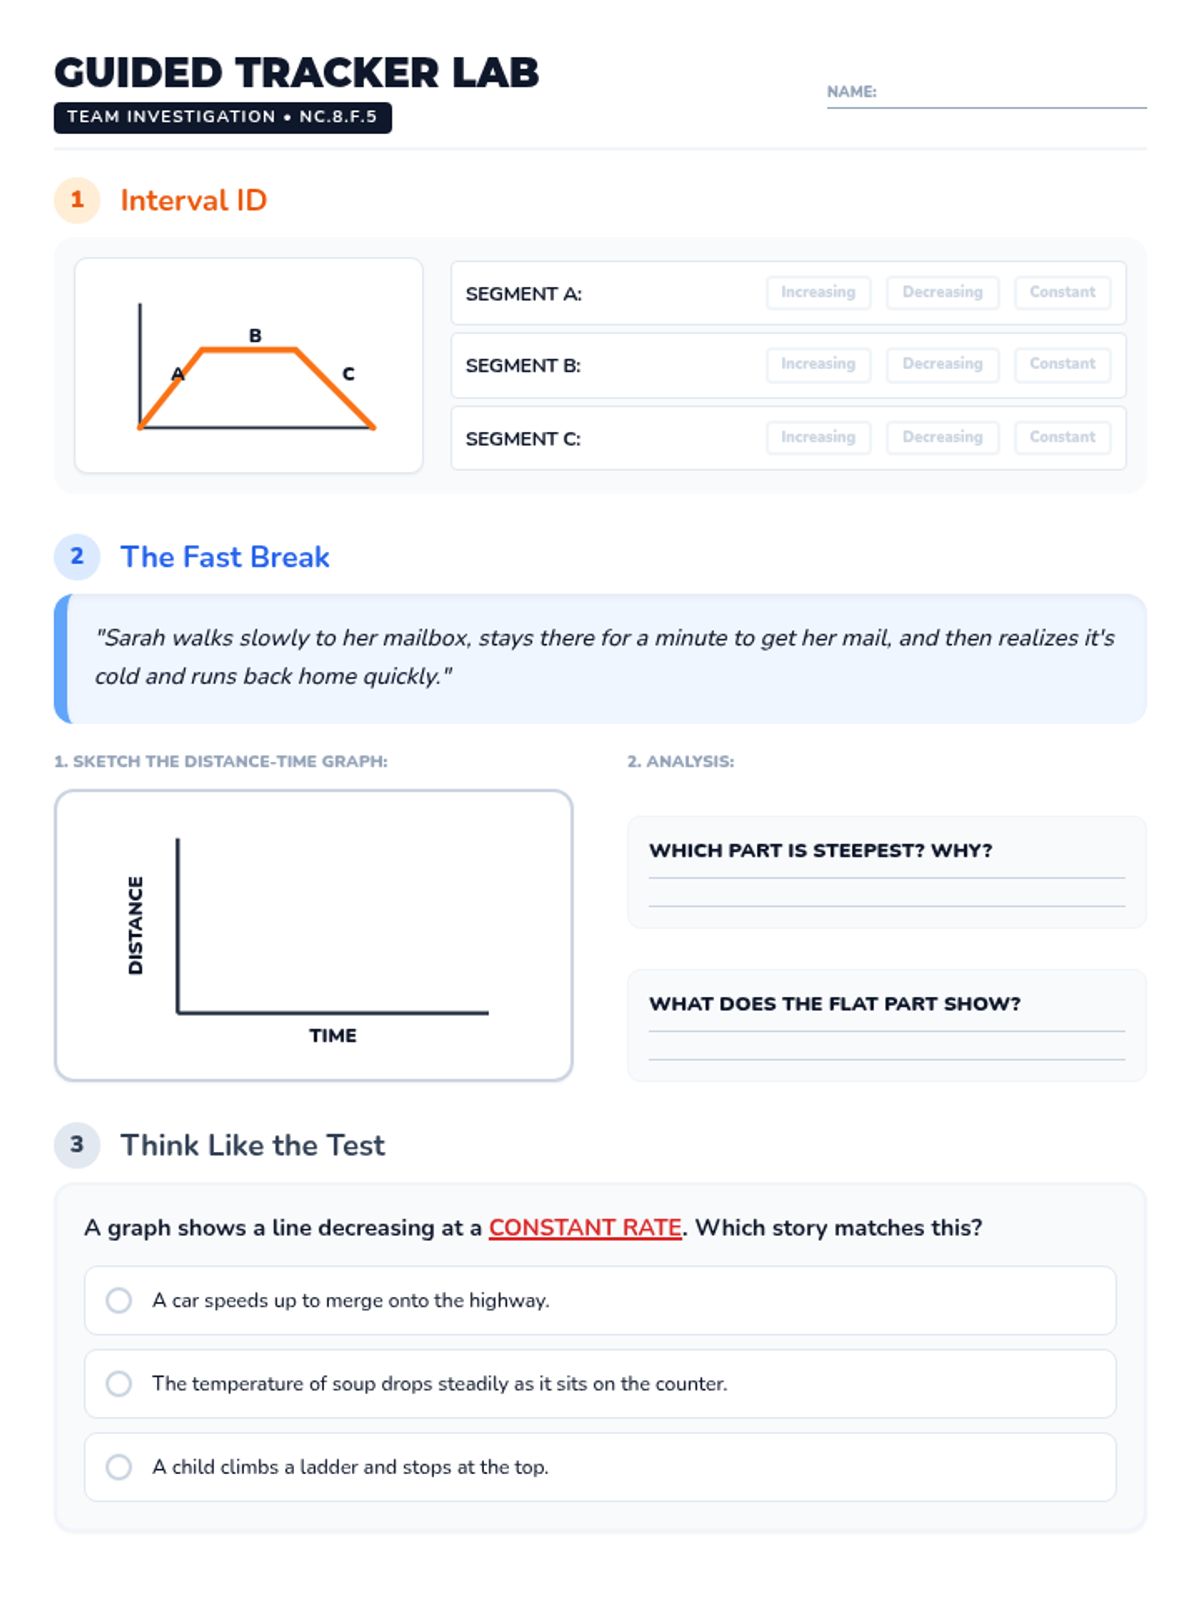
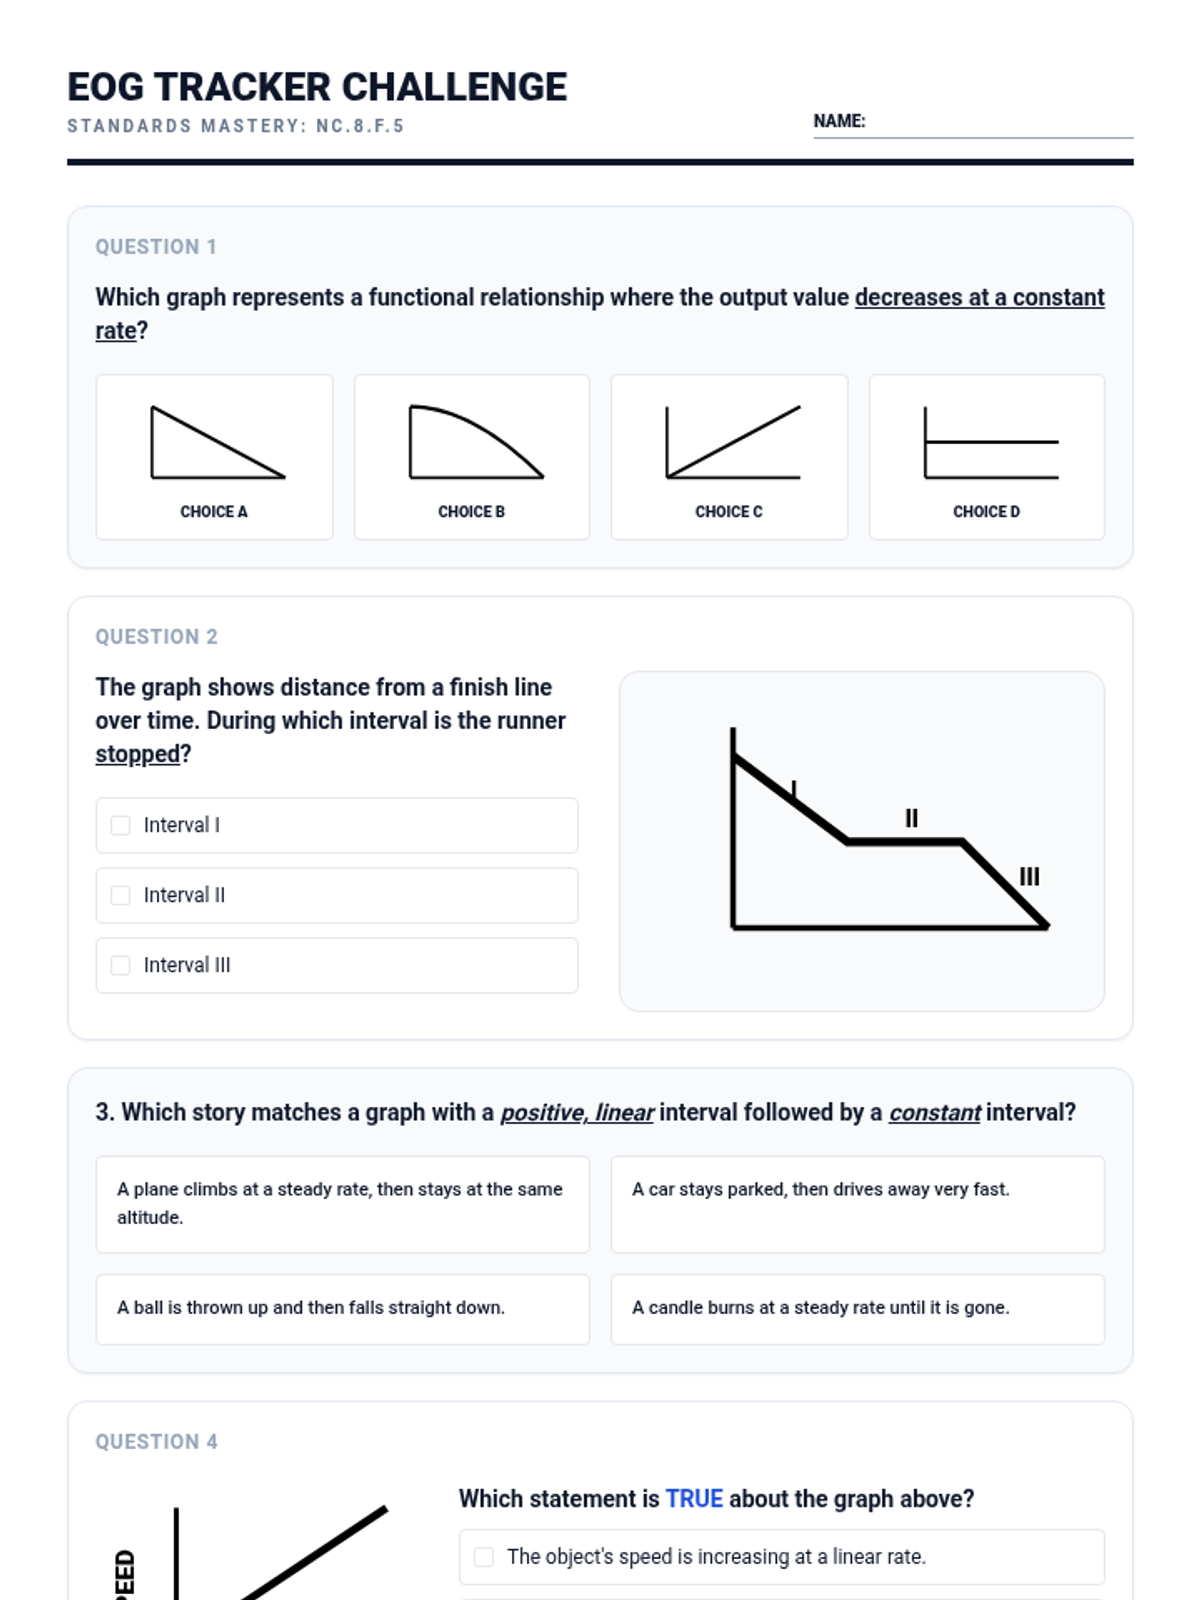
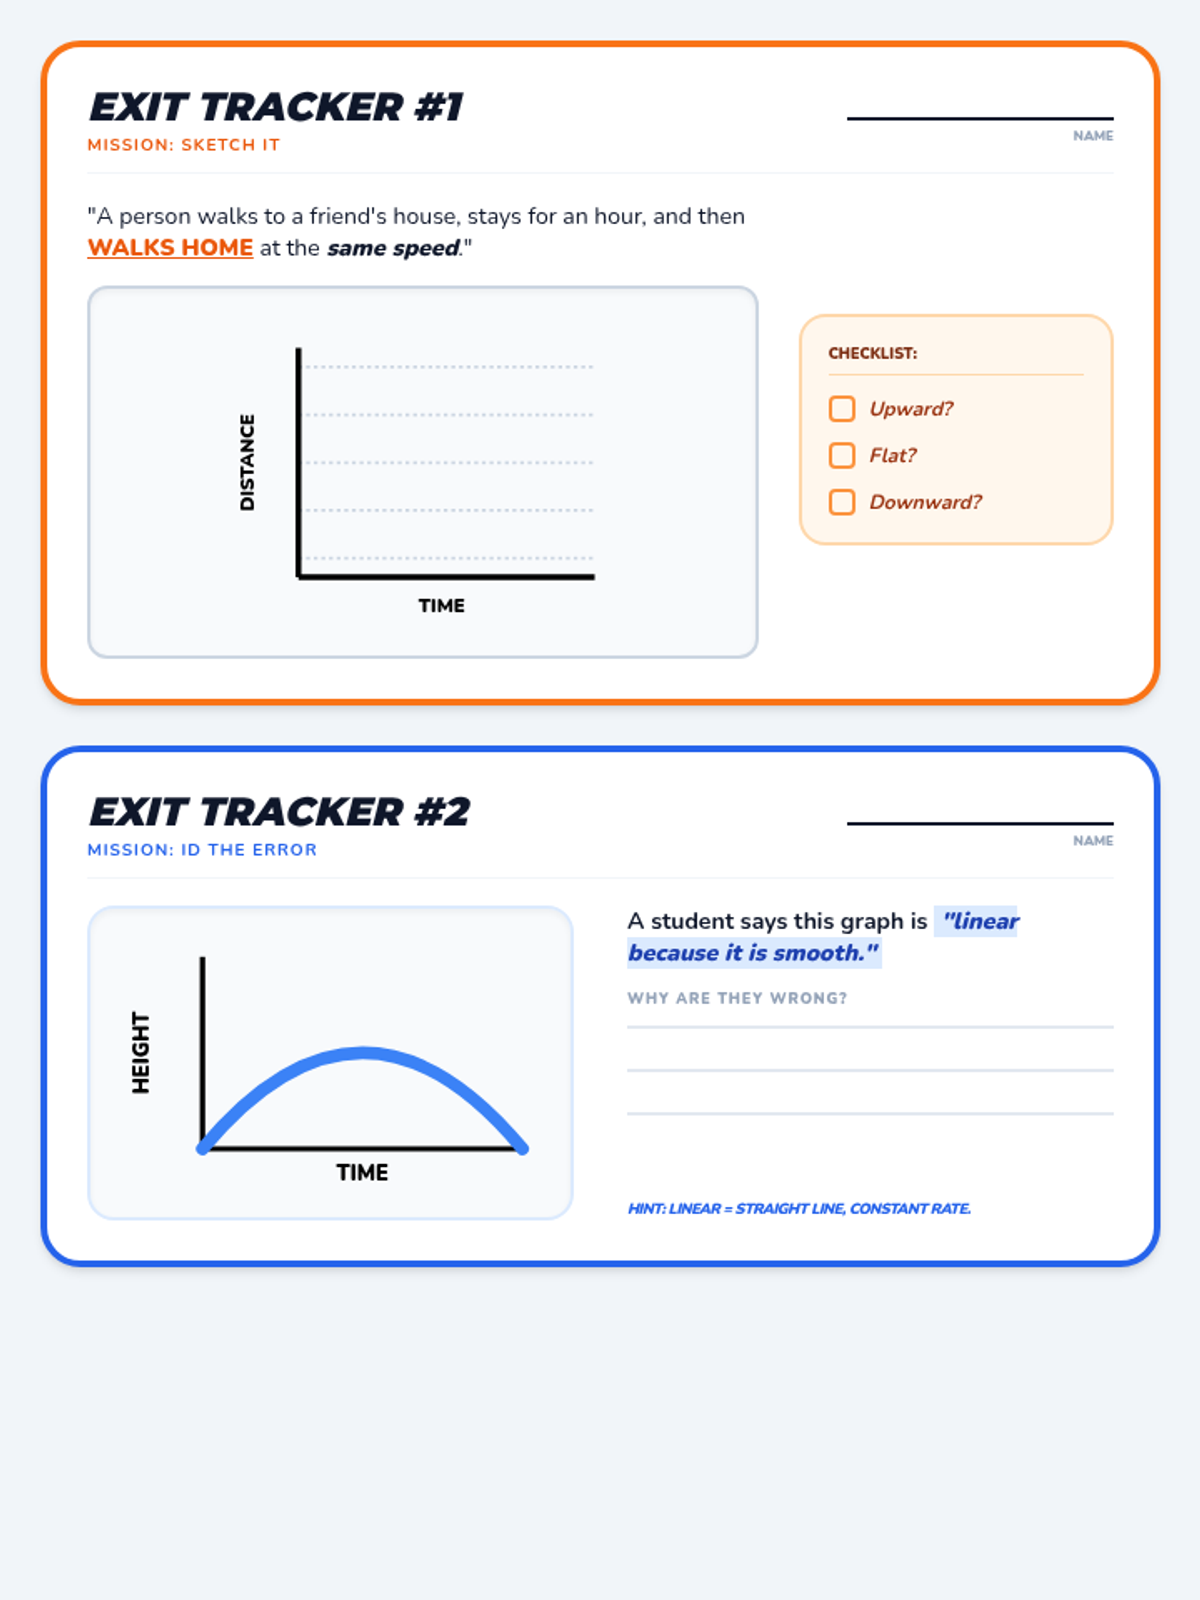
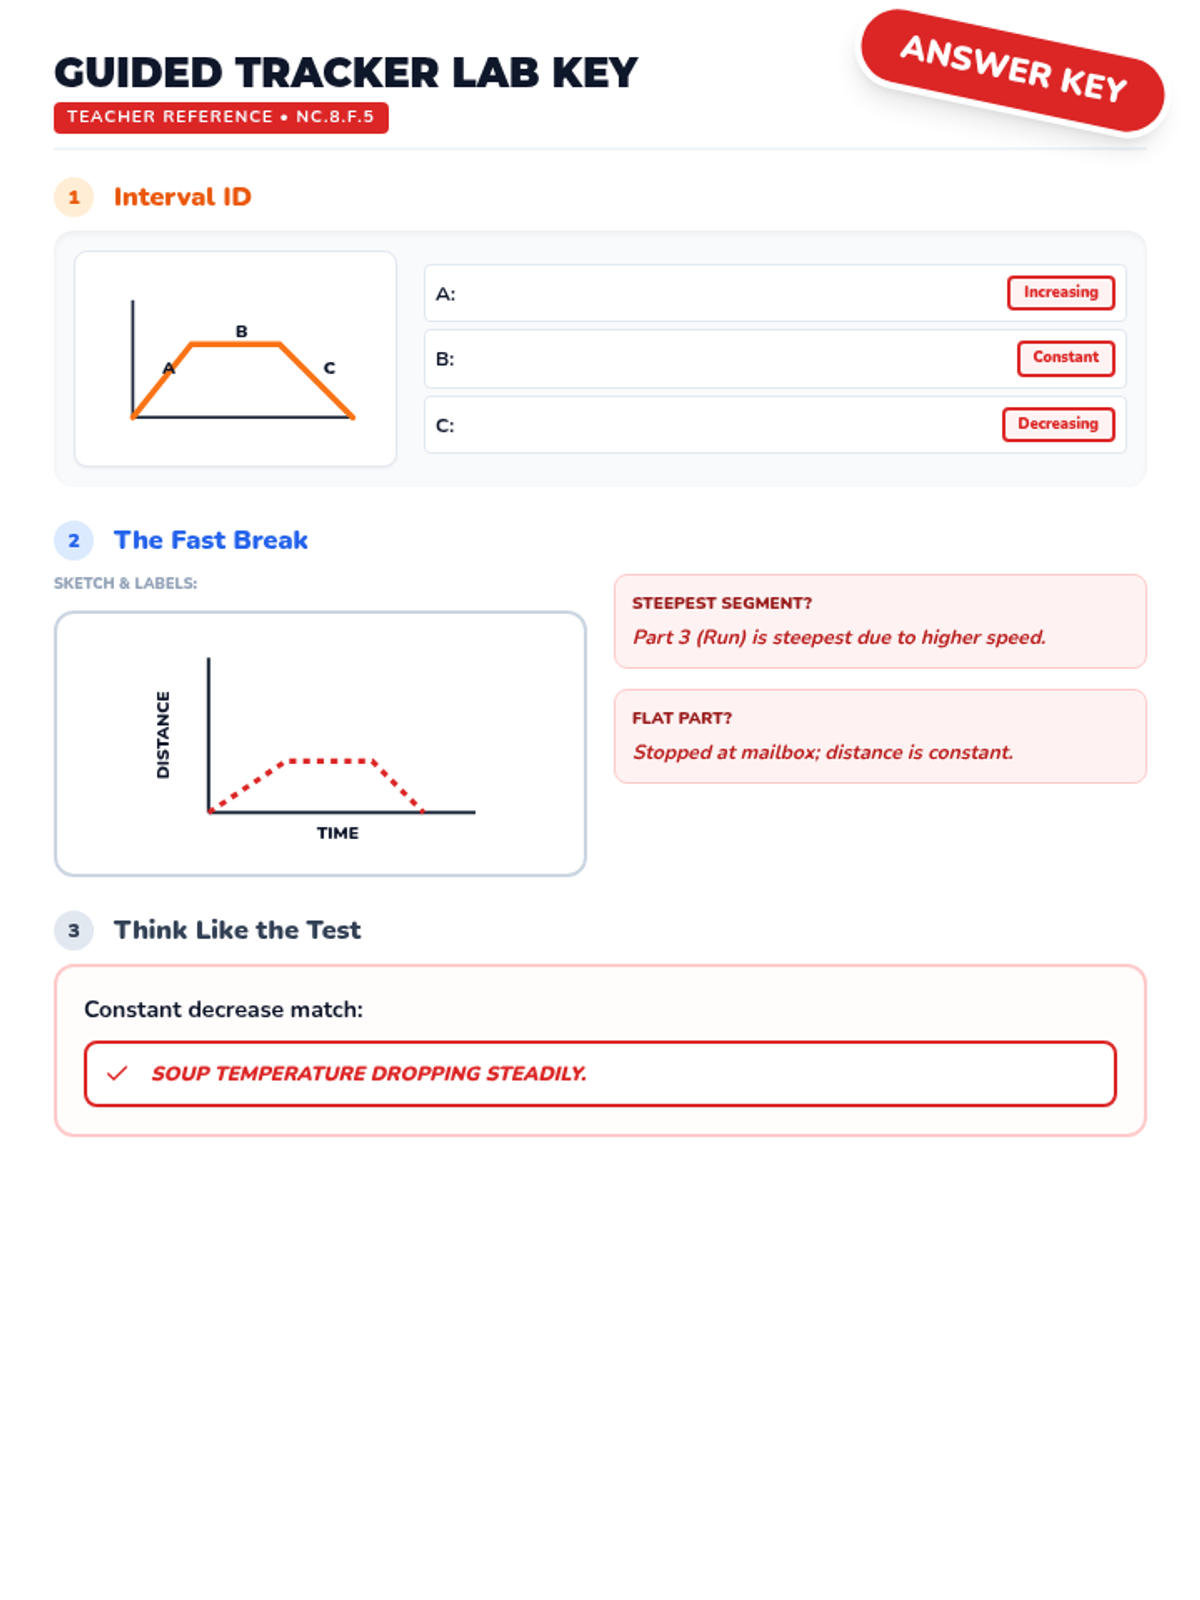
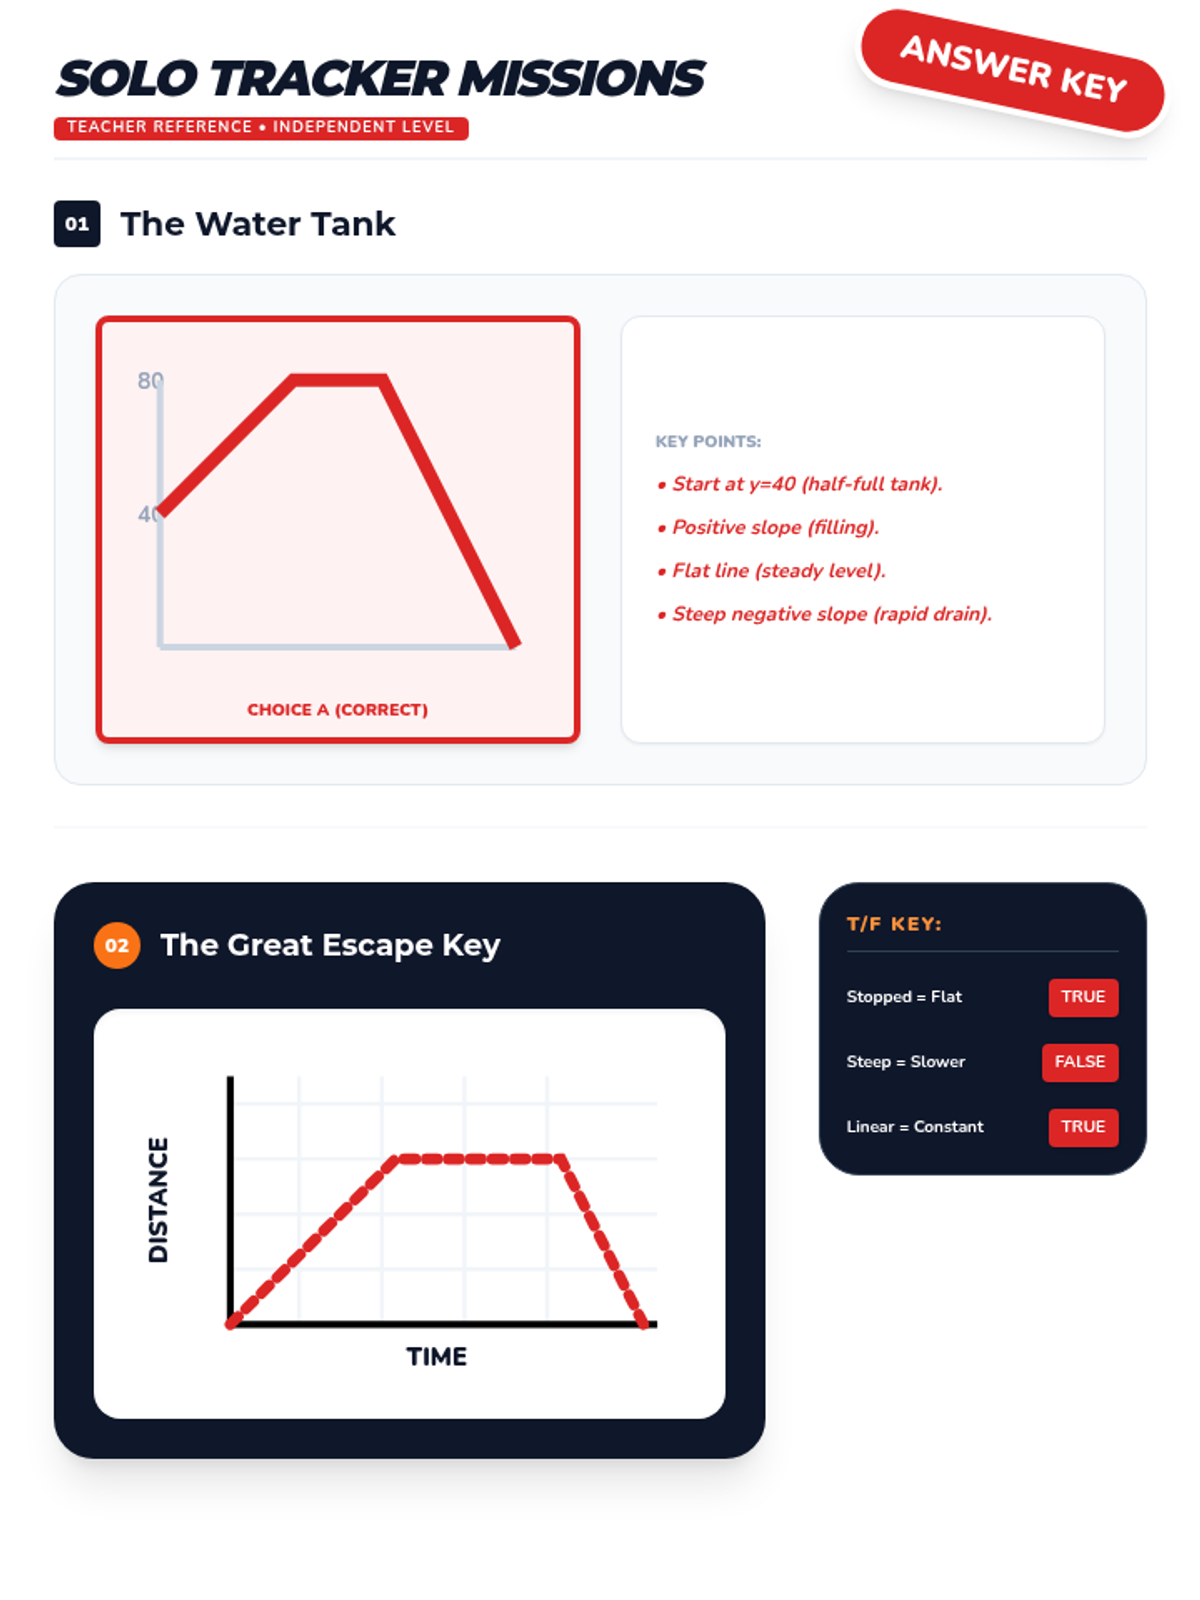
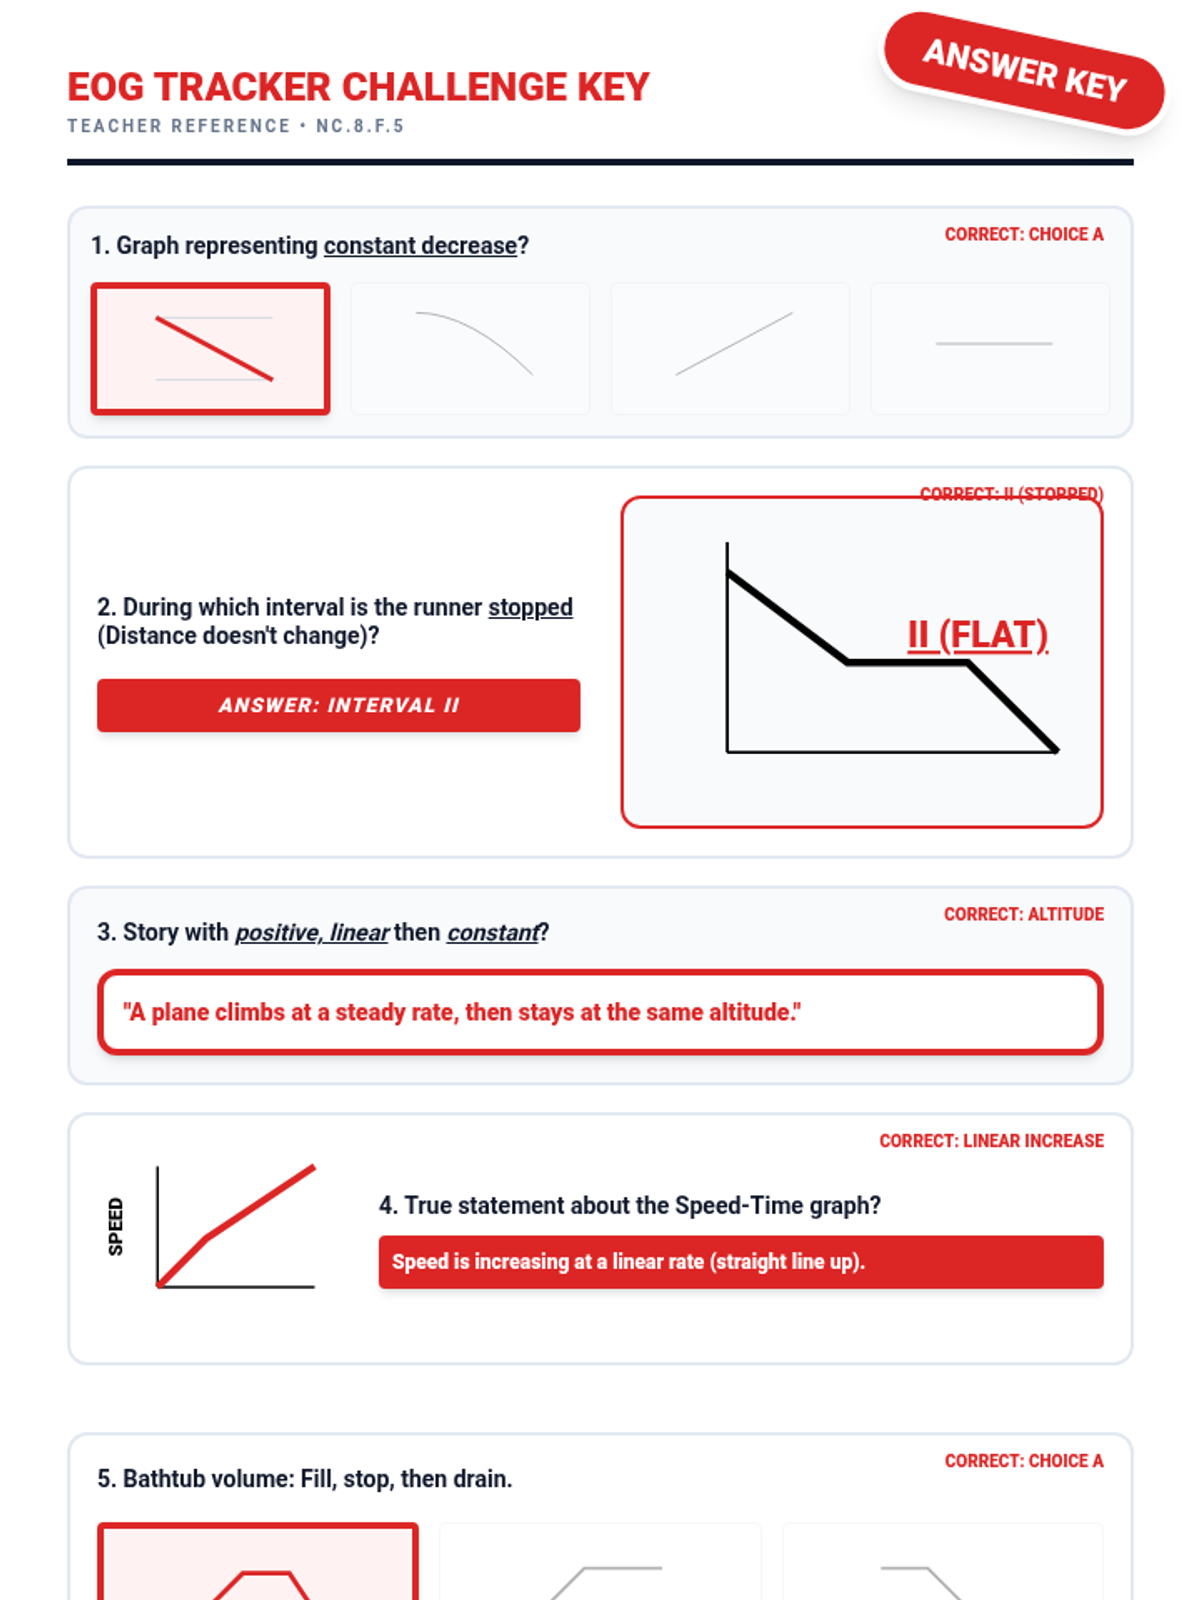
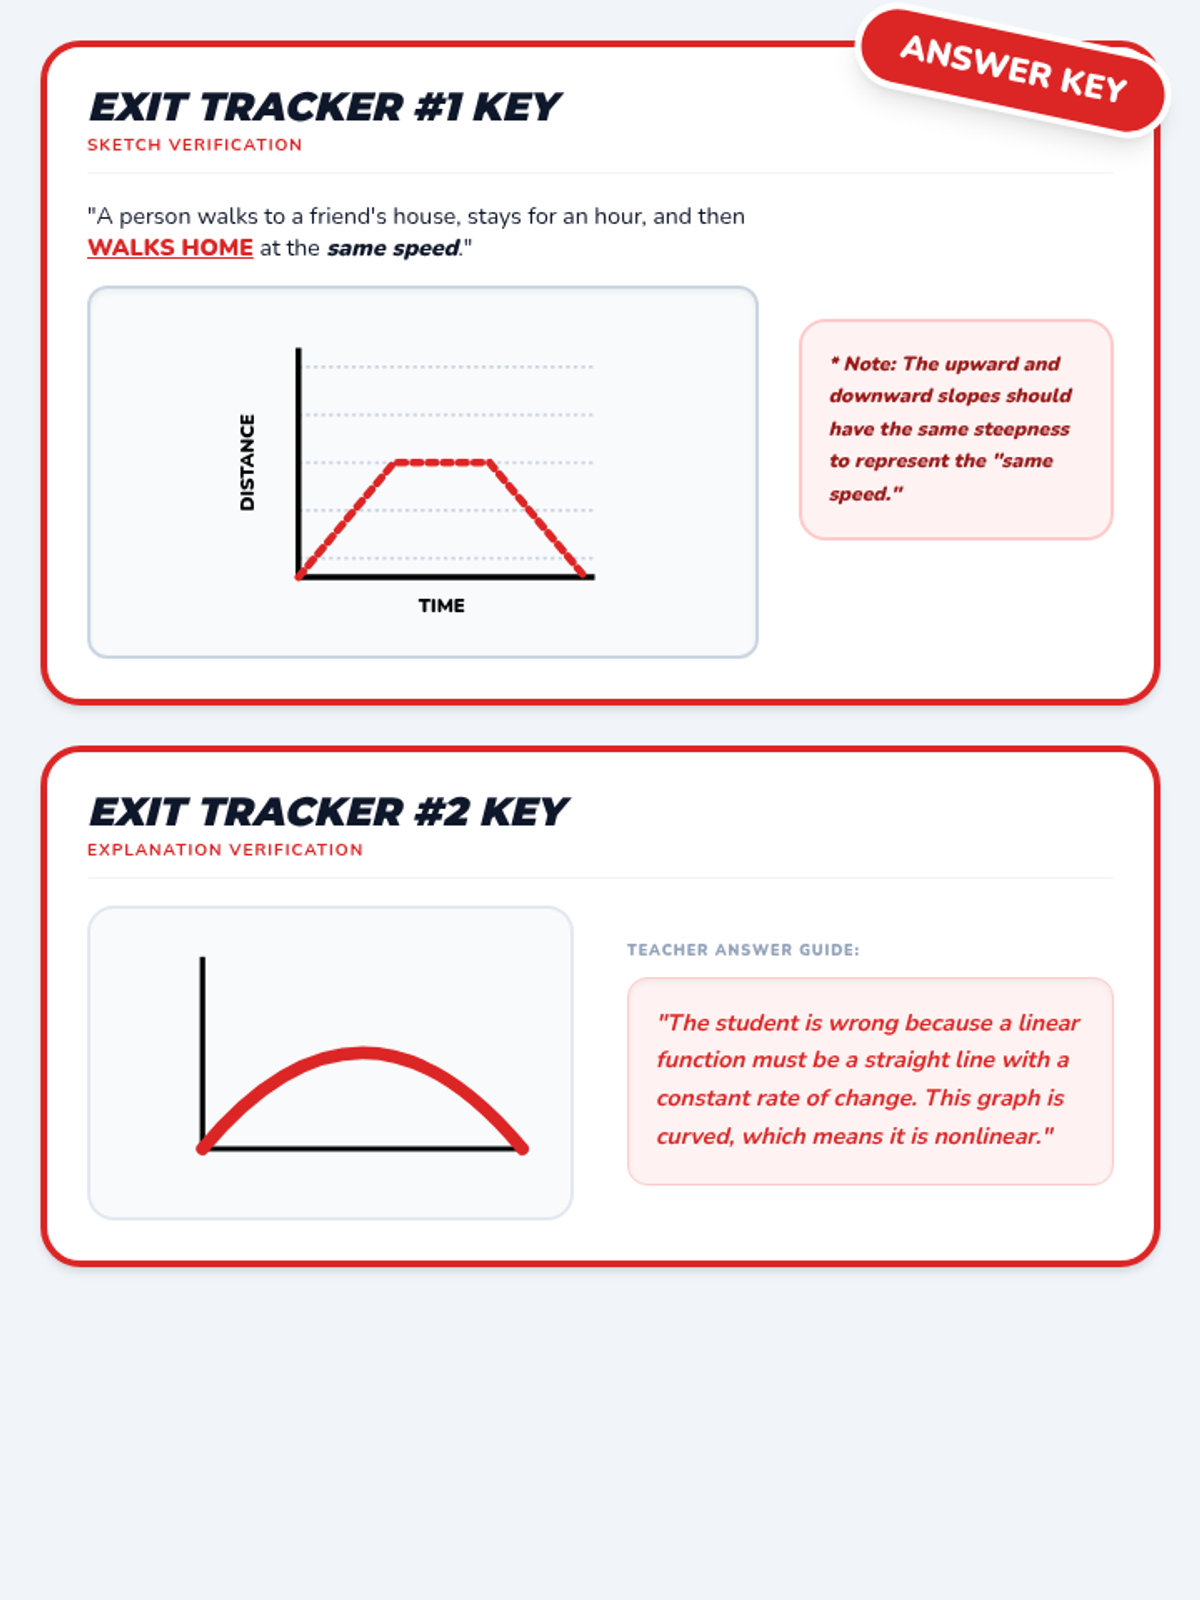
In this lesson, students will learn to describe the relationship between two quantities by analyzing graphs, focusing on increasing, decreasing, and constant intervals, as well as sketching graphs from stories.
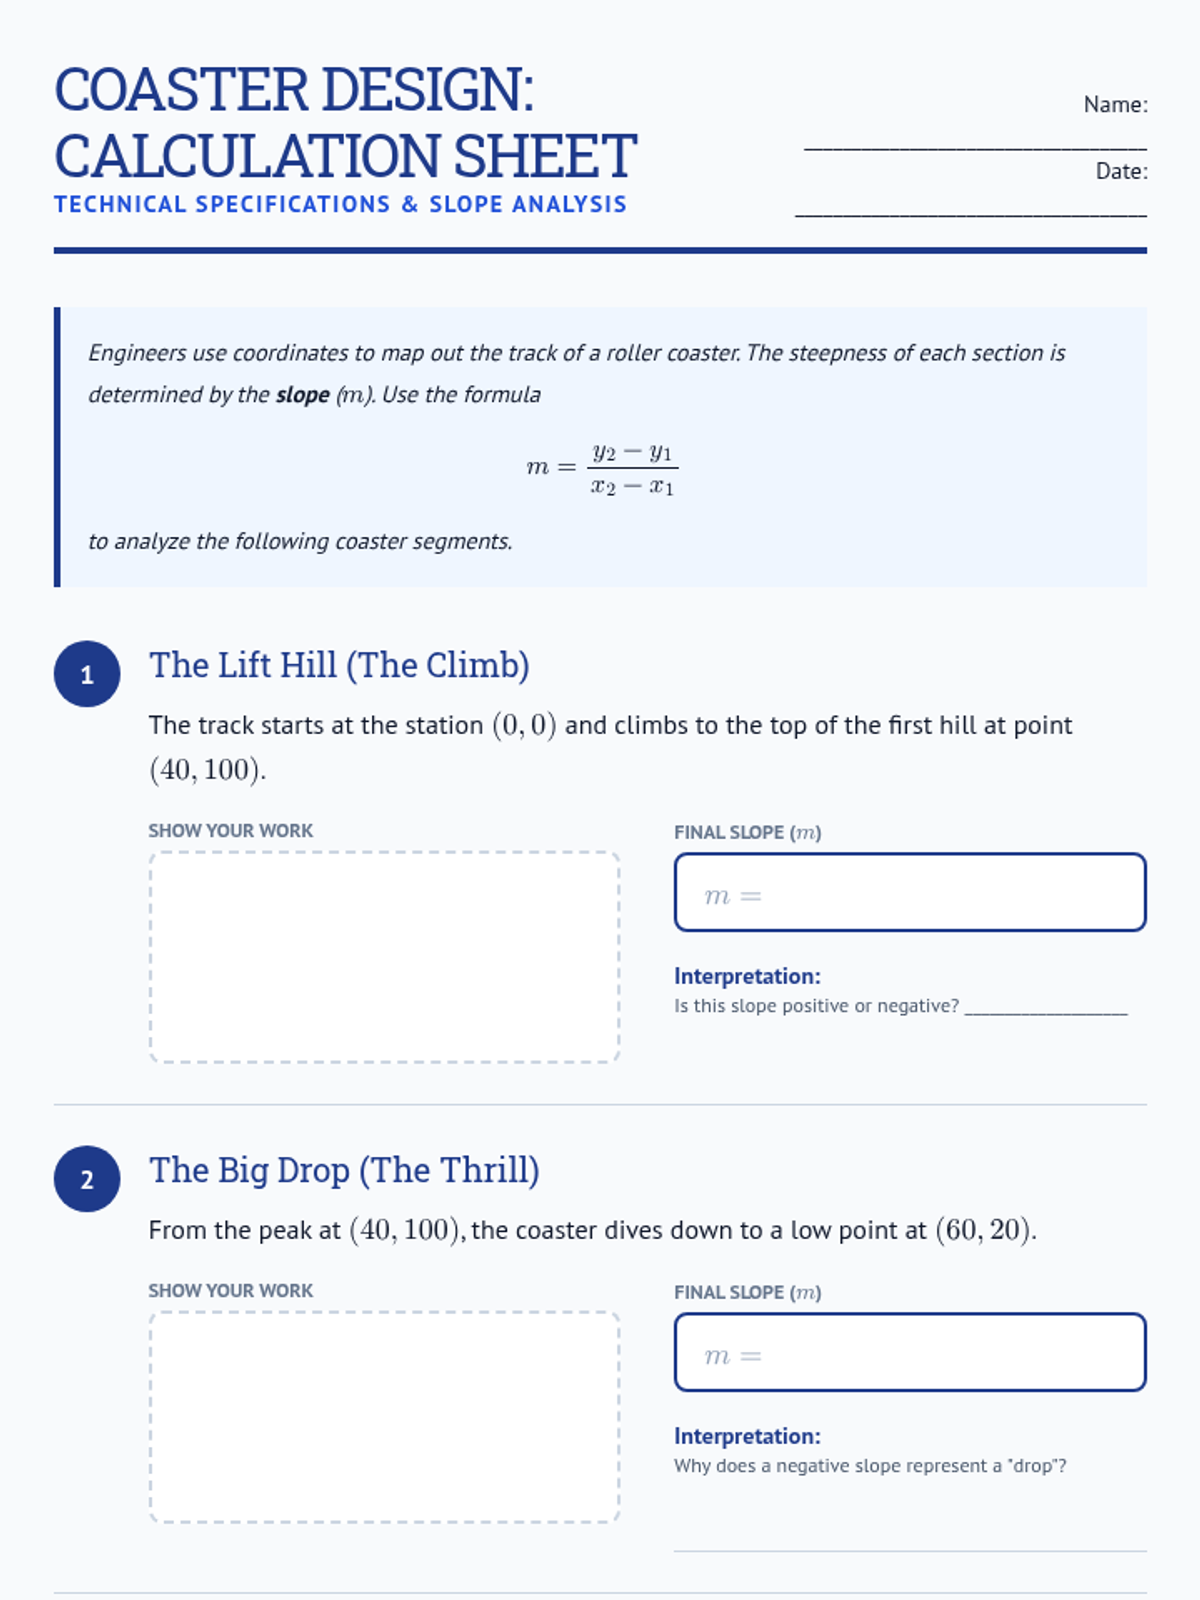
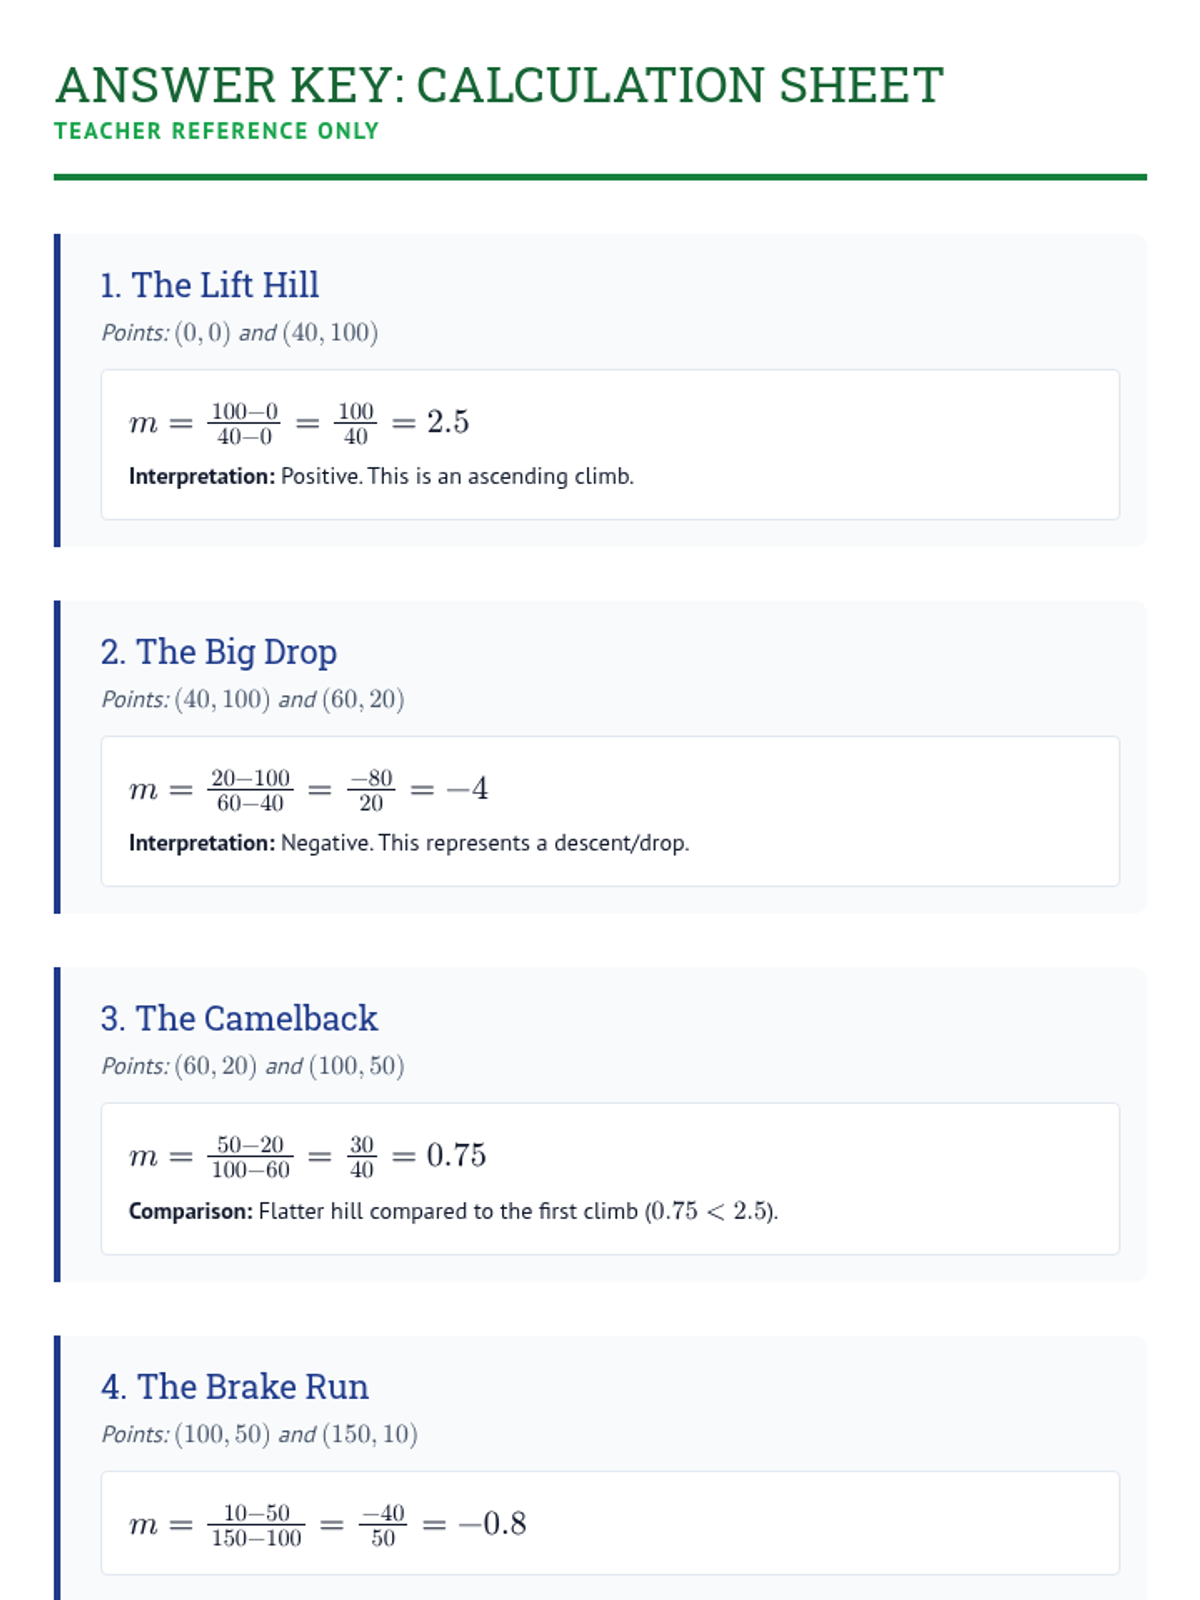
Students apply their knowledge of slope to design a roller coaster. They calculate the steepness of various drops and climbs, representing their findings through a technical blueprint and a visual infographic.
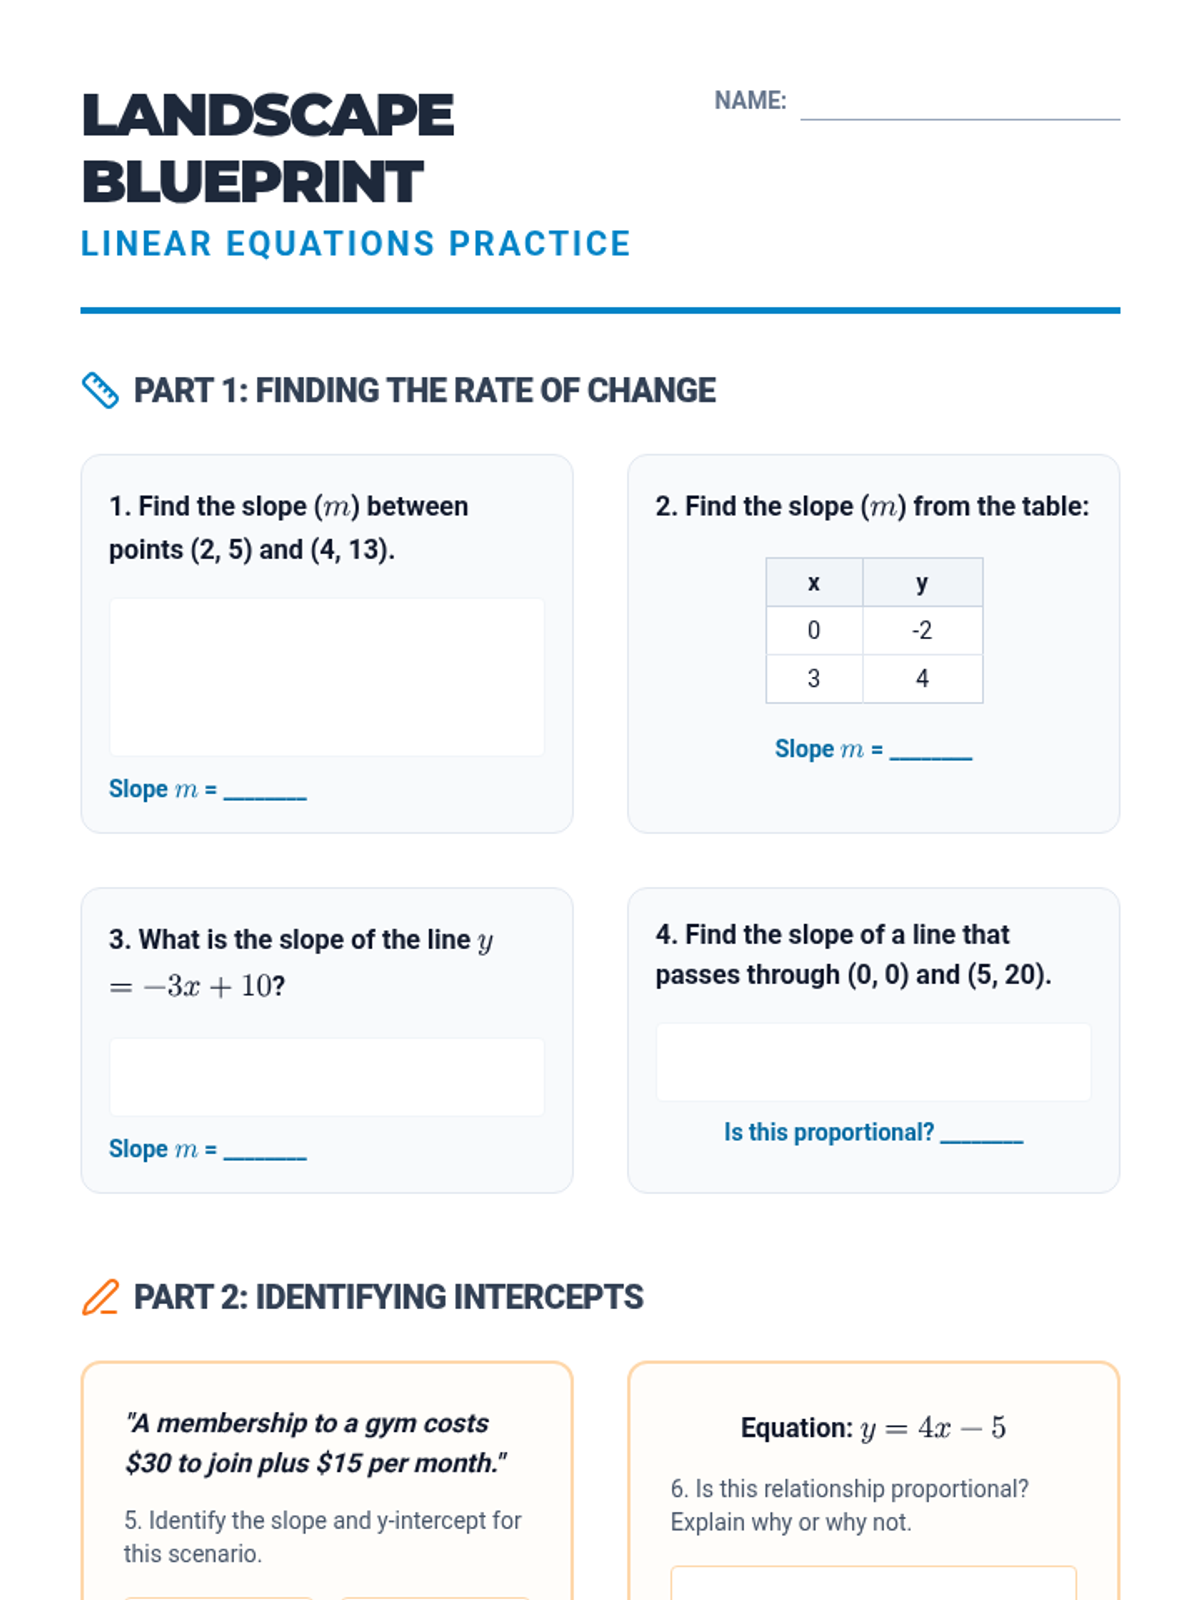
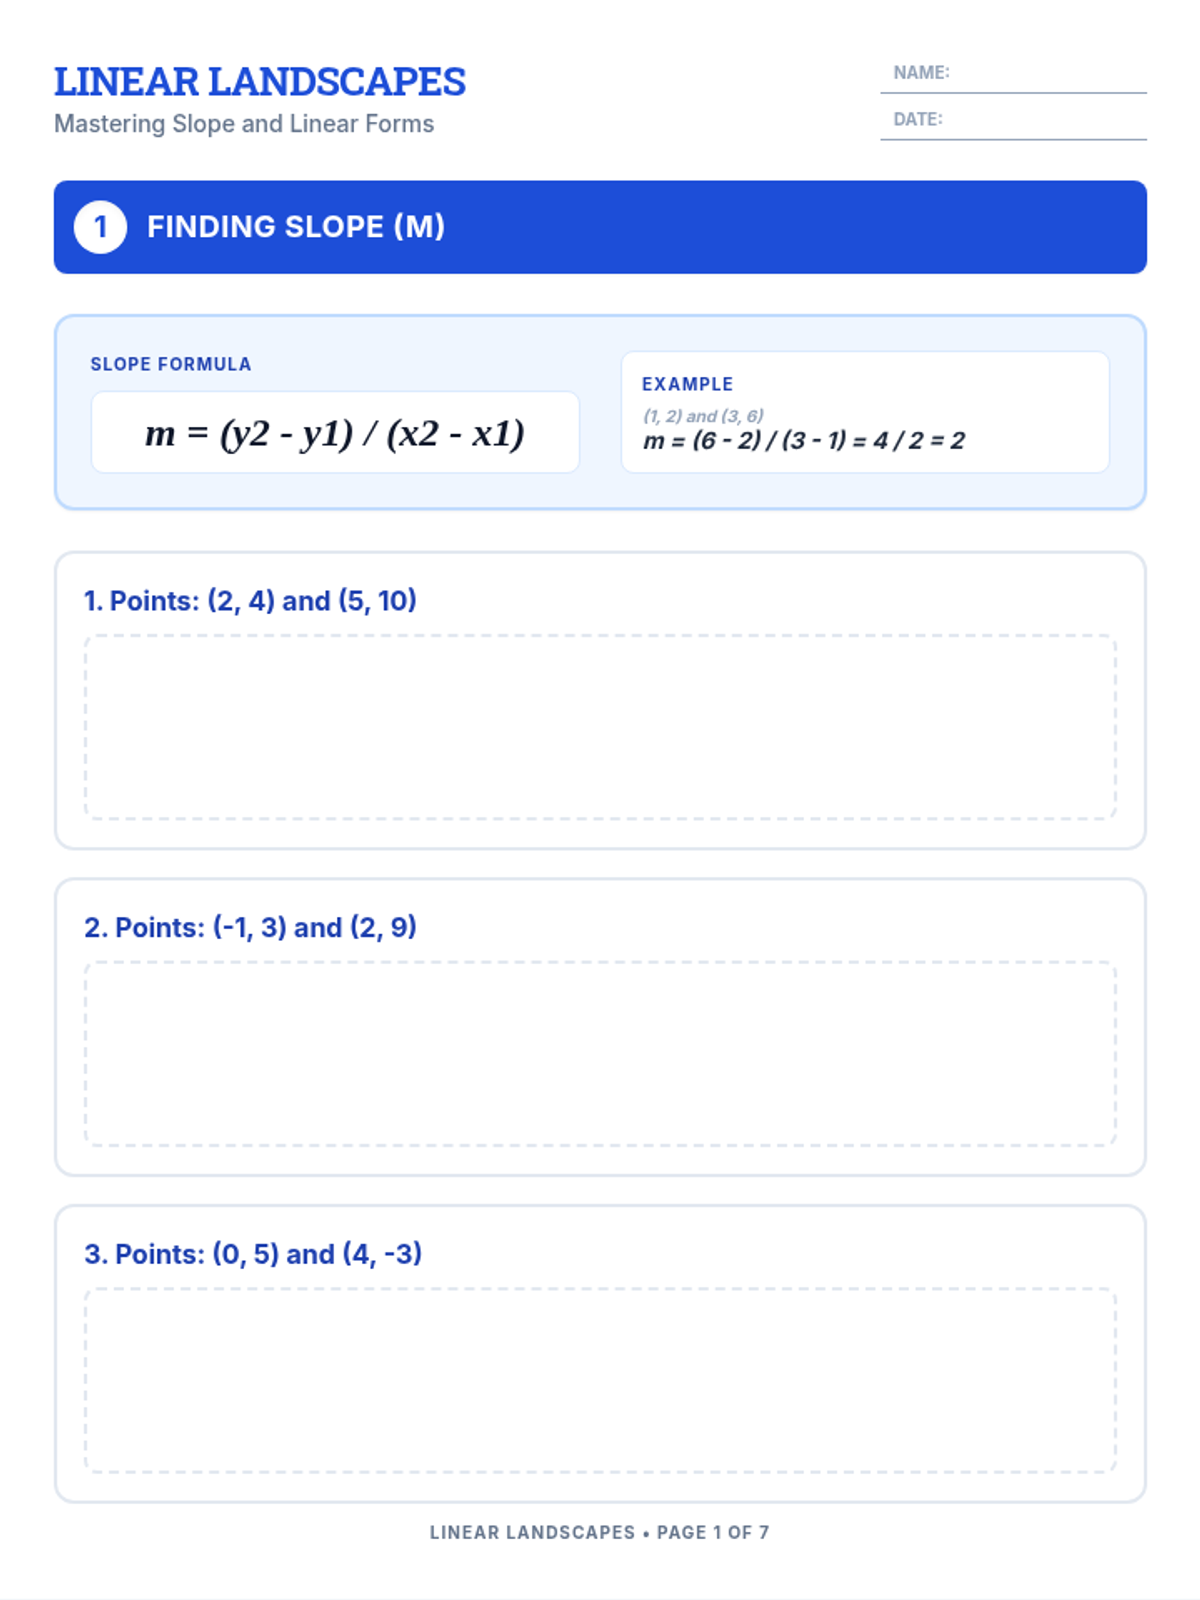
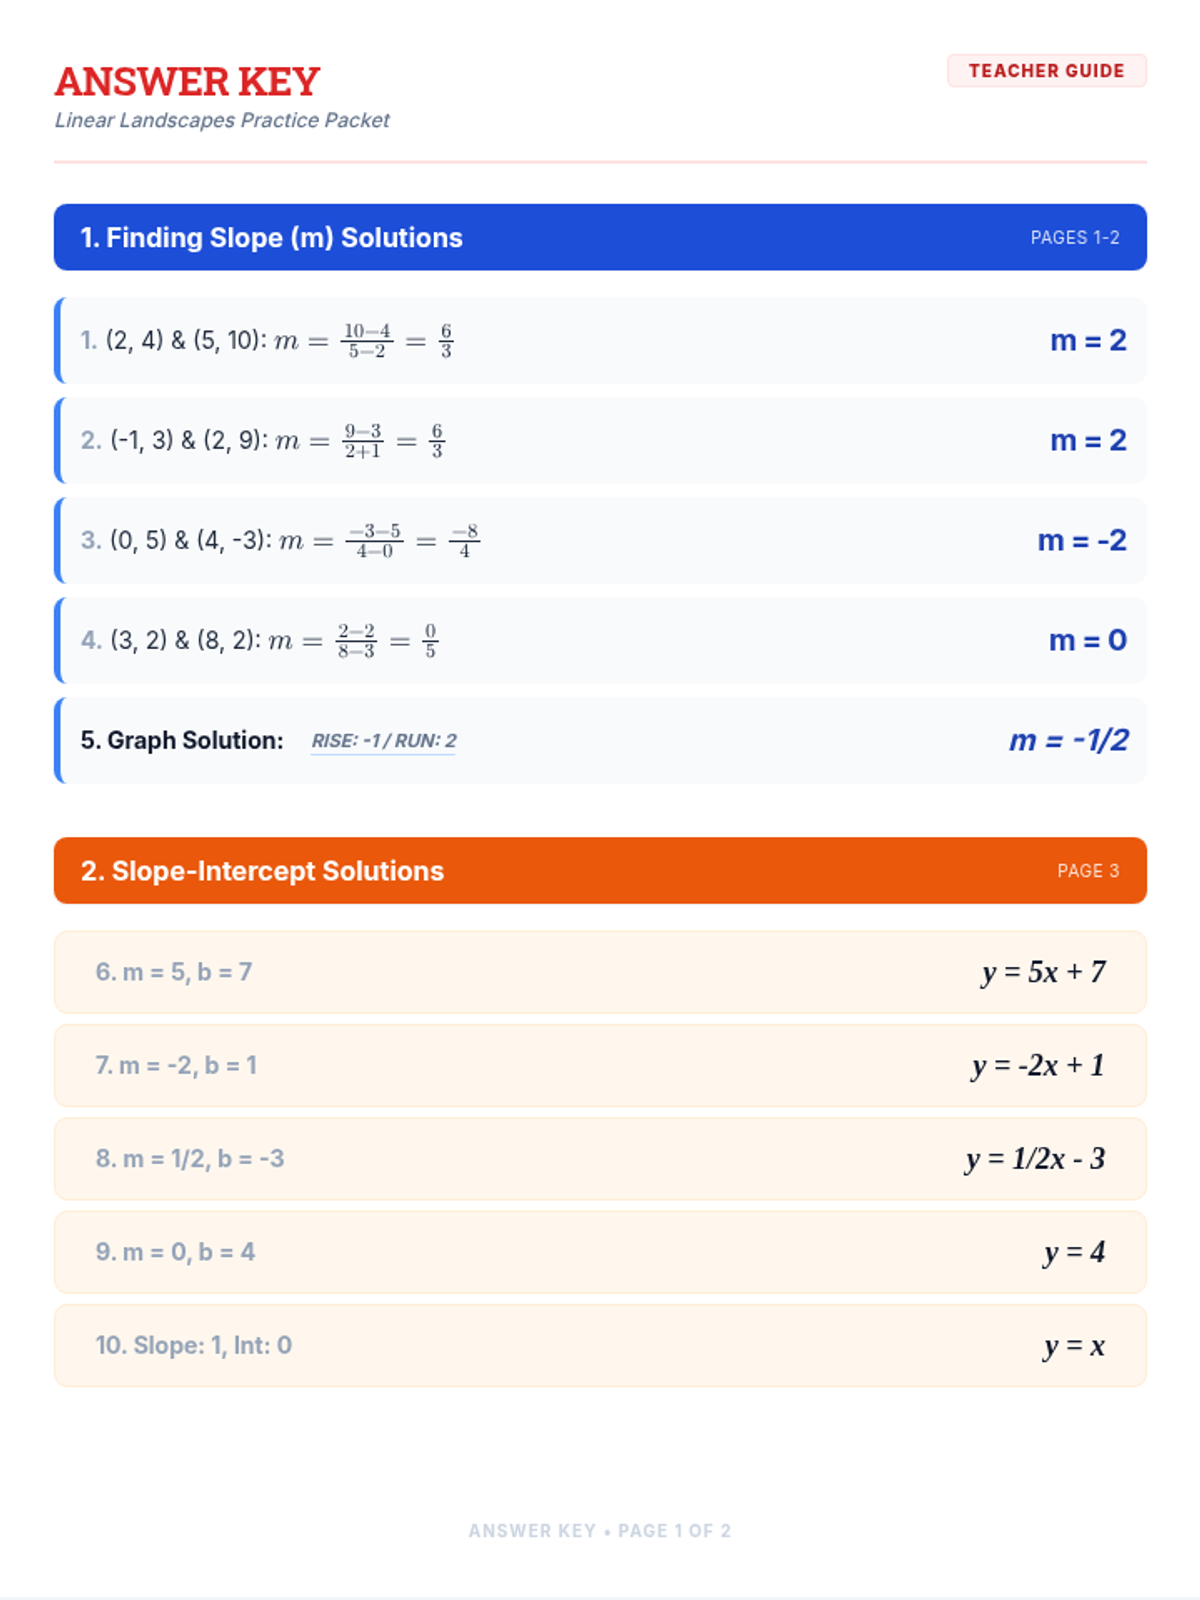
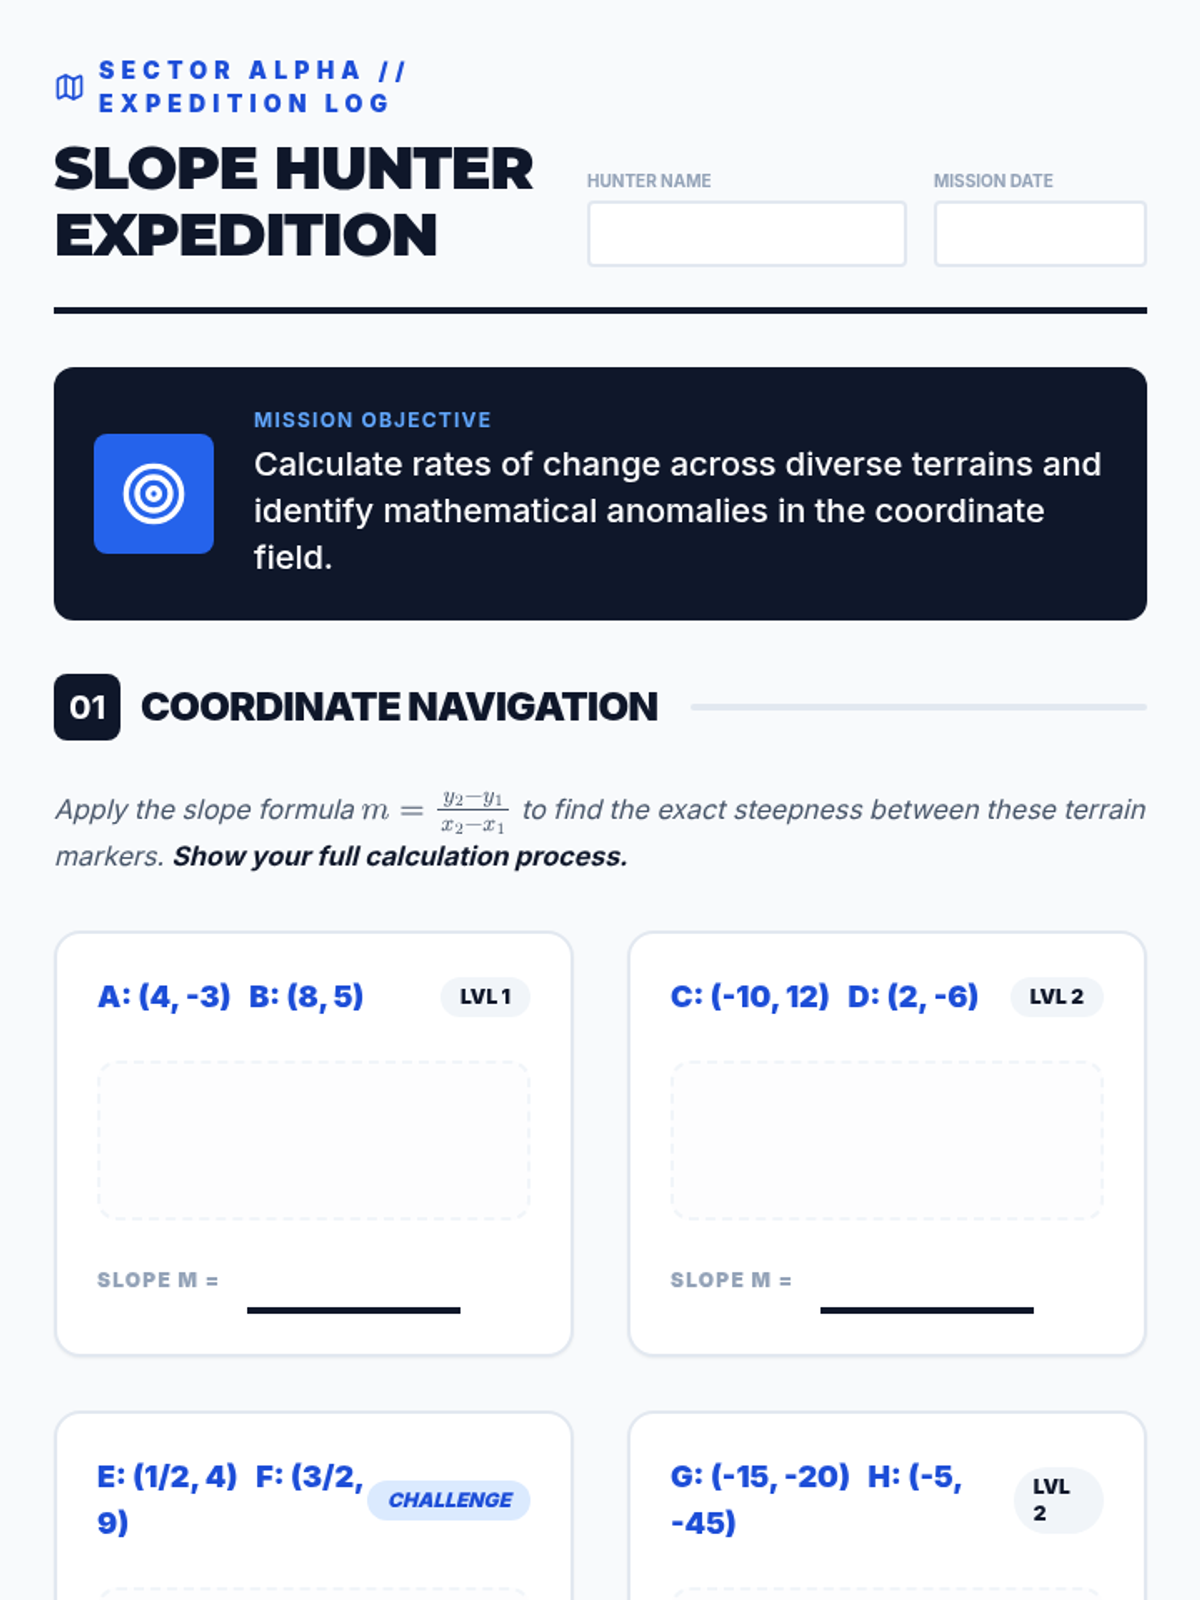
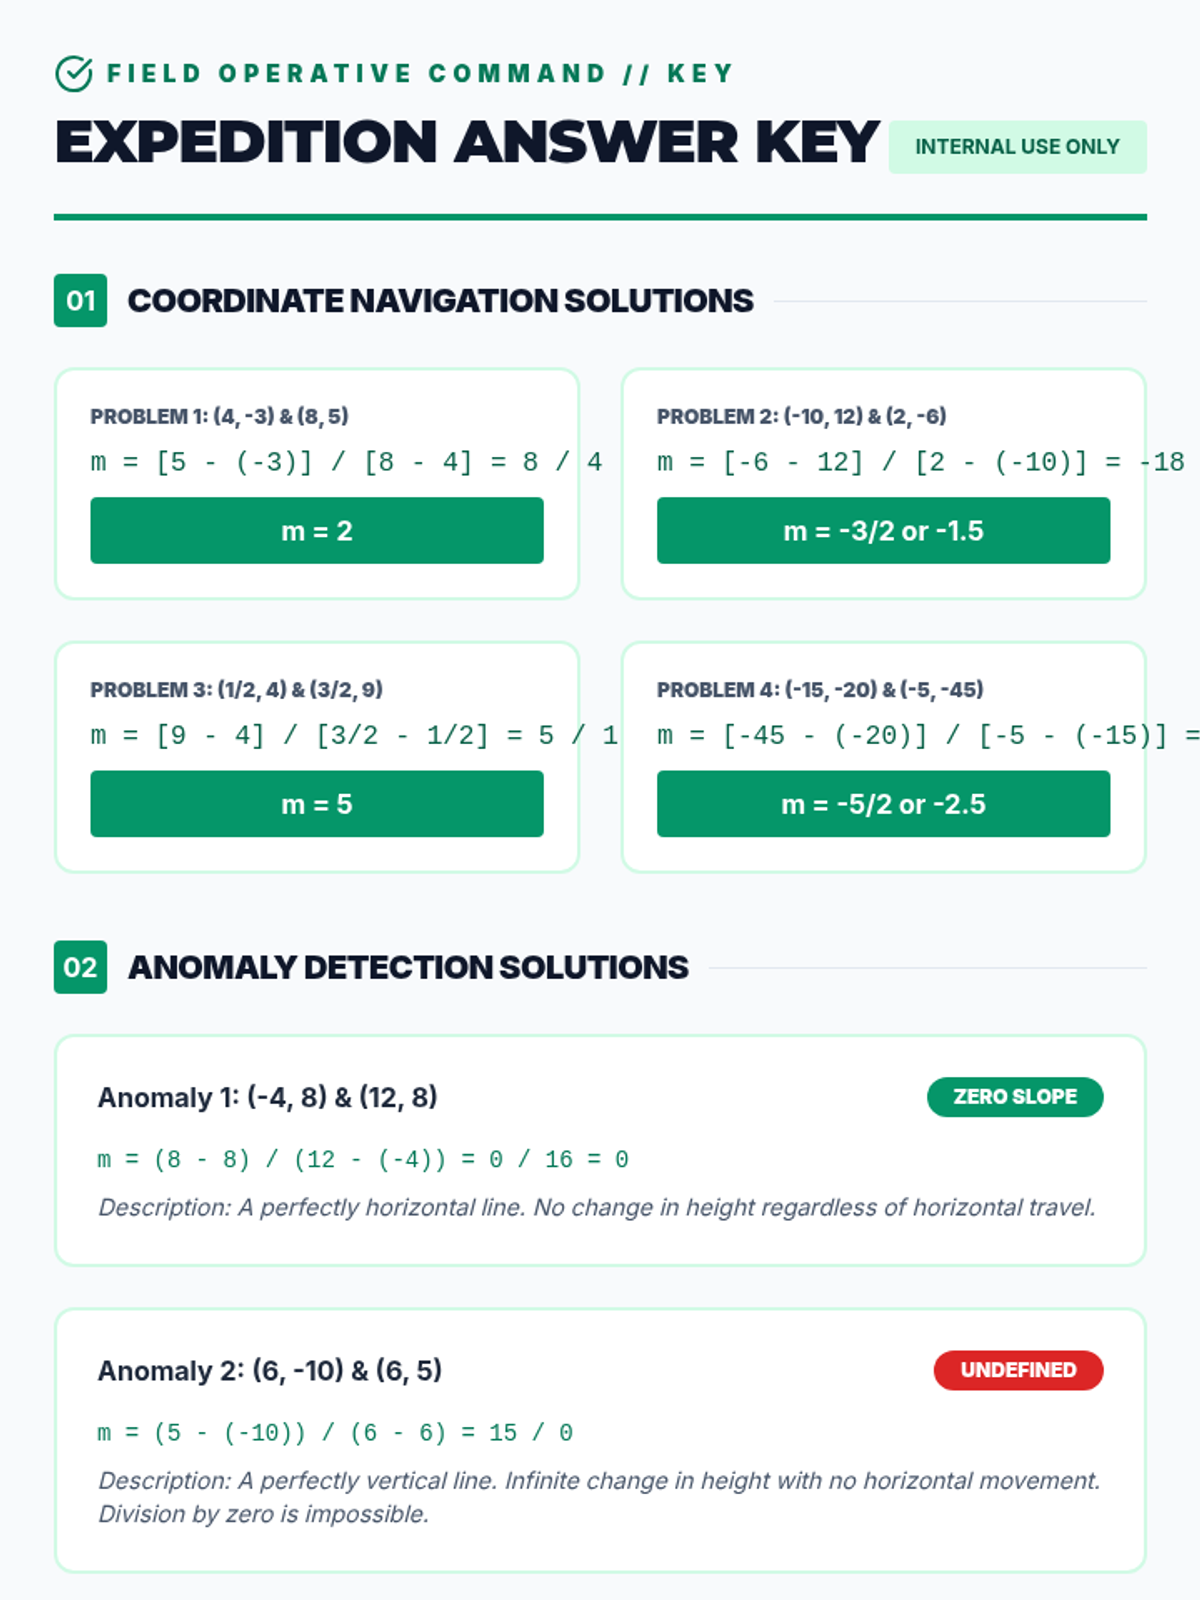
An advanced look at slope as a rate of change, including calculation from coordinates and understanding special cases like zero and undefined slopes.
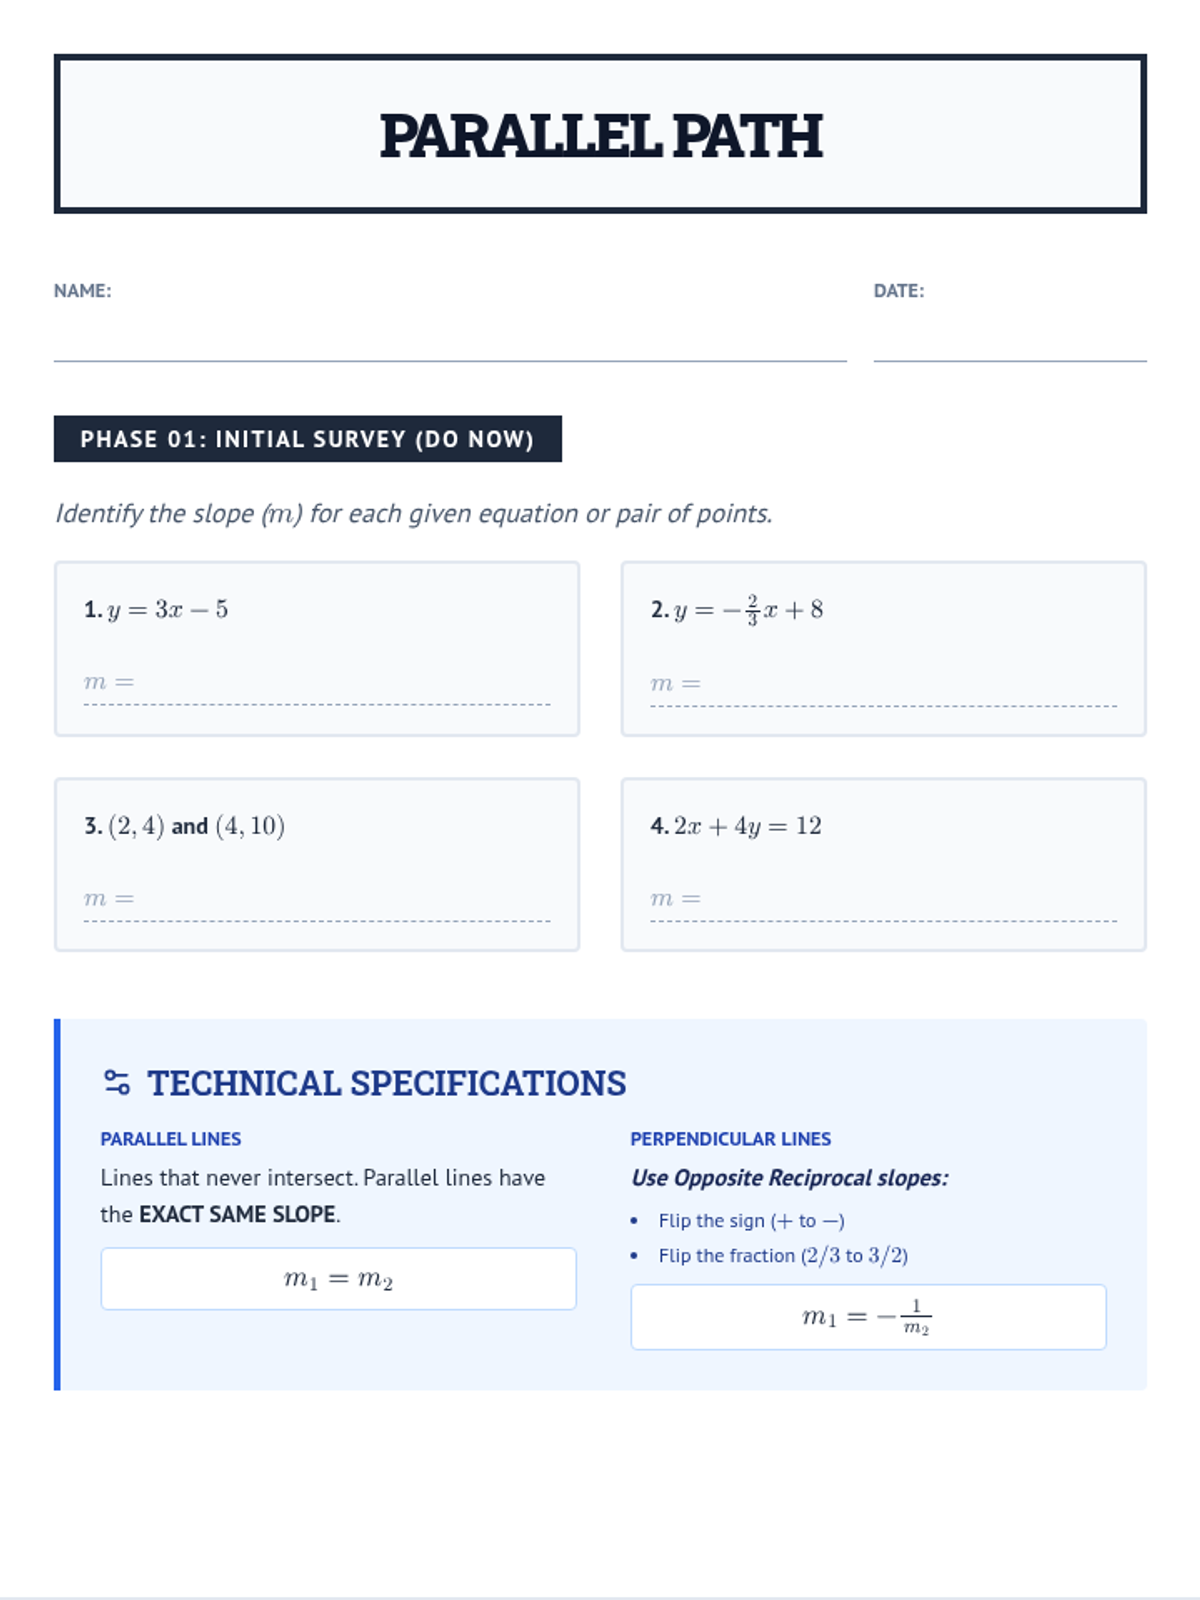
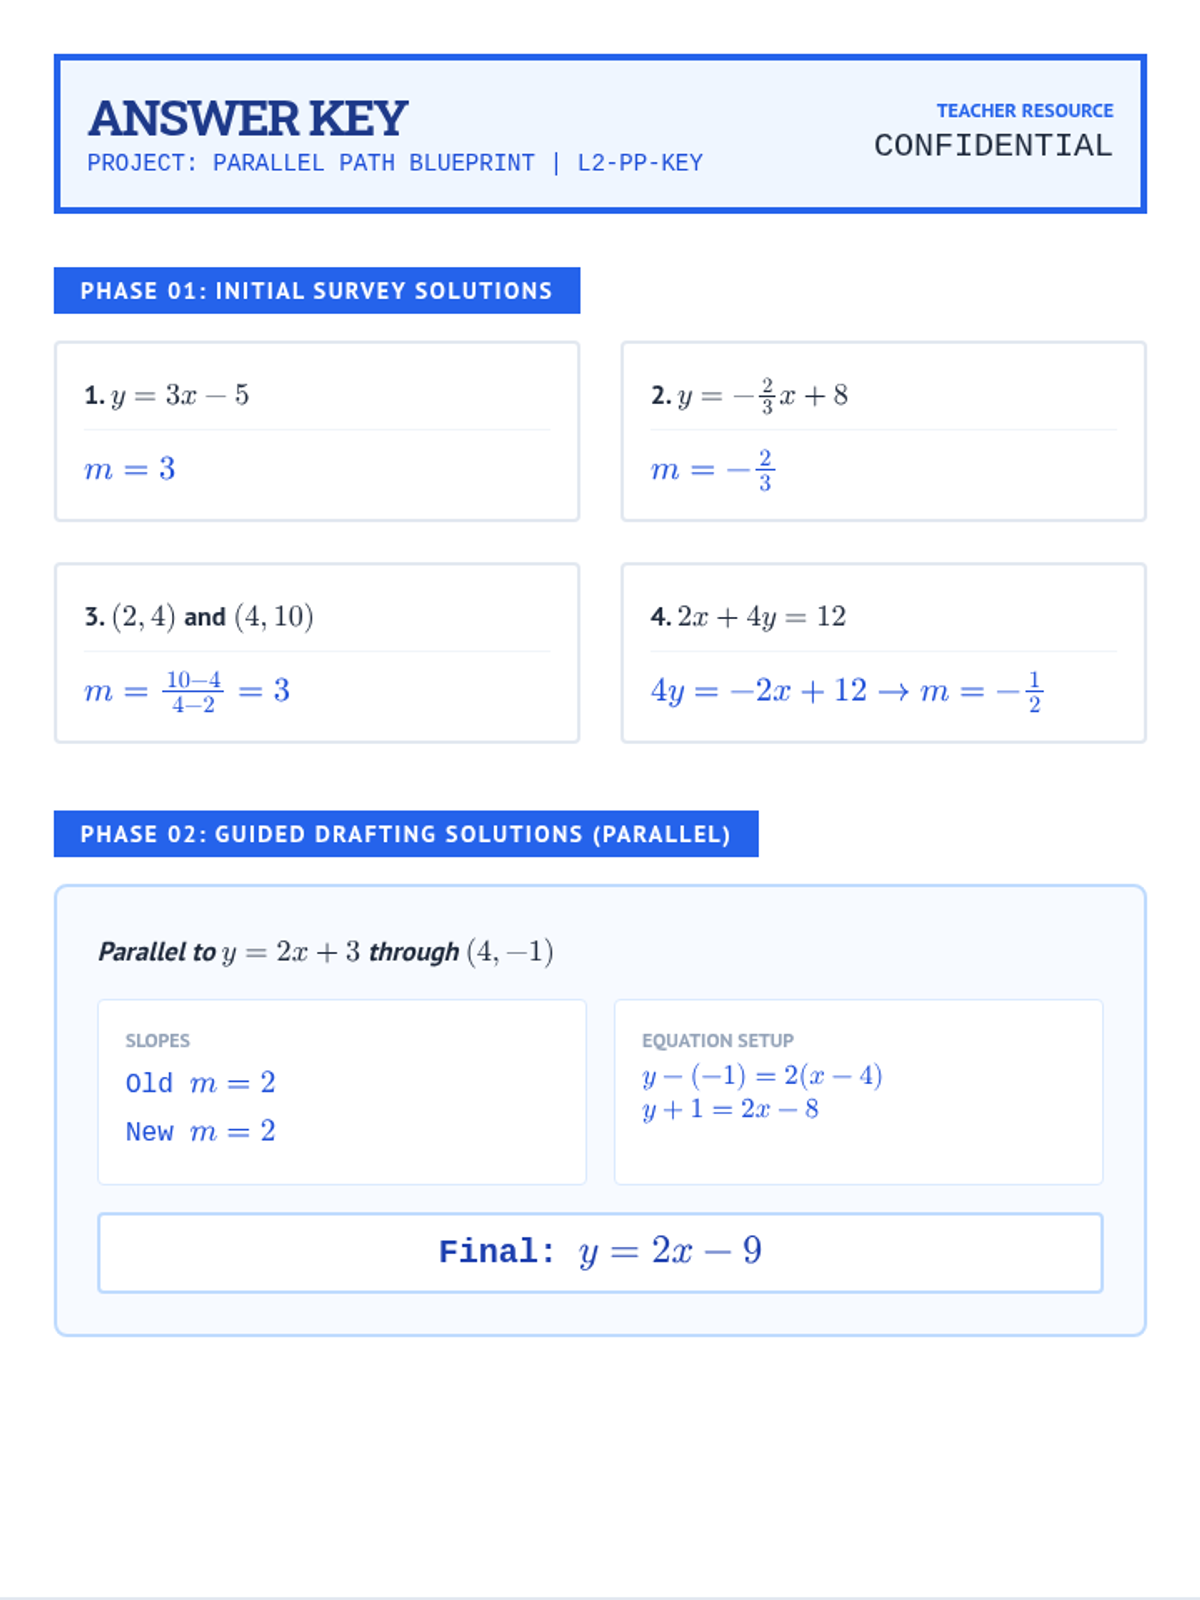
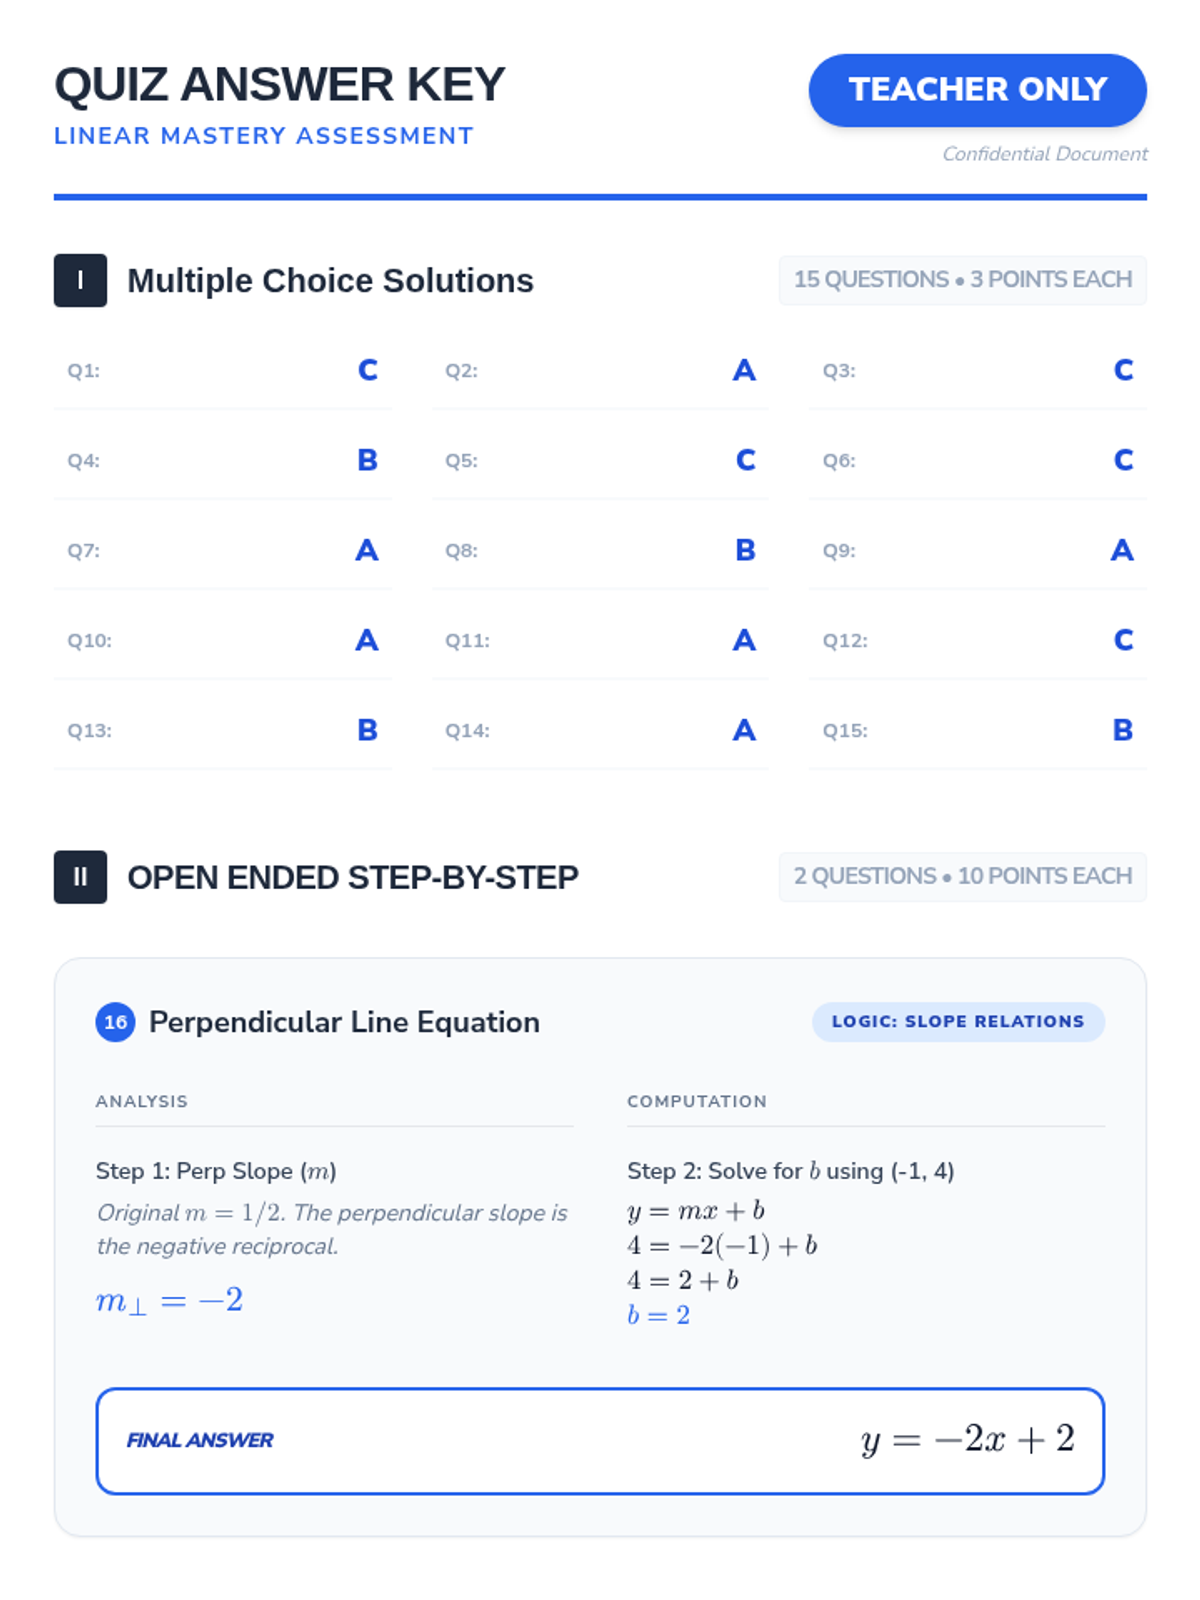
A lesson focused on the geometric and algebraic relationships of parallel and perpendicular lines, teaching students how to identify slopes and write new equations using a technical blueprint aesthetic.
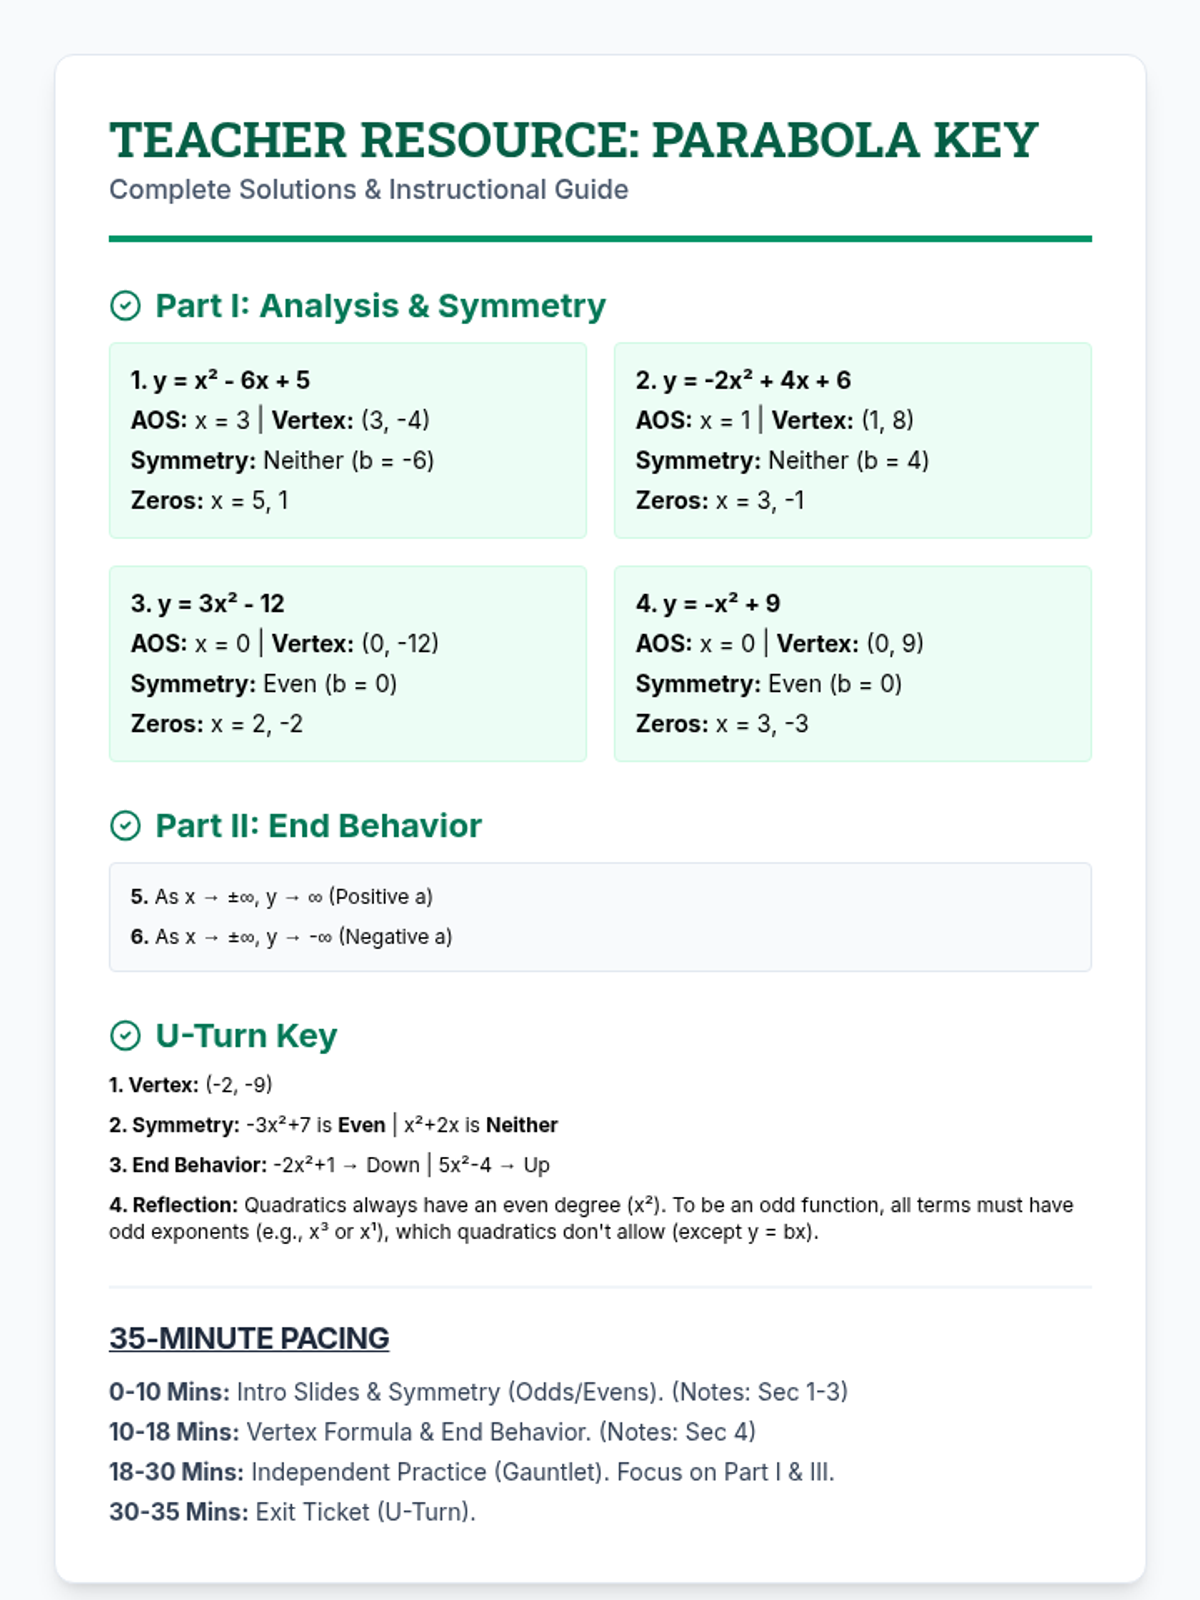
A comprehensive 35-minute lesson on graphing quadratic functions in standard form, covering vertex, axis of symmetry, end behavior, and zeros.
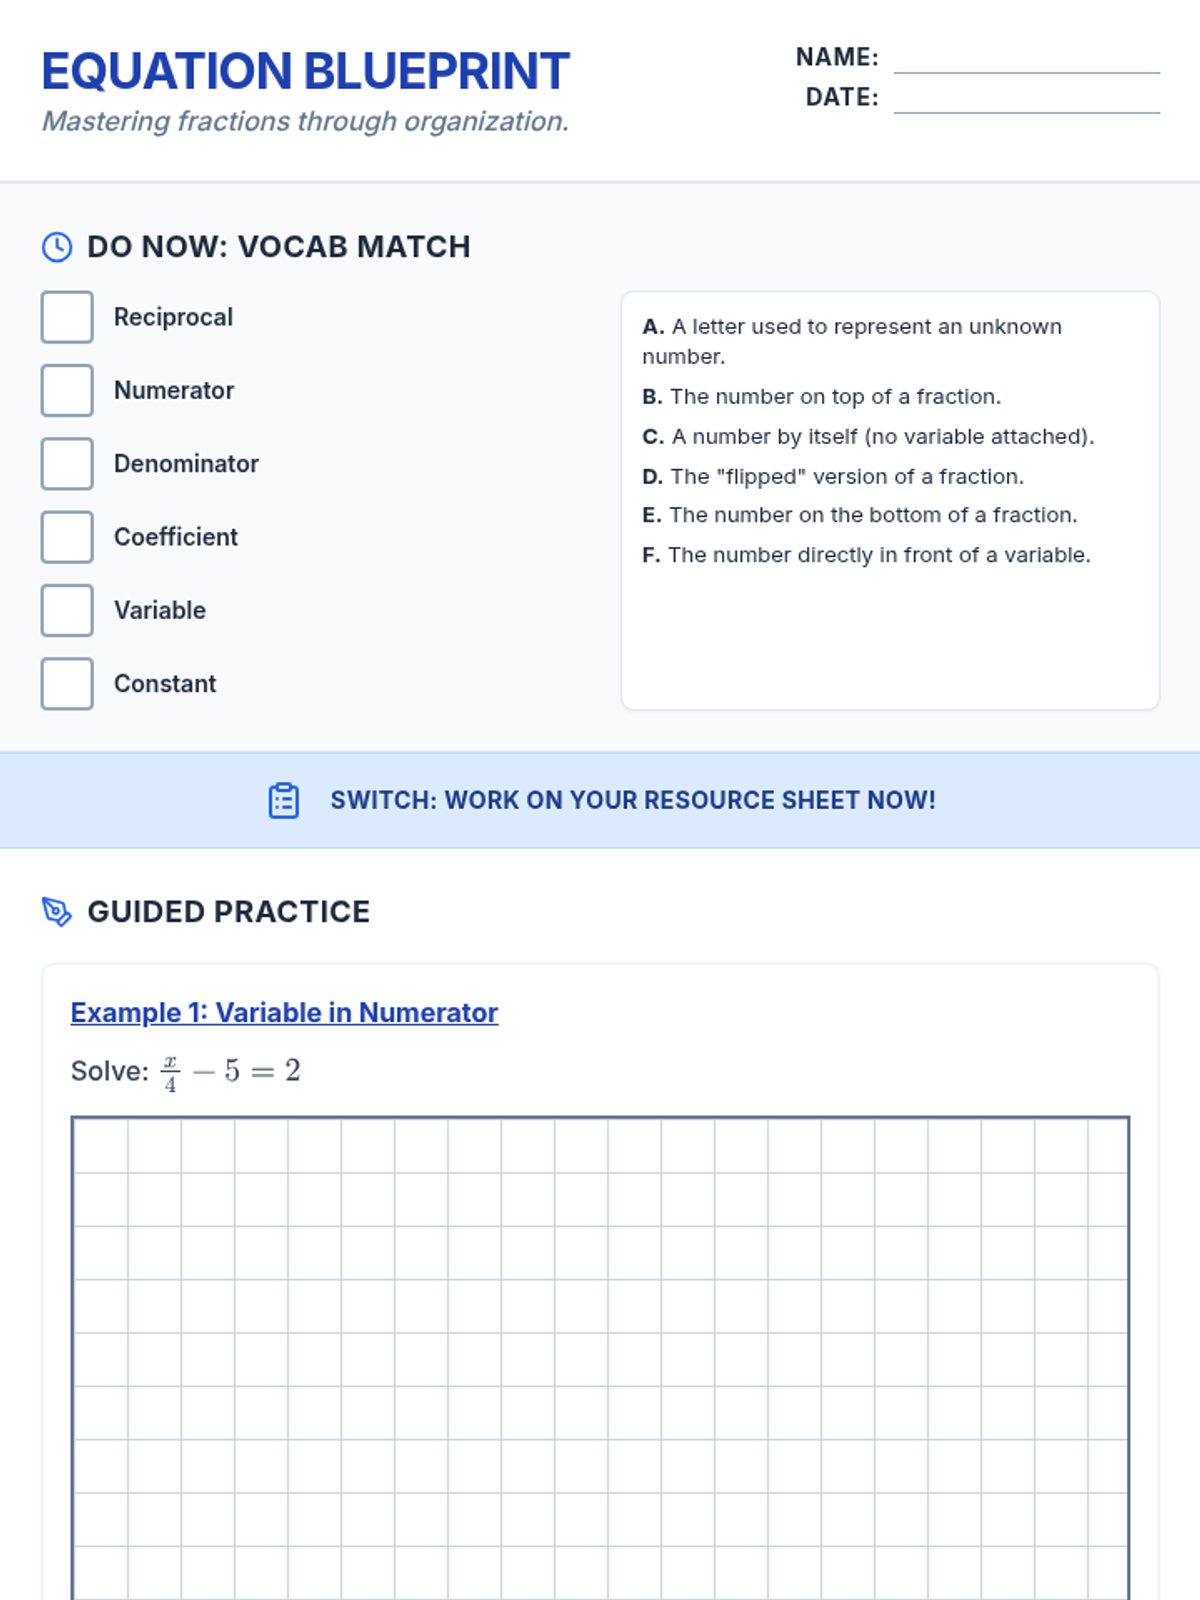
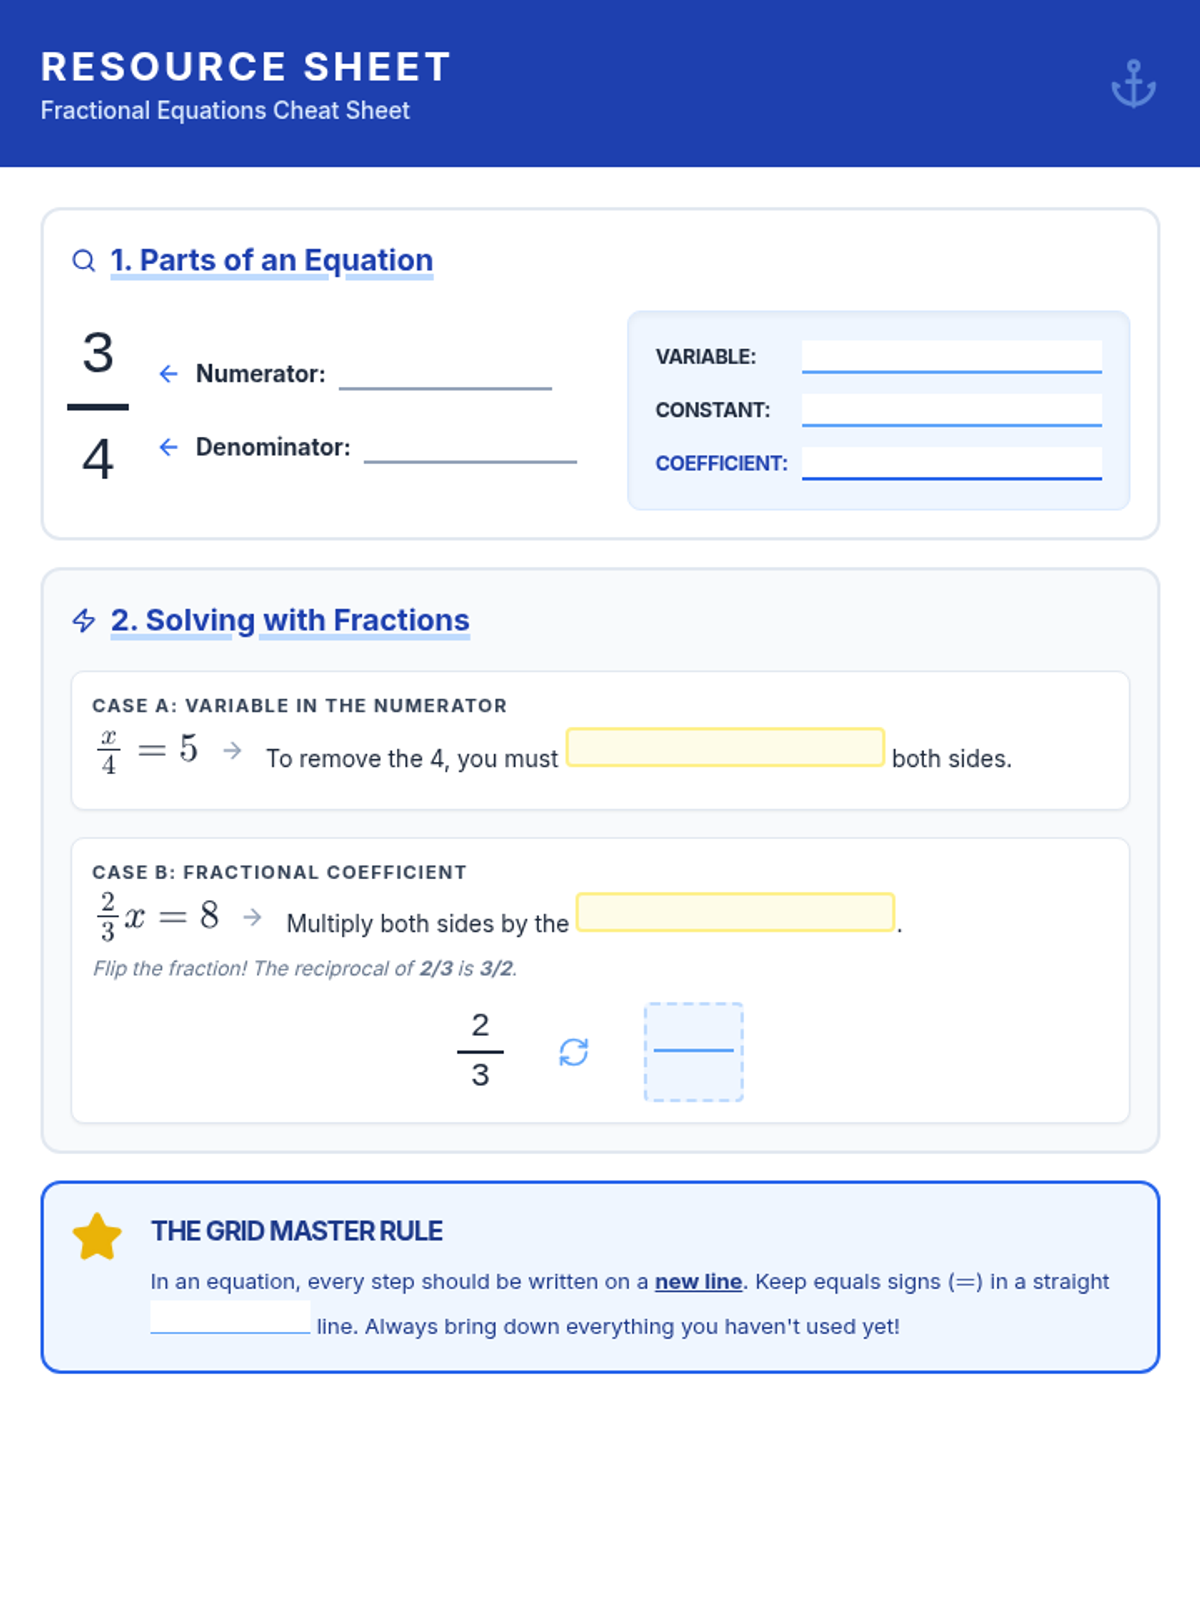
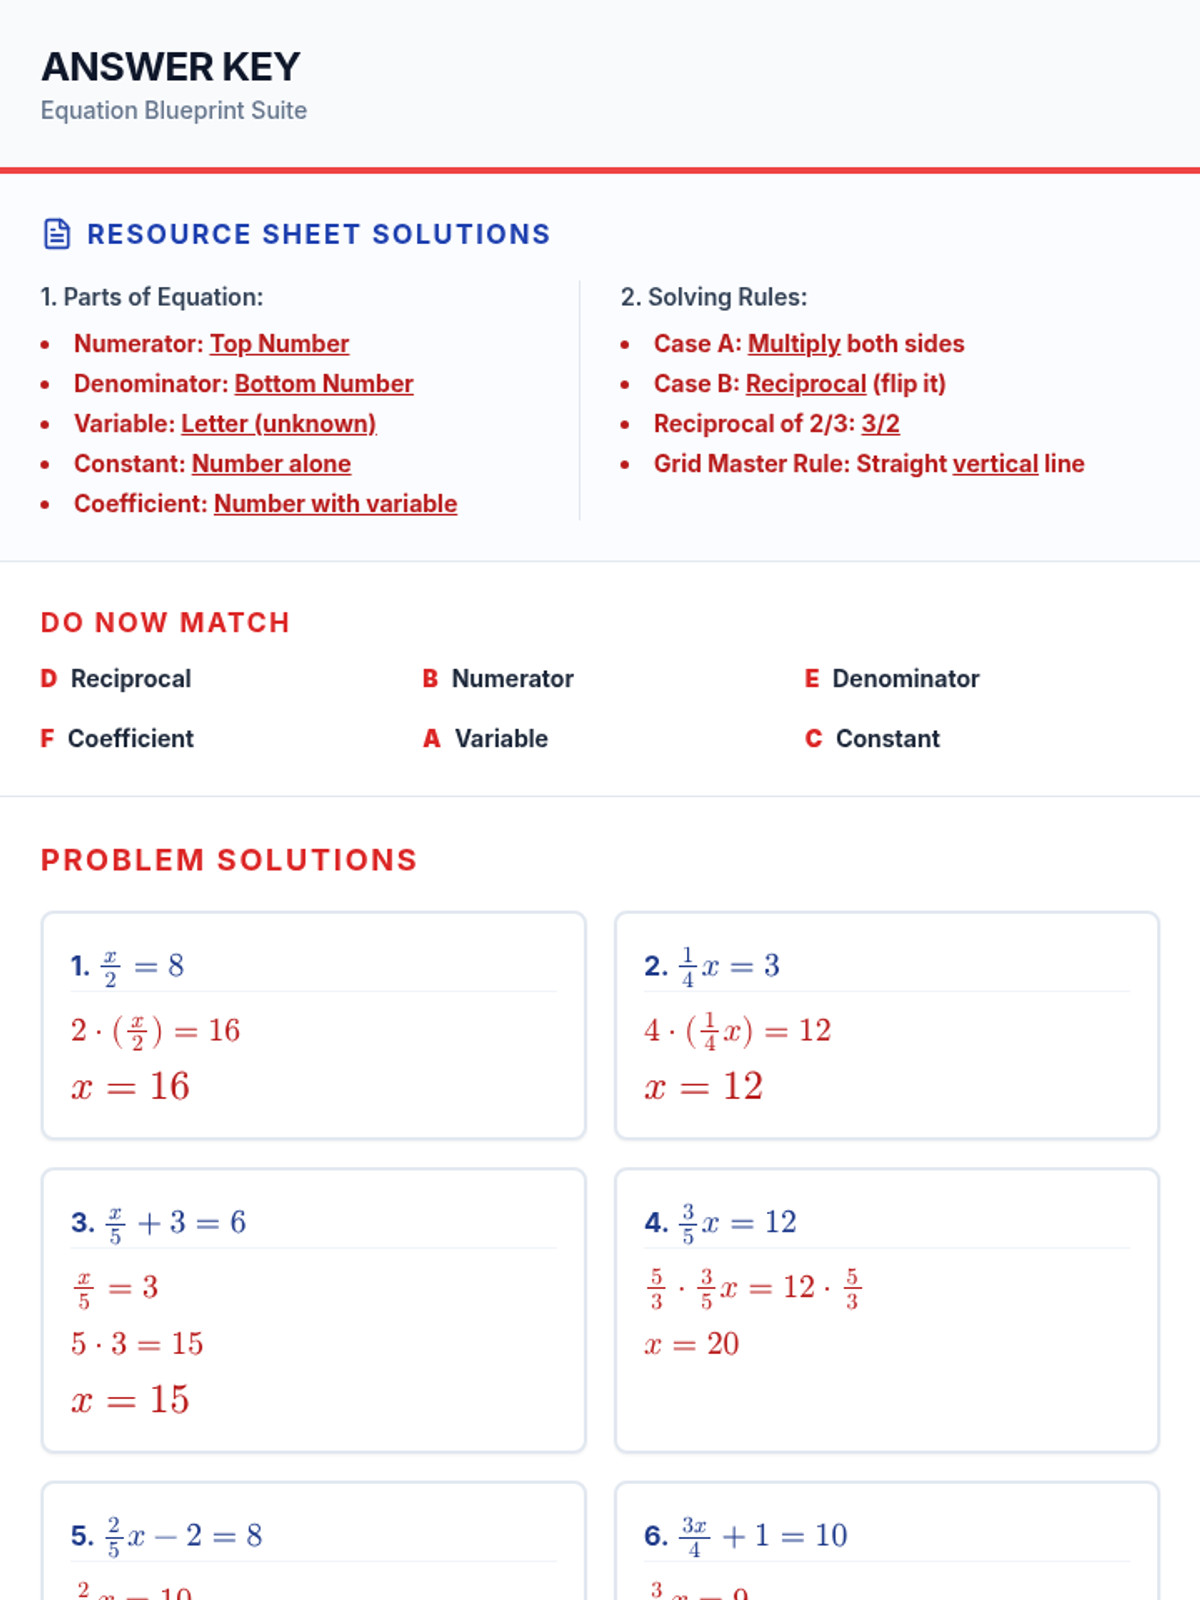
A math foundations lesson for 9th and 10th grade students focusing on solving equations with fractions through organized, line-by-line computation on grid-style layouts.
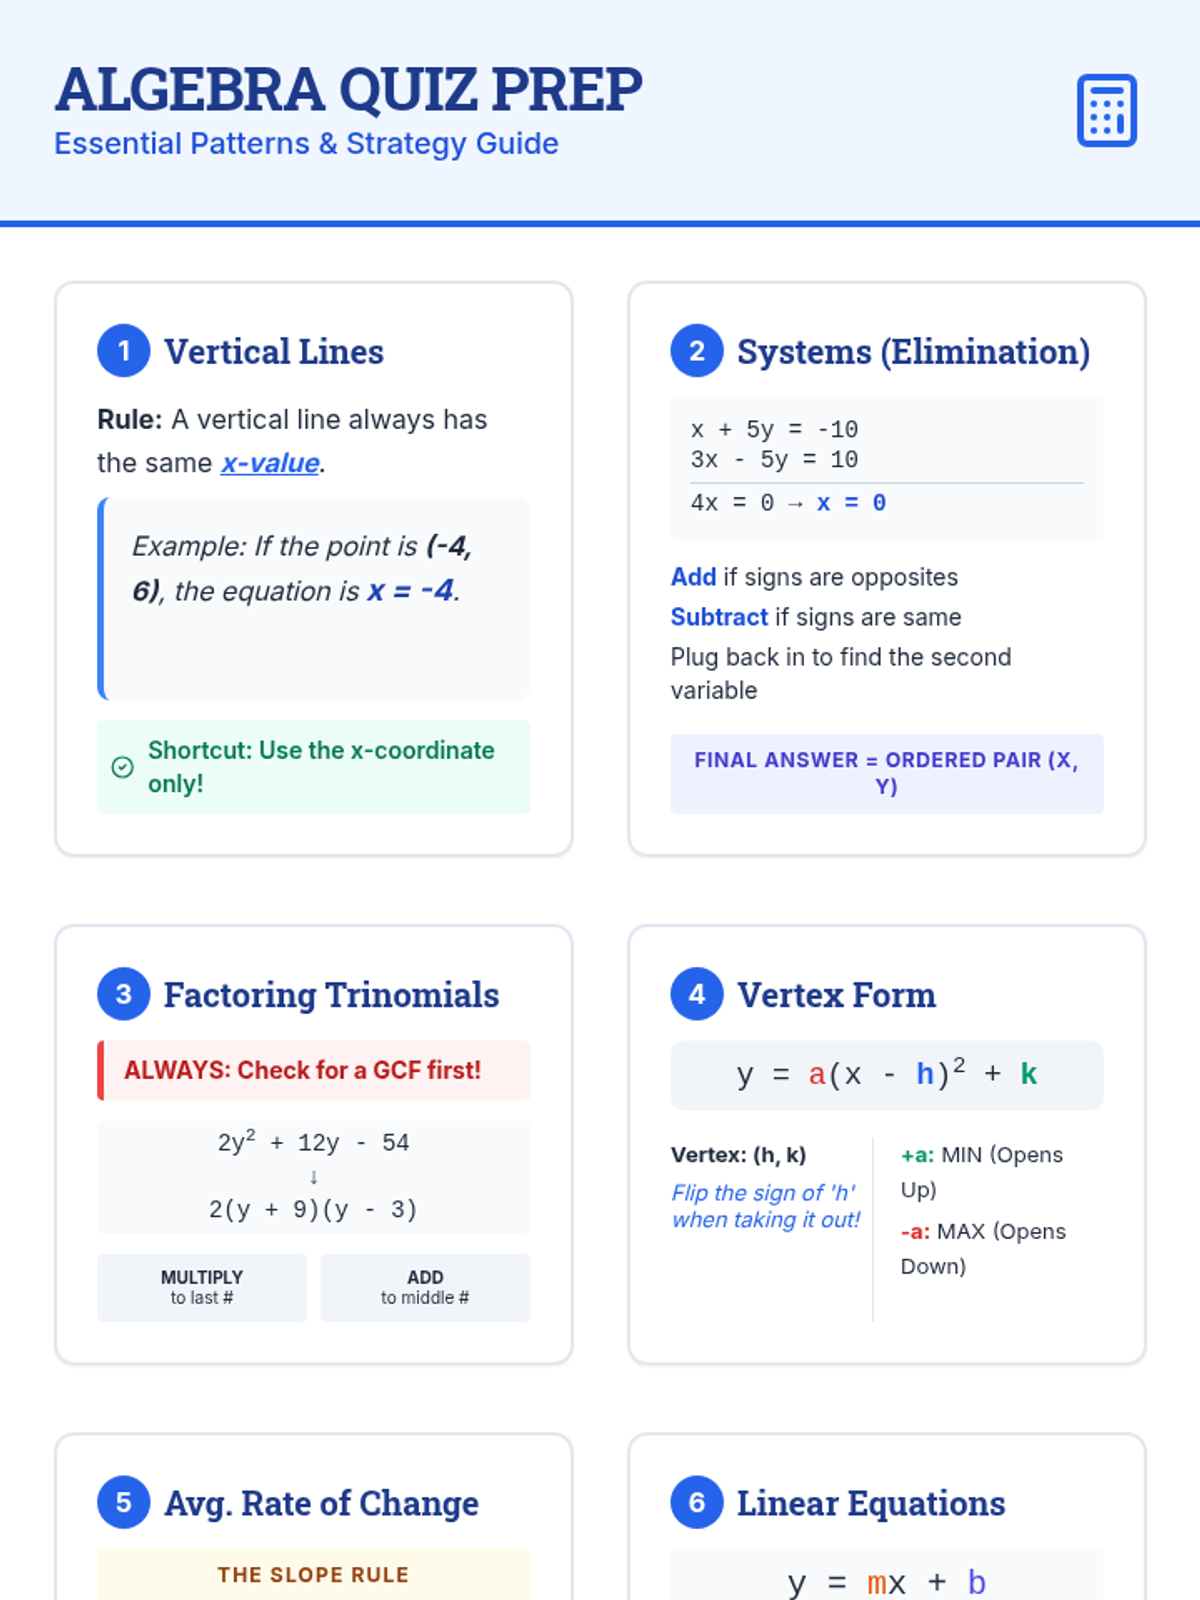
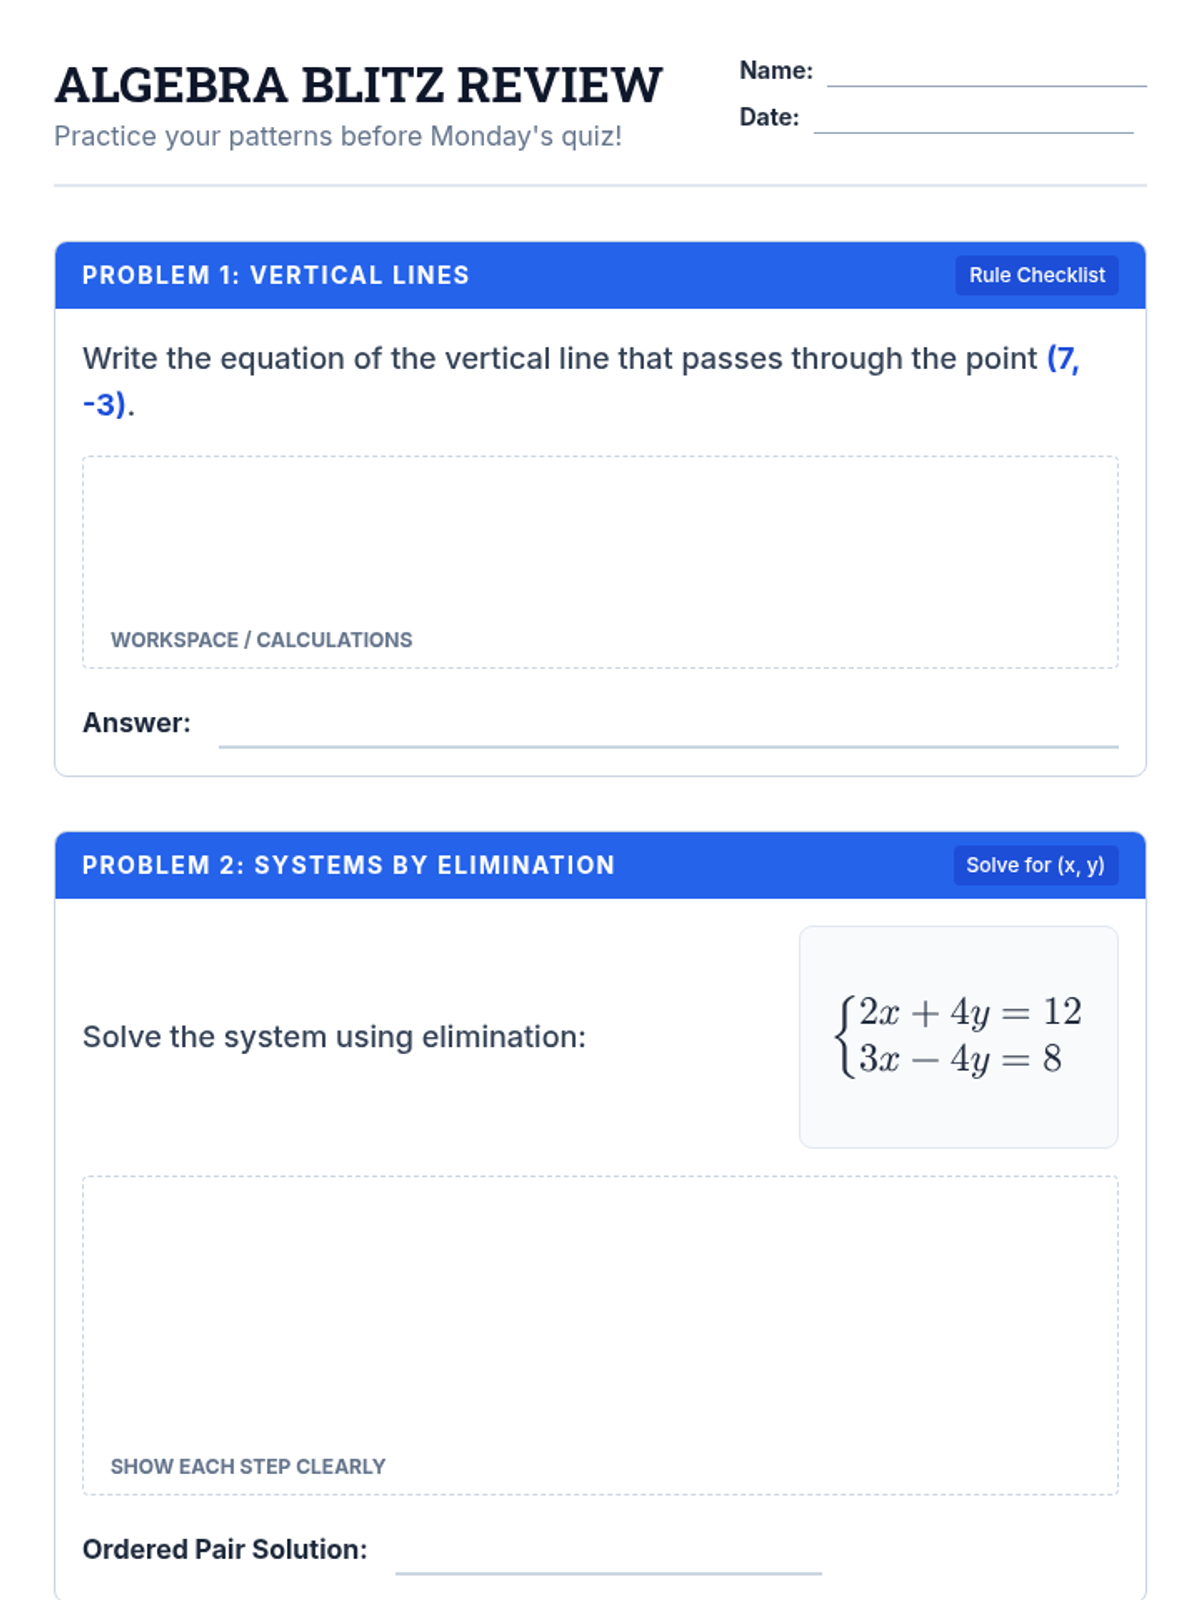
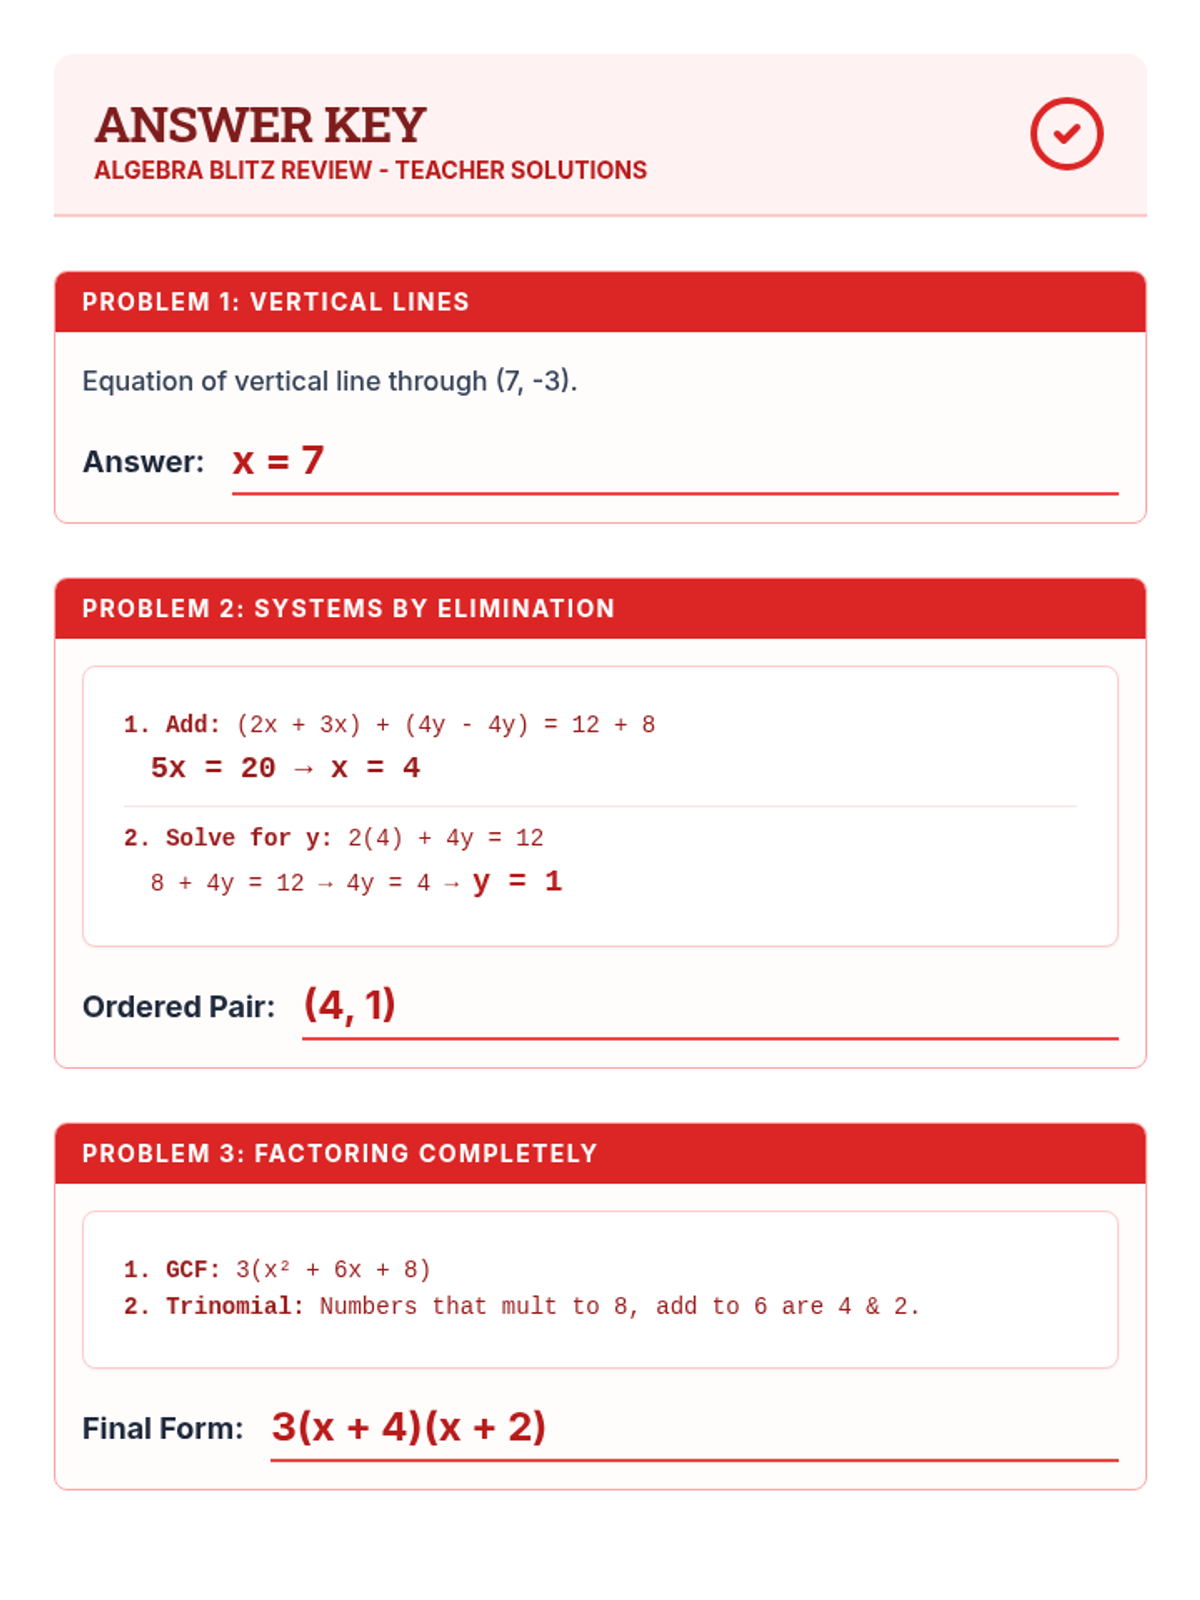
A comprehensive review lesson designed to prepare students for an upcoming Algebra quiz. It covers vertical lines, systems by elimination, factoring, vertex form, rate of change, and linear equations.
A comprehensive unit review and summative assessment covering three key methods for solving quadratic equations: graphing, factoring, and the quadratic formula. Students practice identifying key features of parabolas, algebraic manipulation for factoring, and the step-by-step application of the quadratic formula.
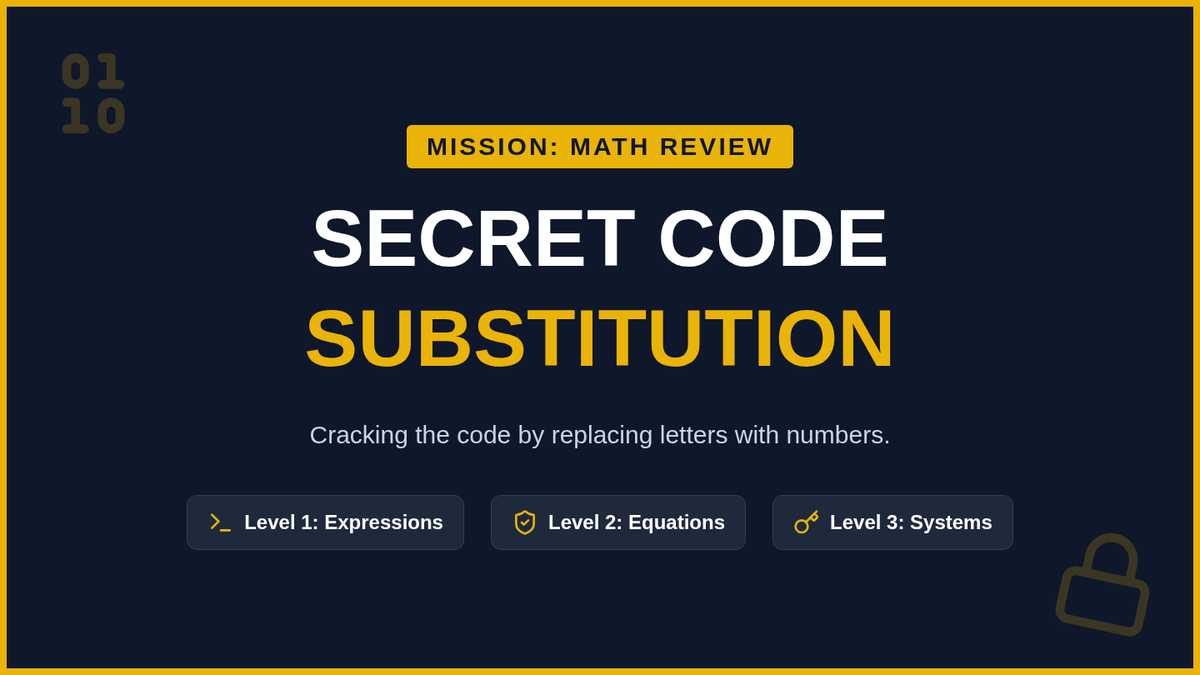
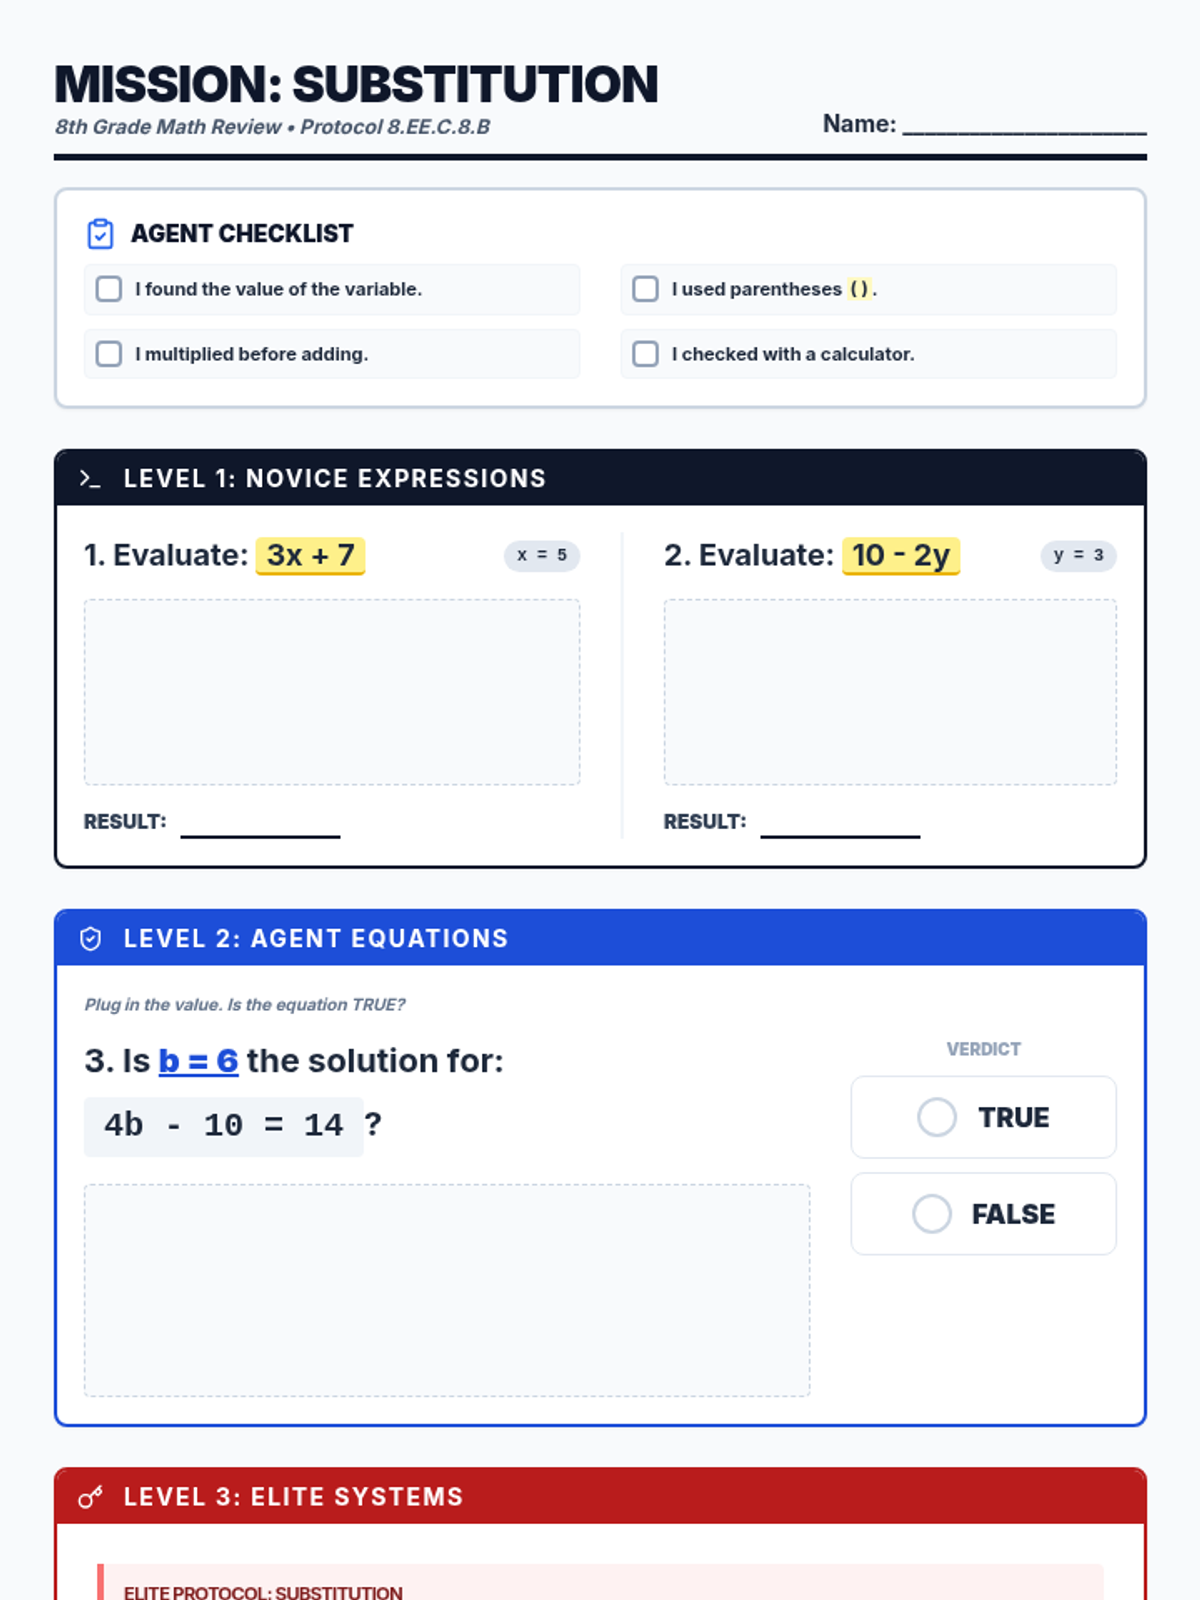
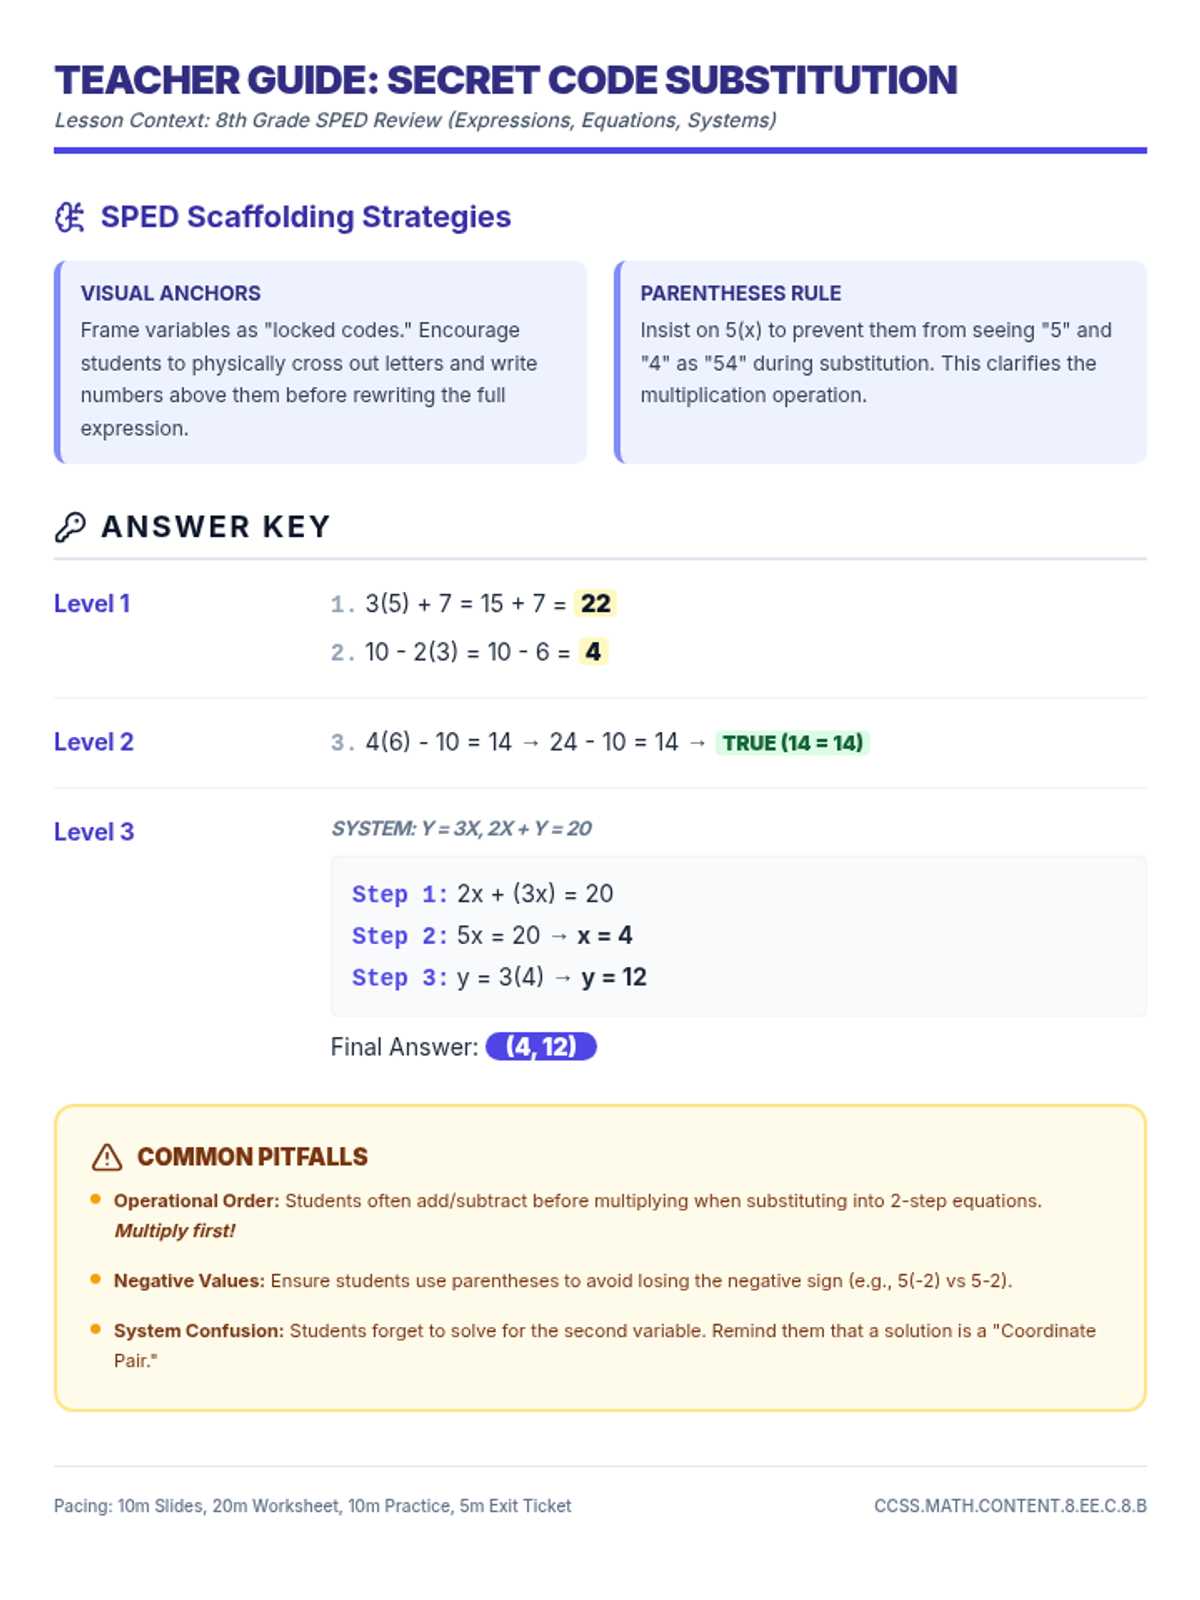
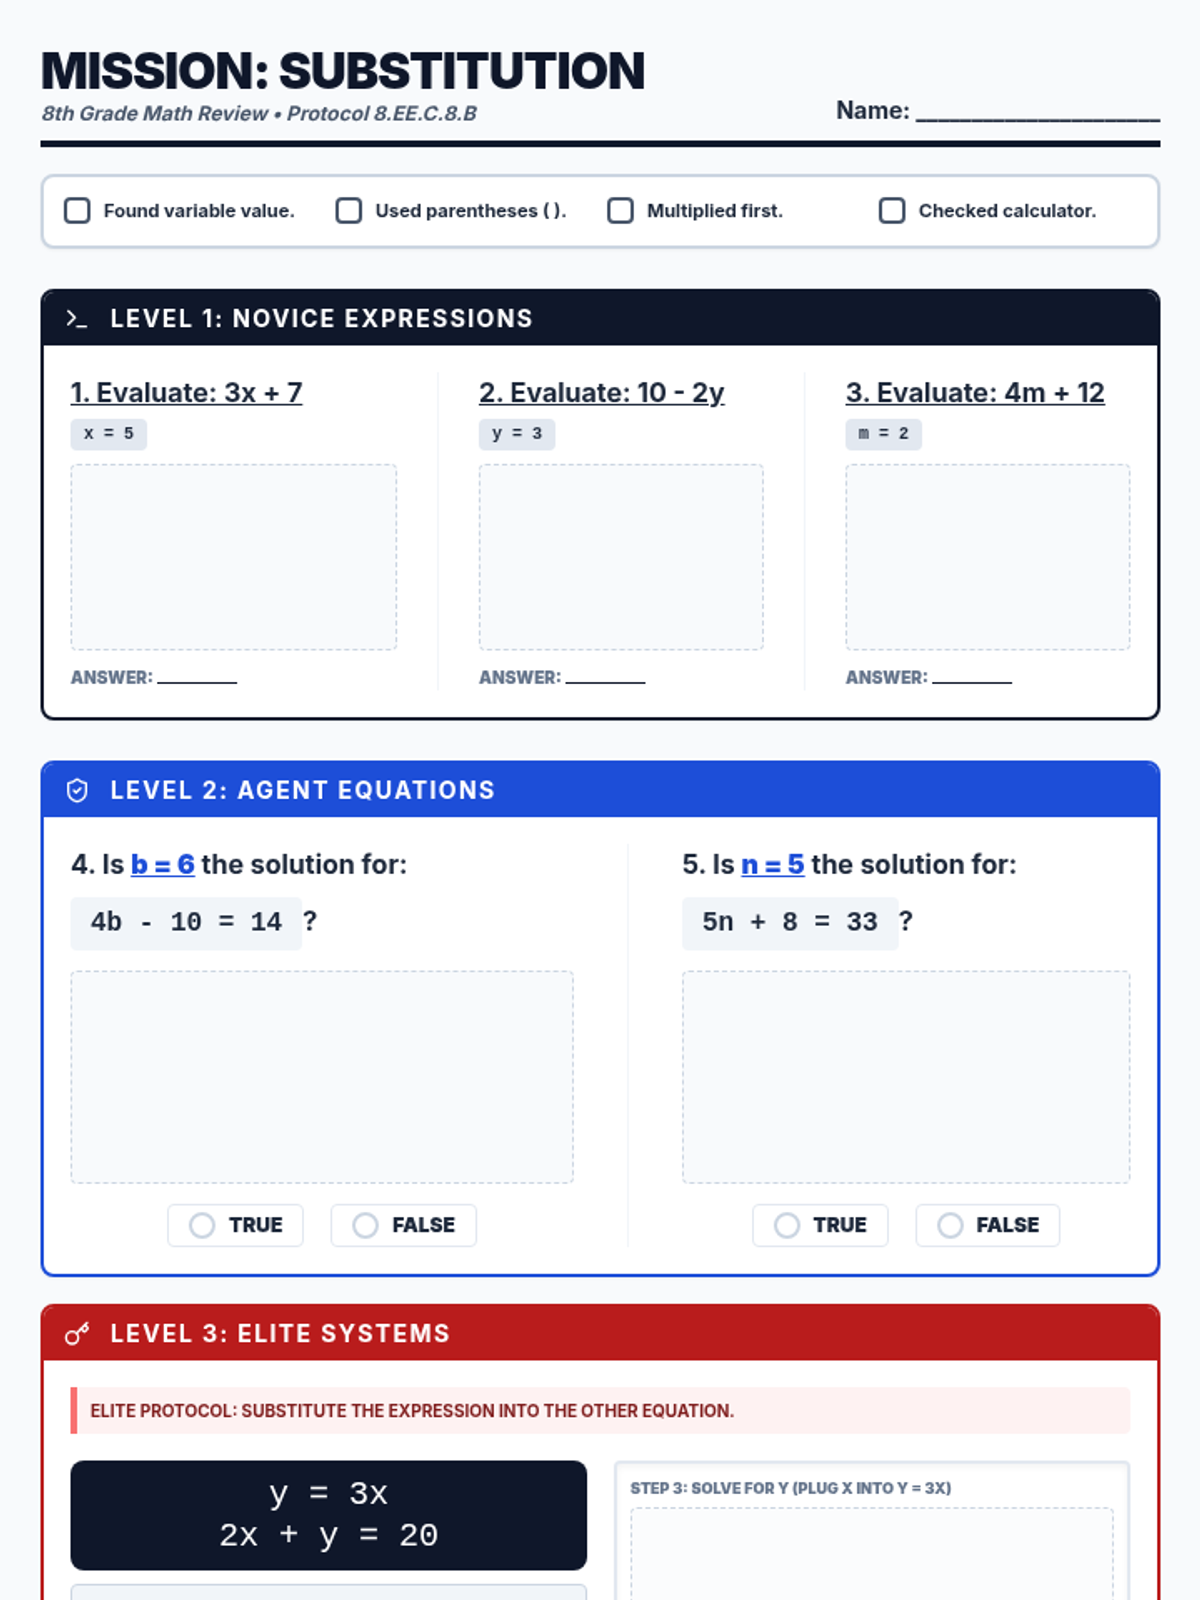
A focused math mini-lesson designed for 8th-grade special education students to review substitution across three levels: expressions, 2-step equations, and systems of equations. The lesson uses a 'Code Breaker' theme to make the abstract concepts more concrete and engaging.
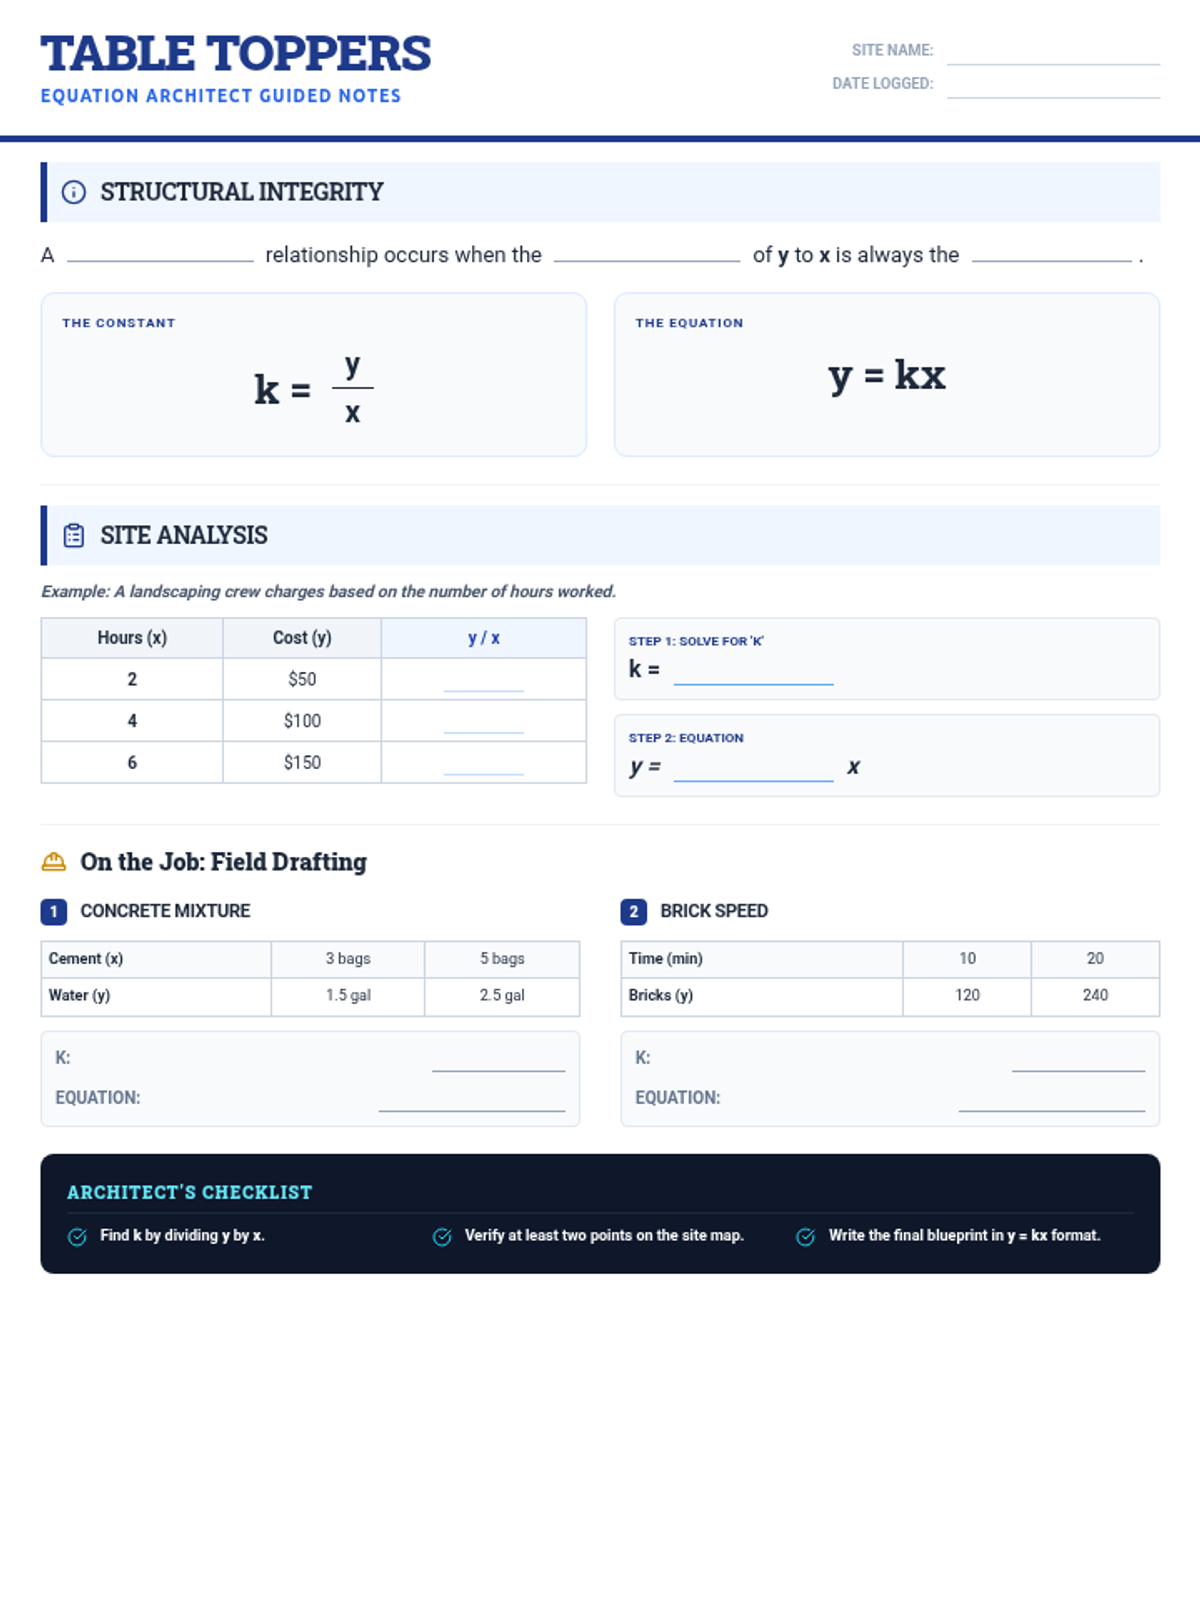
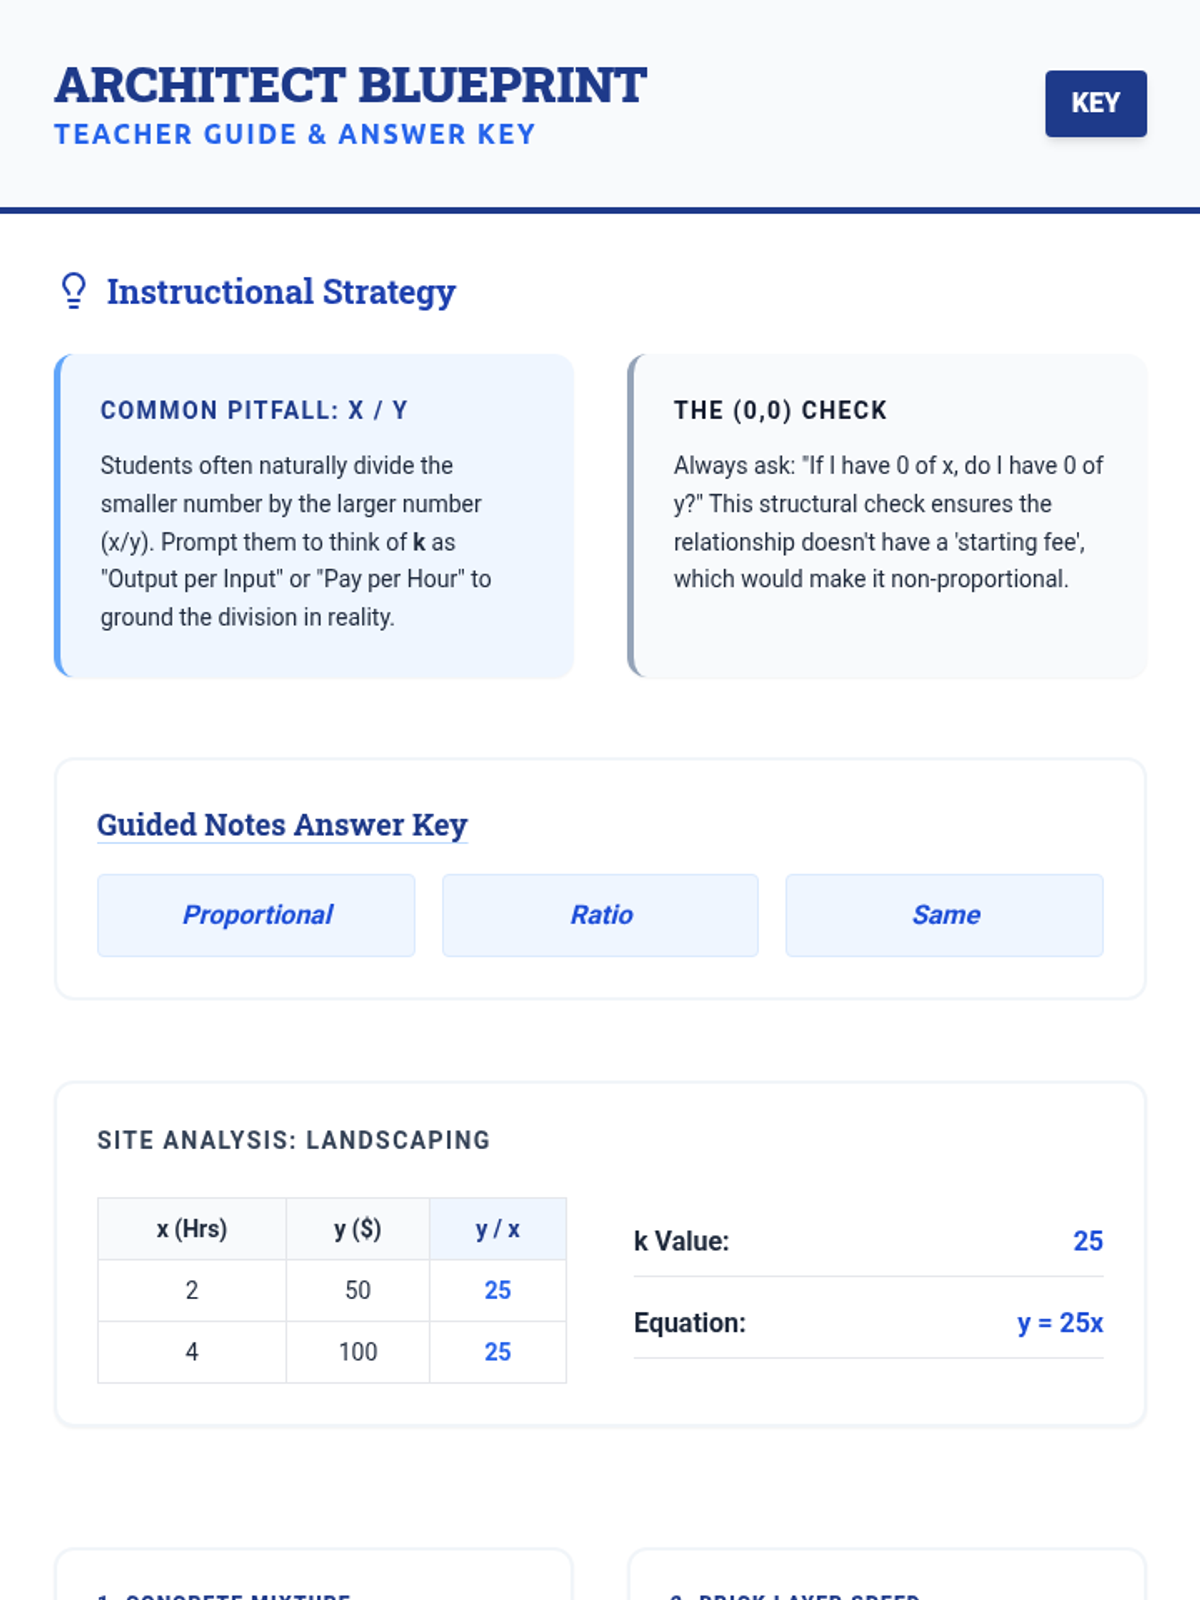
Master the art of writing linear equations from proportional tables using the architect's blueprint for constant of proportionality. Students will learn to identify the unit rate and construct y=kx equations with precision.
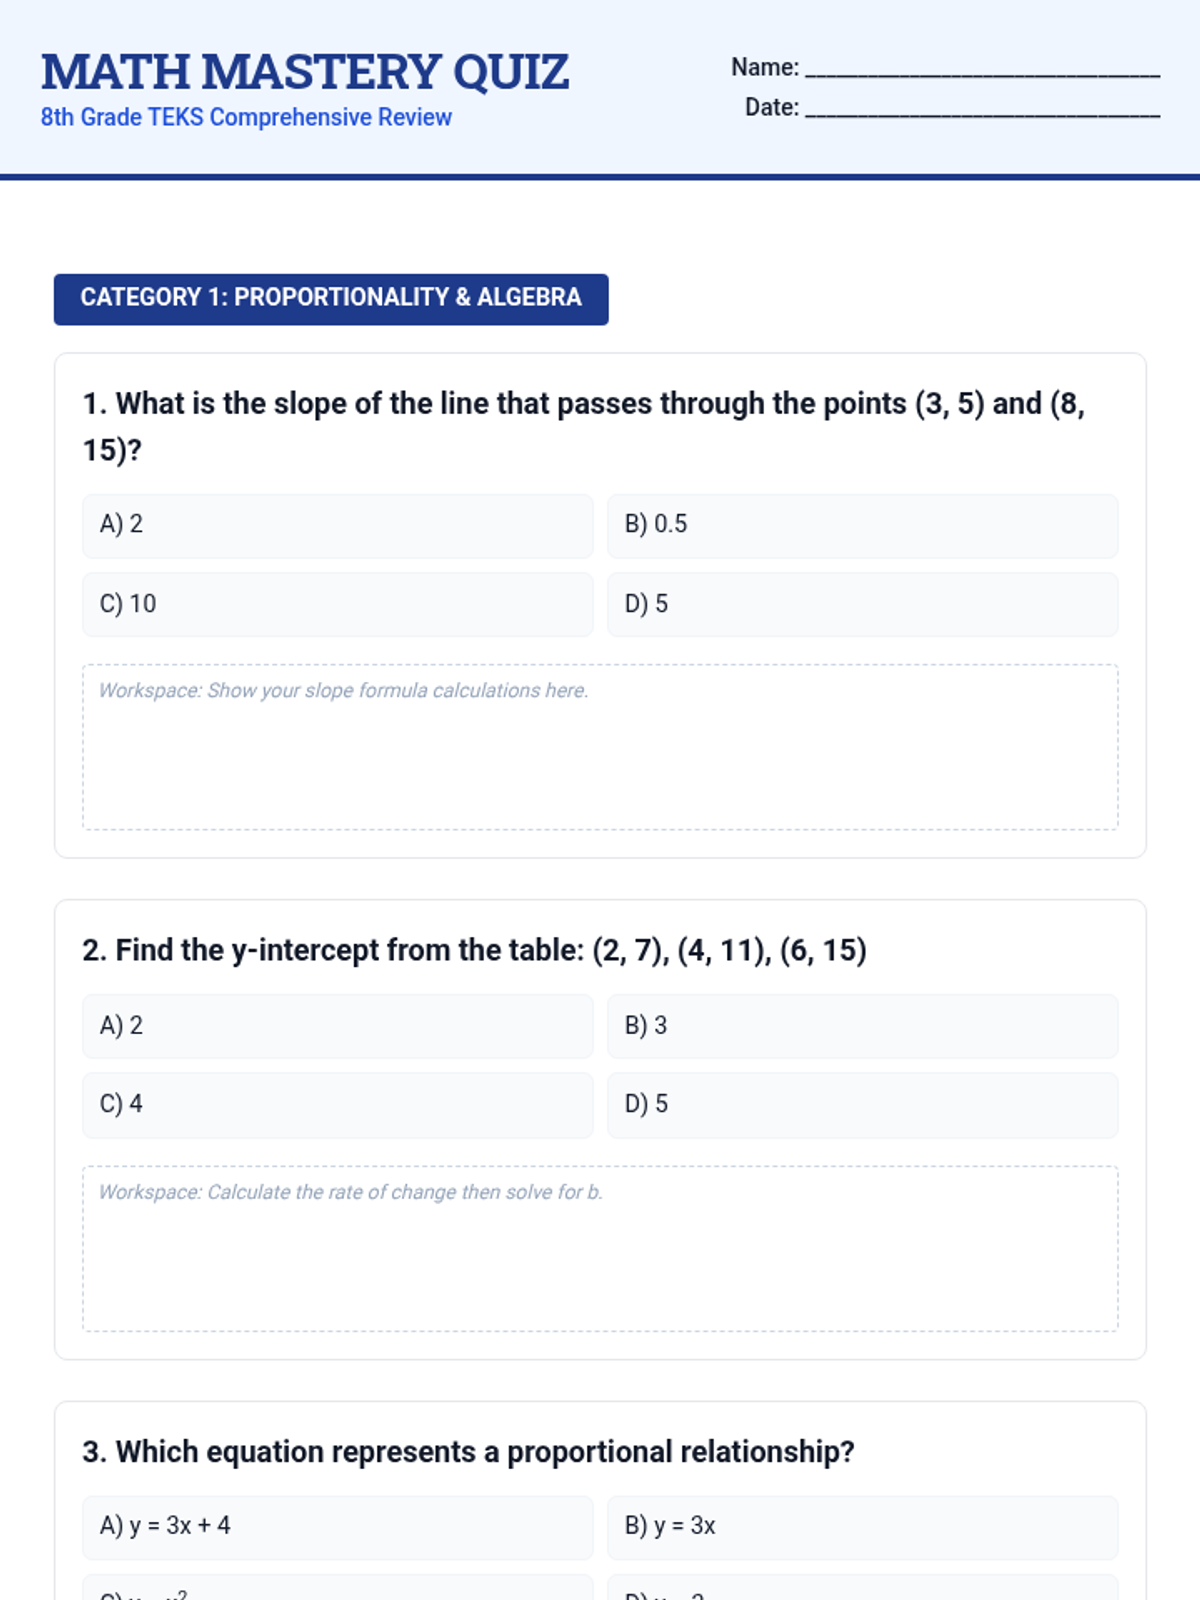
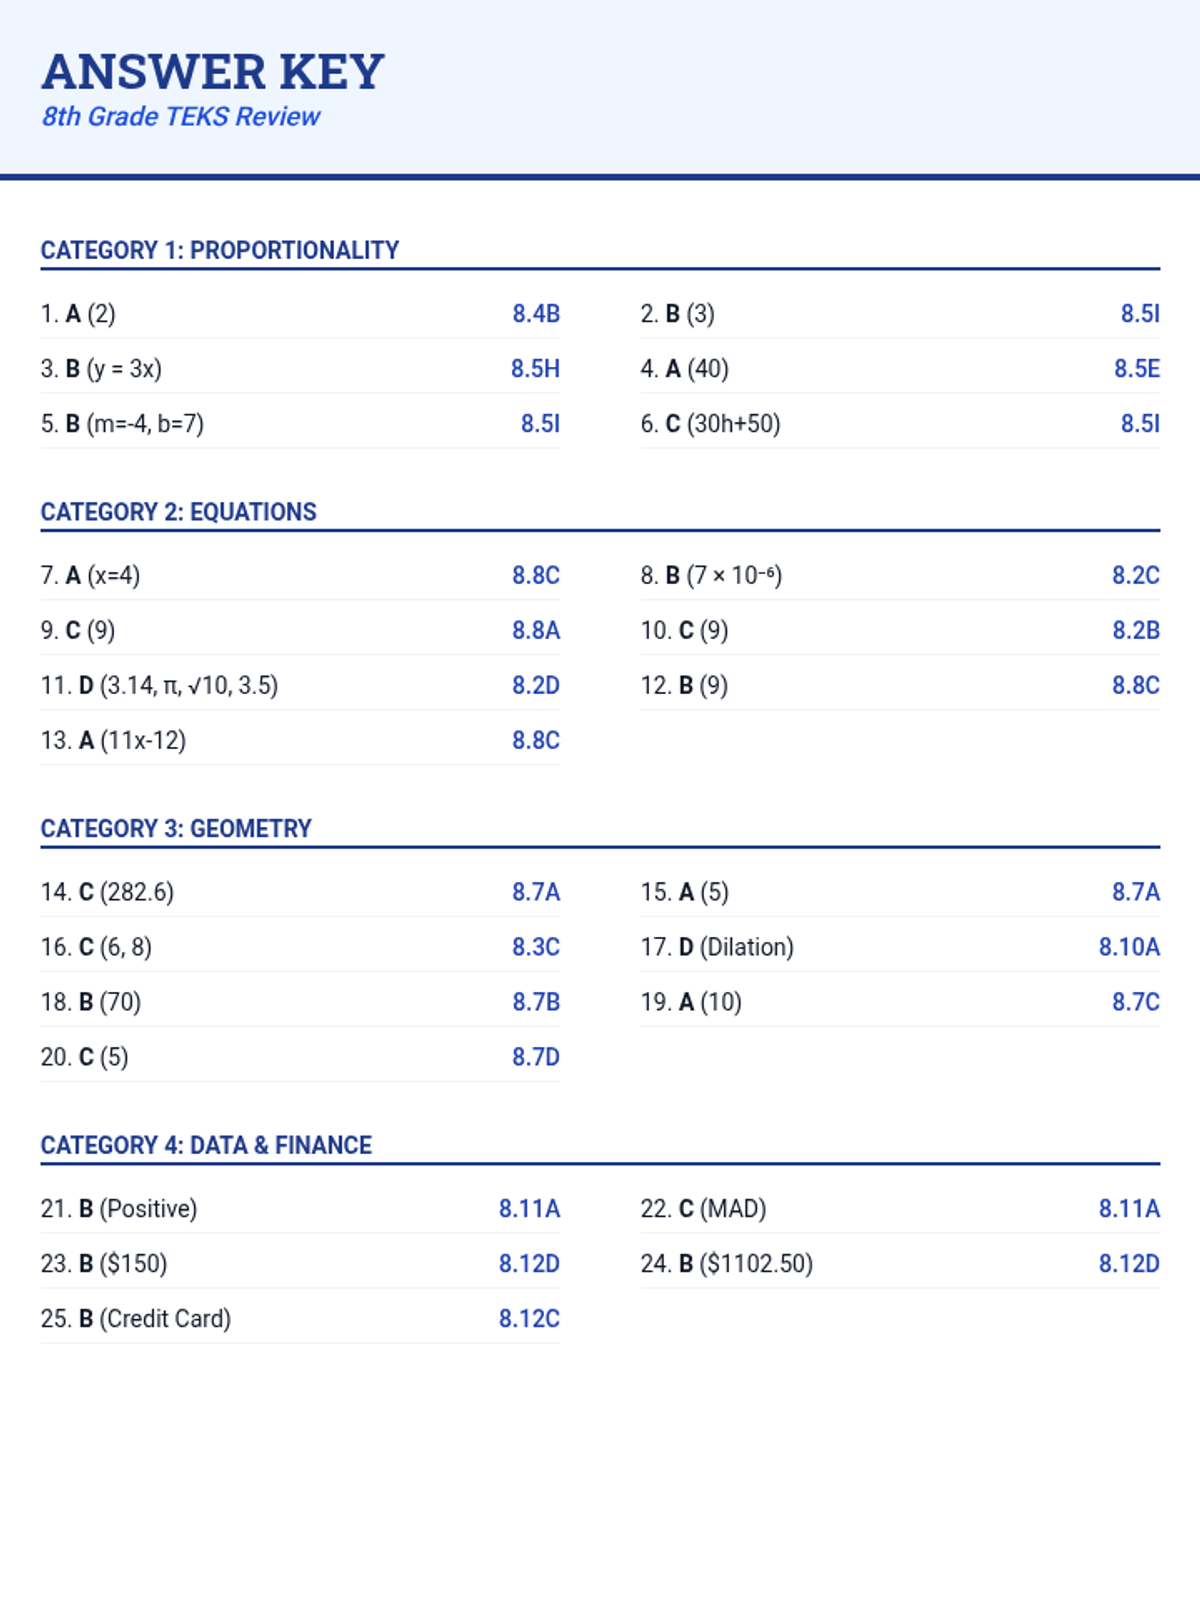
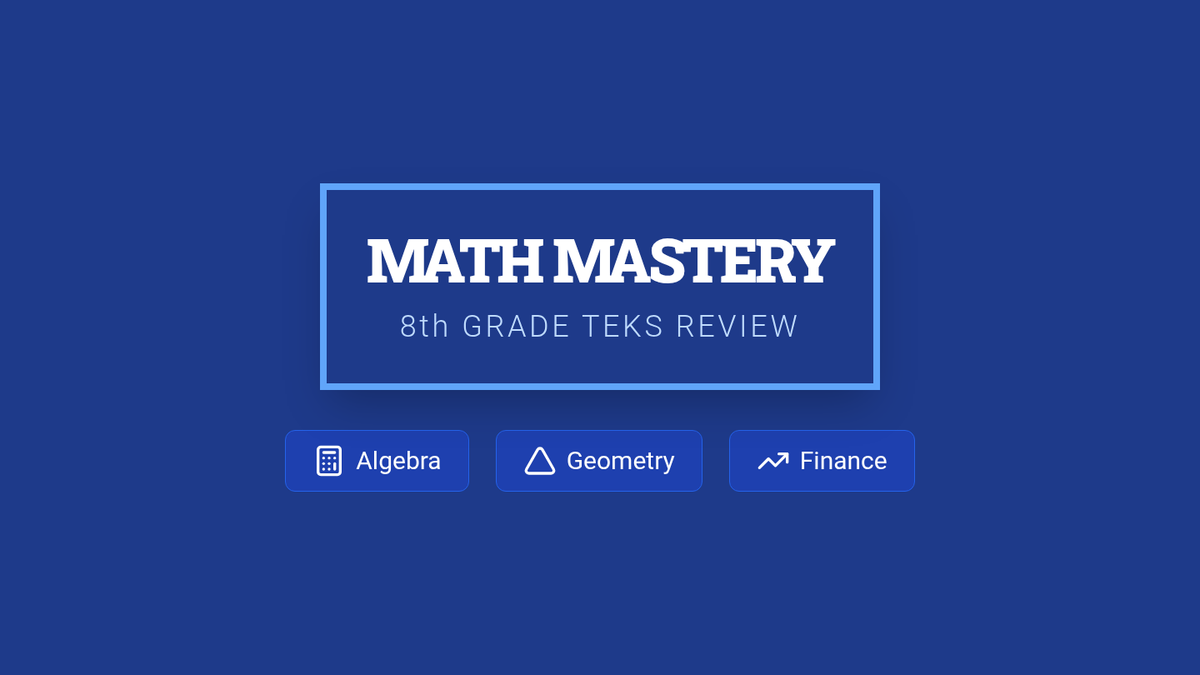
A comprehensive 8th-grade TEKS mathematics review focusing on Proportionality, Algebra, Expressions, Equations, Geometry, Measurement, and Data Analysis. This lesson includes a diagnostic quiz and a supporting presentation for classroom review.
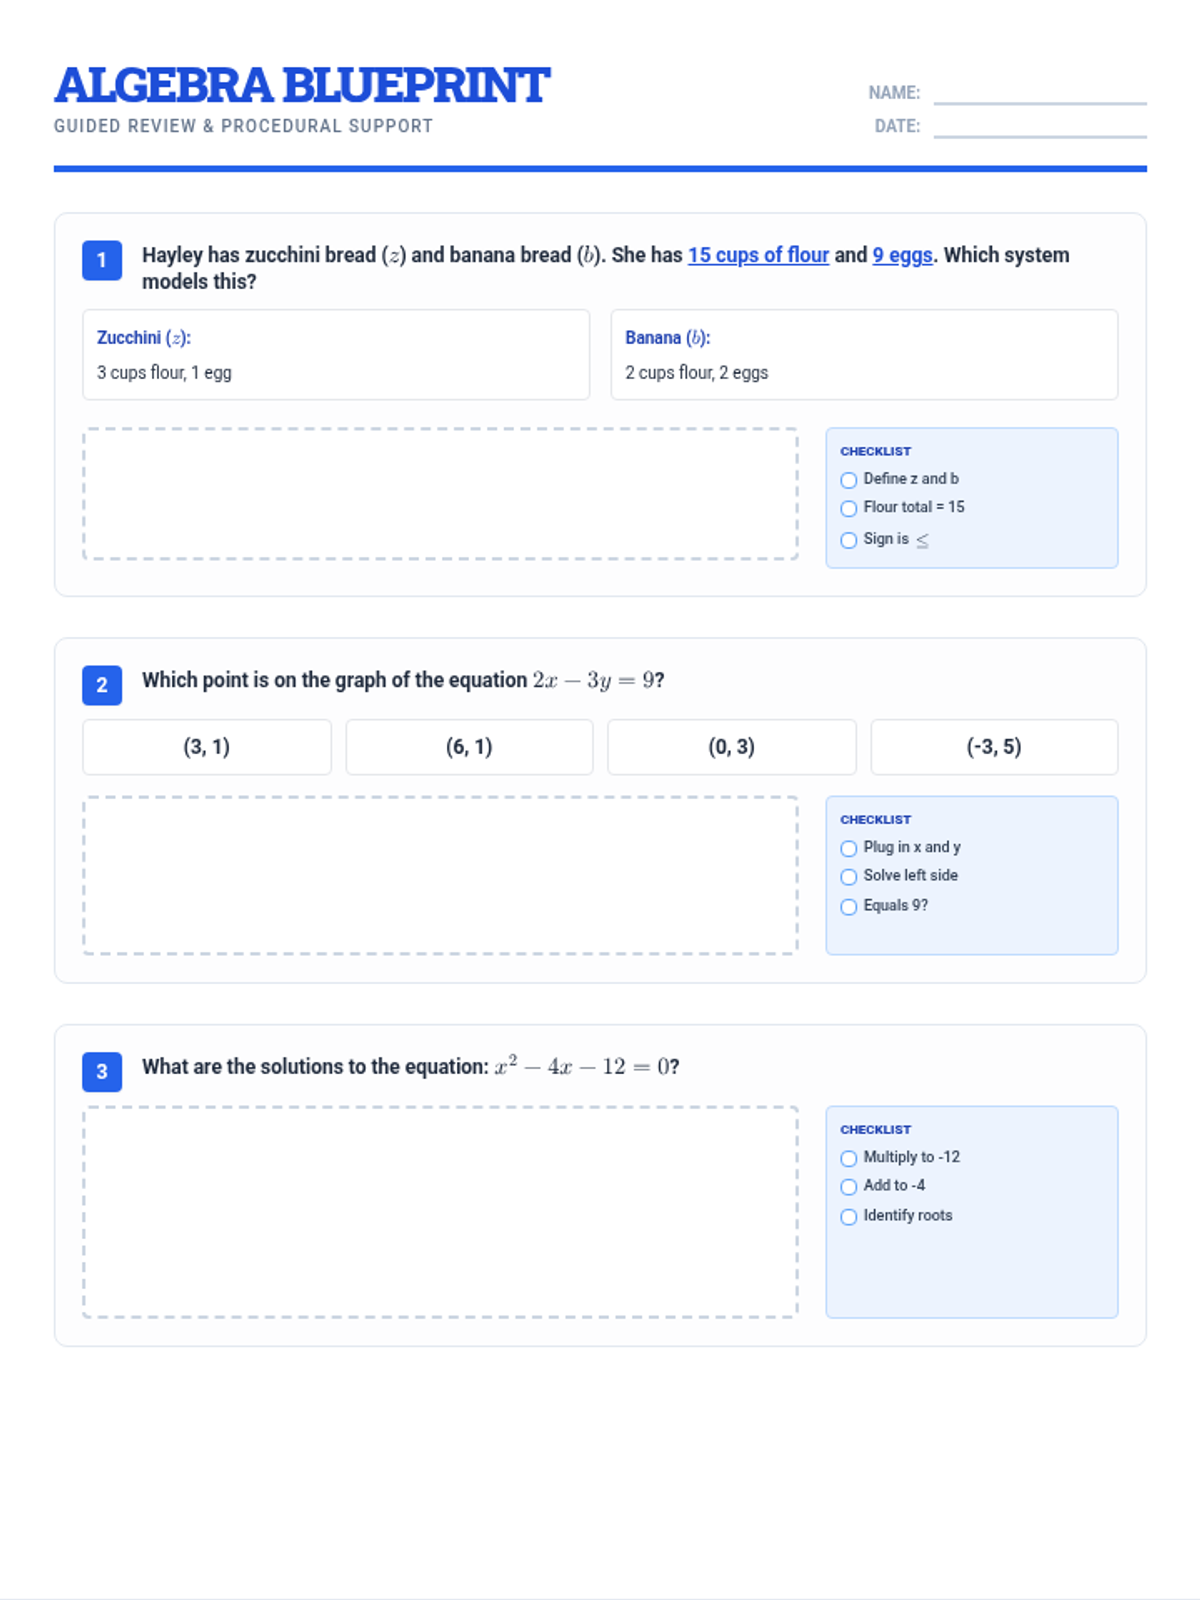
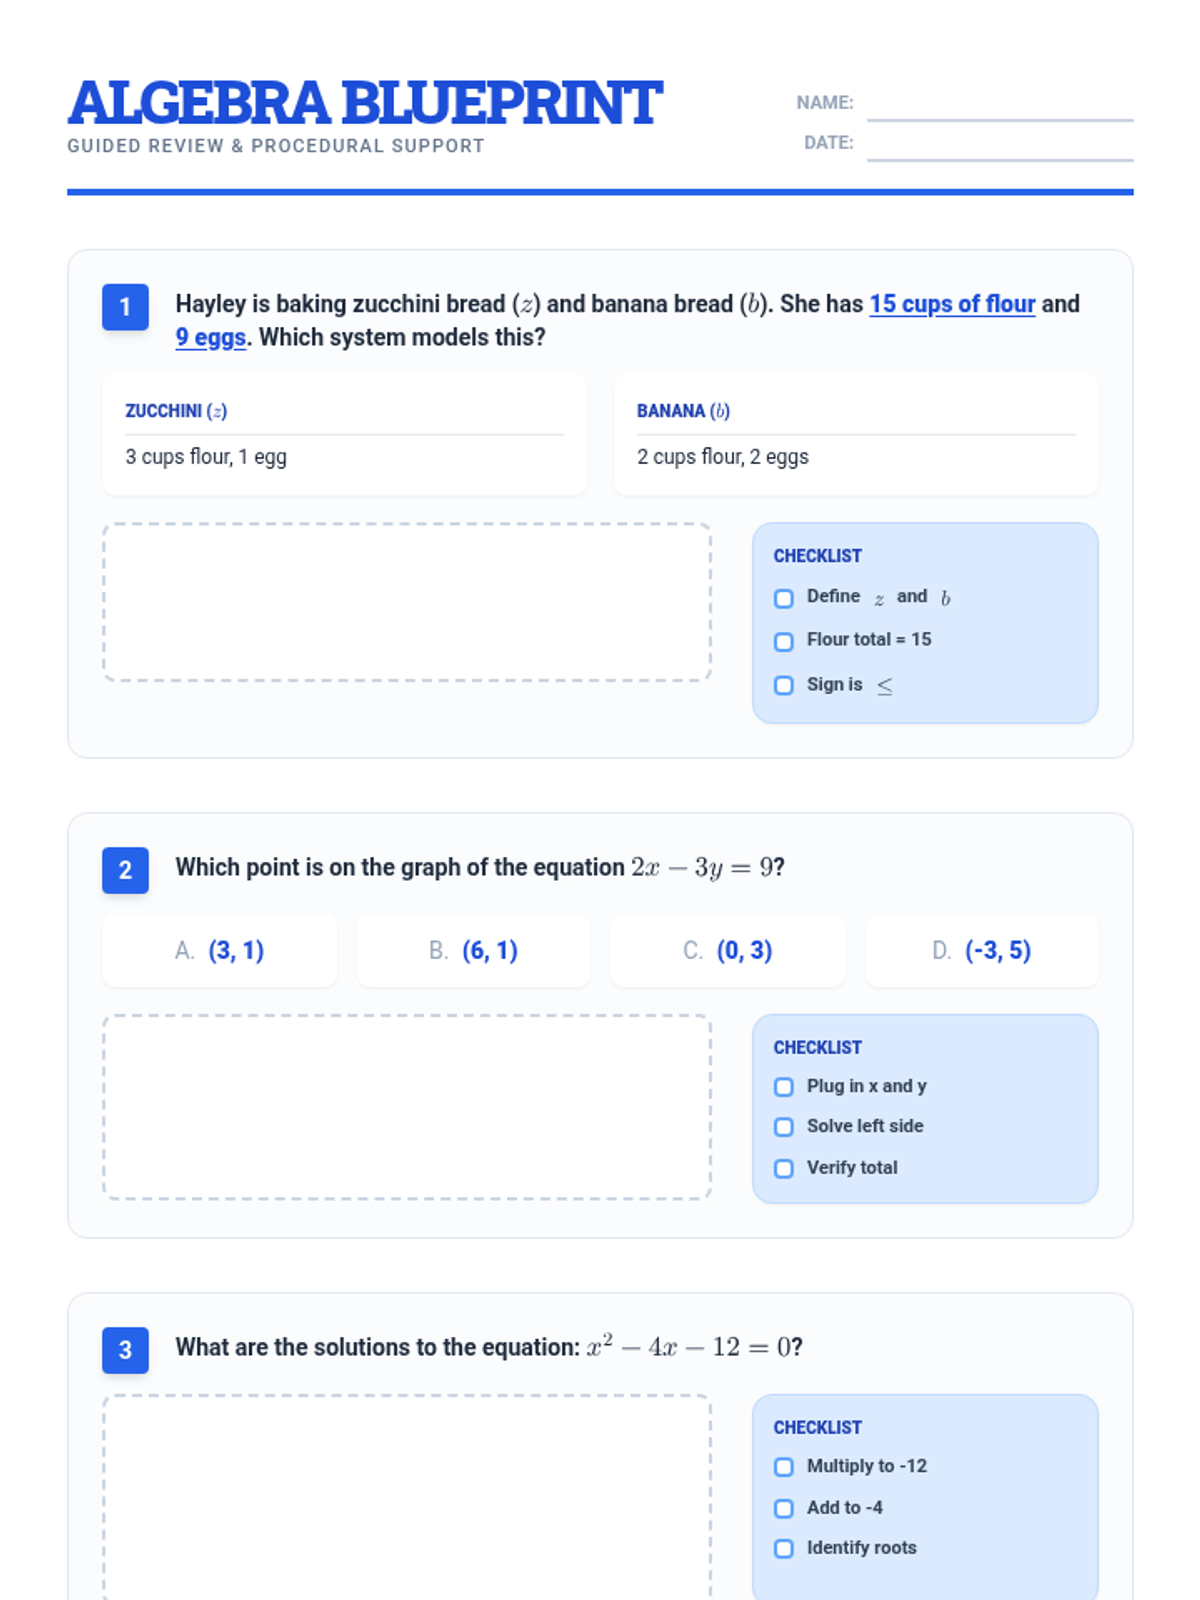
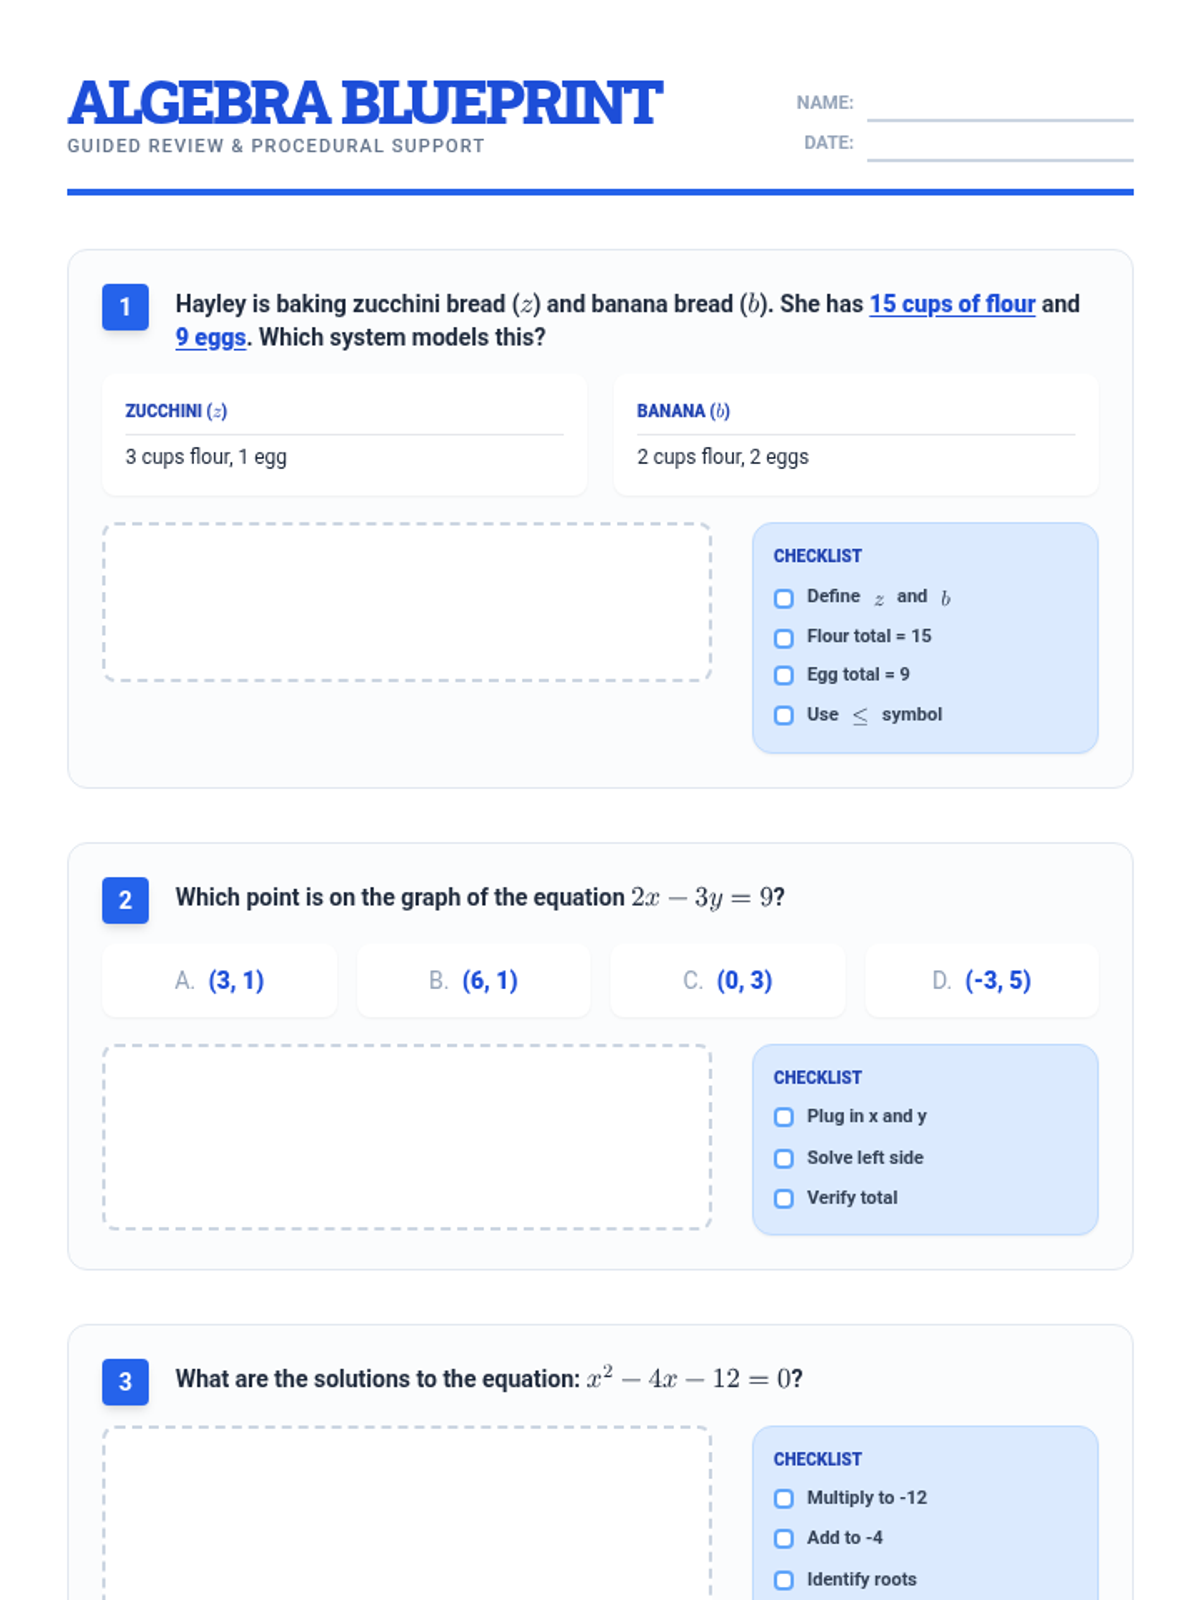
This lesson provides a guided review of core Algebra 1 concepts including systems of linear inequalities, transformations of functions, and quadratic equations. It features a step-by-step checklist approach to support students in breaking down complex multi-step problems.
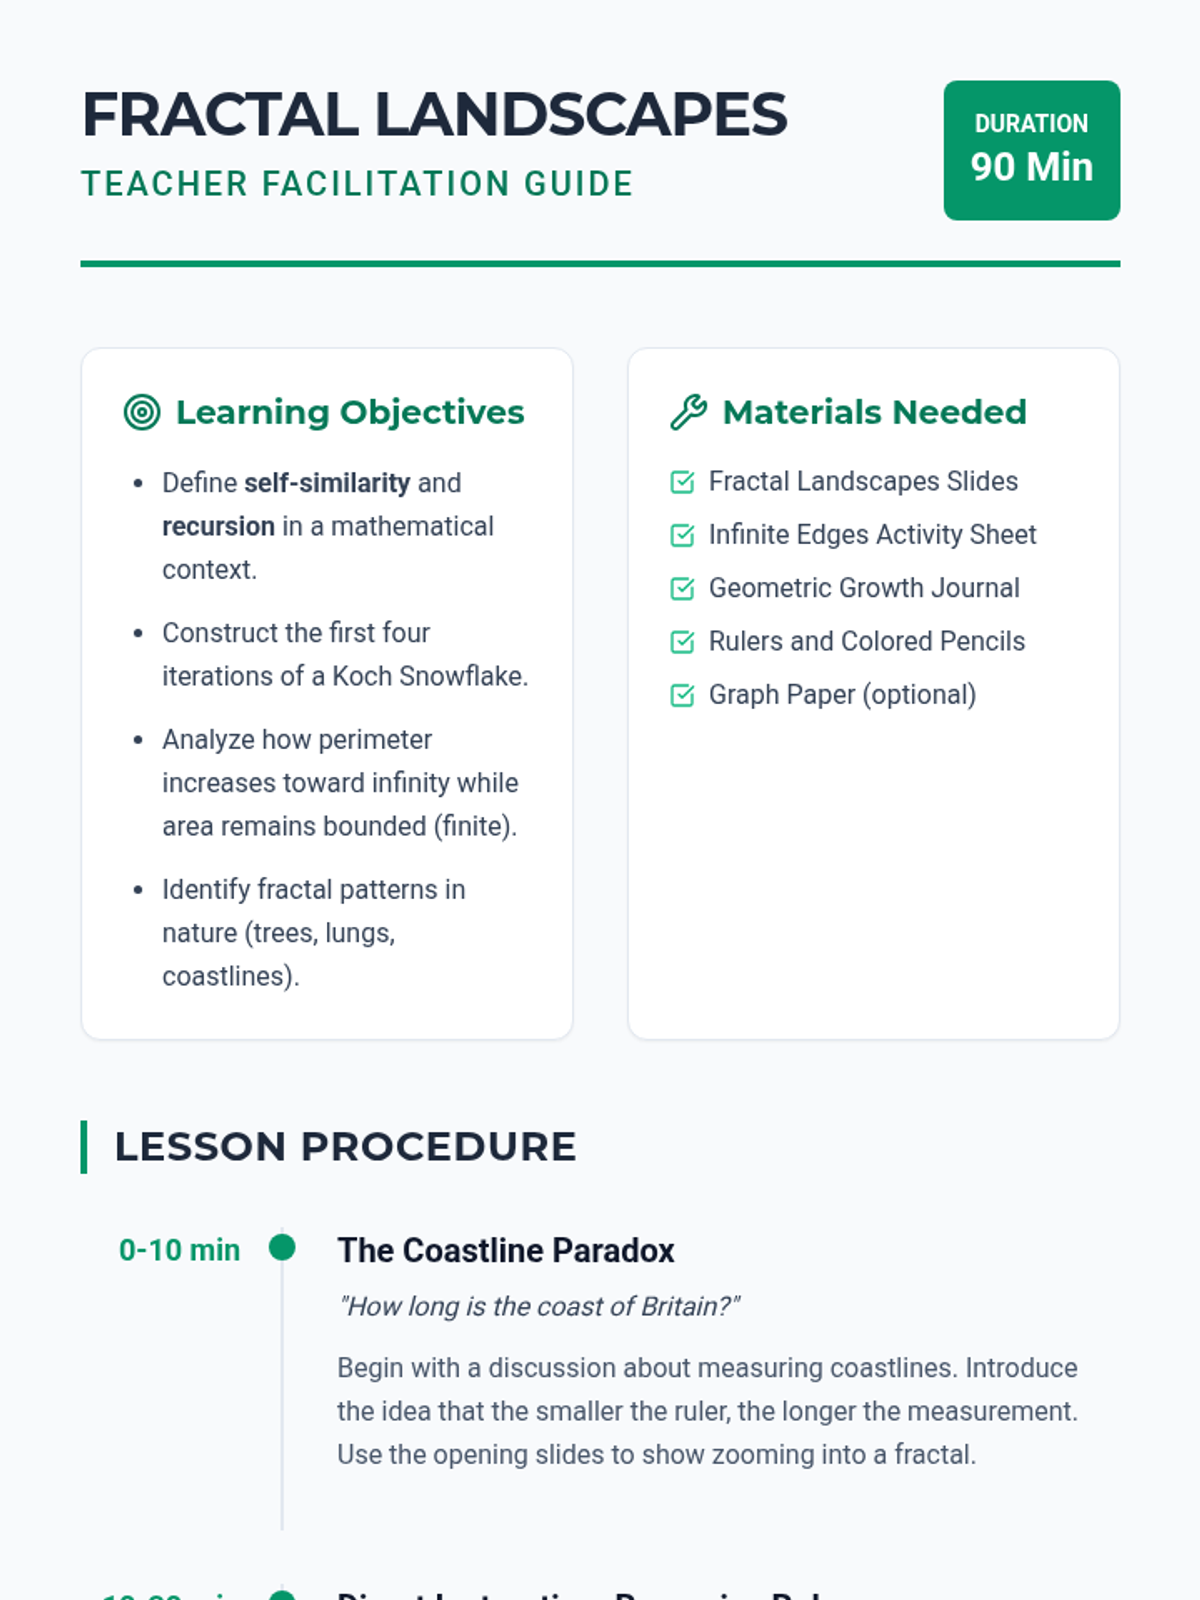
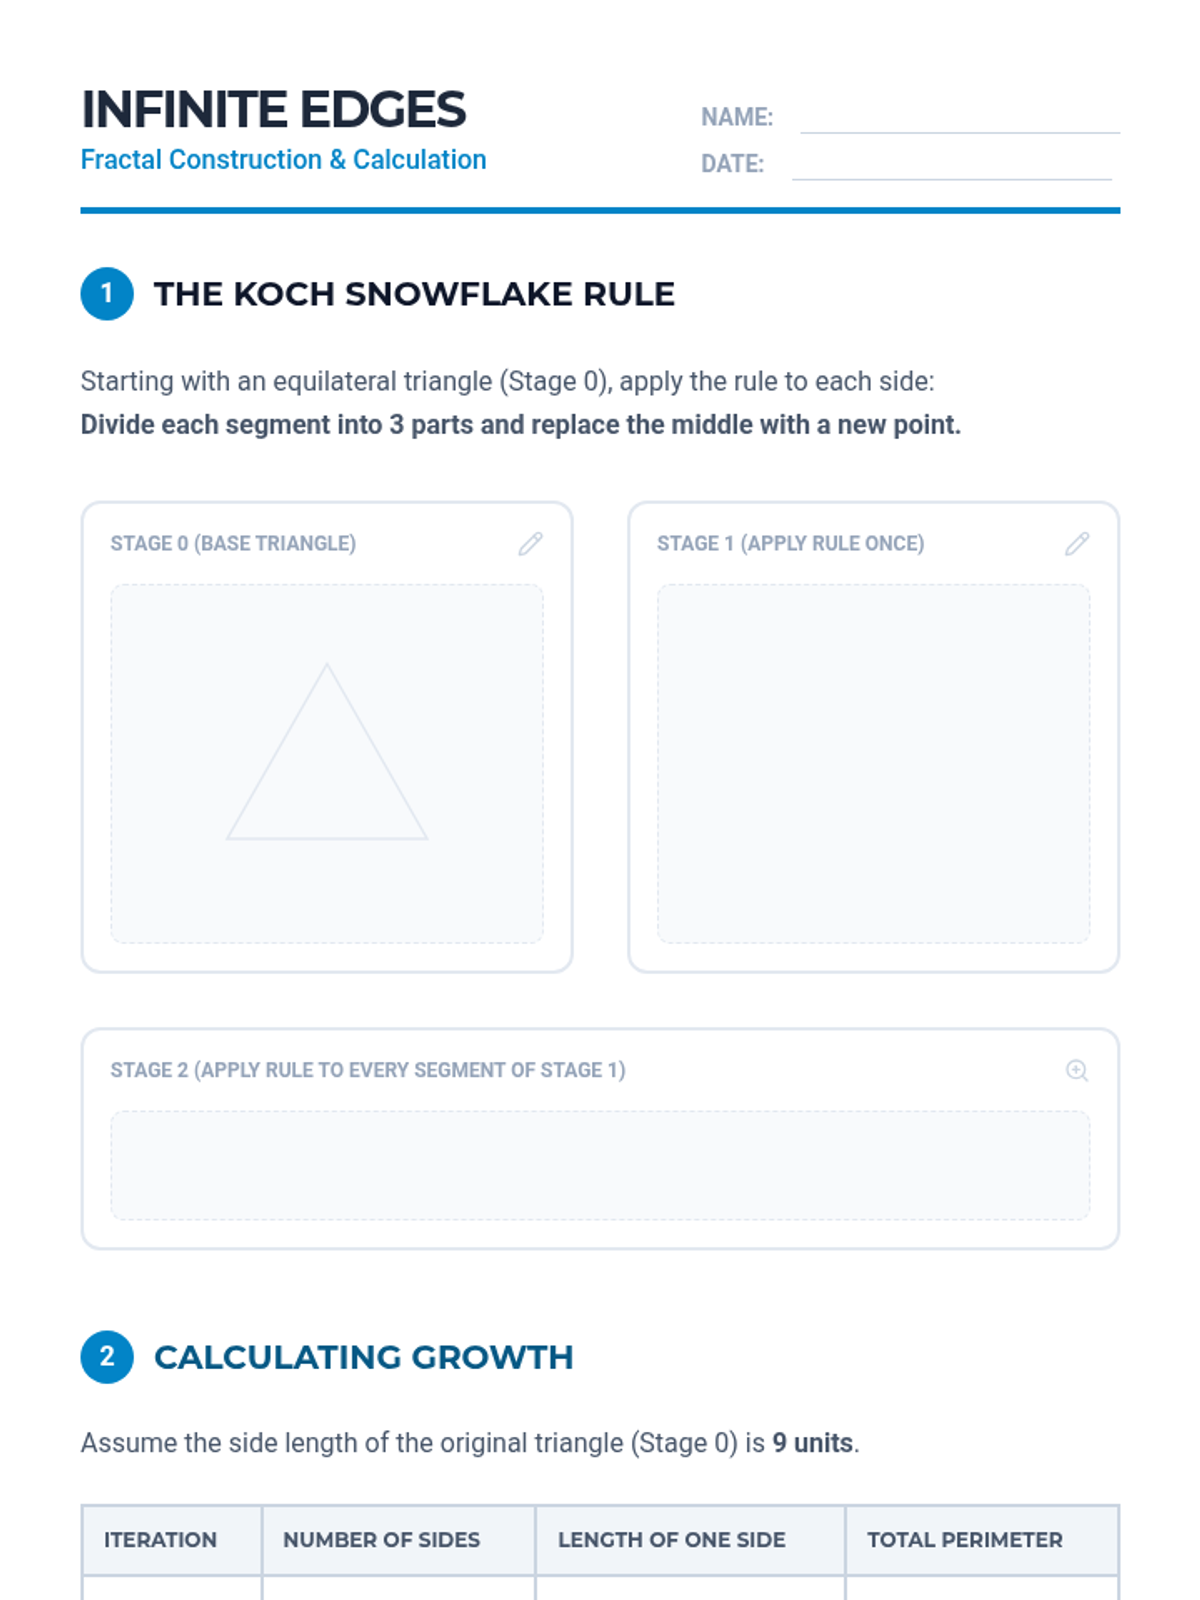
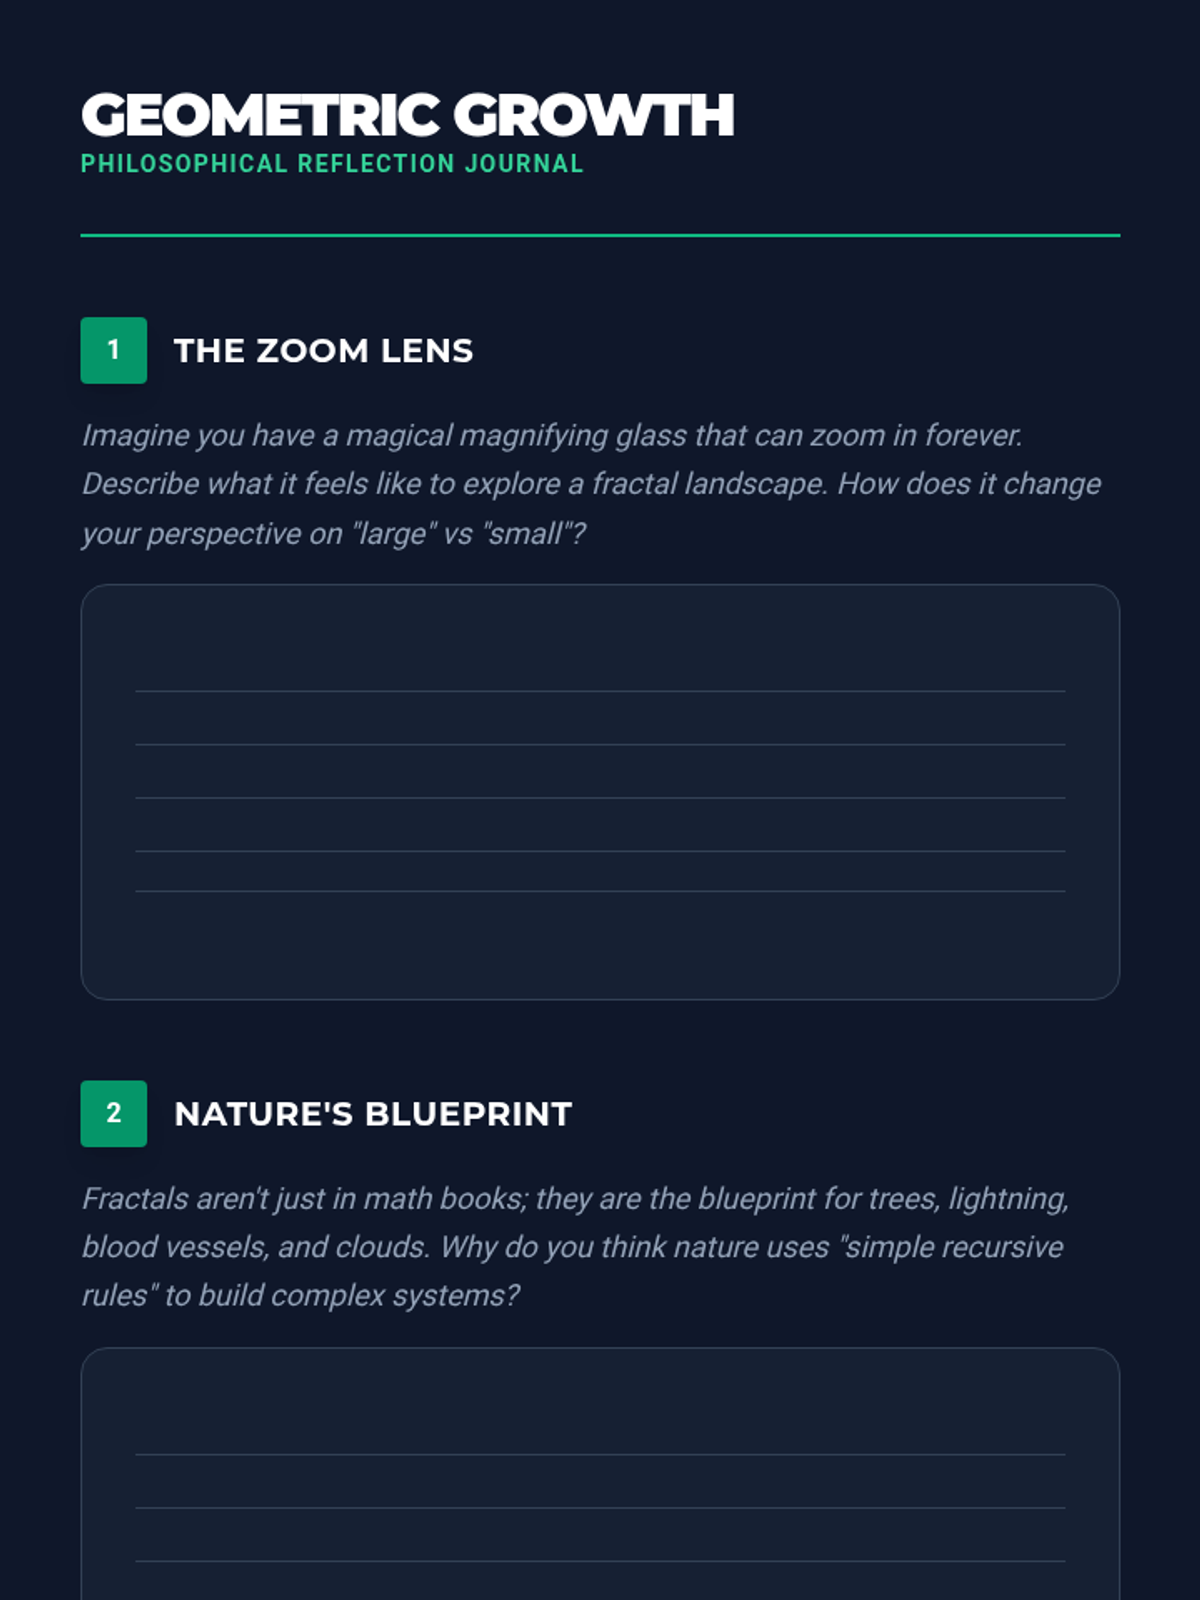
Explore the mesmerizing world of fractals where art meets mathematics. Students investigate recursive patterns, self-similarity, and the mind-bending paradox of infinite perimeters within finite spaces.
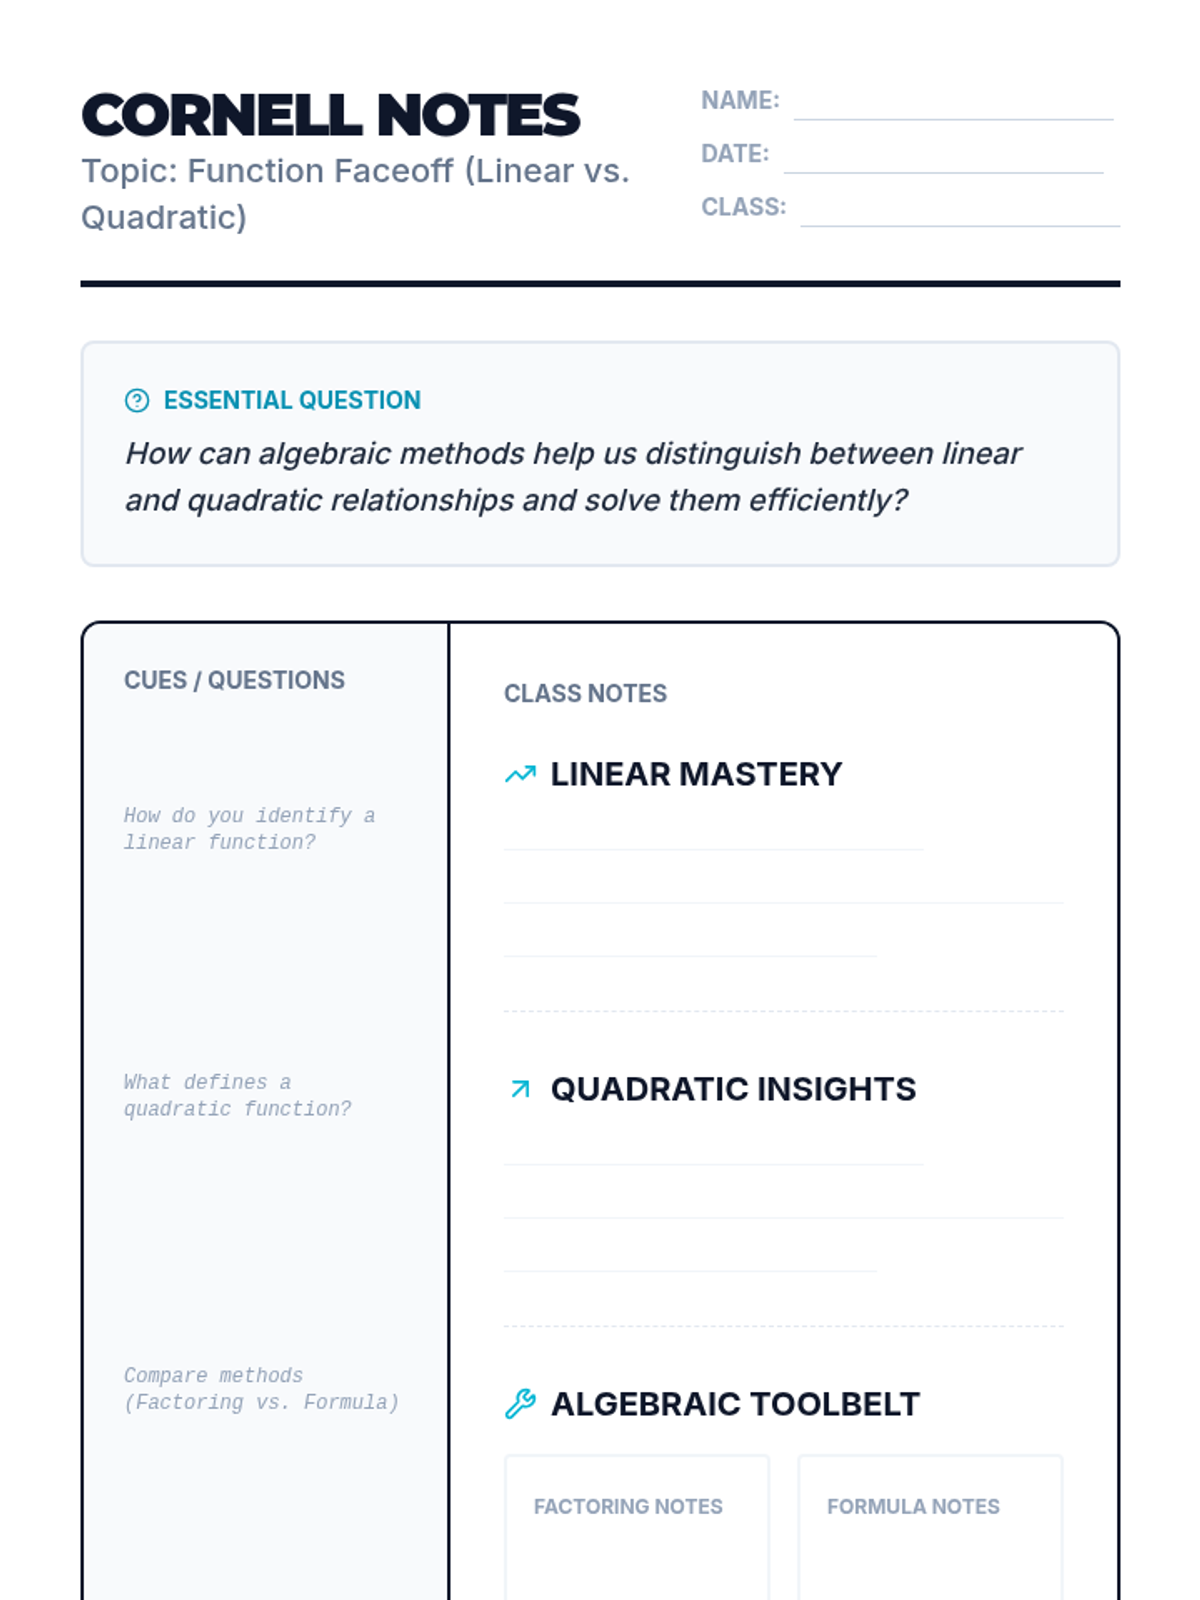
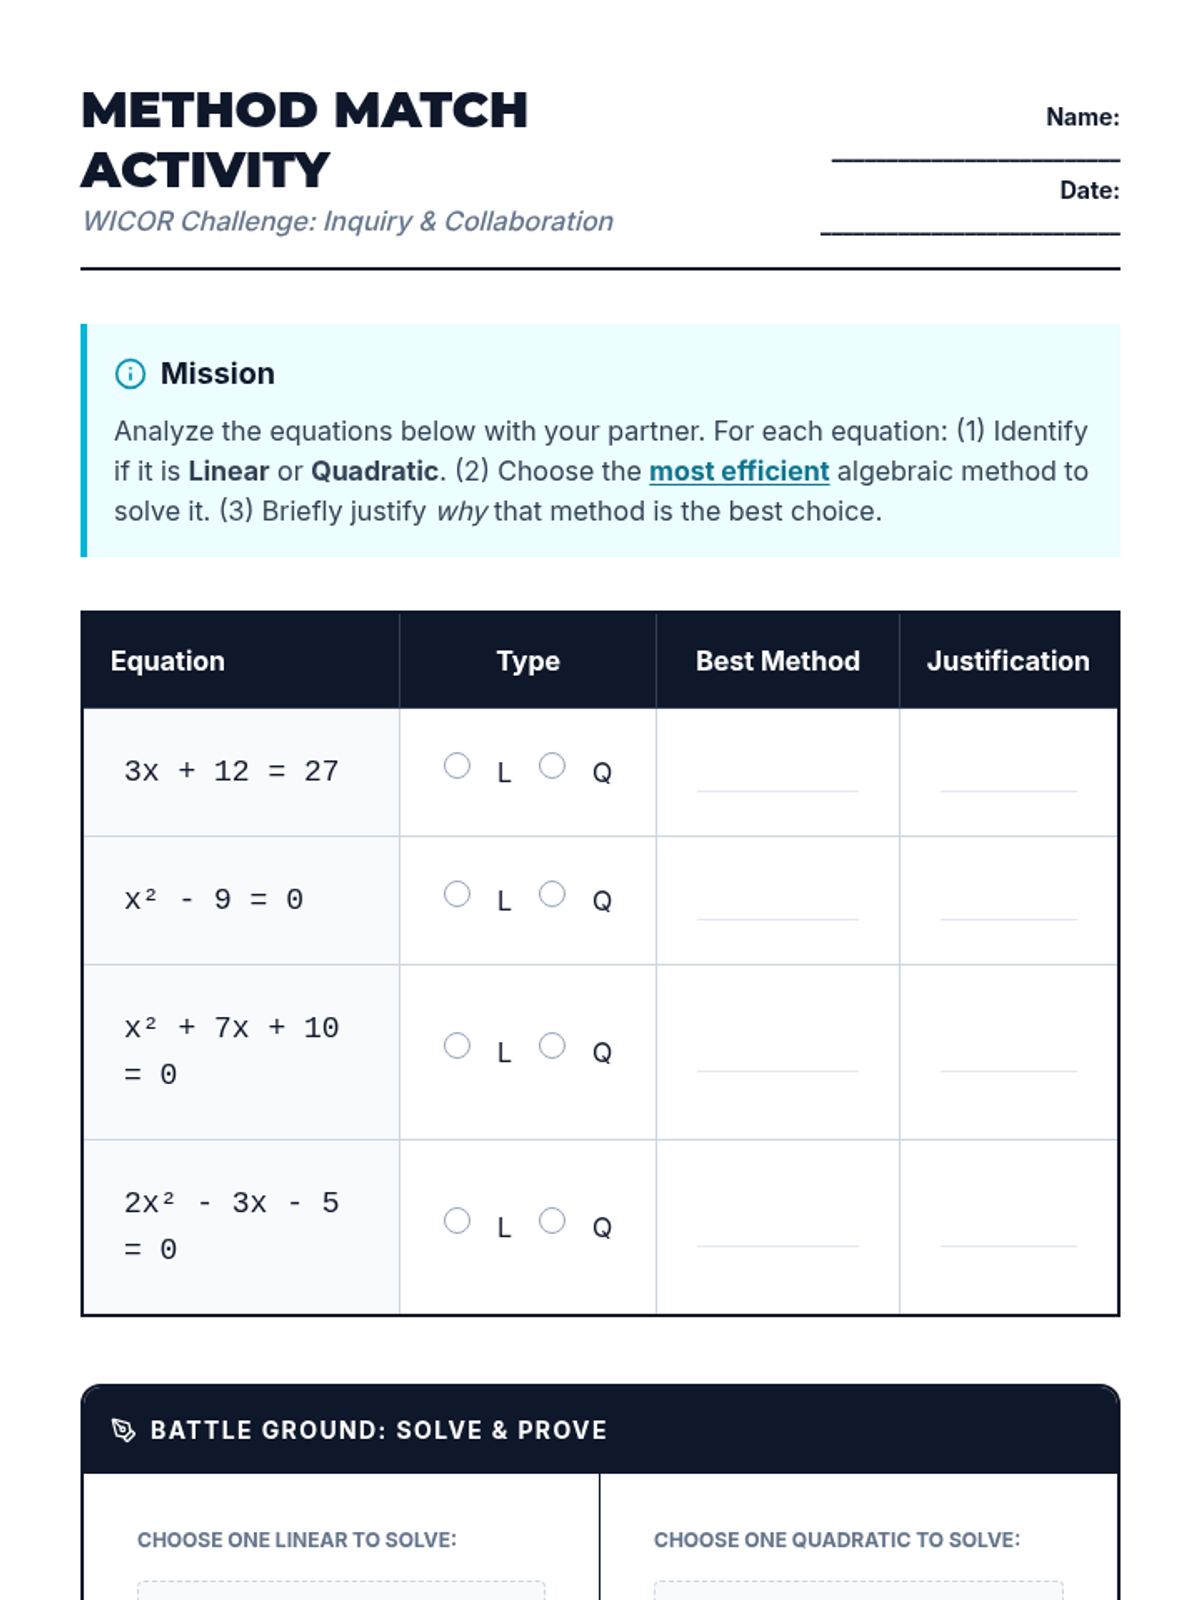
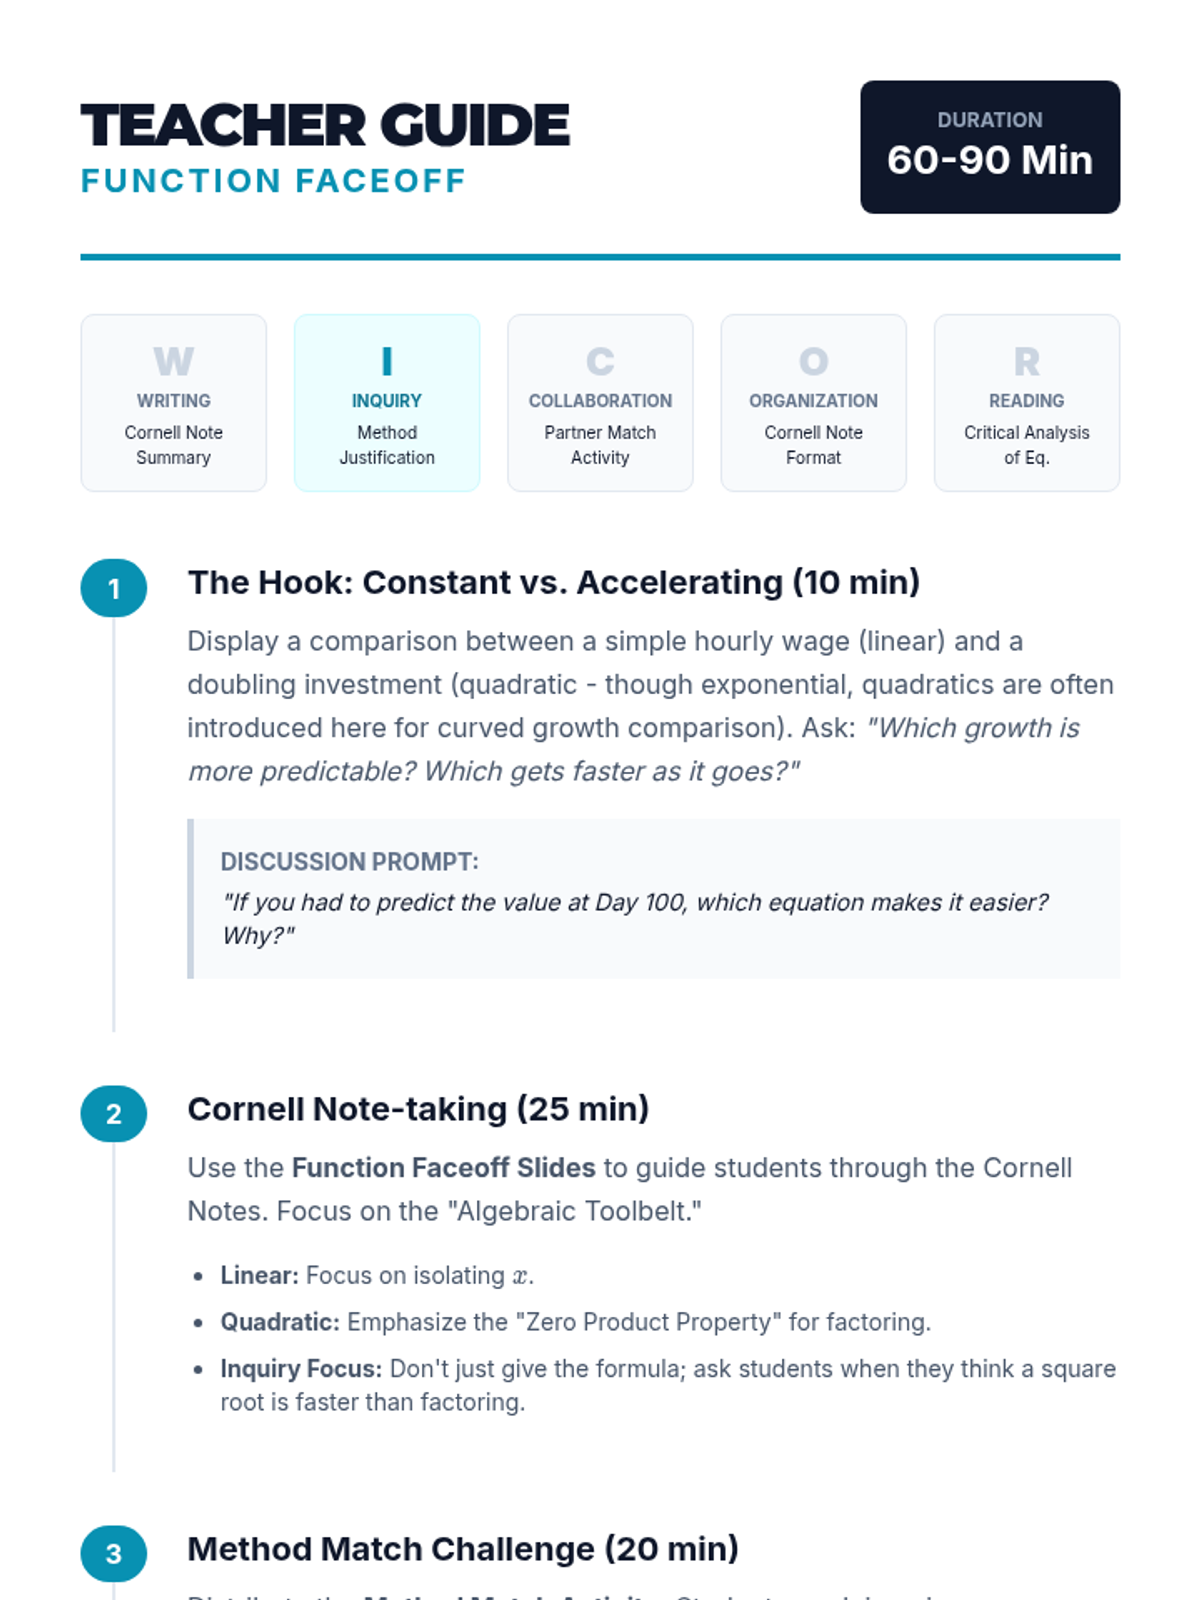
A comprehensive AVID-style lesson comparing linear and quadratic functions through inquiry-based algebraic methods and Cornell Note-taking.
Focus on exponential growth vs. linear growth, and identifying and writing sequence formulas.
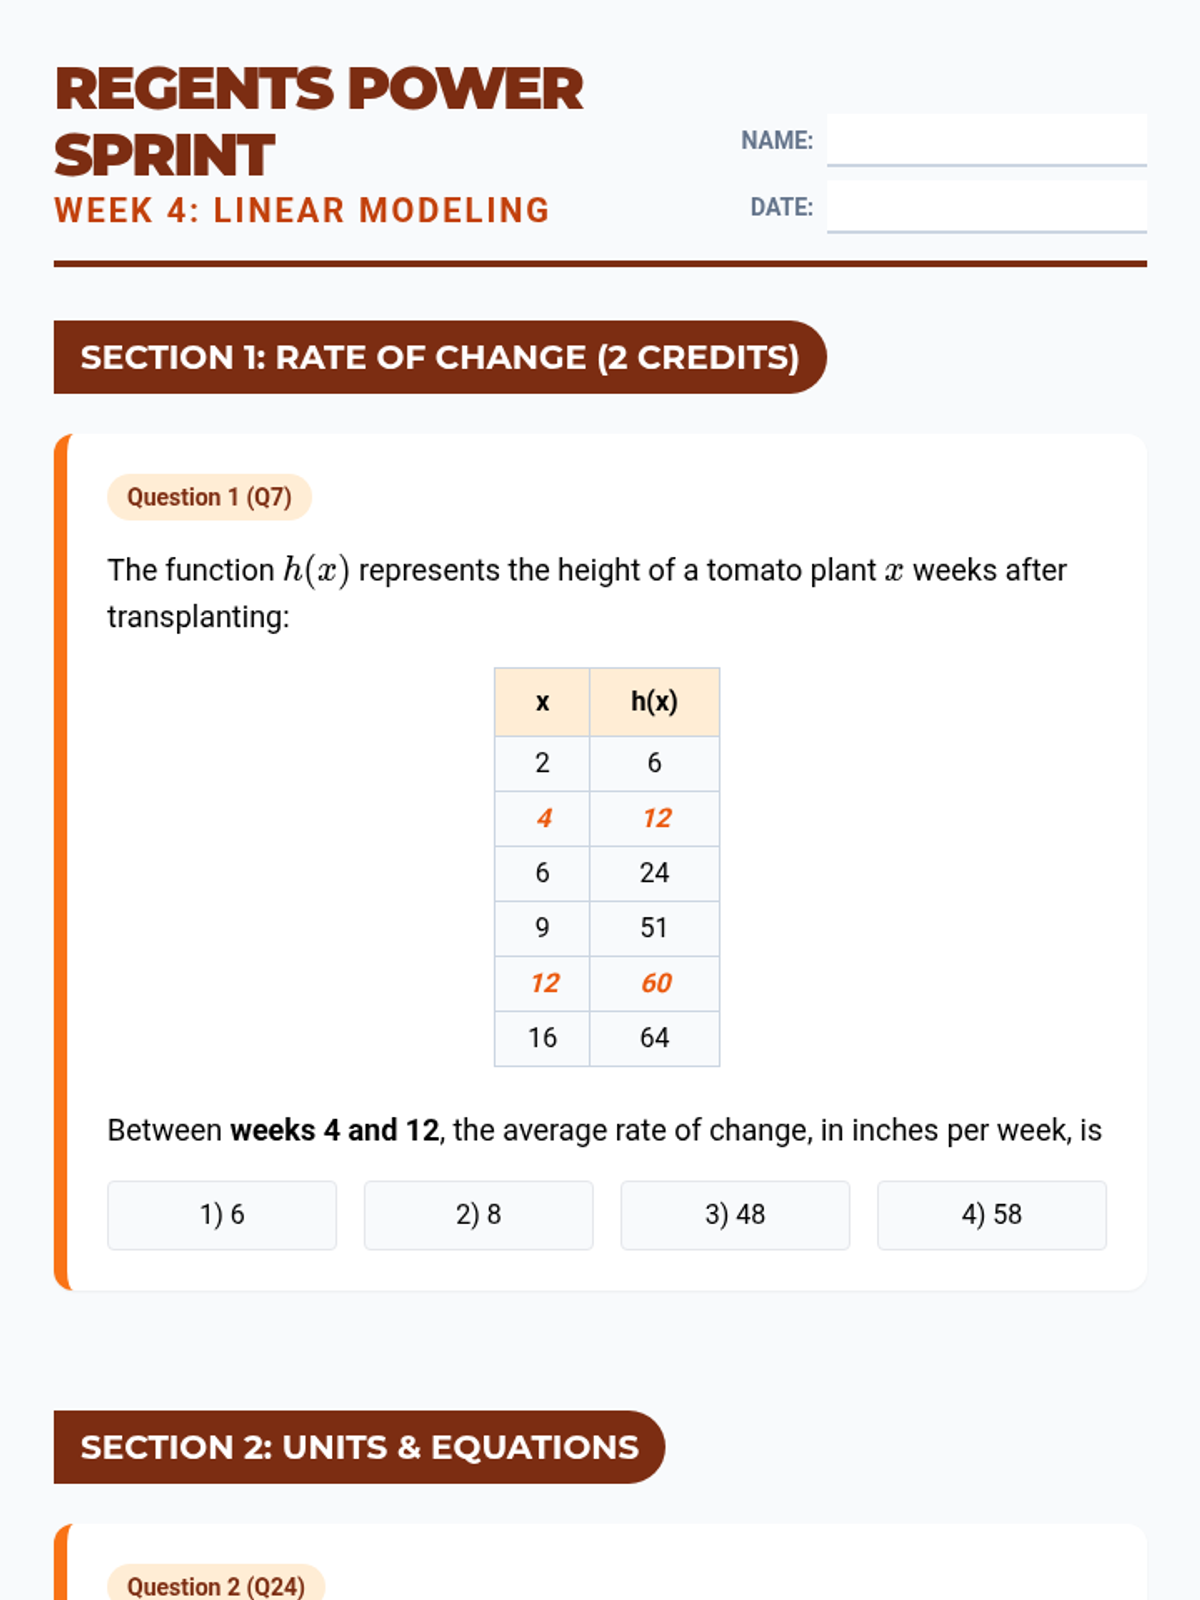
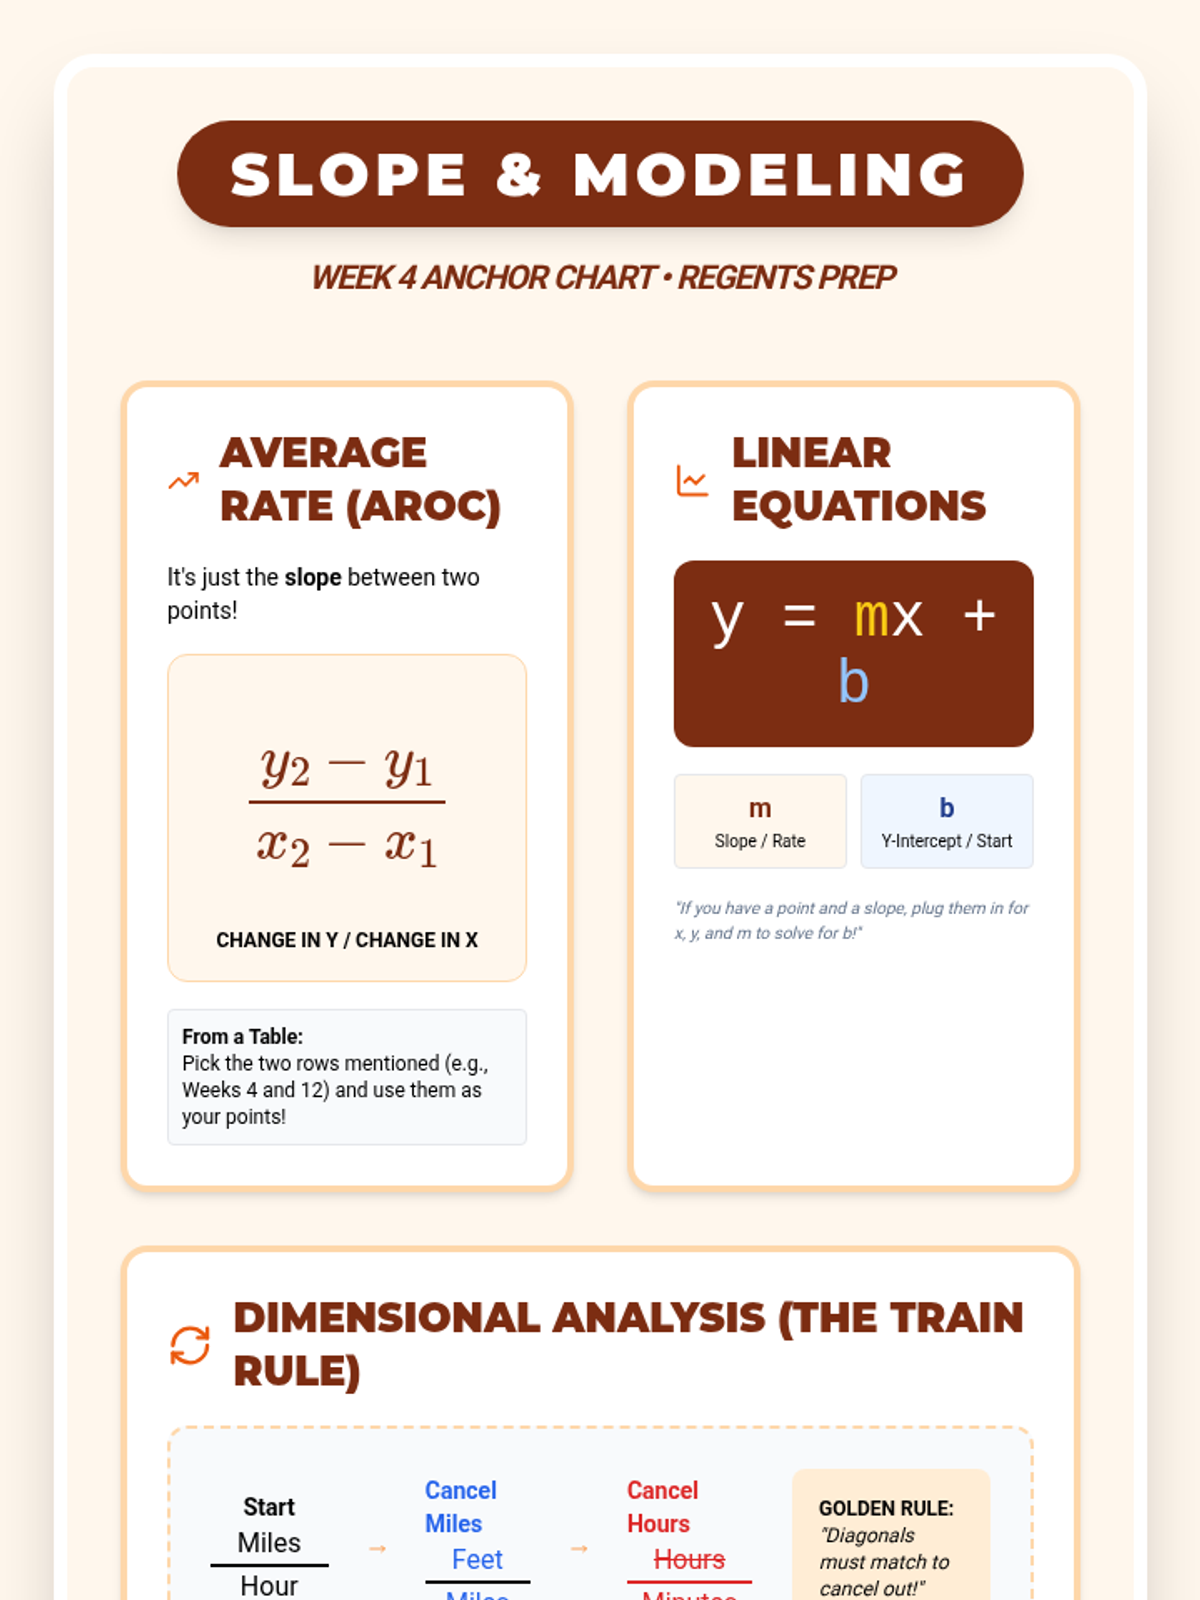
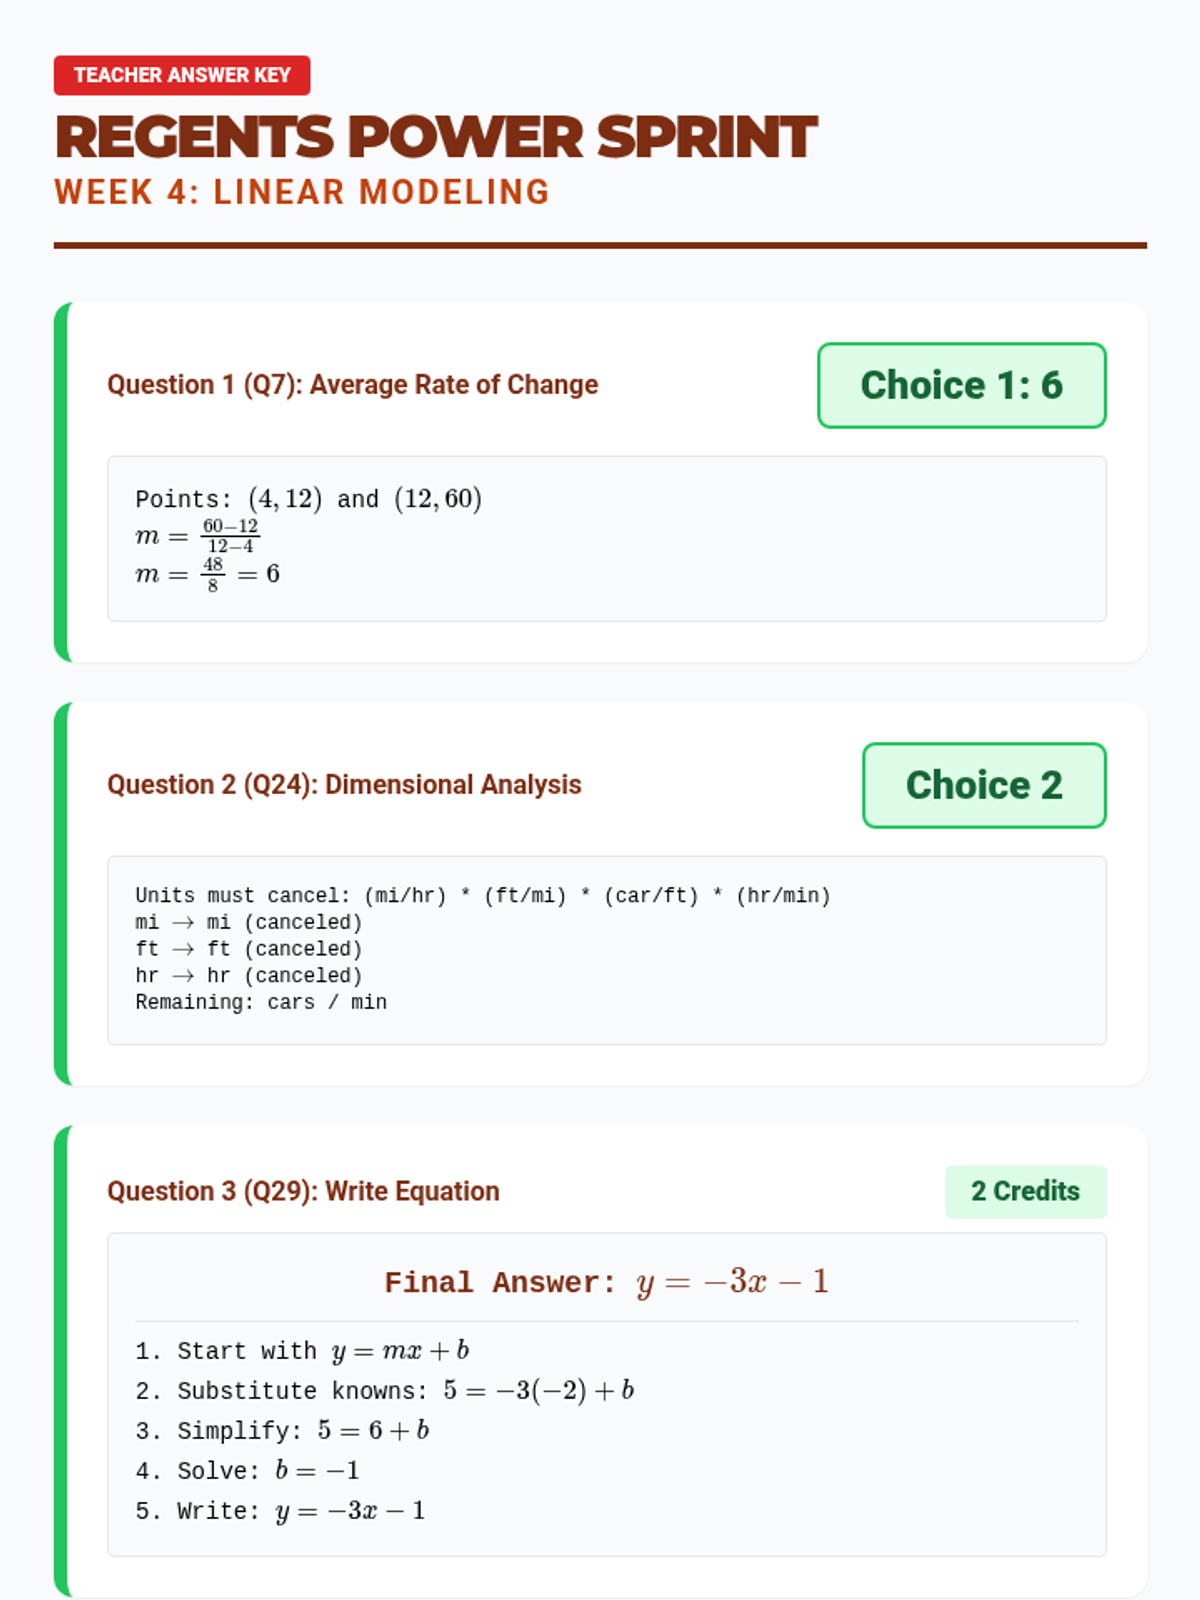
Focus on average rate of change, modeling linear scenarios, and writing equations in slope-intercept form.
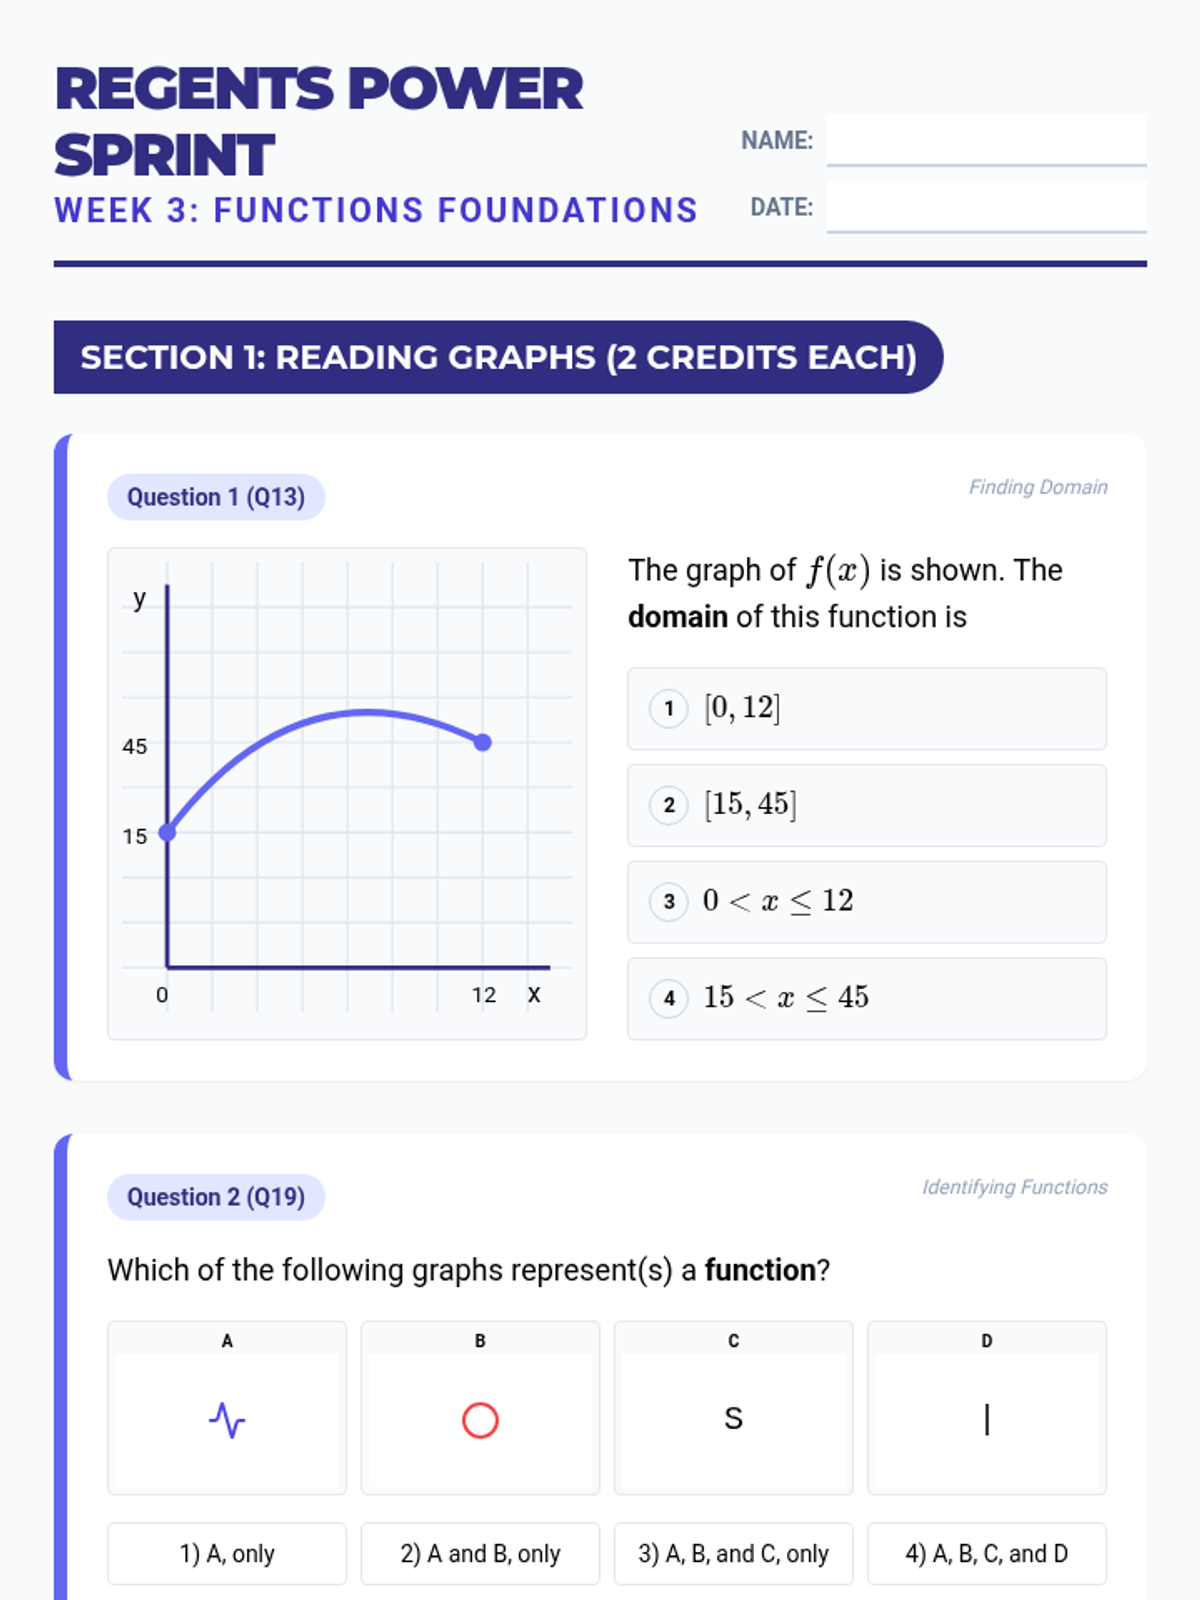
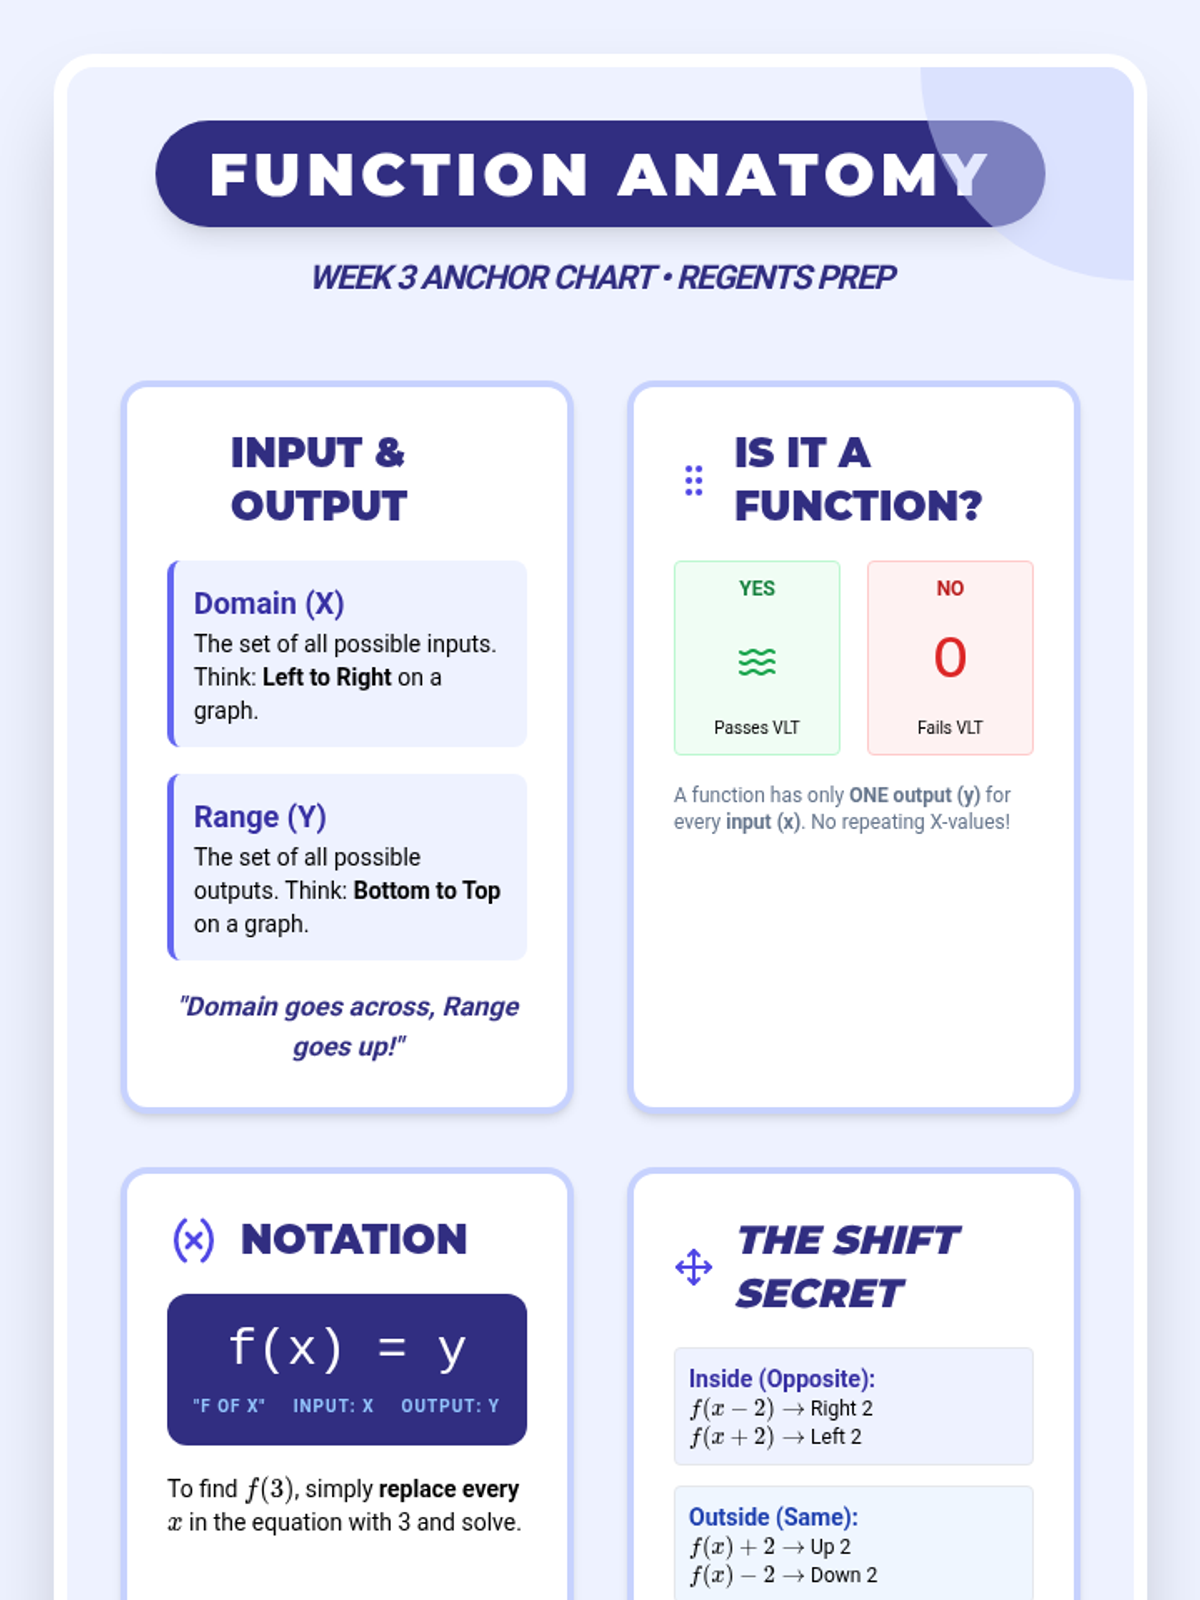
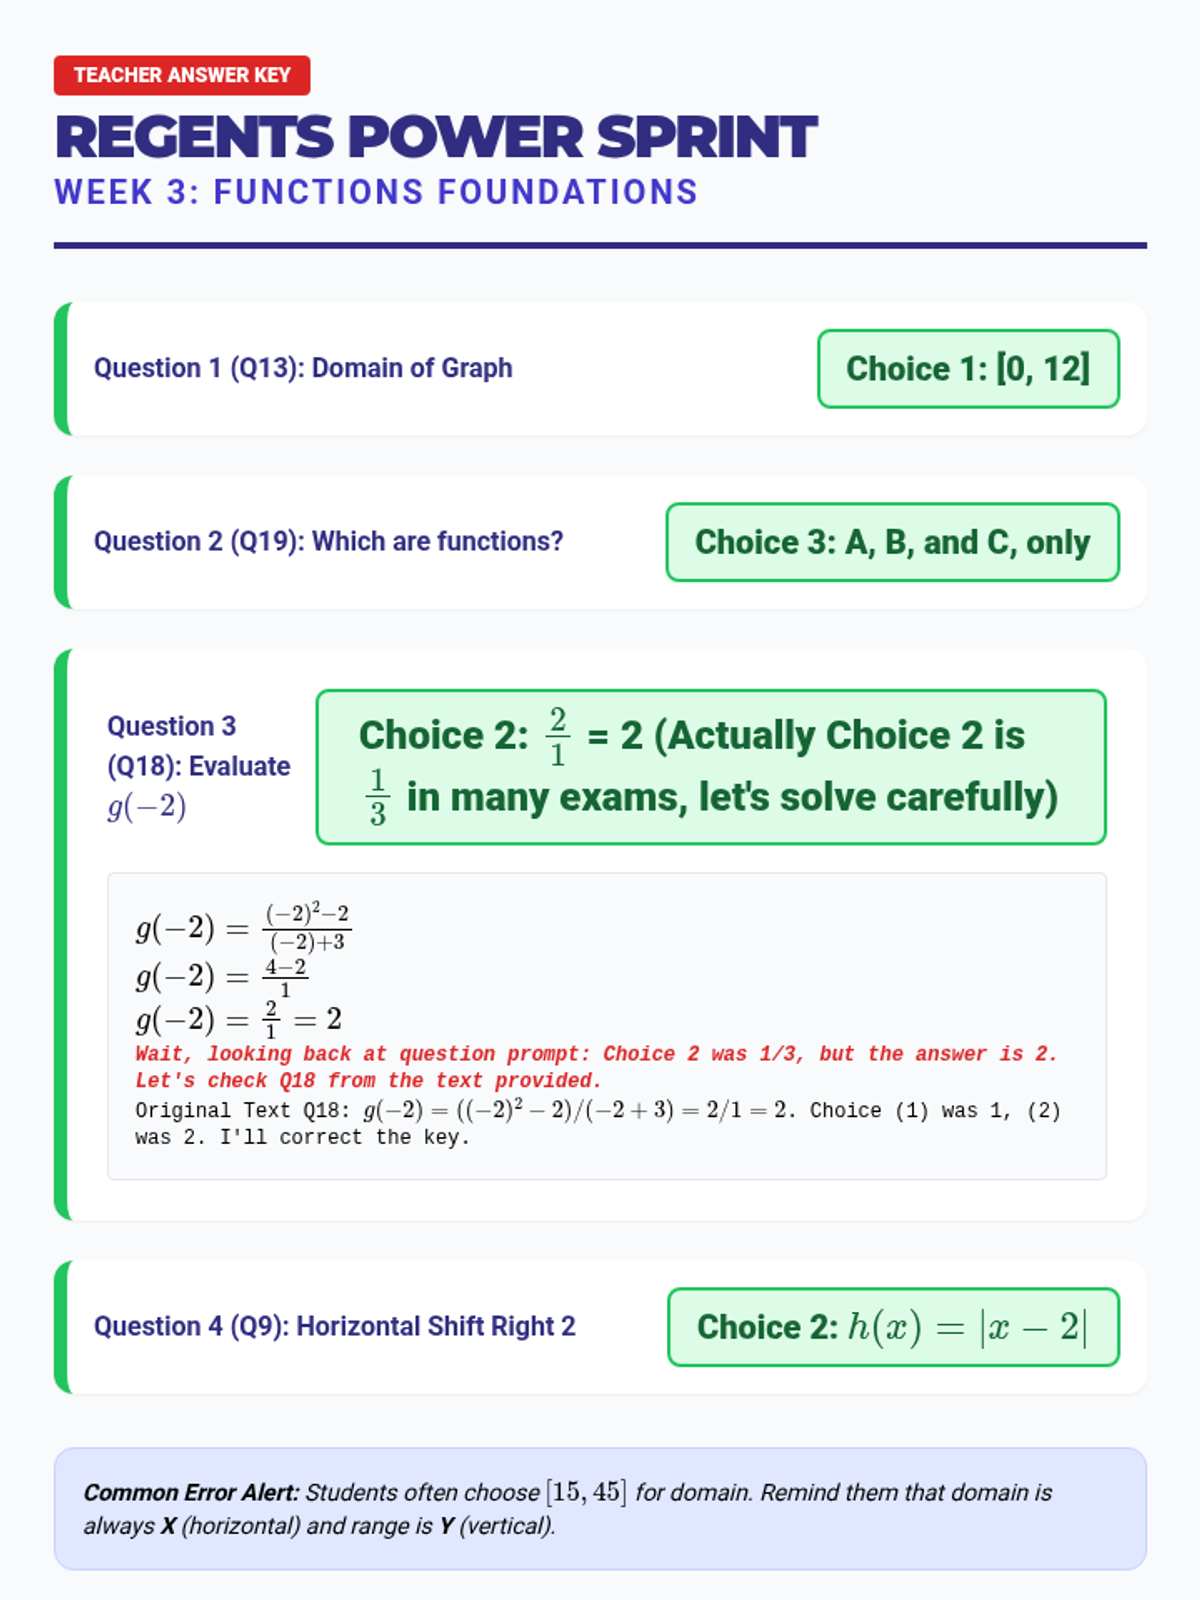
Focus on function notation, the vertical line test, and identifying domain and range from graphs.
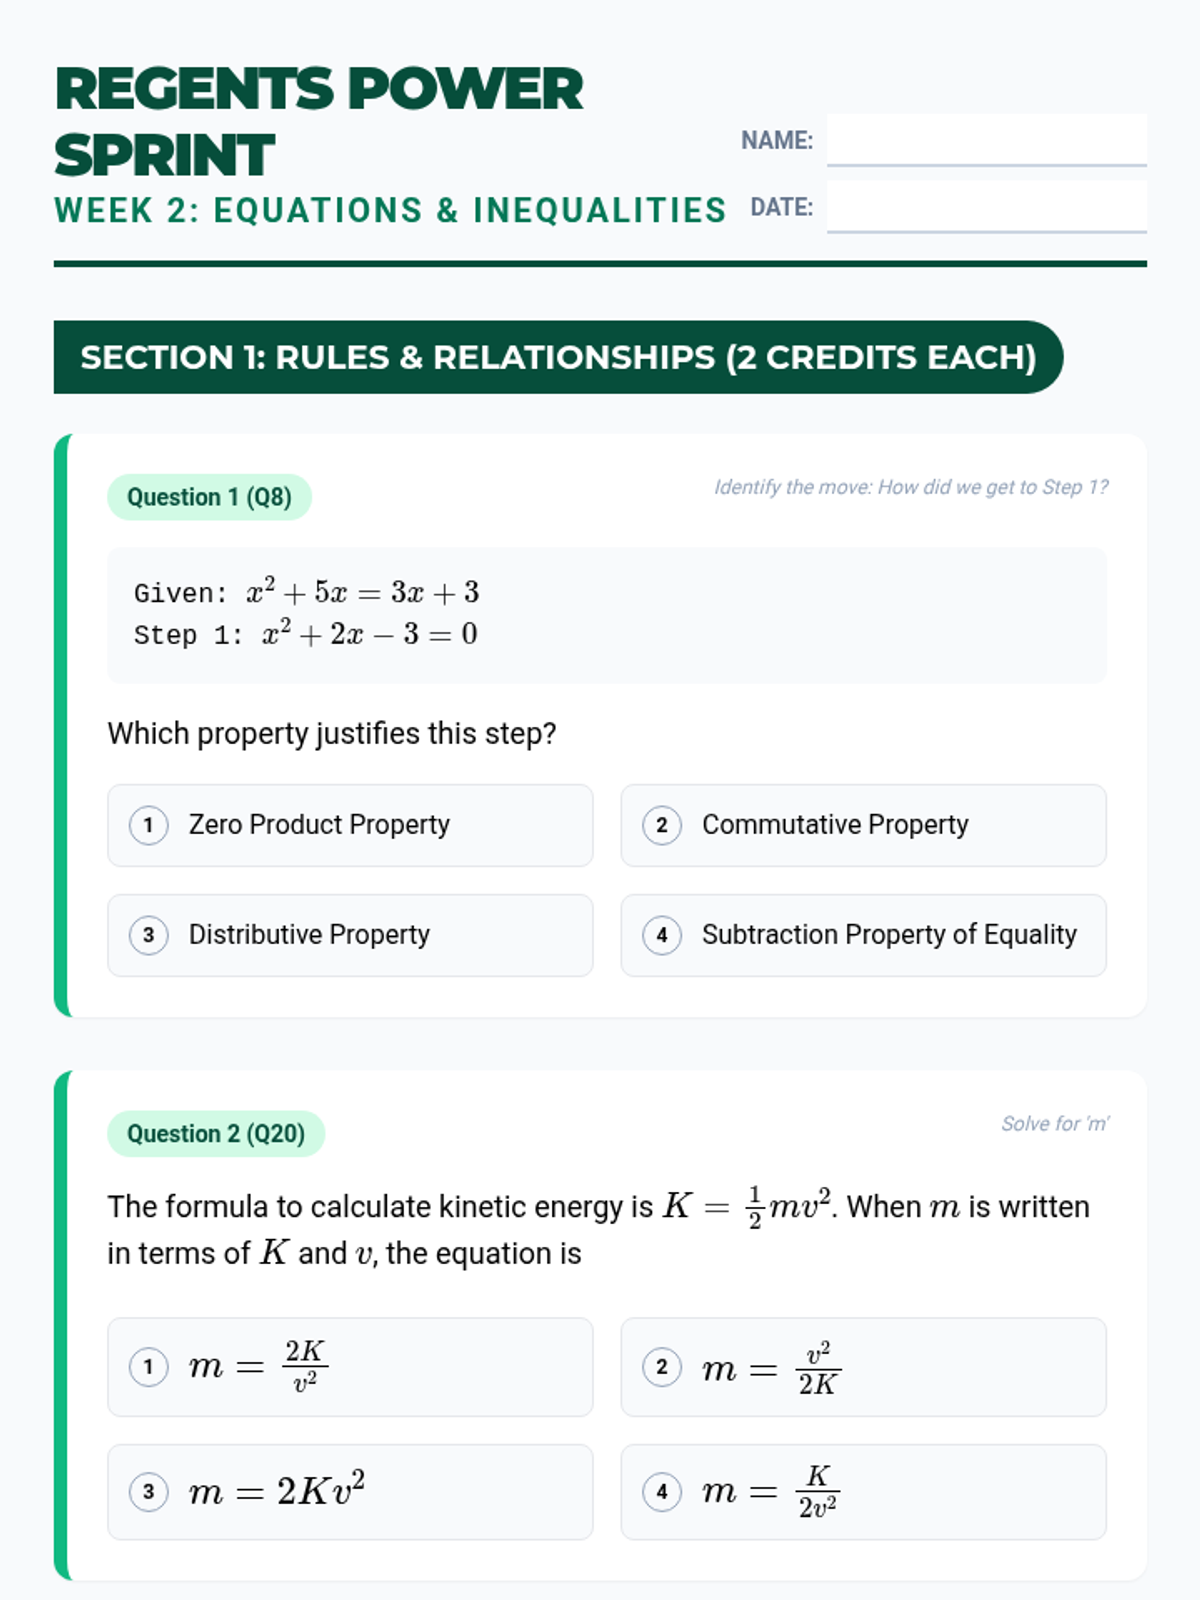
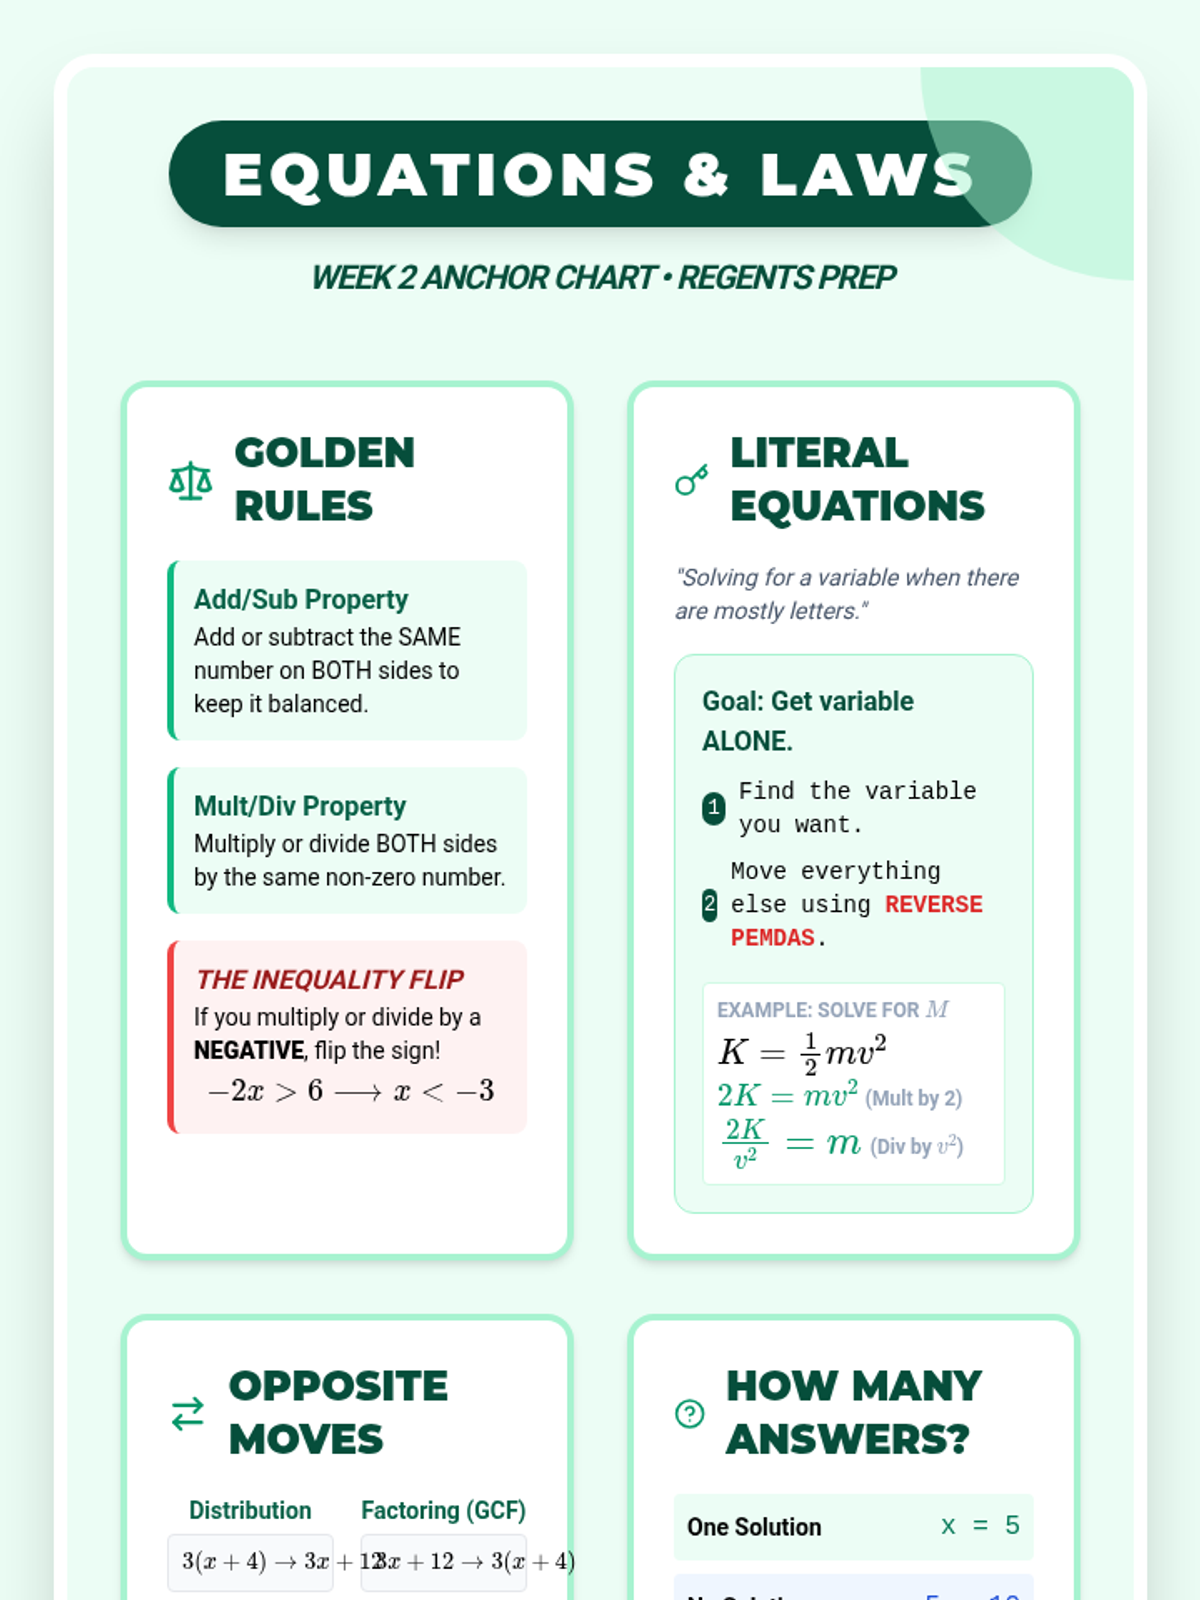
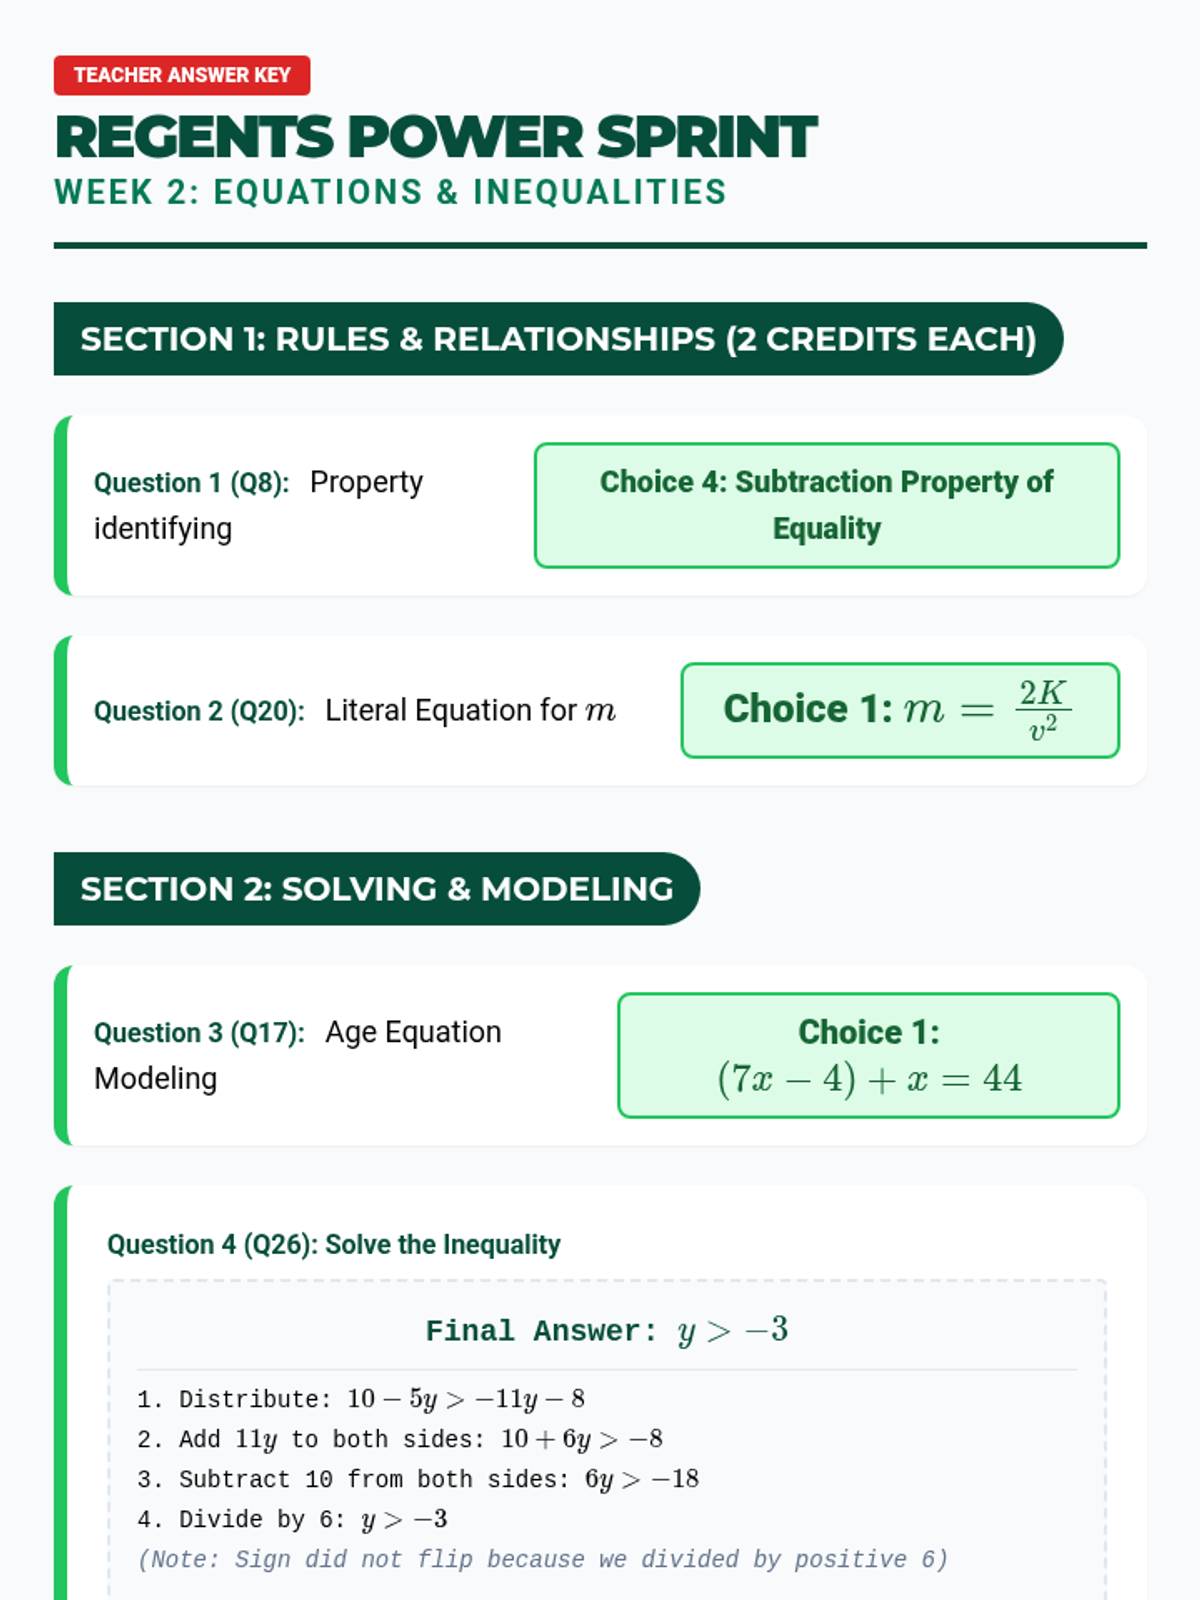
Focus on multi-step equations, literal equations (solving for a variable), and properties of equality.
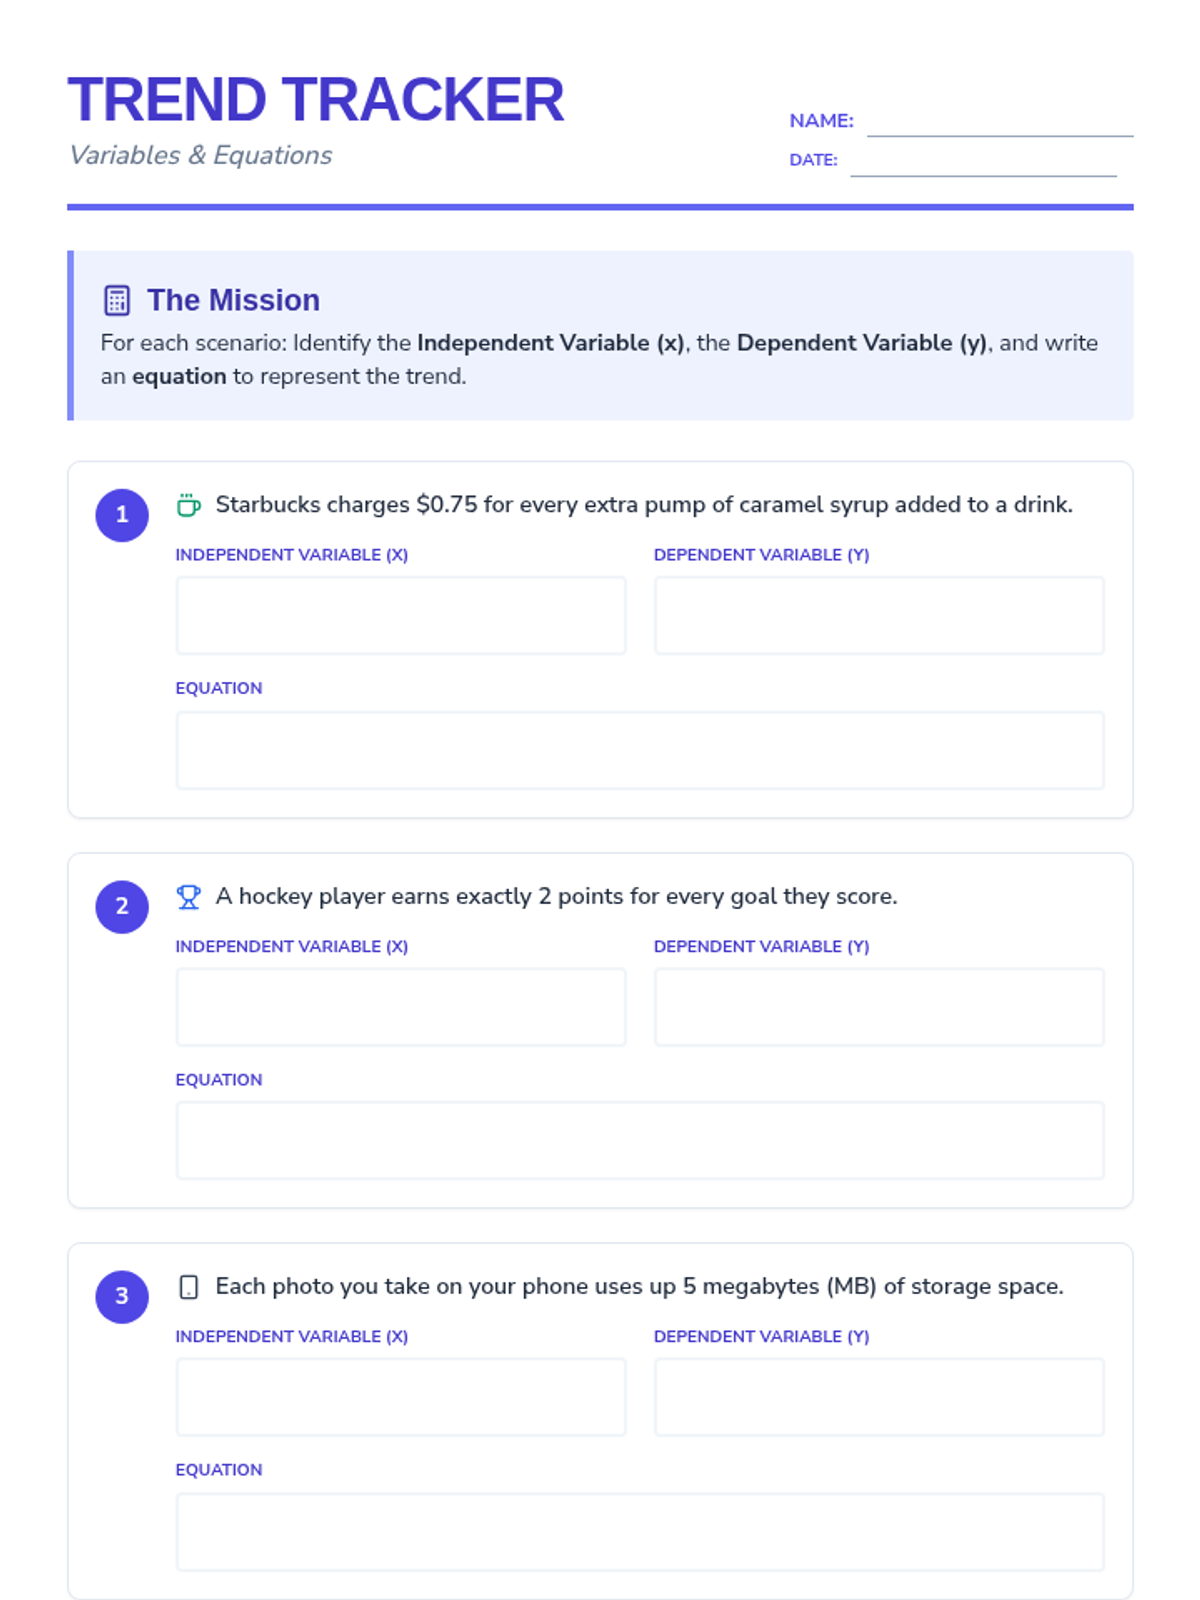
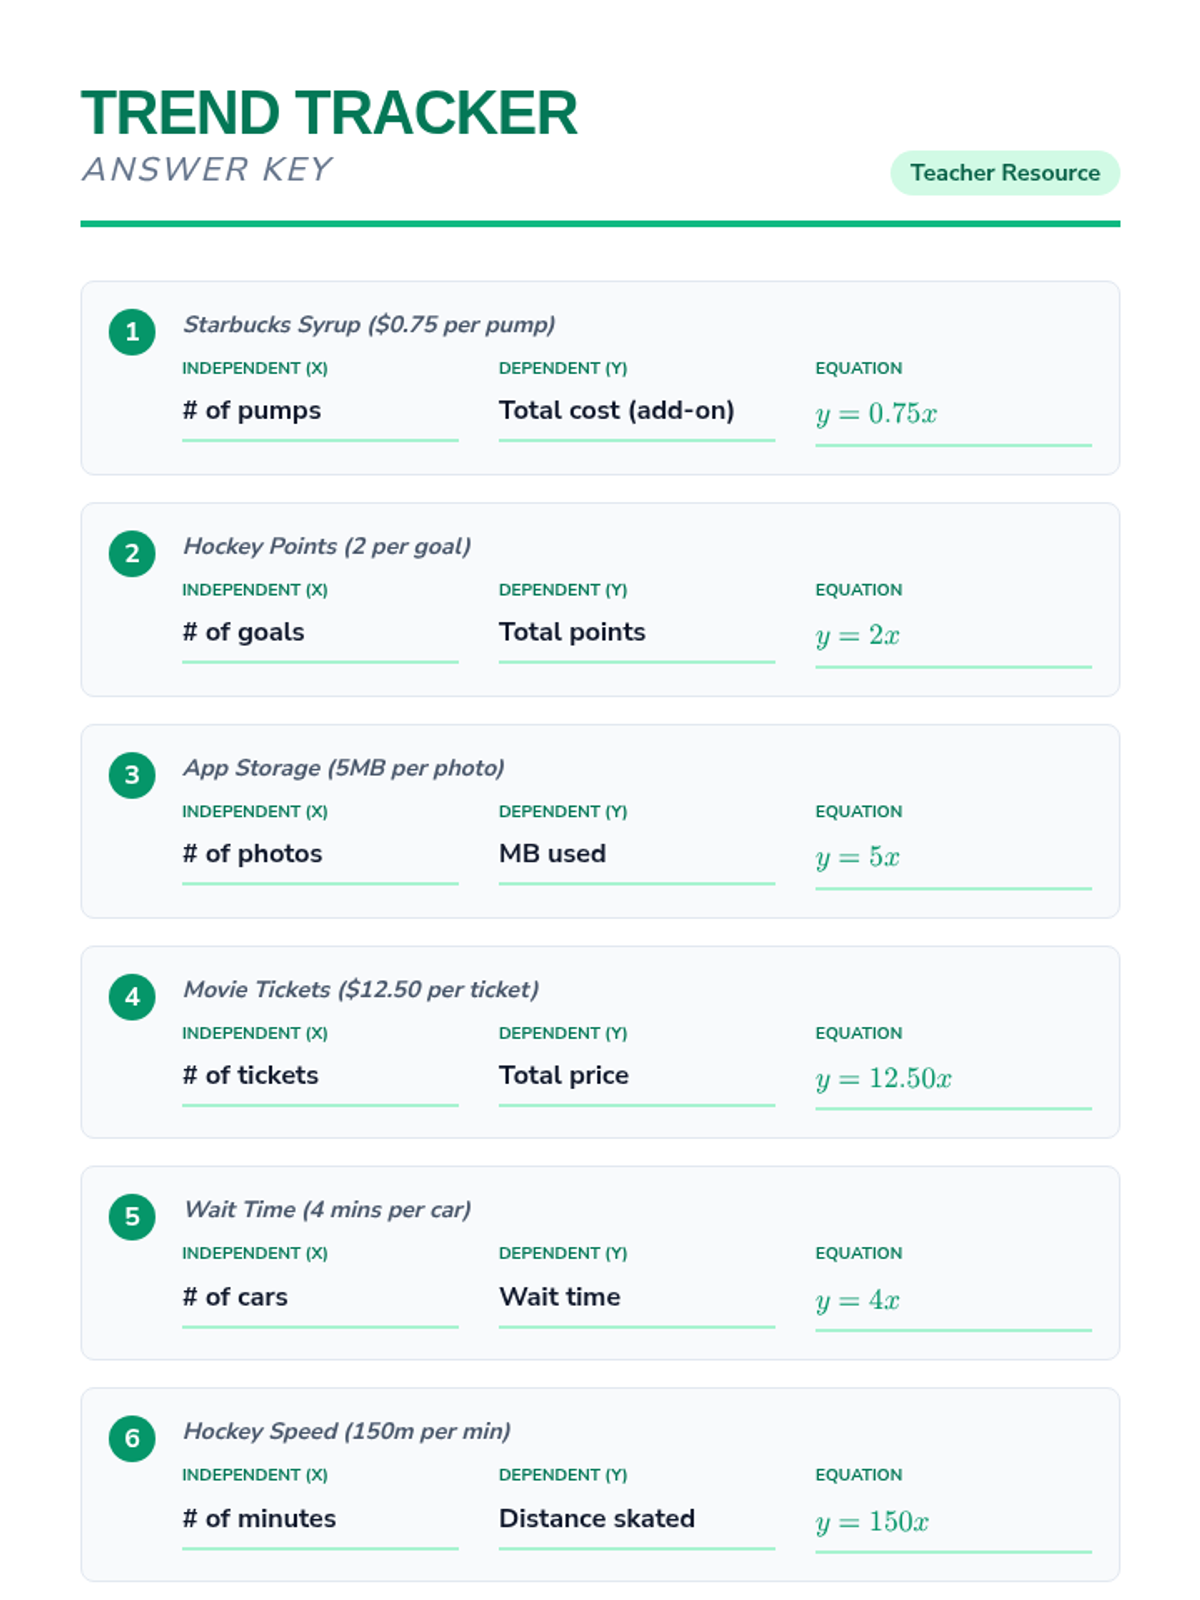
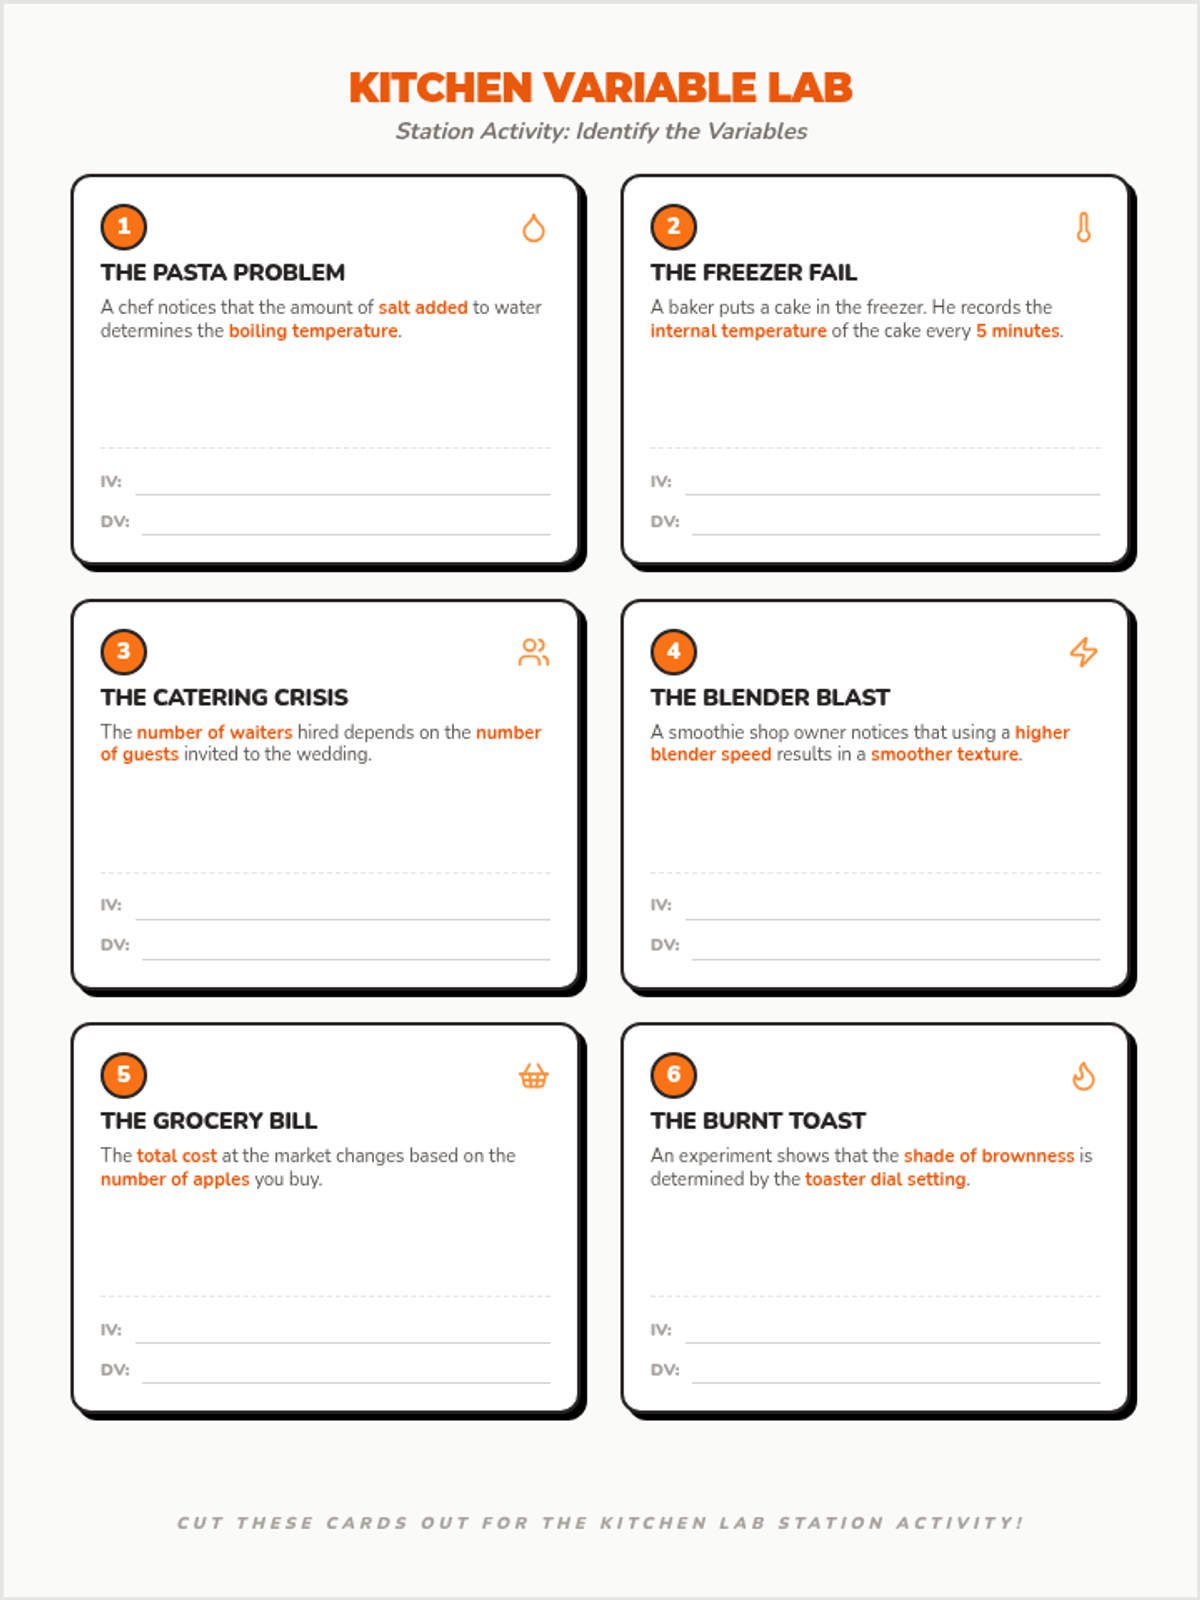
A practice-focused lesson where students identify independent and dependent variables in relatable, modern scenarios like sports, snacks, and technology.
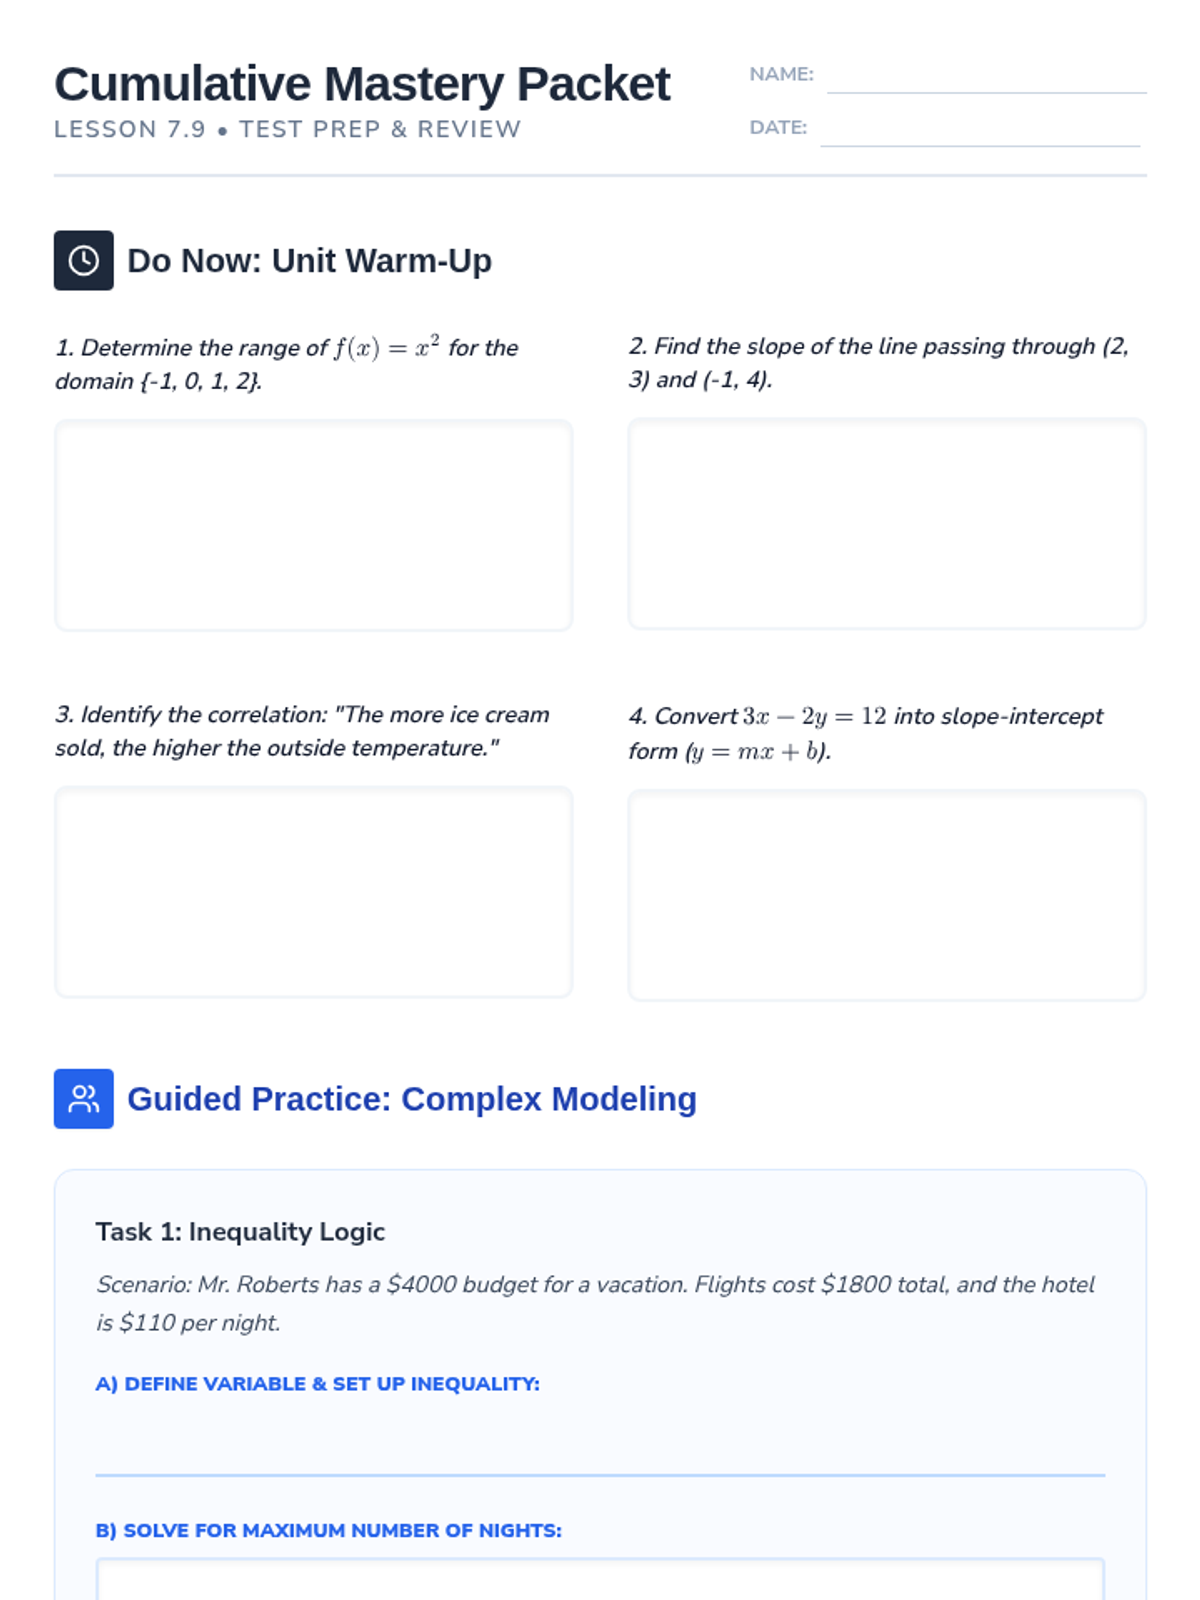
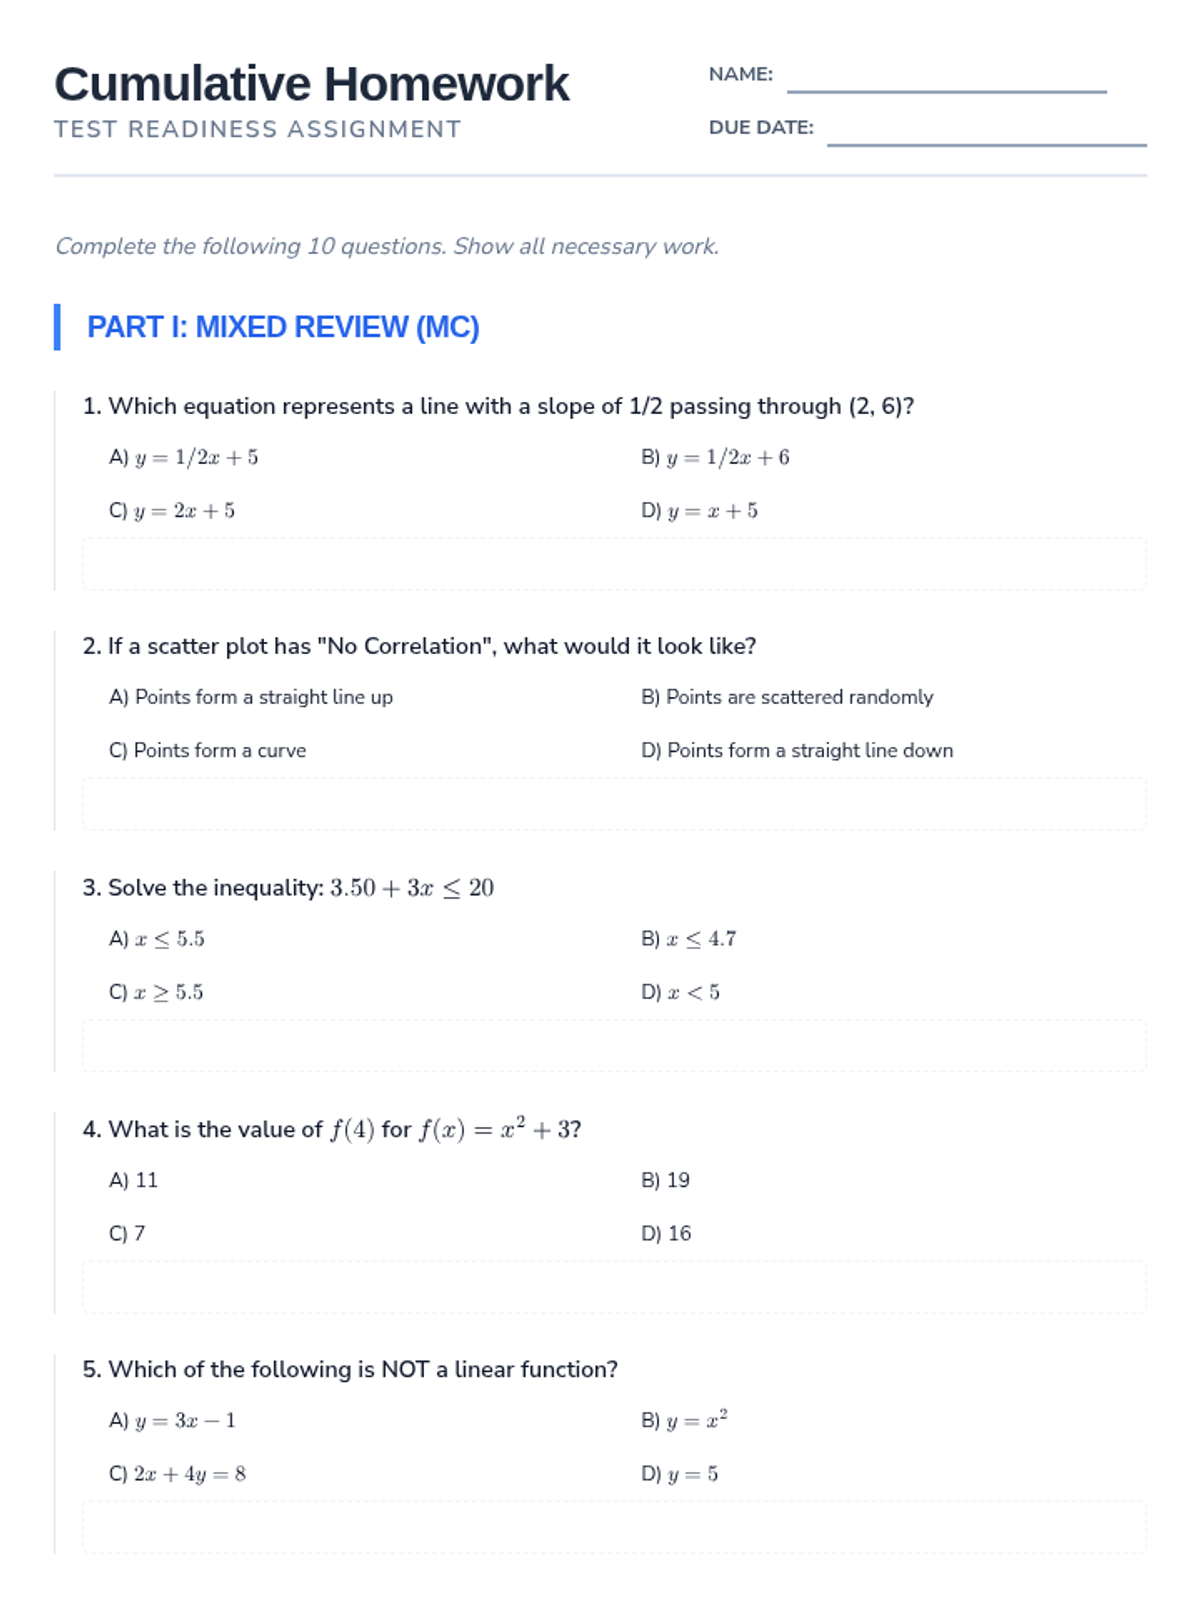
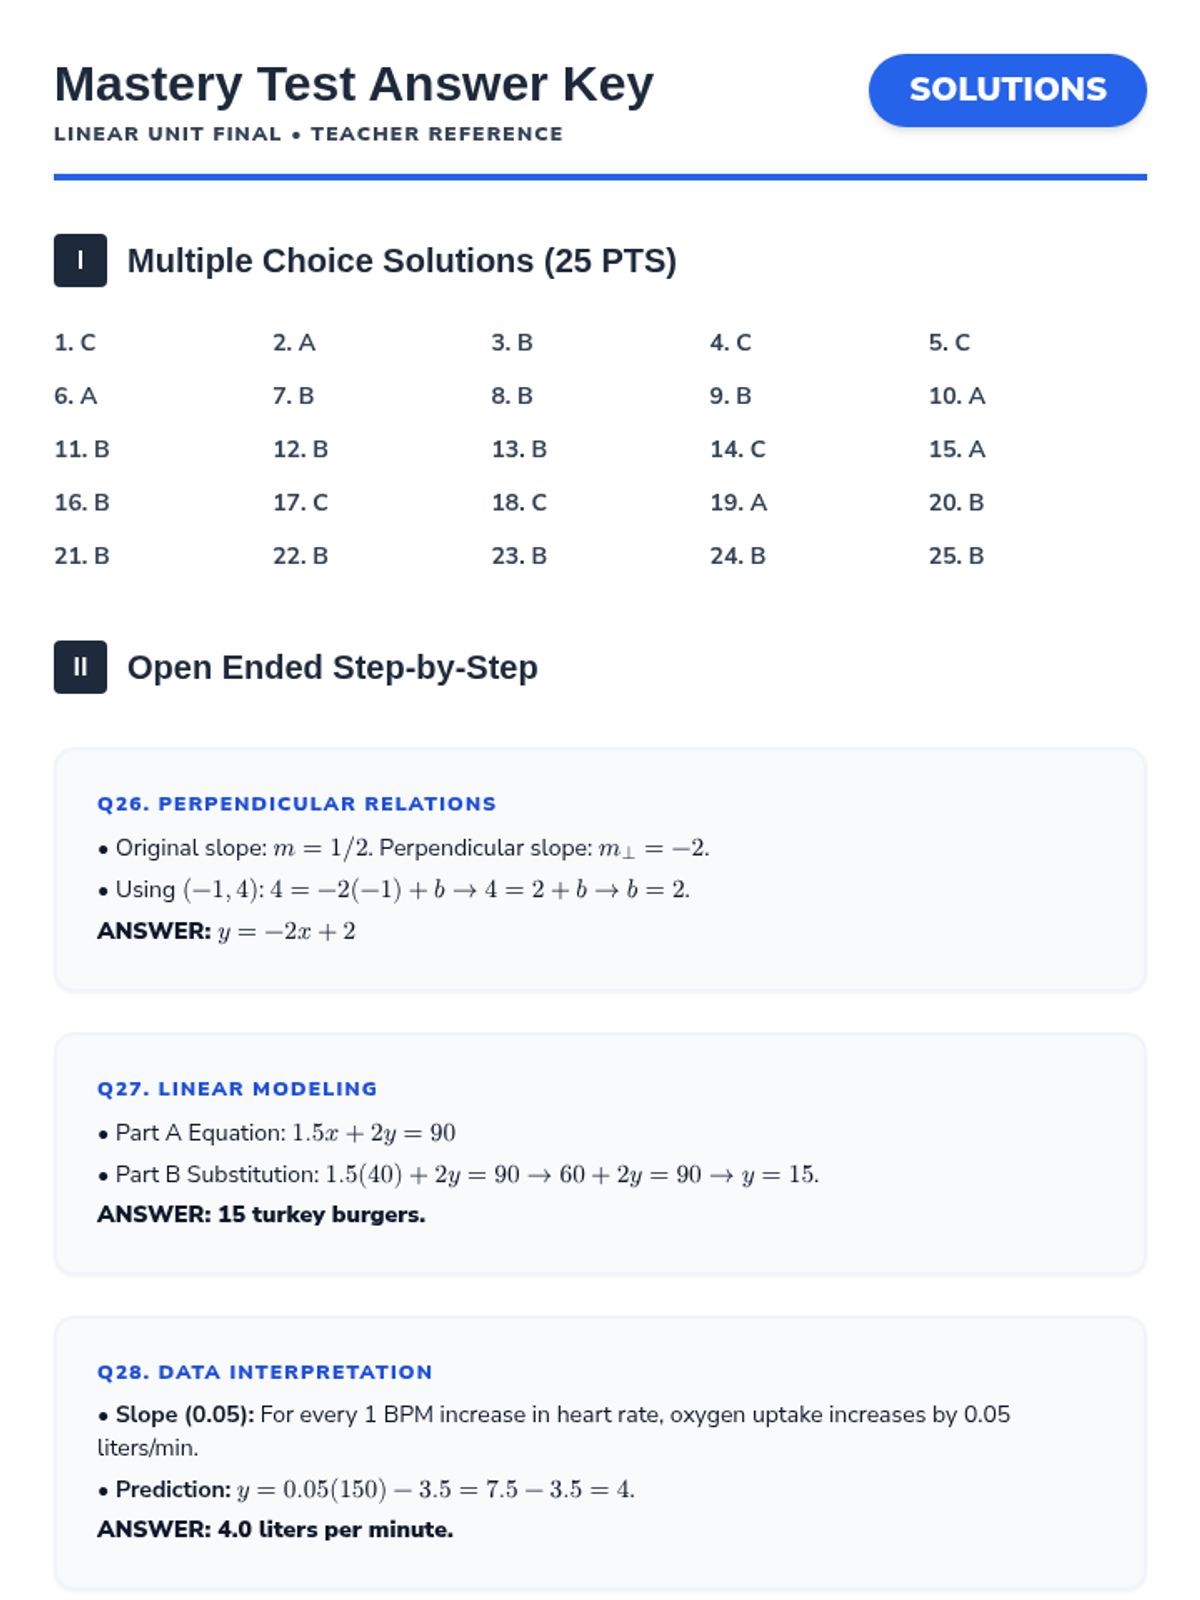
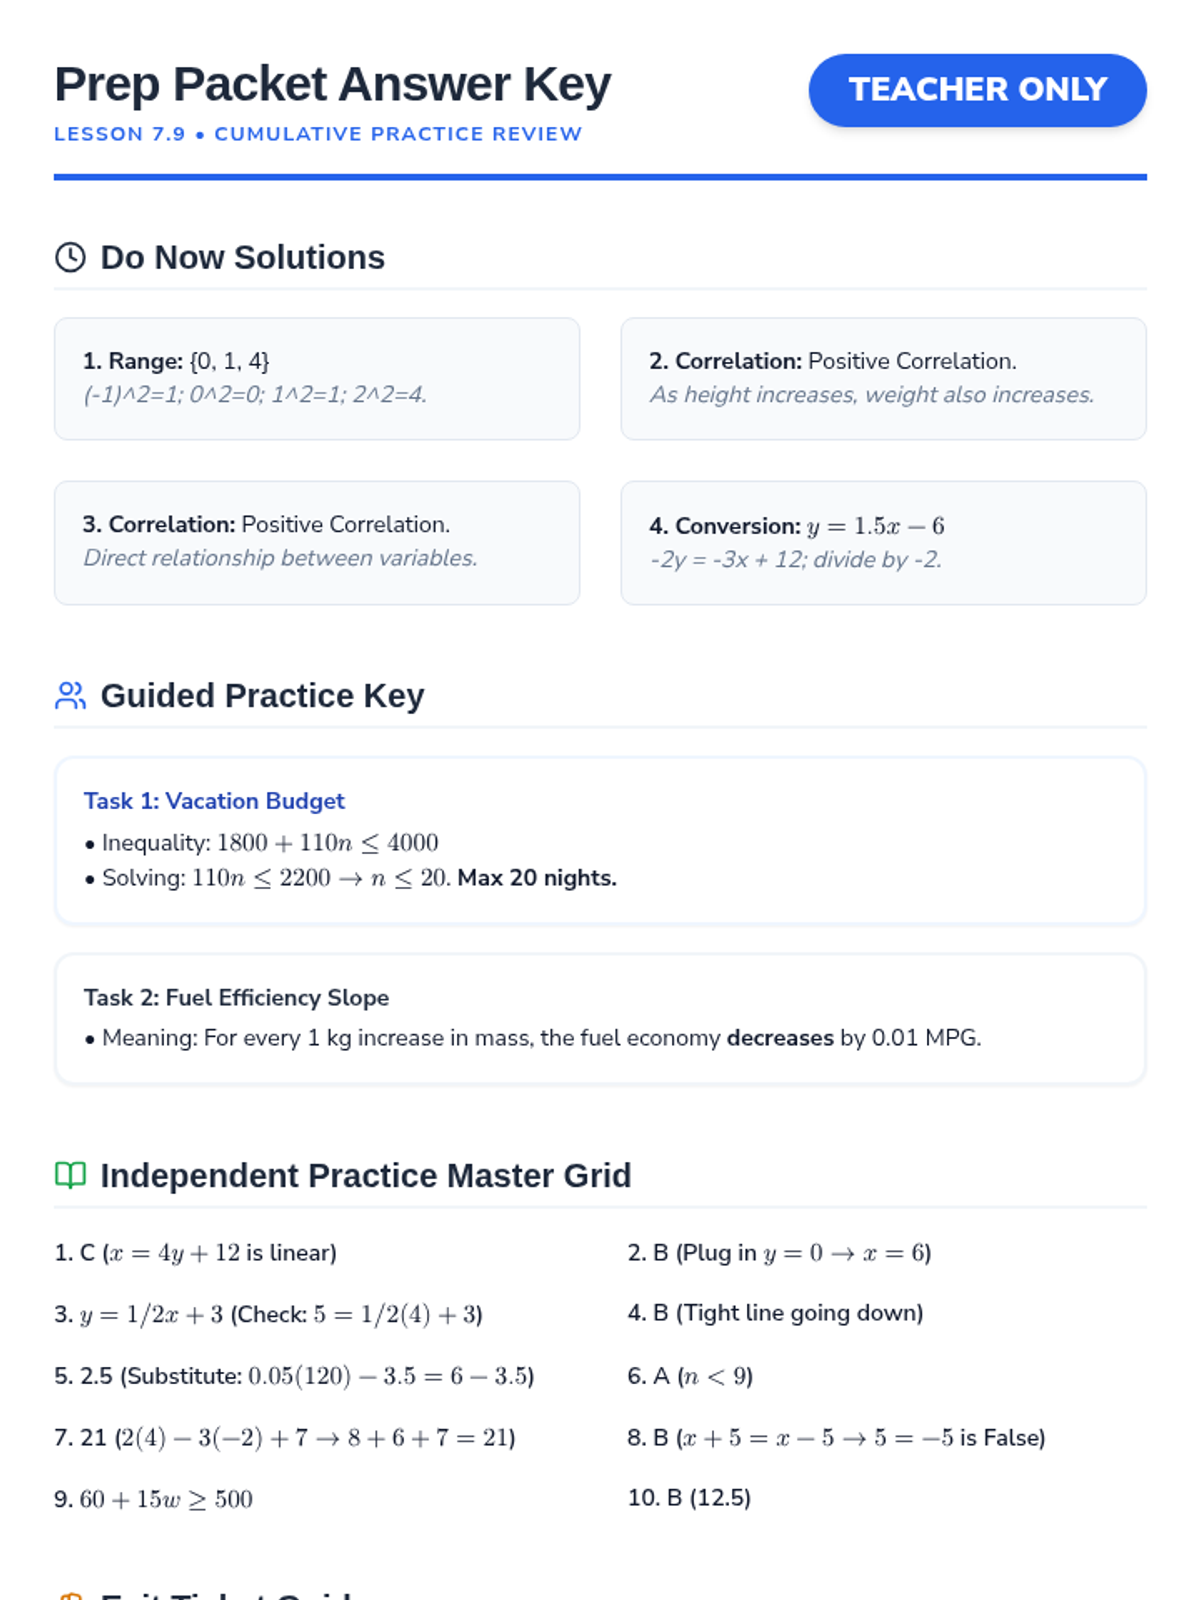
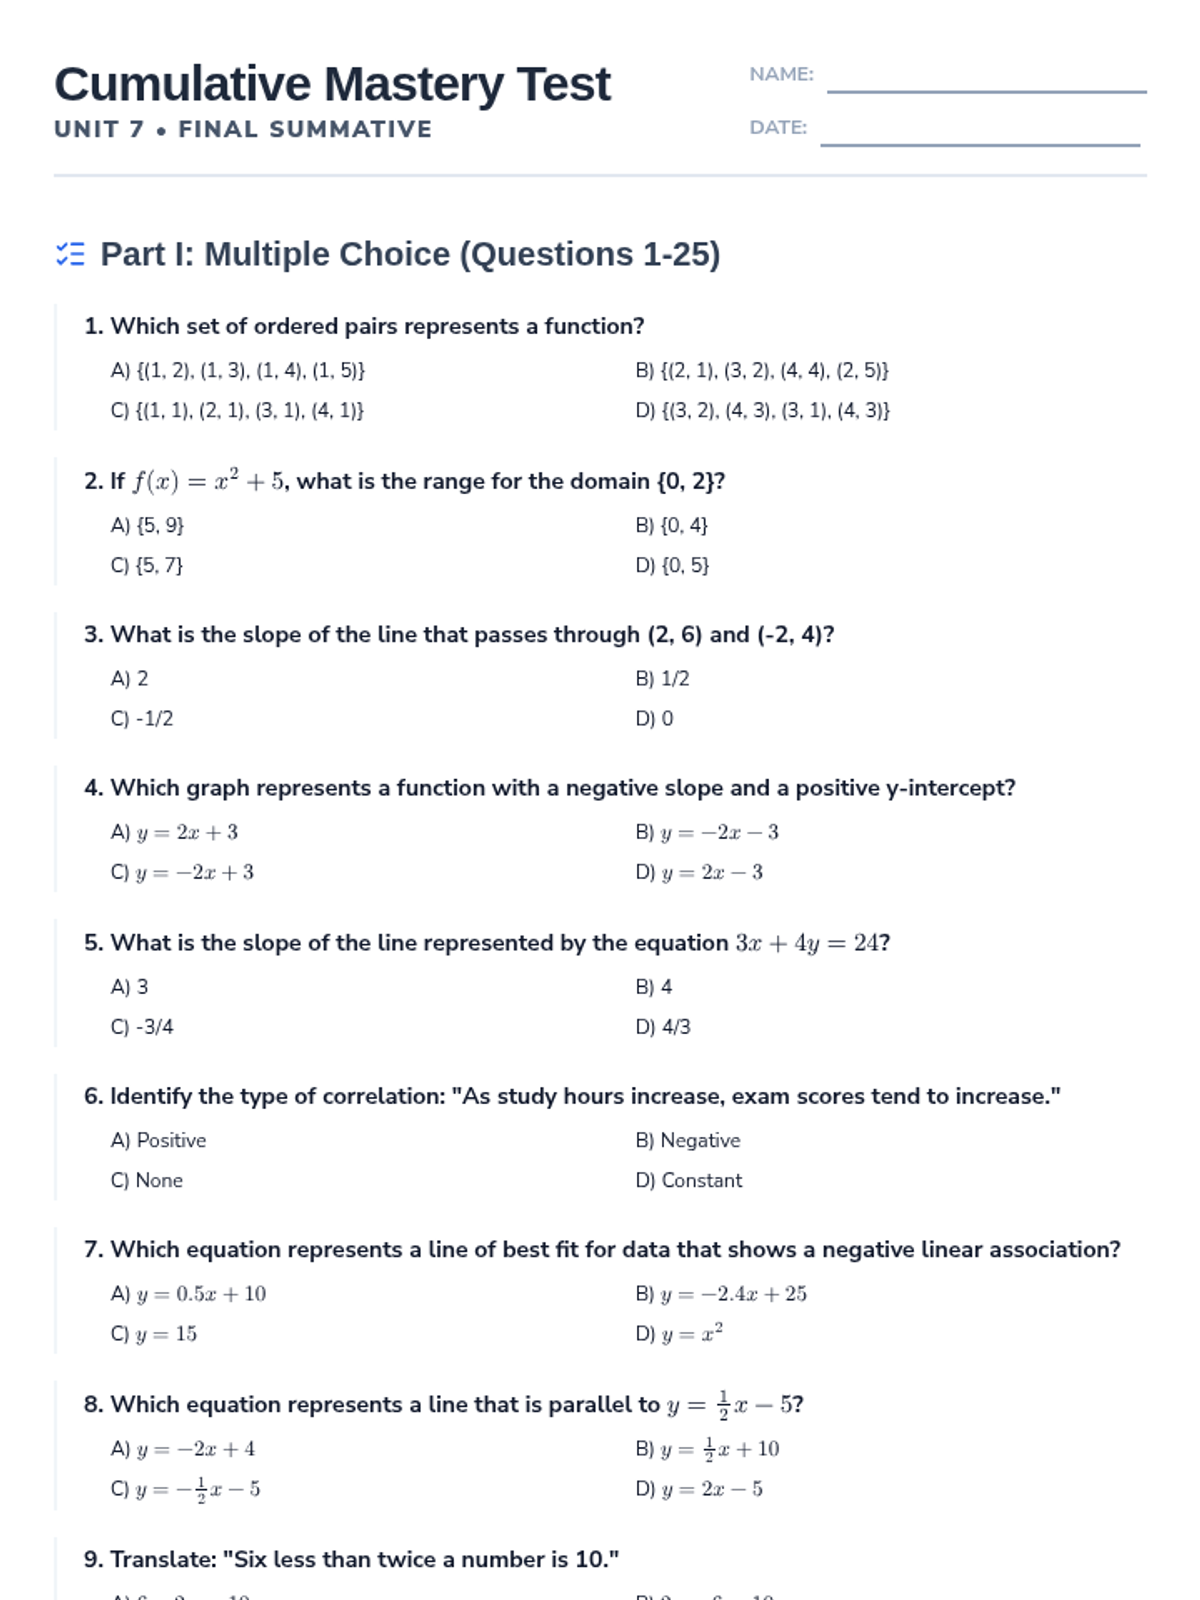
This prep lesson bridges previously mastered linear equation concepts with newer topics like scatter plots, correlation, and linear inequalities. Students will synthesize modeling techniques and algebraic conversions to prepare for the cumulative unit test.
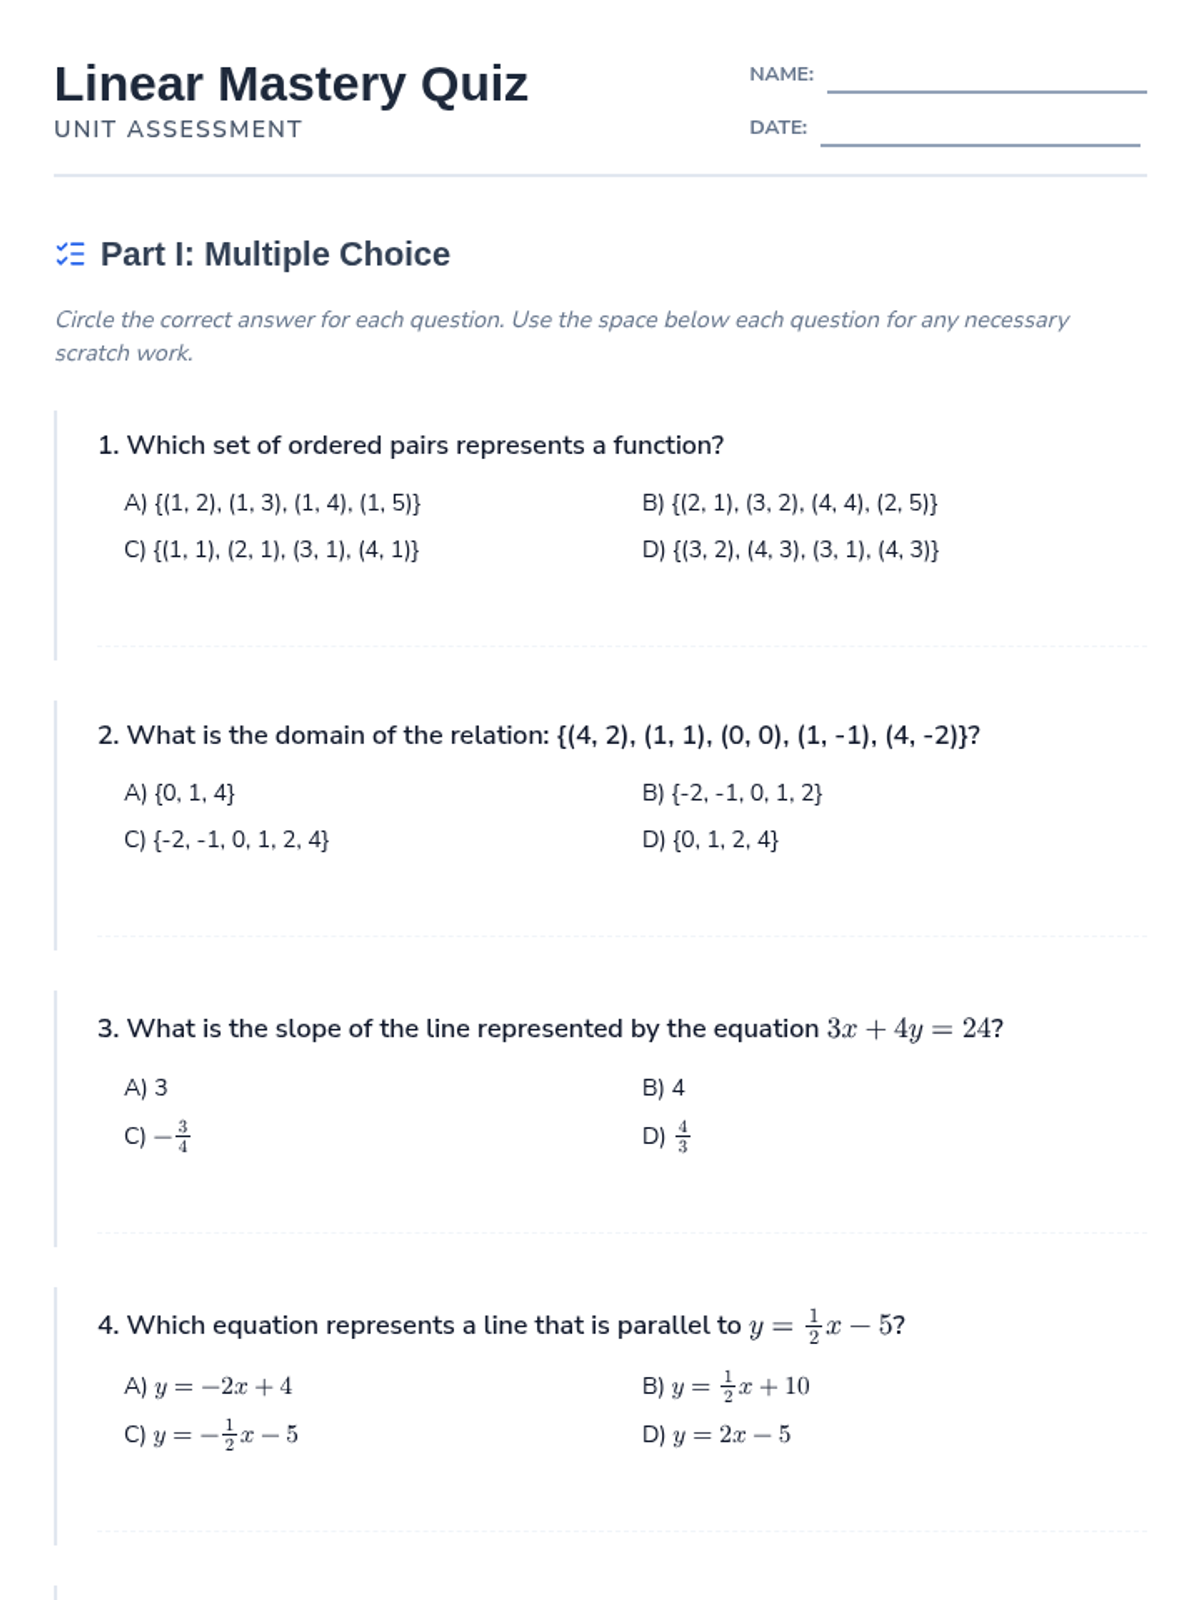
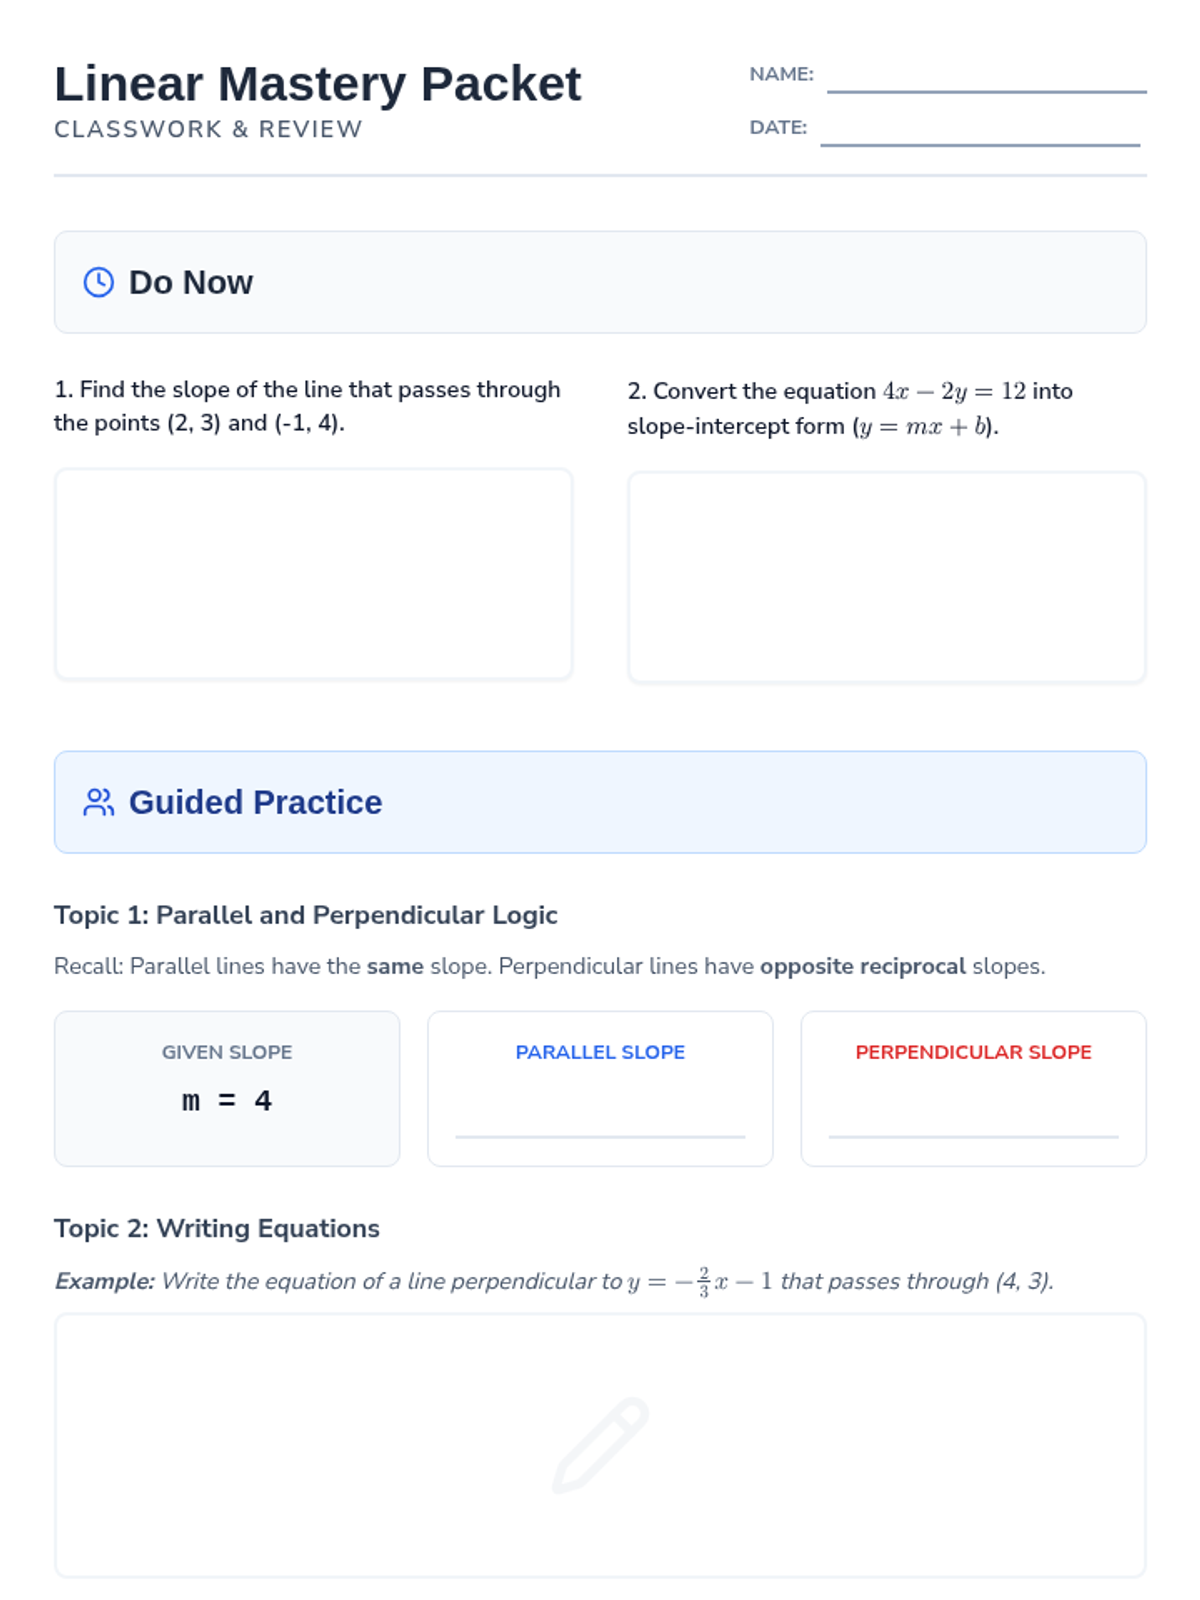
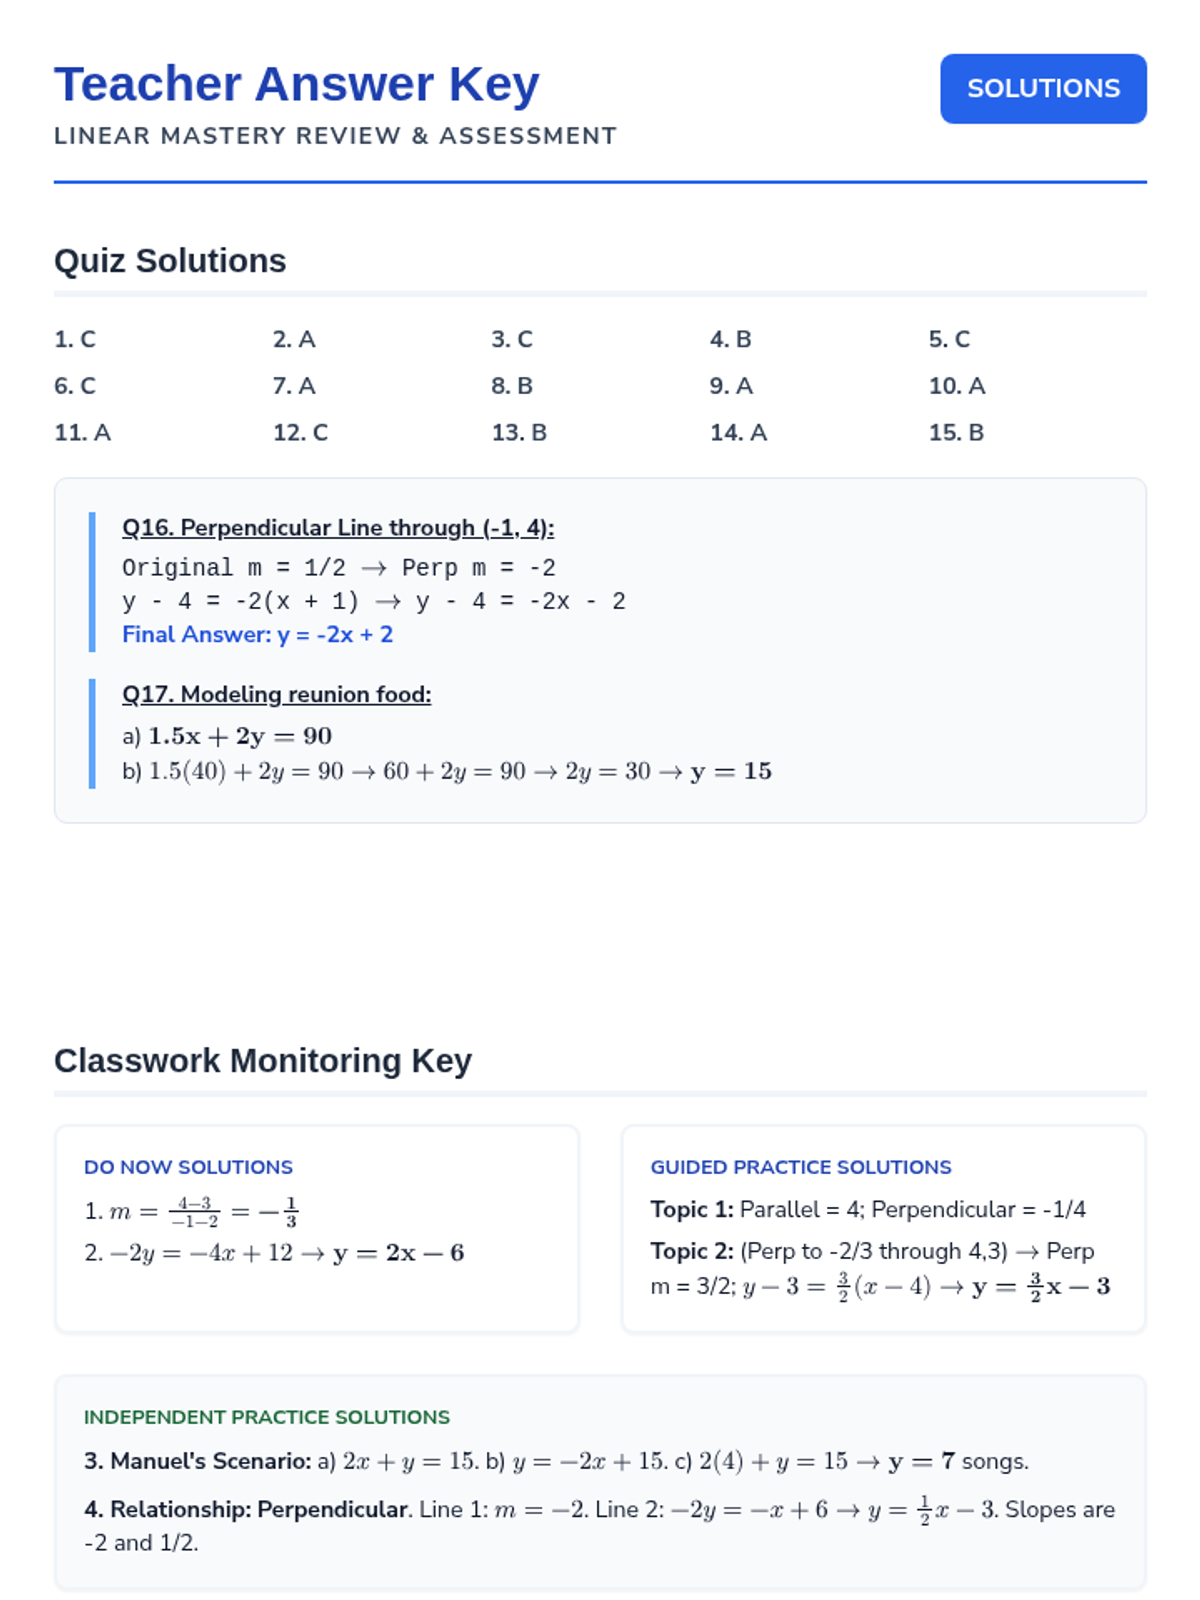
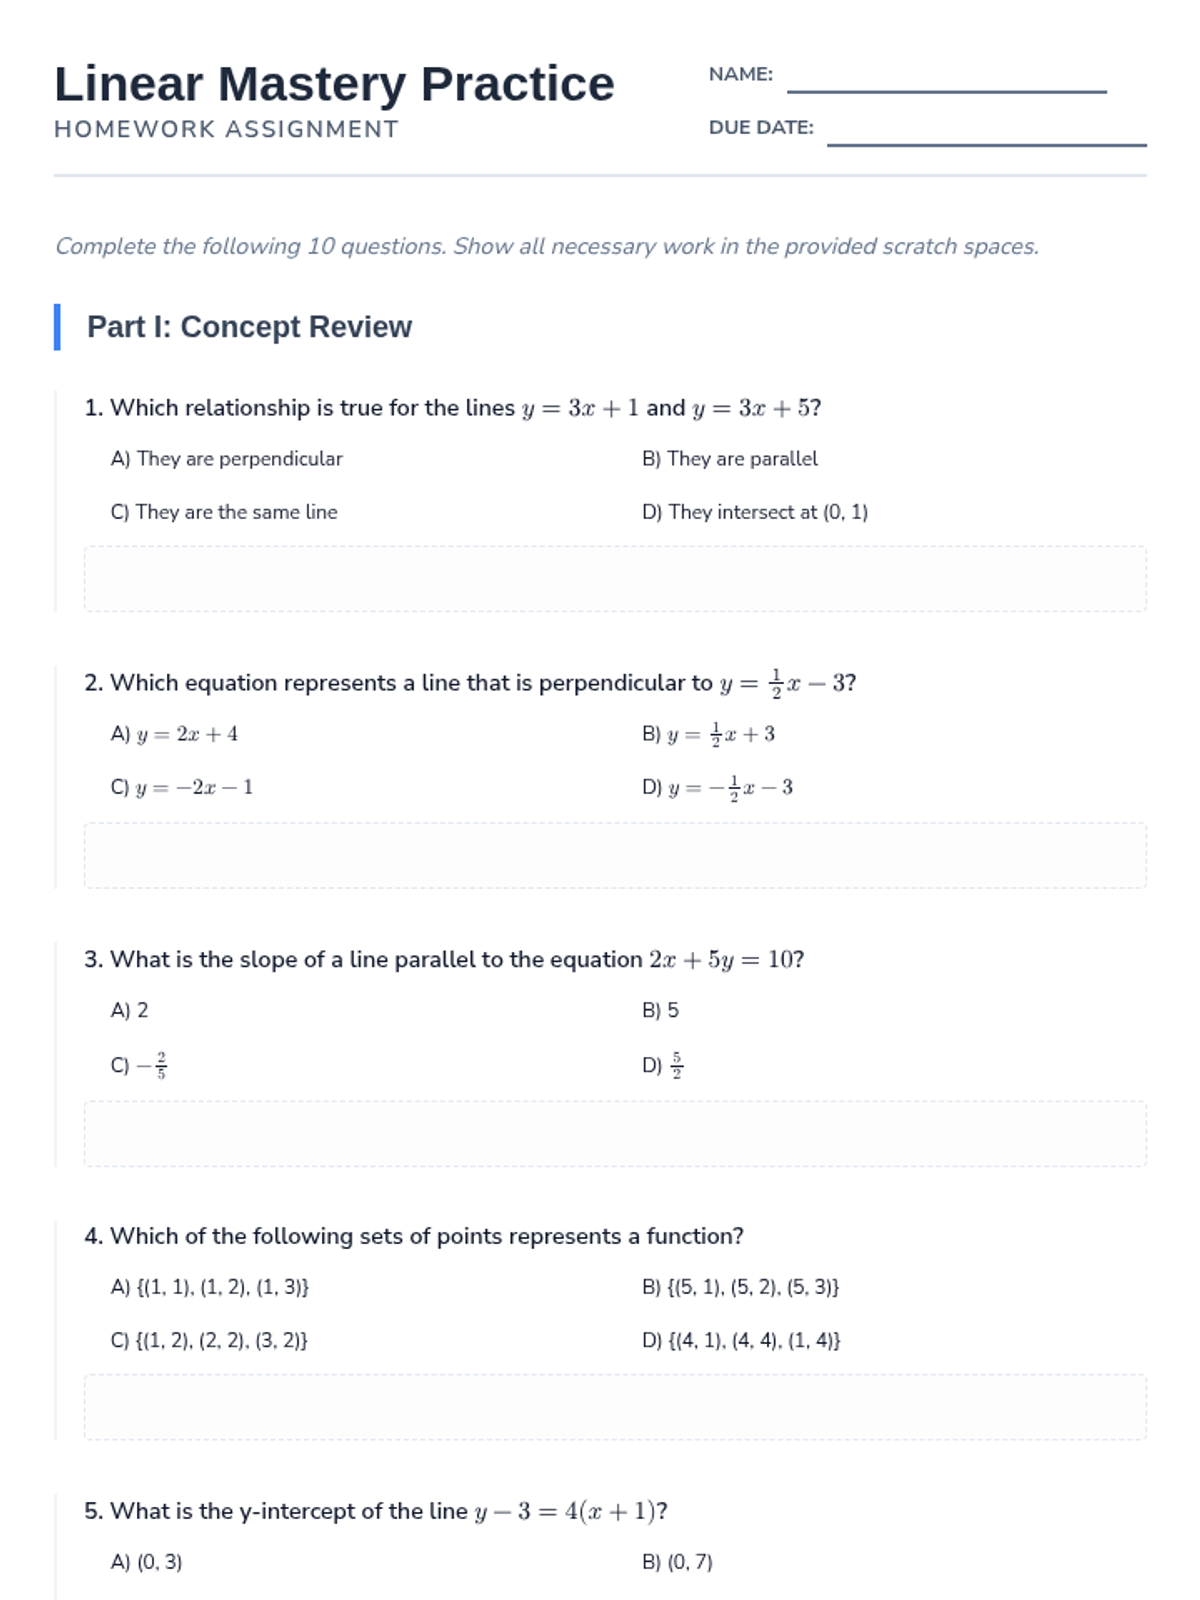
This lesson provides a comprehensive review and assessment of linear equations, covering function identification, standard form conversions, and the properties of parallel and perpendicular lines. Students will engage in guided practice, independent modeling, and summative evaluation to master linear relationships.
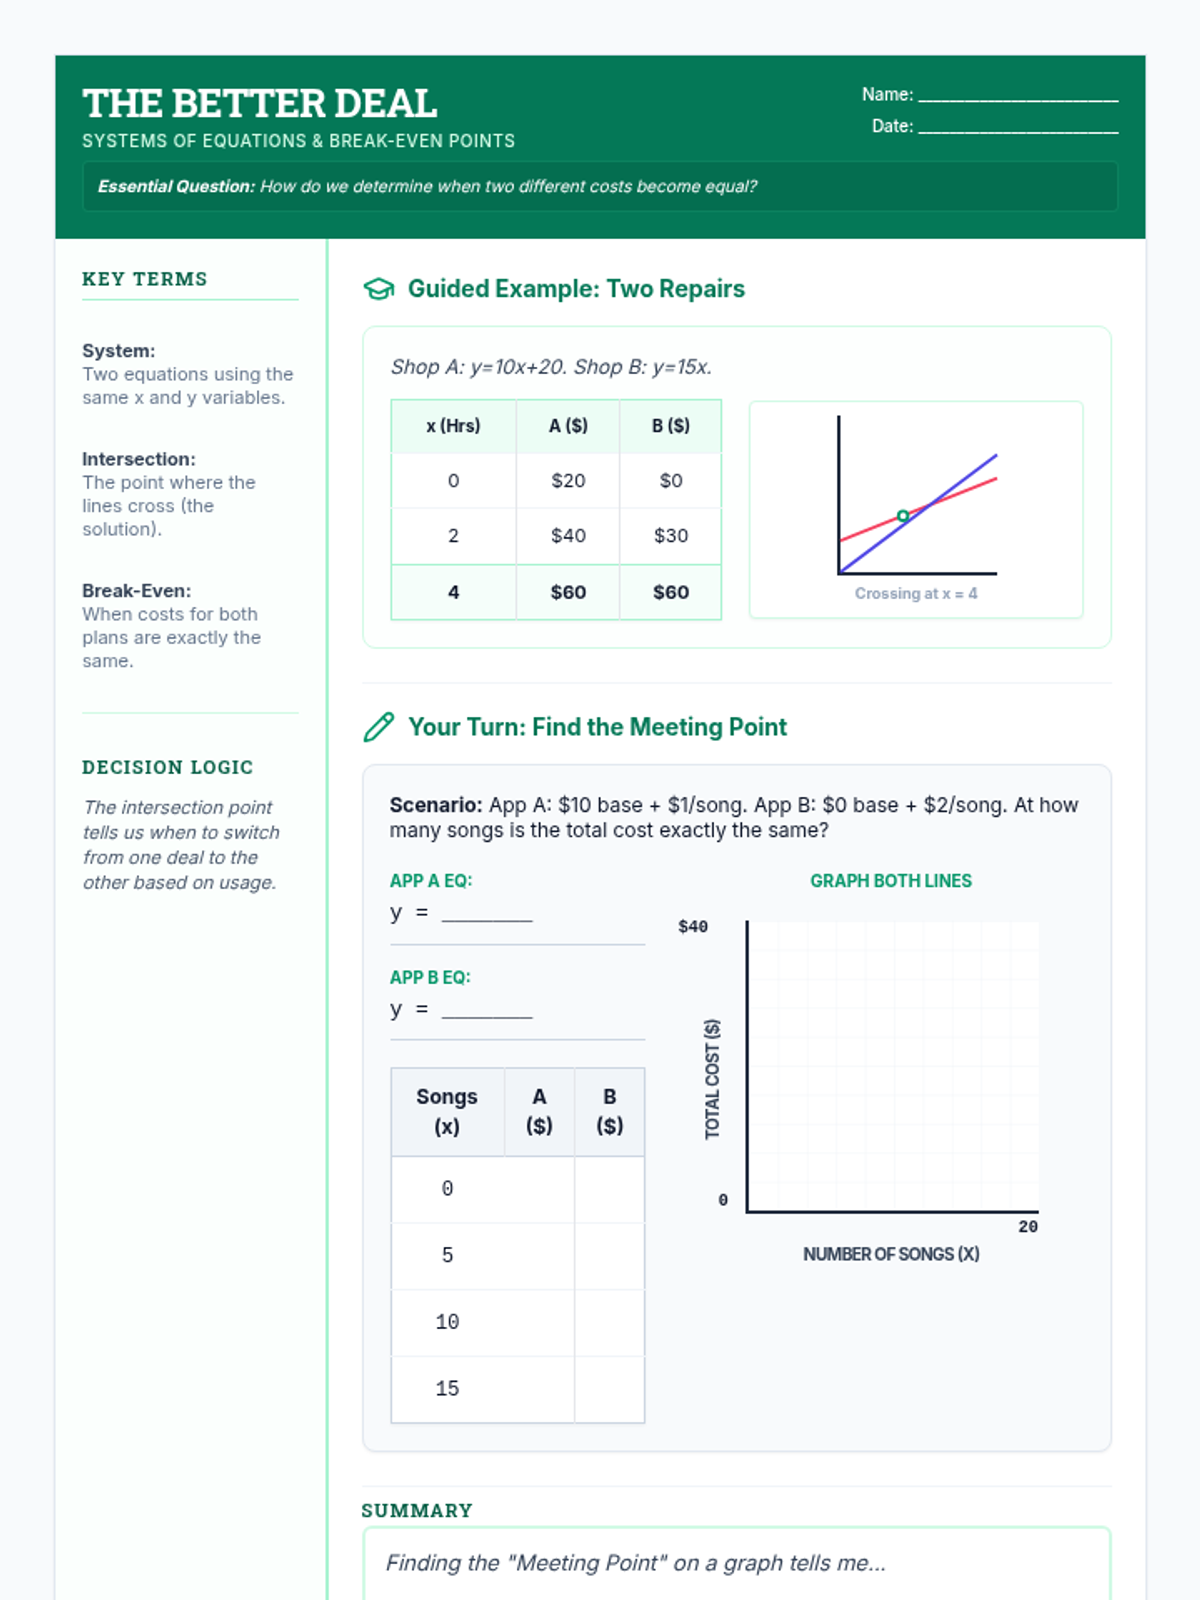
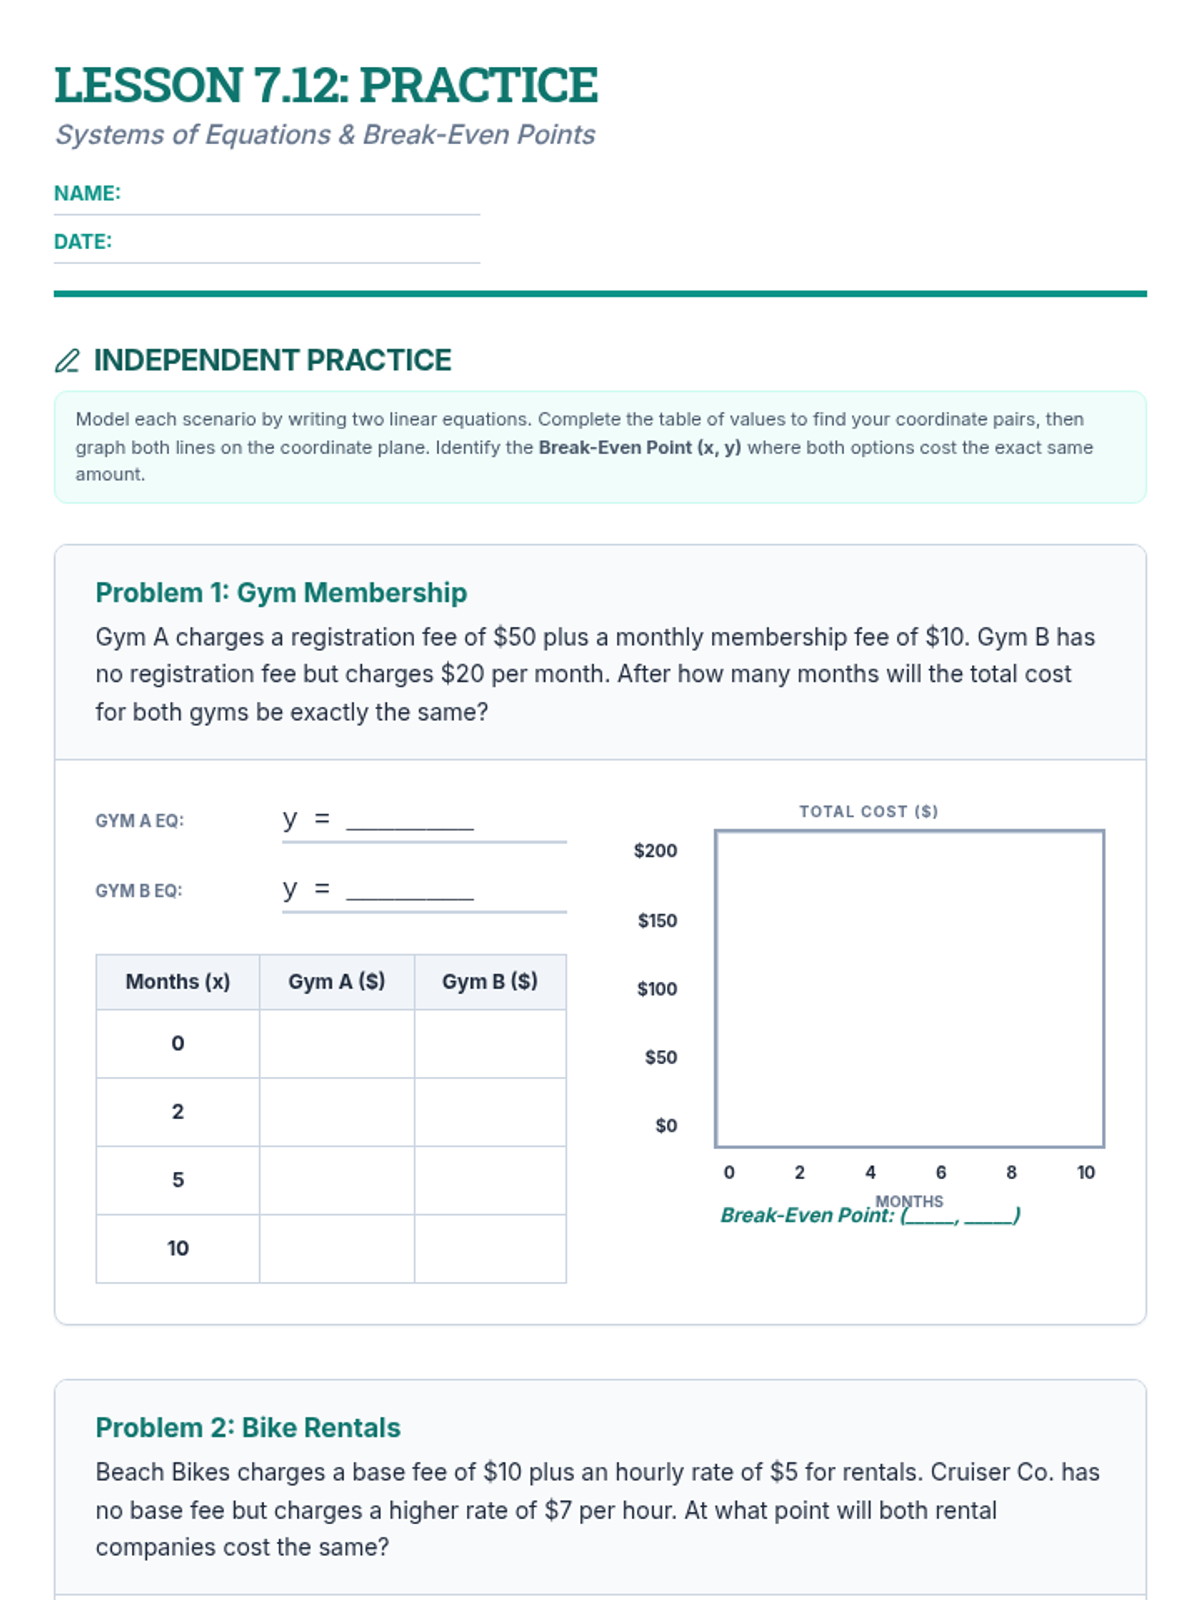
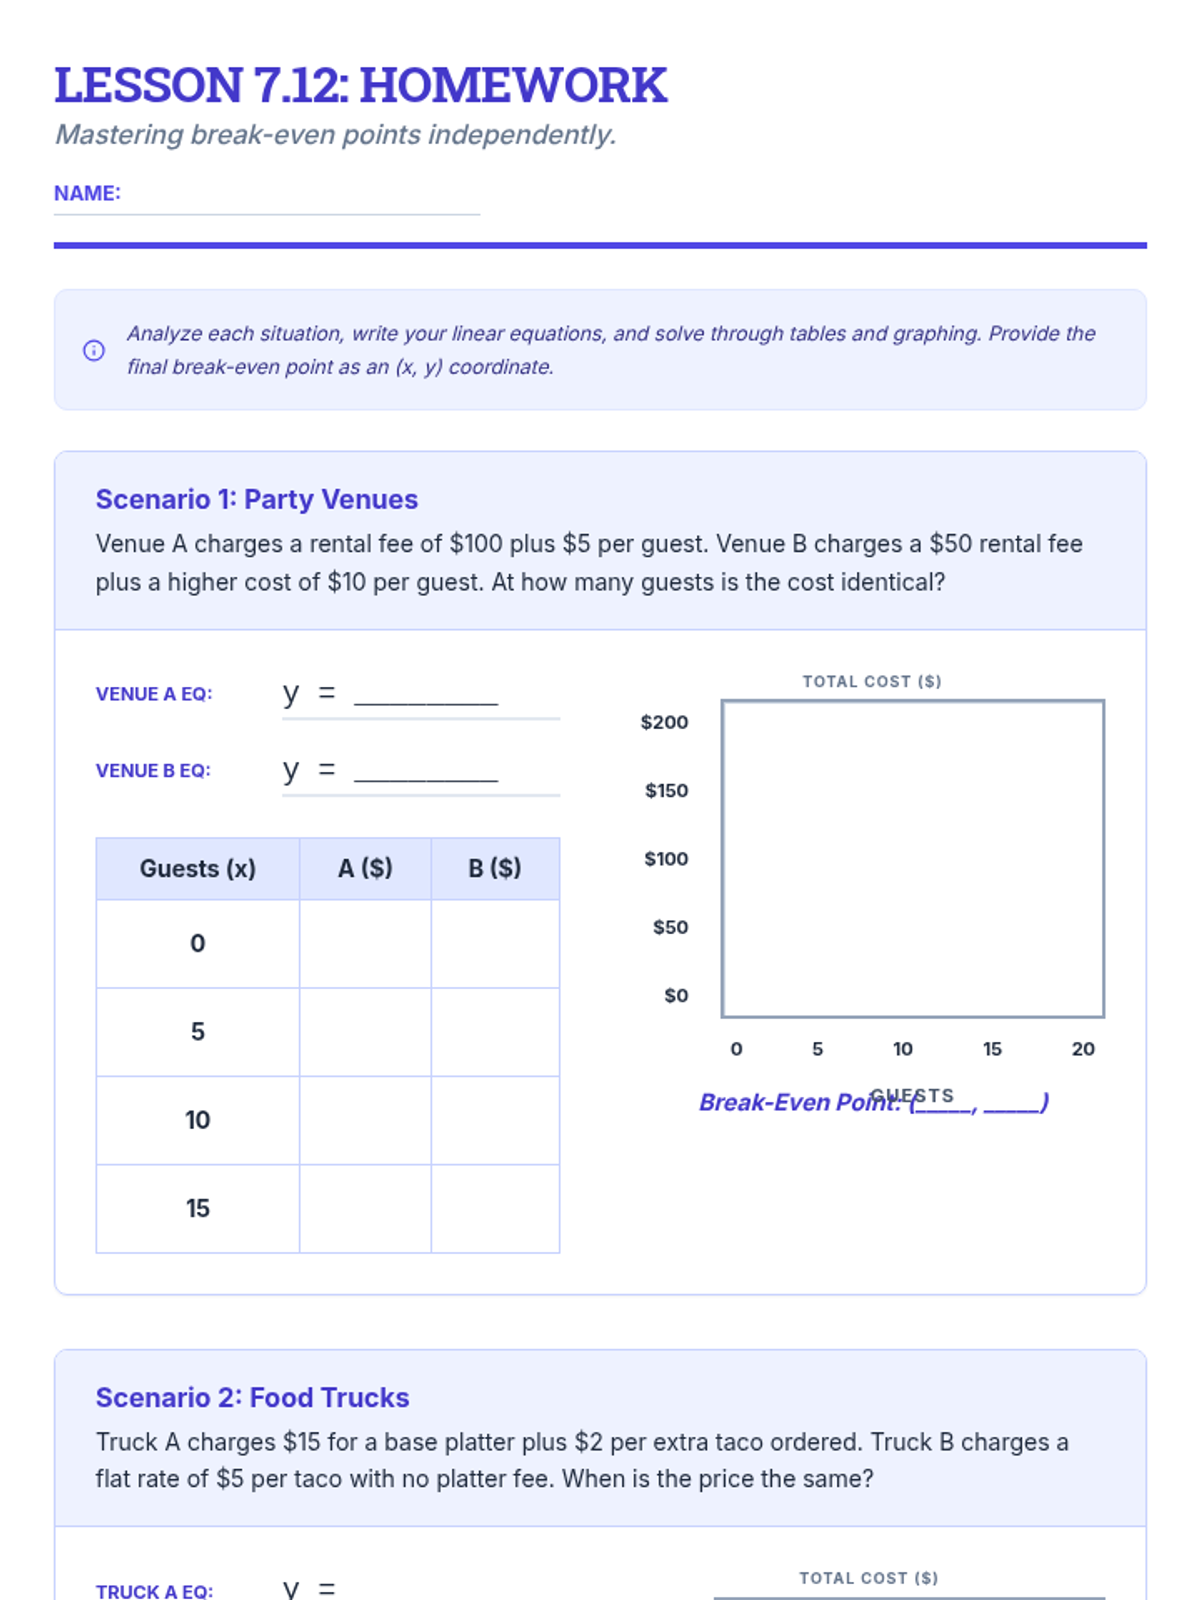
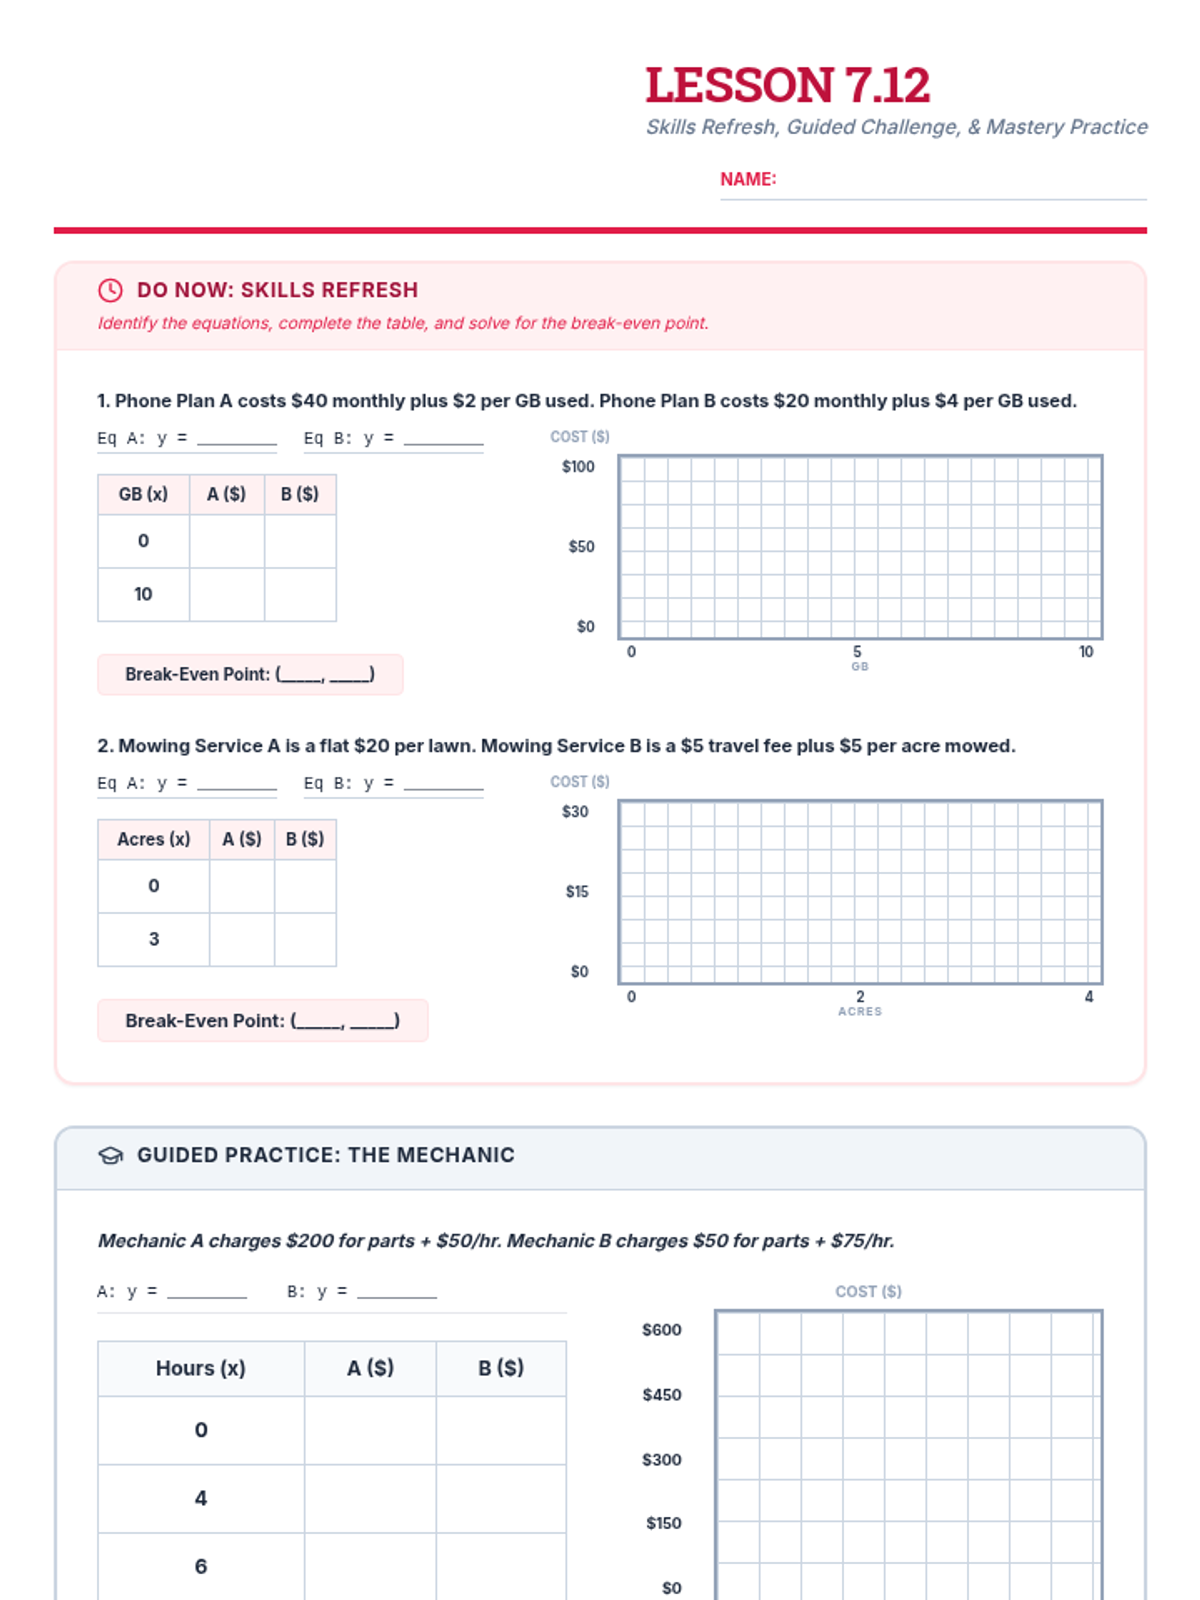
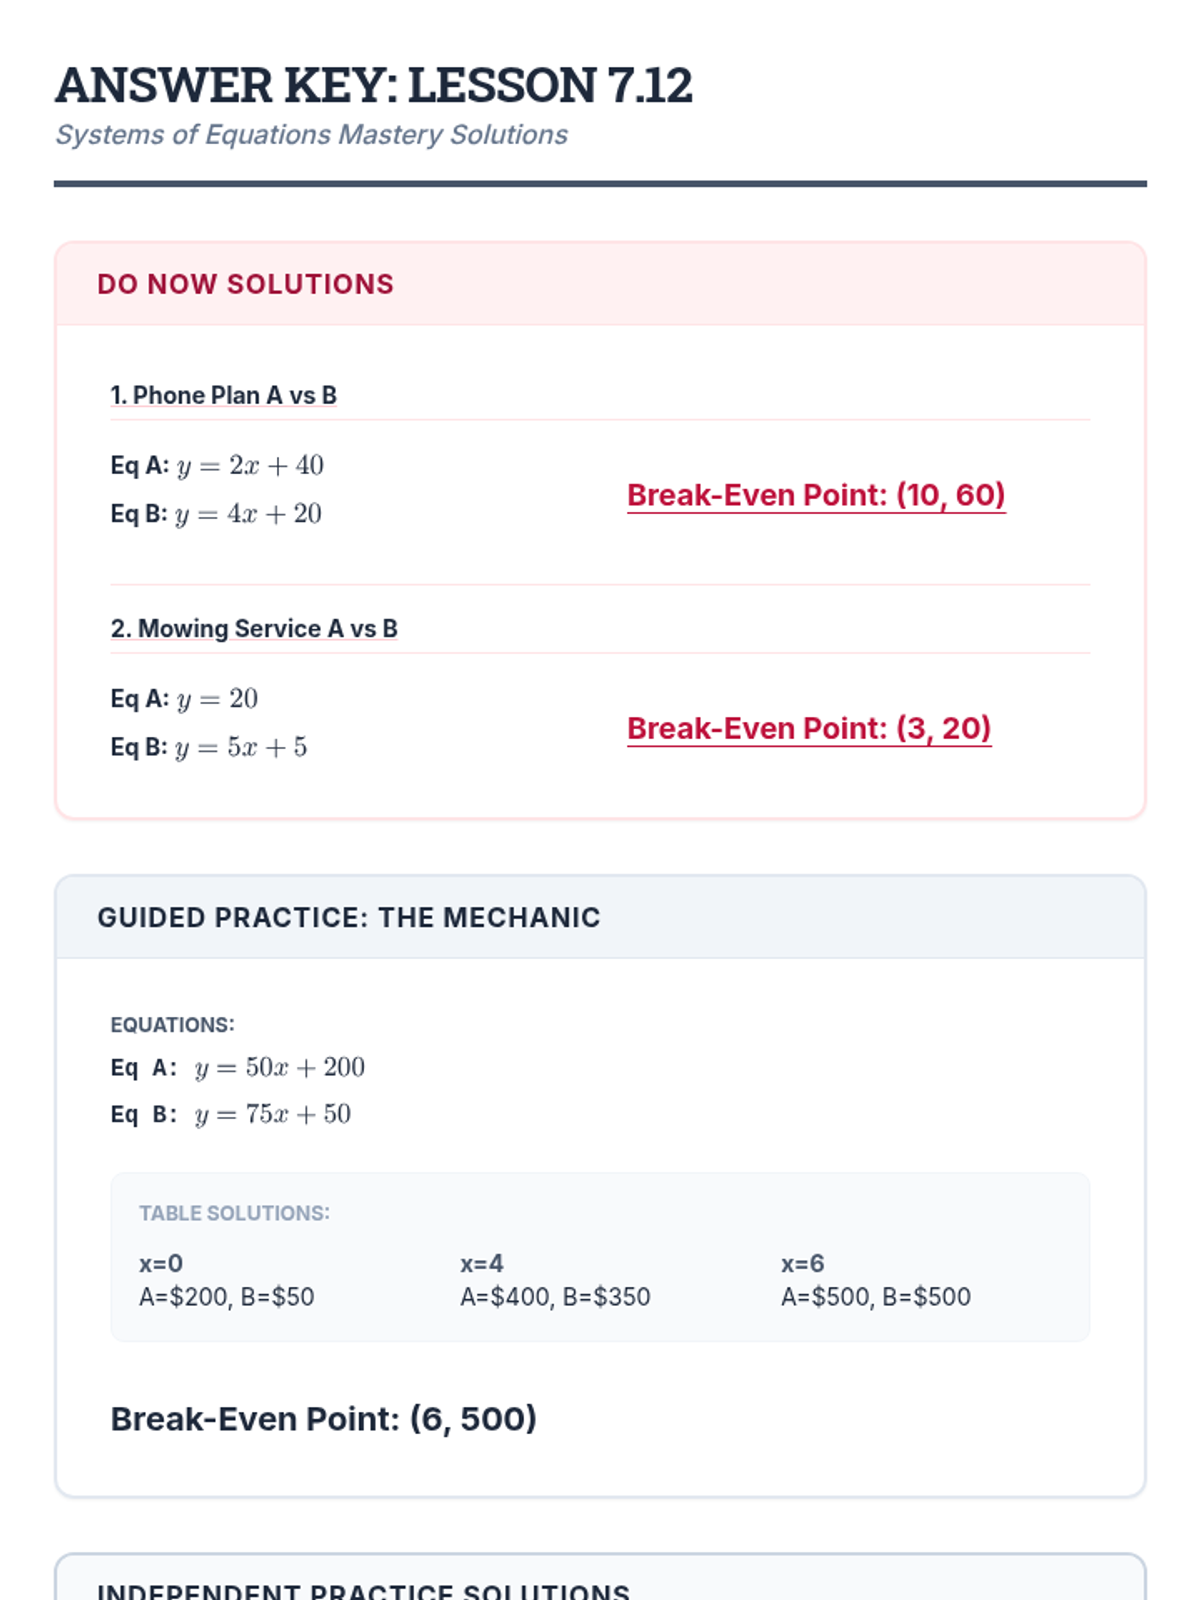
A comprehensive series of activities where students learn to identify, model, and solve systems of linear equations to find the 'better deal' in real-world scenarios.
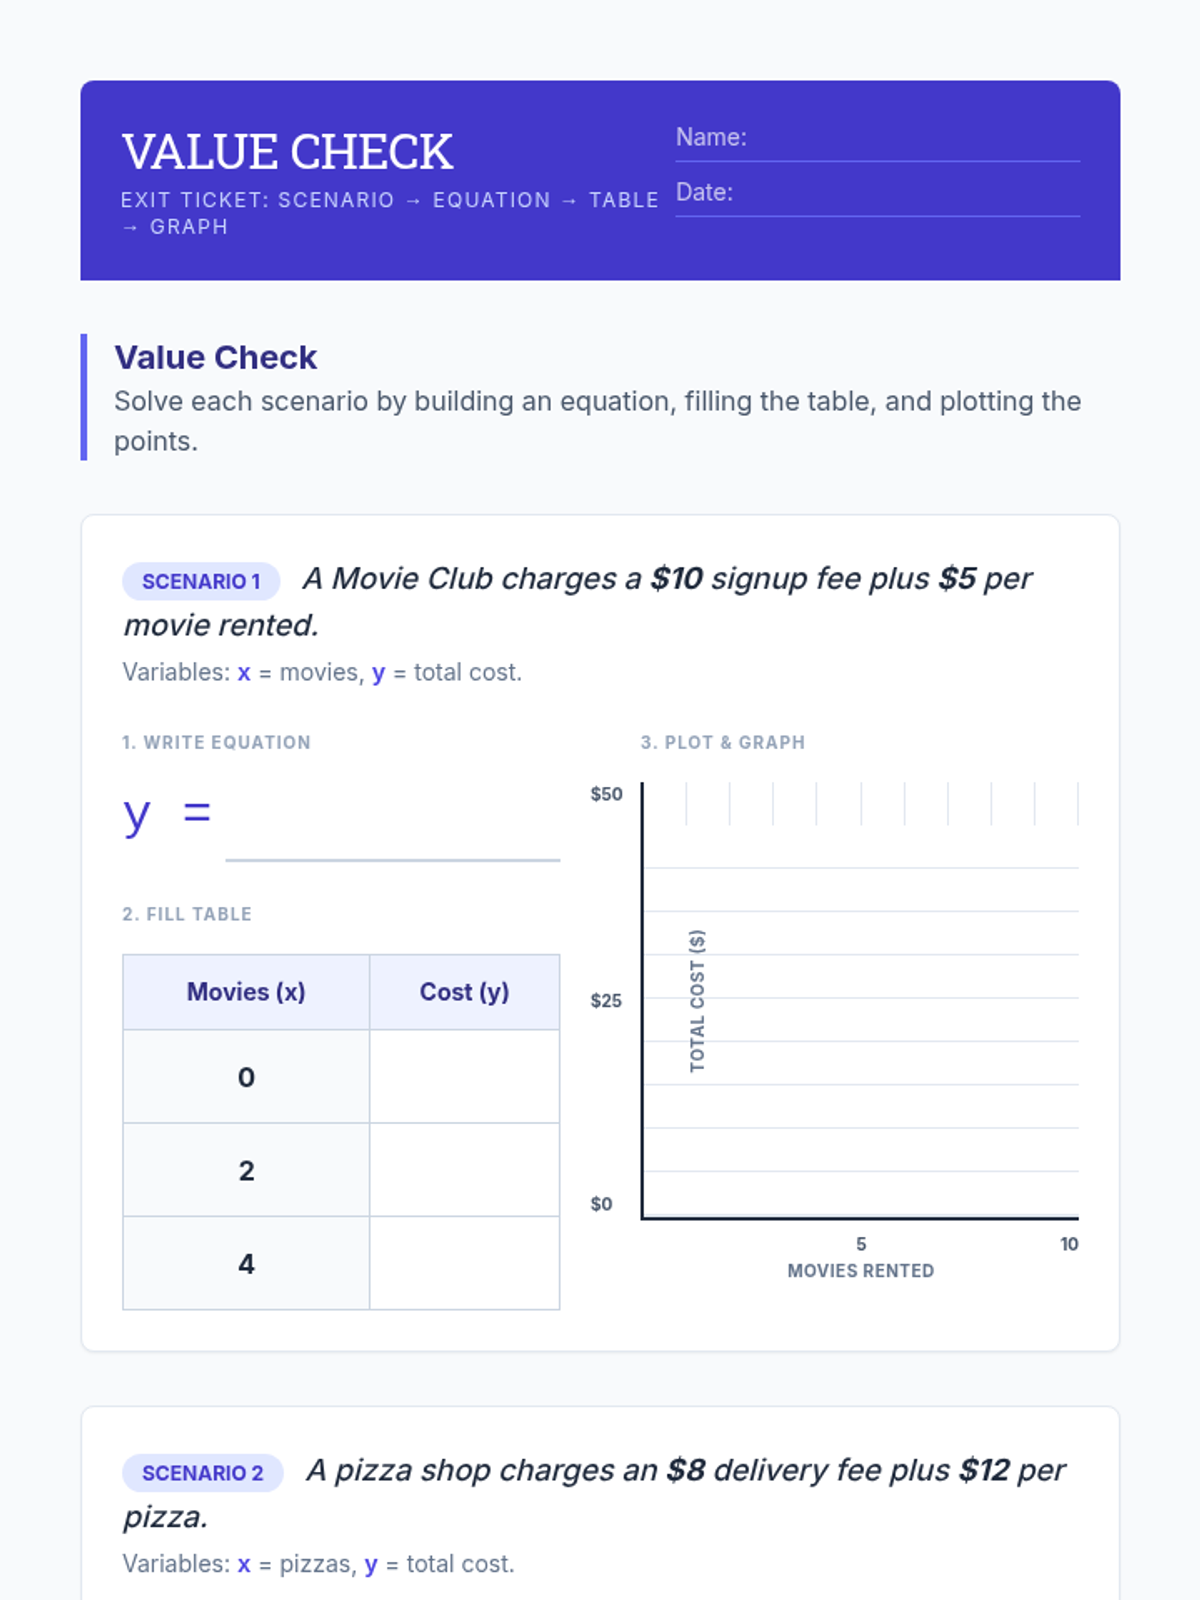
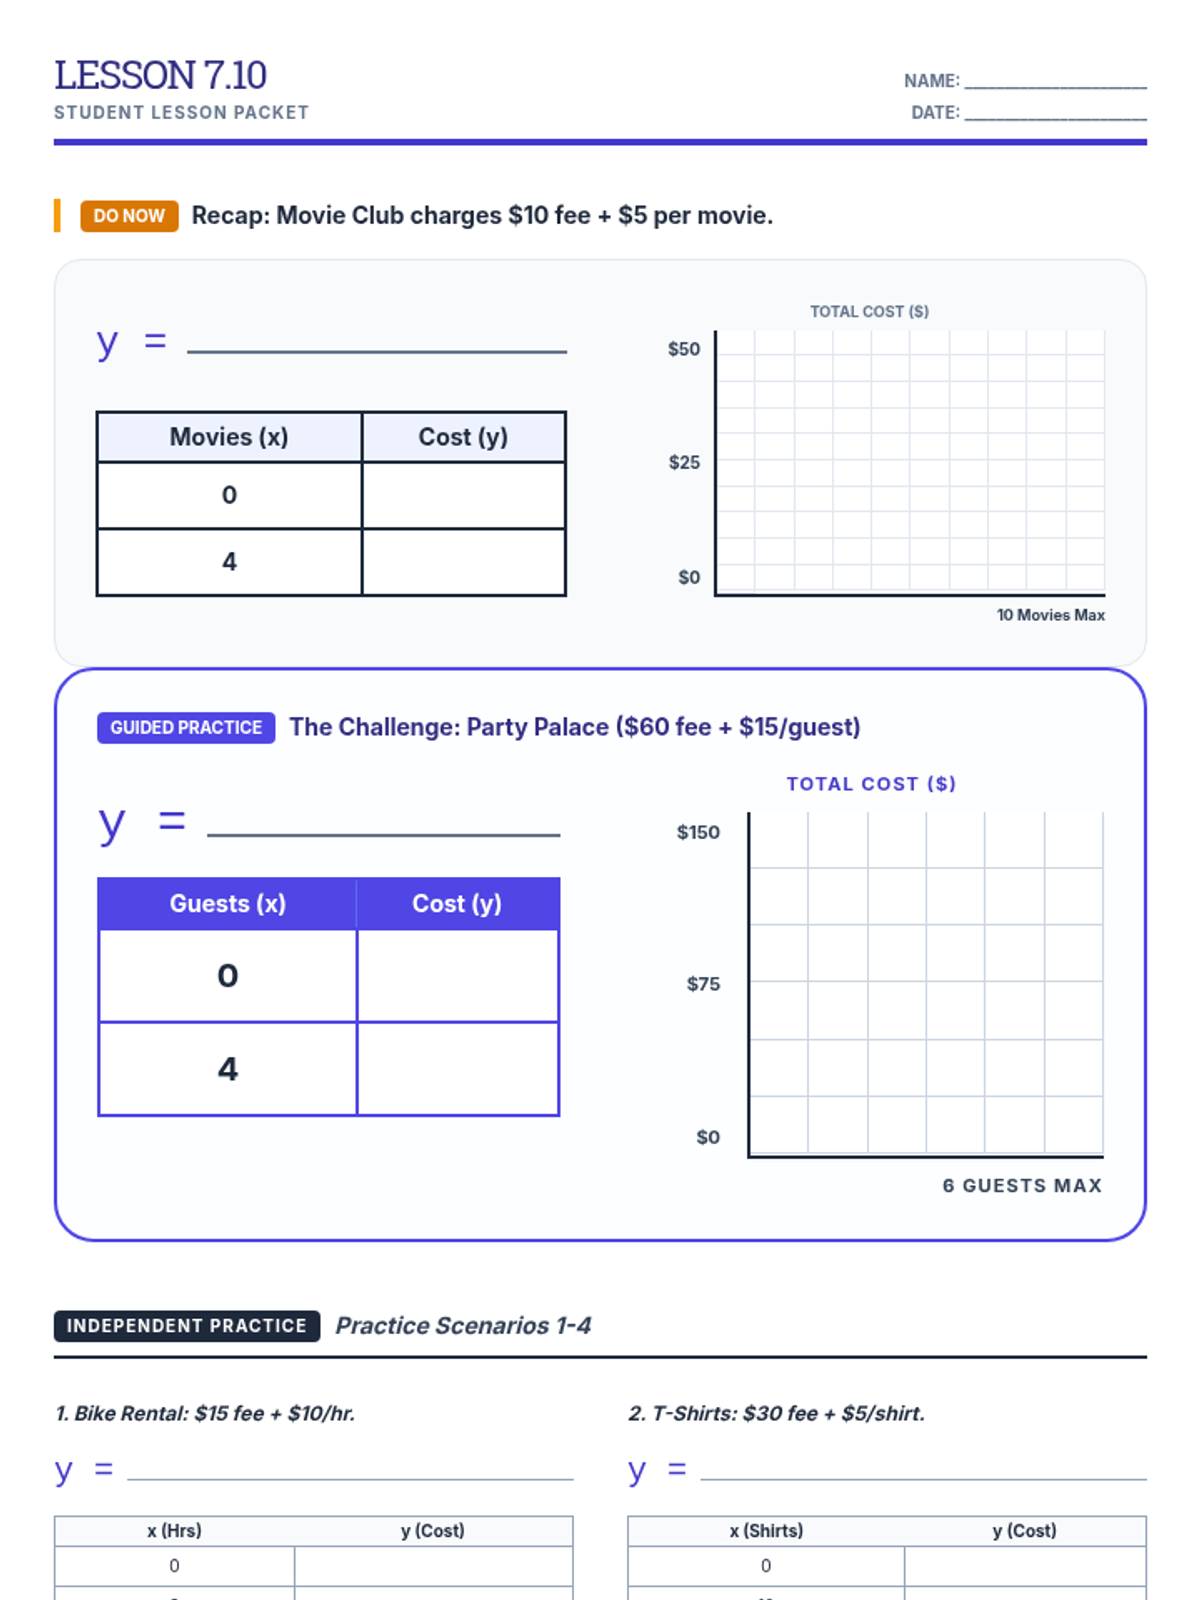
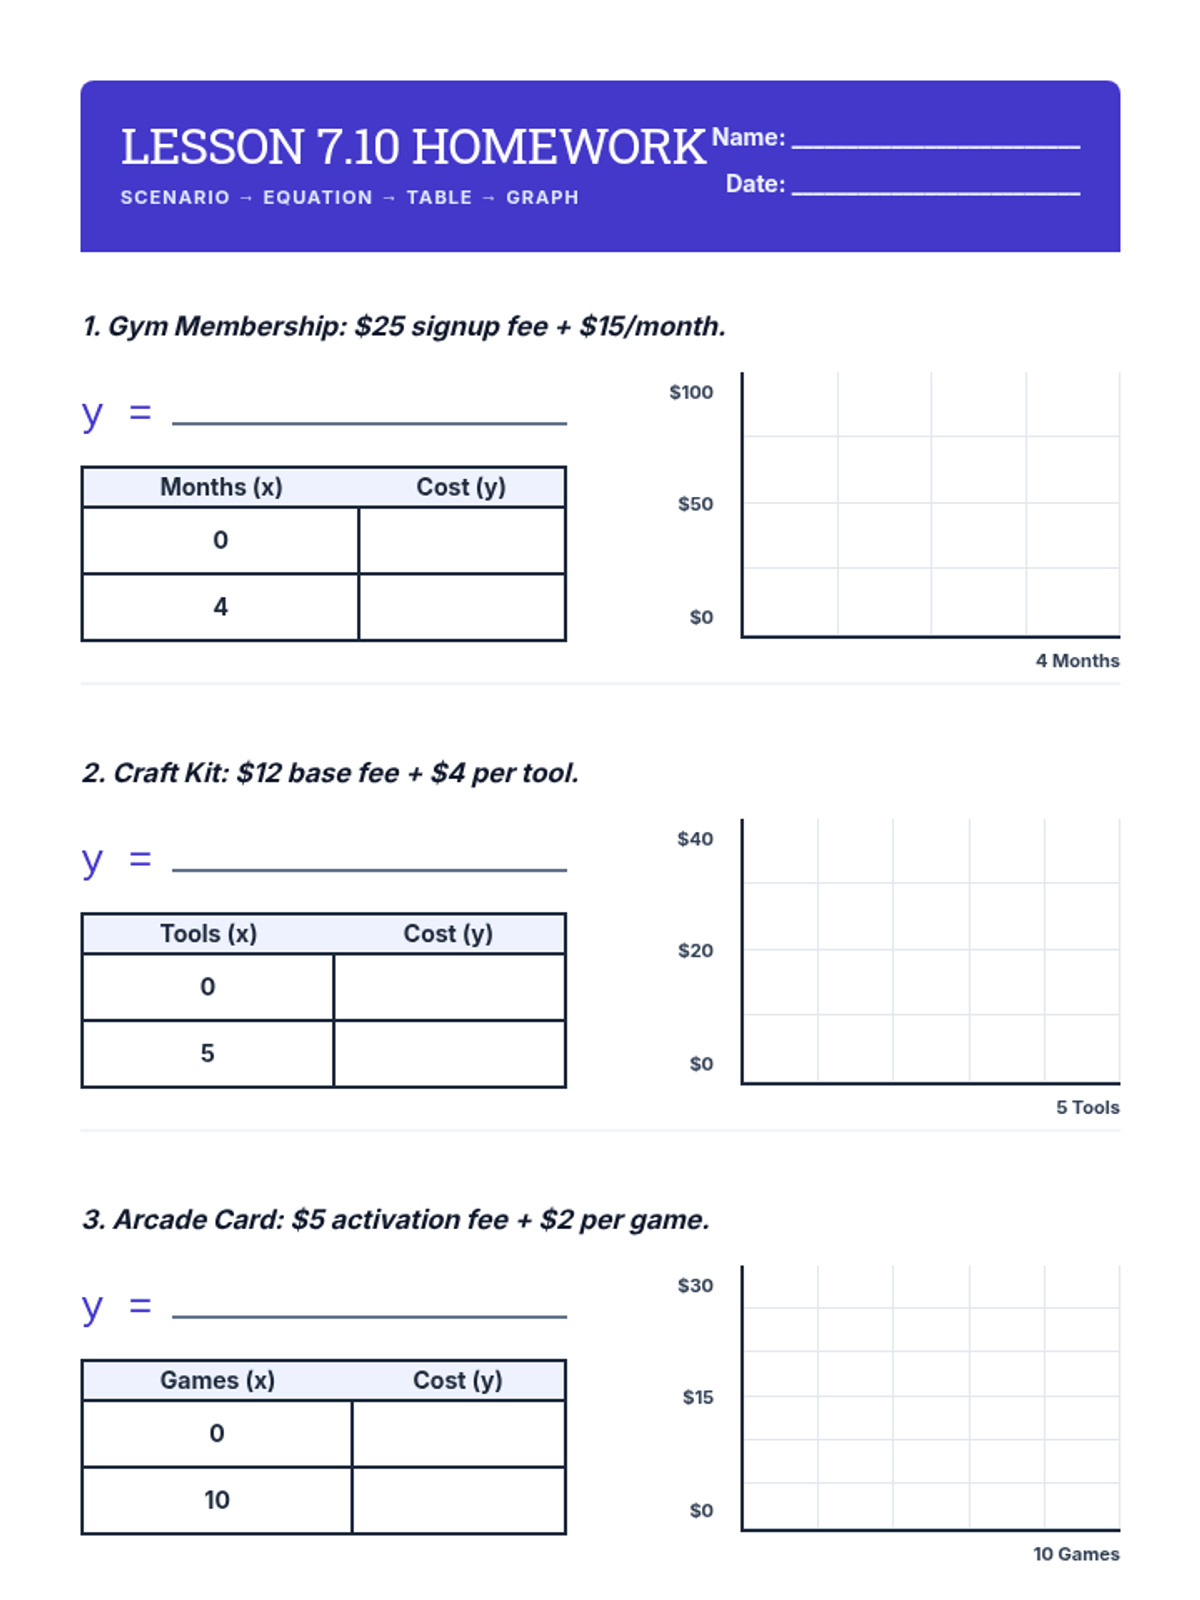
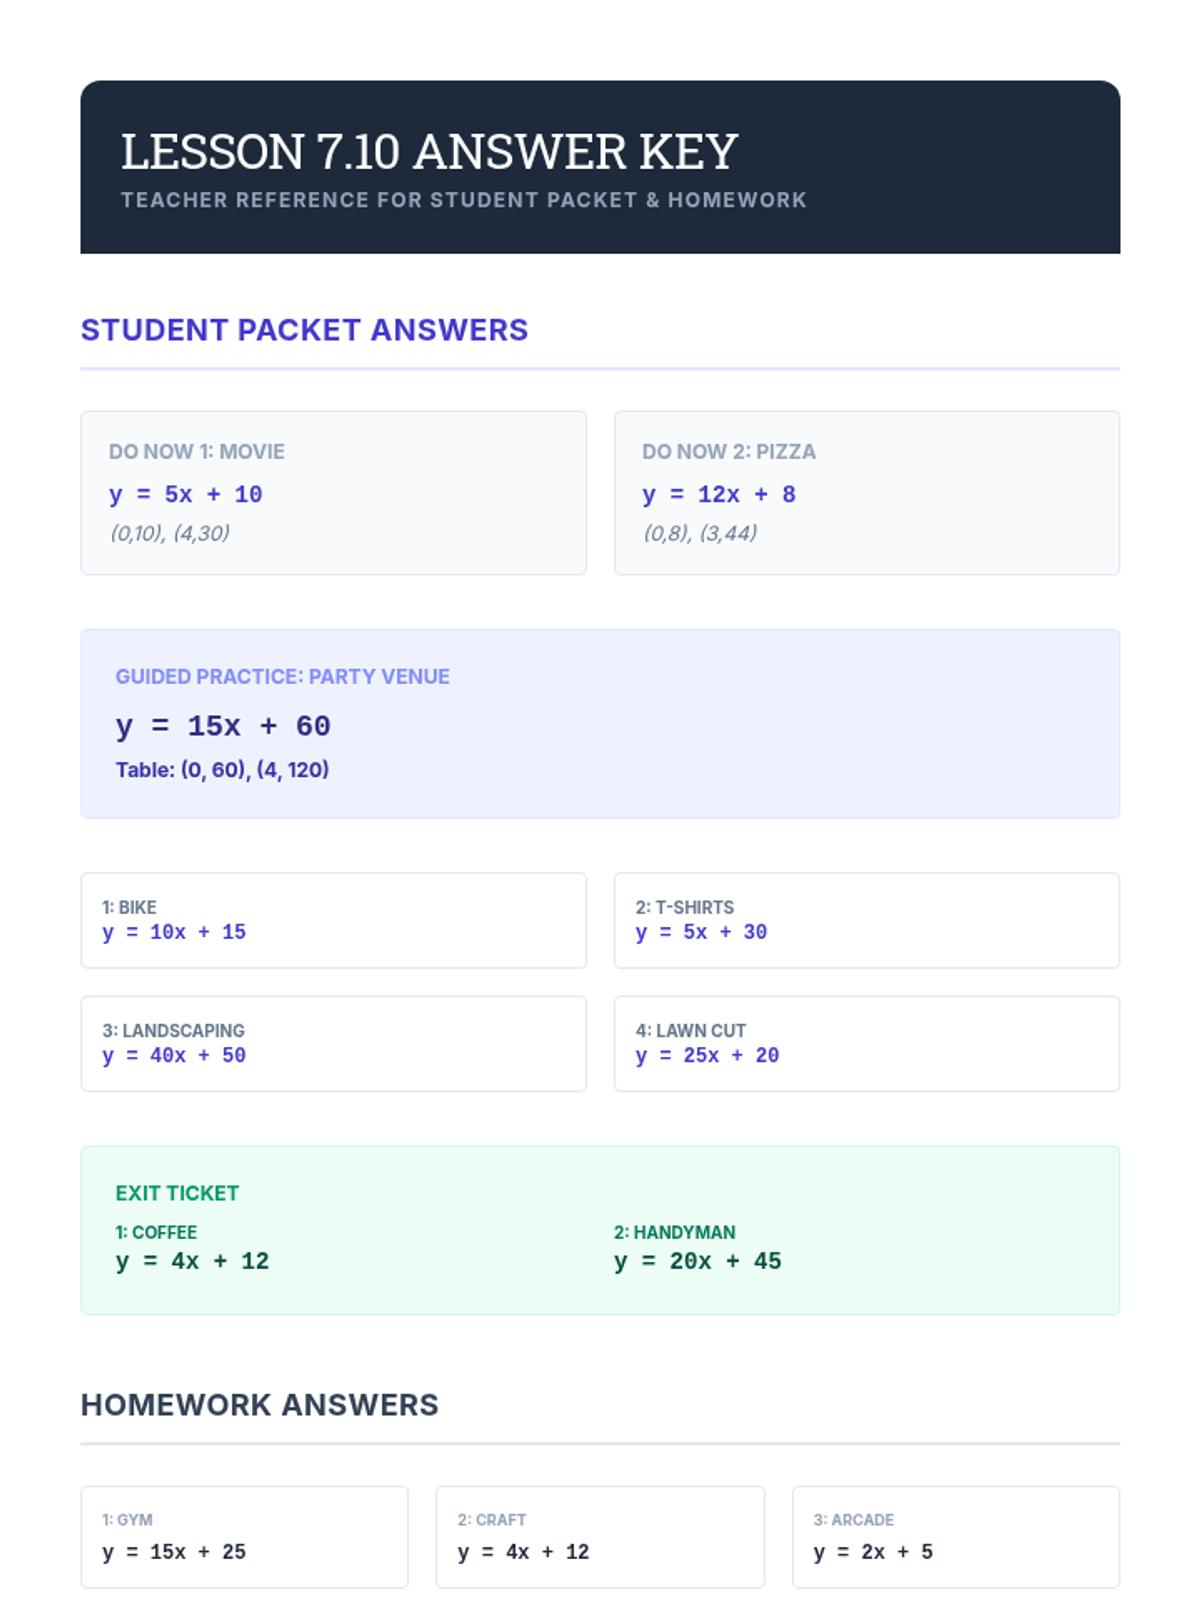
Students practice translating real-world scenarios into linear equations, tables, and graphs using positive whole numbers. This lesson reinforces the relationship between initial fees (y-intercept) and rates of change (slope).
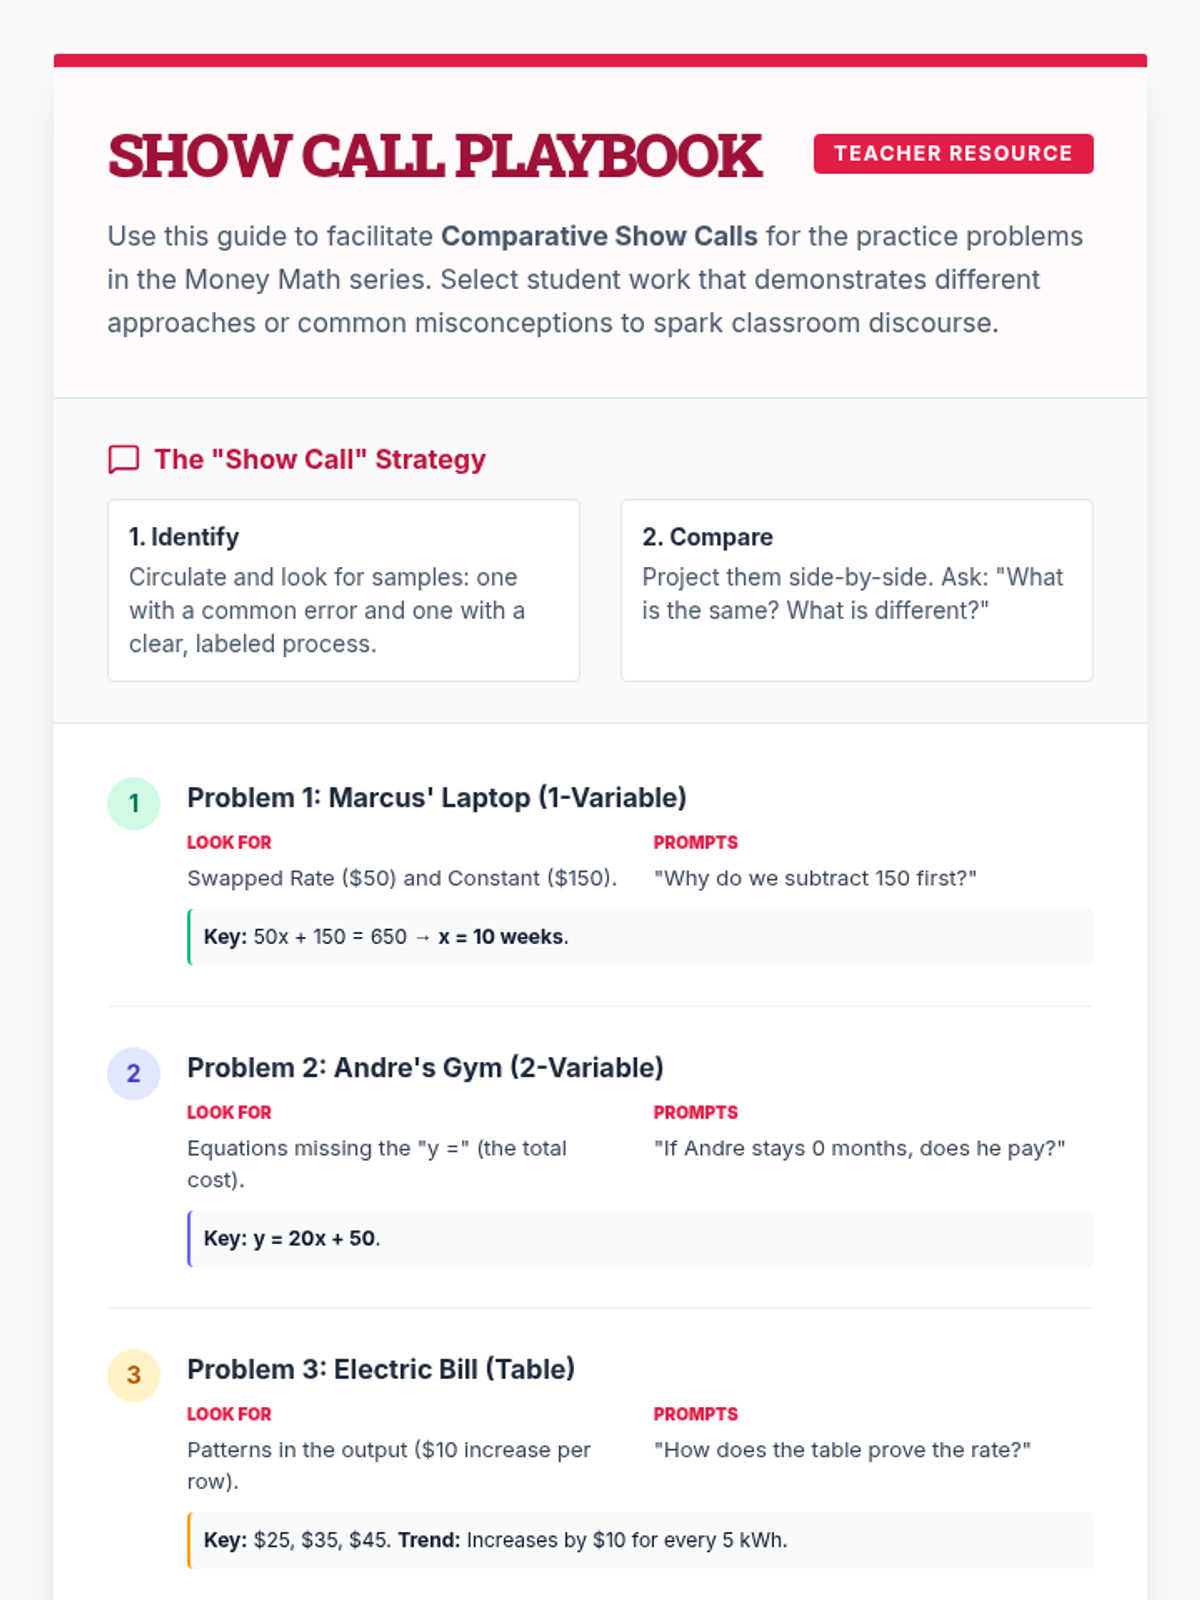
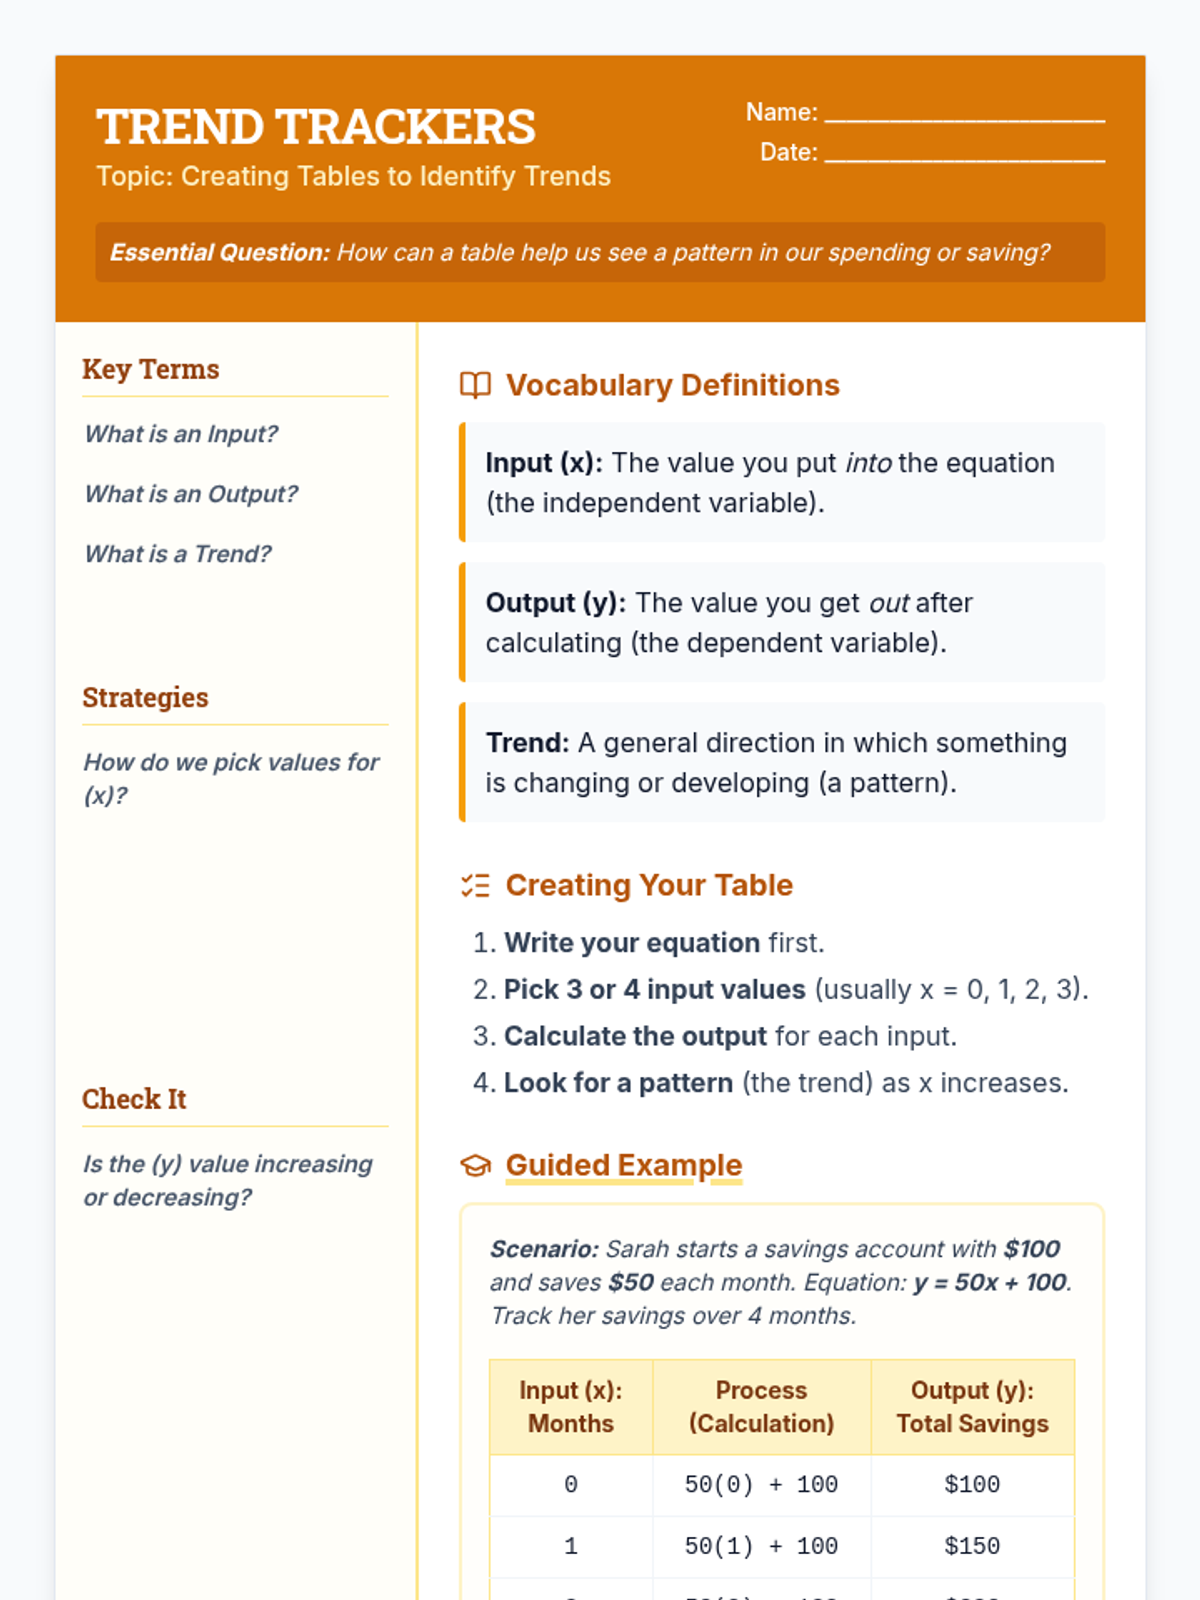
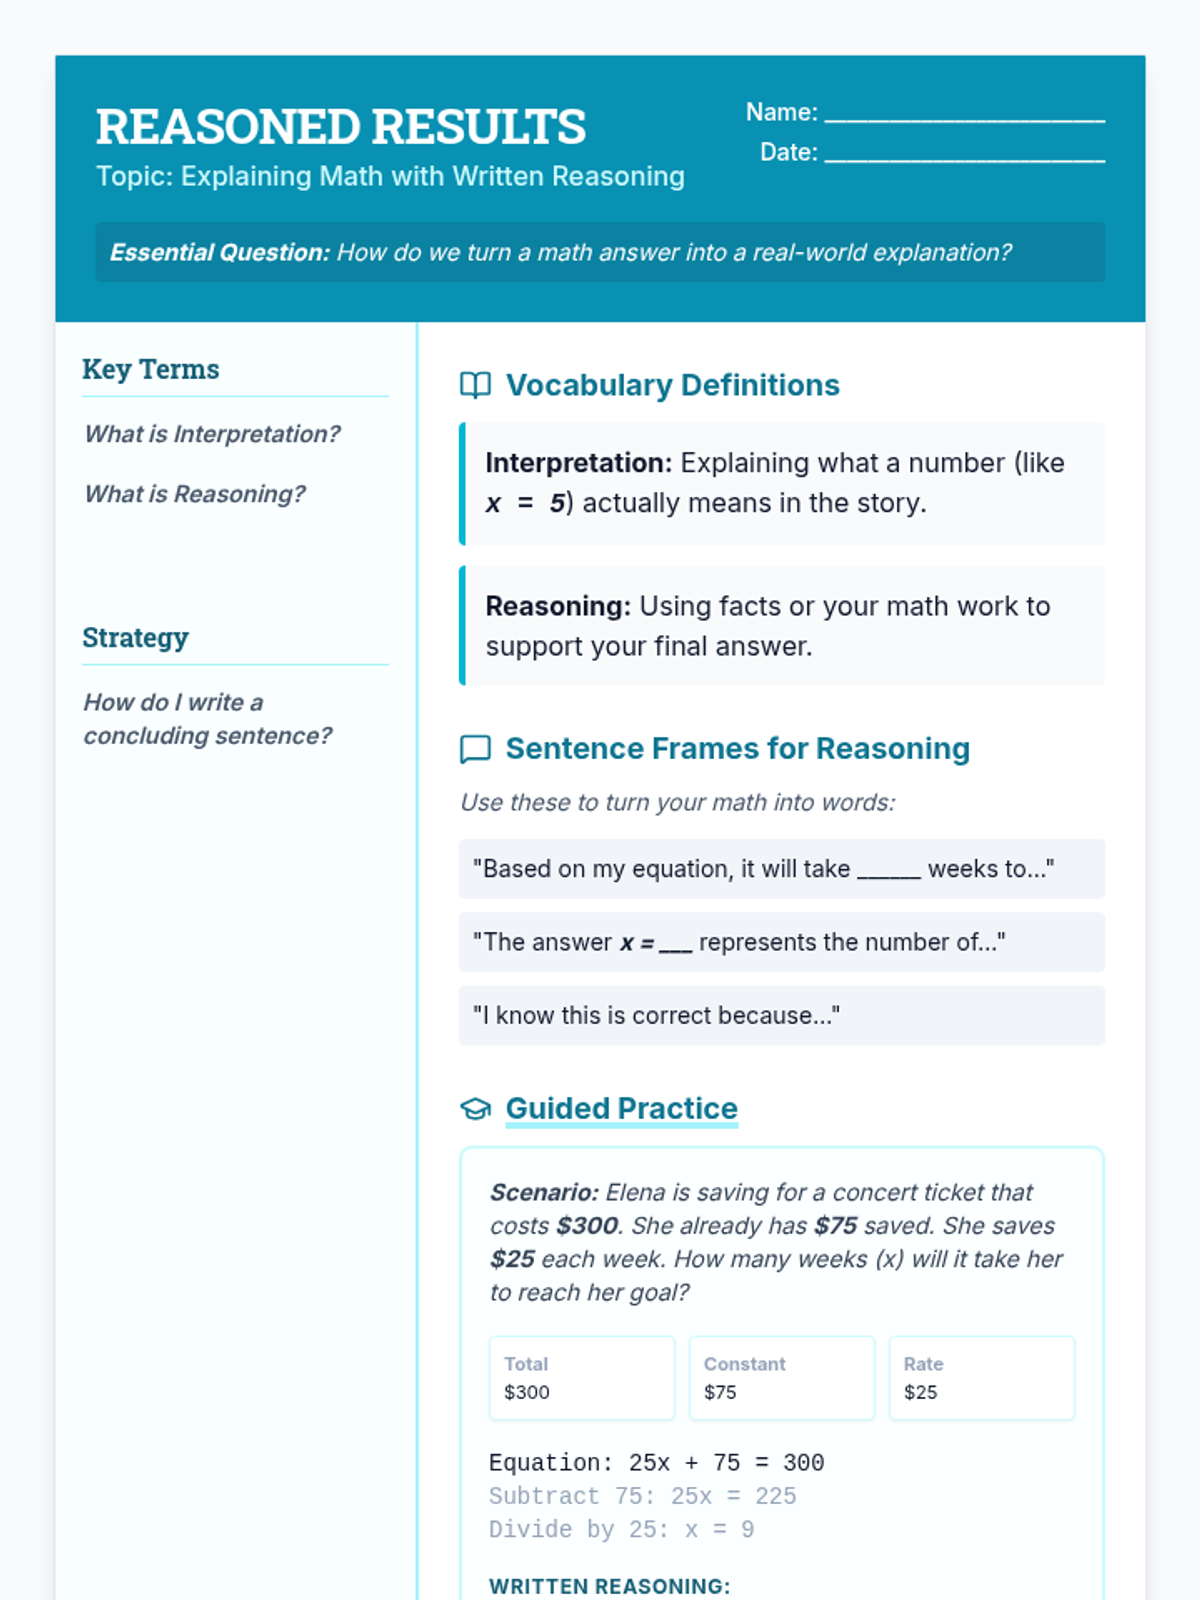
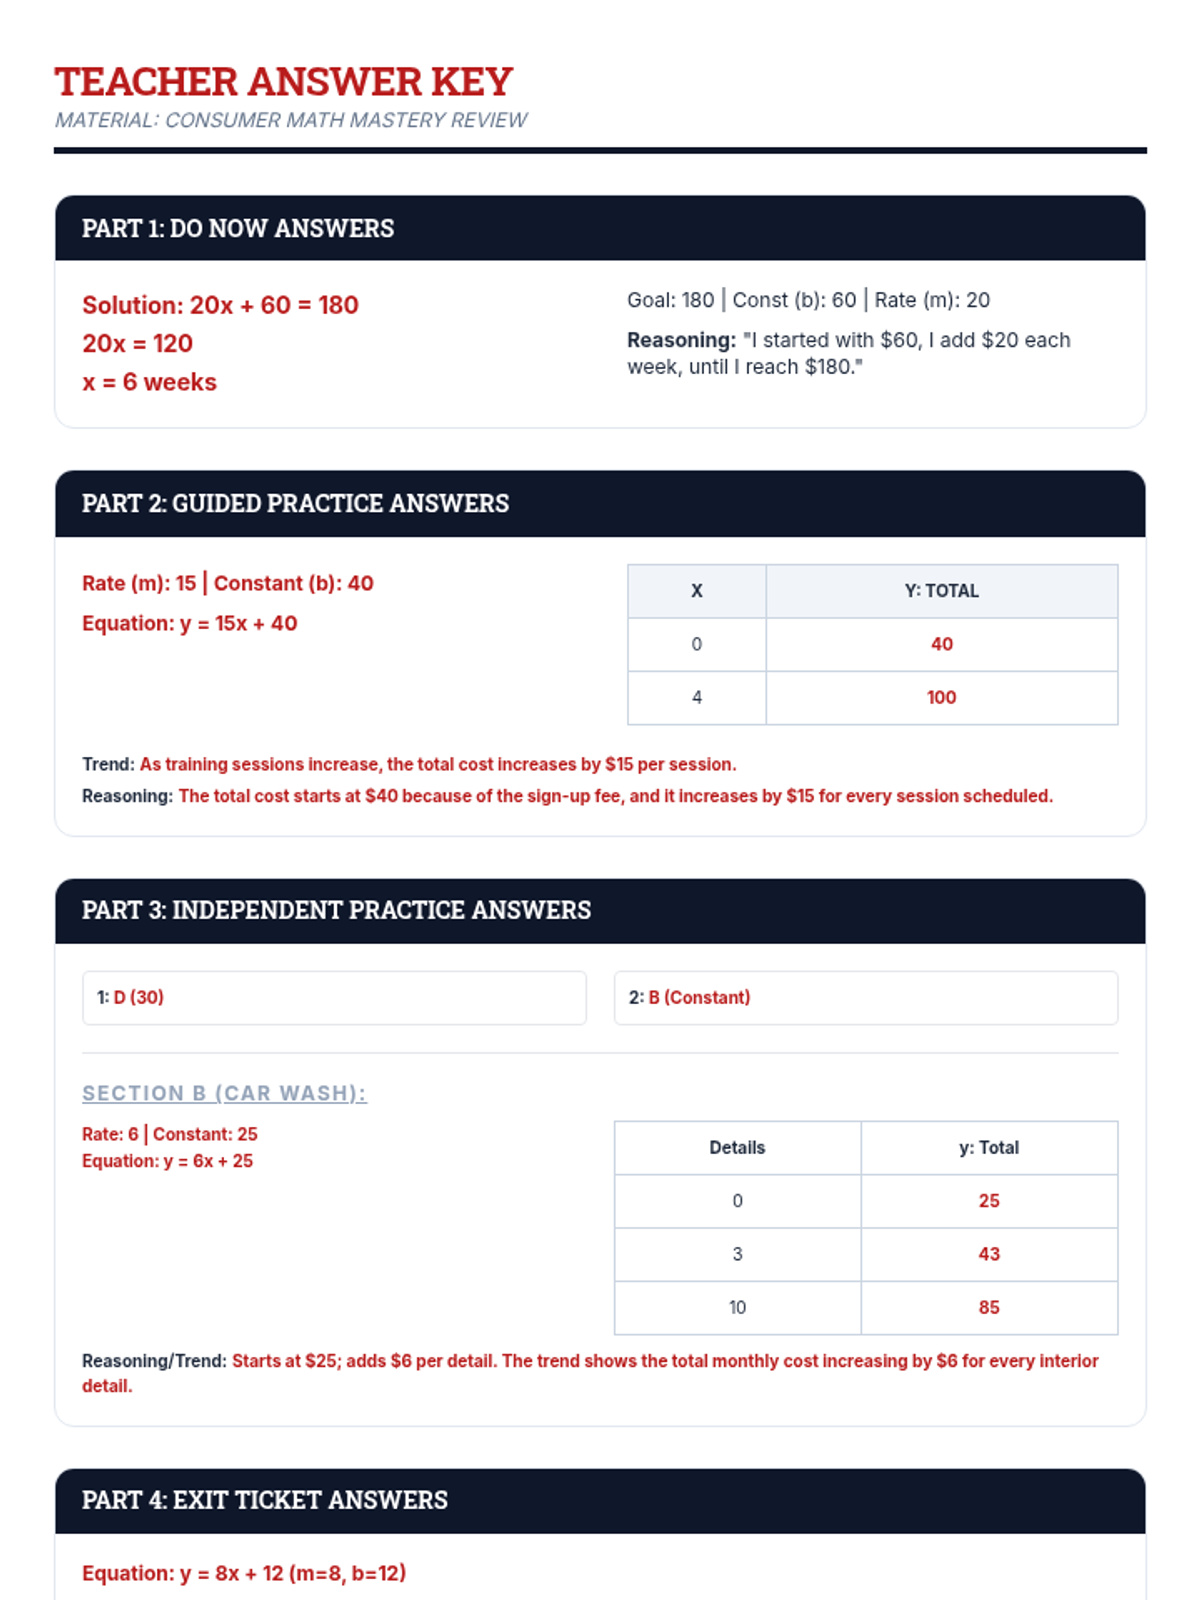
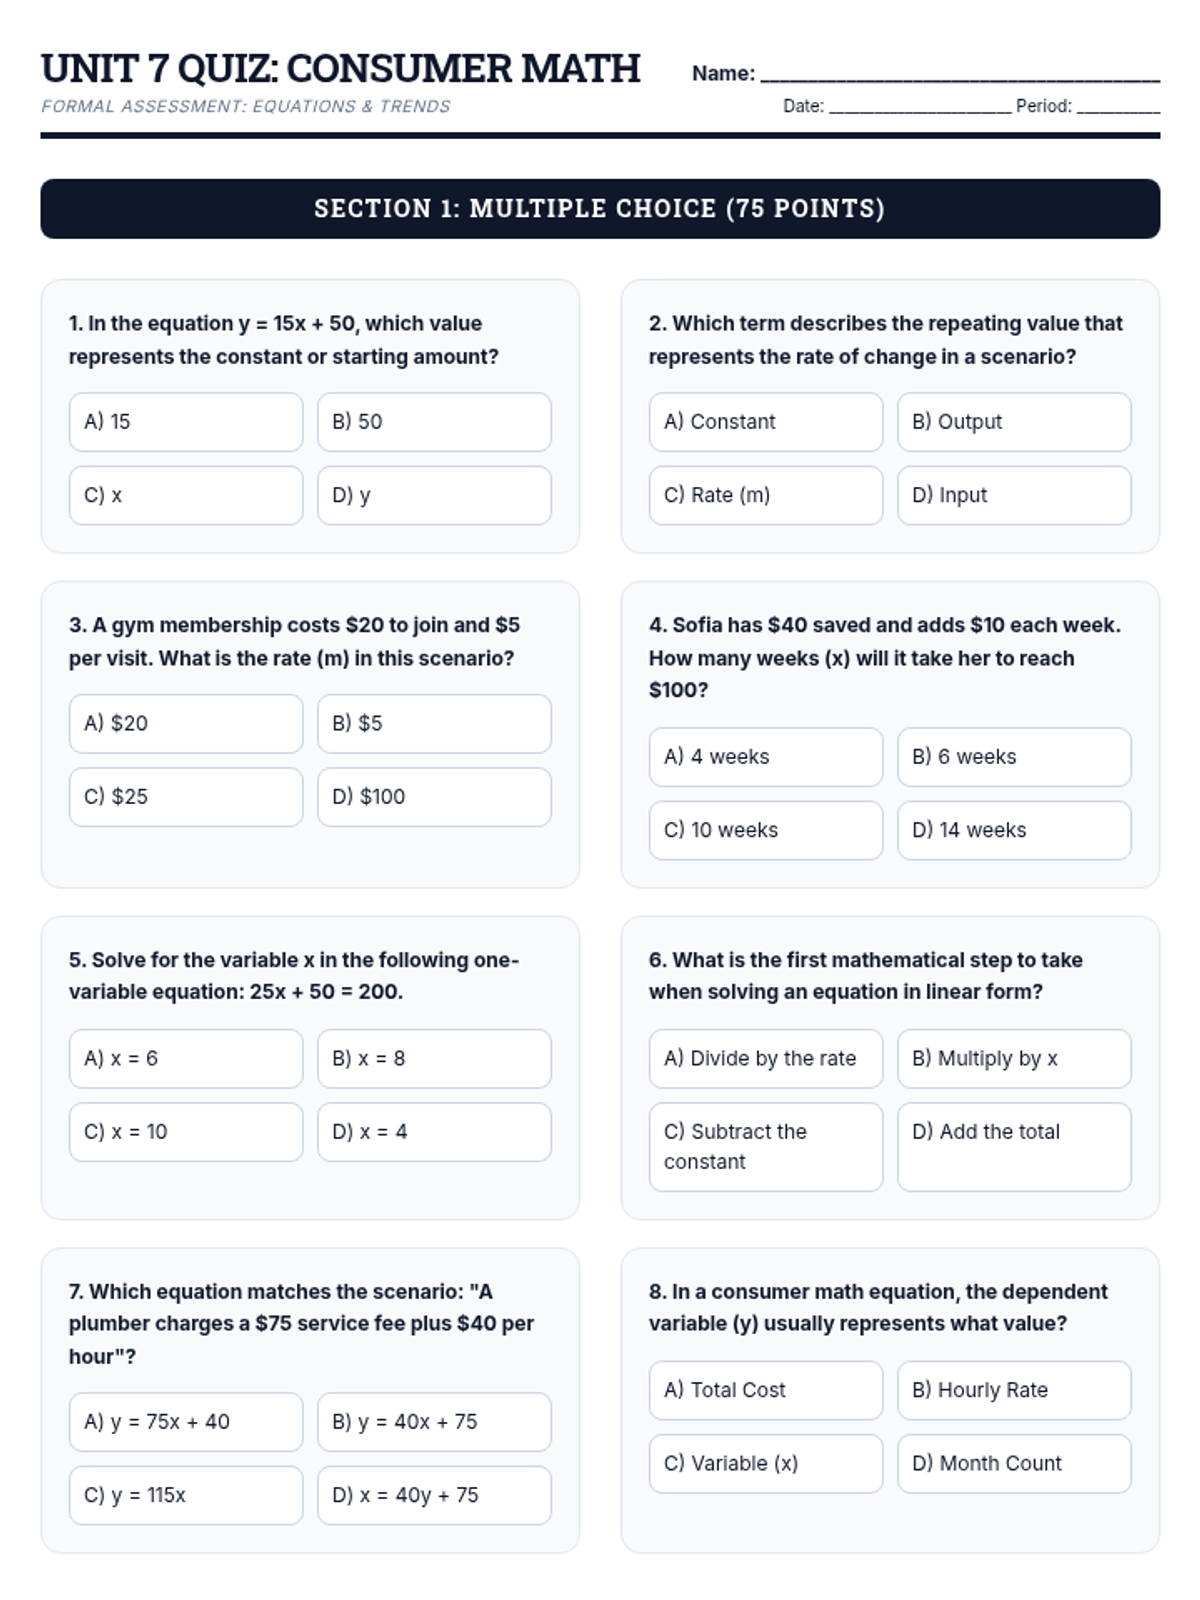
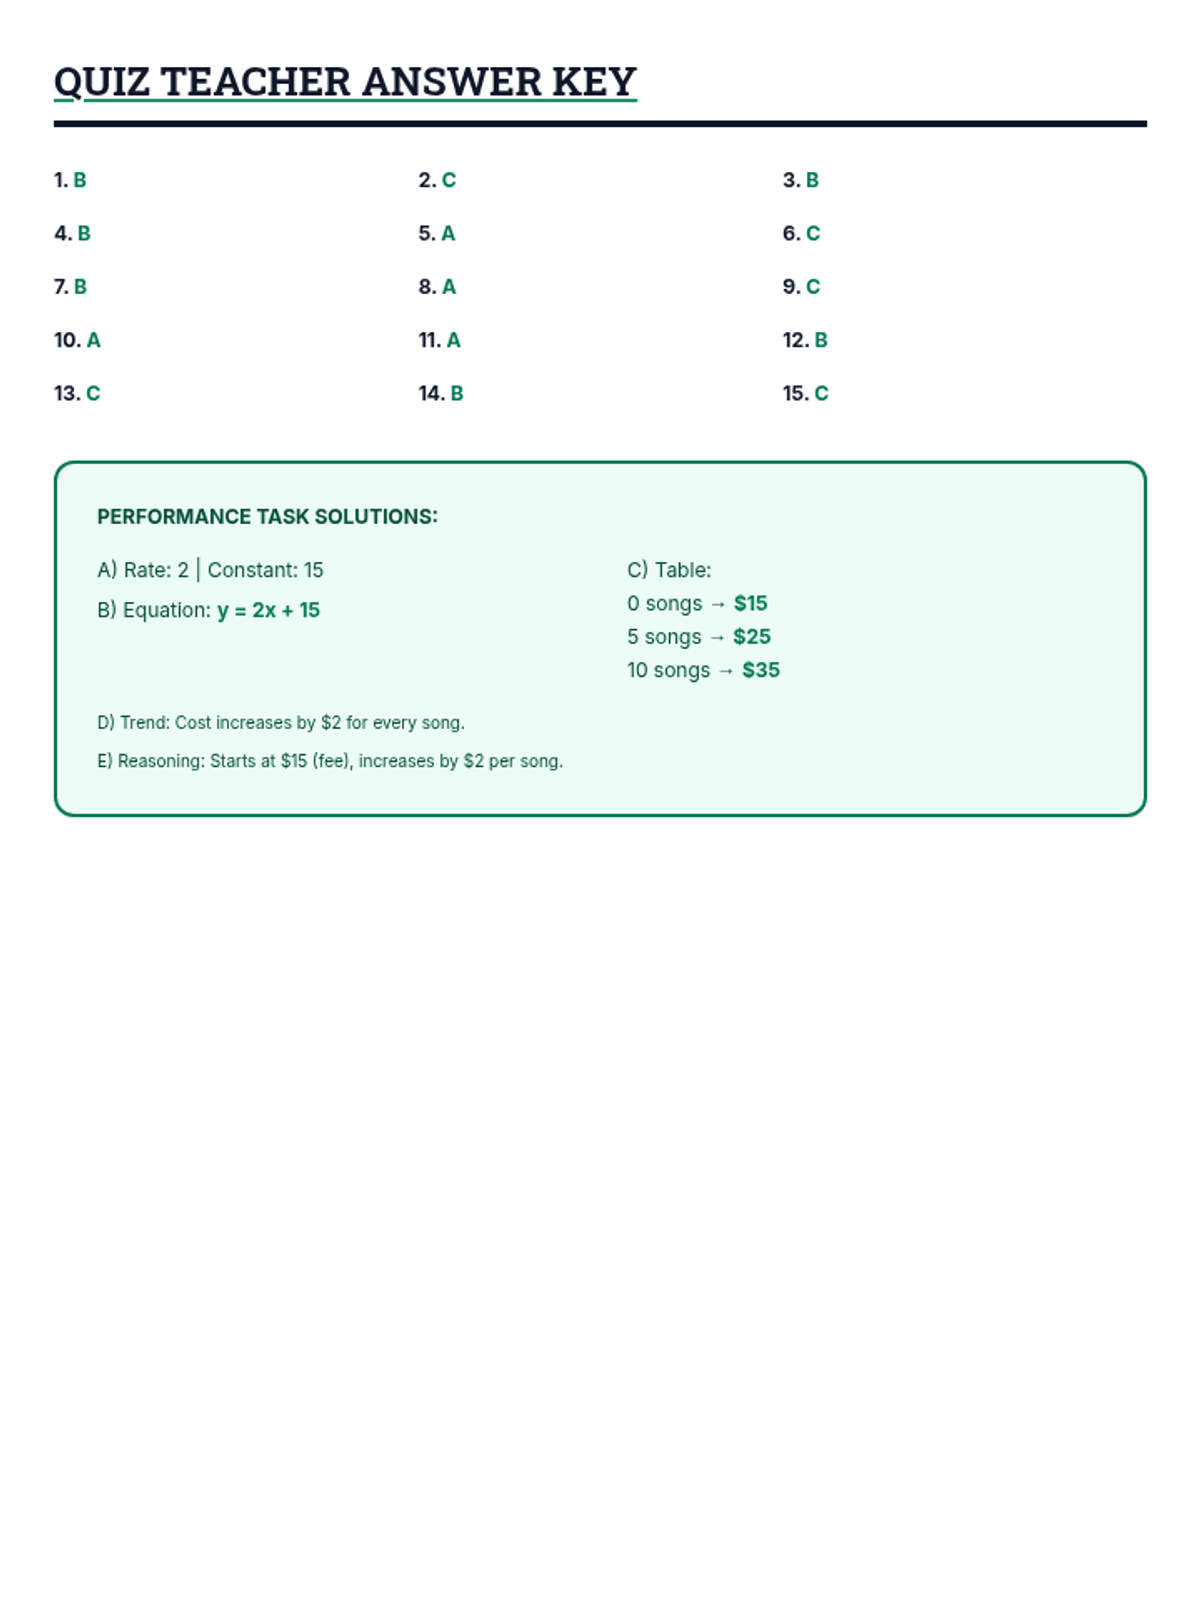
A comprehensive review of Consumer Math concepts including one and two-variable equations, written reasoning, and trend identification through tables. Includes a full 50-minute review handout and a 15-question multiple-choice quiz with an open-ended performance task.
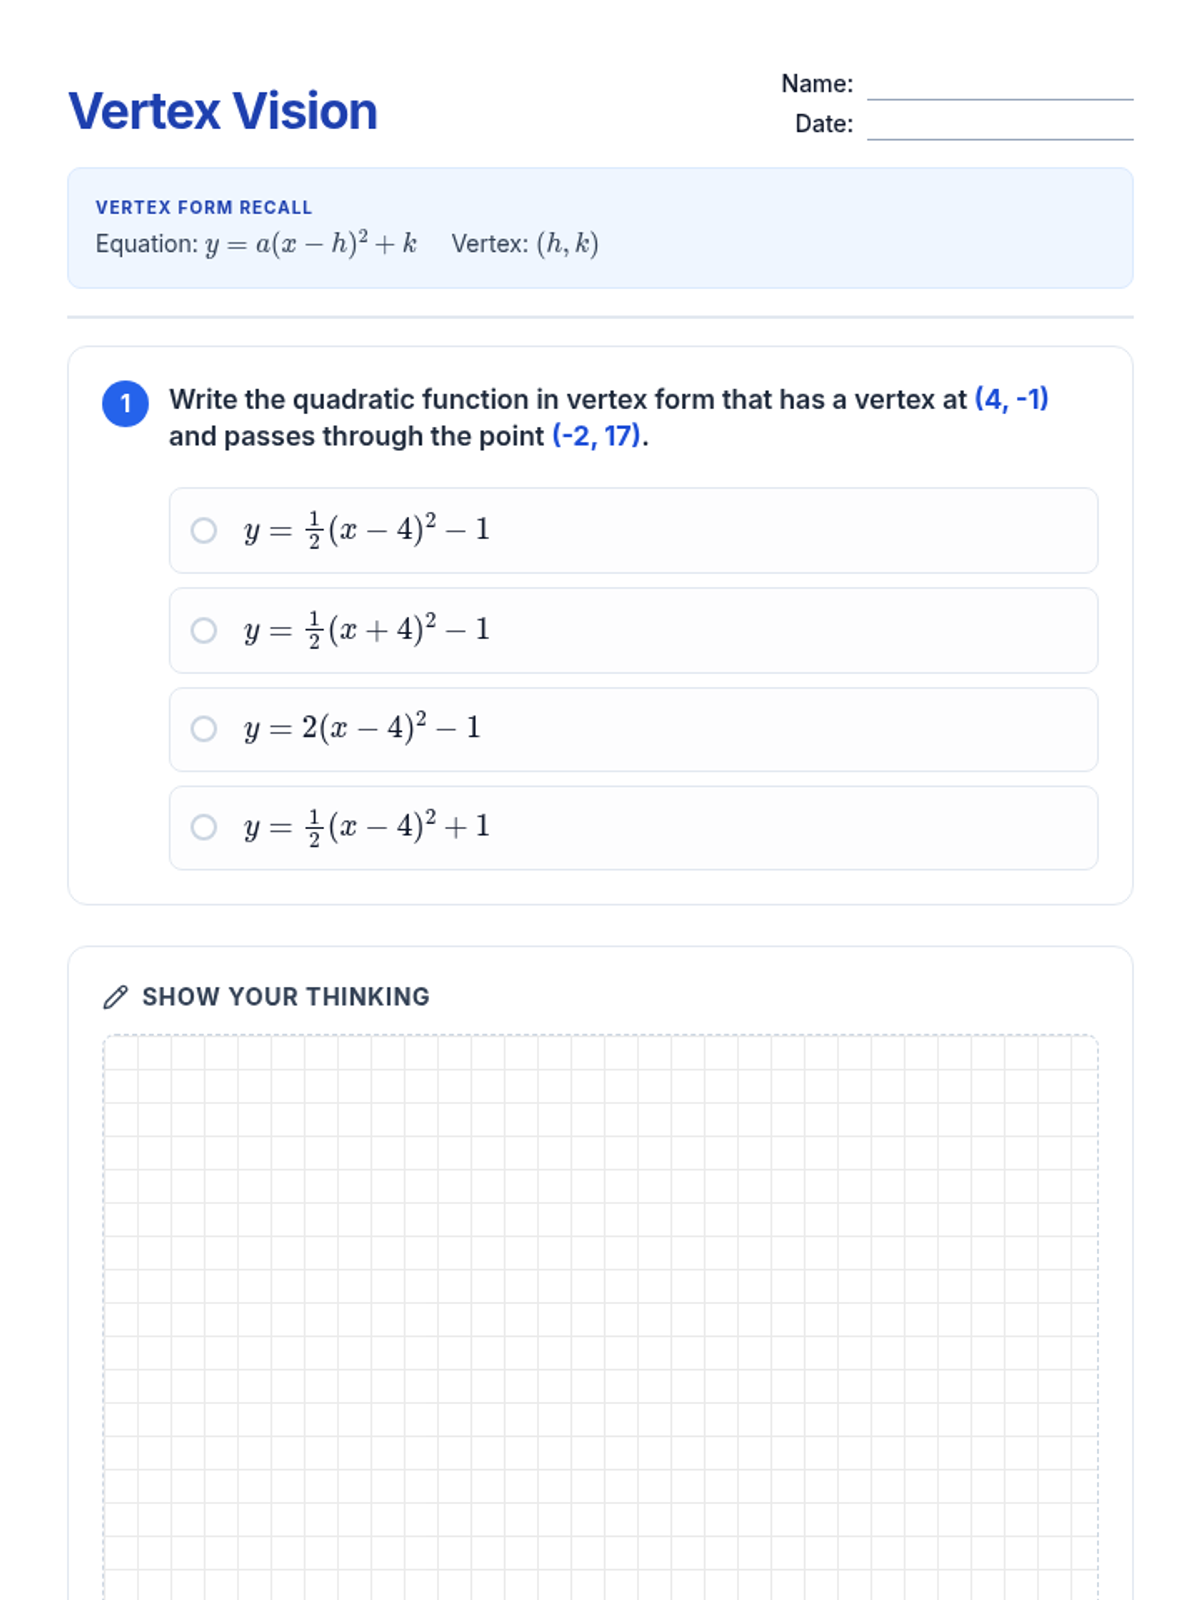
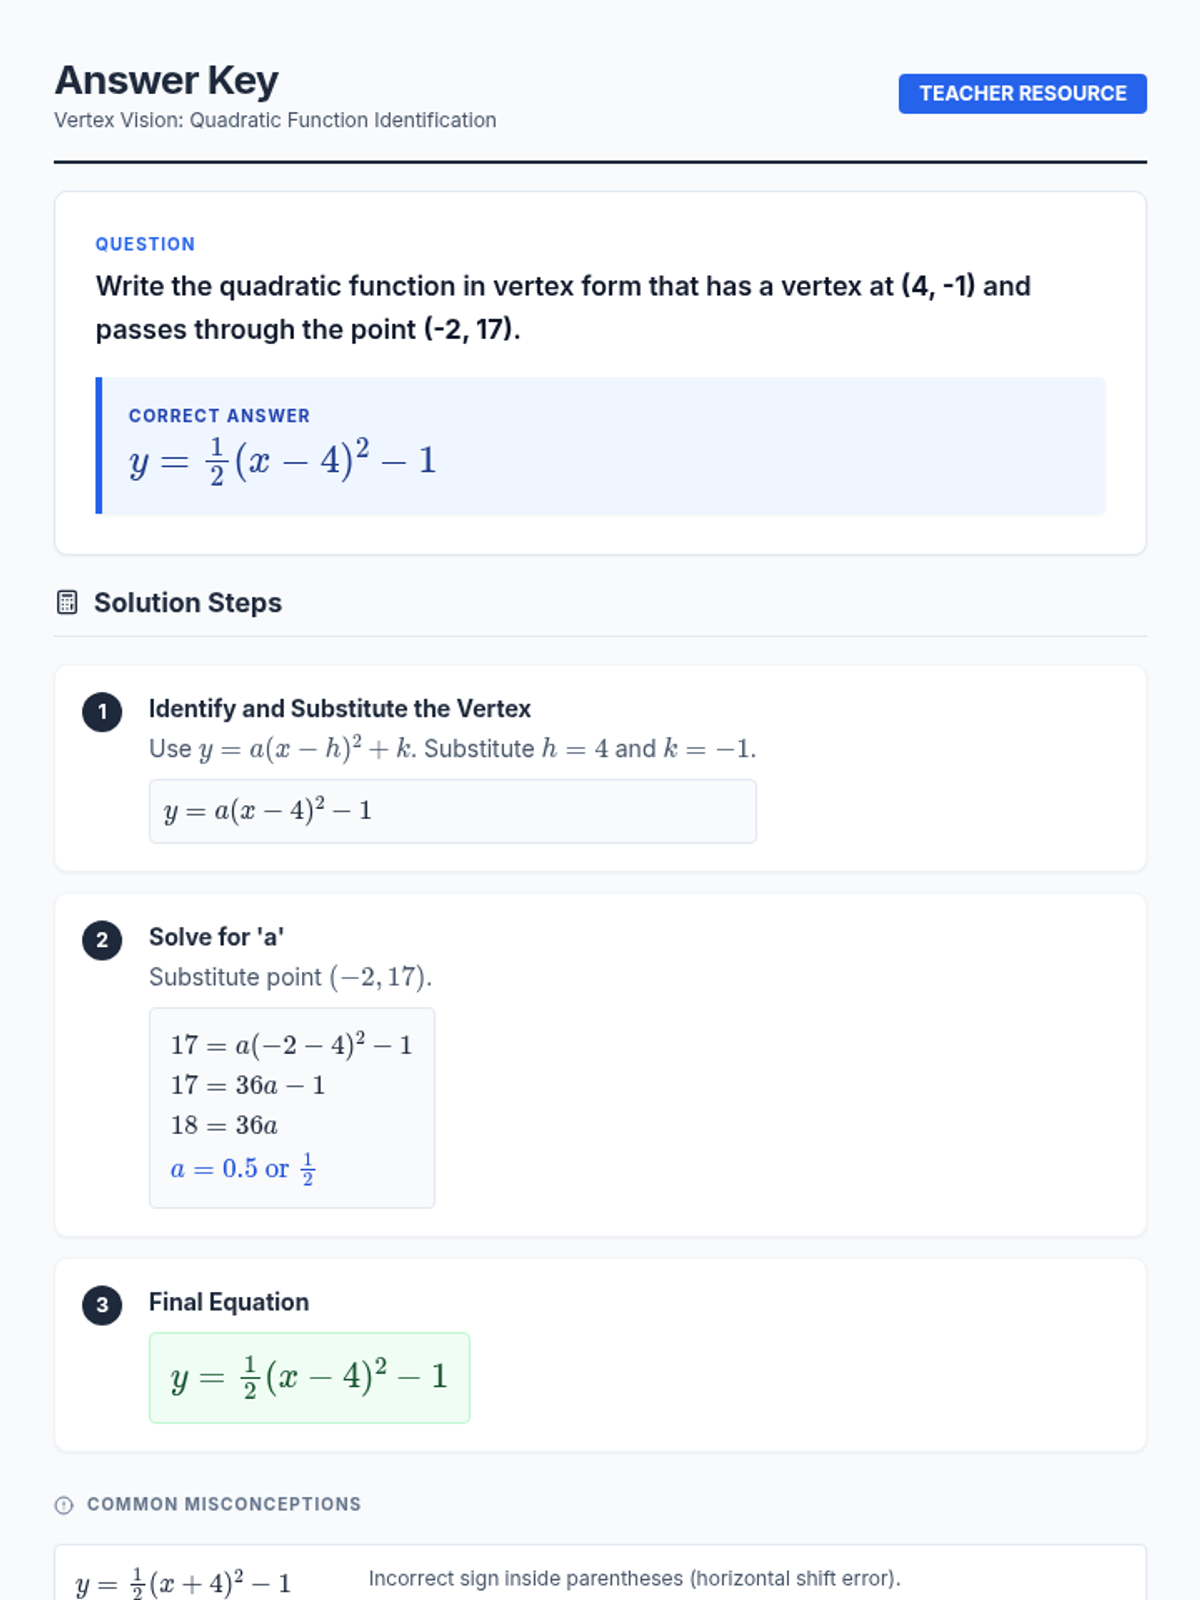
A mini-lesson focused on deriving and identifying quadratic functions in vertex form given specific geometric constraints like the vertex and a passing point.
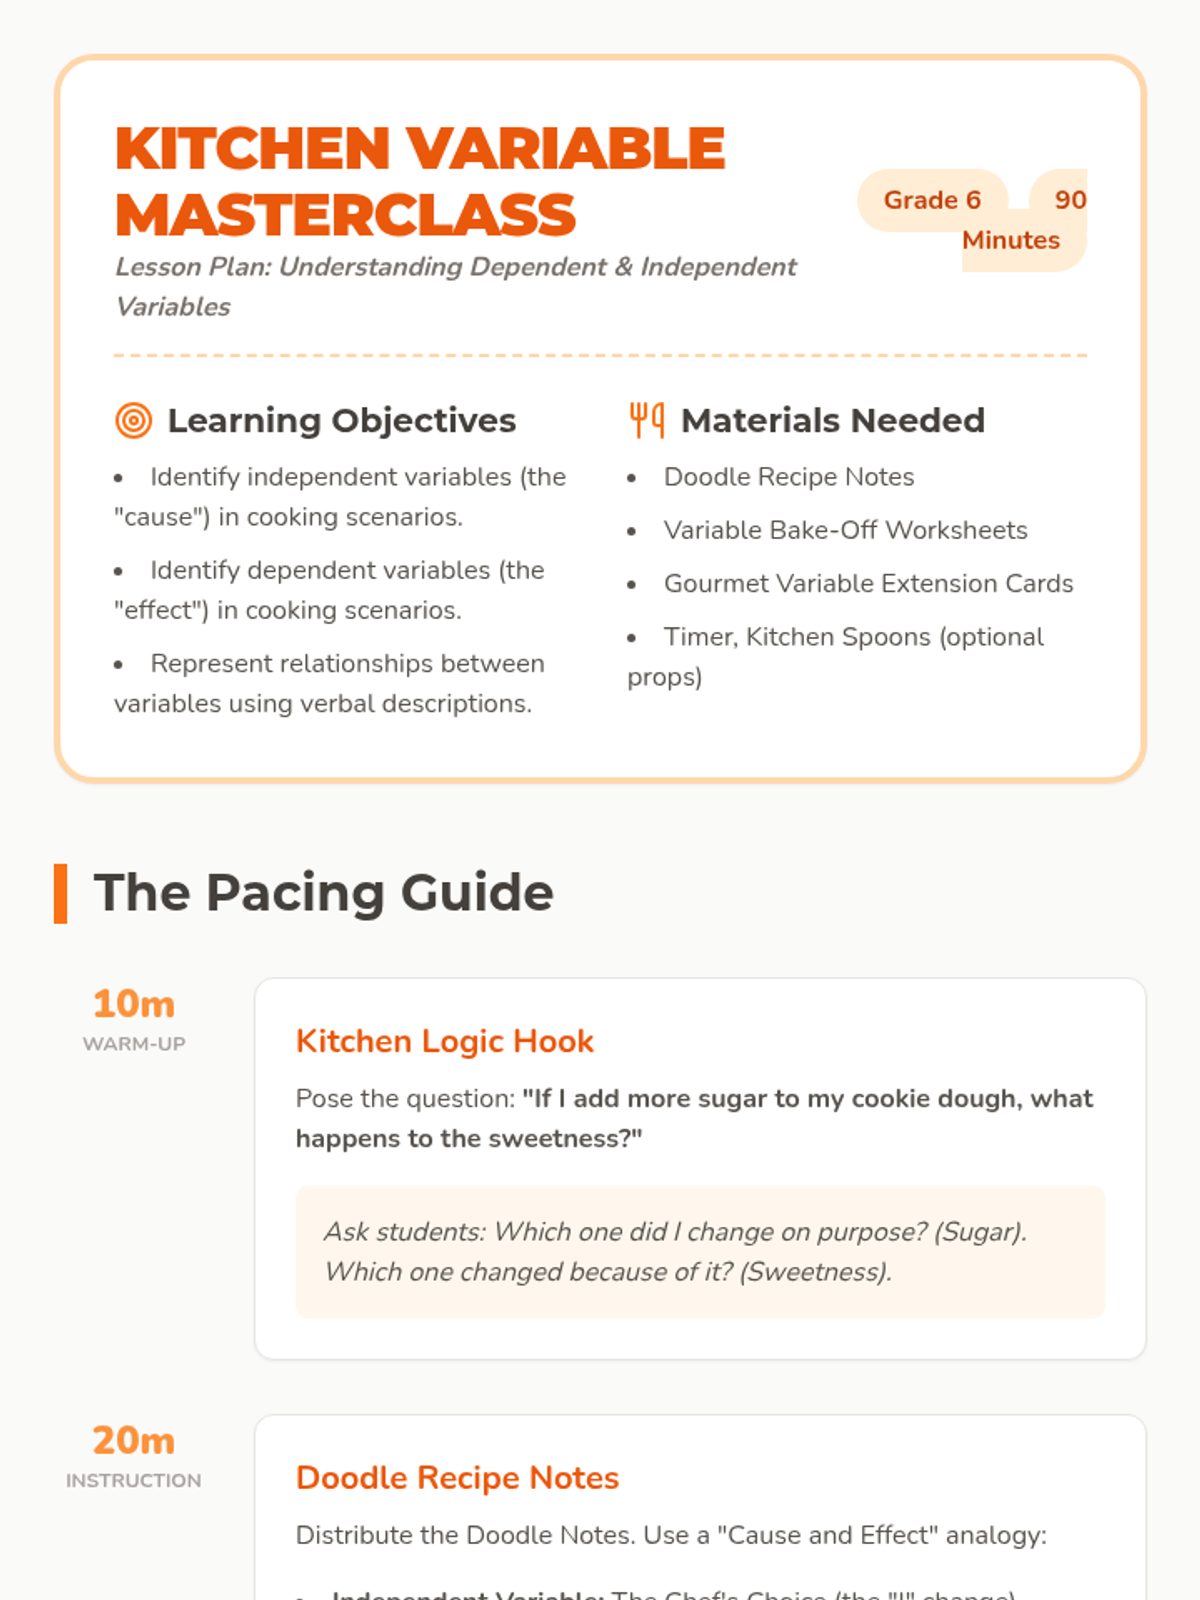
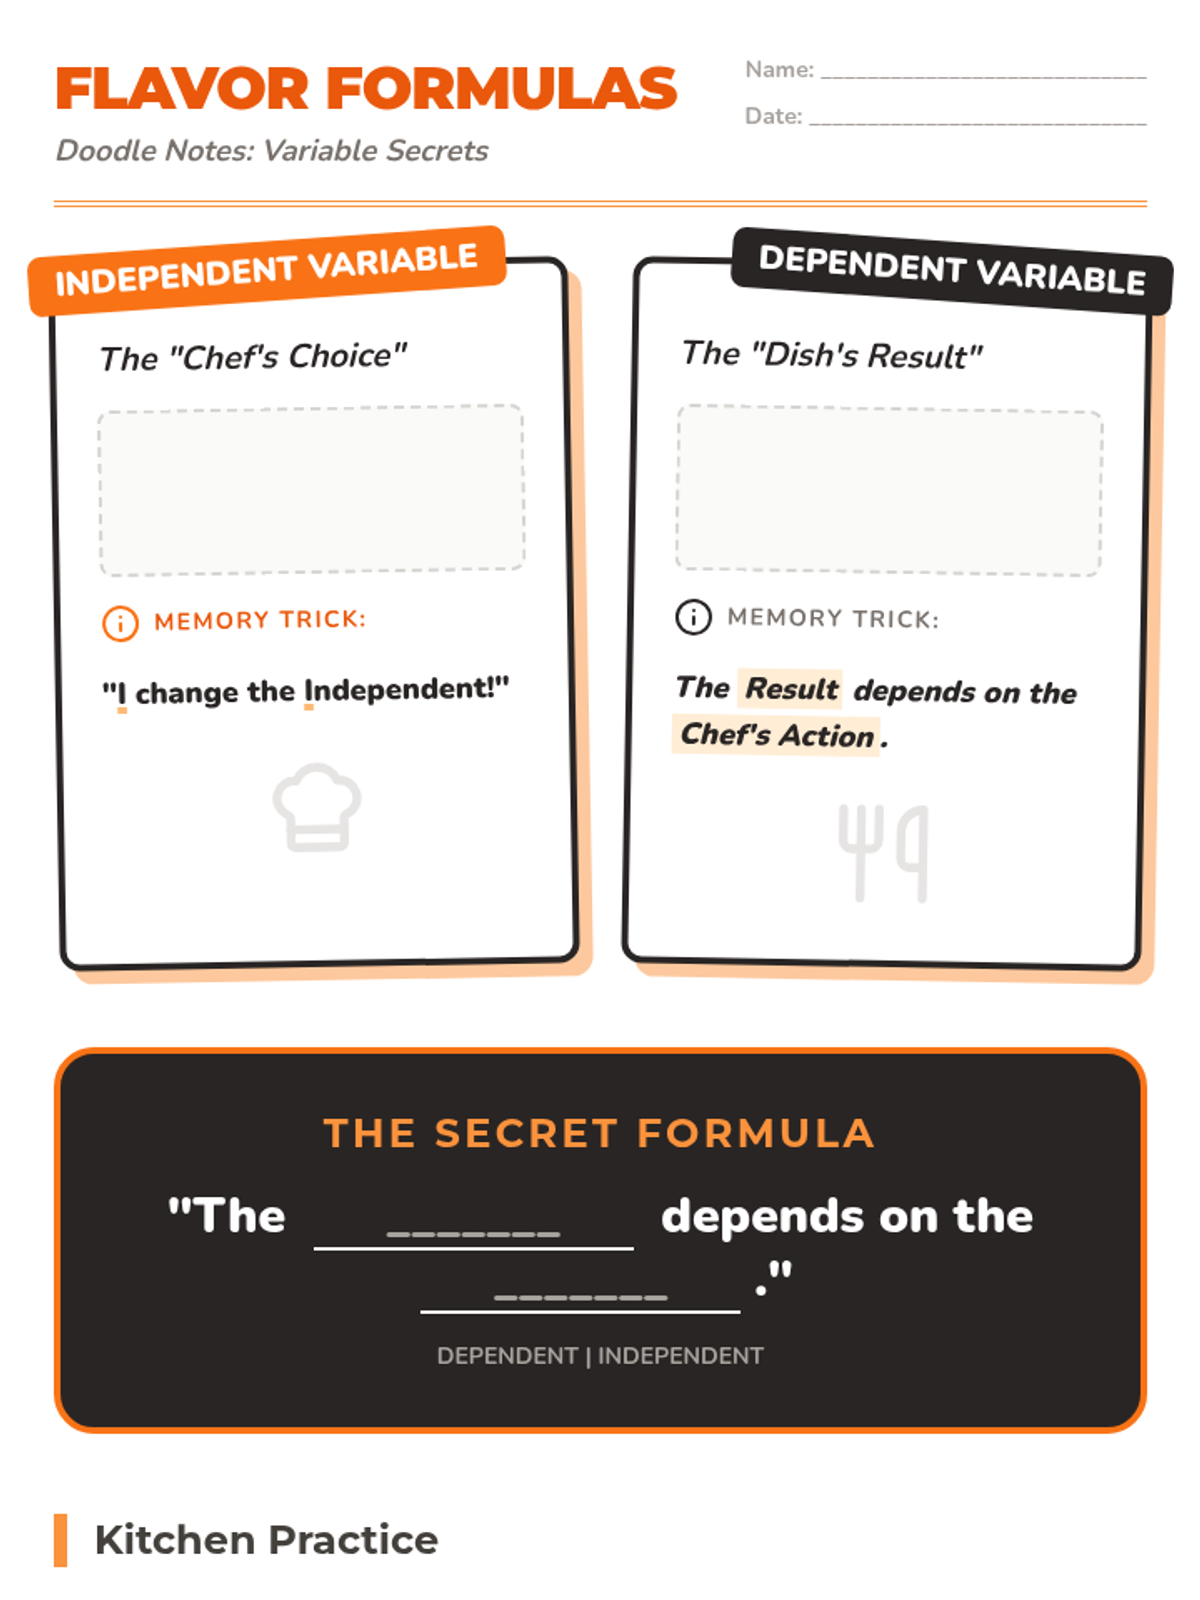
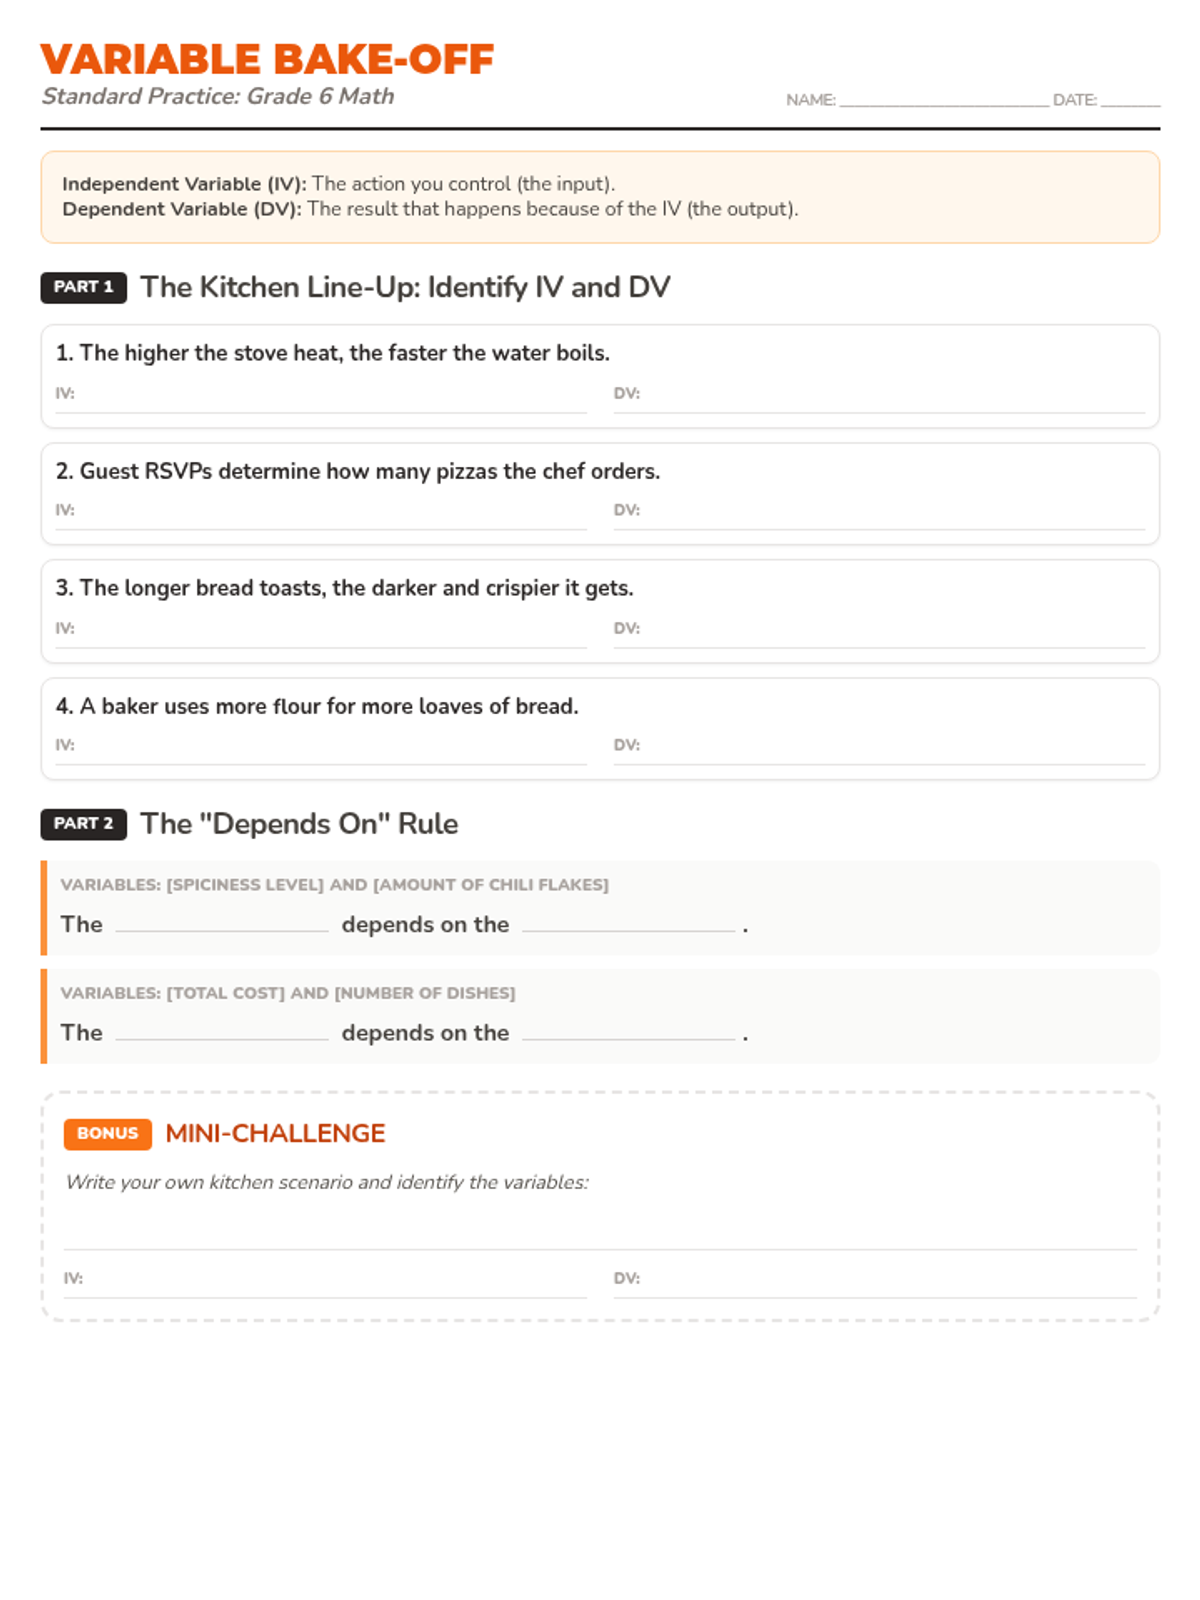
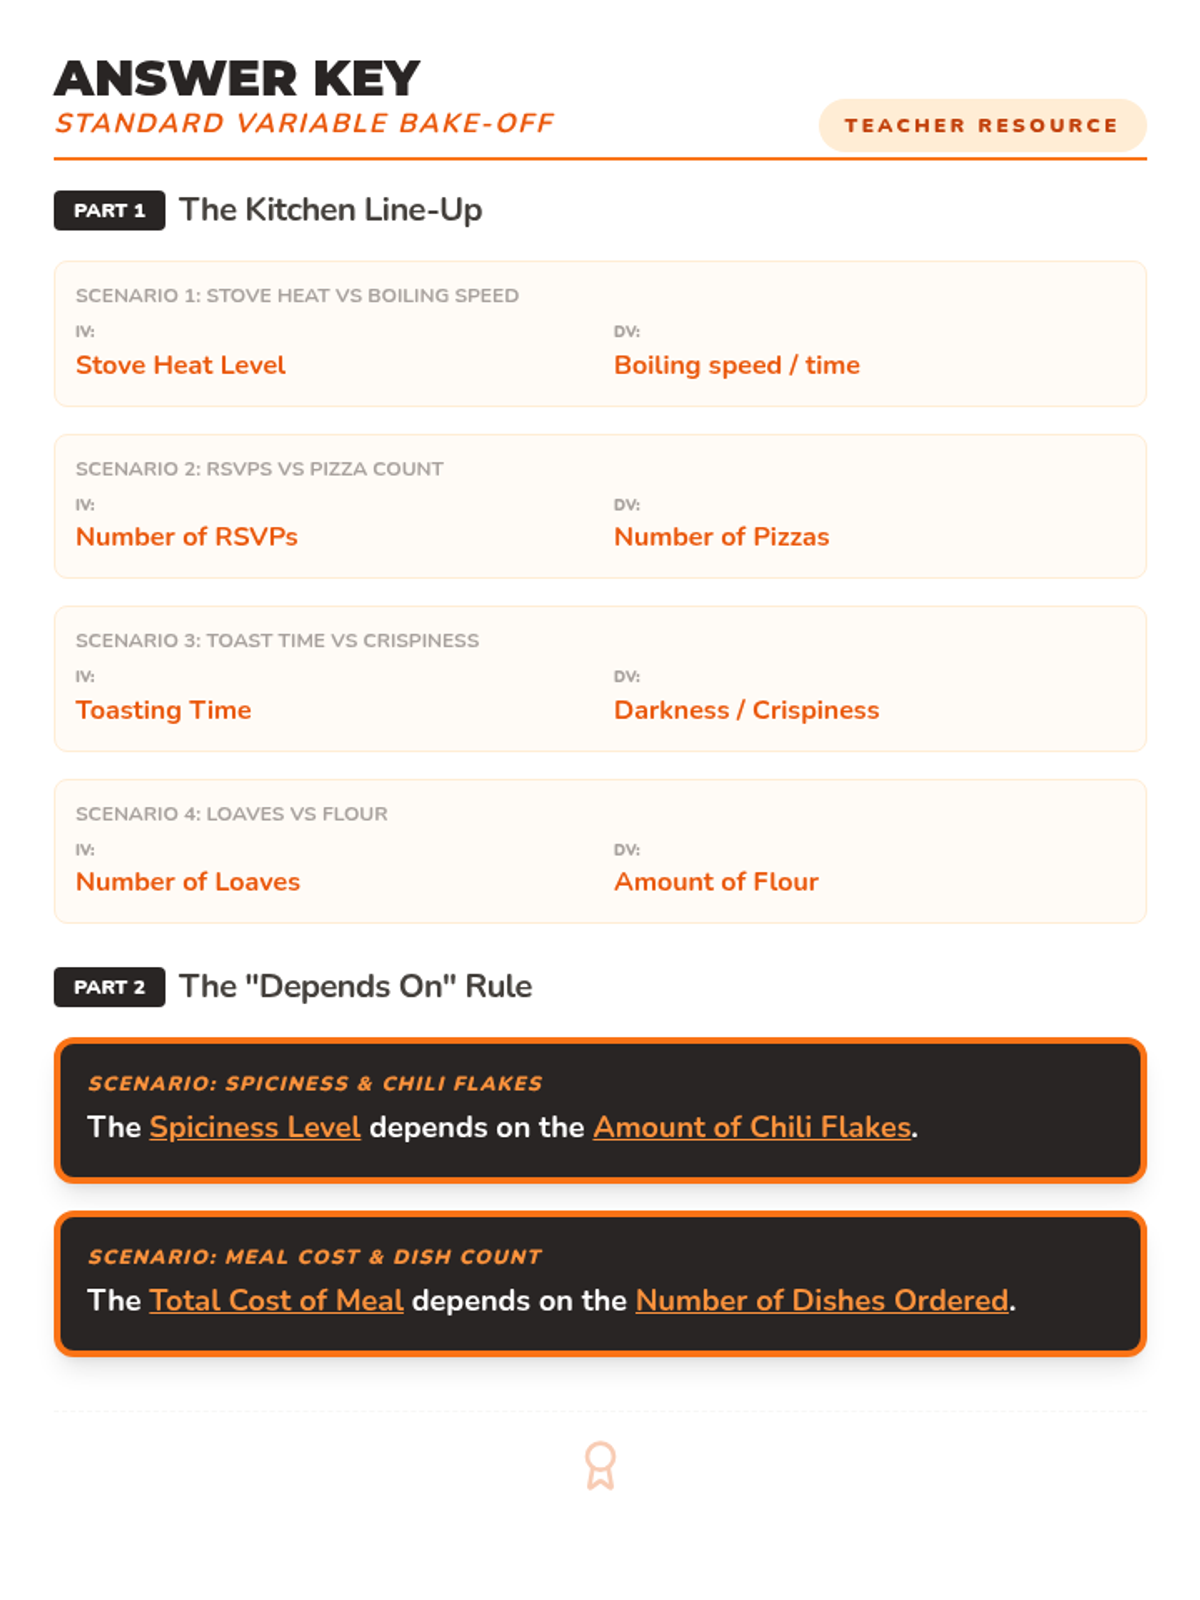
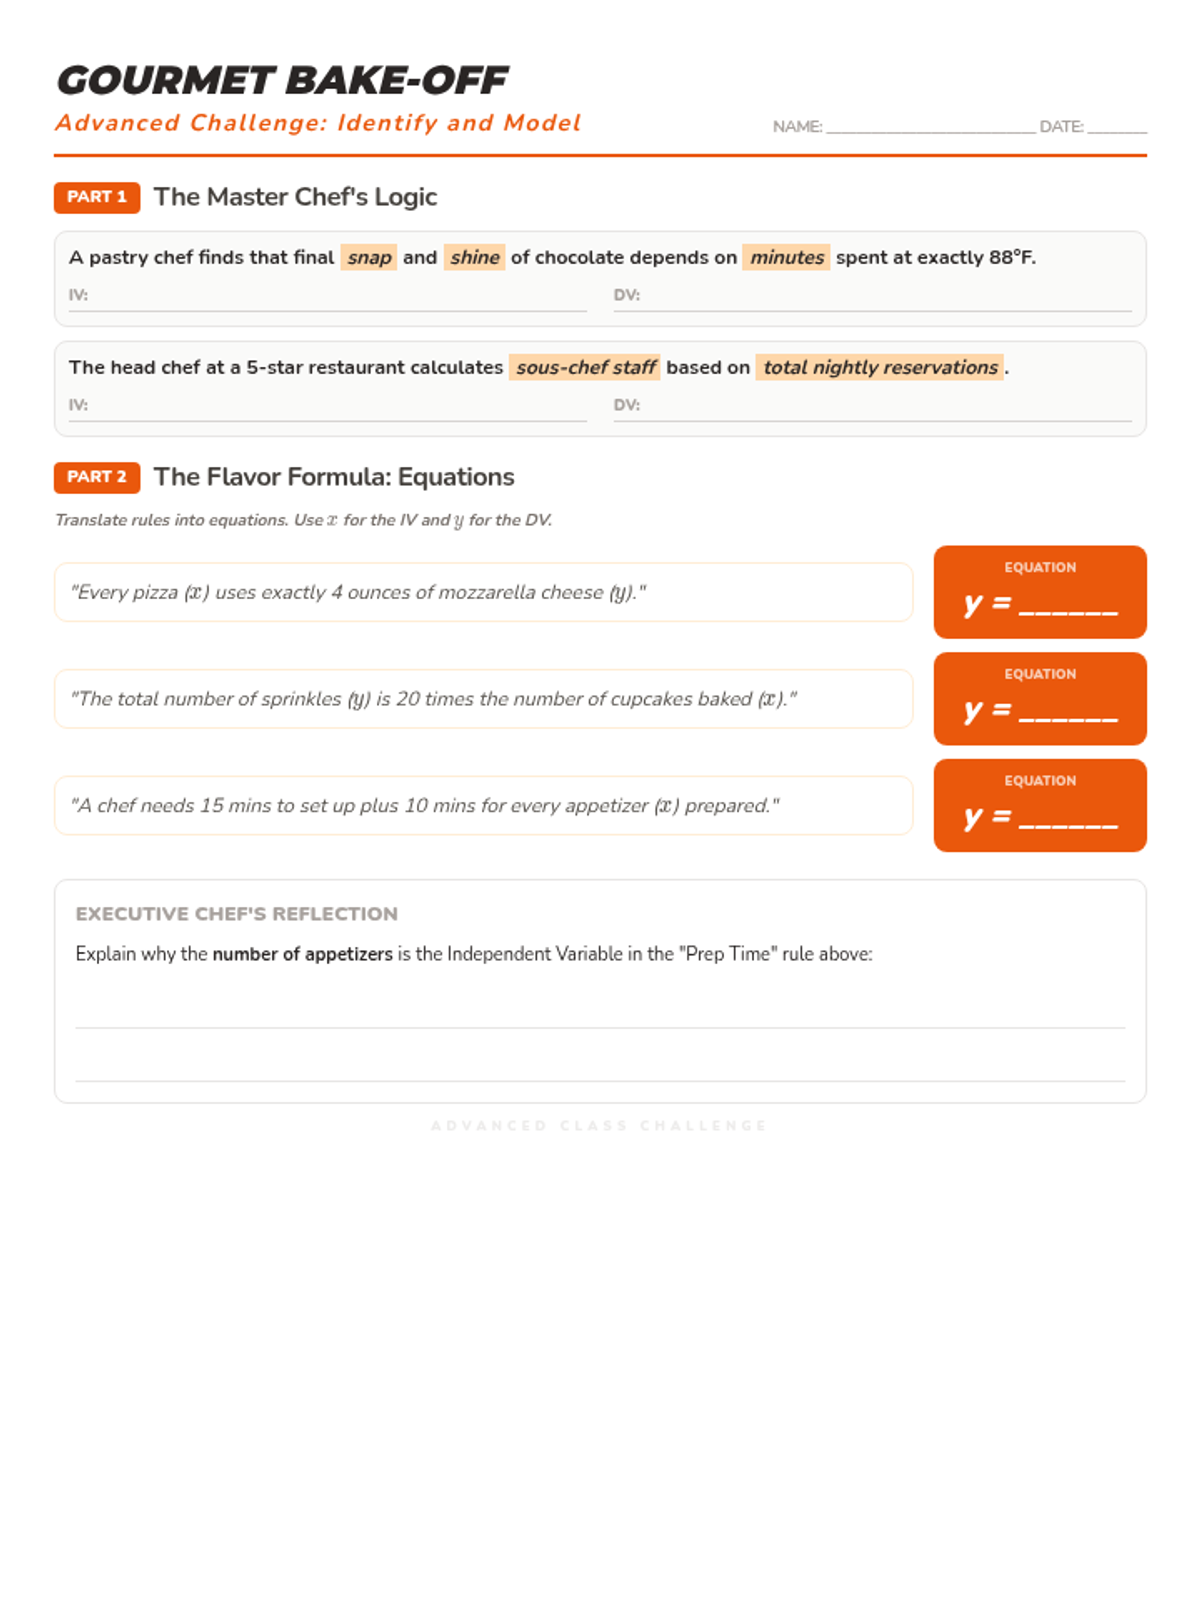
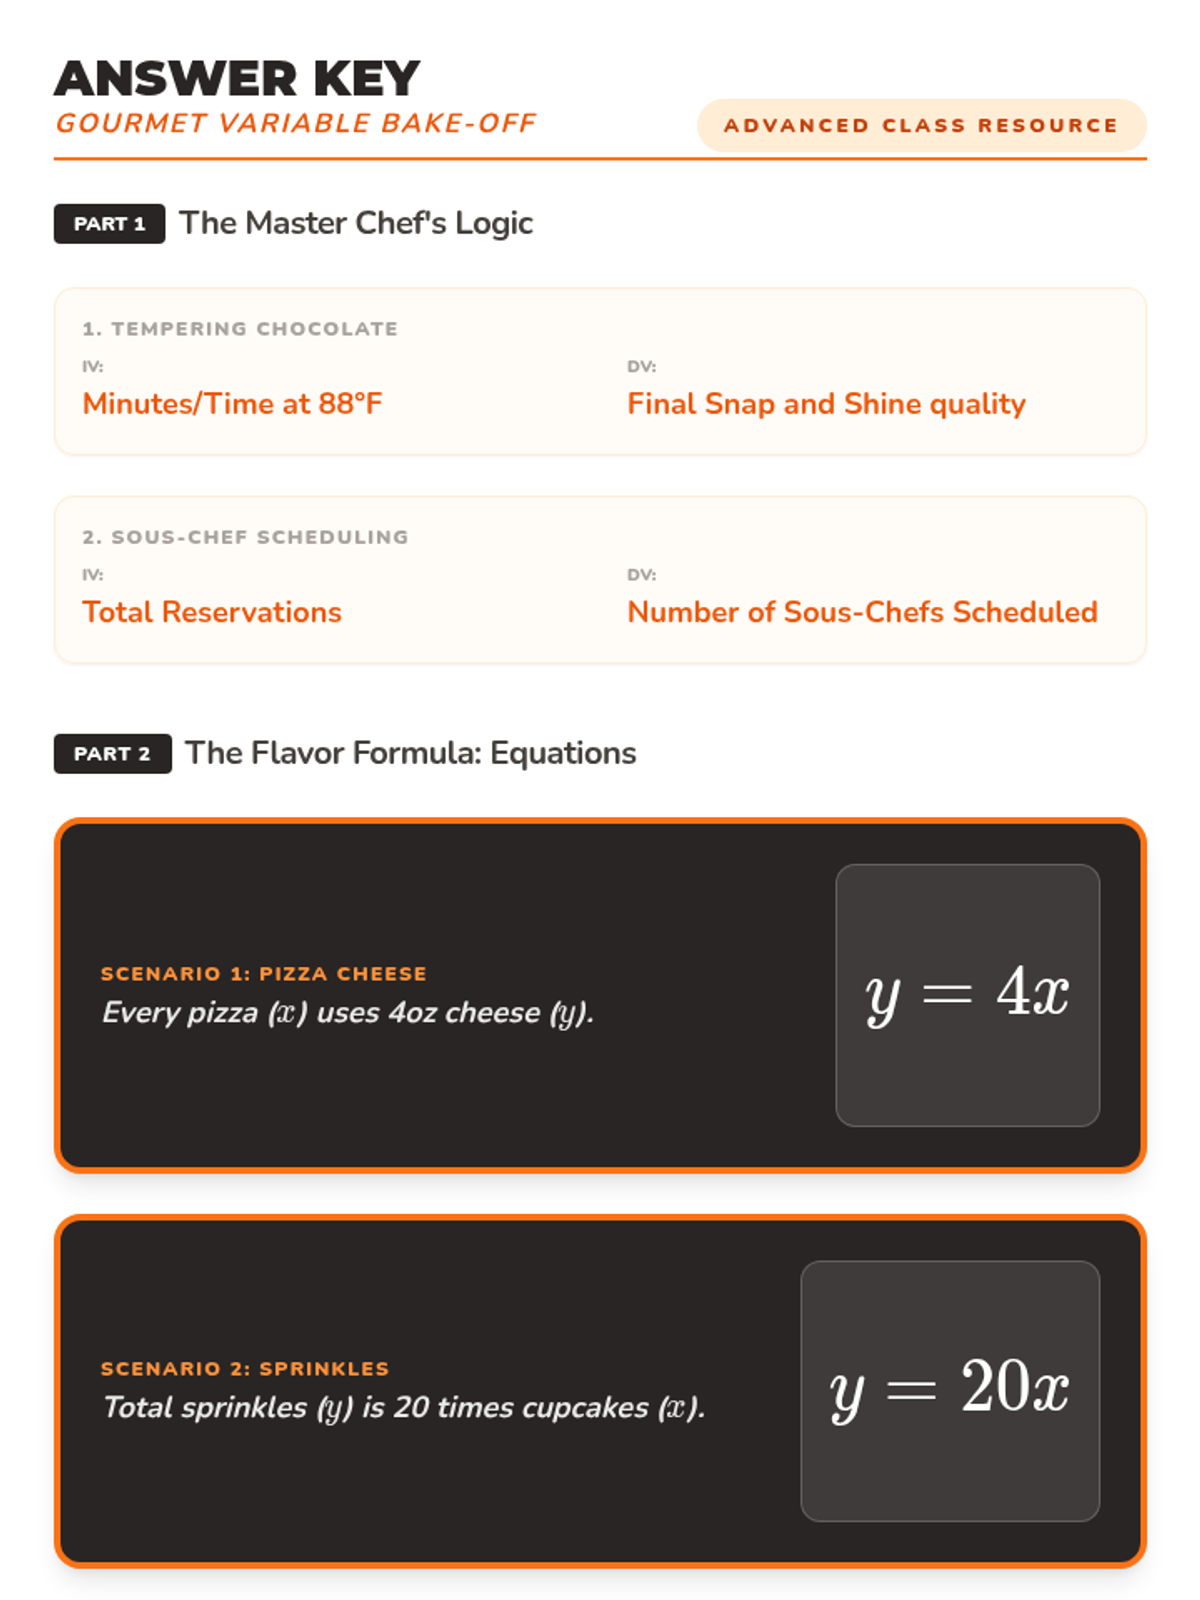
A comprehensive 90-minute lesson on dependent and independent variables using a baking and cooking theme. Includes doodle notes, tiered worksheets, and a collaborative kitchen activity.
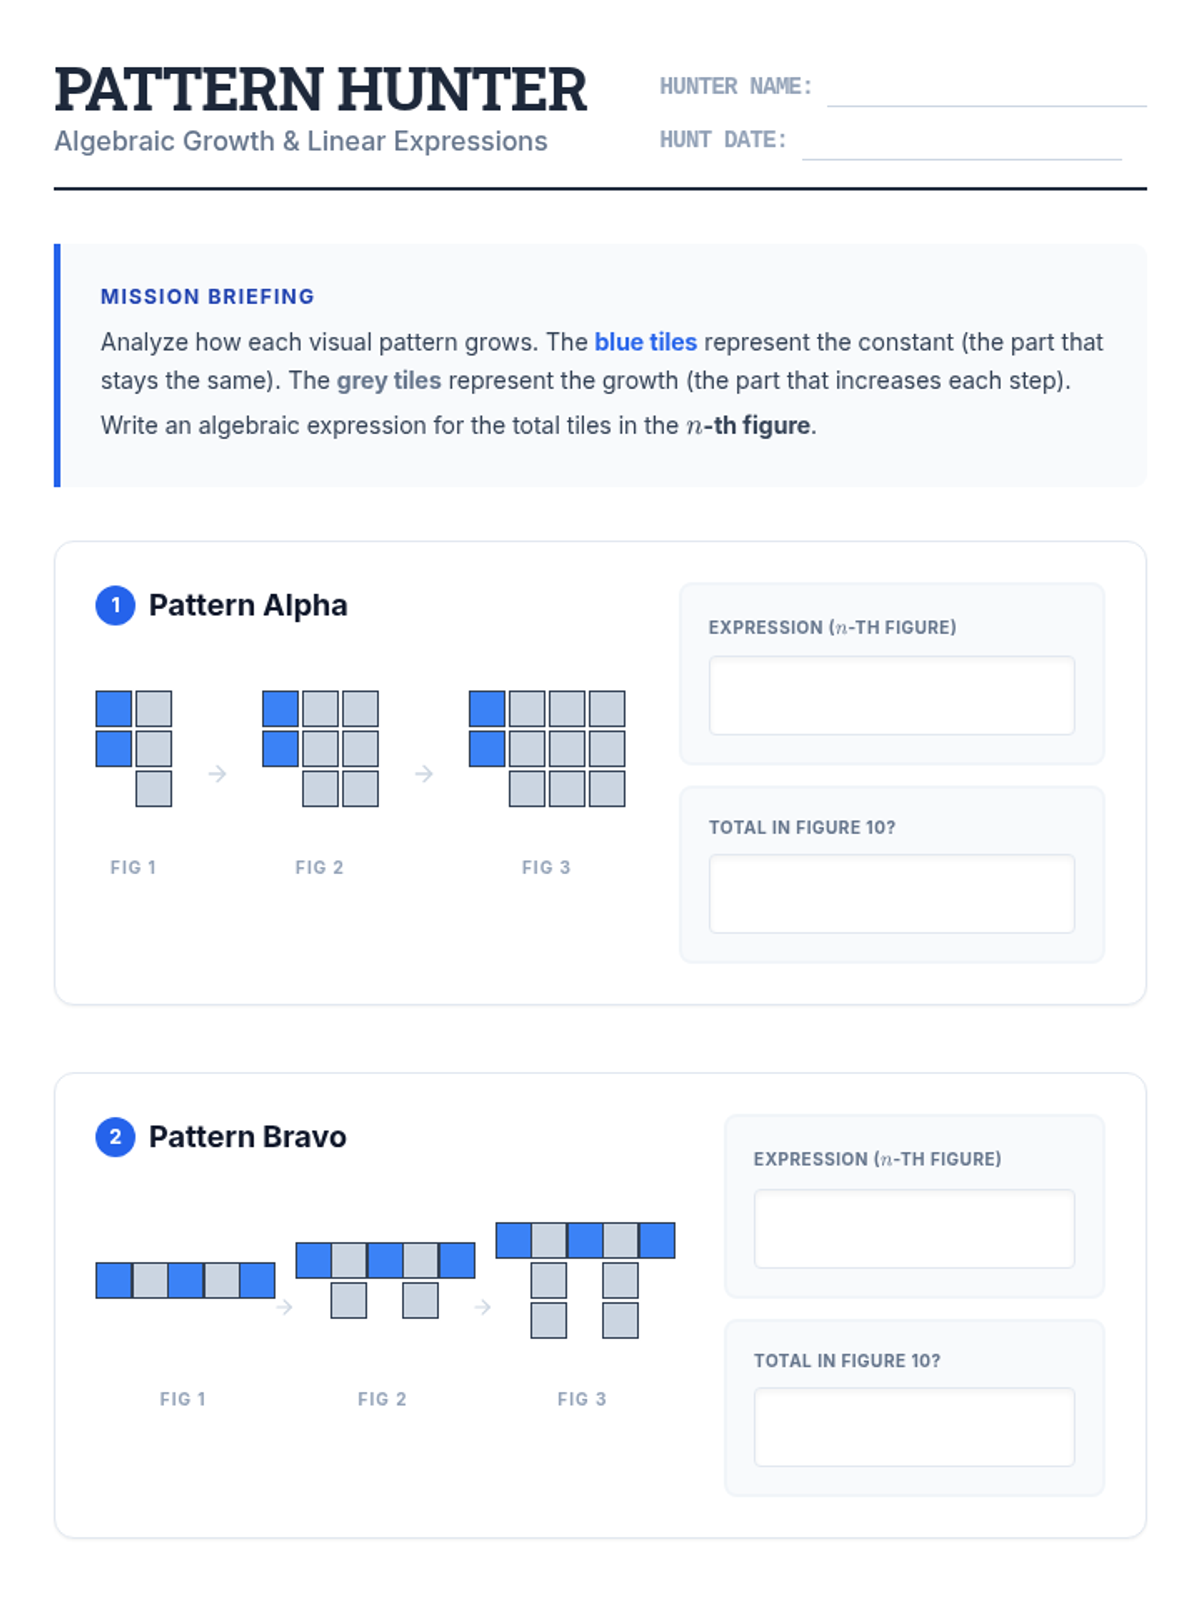
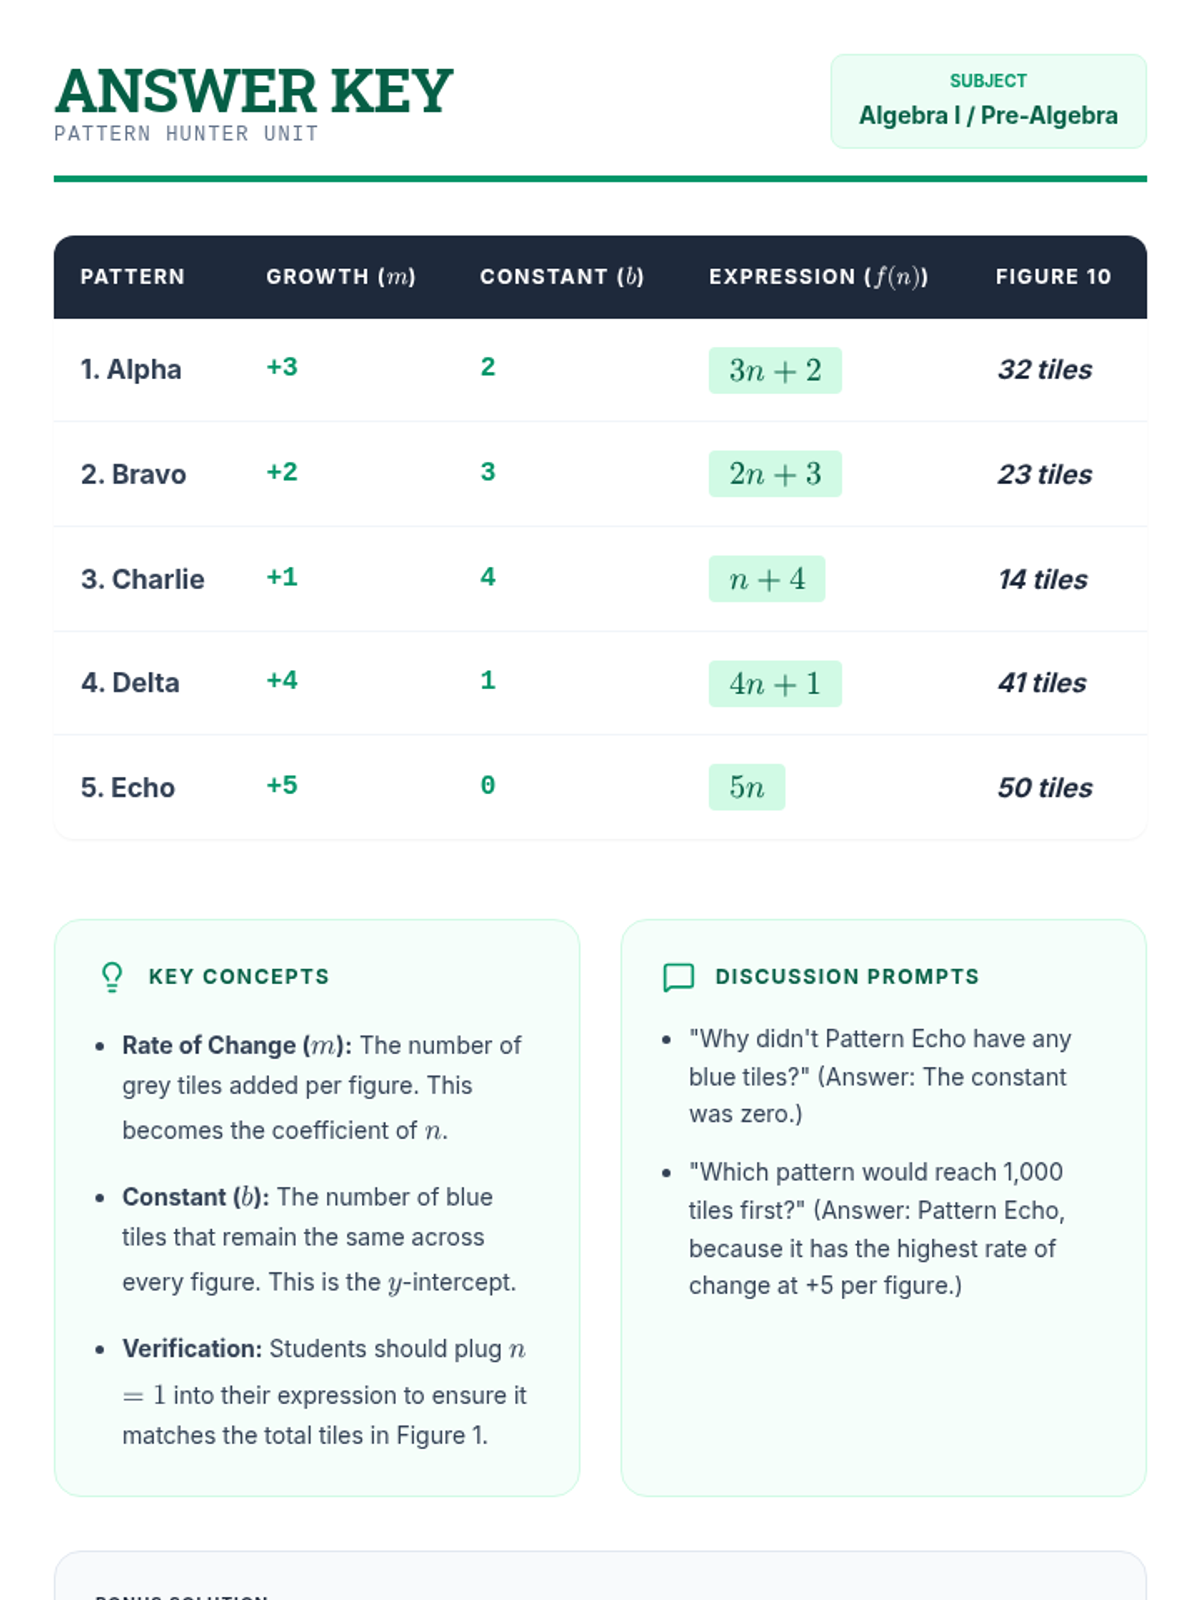
Students explore linear growth by analyzing visual patterns made of square tiles. They will identify the rate of change and the constant to build algebraic expressions for the nth term.
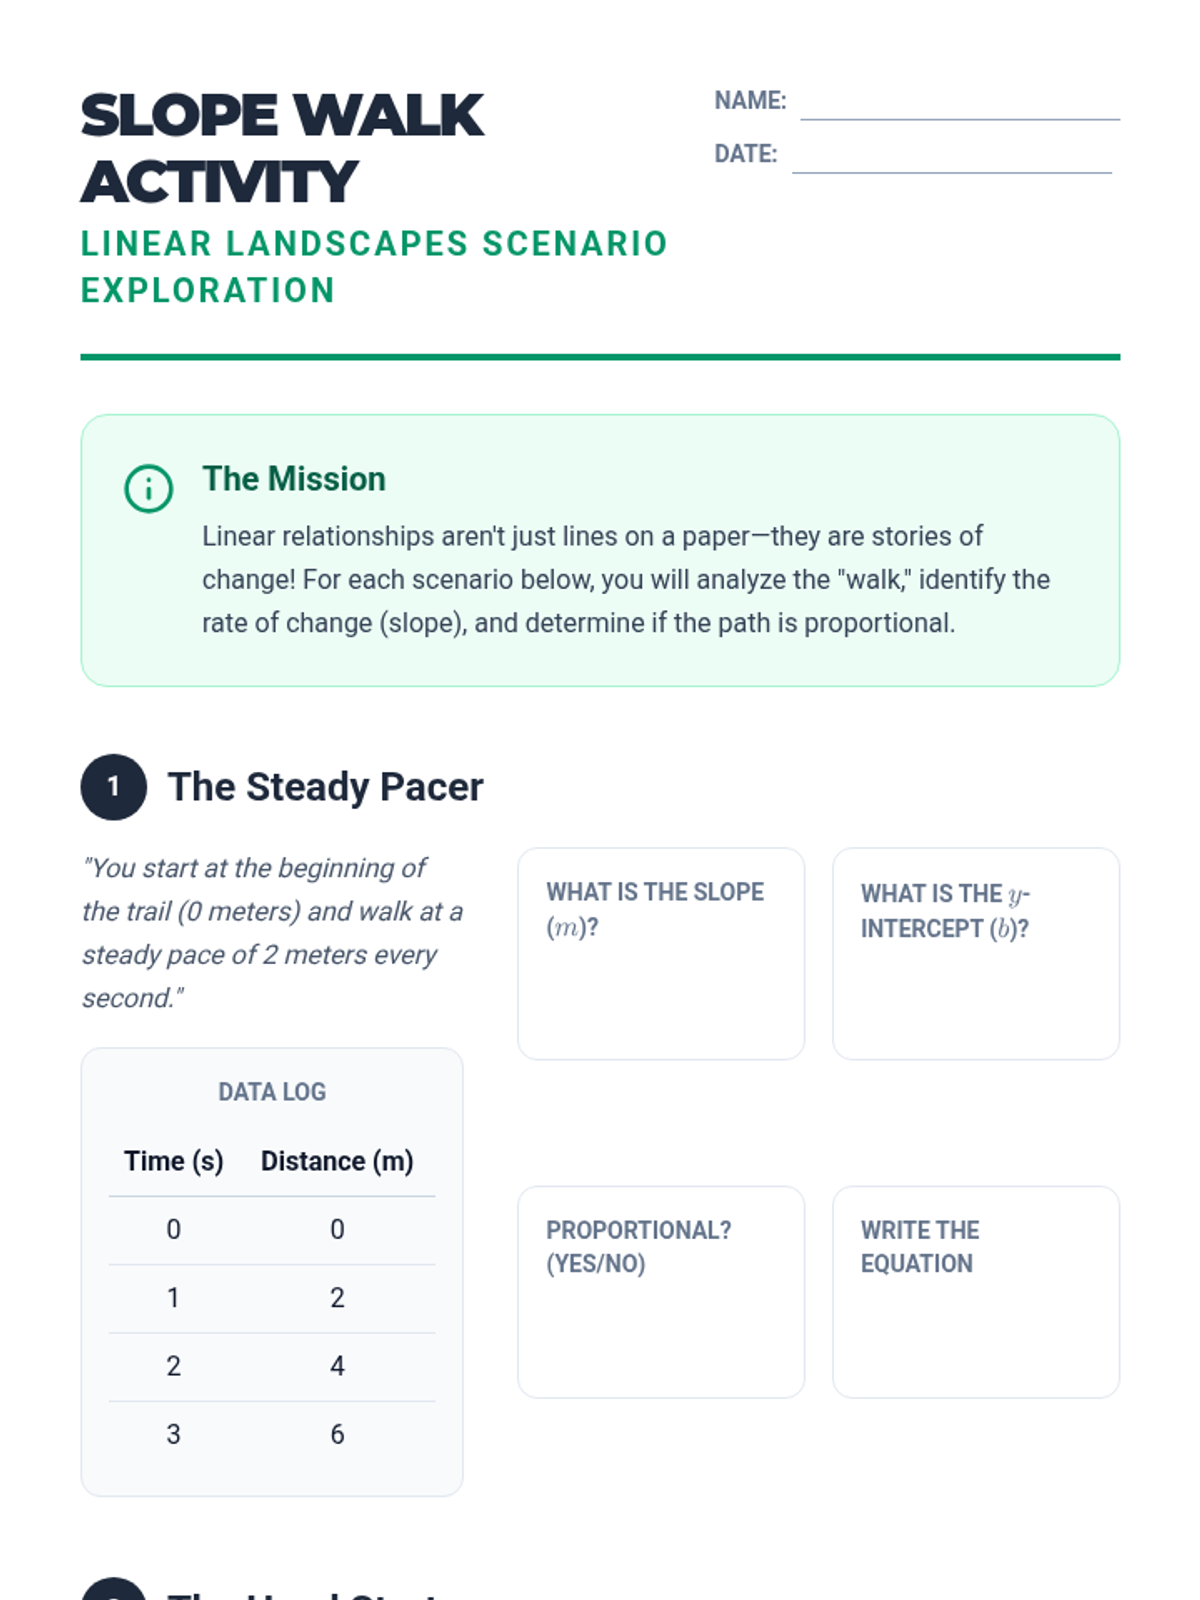
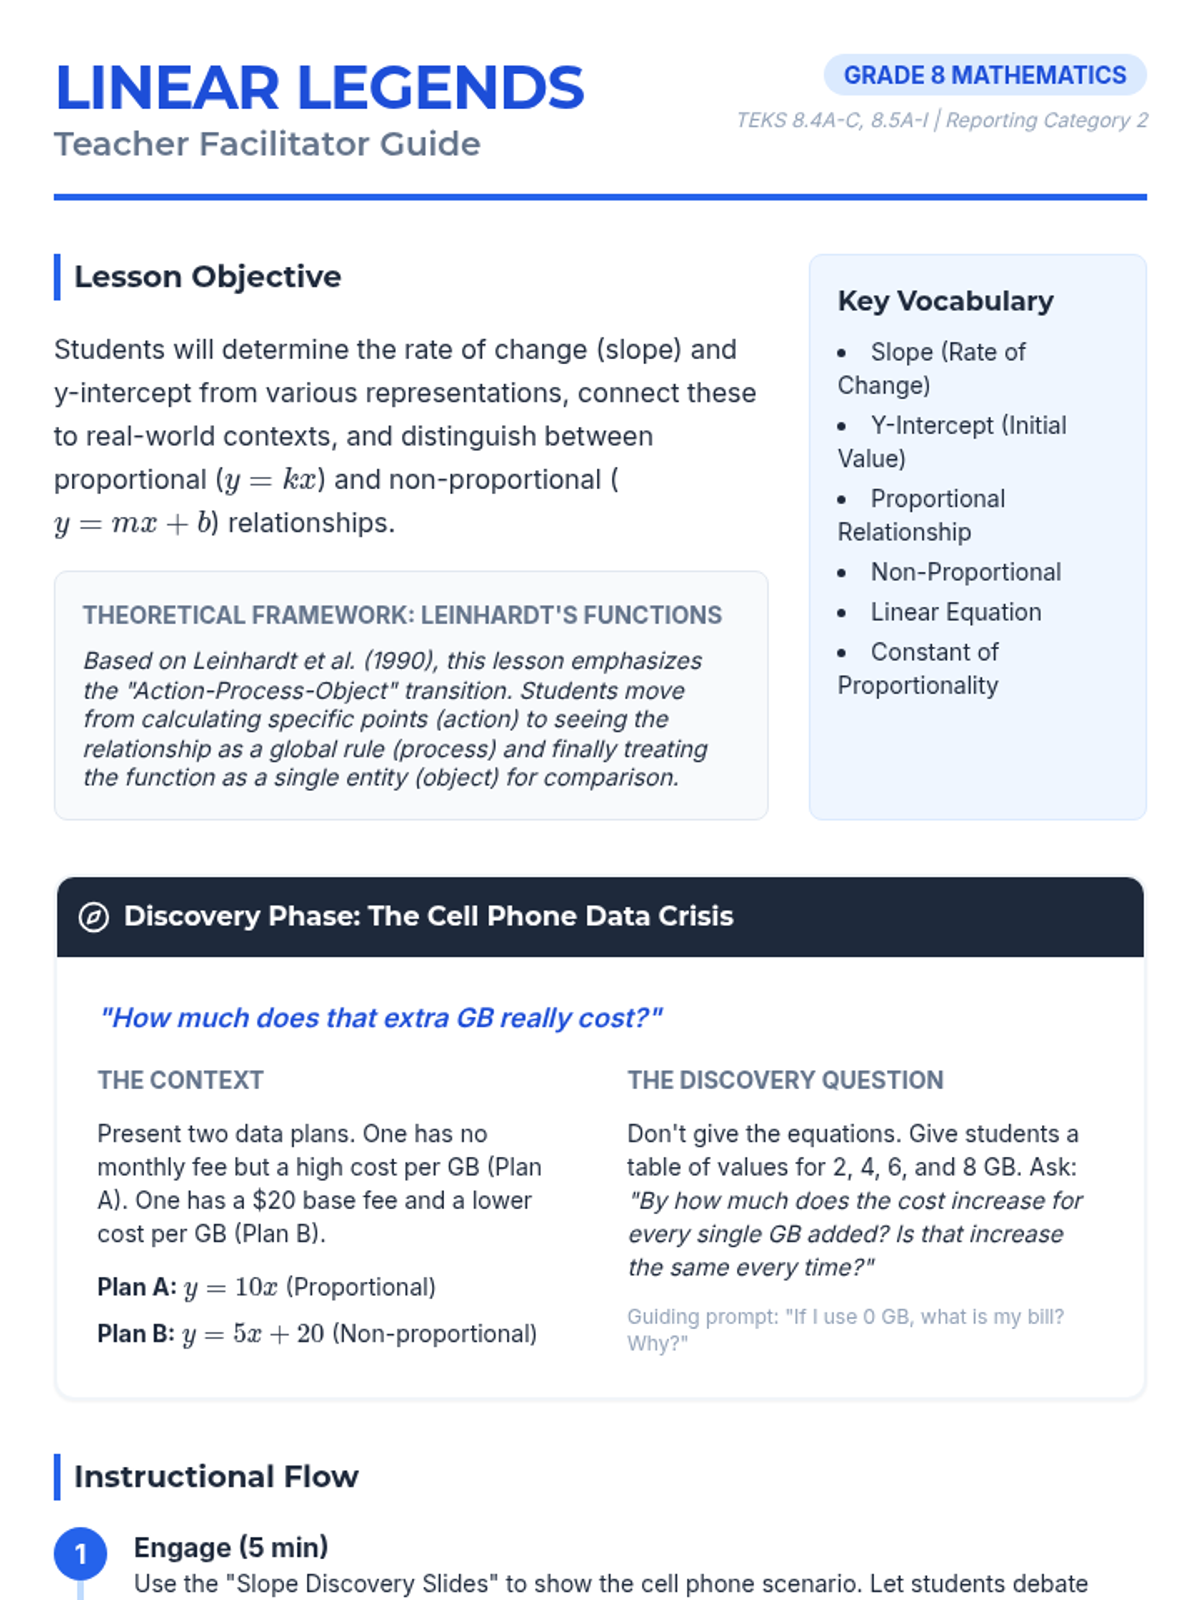
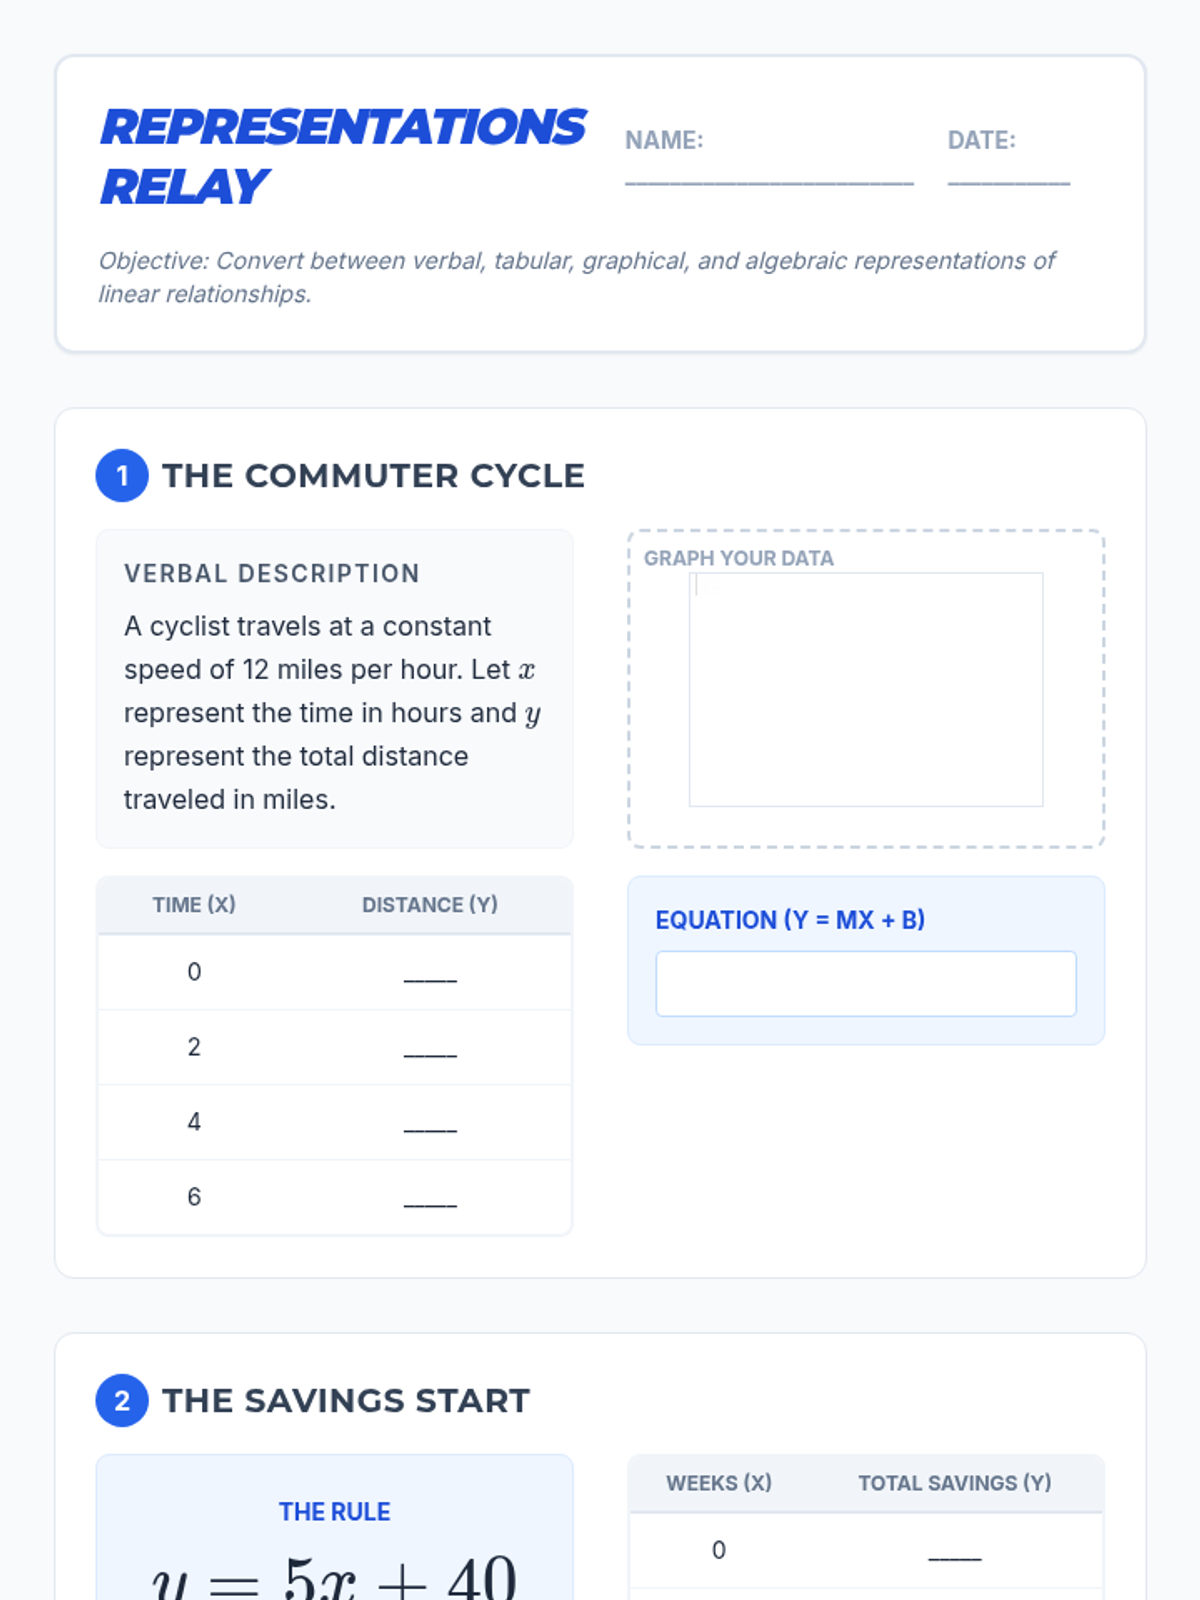
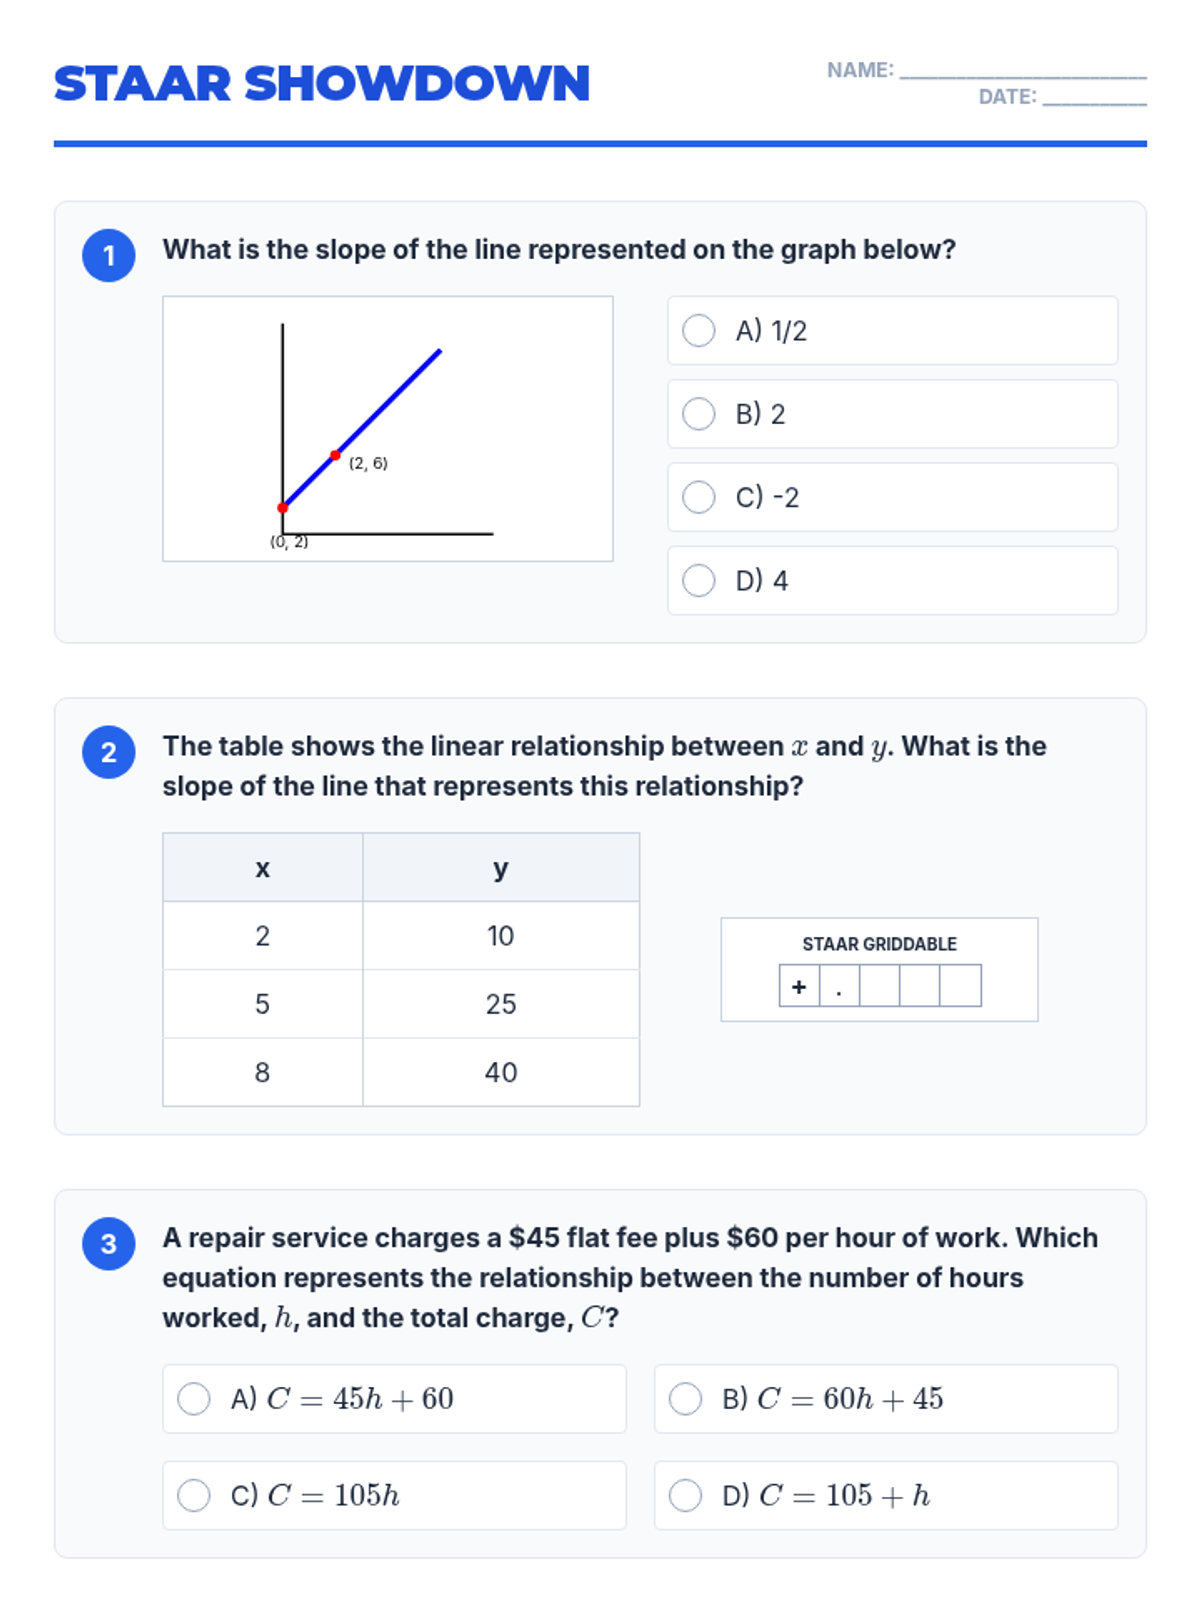
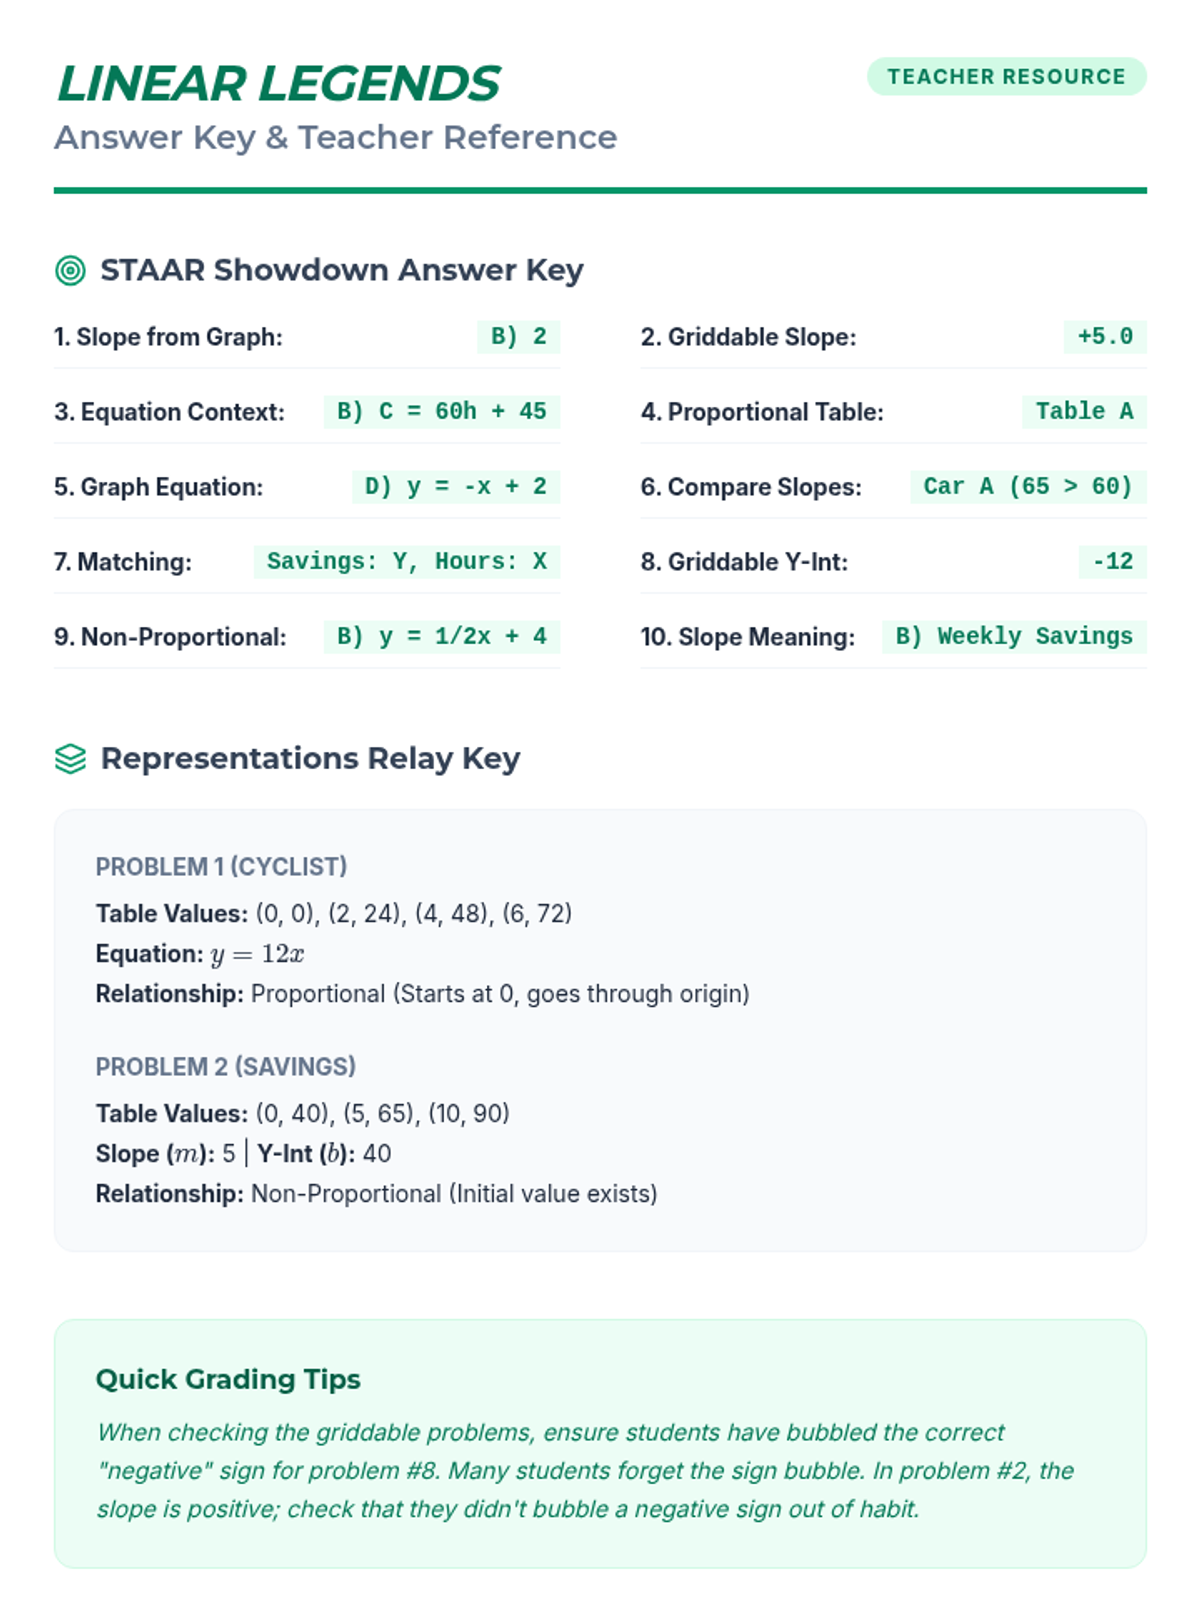
Students will discover slope as a rate of change, connect multiple representations (table, graph, equation, verbal), and distinguish between proportional and non-proportional linear relationships. Includes STAAR-aligned practice.