Mapping relationships through notation, algebraic representations, and growth rate comparisons. Equips learners to transform functions, model contextual data, and solve exponential equations.
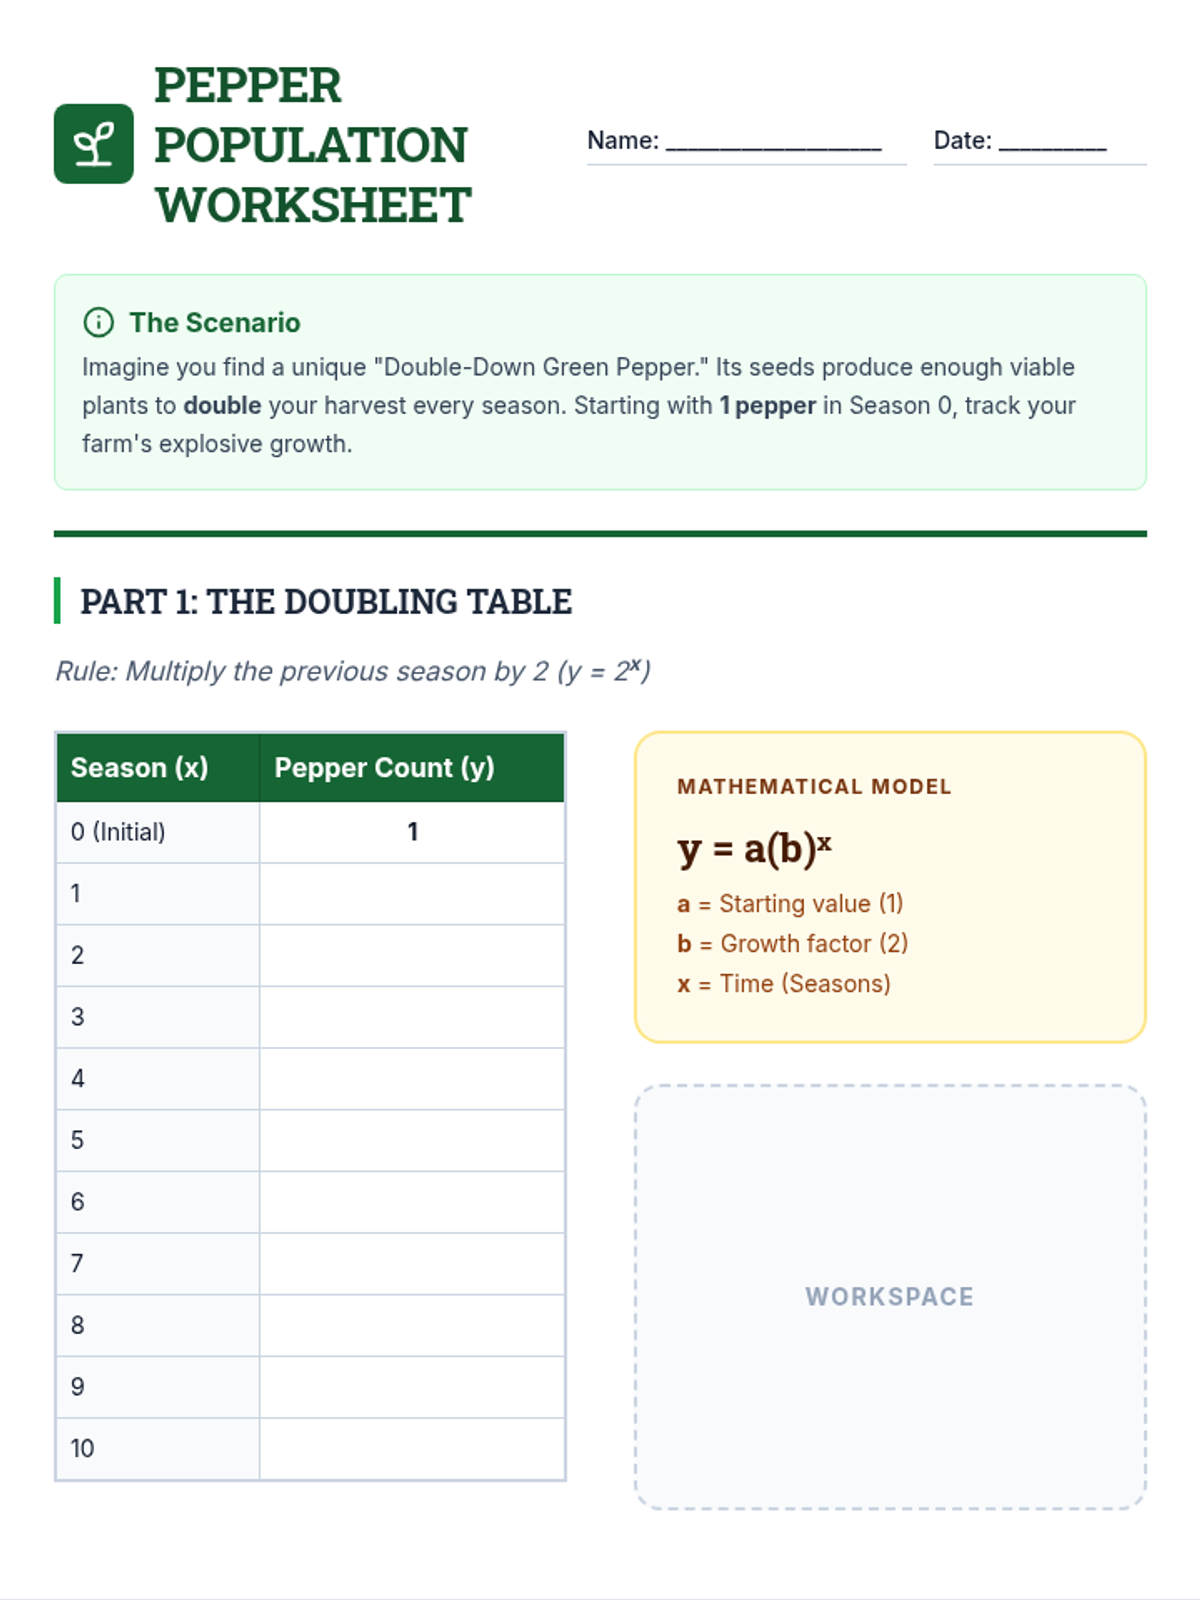
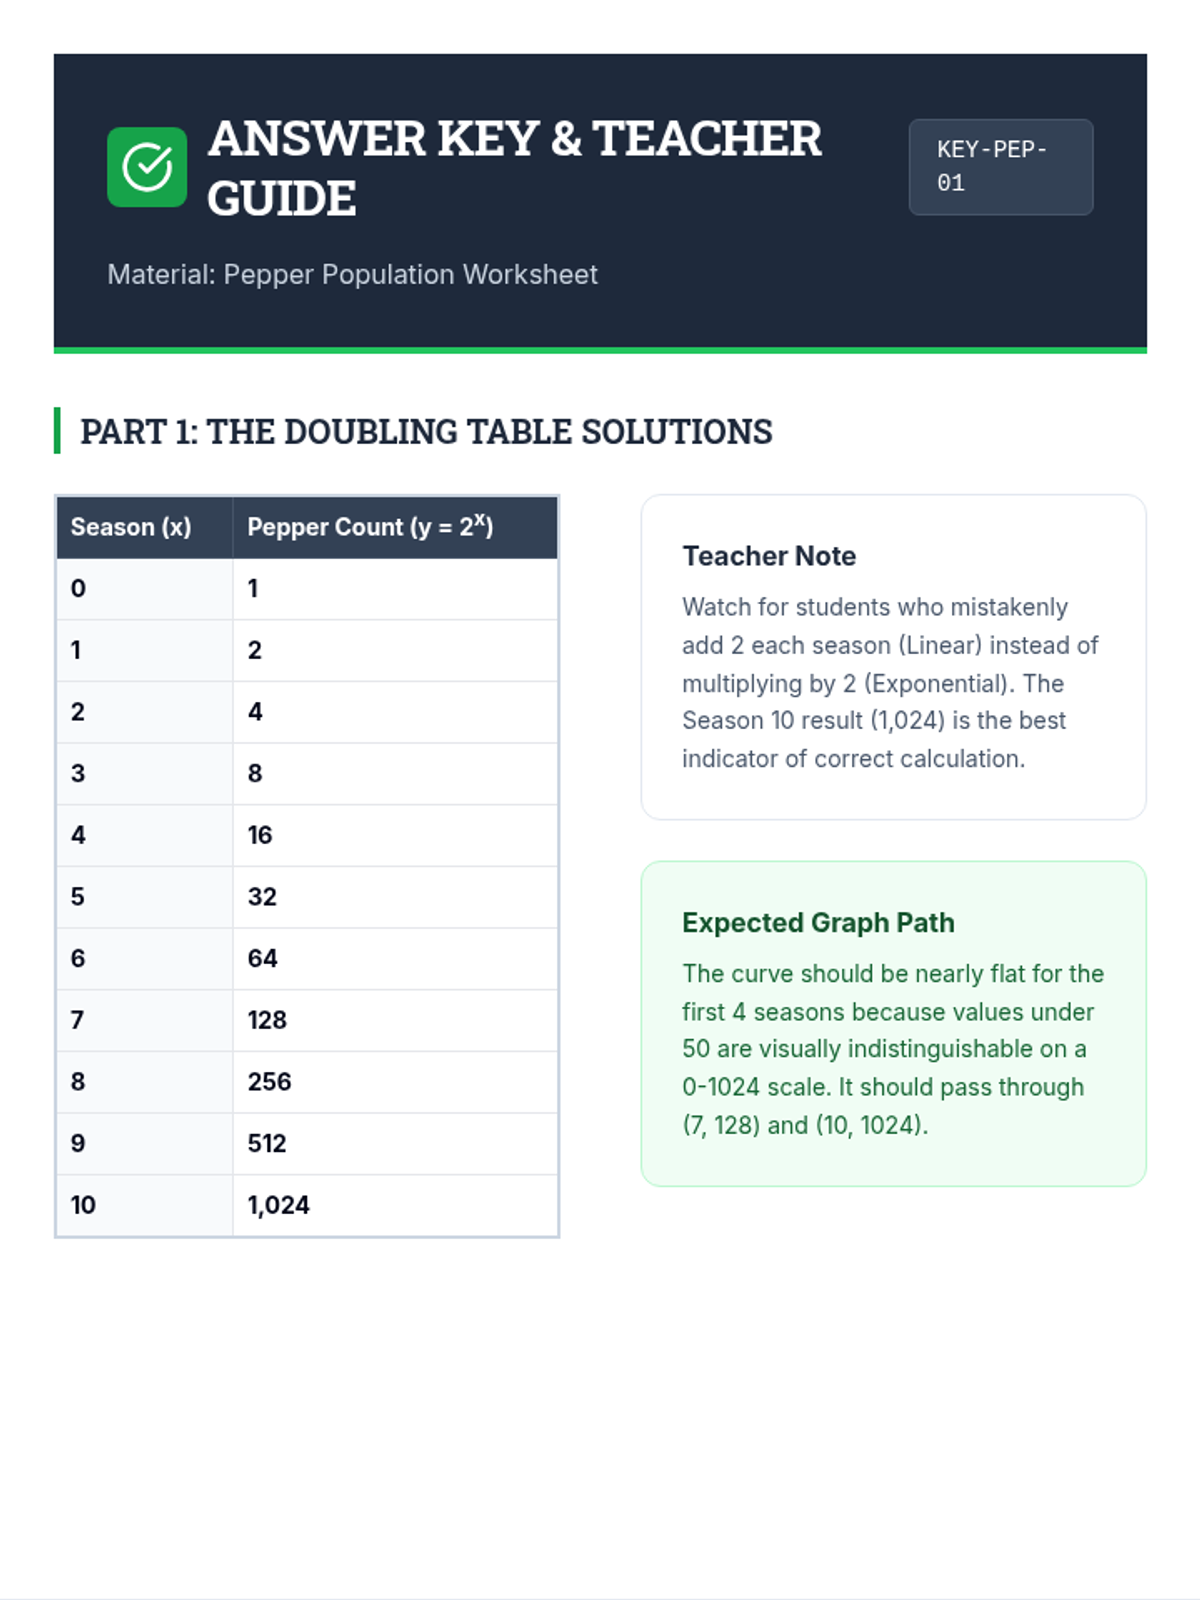
A sequence focused on exponential growth models through the lens of agricultural yields, specifically tracking the population growth of peppers from a single fruit.
A comprehensive 7-week NYS Math Assessment preparation sequence for 8th grade, covering major clusters including algebra, functions, geometry, and statistics.
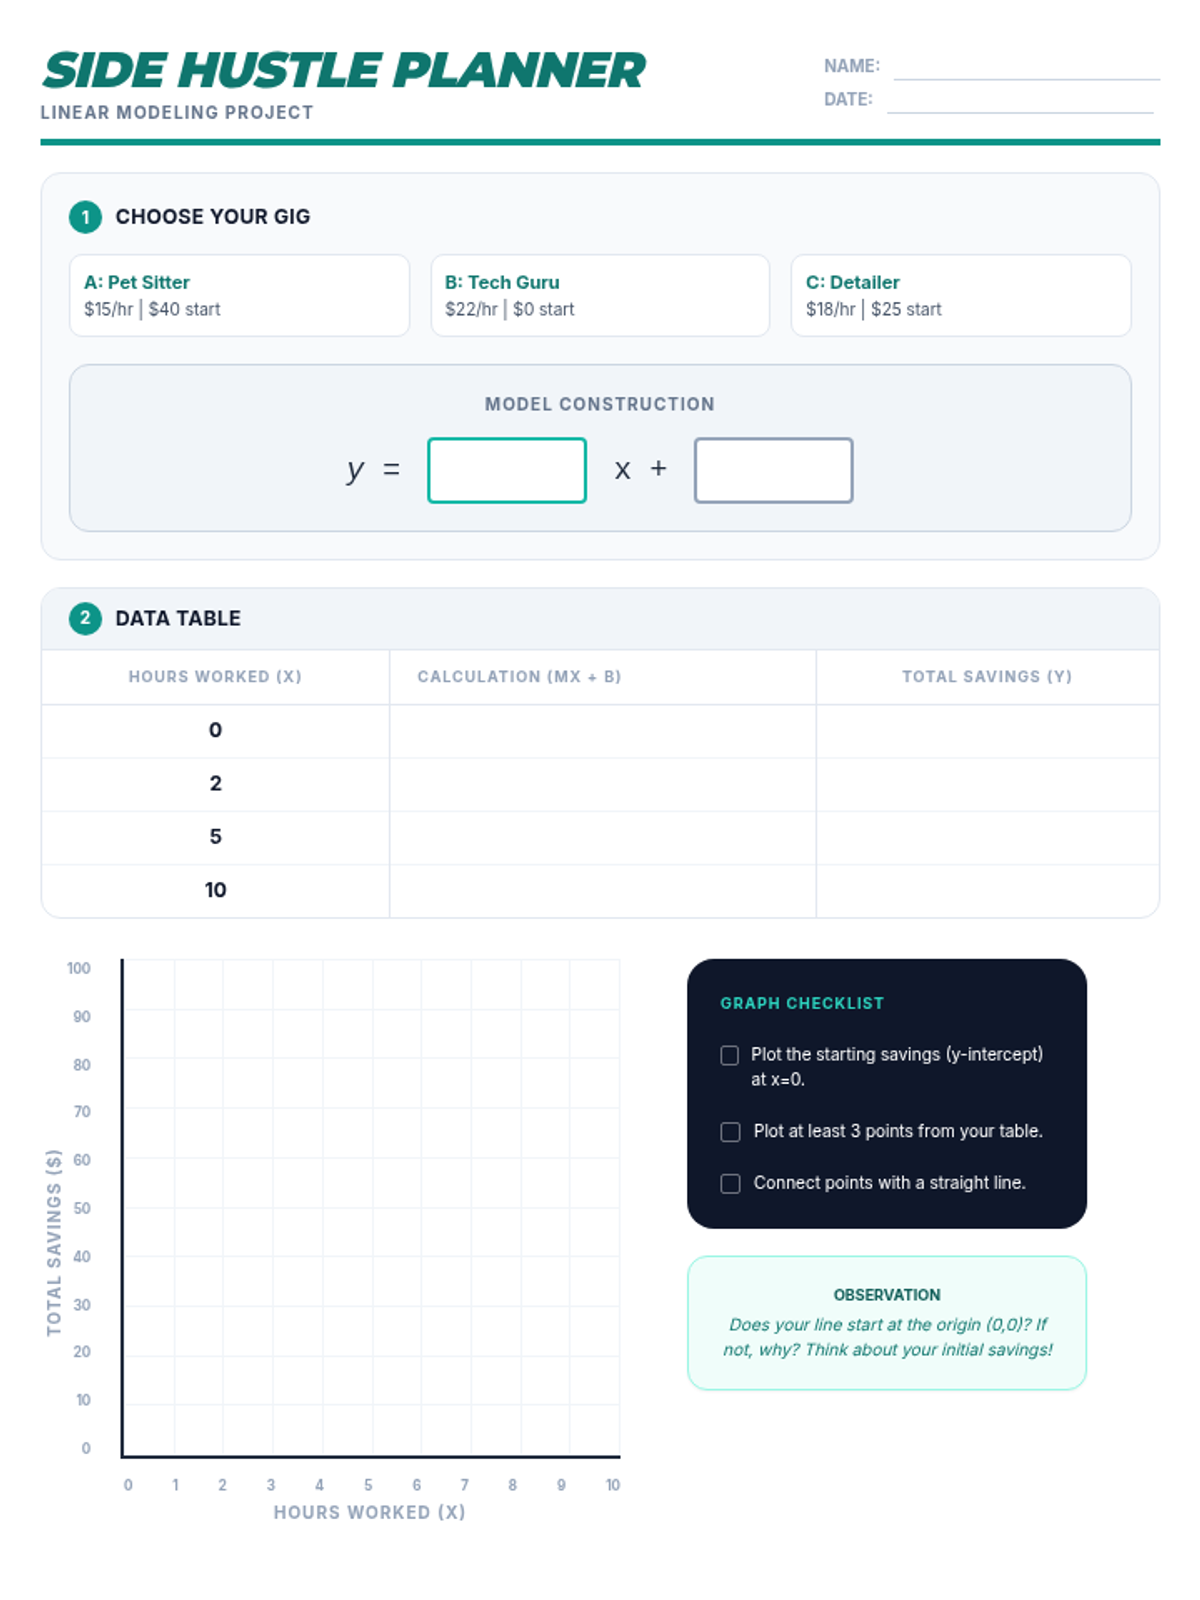
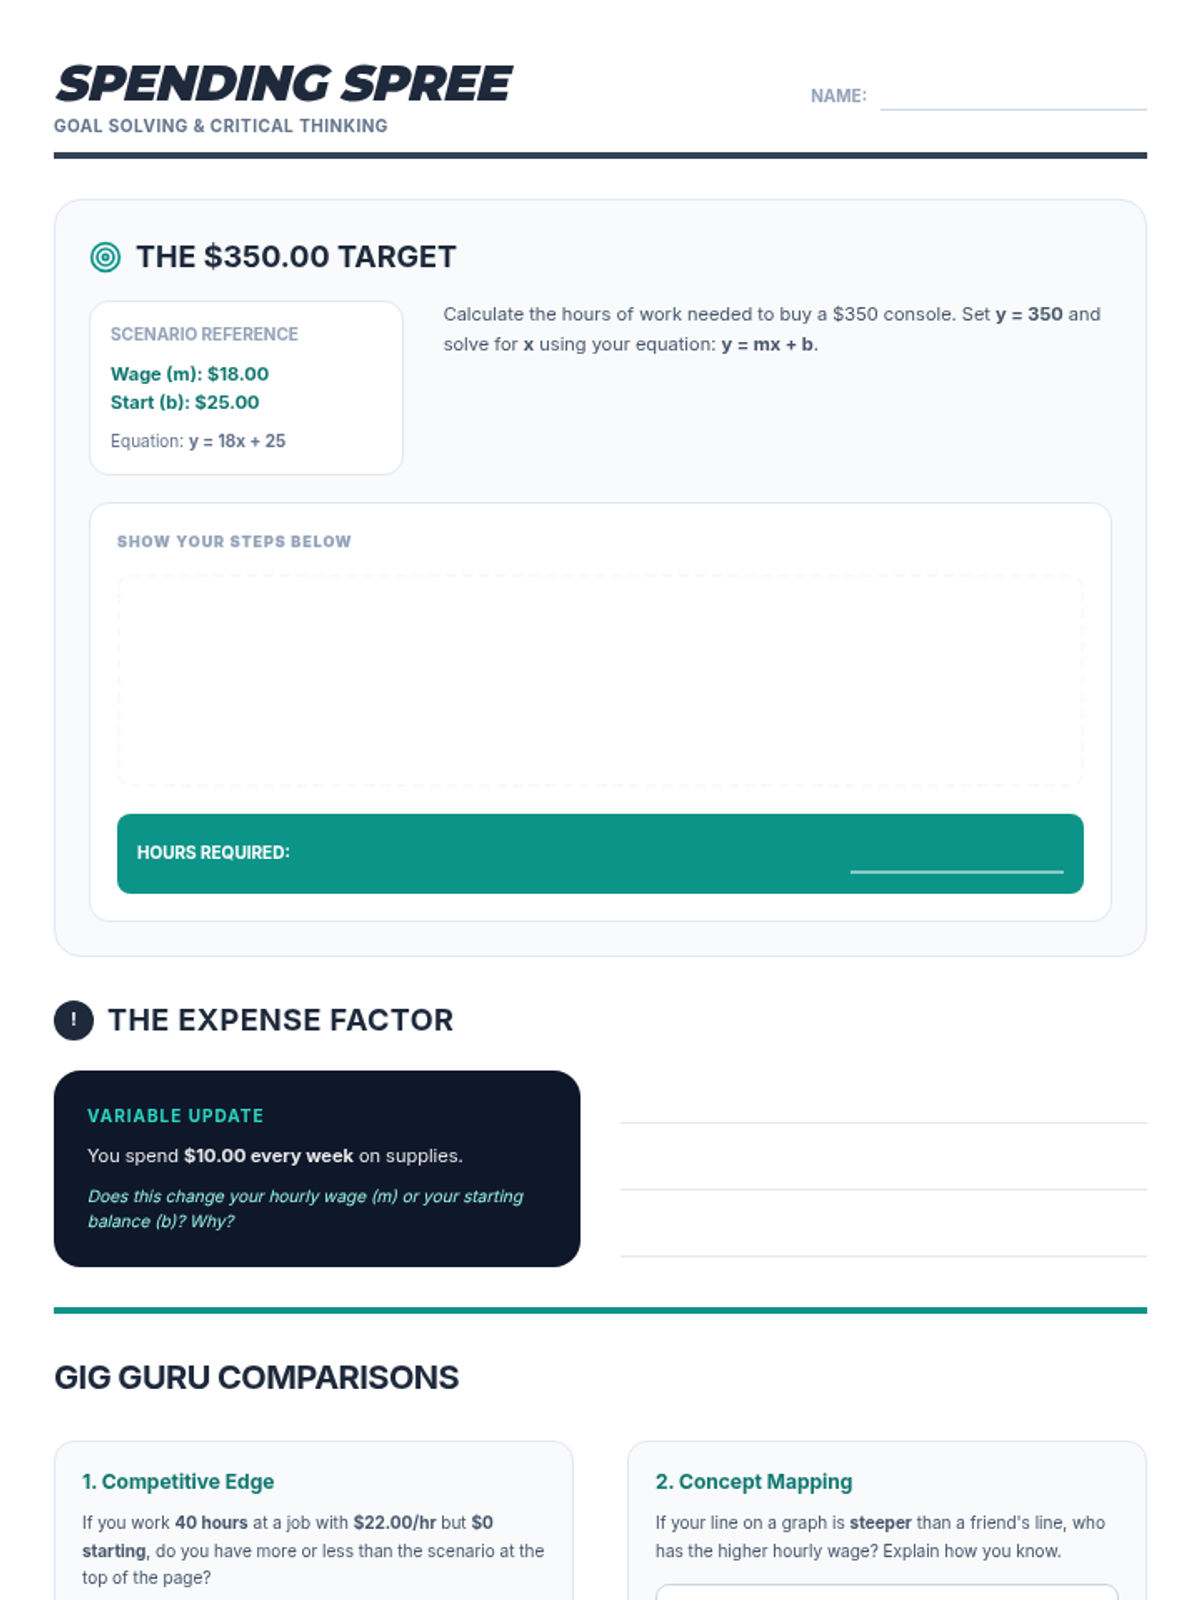
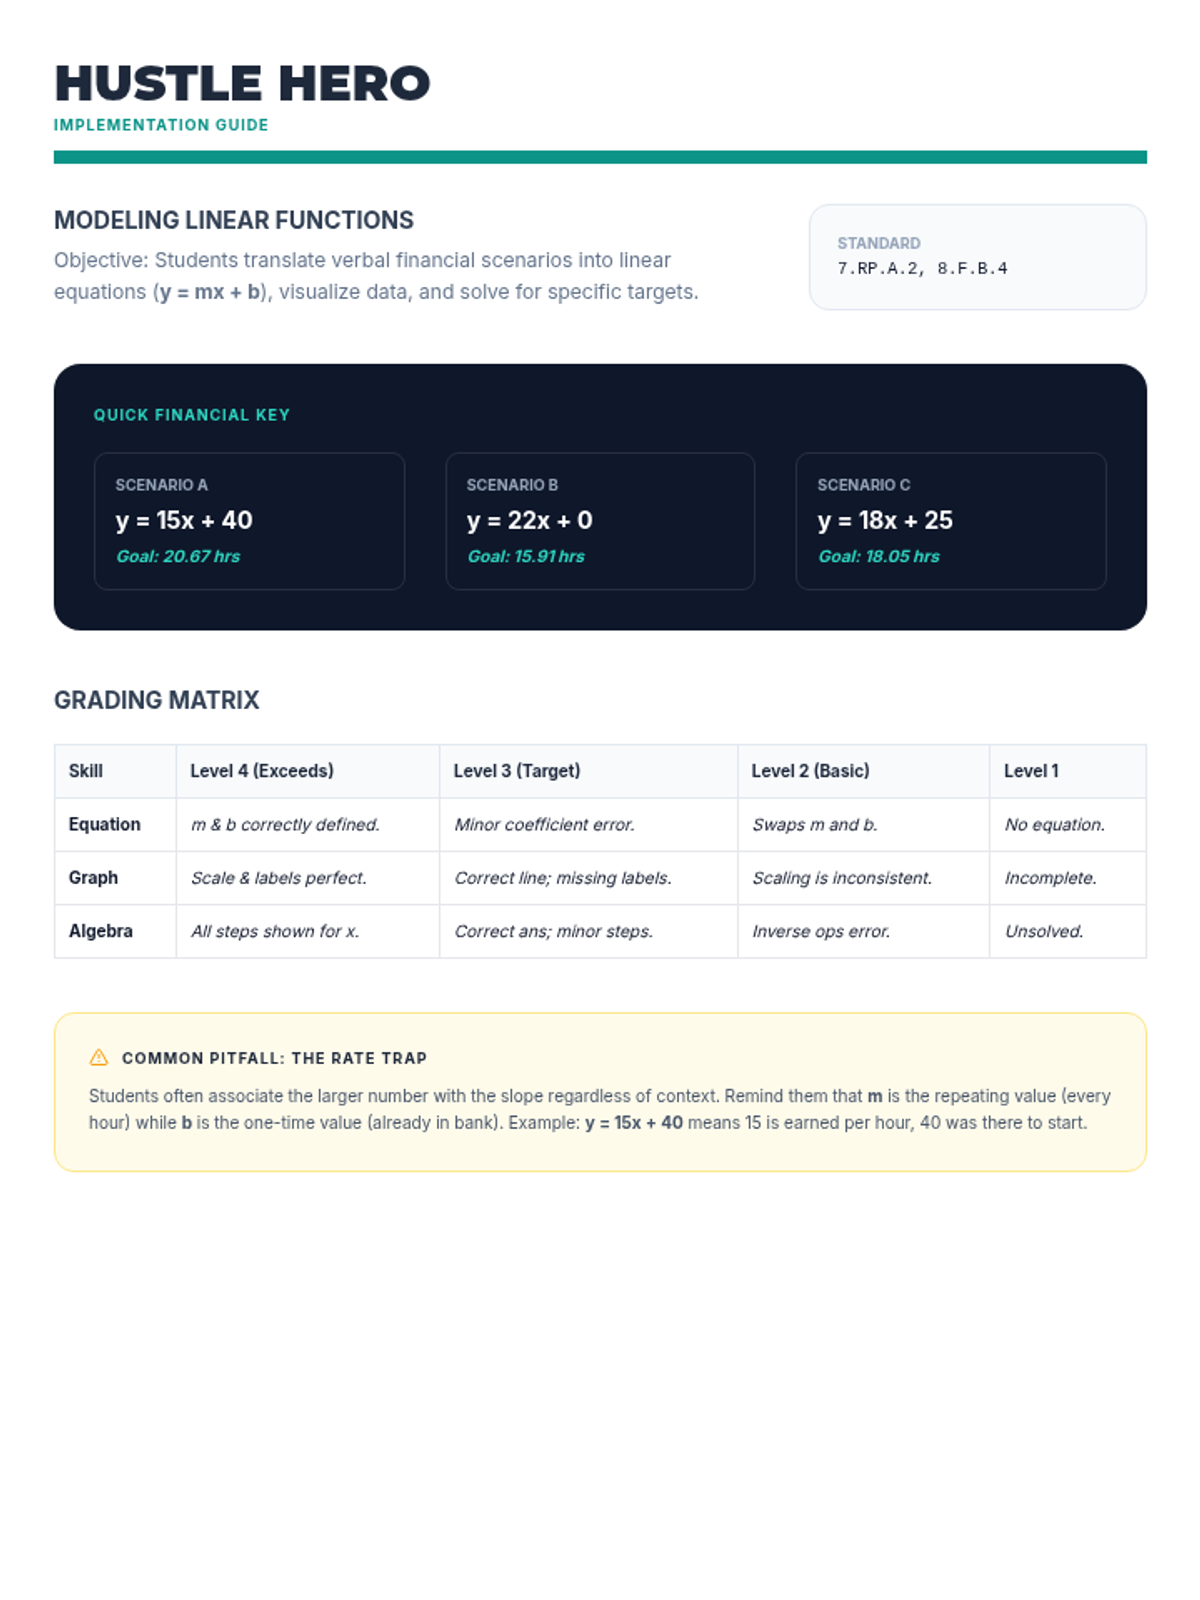
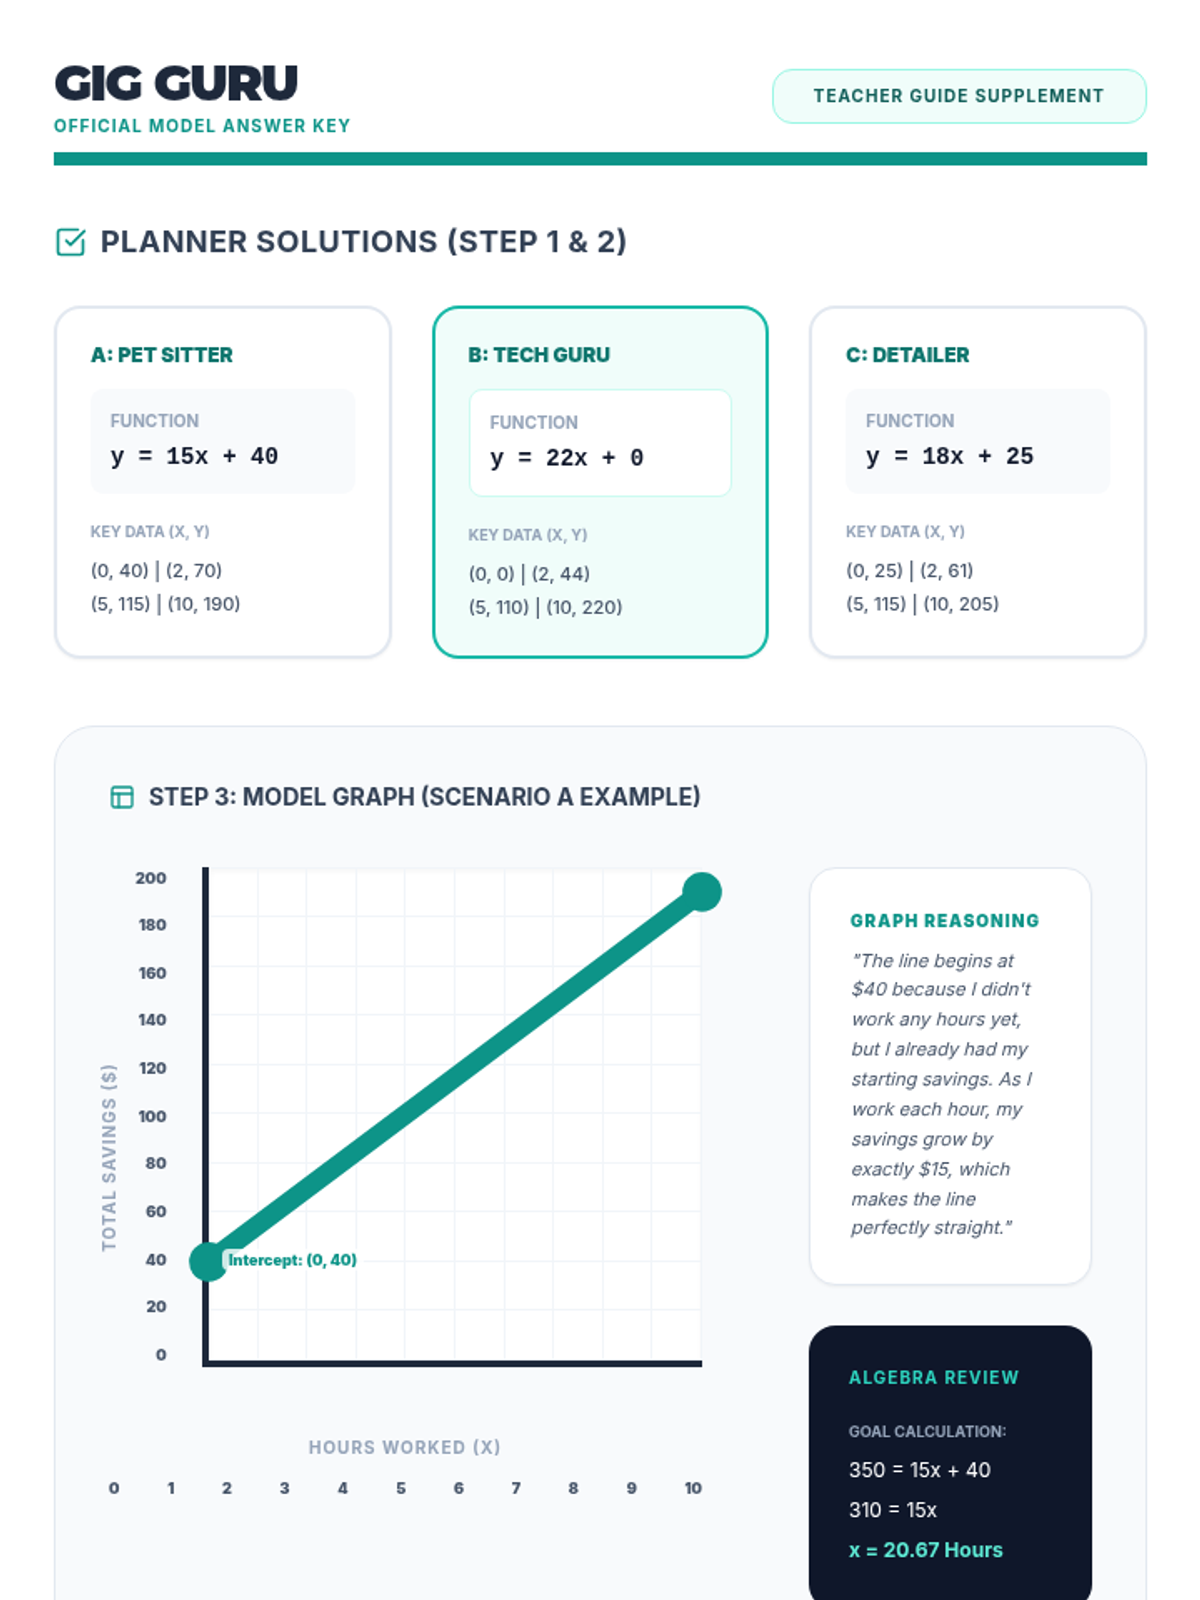
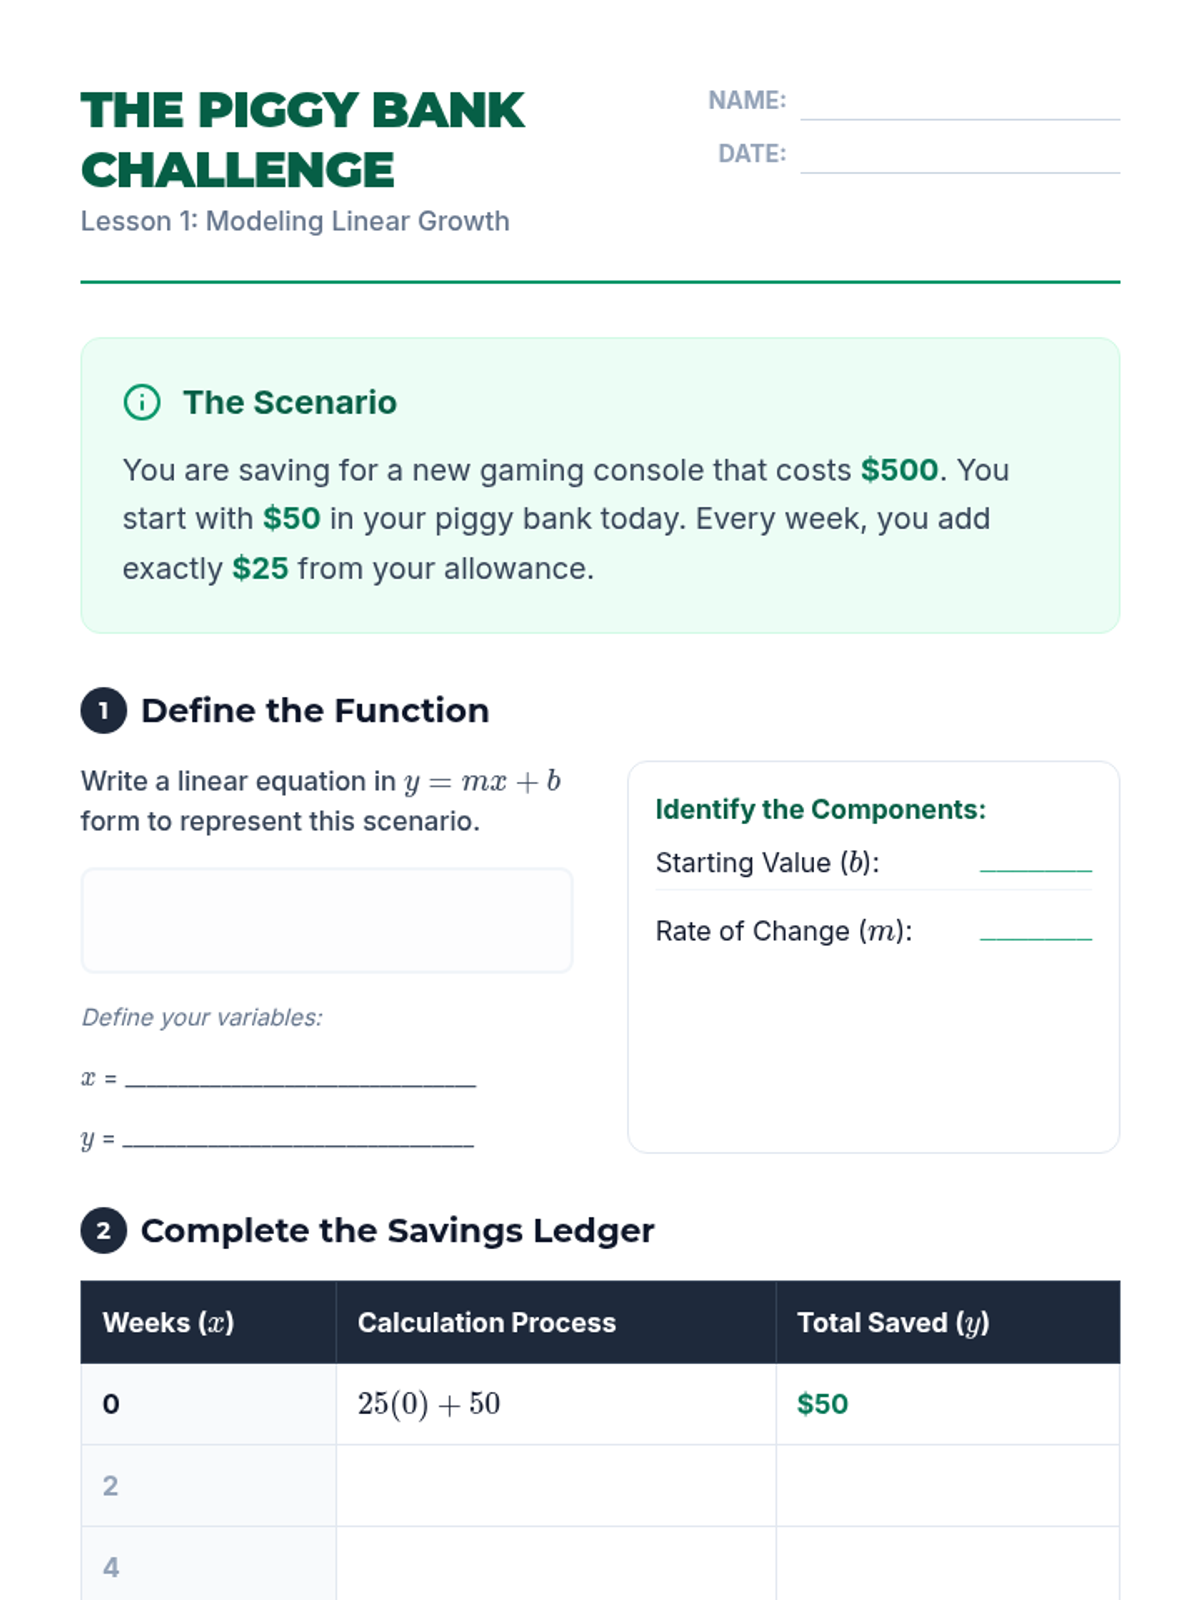
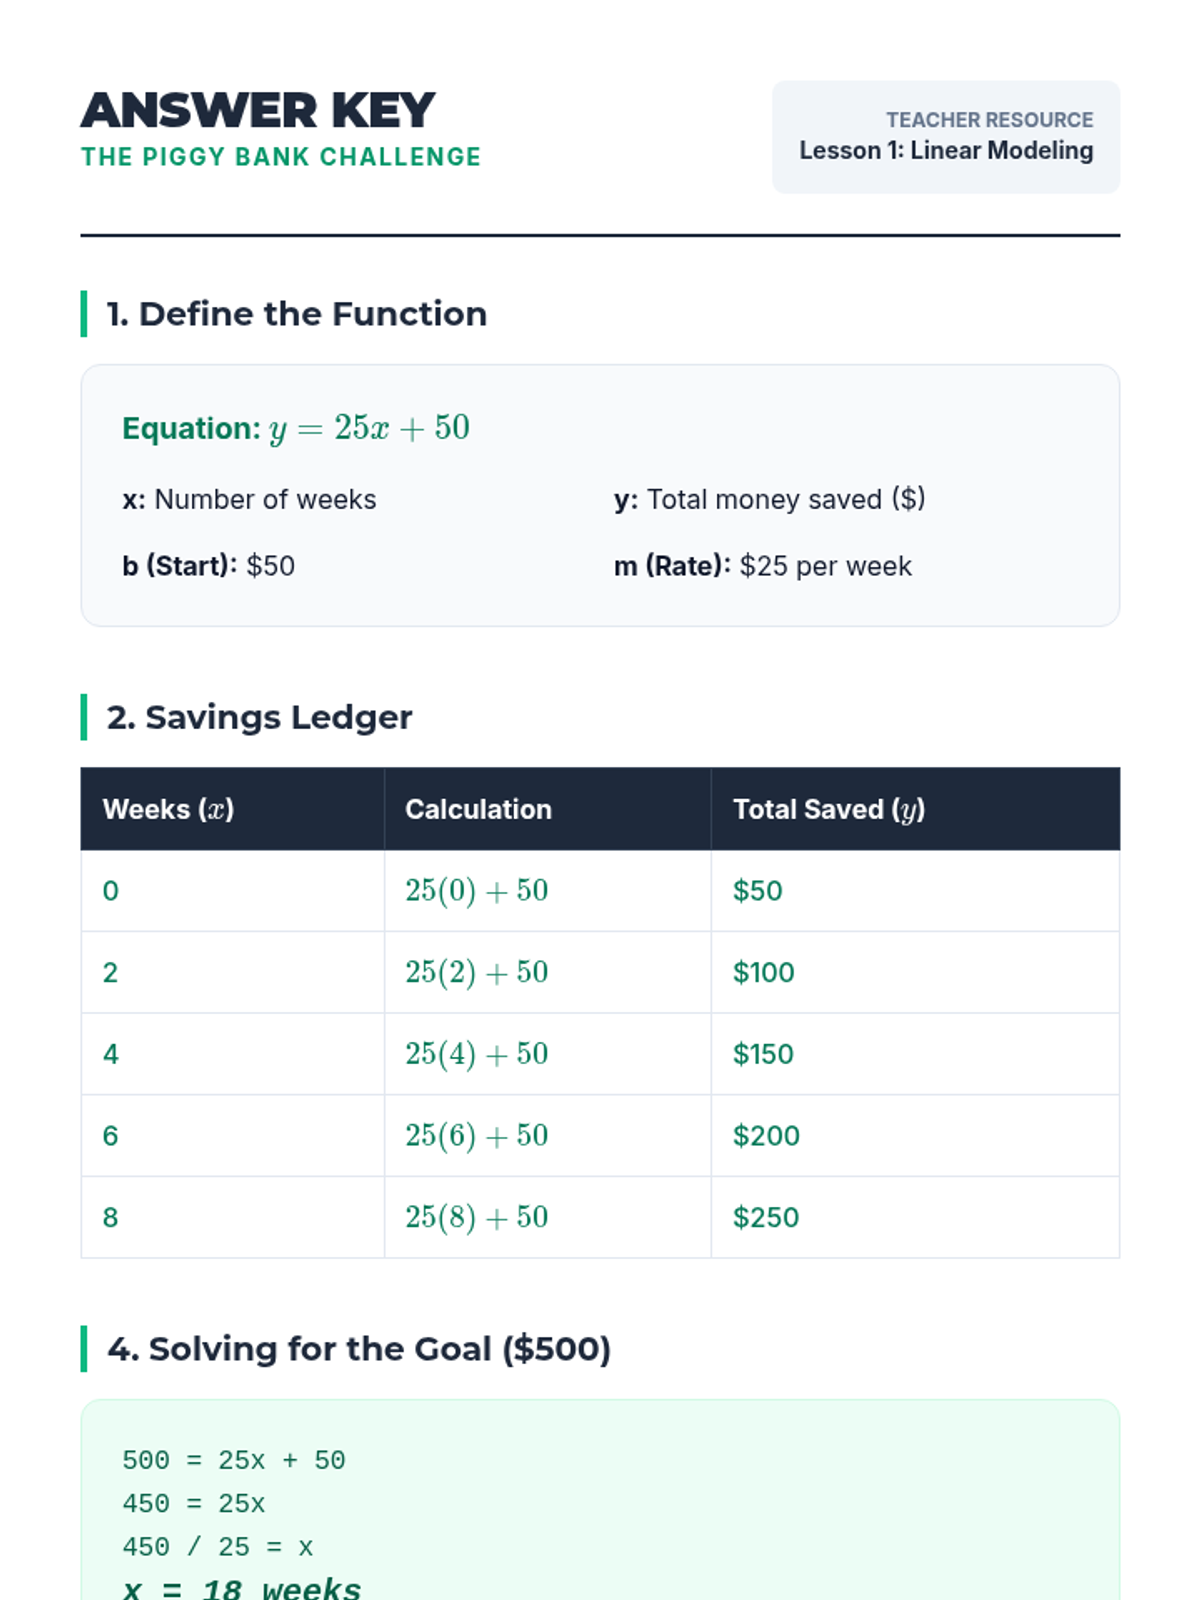
A real-world project where students use linear functions to model earnings from a summer job and manage a budget to reach a savings goal. Students will define variables, write equations, create tables, and graph their financial progress.
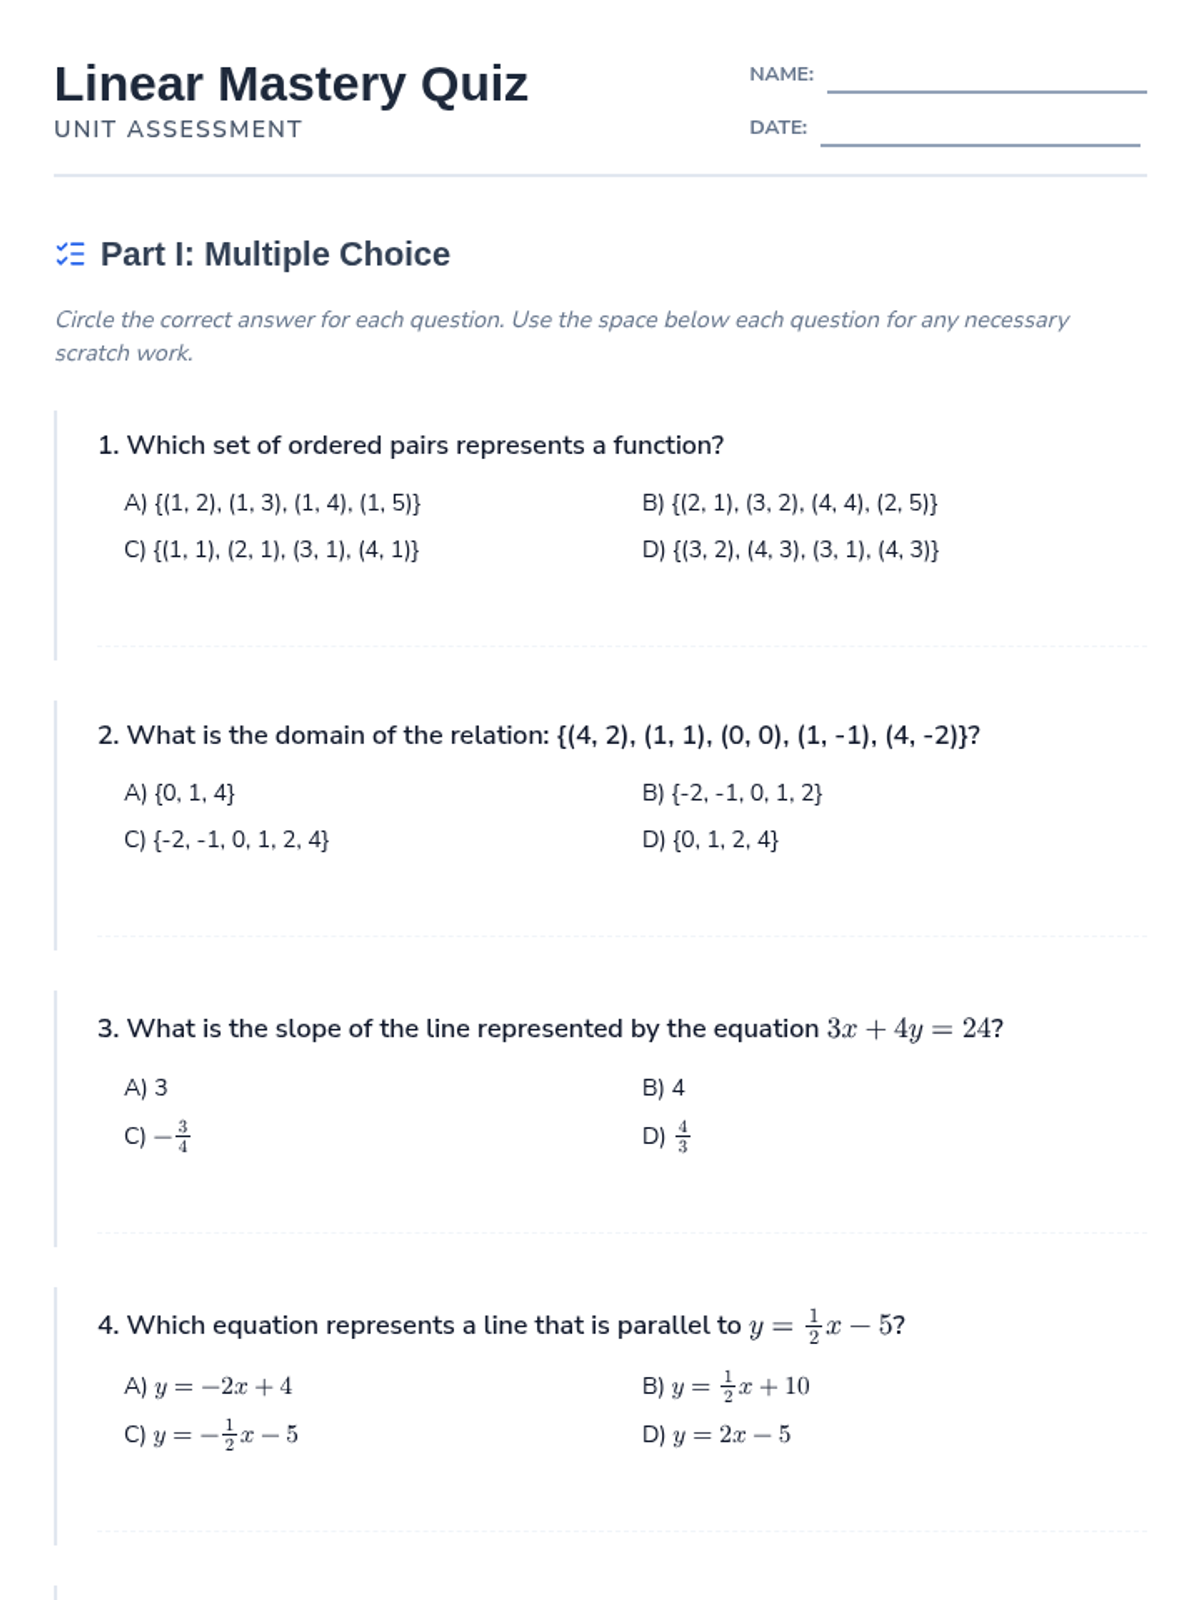
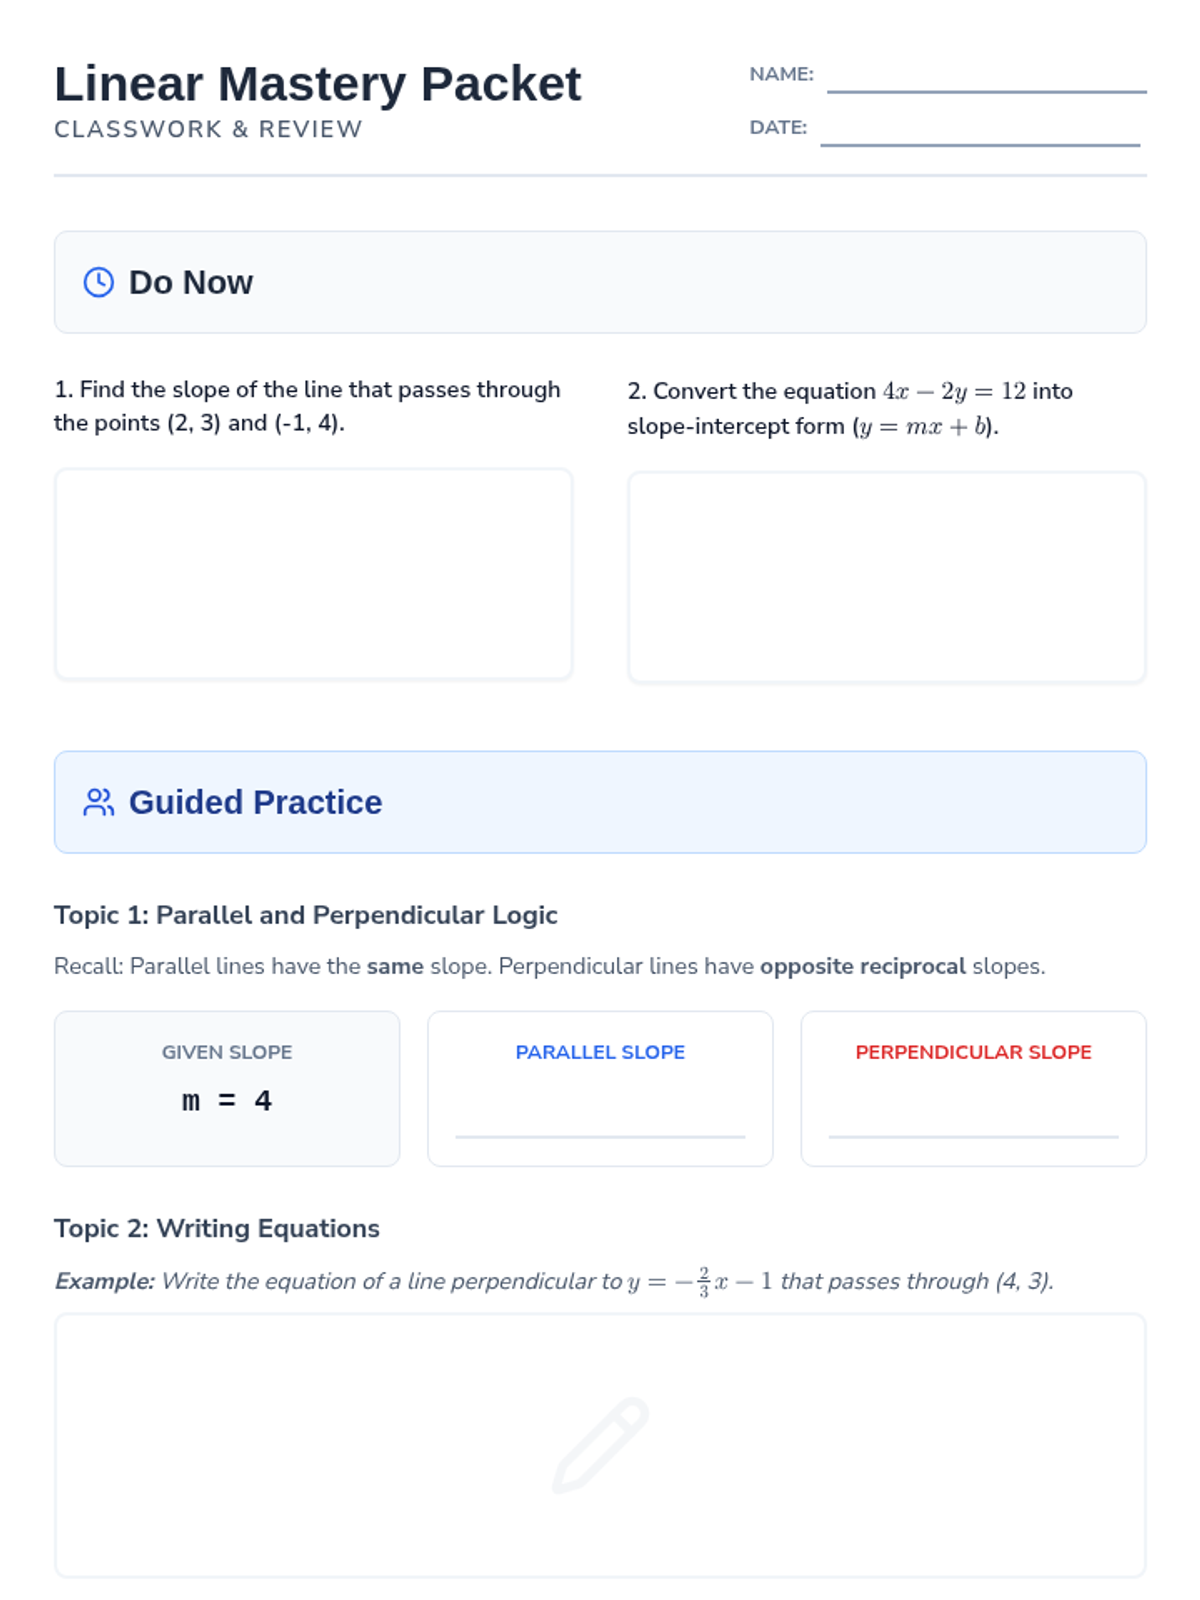
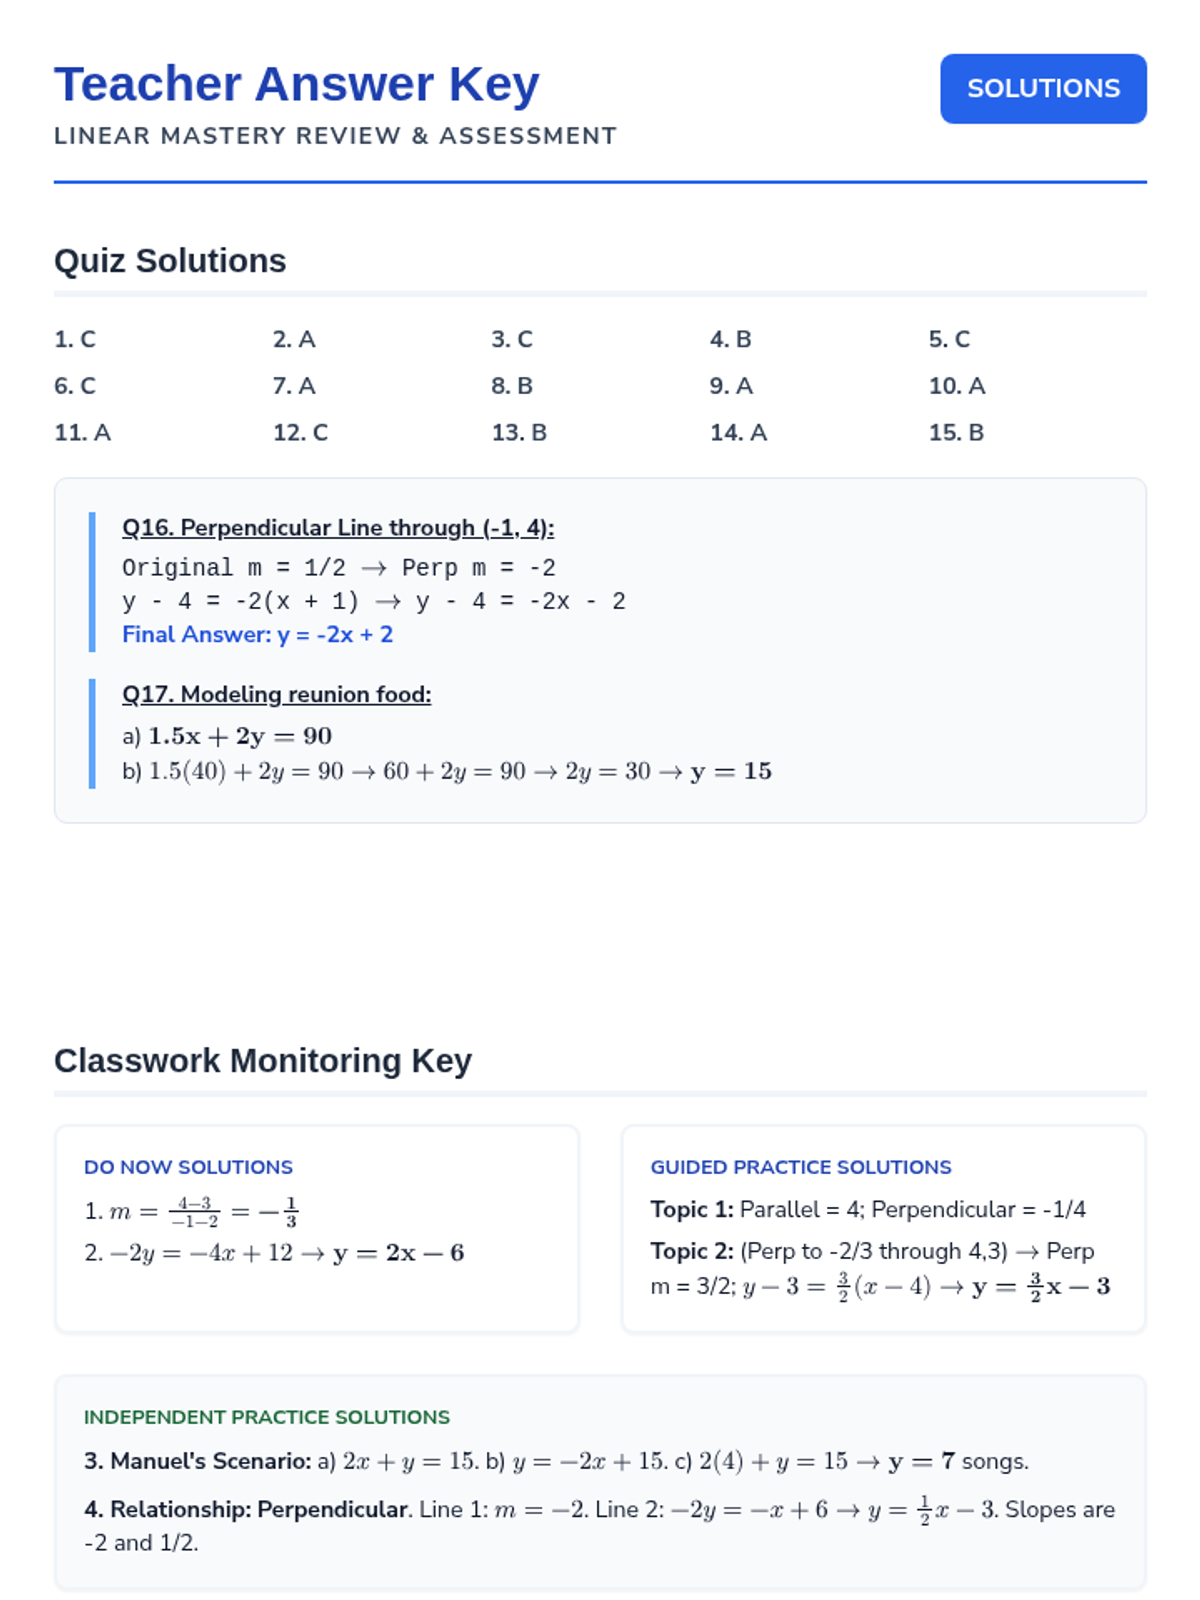
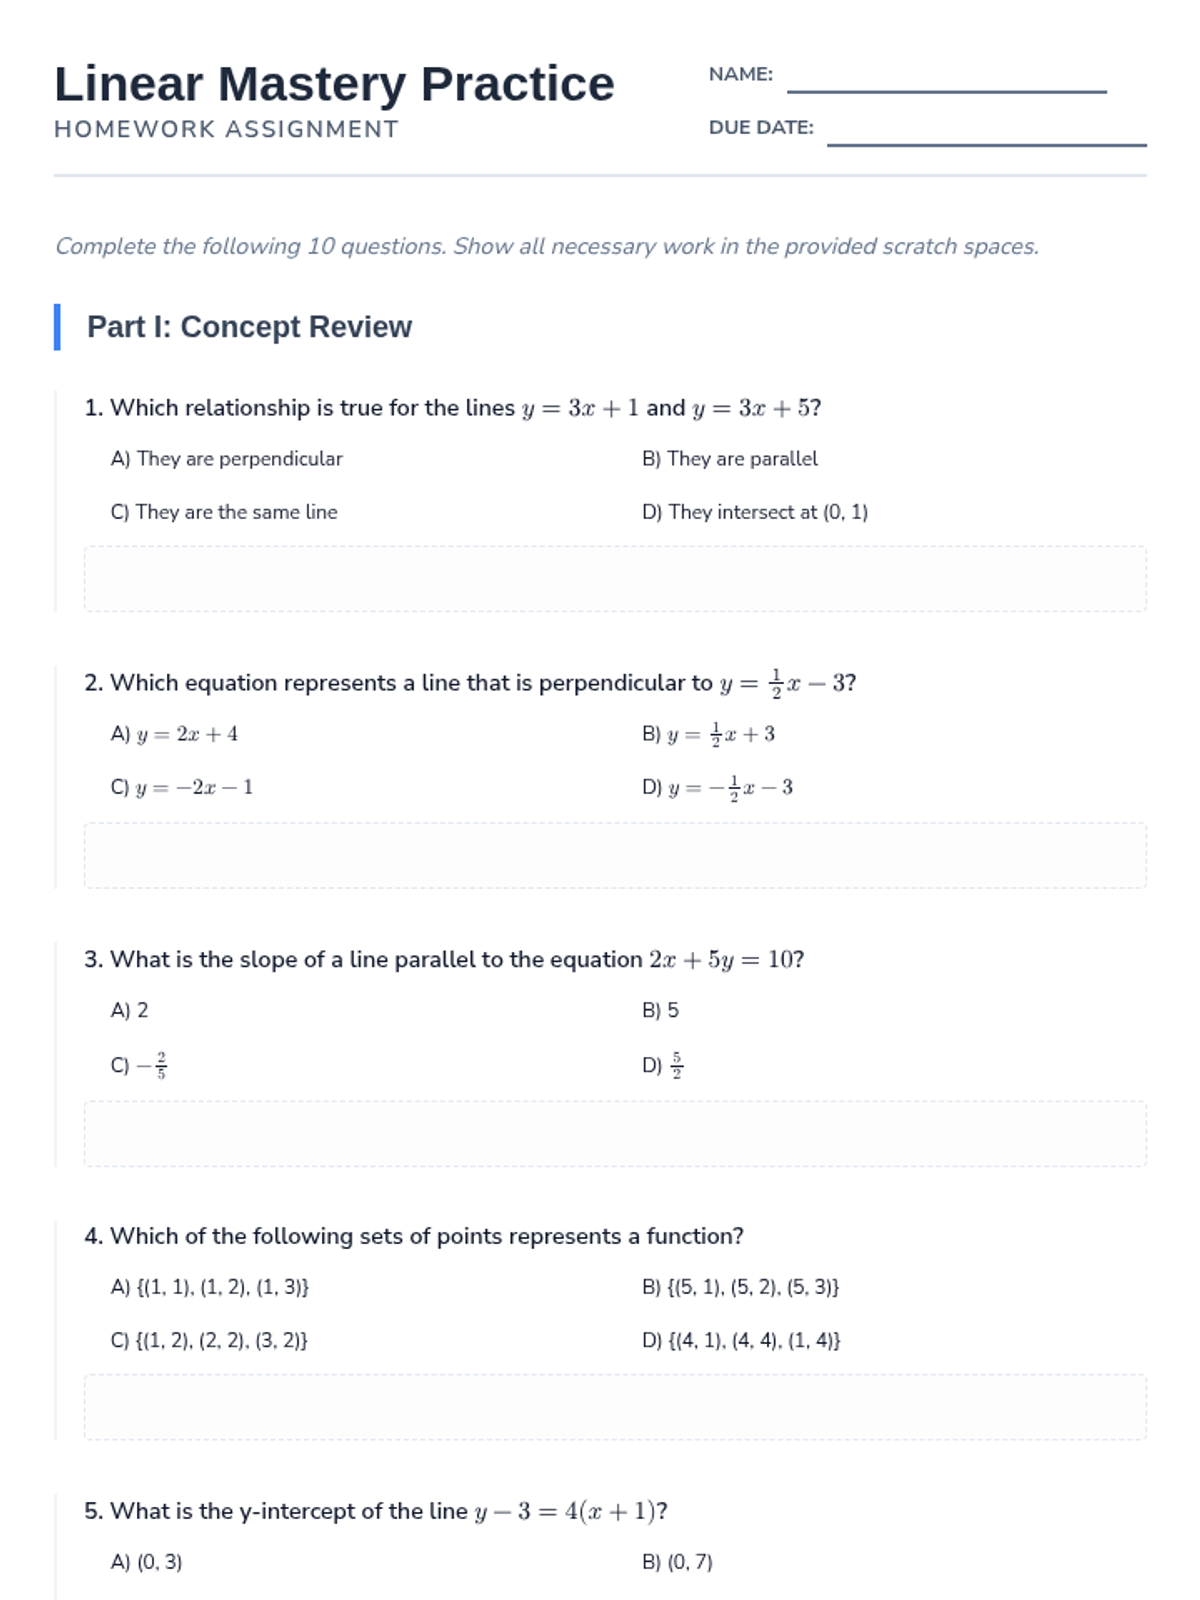
A comprehensive sequence covering the mastery of linear functions, equations, and inequalities. This progression takes students from identifying functions and solving basic equations to complex modeling with lines of best fit and inequality systems.
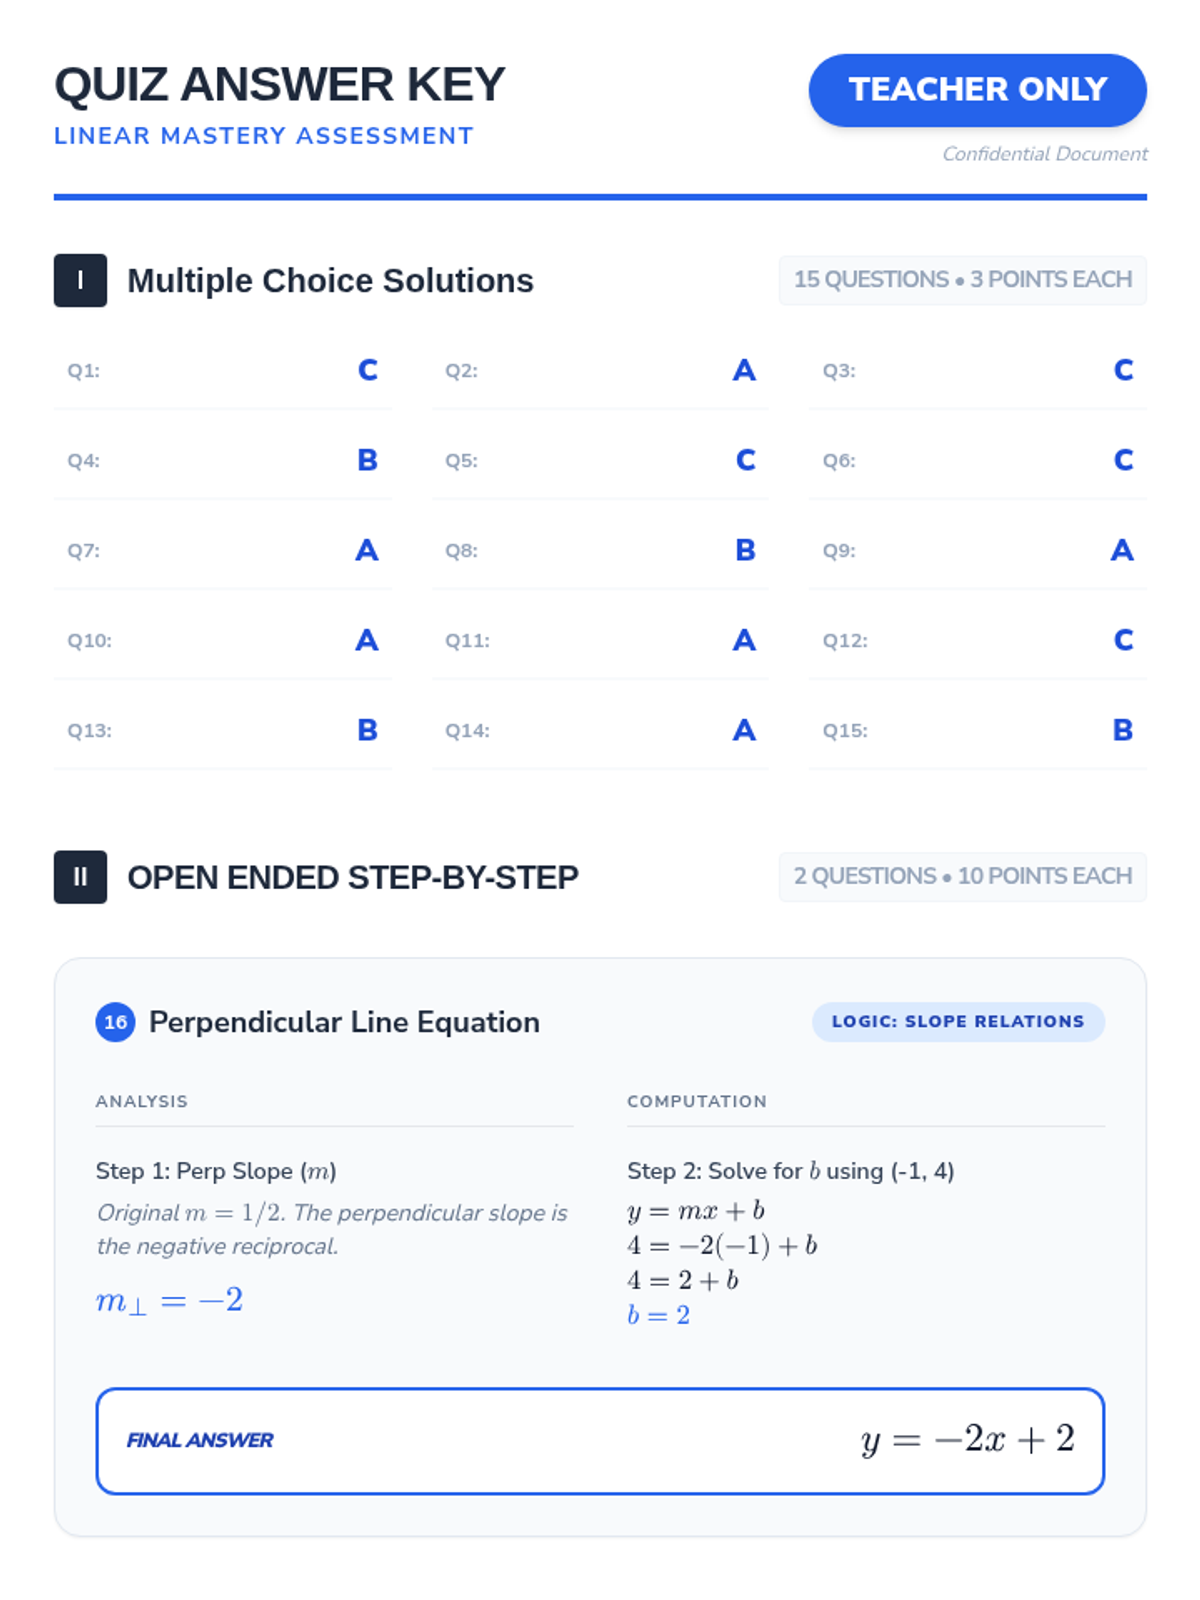
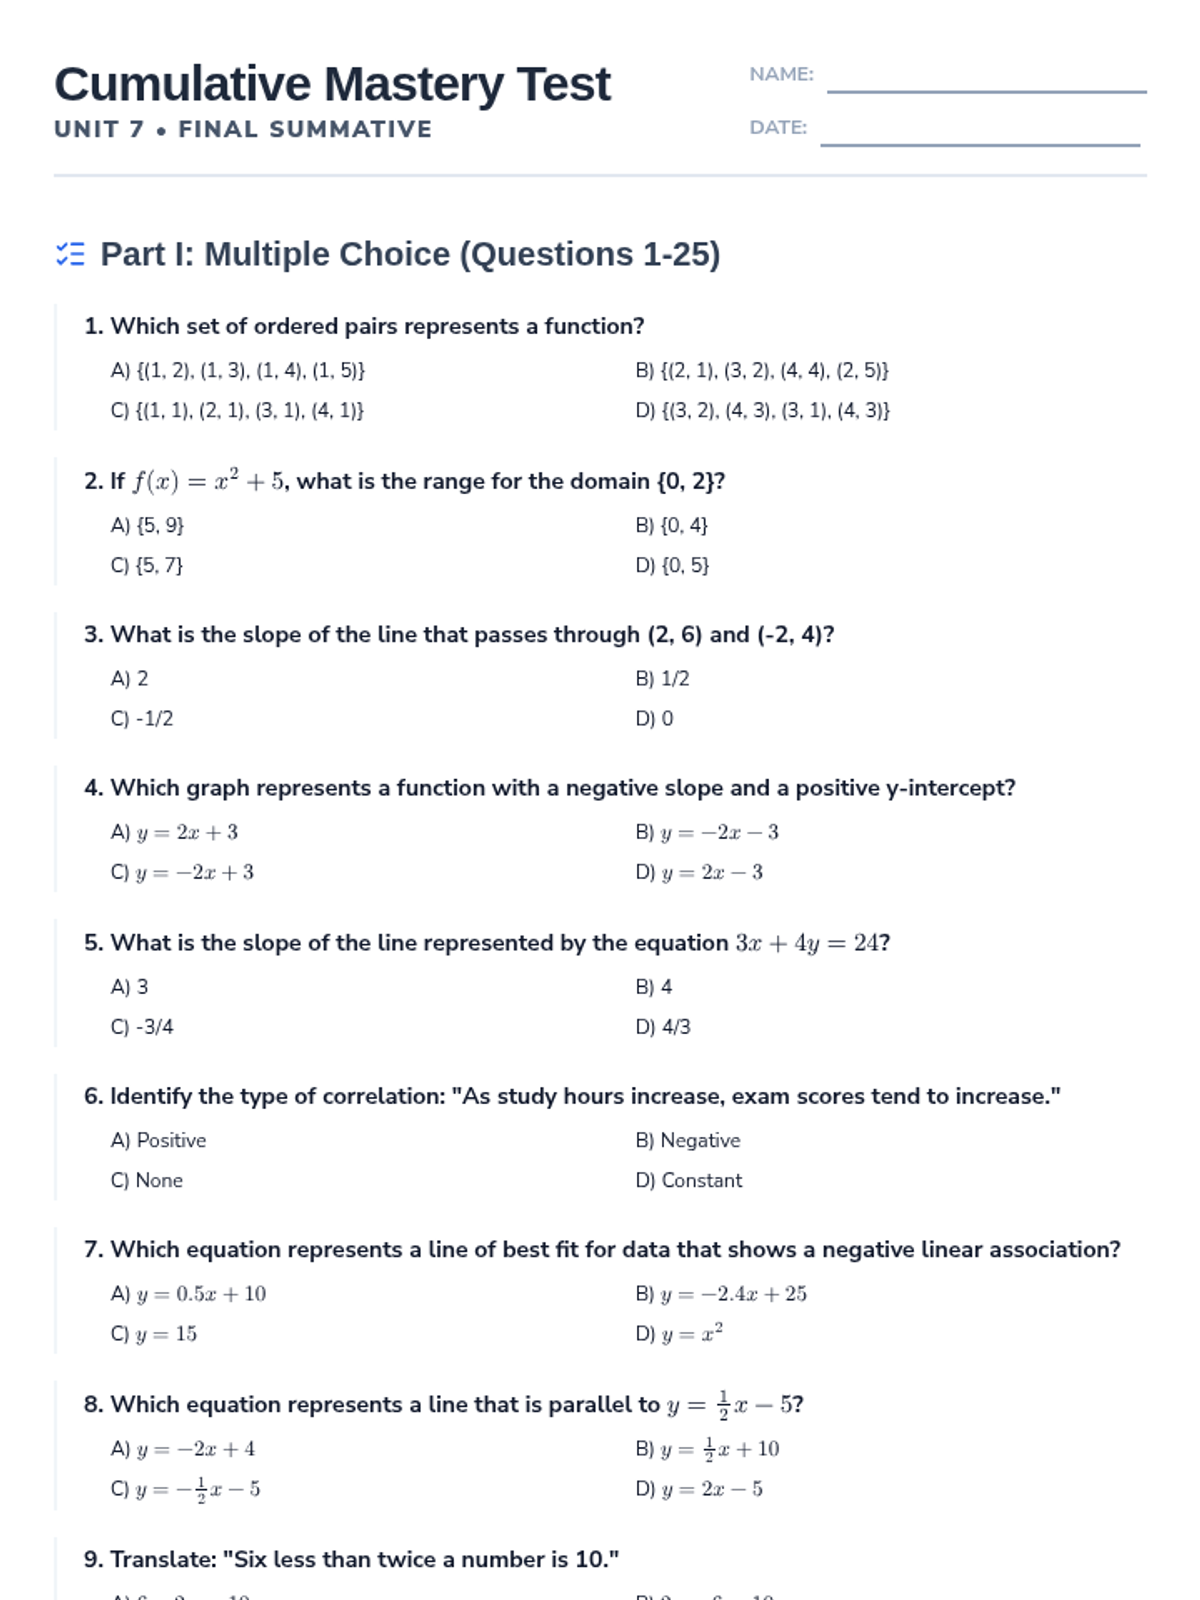
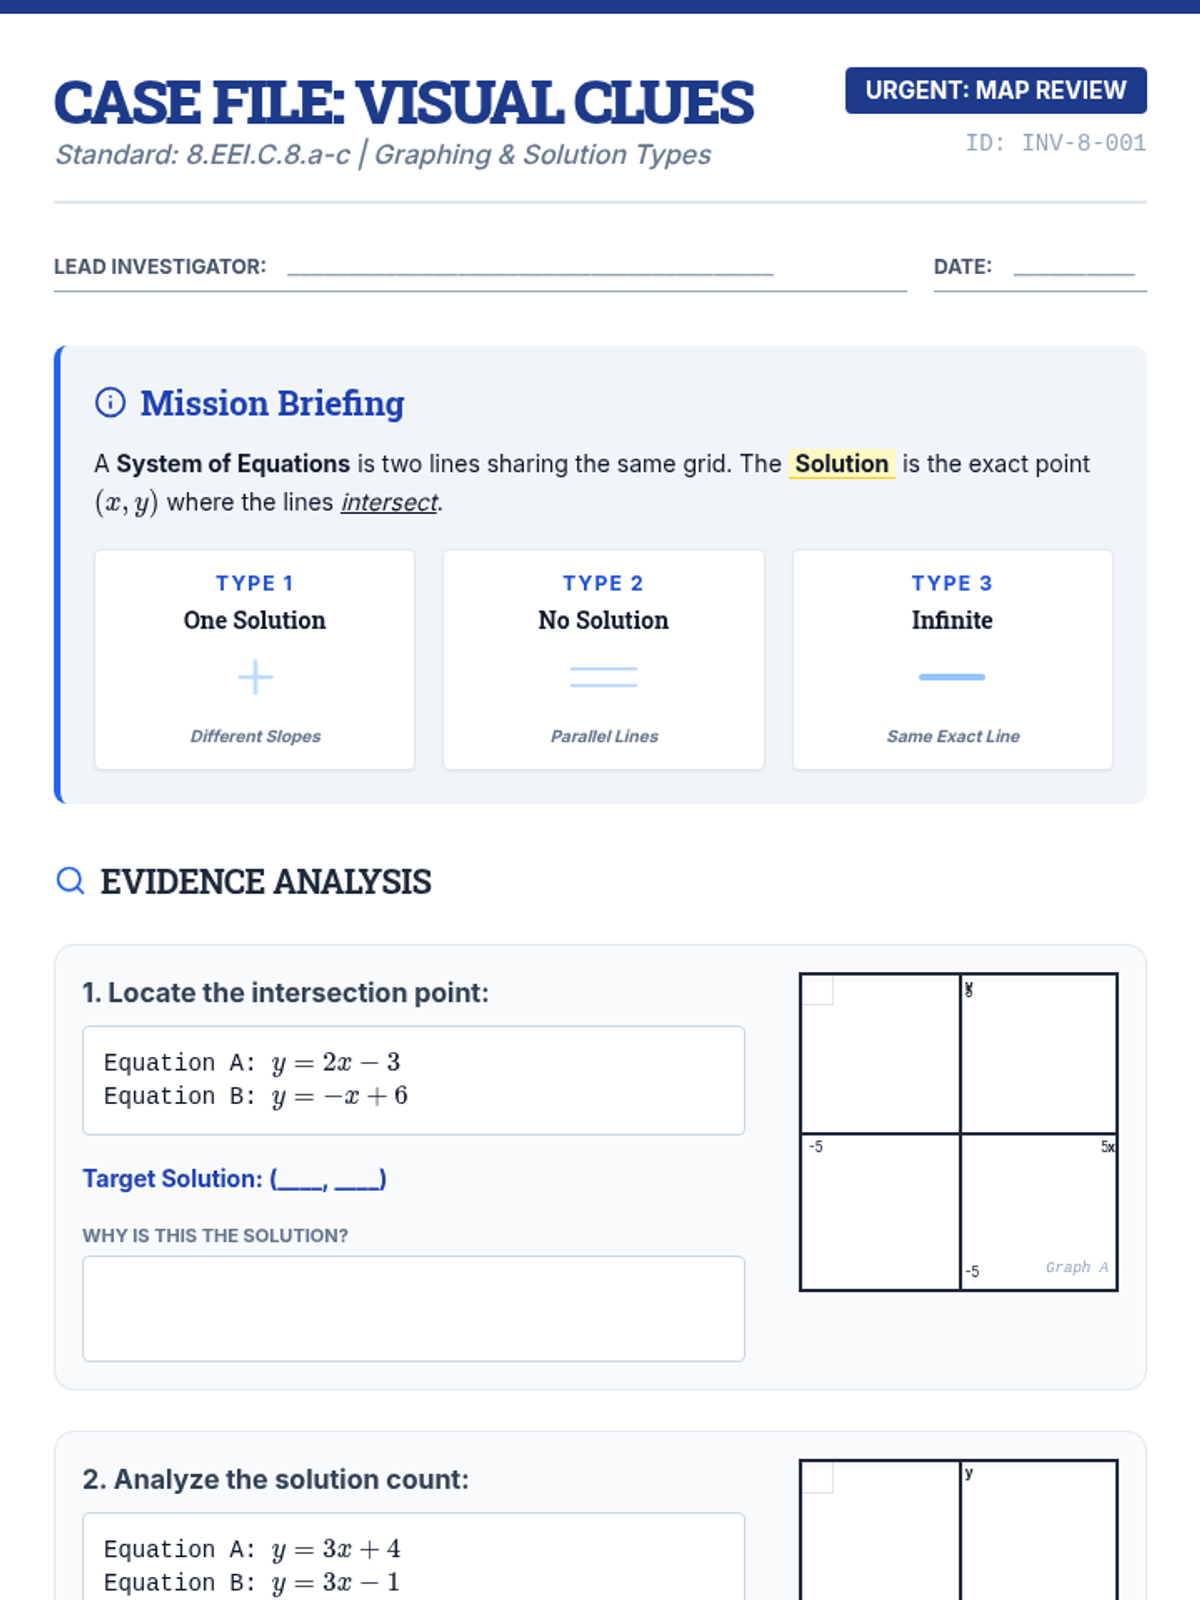
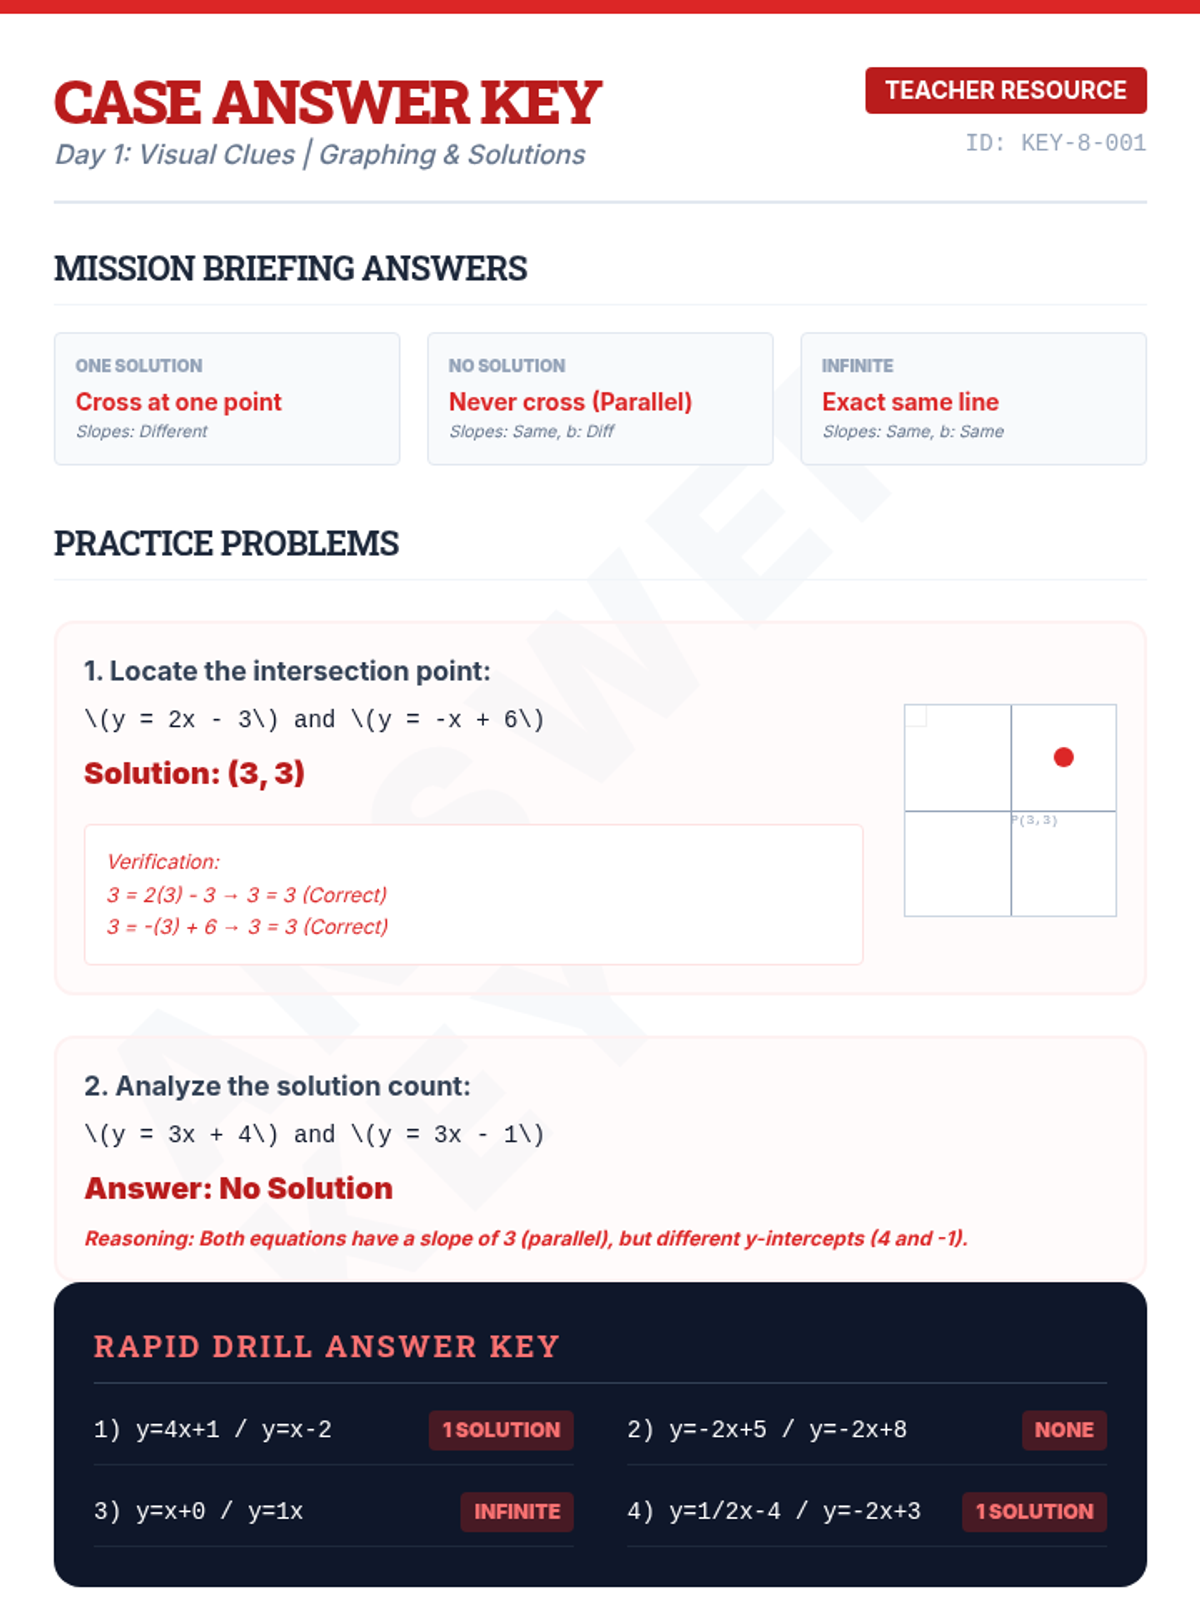
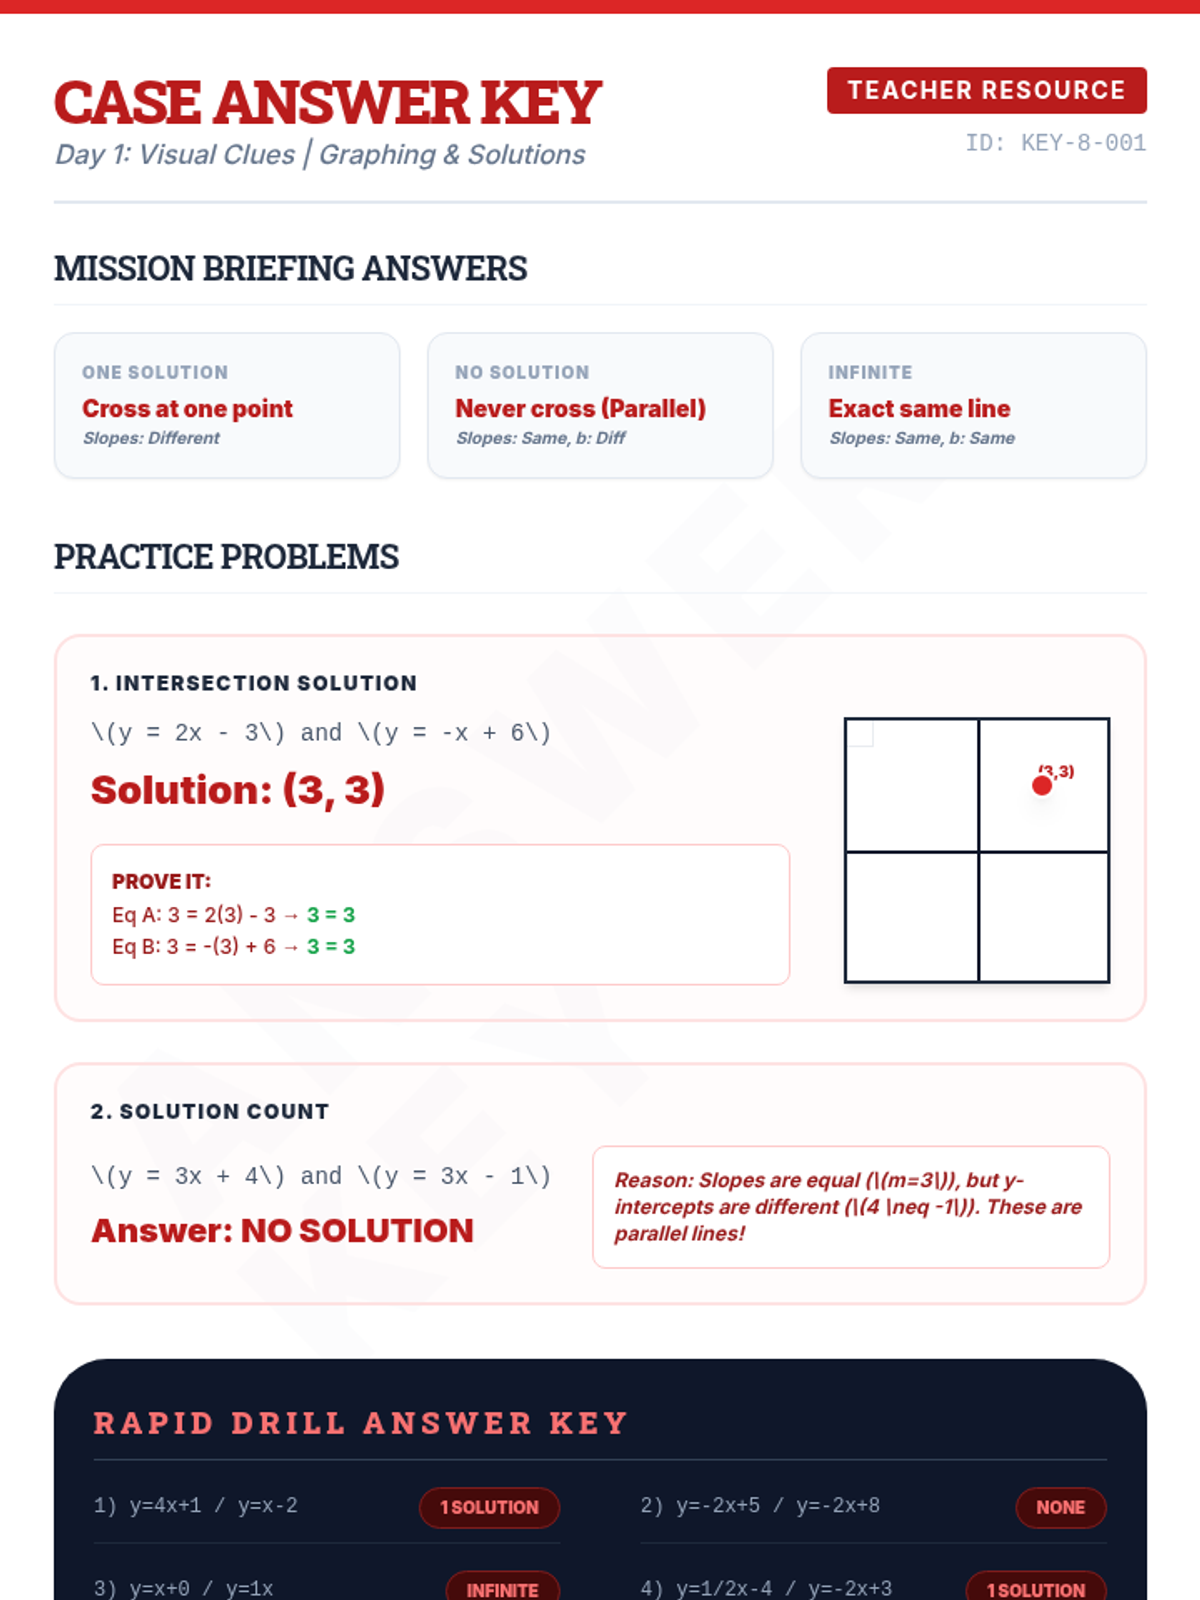
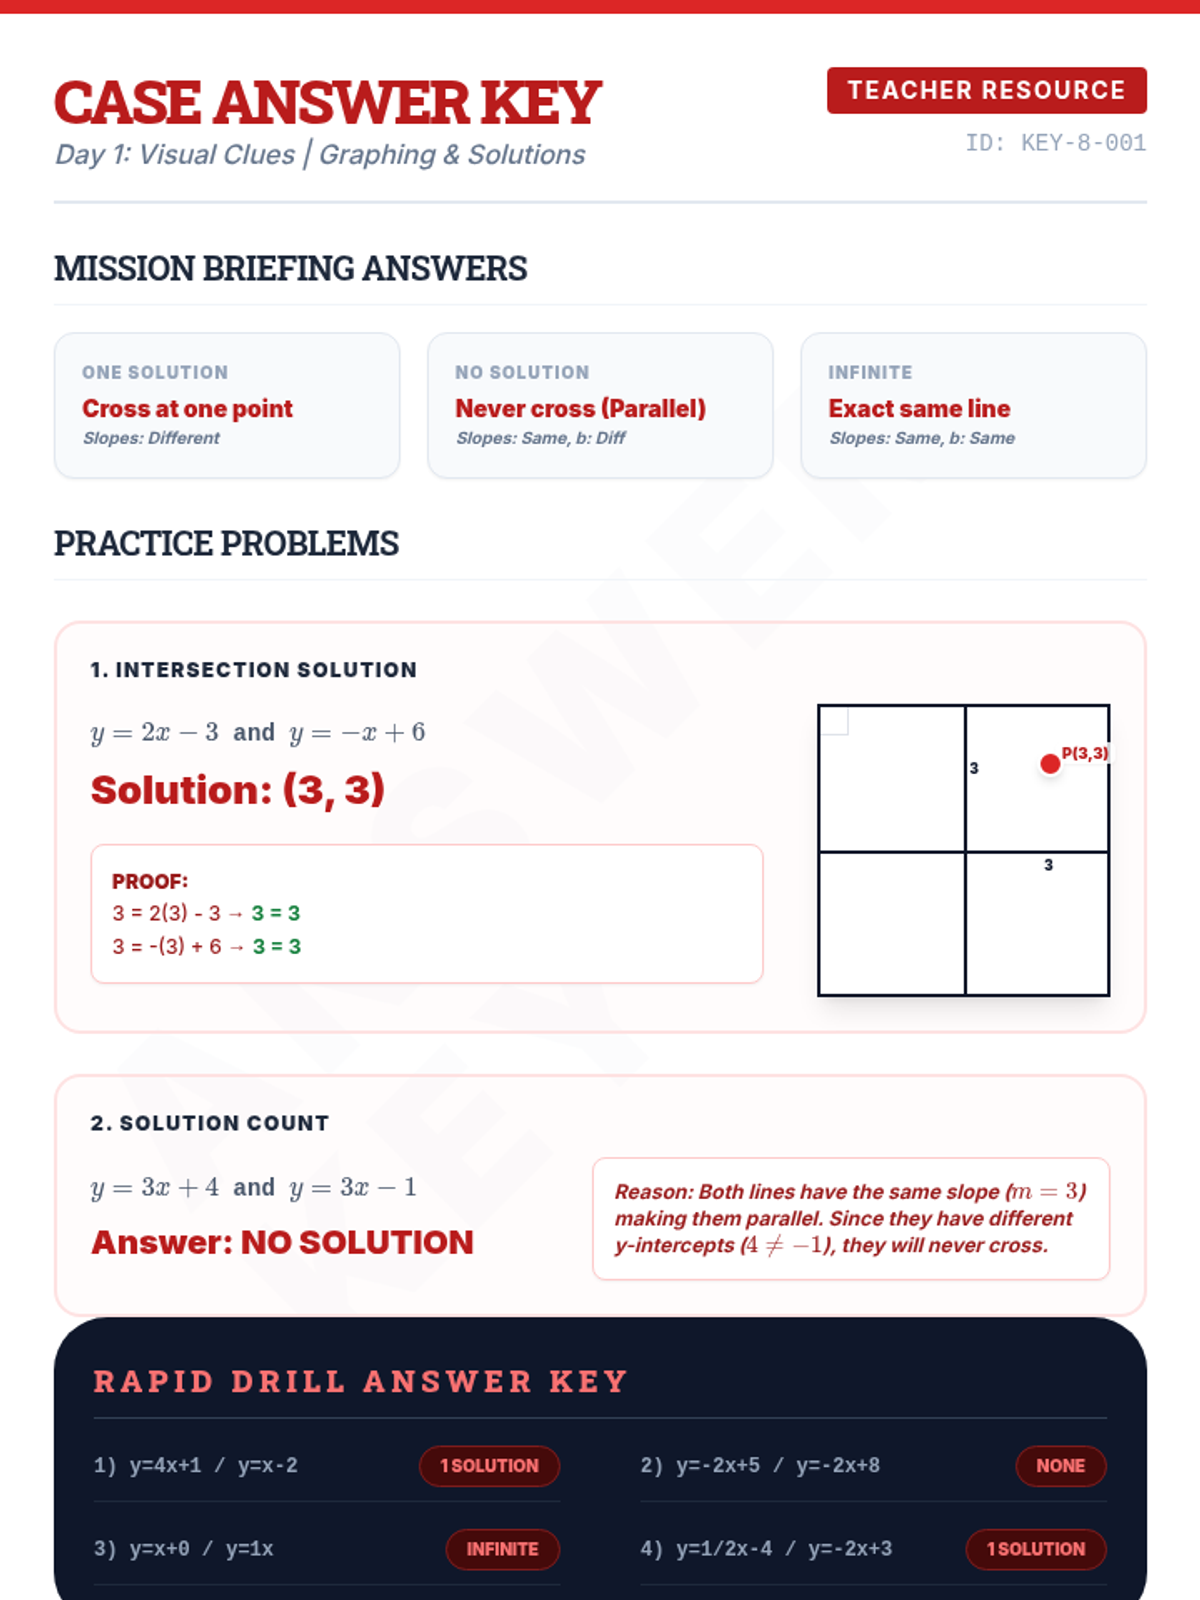
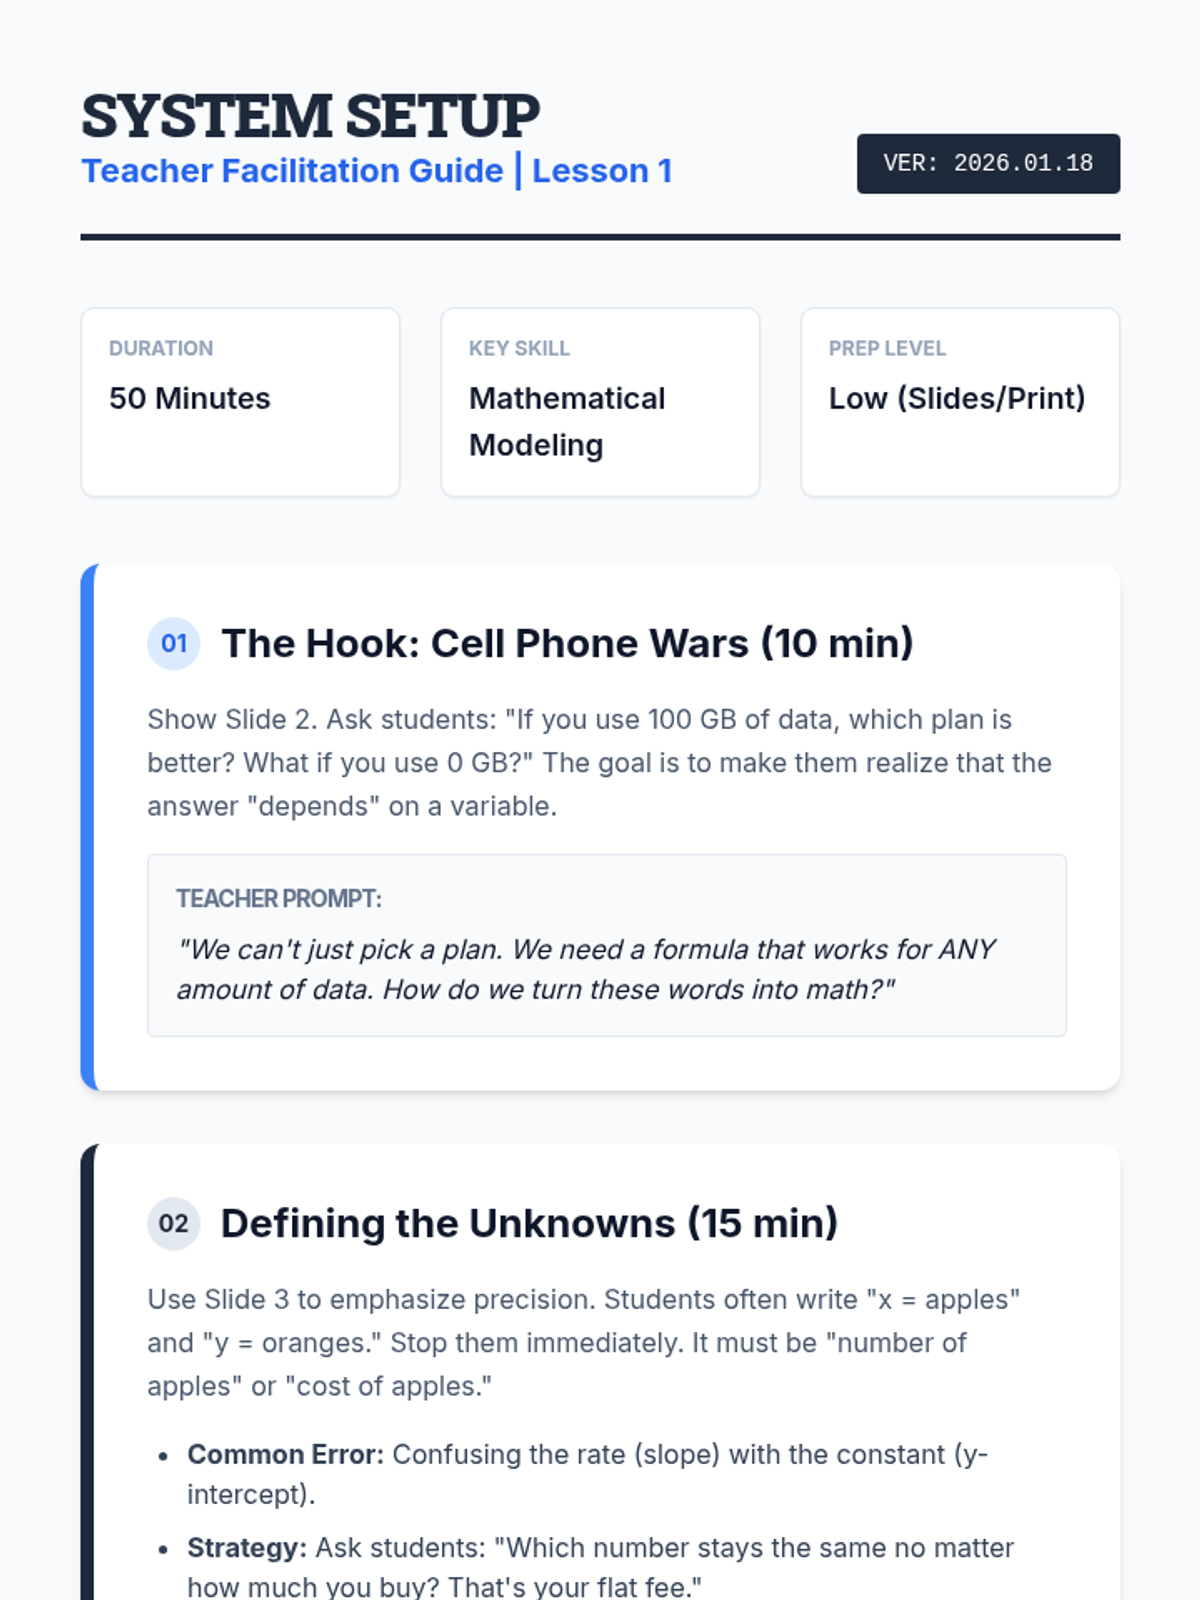
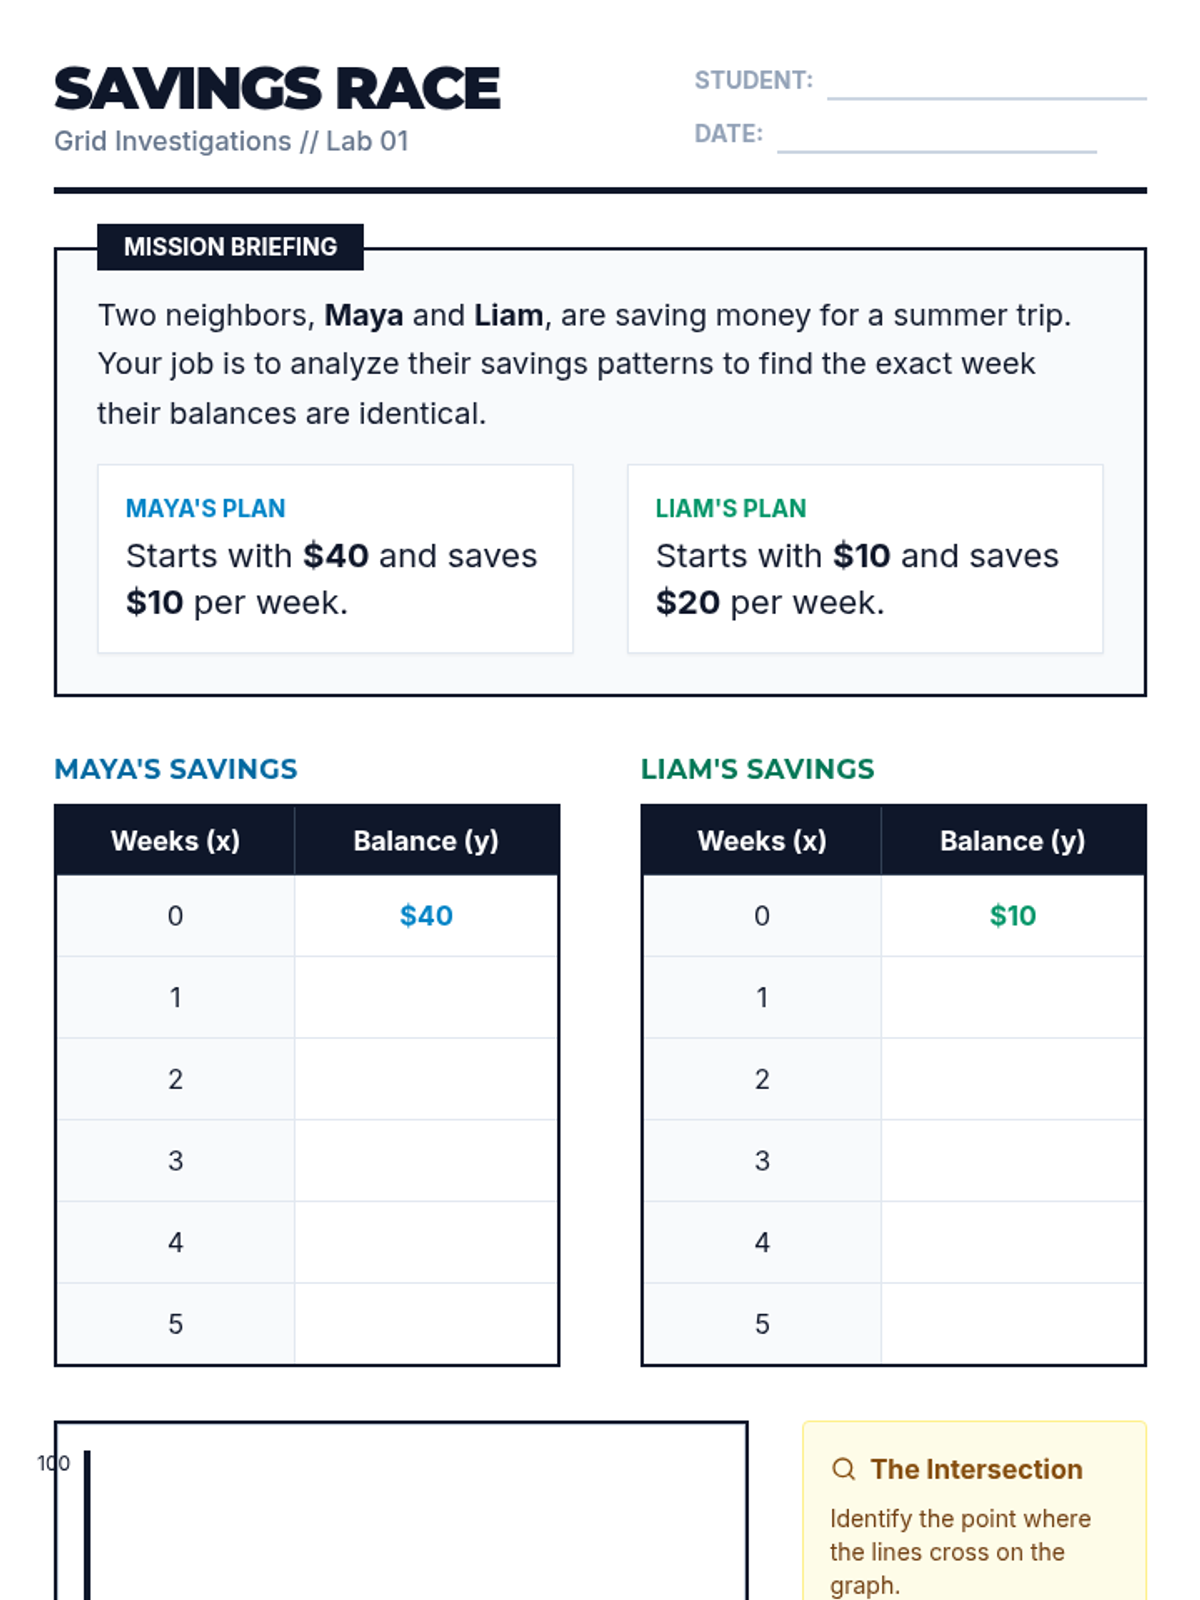
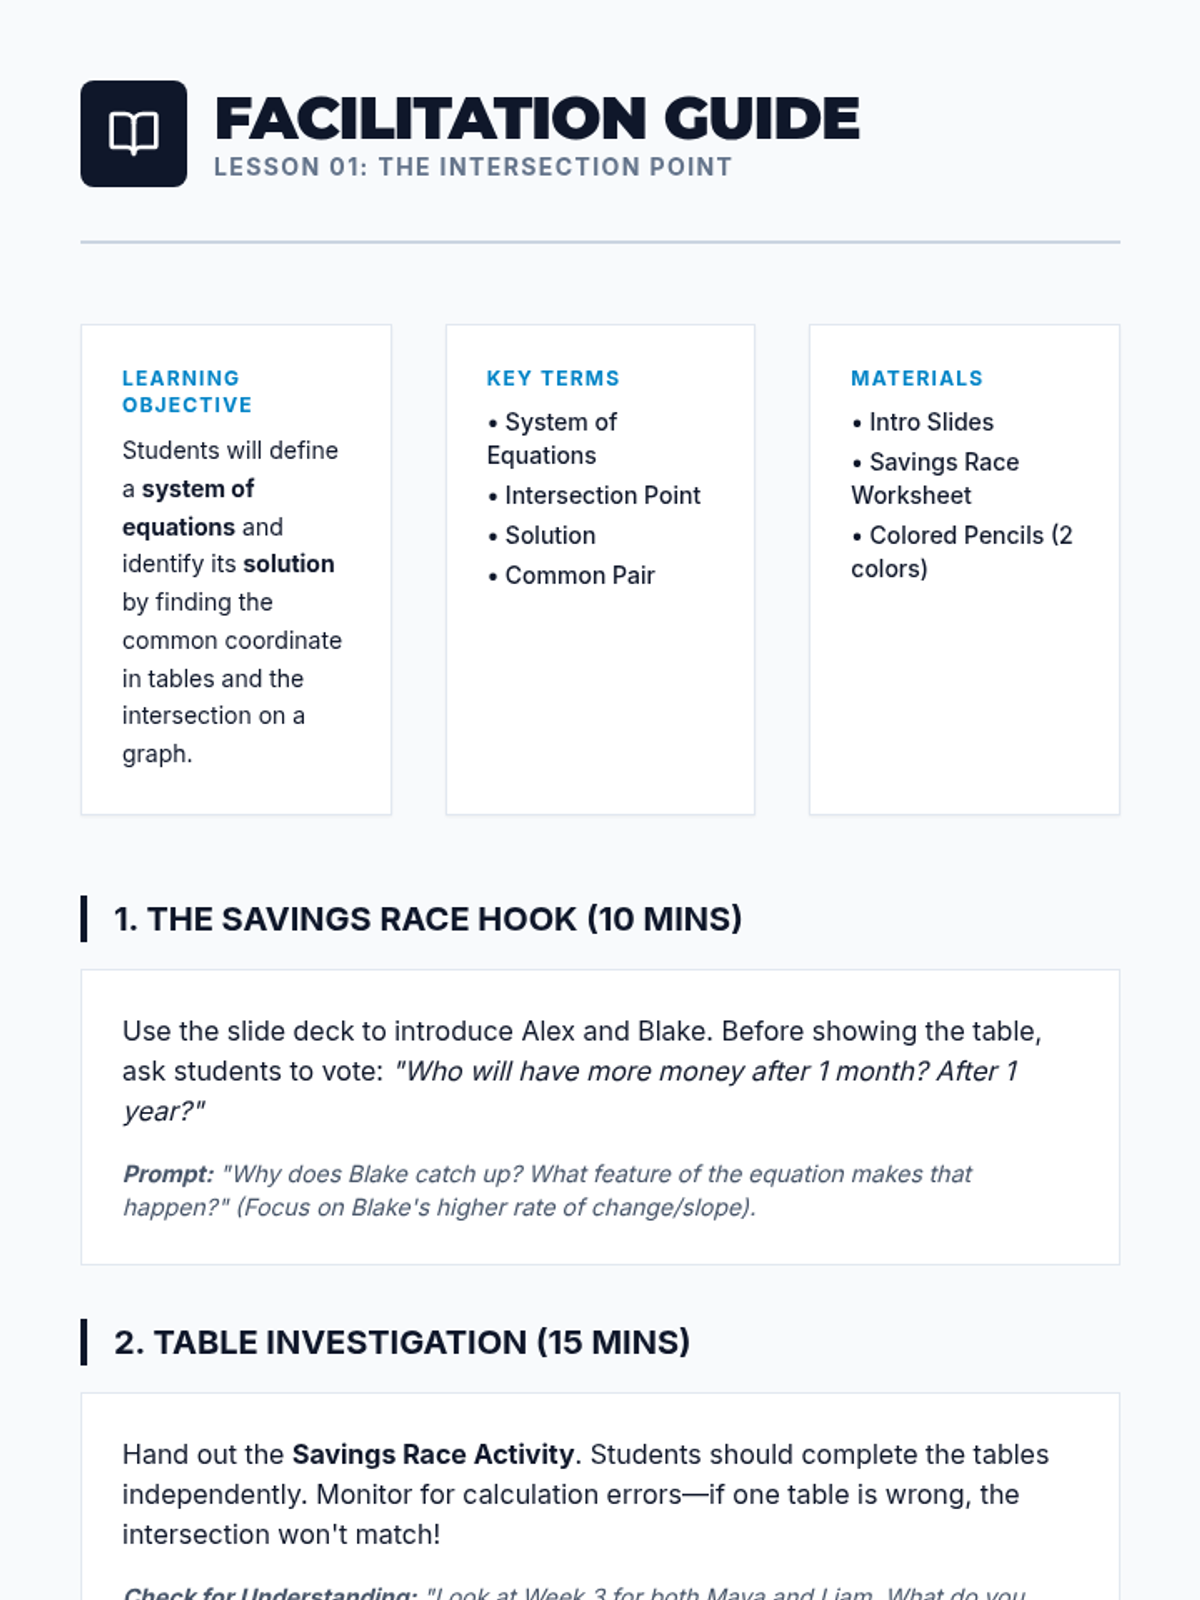
An intensive 4-day MAP review sequence for 8th grade students focusing on solving systems of linear equations using graphing, substitution, elimination, and real-world applications. The theme 'Intersection Investigators' uses a detective motif to make algebraic concepts engaging and accessible for reteaching.
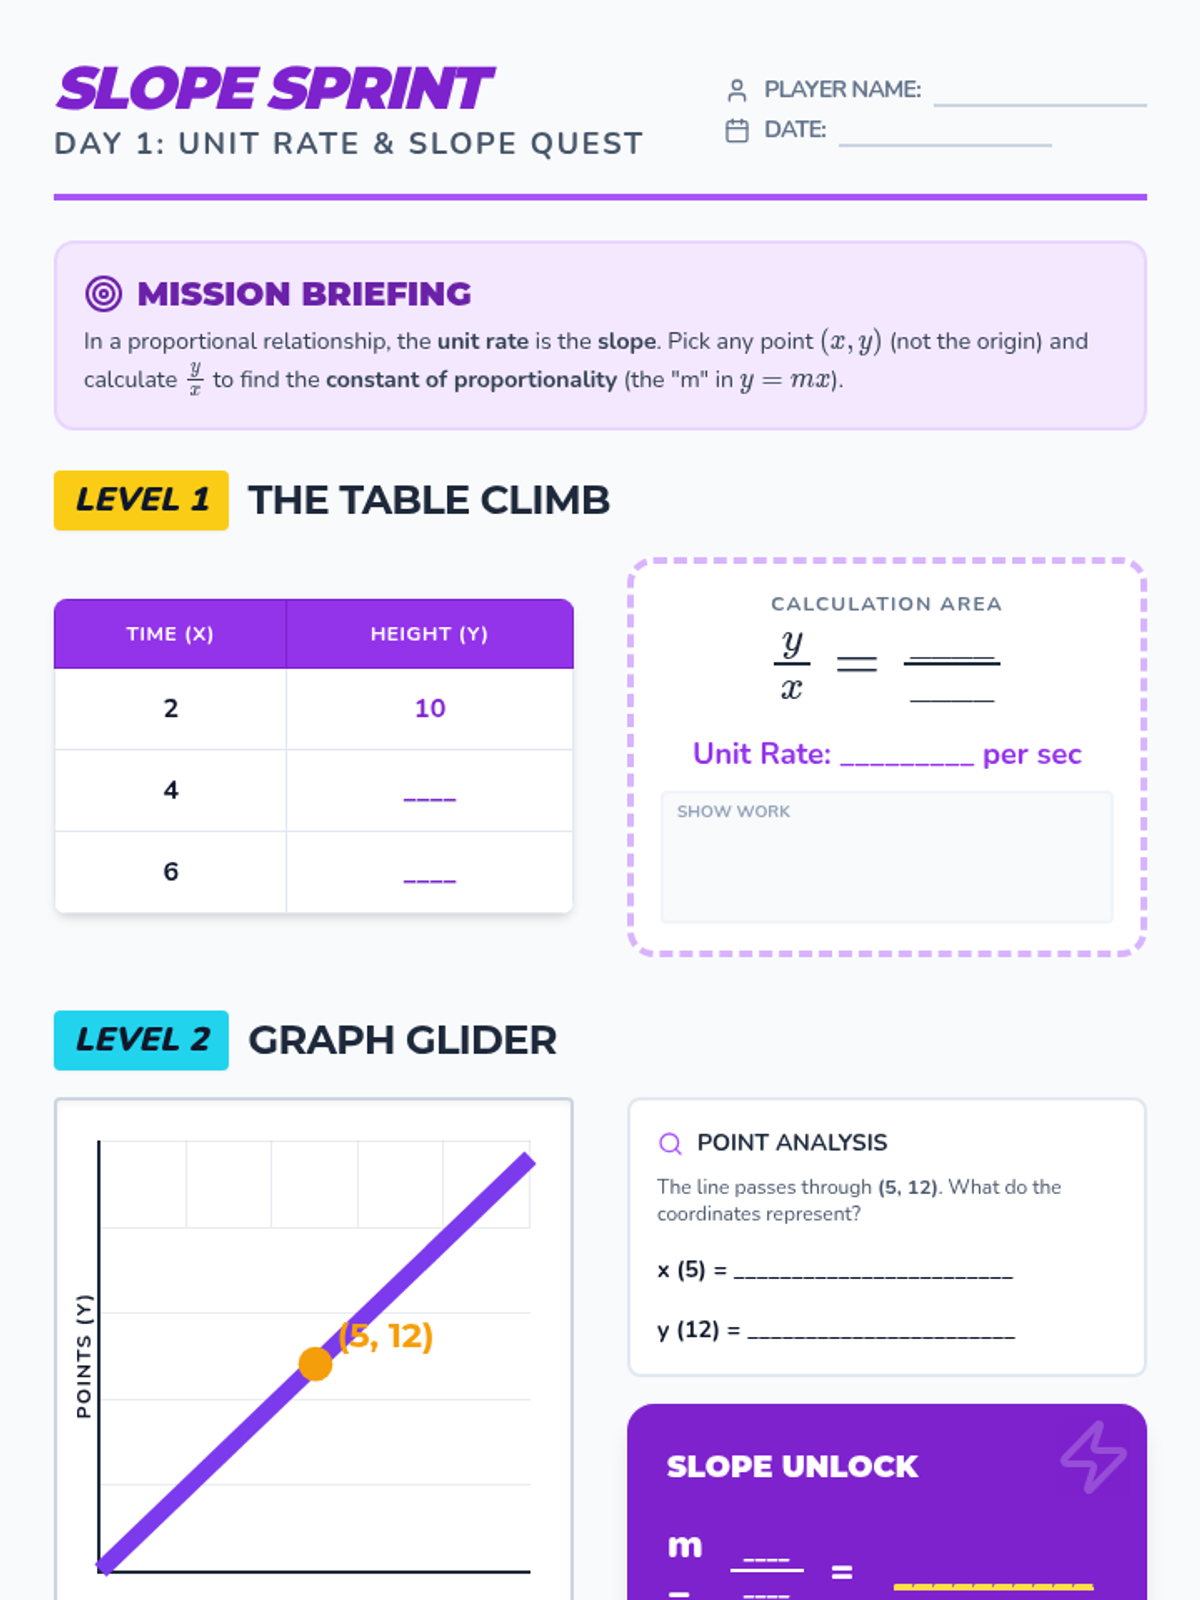
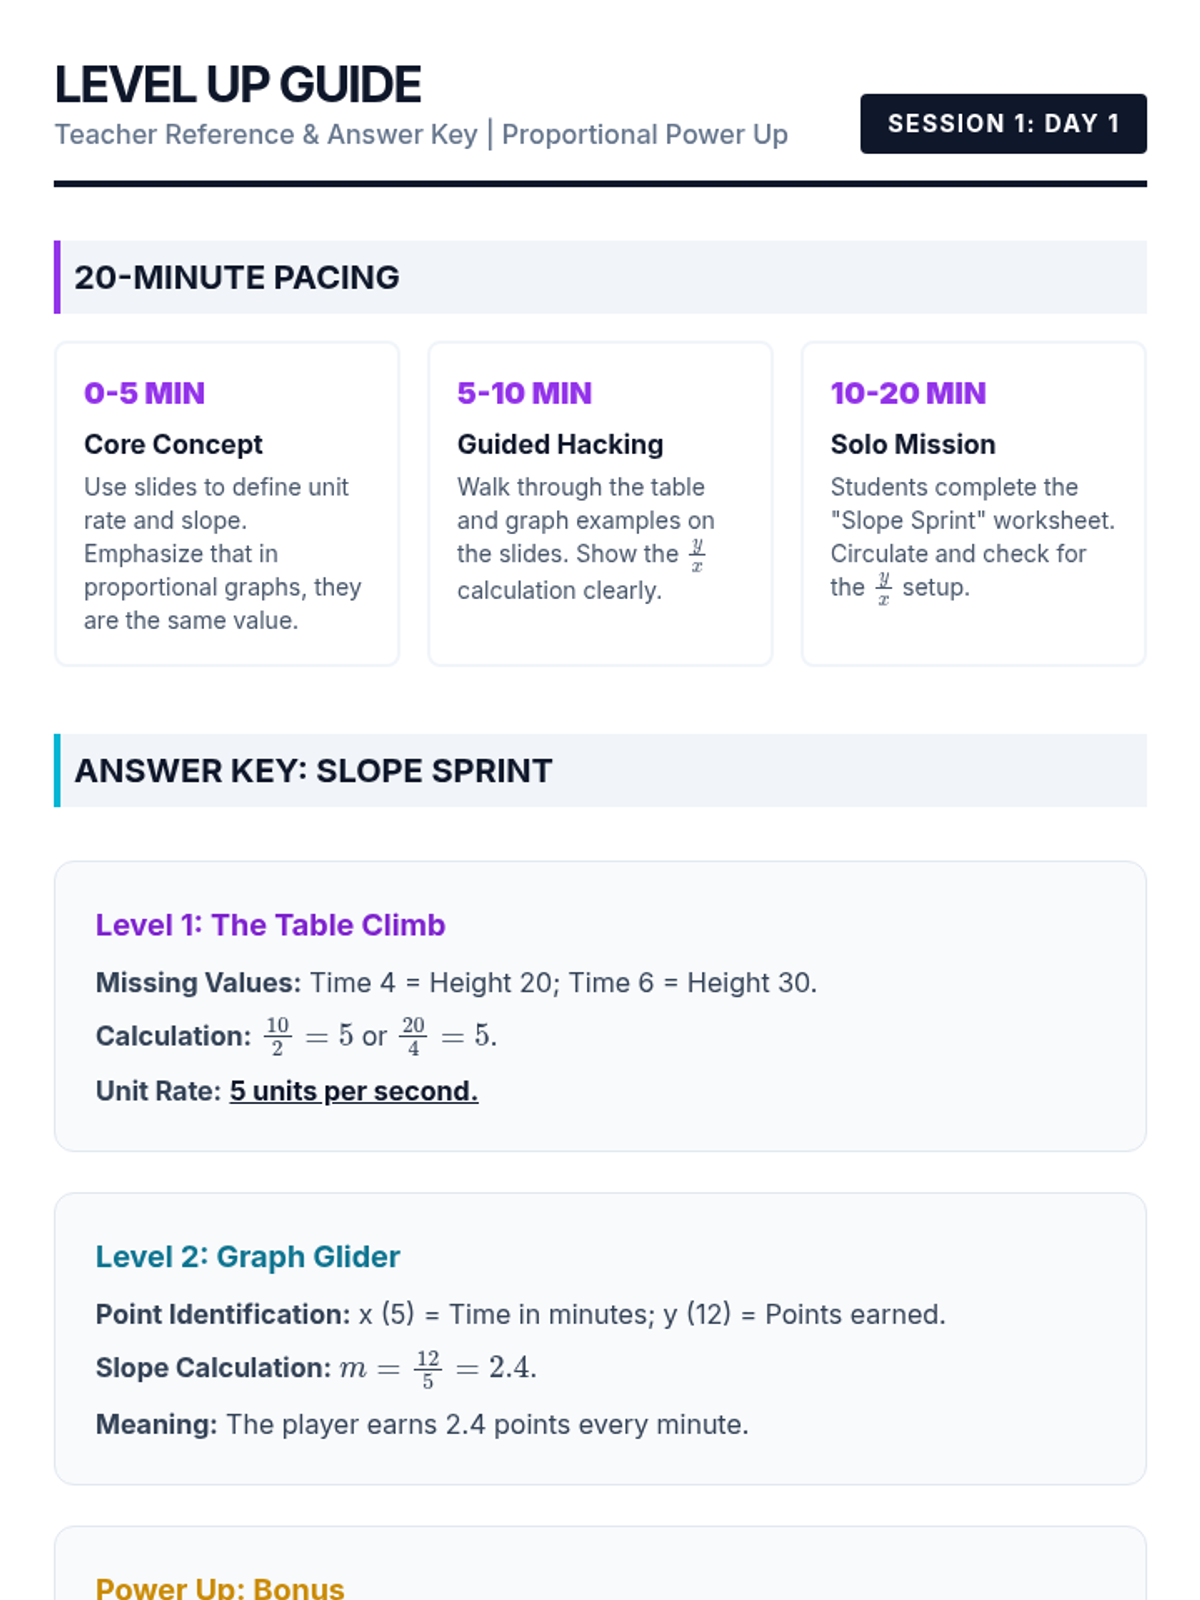
A 4-day intensive tutoring sequence for 8th-grade Missouri MAP review, focusing on graphing proportional relationships, unit rate as slope, and comparing multiple representations. Designed for 20-minute high-impact sessions using a retro-gaming theme.
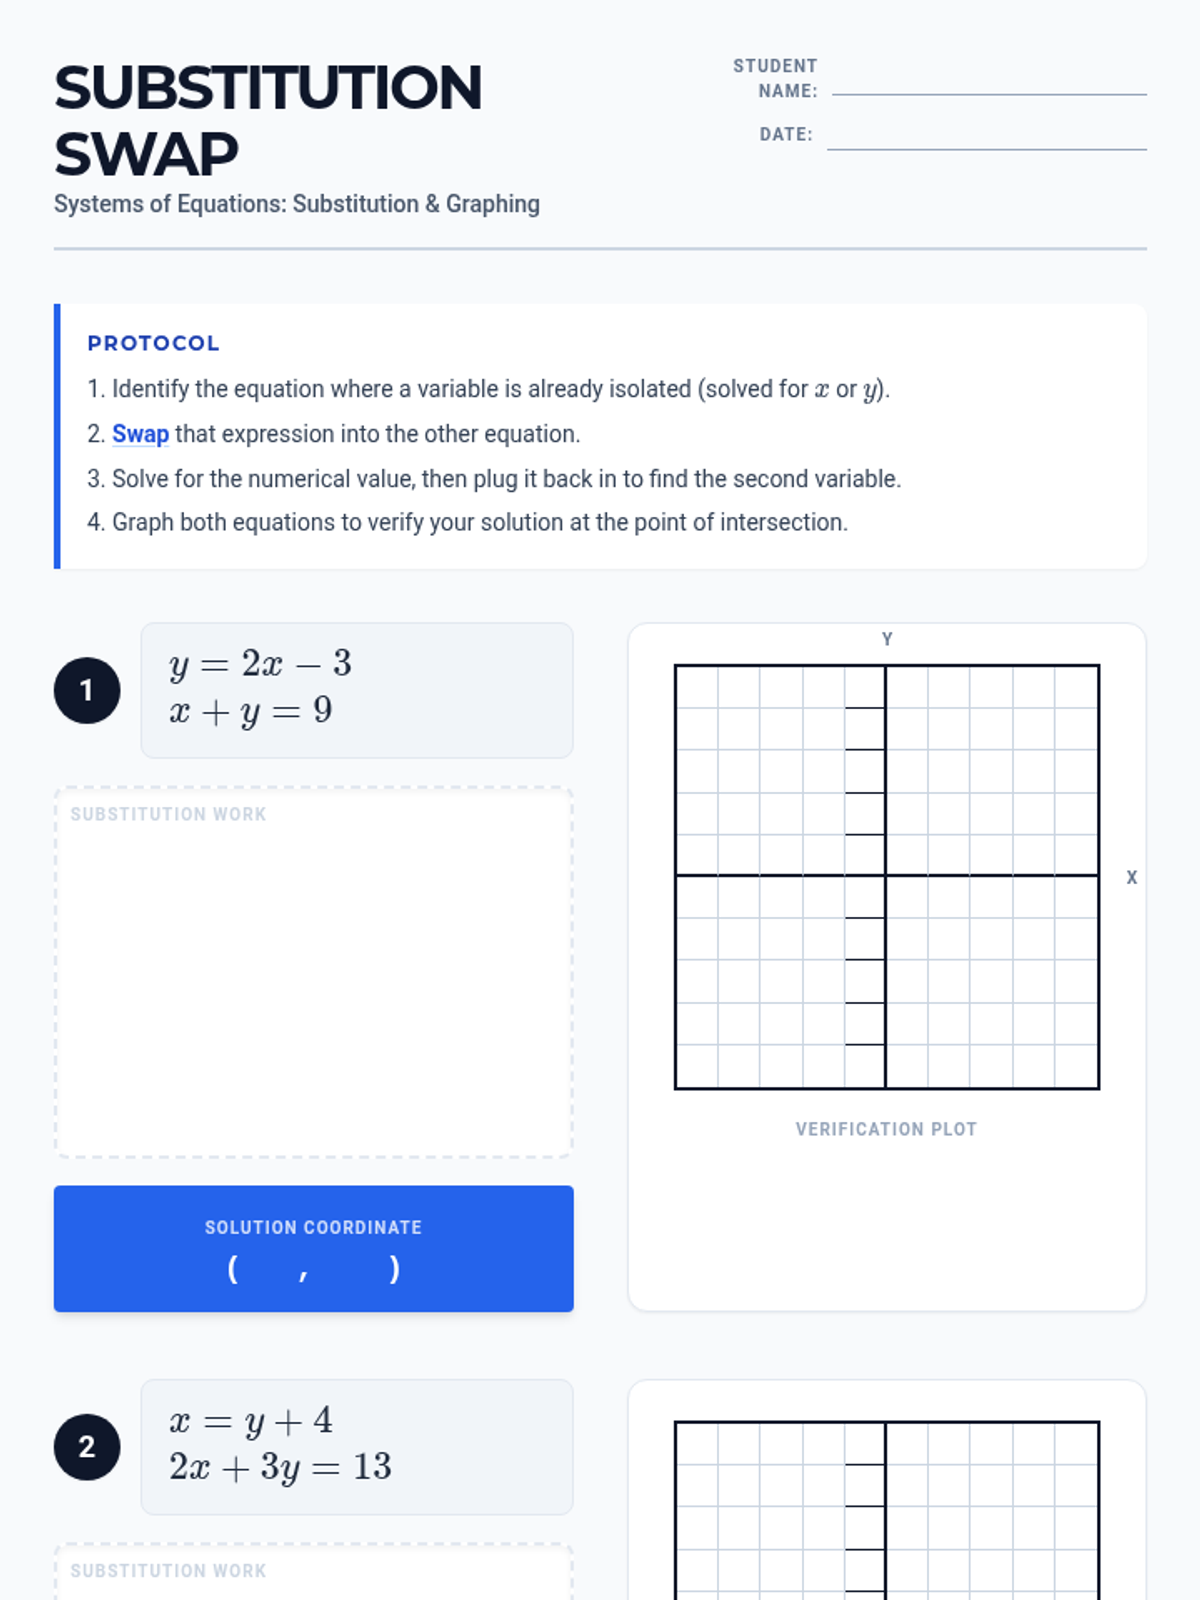
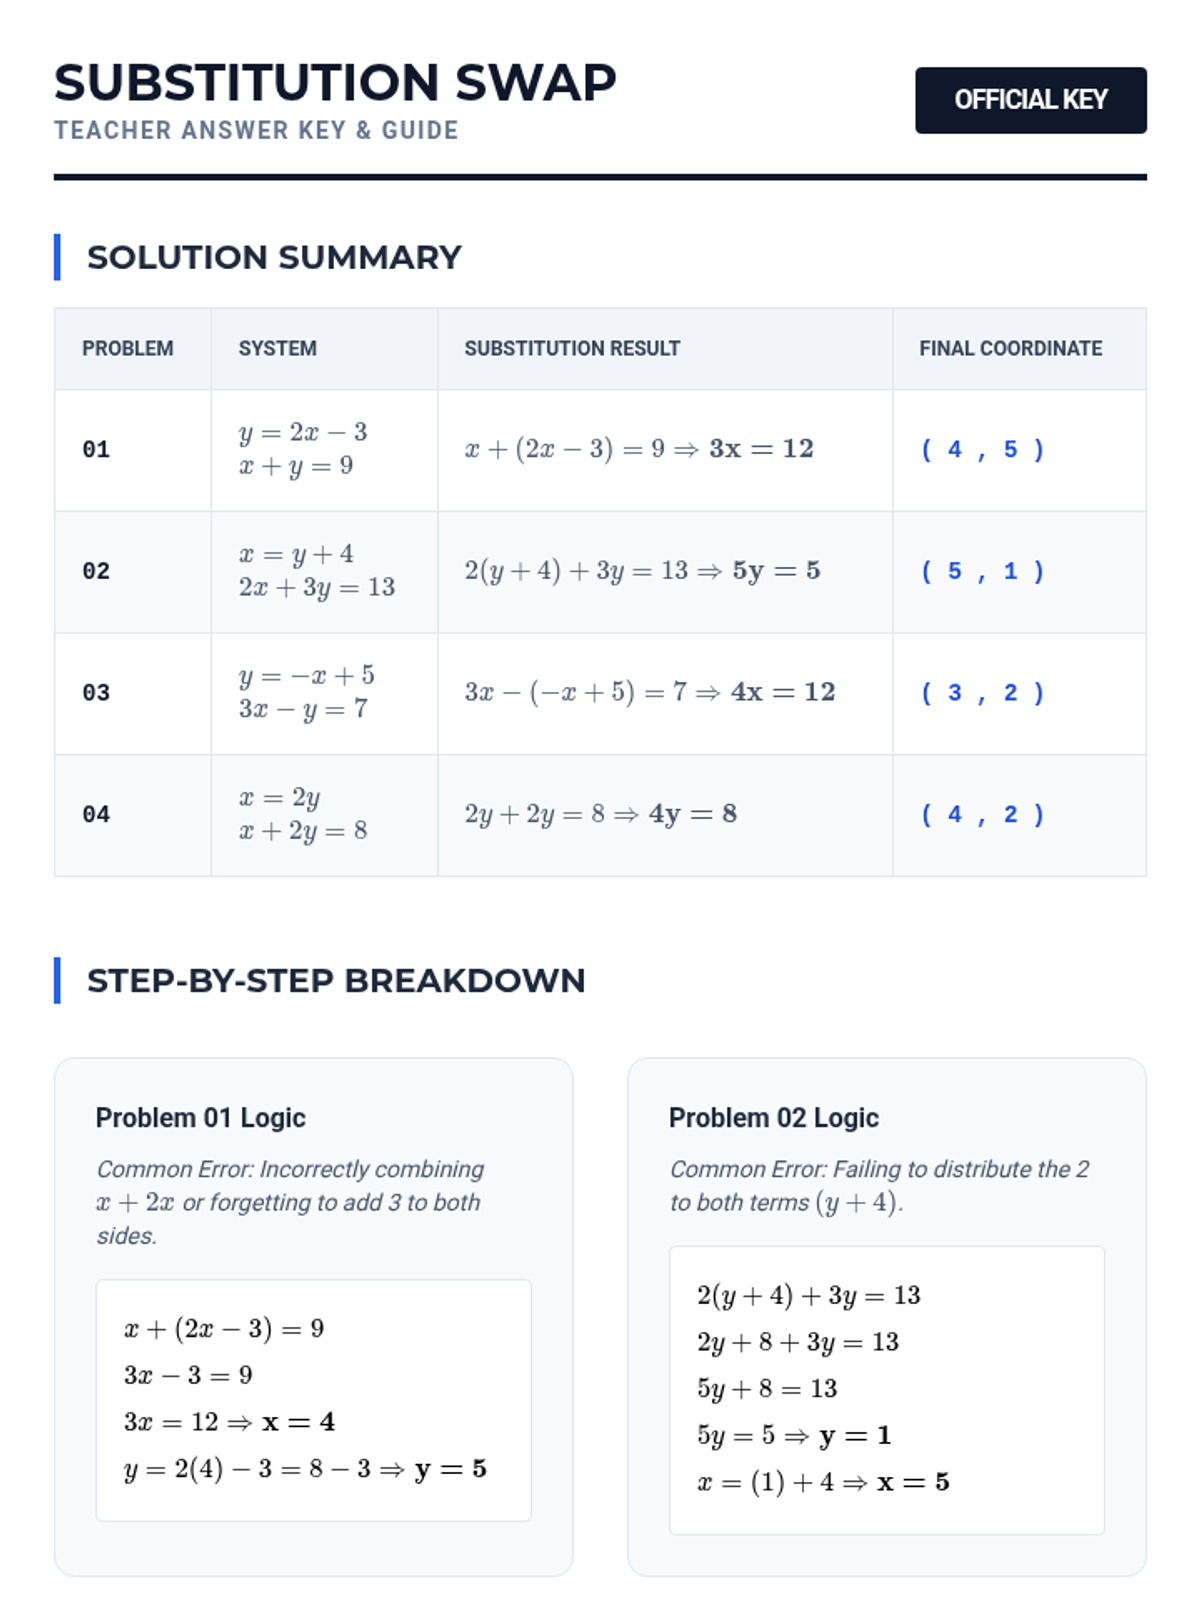
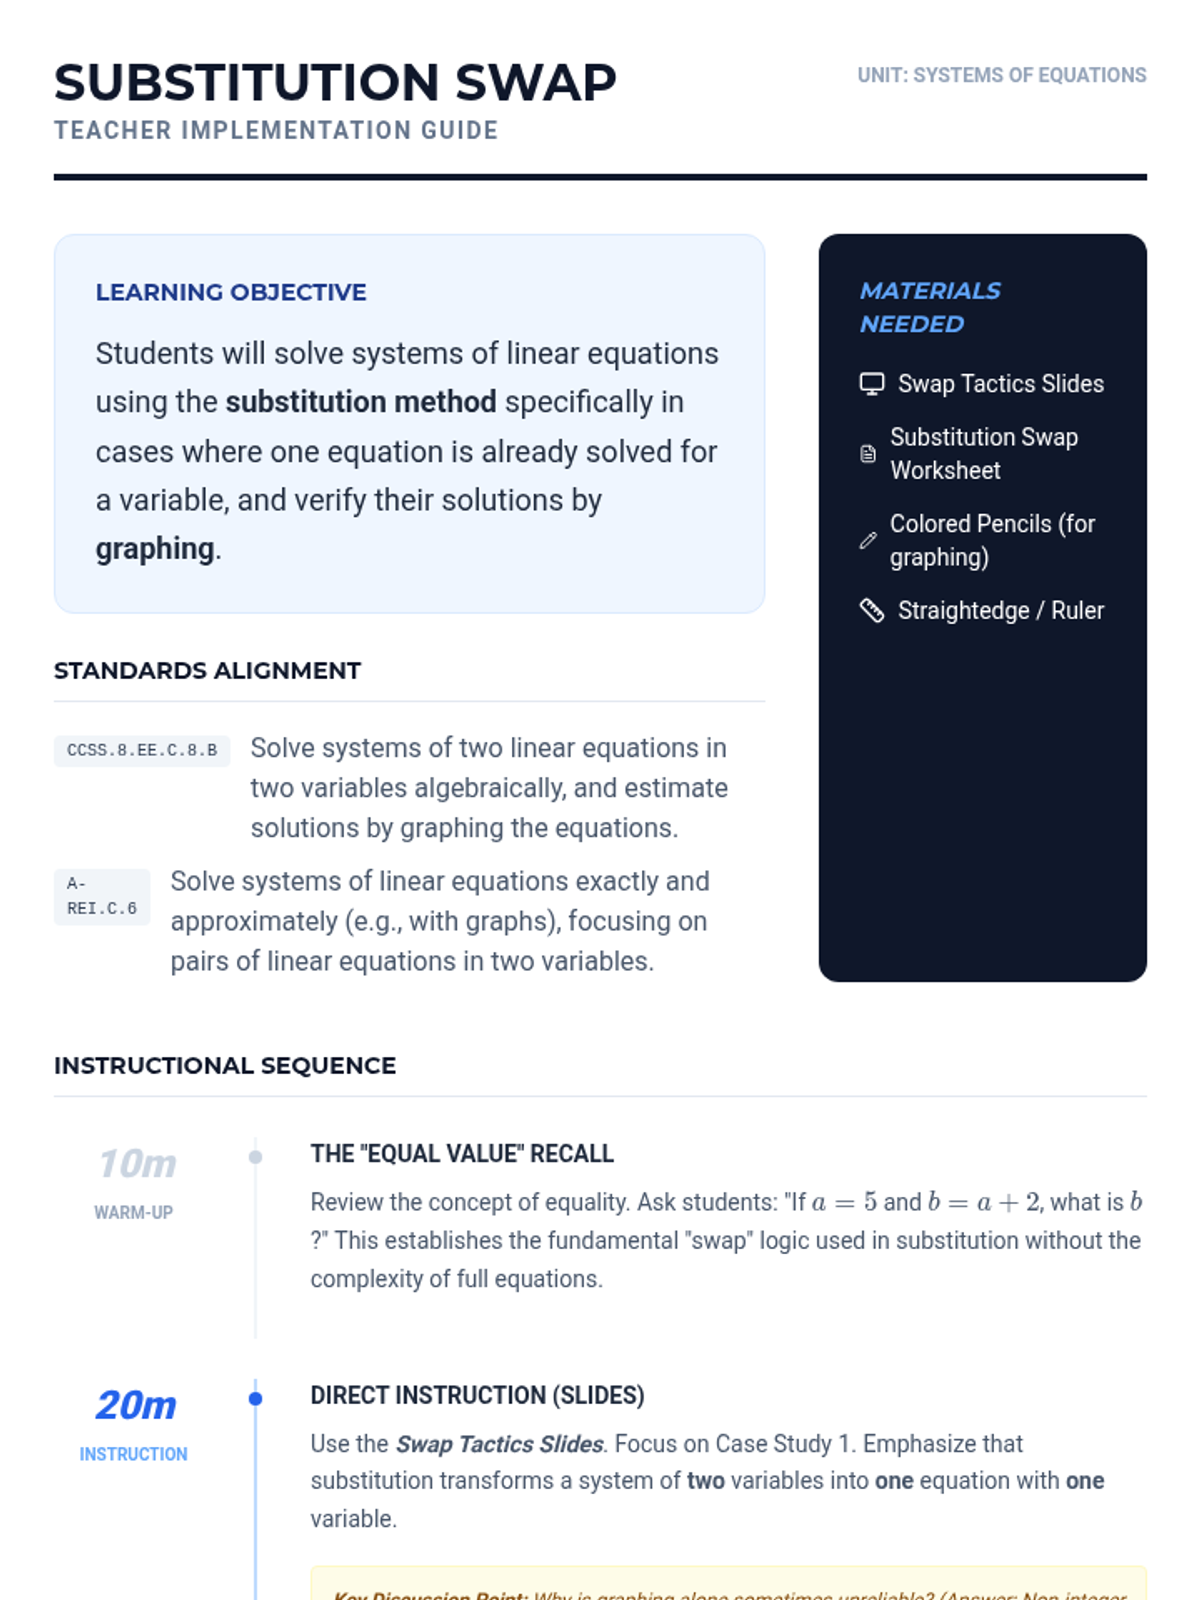
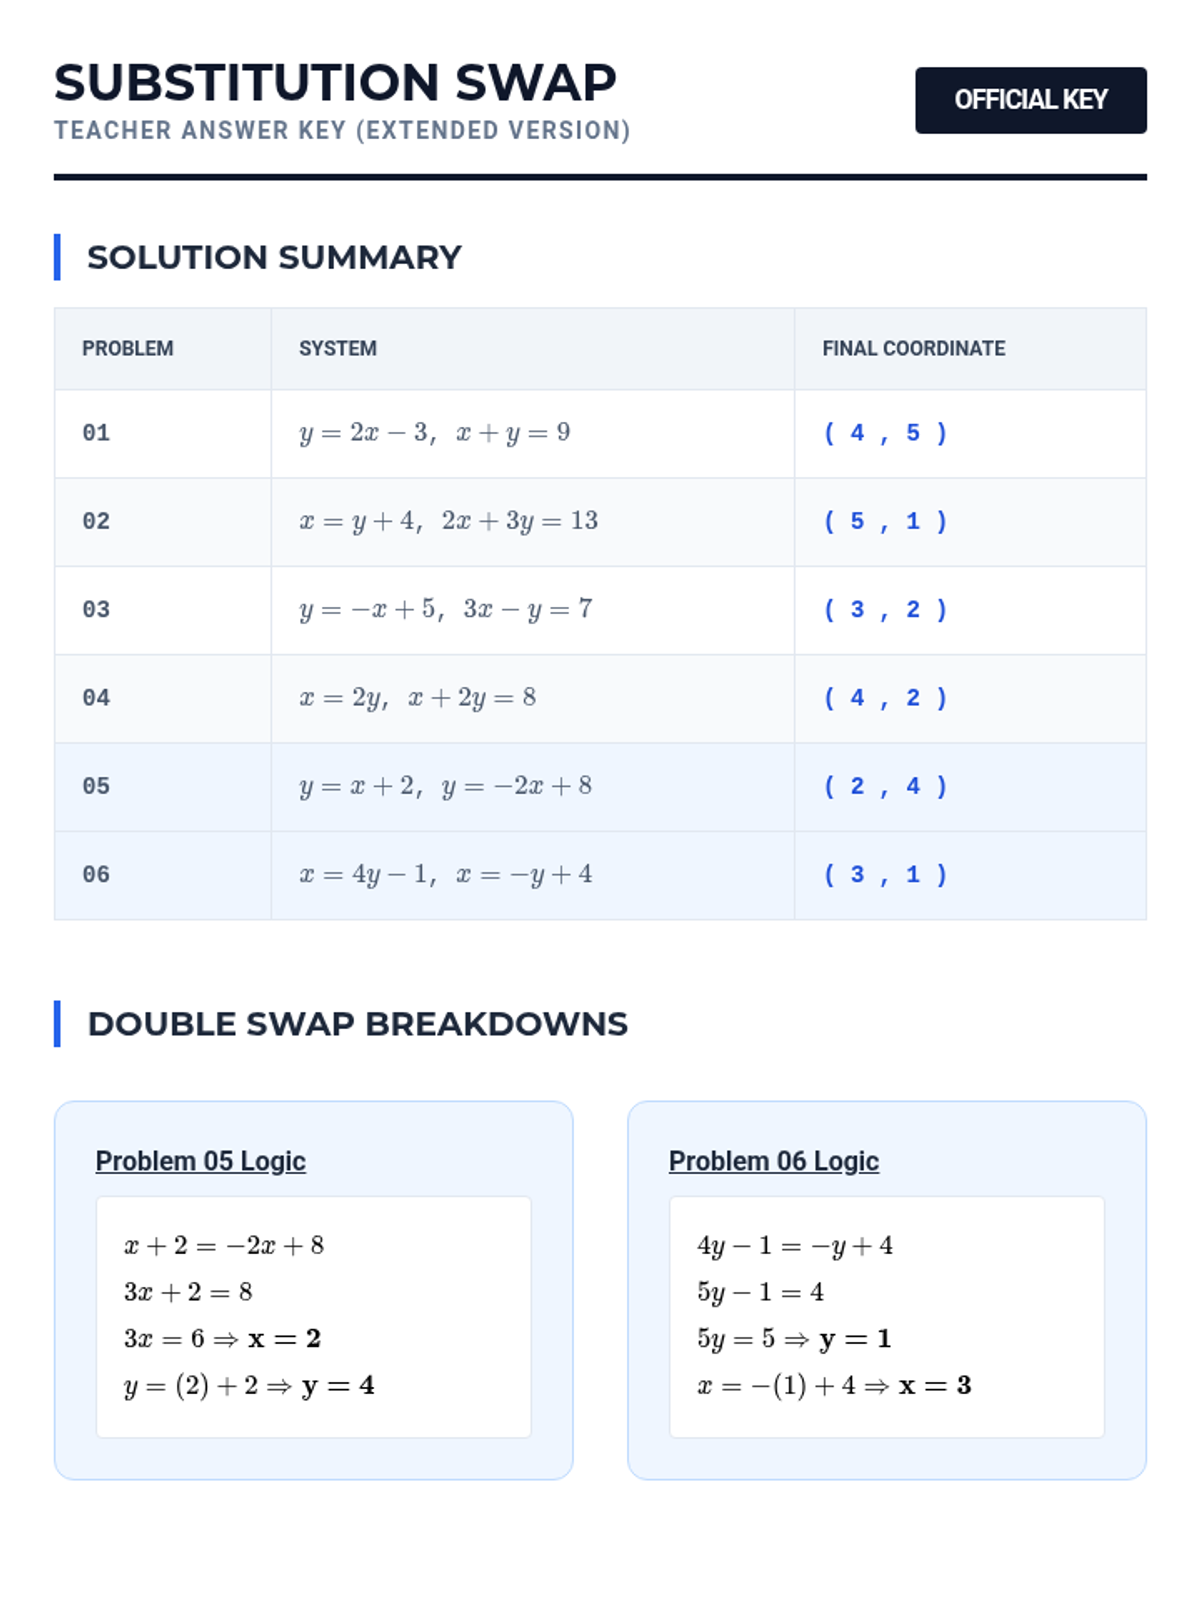
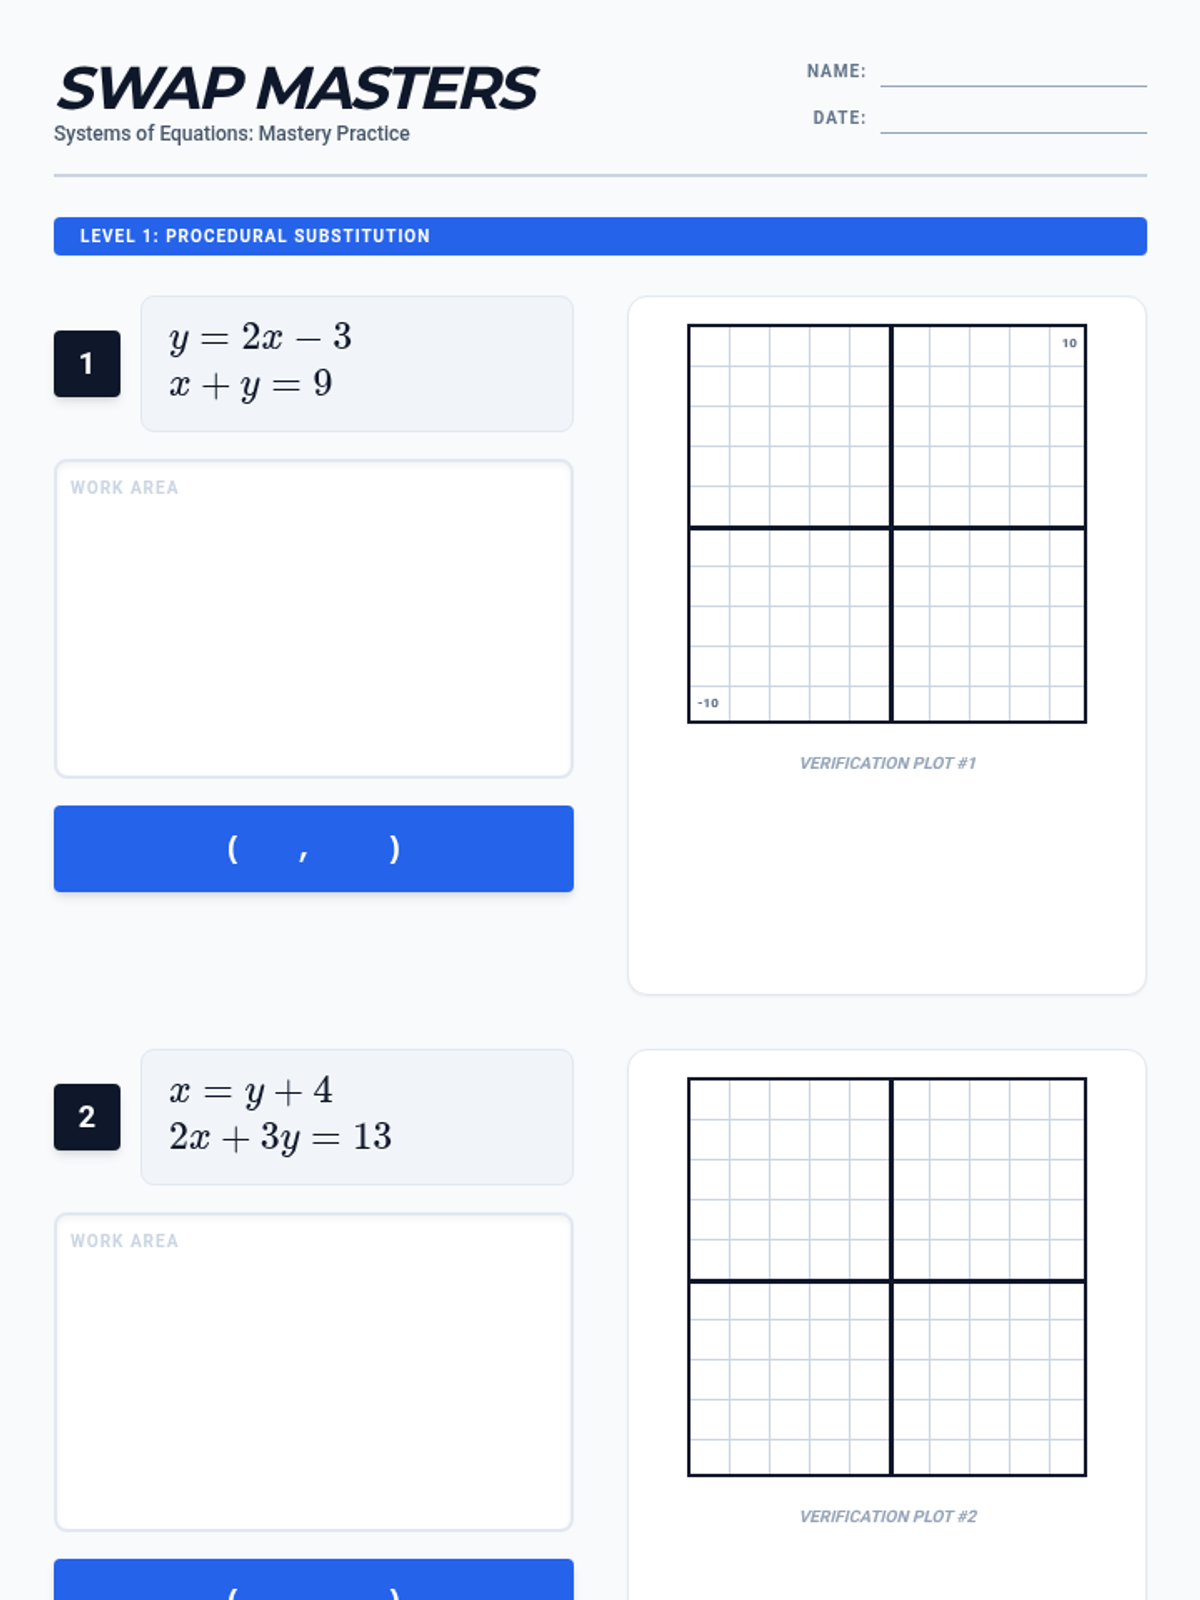
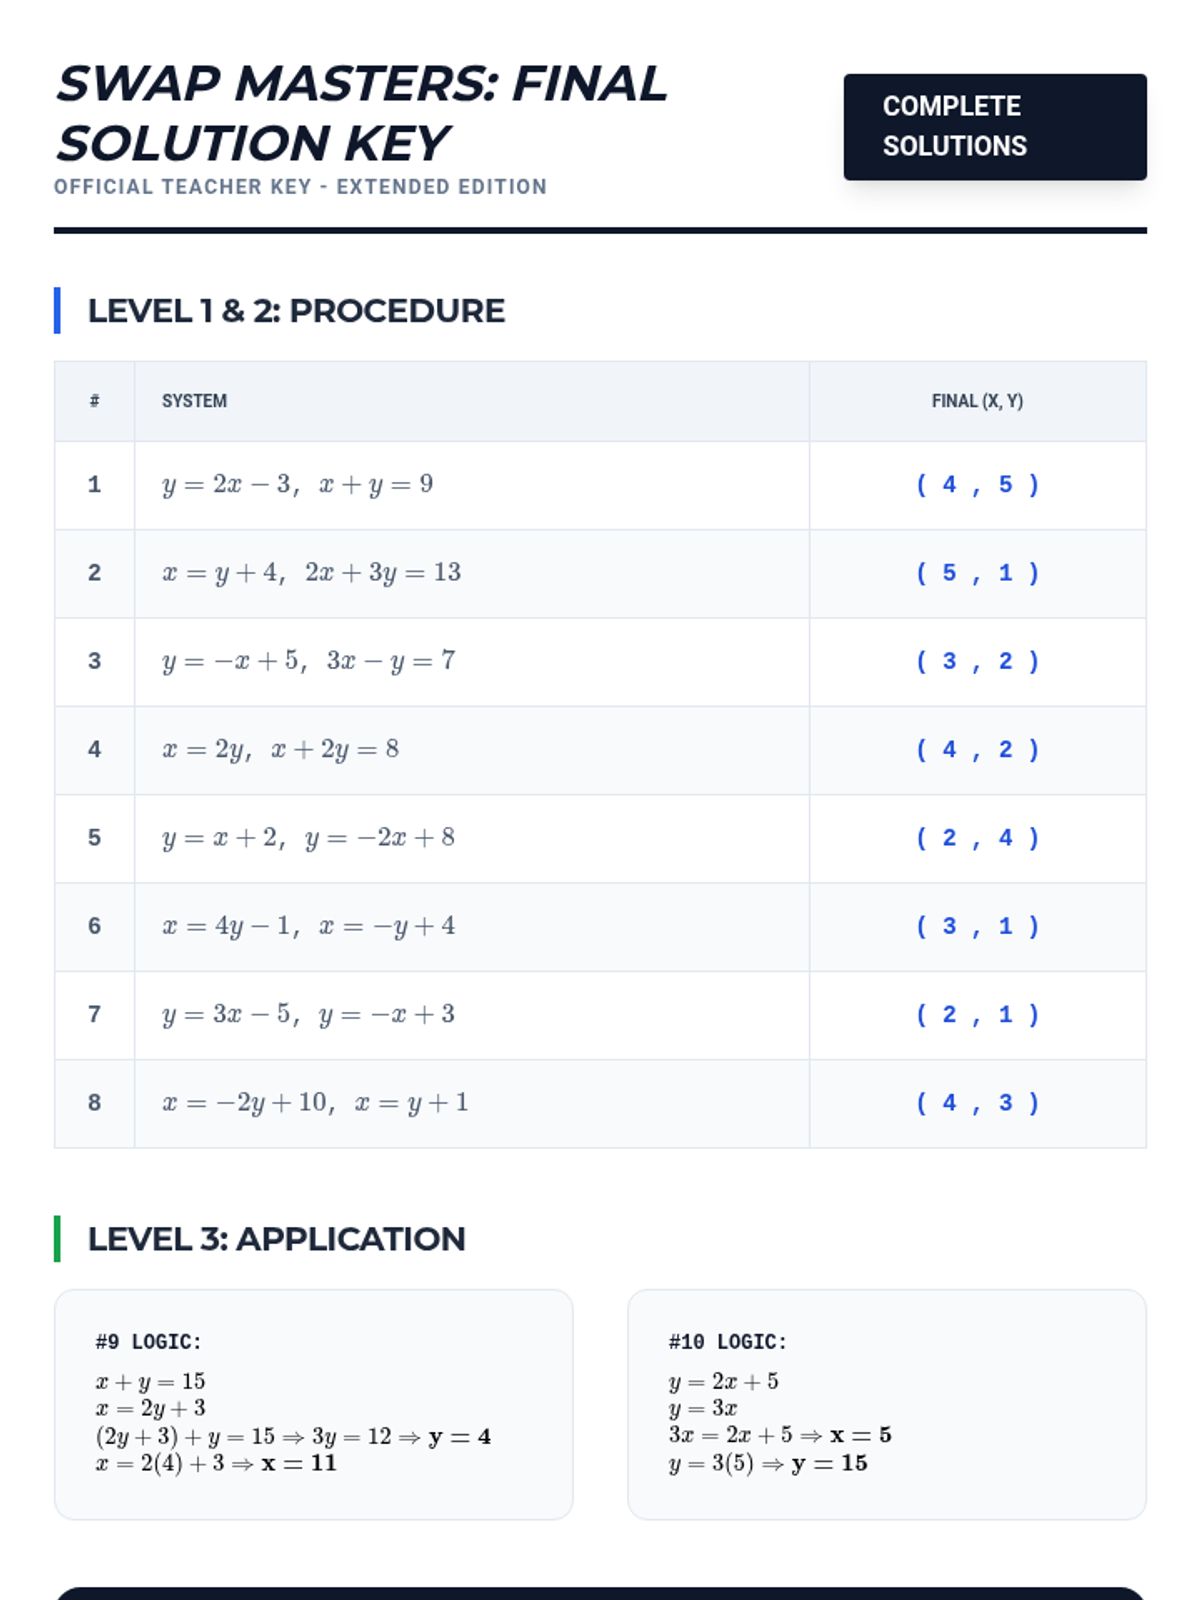
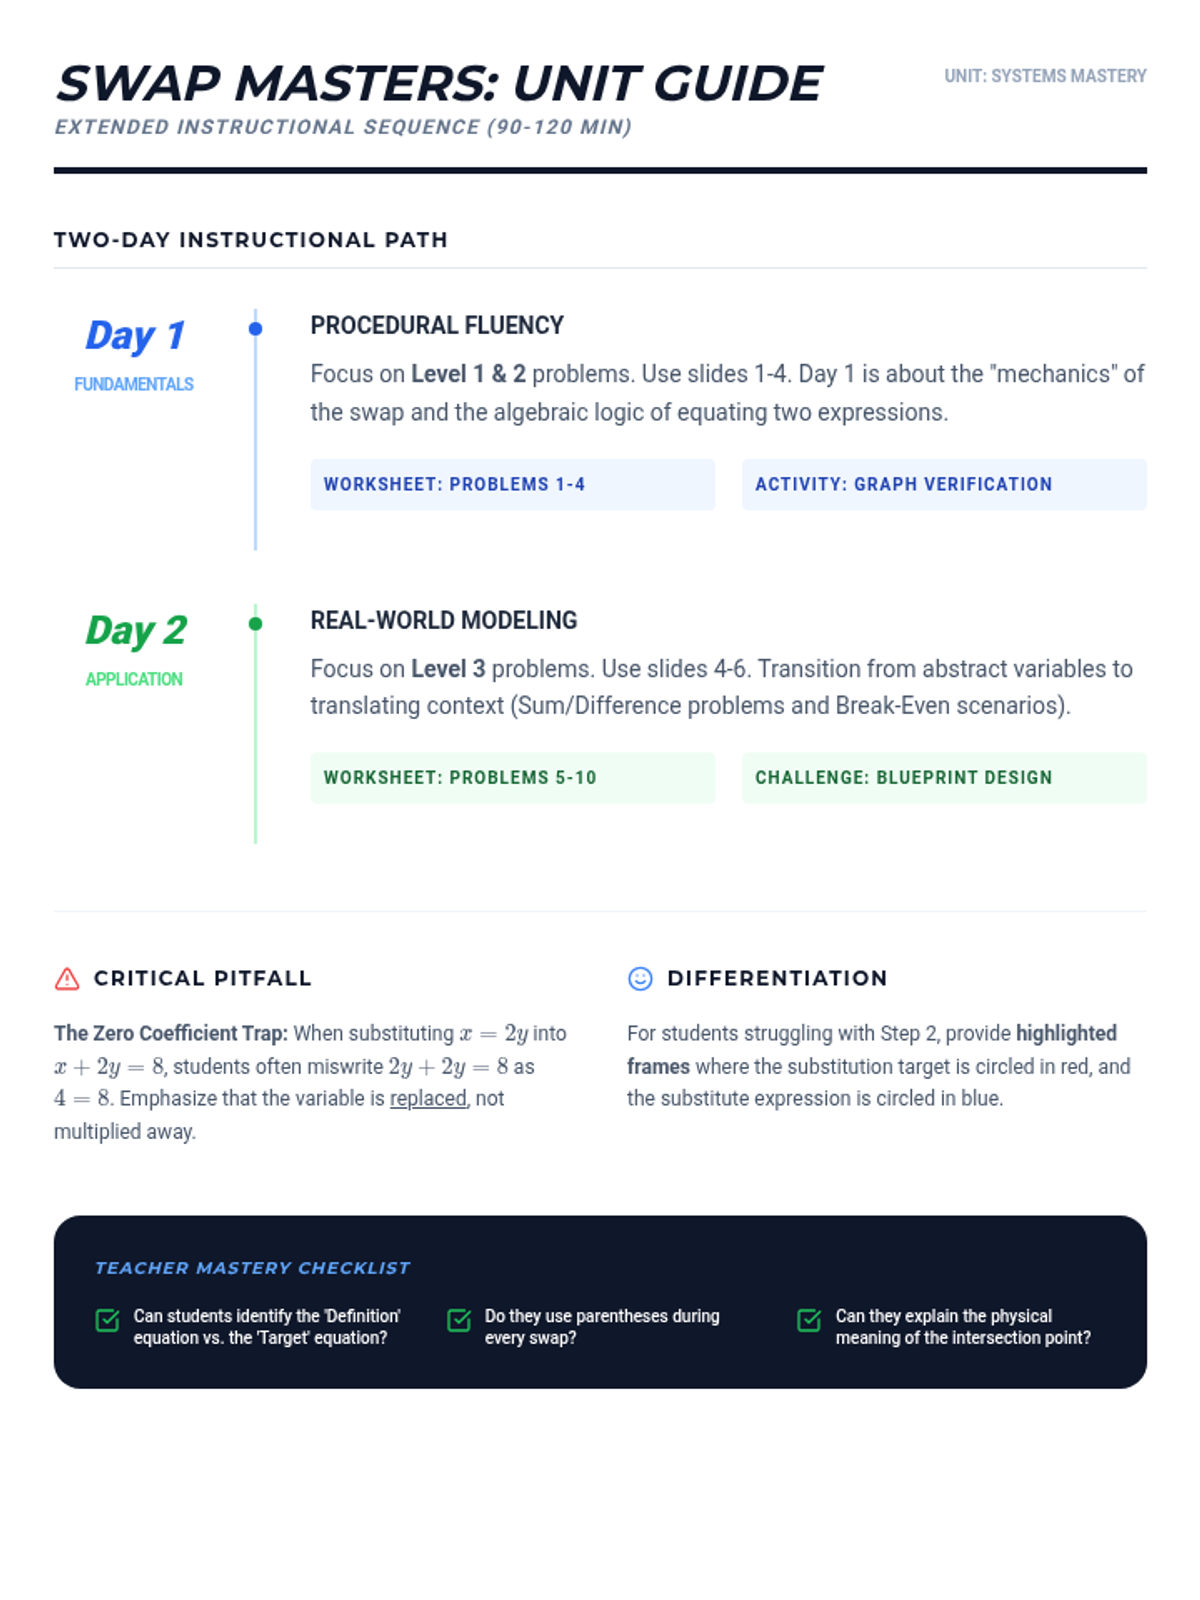
A comprehensive unit on solving systems of linear equations using the substitution method, covering procedural steps, graphical verification, and real-world modeling.
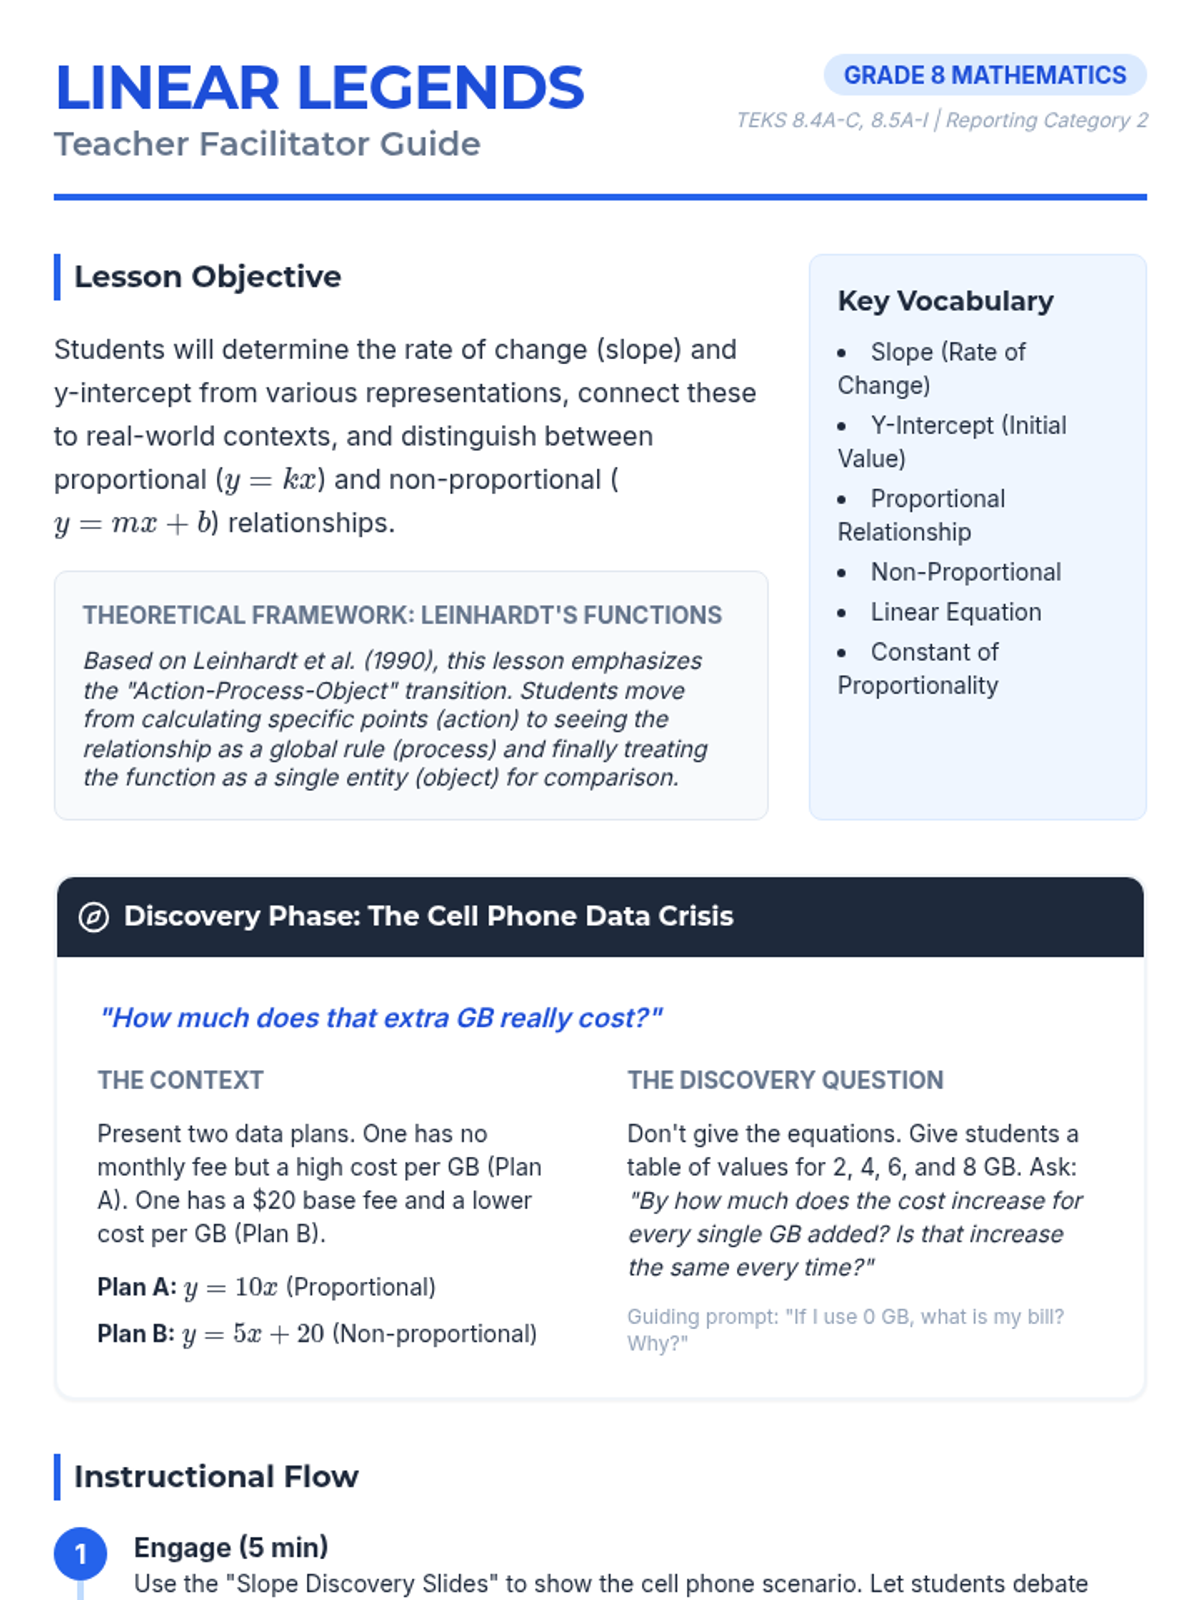
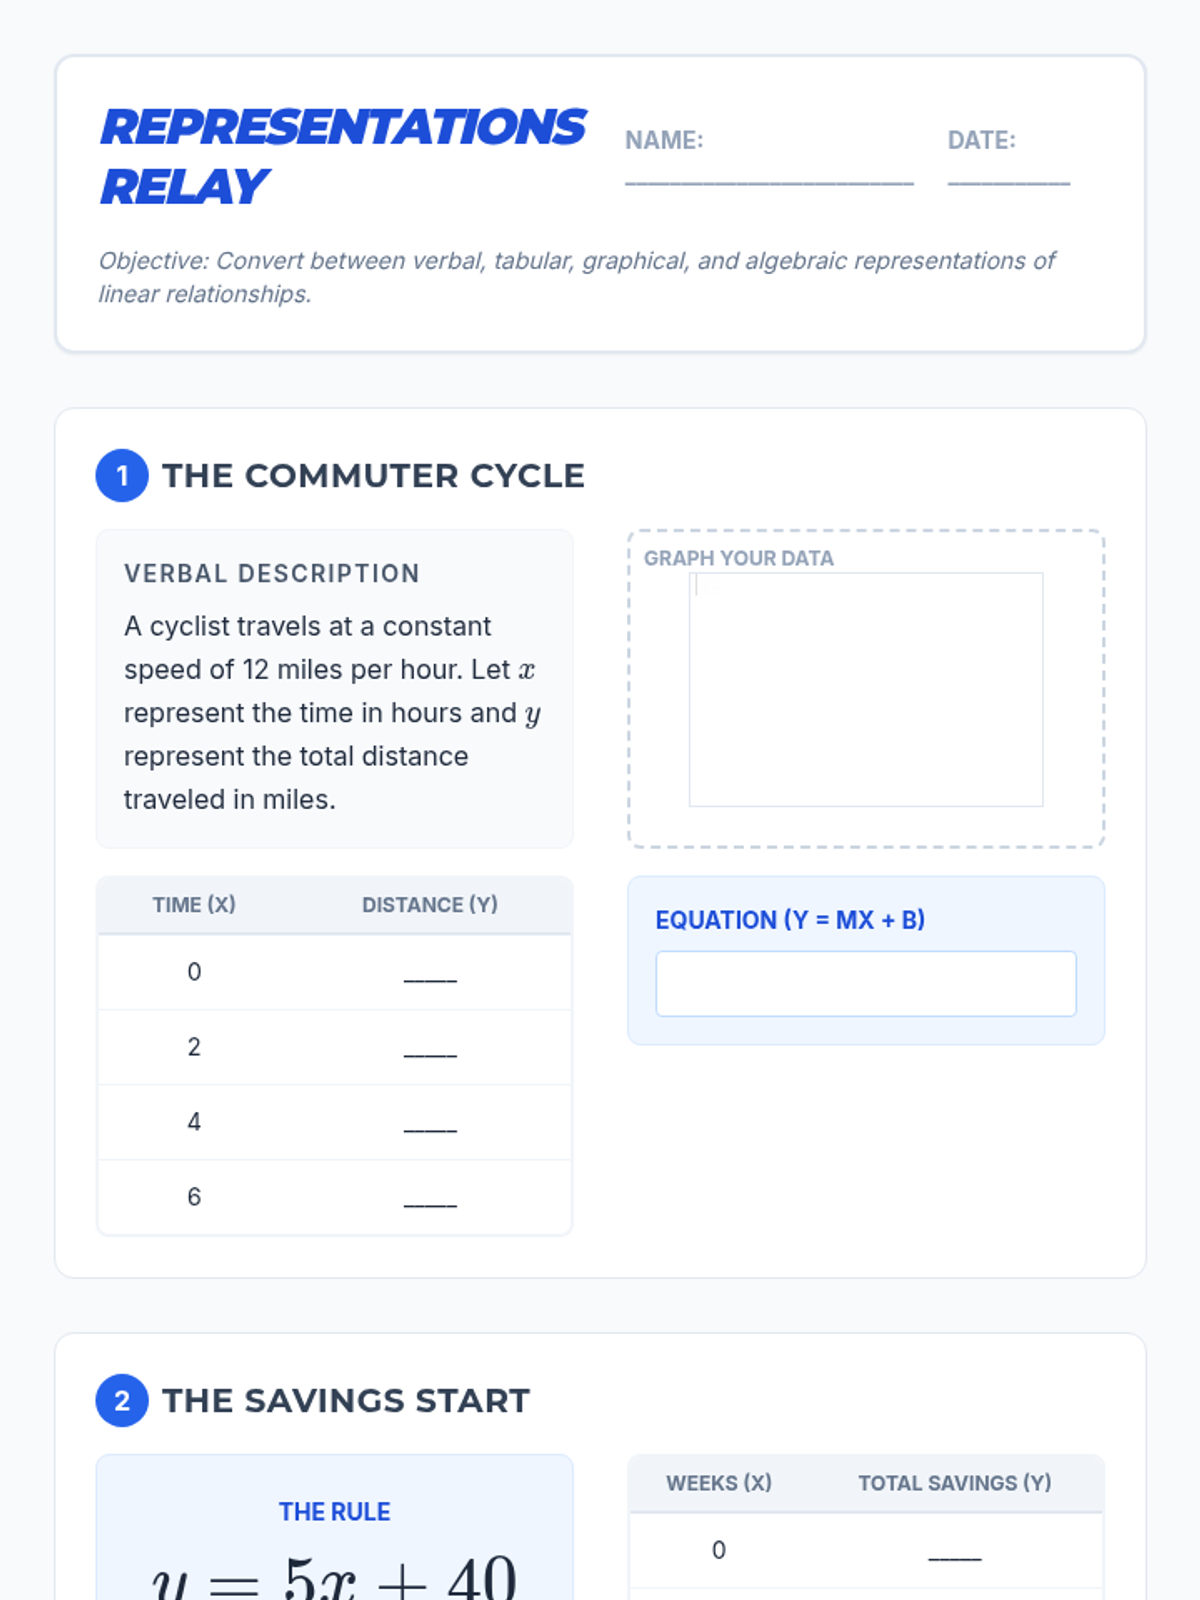
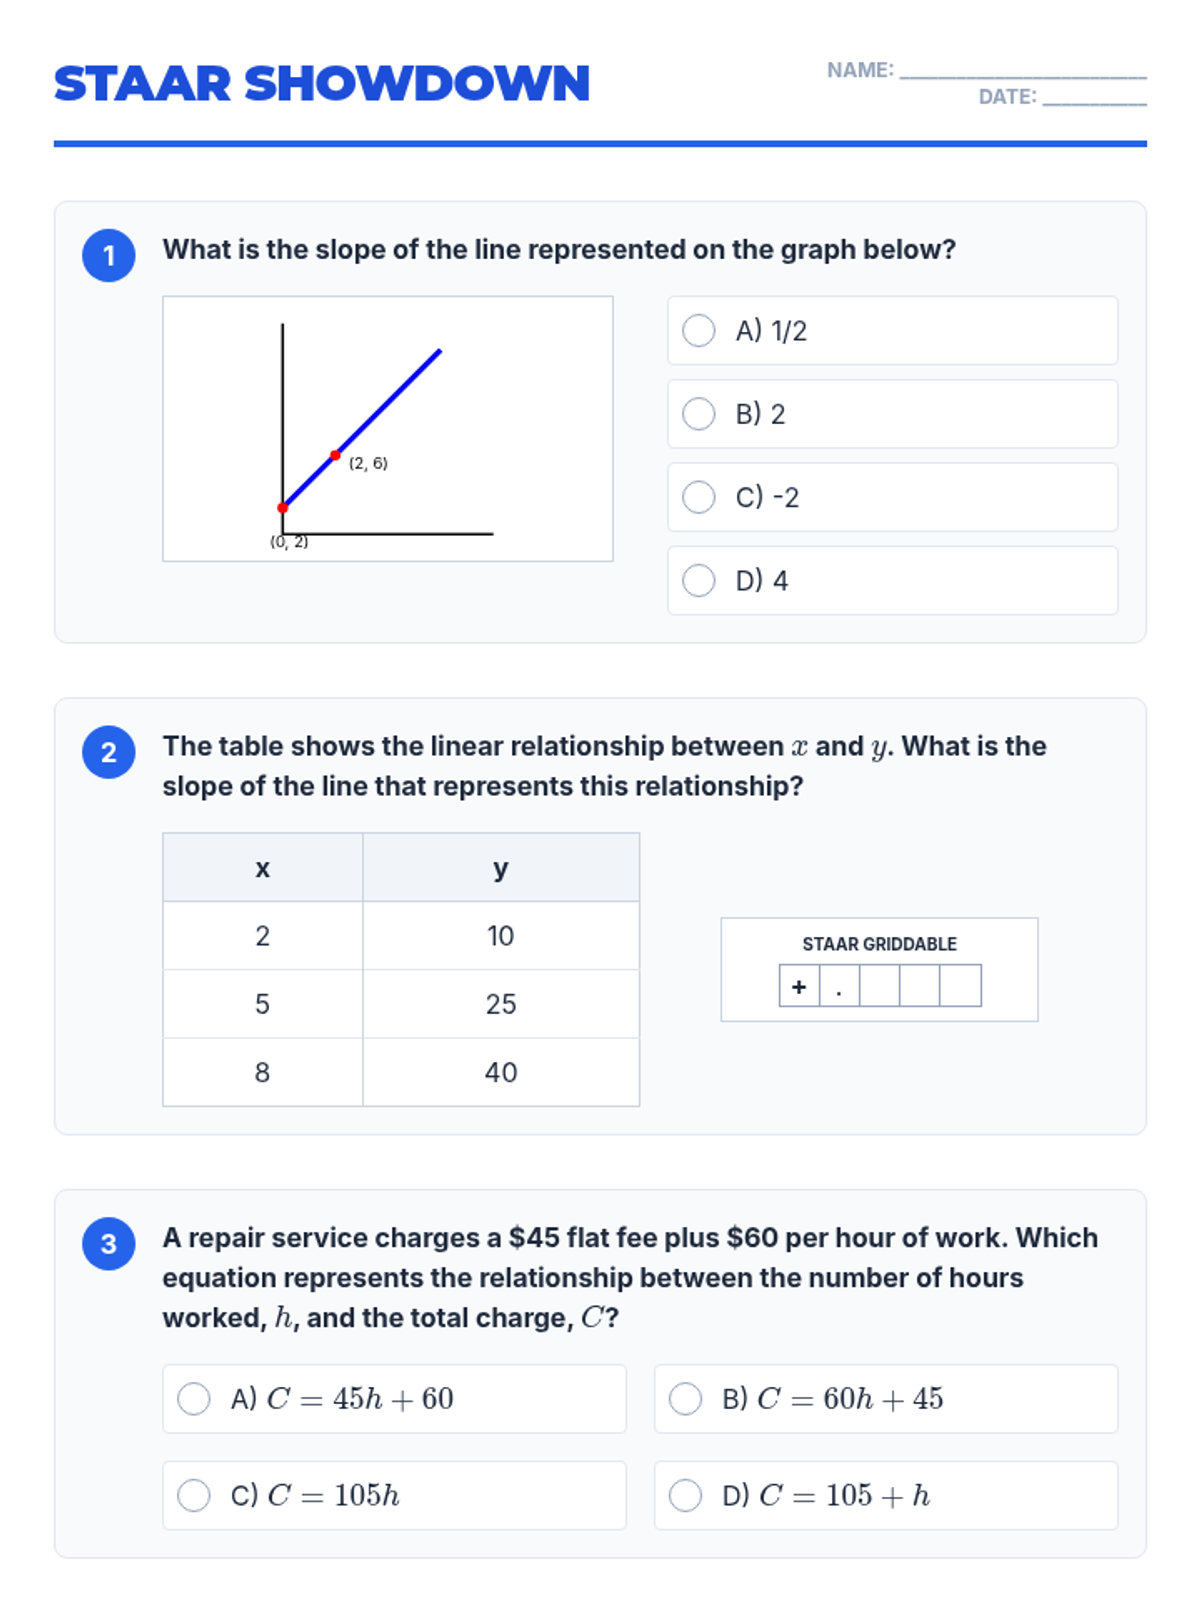
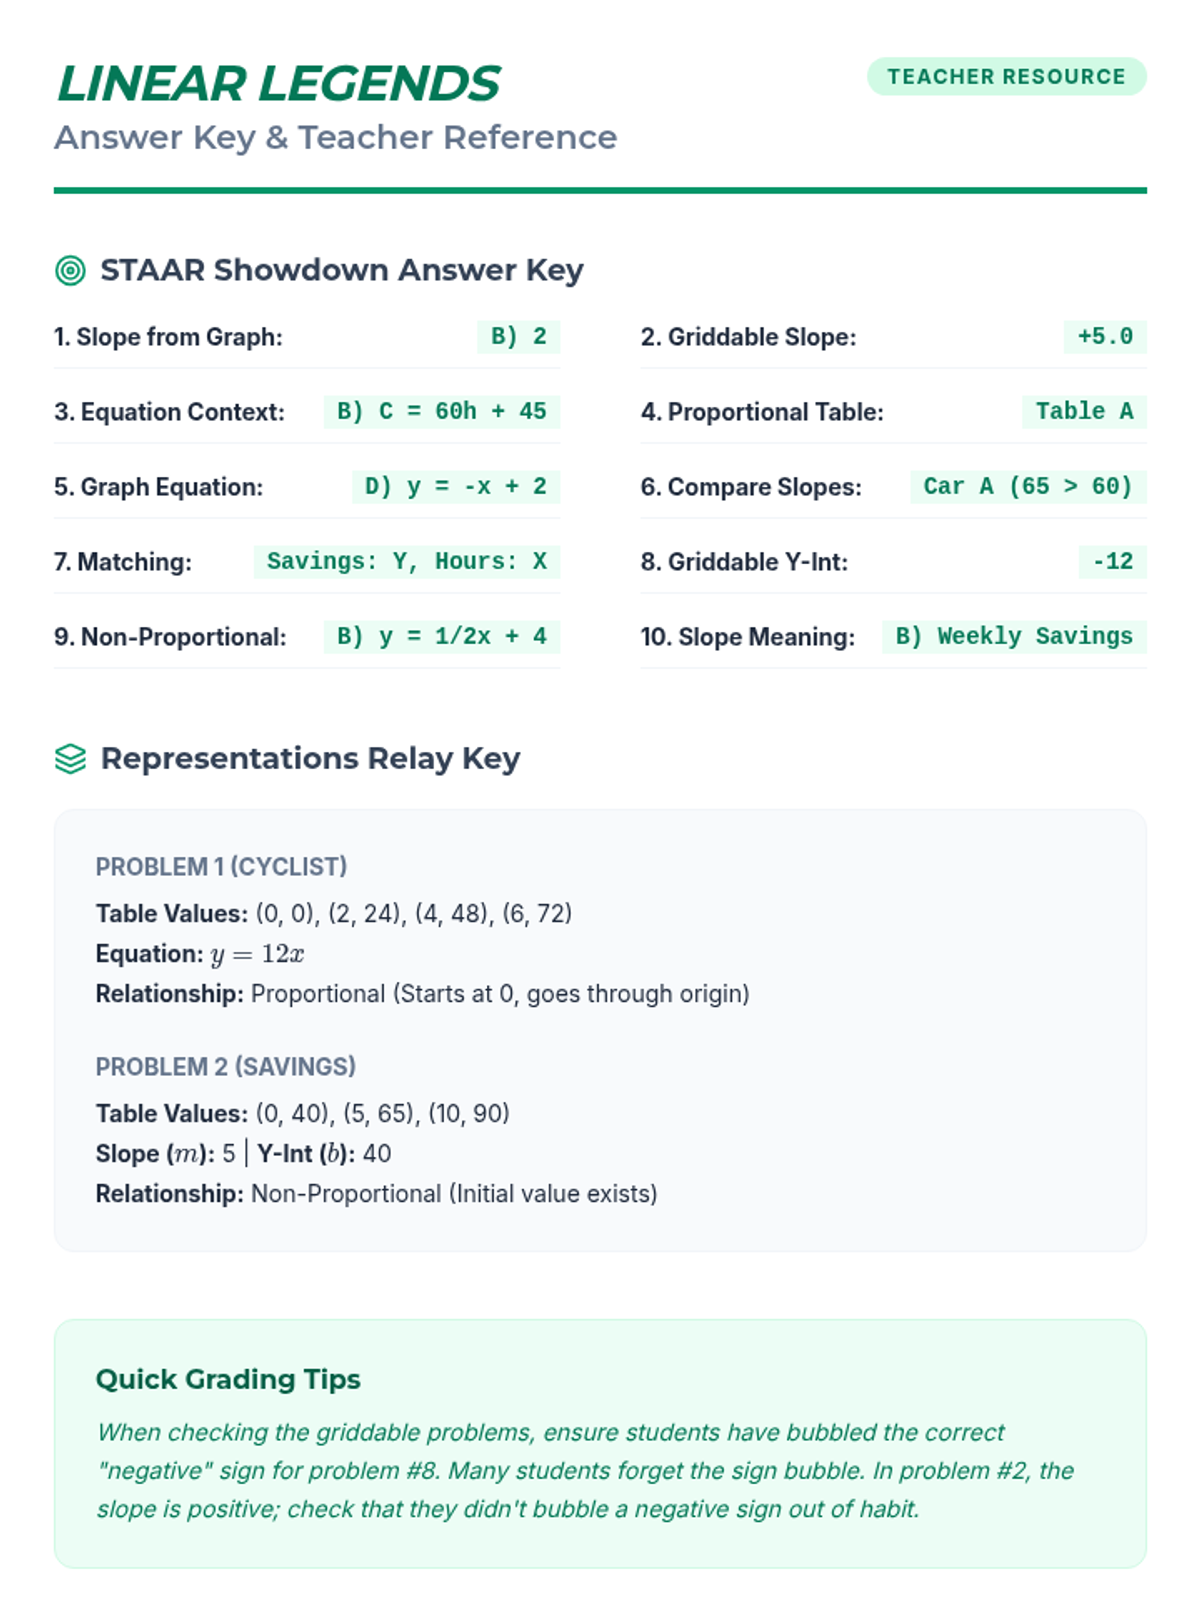
A comprehensive unit on Grade 8 TEKS-aligned linear relationships, focusing on slope, y-intercept, and multiple representations. This sequence moves from discovery-based exploration of rate of change to mastery of STAAR-format algebraic computations.
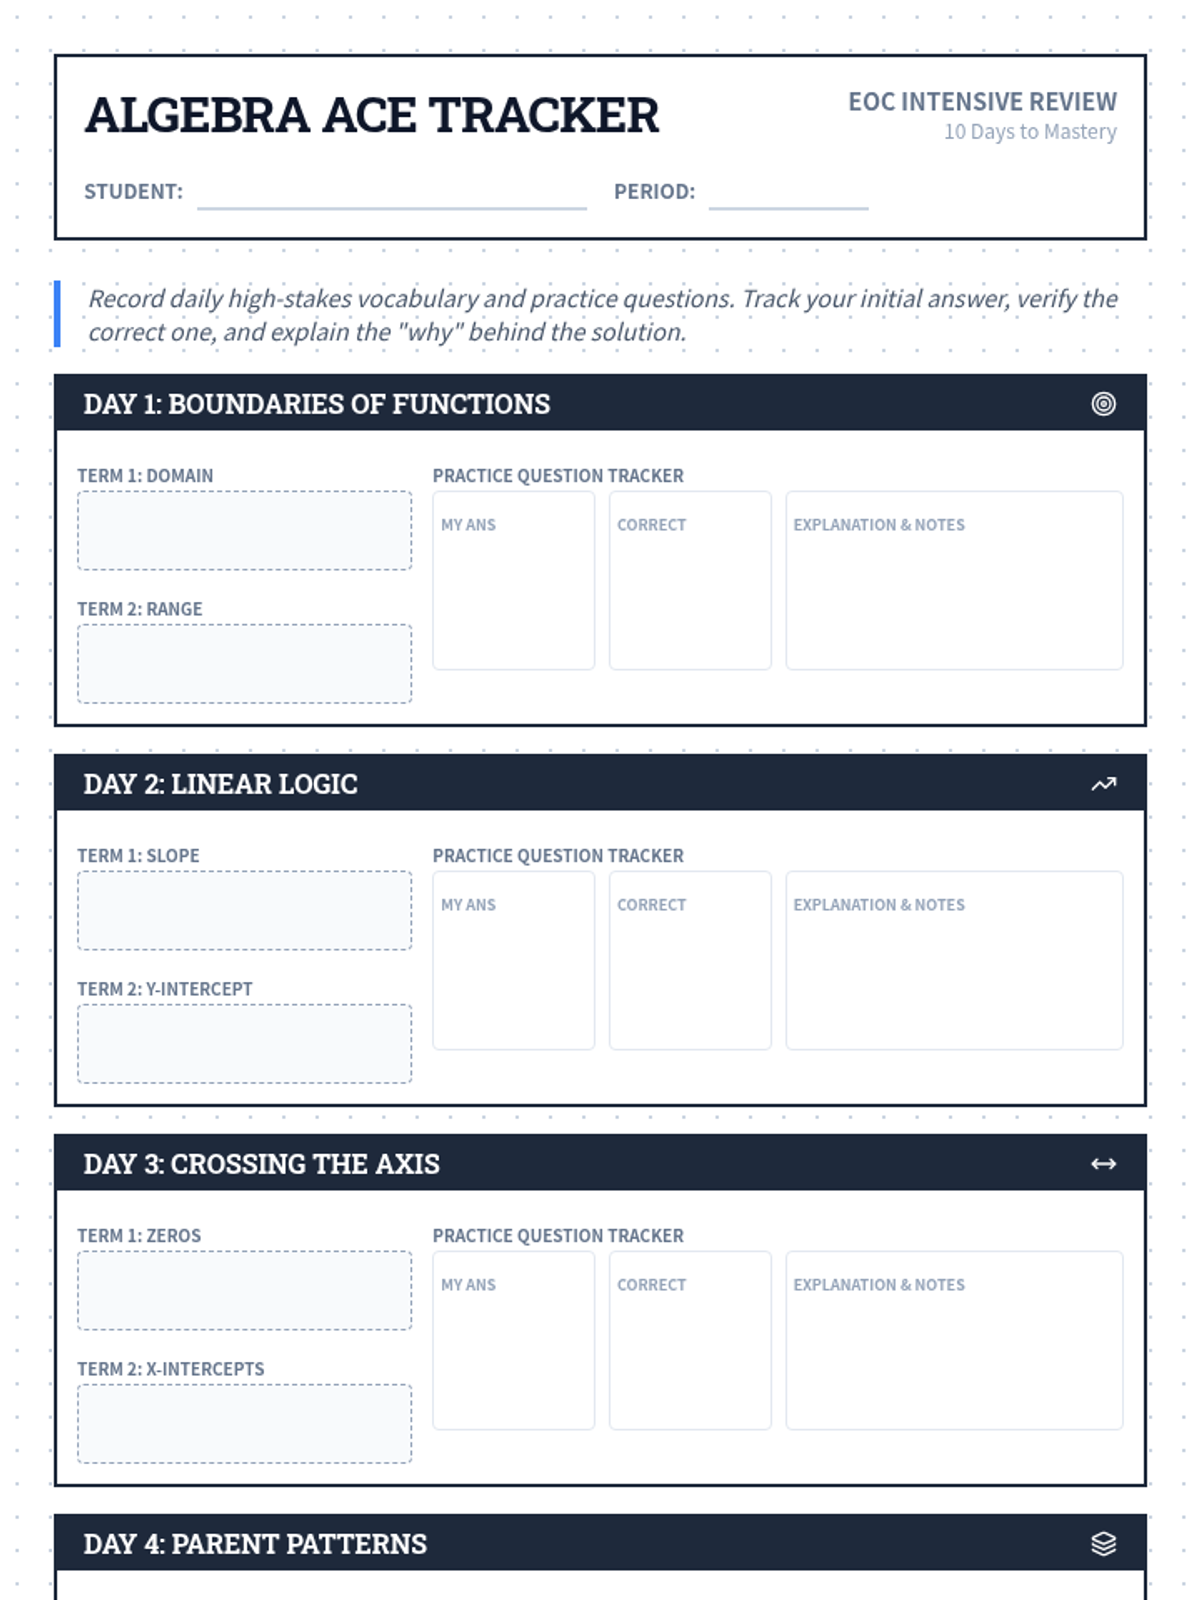
A 10-day intensive review sequence for the Texas Algebra I EOC exam, focusing on two high-stakes vocabulary terms each day with definitions, visual samples, and practice problems.
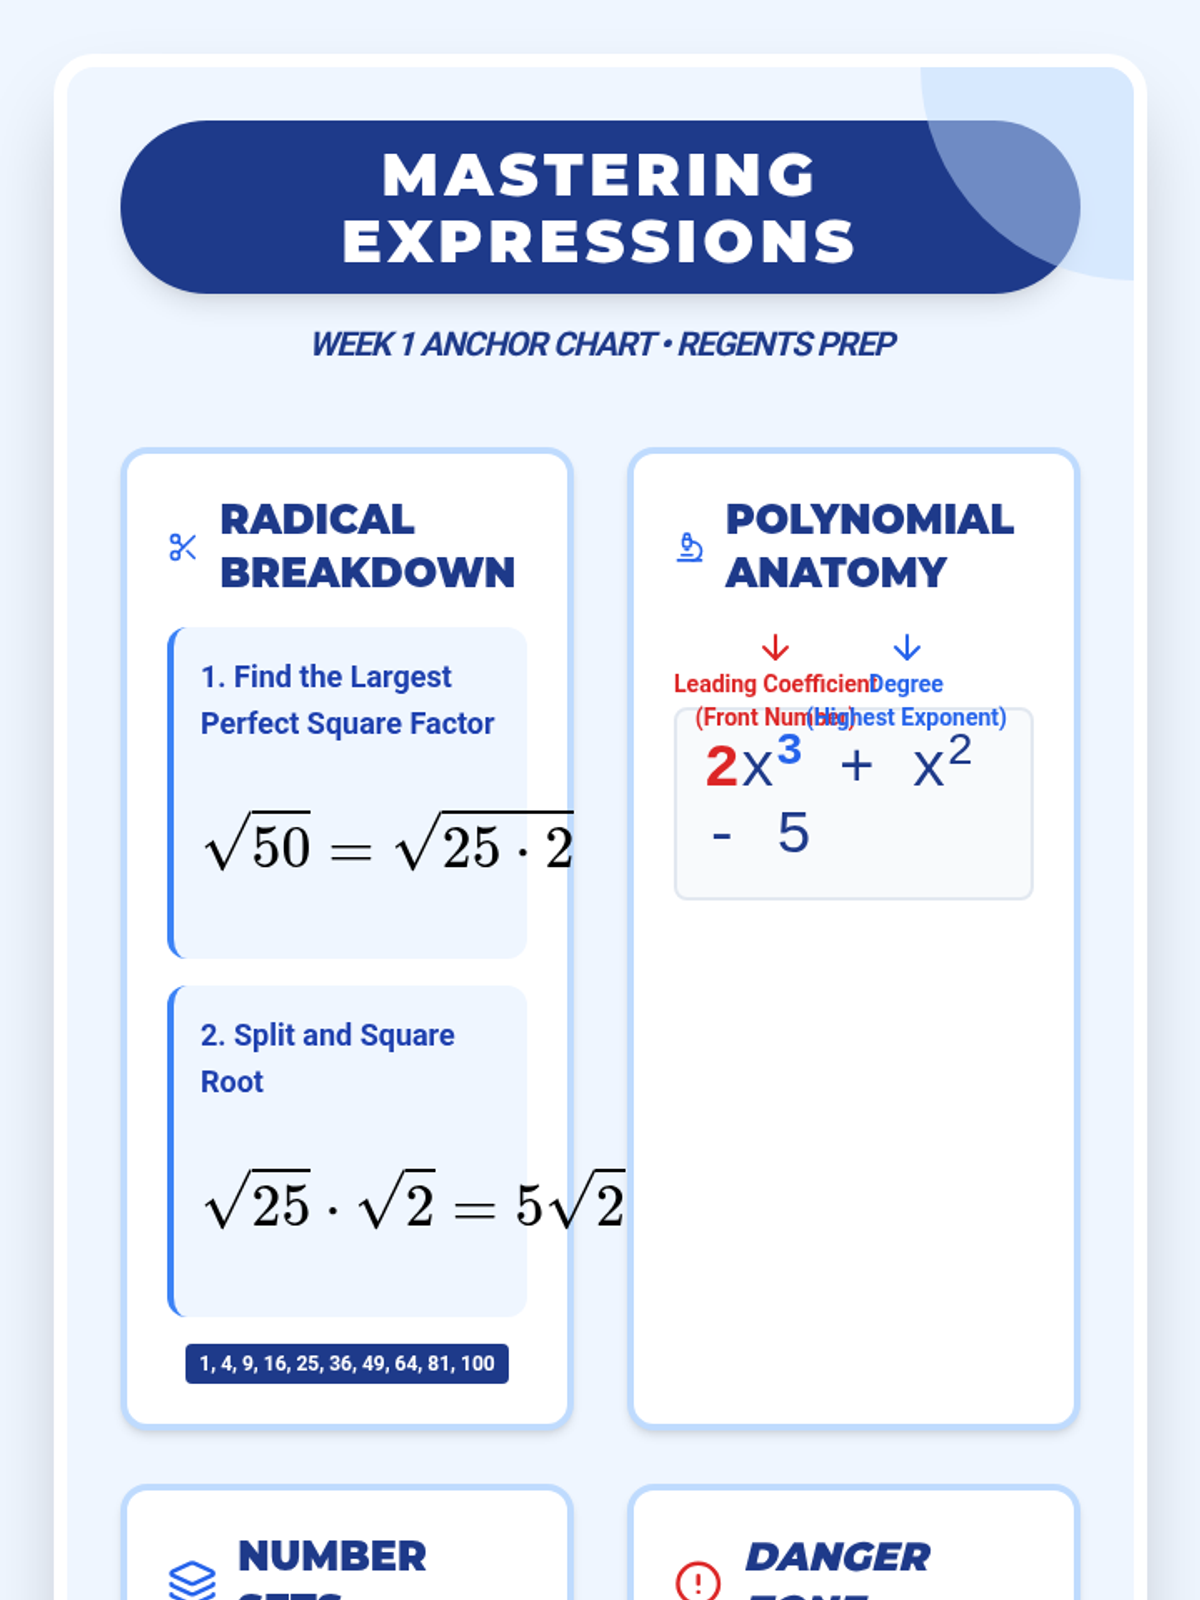
A comprehensive 10-week preparation sequence designed to get students ready for the Algebra I Regents exam by May 15th, featuring bi-weekly 30-minute practice sessions and visual anchor charts.
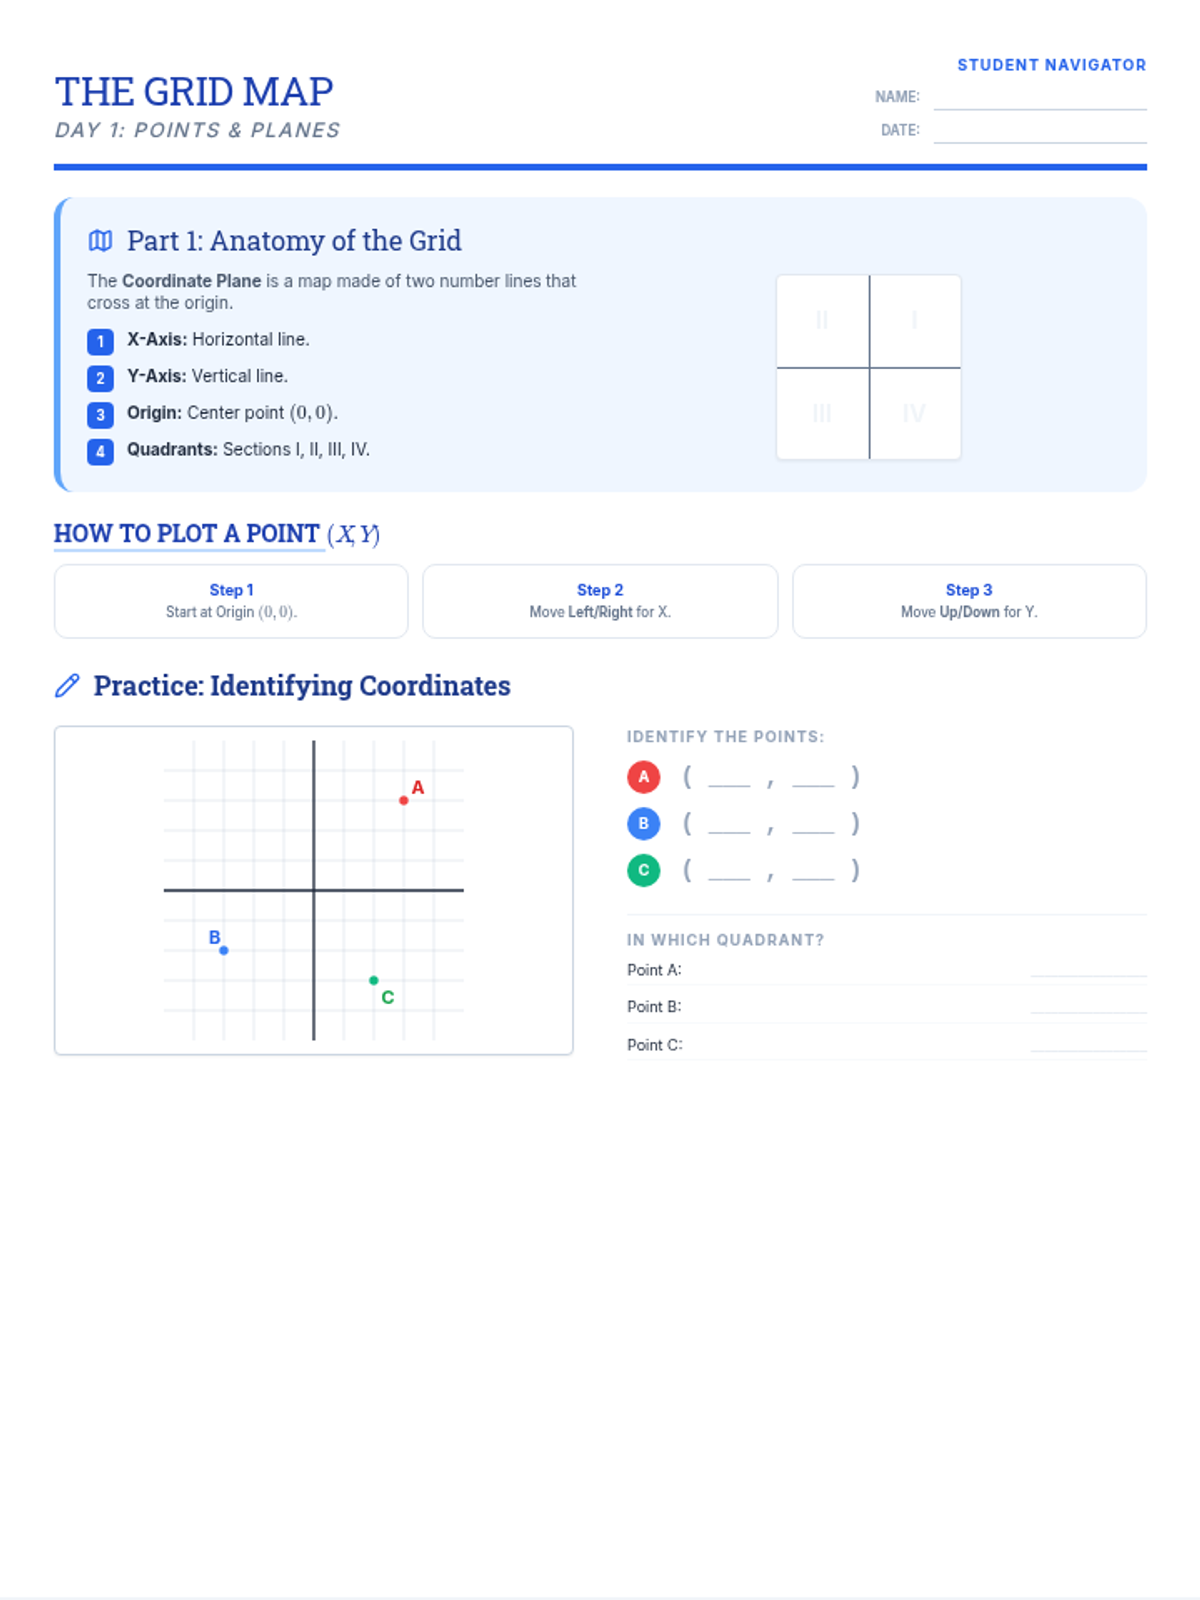
A comprehensive 5-day self-paced packet for remedial Algebra 1 students focusing on the fundamentals of graphing, from basic coordinate planes to finding slope.
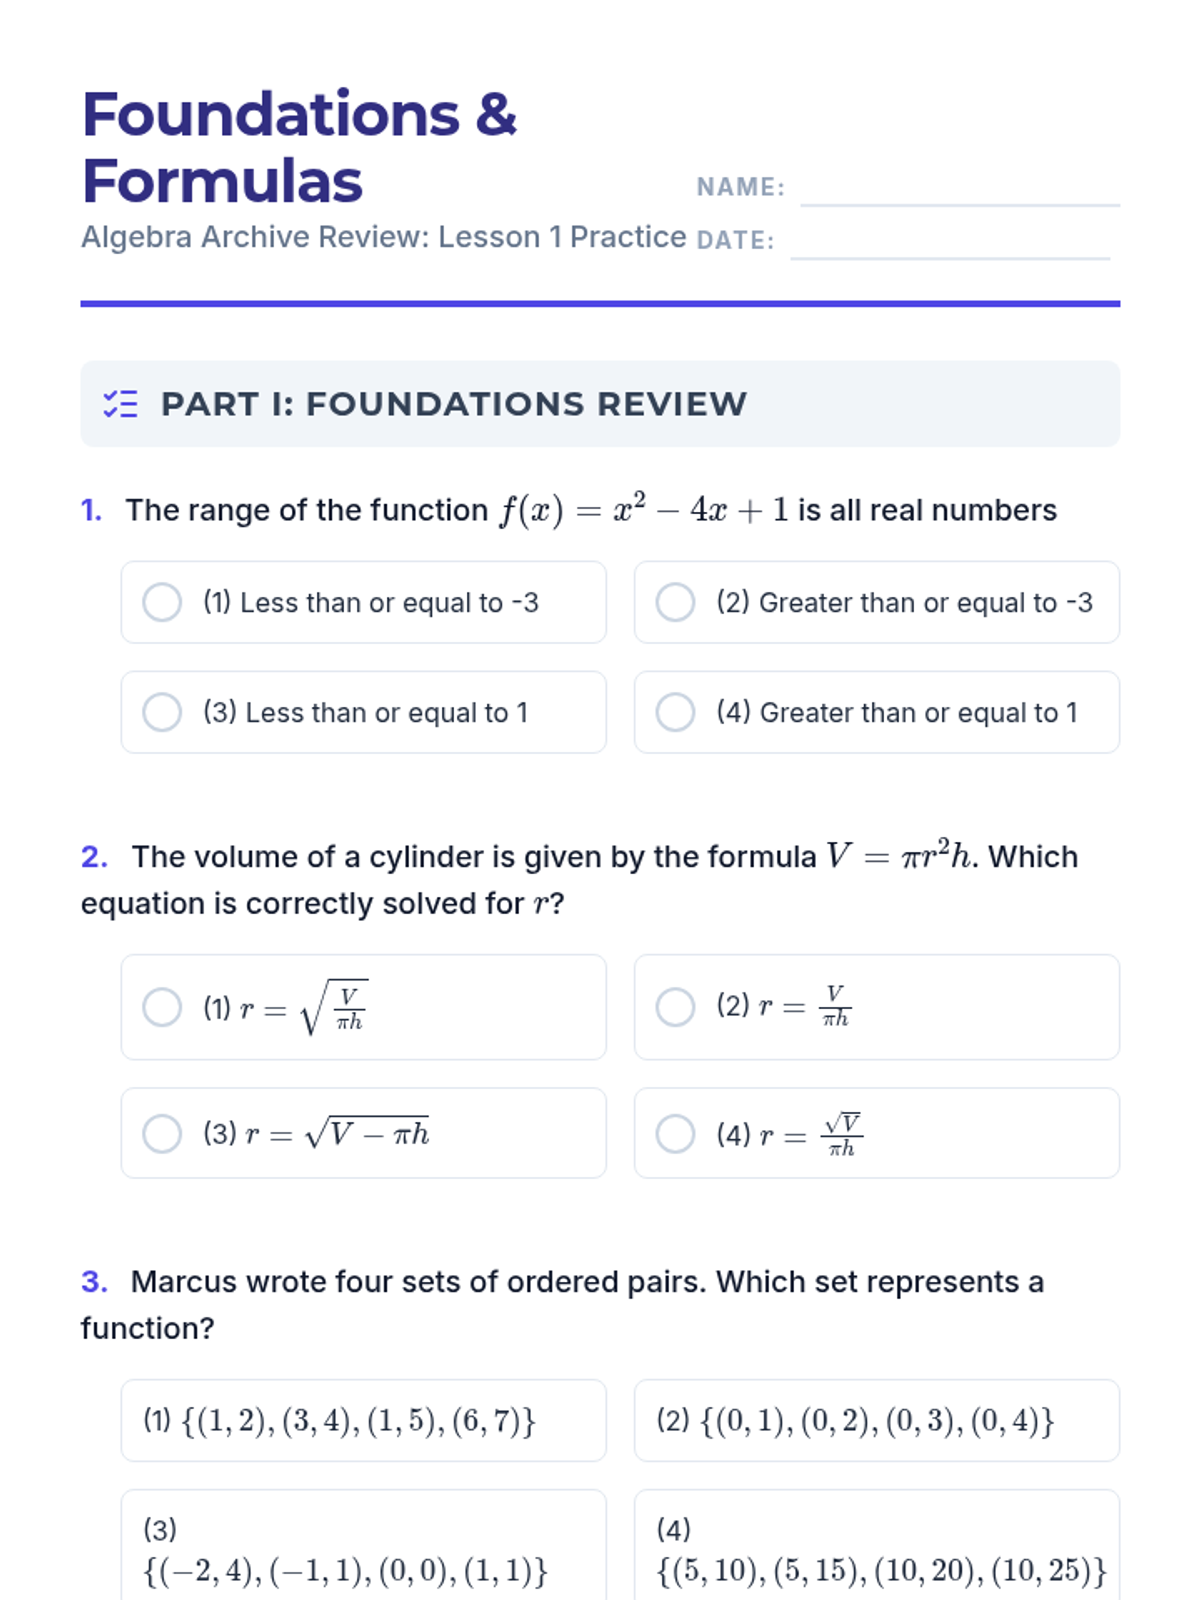
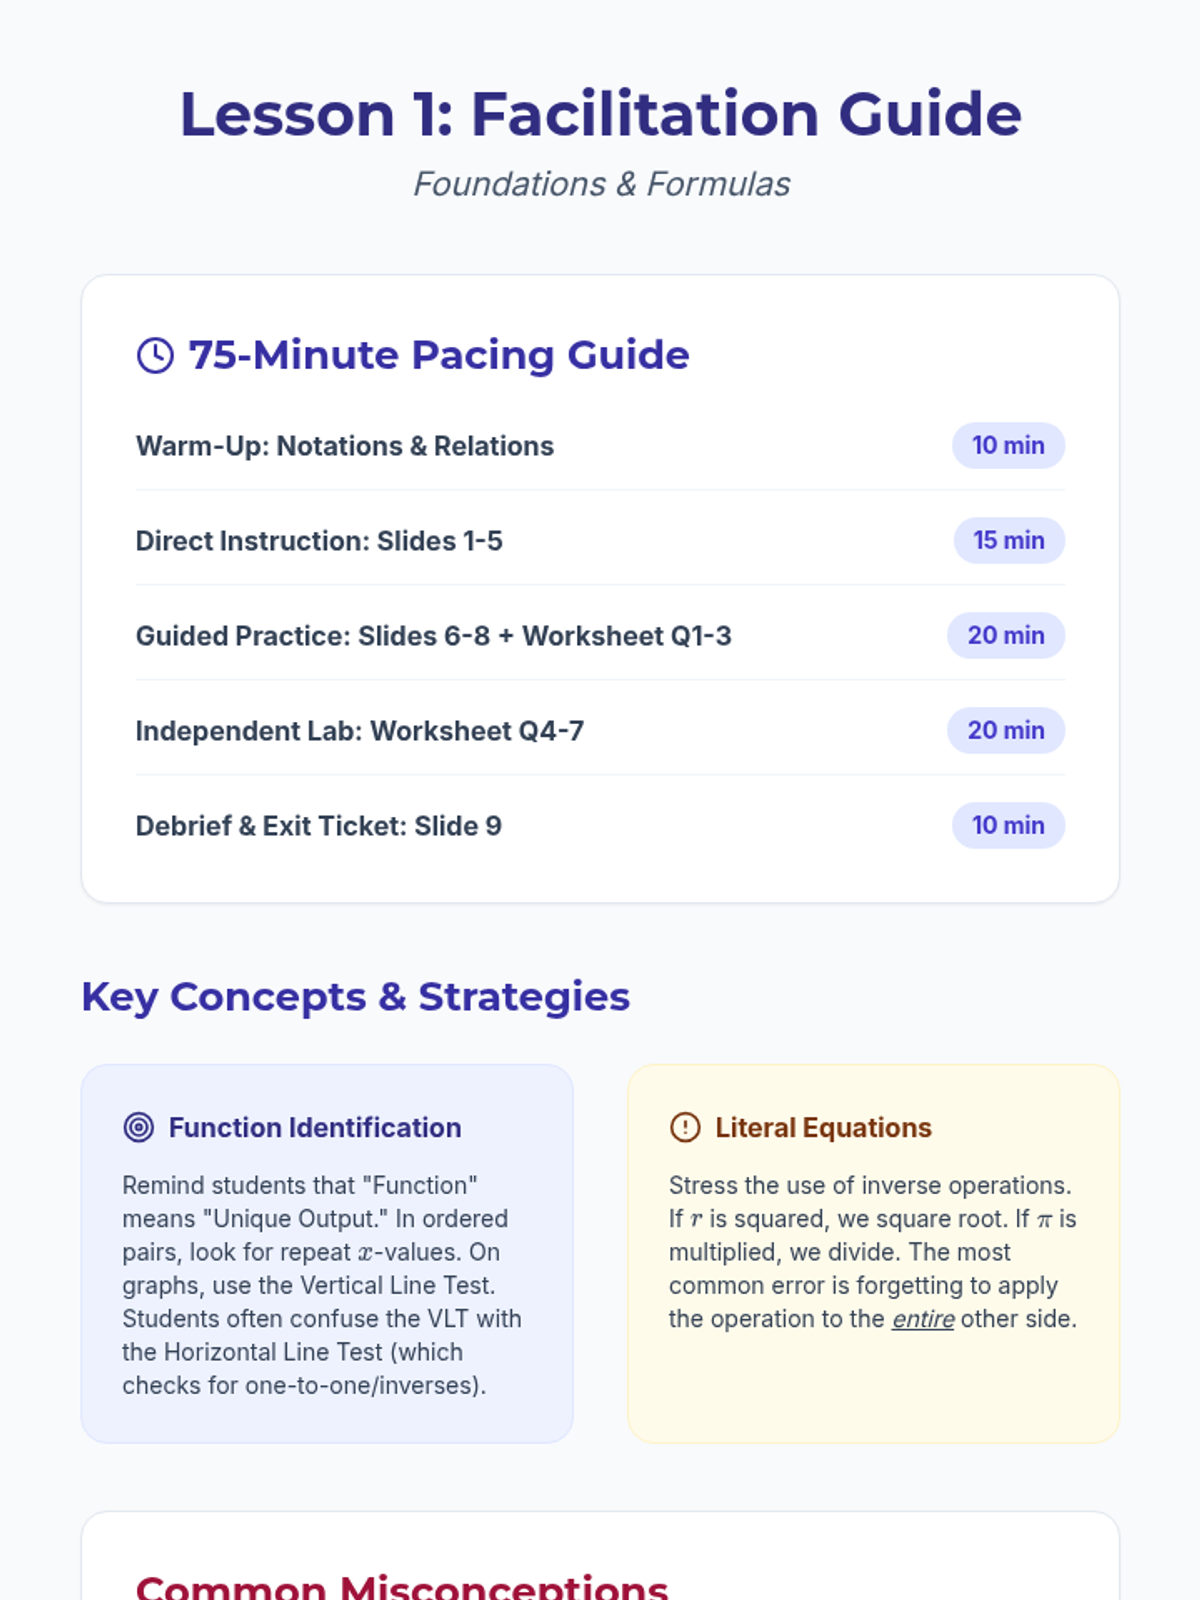
A comprehensive 3-day review sequence for the Algebra I Regents examination, focusing on foundations, systems, and polynomial operations. Each 75-minute lesson provides a balance of guided instruction and independent practice with problems modeled after the NYS Interim Assessment.
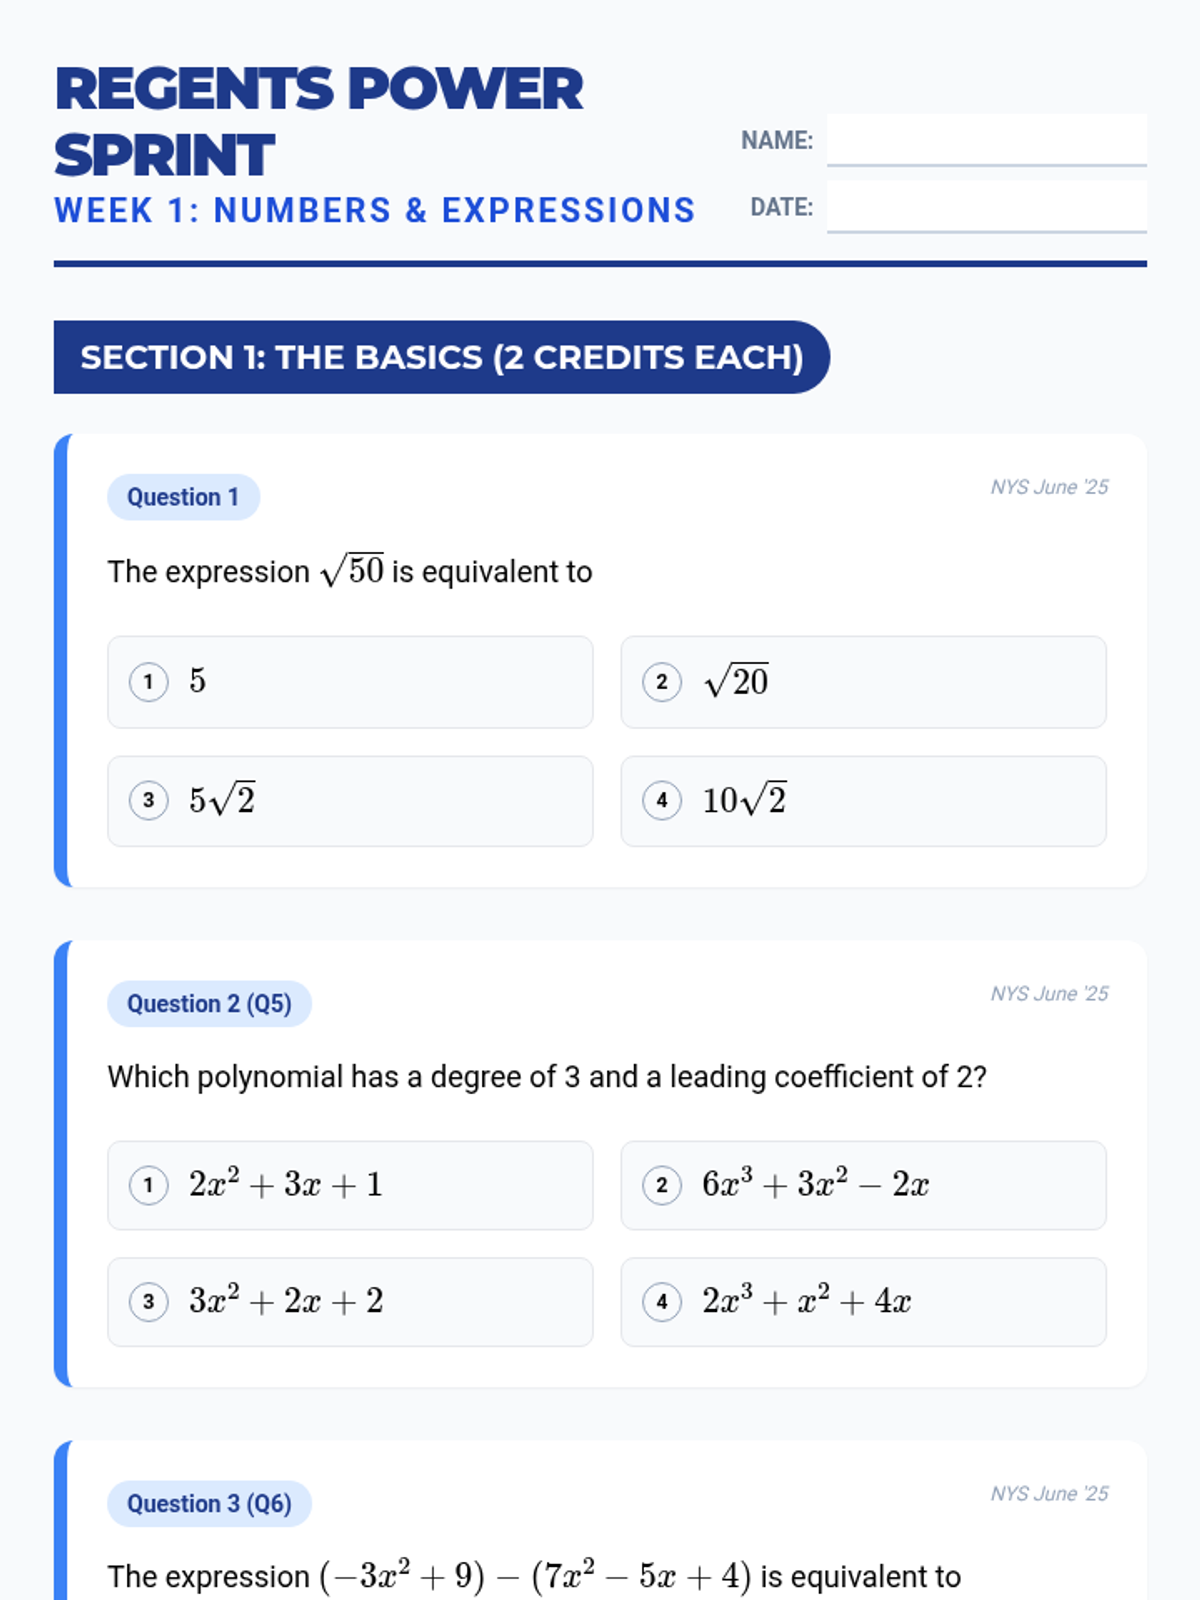
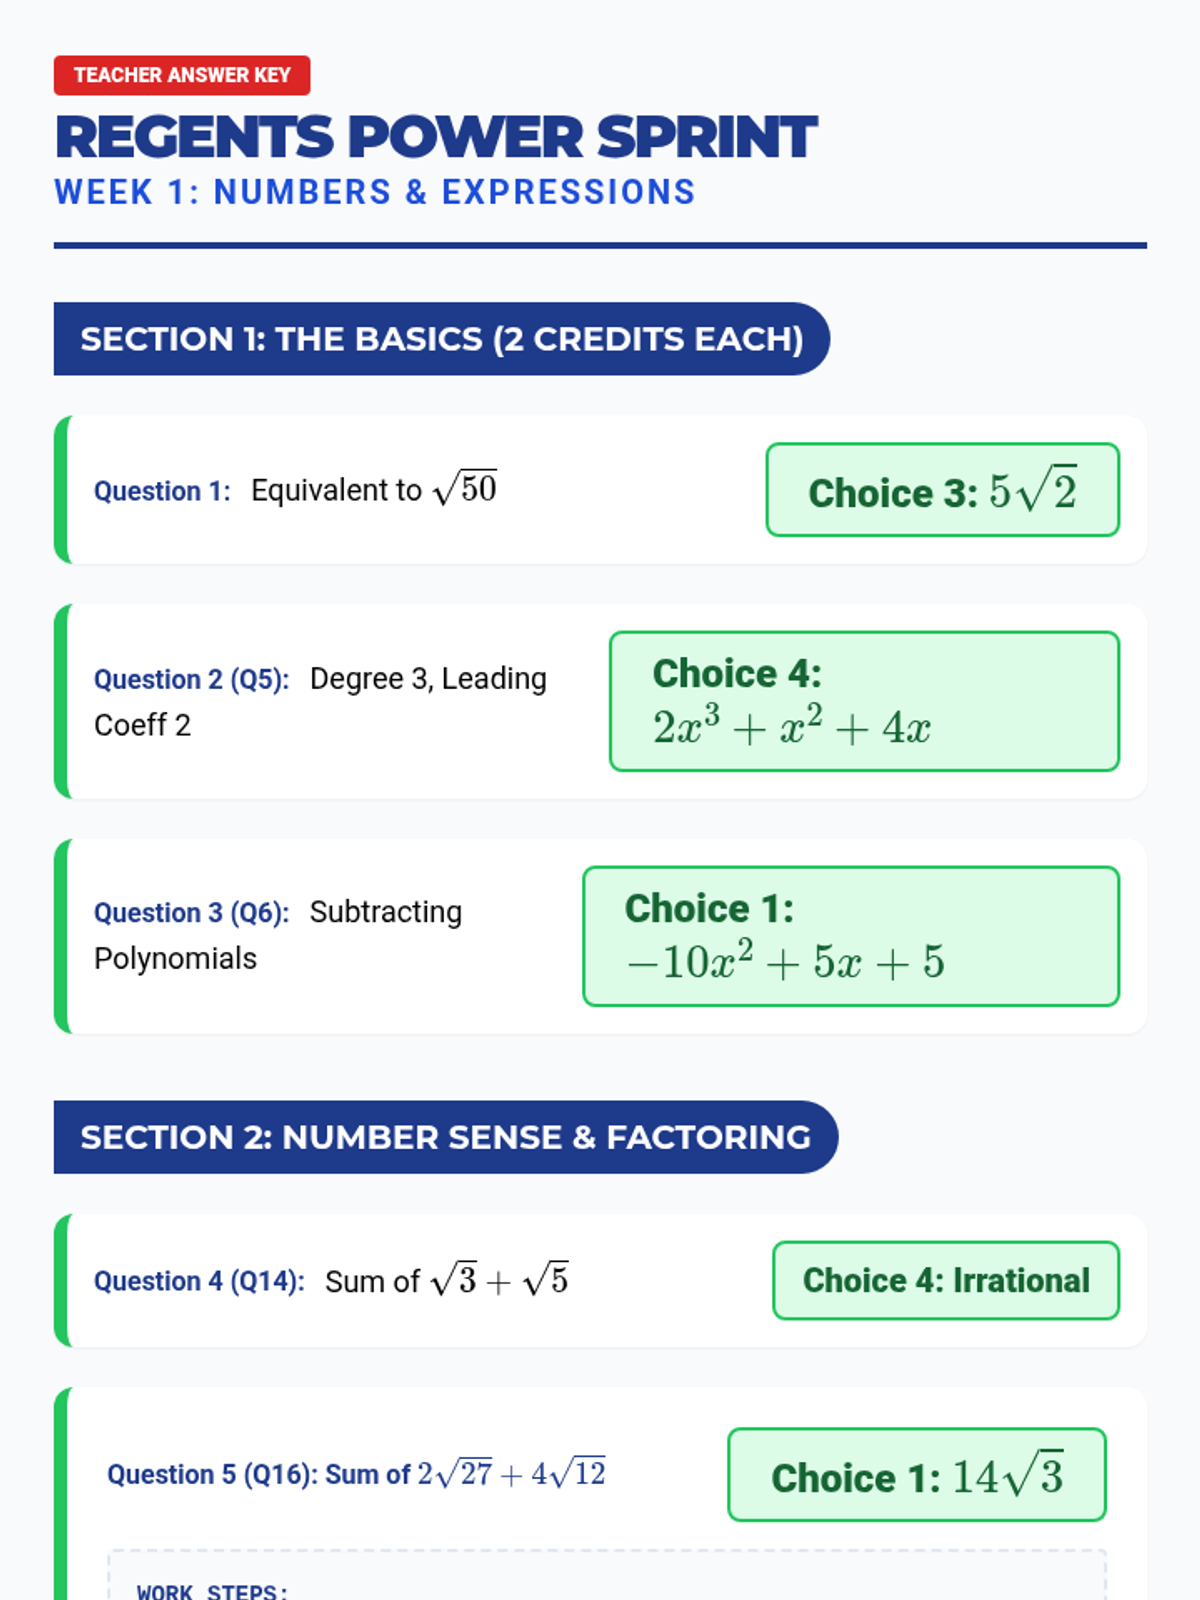
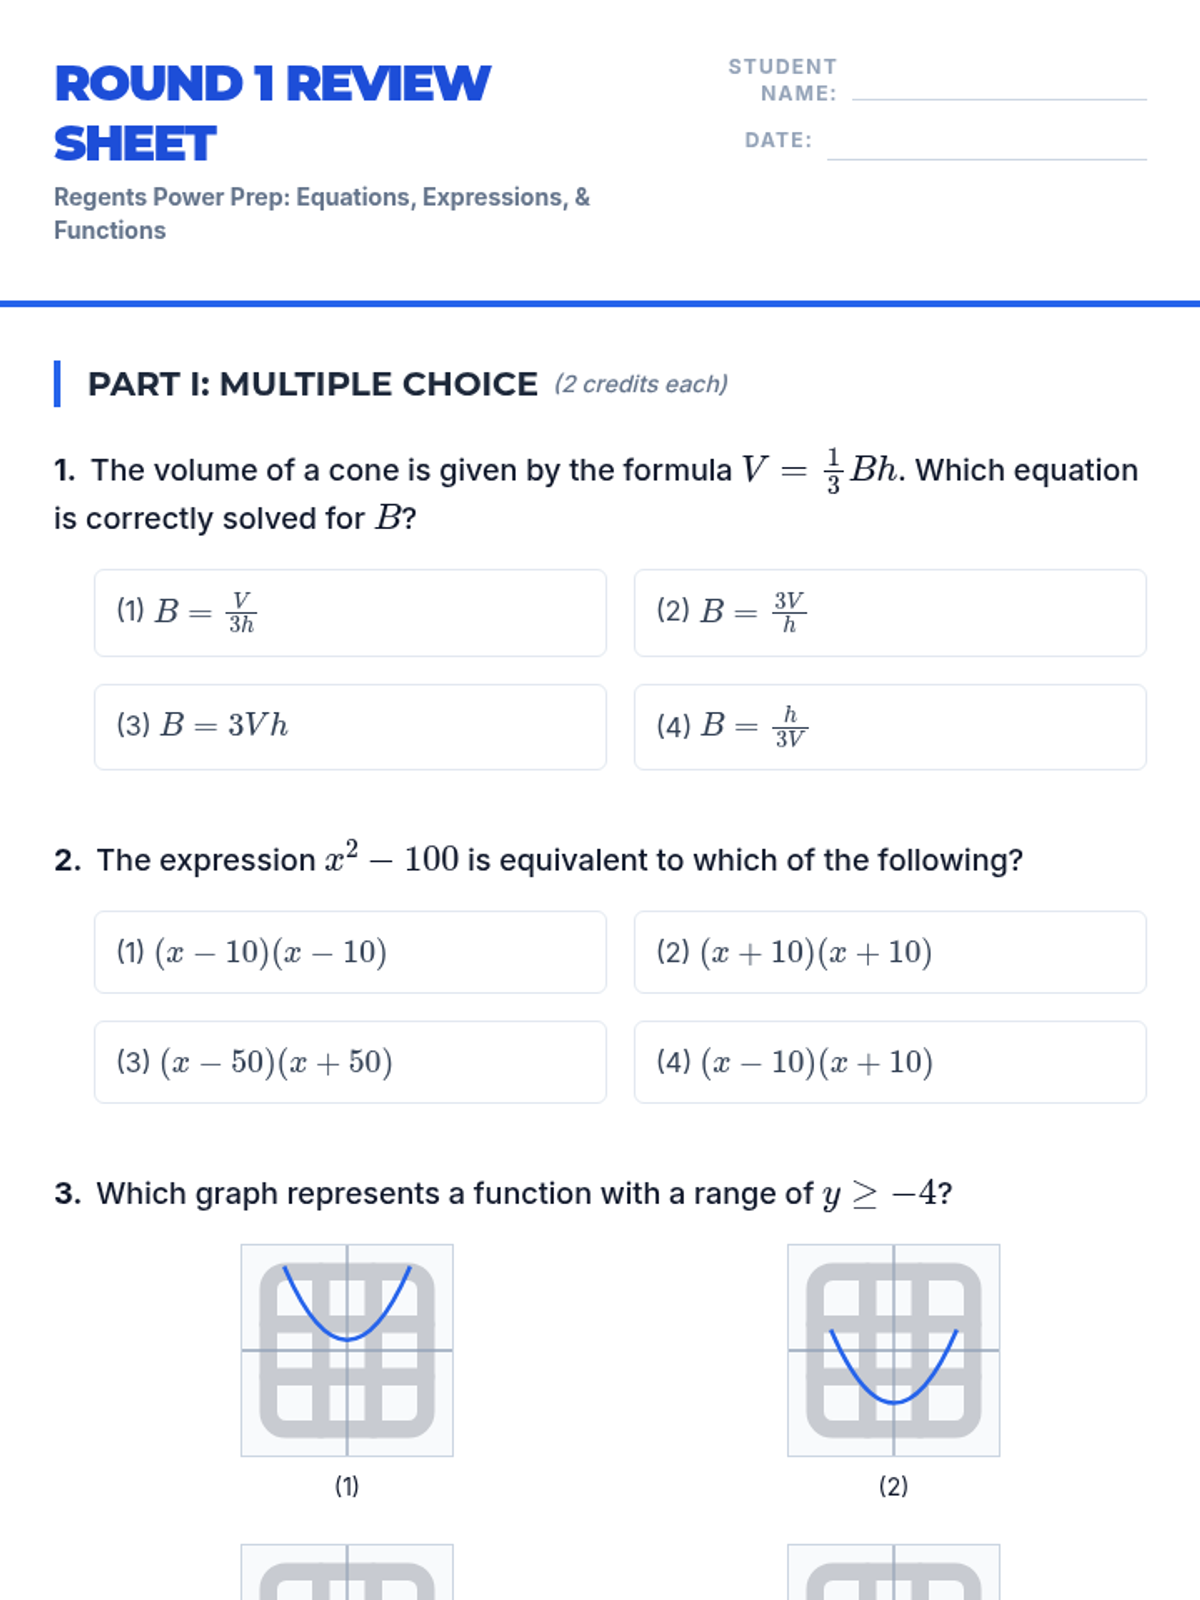
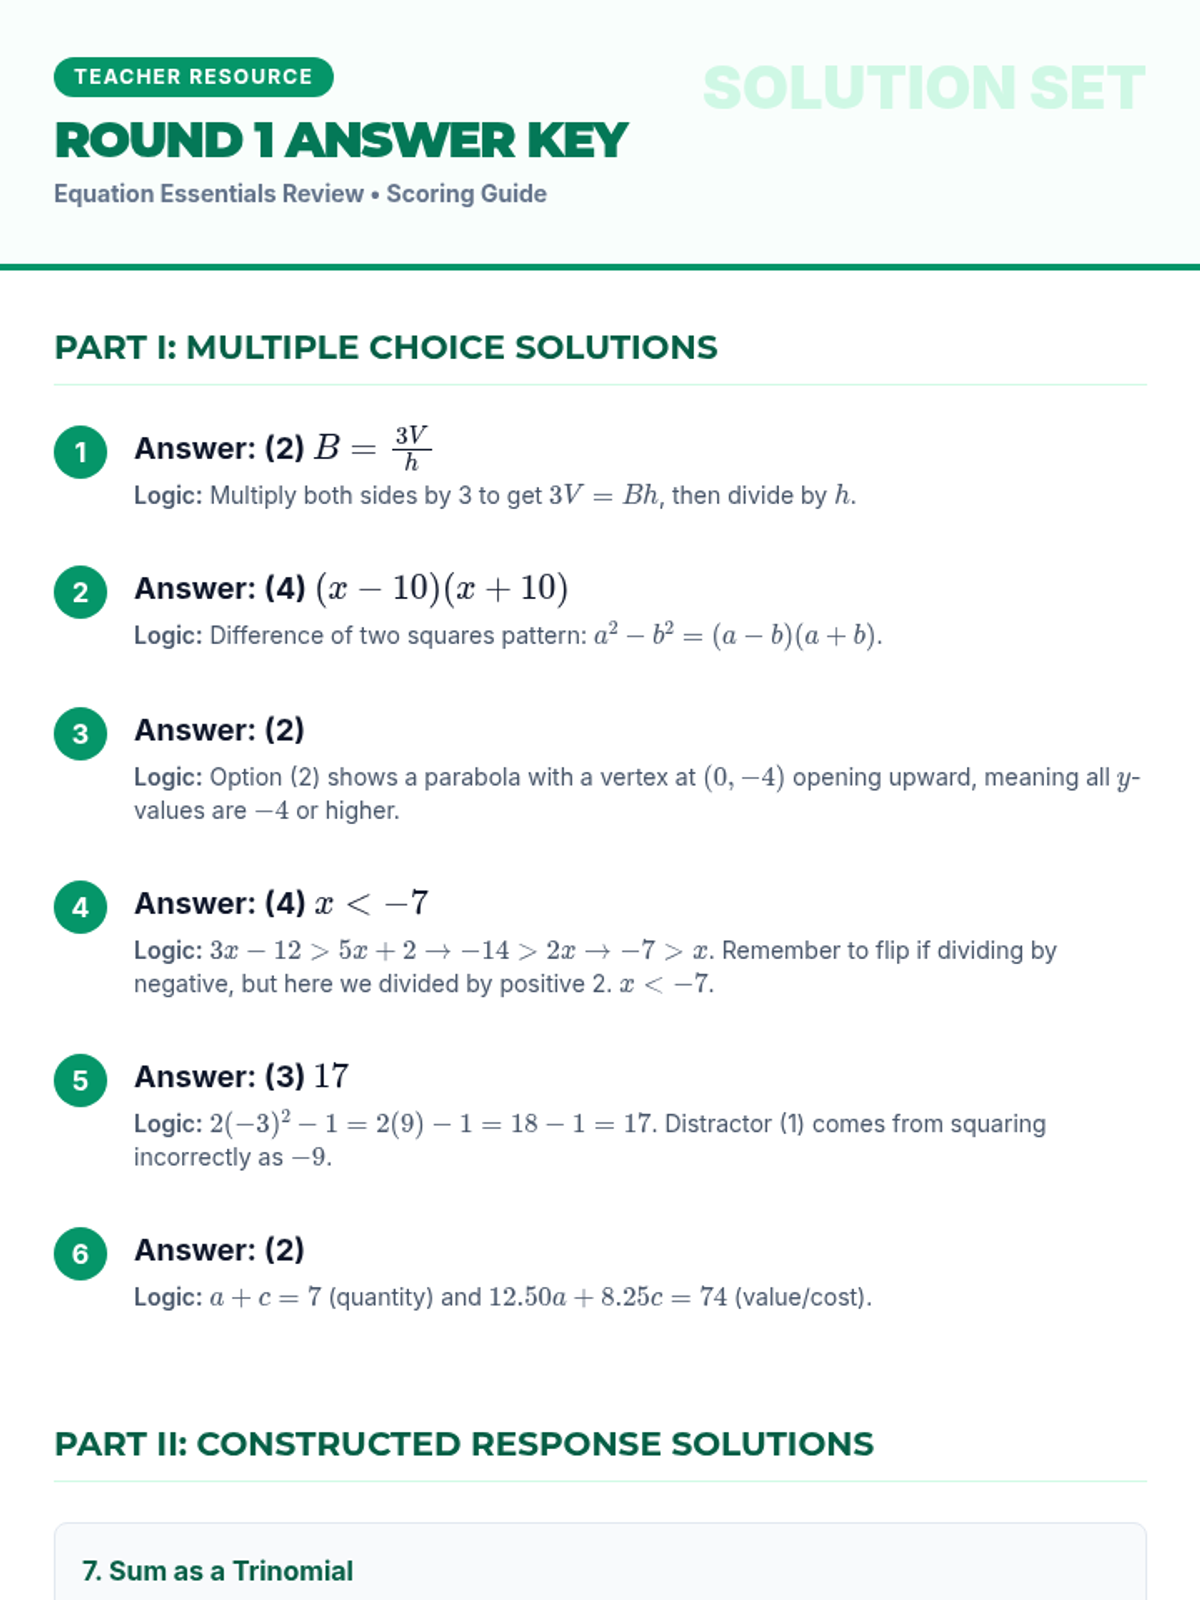
A series of five high-stakes review rounds designed to prepare students for the Algebra I NYS Regents exam, focusing on expressions, equations, inequalities, and functions.
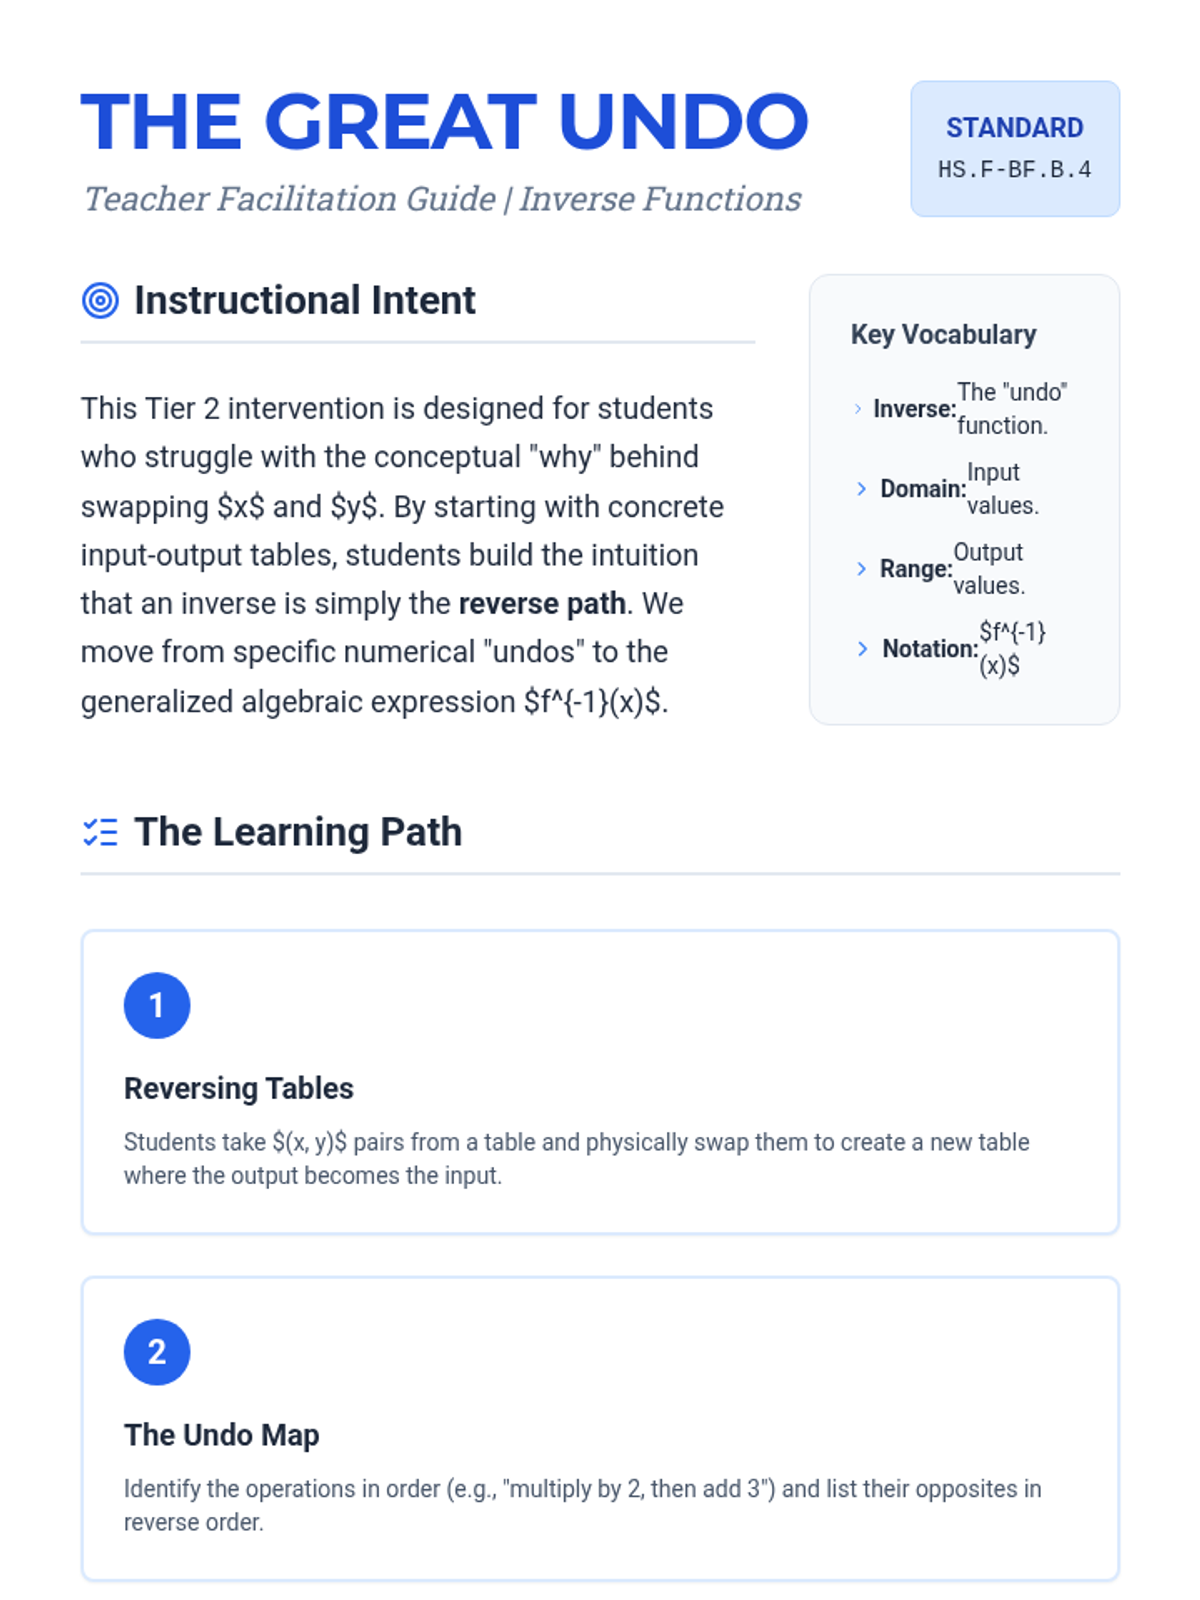
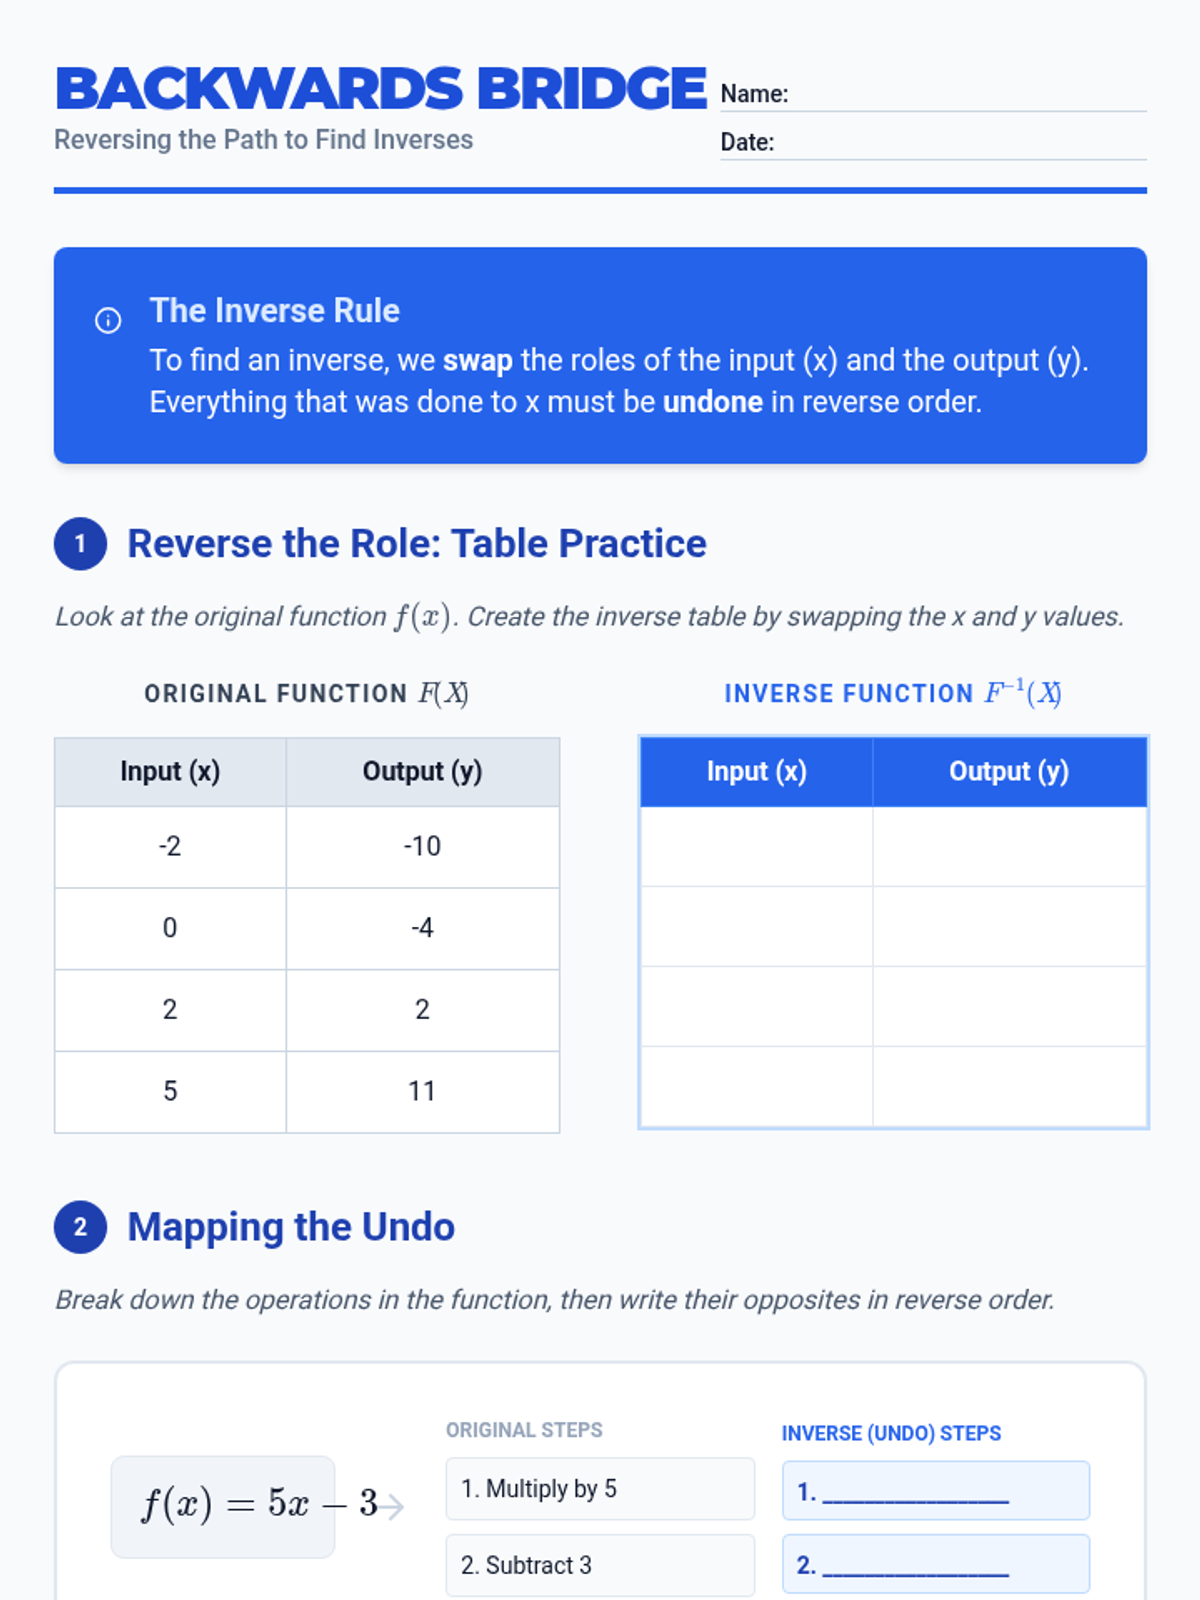
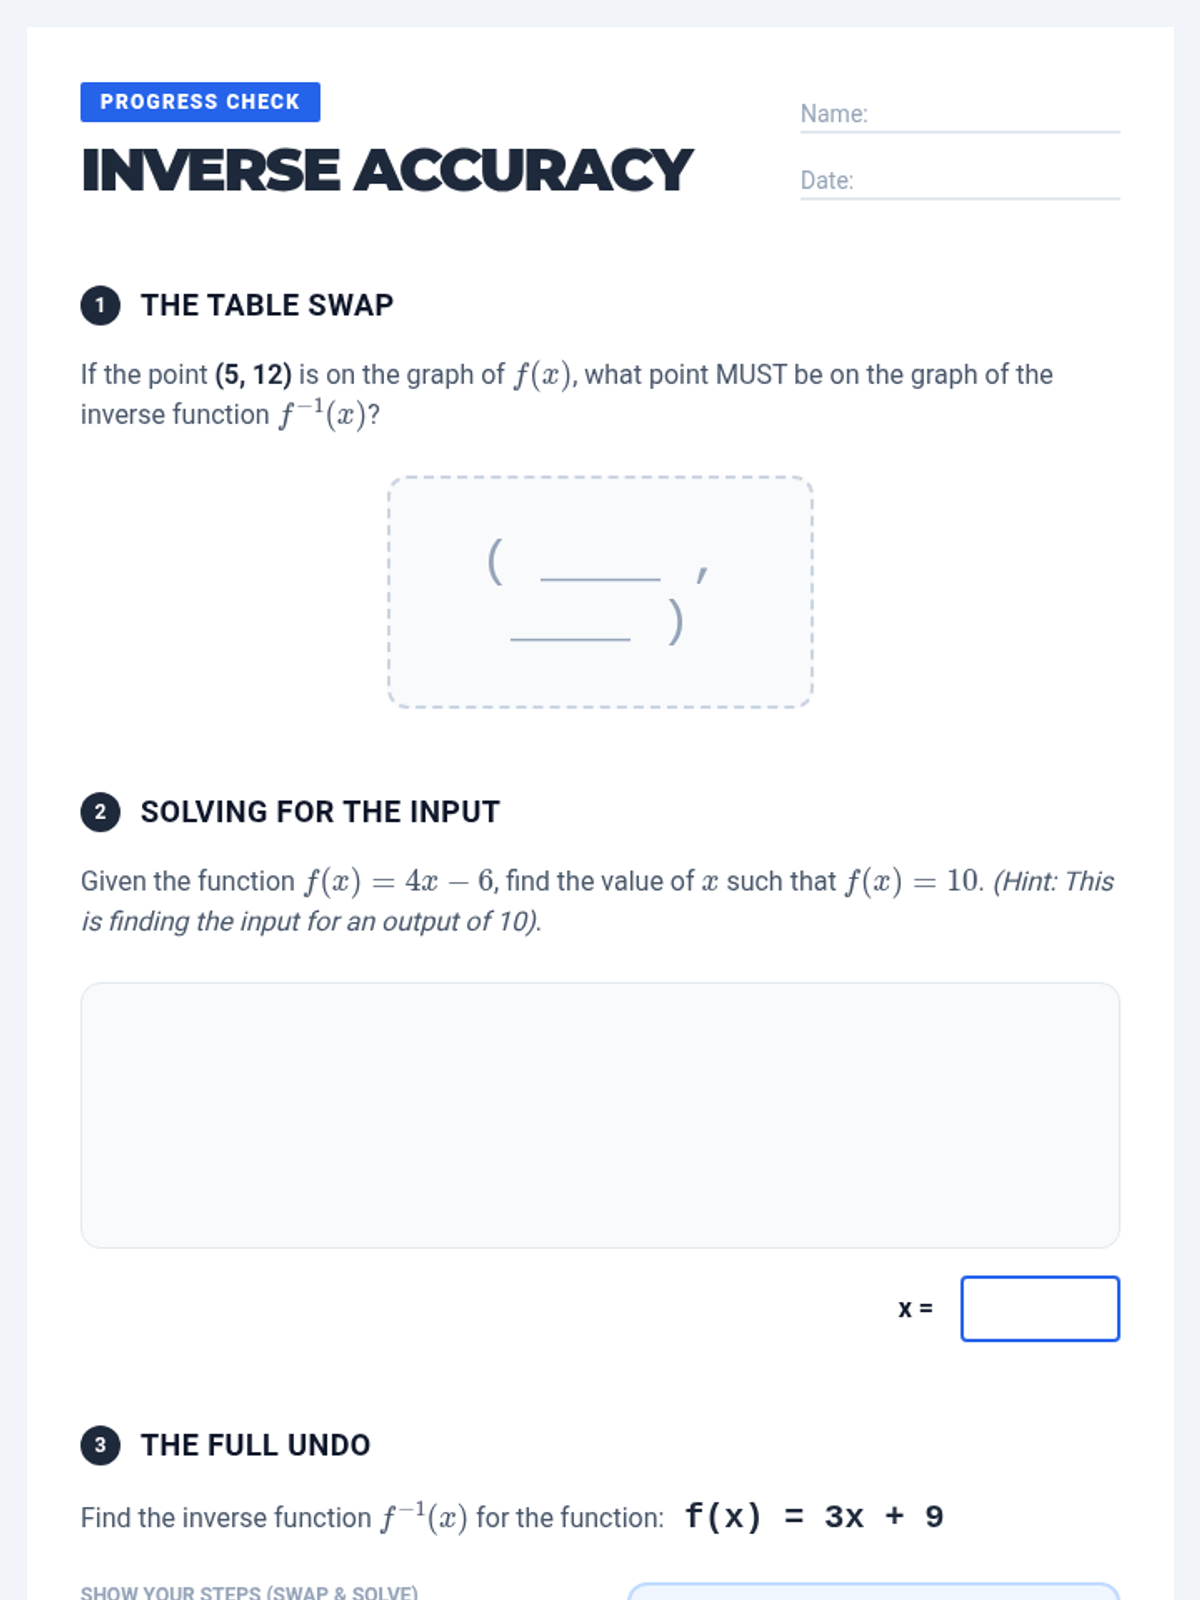
A Tier 2 intervention sequence focused on the conceptual and algebraic foundations of inverse functions. Students move from reversing input-output tables to solving algebraic equations to find inverse expressions.
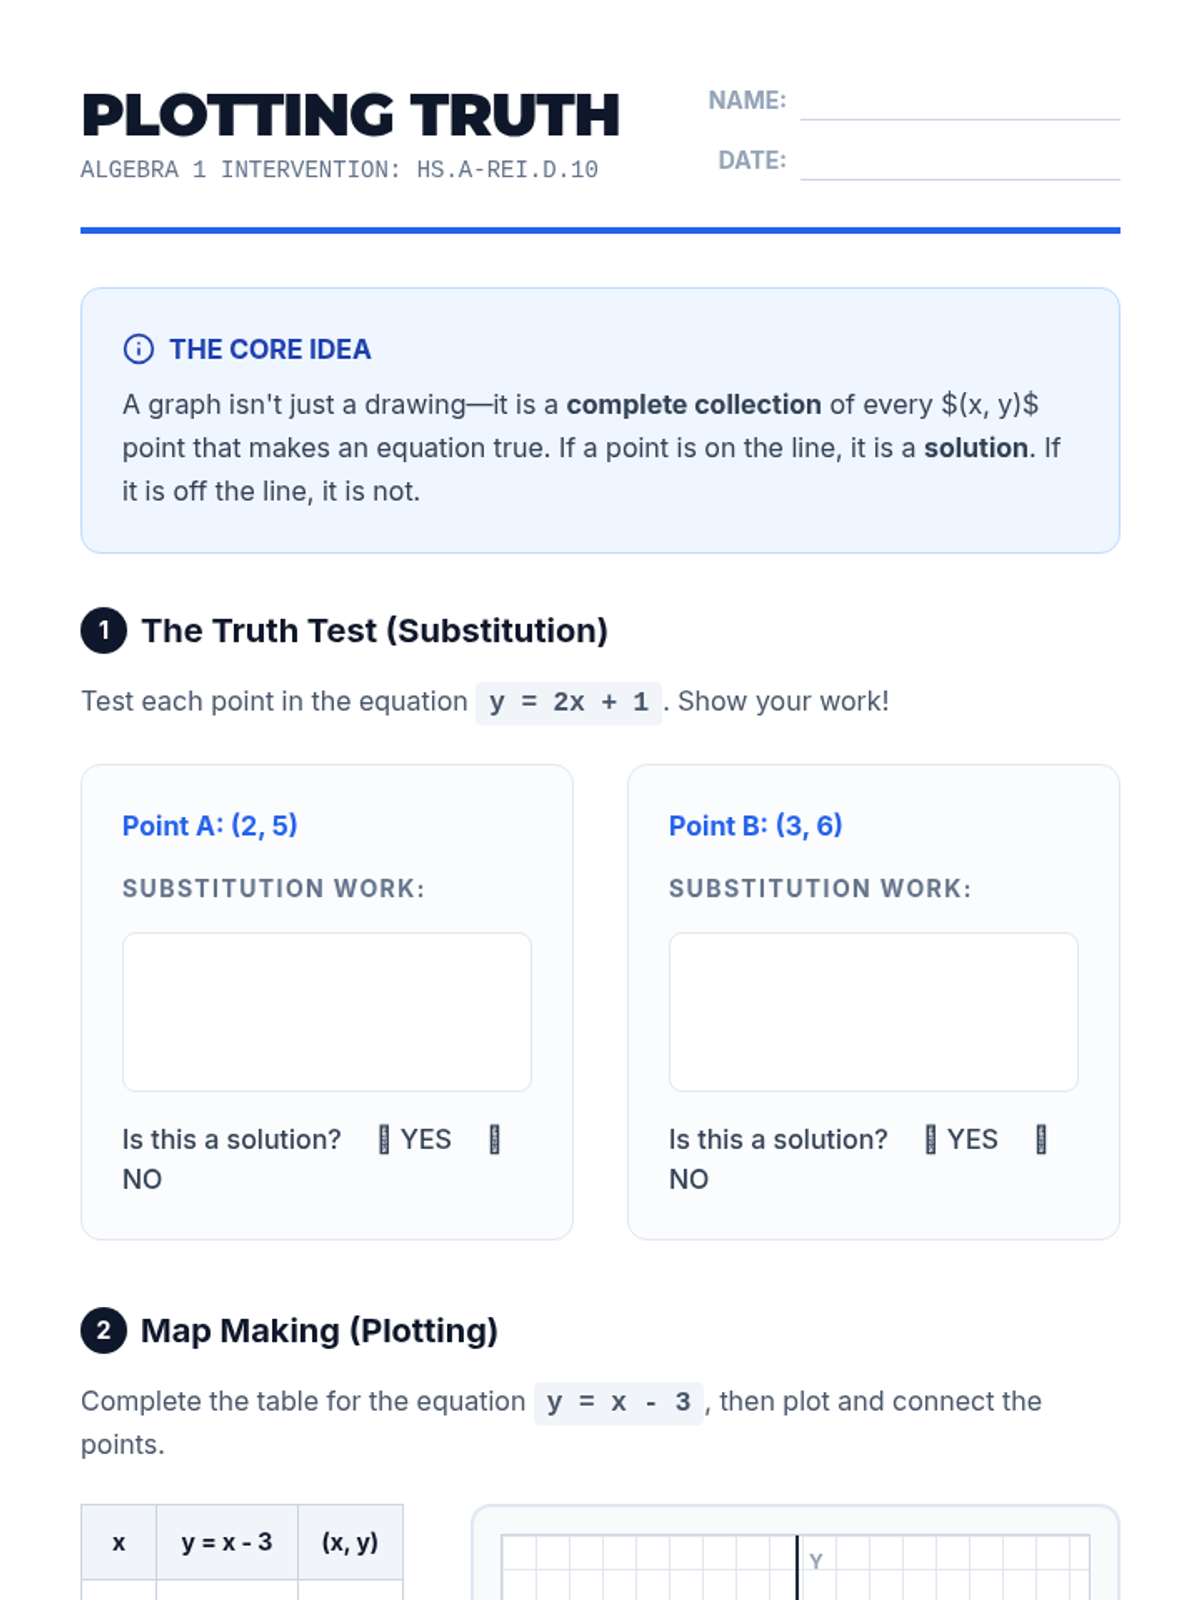
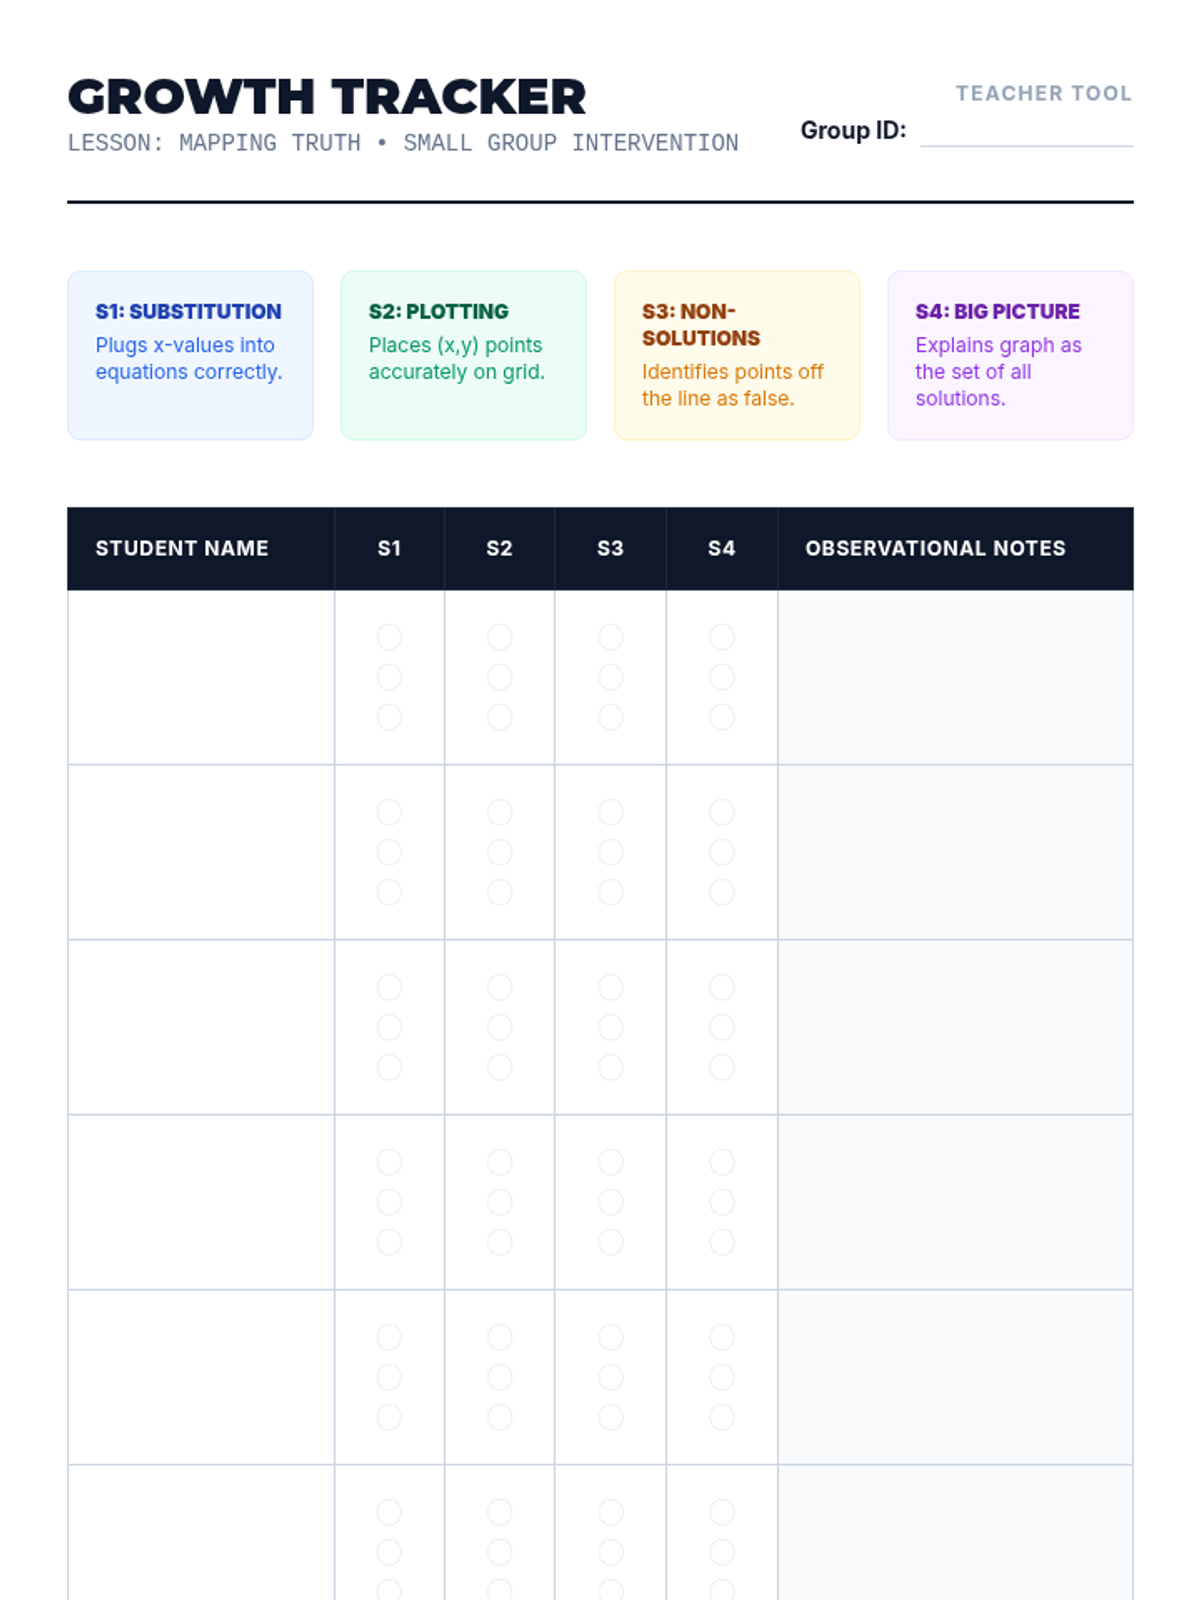
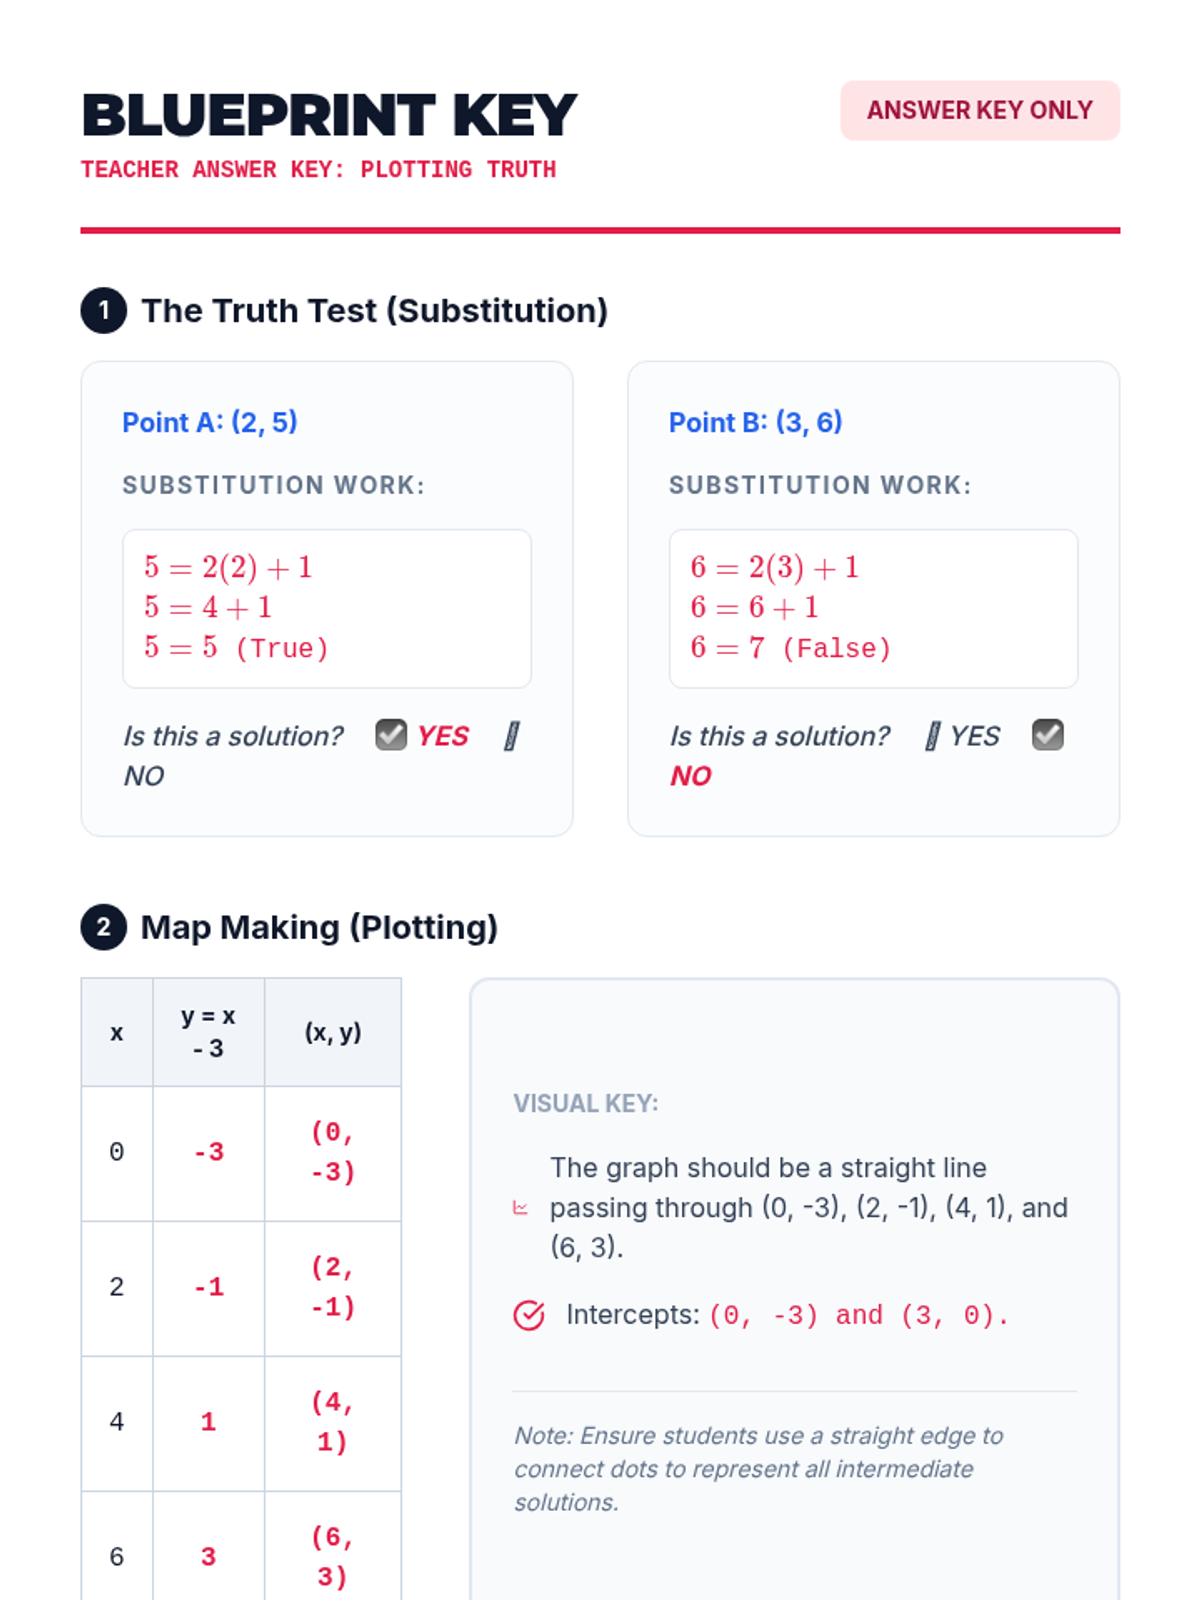
A Tier 2 intervention sequence focused on understanding the relationship between algebraic equations in two variables and their graphical representations as sets of solutions.
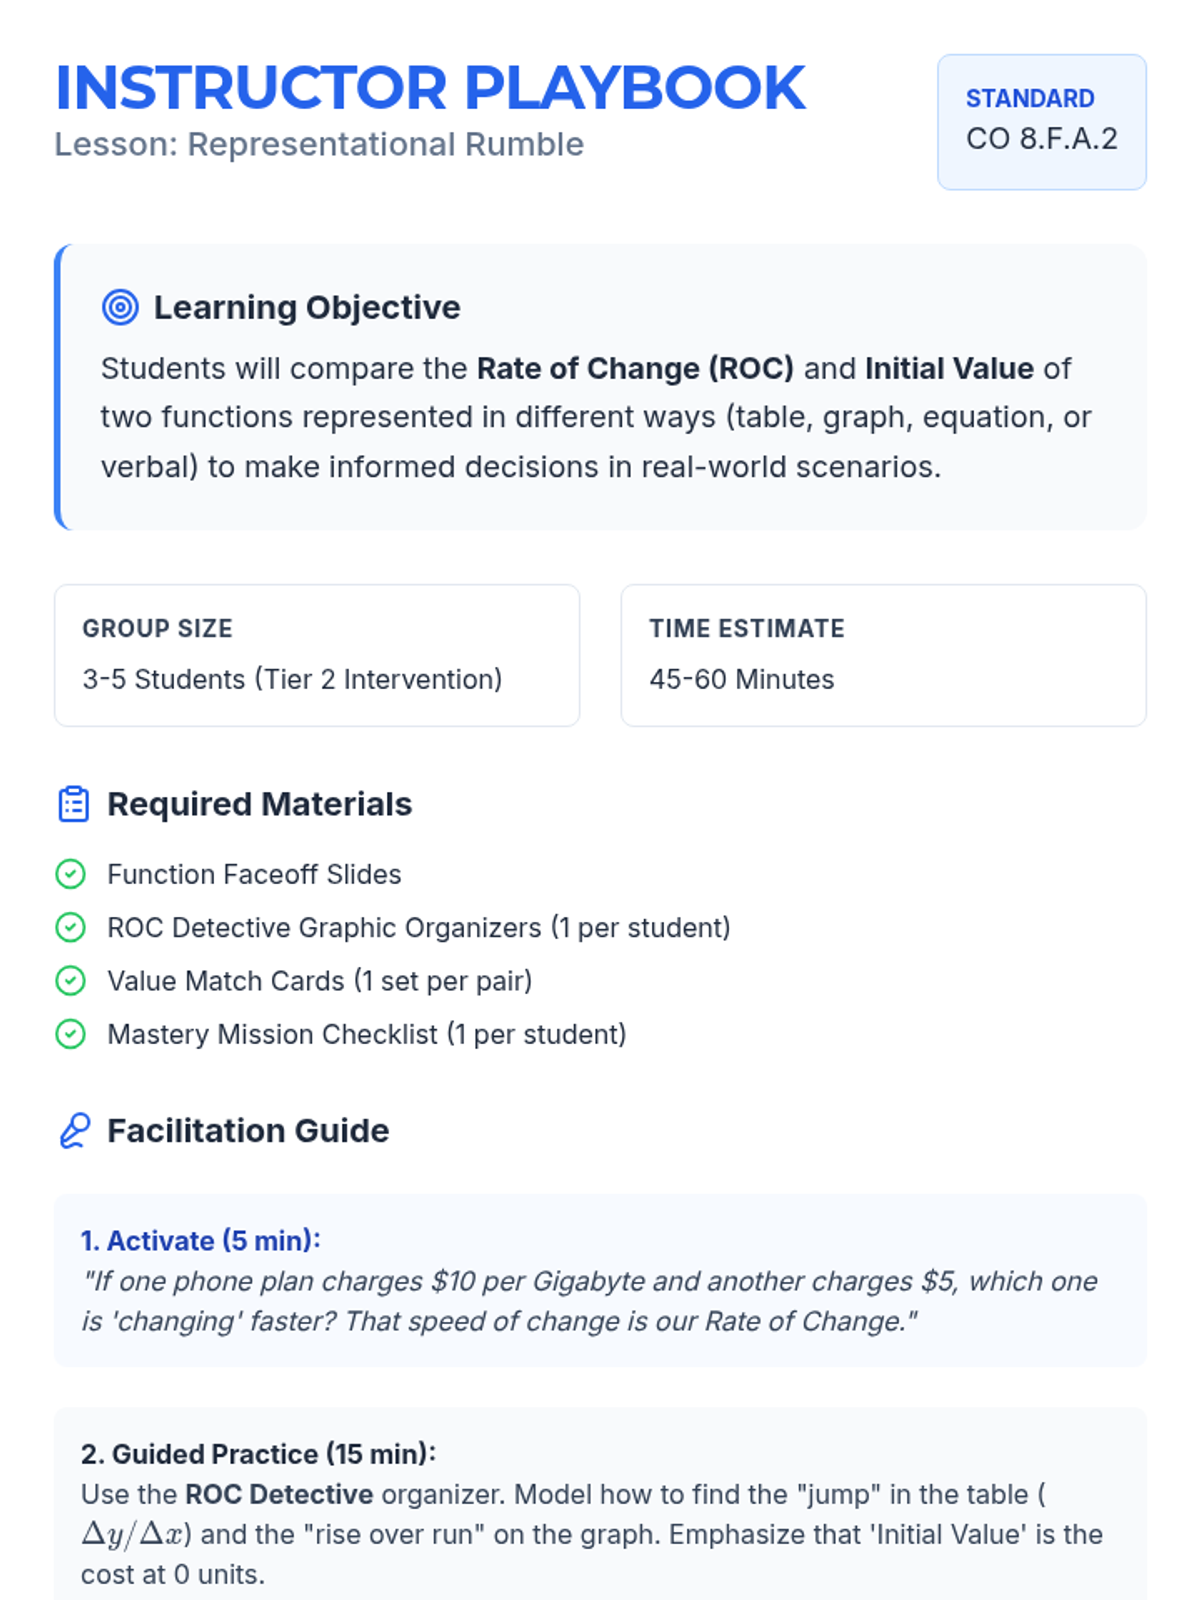
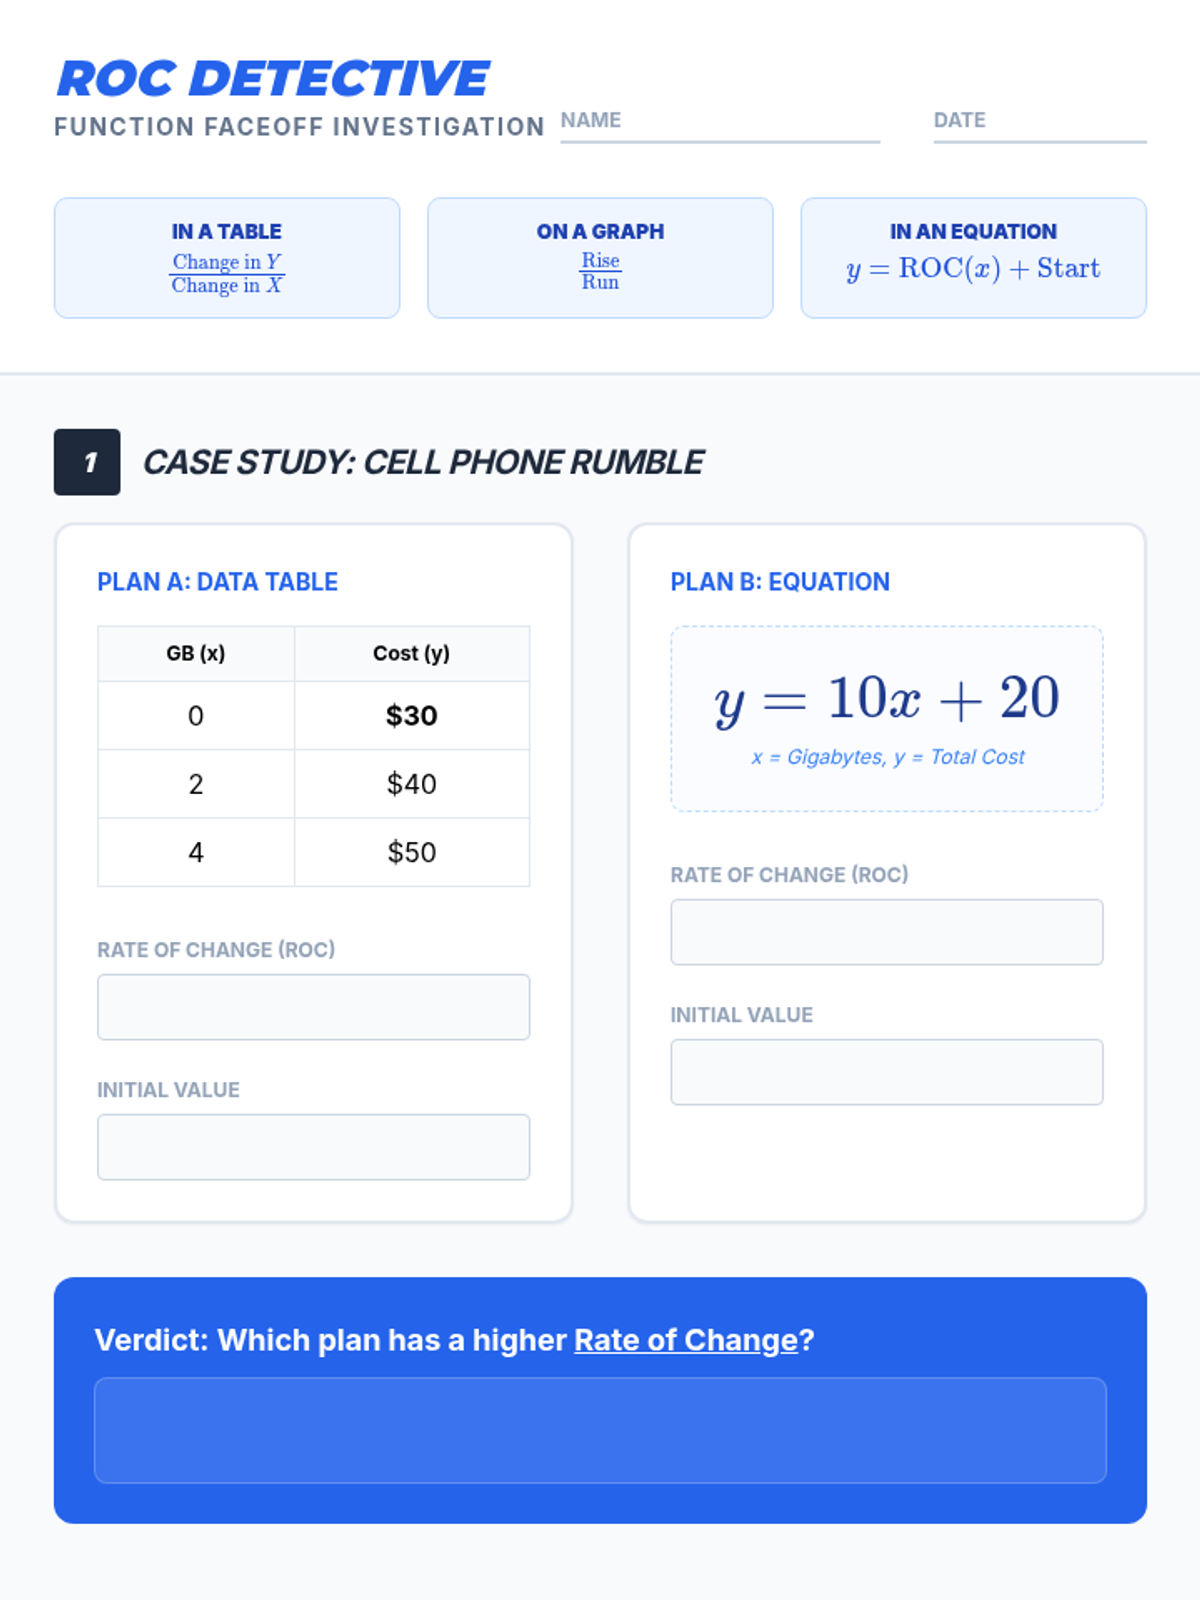
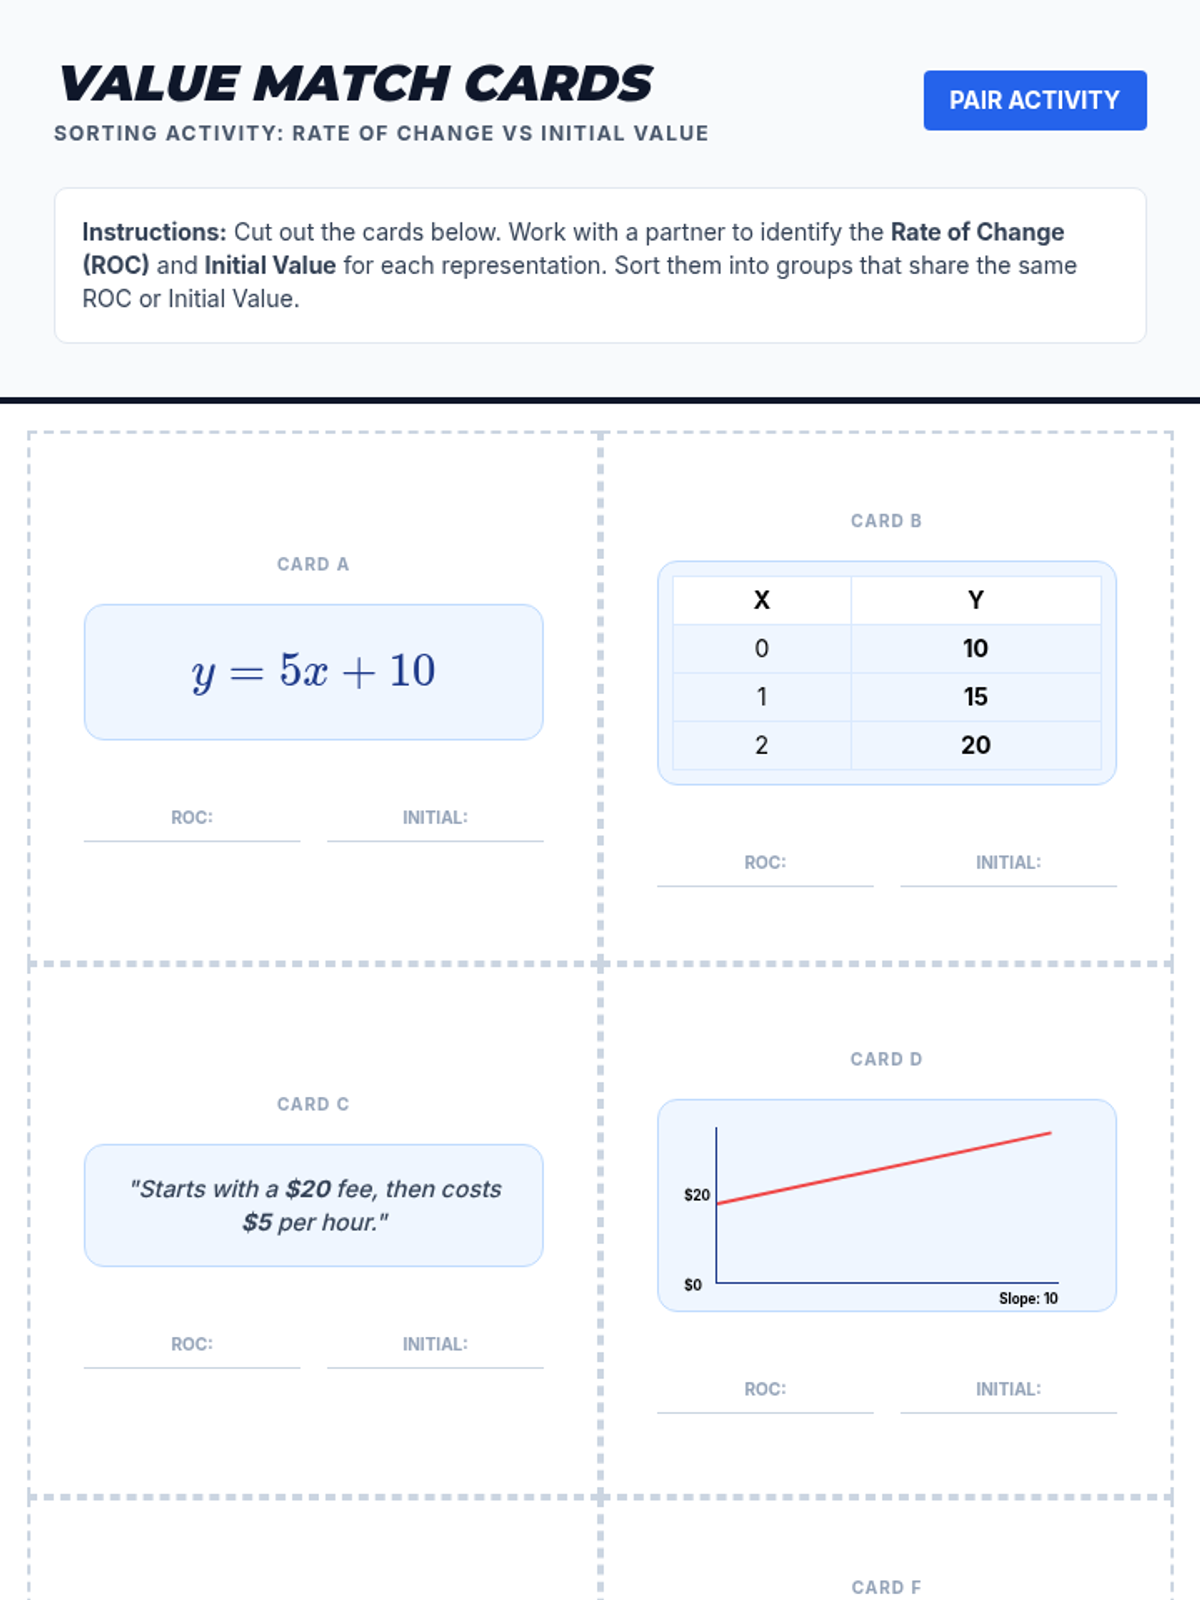
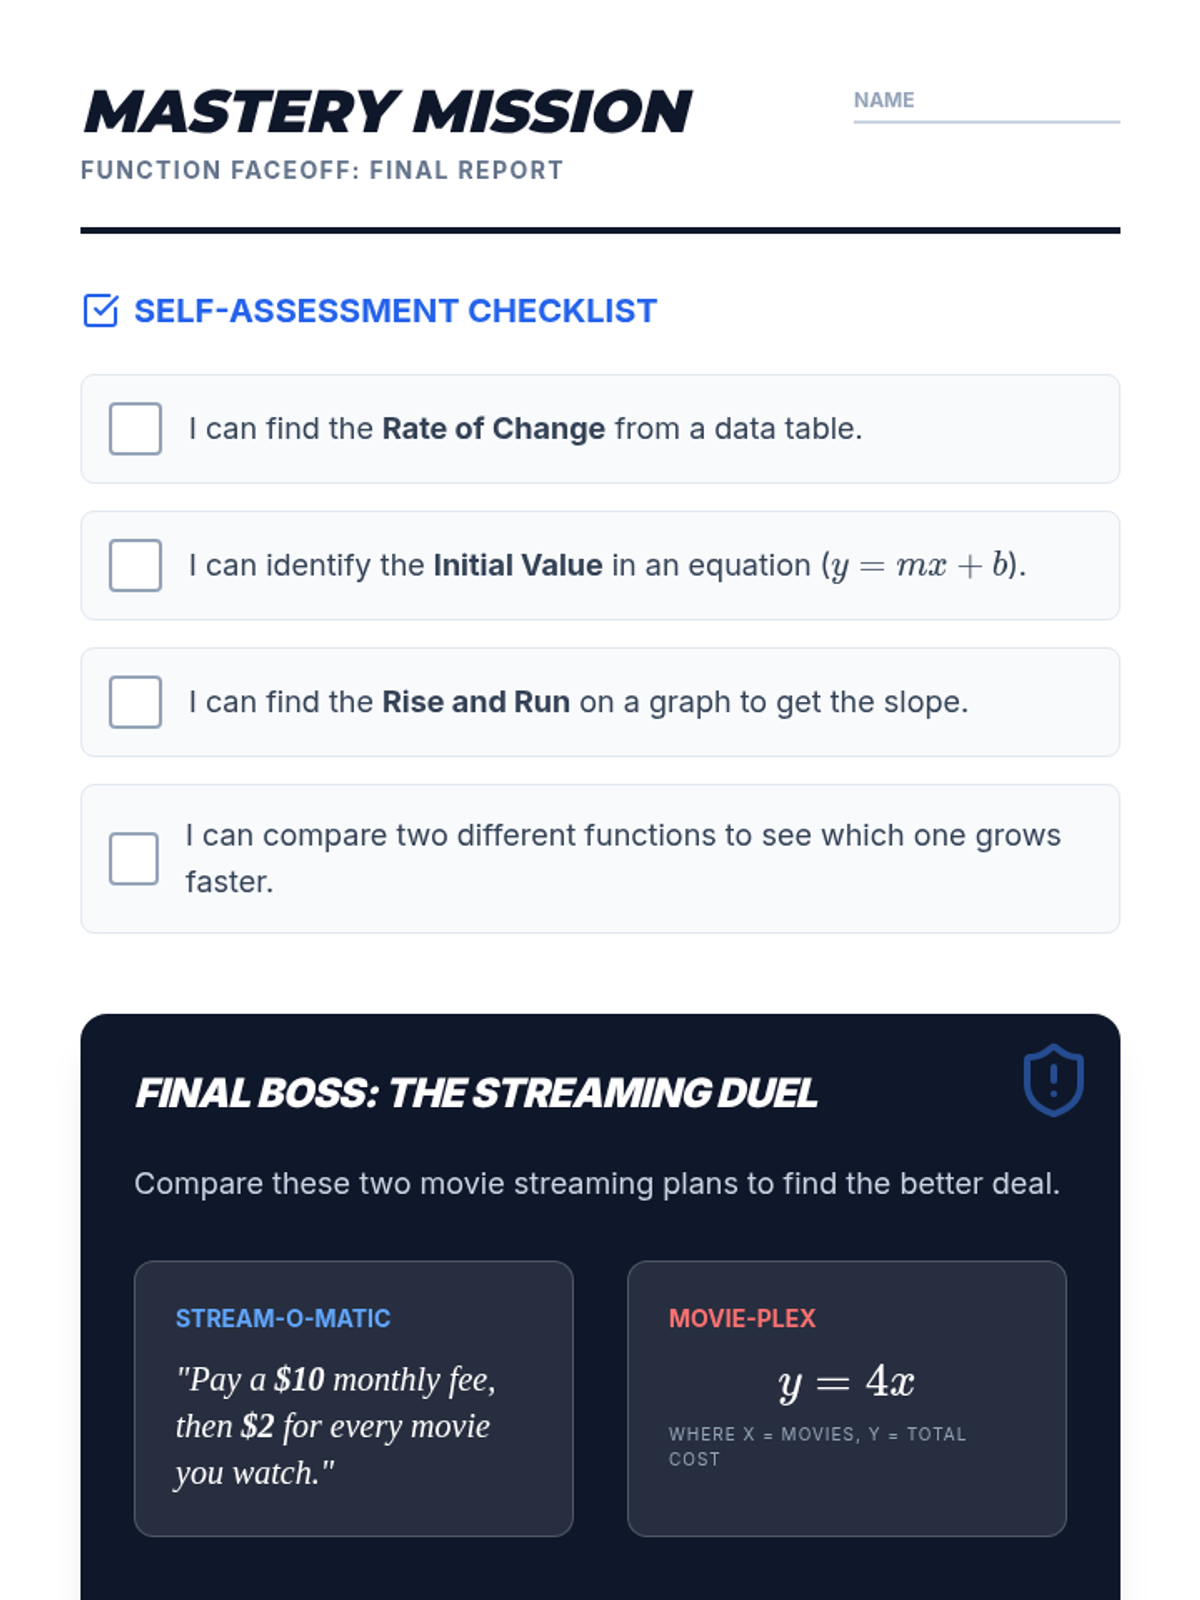
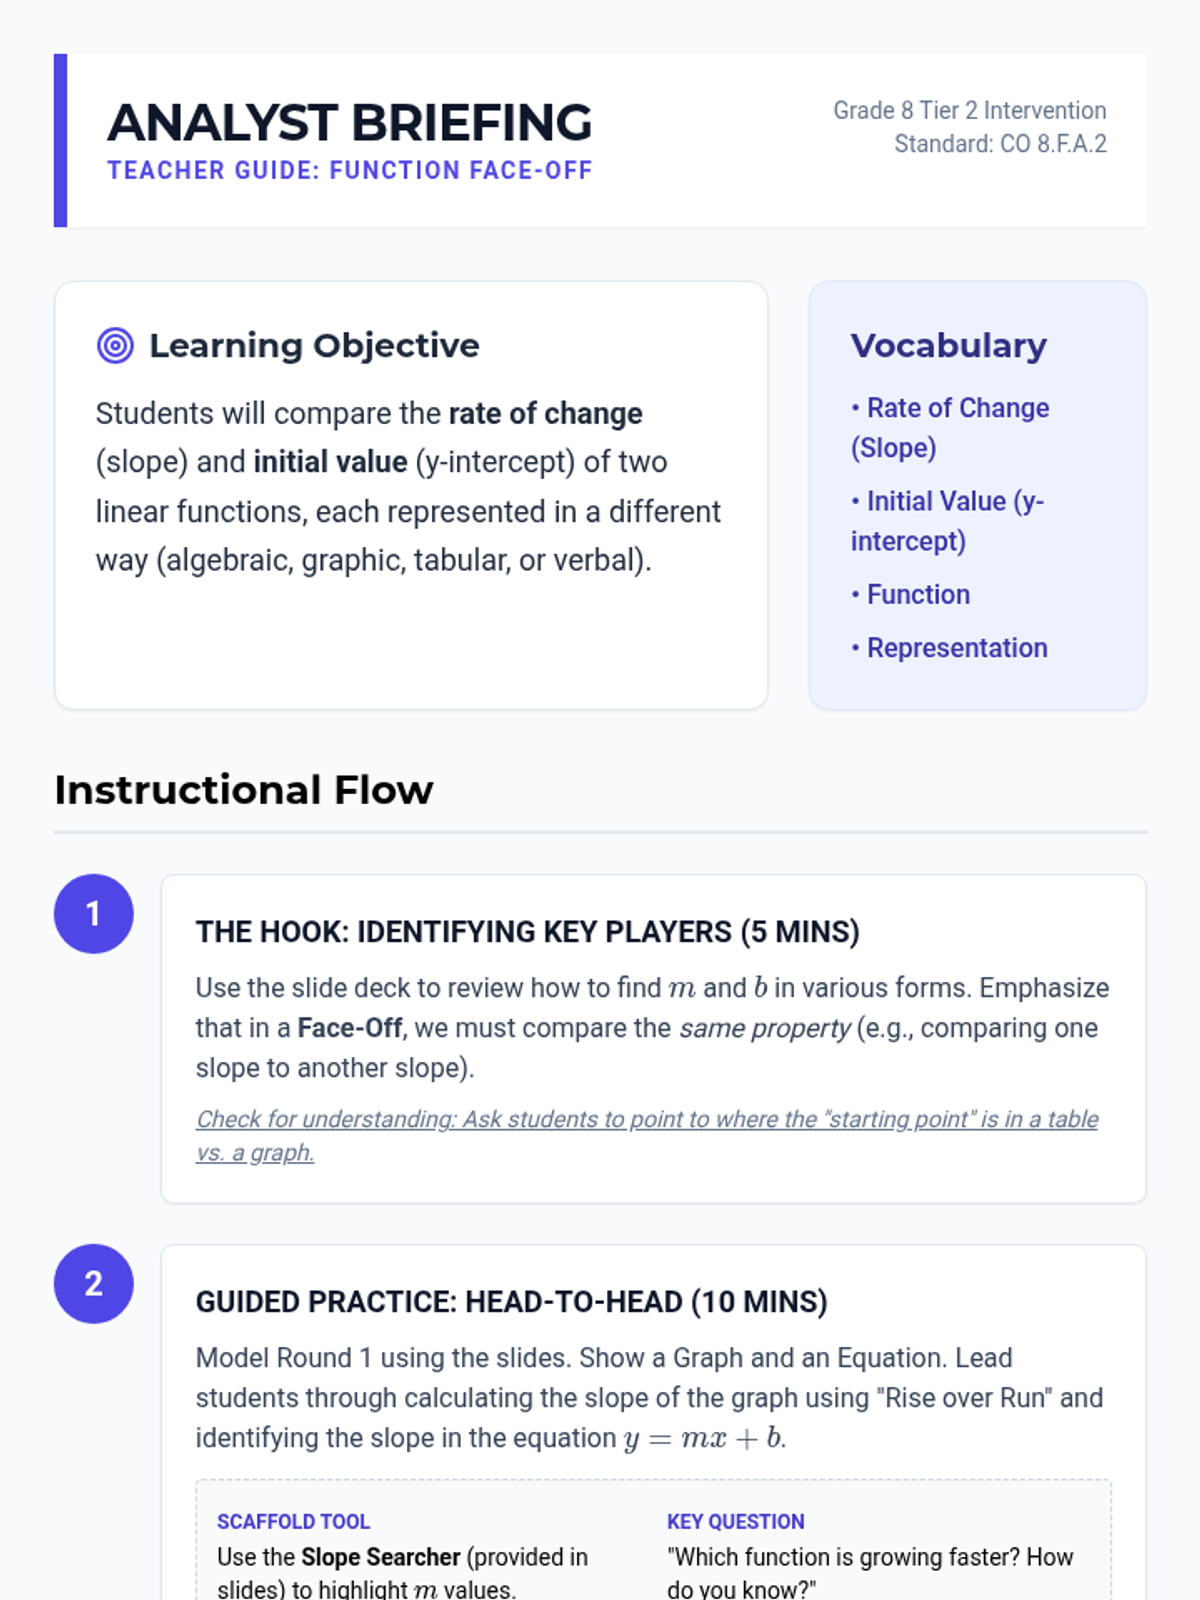
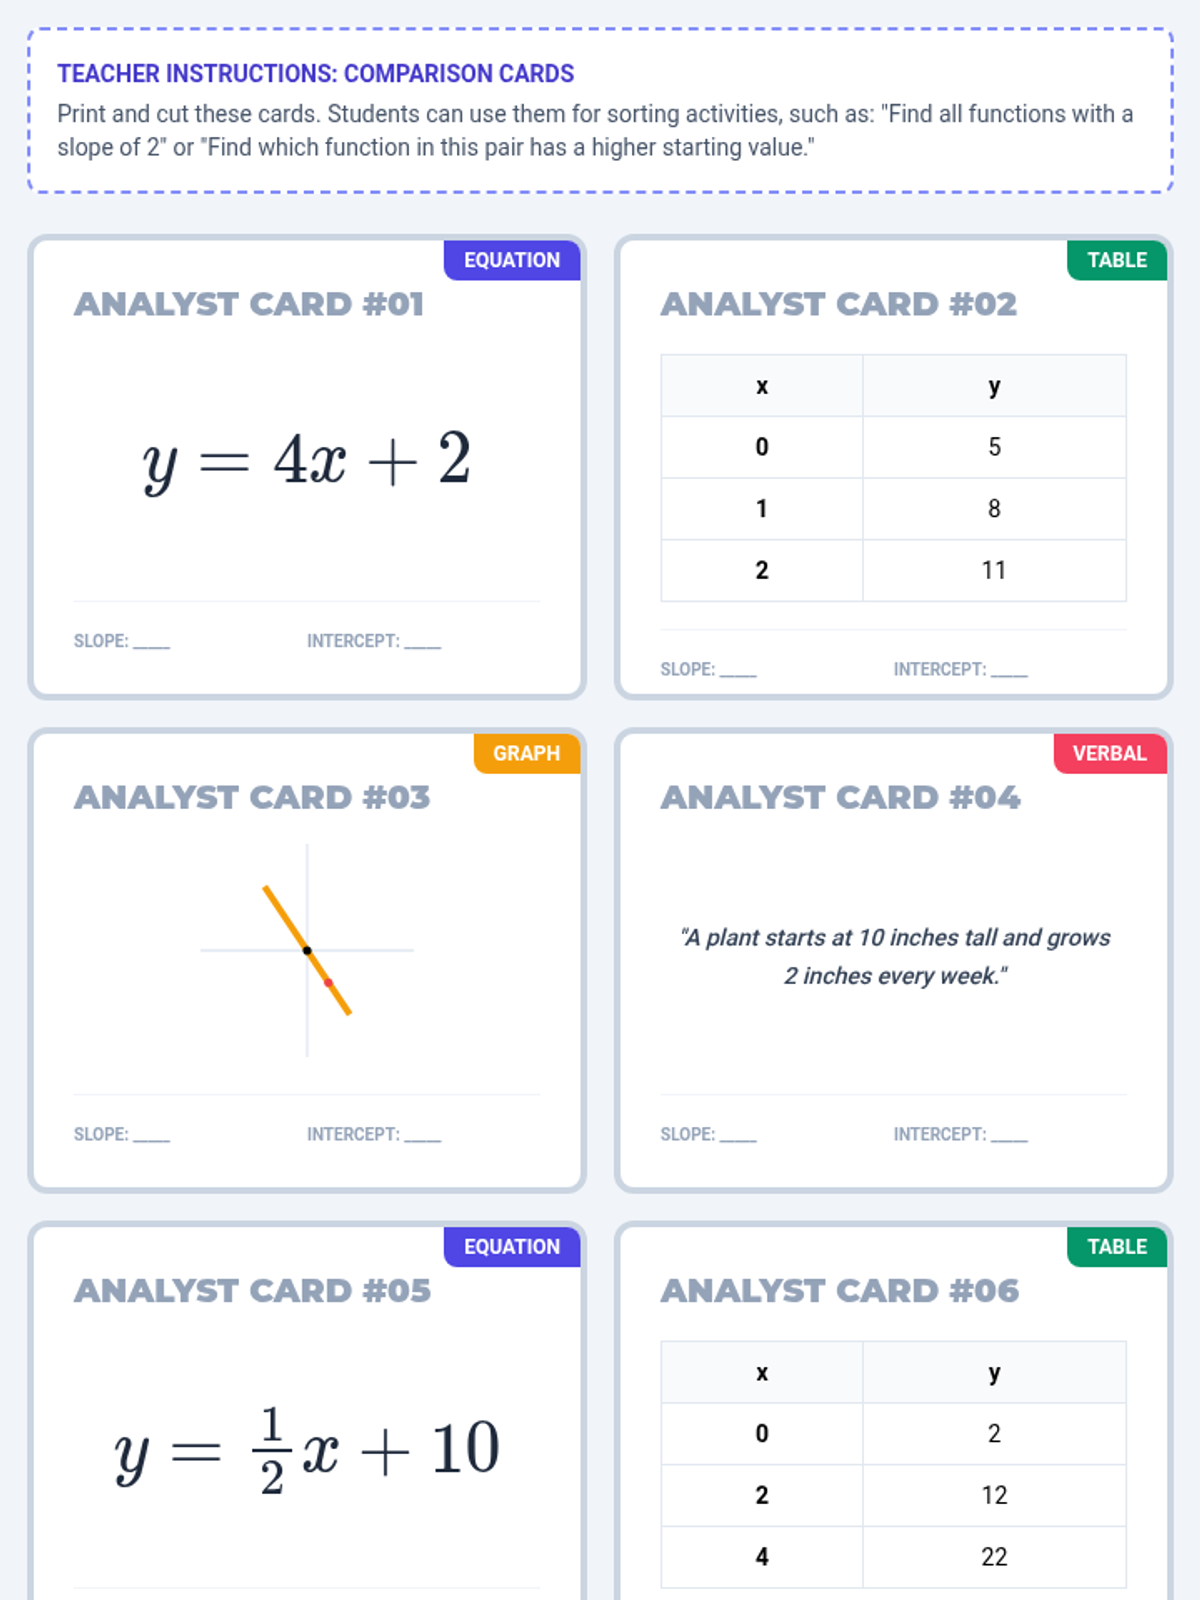
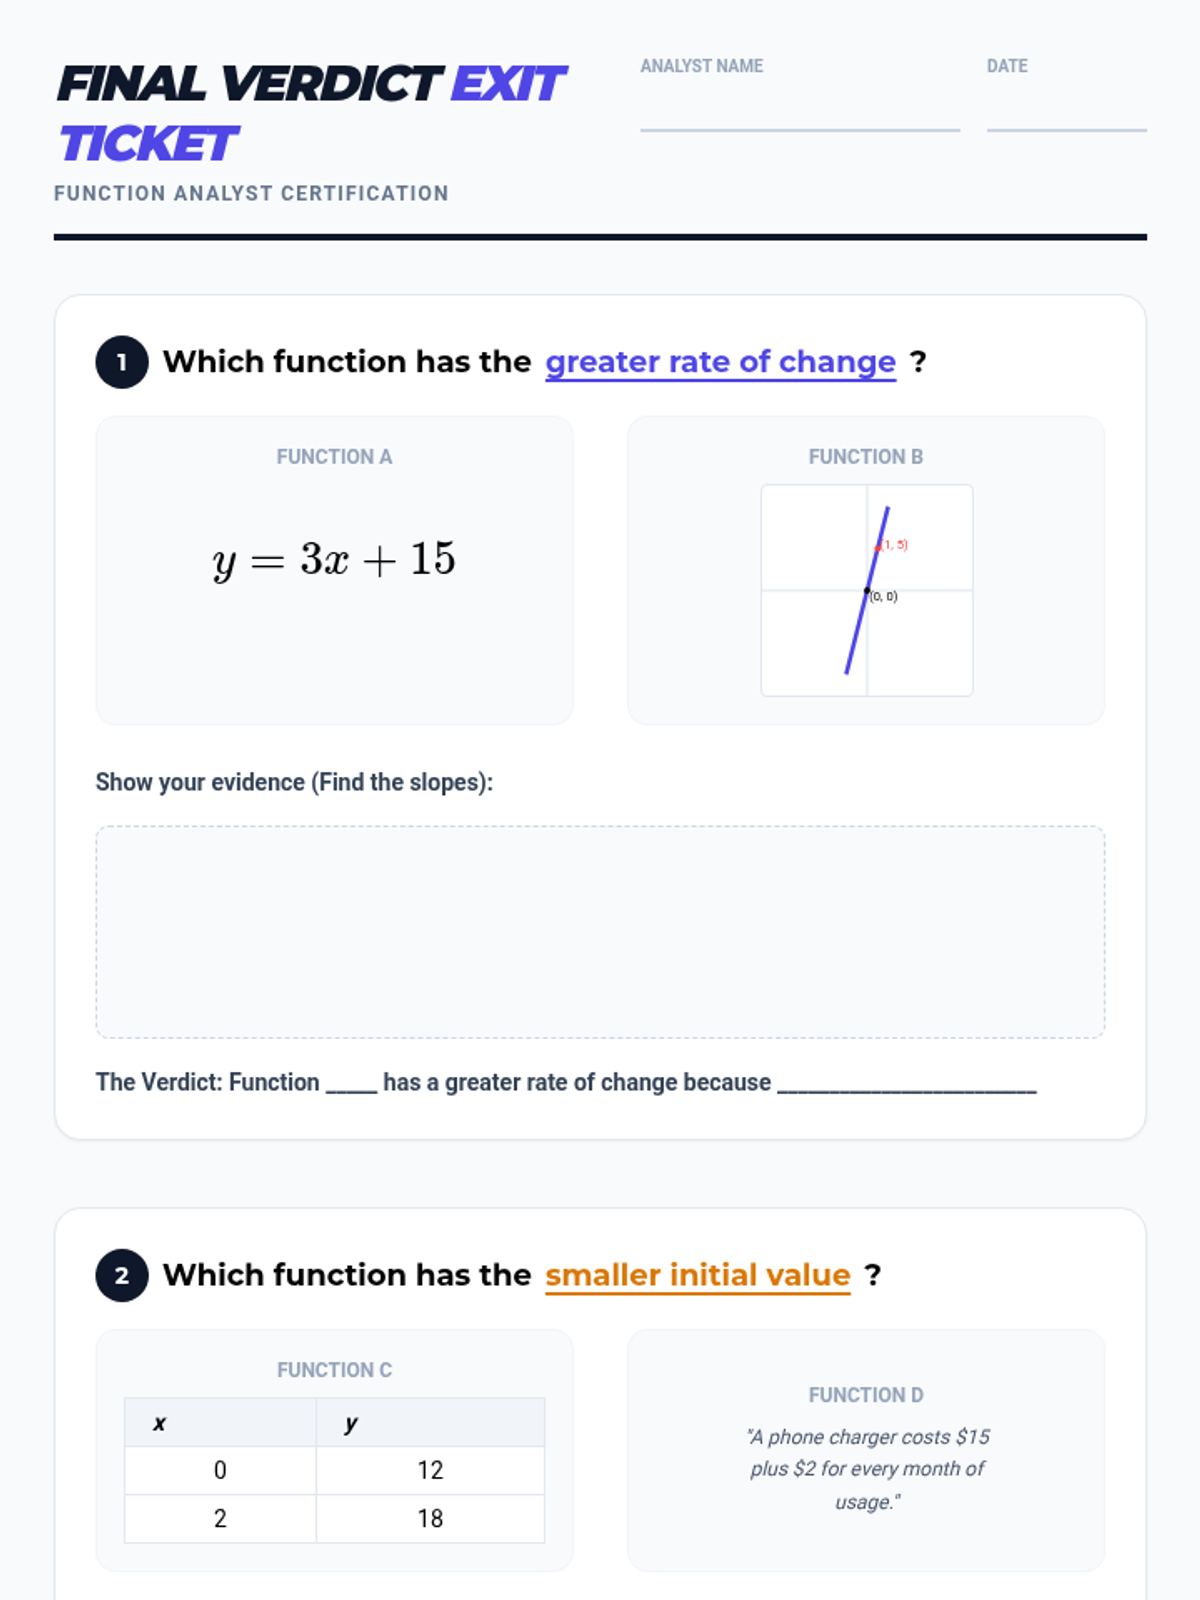
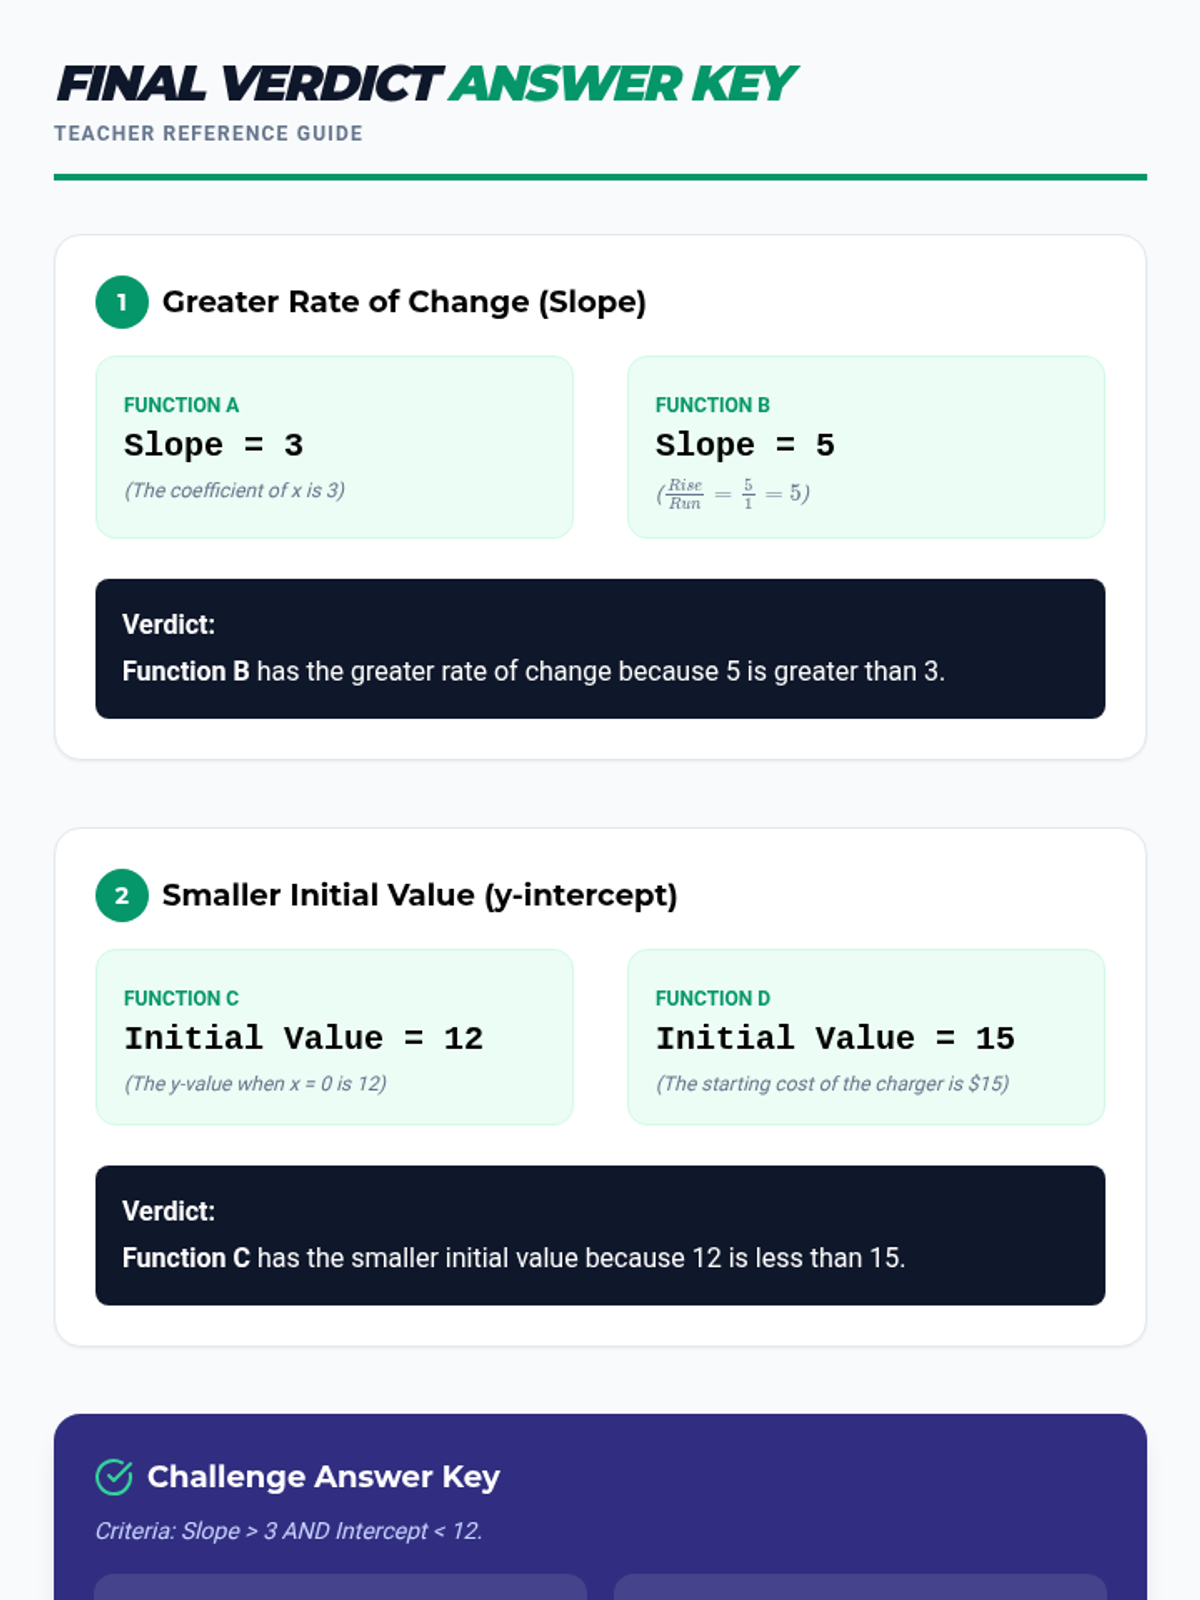
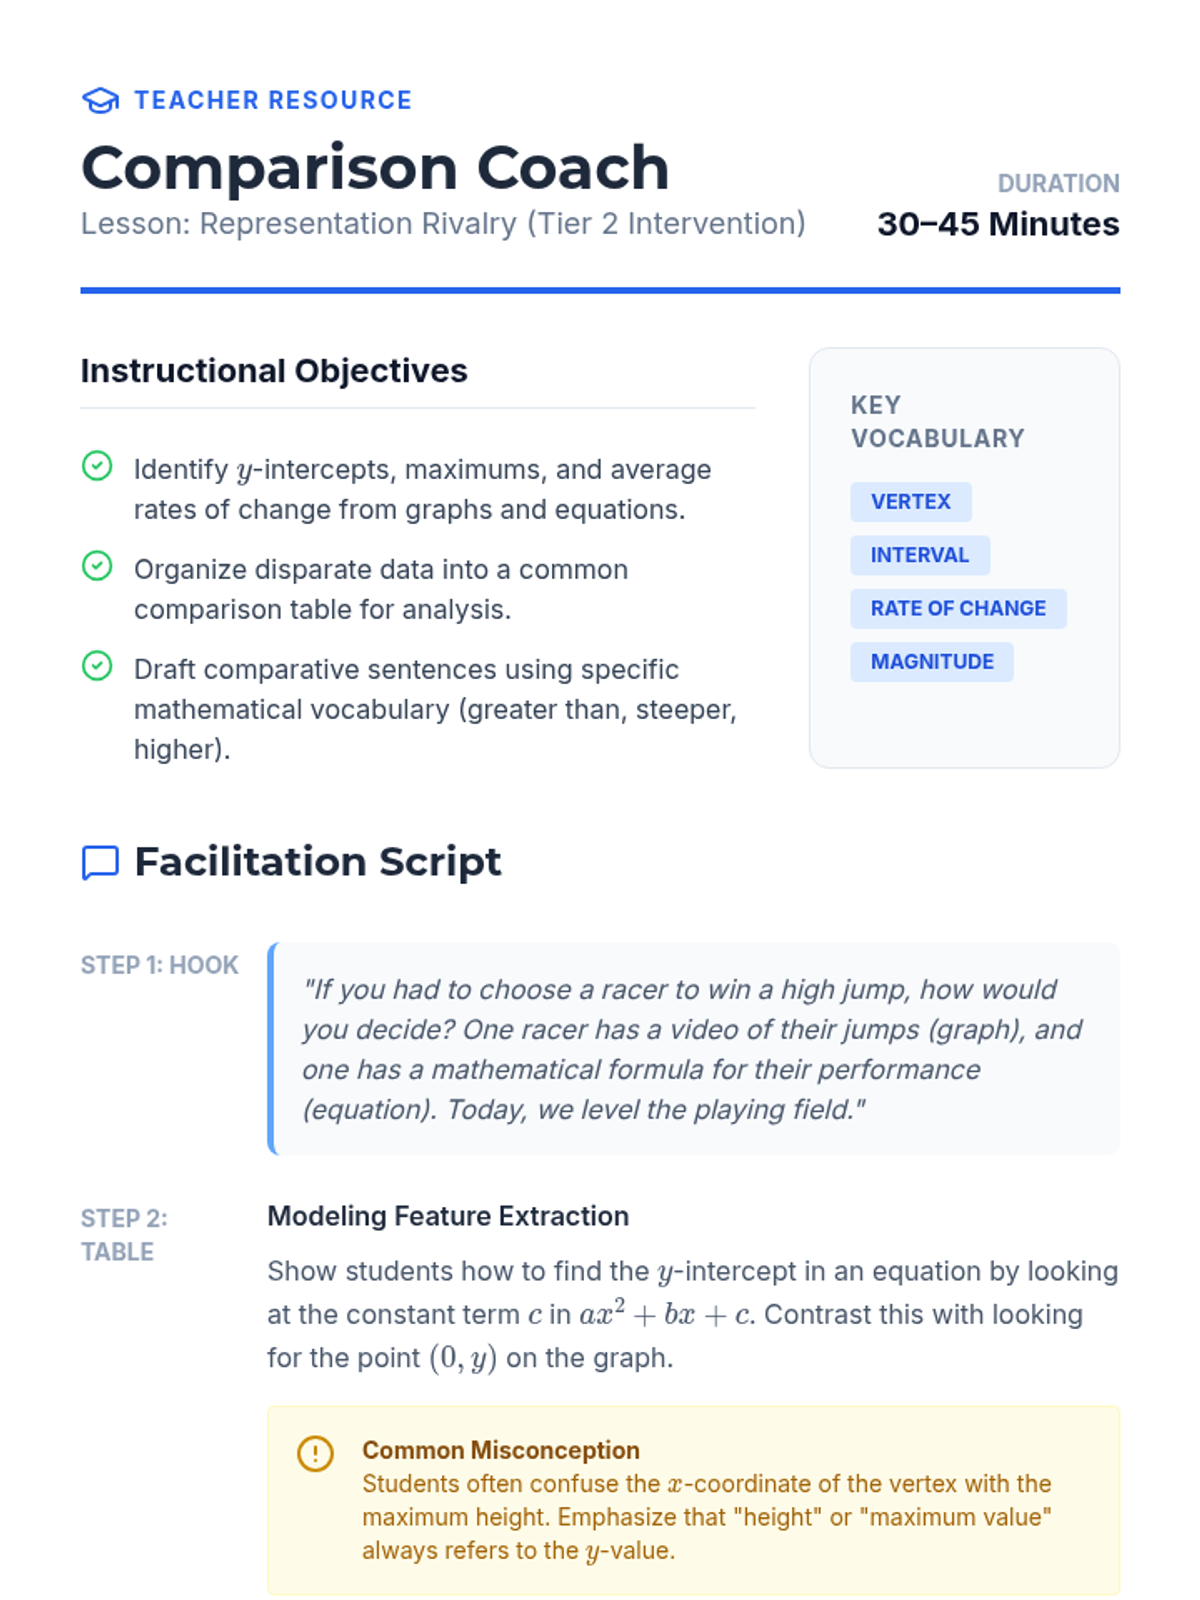
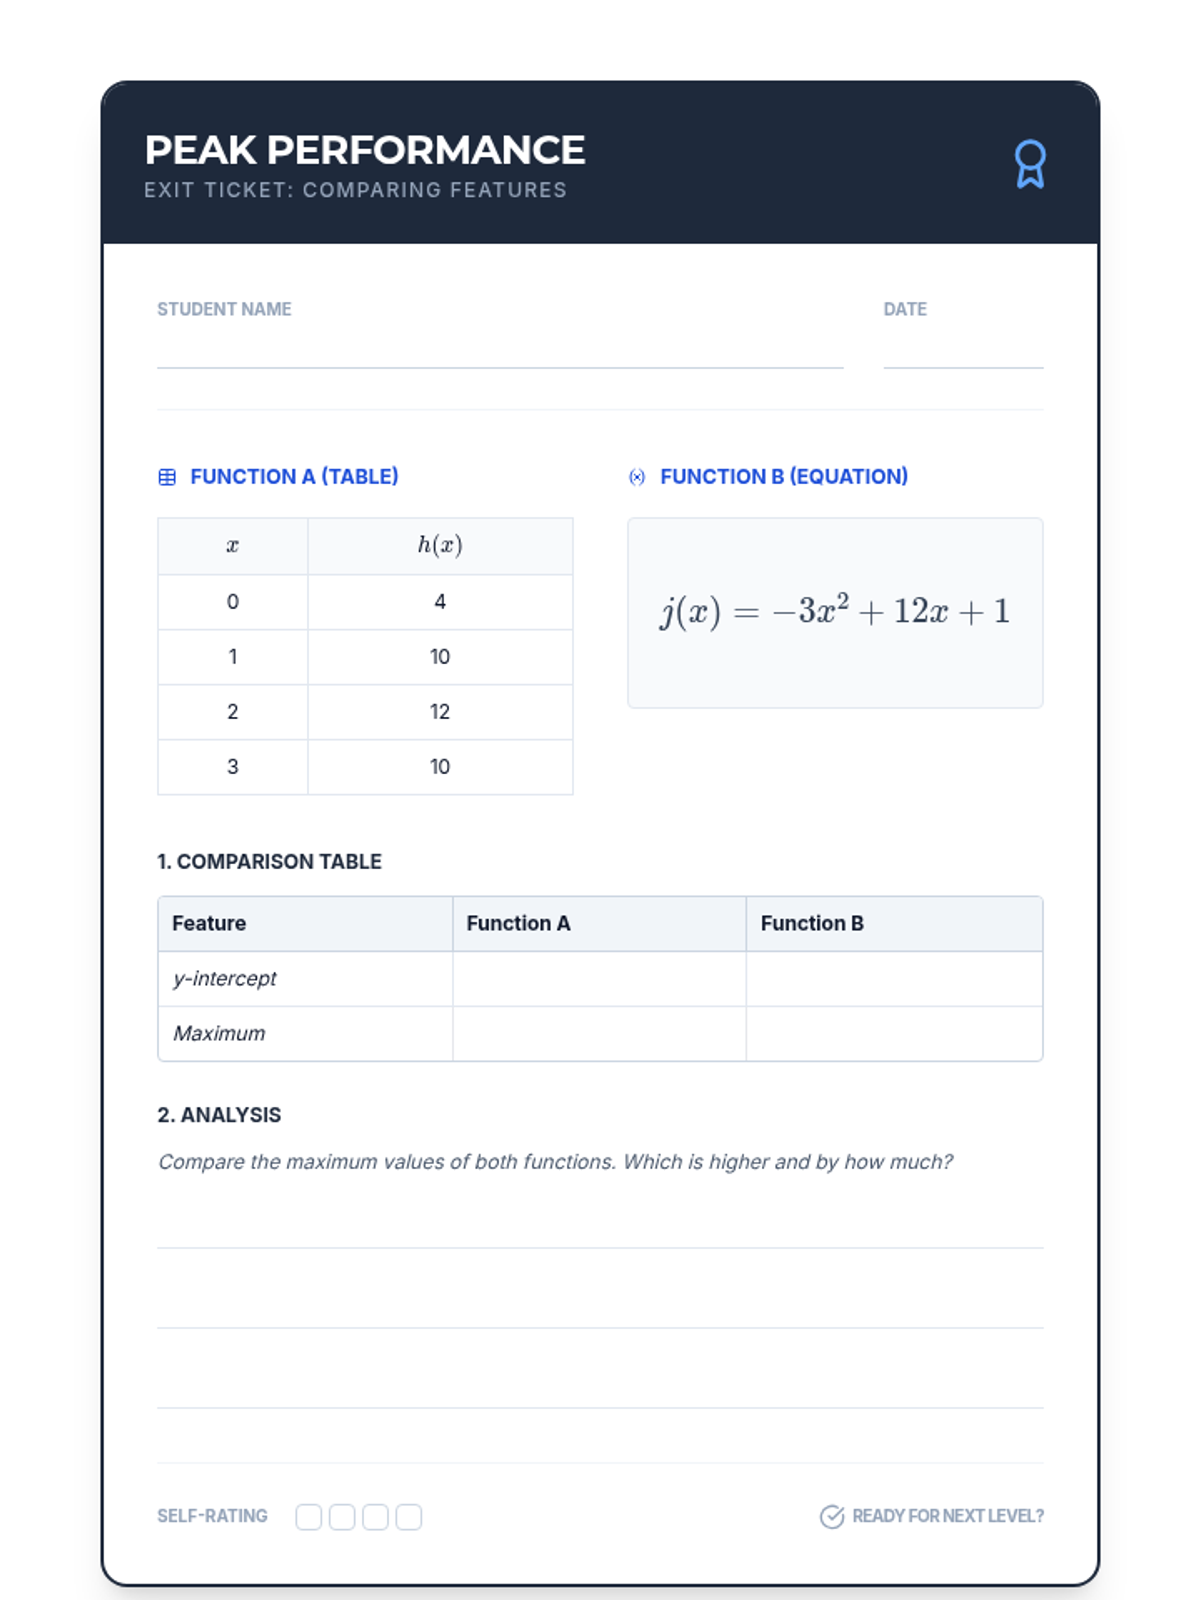
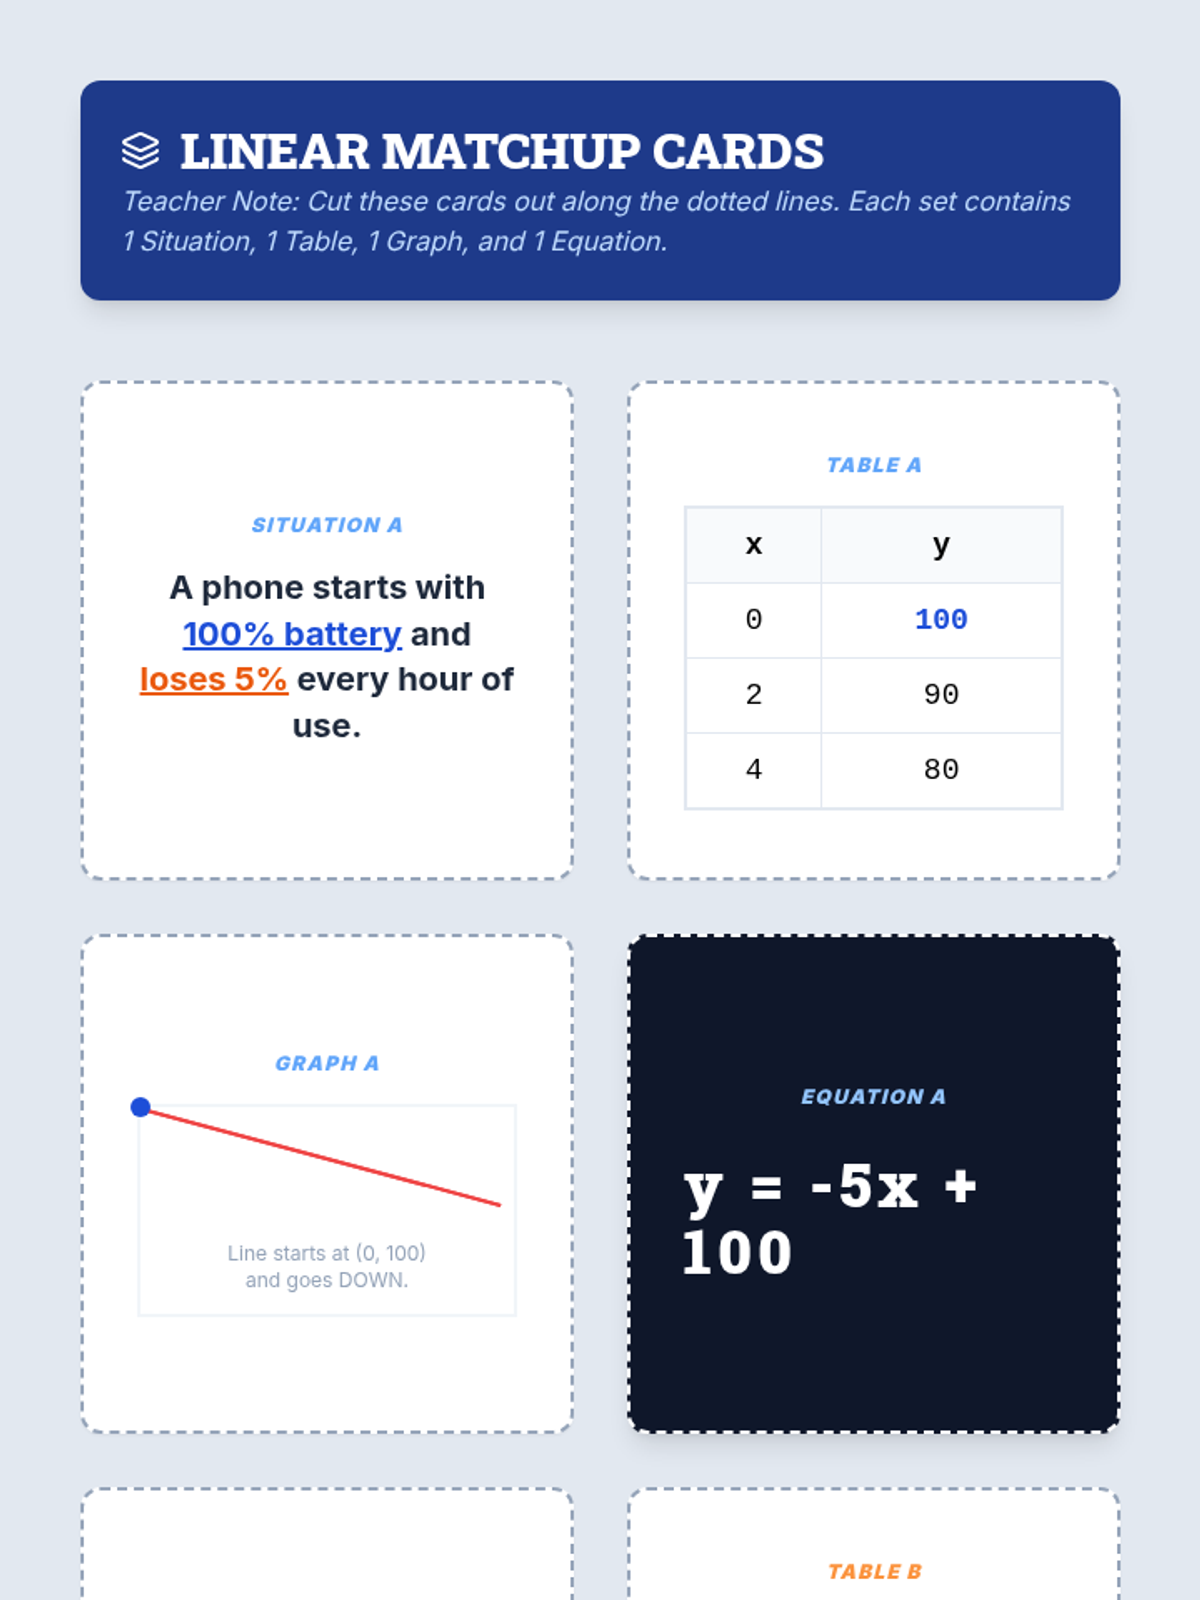
A Tier 2 intervention unit focused on comparing linear functions across different representations (tables, graphs, equations, and verbal descriptions) using real-world contexts.
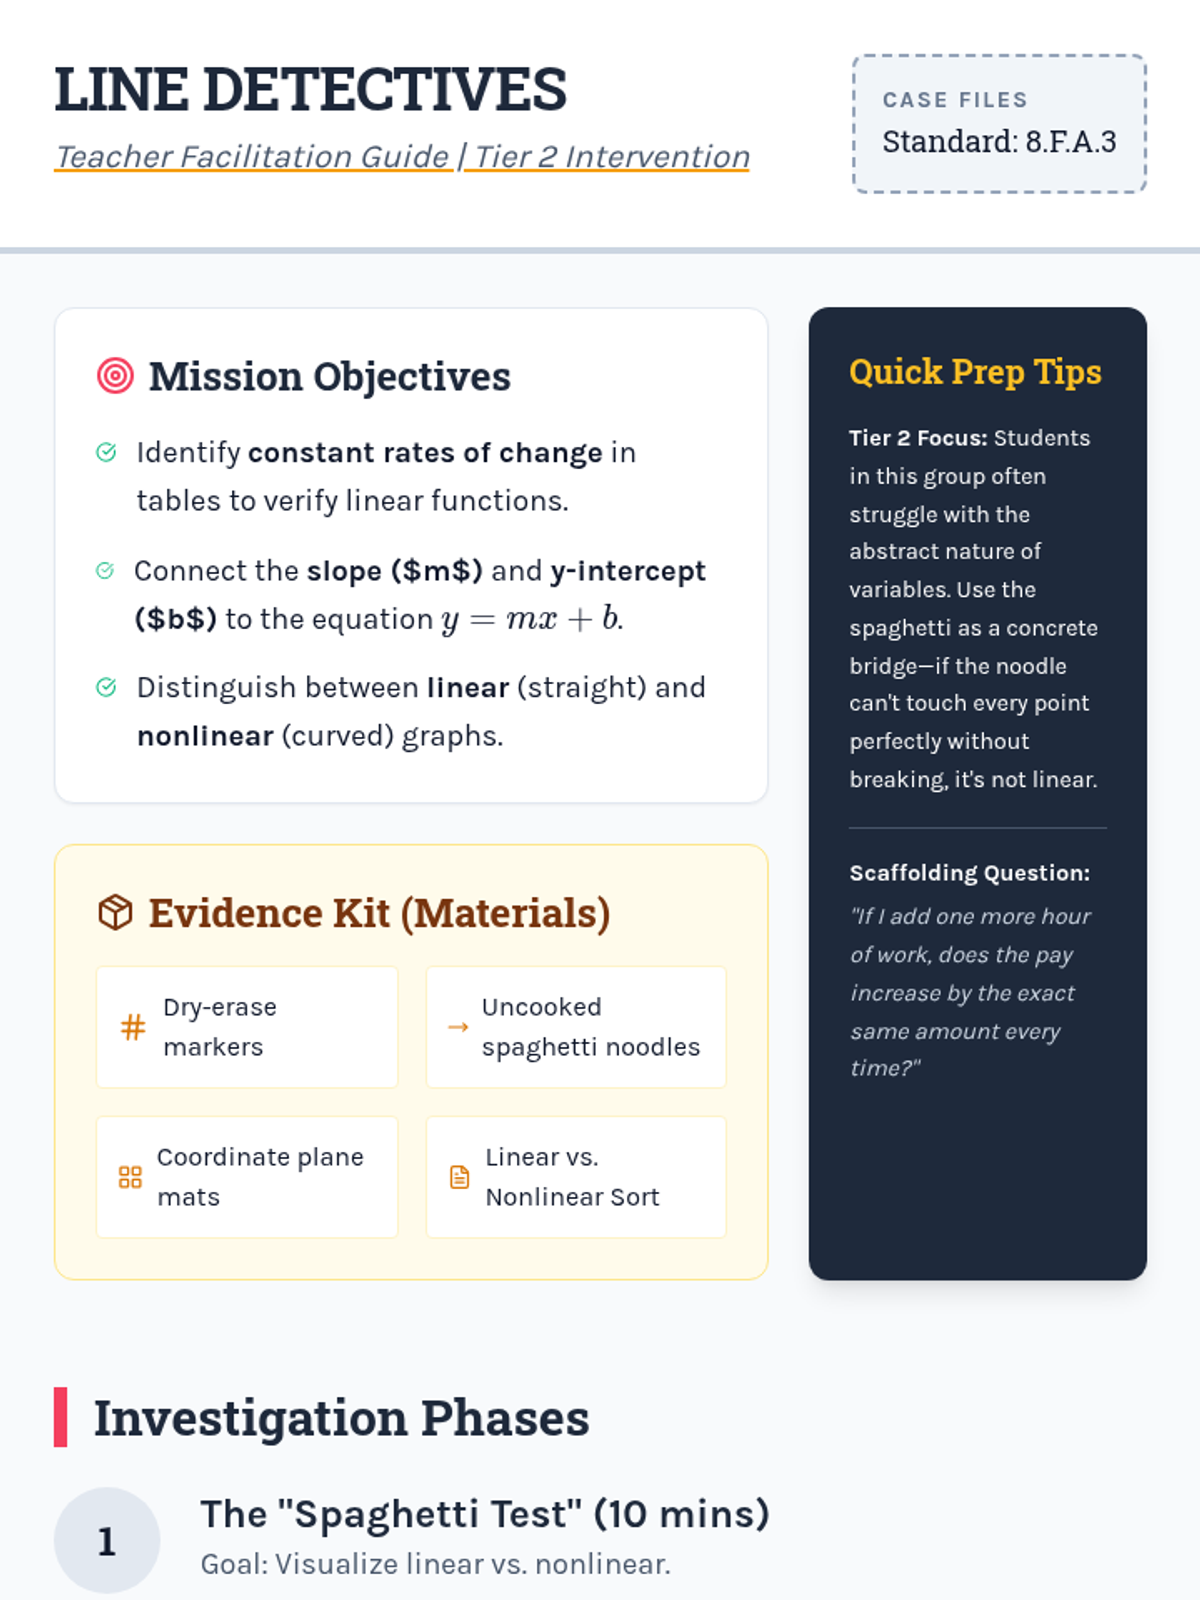
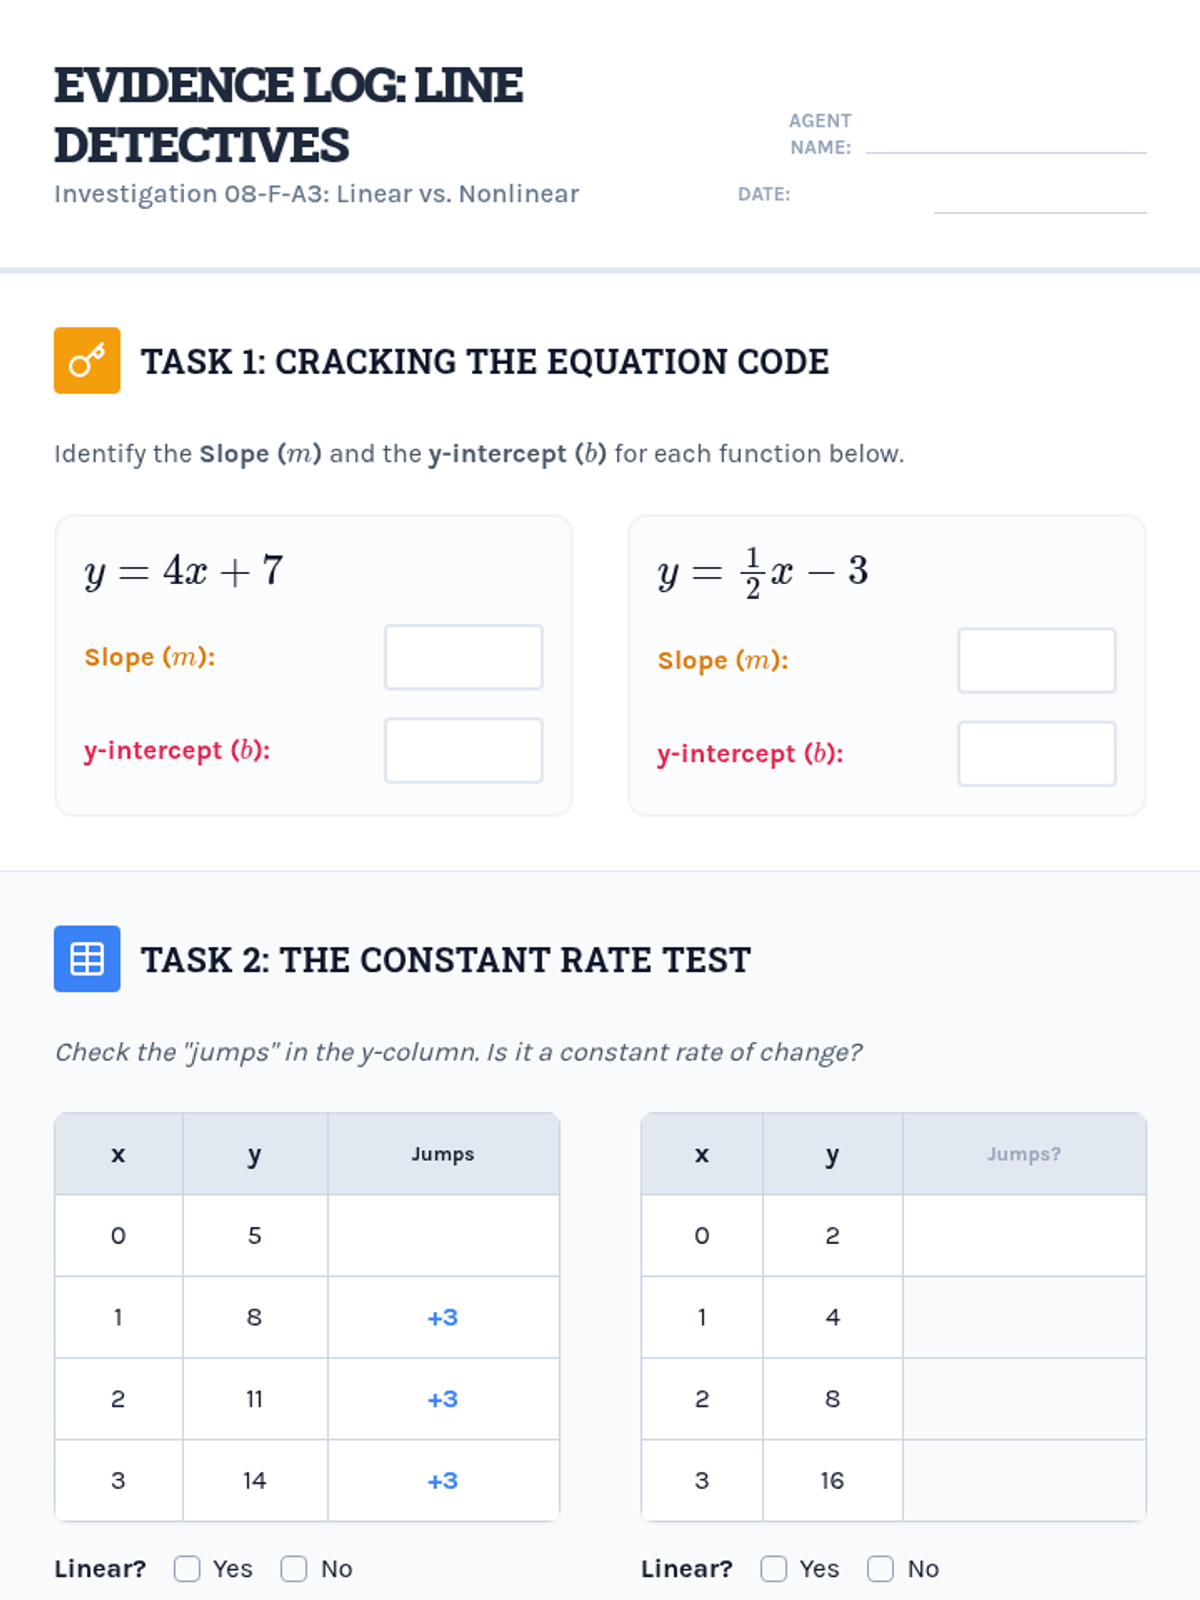
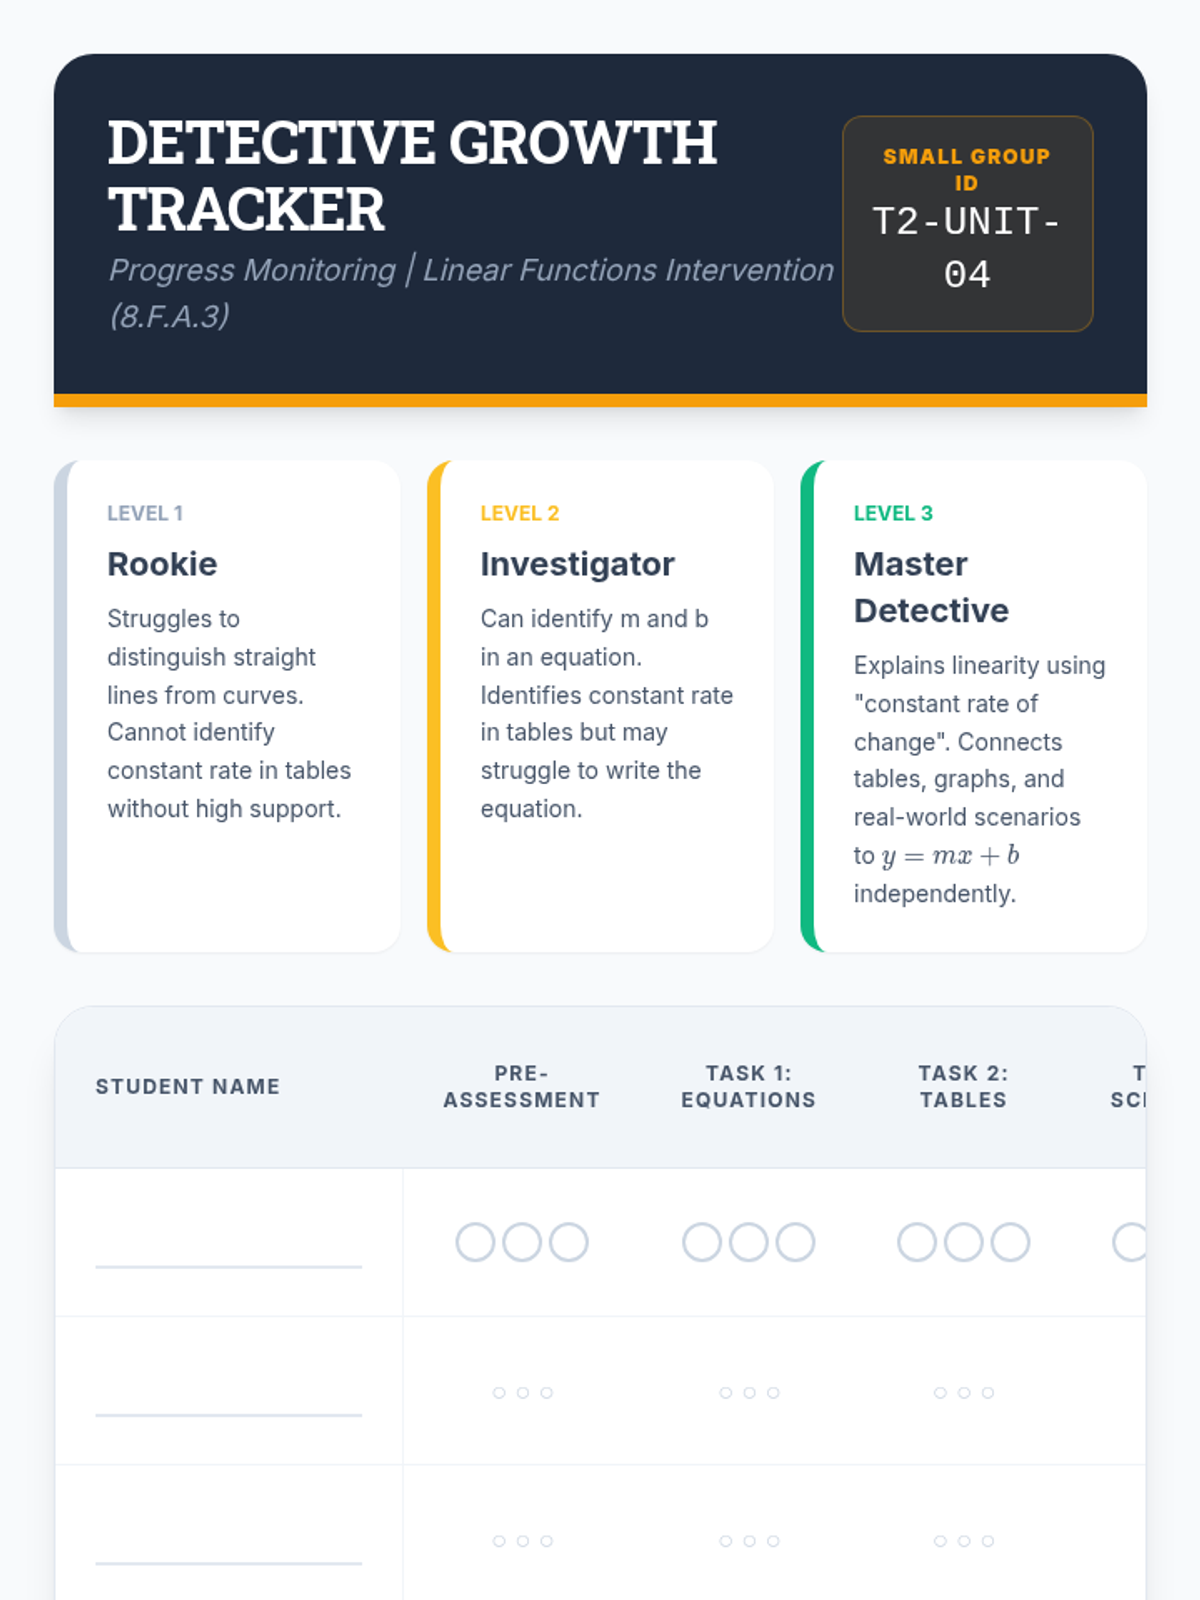
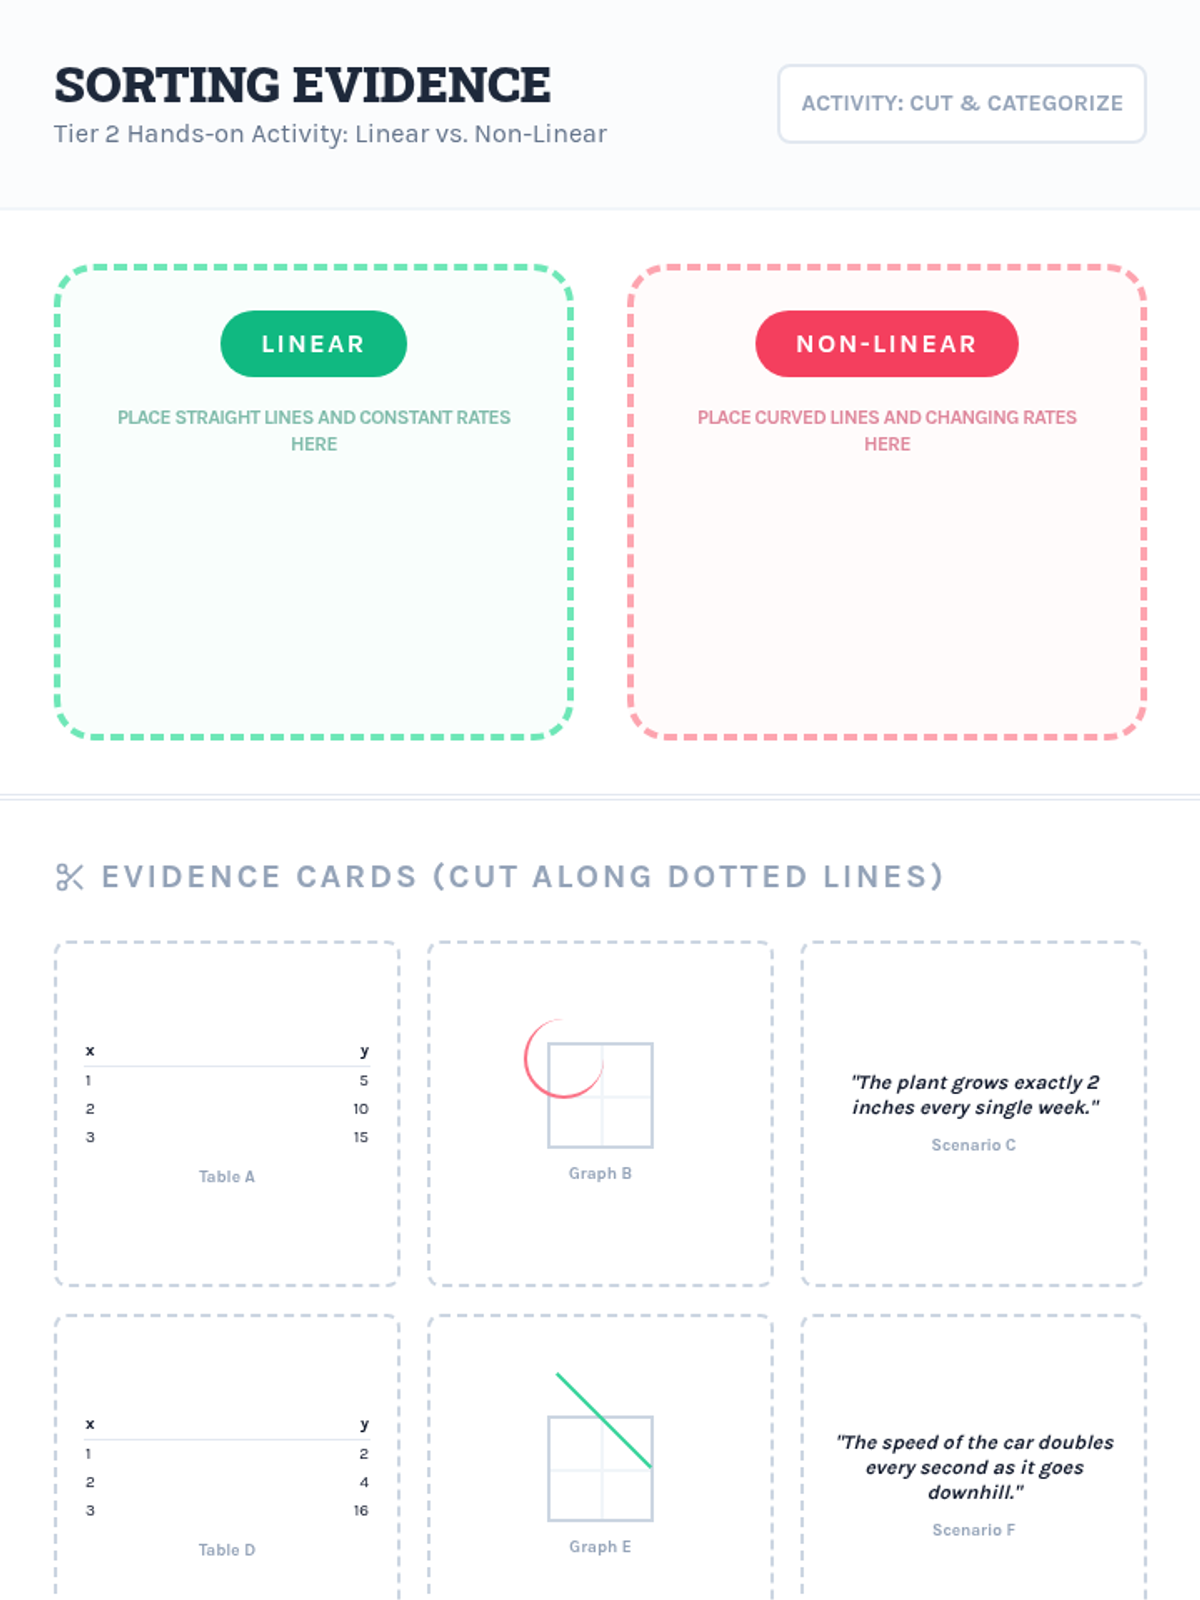
A targeted intervention sequence for 8th-grade students to master linear functions, focusing on interpreting y=mx+b, constant rates of change, and distinguishing linear from nonlinear relationships.
A targeted intervention sequence for Grade 8 students to master comparing properties of linear functions represented in multiple forms including tables, graphs, equations, and verbal descriptions.
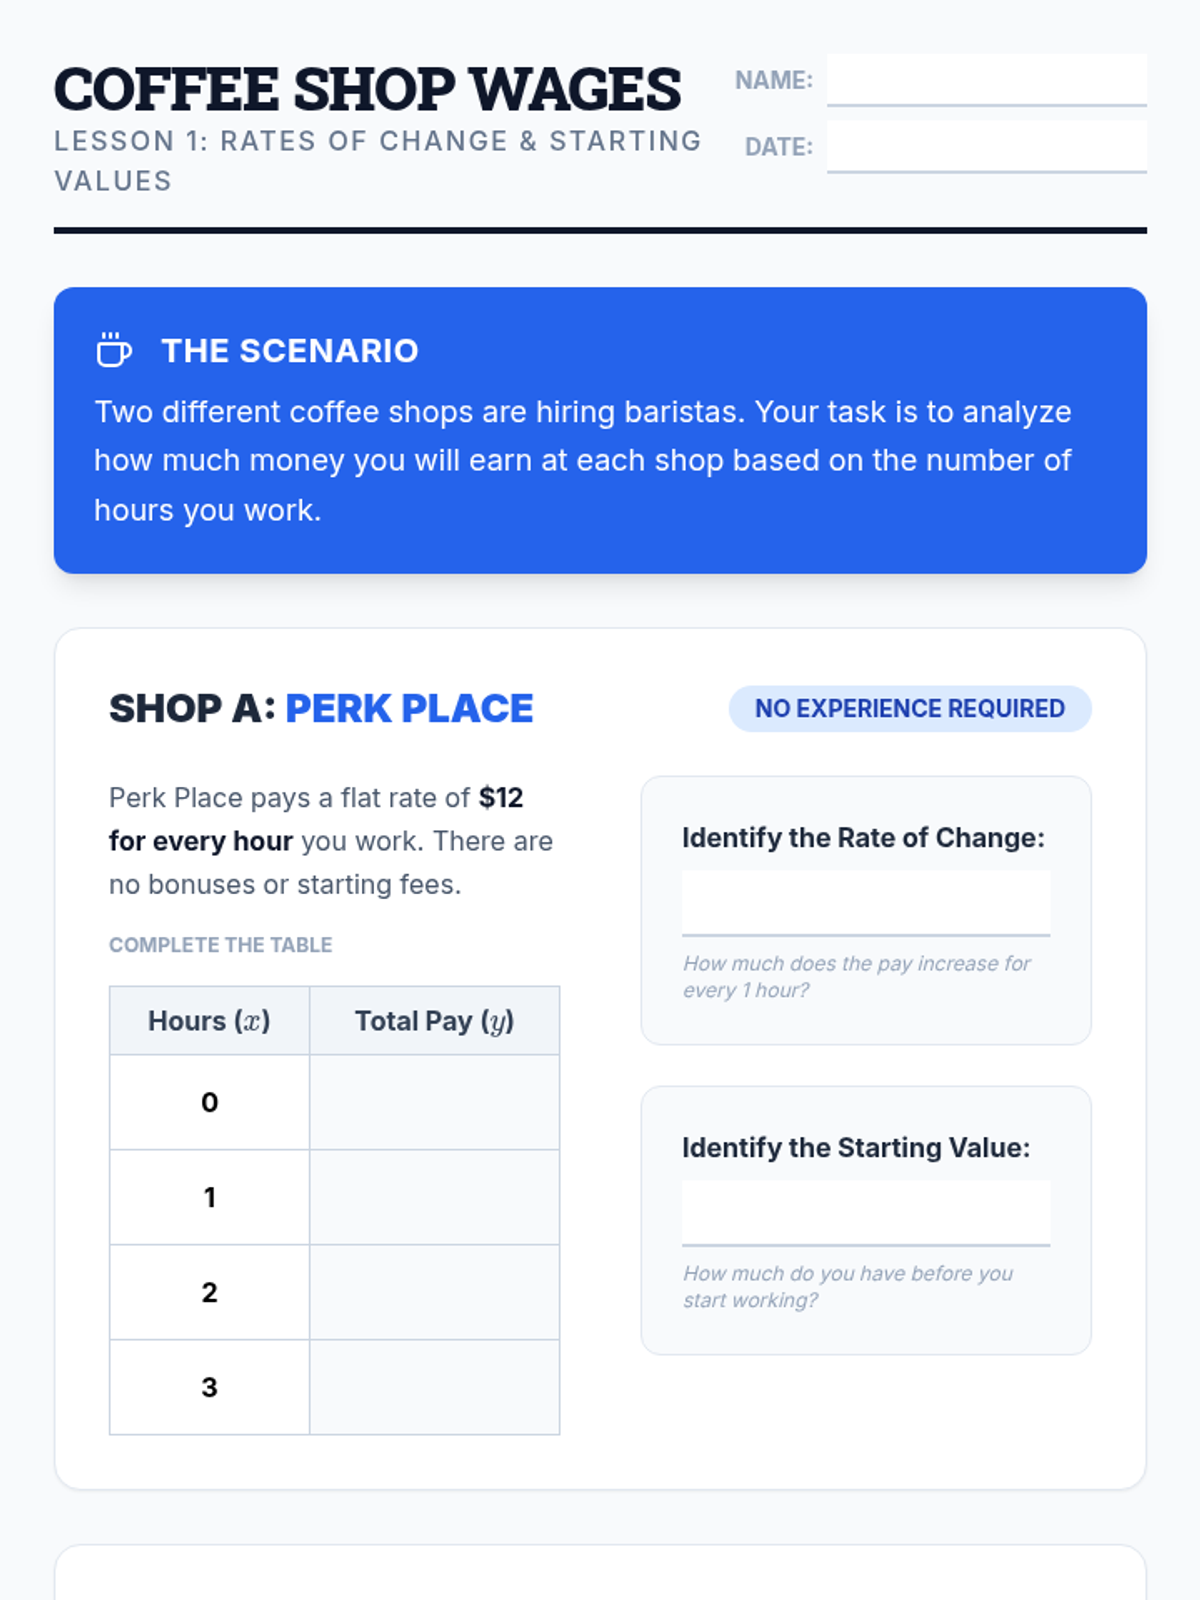
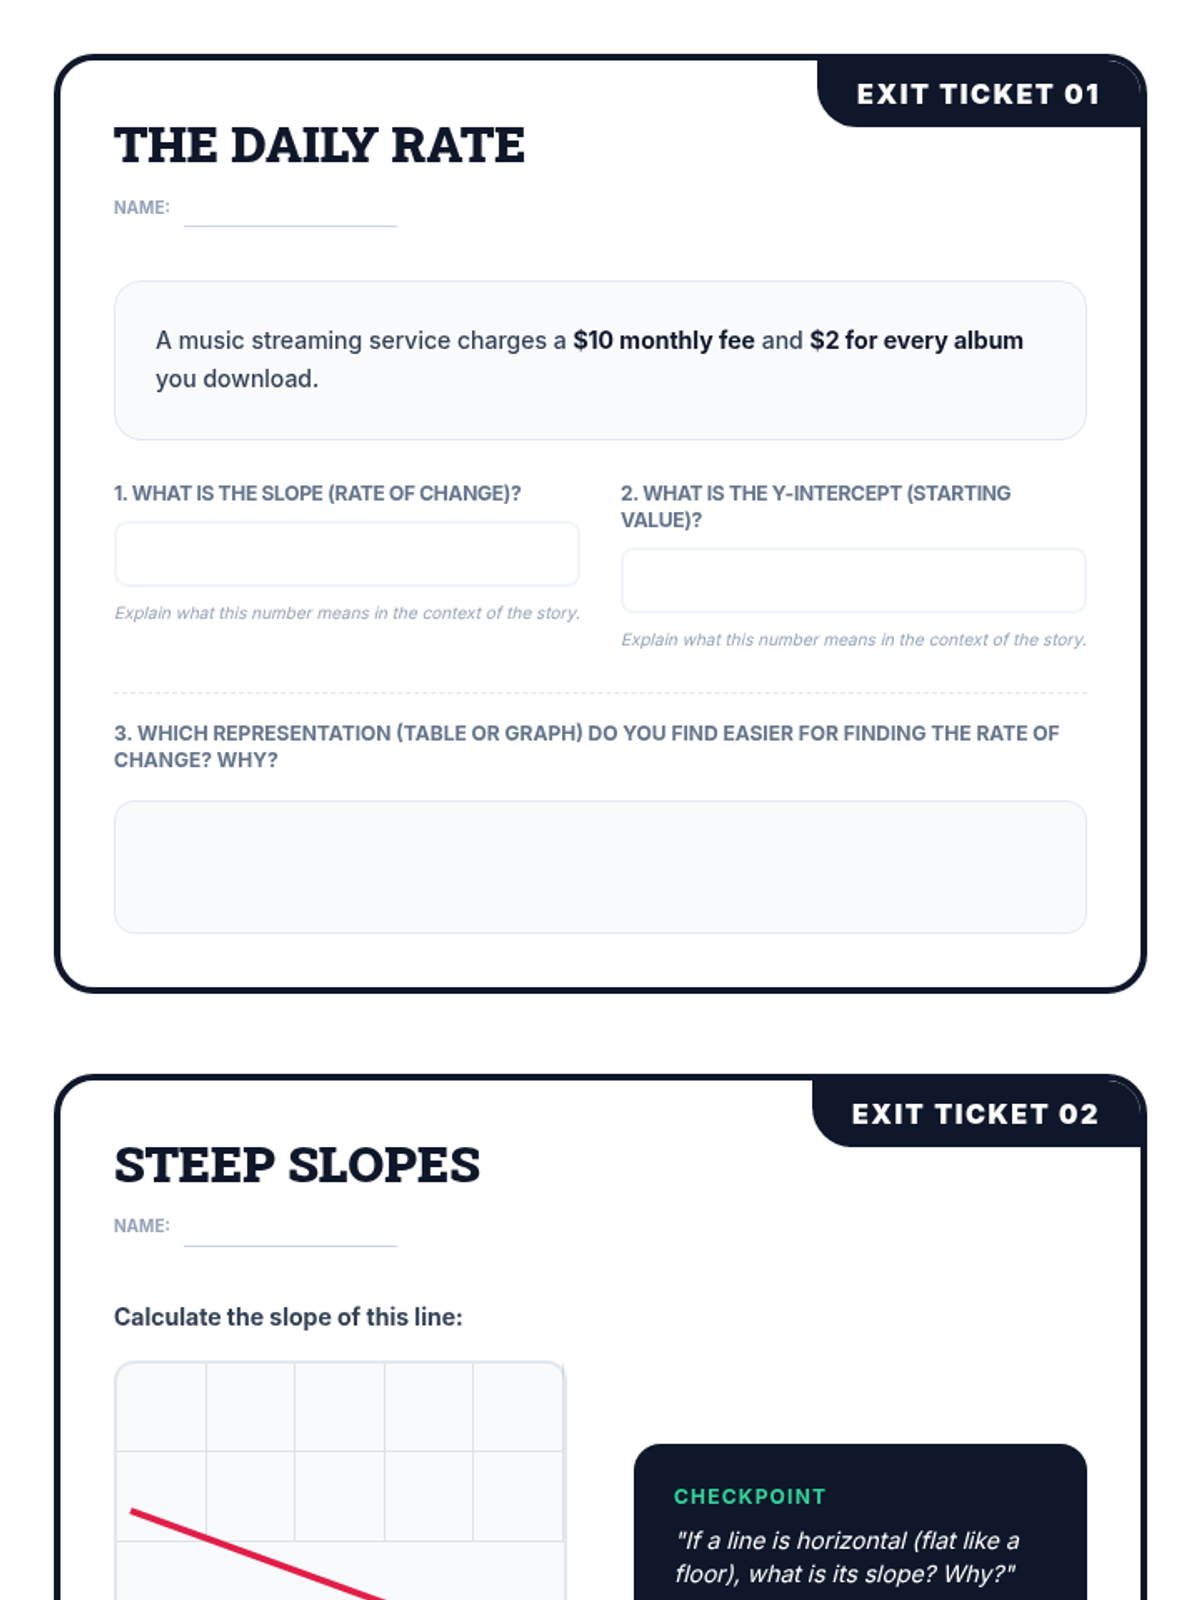
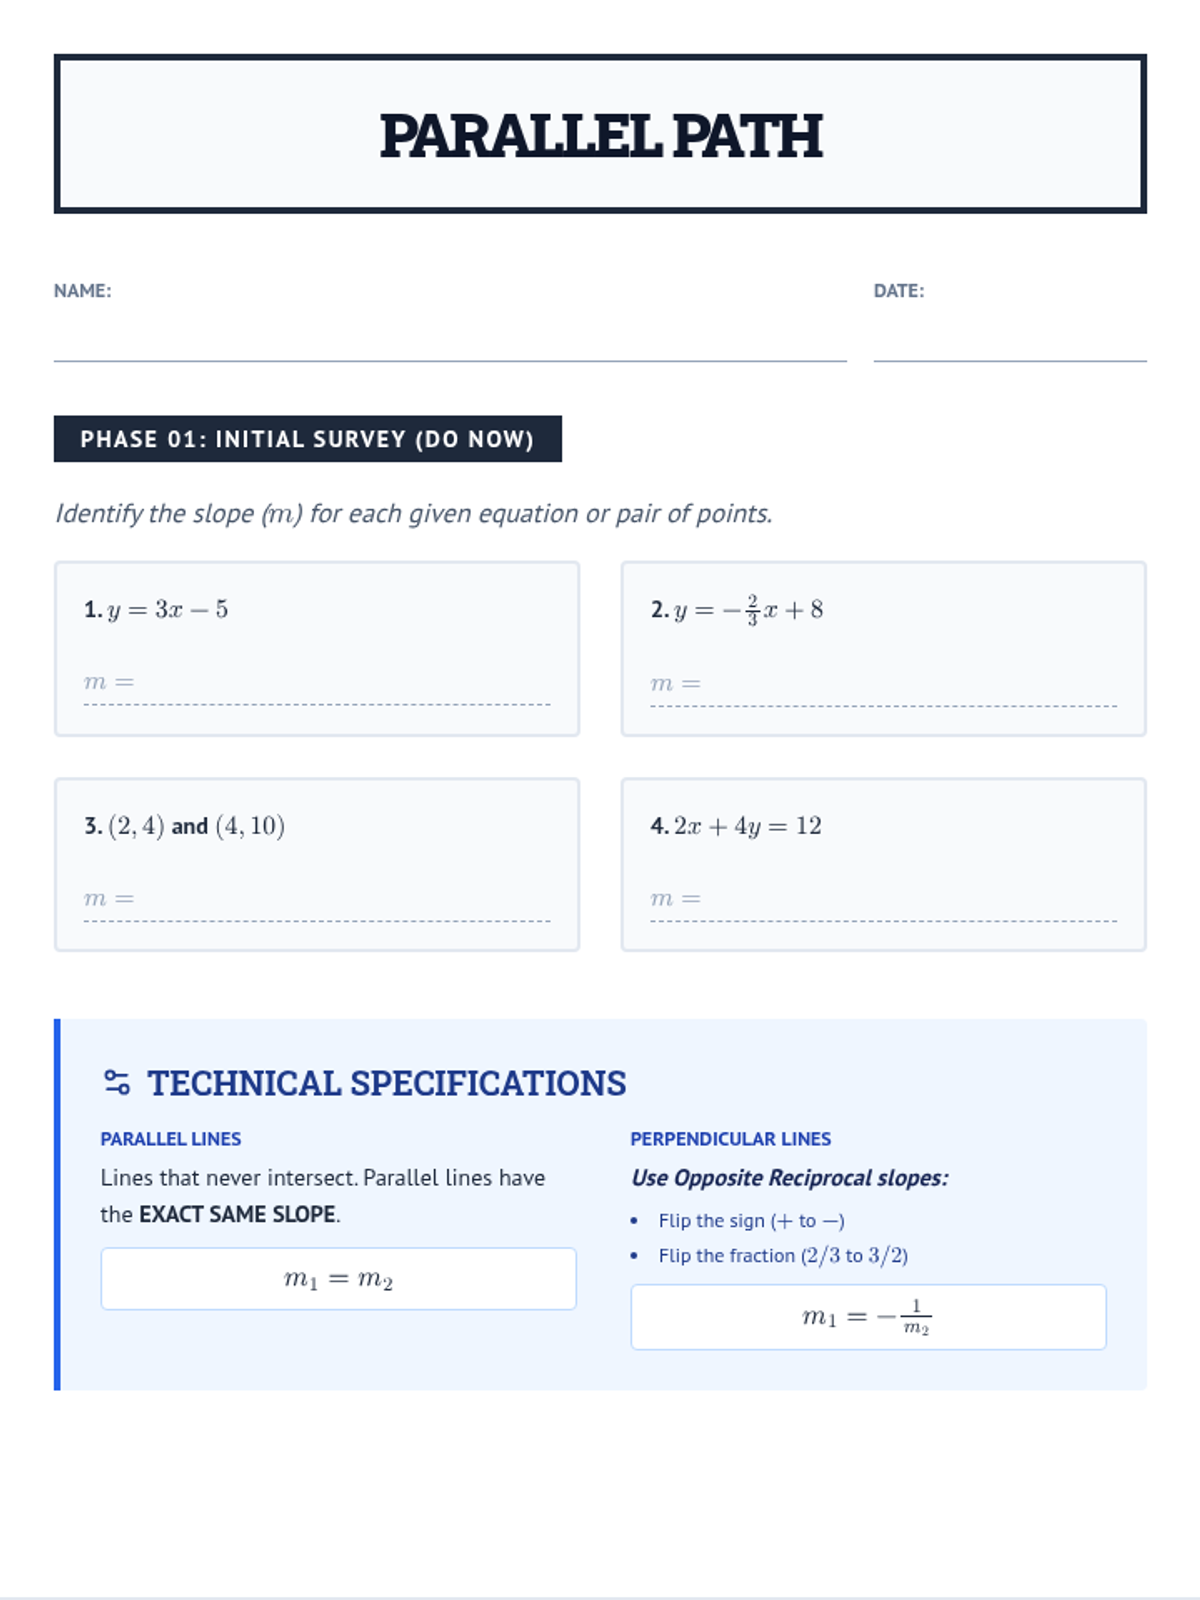
A comprehensive 5-lesson unit on linear relationships, focusing on conceptual understanding of slope as a rate of change through real-world scenarios, multiple representations, and error analysis.
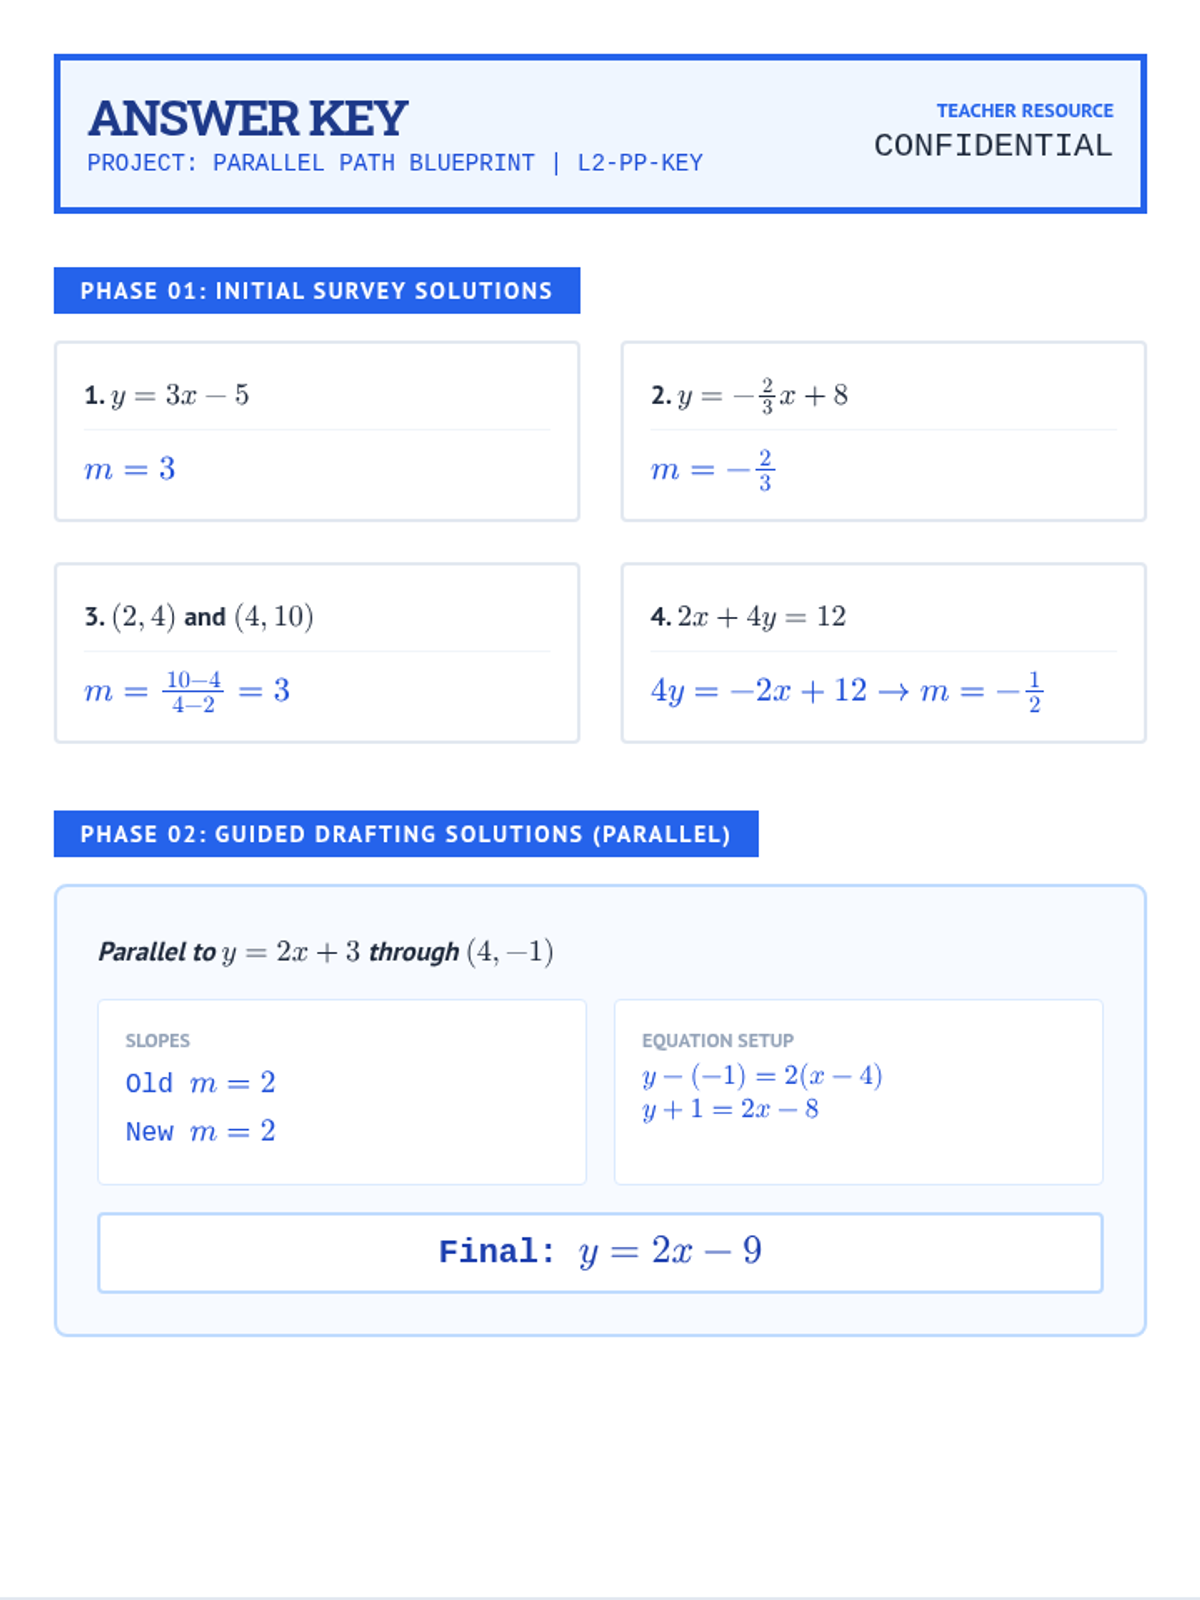
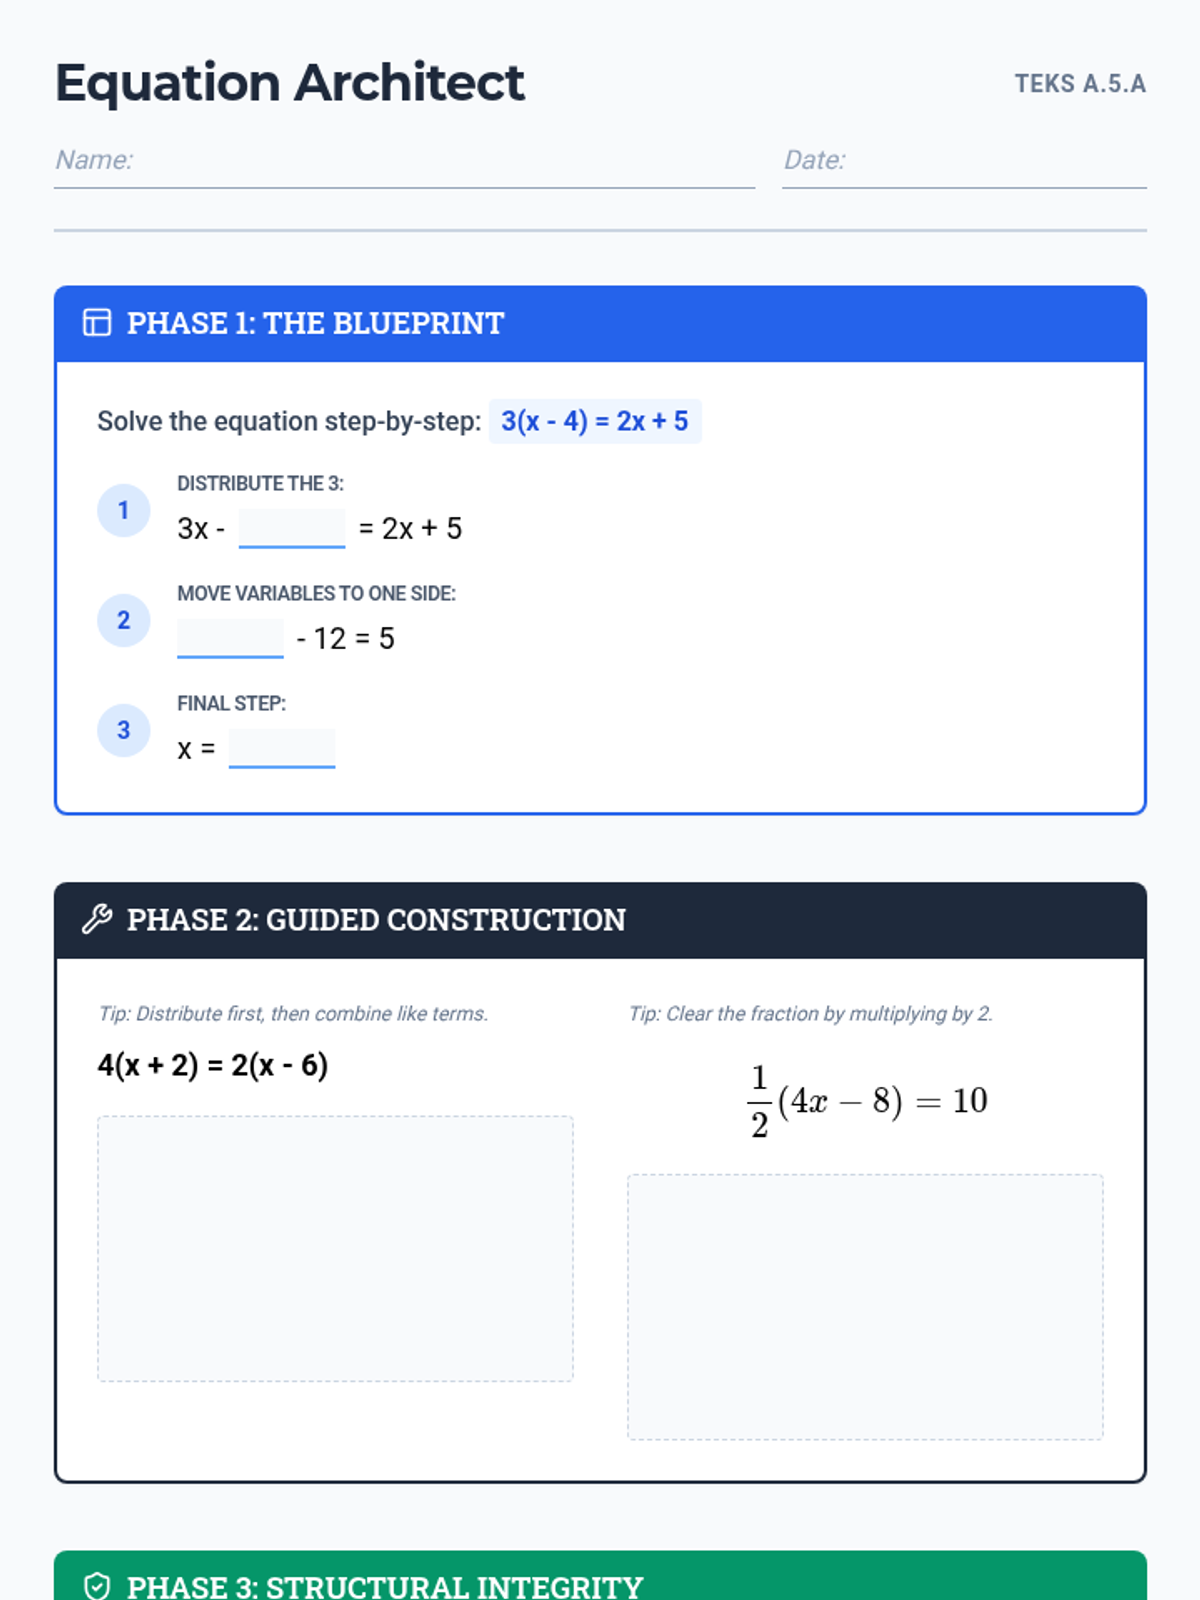
A series of algebra and geometry foundation lessons designed with a technical blueprint aesthetic, focusing on precision, organized computation, and visual clarity in mathematical steps.
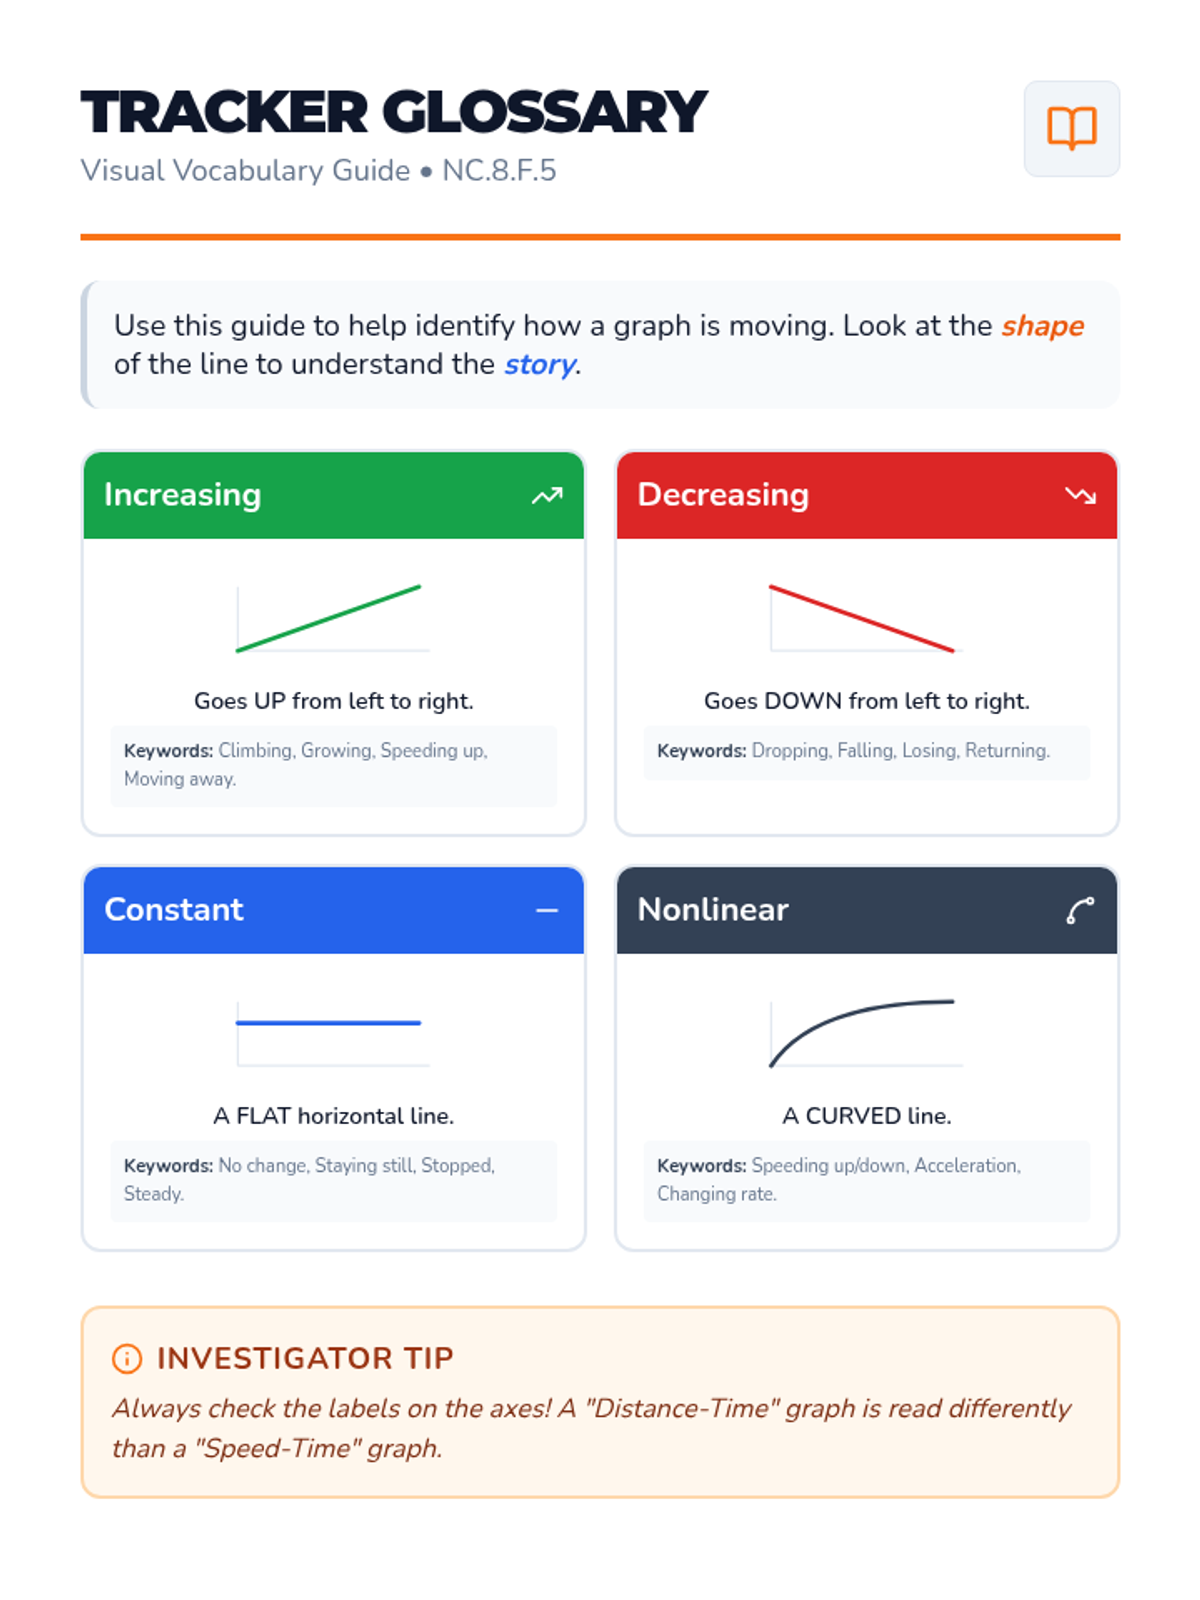
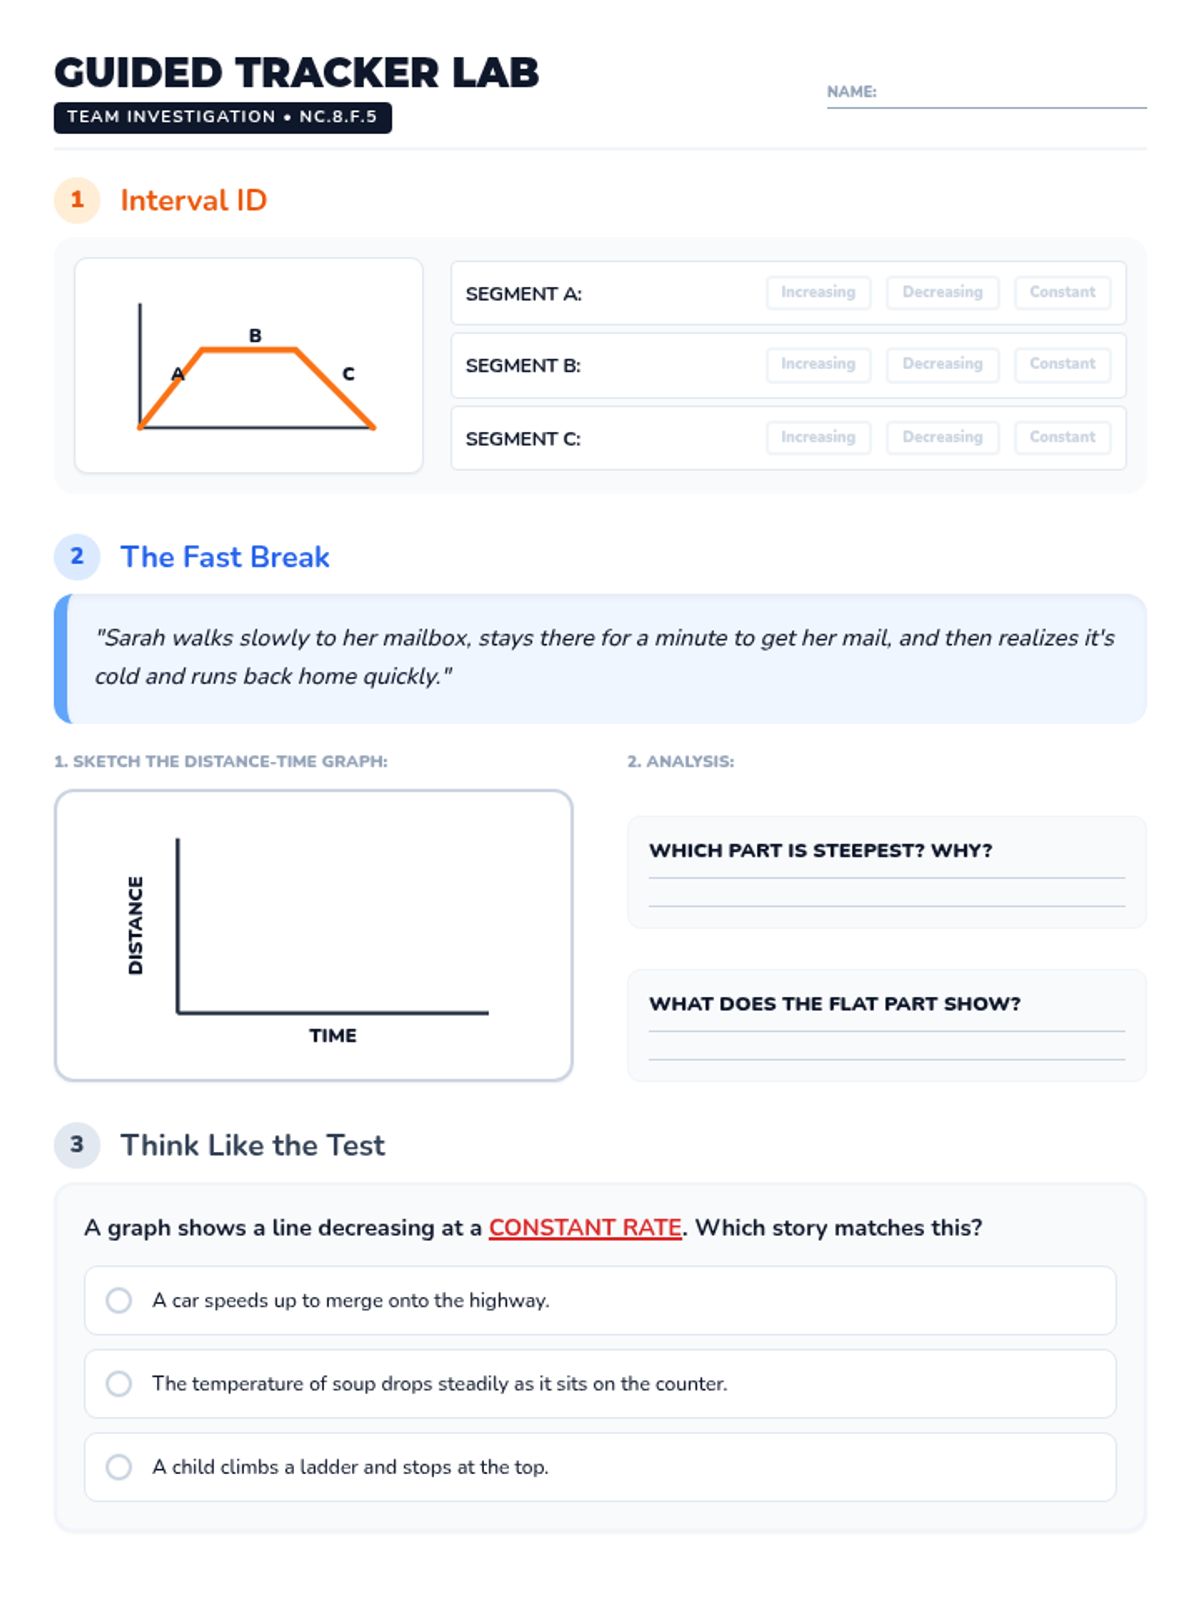
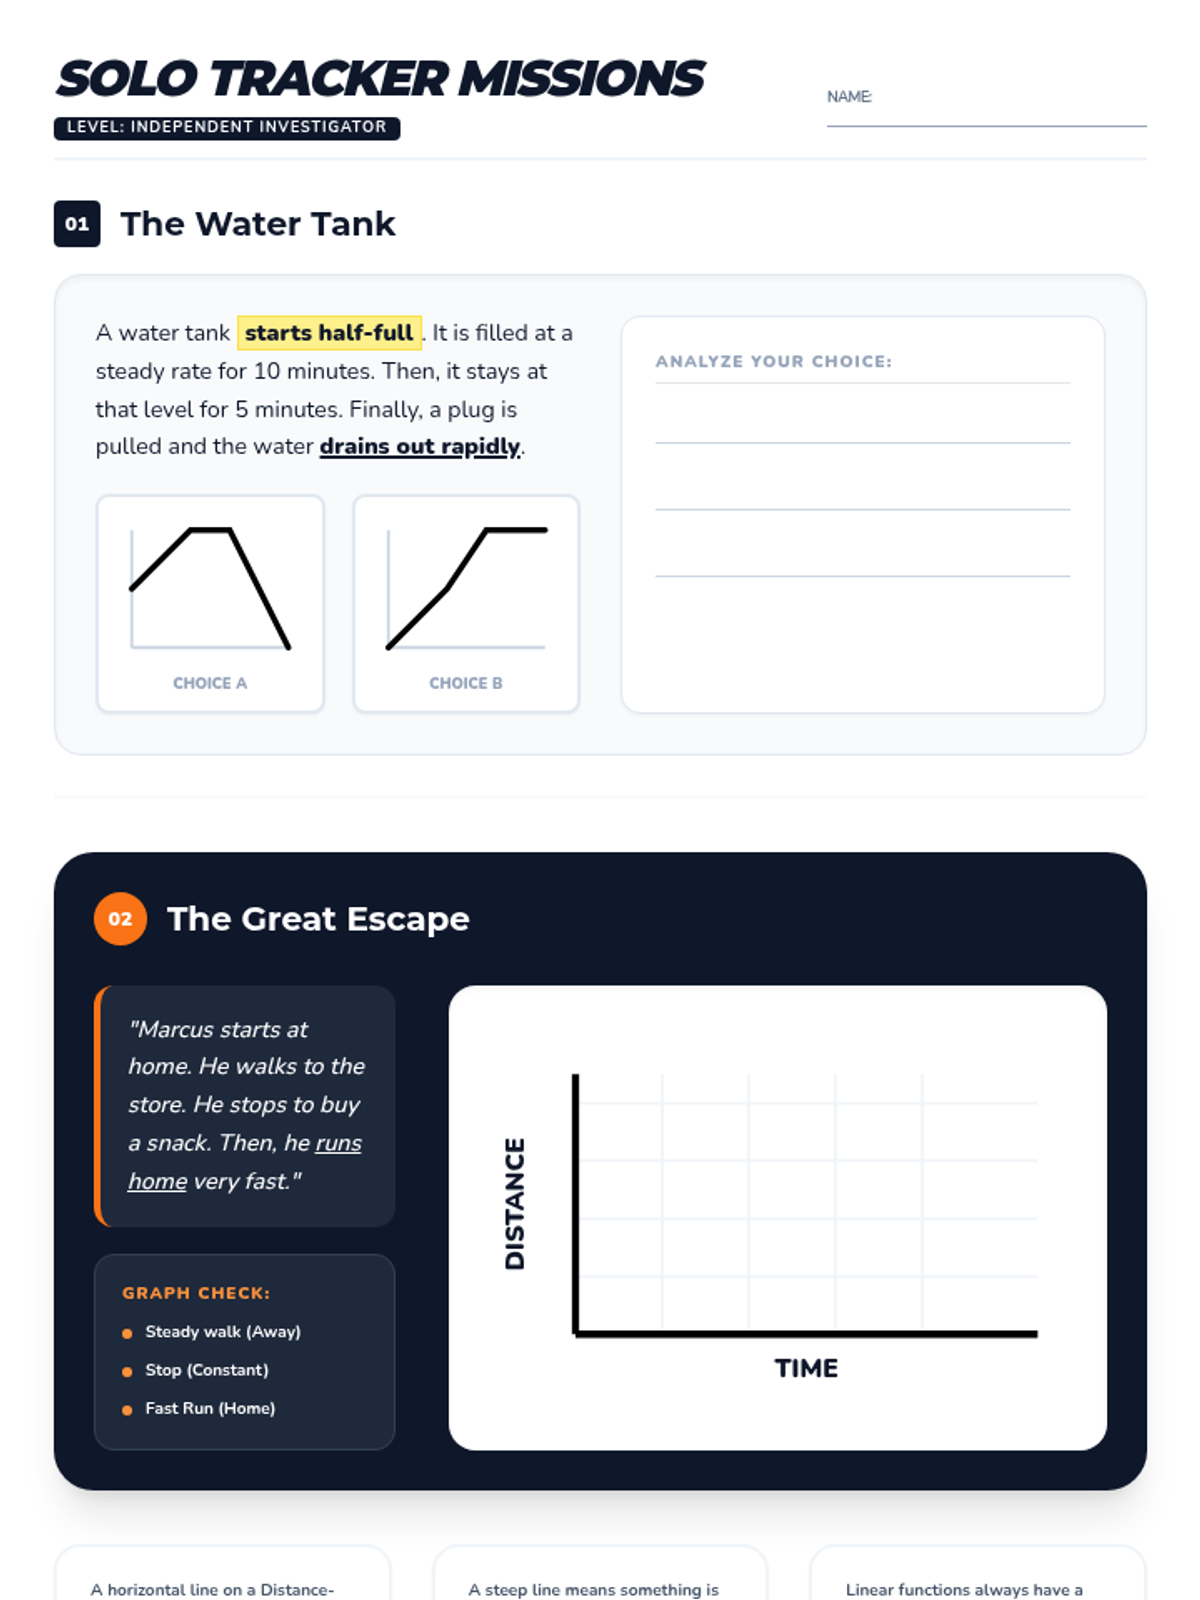
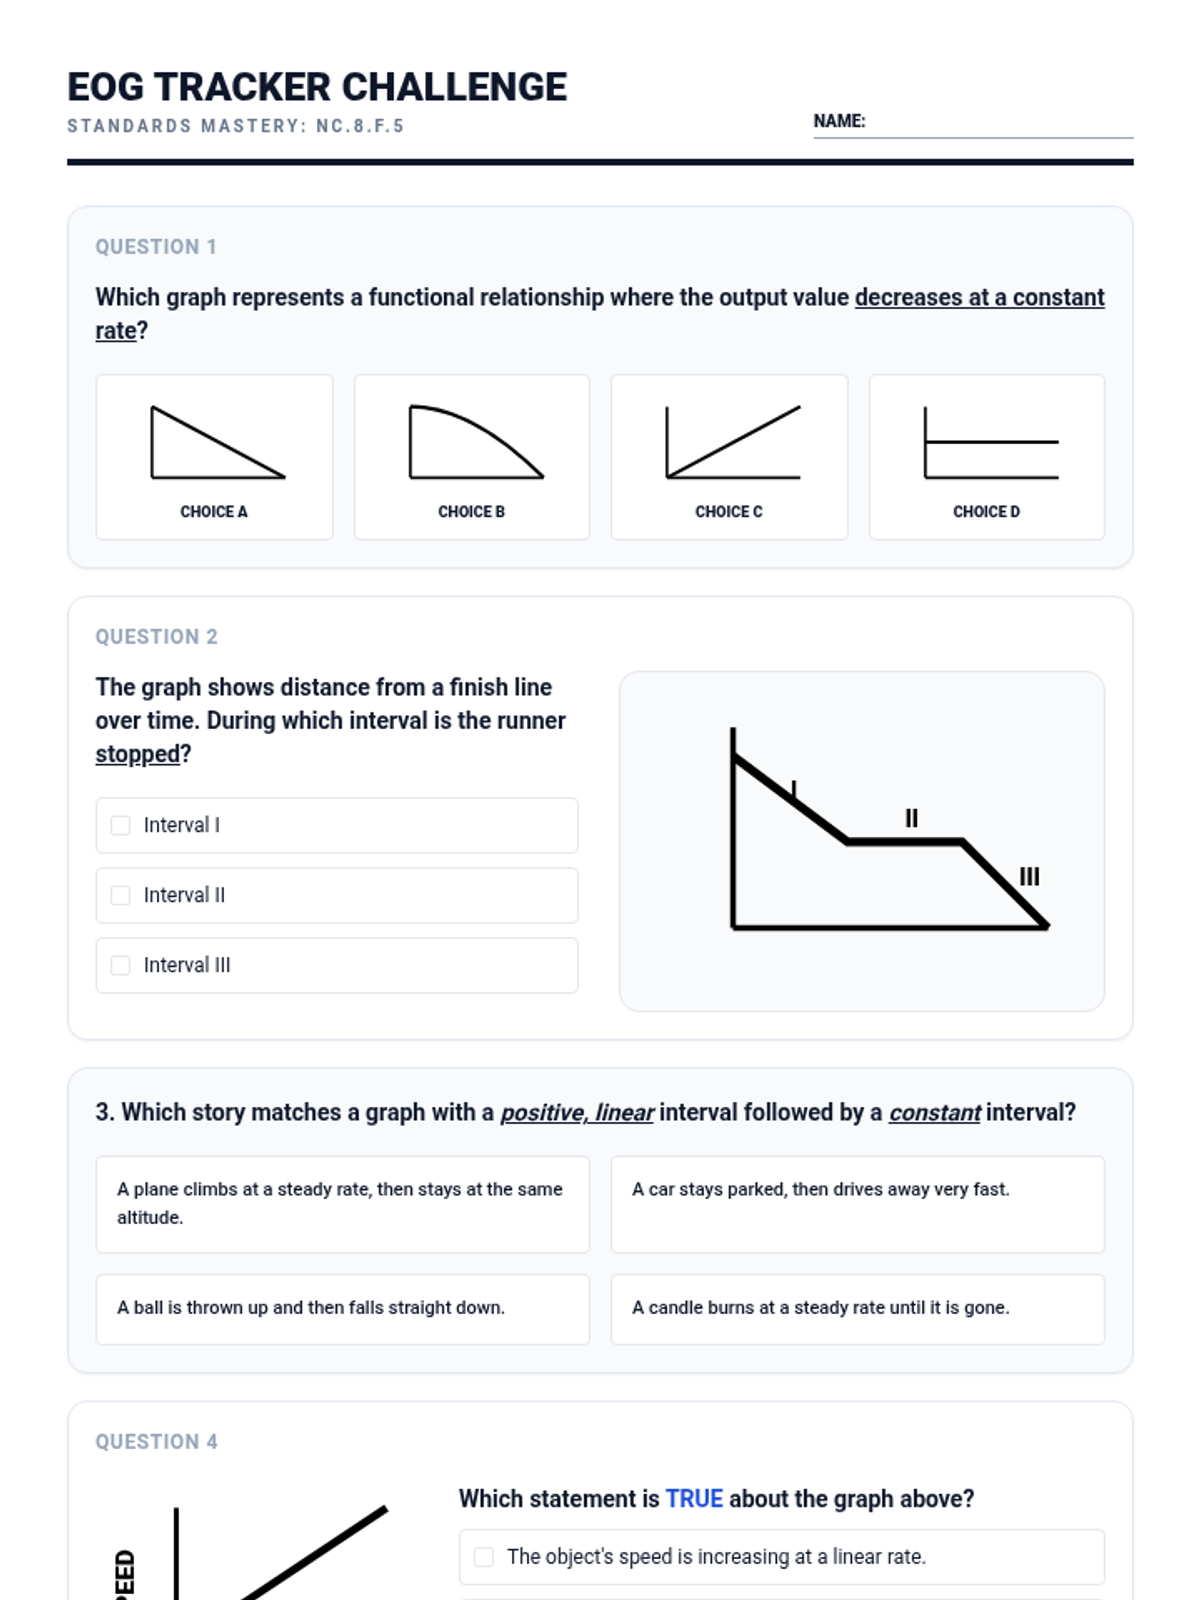
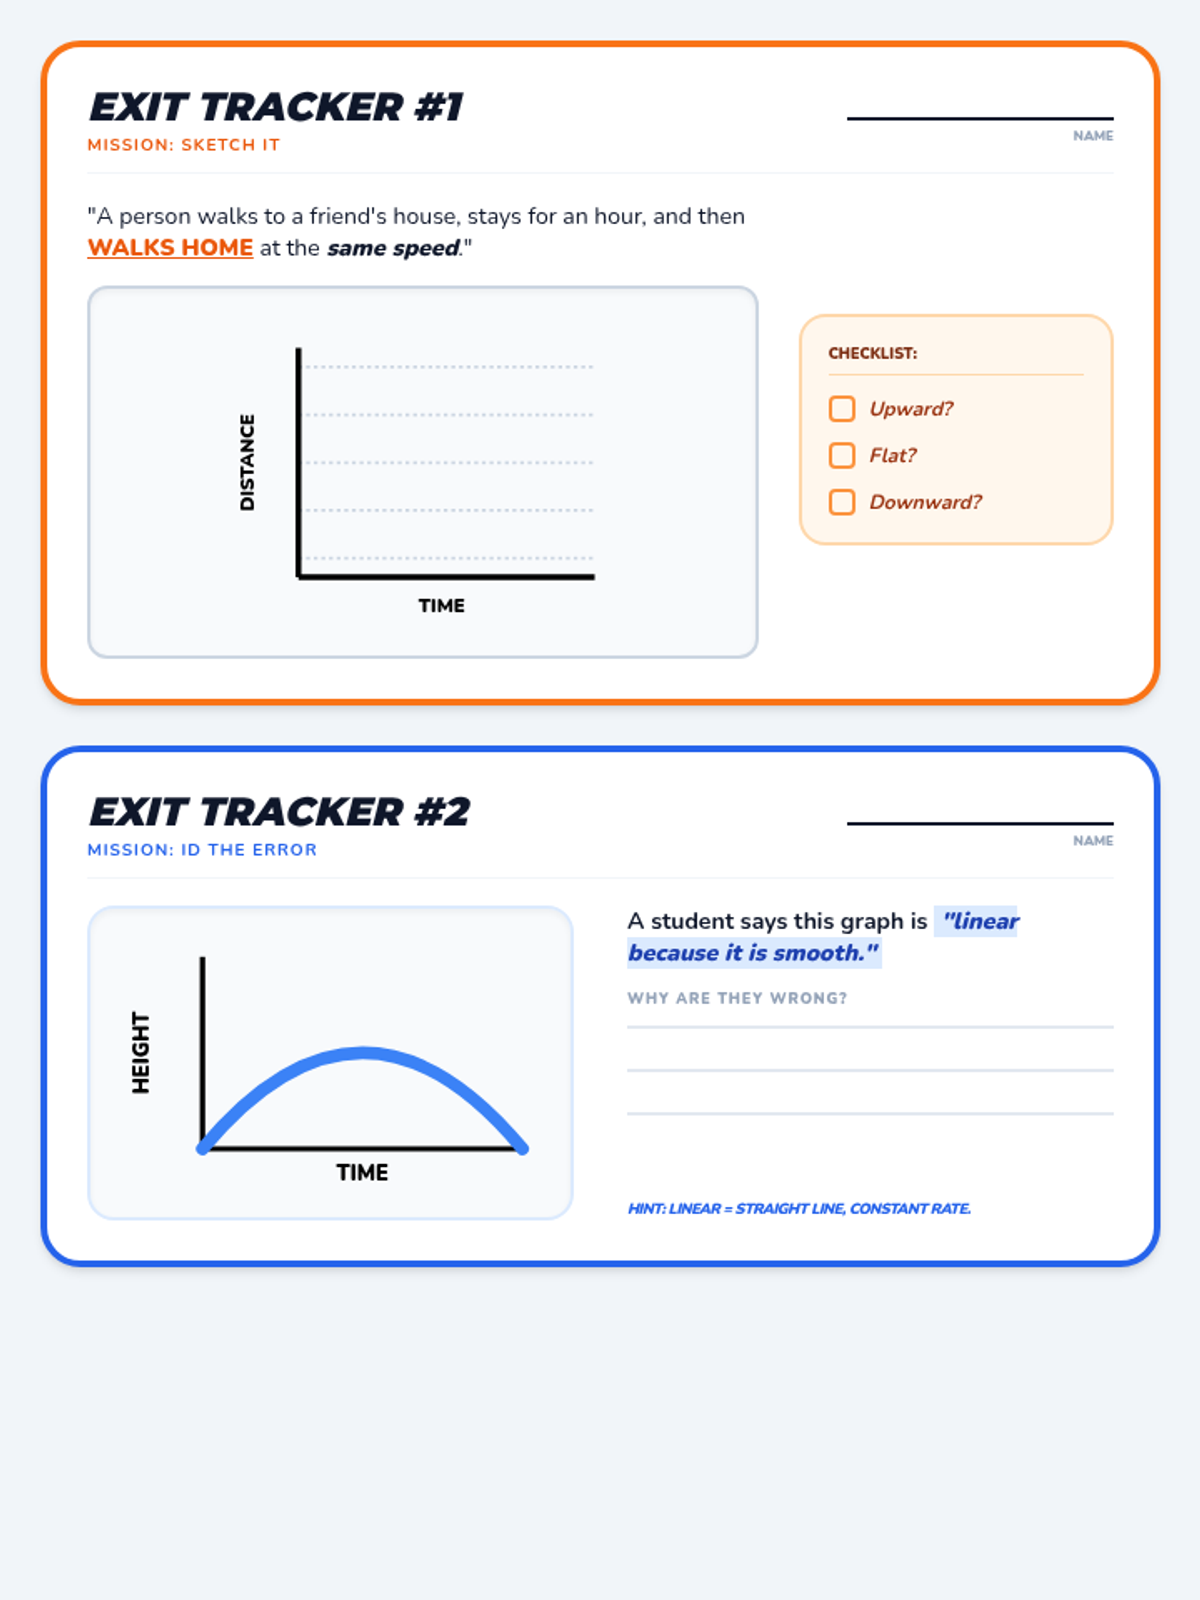
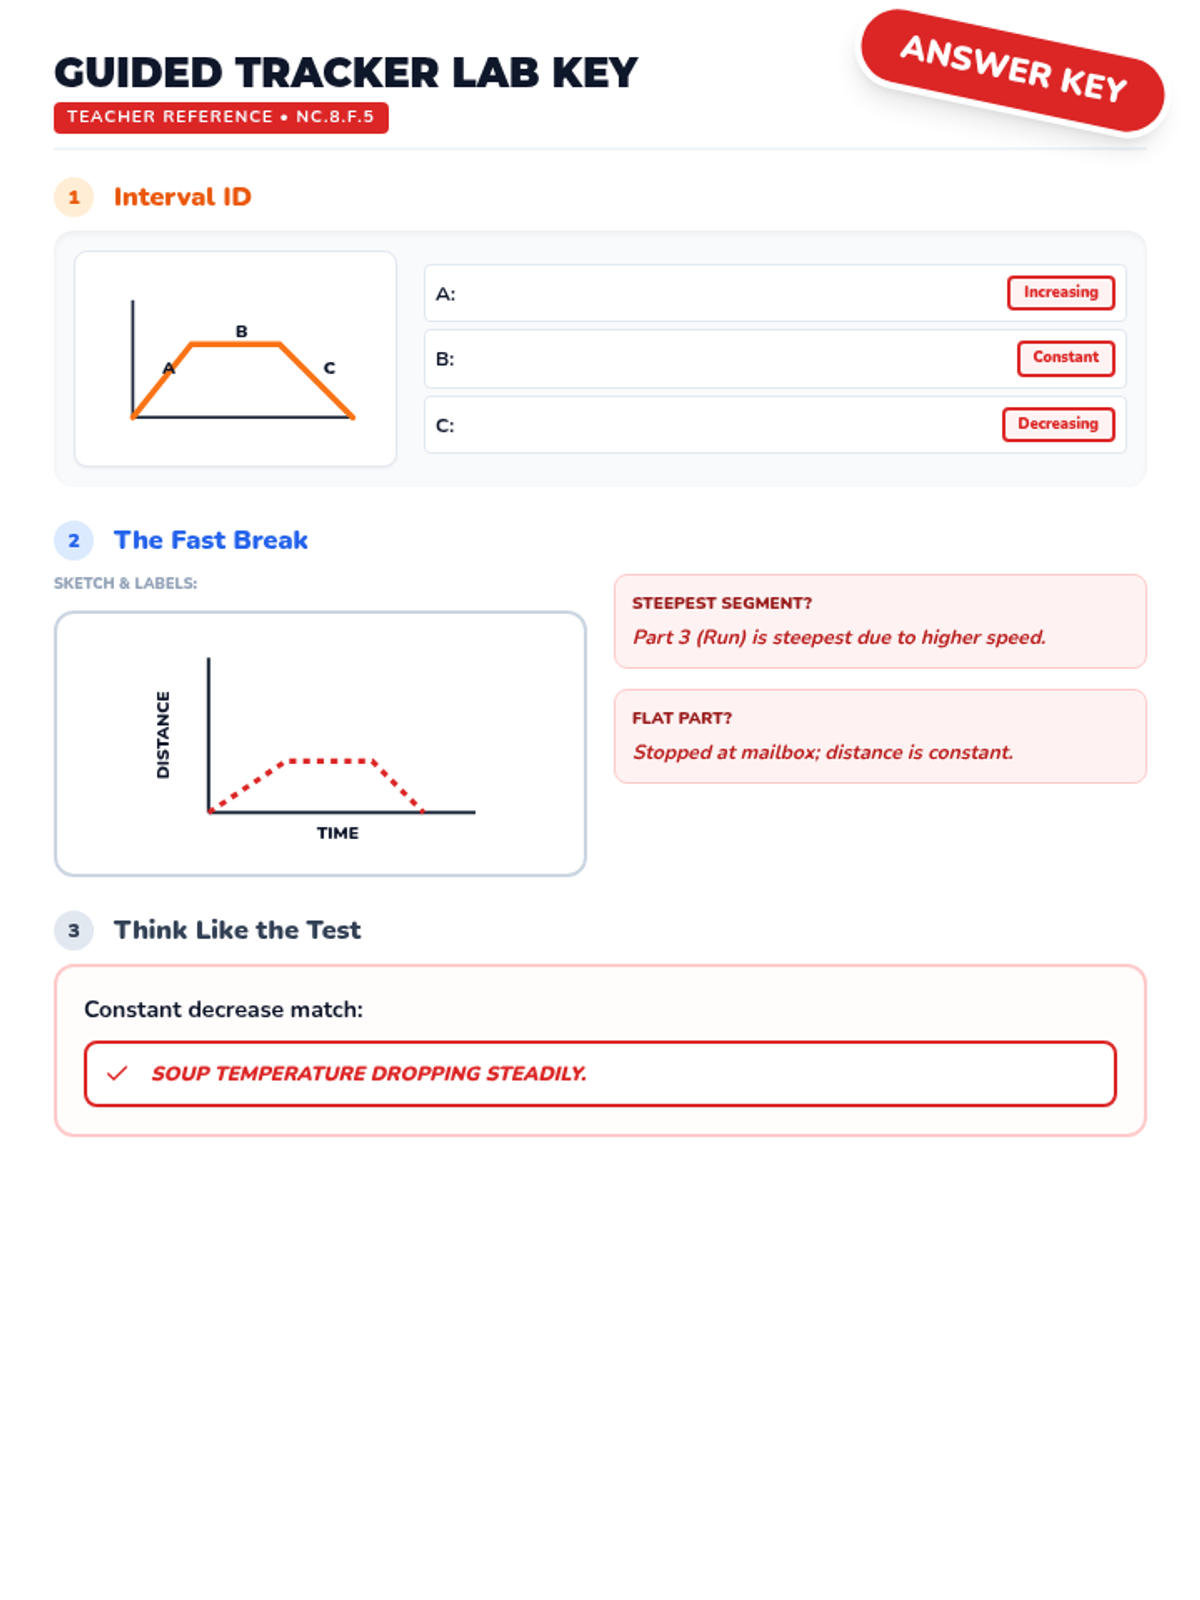
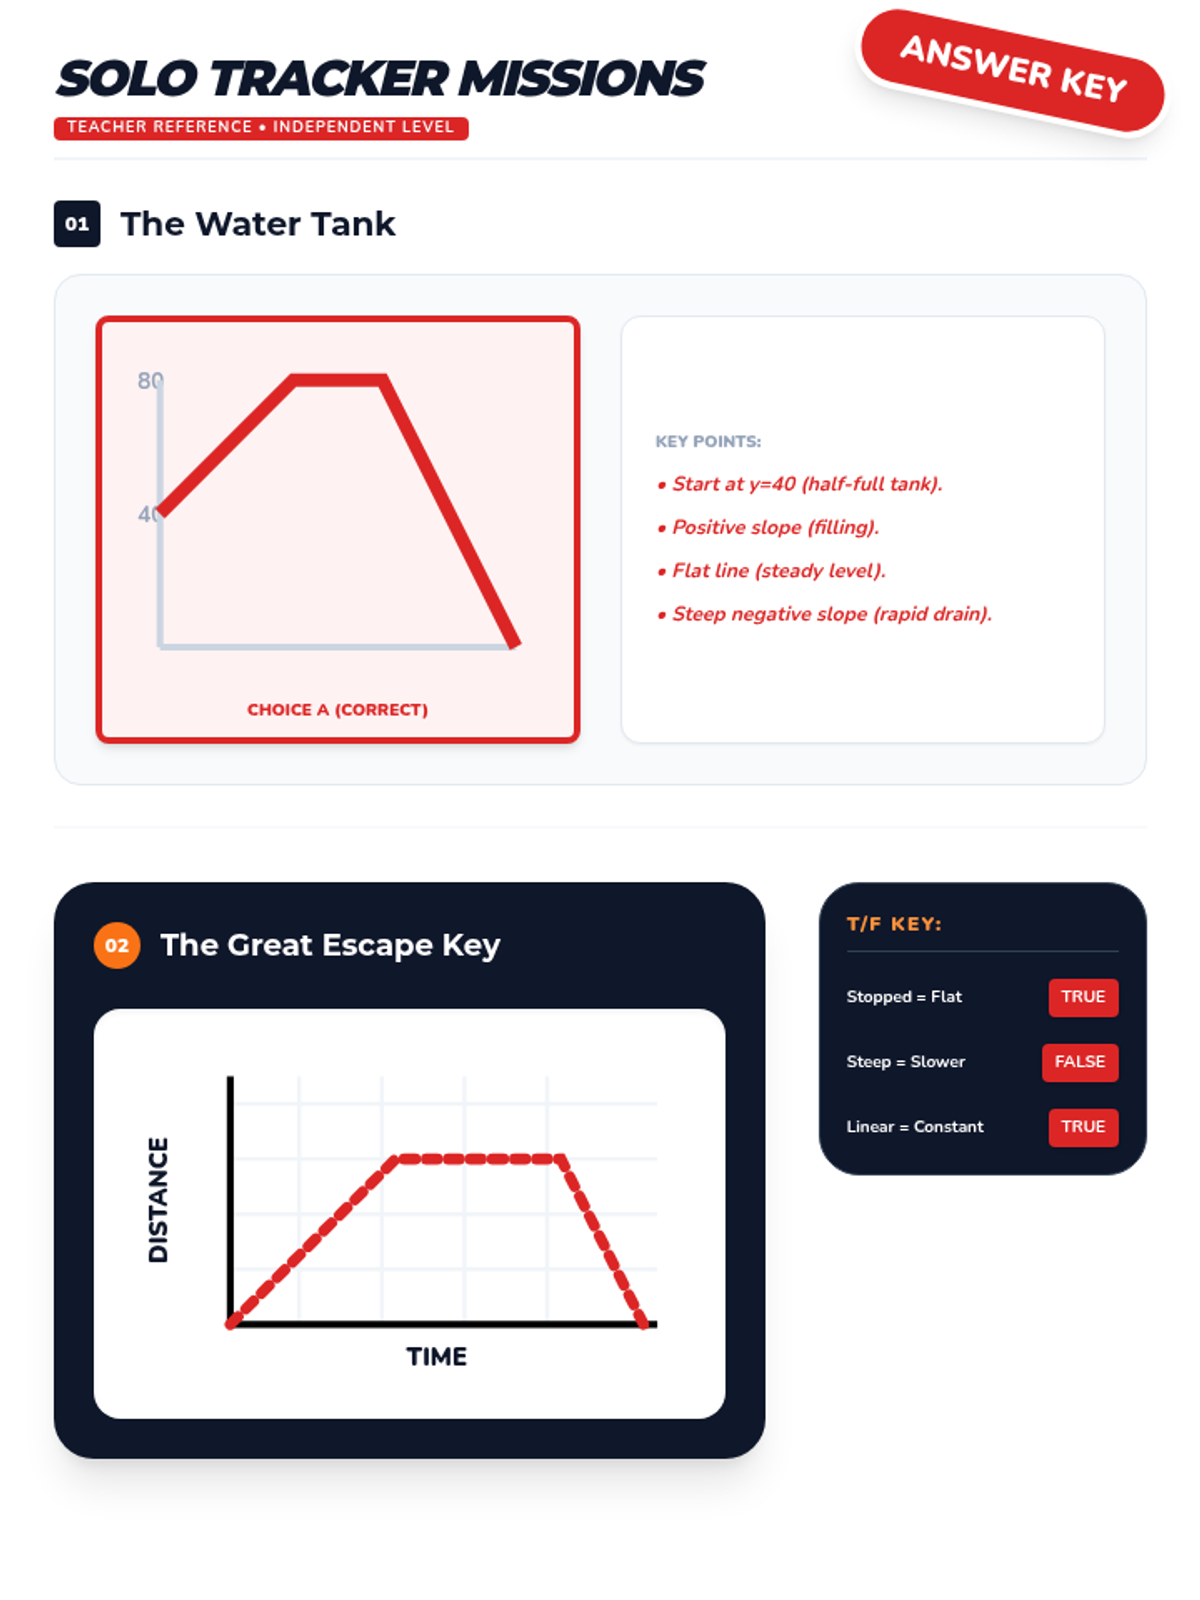
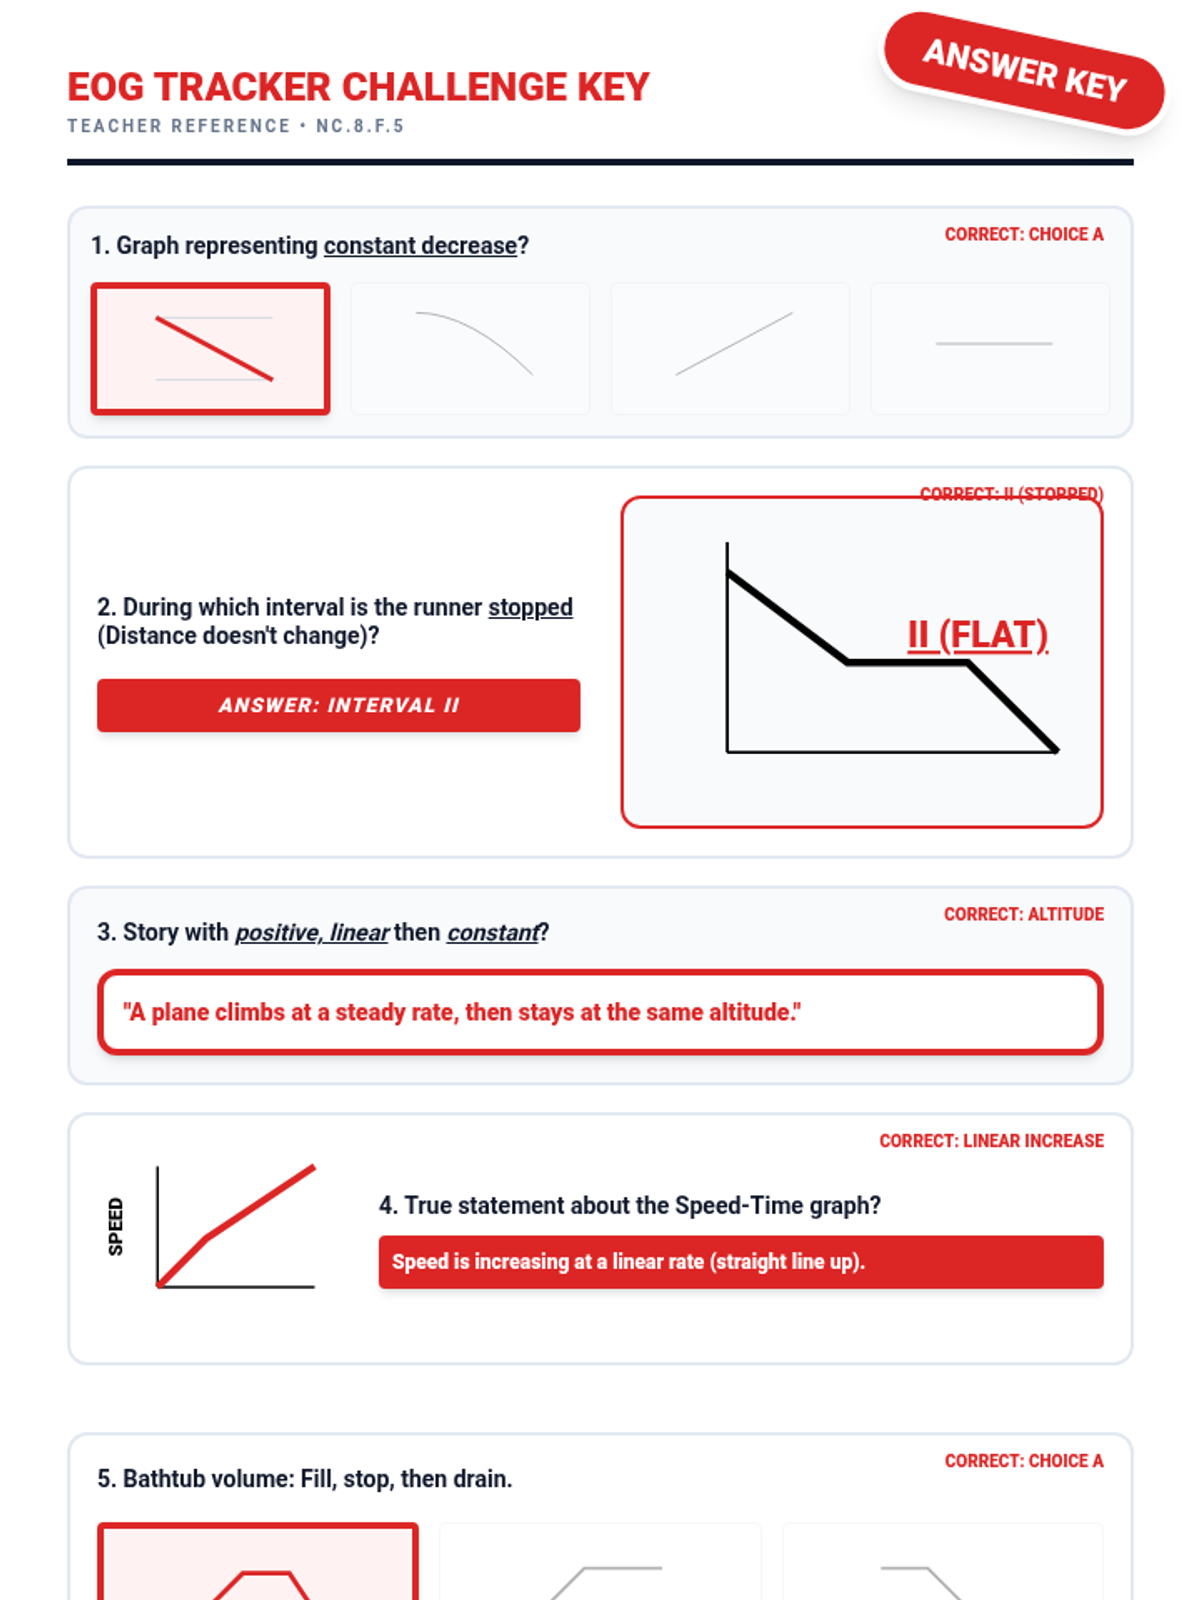
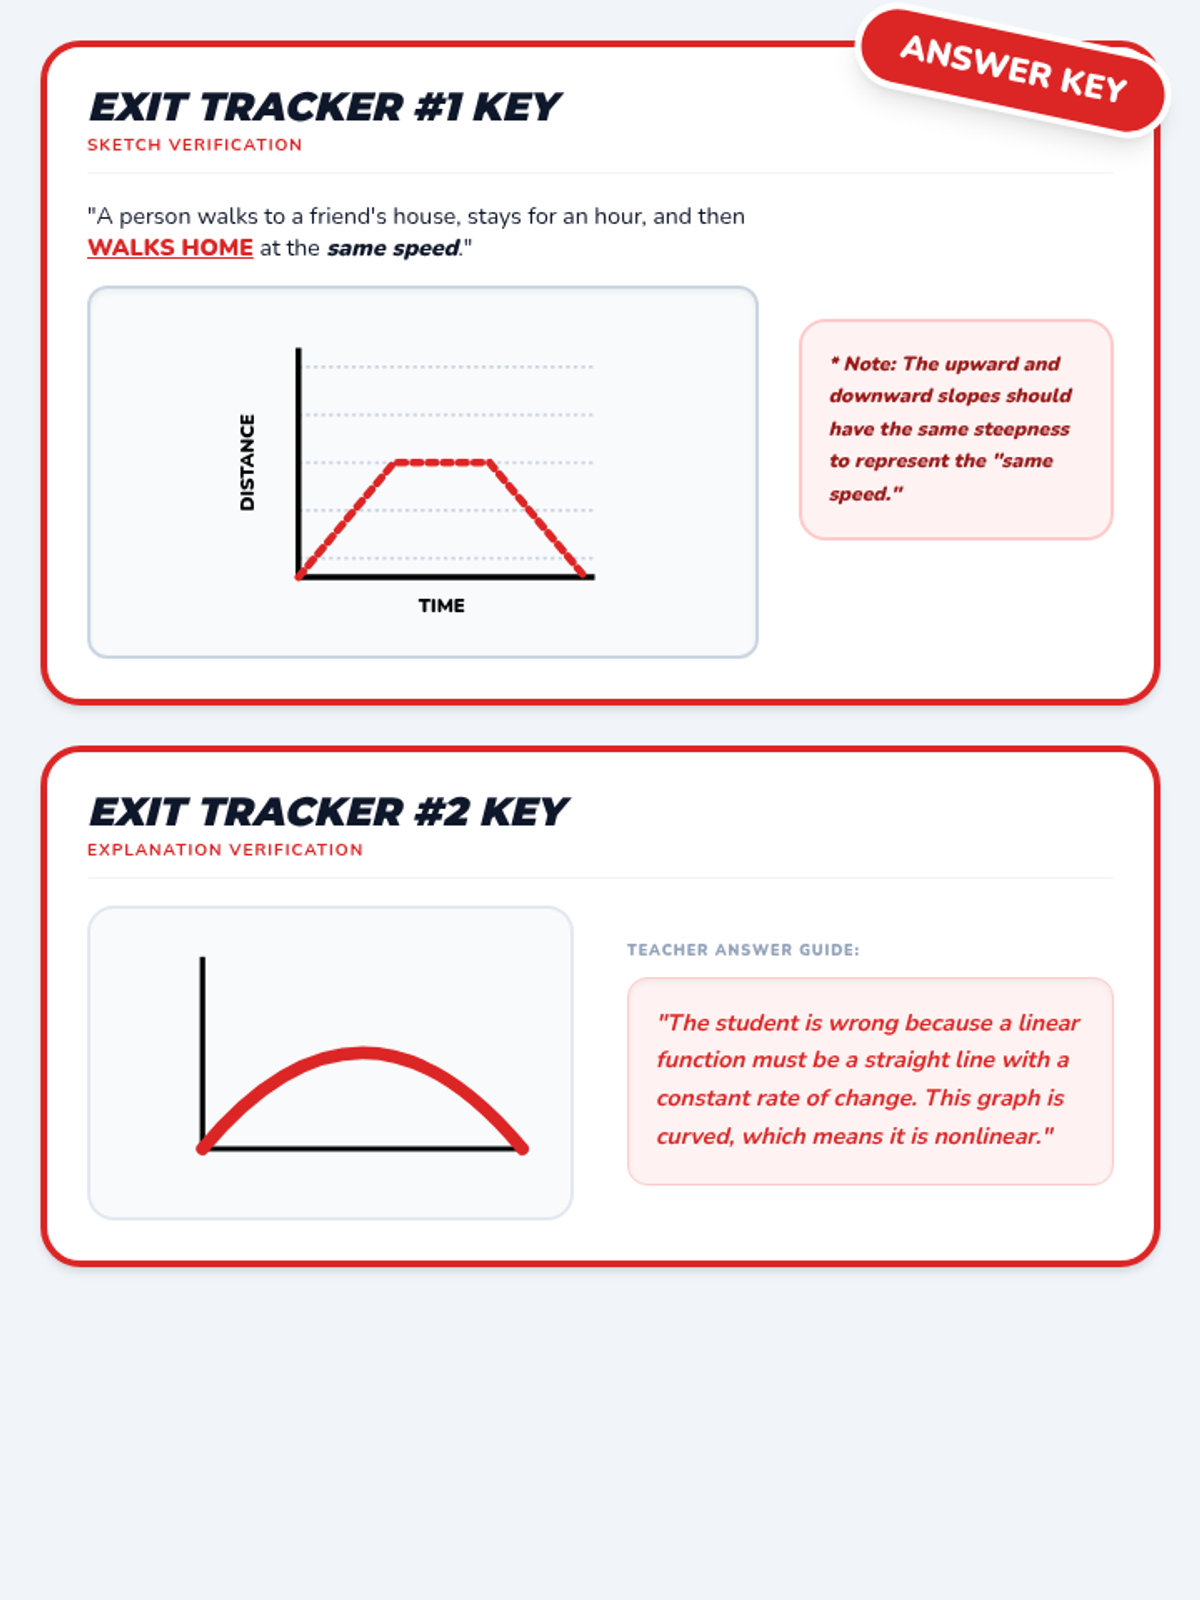
A comprehensive unit on qualitative graph analysis for 8th grade students, focusing on interpreting functional relationships, identifying intervals, and matching stories to graphs.
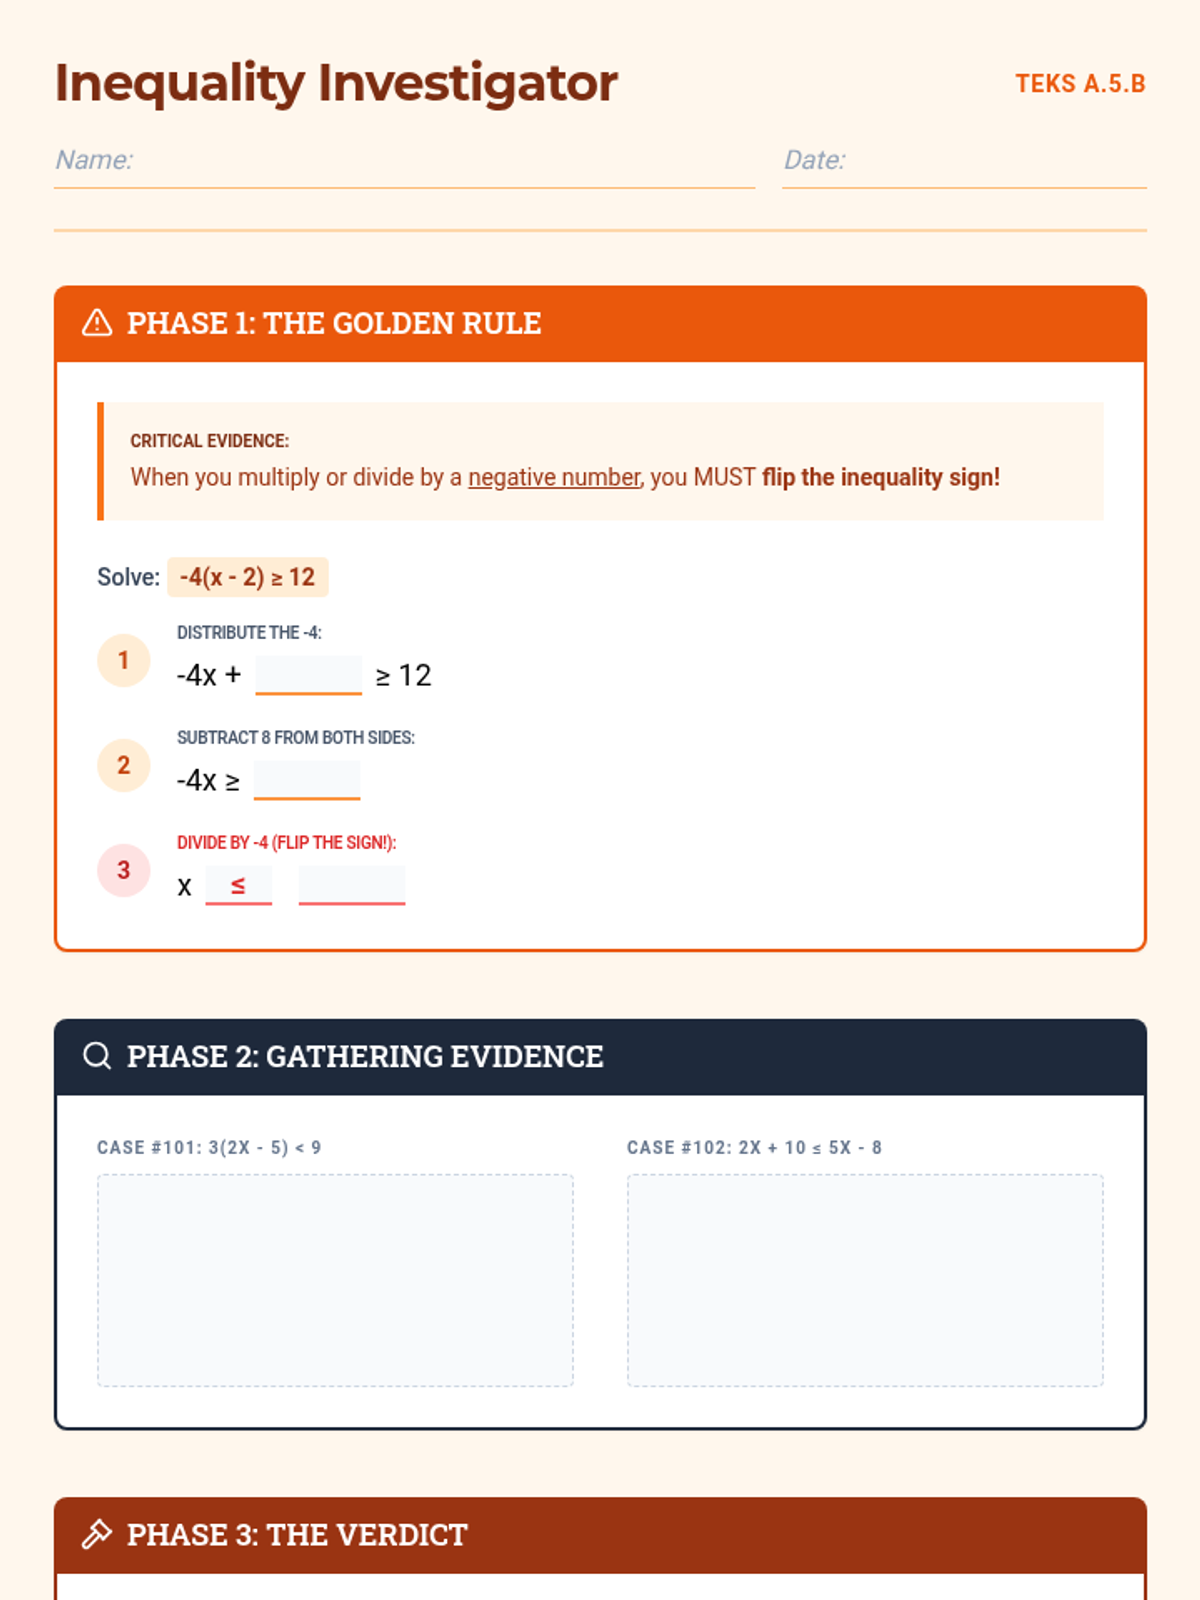
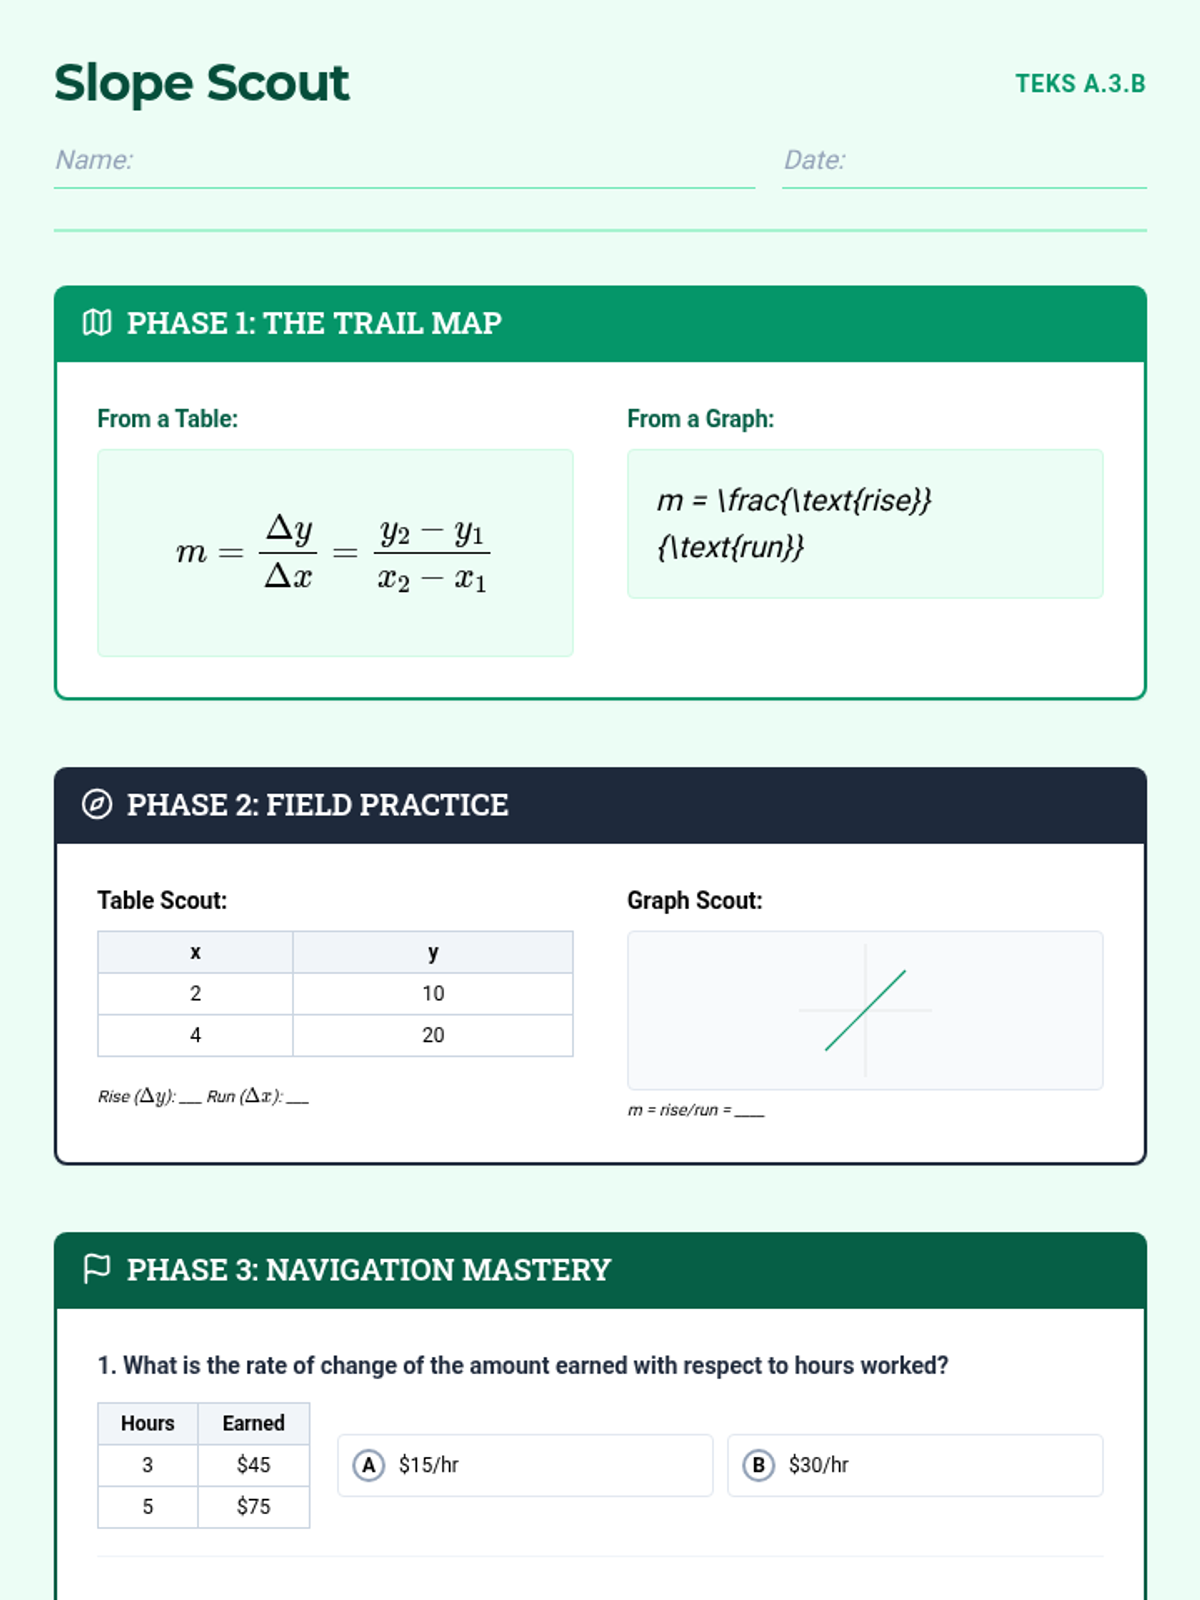
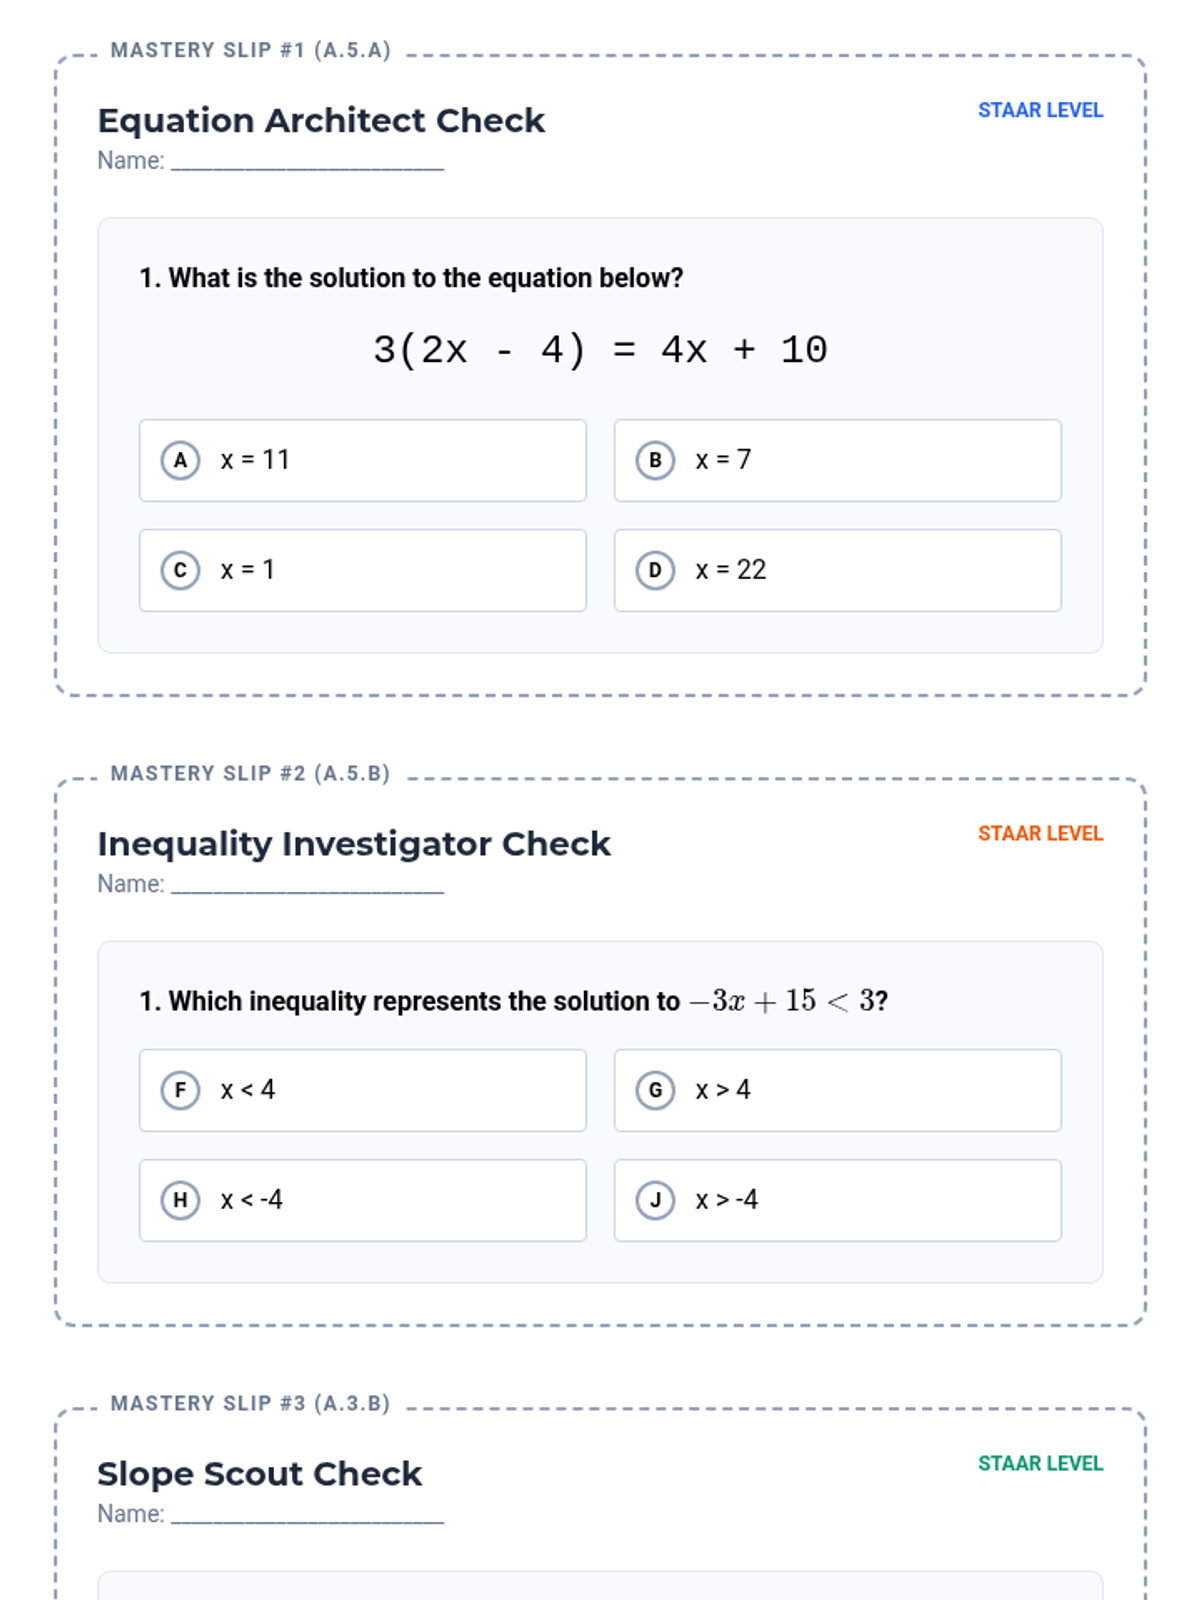
A series of targeted Algebra 1 lessons focusing on foundational linear skills: solving equations, inequalities, and calculating rate of change, all aligned to STAAR standards.
A Tier 2 intervention sequence for 8th-grade students focused on mastering the concept of functions and interpreting linear equations in the form y = mx + b. This unit provides scaffolded instruction on identifying functions, calculating slope, and connecting multiple representations.
A targeted intervention series focused on helping students compare key features of functions across various representations including graphs, tables, and equations.
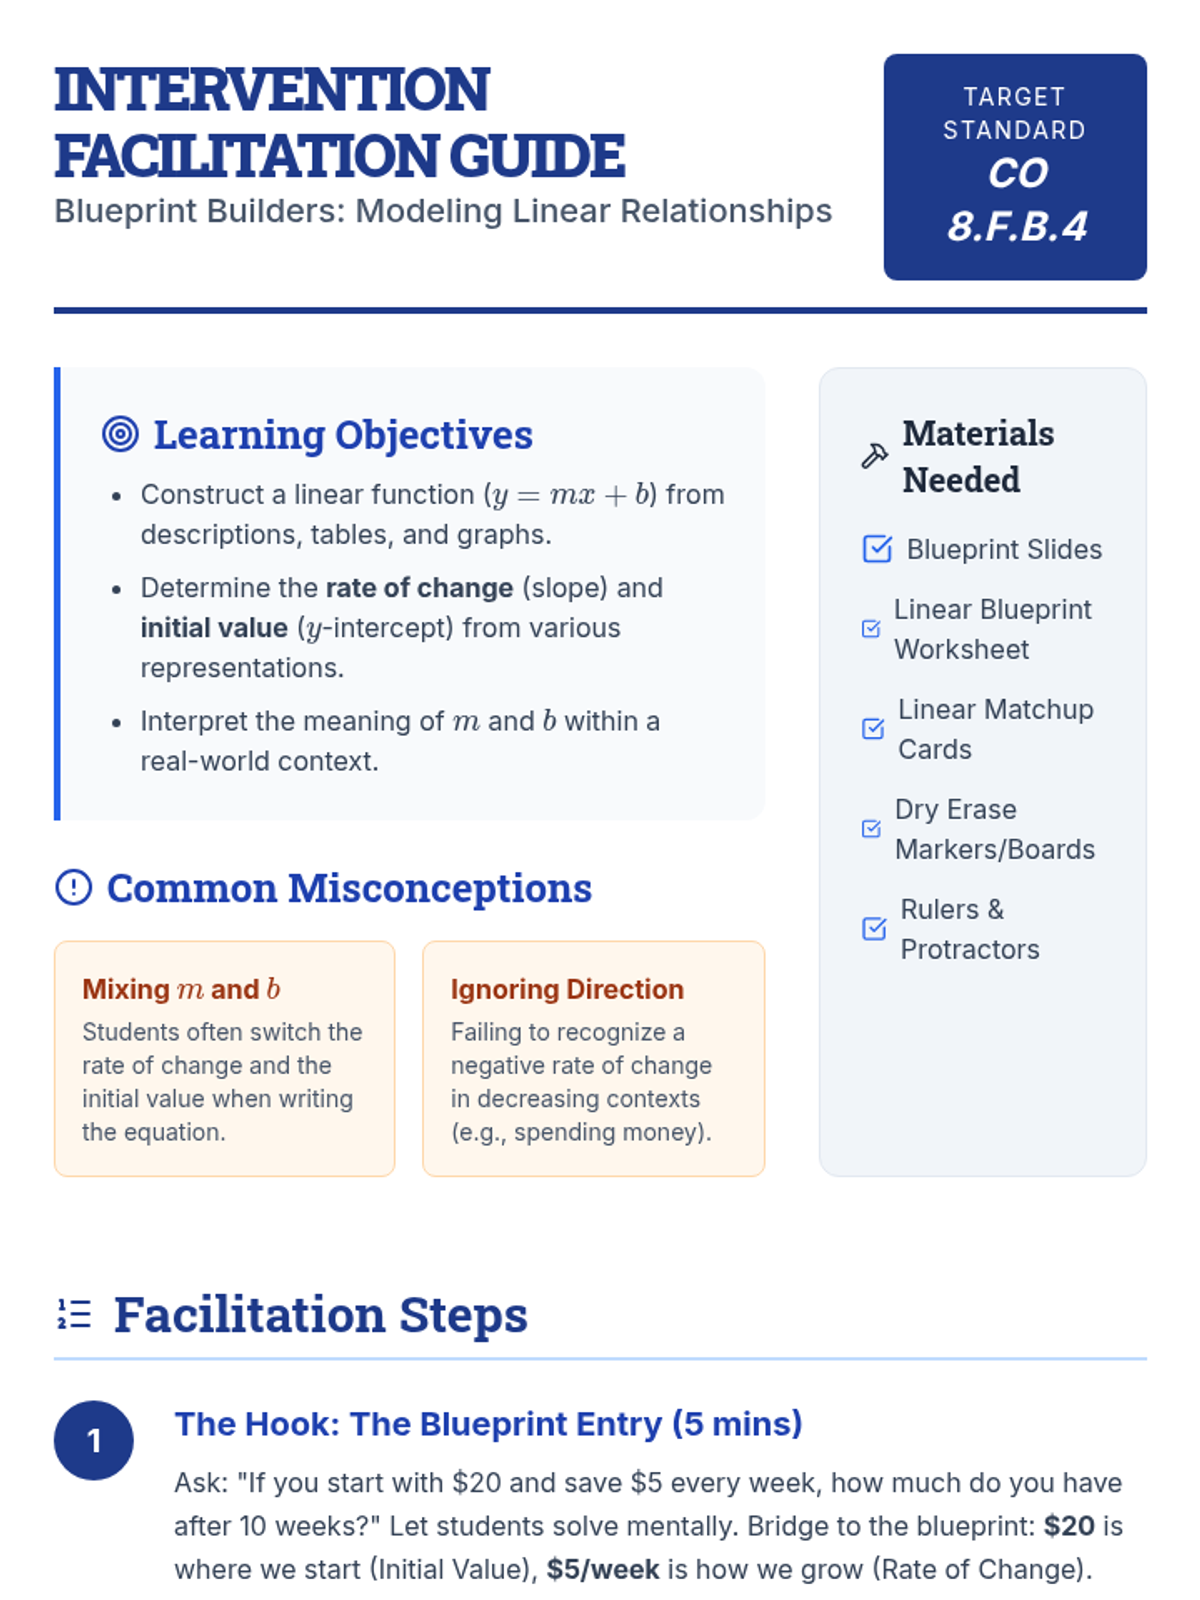
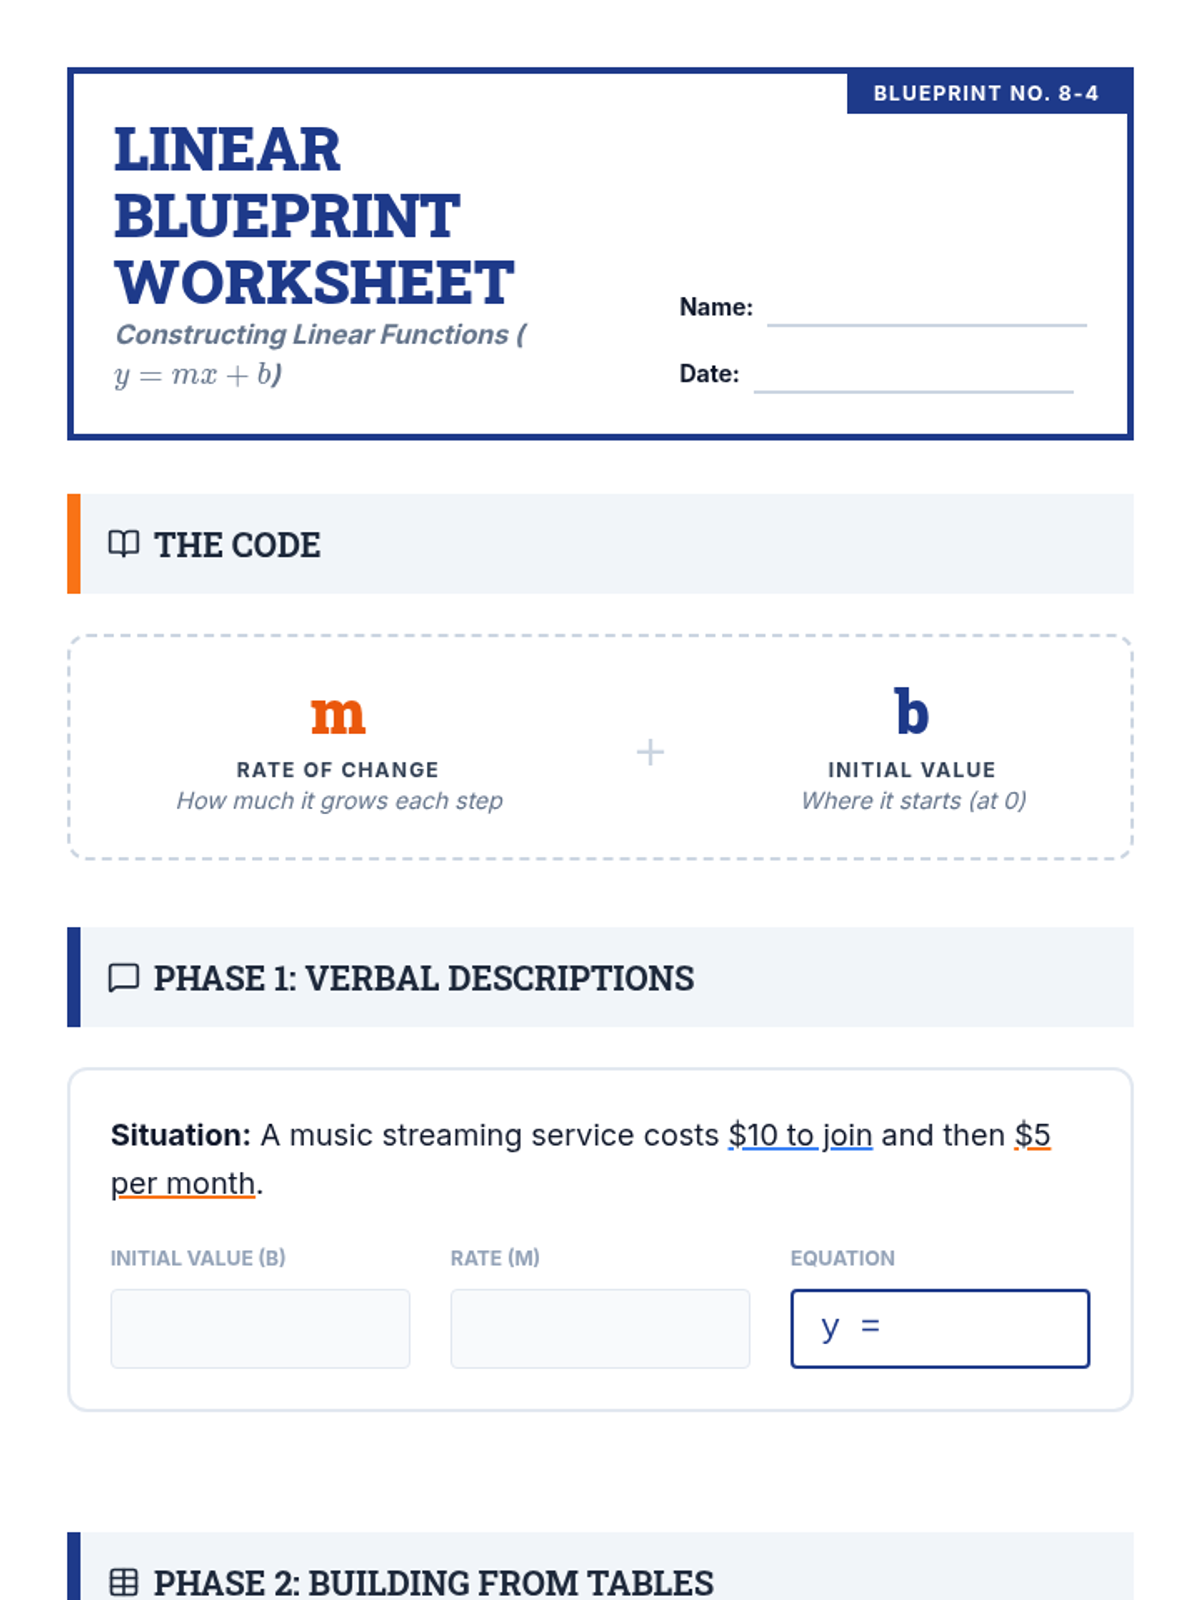
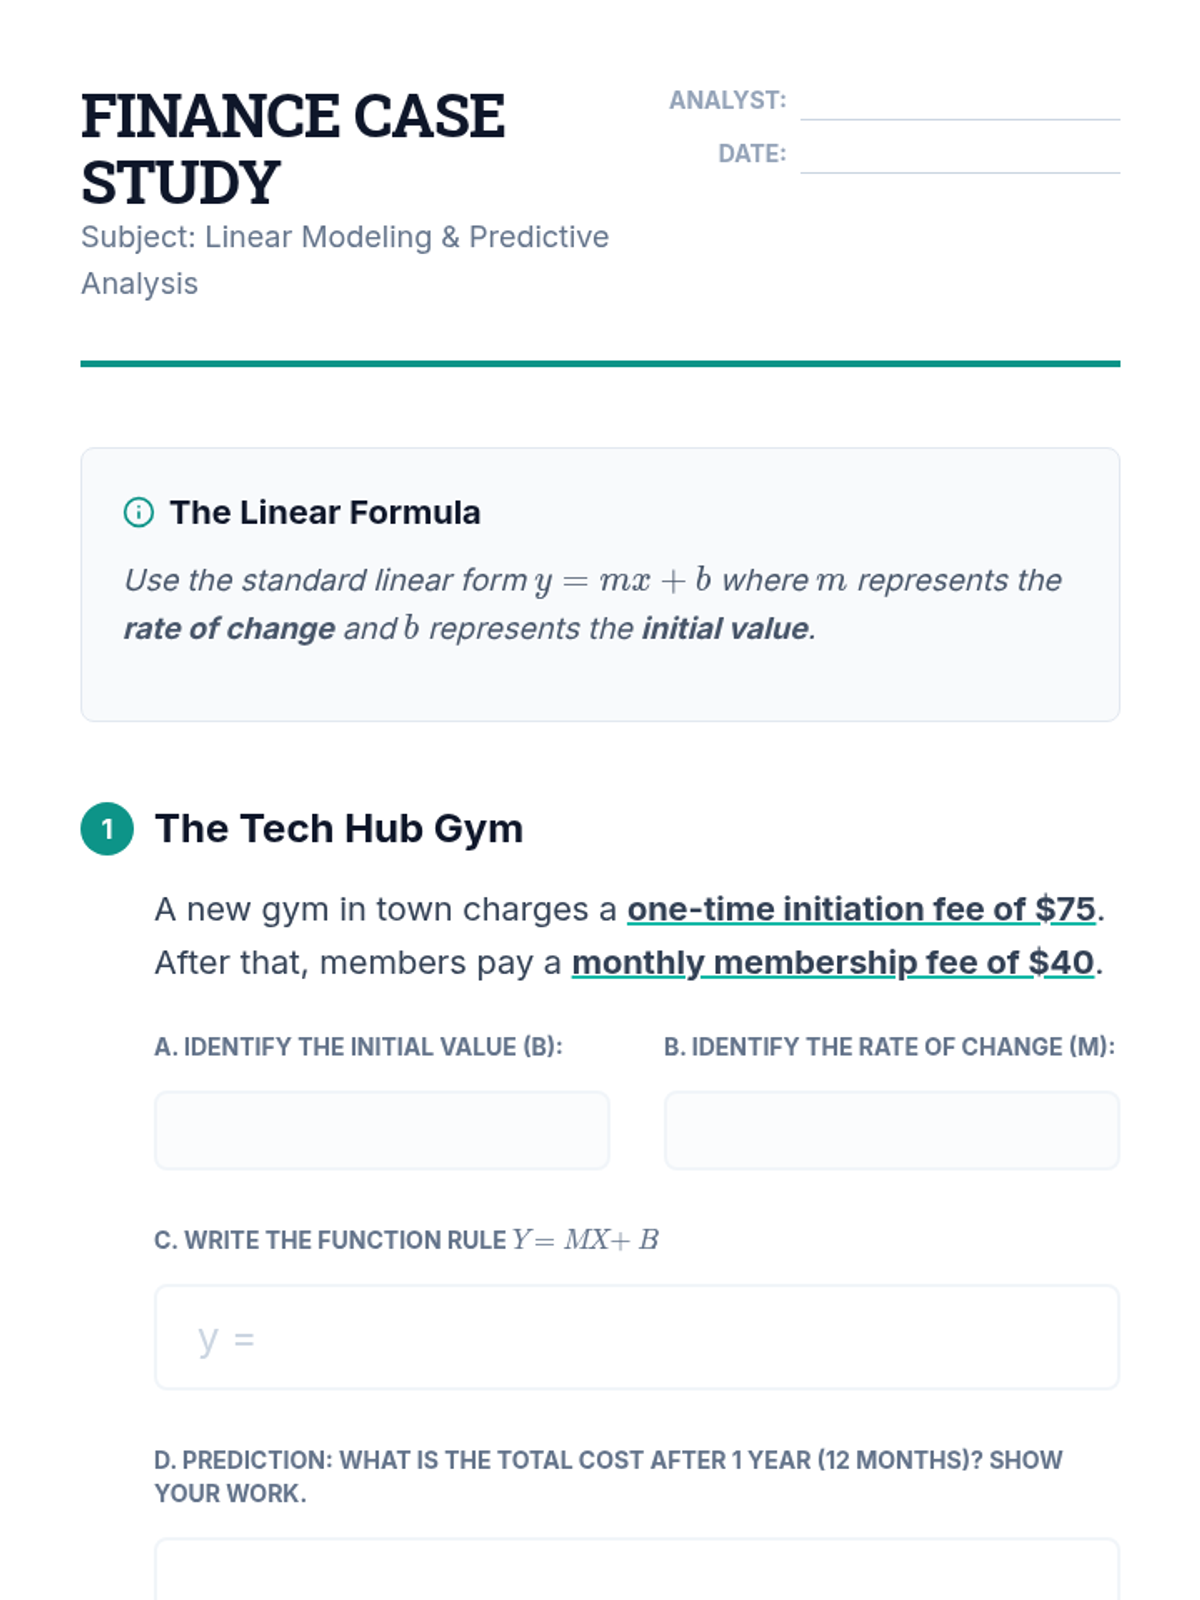
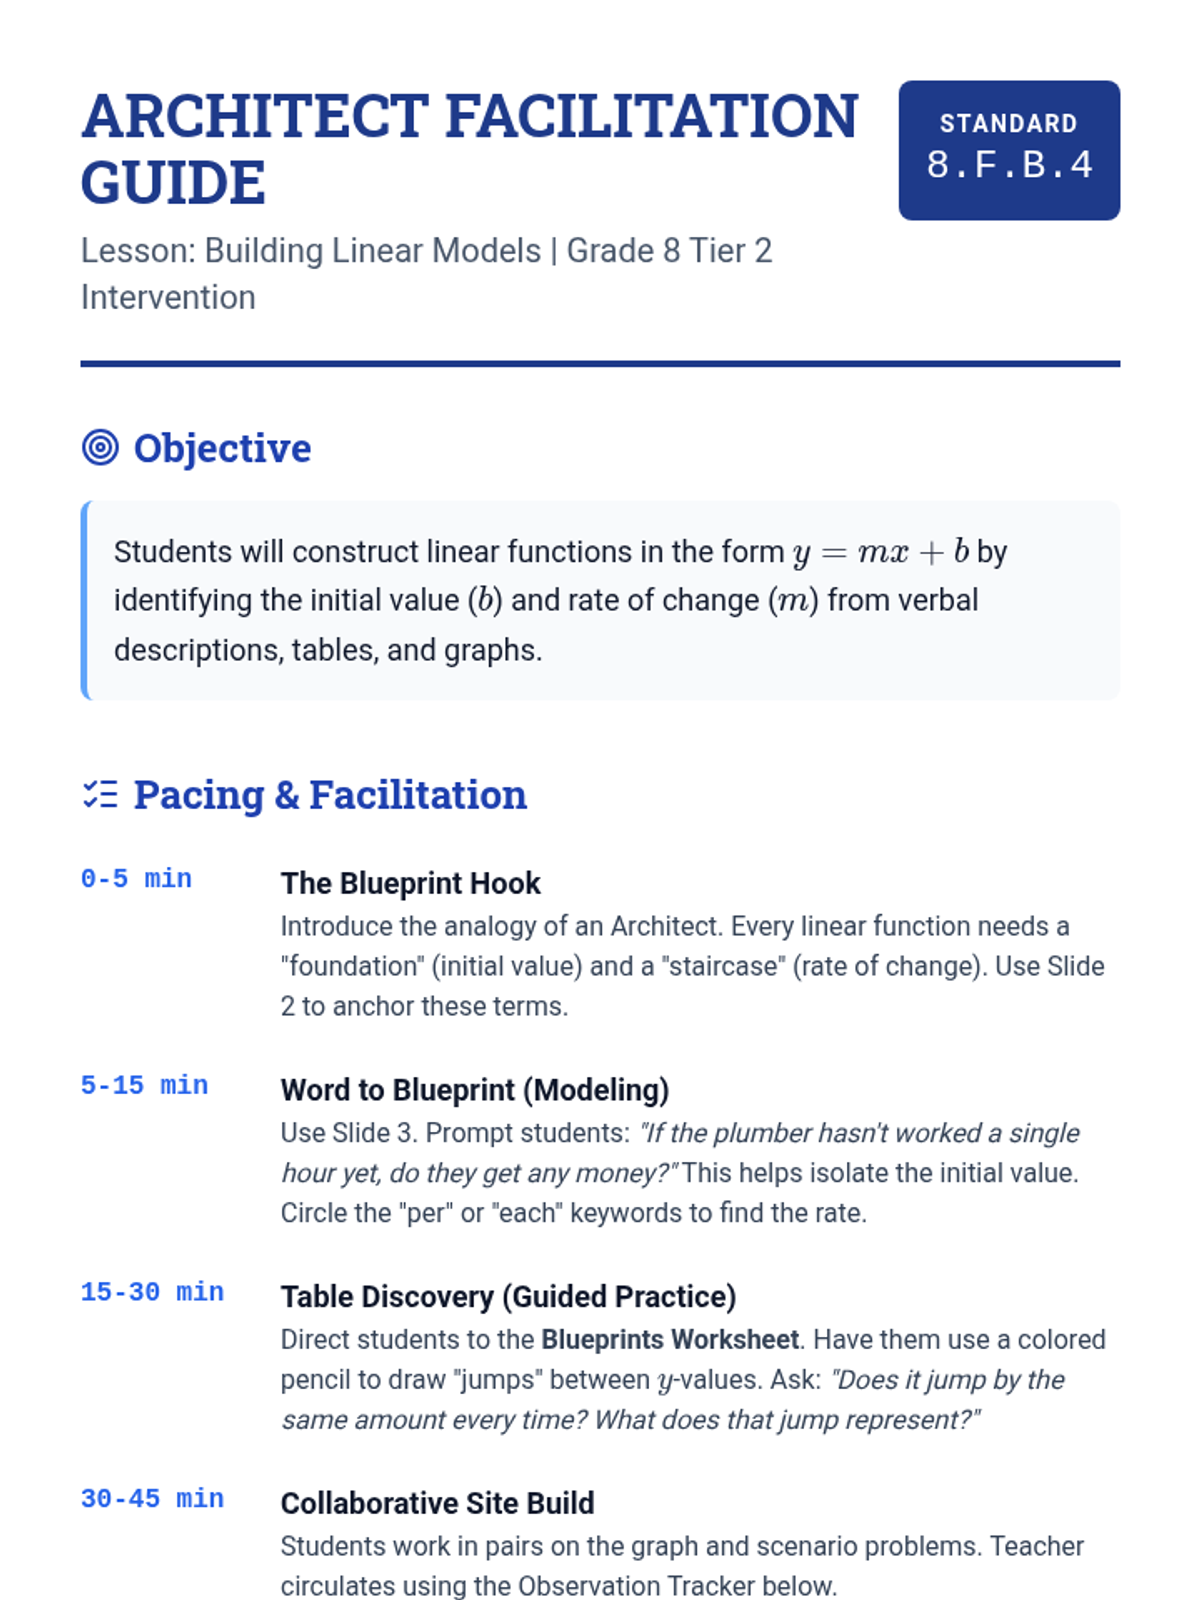
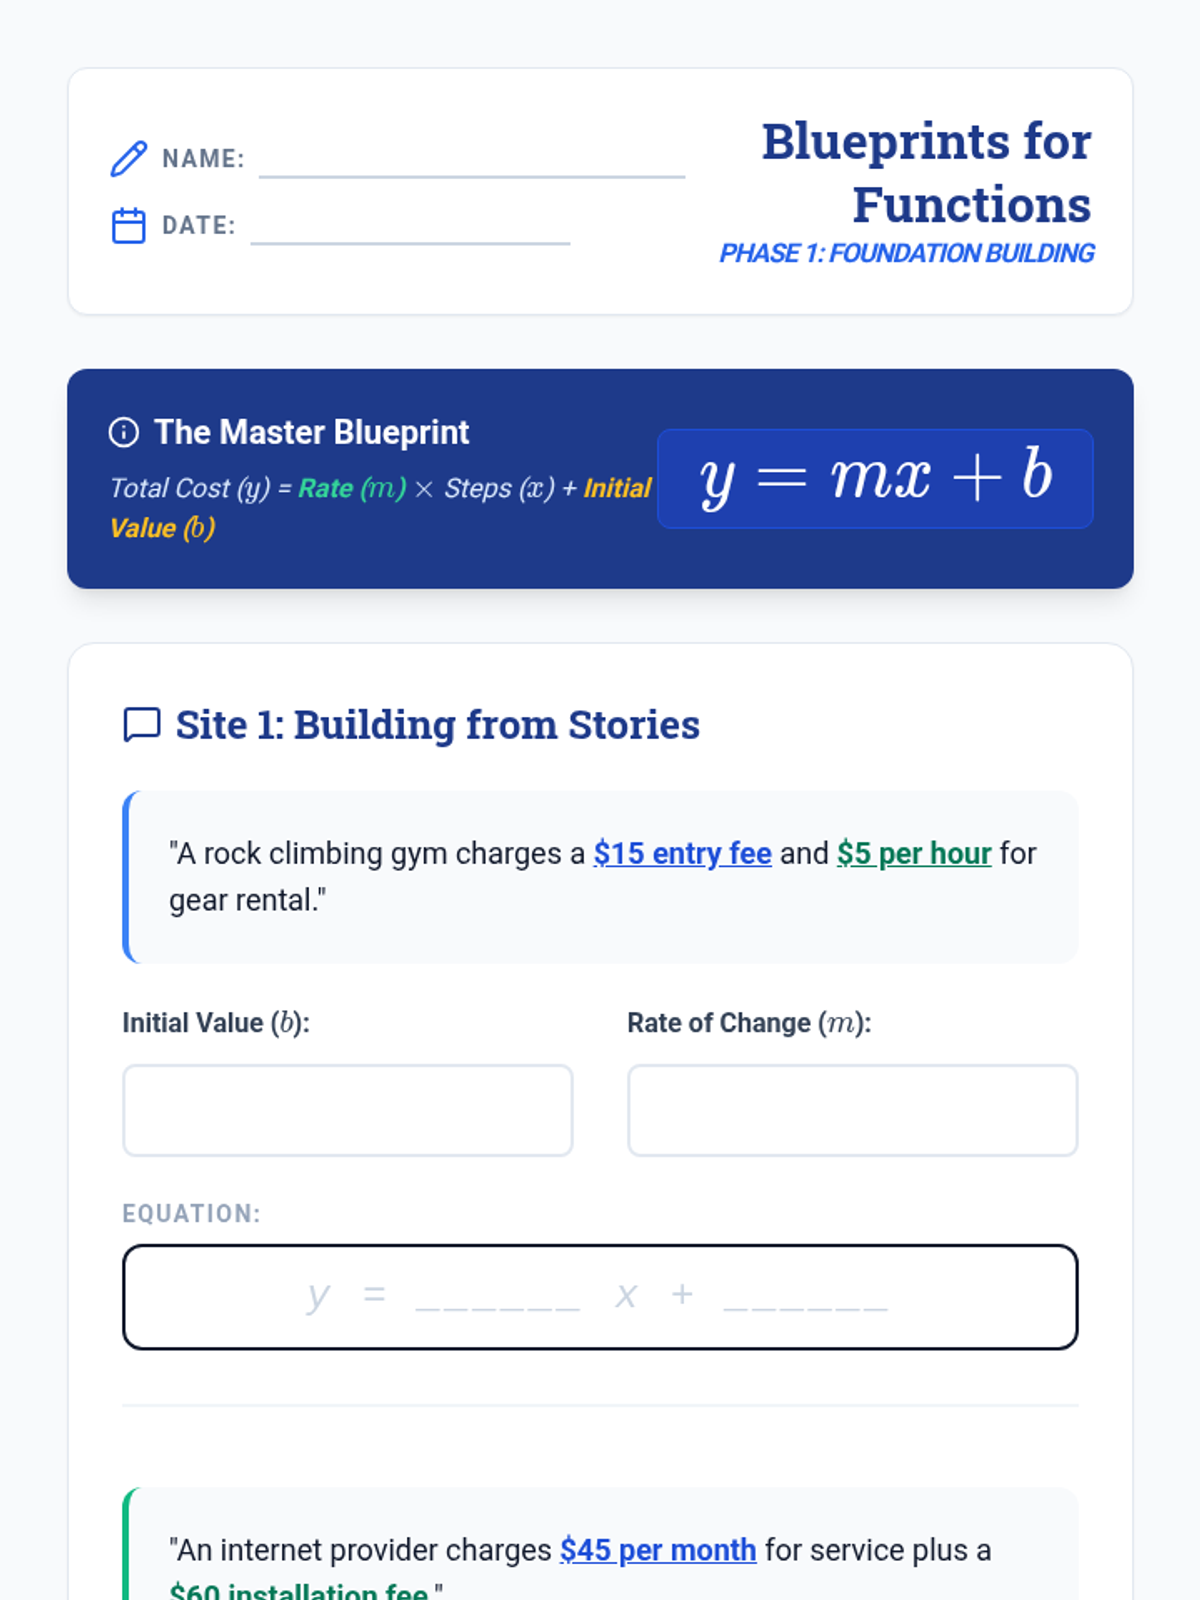
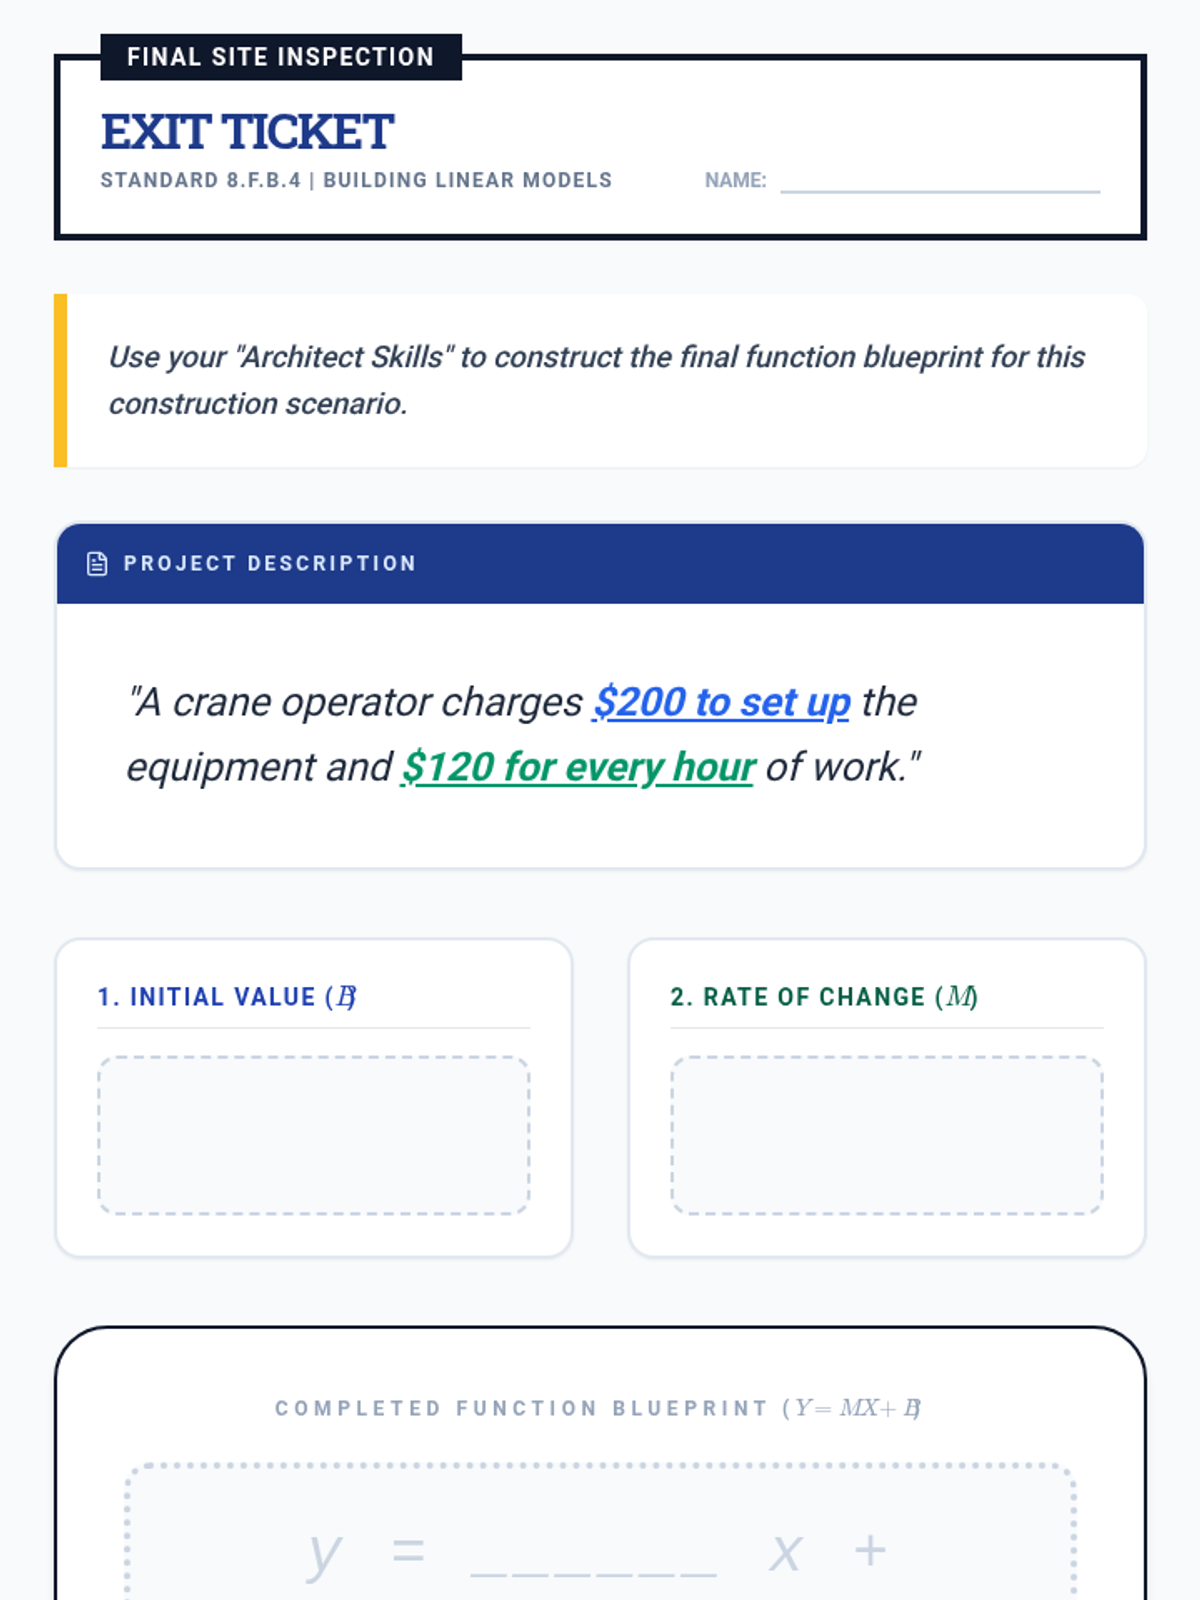
A targeted intervention sequence focused on Grade 8 linear modeling, helping students construct functions from verbal descriptions, tables, and graphs while interpreting rate of change and initial value in context.
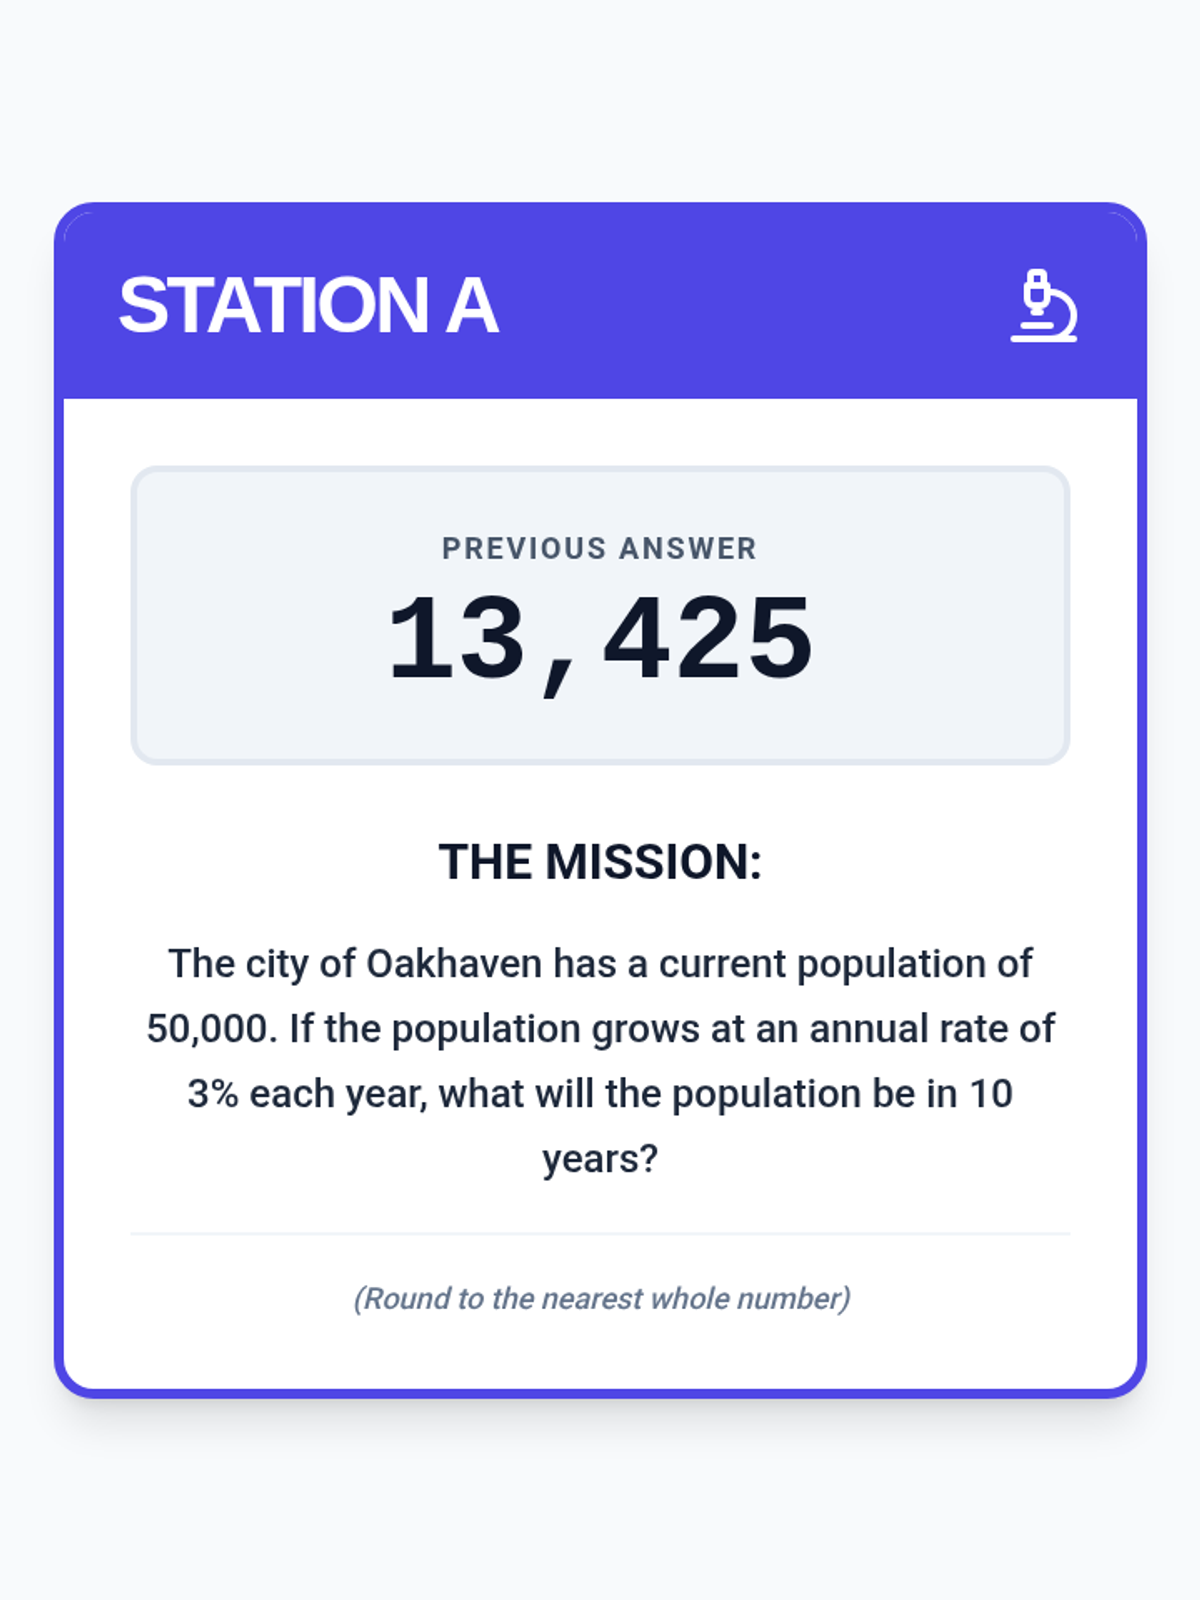
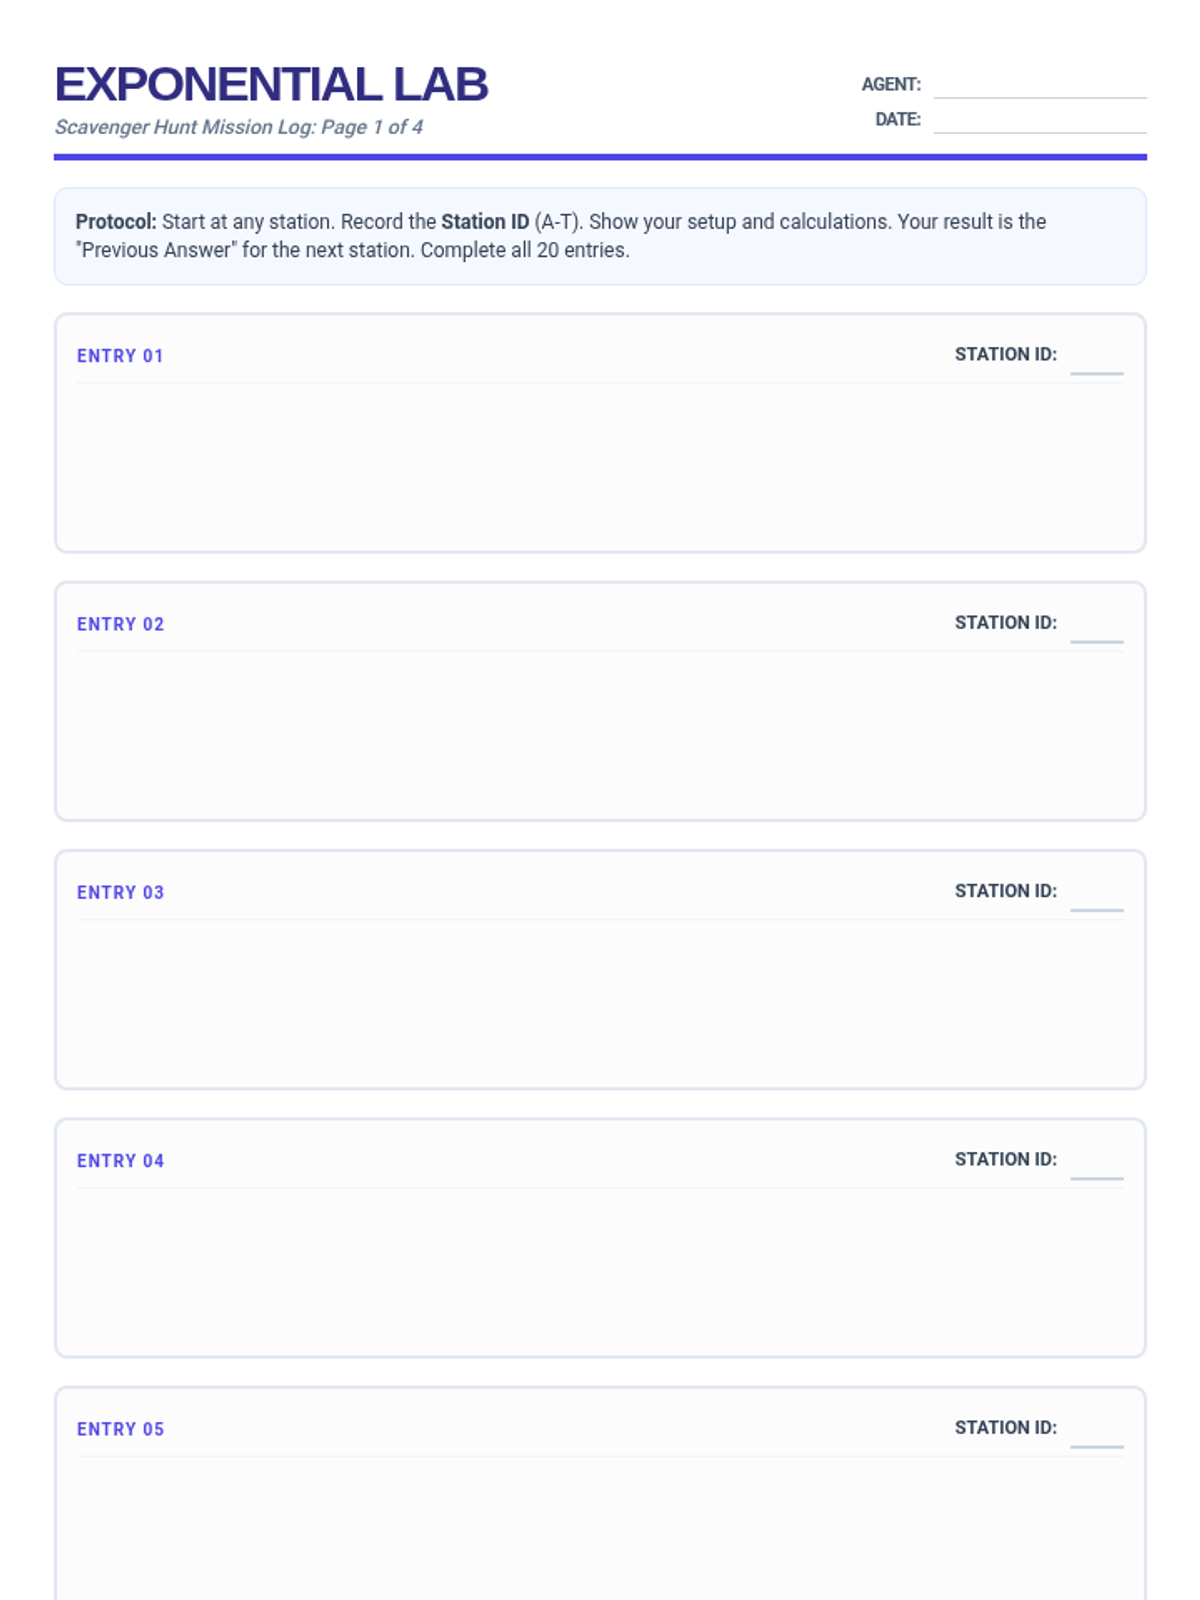
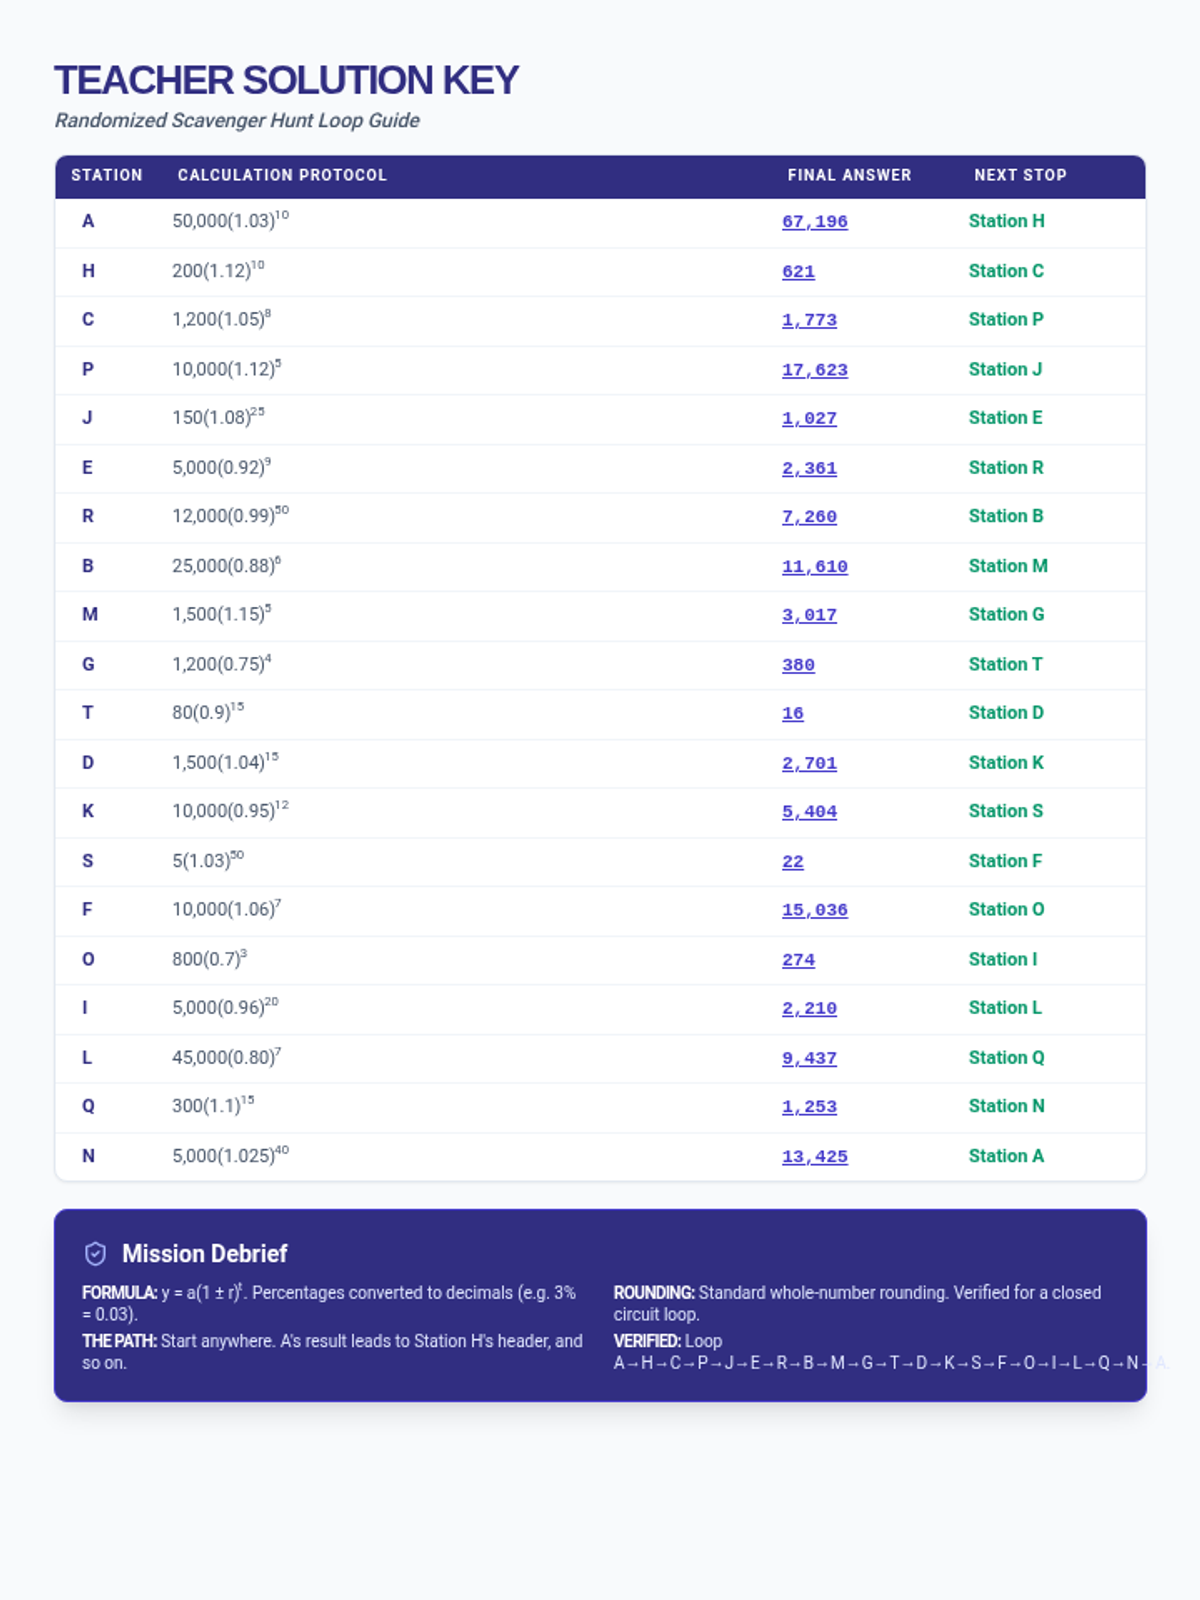
A high-energy, real-world application of exponential growth and decay through an interactive scavenger hunt. Students solve 20 distinct word problems to navigate a loop of stations.
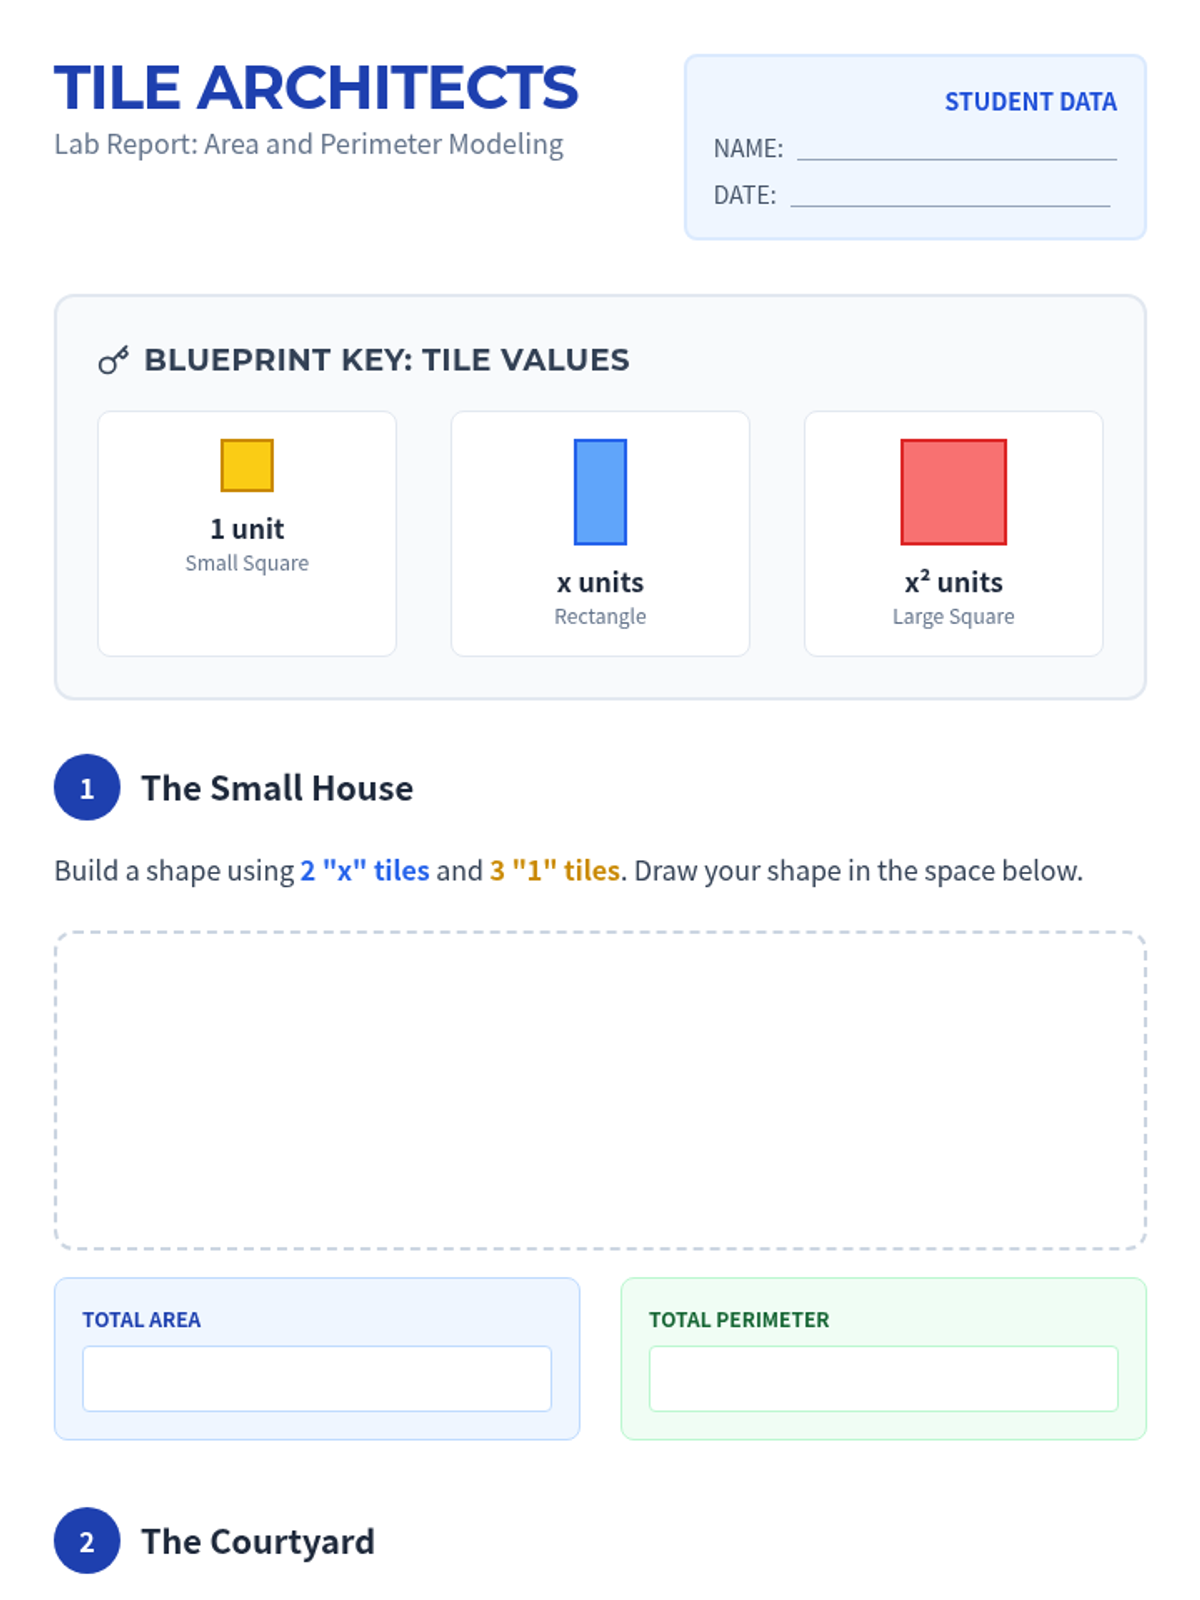
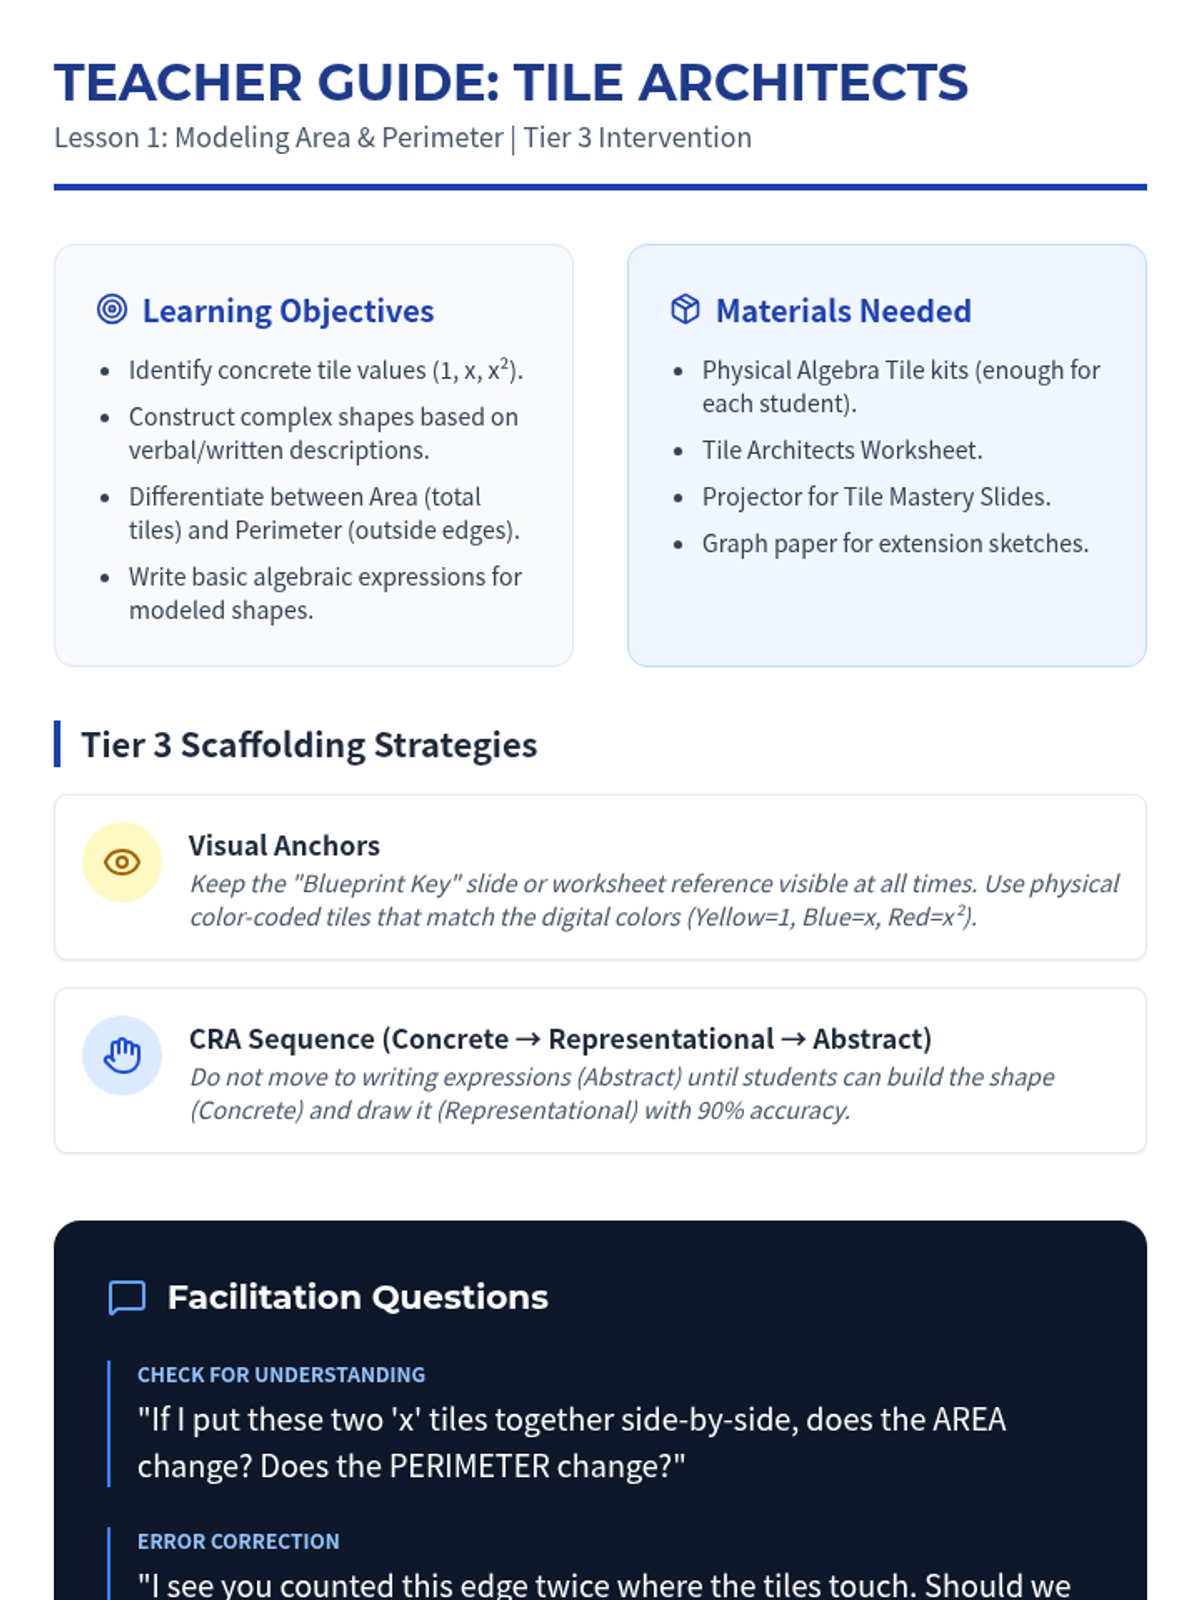
A specialized Tier 3 intervention sequence for 8th-grade students performing at a 5th-grade level, focusing on bridging foundational arithmetic to high school algebra concepts. This sequence uses concrete-representational-abstract (CRA) methods to explore area modeling, systems of equations, exponential patterns, and inequalities.
A series of lessons exploring exponential functions, their components, graphs, and real-world applications in Algebra 1.
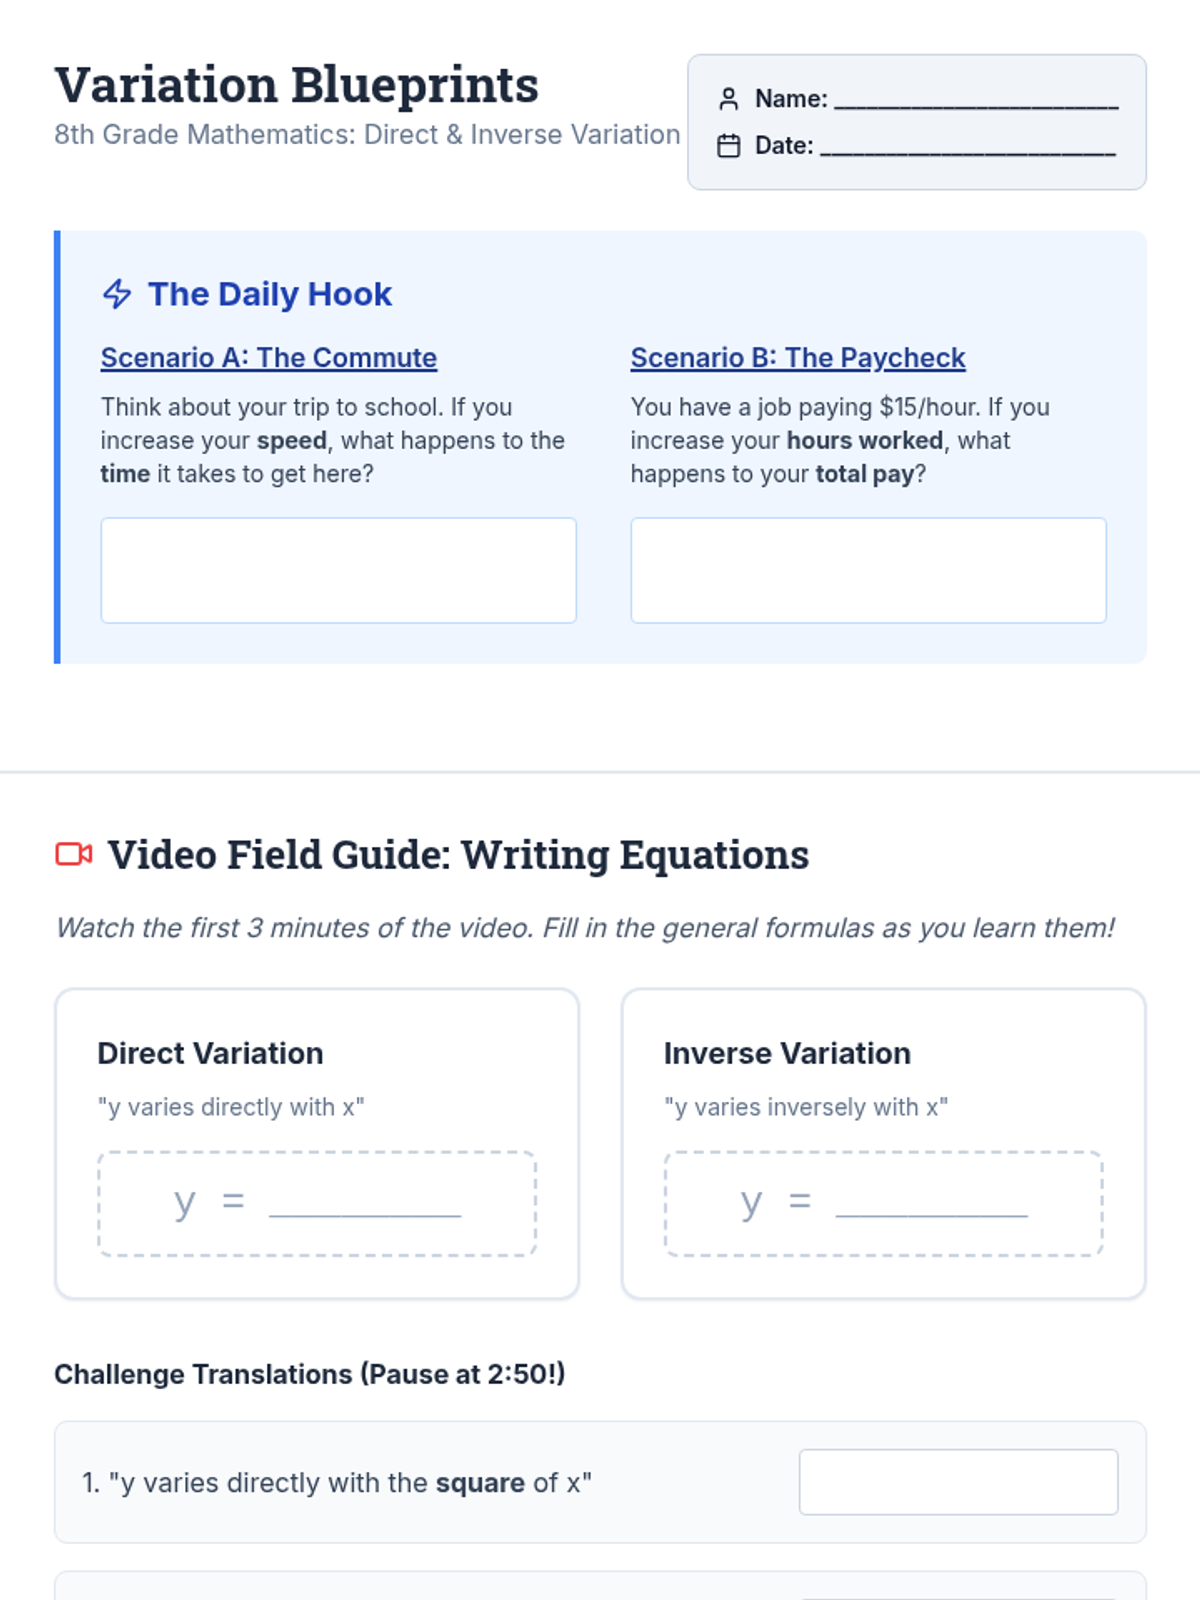
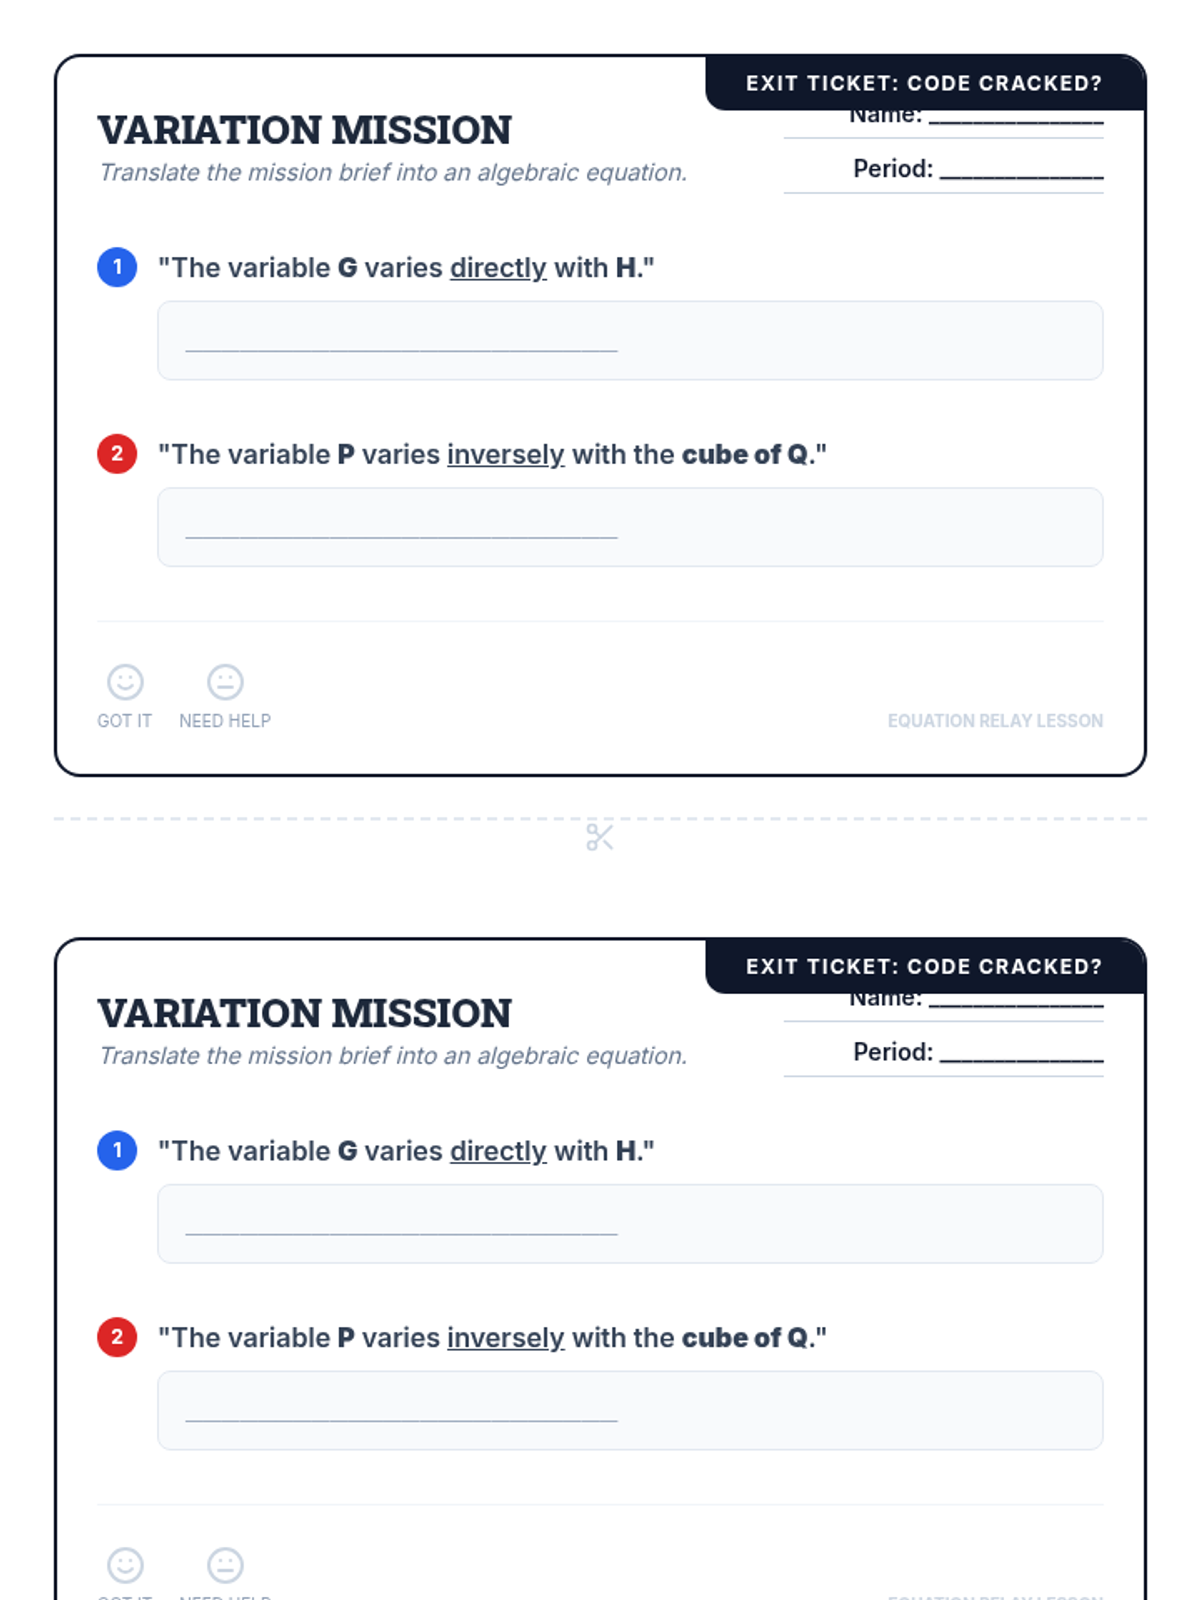
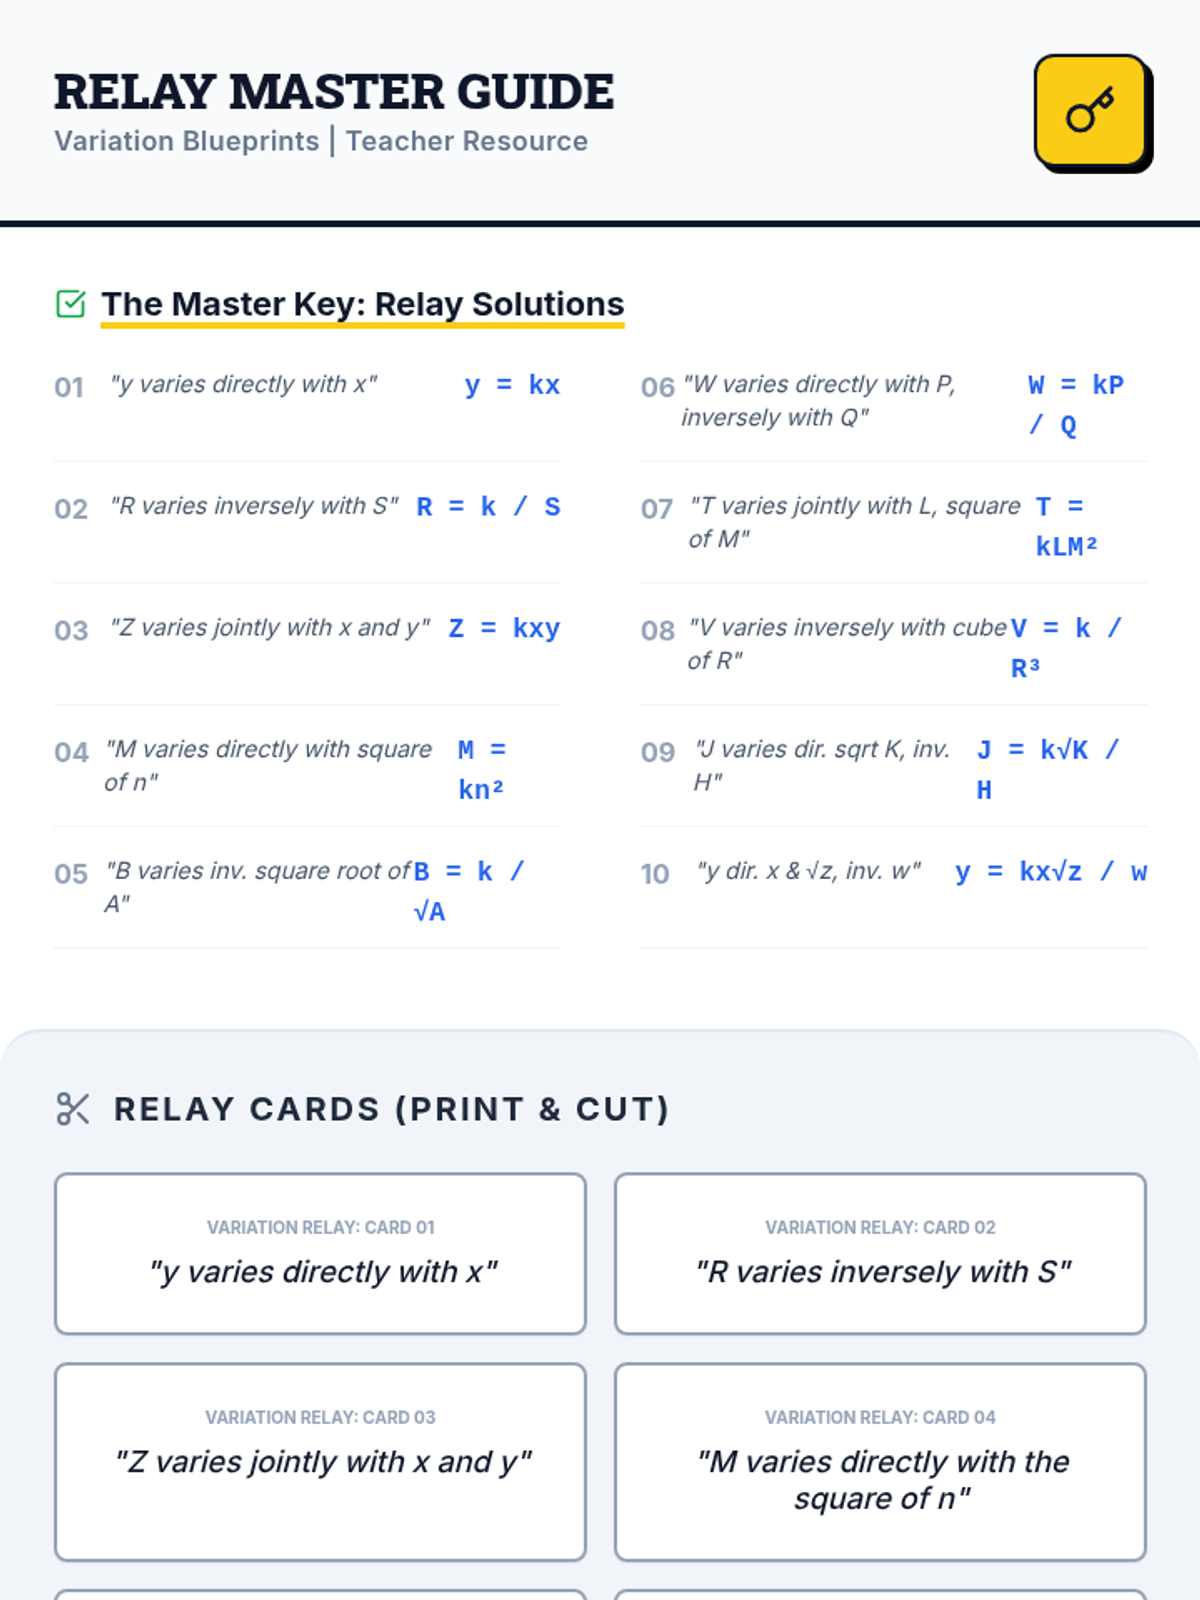
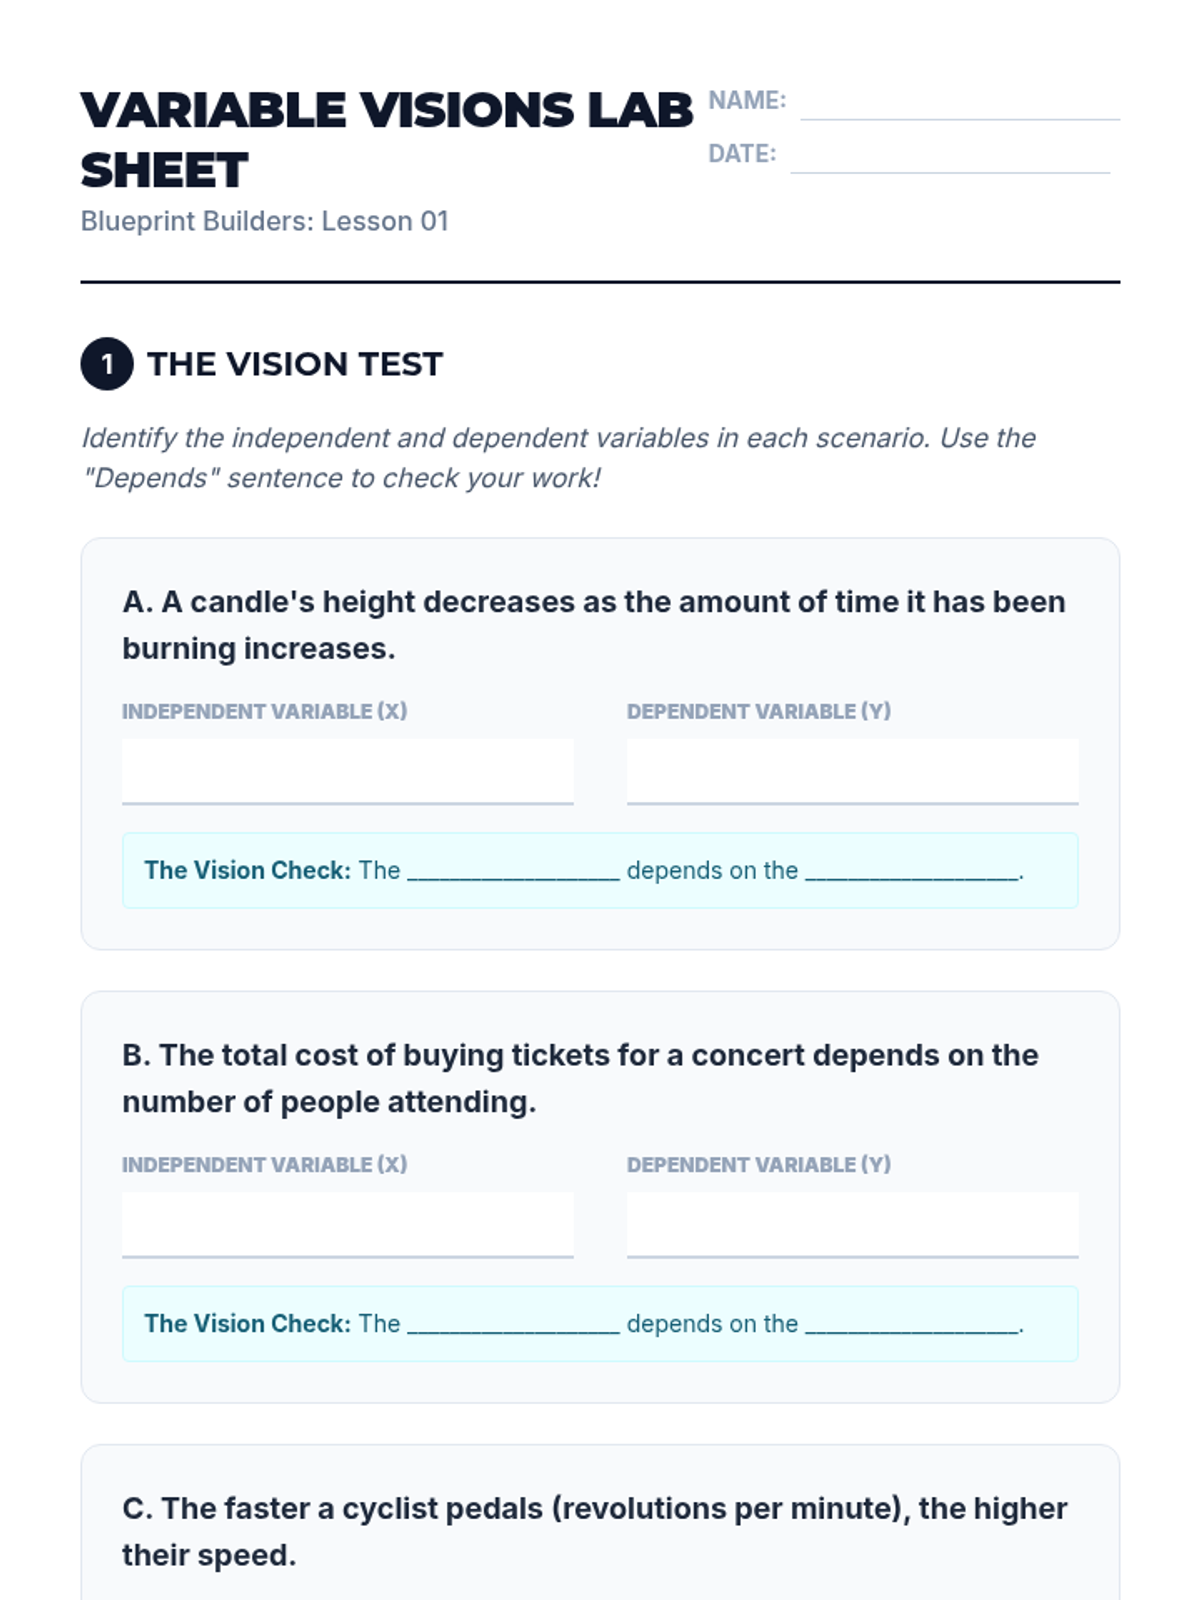
A lesson sequence focused on understanding the relationships between variables, specifically direct and inverse variation, and translating verbal descriptions into algebraic equations.
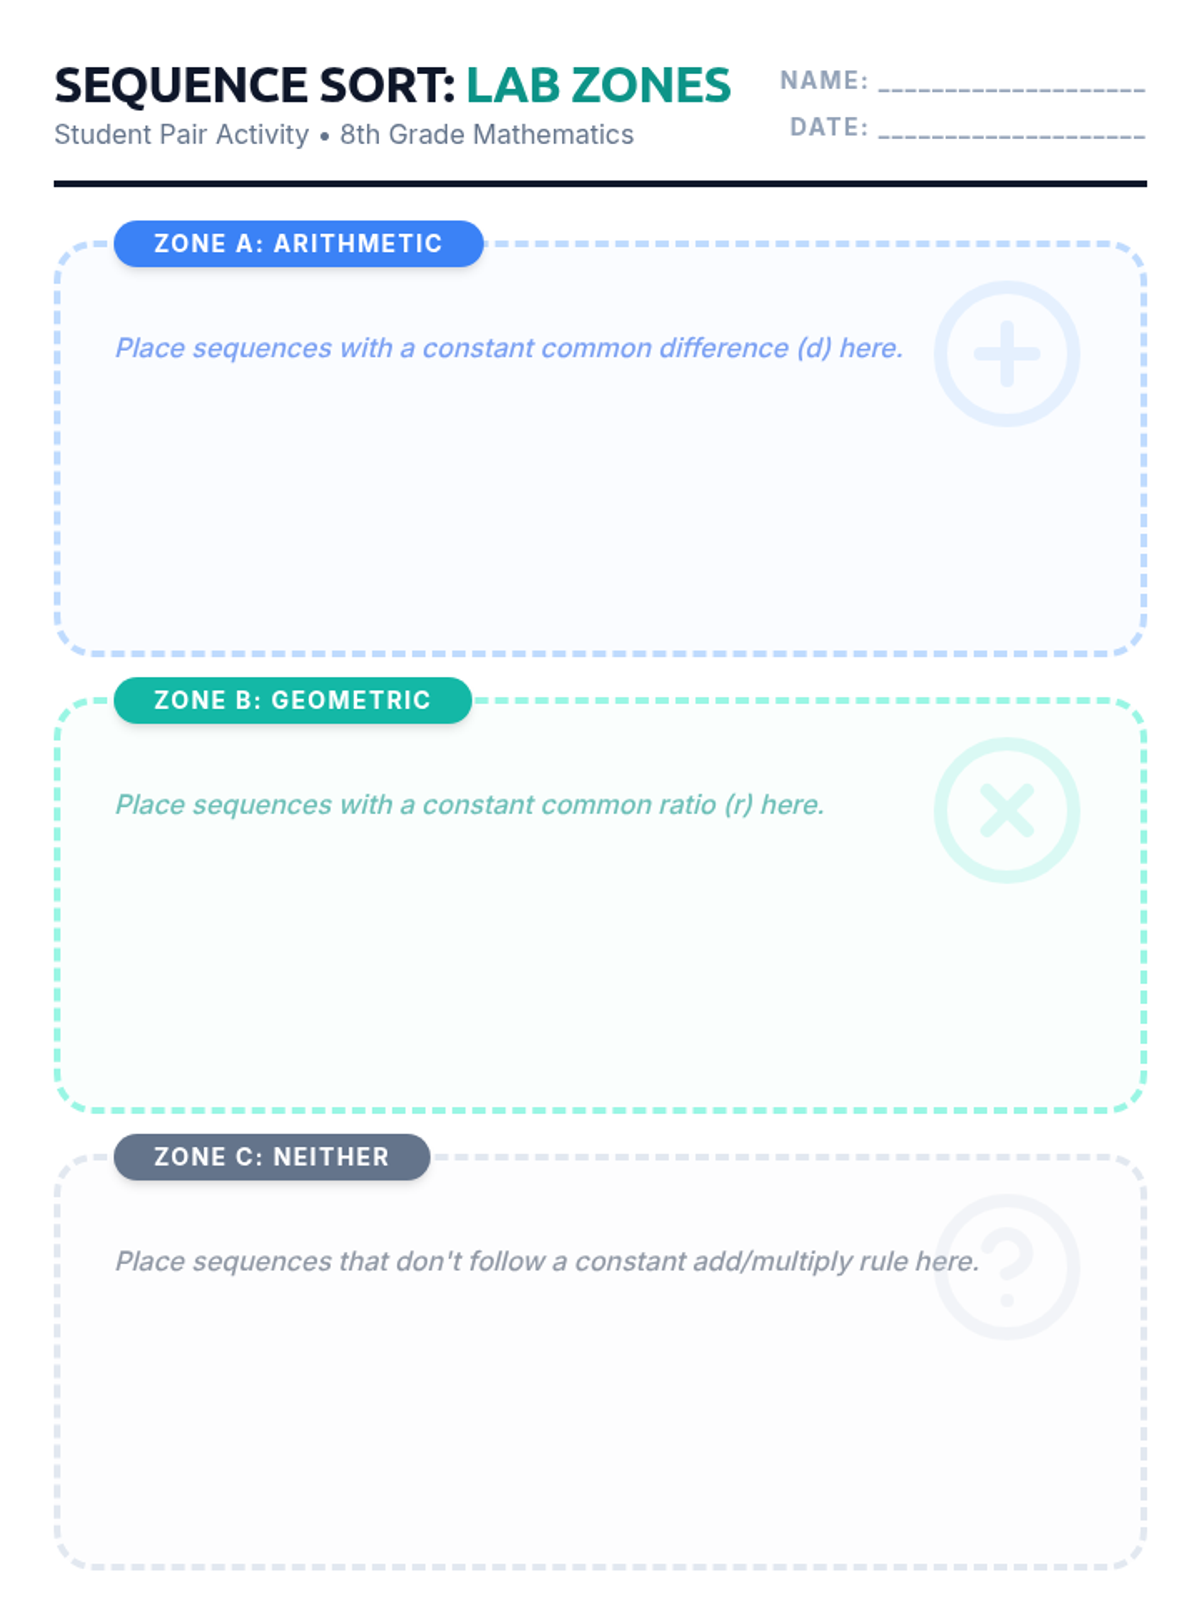
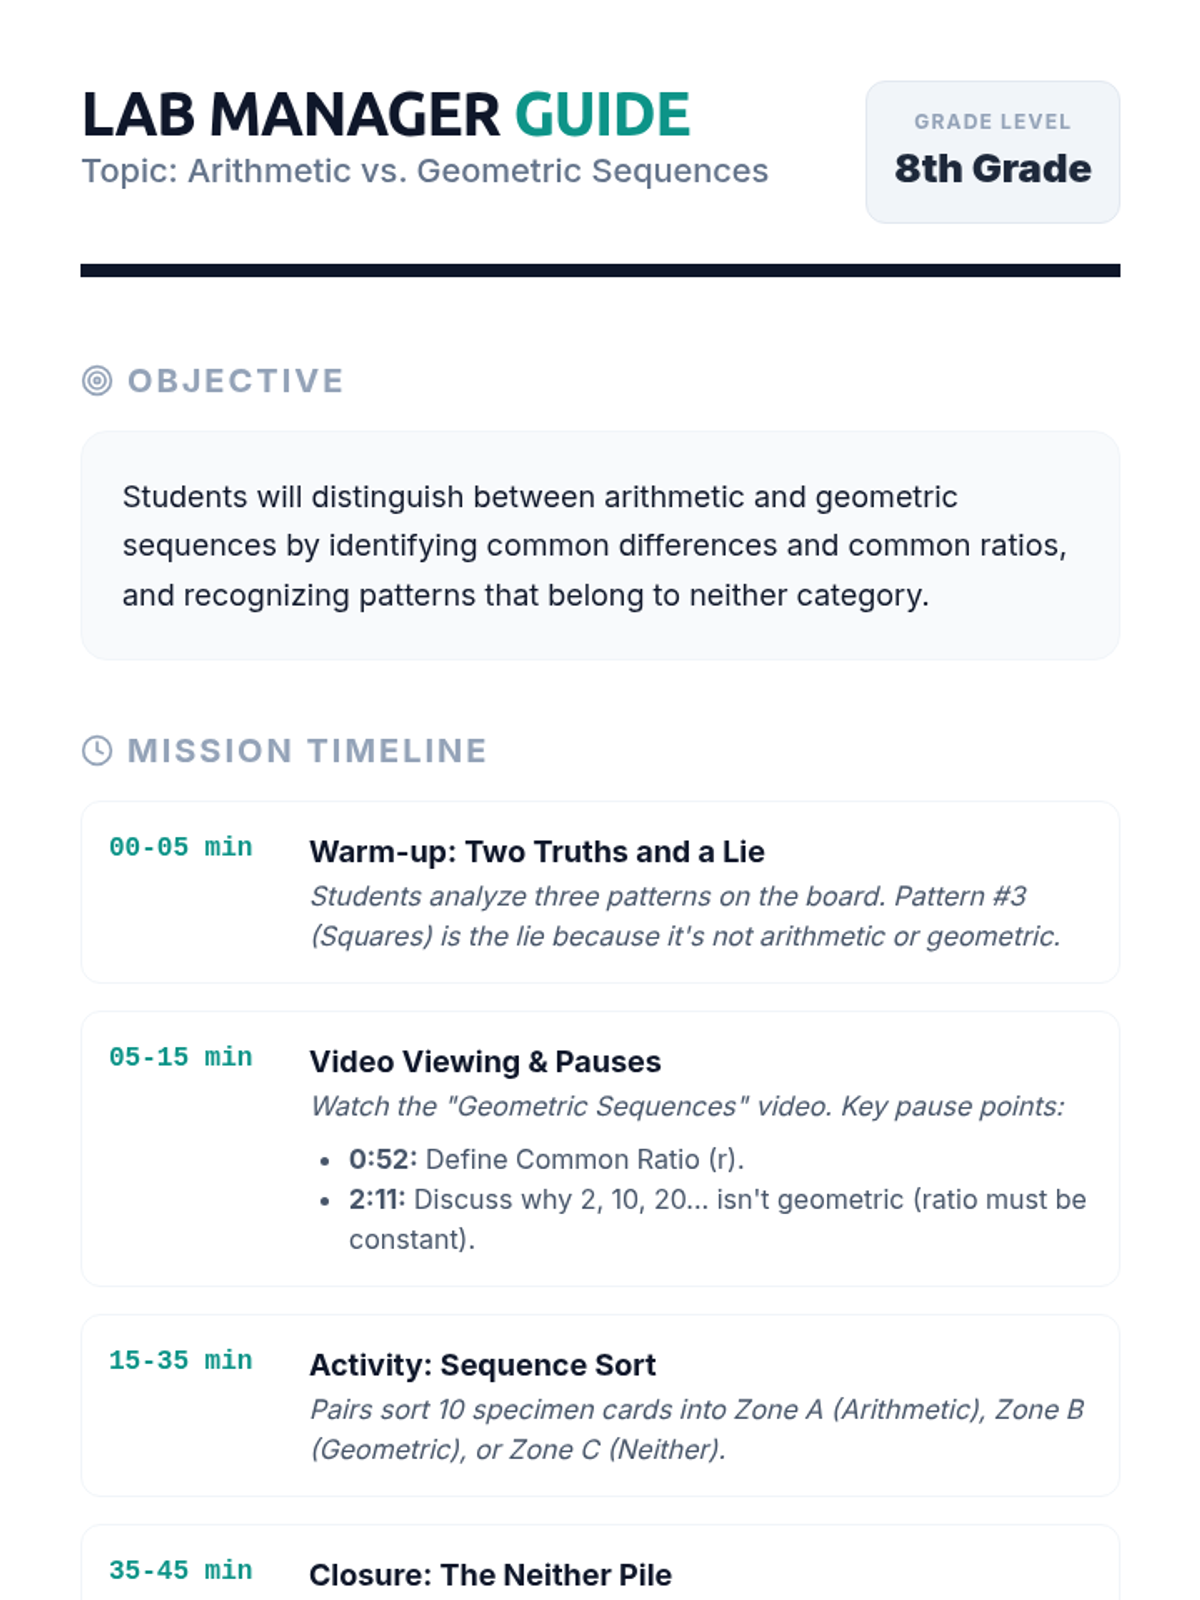
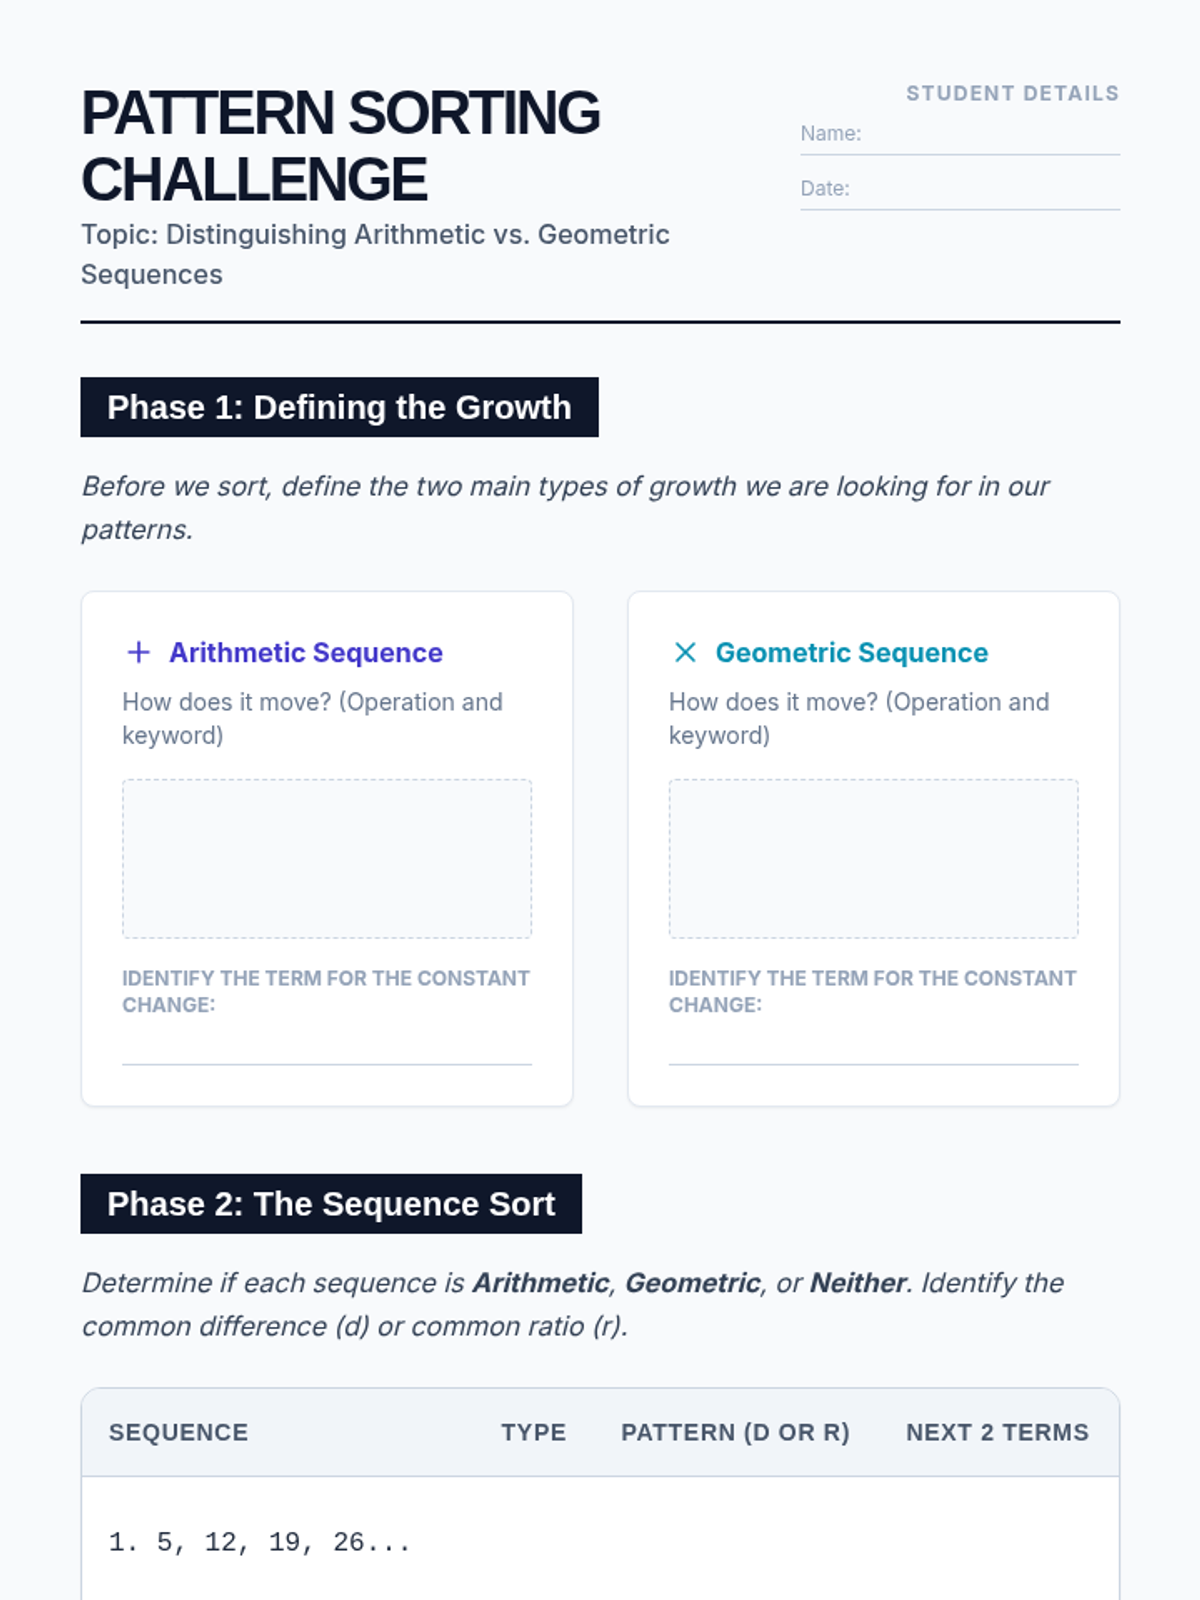
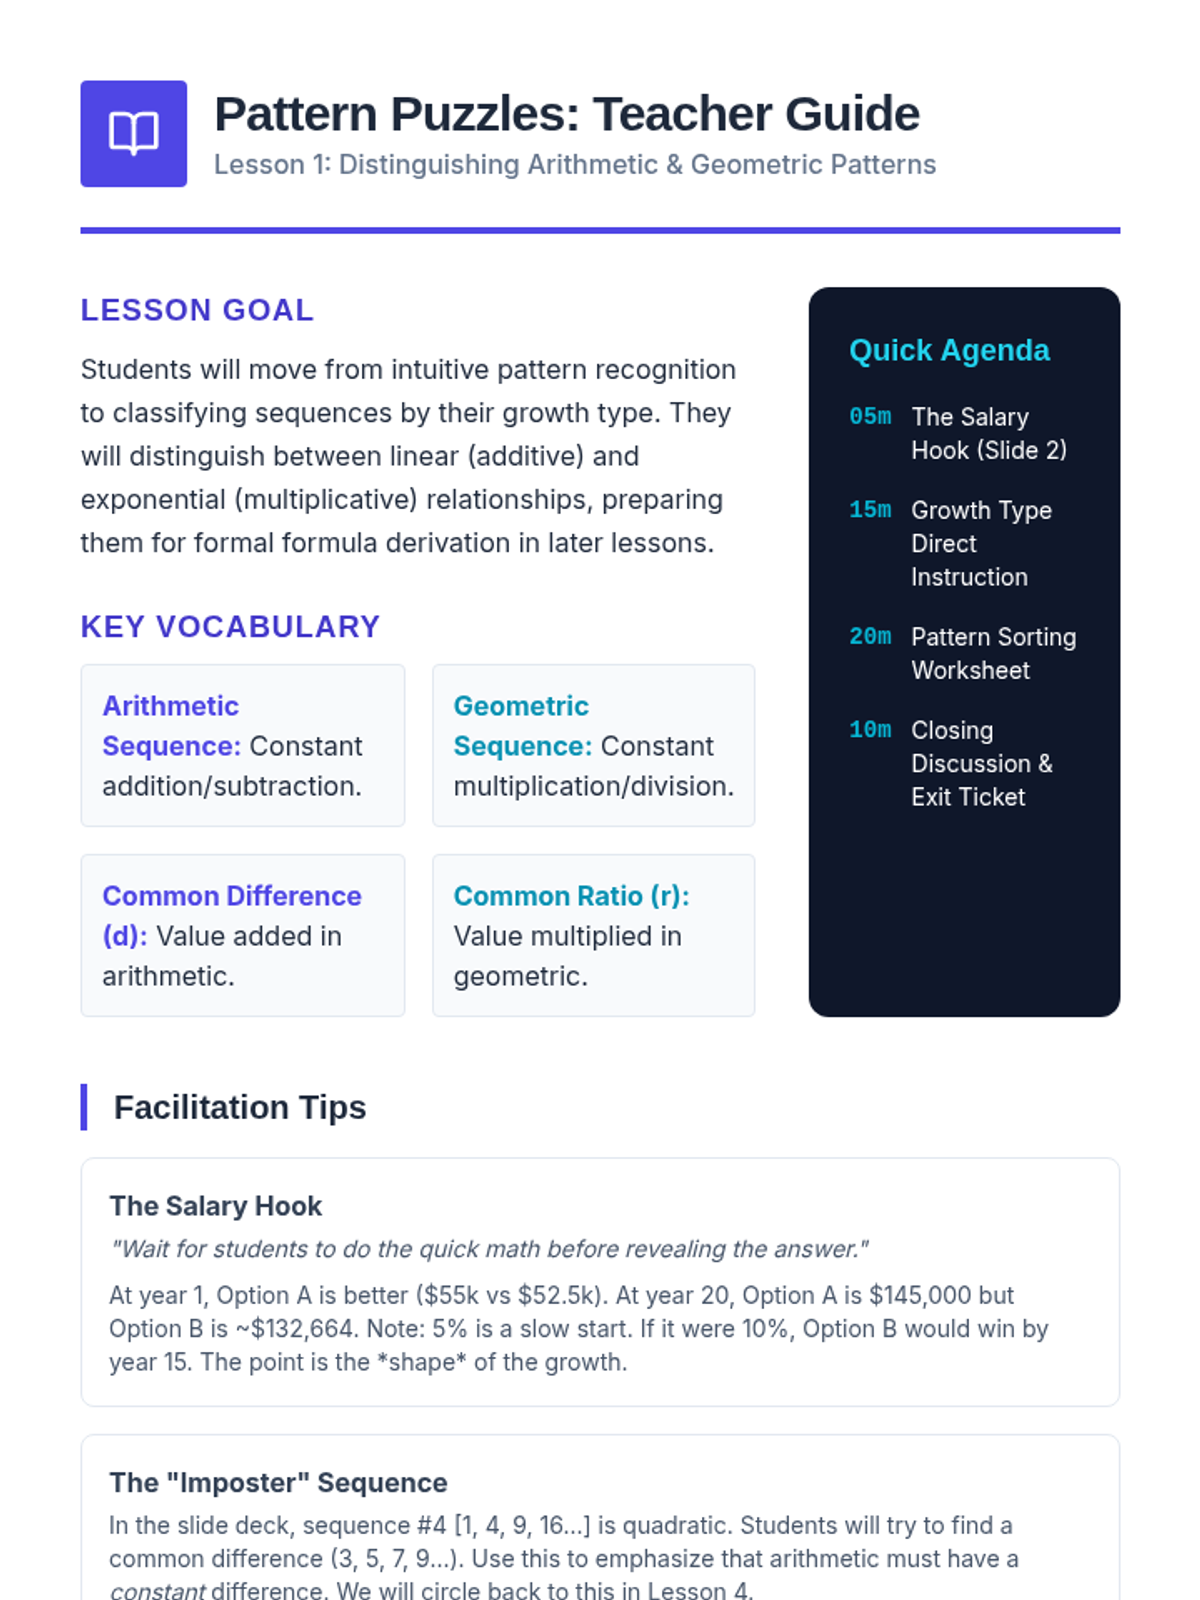
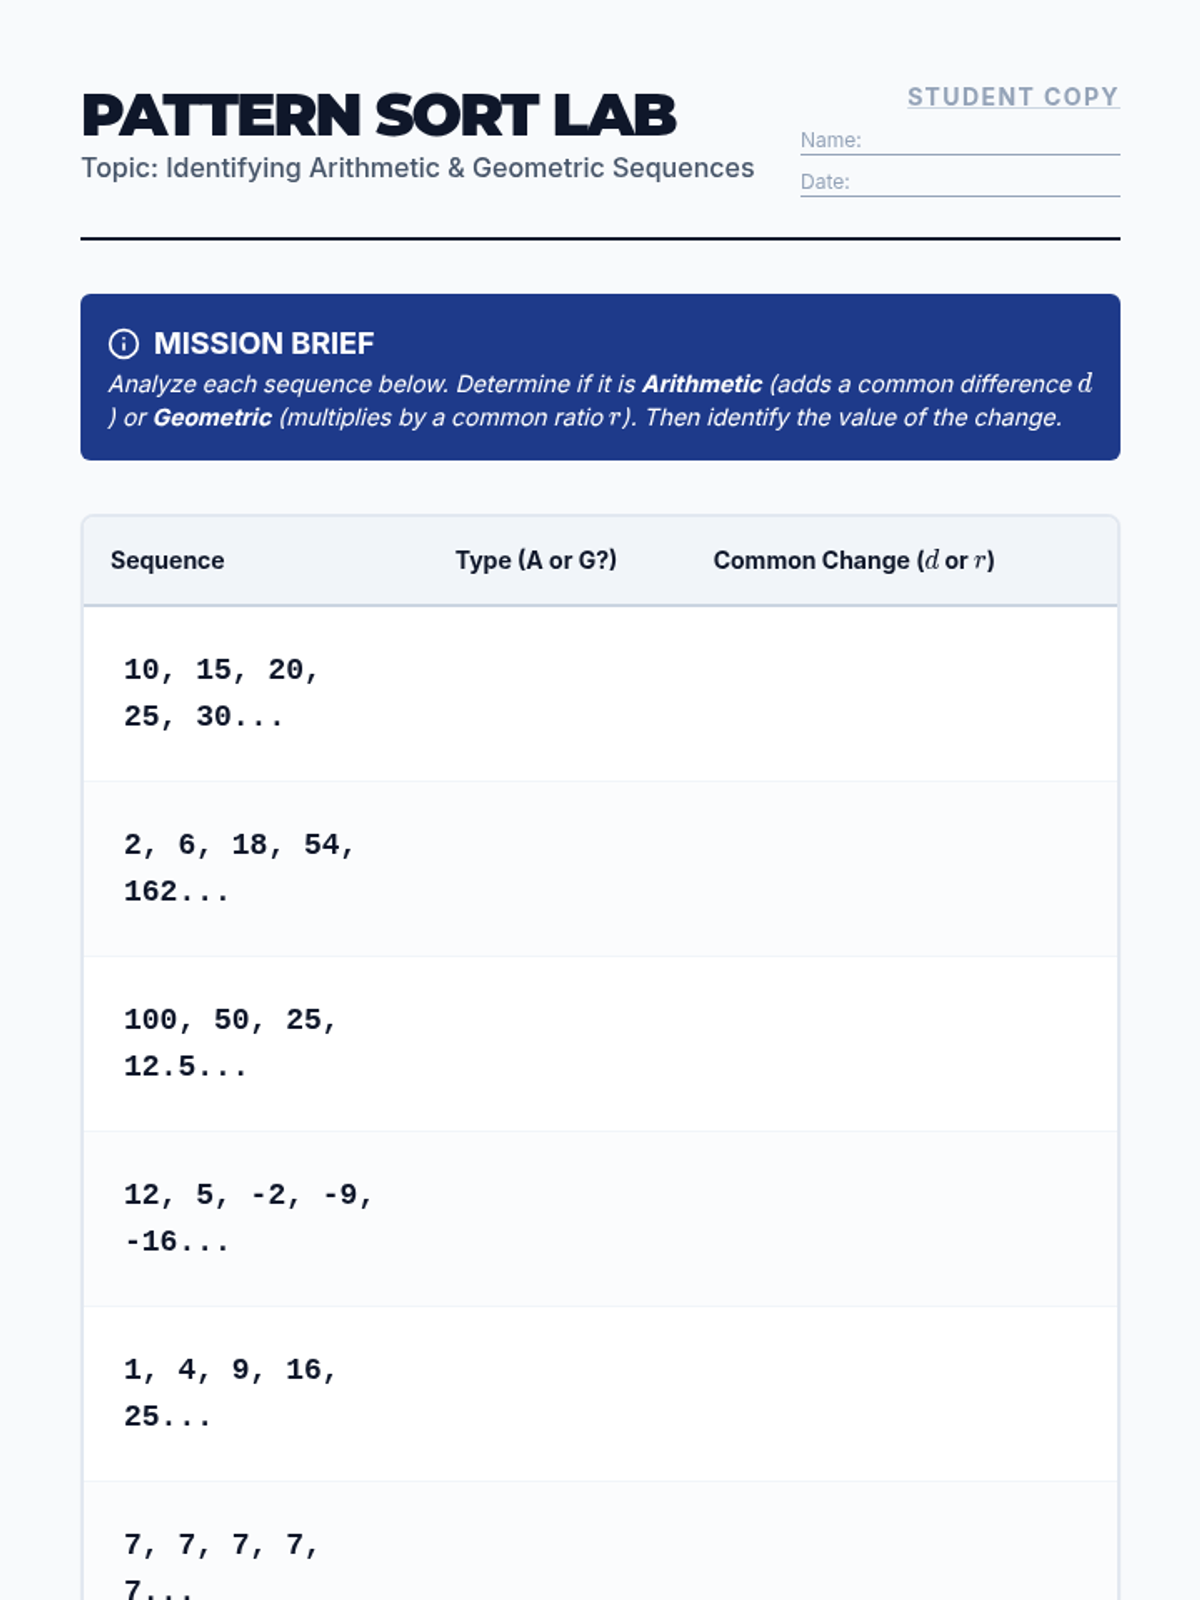
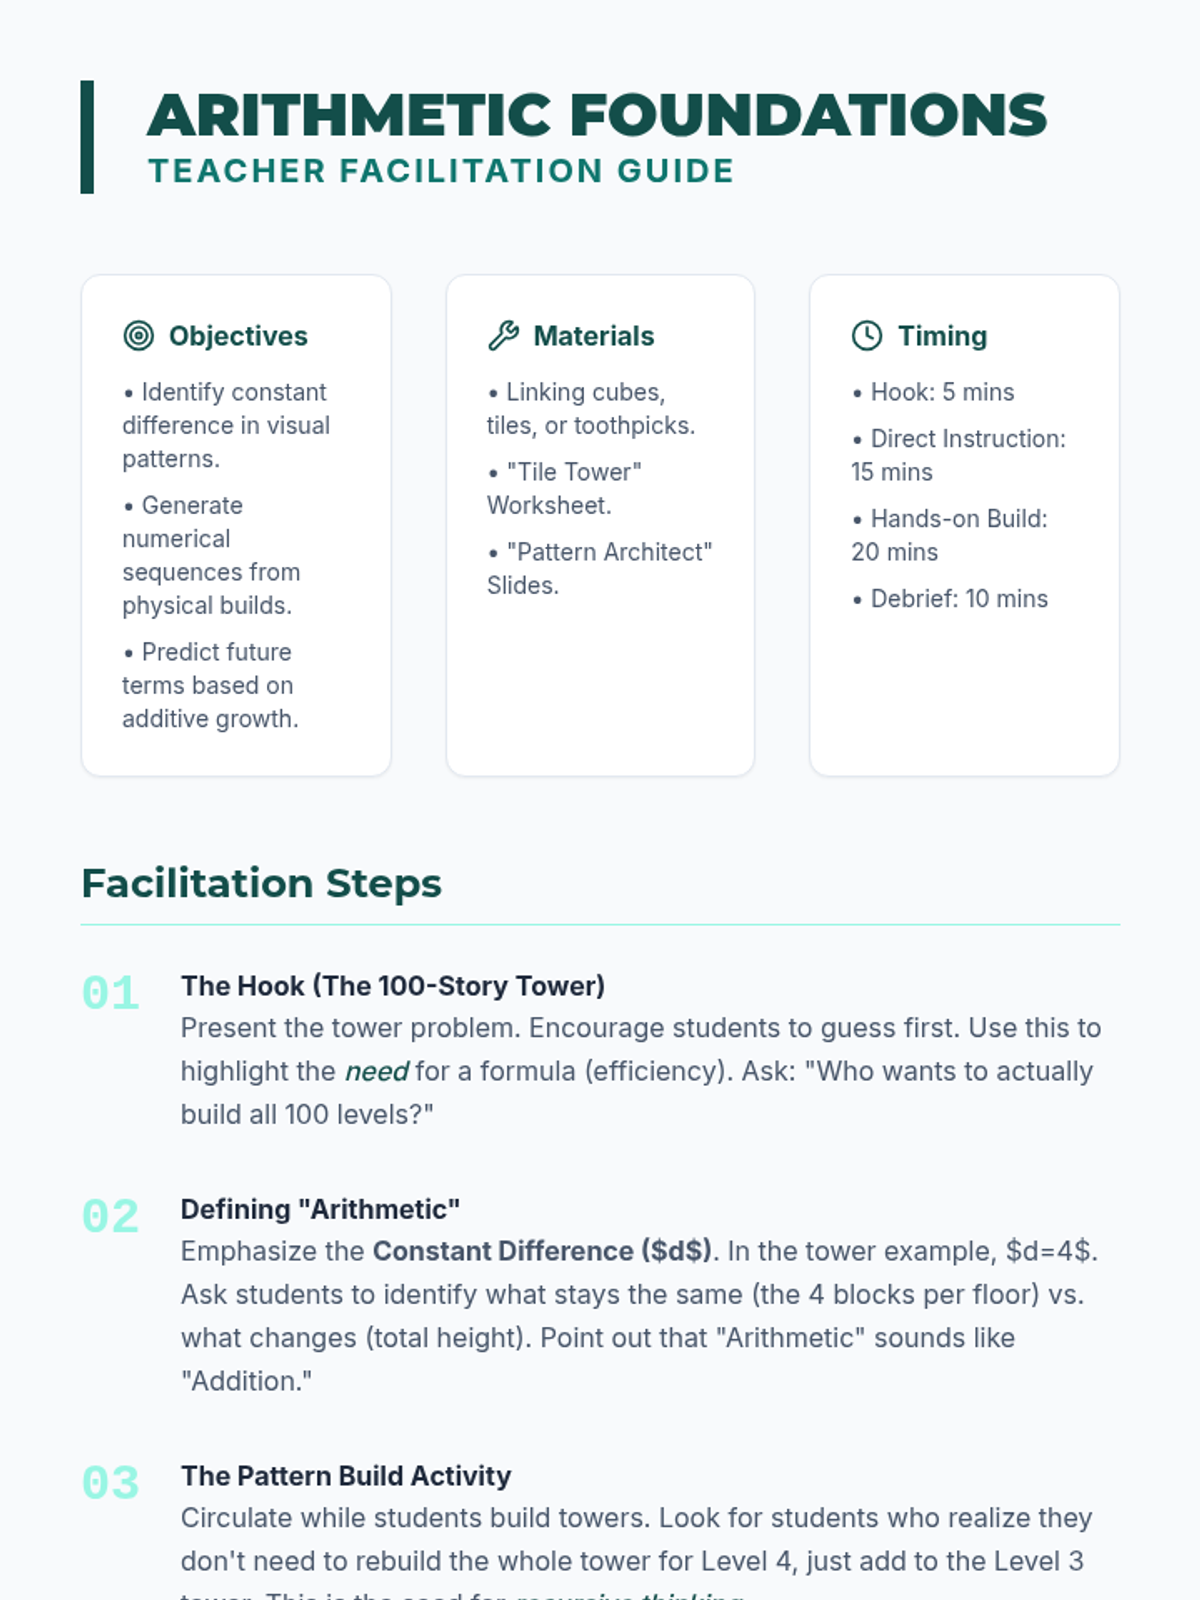
A comprehensive lesson for 8th-grade math students to distinguish between arithmetic and geometric sequences through interactive sorting and video-based analysis.
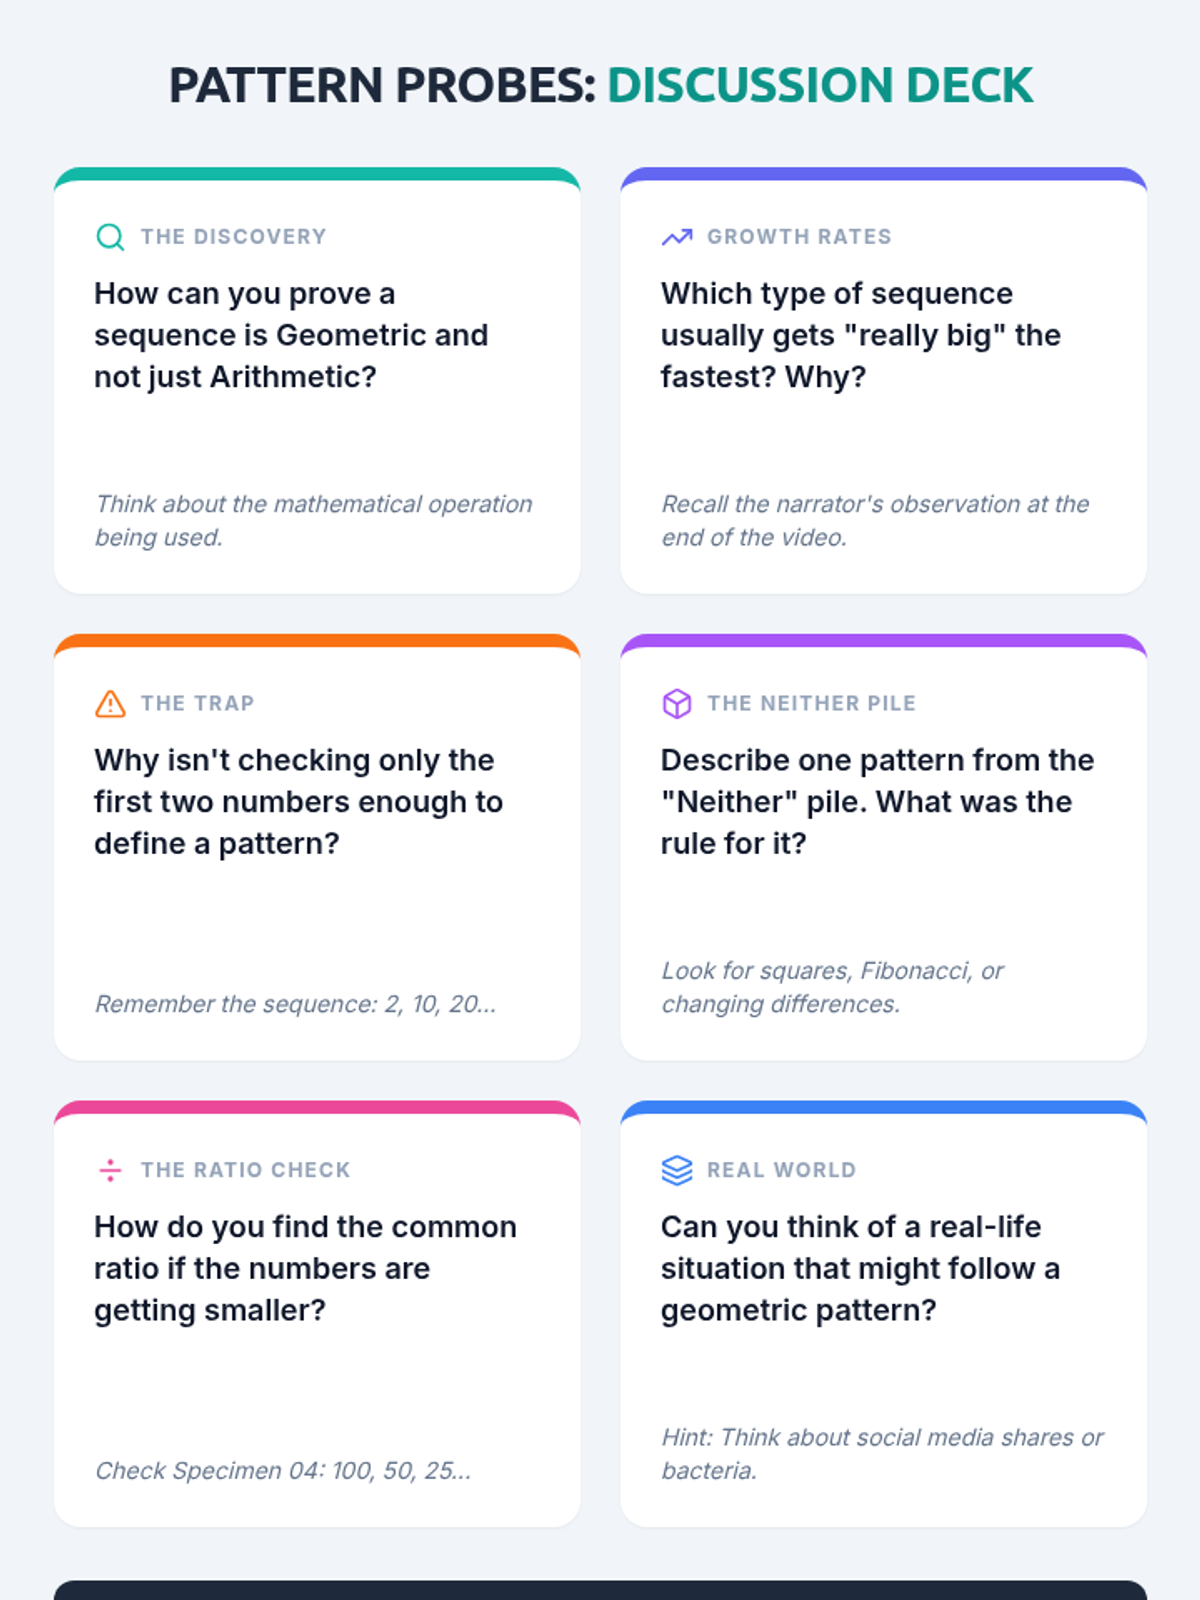
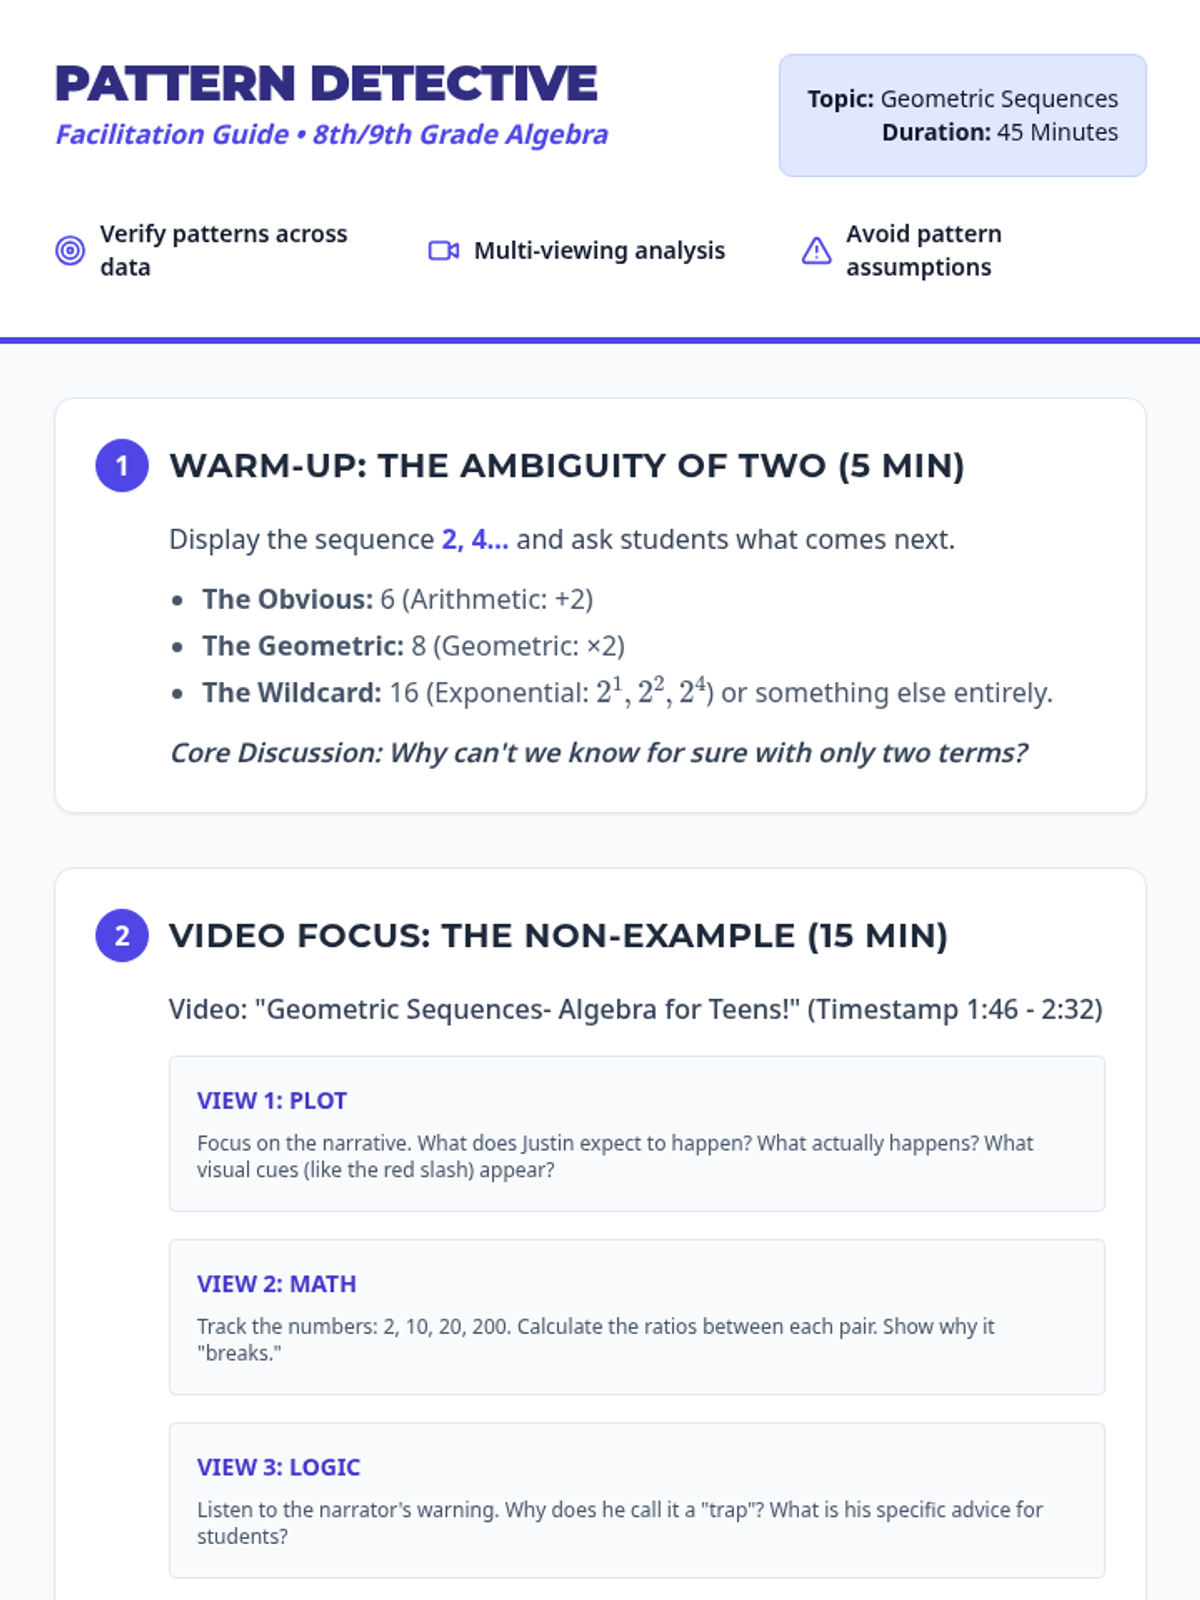
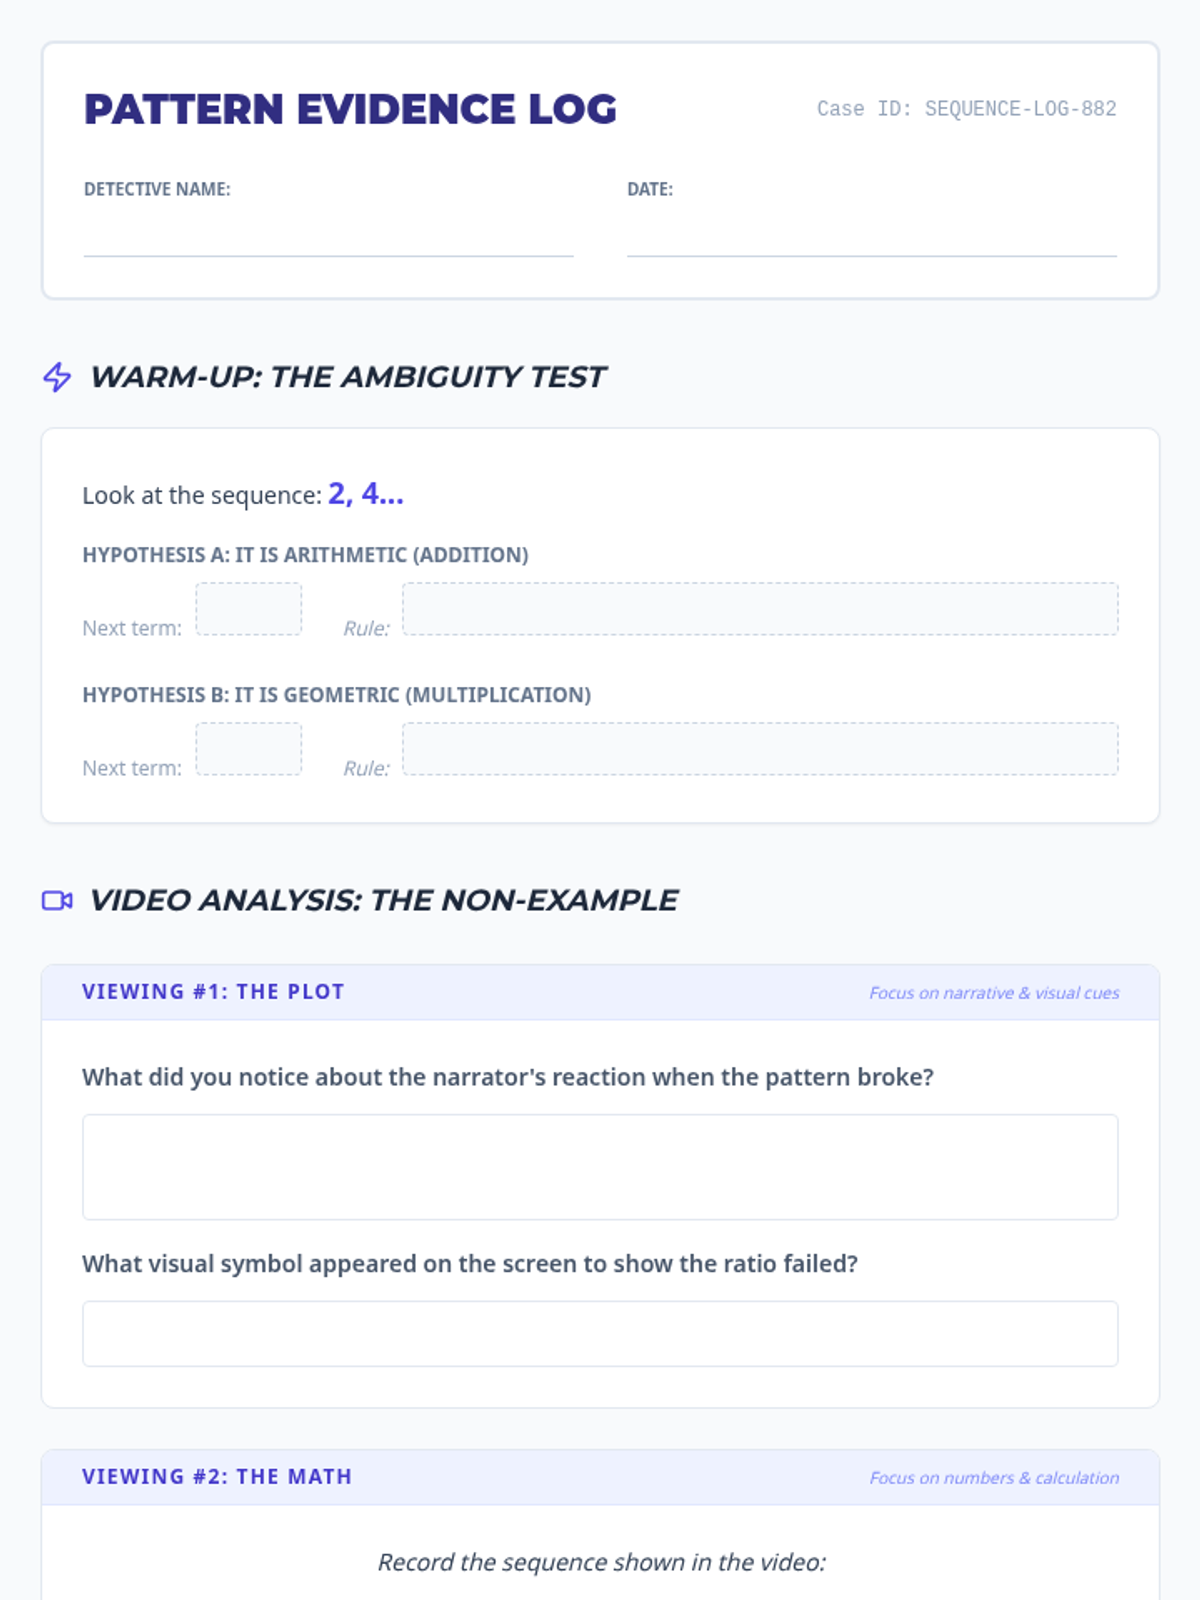
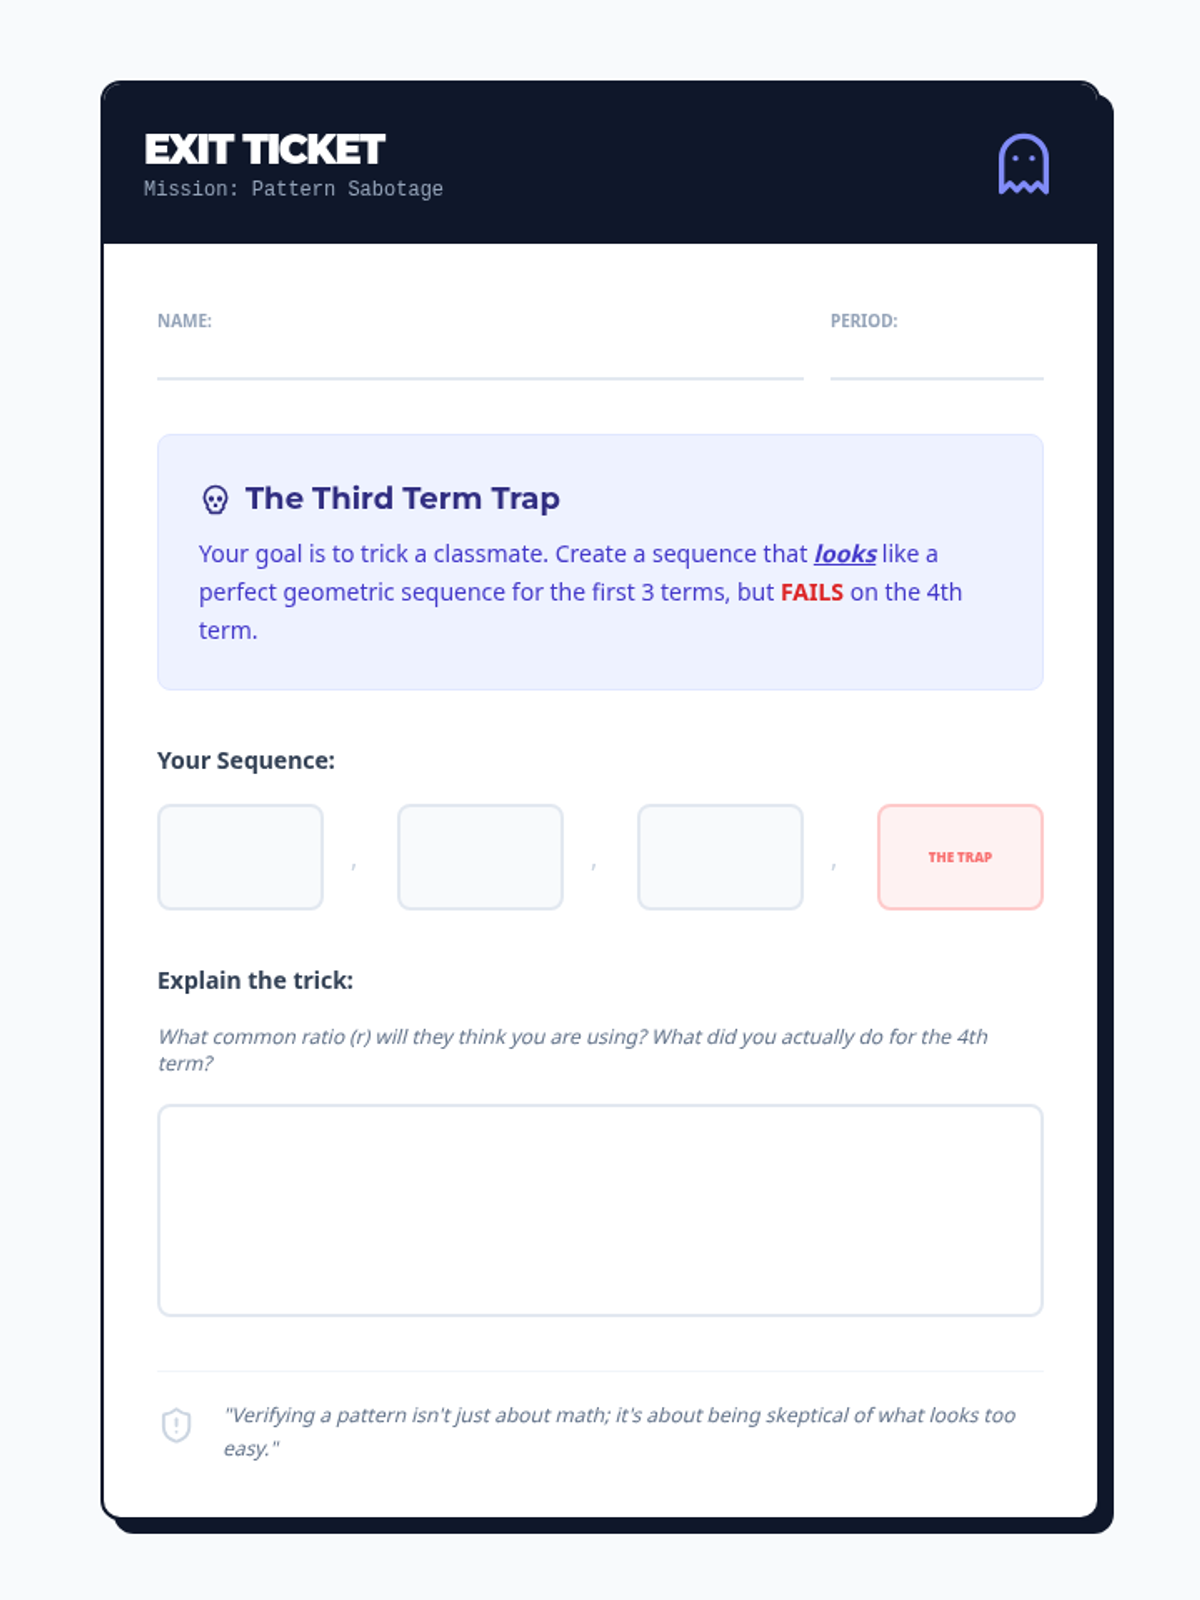
A lesson sequence focused on the critical thinking skills required to verify mathematical patterns, using geometric sequences as the primary vehicle for exploration. Students learn that initial data points can be deceptive and that rigorous verification is essential for mathematical proof and real-world predictions.
This sequence introduces students to arithmetic and geometric sequences, moving from visual patterns to formal algebraic formulas. Students explore the connections between sequences and linear or exponential functions, analyze complex non-standard patterns, and apply their knowledge in a culminating mastery assessment.
This sequence explores arithmetic and geometric sequences through inquiry, algebraic modeling, and real-world applications. Students transition from pattern recognition to formalizing recursive and explicit formulas to predict outcomes in linear and exponential systems.
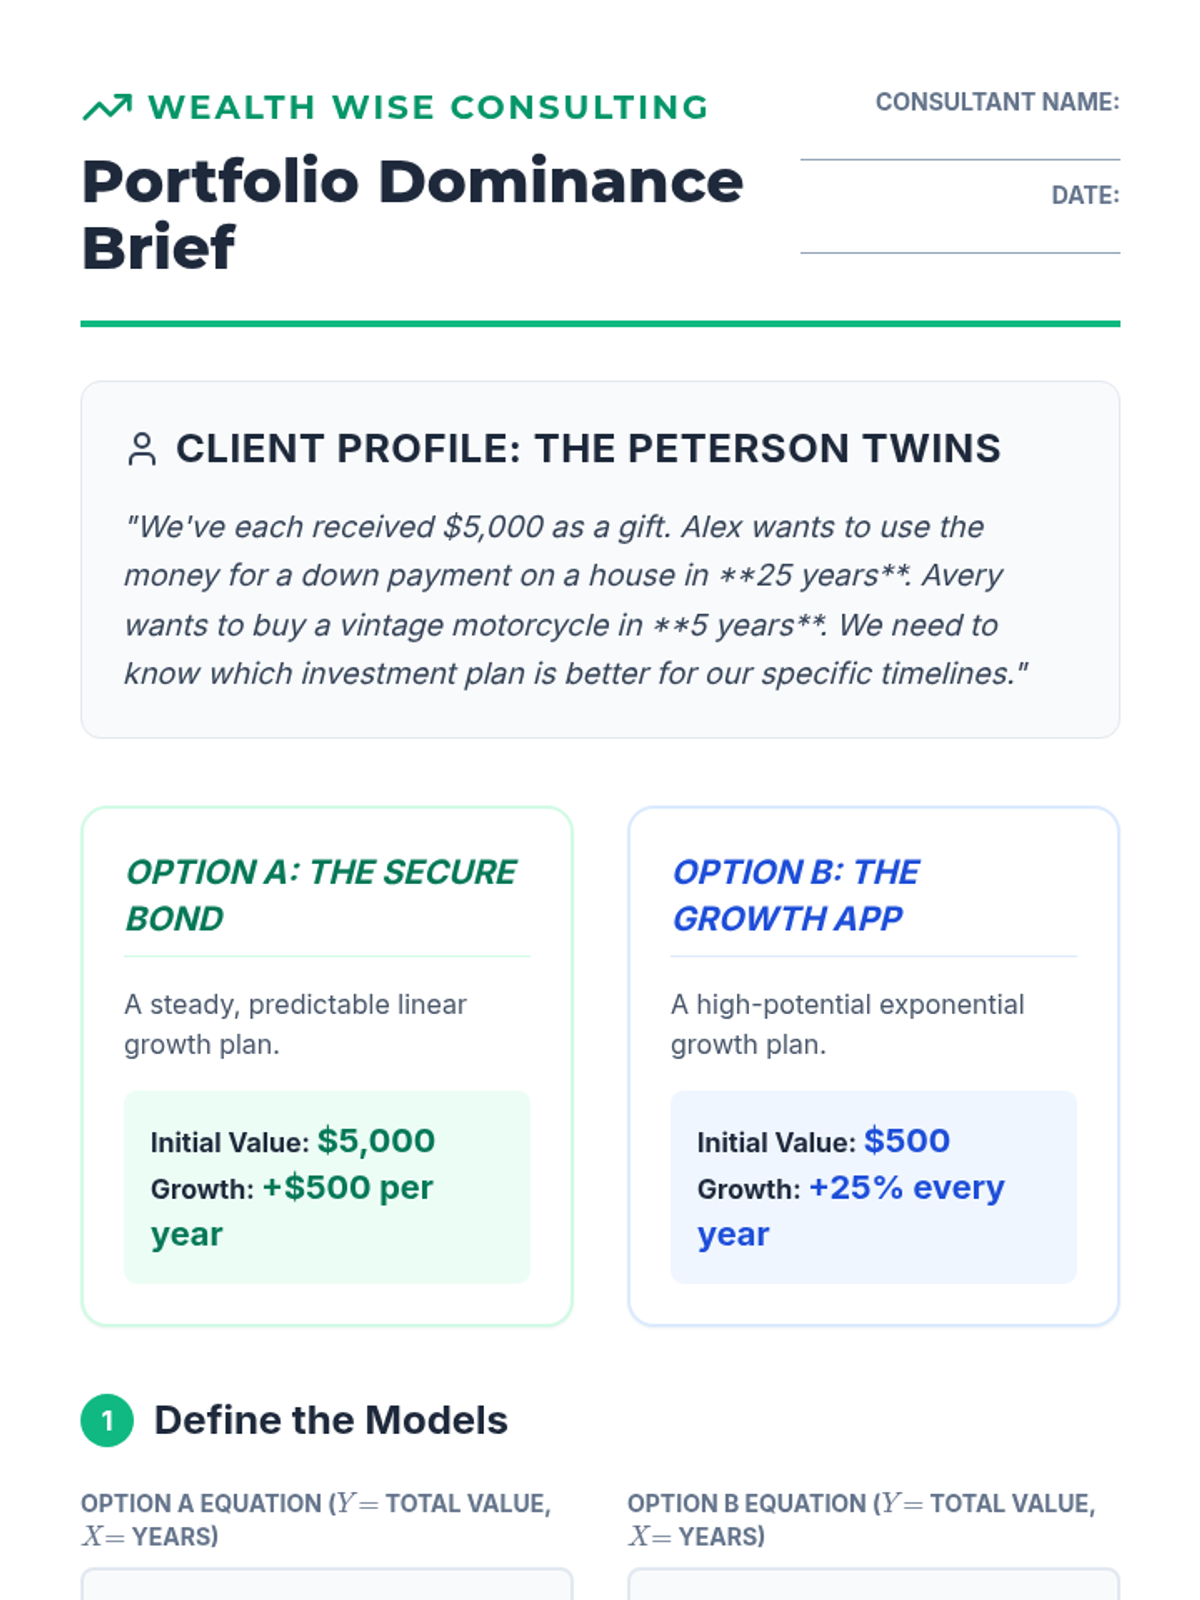
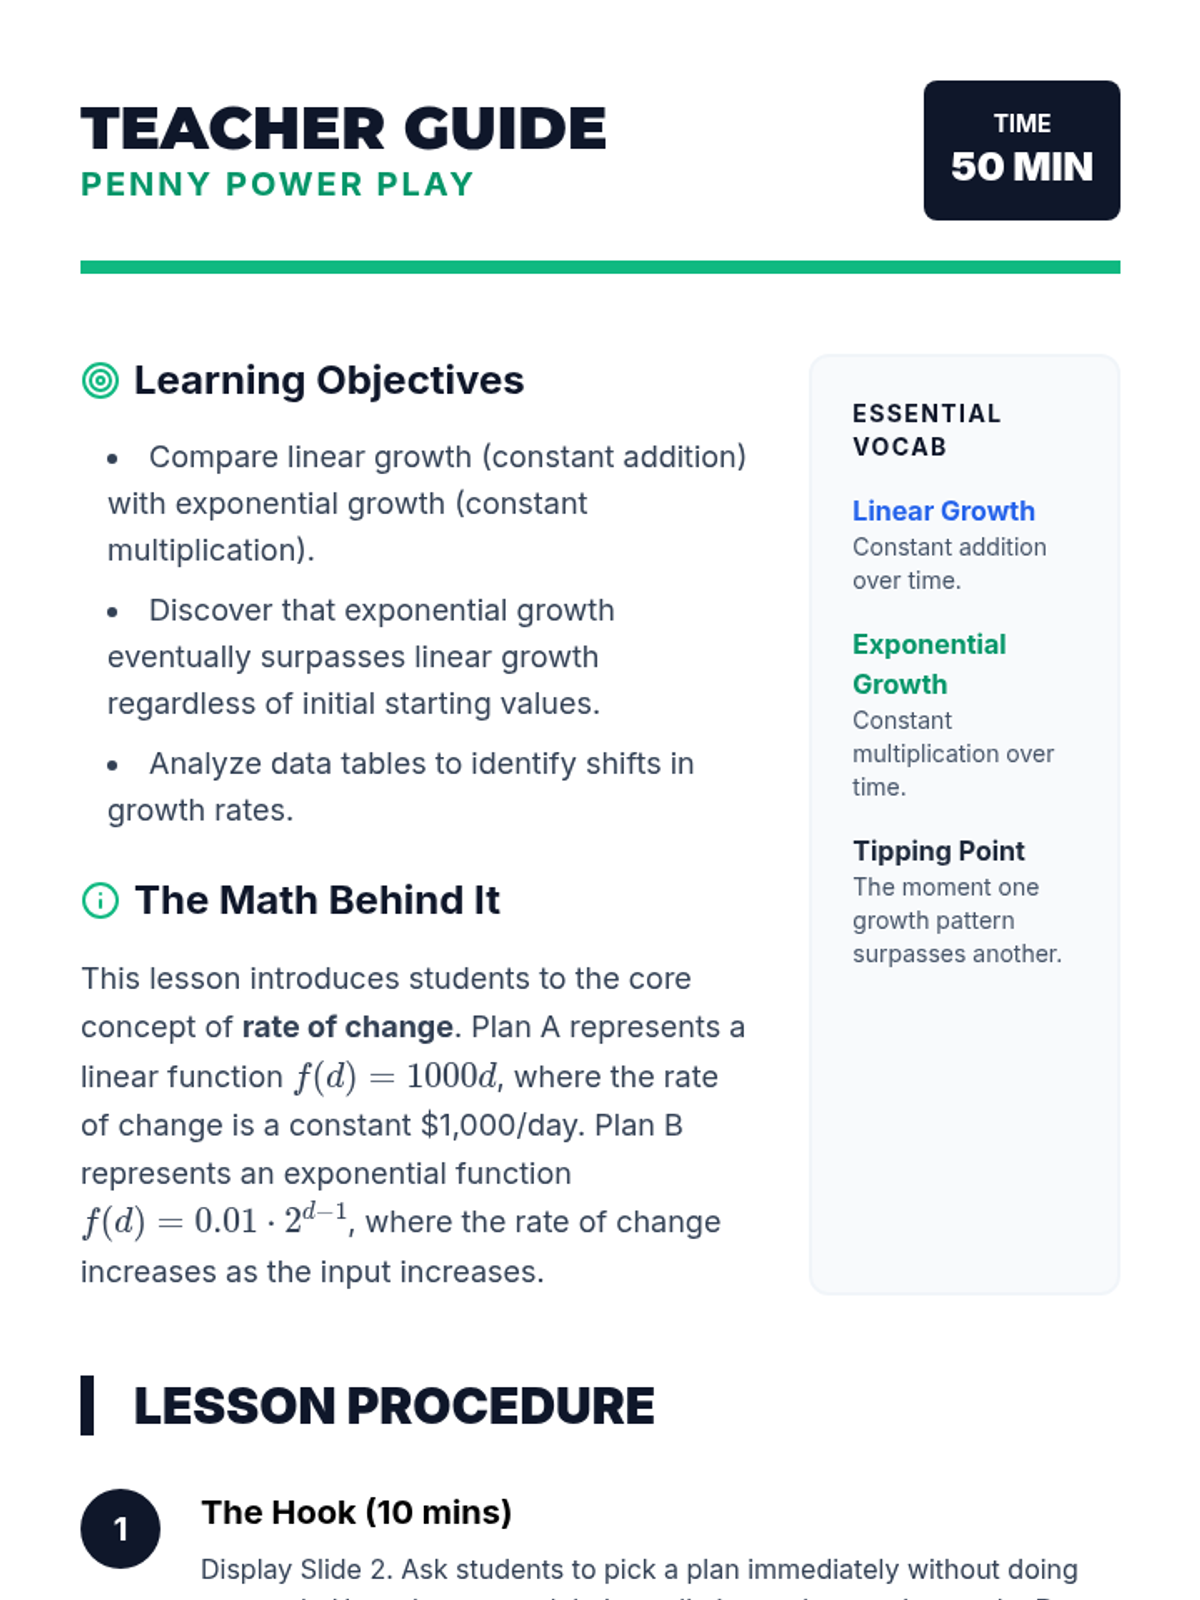
This financial literacy-themed sequence teaches 8th-grade students to compare linear and exponential growth rates. Students act as financial consultants, analyzing investment, debt, and depreciation scenarios to understand function dominance and long-term behavior.
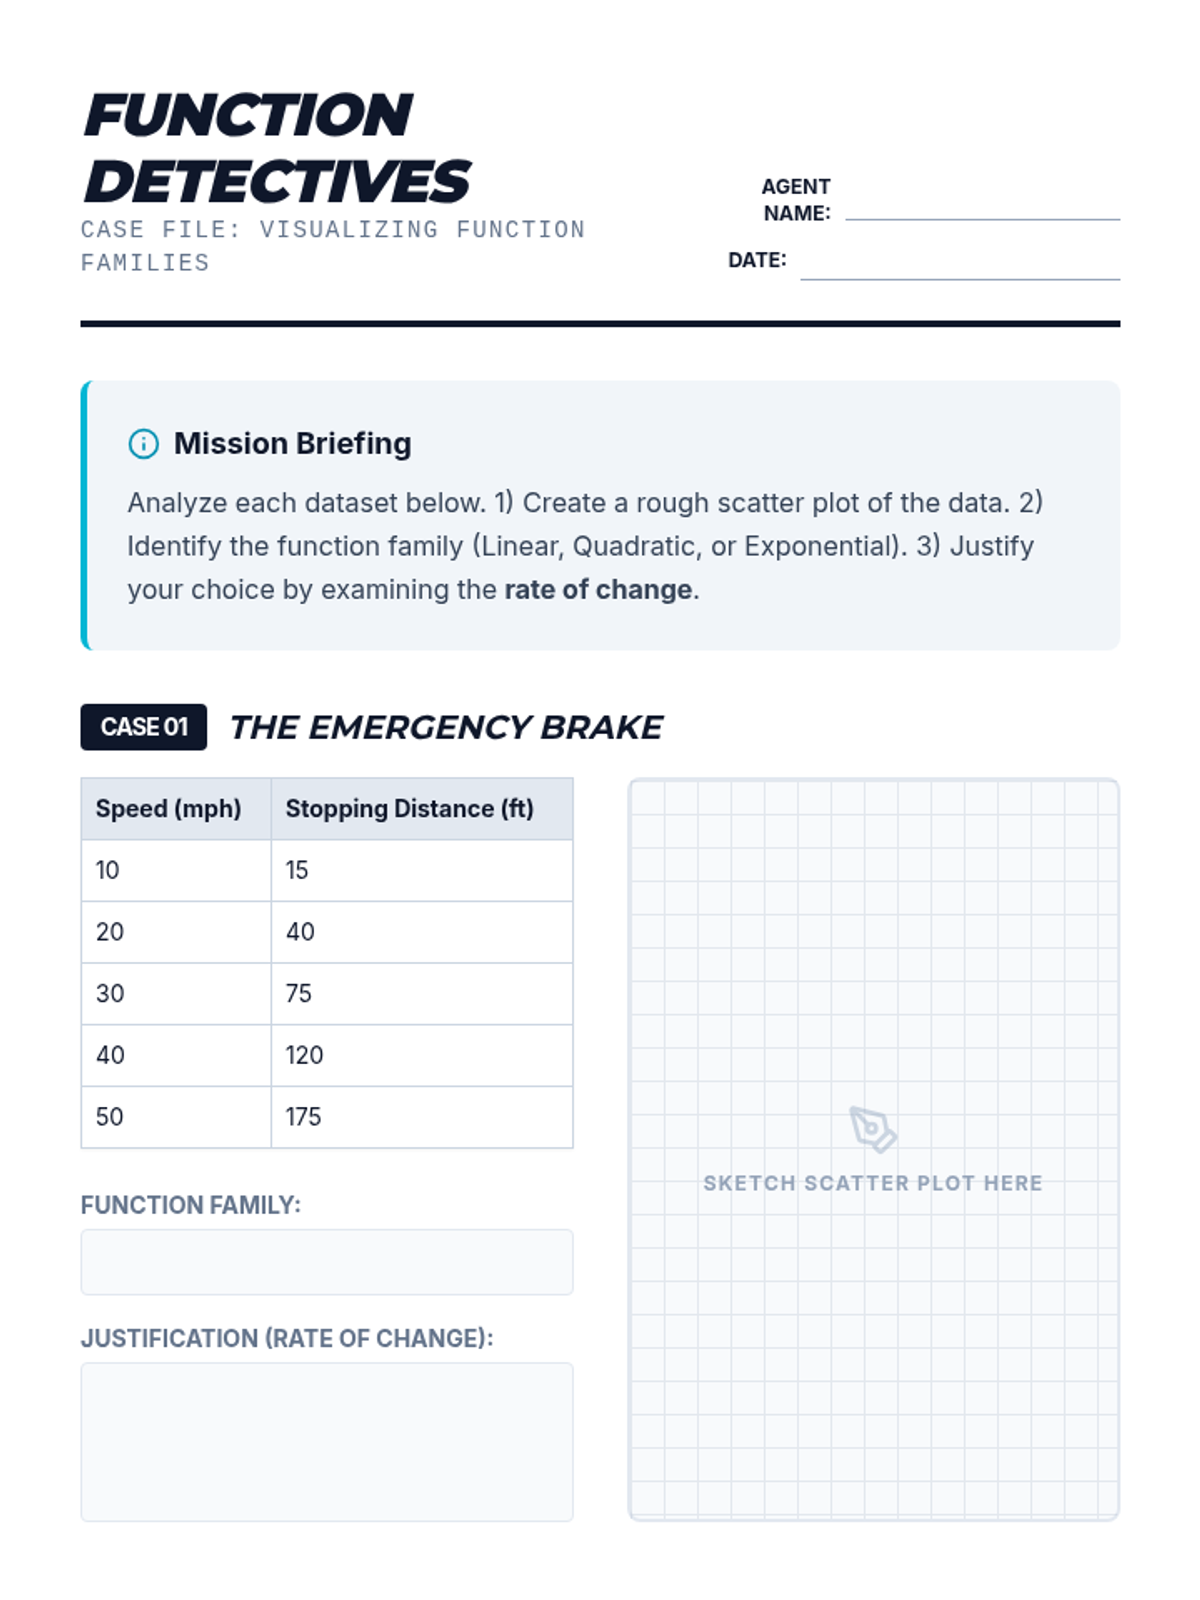
An inquiry-based exploration of growth rates, comparing linear, quadratic, and exponential patterns through real-world simulations, table analysis, and graphing. Students discover how constant addition, area growth, and constant multiplication create vastly different outcomes over time.
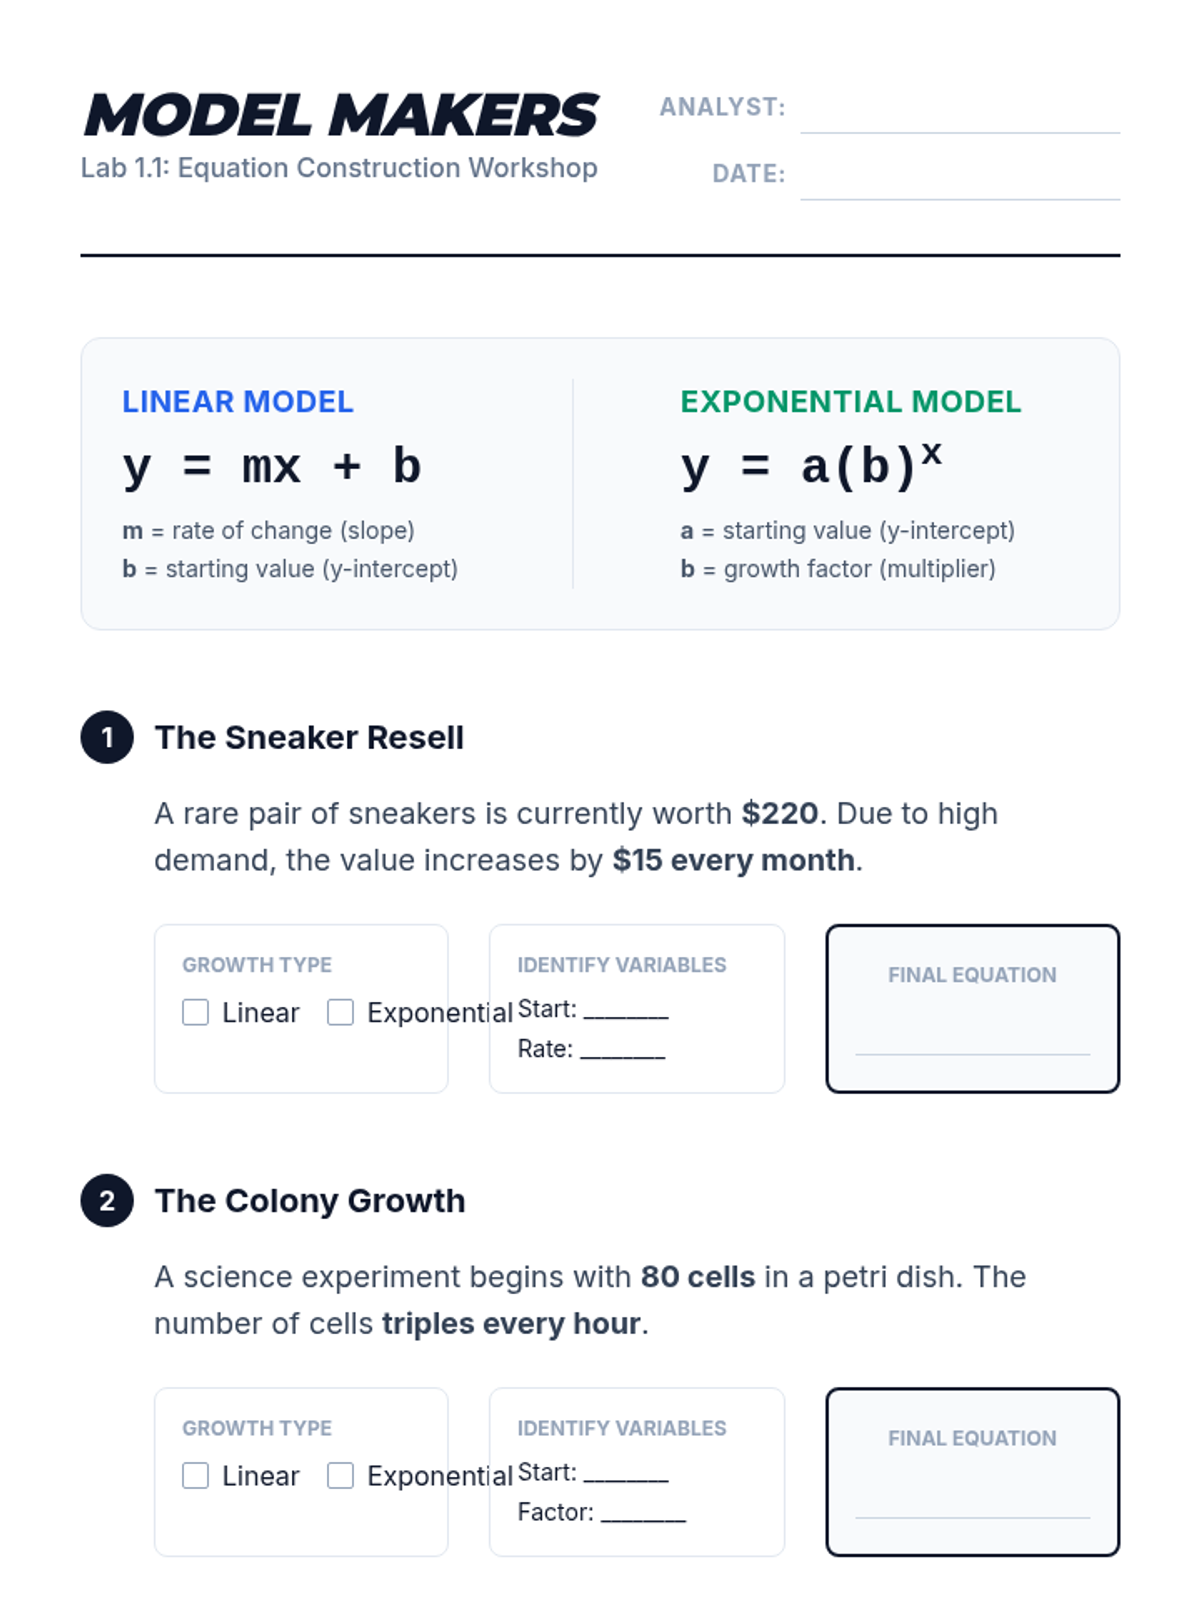
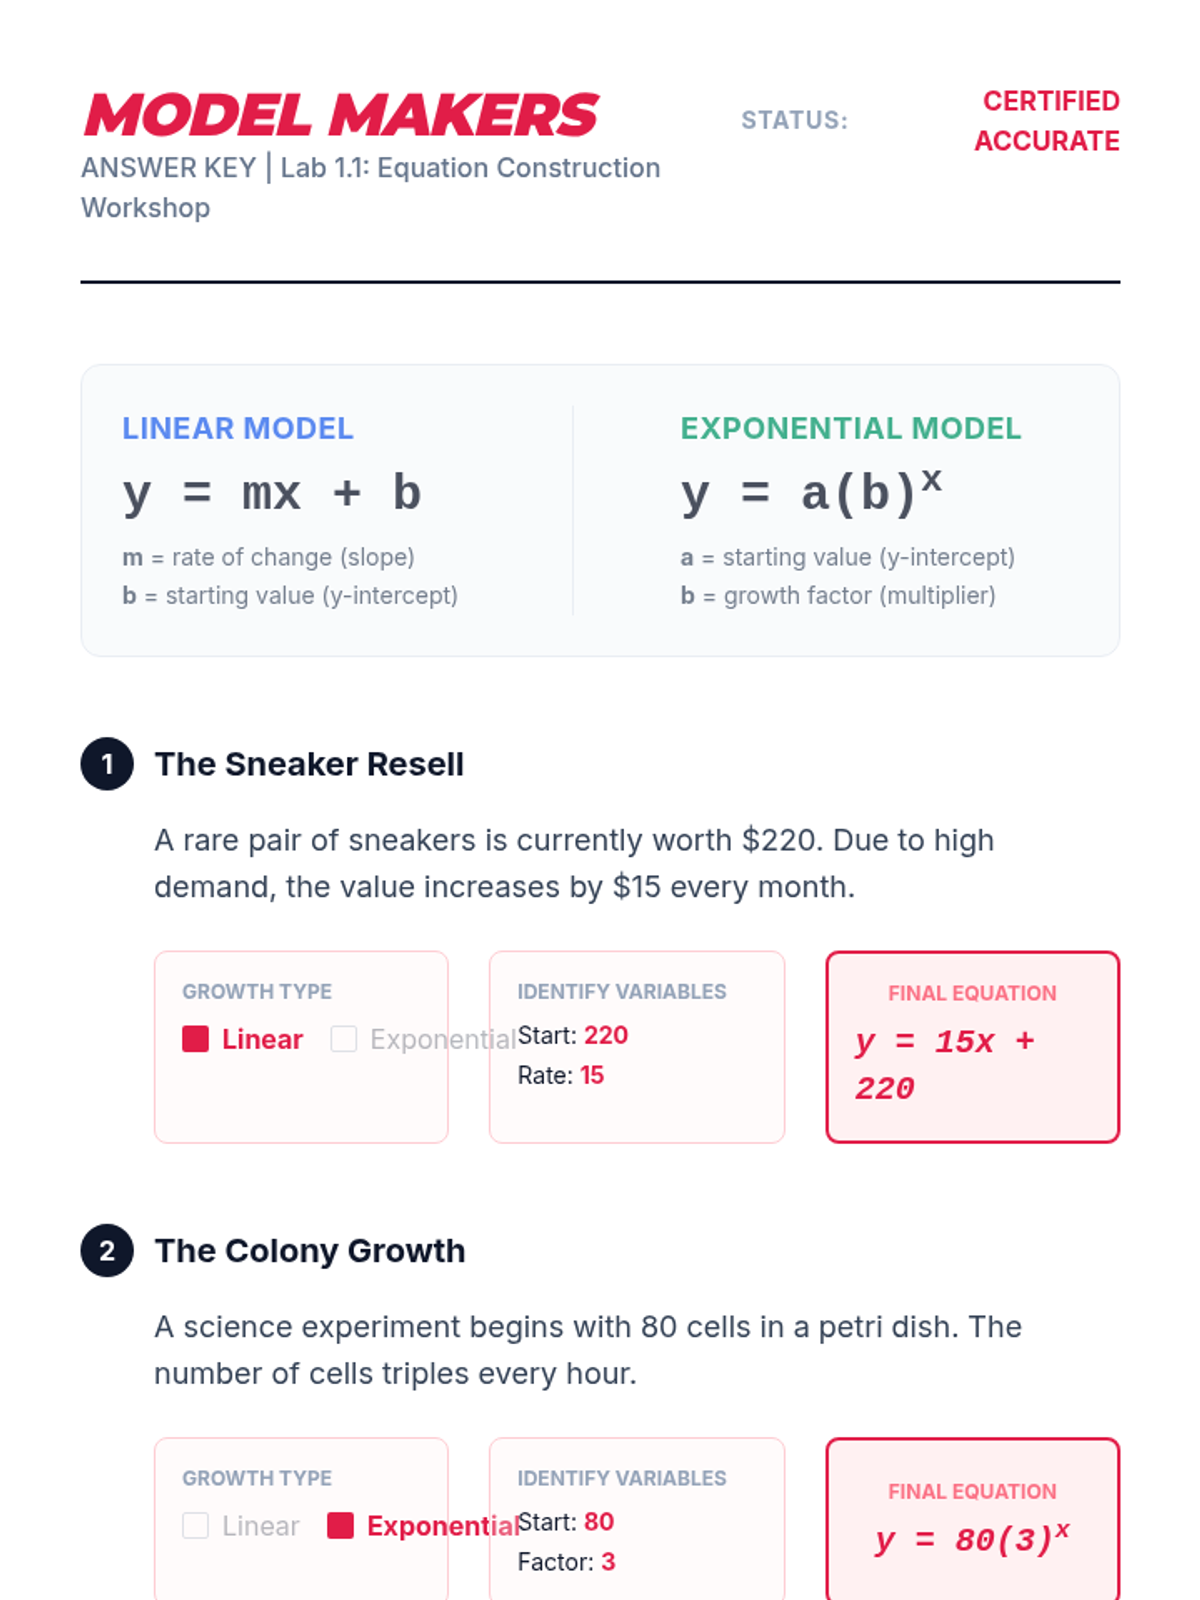
This workshop-style sequence focuses on the technical skills required to construct and compare function representations explicitly. Students move from conceptual understanding to algebraic rigor, learning to write equations for different growth models and comparing their rates of change directly.
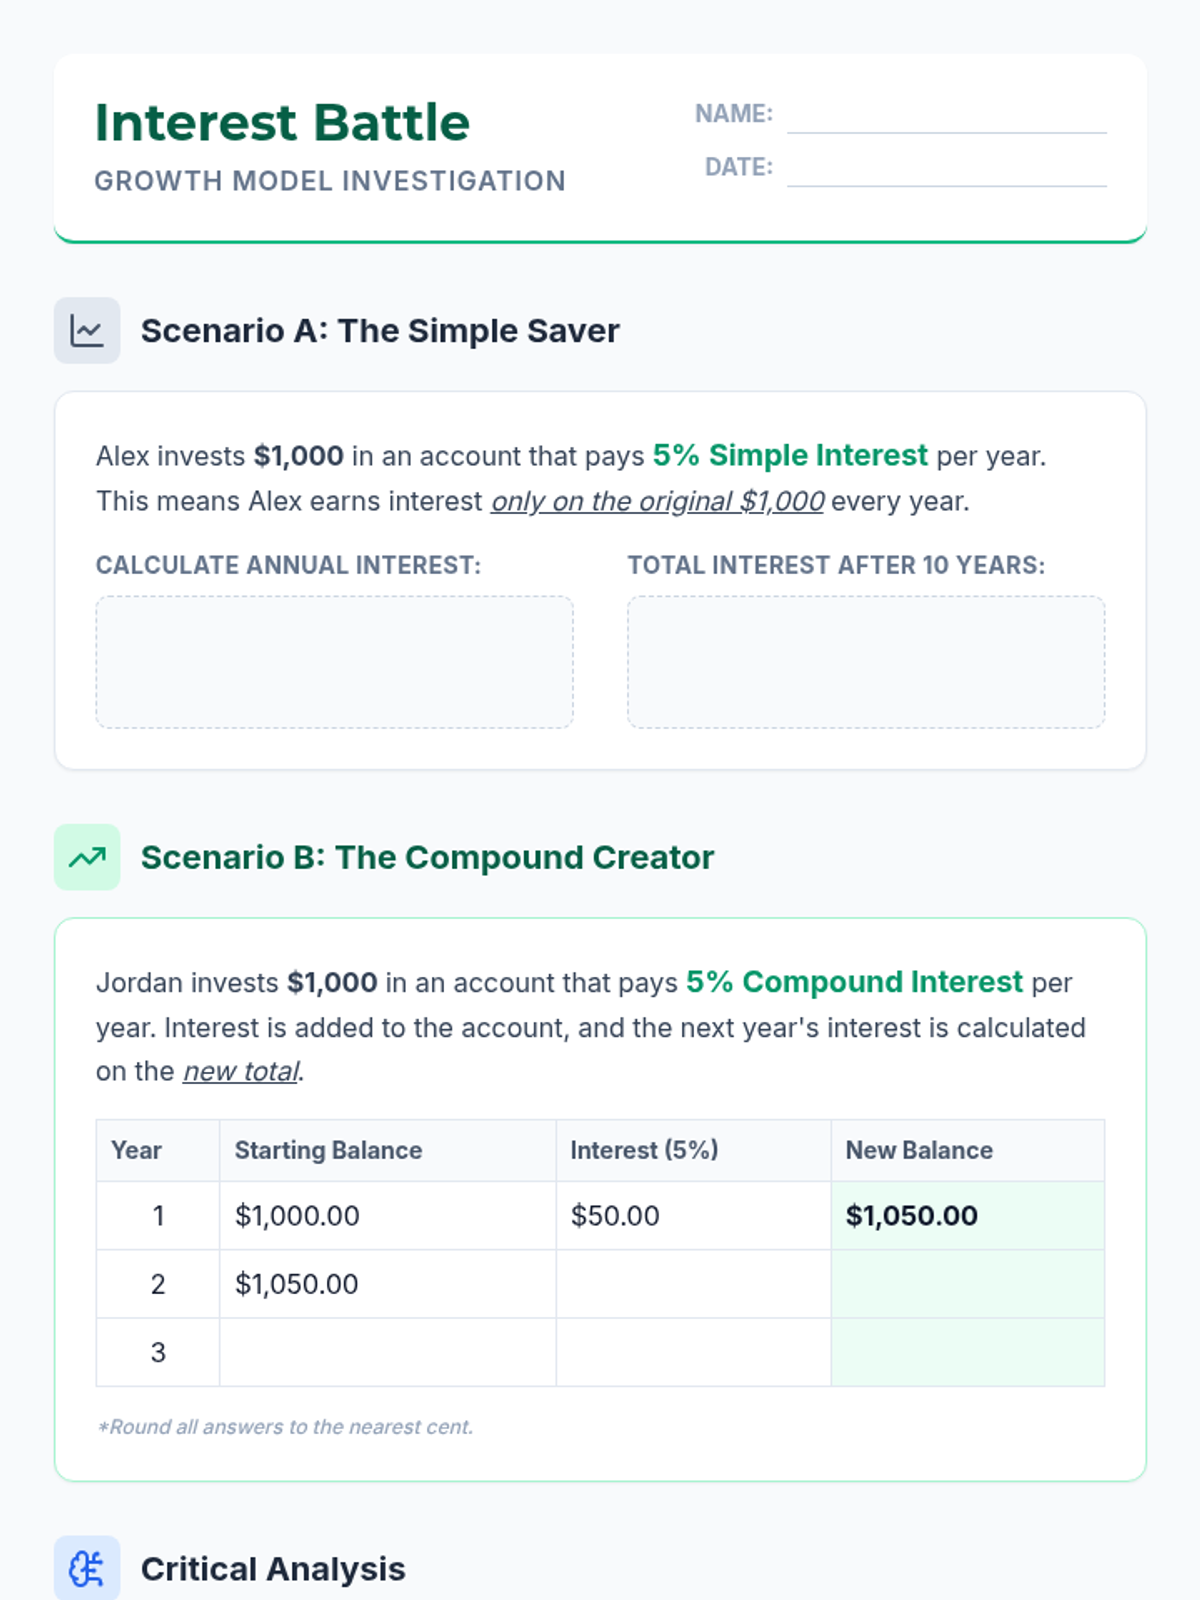
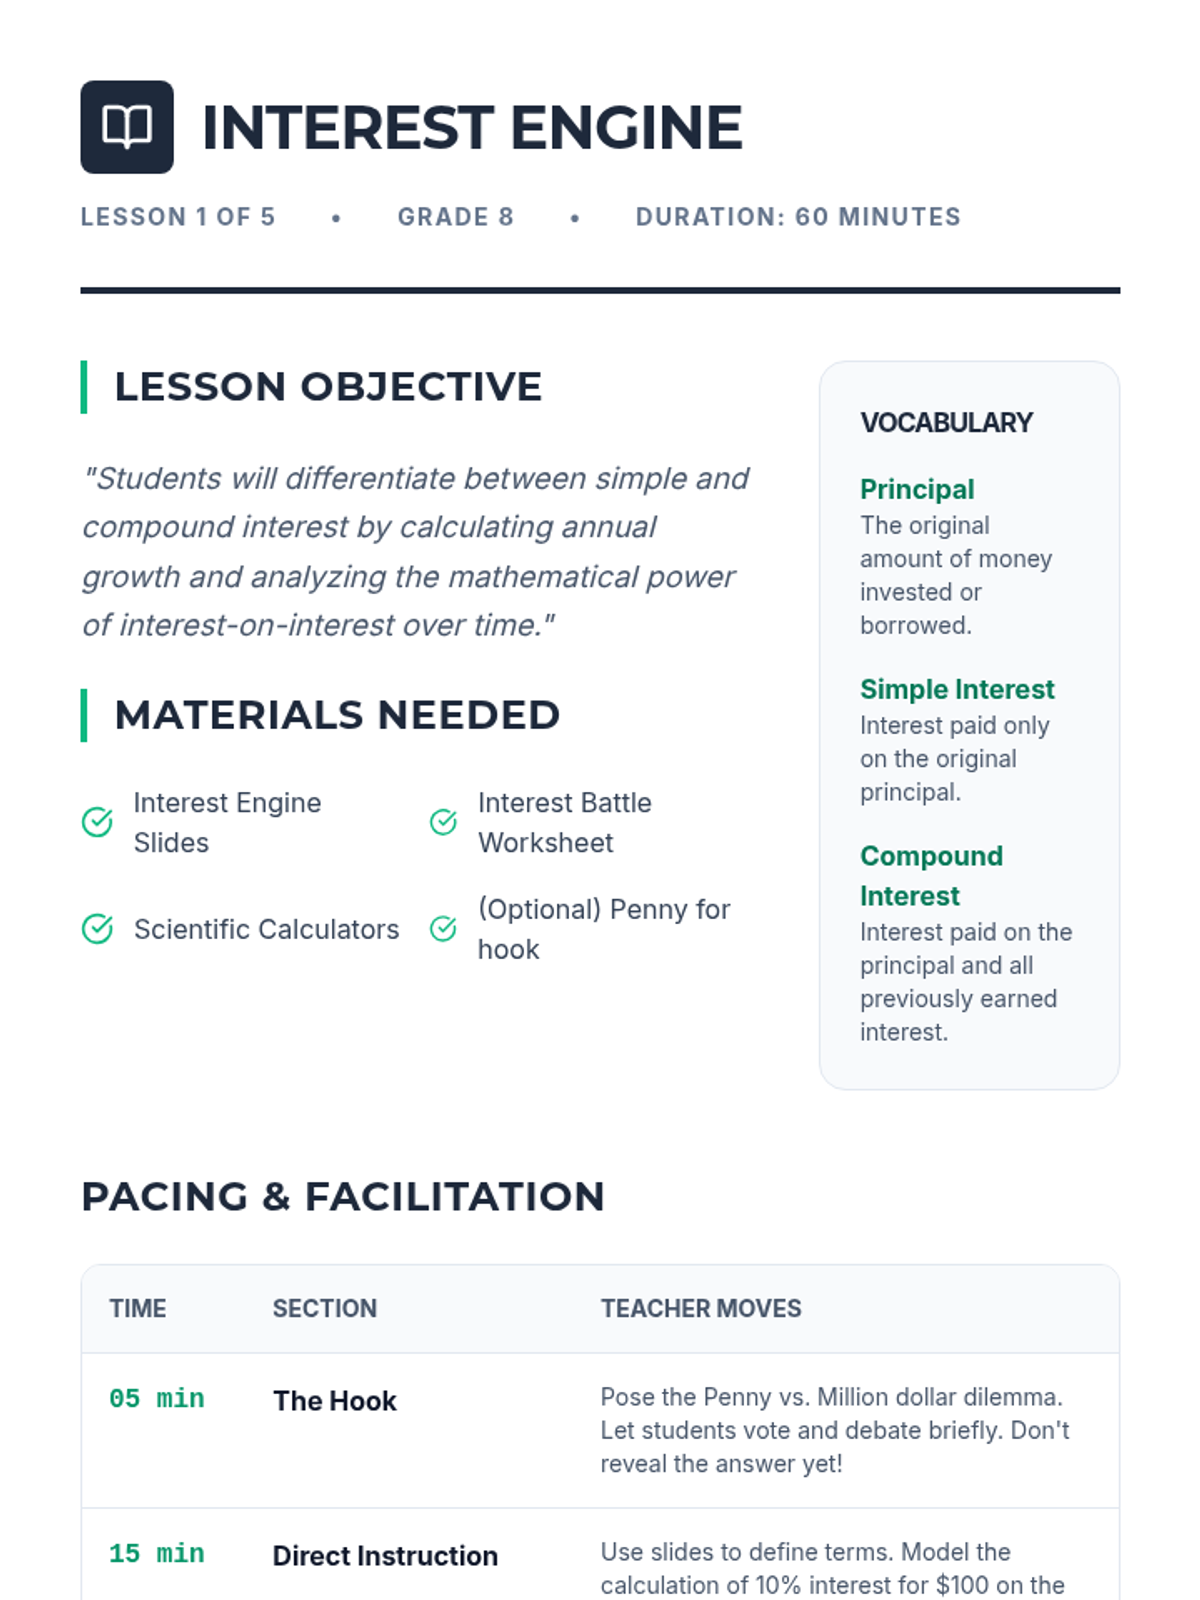
Students explore linear and exponential growth through personal finance, comparing simple and compound interest to make informed decisions about saving and debt.
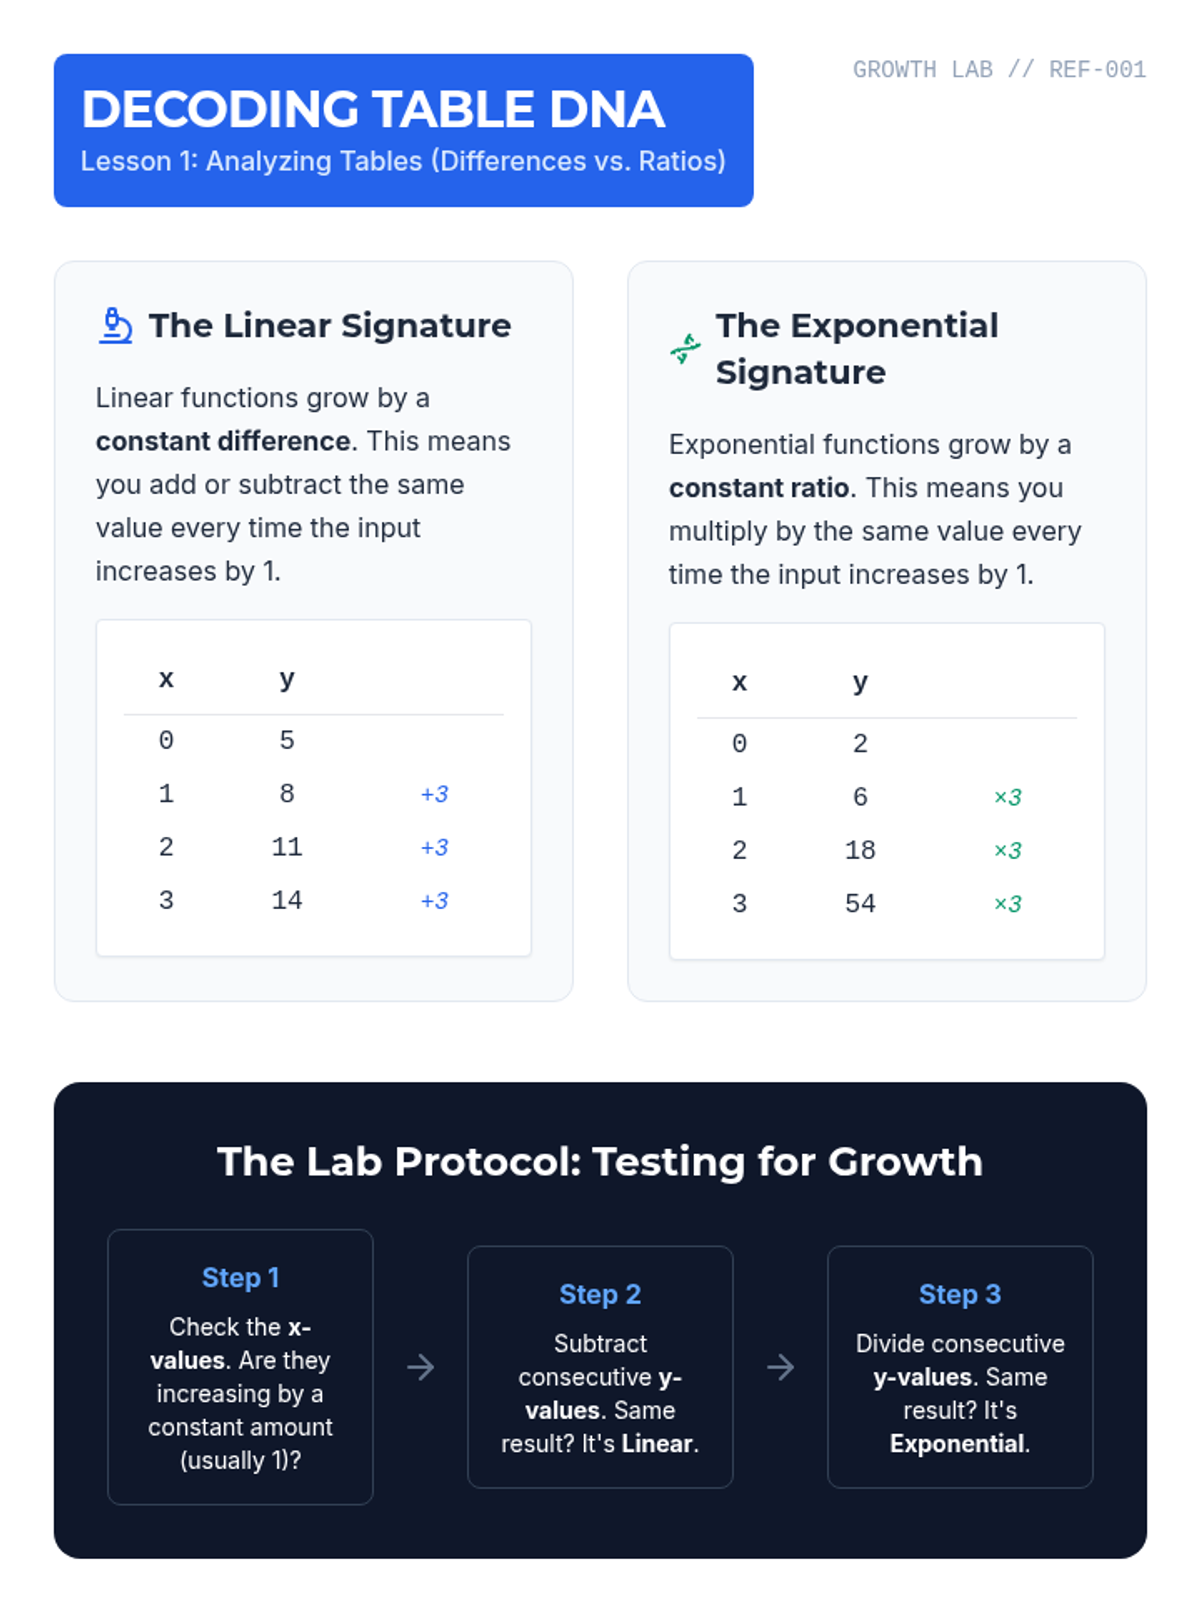
This skill-building sequence focuses on the technical analysis of data representations. Students learn specific methods for testing tables and graphs to determine function types, transitioning from visual inspection to algebraic verification. The sequence emphasizes the ability to write basic equations ($y=mx+b$ vs $y=ab^x$) based on identified patterns. By the conclusion, students will demonstrate proficiency in translating between tables, graphs, and function rules for both linear and exponential contexts.
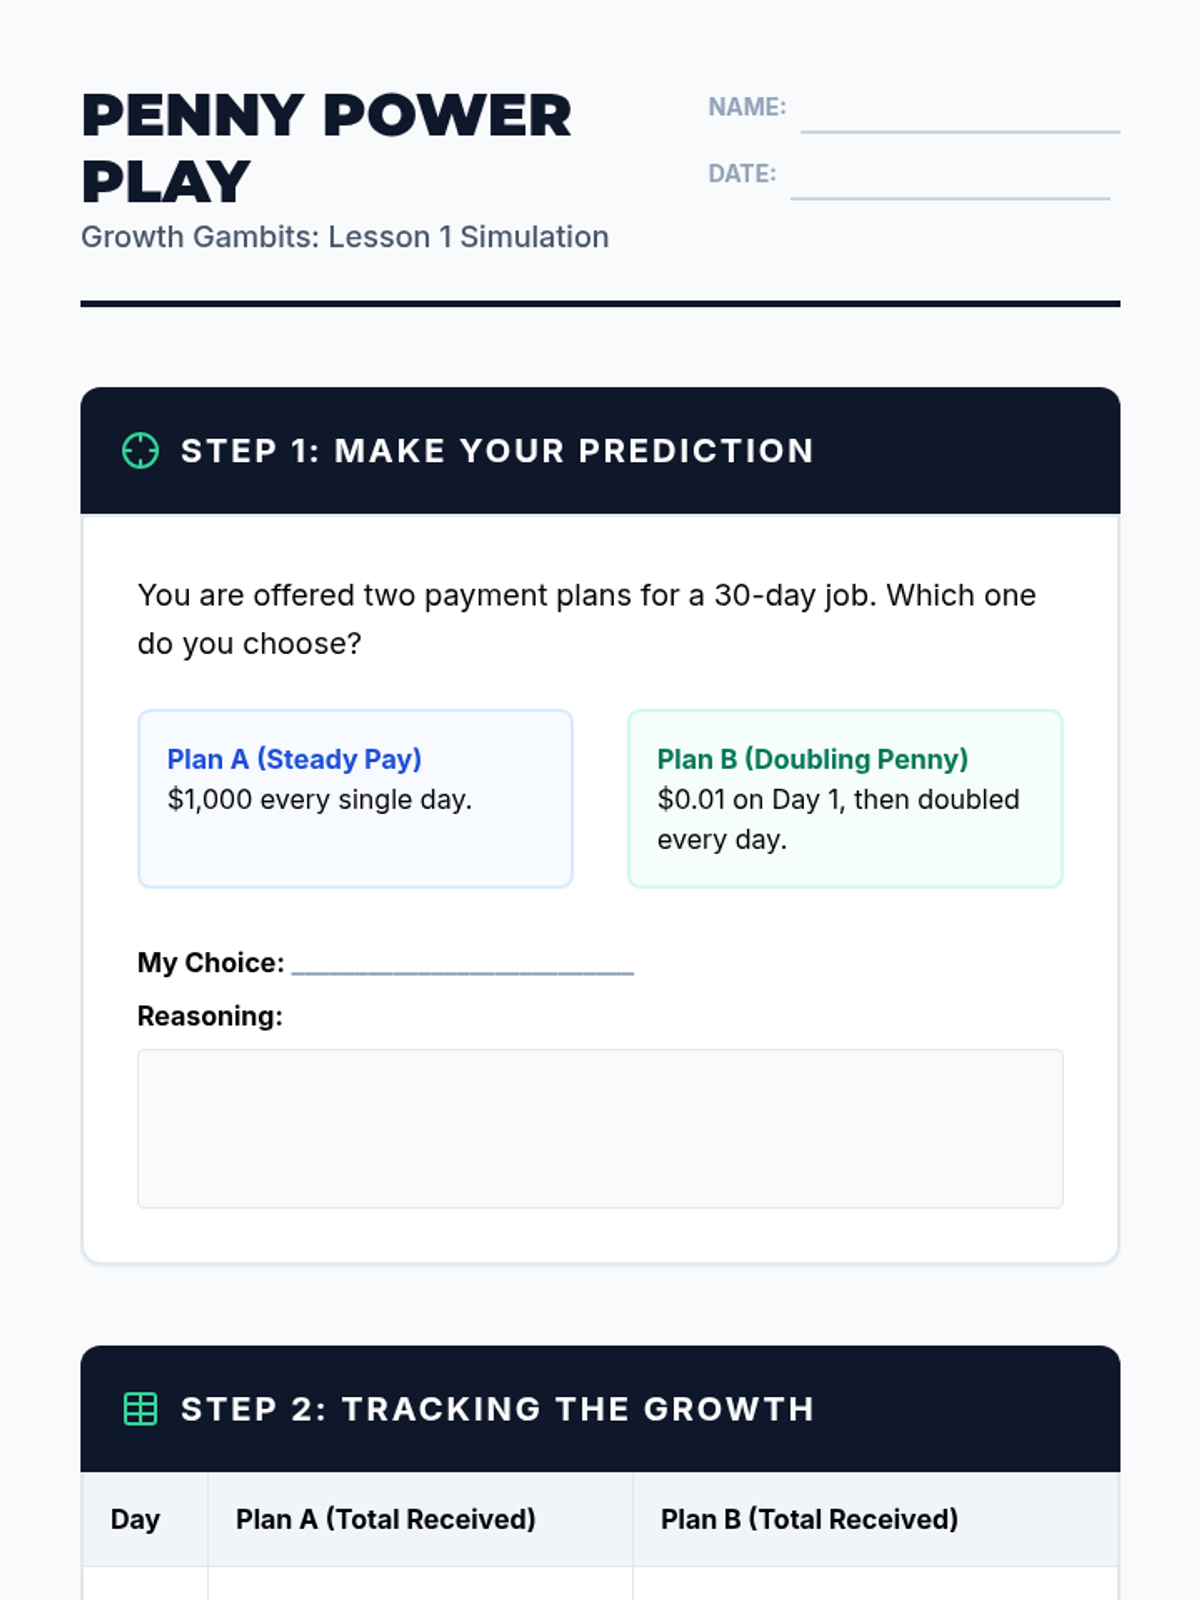
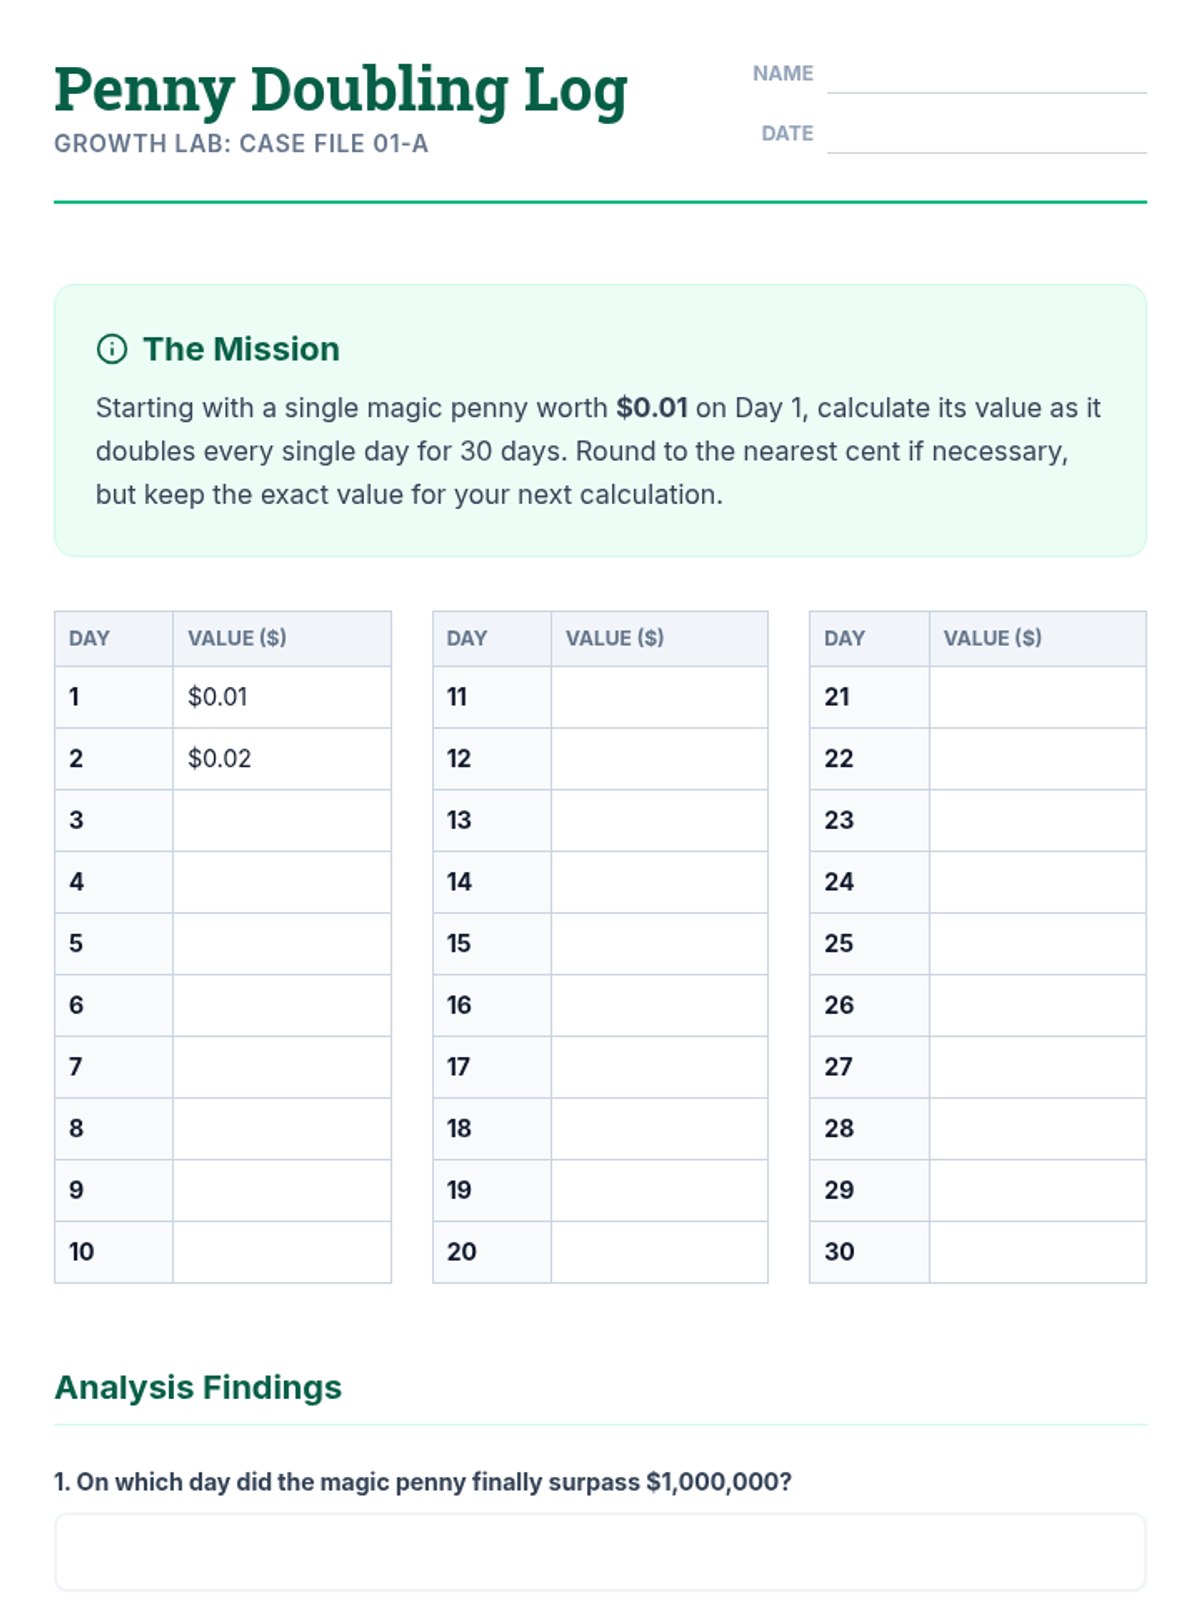
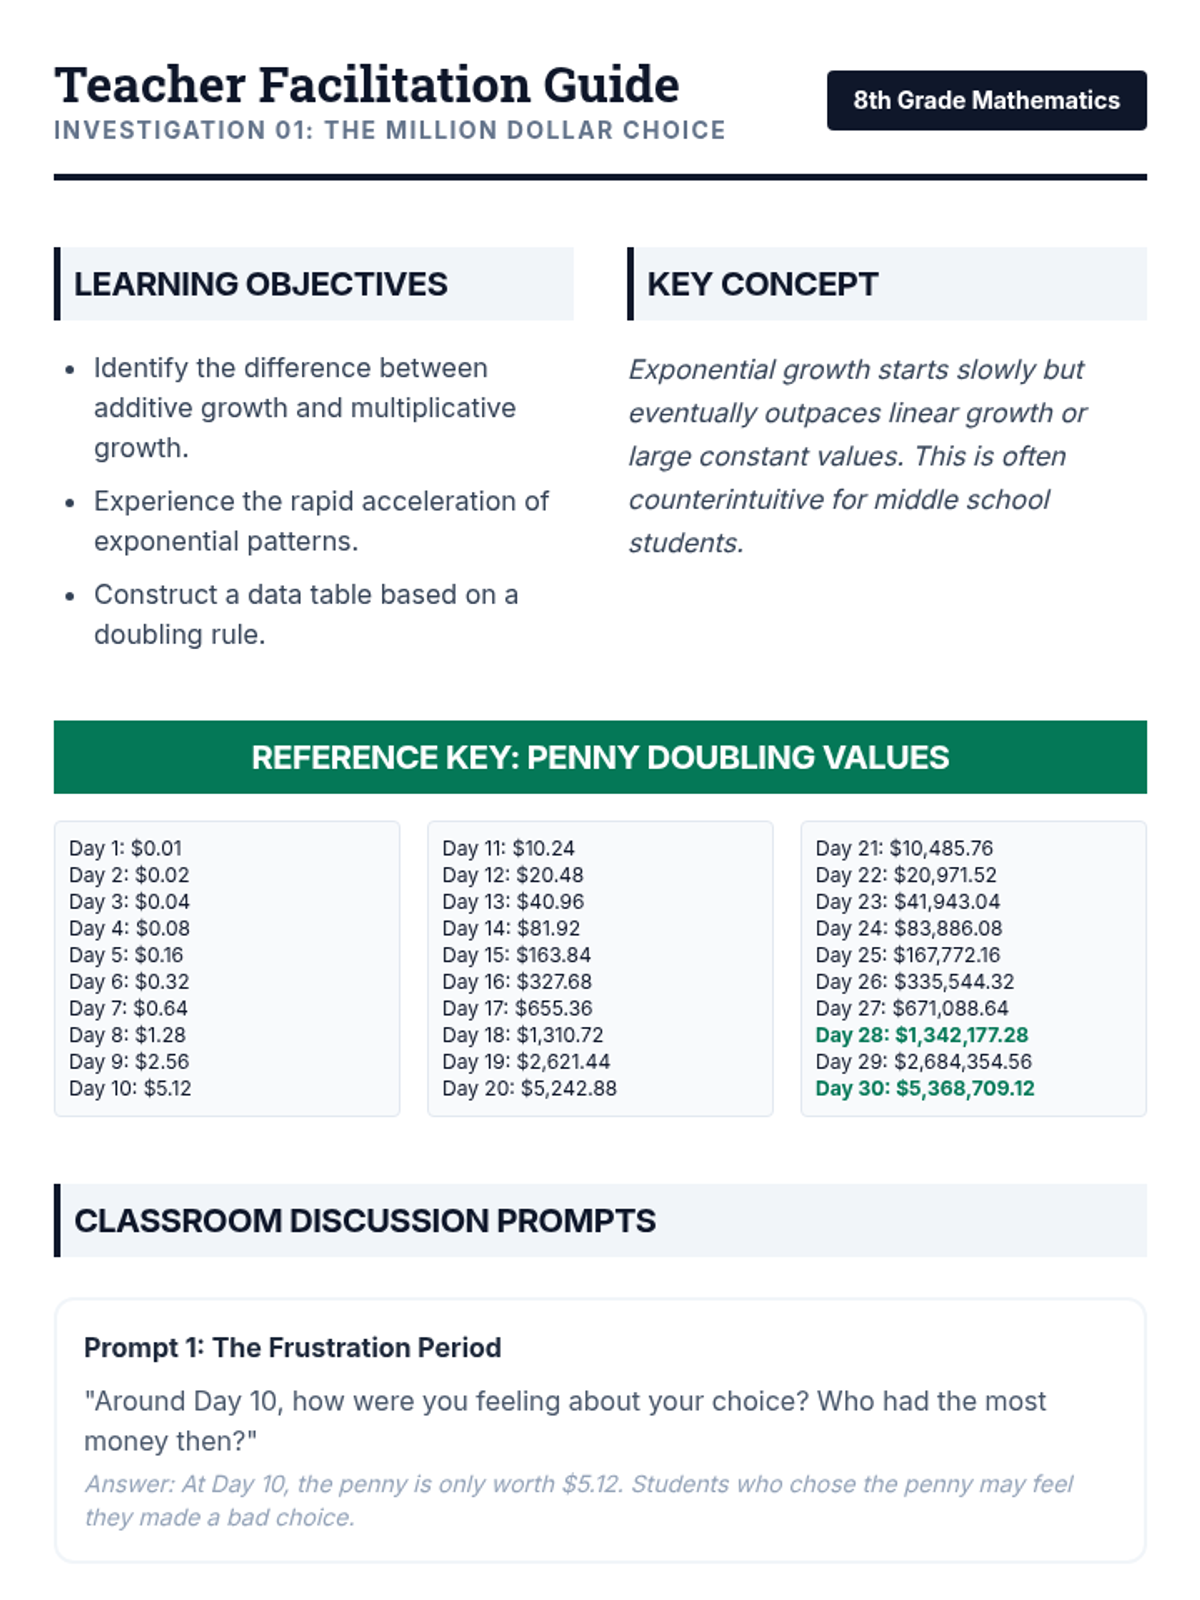
An inquiry-based exploration of additive vs. multiplicative growth, moving from a classic penny-doubling dilemma to formal identification of linear and exponential functions using tables and graphs.
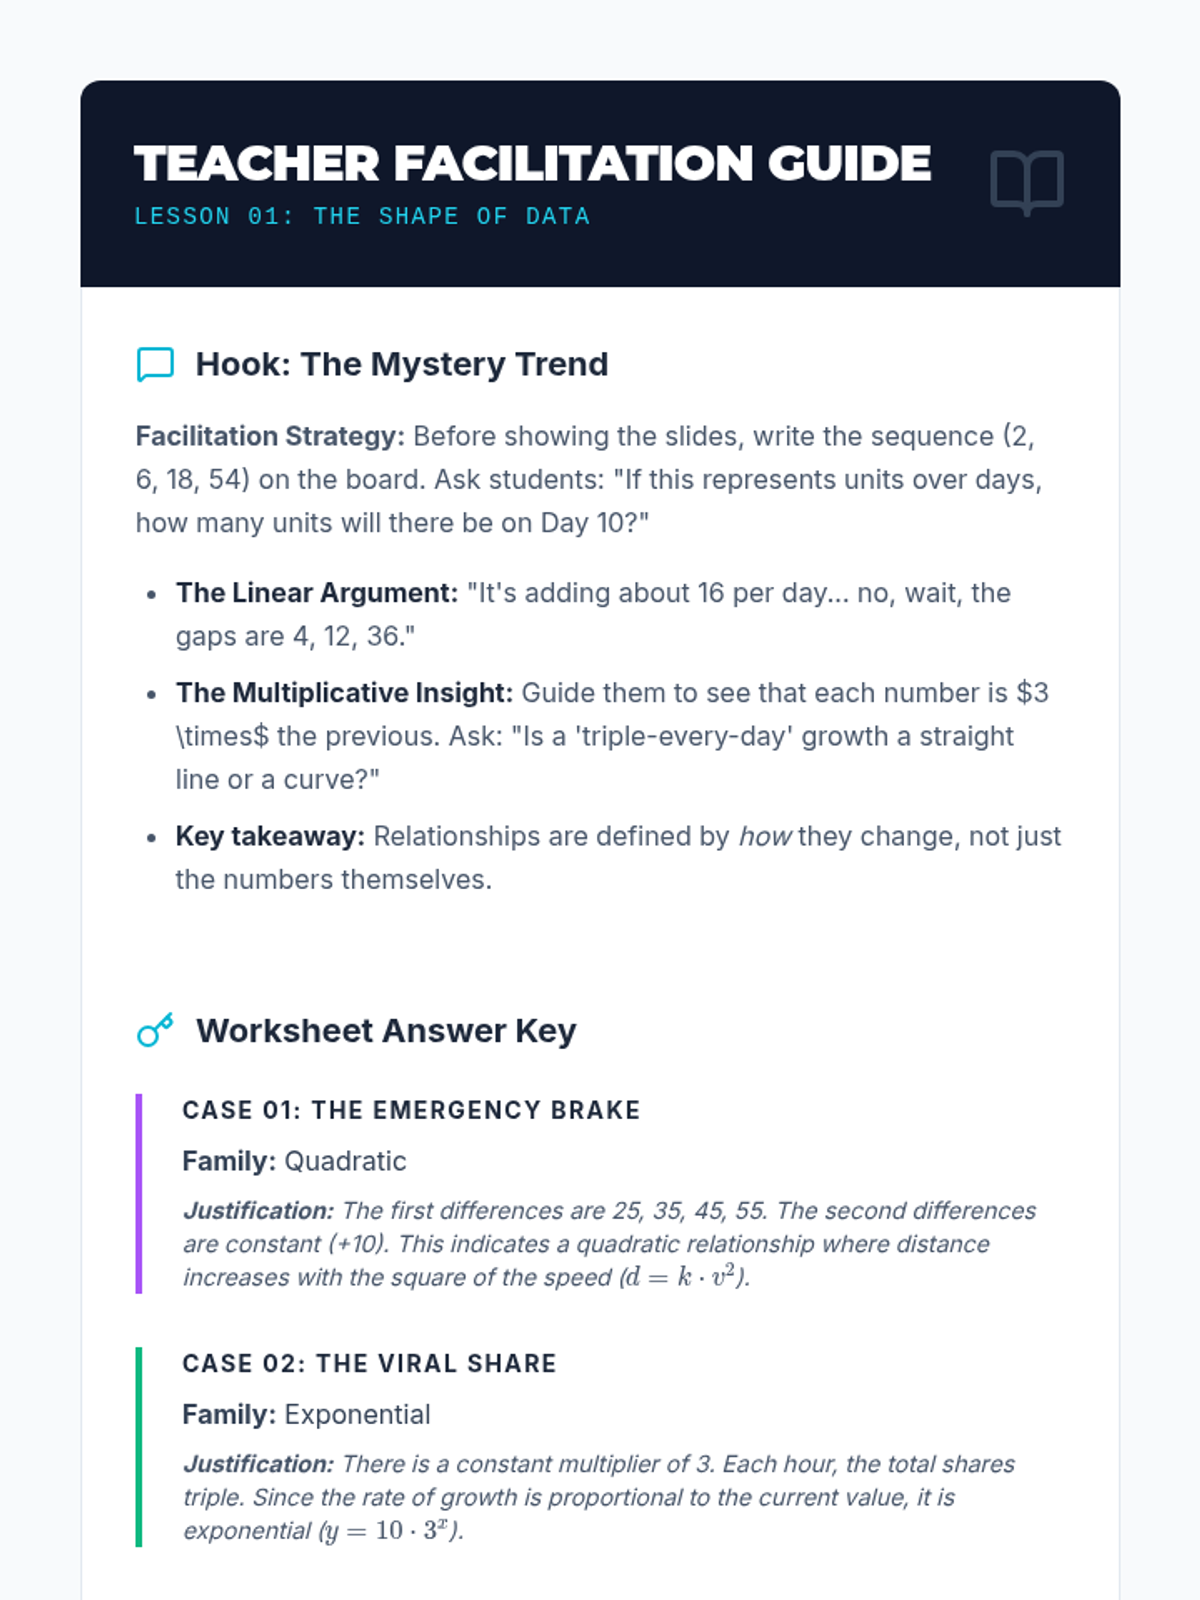
A project-based sequence for 8th-grade students to master building and interpreting linear, exponential, and quadratic functions through real-world scenarios like finance, viral trends, and geometric growth.
Students move from concrete visual patterns to abstract formulas, exploring arithmetic and geometric growth. They learn to translate sequences into recursive and explicit function rules.
A comprehensive deep dive into the mathematical mechanics of money. Students move from basic interest calculations to understanding the exponential power of compound interest, the impact of inflation, and the massive advantage of starting early.
Students assume the role of data analysts to interpret complex real-world datasets related to economics, population dynamics, and environmental science. They identify function families, construct algebraic models using regression, evaluate 'goodness of fit' via residuals, and apply their models for predictions while critically analyzing domain limitations.
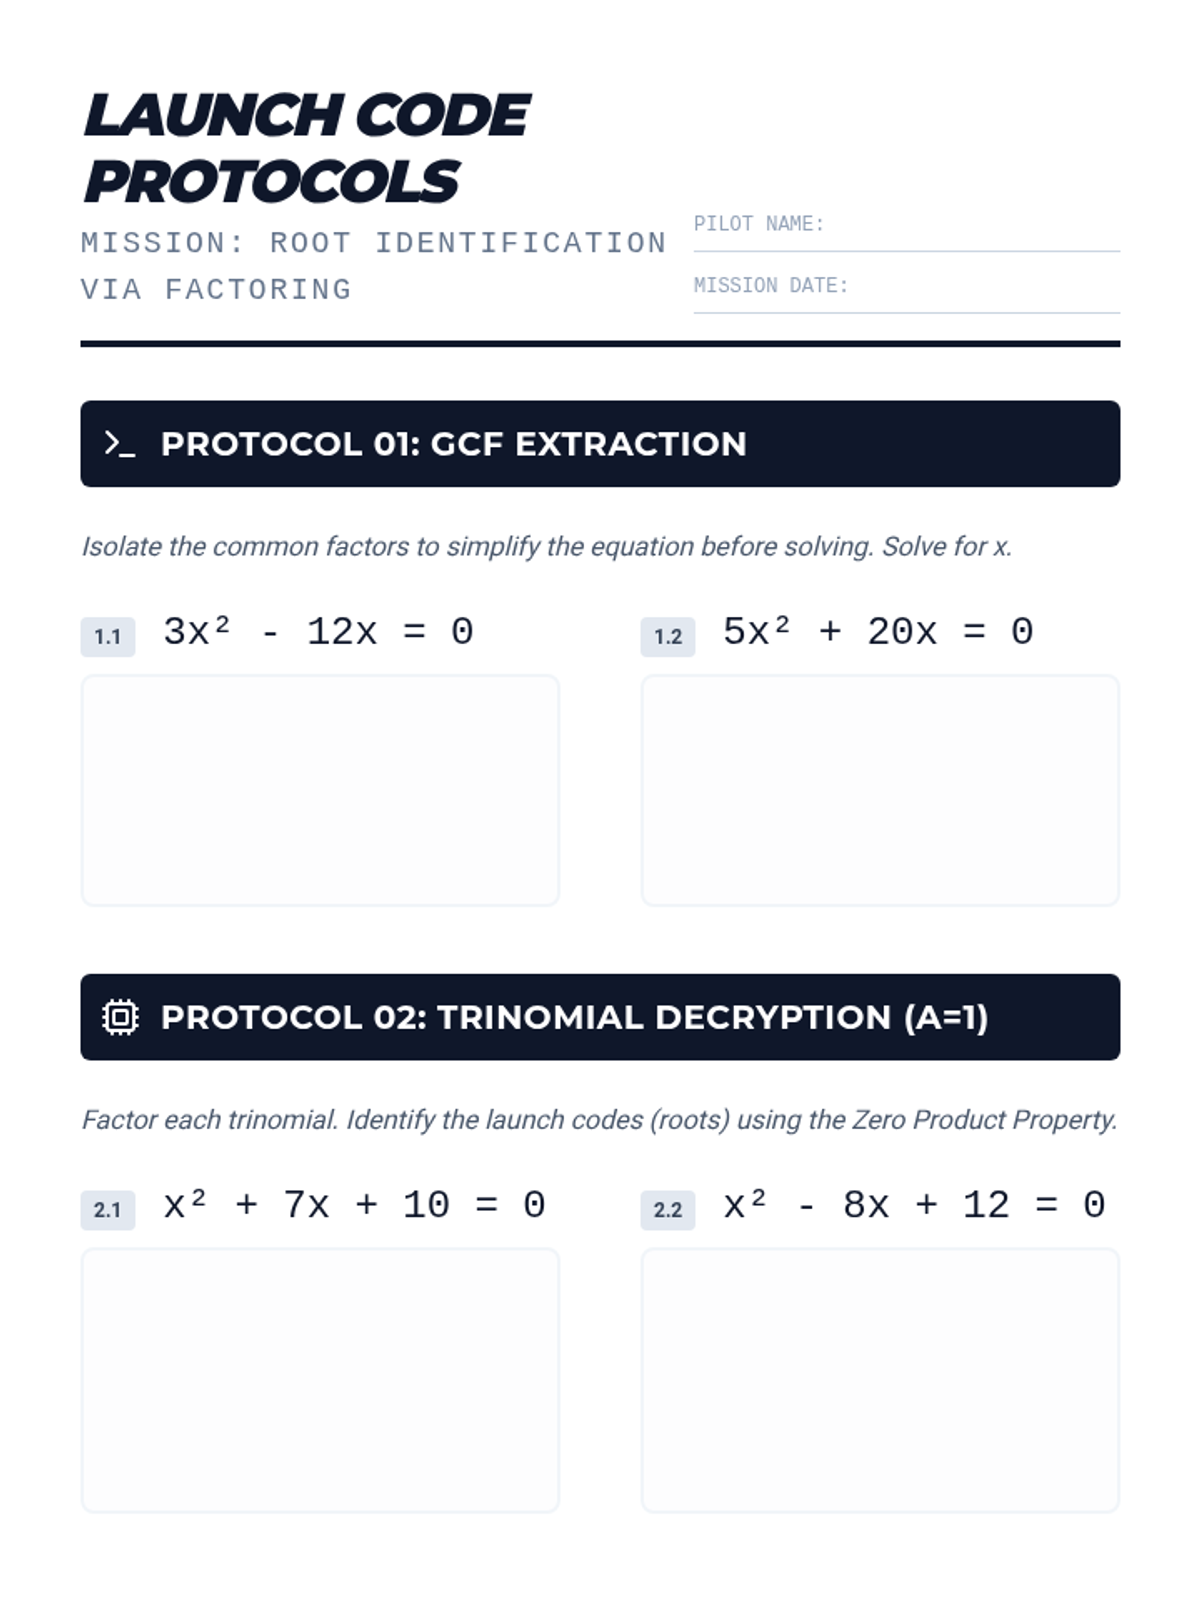
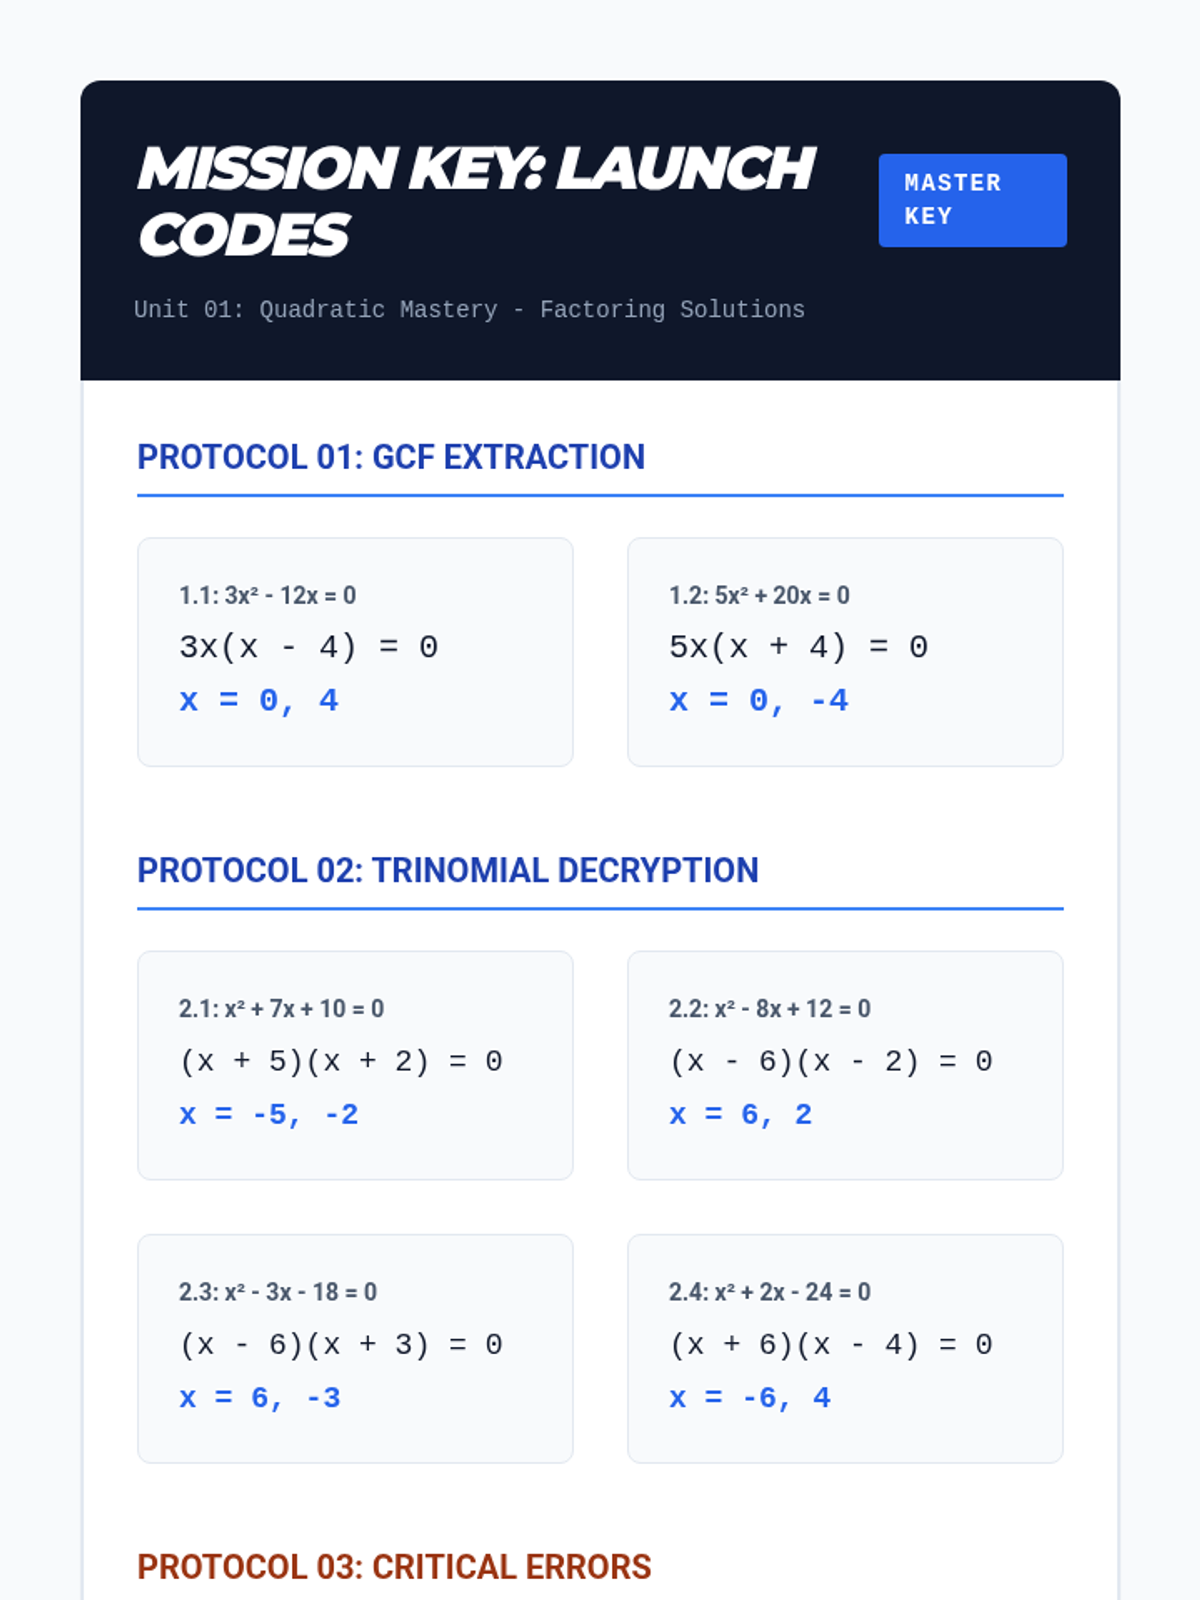
A comprehensive 3-week unit on quadratic equations themed around aerospace engineering and flight mechanics. Students learn to factor, graph, use the quadratic formula, and model projectile motion through the lens of mission control and rocket launches.
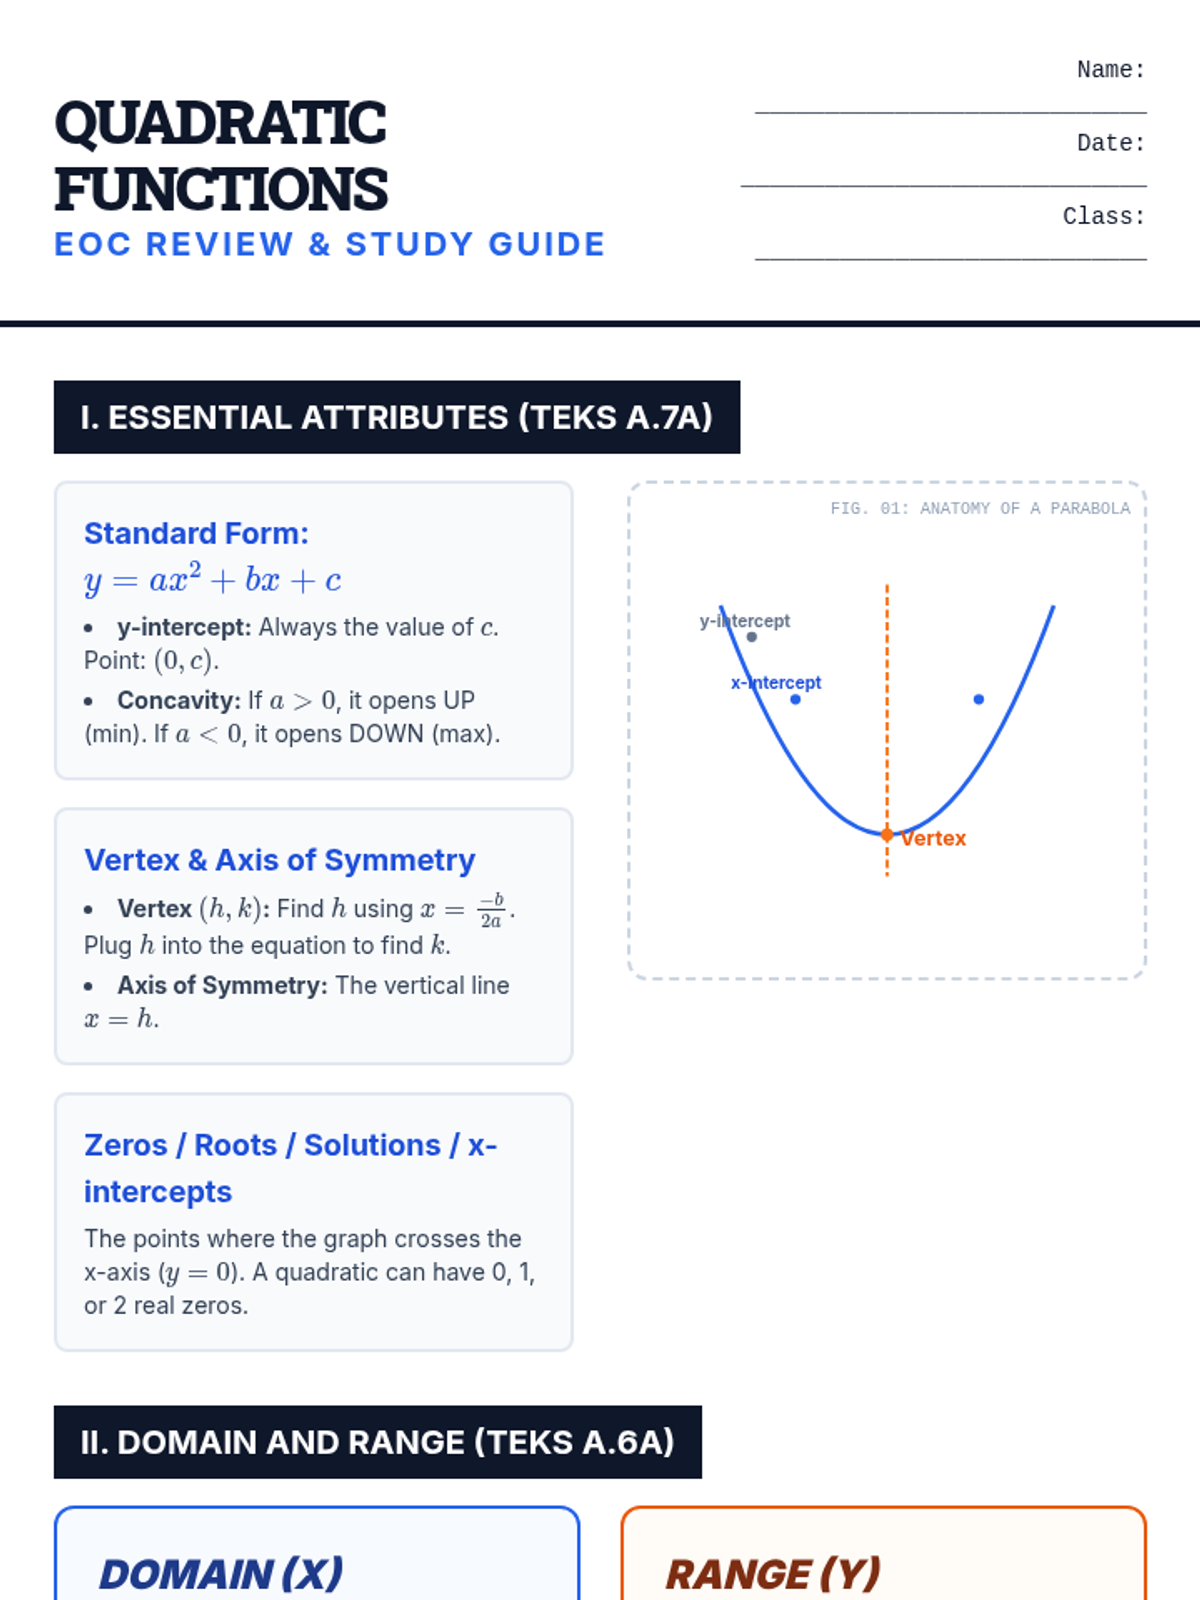
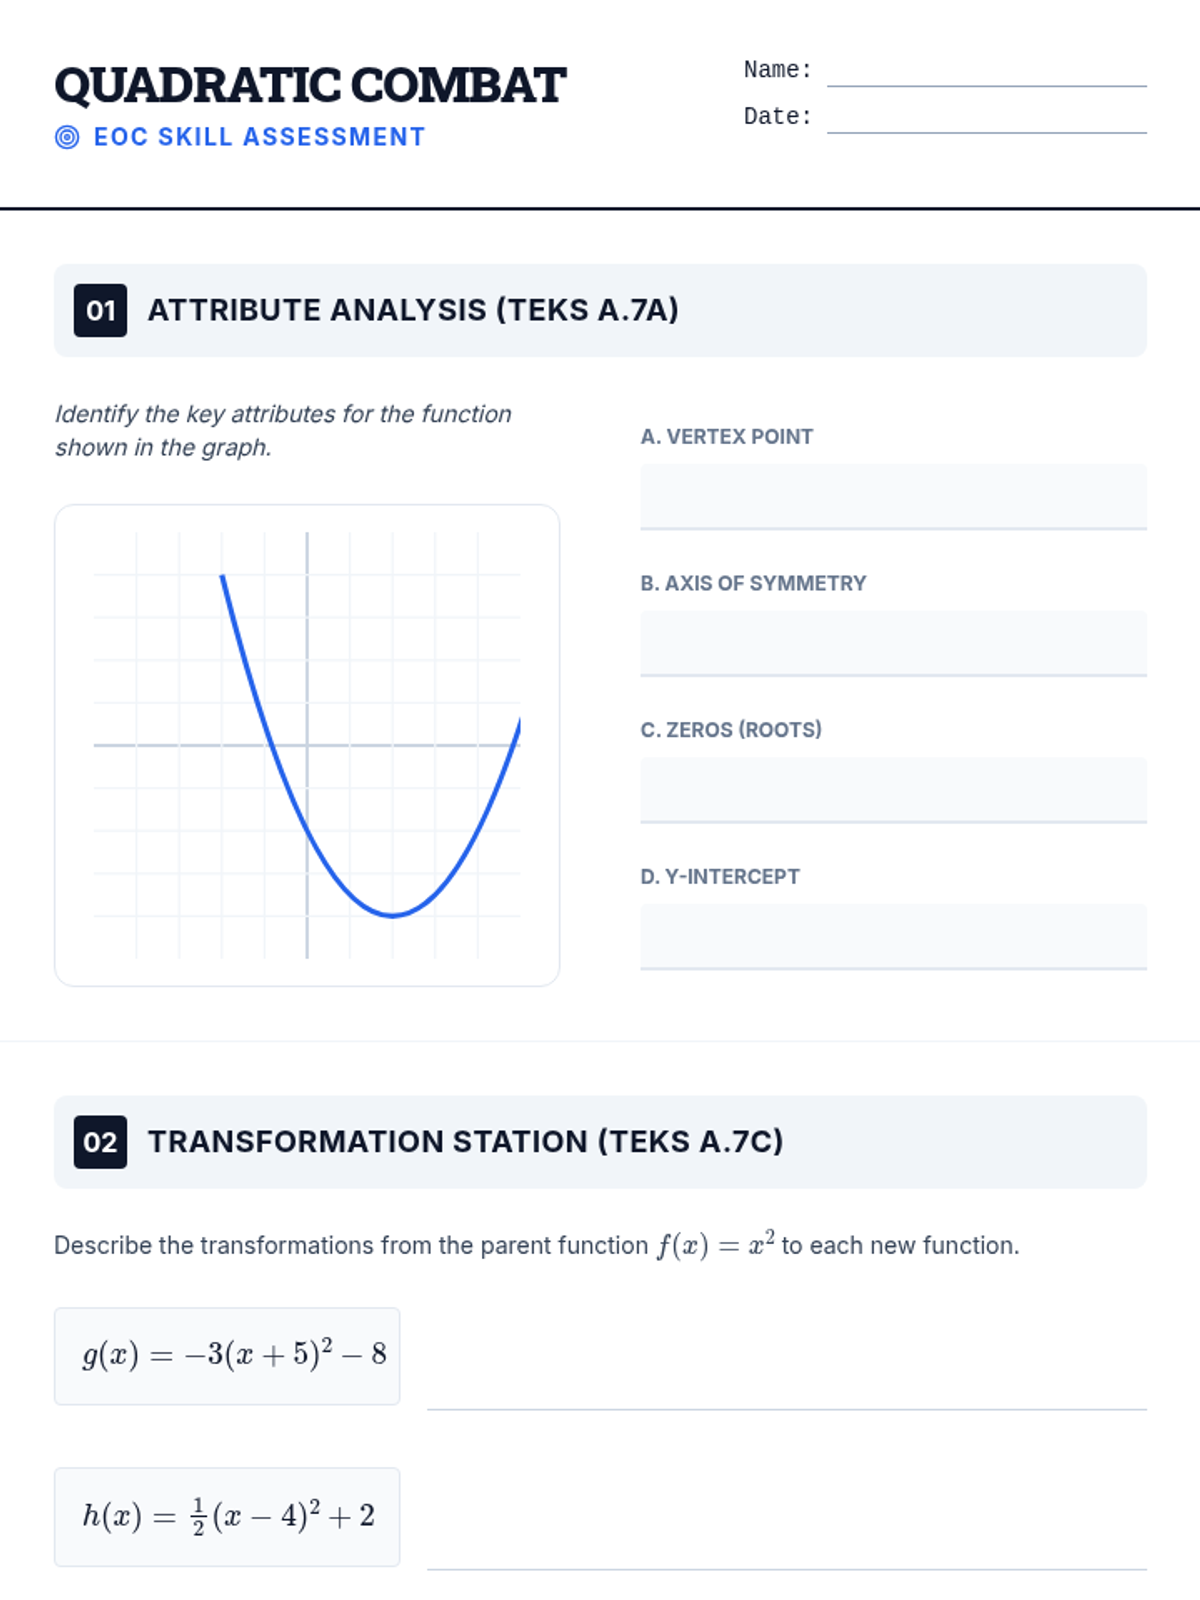
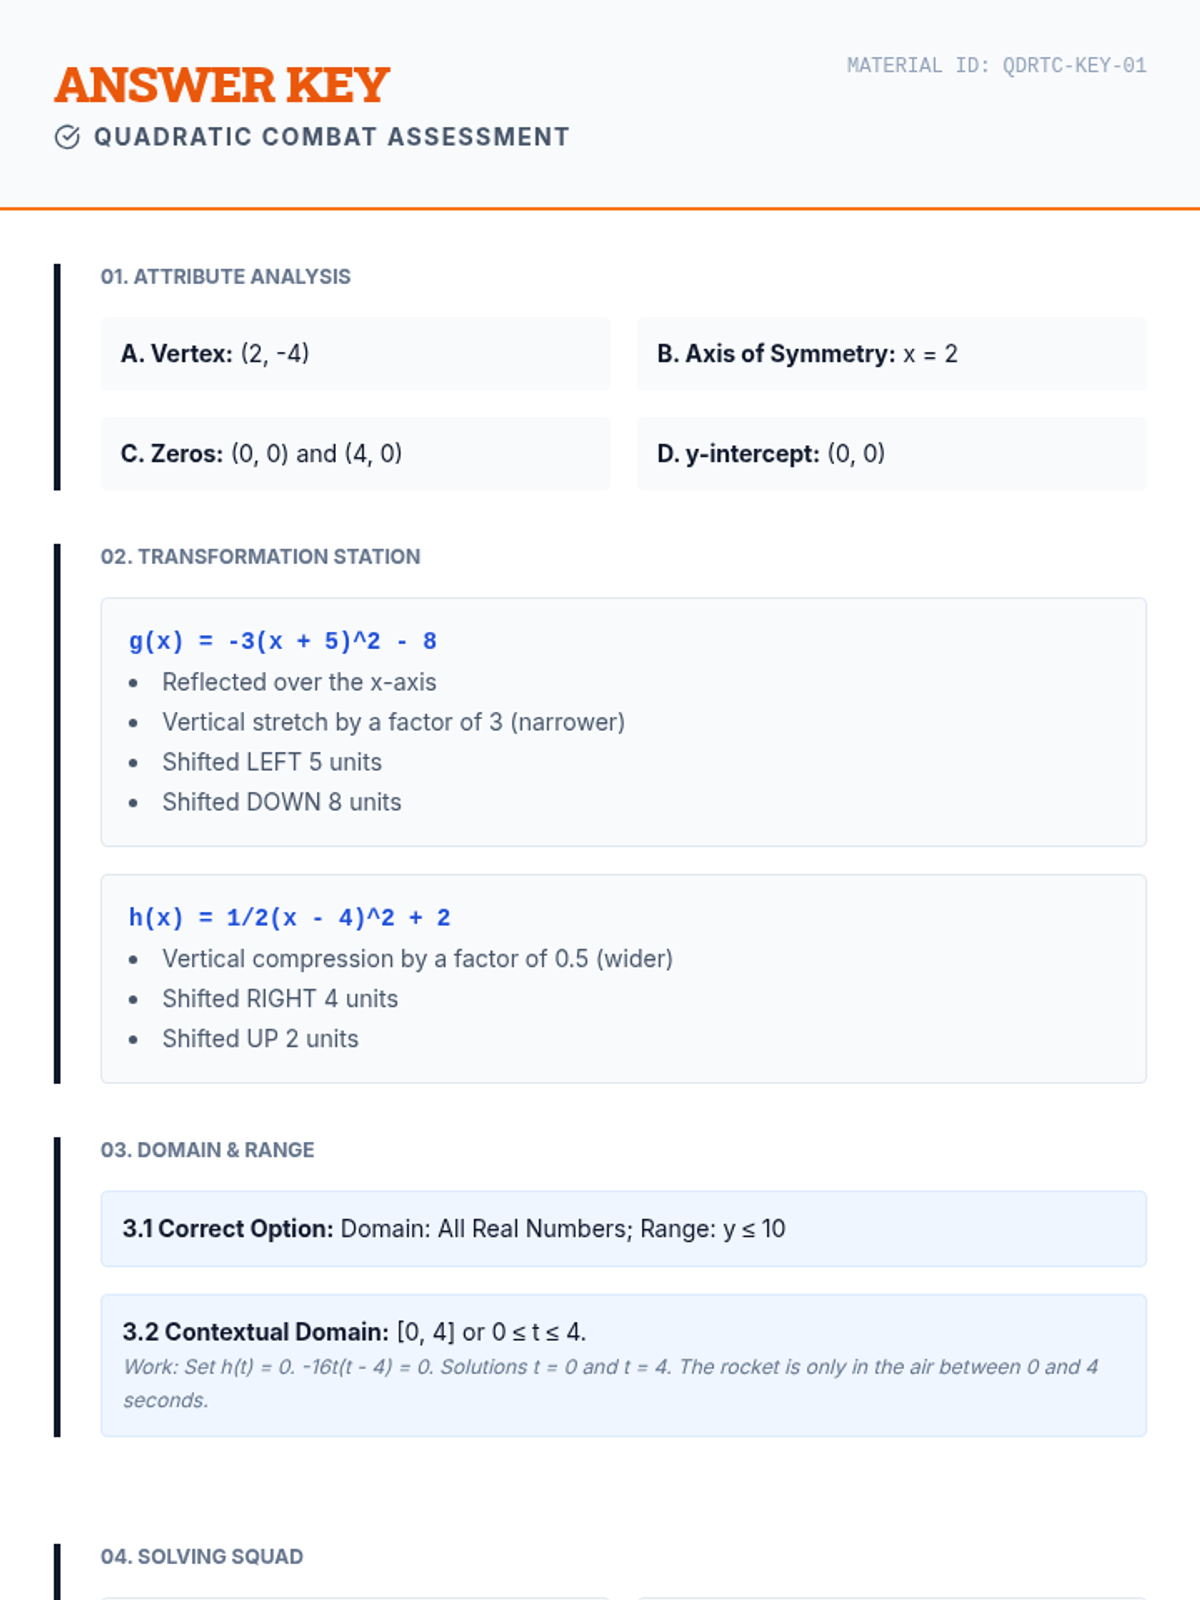
A series of targeted review lessons designed to prepare students for the Texas Algebra 1 End-of-Course (EOC) assessment, focusing on high-stakes TEKS.
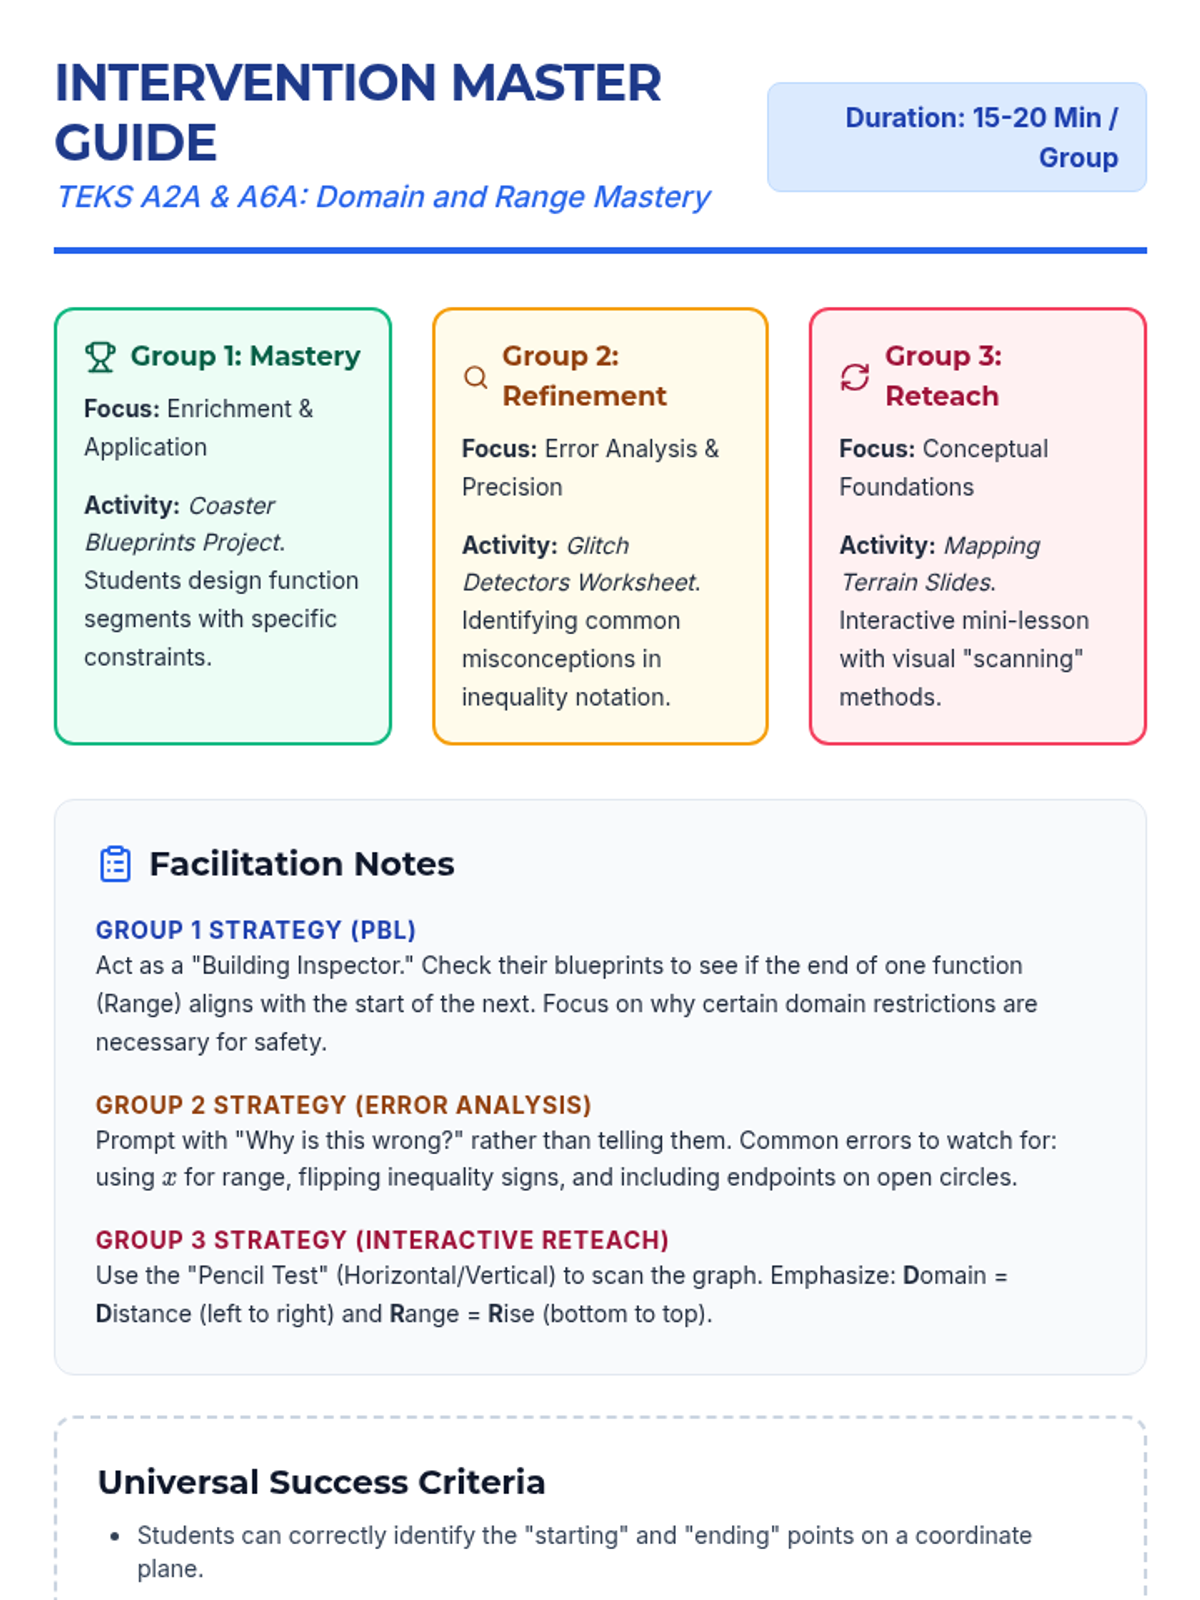
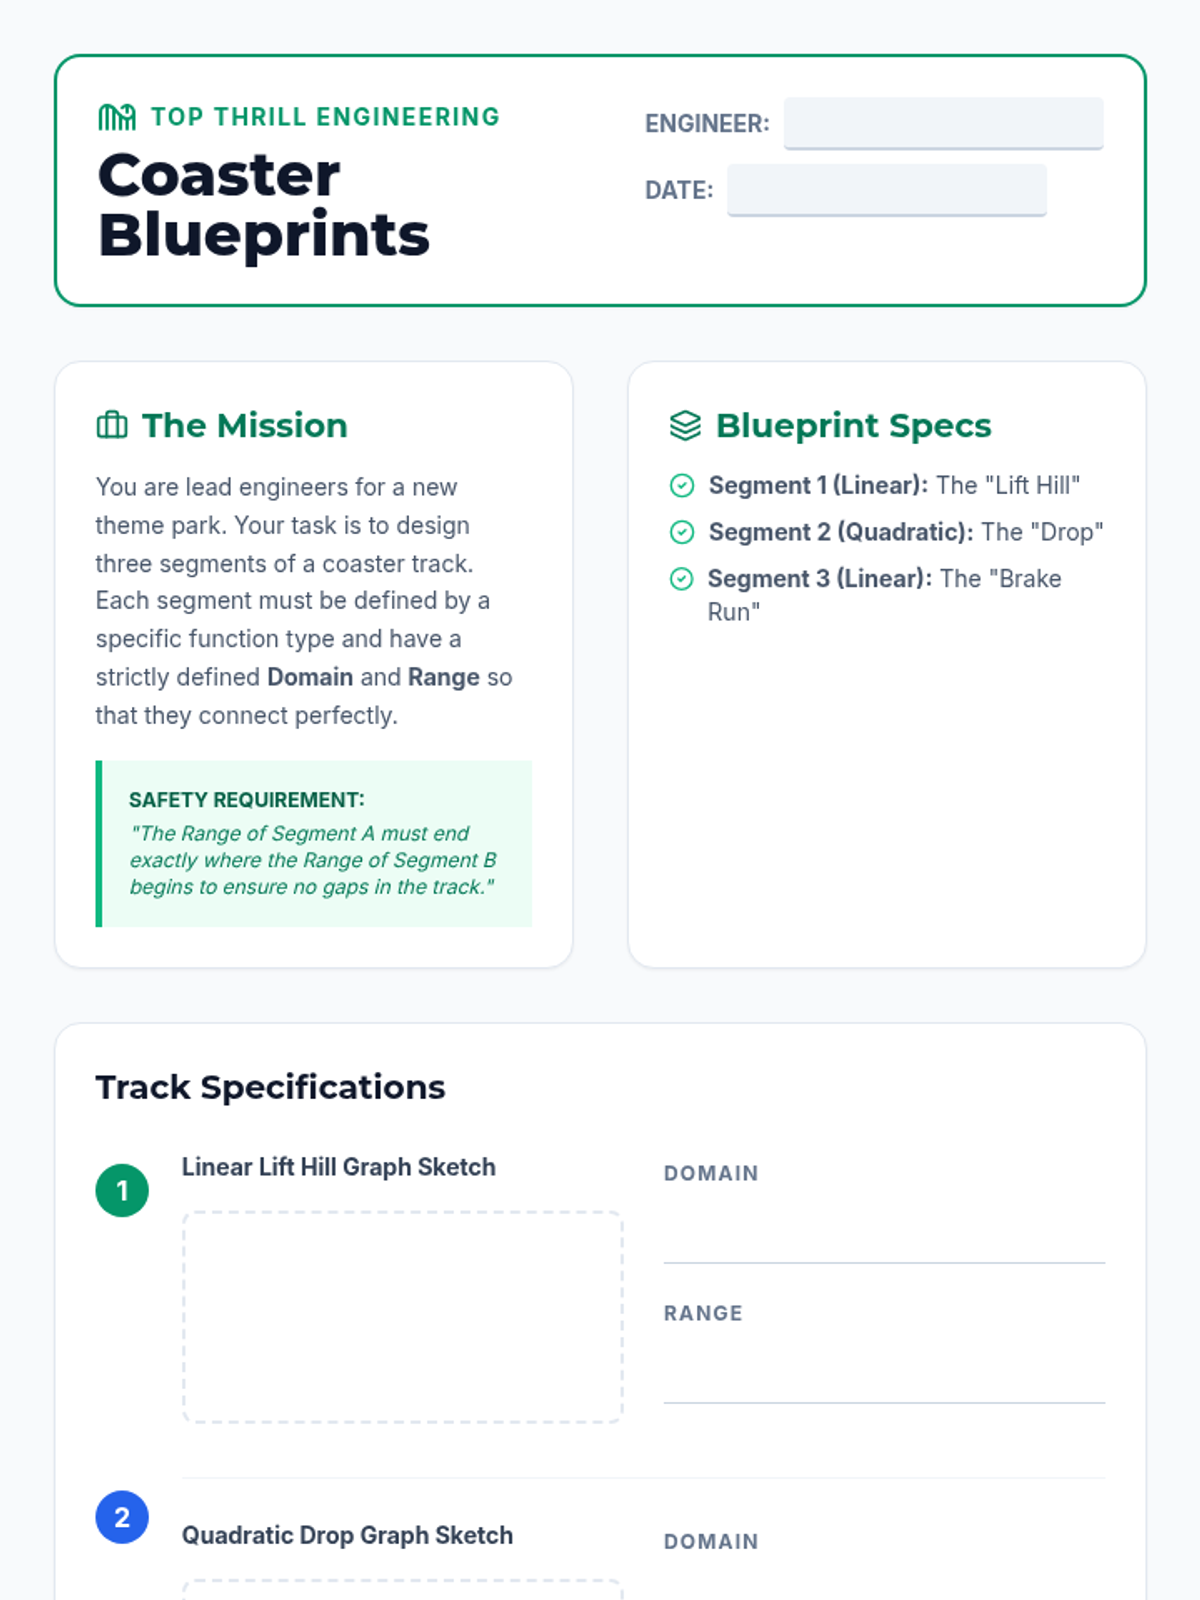
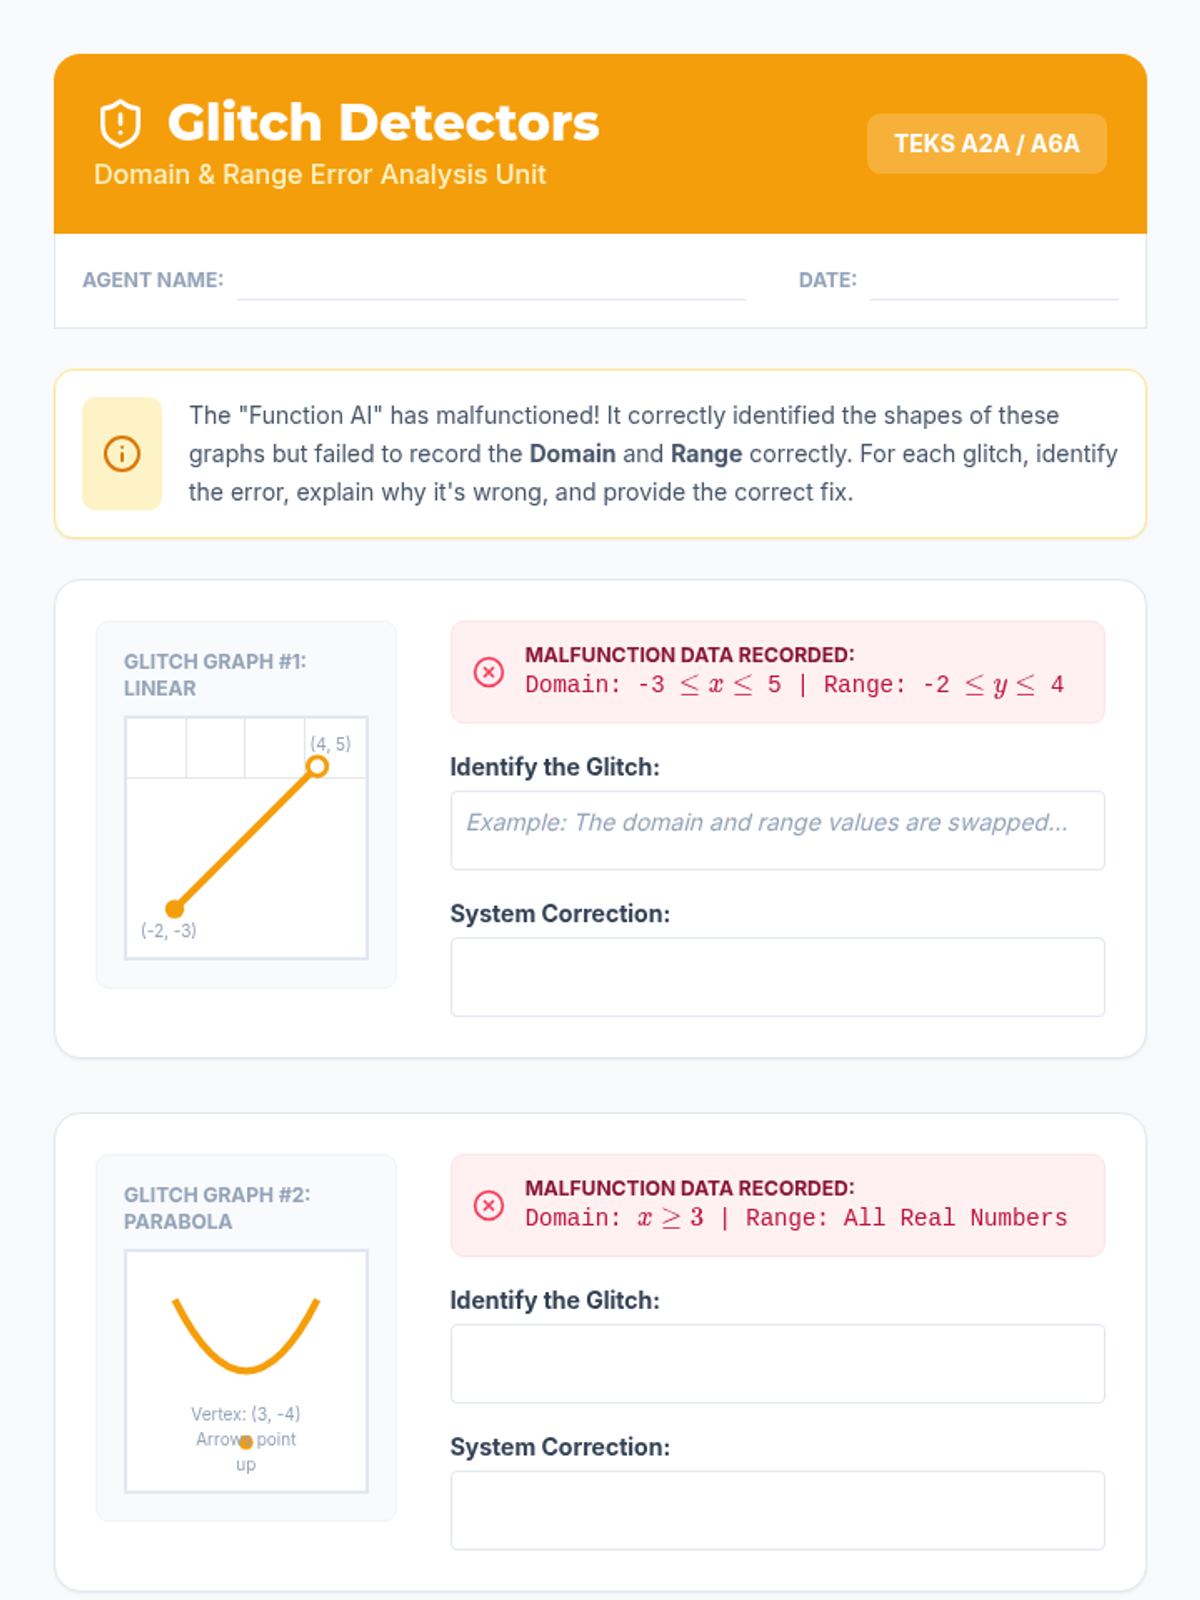
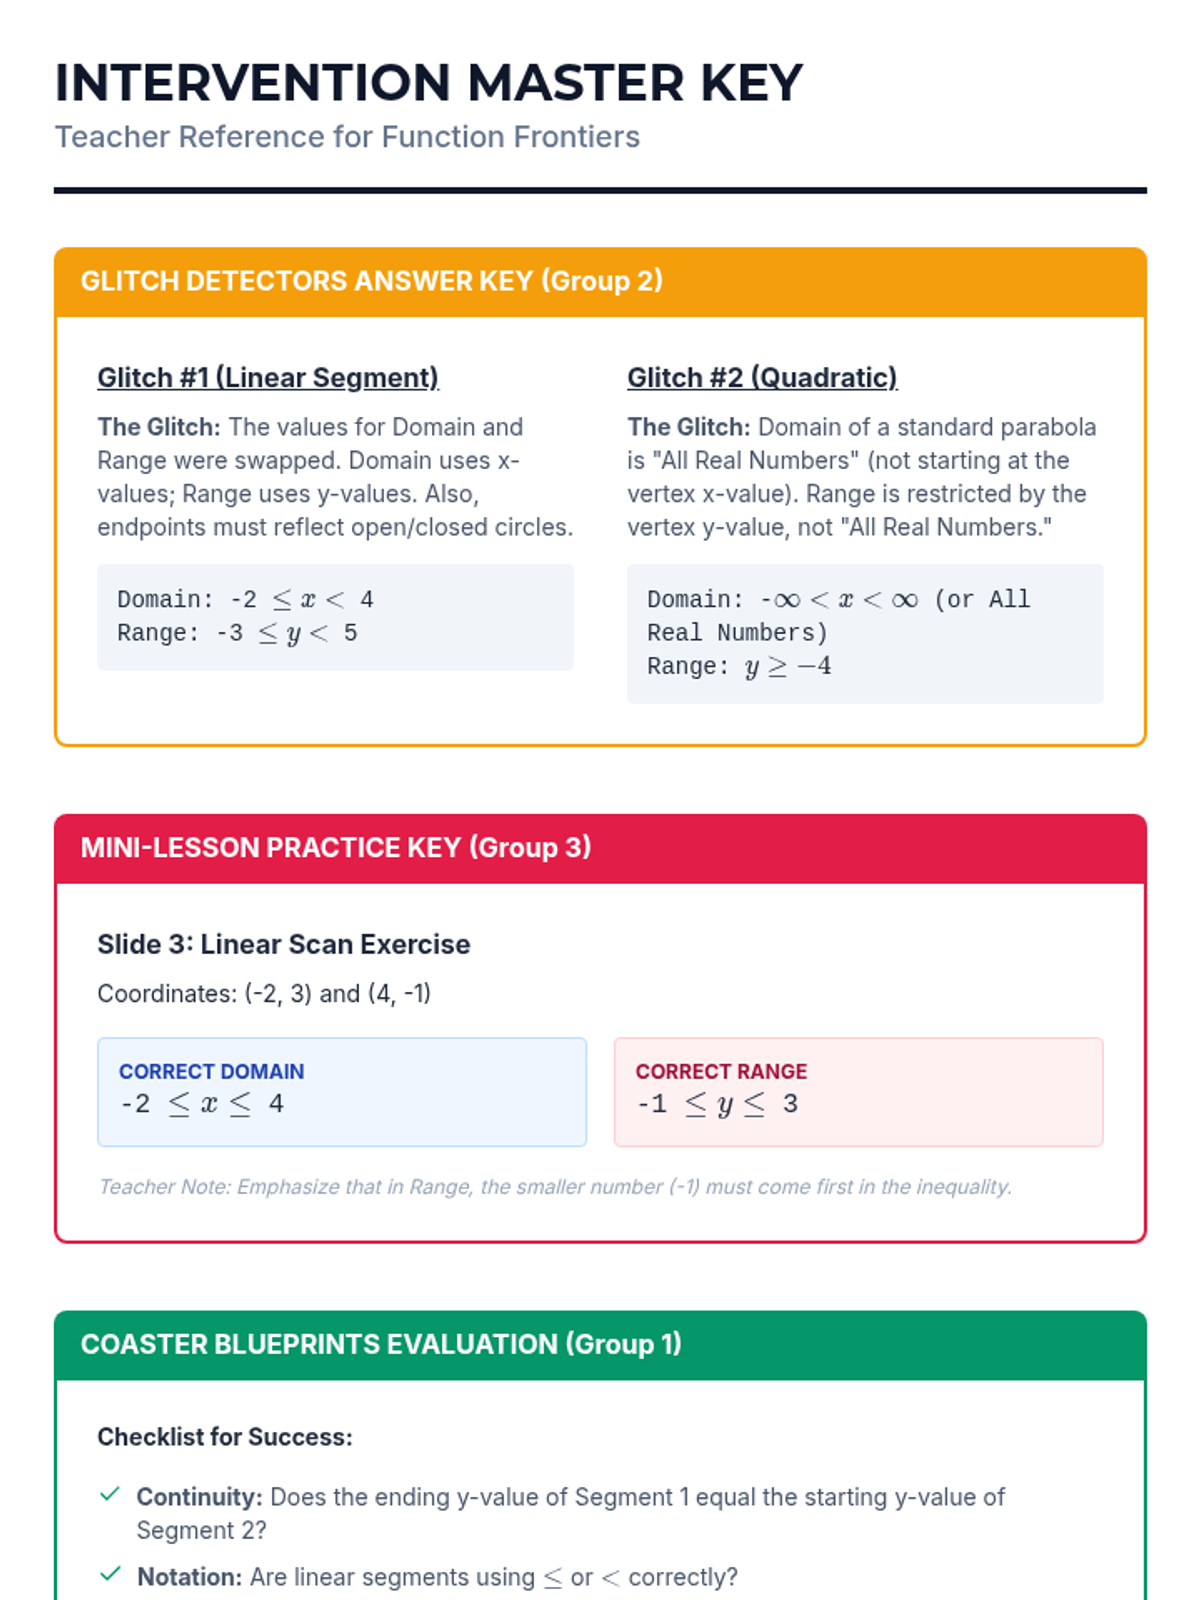
A specialized intervention sequence designed for Algebra I students to master TEKS A2A and A6A, focusing on the domain and range of linear and quadratic functions through tiered small-group instruction.
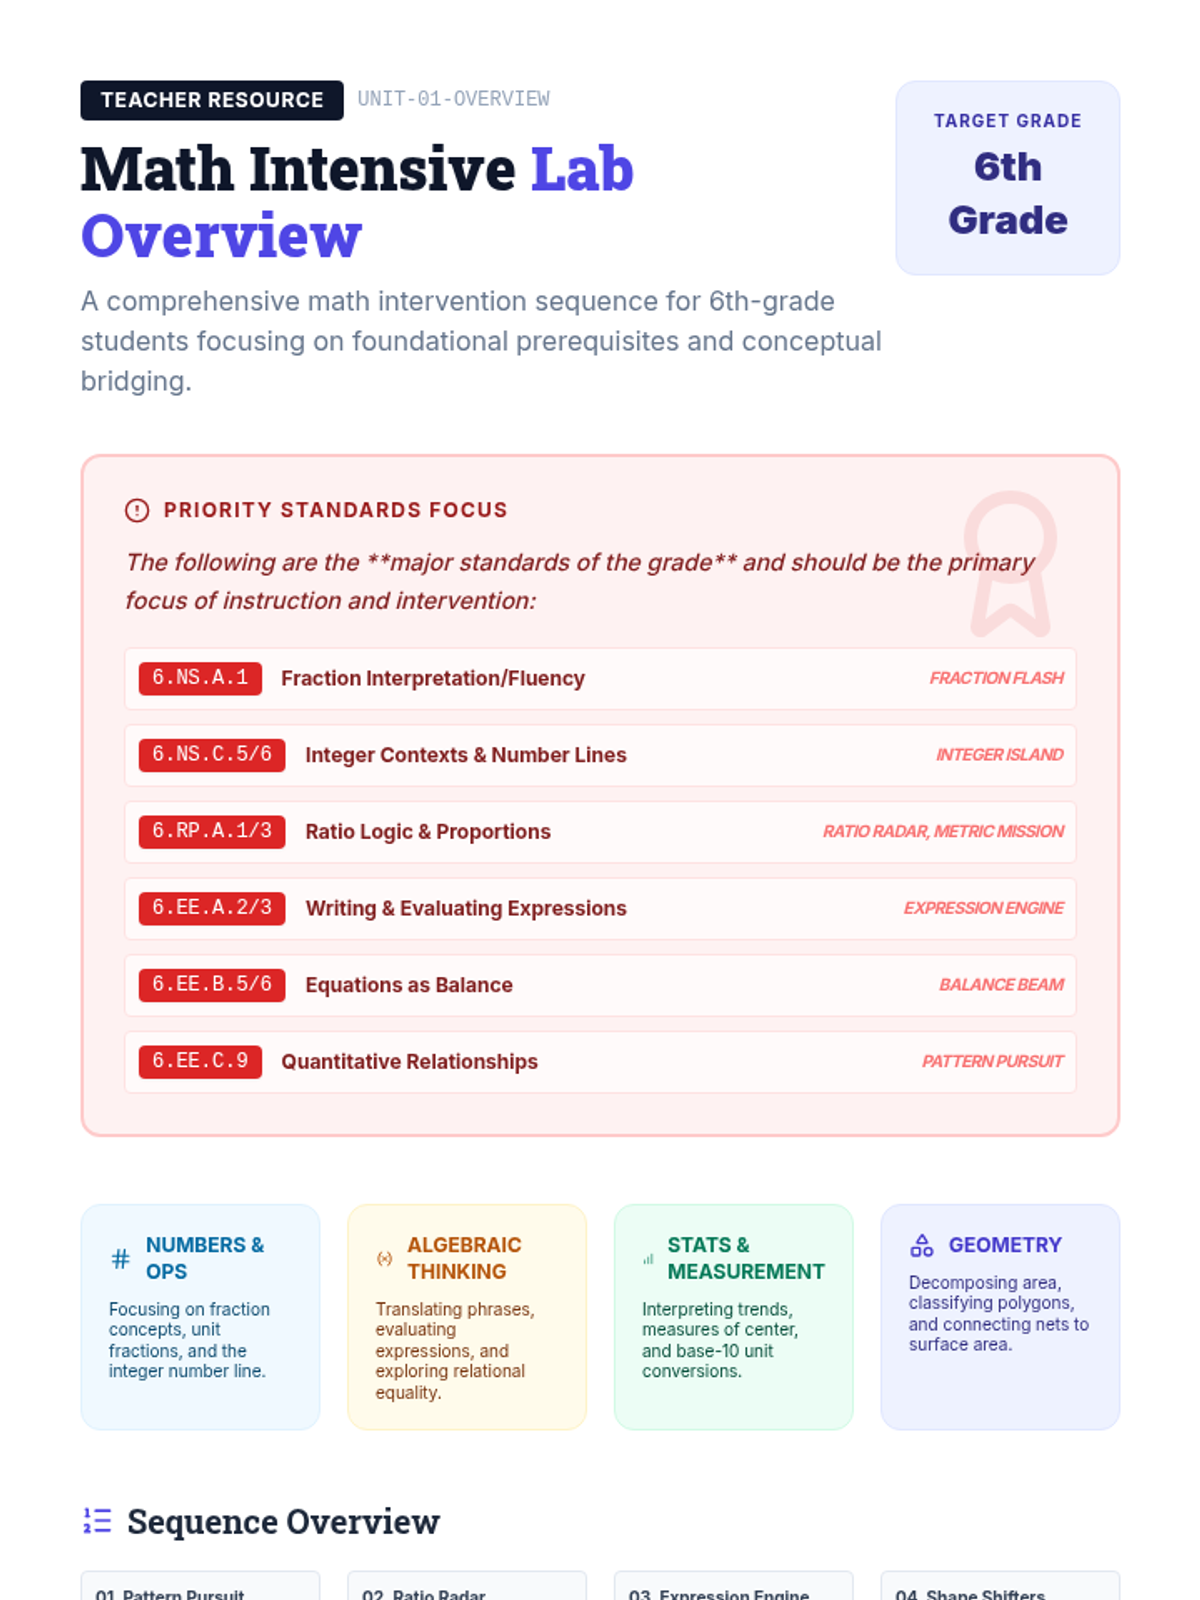
A comprehensive math intervention sequence for 6th-grade students, focusing on four key domains: Numbers & Operations, Algebraic Thinking, Measurement & Data, and Geometry. This sequence uses high-leverage strategies from the All Learners Network (ALN) and aligns with i-Ready prerequisite modules to bridge conceptual gaps.
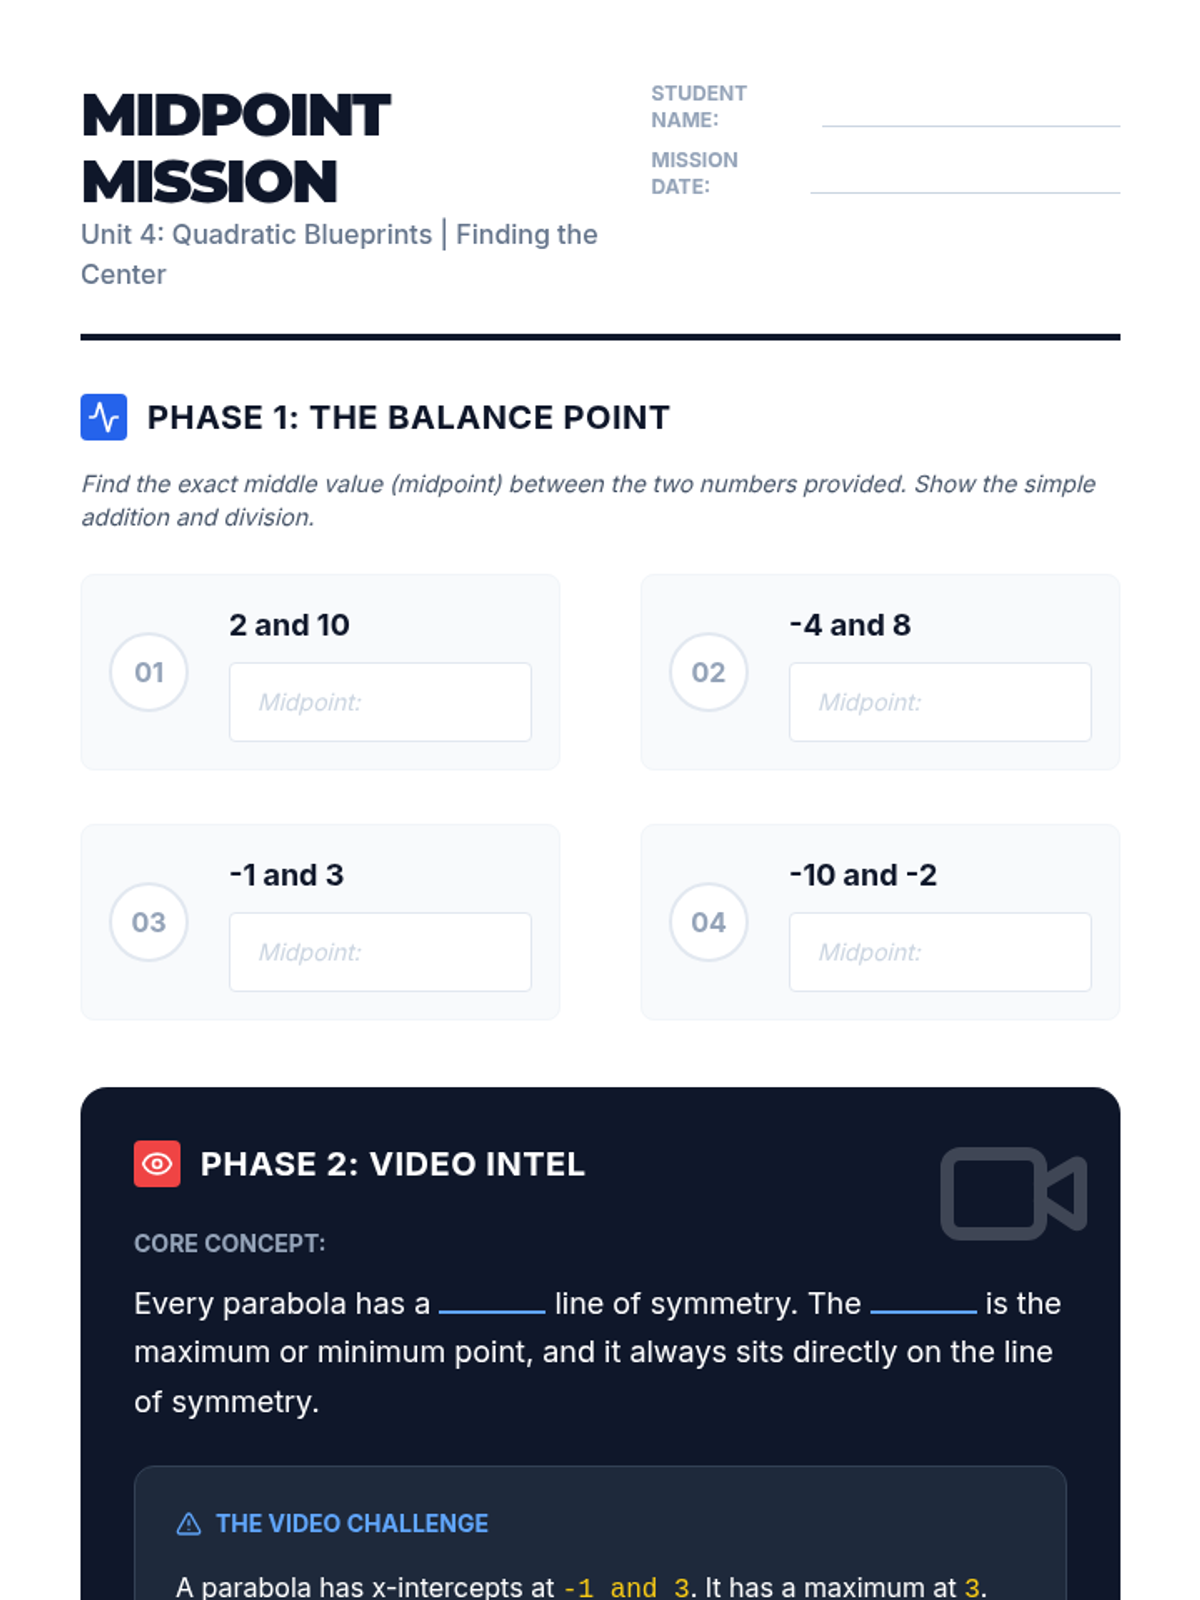
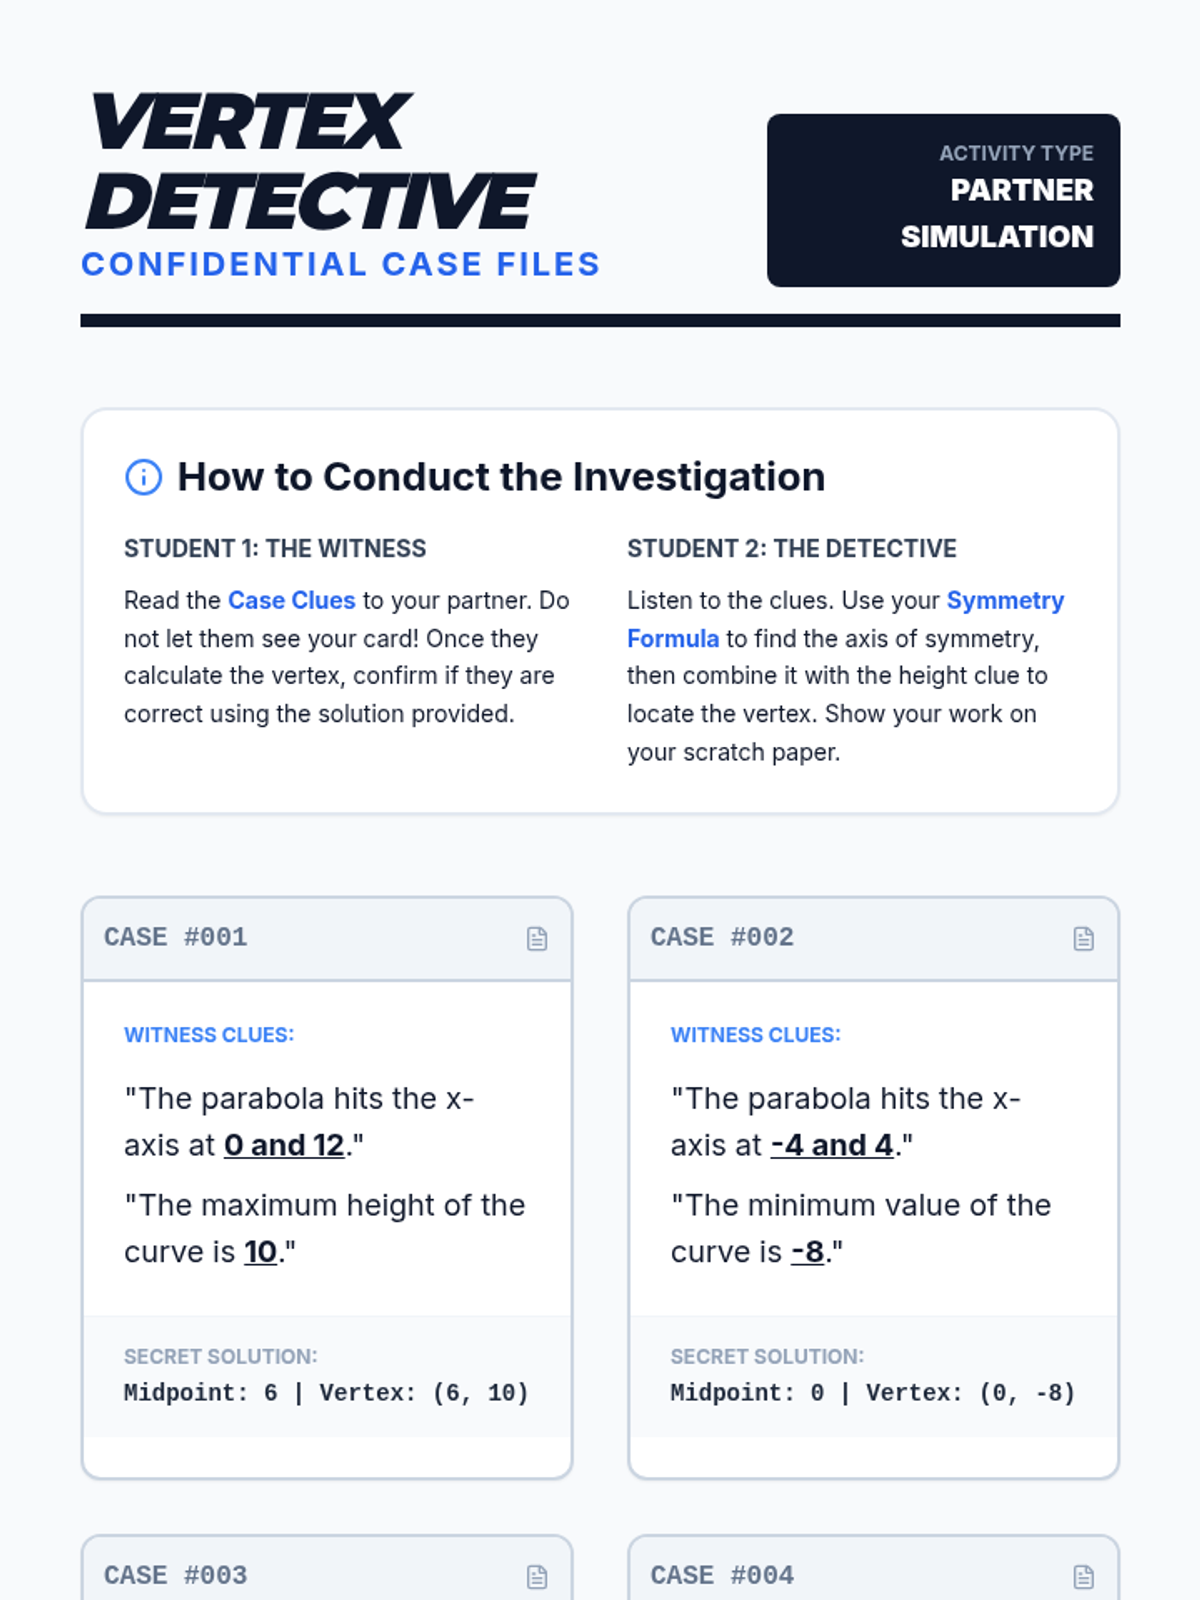
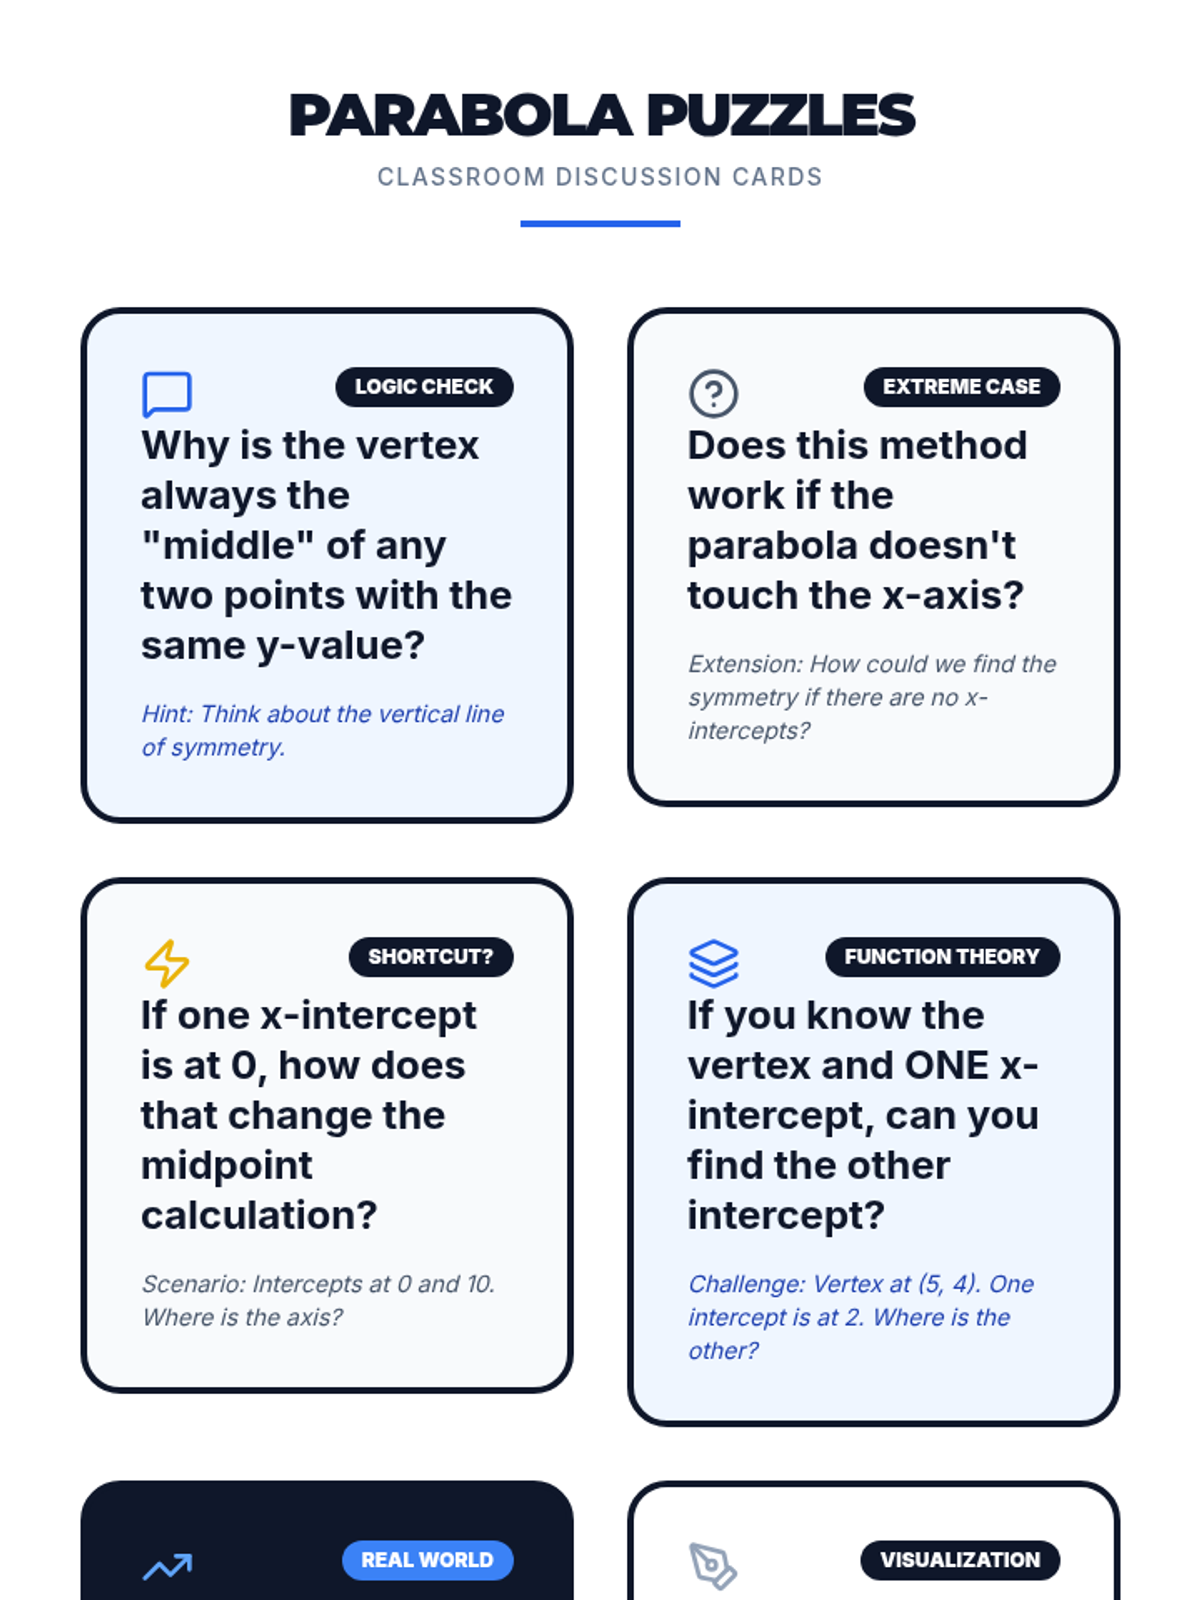
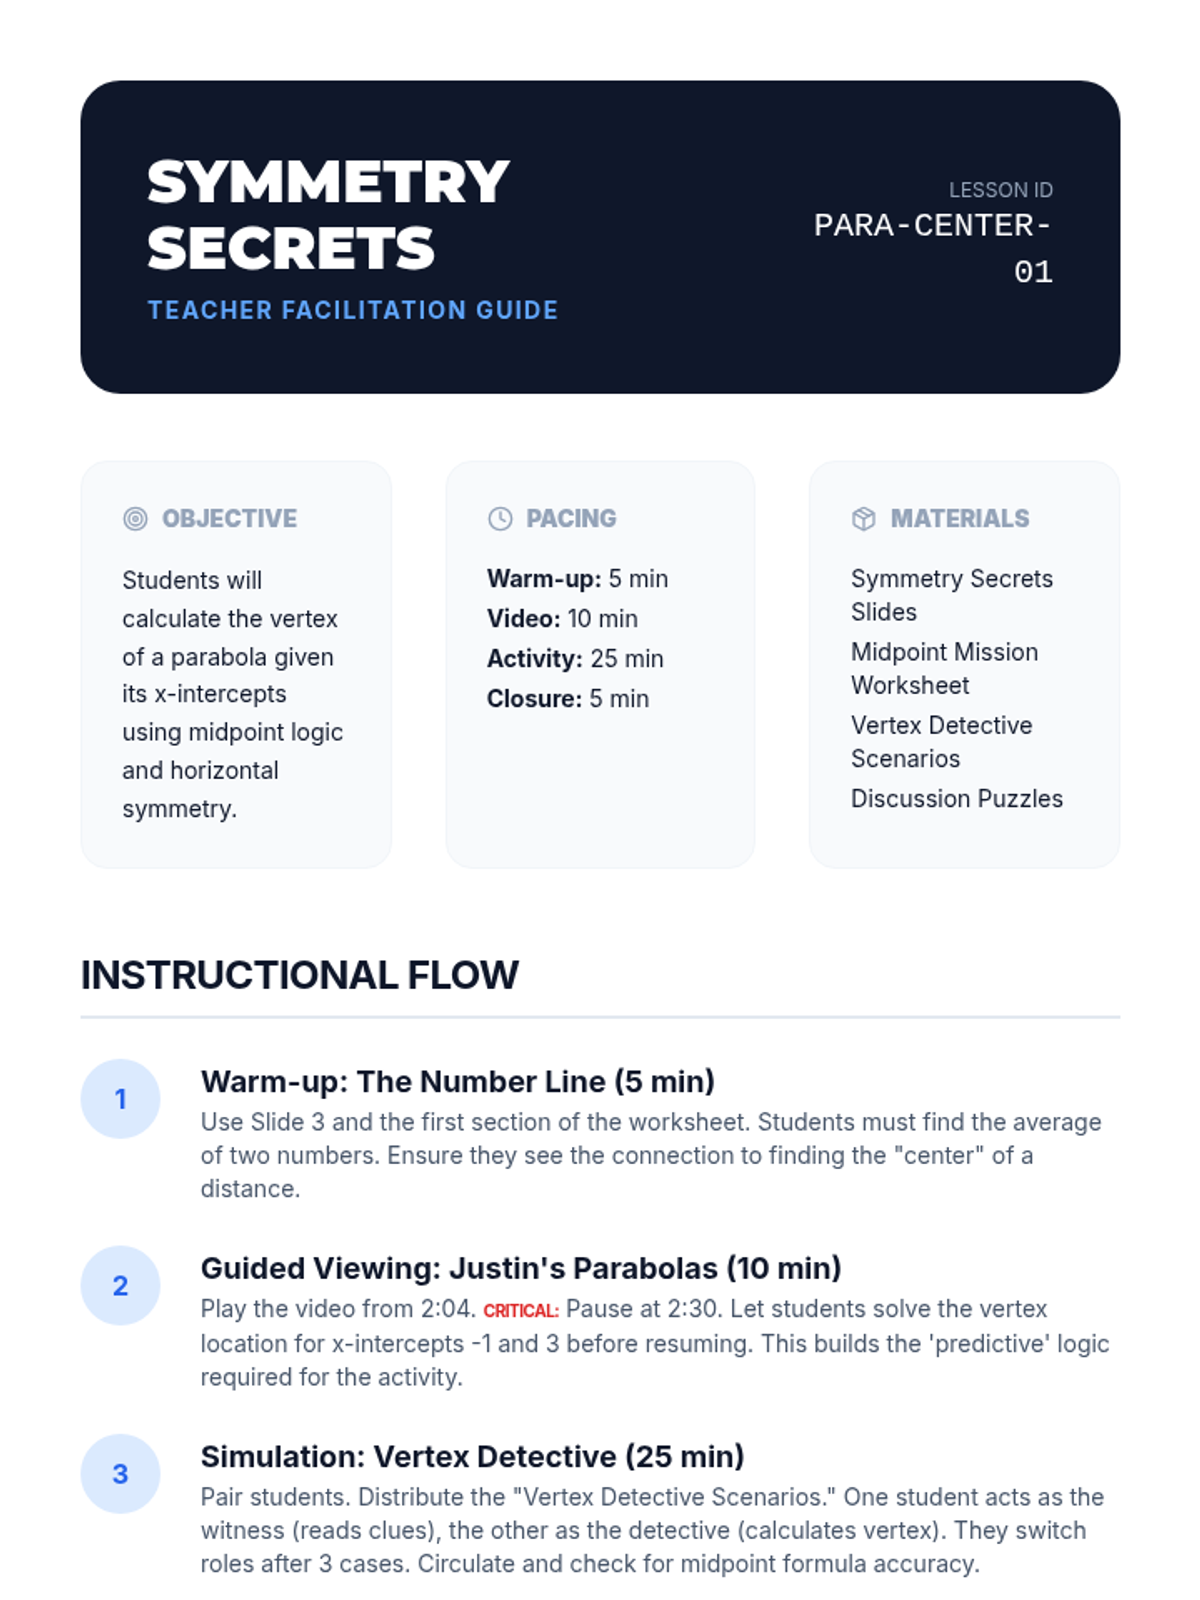
A lesson sequence focusing on the geometric properties of quadratic functions, specifically using symmetry to locate key features like the vertex and axis of symmetry.
A Tier 2 intervention sequence focused on helping 8th-grade students master the construction and interpretation of linear functions ($y = mx + b$) from various representations. The sequence emphasizes scaffolding, contextual meaning, and procedural fluency with rate of change and initial values.
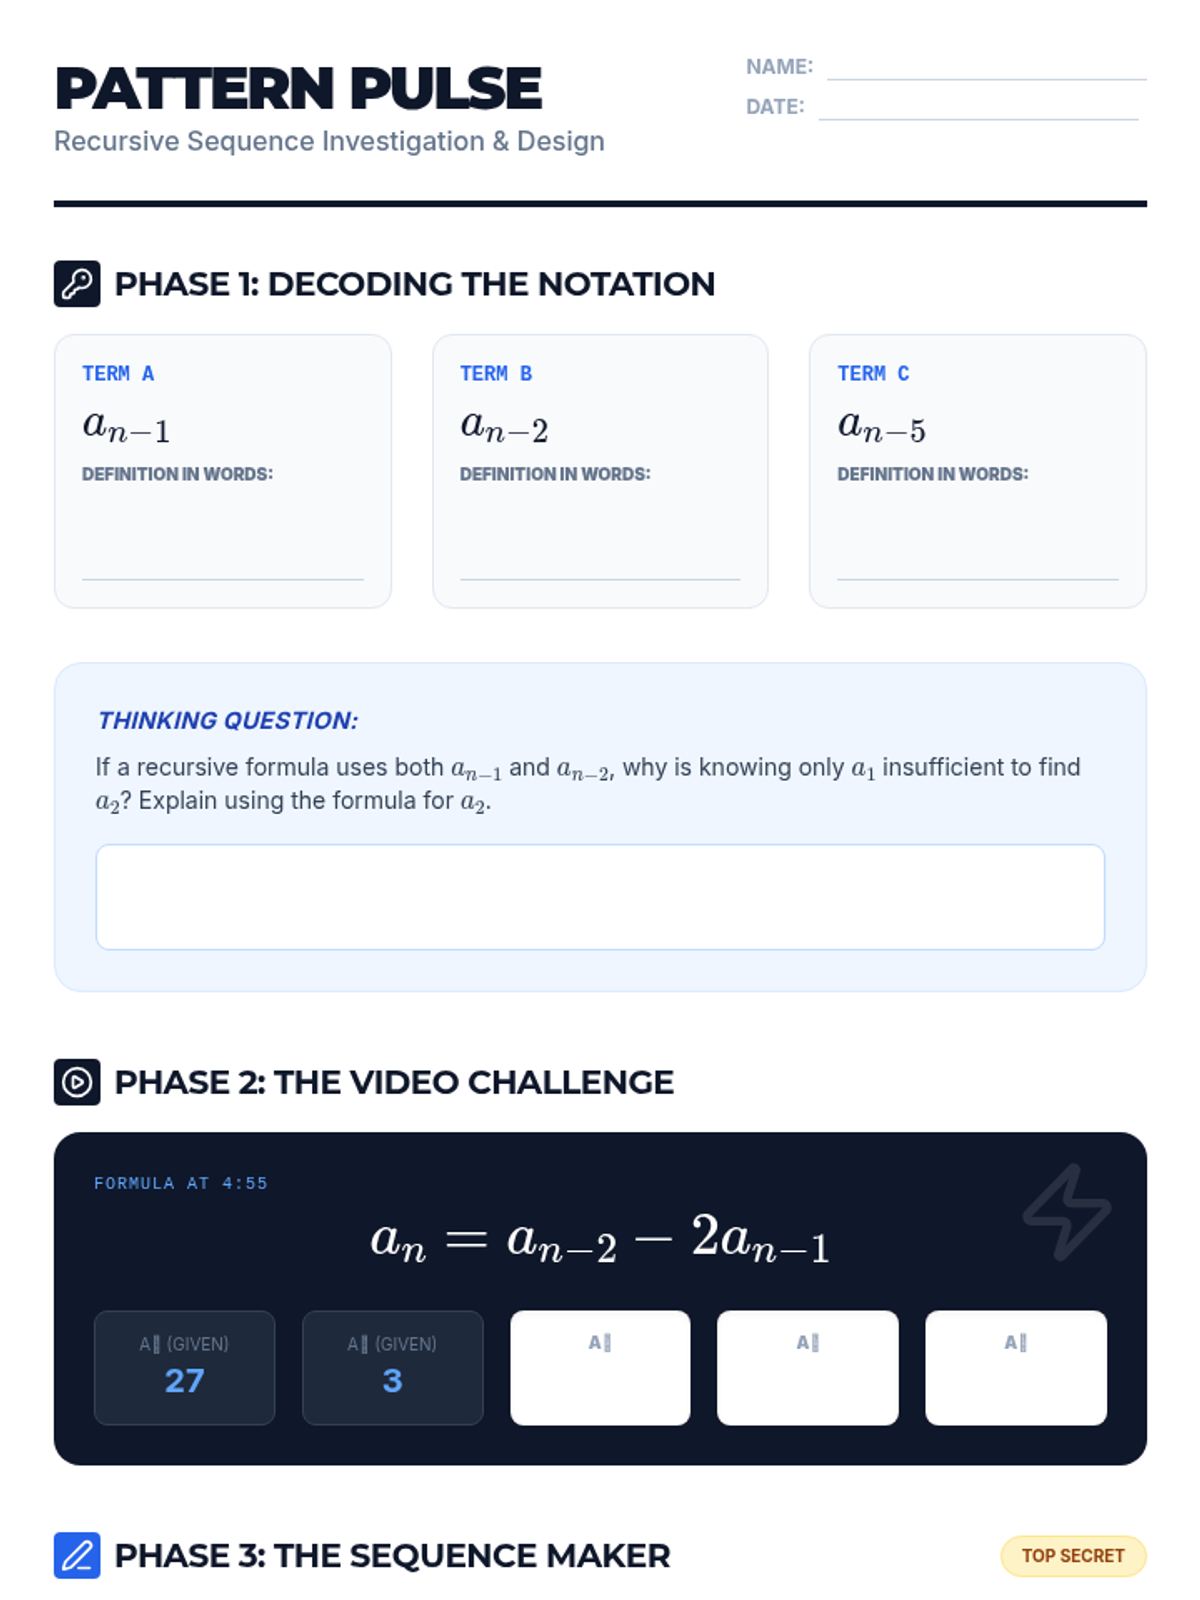
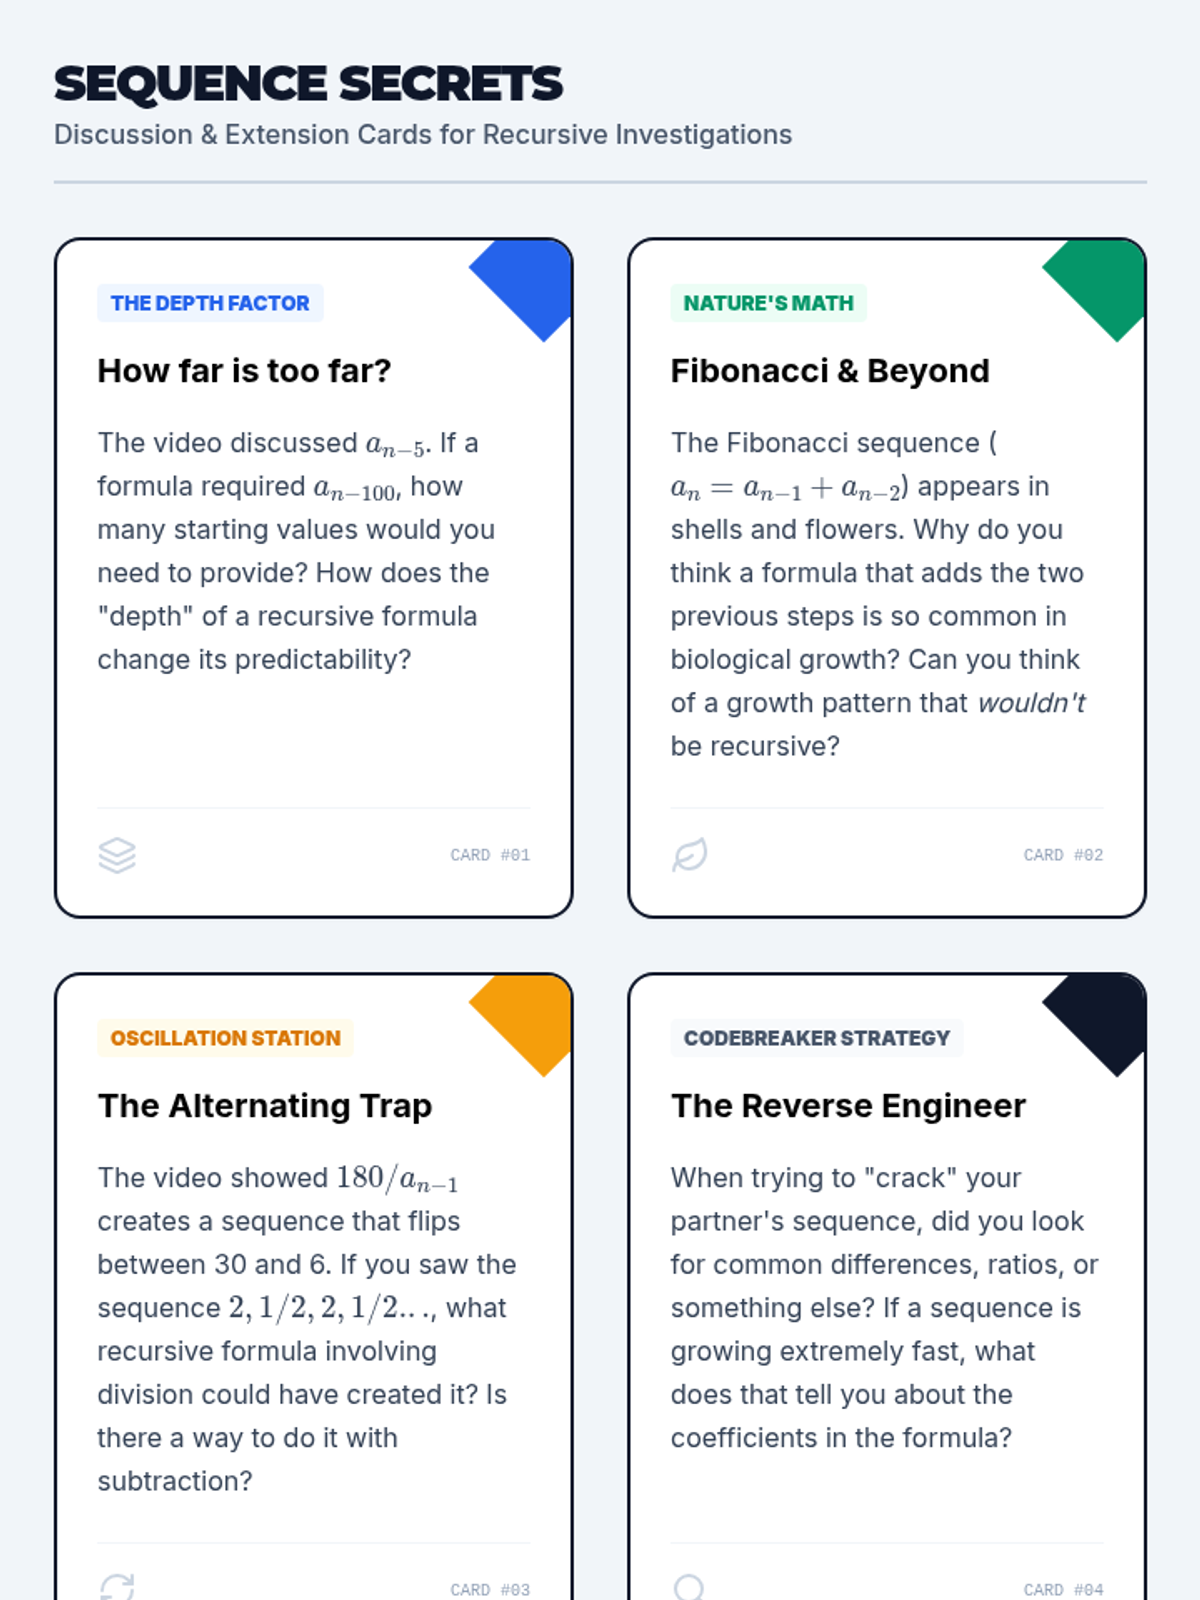
A high-level Honors Algebra lesson focused on complex recursive sequences where students analyze notation, explore the Fibonacci sequence, and engage in a 'Sequence Maker' activity to reverse-engineer formulas.
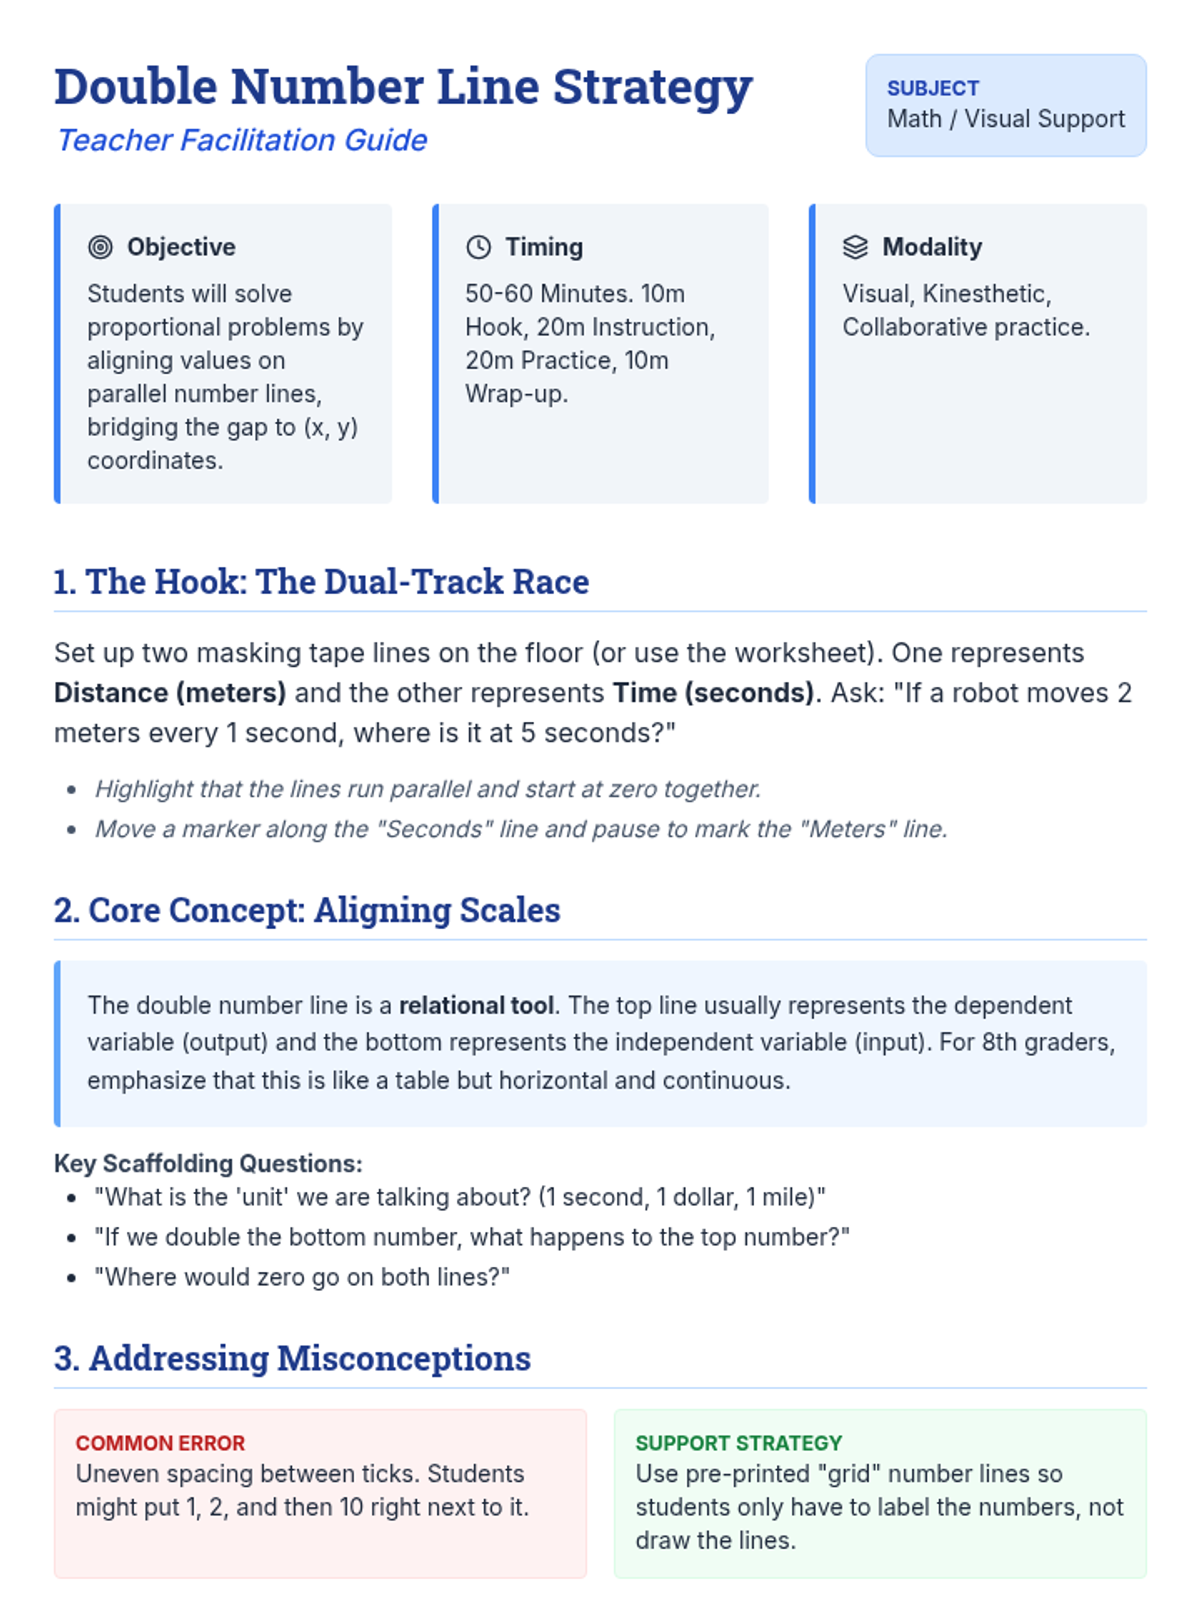
This sequence uses visual tools like double number lines, slope triangles, and coordinate overlays to help 8th-grade students understand functions and rates of change. It provides concrete representations for abstract algebraic concepts, supporting students who benefit from visual and spatial reasoning.
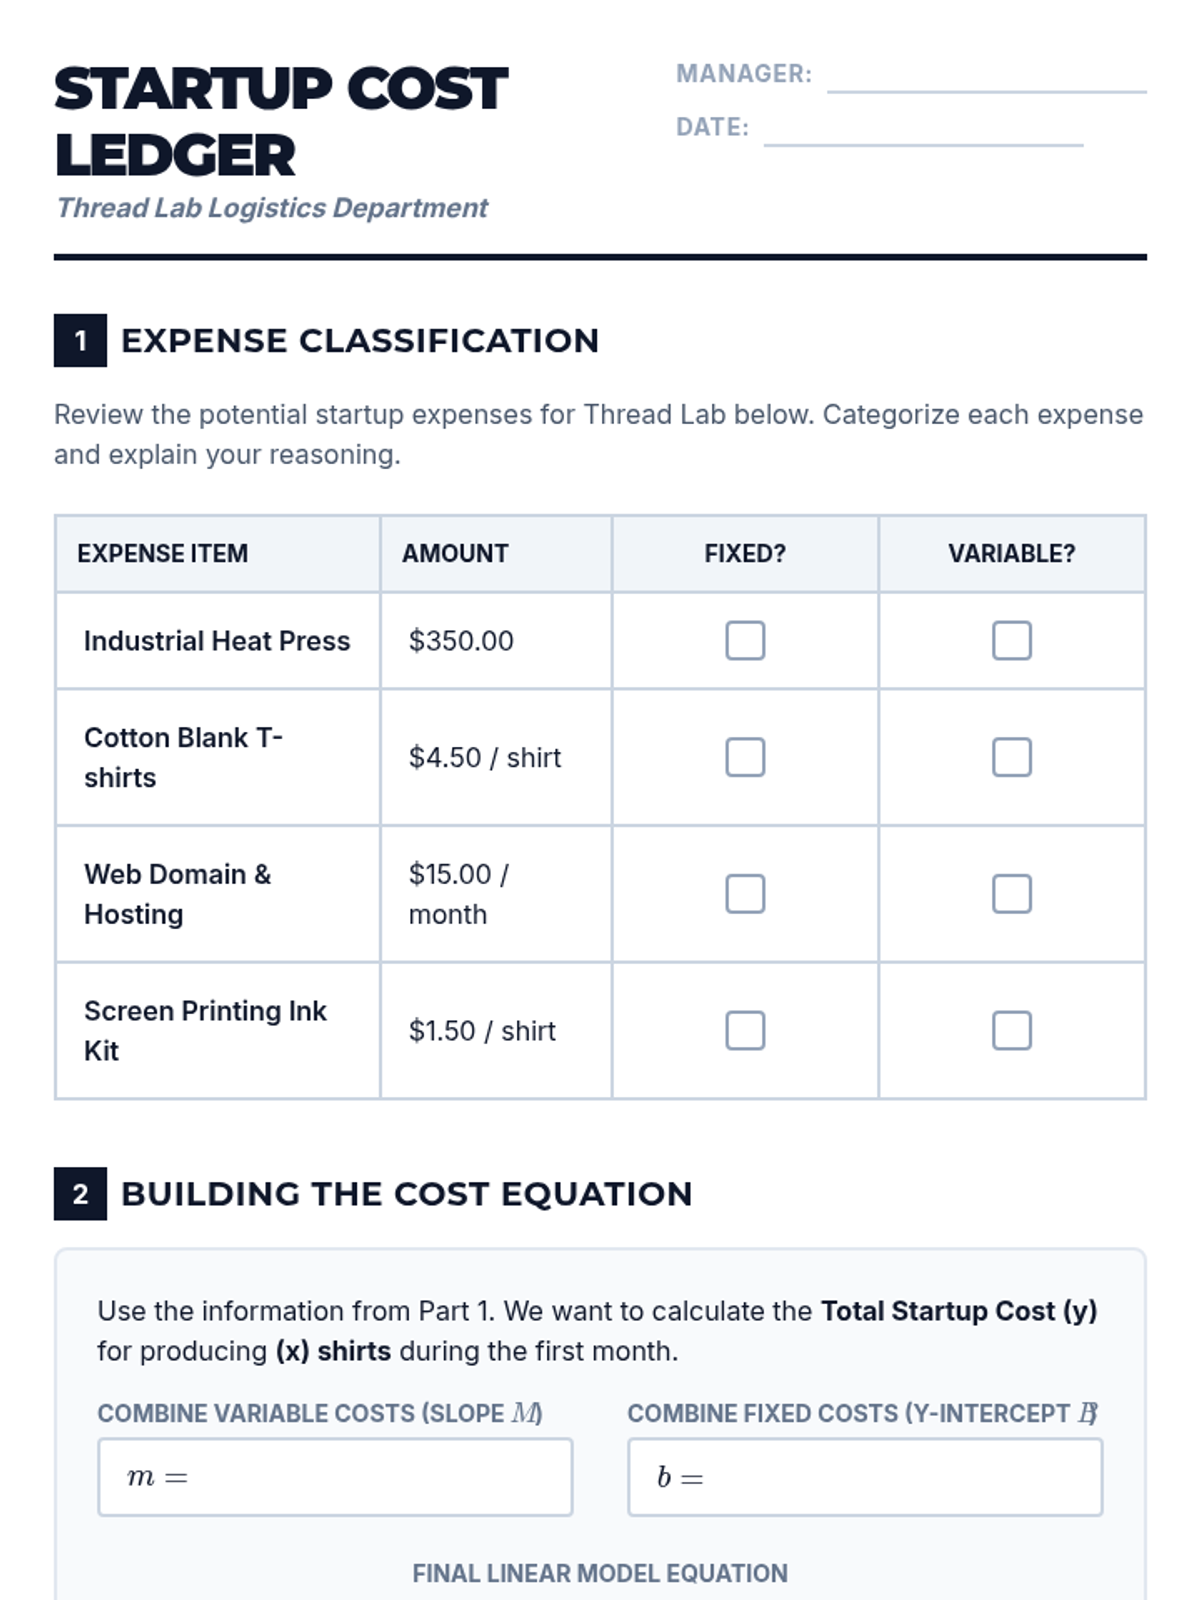
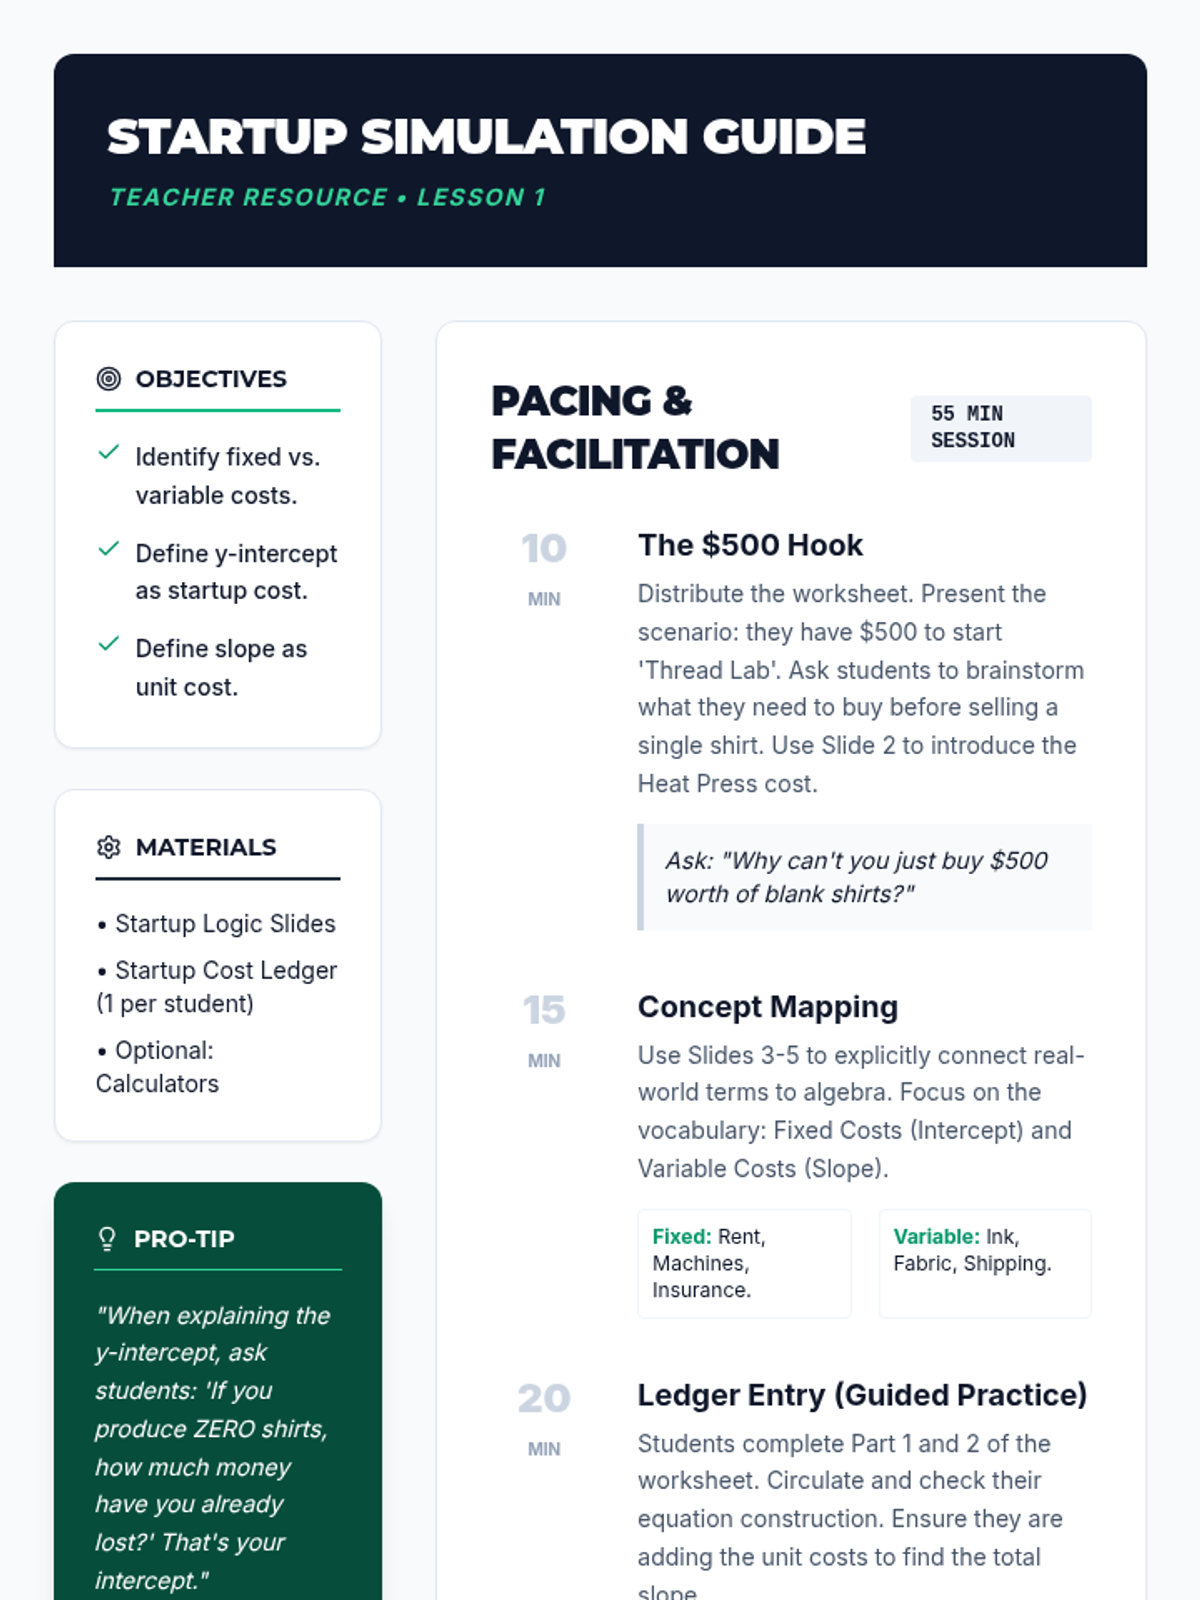
A 5-lesson sequence for 8th Grade students that teaches linear modeling through the lens of business management. Students use slope and y-intercept to represent variable and fixed costs, identify break-even points, and make strategic financial decisions based on data analysis.
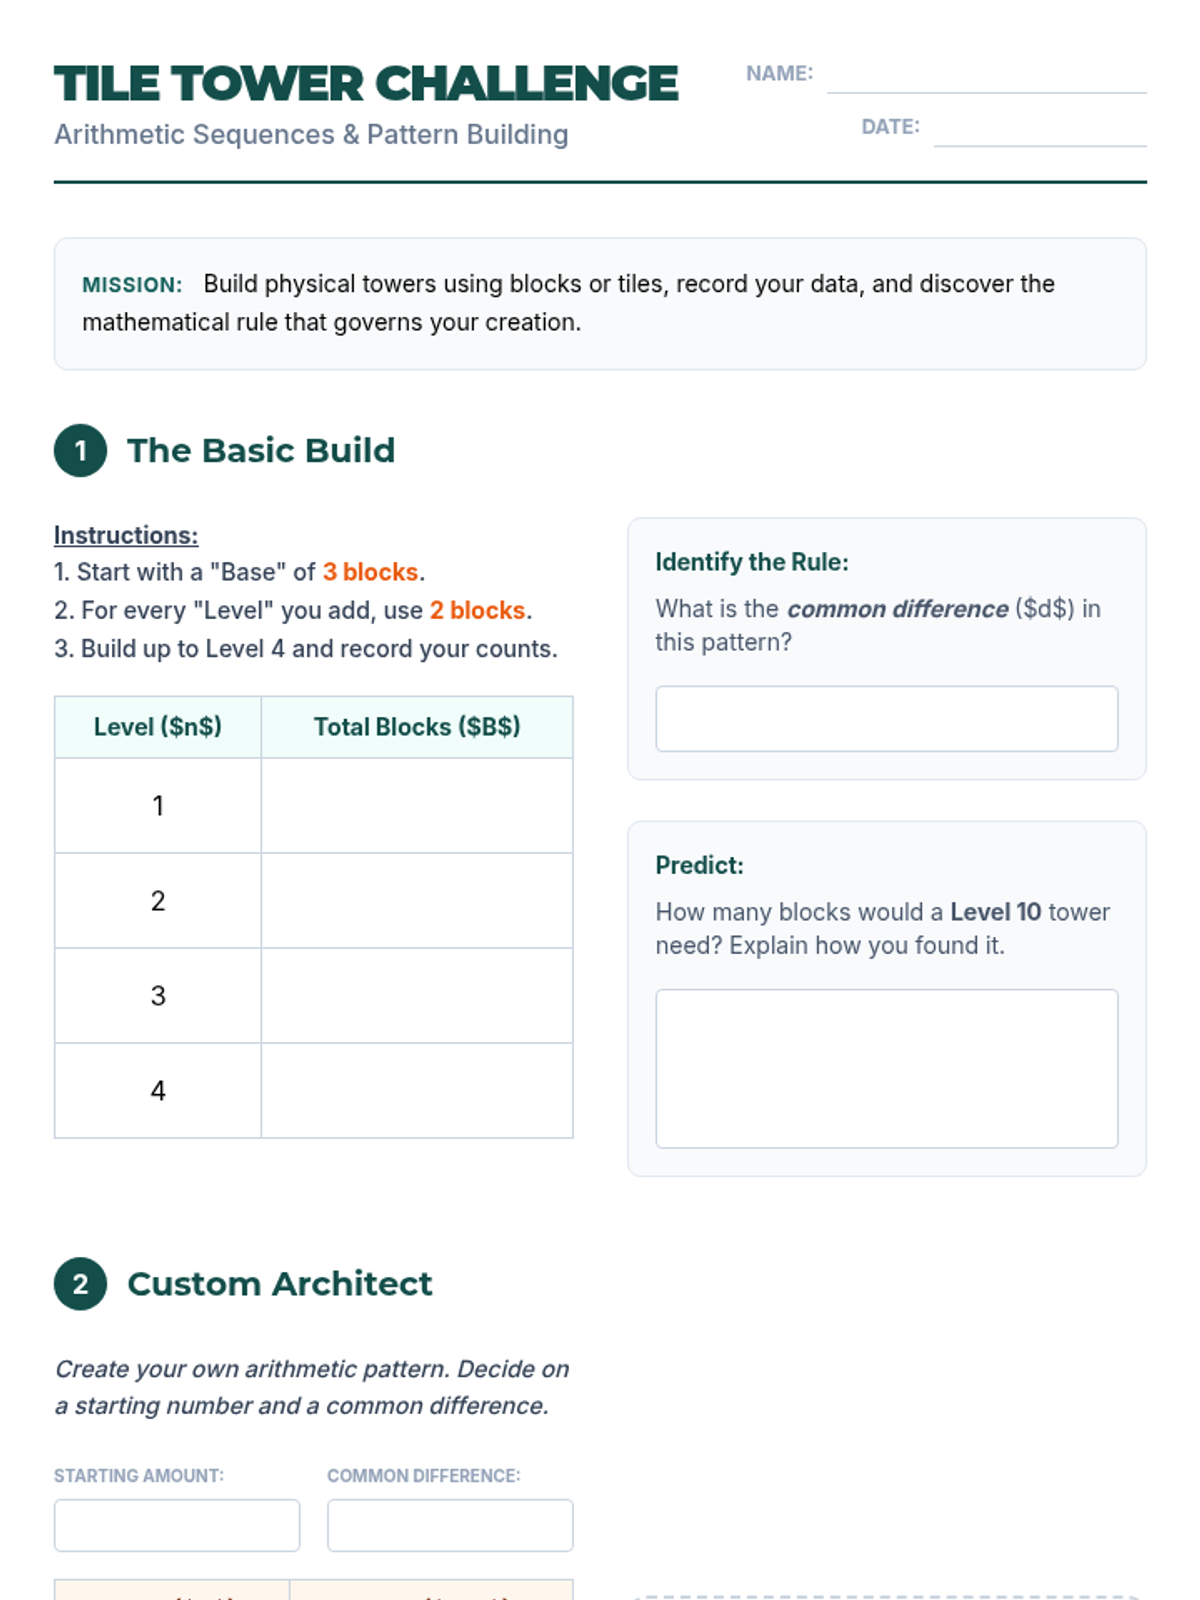
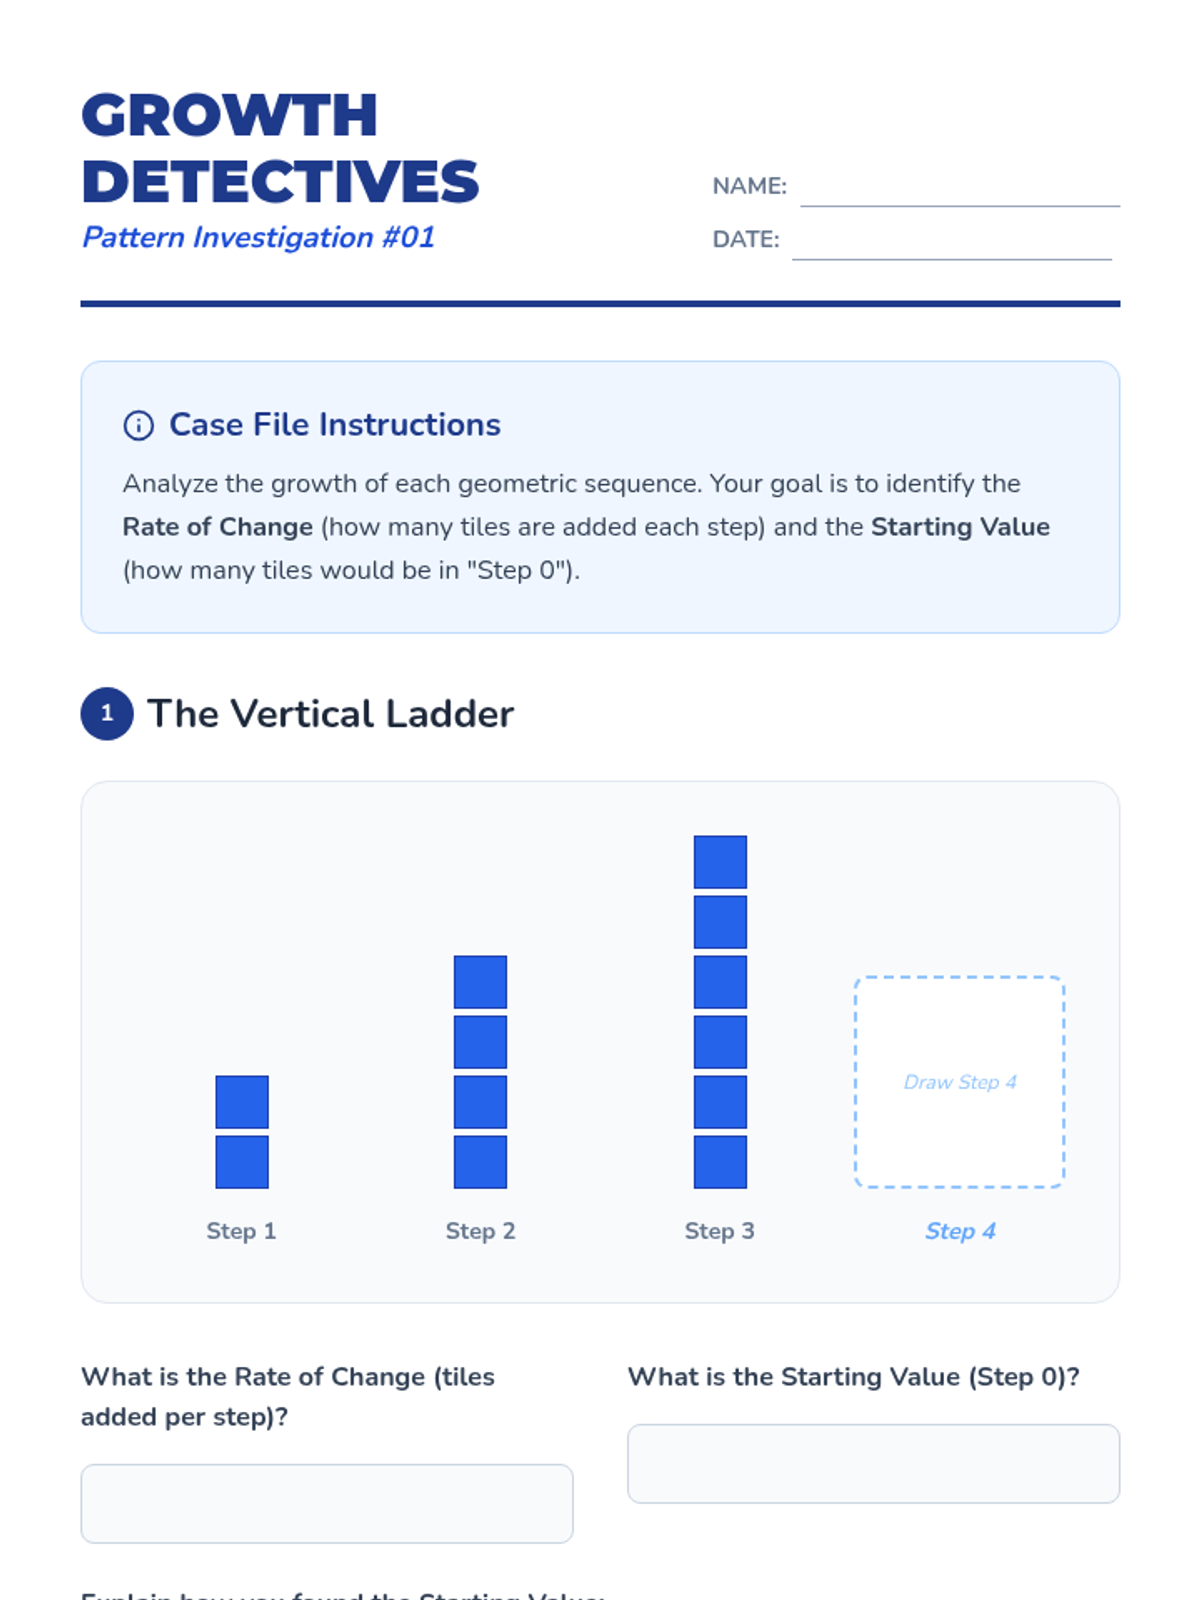
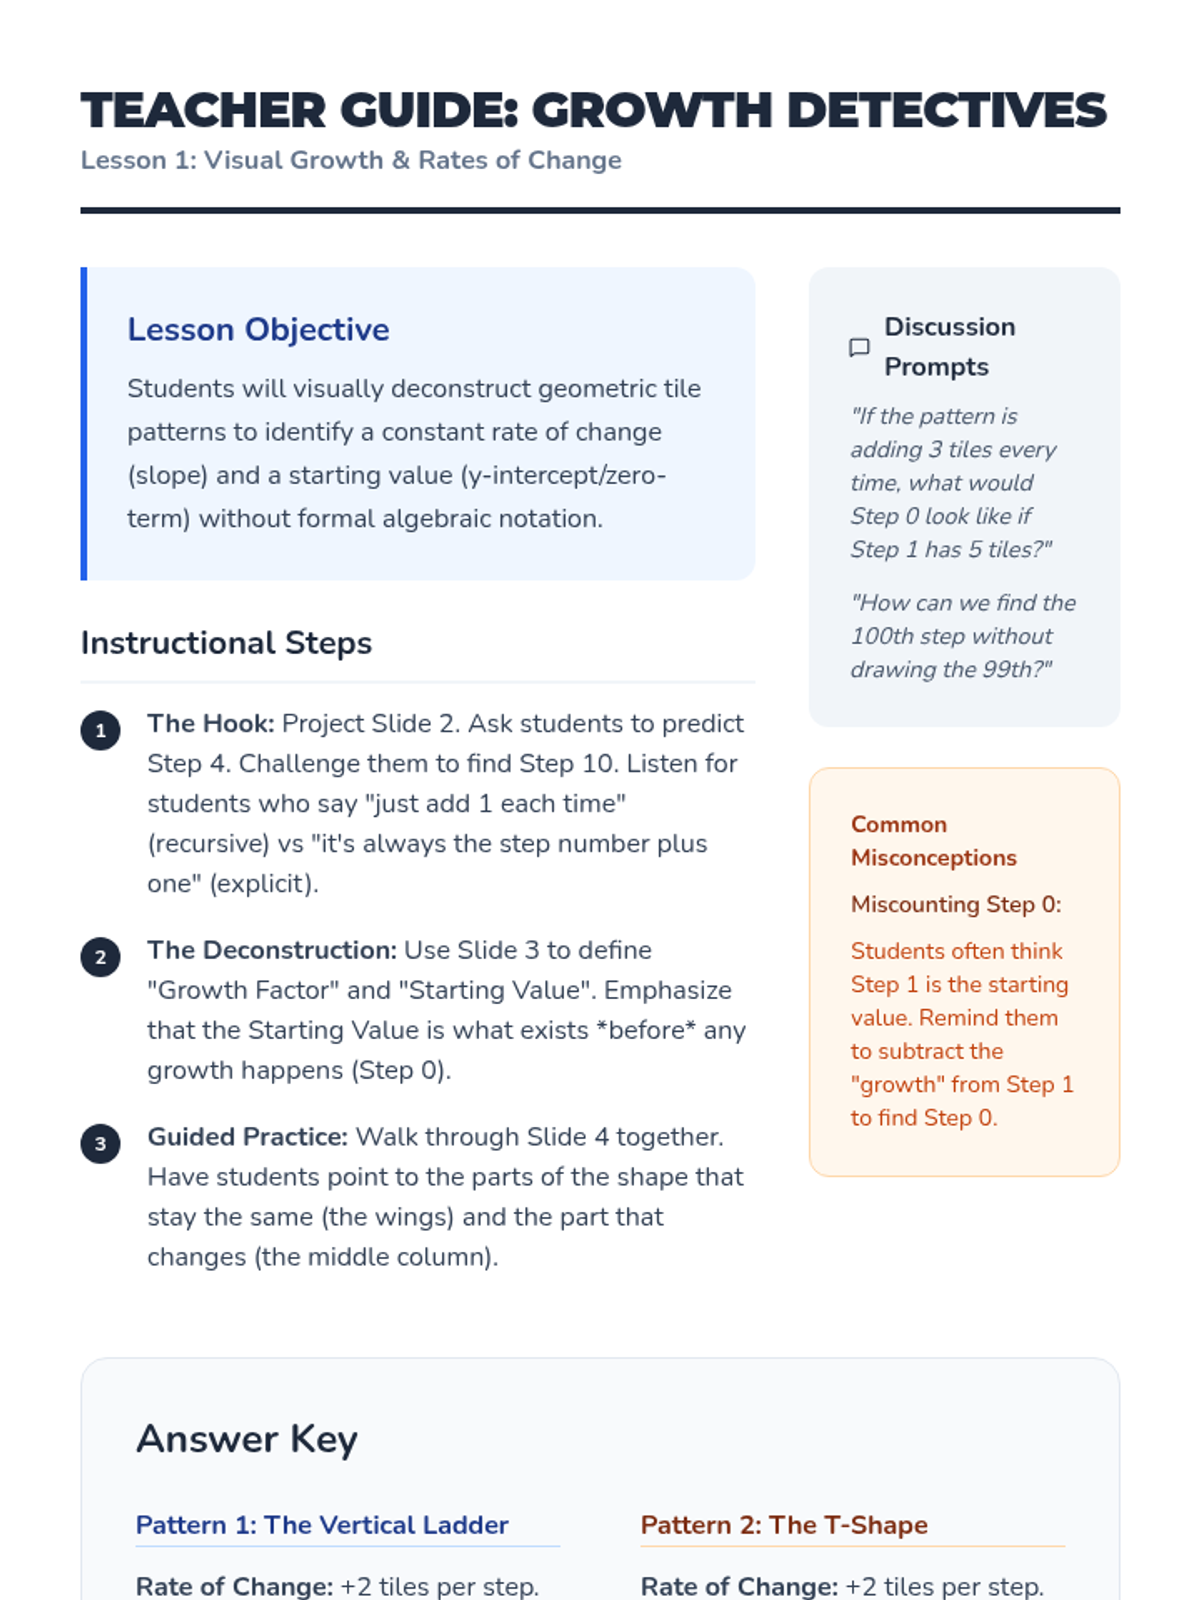
This 8th-grade sequence bridges arithmetic patterns and linear functions. Students analyze geometric tile patterns, organize data into tables, derive explicit algebraic equations (y = mx + b), and graph relationships to predict future behavior.
A comprehensive 8th-grade unit focused on constructing, interpreting, and applying linear function models to real-world scenarios. Students move from identifying variables to building complex mathematical models for prediction and comparison.
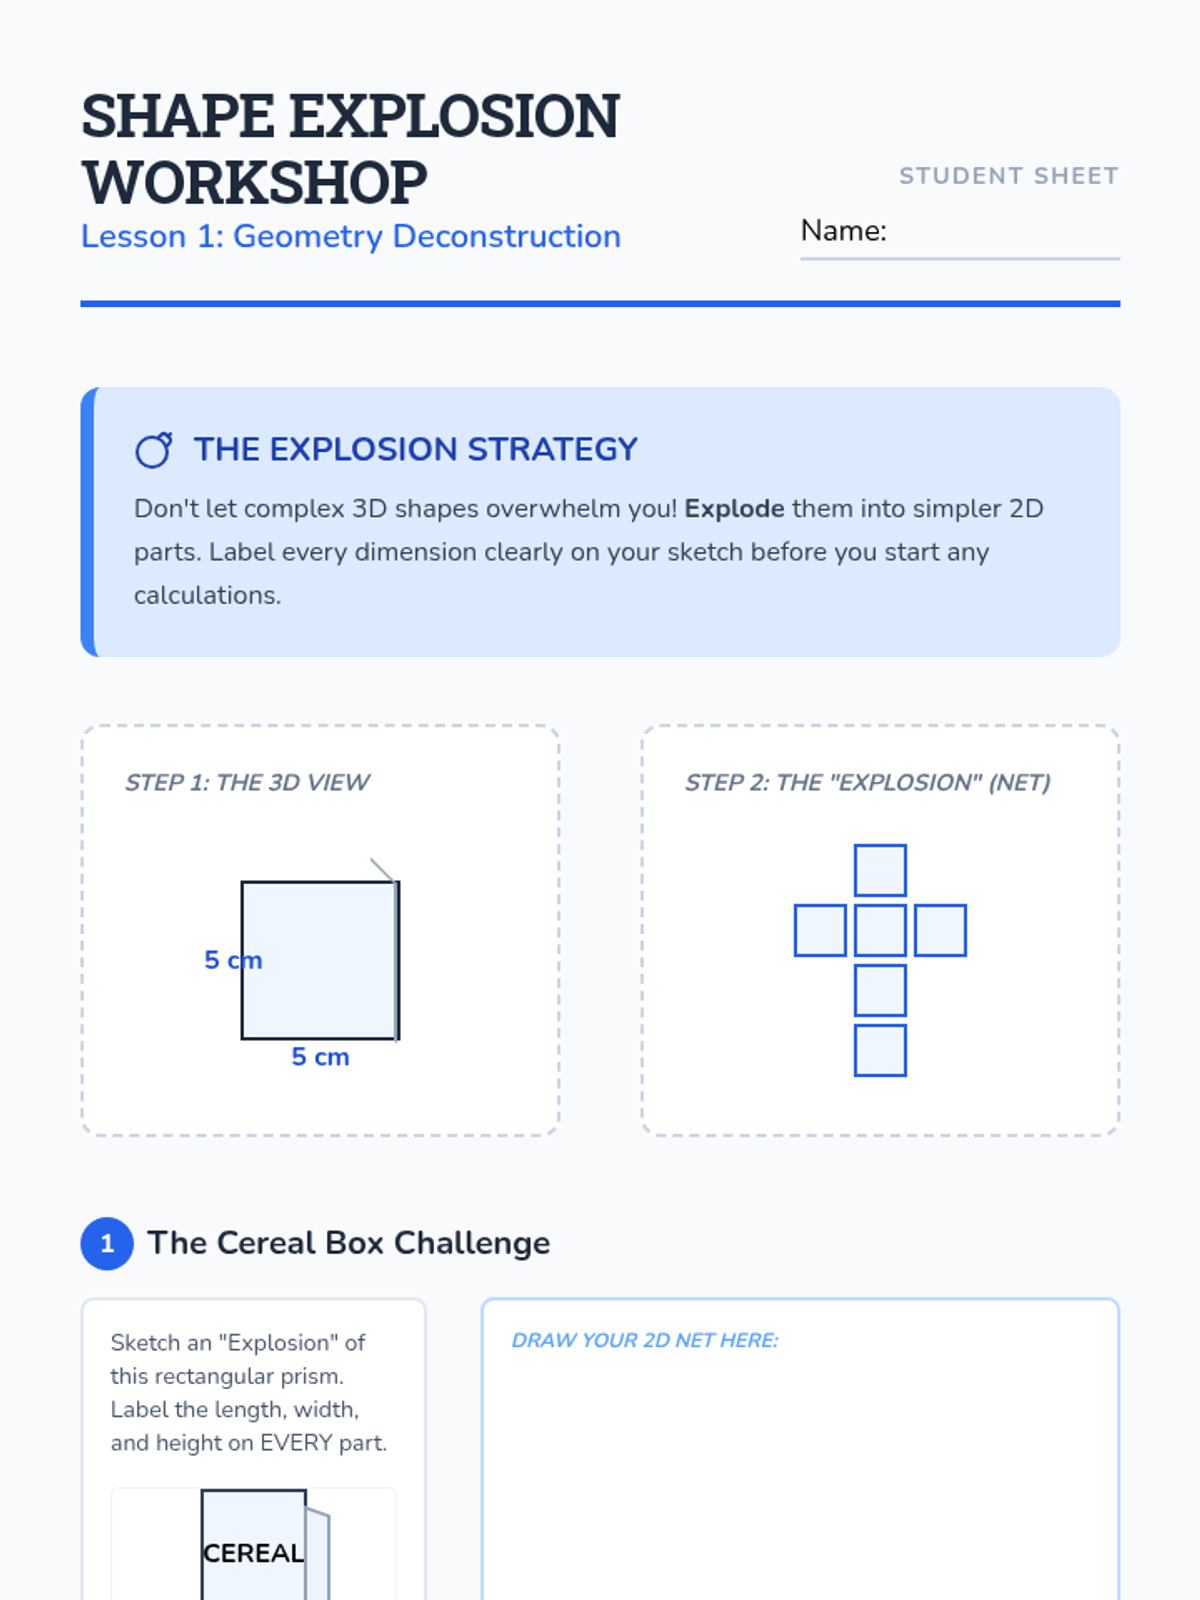
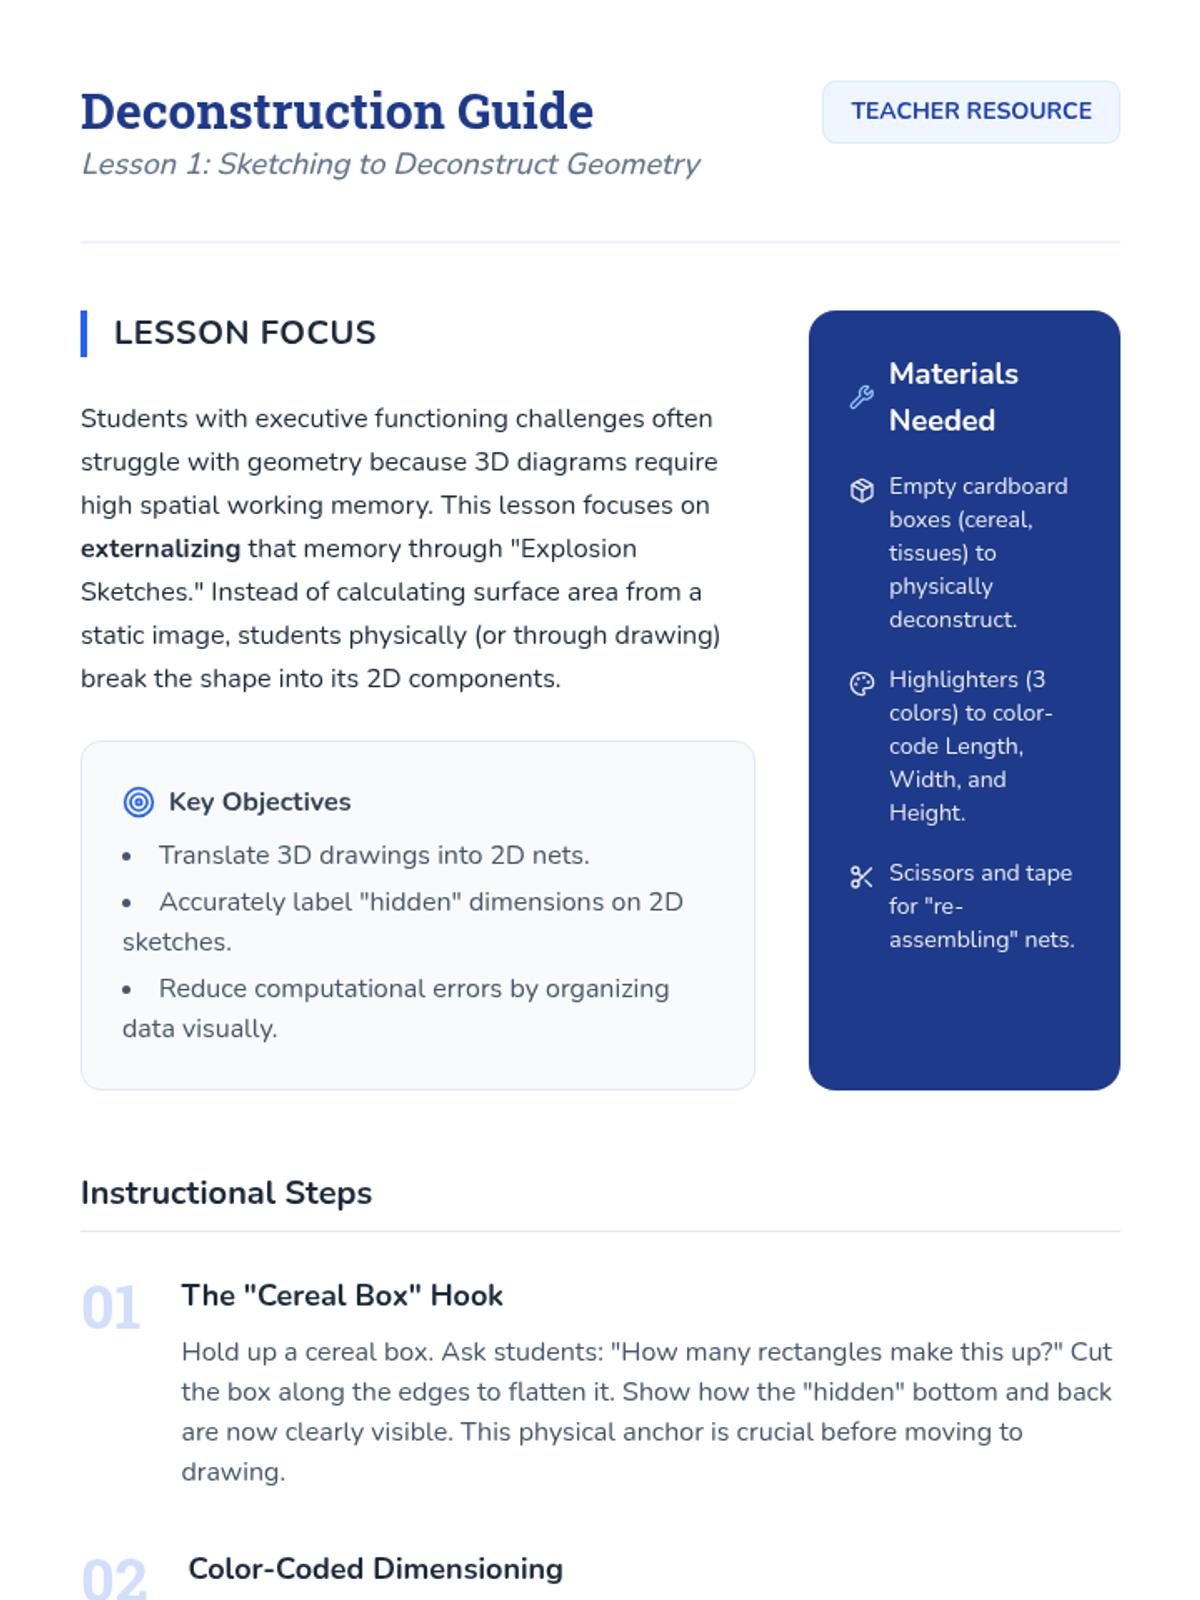
This 8th-grade sequence focuses on visual strategies to deconstruct geometry and systems of equations, helping students manage cognitive load through sketching, color-coding, and decomposition of complex problems.
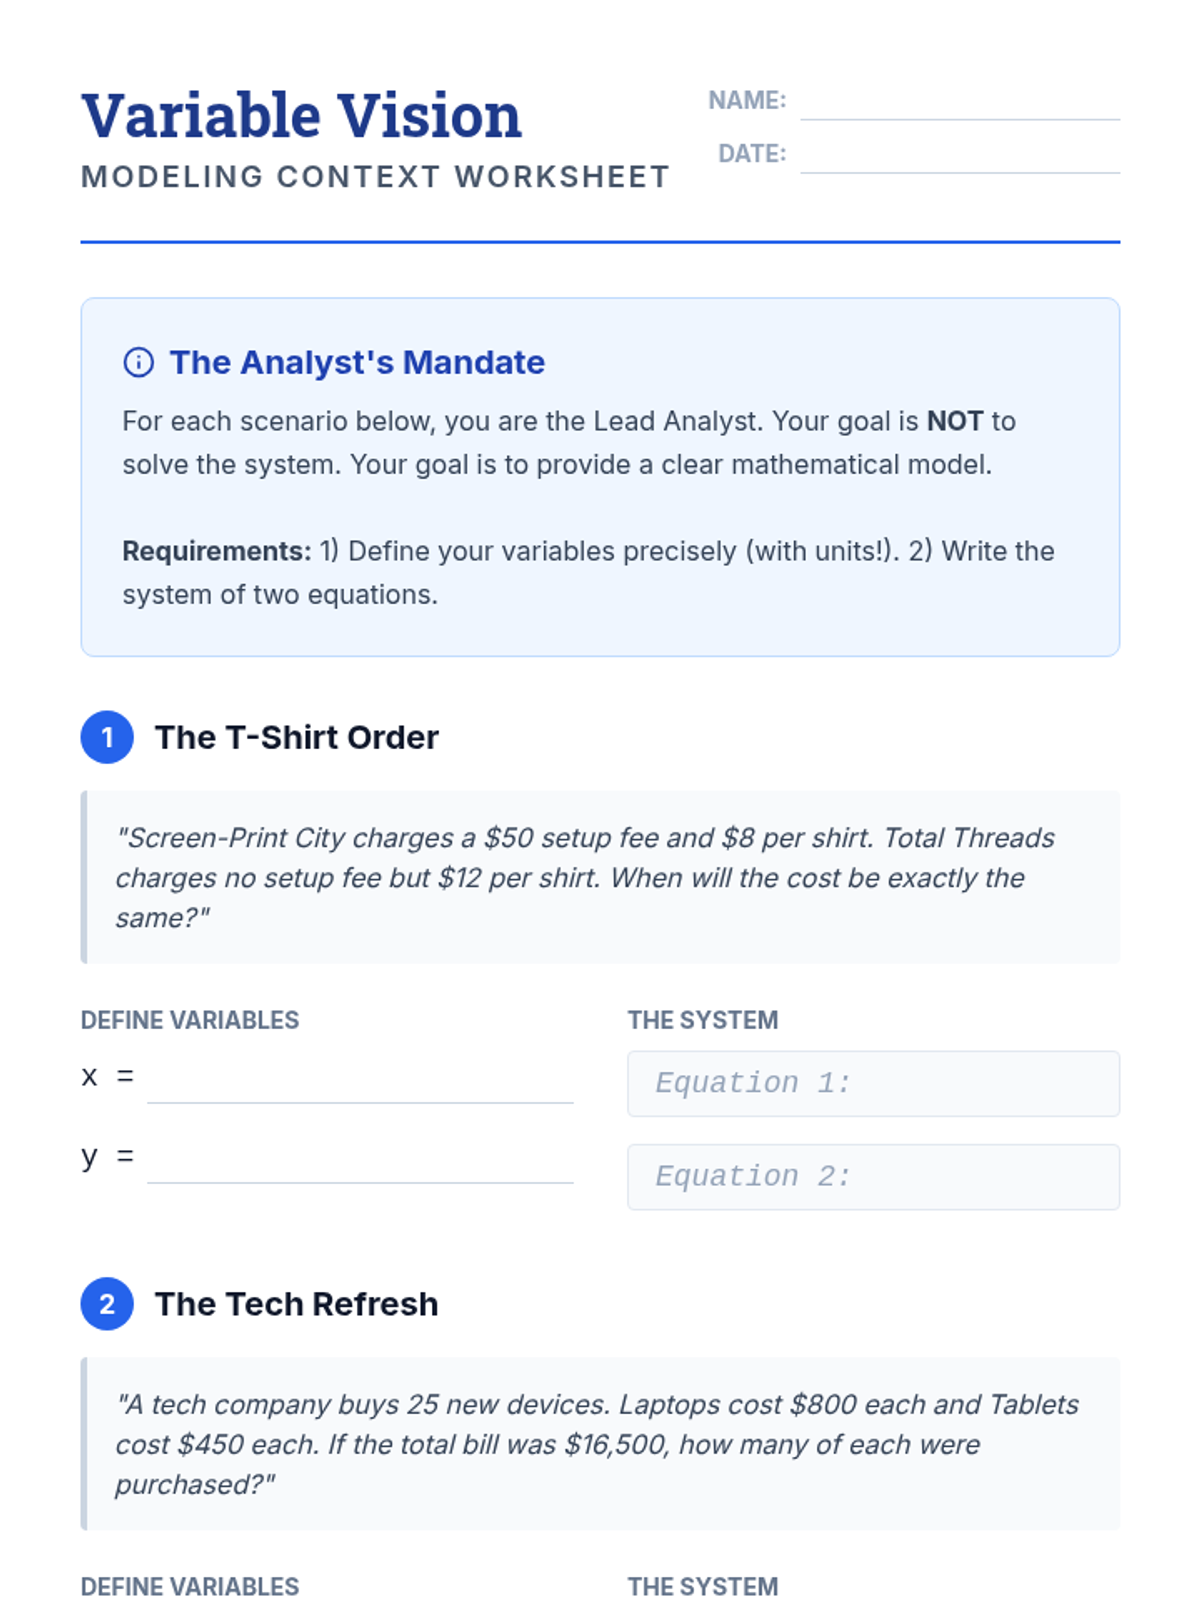
An 8th-grade Algebra sequence focusing on translating real-world scenarios into systems of linear equations. Students act as business analysts to solve break-even, mixture, and motion problems, culminating in a business comparison project.
An inquiry-based exploration of systems of equations using graphing and visual inspection. Students progress from comparing tables to graphing lines and identifying special cases like parallel and coinciding lines.