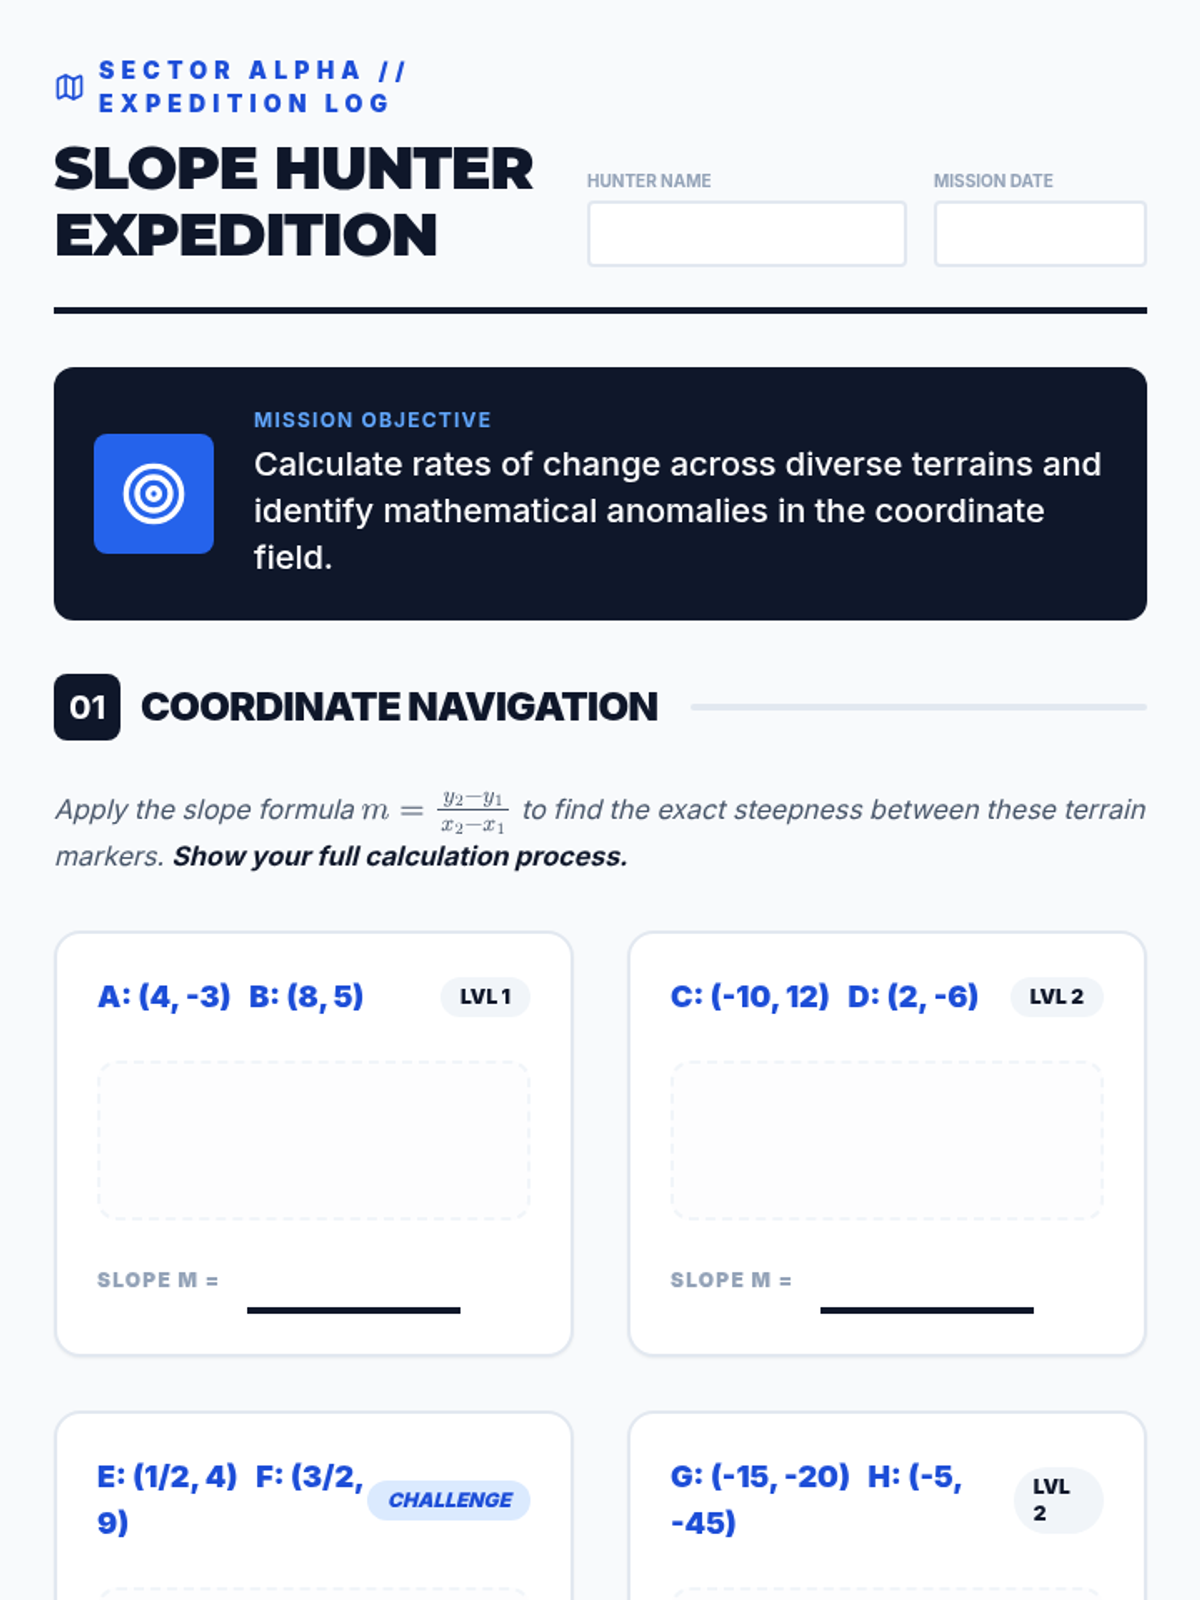
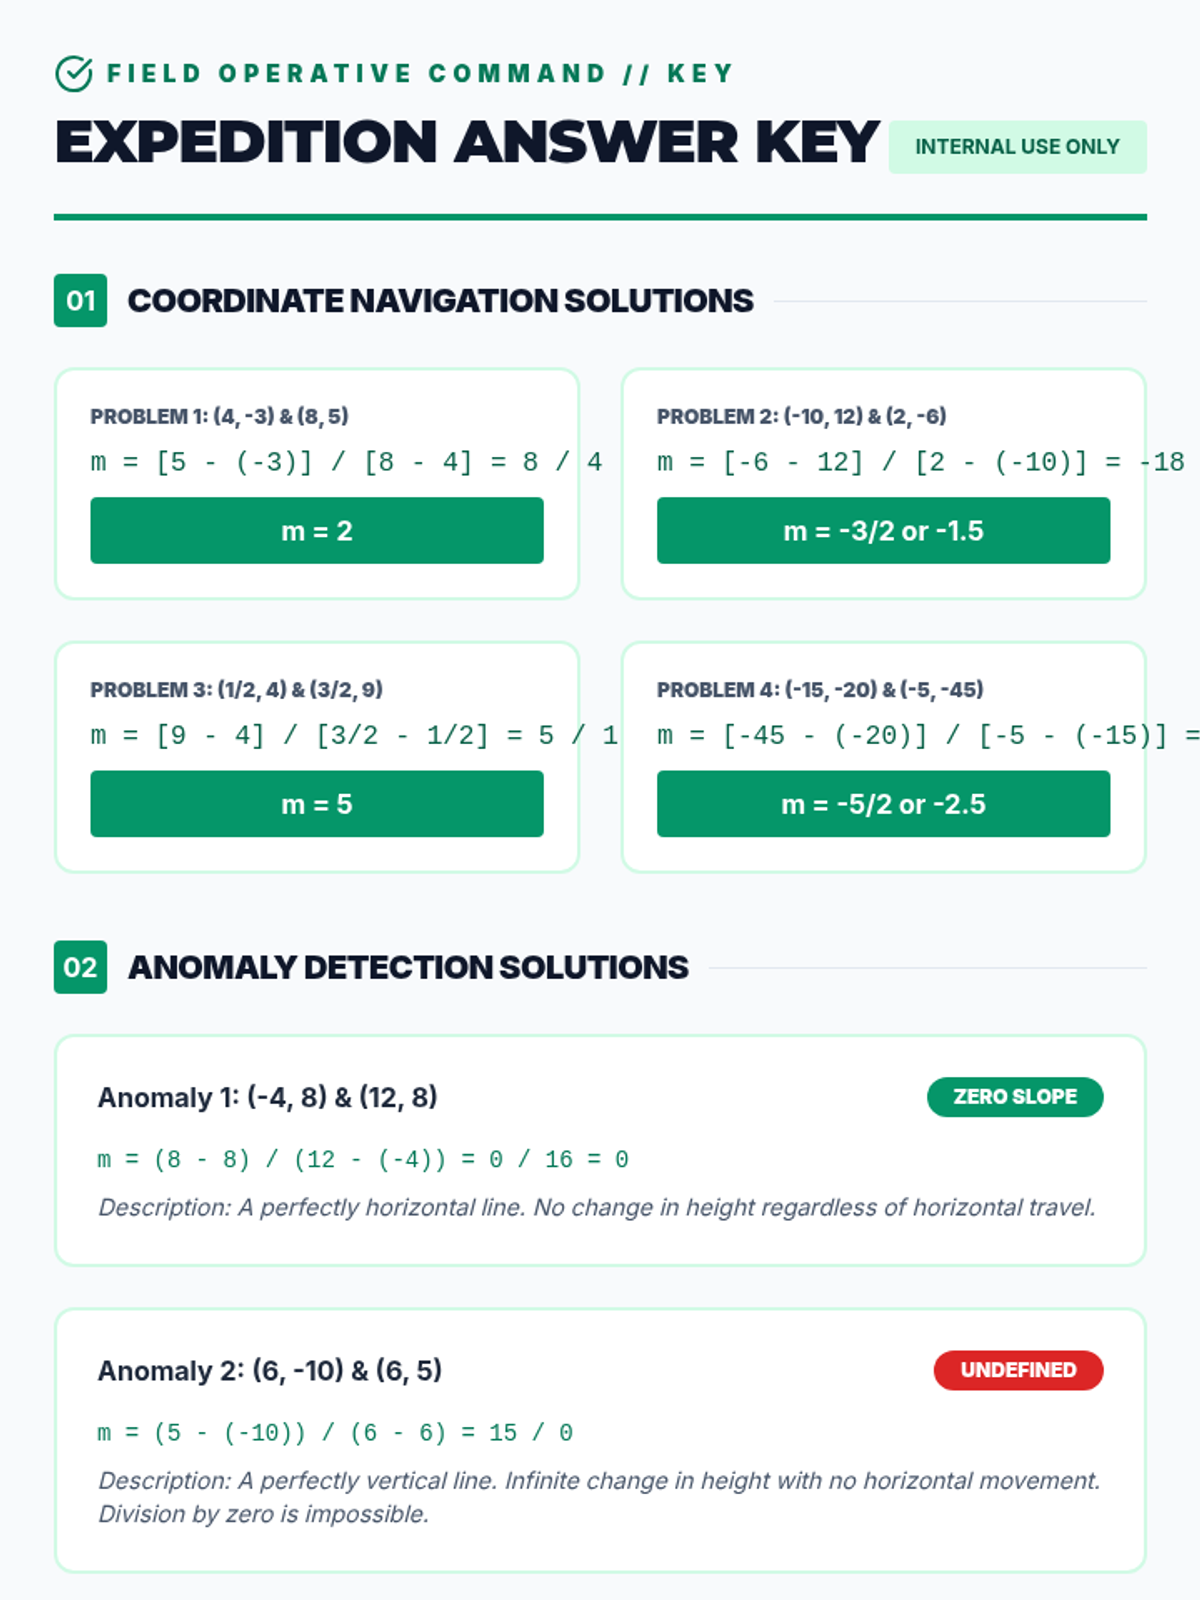
Students apply their knowledge of slope to design a roller coaster. They calculate the steepness of various drops and climbs, representing their findings through a technical blueprint and a visual infographic.
A hands-on project where students apply right triangle trigonometry to design a piece of modern architecture or geometric art, culminating in a detailed calculation poster.
A hands-on geometry project where students apply similarity criteria (AA, SSS, SAS) to measure unreachable heights using shadow casting and mirror reflections. Students will perform outdoor measurements, calculate scale factors, and provide formal geometric proofs for their methods.
A project-based lesson where students design an infographic poster demonstrating their mastery of triangle similarity criteria and real-world proportional reasoning.
A creative art-based project where students apply circle geometry concepts—arc length, sector area, and inscribed angles—to design and calculate a geometric masterpiece.
A math project where students analyze Olympic athlete performance and track difficulty using unit rates and slope concepts to determine who is the fastest and which courses are the steepest.
Students apply linear function concepts to model a real-world income and expense scenario. They will calculate rates of change, identify initial values, and visualize their budget through graphing.
A real-world project exploring linear functions through cell phone plans and career earnings. Students analyze slope as a rate of change and the y-intercept as a starting value.
A project-based lesson where students apply concepts of similarity, scale factor, and proportions to create a scale drawing or 3D model of a real-world object. Students move from mathematical practice to creative application.
A hands-on geometry project where students apply the properties of similar triangles to calculate the height of tall, unmeasurable objects using their shadows.
A real-world project-based learning unit where students apply the Pythagorean Theorem to urban planning, sports field design, and GPS navigation. Students act as urban developers and navigators to solve practical distance problems.
A comprehensive 90-minute lesson where students become 'Data Detectives' to investigate how outliers influence measures of center and variability, culminating in a collaborative poster session.
A comprehensive unit review and summative assessment covering three key methods for solving quadratic equations: graphing, factoring, and the quadratic formula. Students practice identifying key features of parabolas, algebraic manipulation for factoring, and the step-by-step application of the quadratic formula.
A comprehensive 90-minute lesson where students investigate data spread by calculating Mean Absolute Deviation (MAD) and Interquartile Range (IQR) through a "Stat Squad" forensic lens.
Students learn to plot bivariate data, identify trends, and spot outliers using a real-world scenario of sleep and mood.
A high-energy, amusement park-themed packet for calculating the area of a circle. Students explore the Midway and Thrill Rides while solving radius and diameter problems using visual aids and calculators.
A comprehensive guide to analyzing and graphing rational functions, covering all key features from asymptotes to holes.
An advanced look at slope as a rate of change, including calculation from coordinates and understanding special cases like zero and undefined slopes.