Data representation, distributions, and statistical variability using sampling and inference techniques. Integrates probability models, compound events, bivariate patterns, and linear models to guide data-driven decision making.
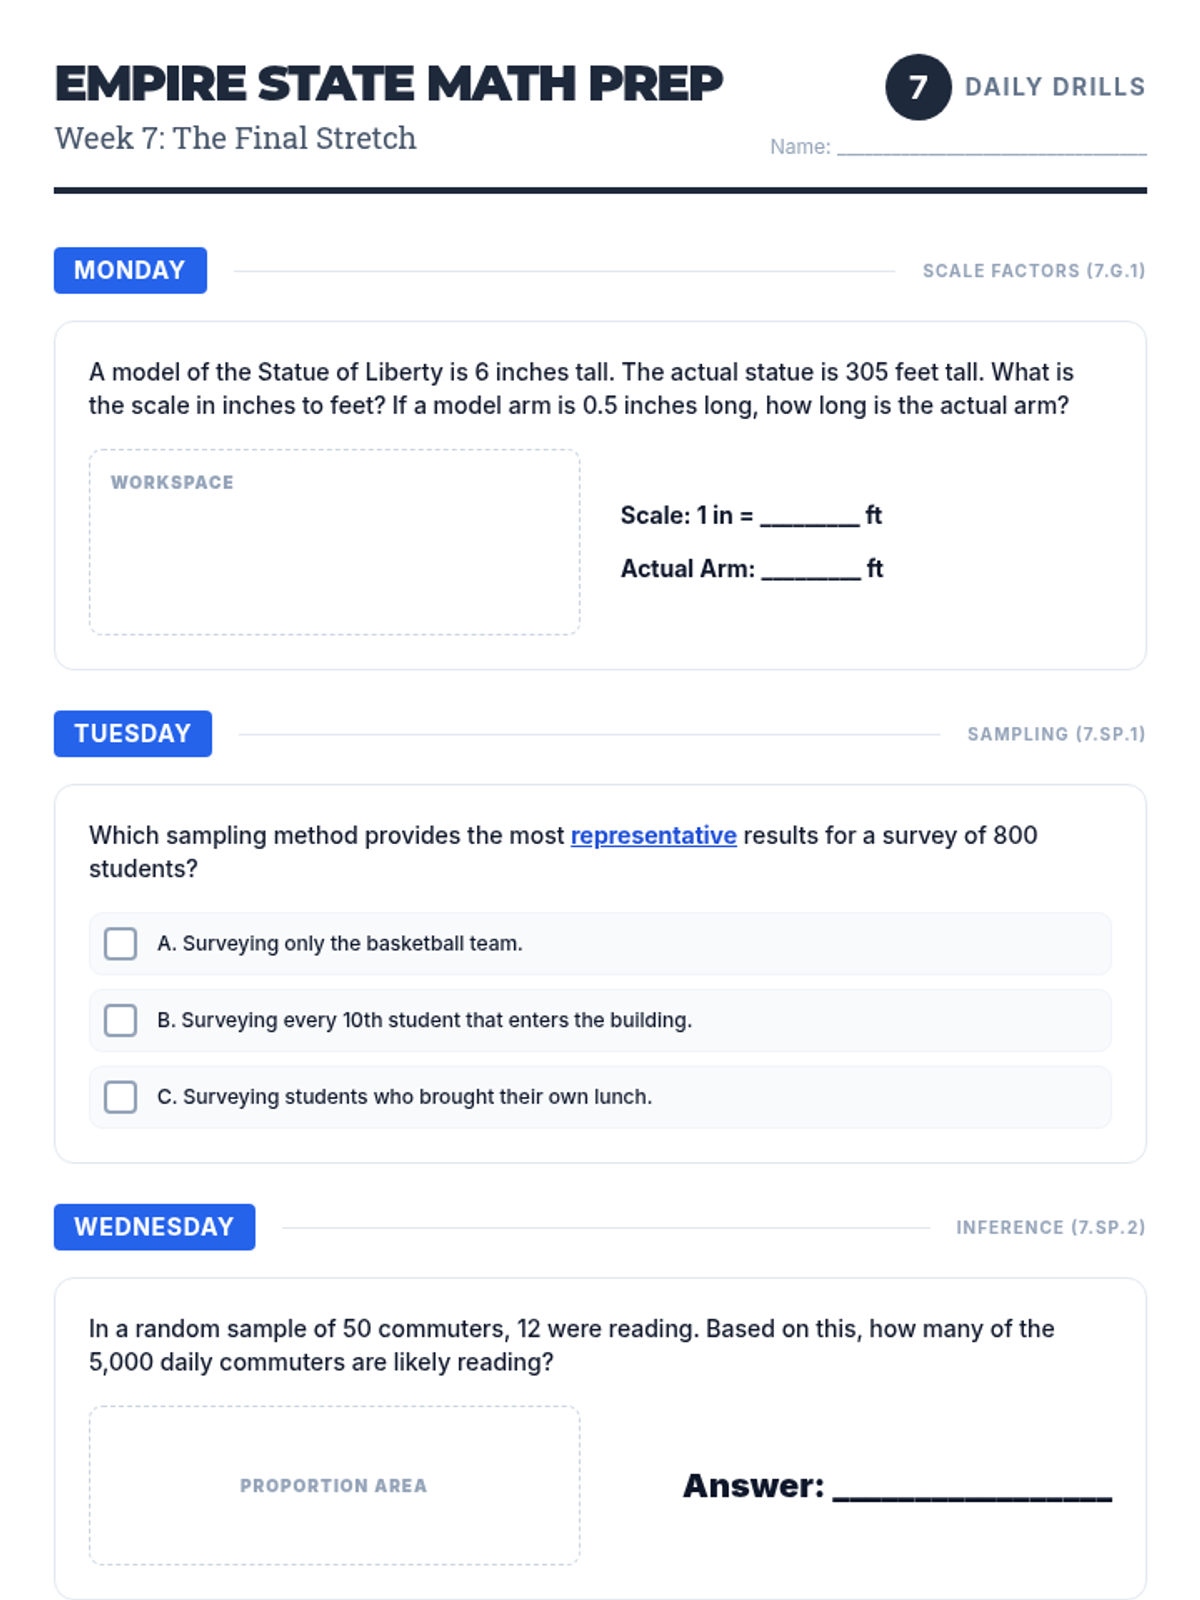
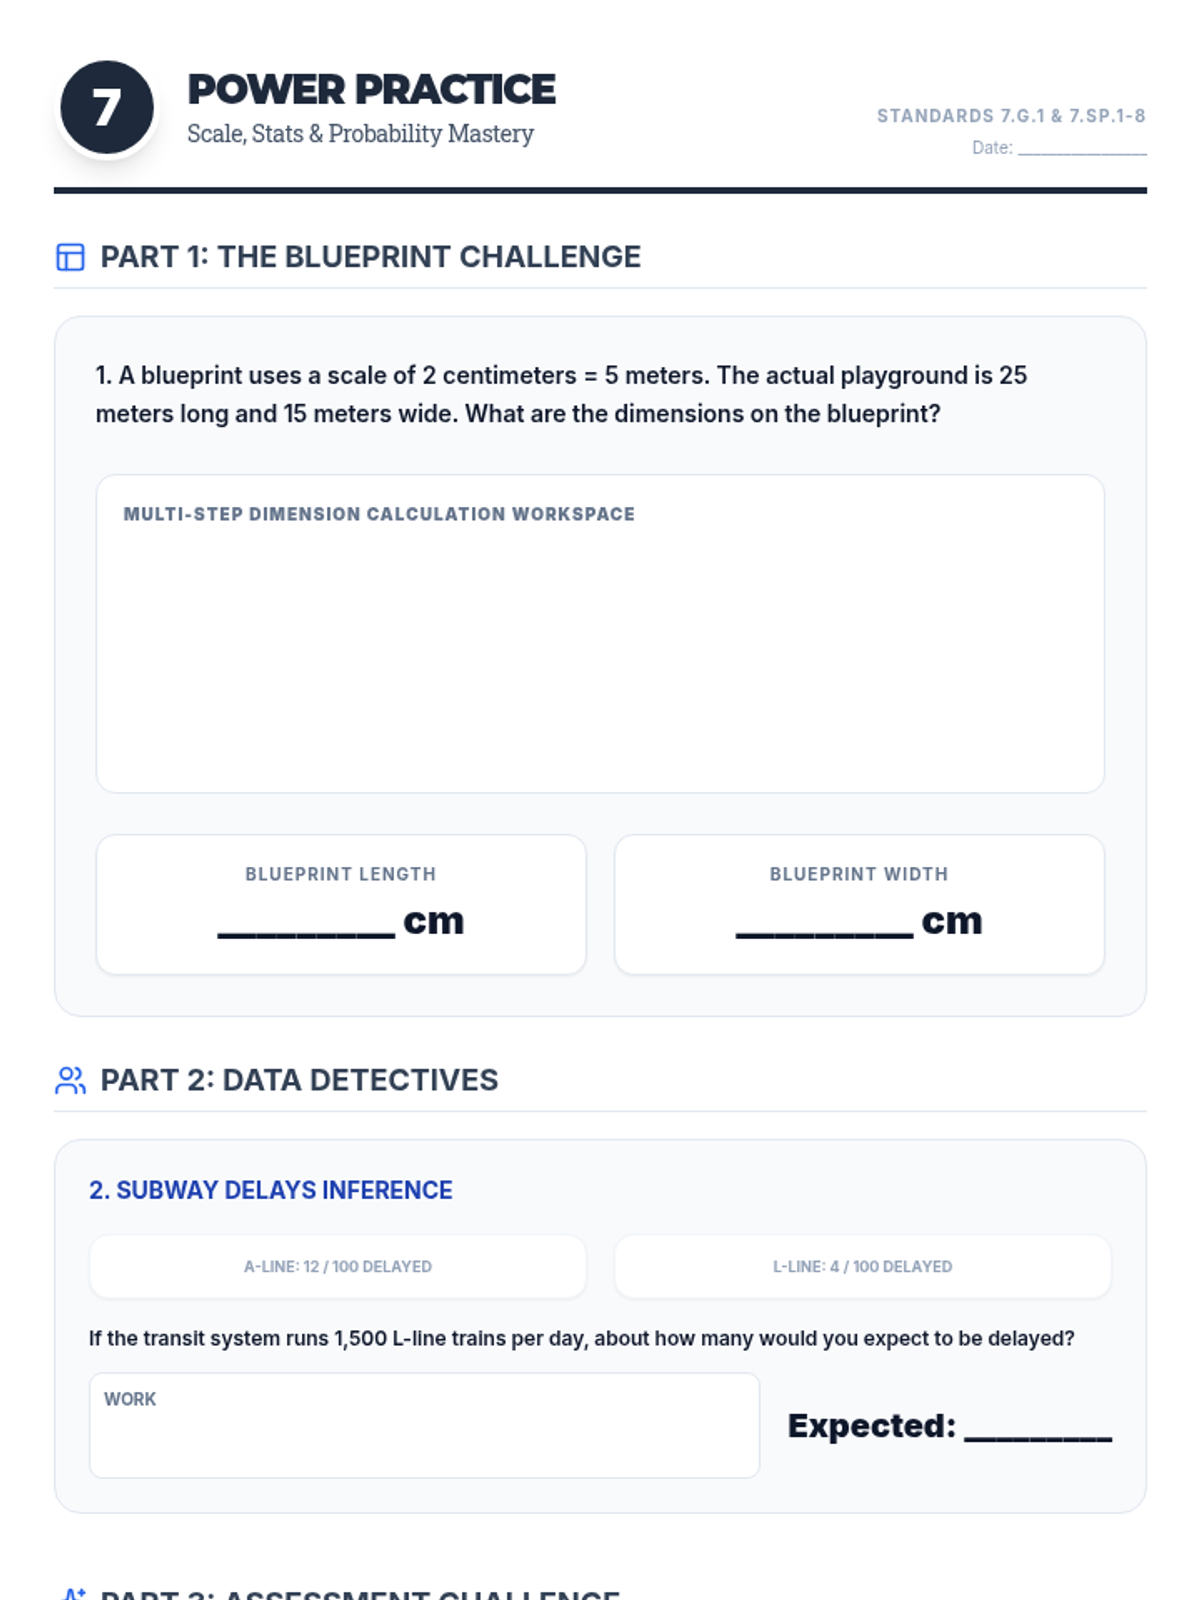
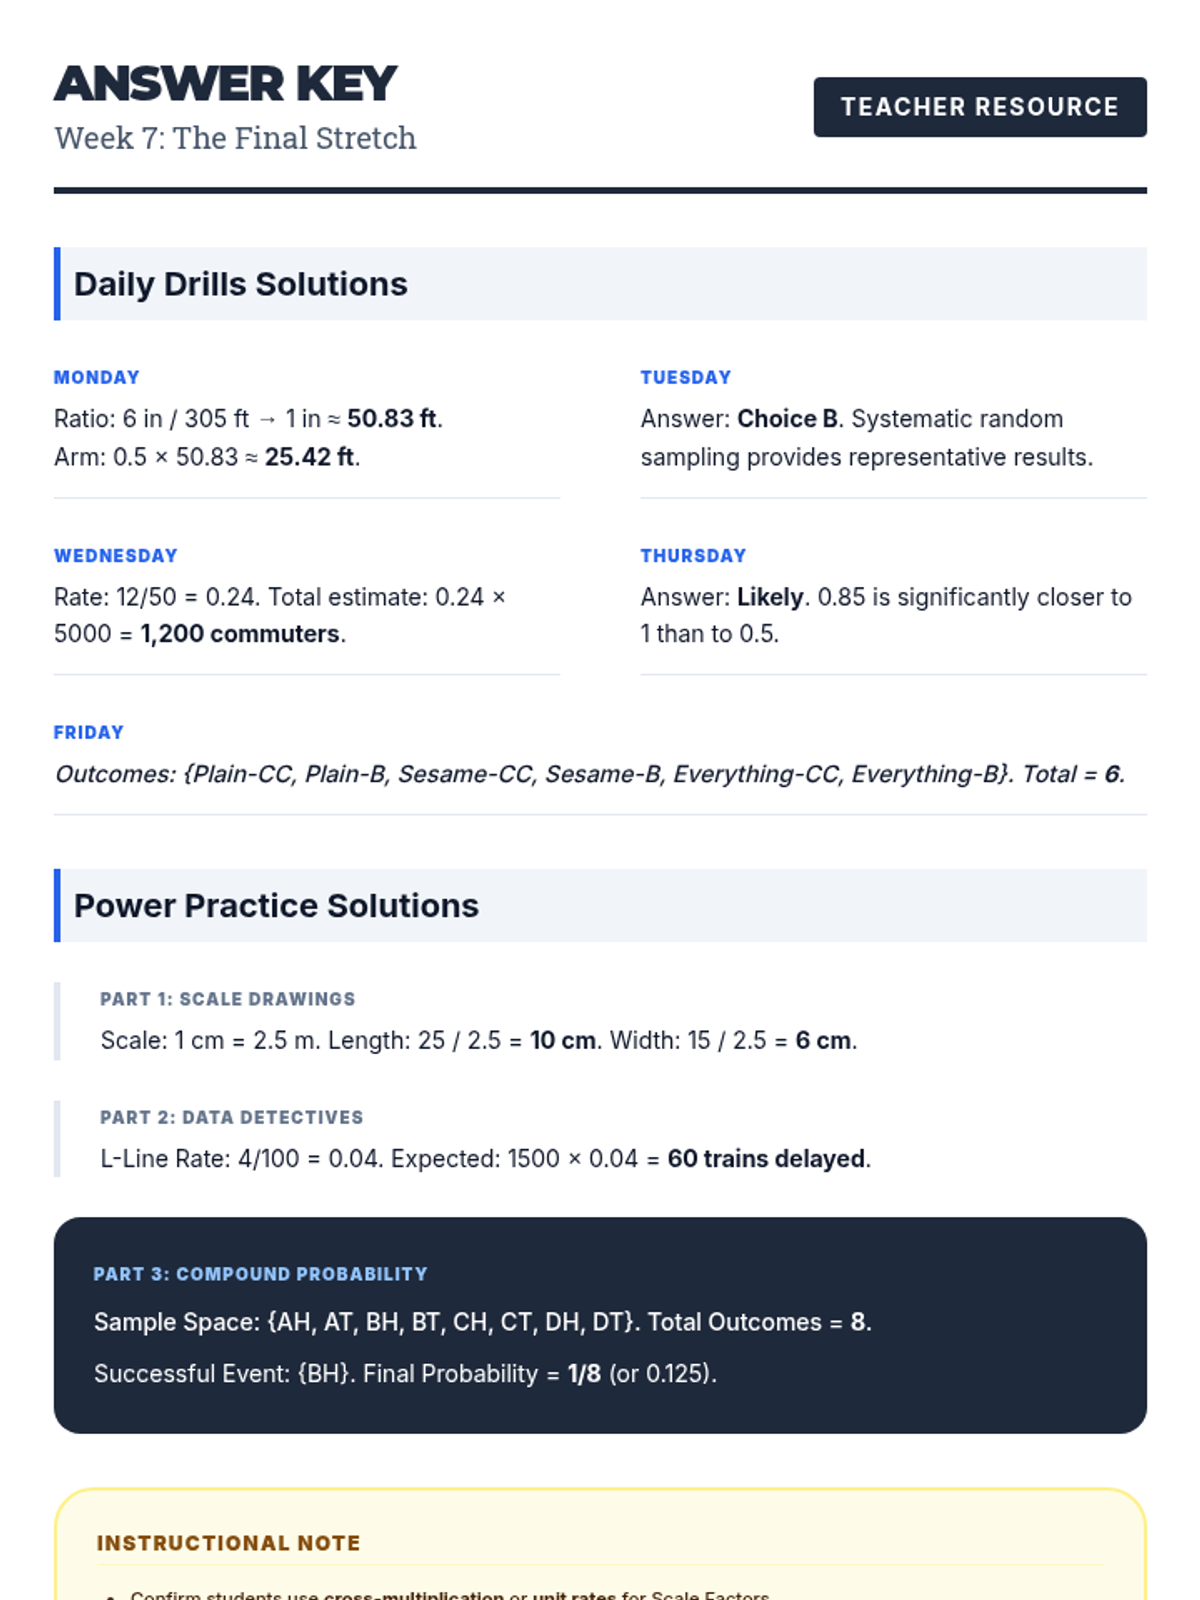
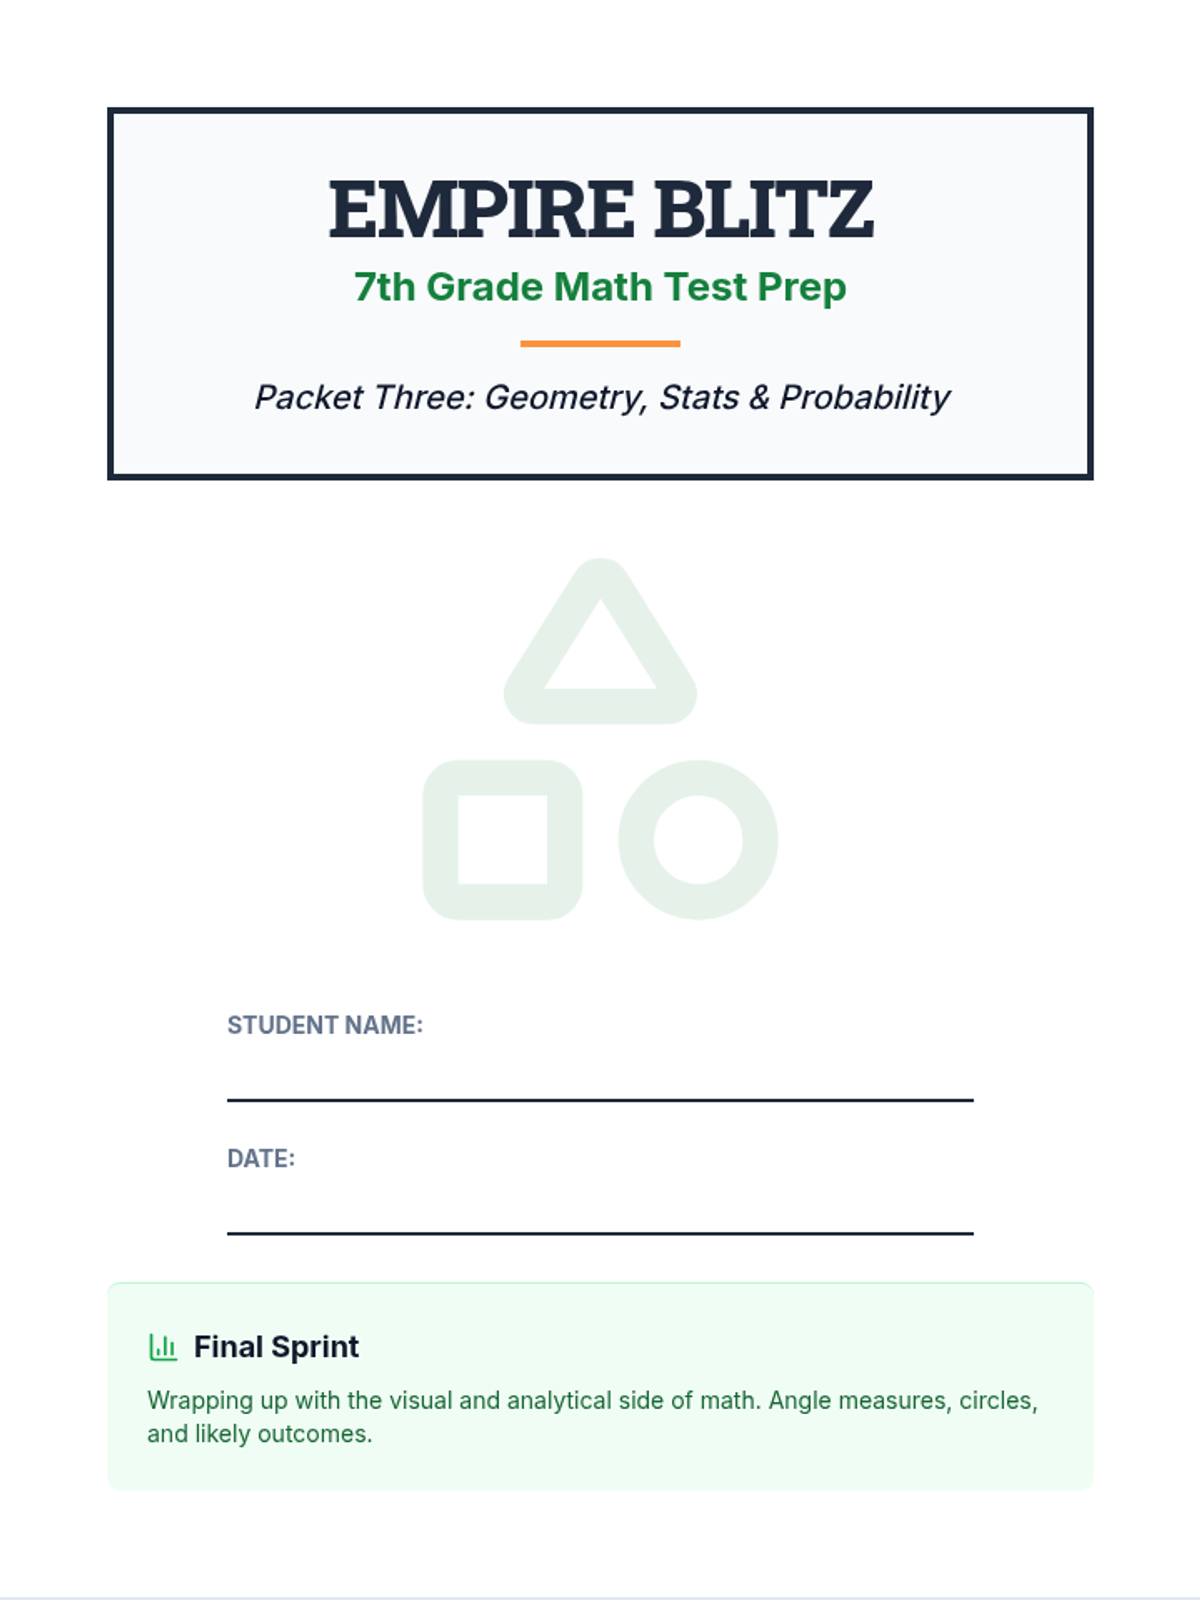
Reviewing scale drawings, statistics, and probability to round out the comprehensive NYS Assessment preparation.
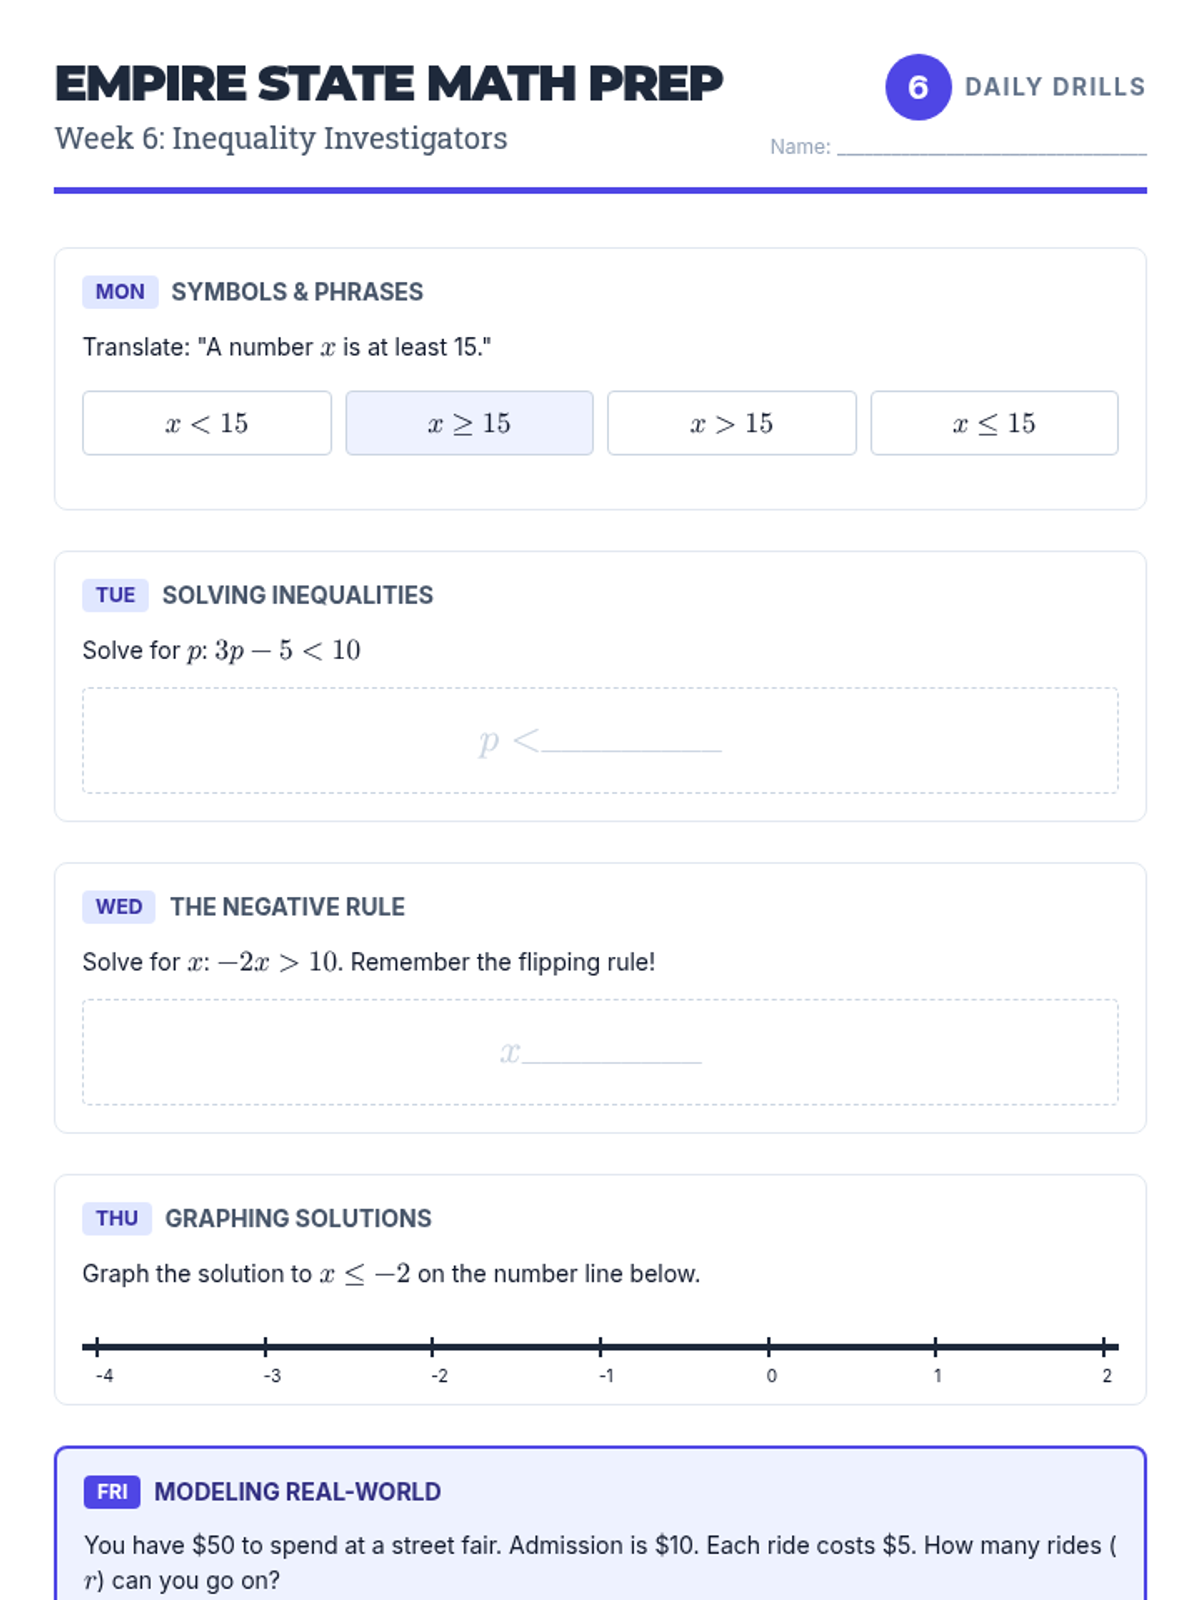
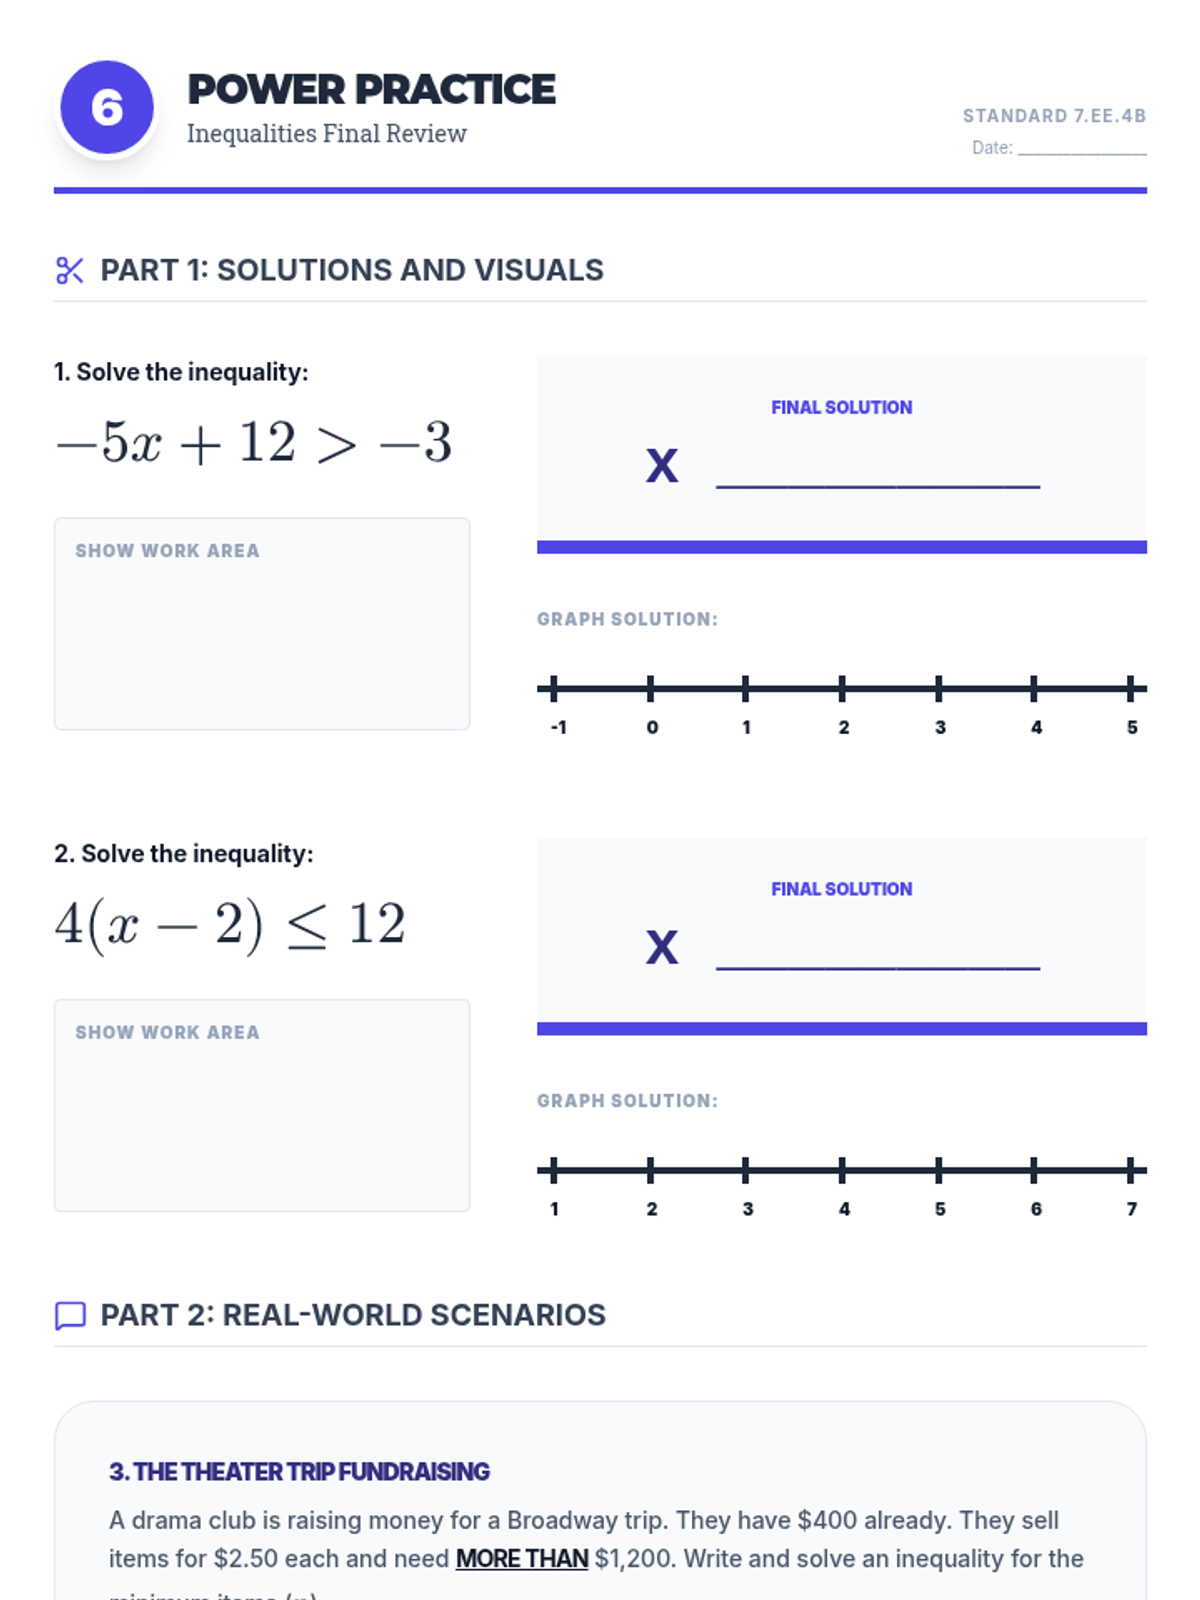
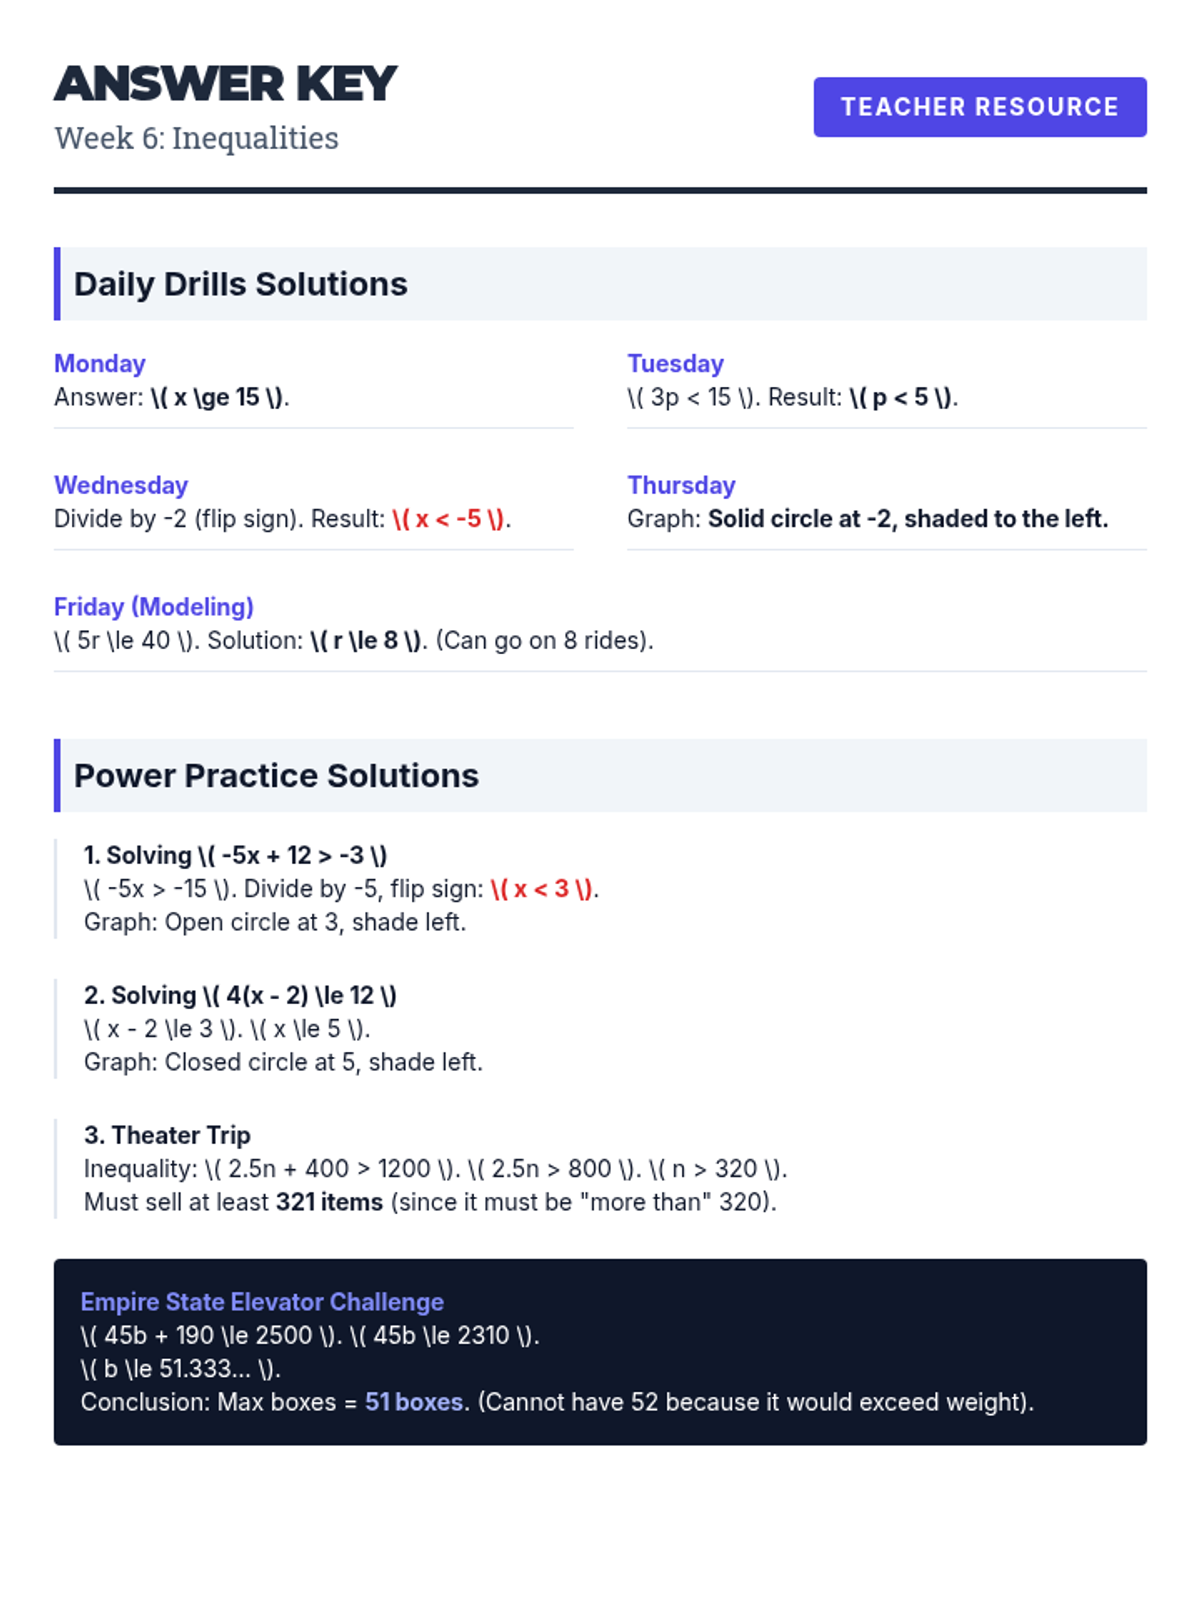
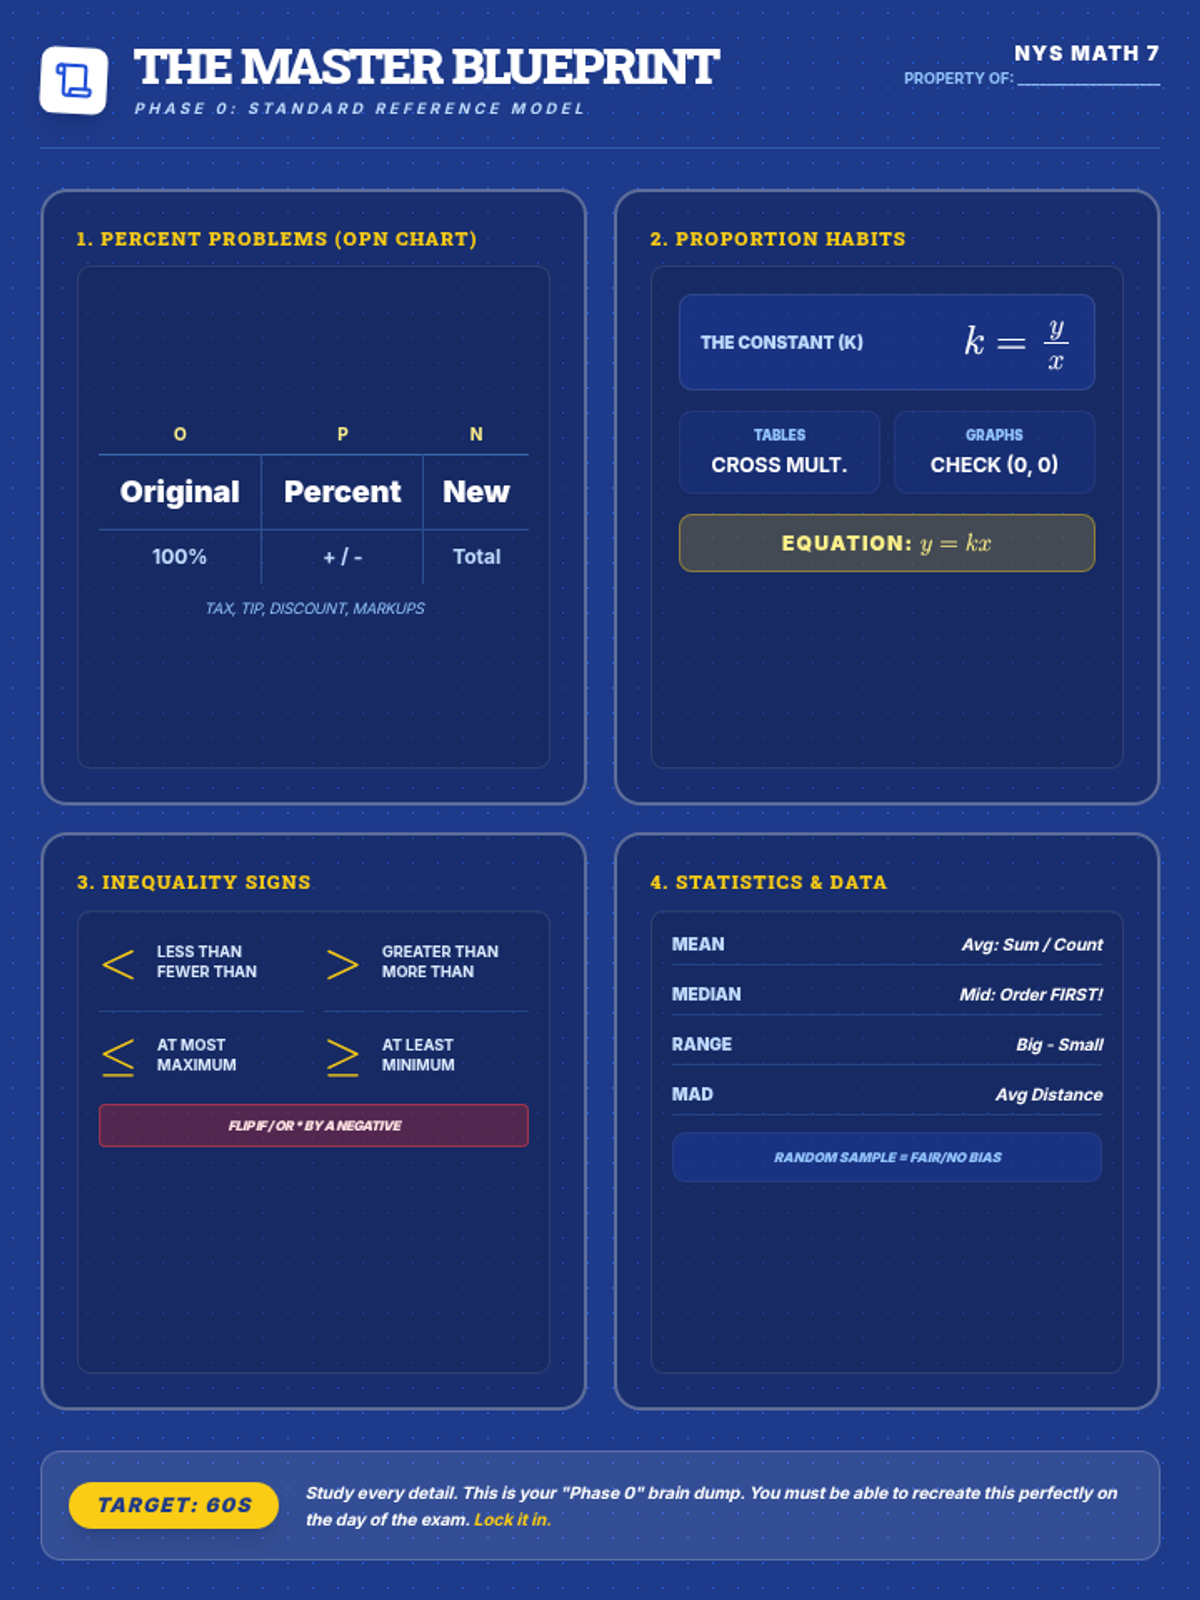
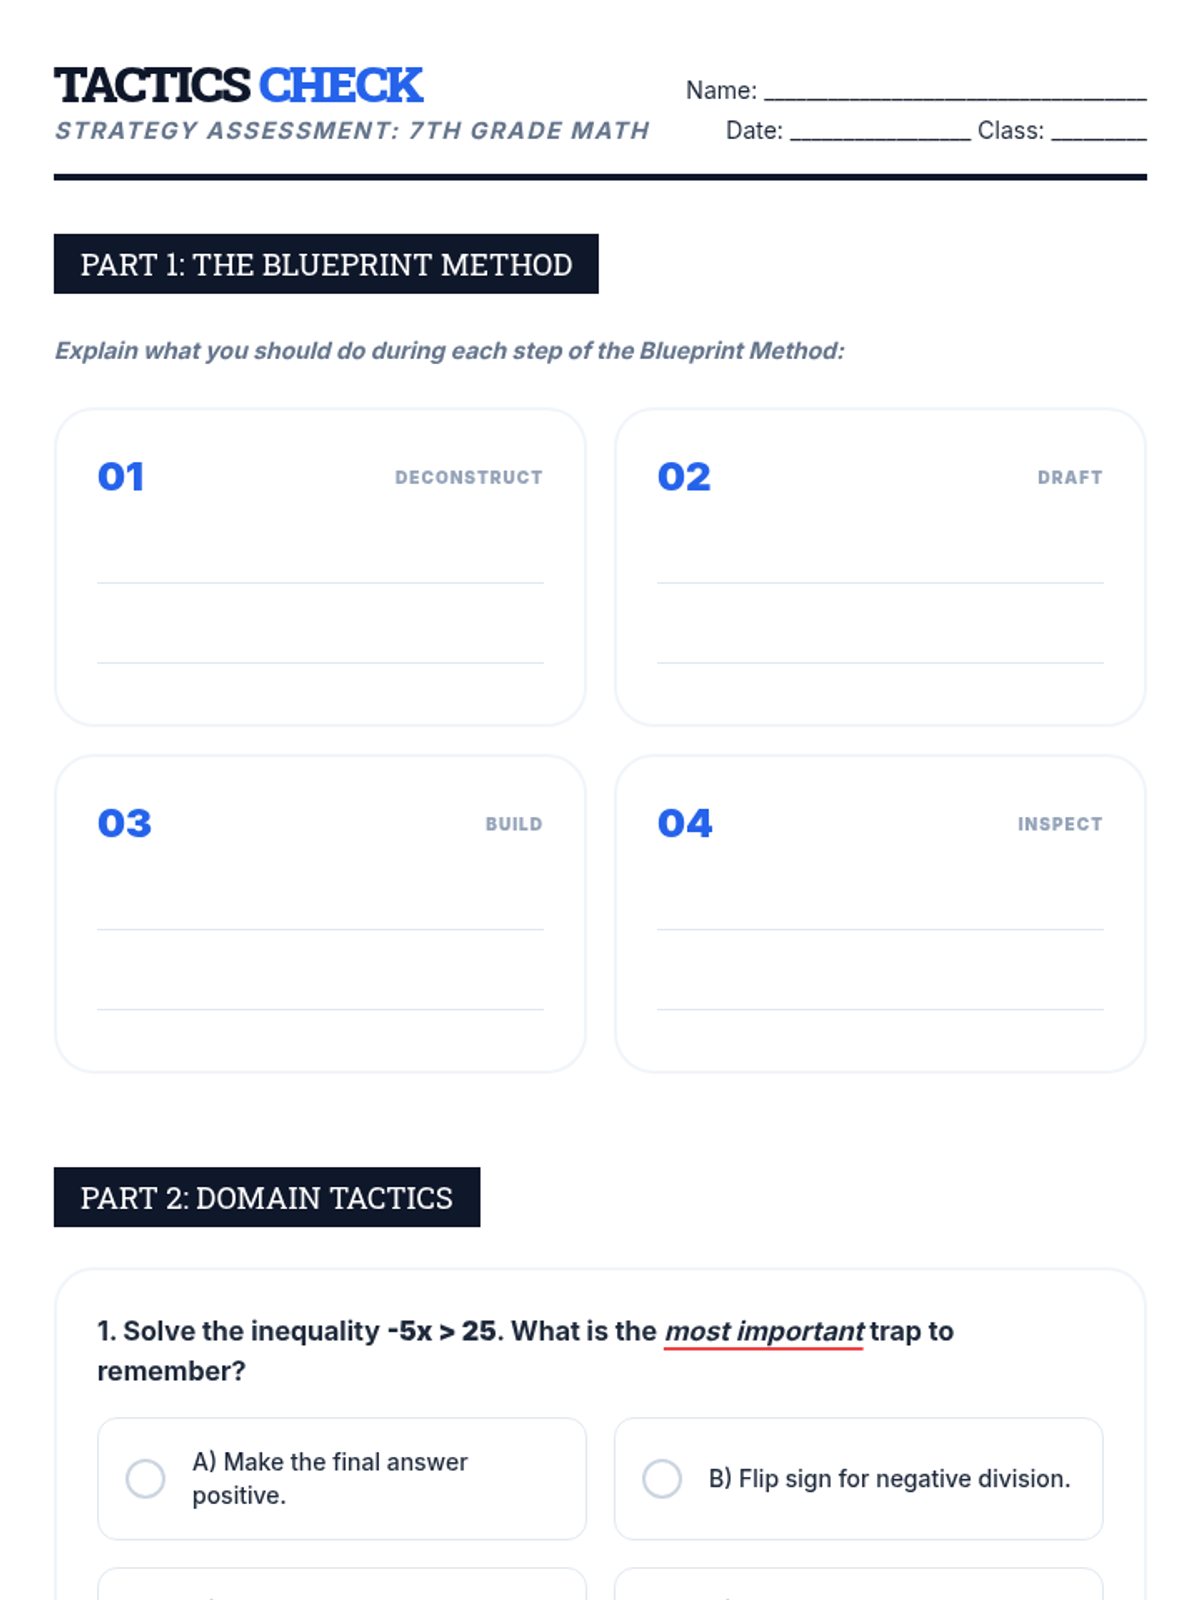
Solving and graphing linear inequalities and applying them to real-world NYS assessment scenarios.
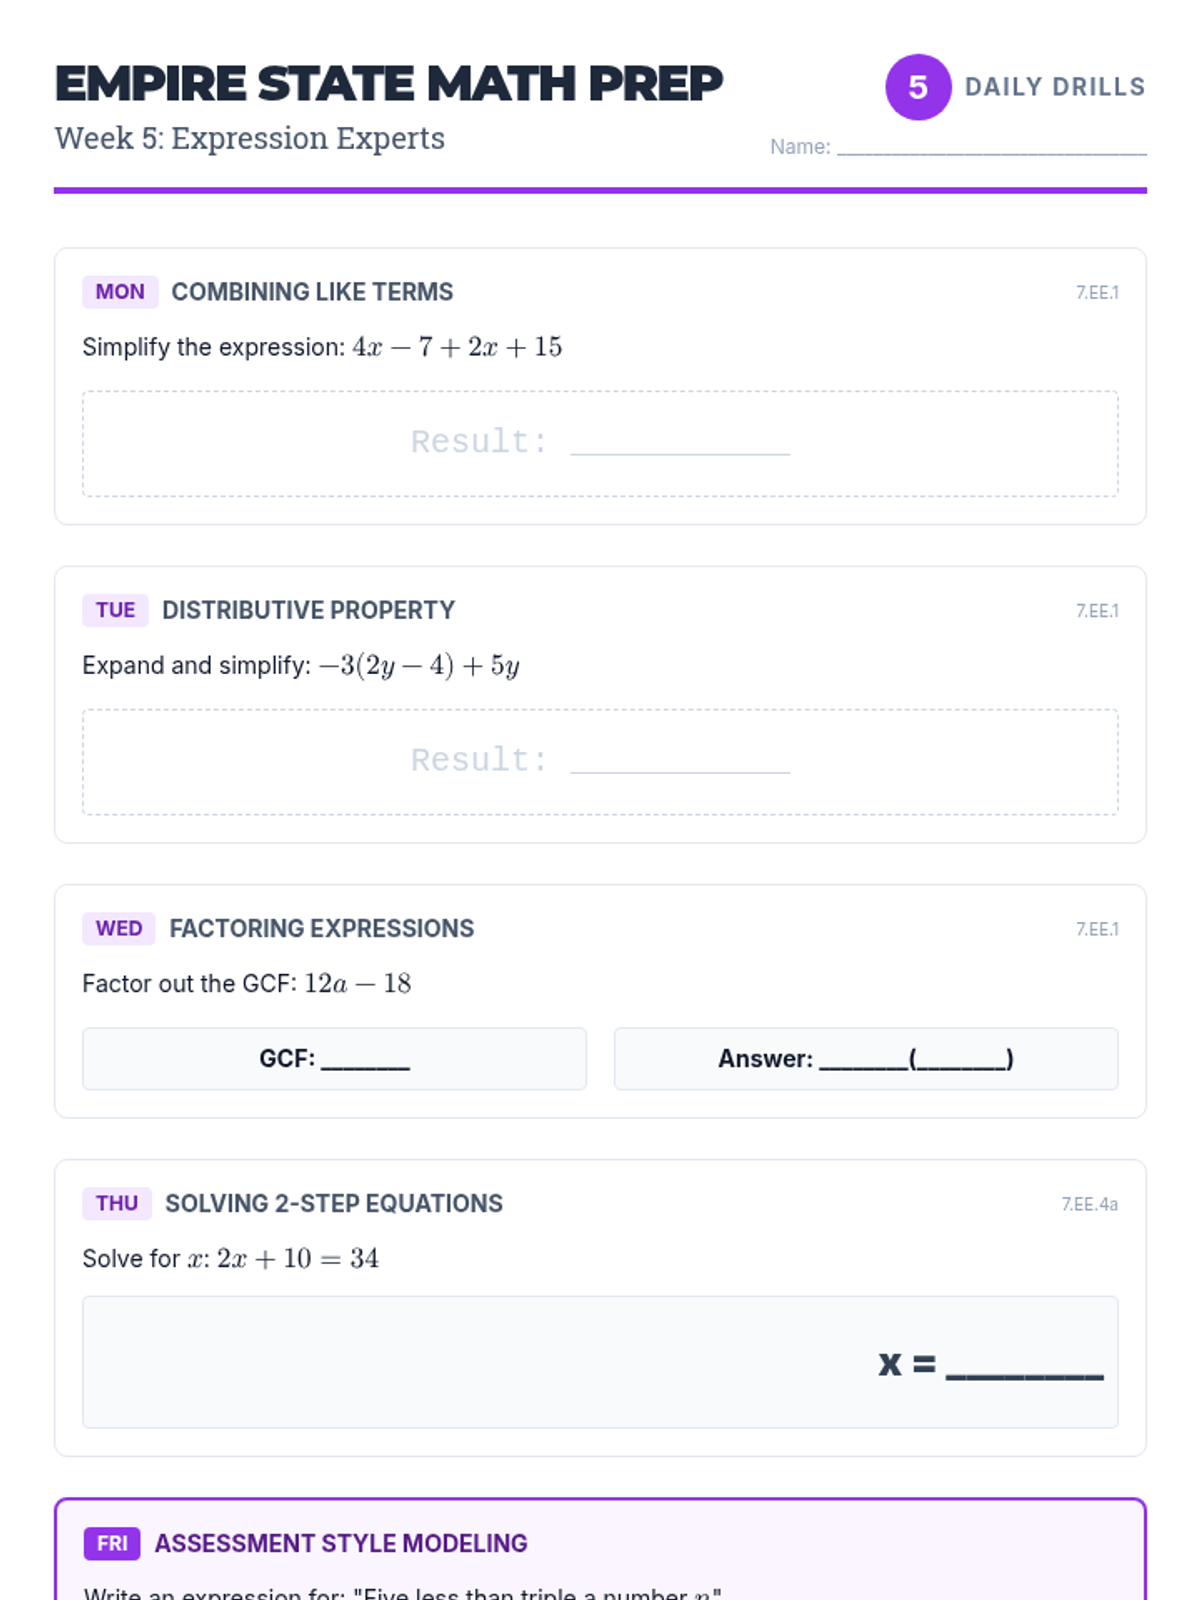
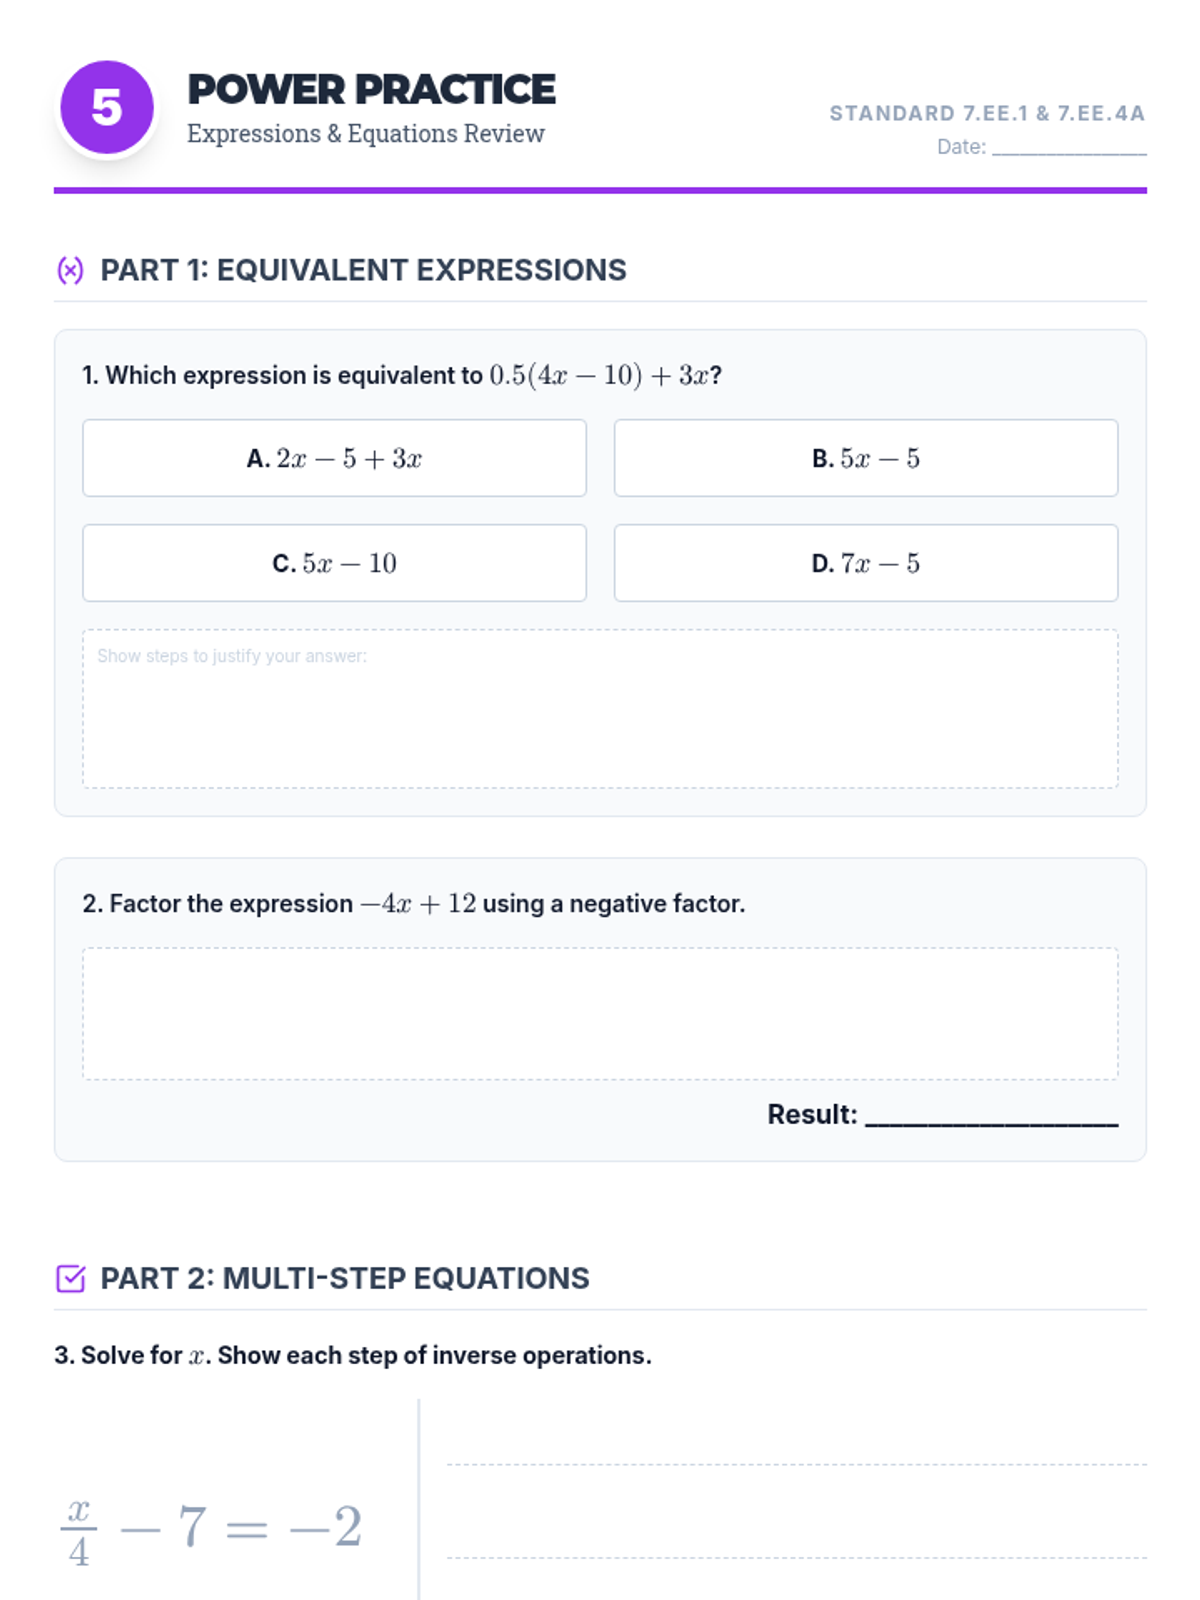
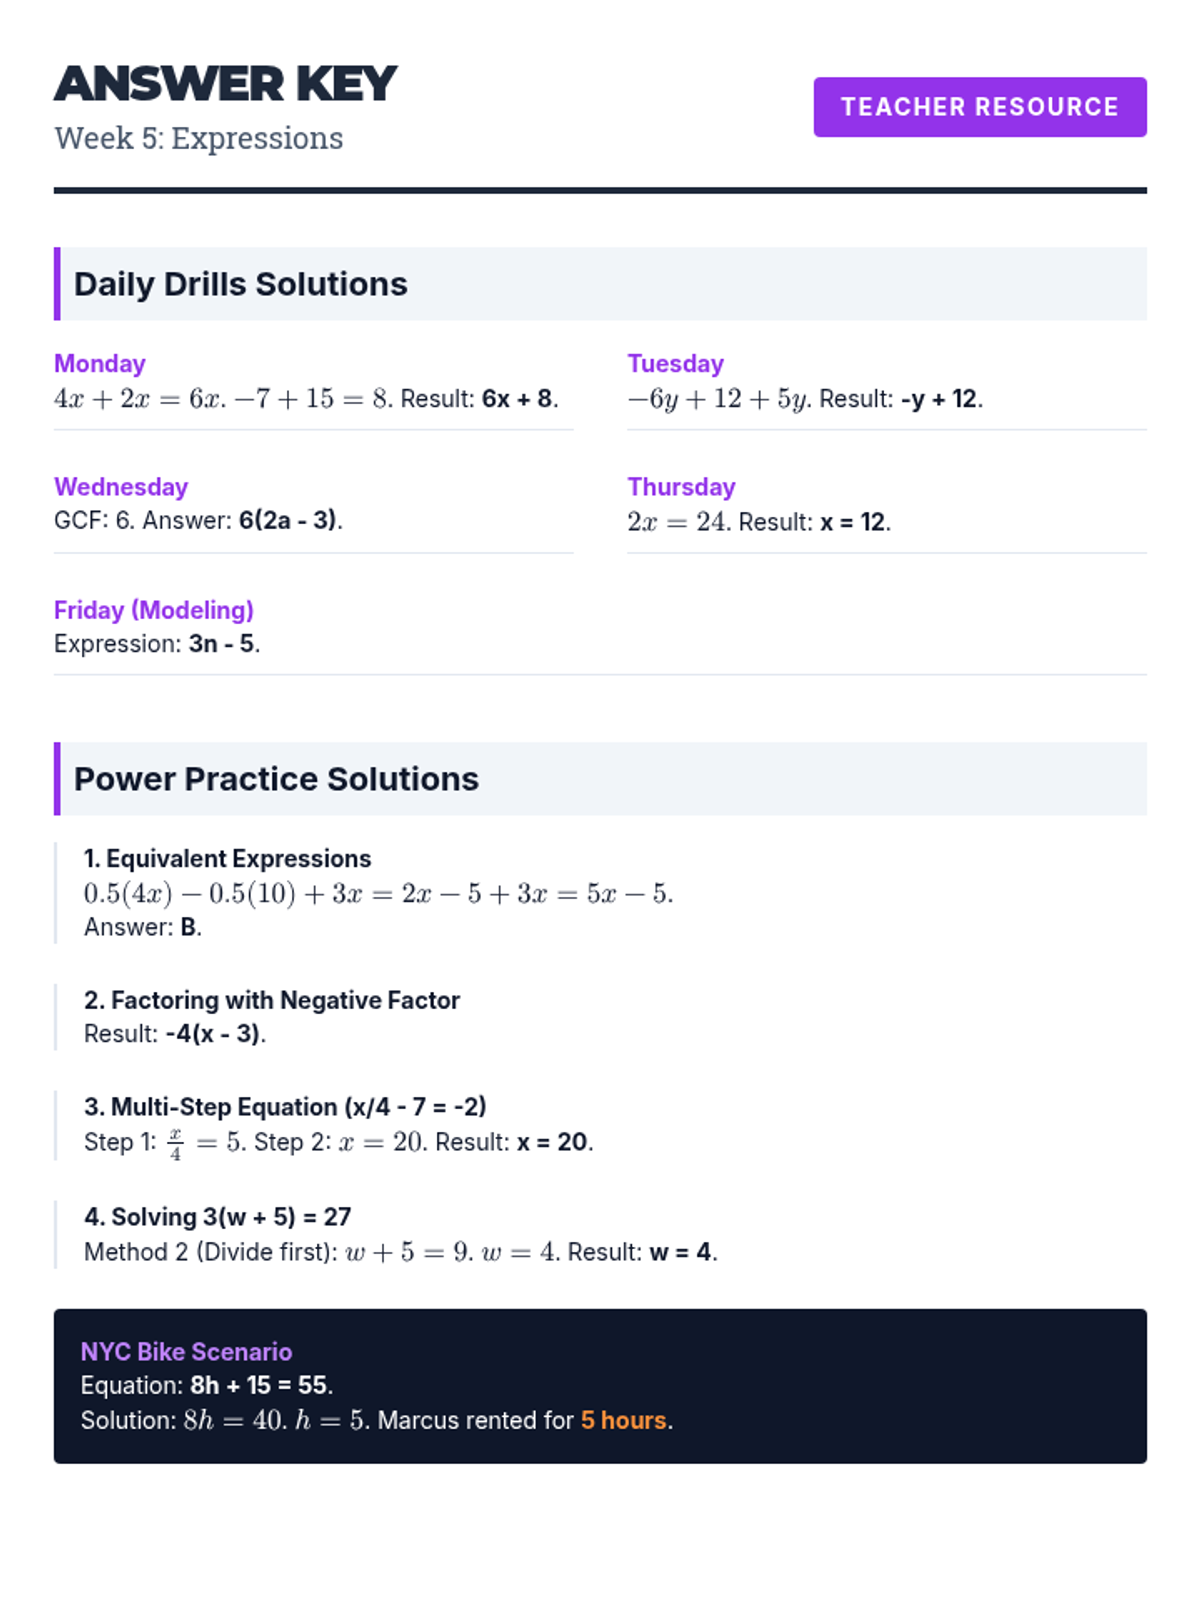
Simplifying linear expressions and solving multi-step equations using properties of operations.
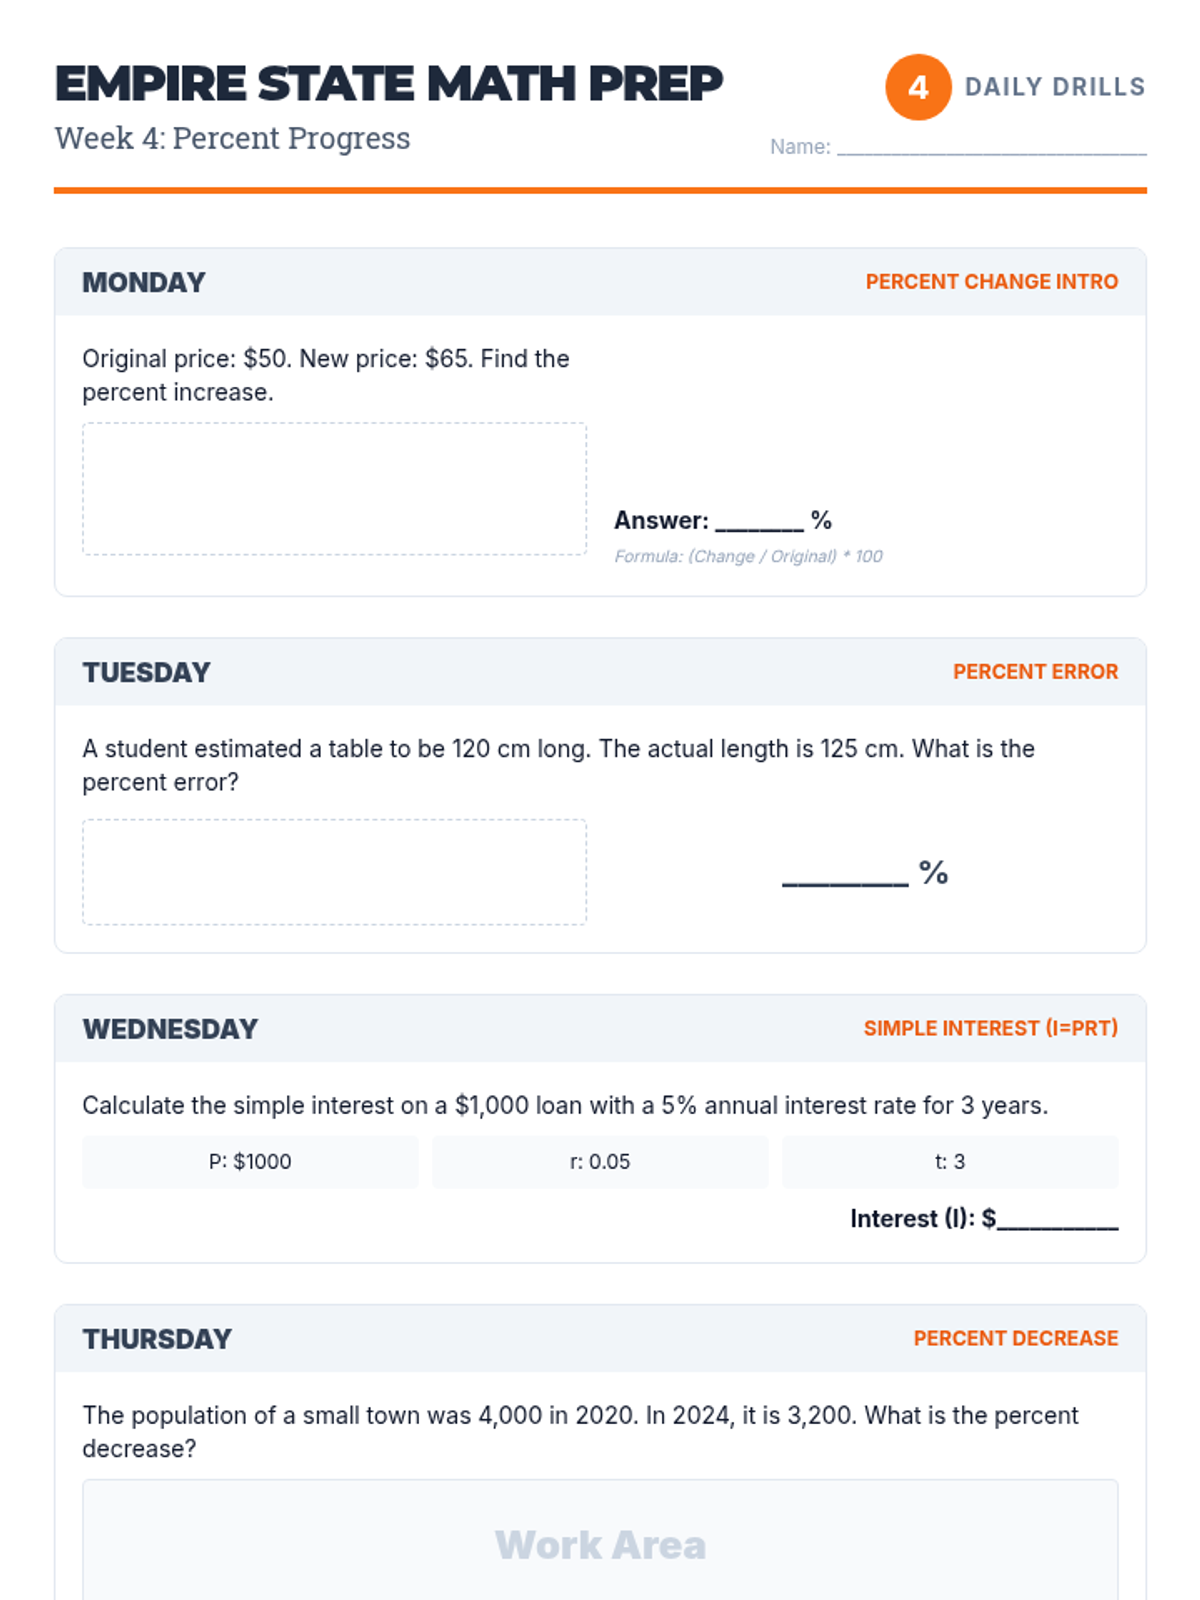
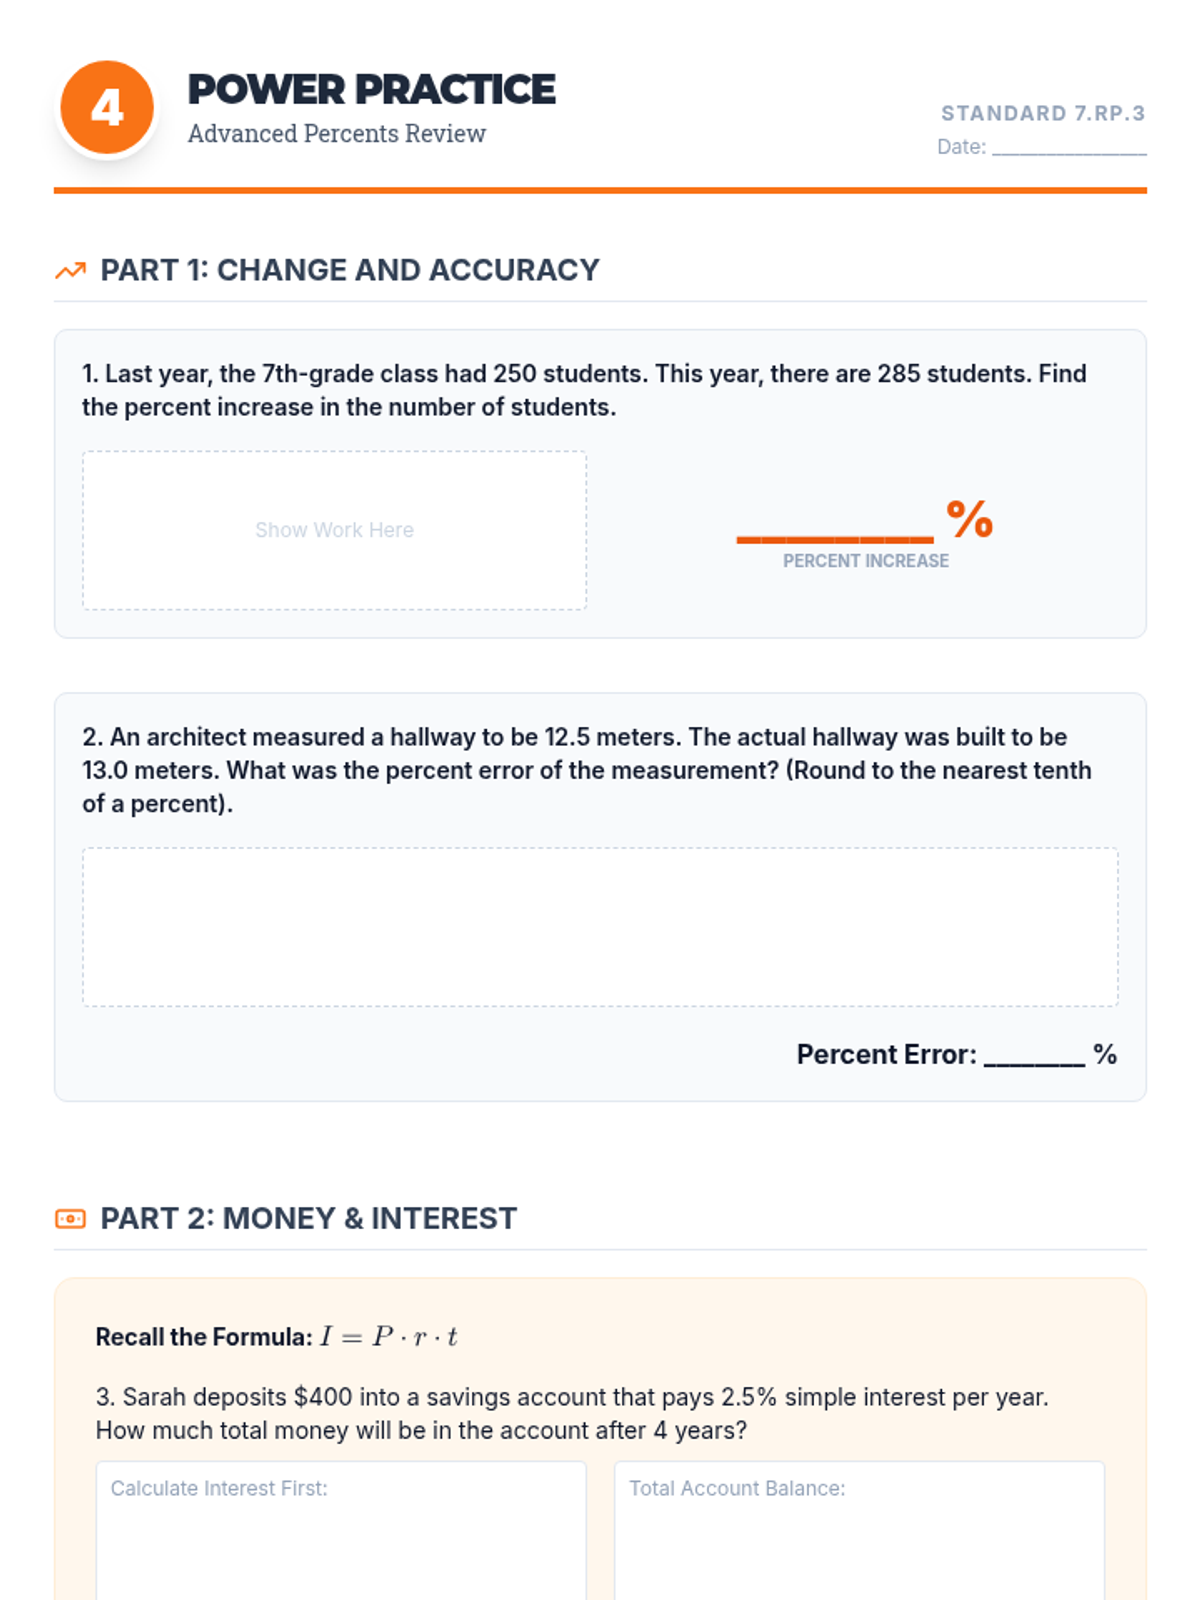
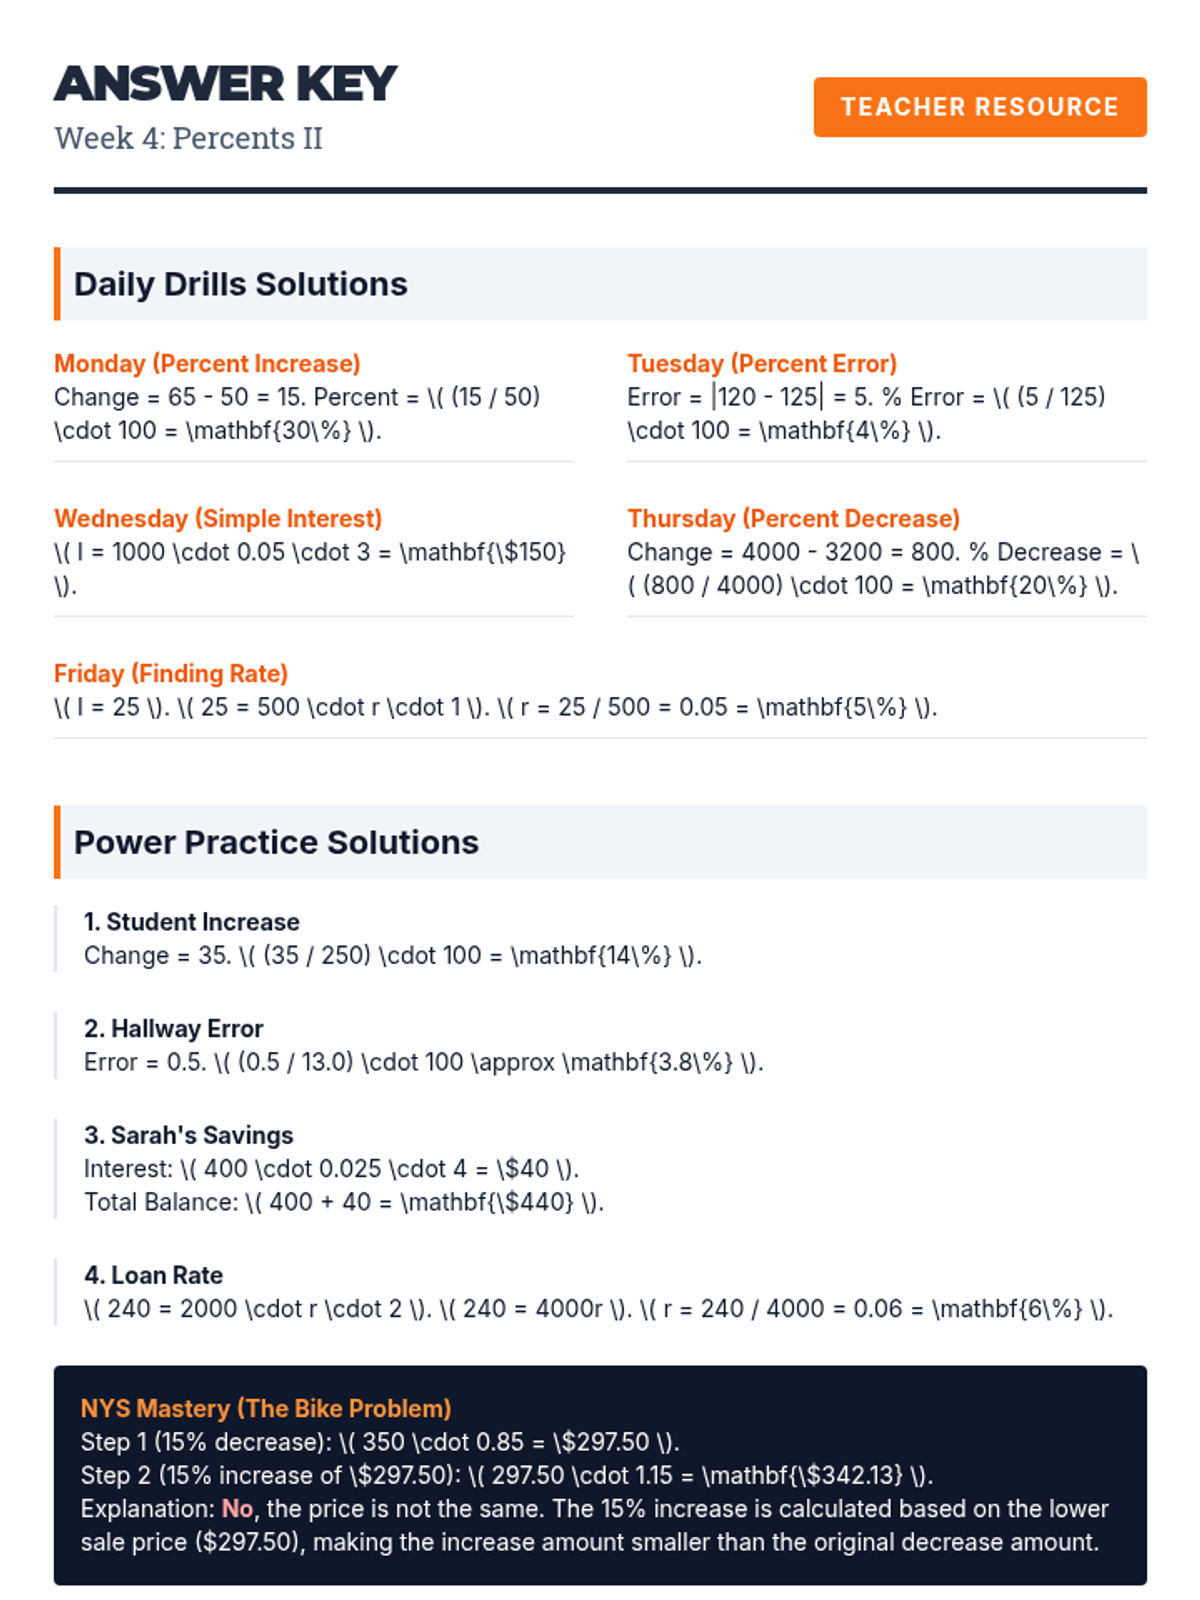
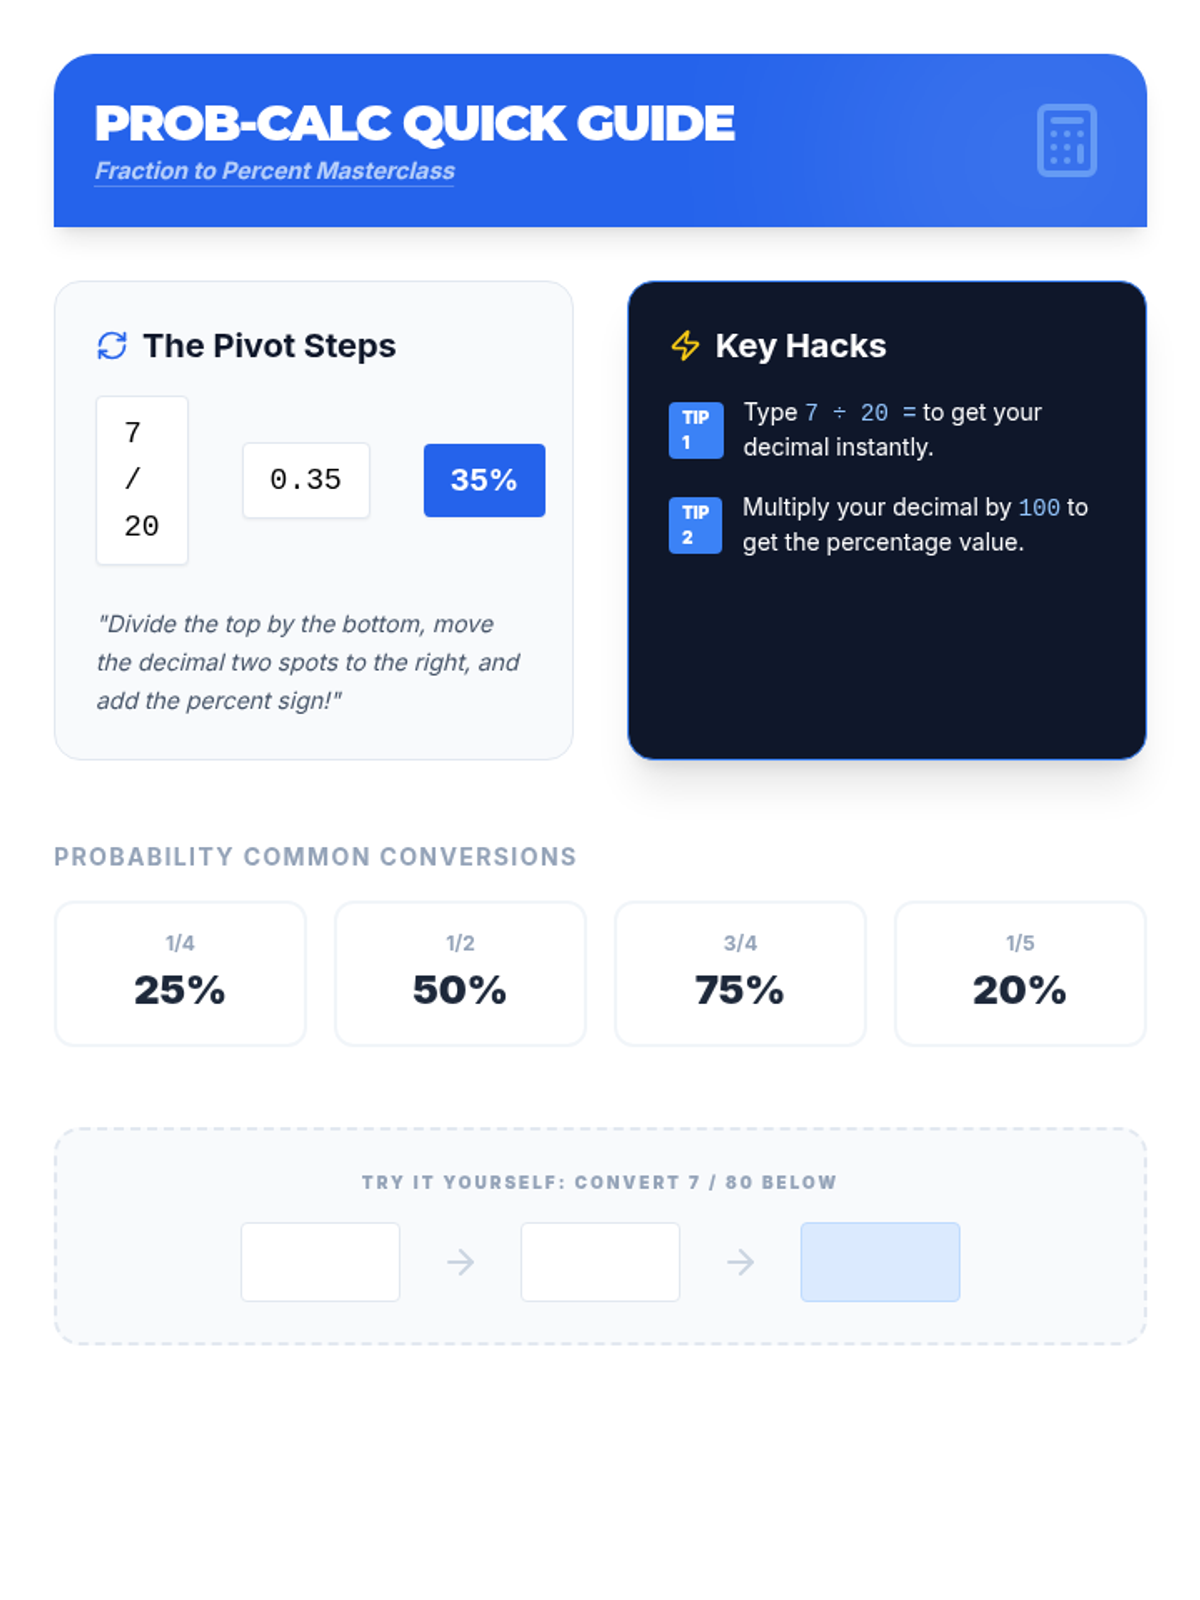
Advanced percent problems including simple interest, percent change (increase/decrease), and percent error.
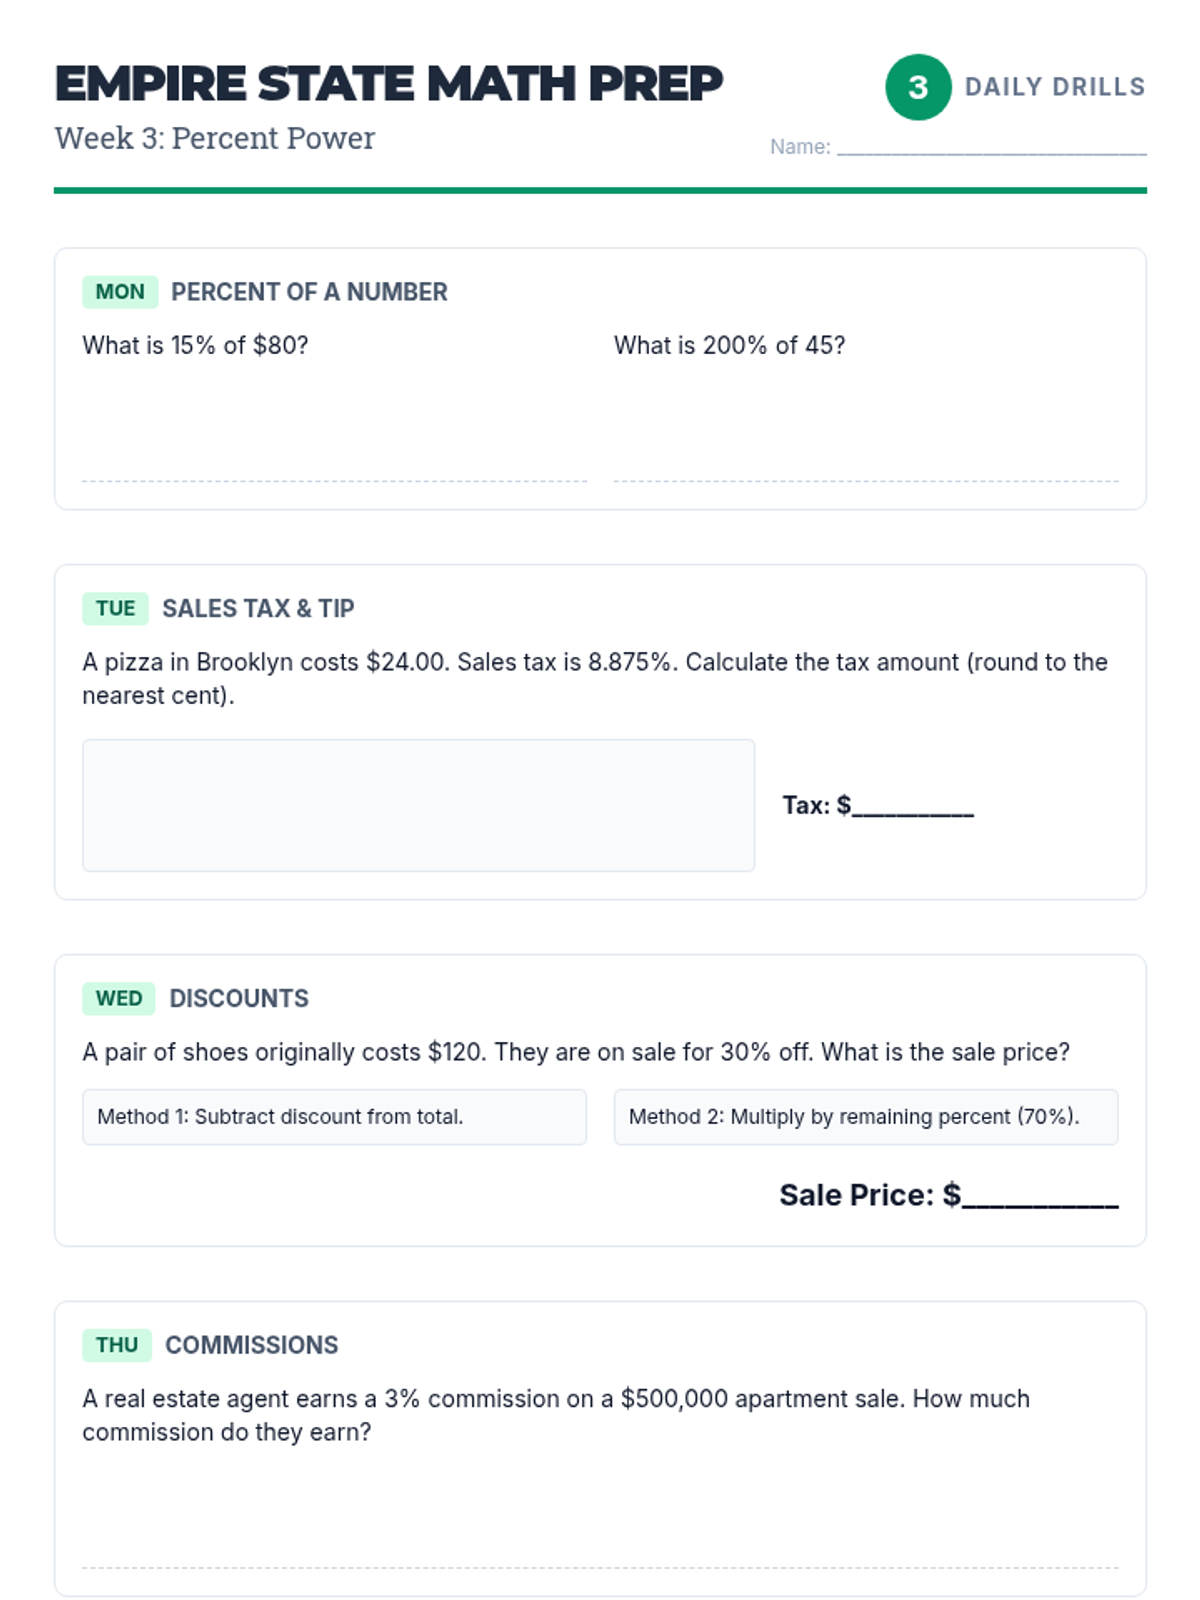
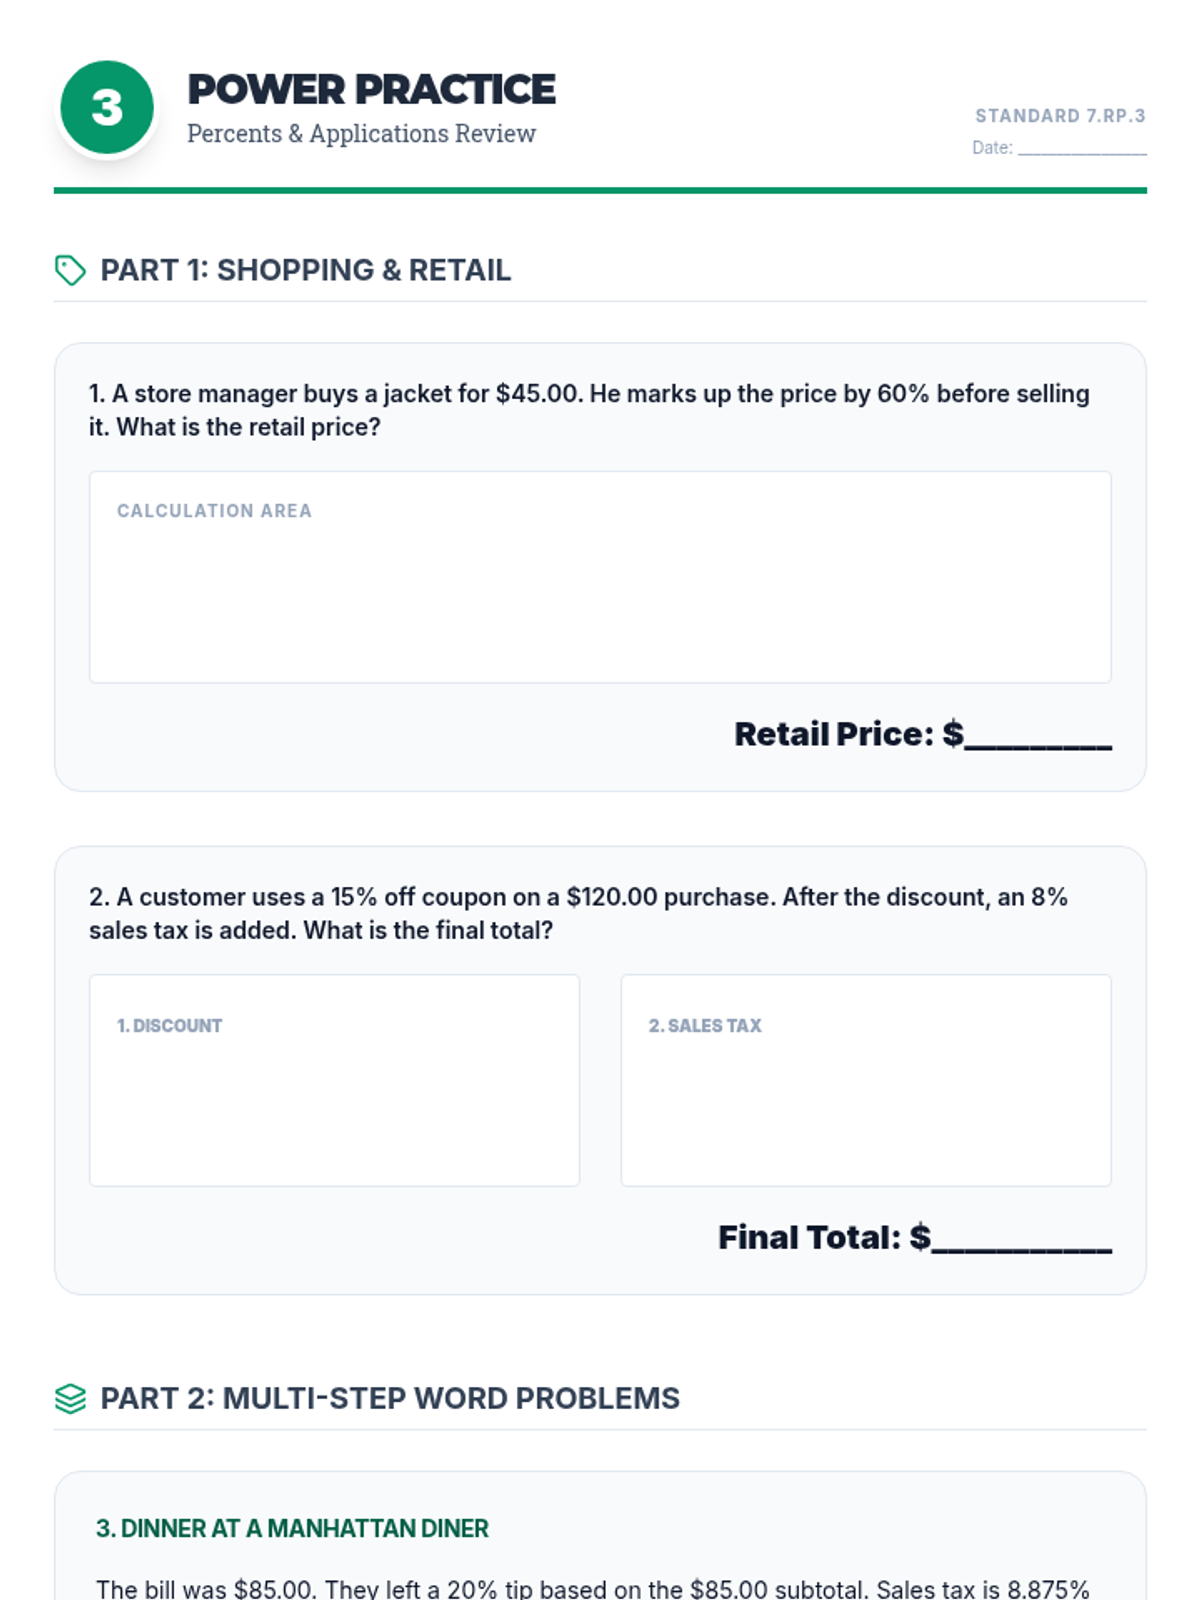
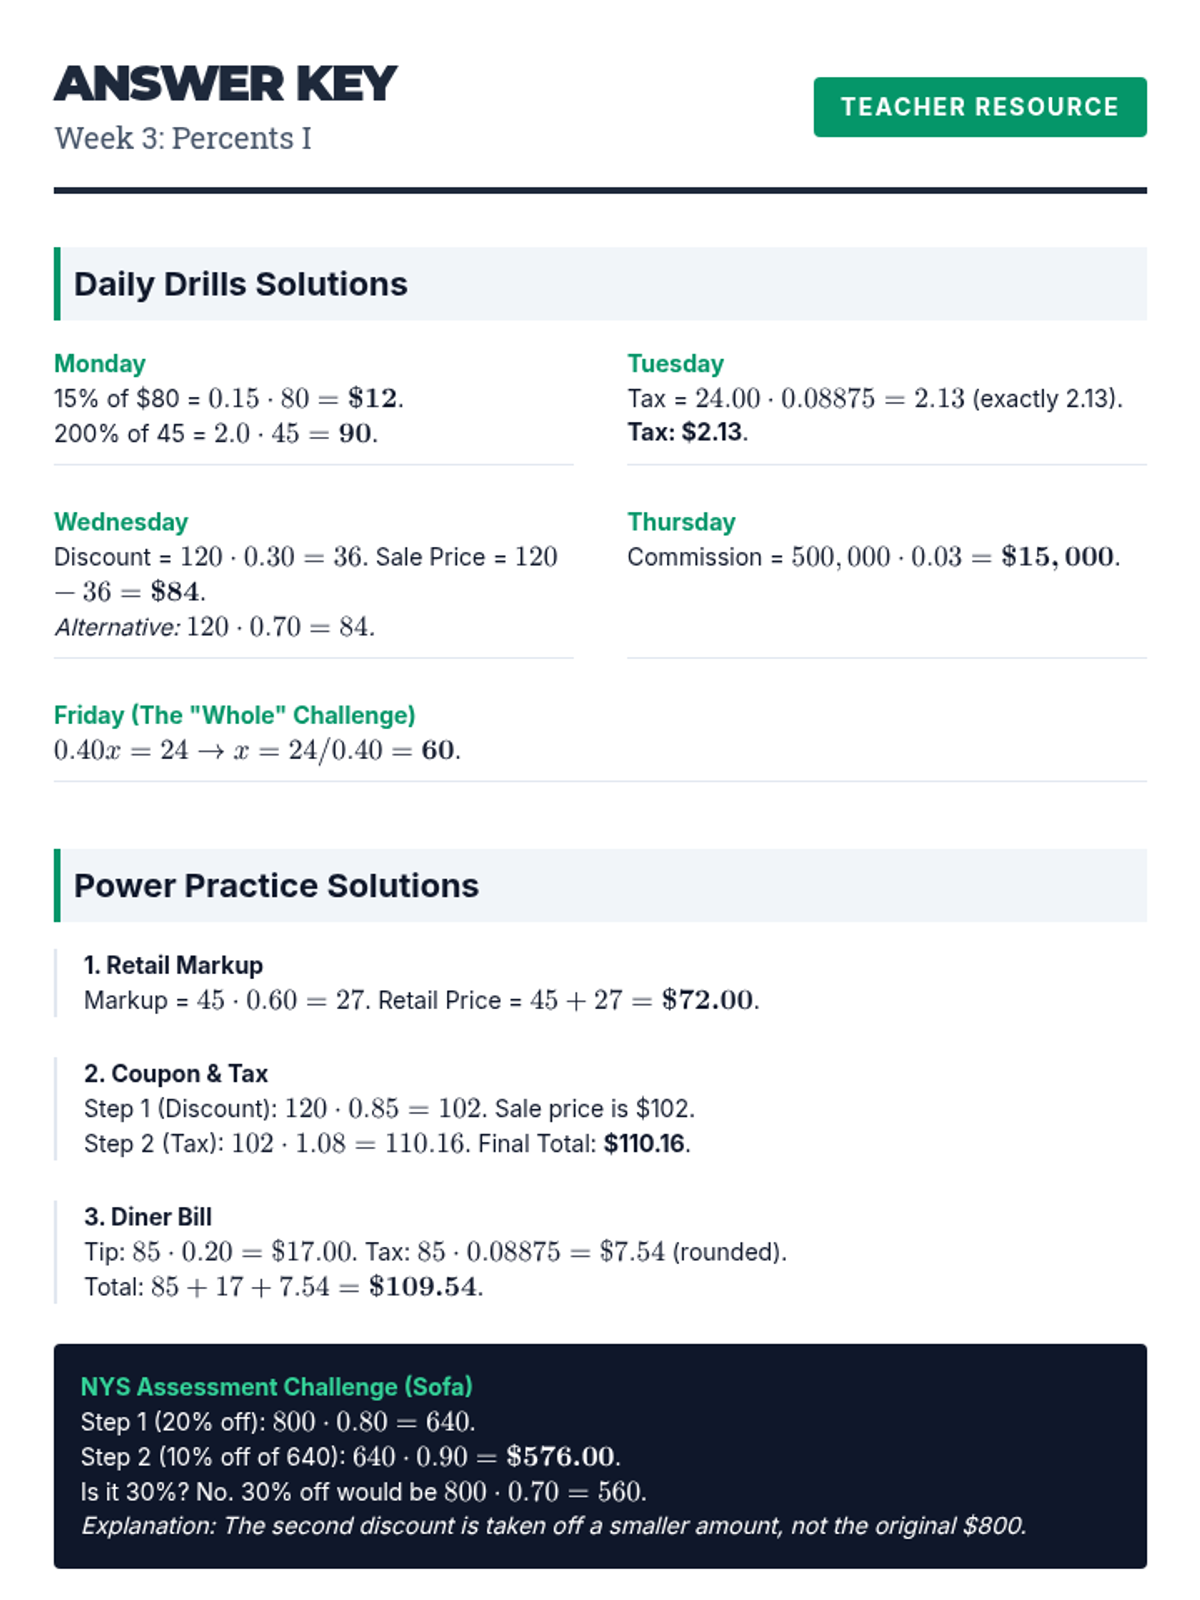
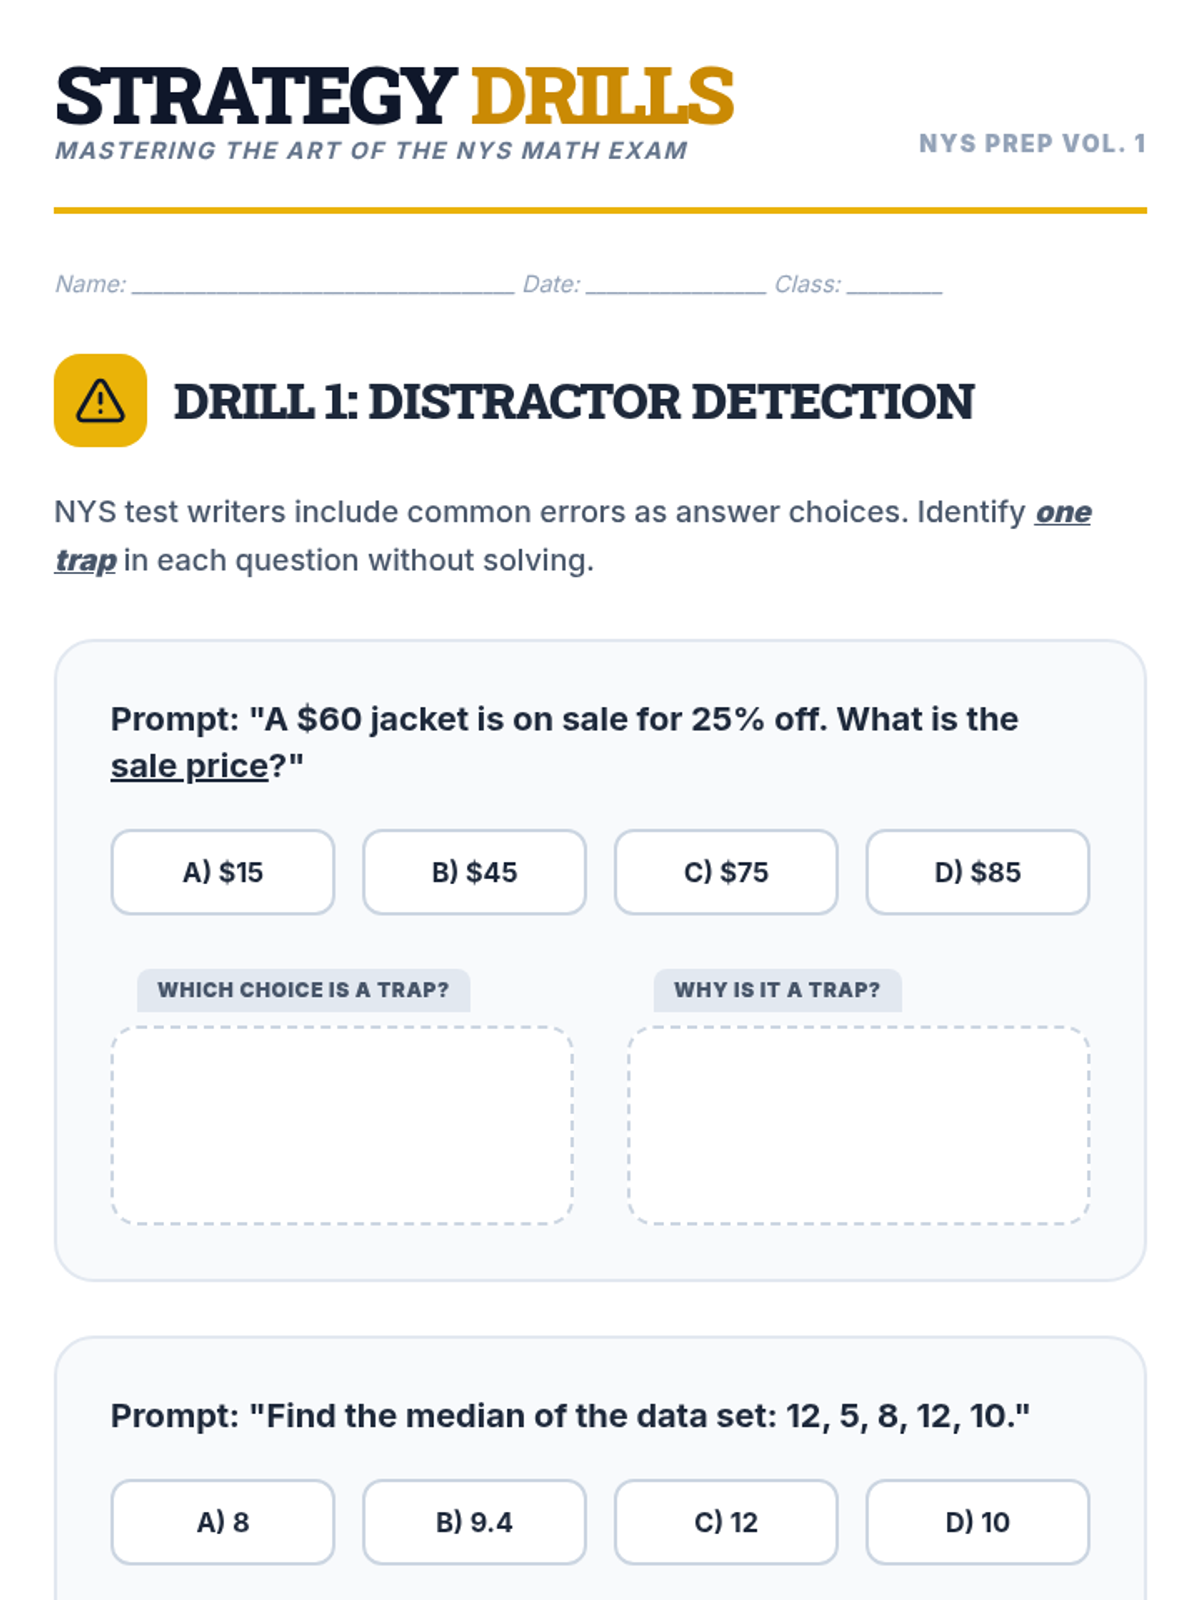
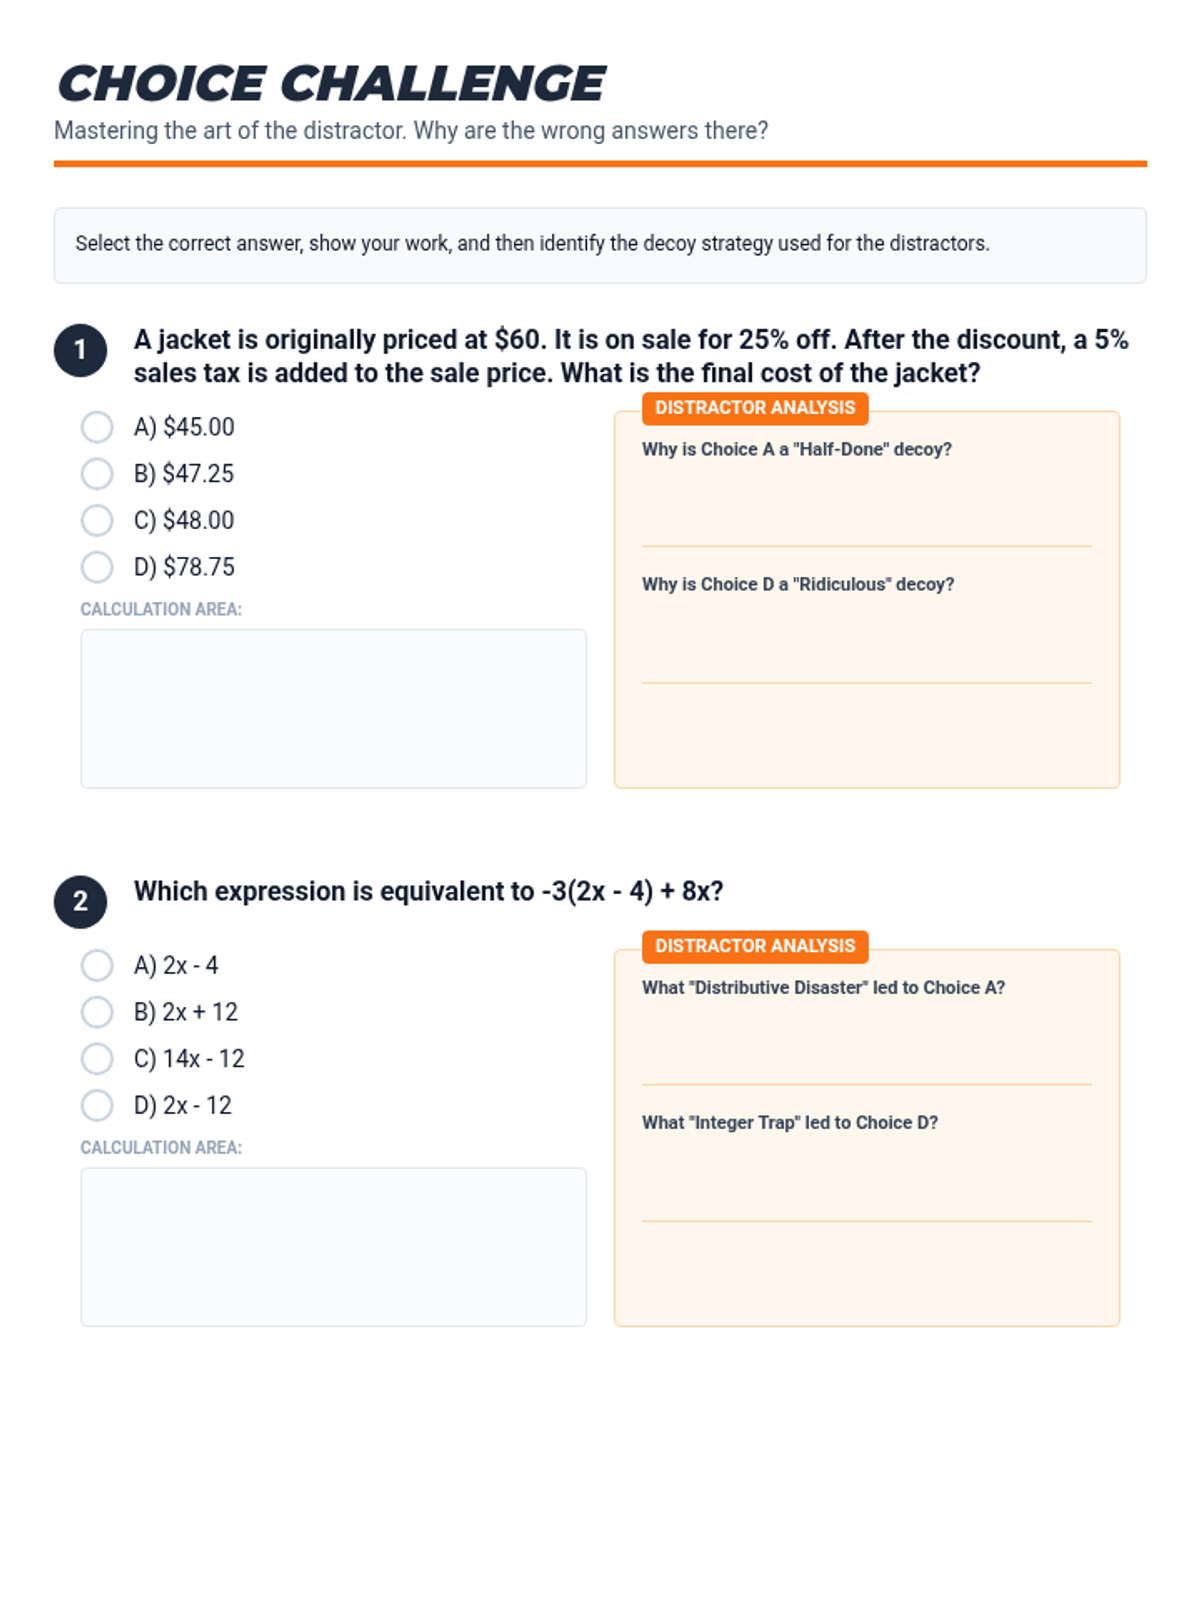
Practical applications of percents, including calculating tax, tip, commissions, discounts, and markups.
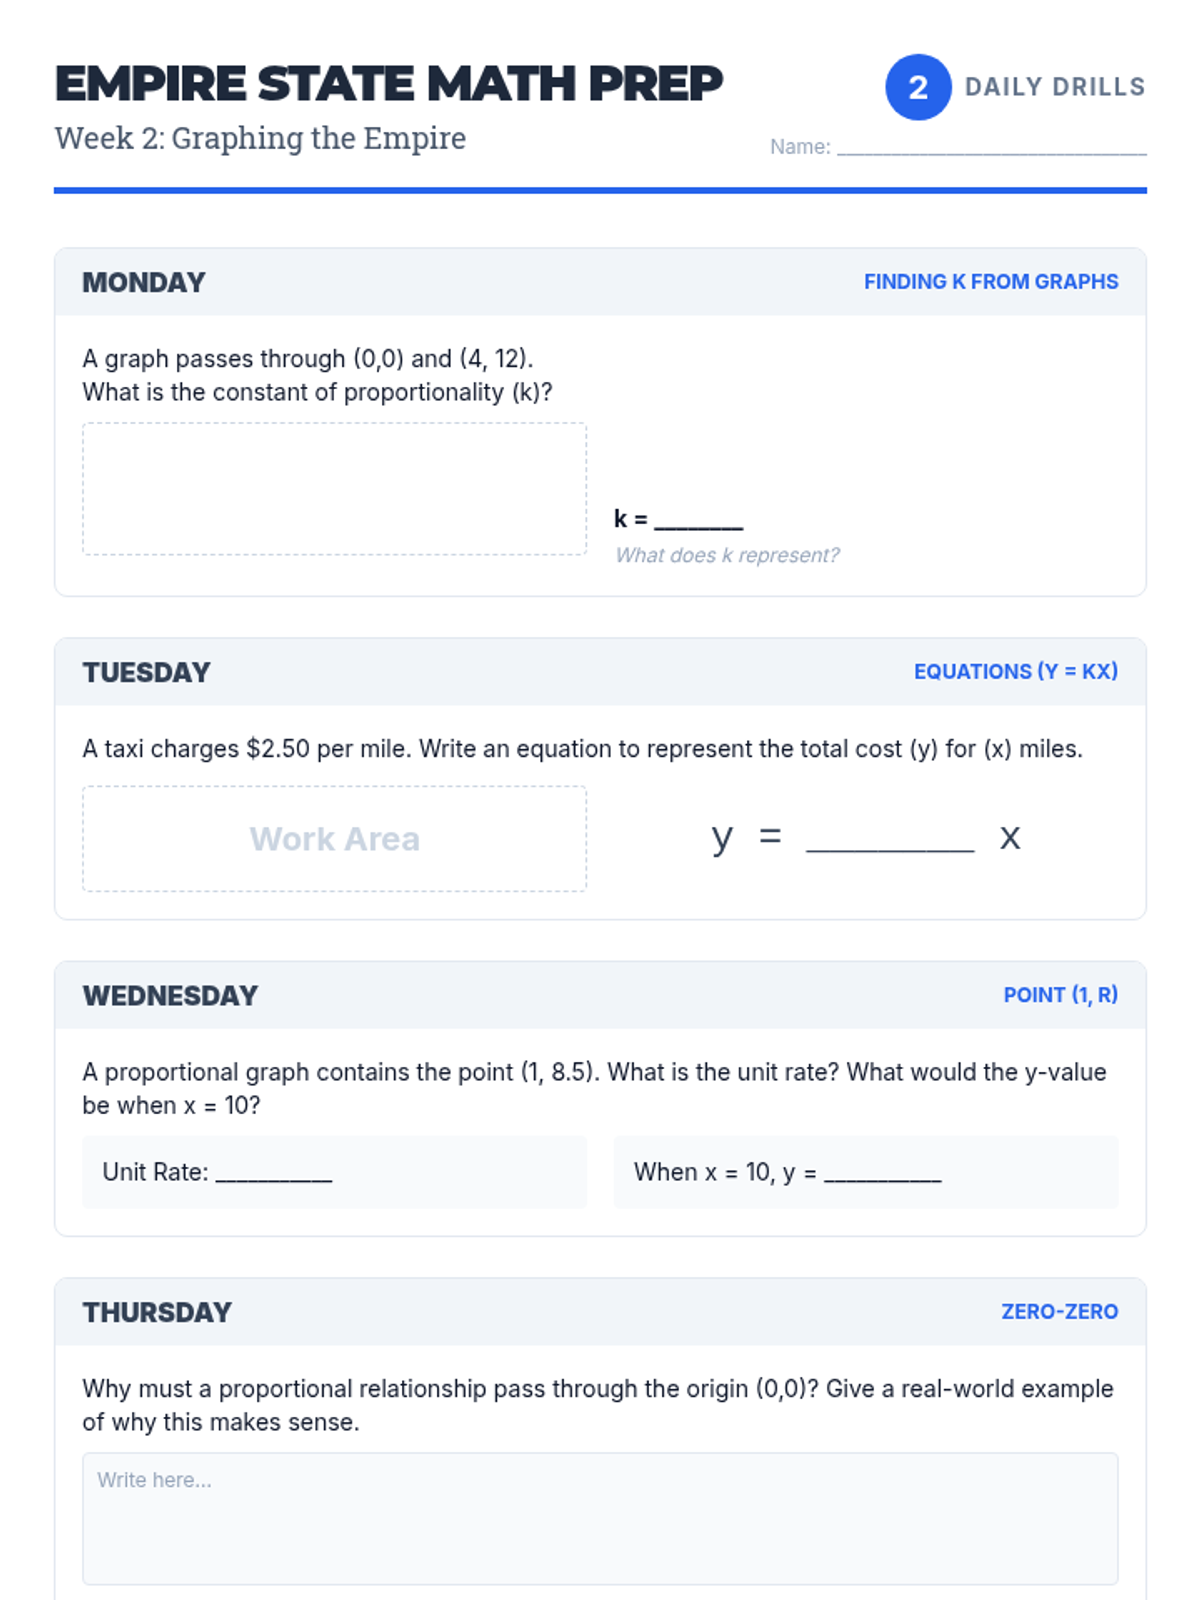
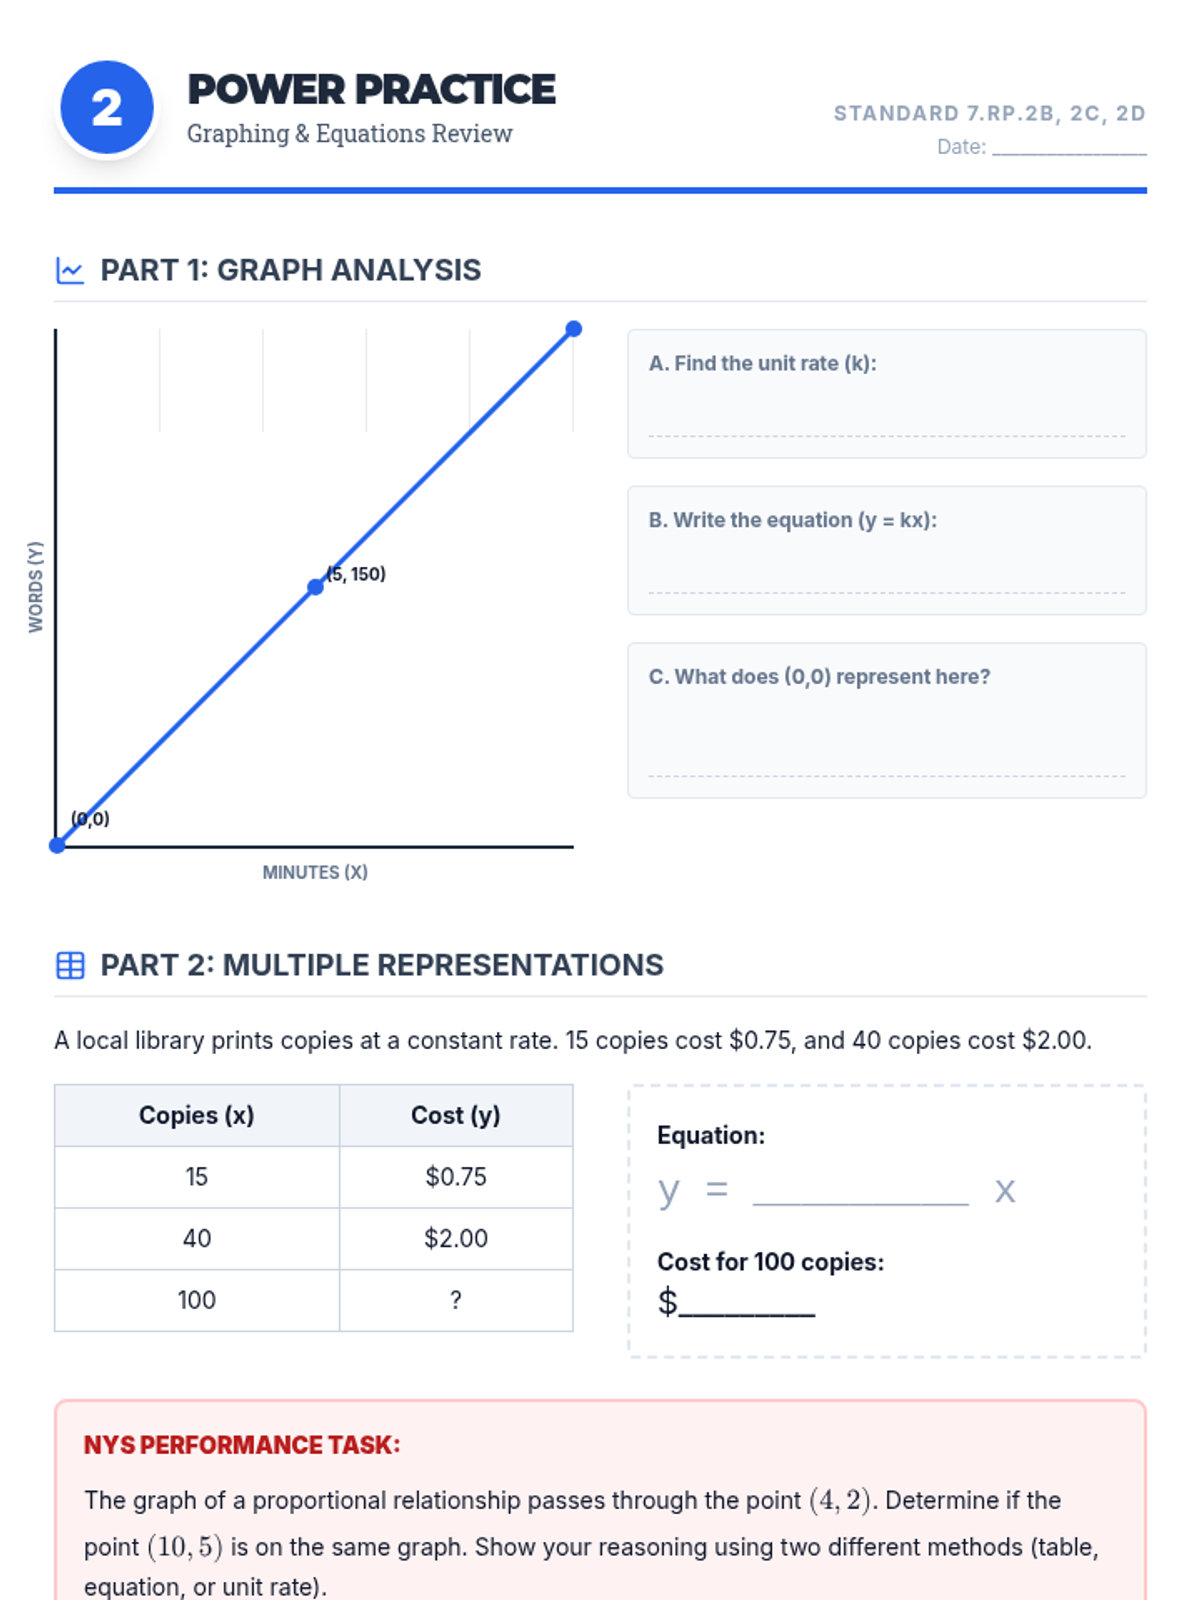
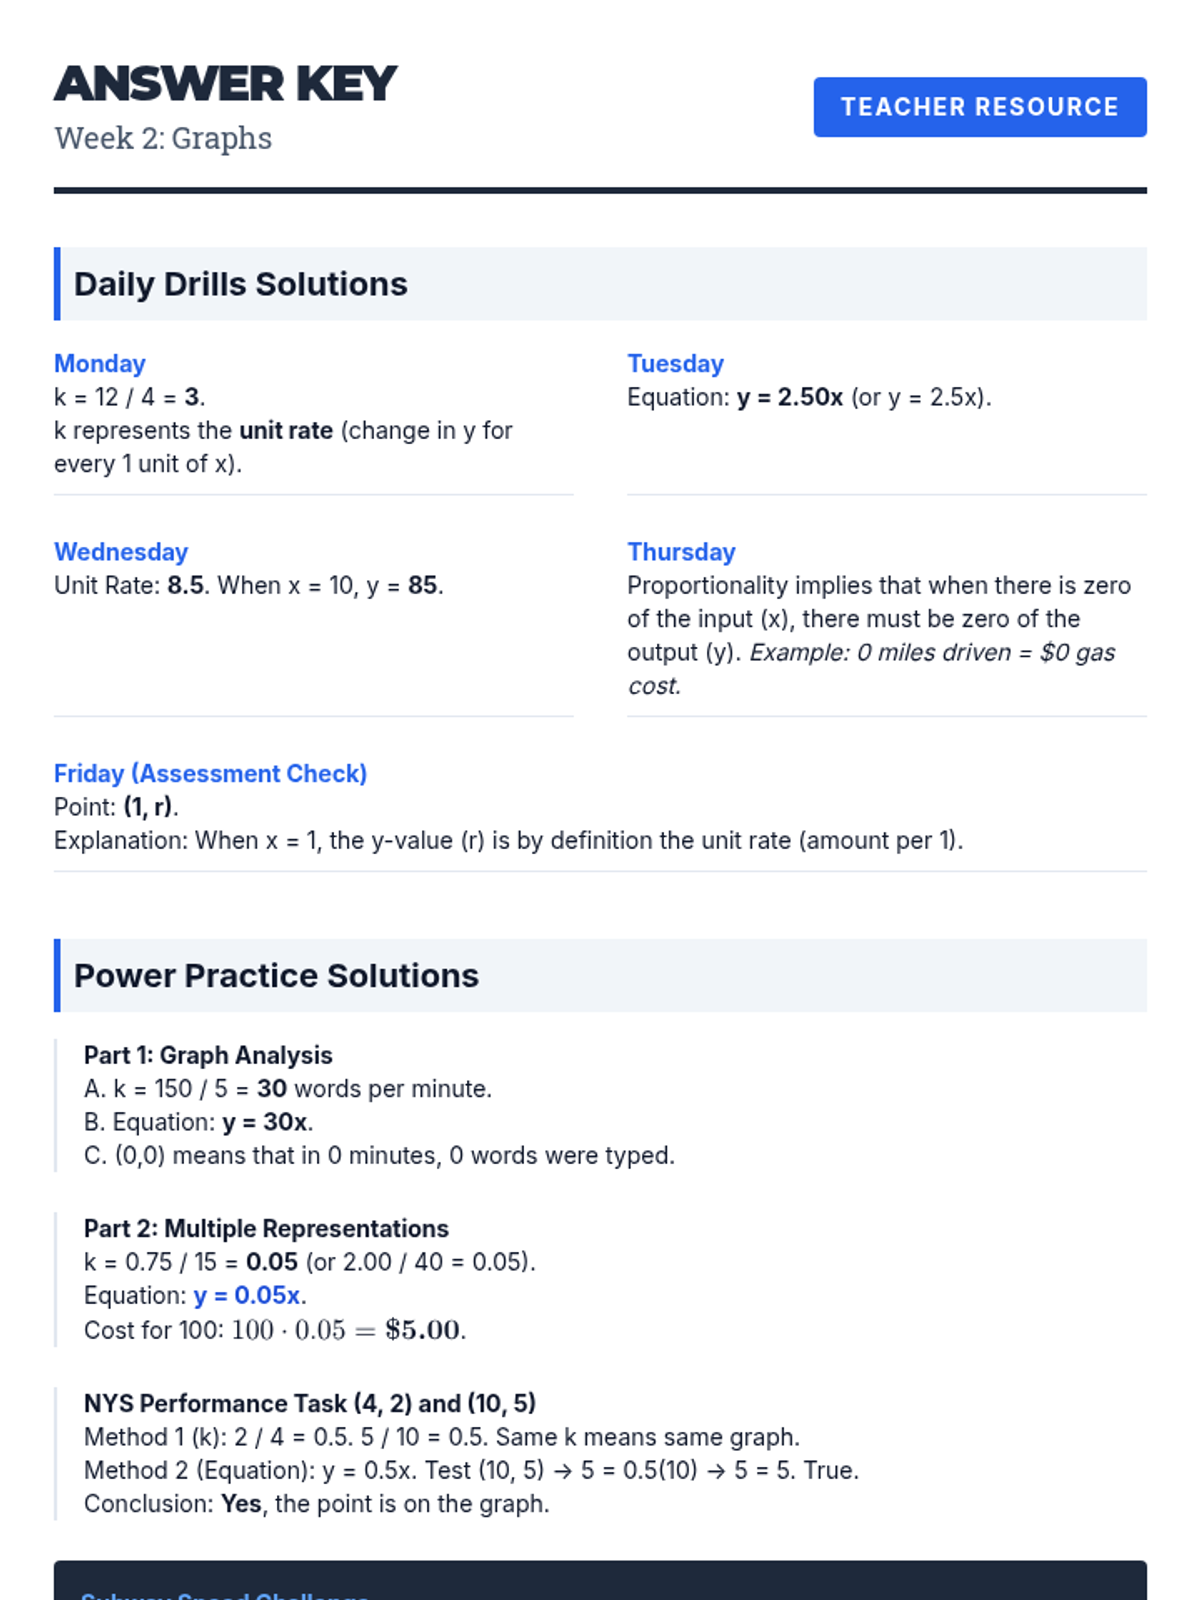
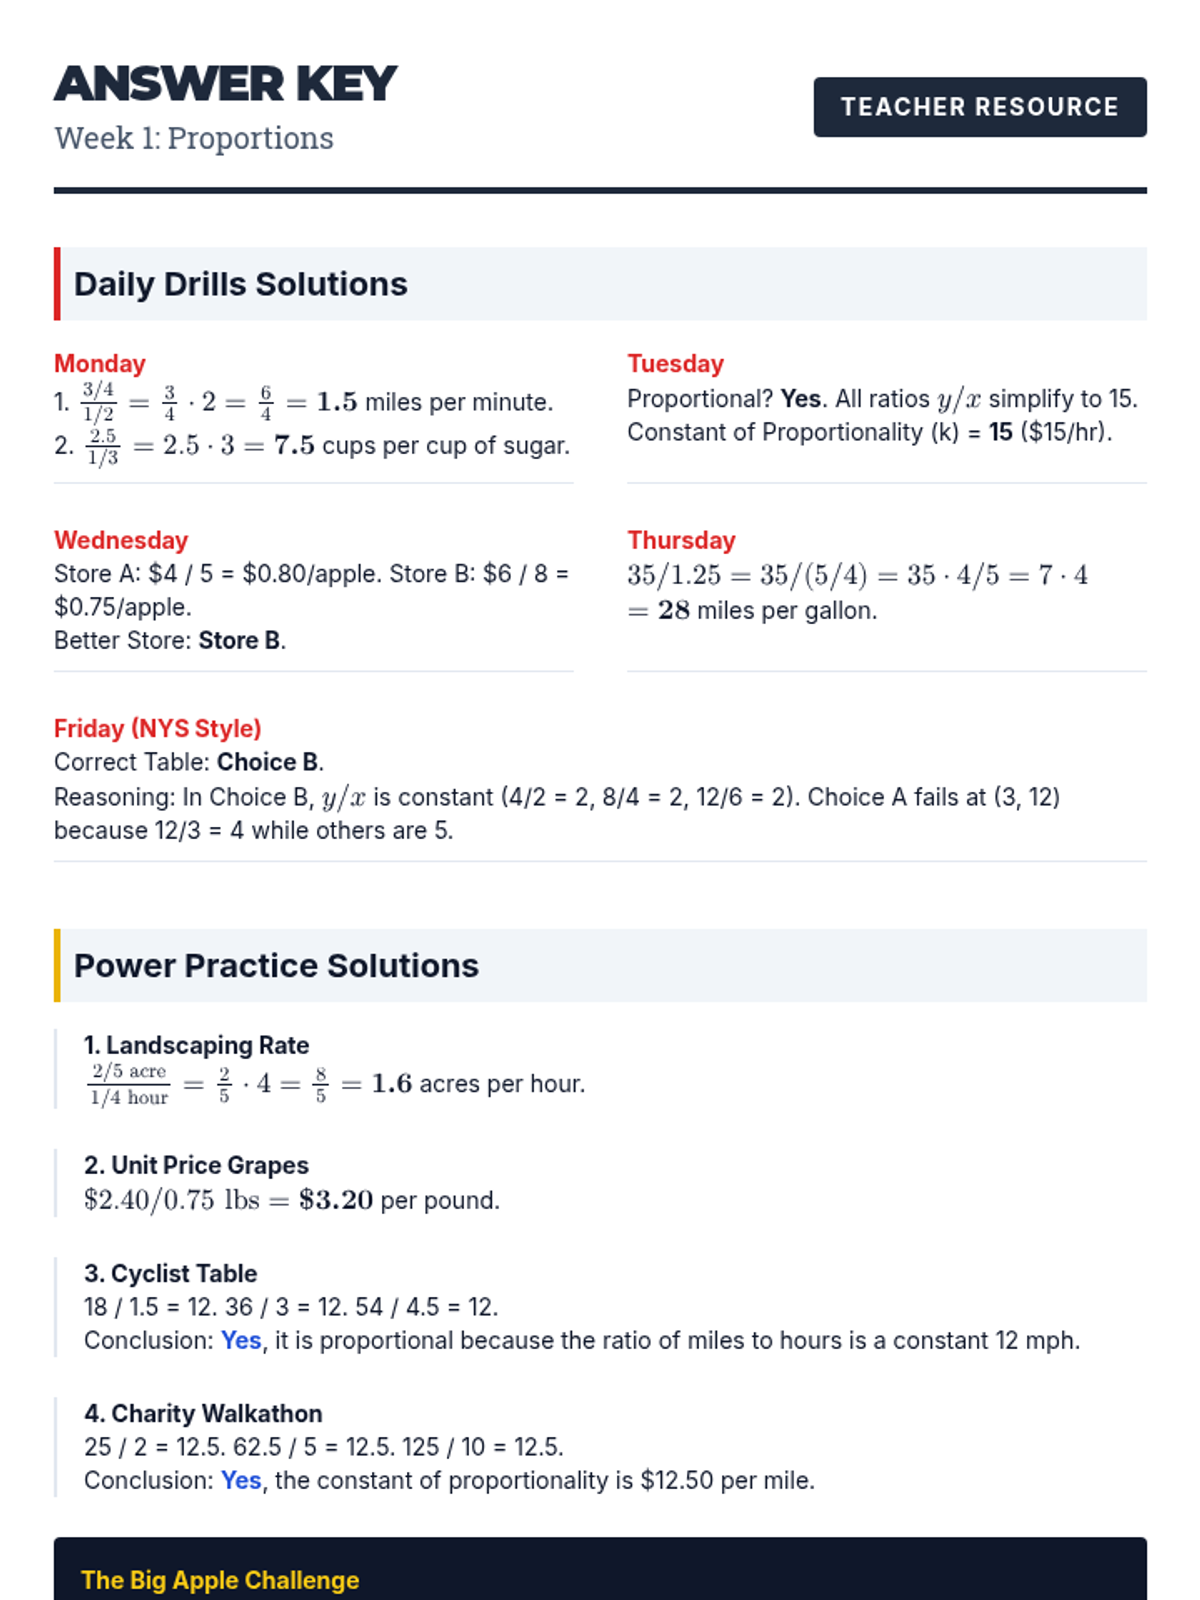
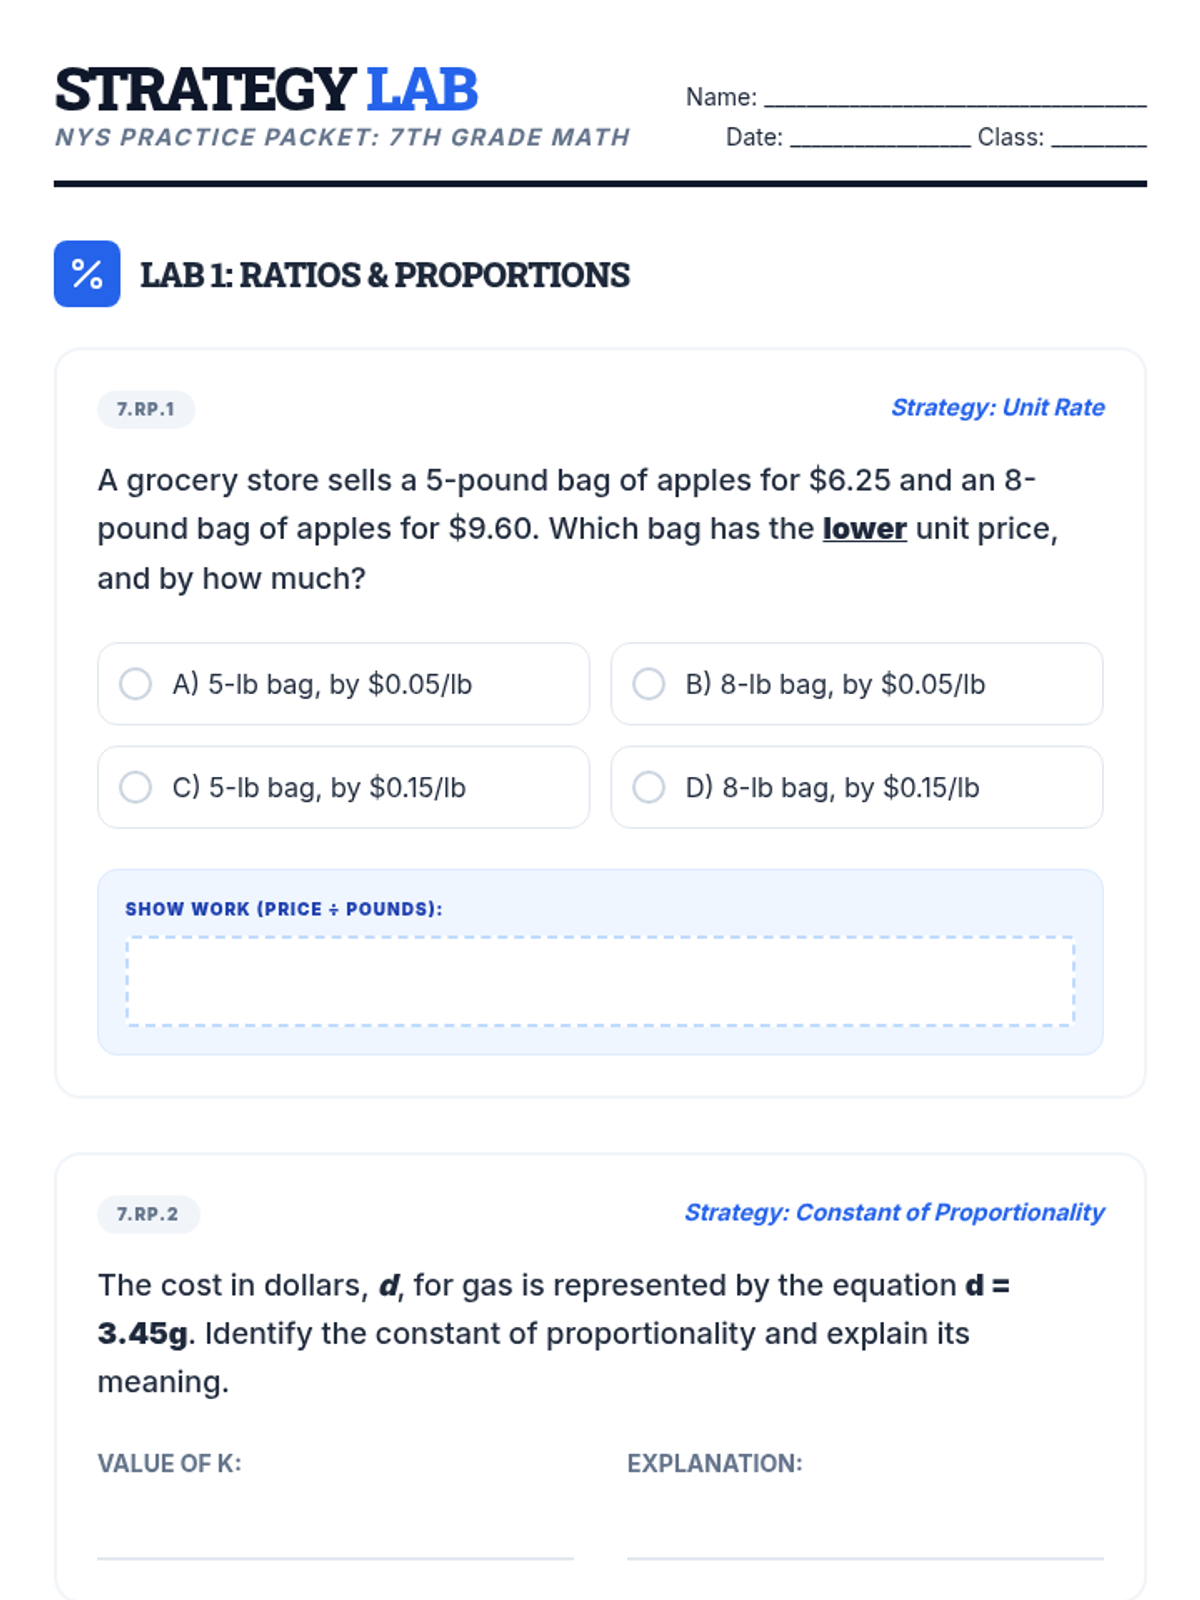
Analyzing graphs of proportional relationships, finding the constant of proportionality, and writing equations in the form y = kx.
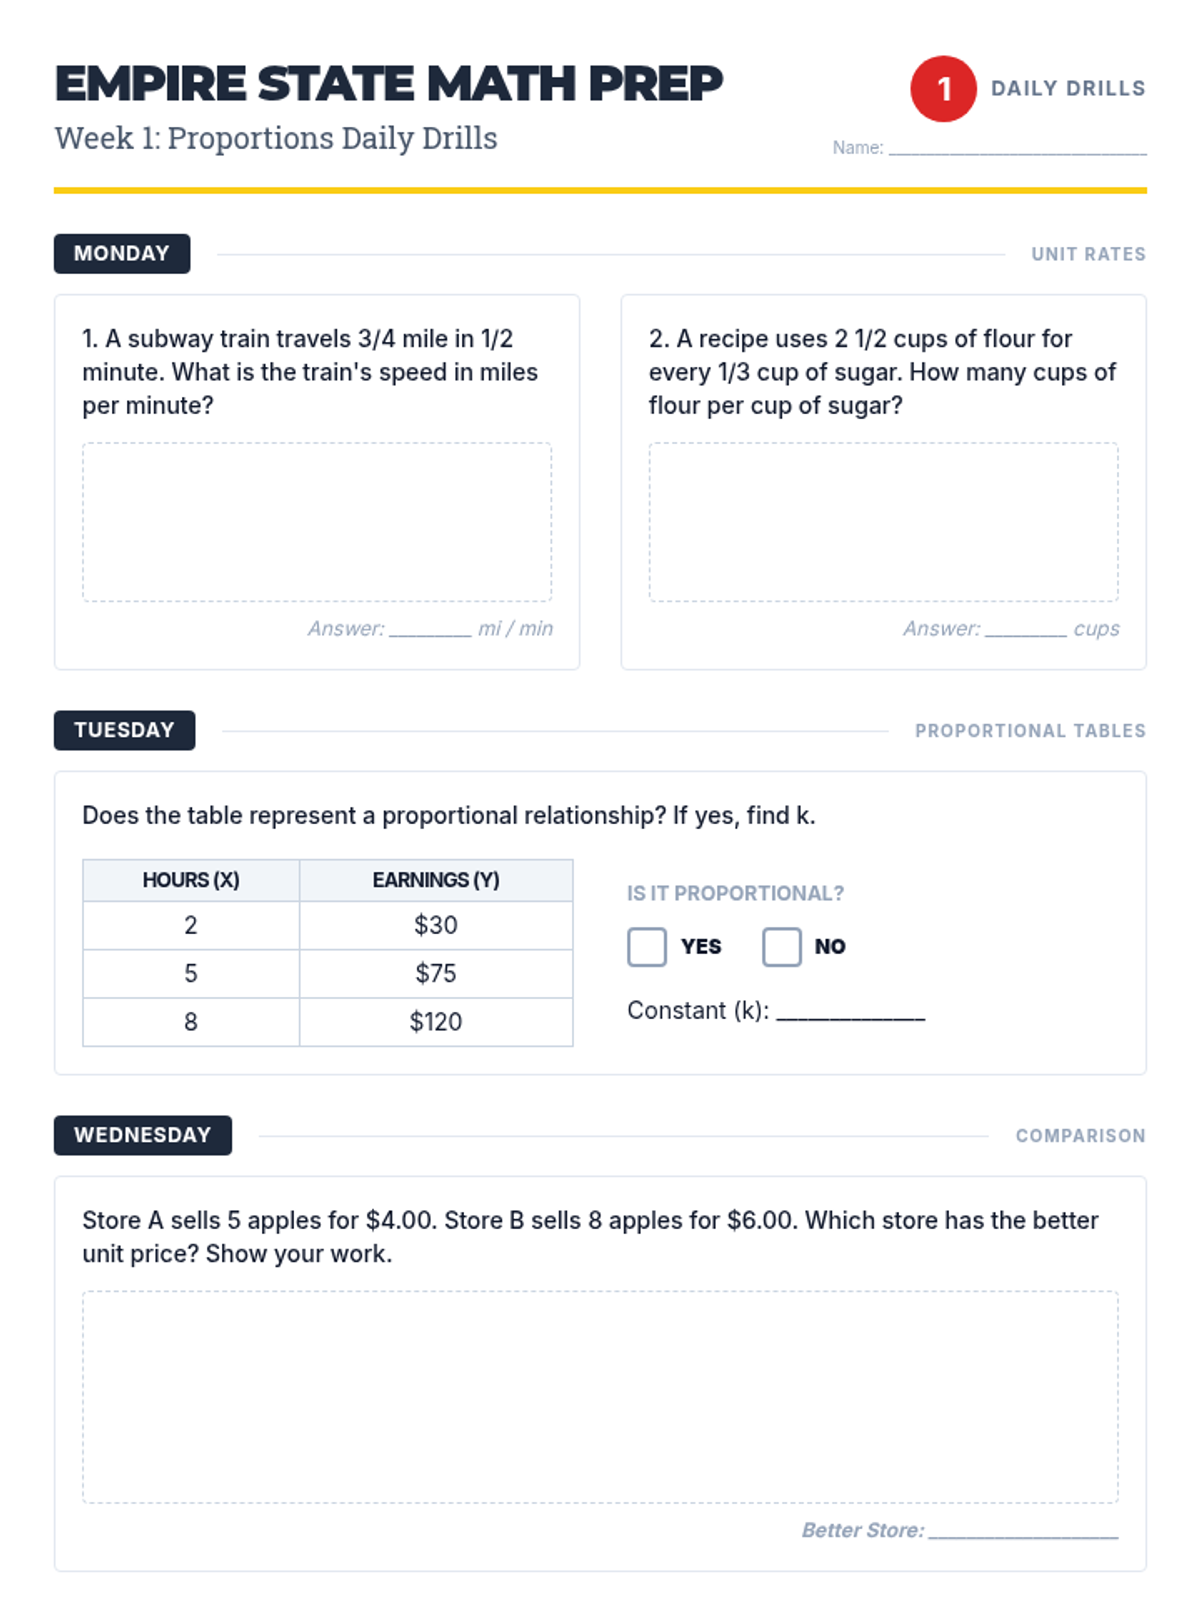
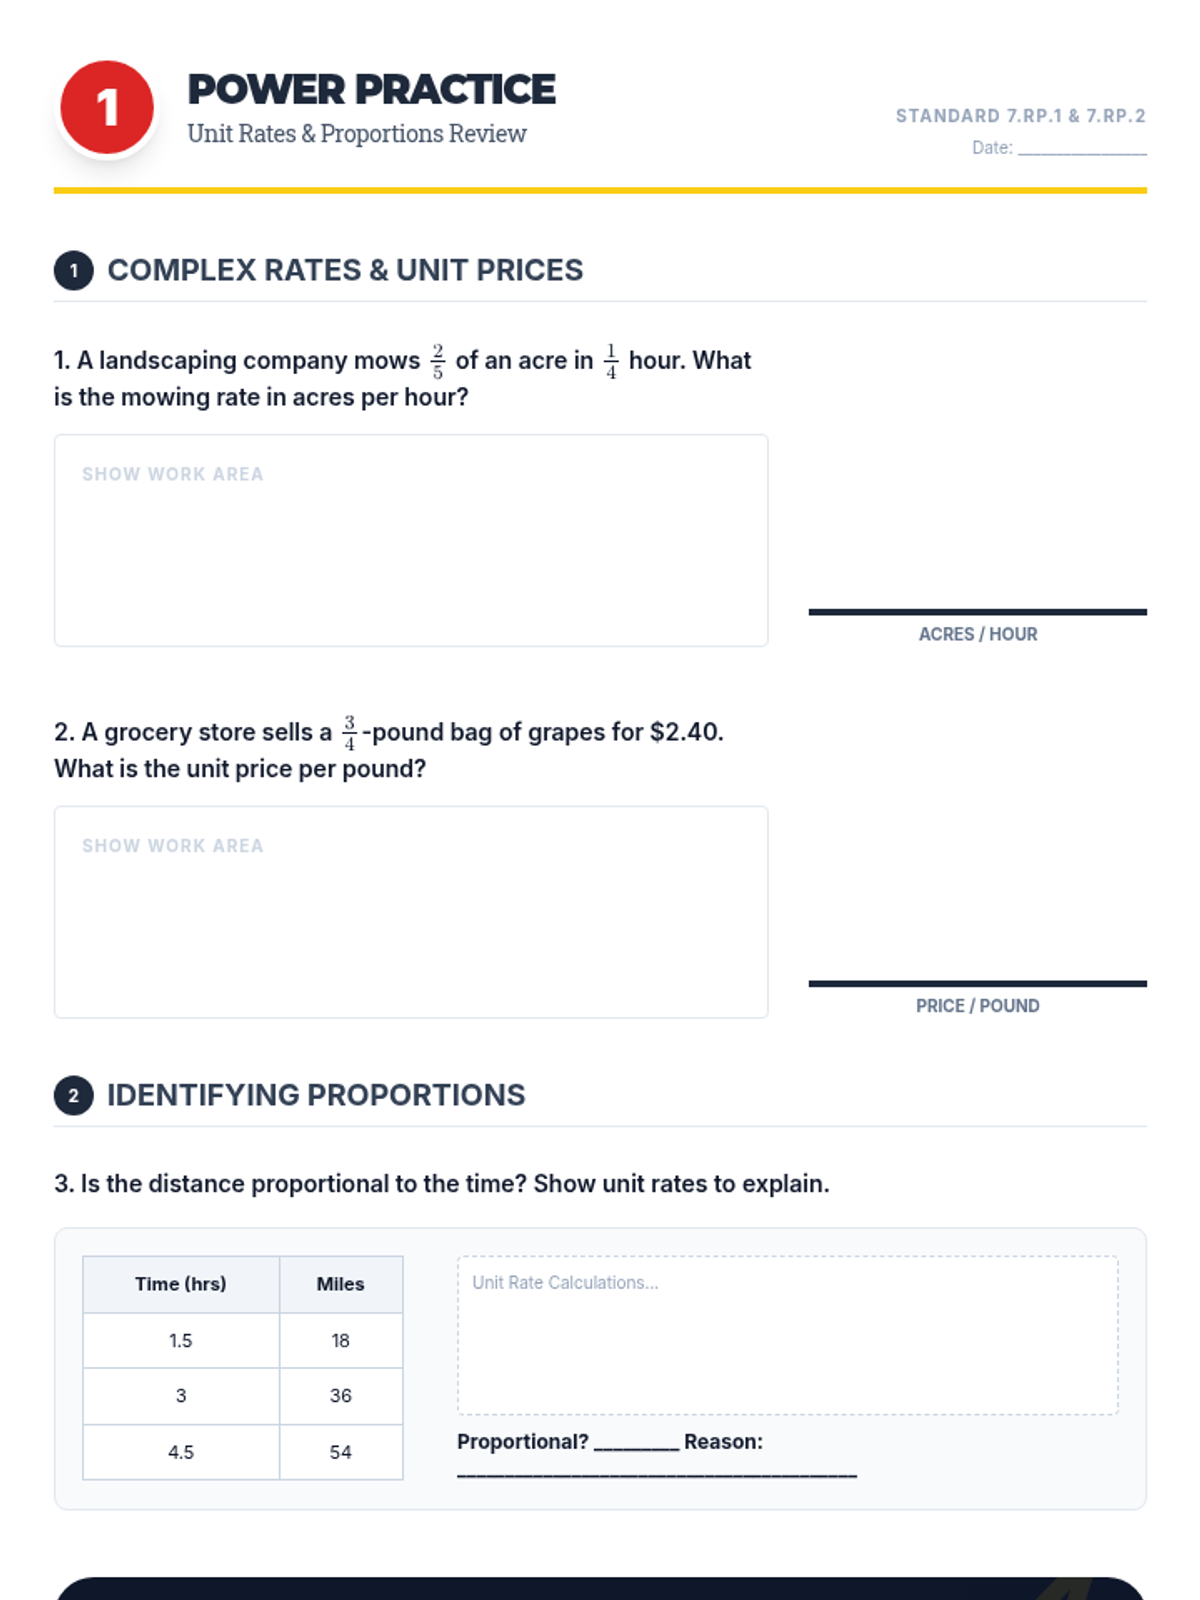
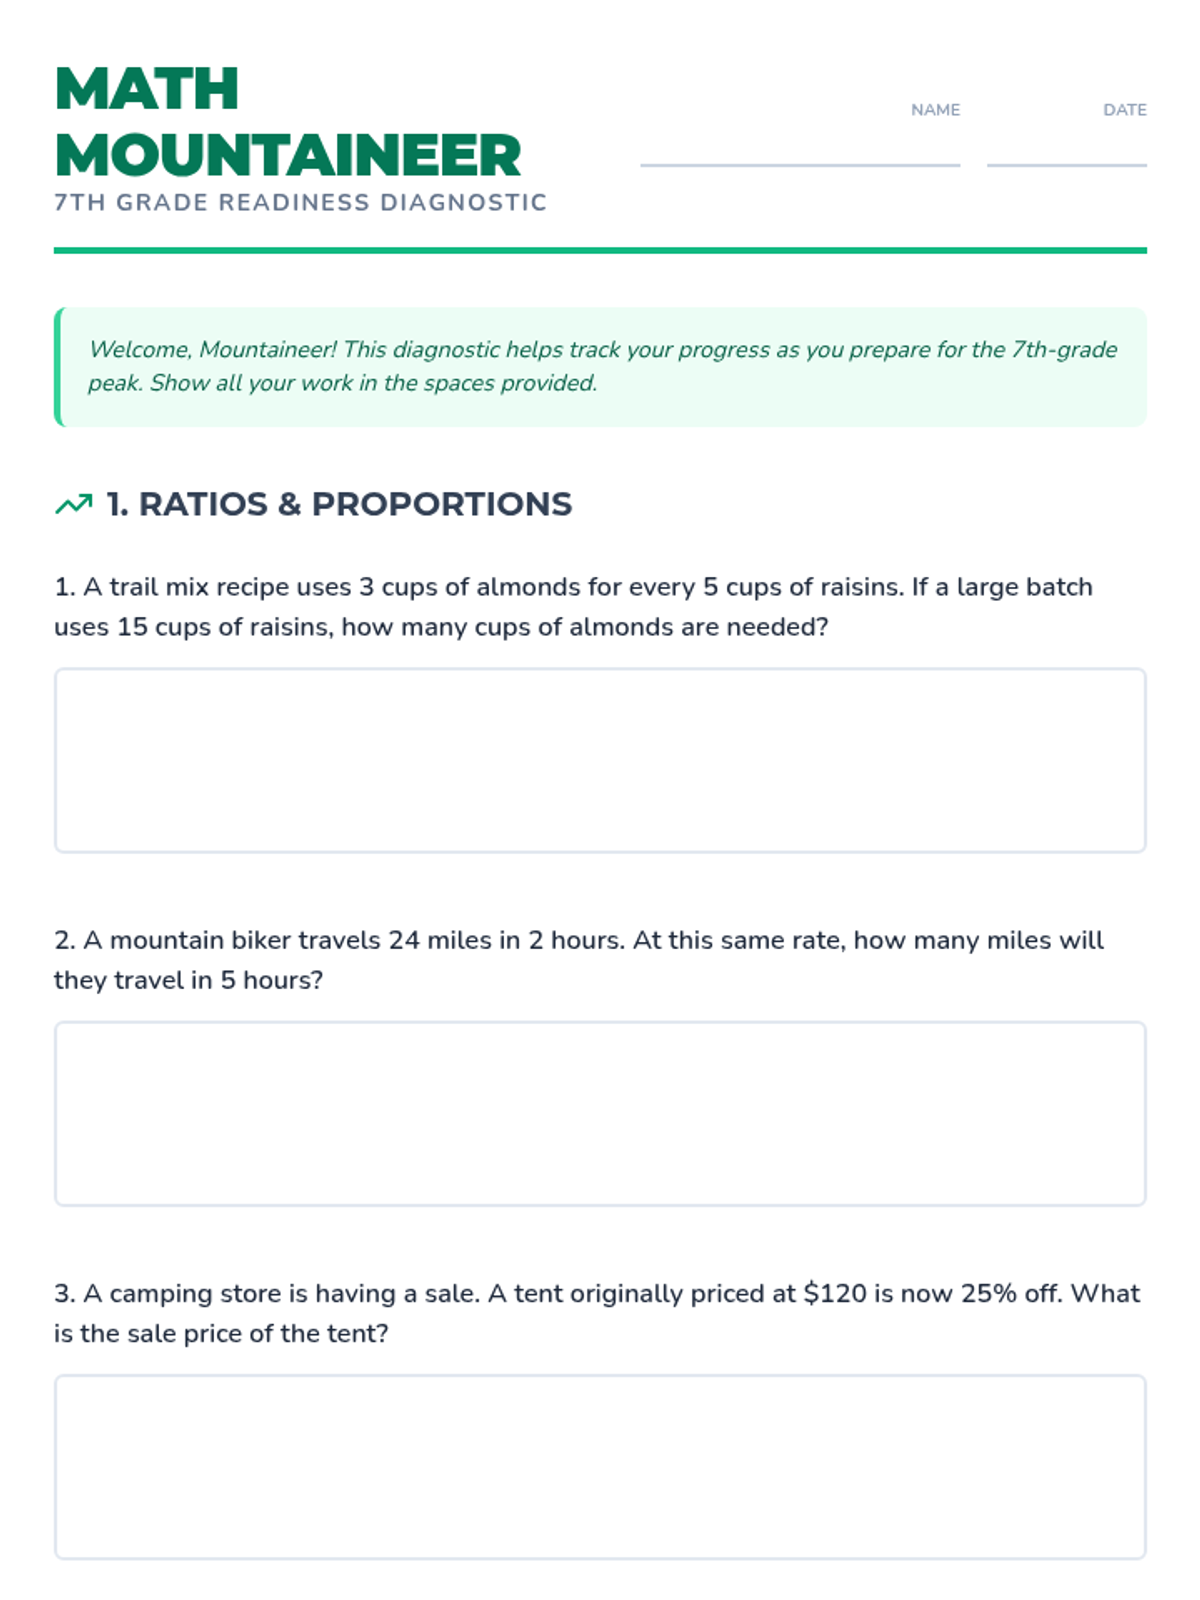
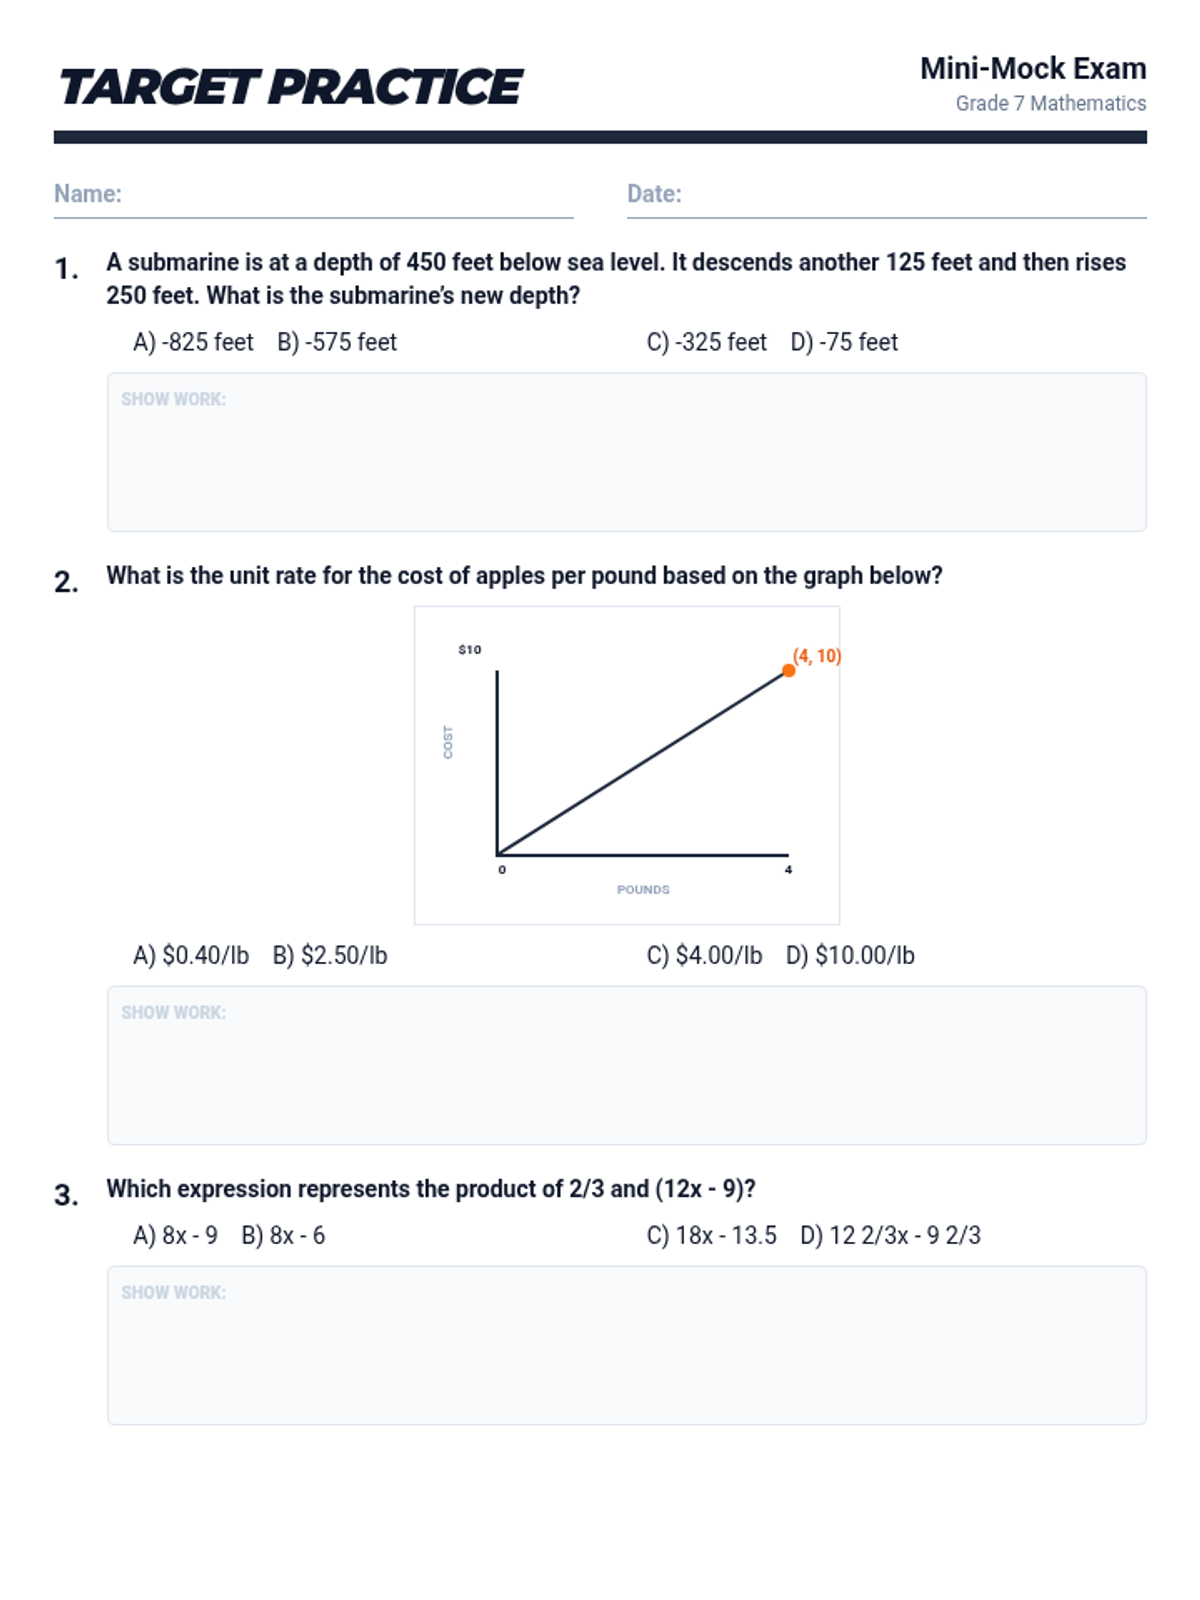
Review of ratios, unit rates with fractions, and identifying proportional relationships in tables and context.
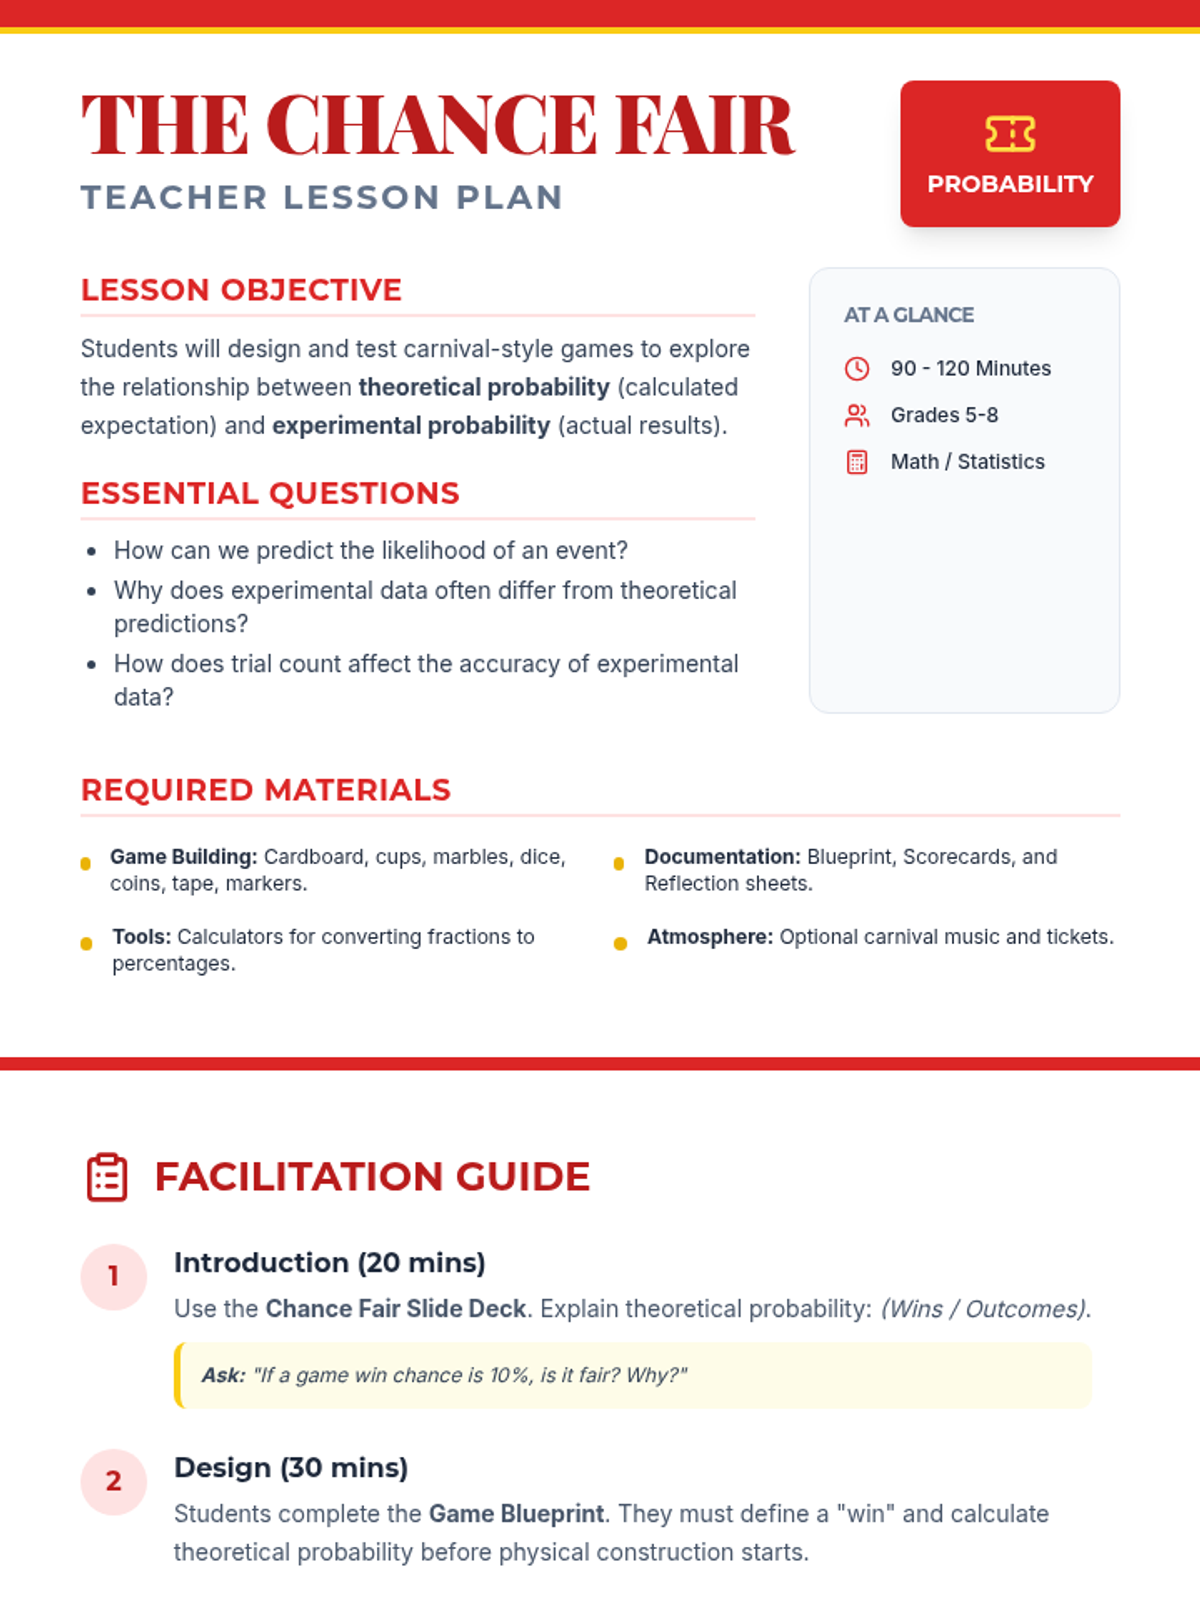
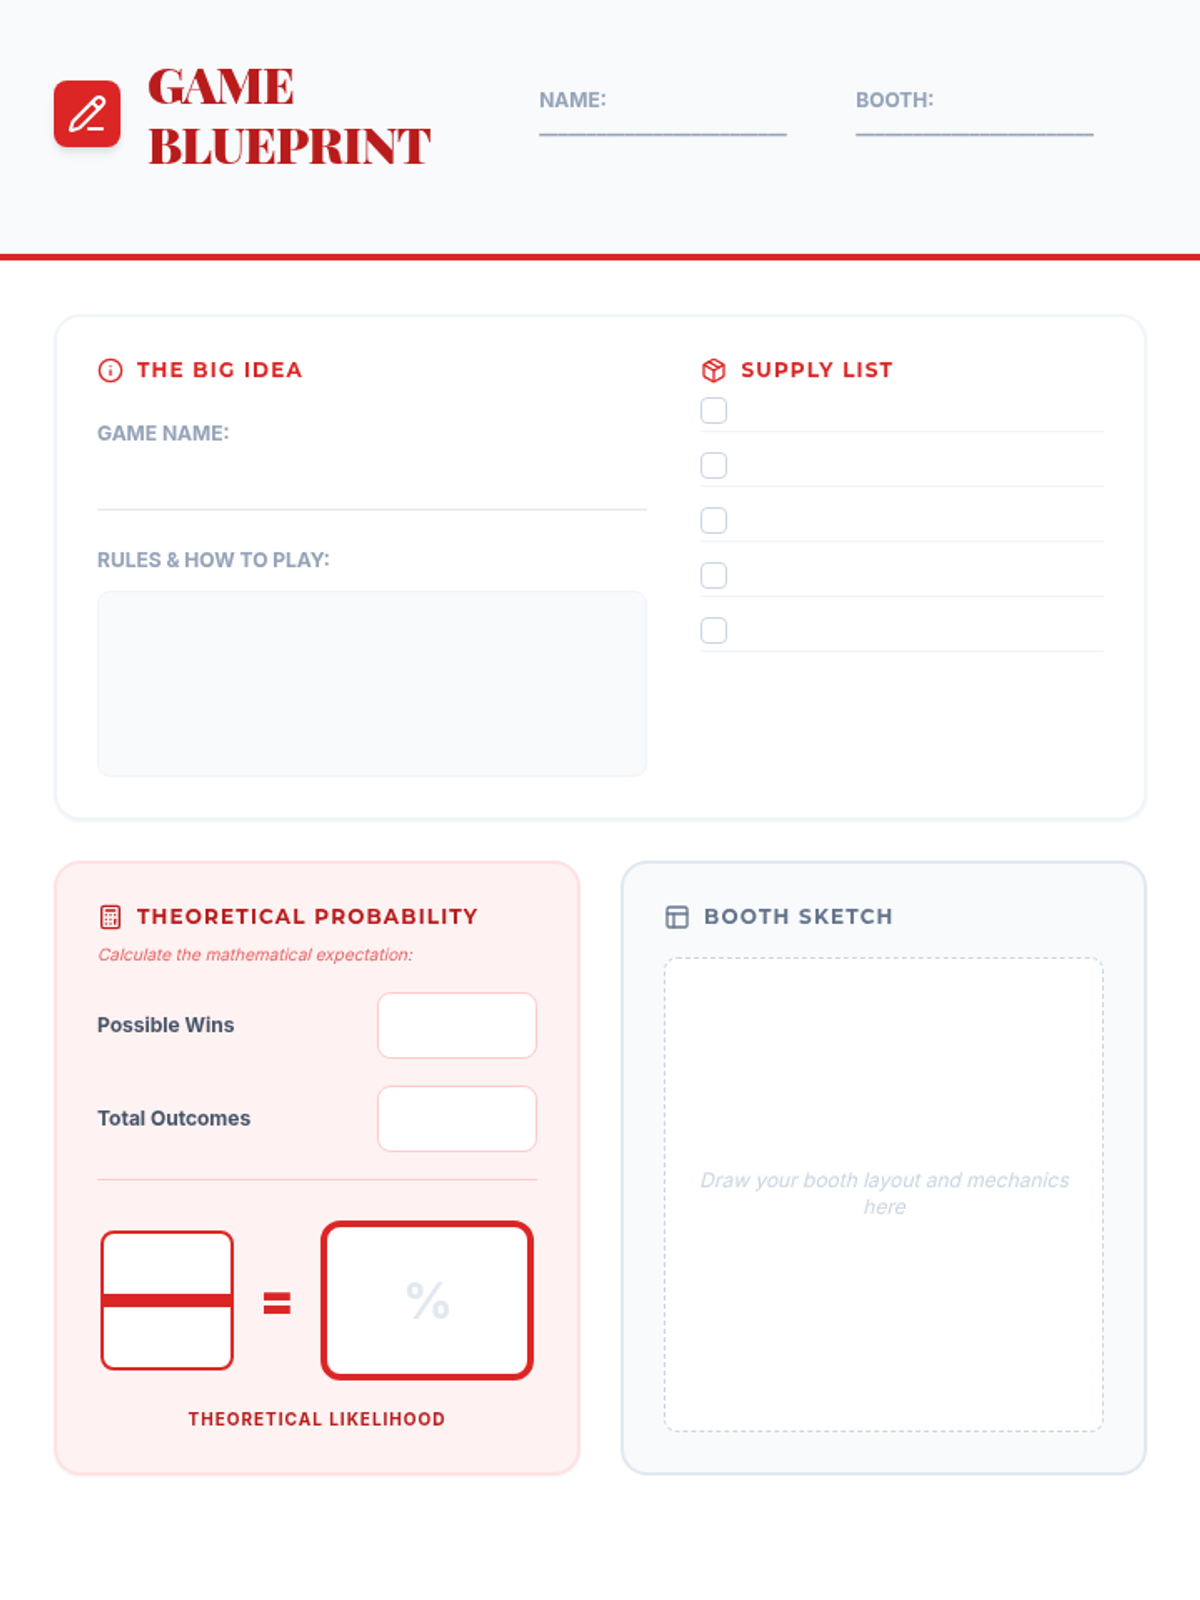
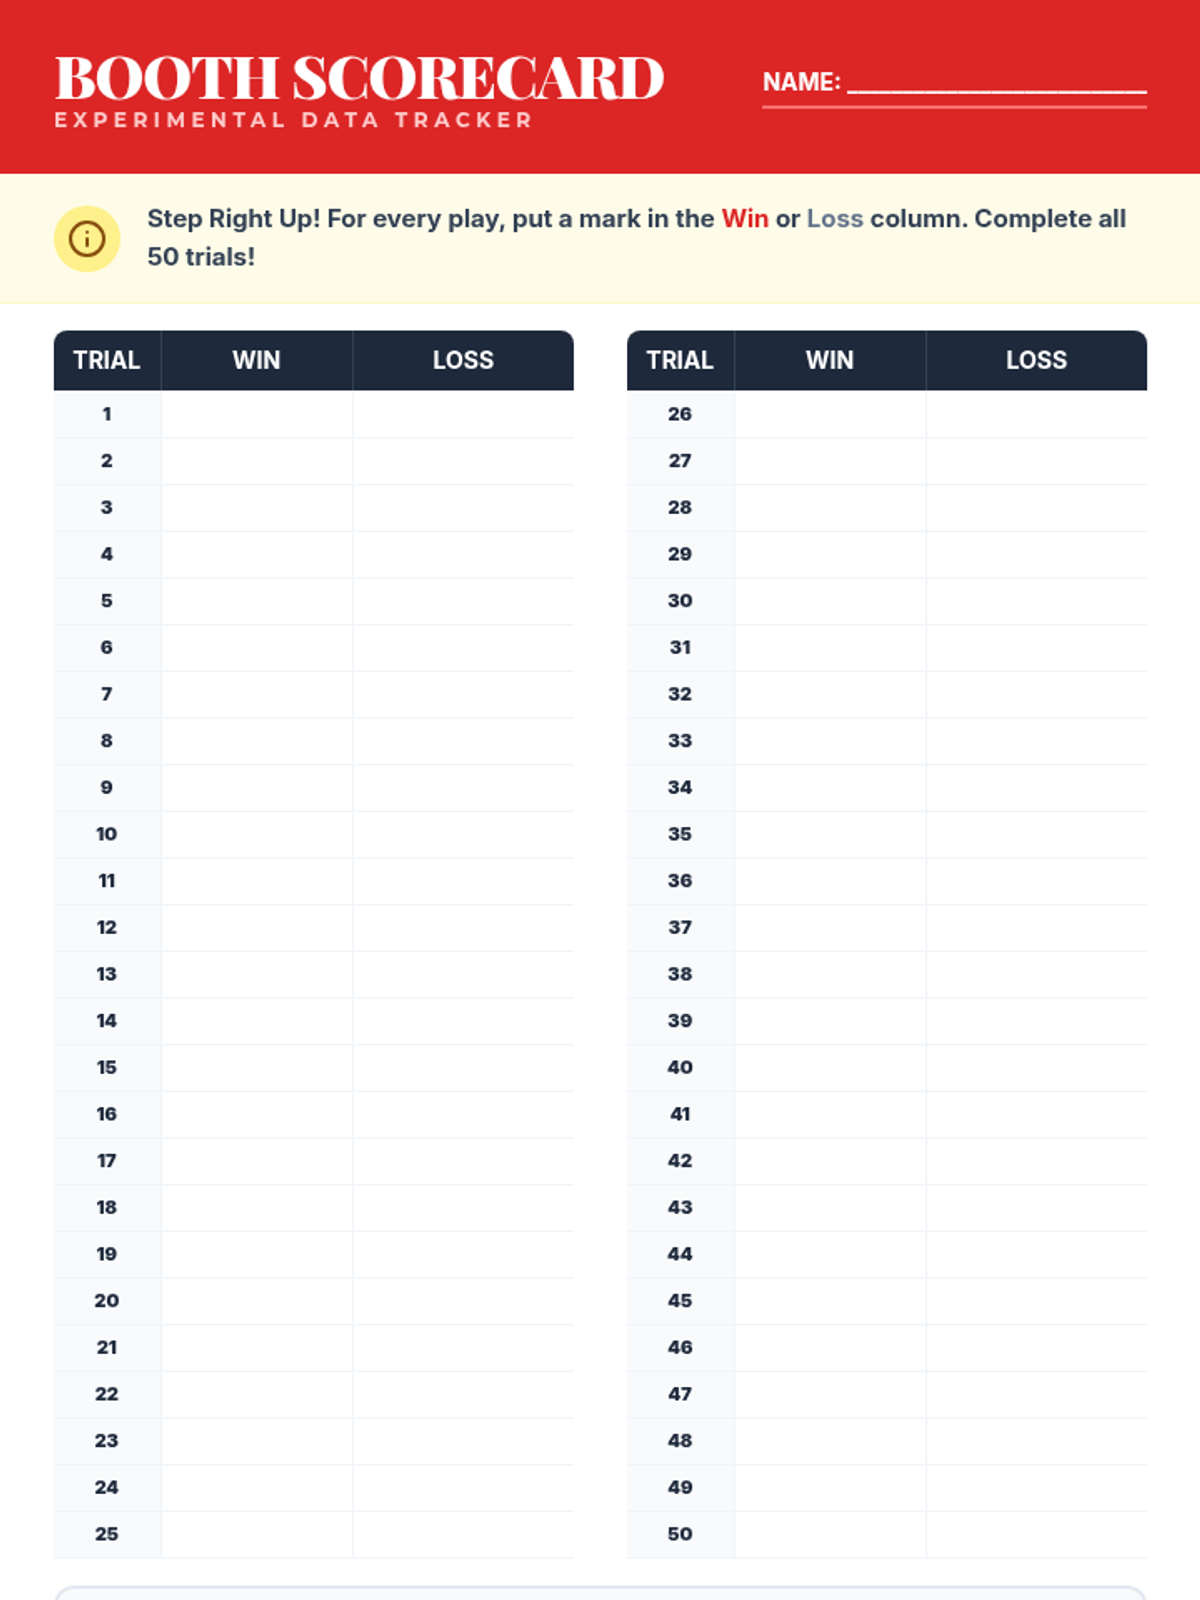
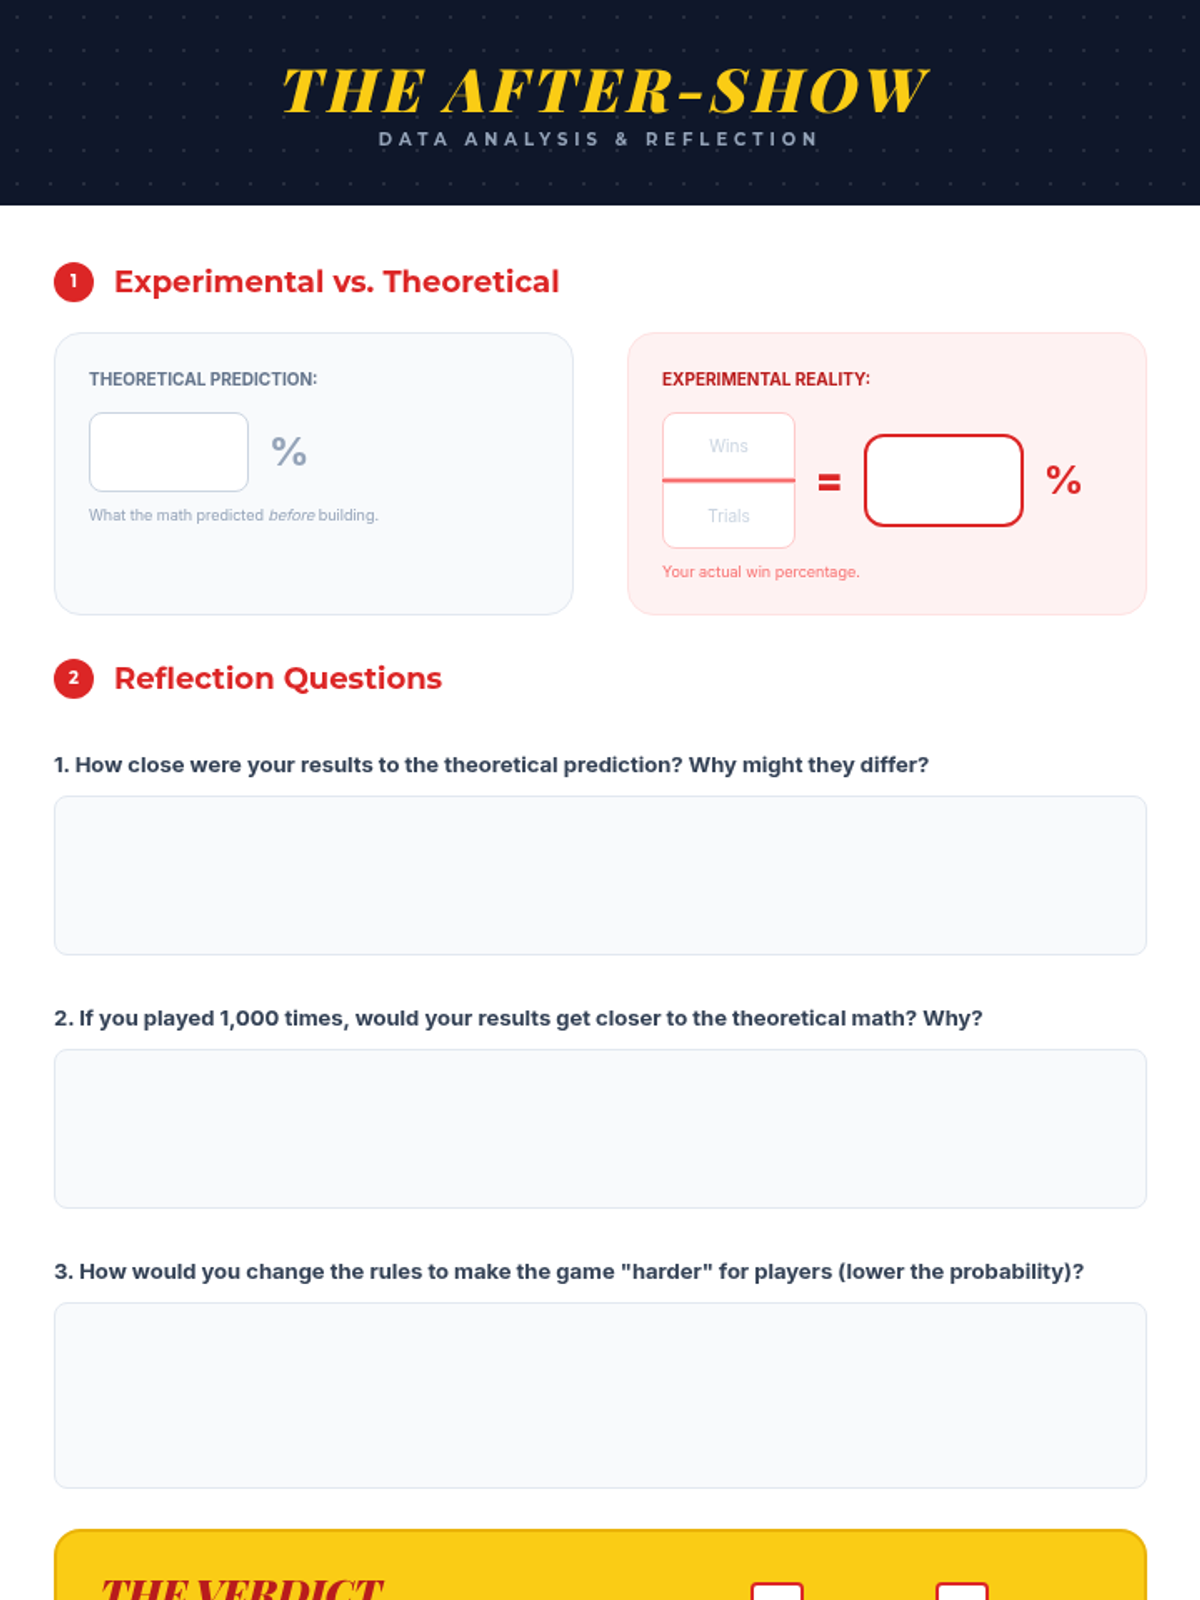
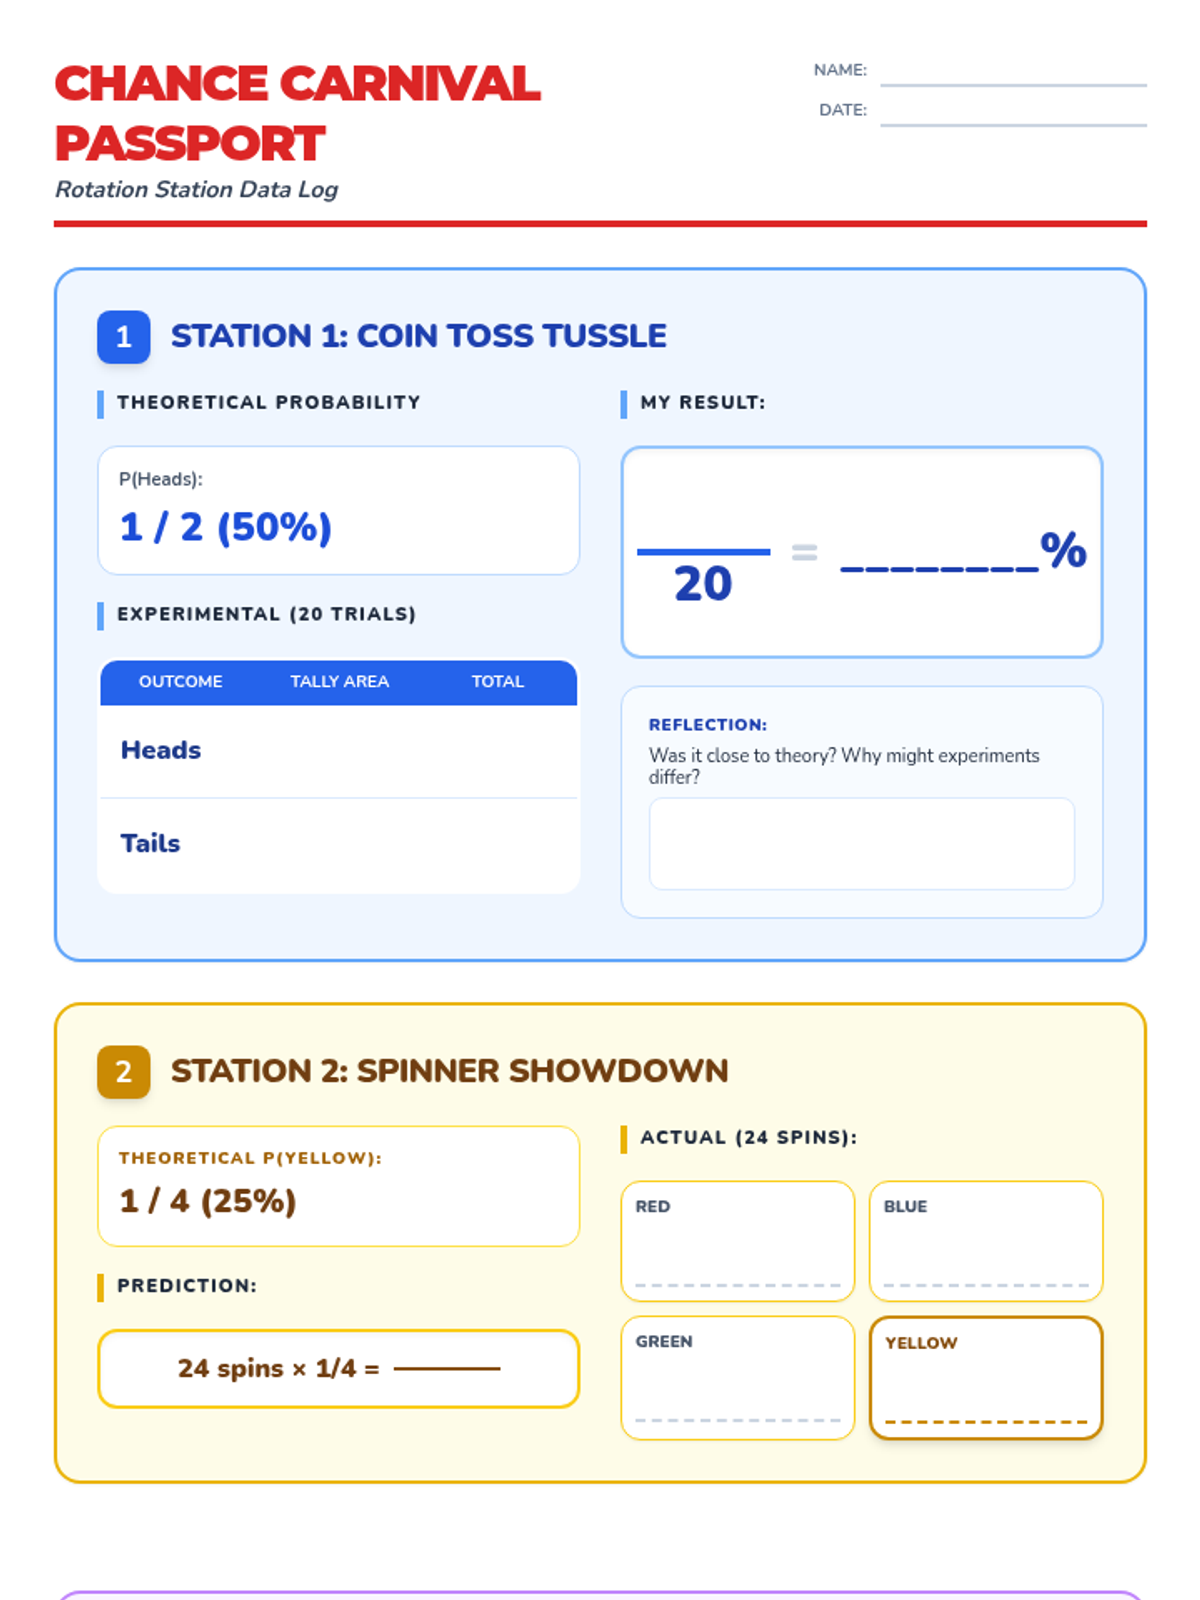
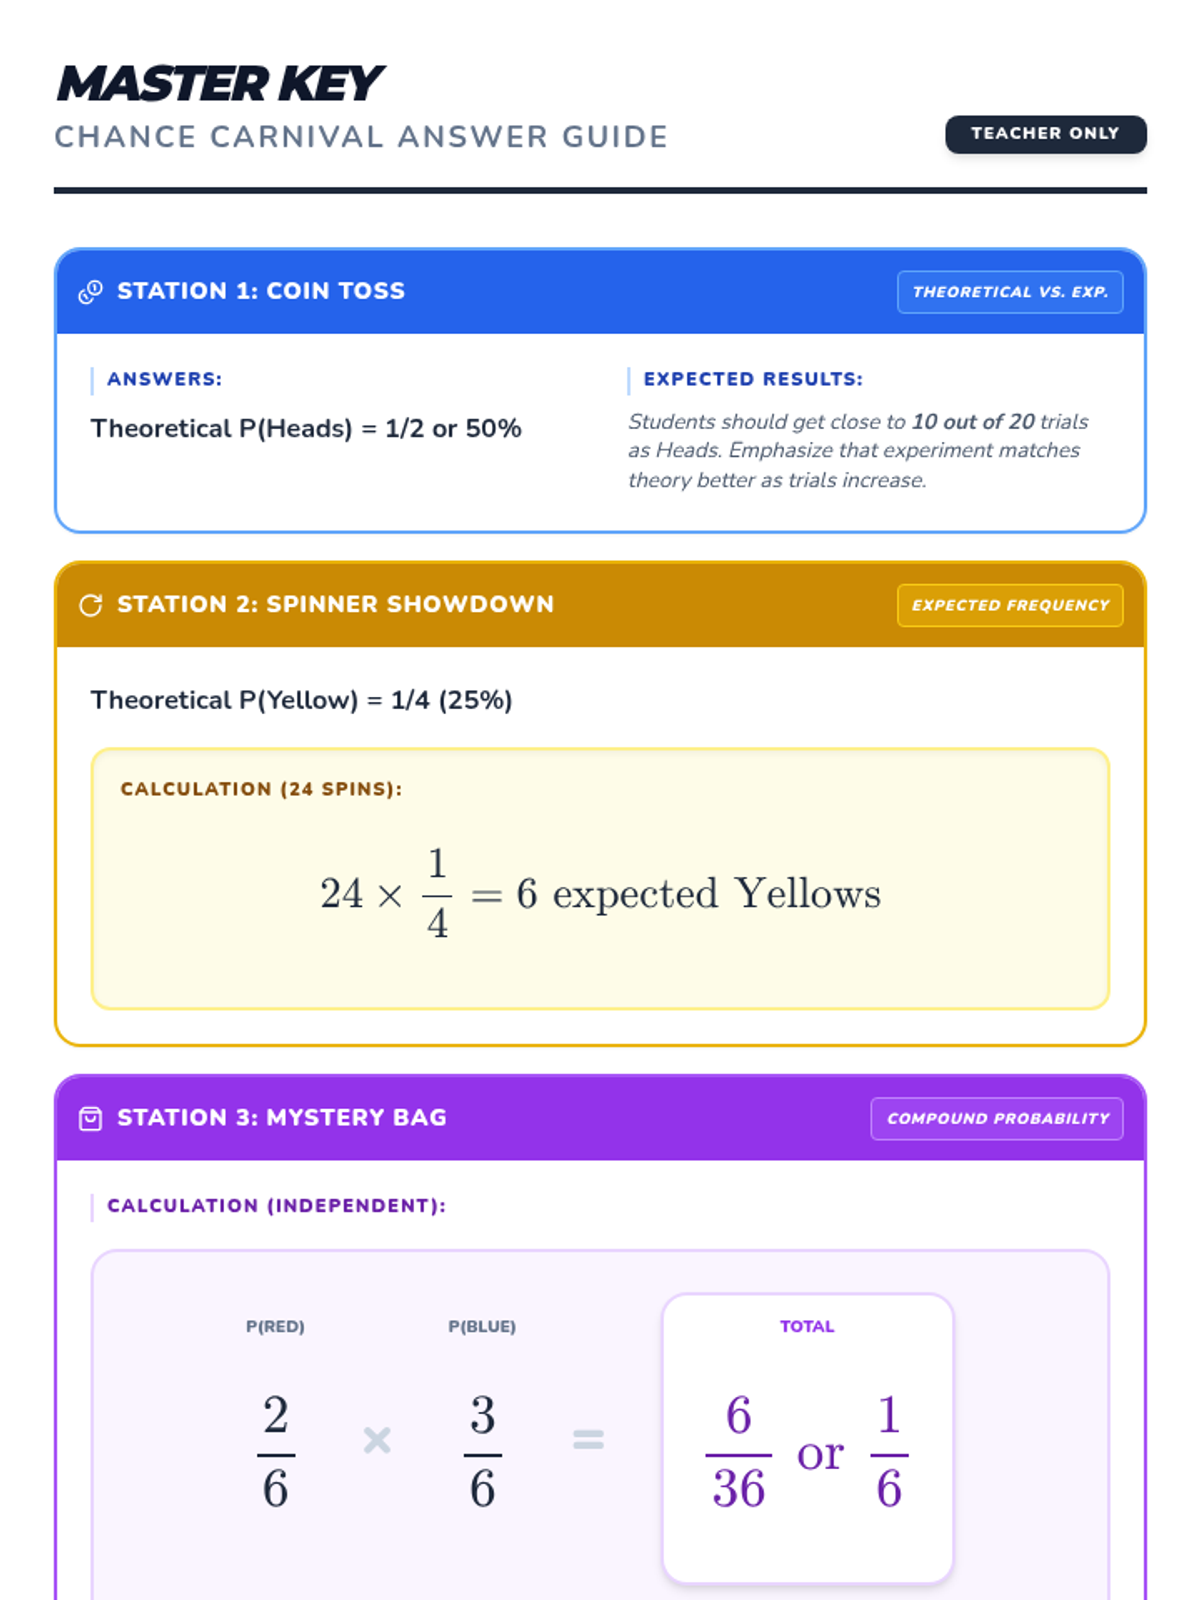
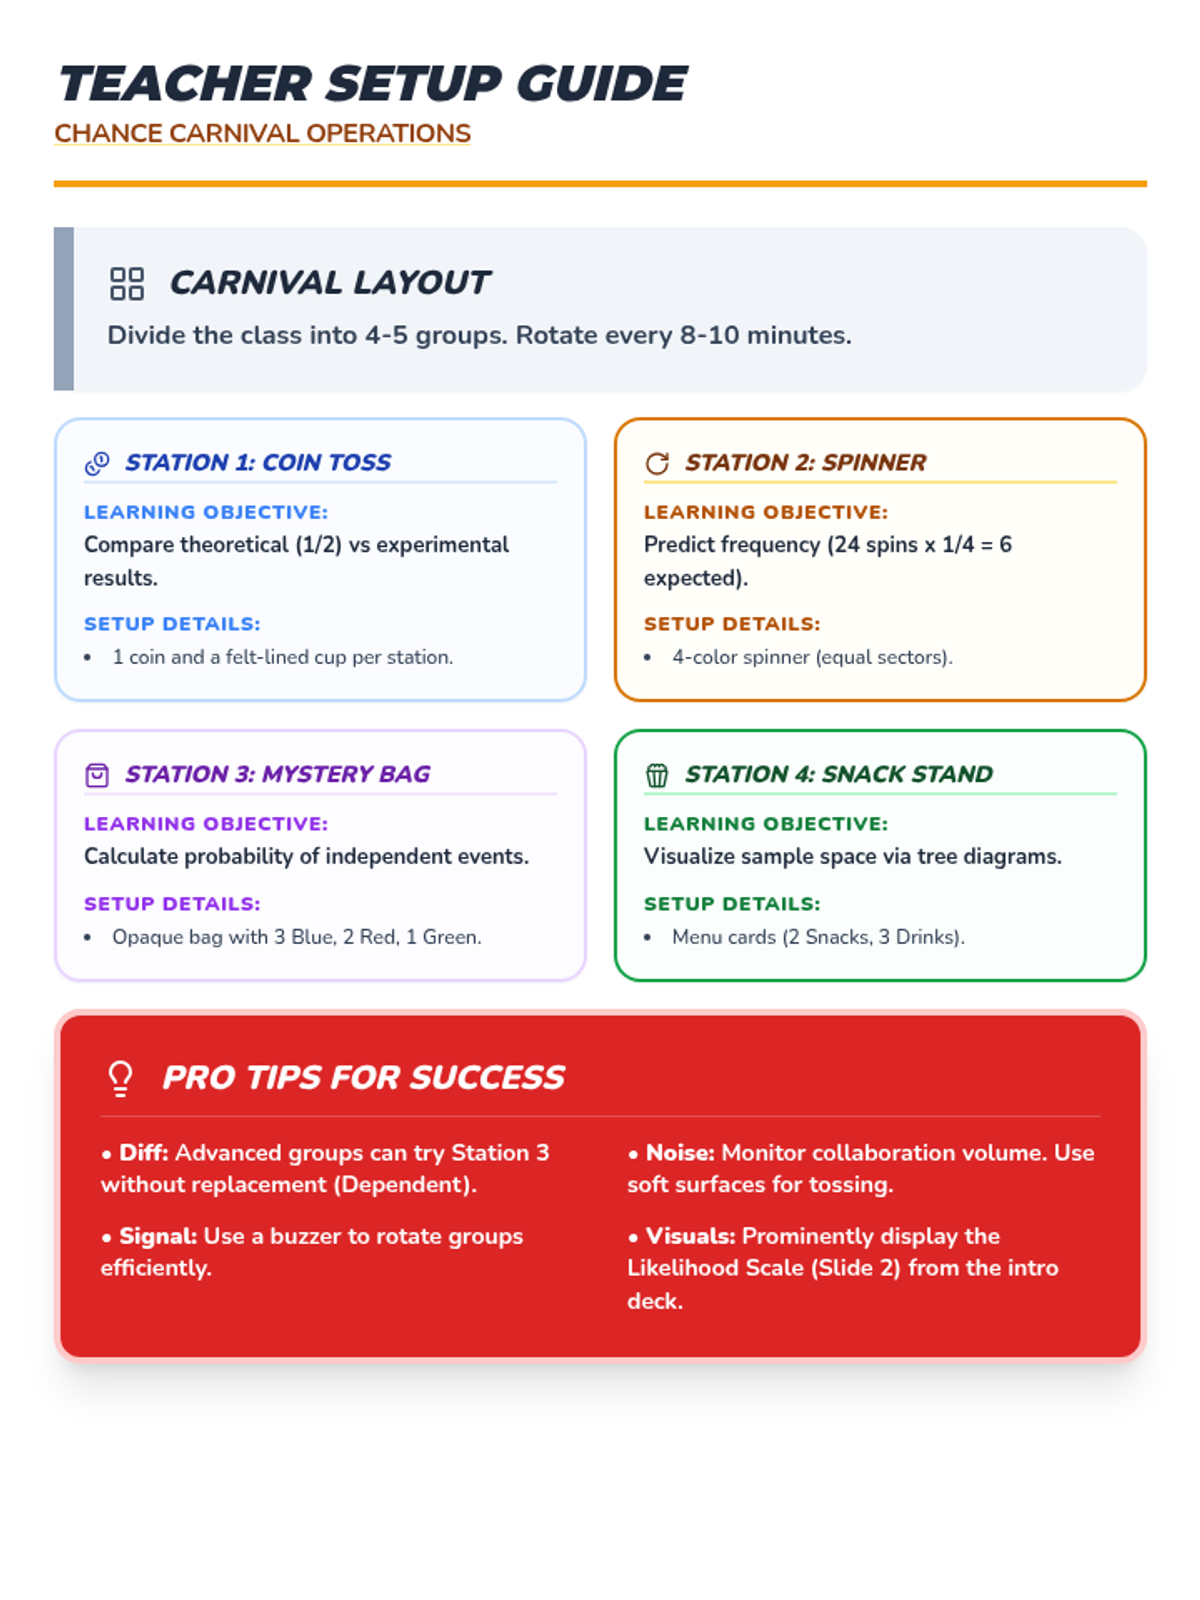
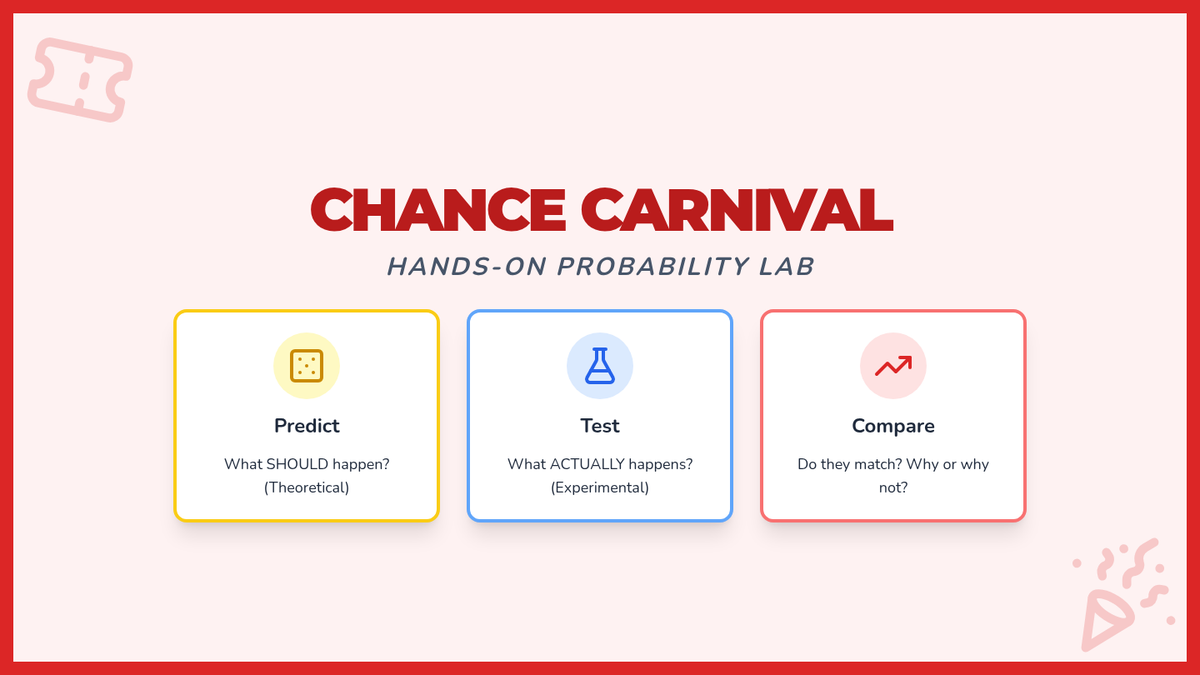
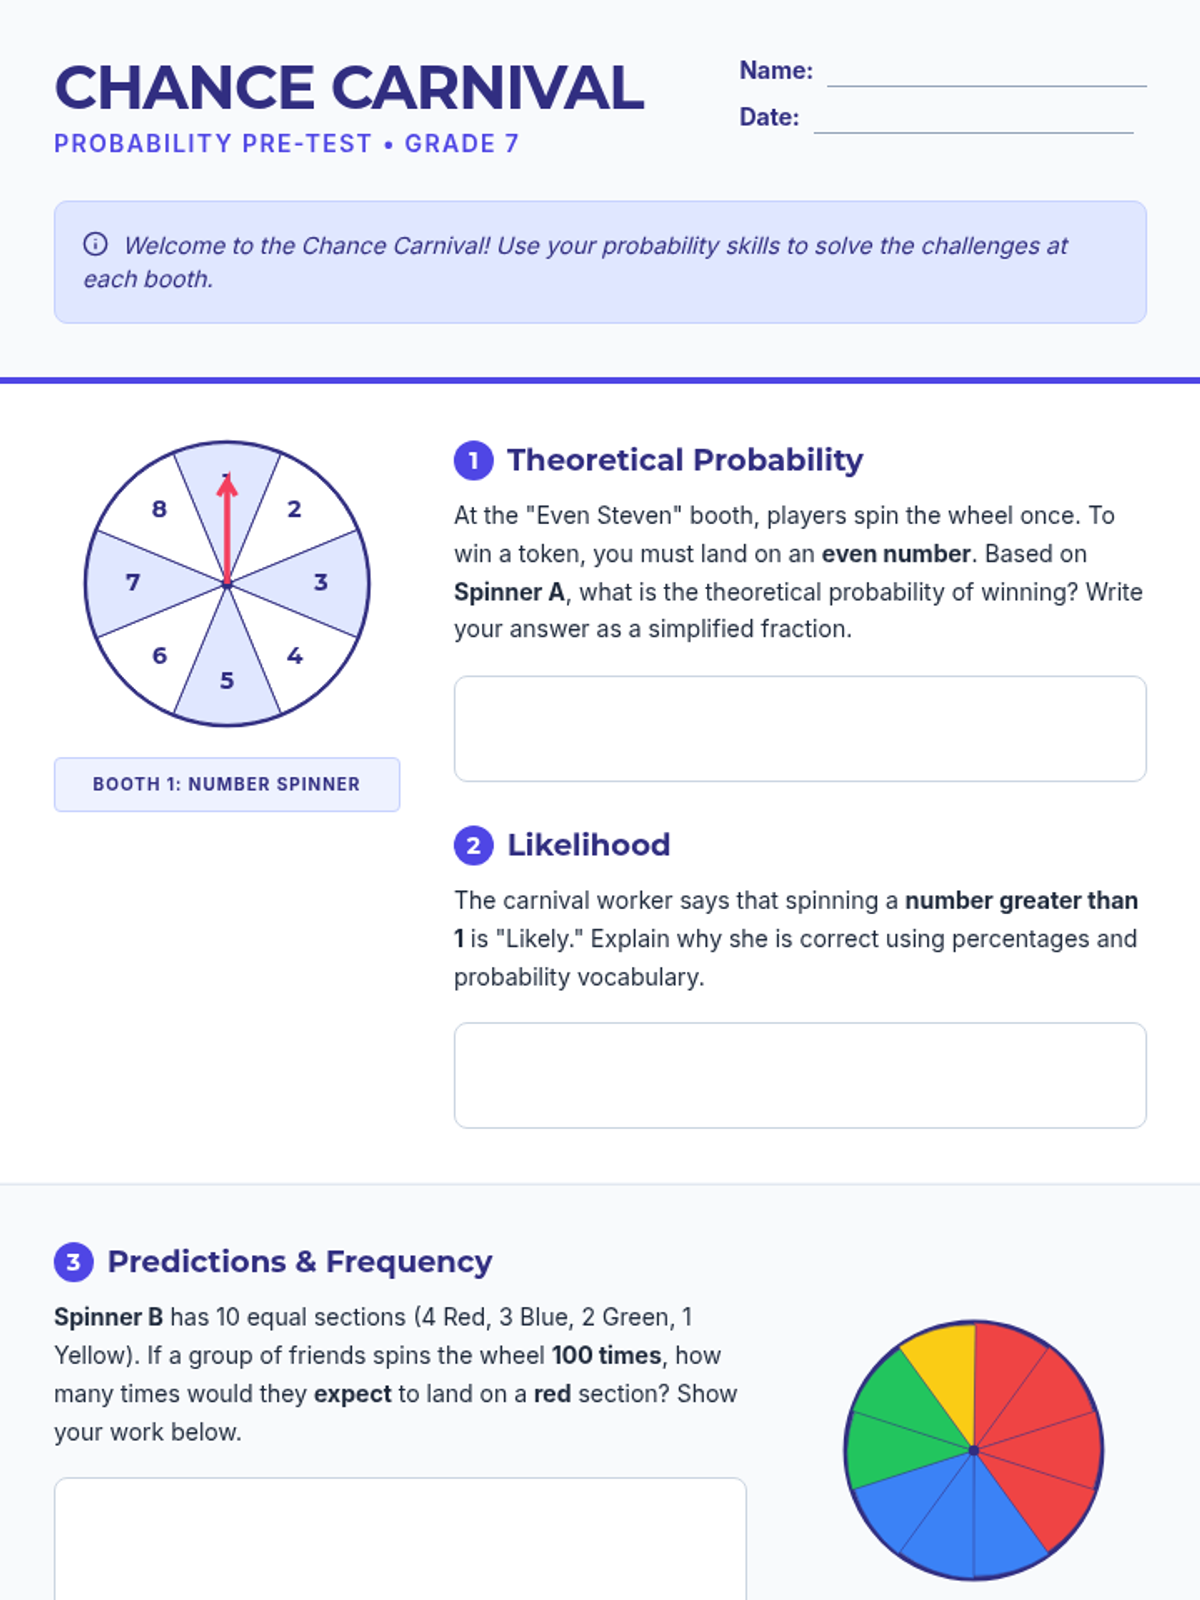
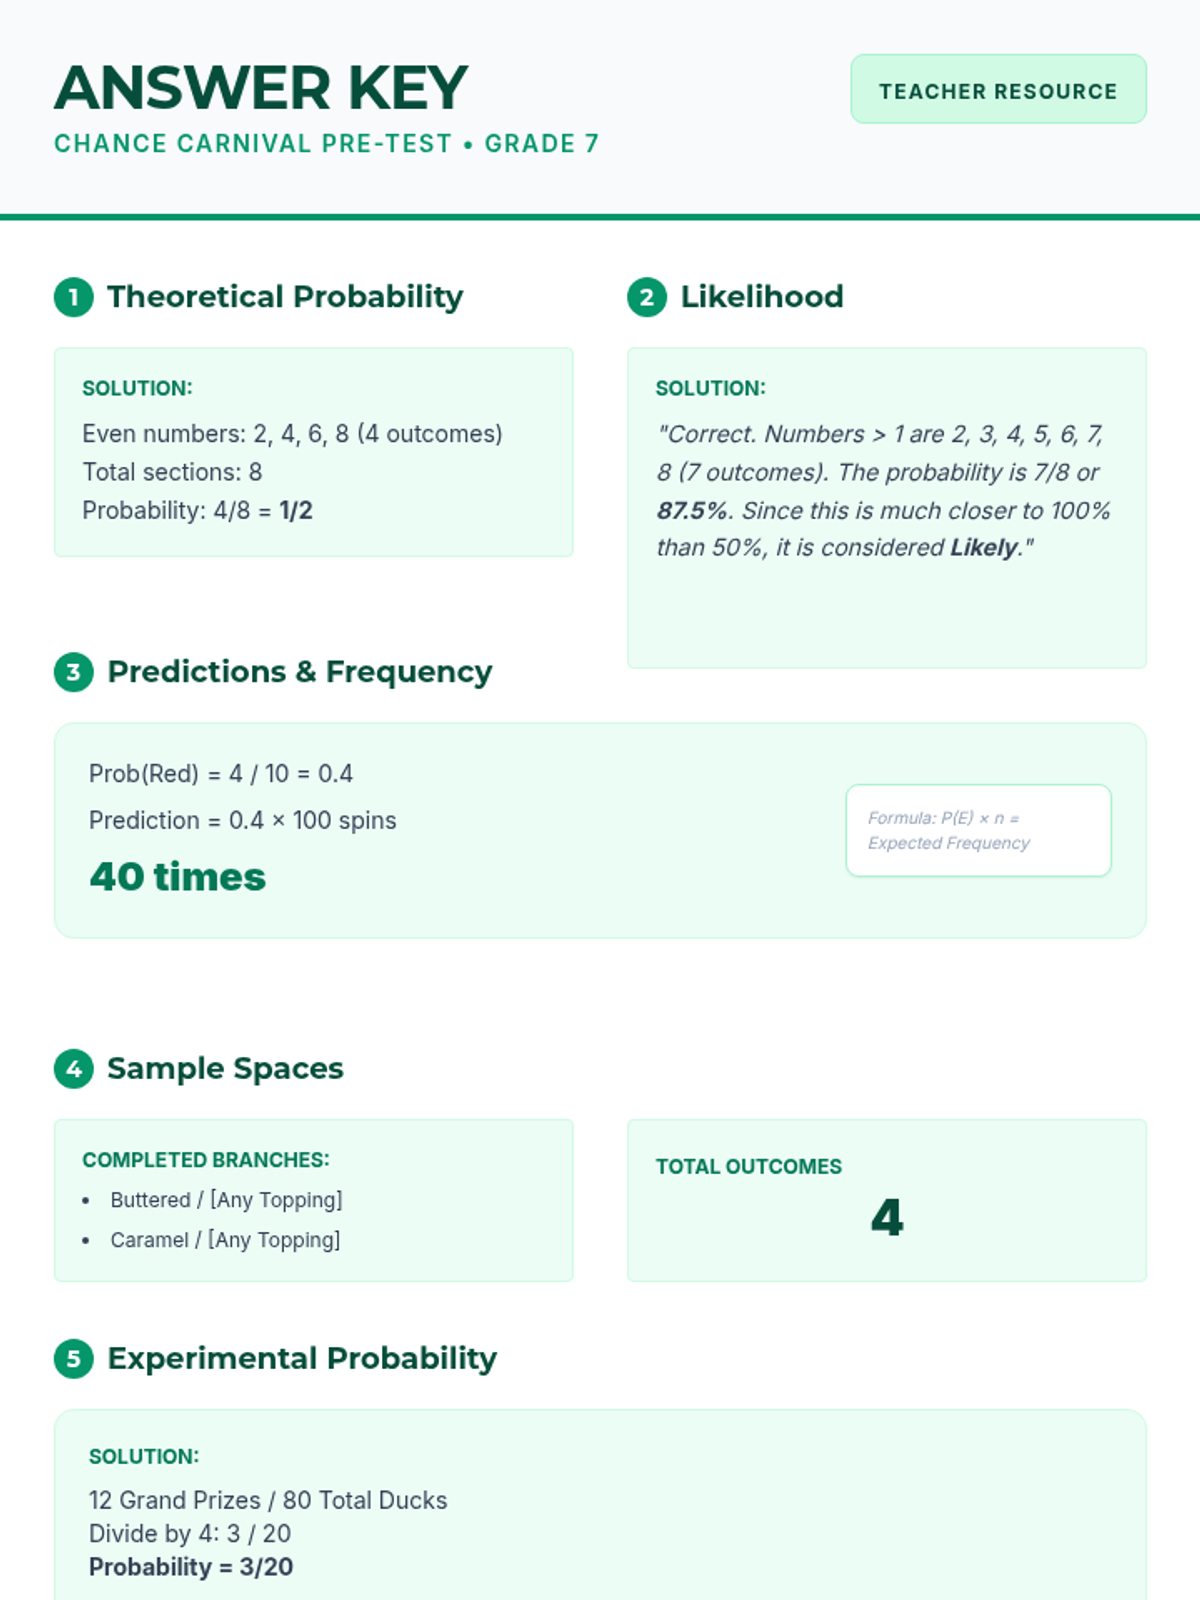
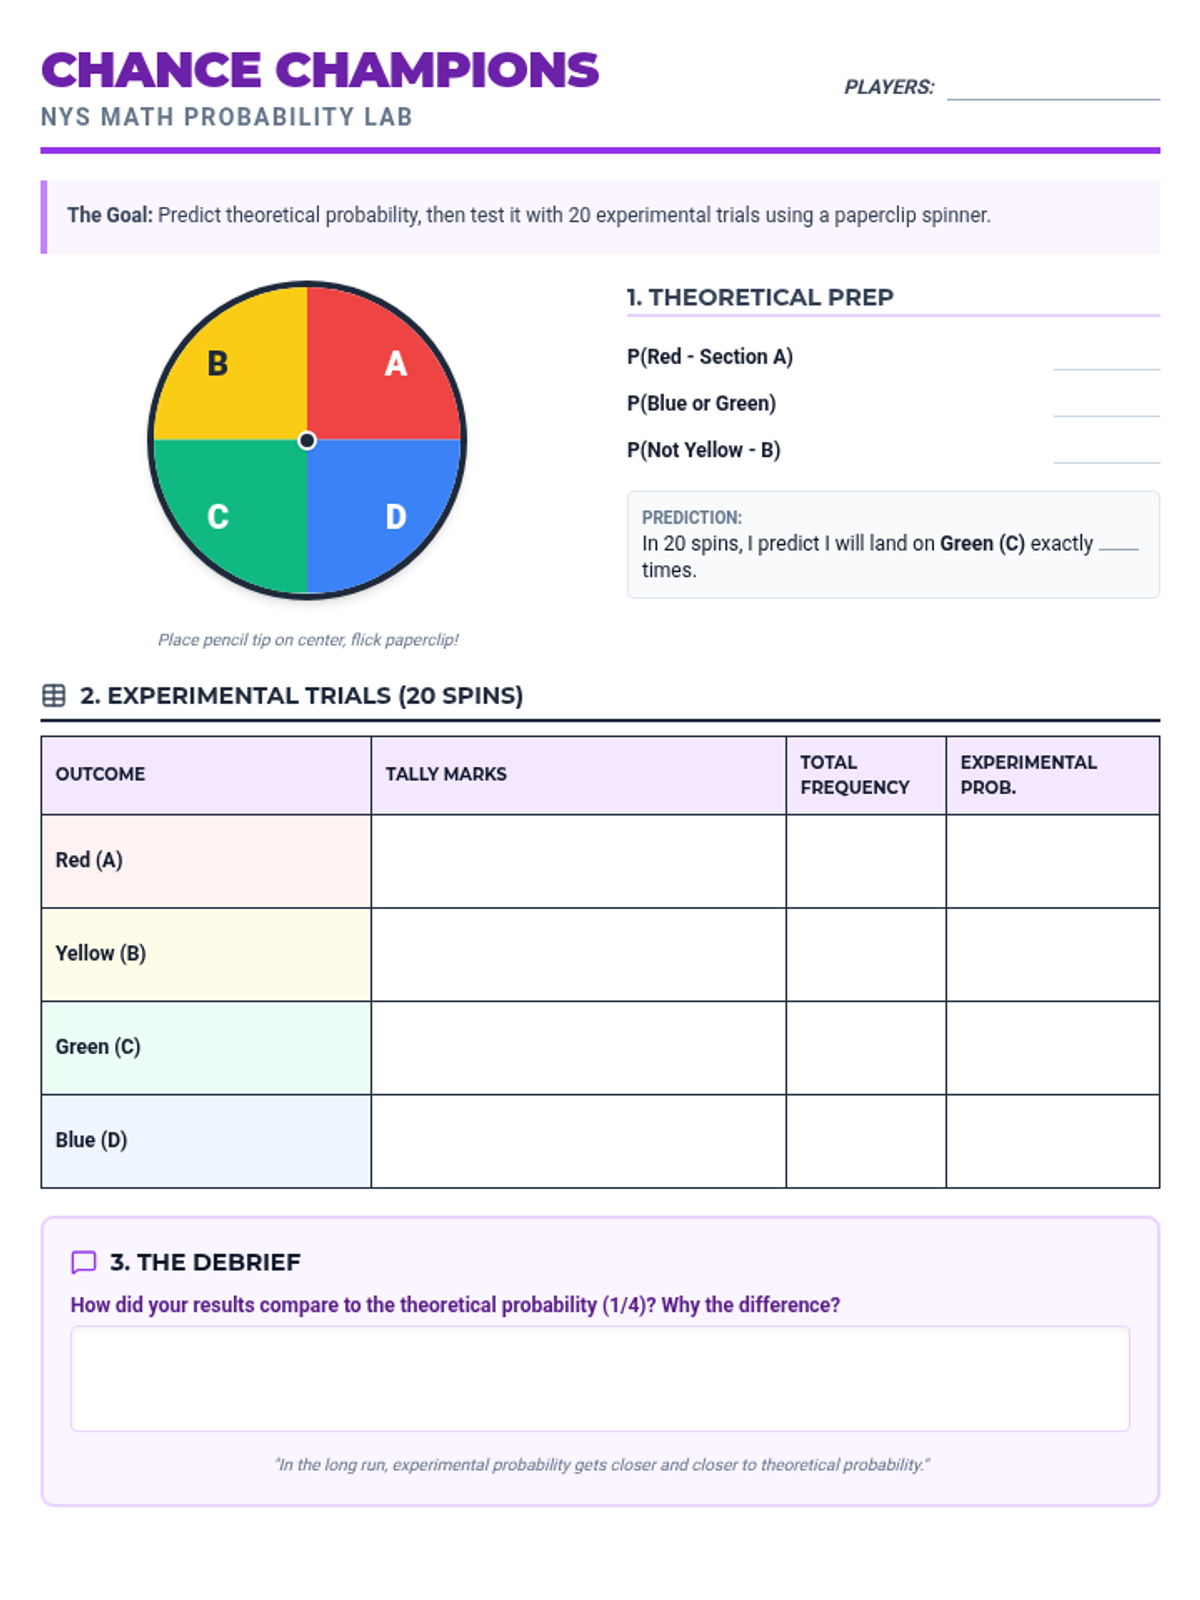
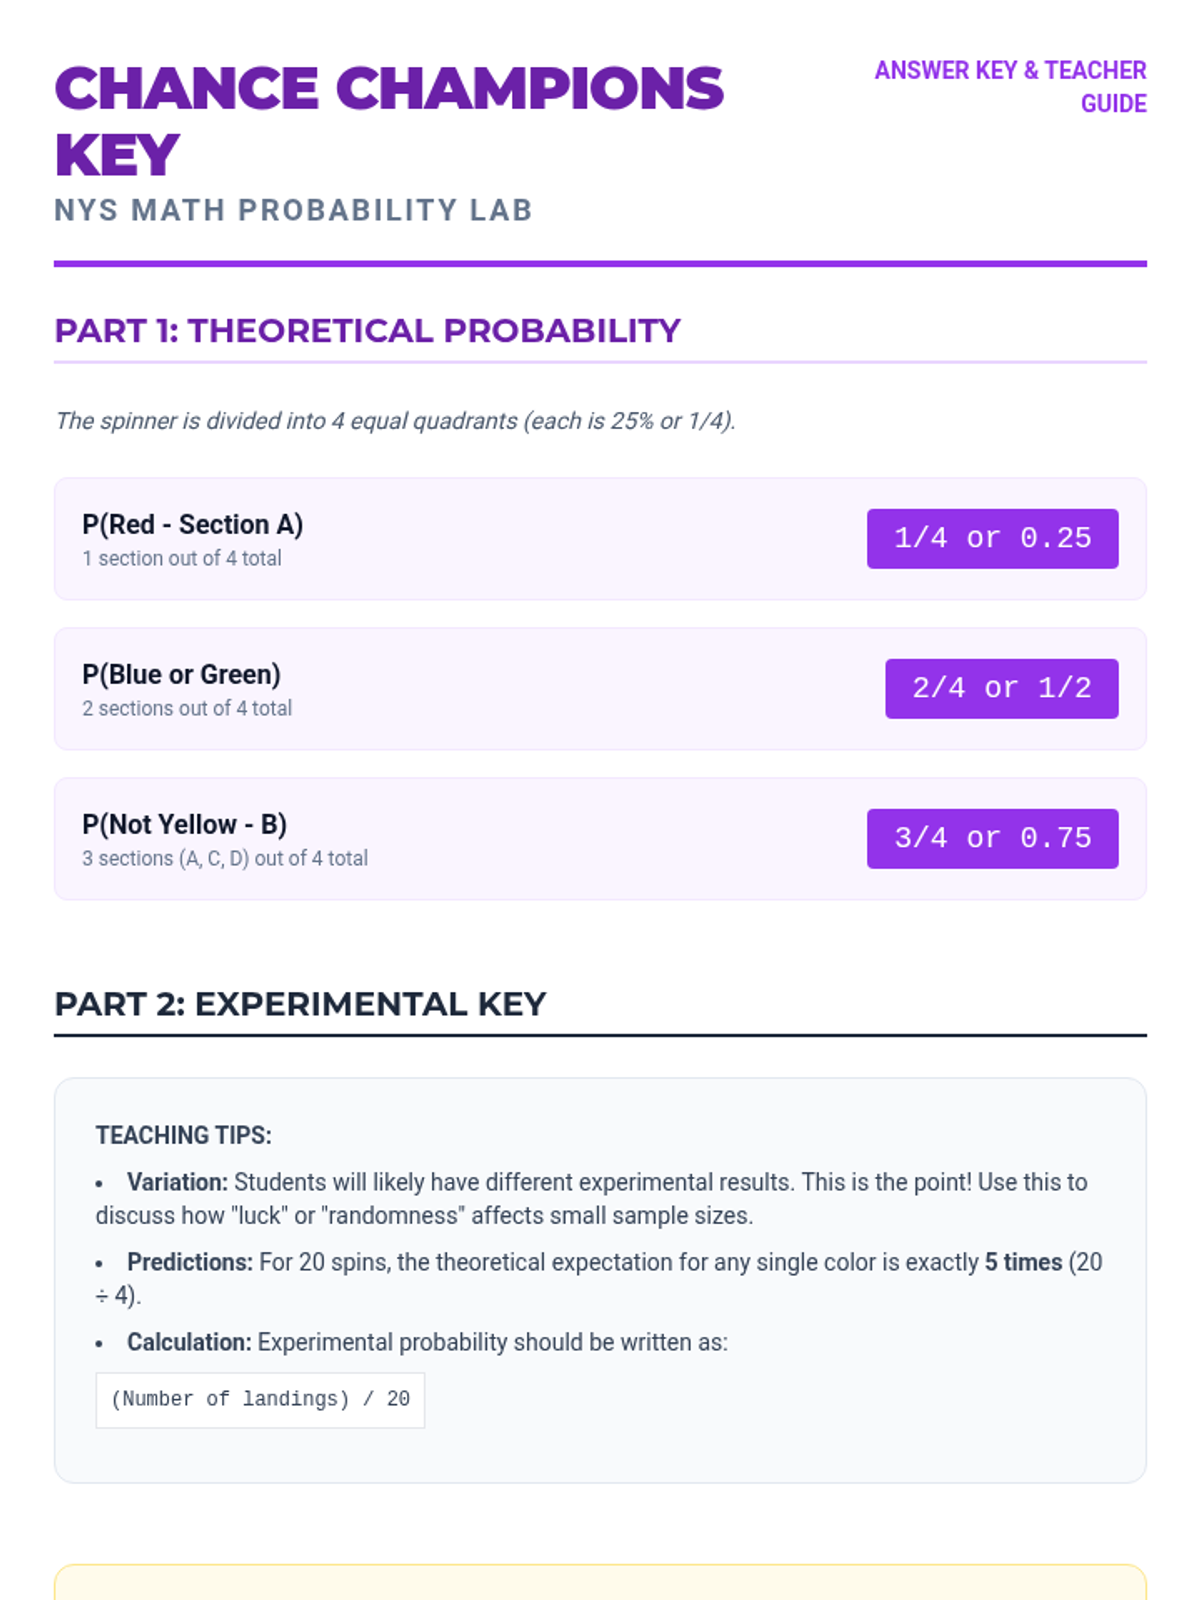
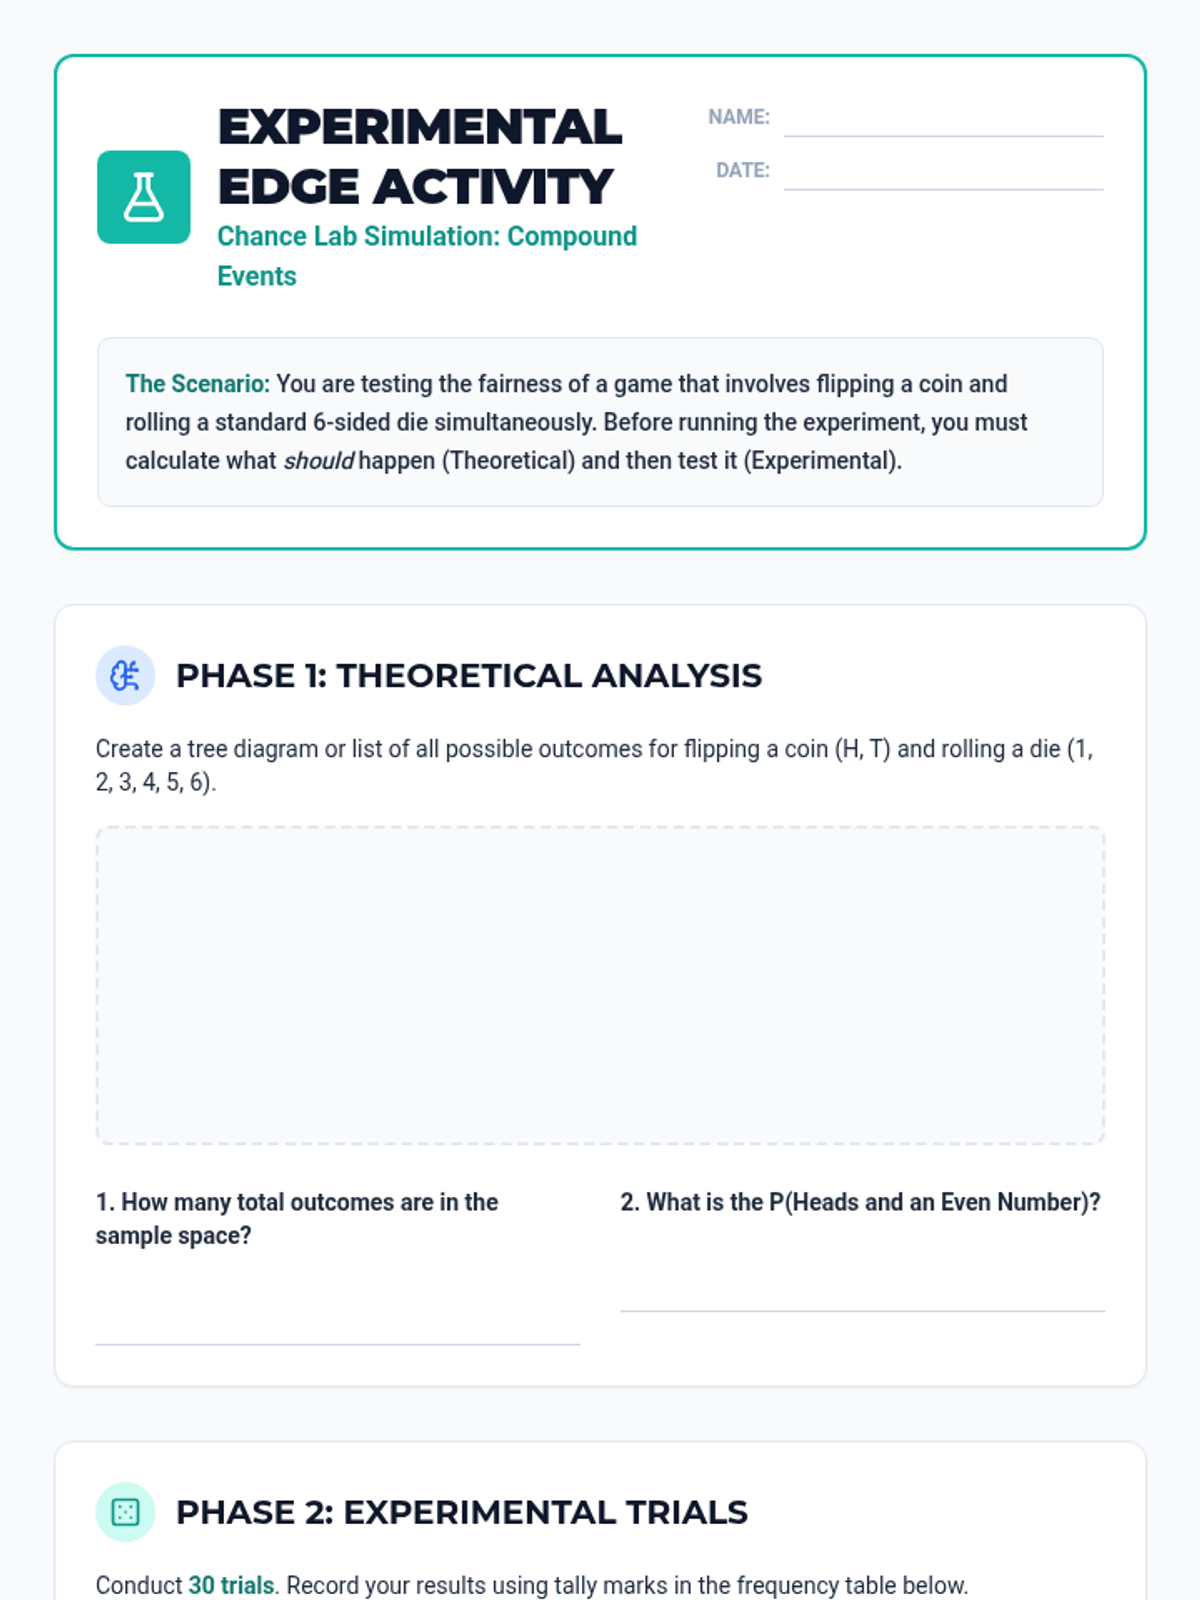
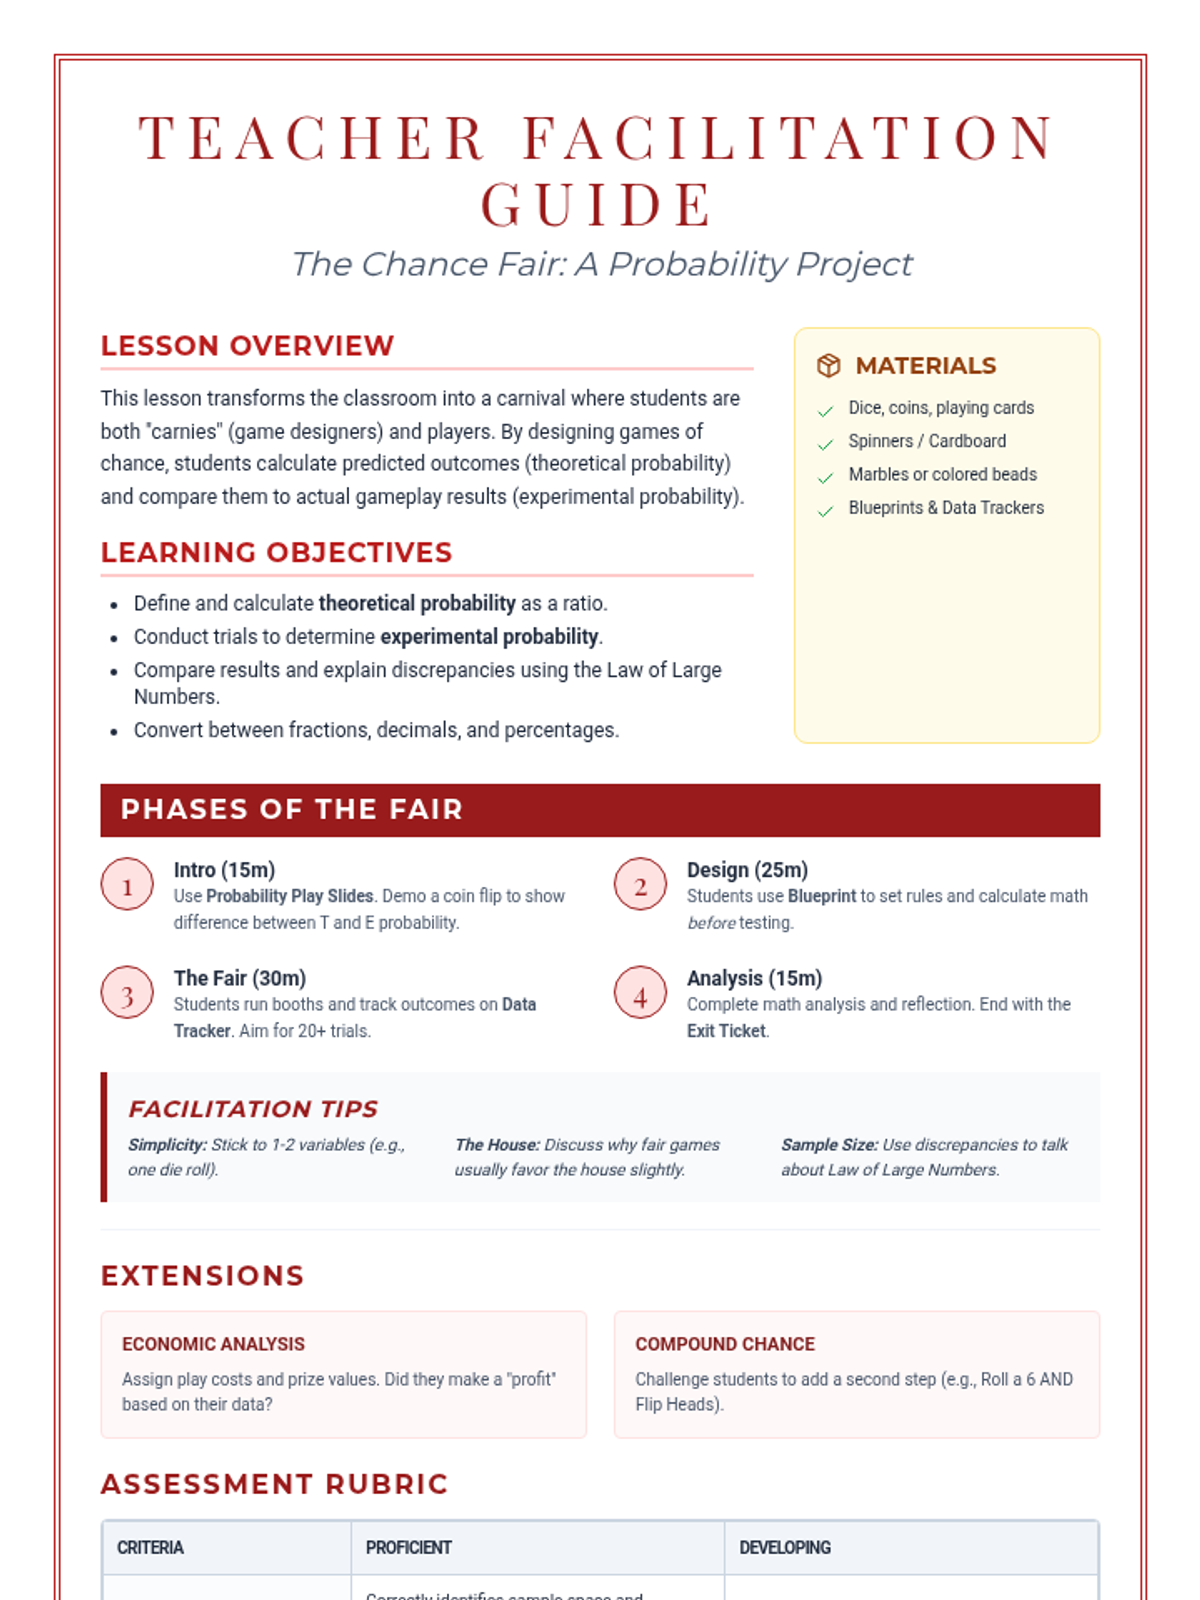
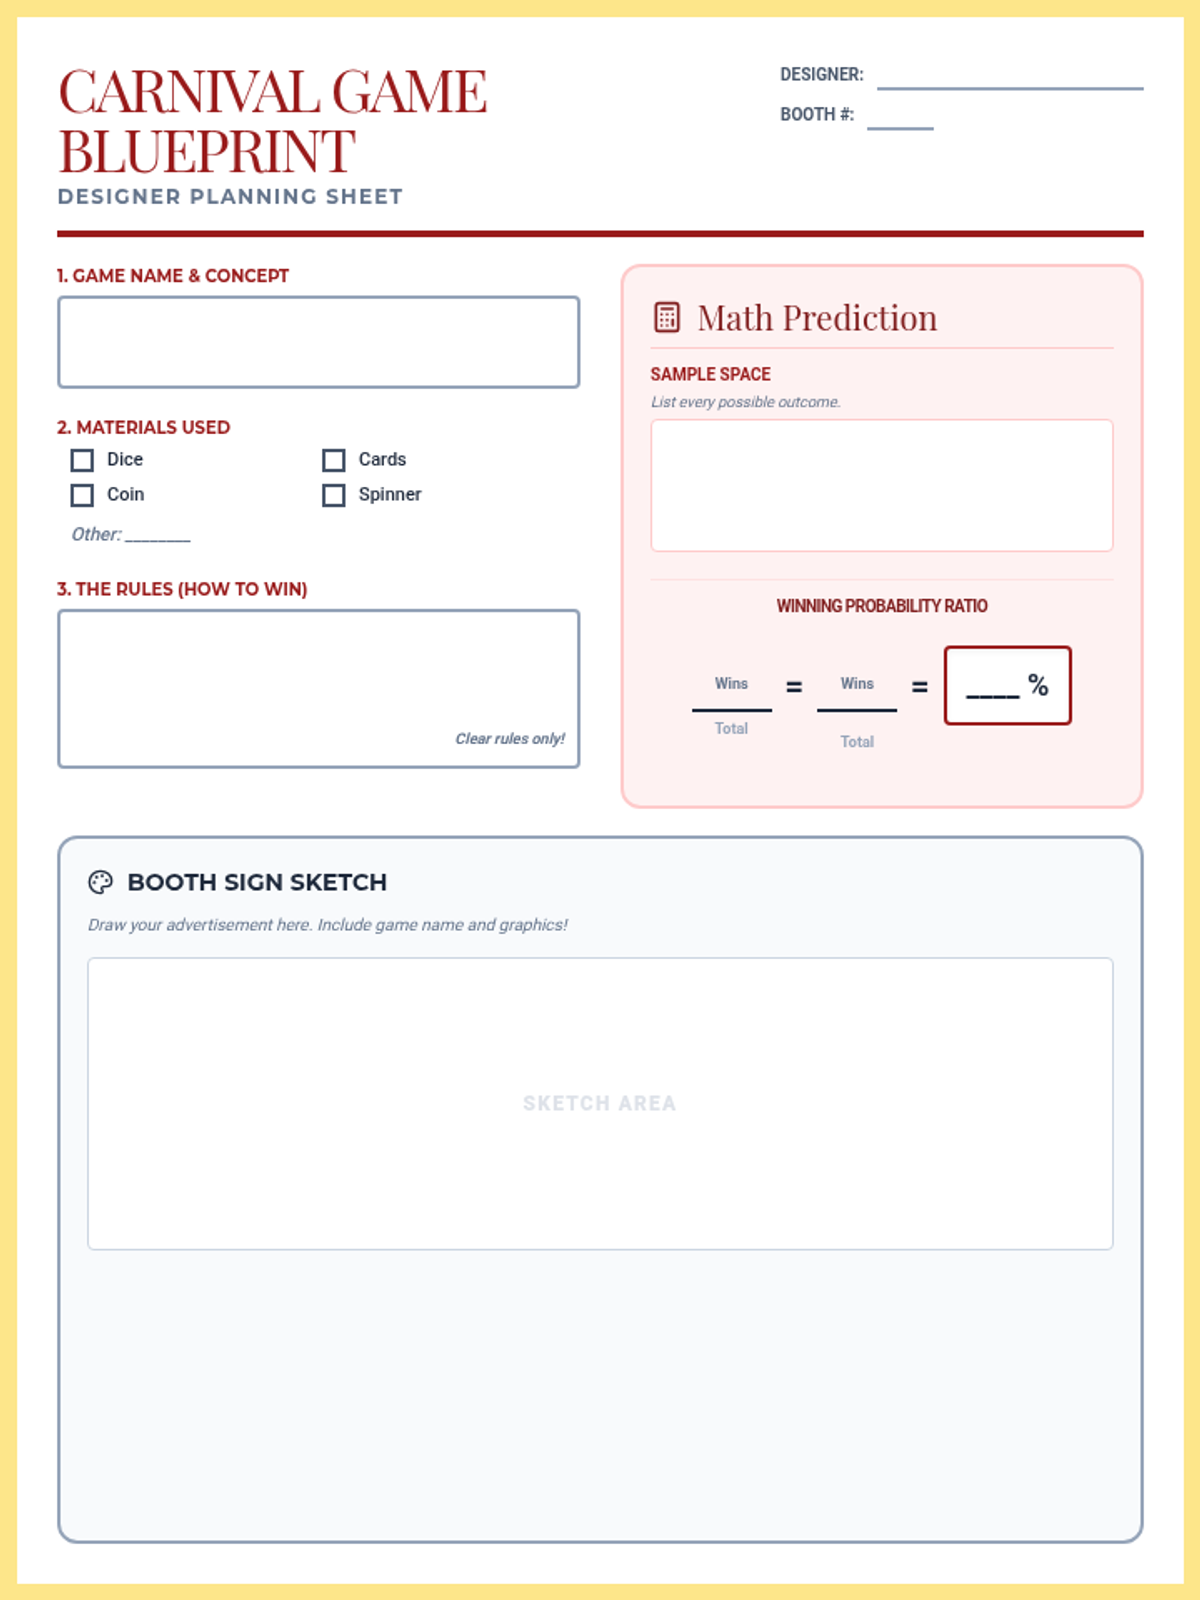
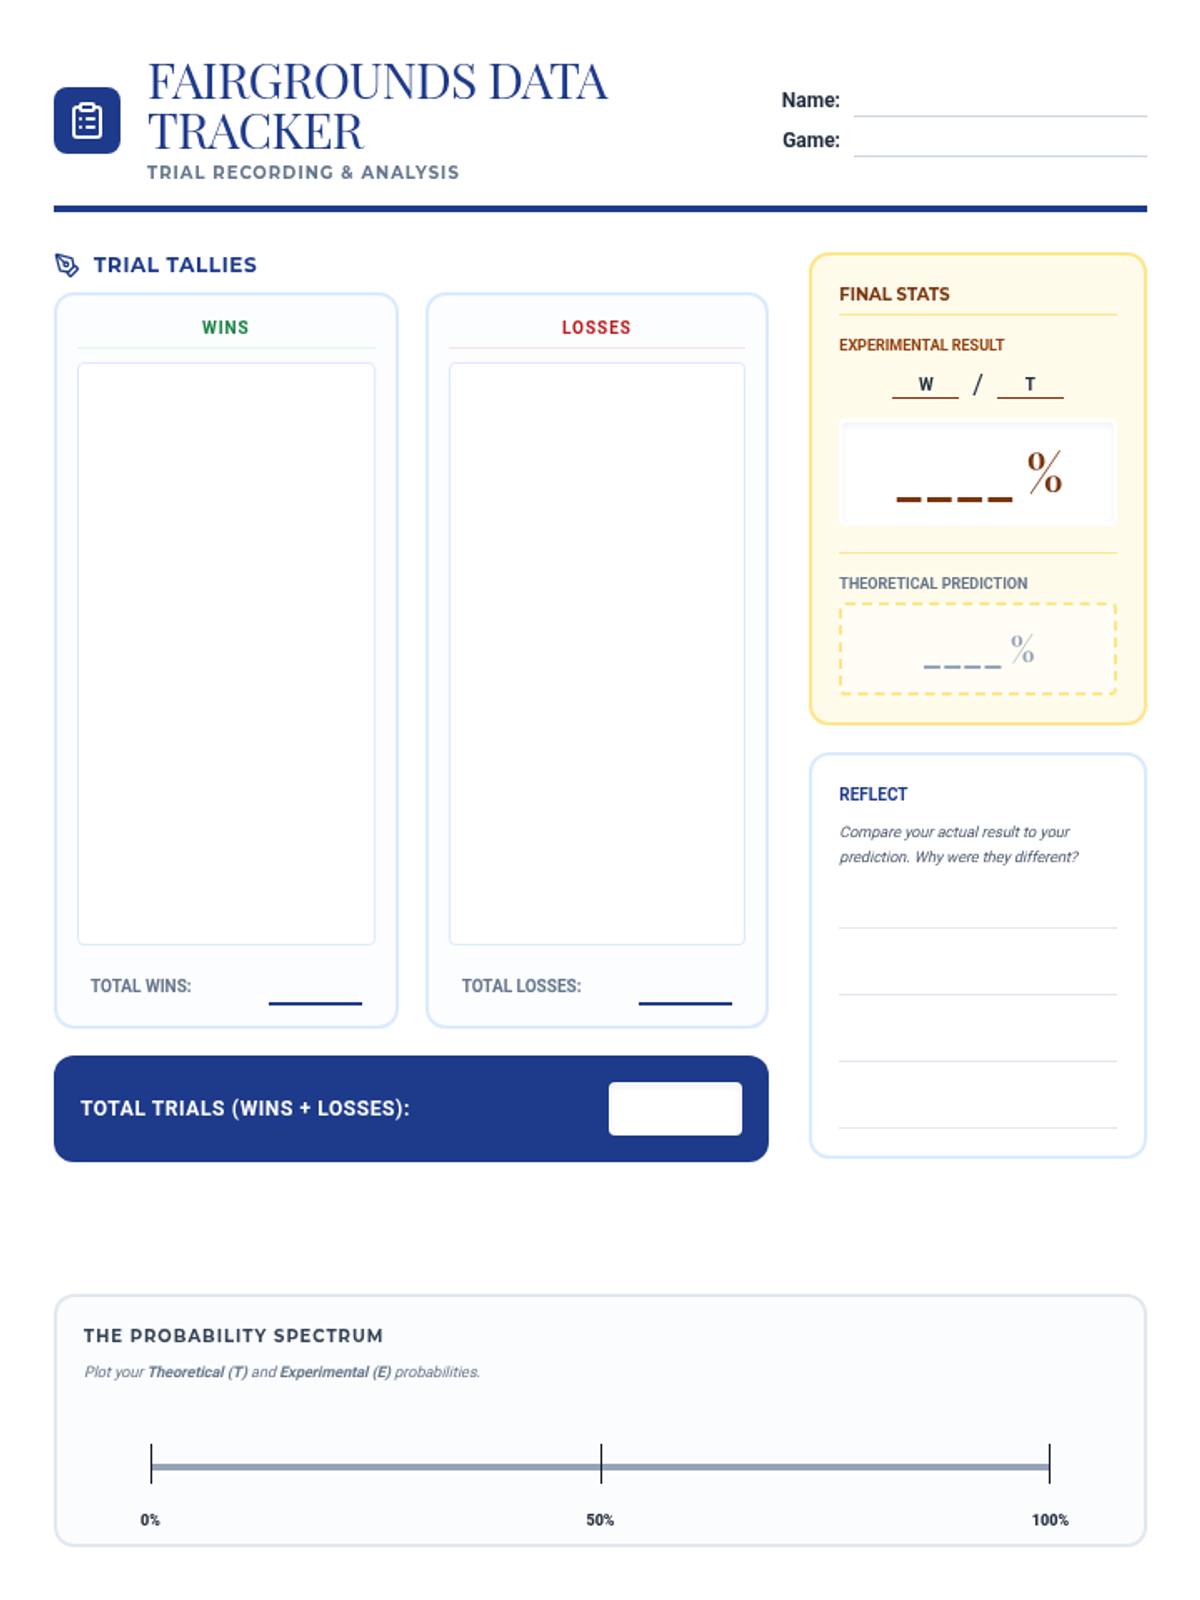
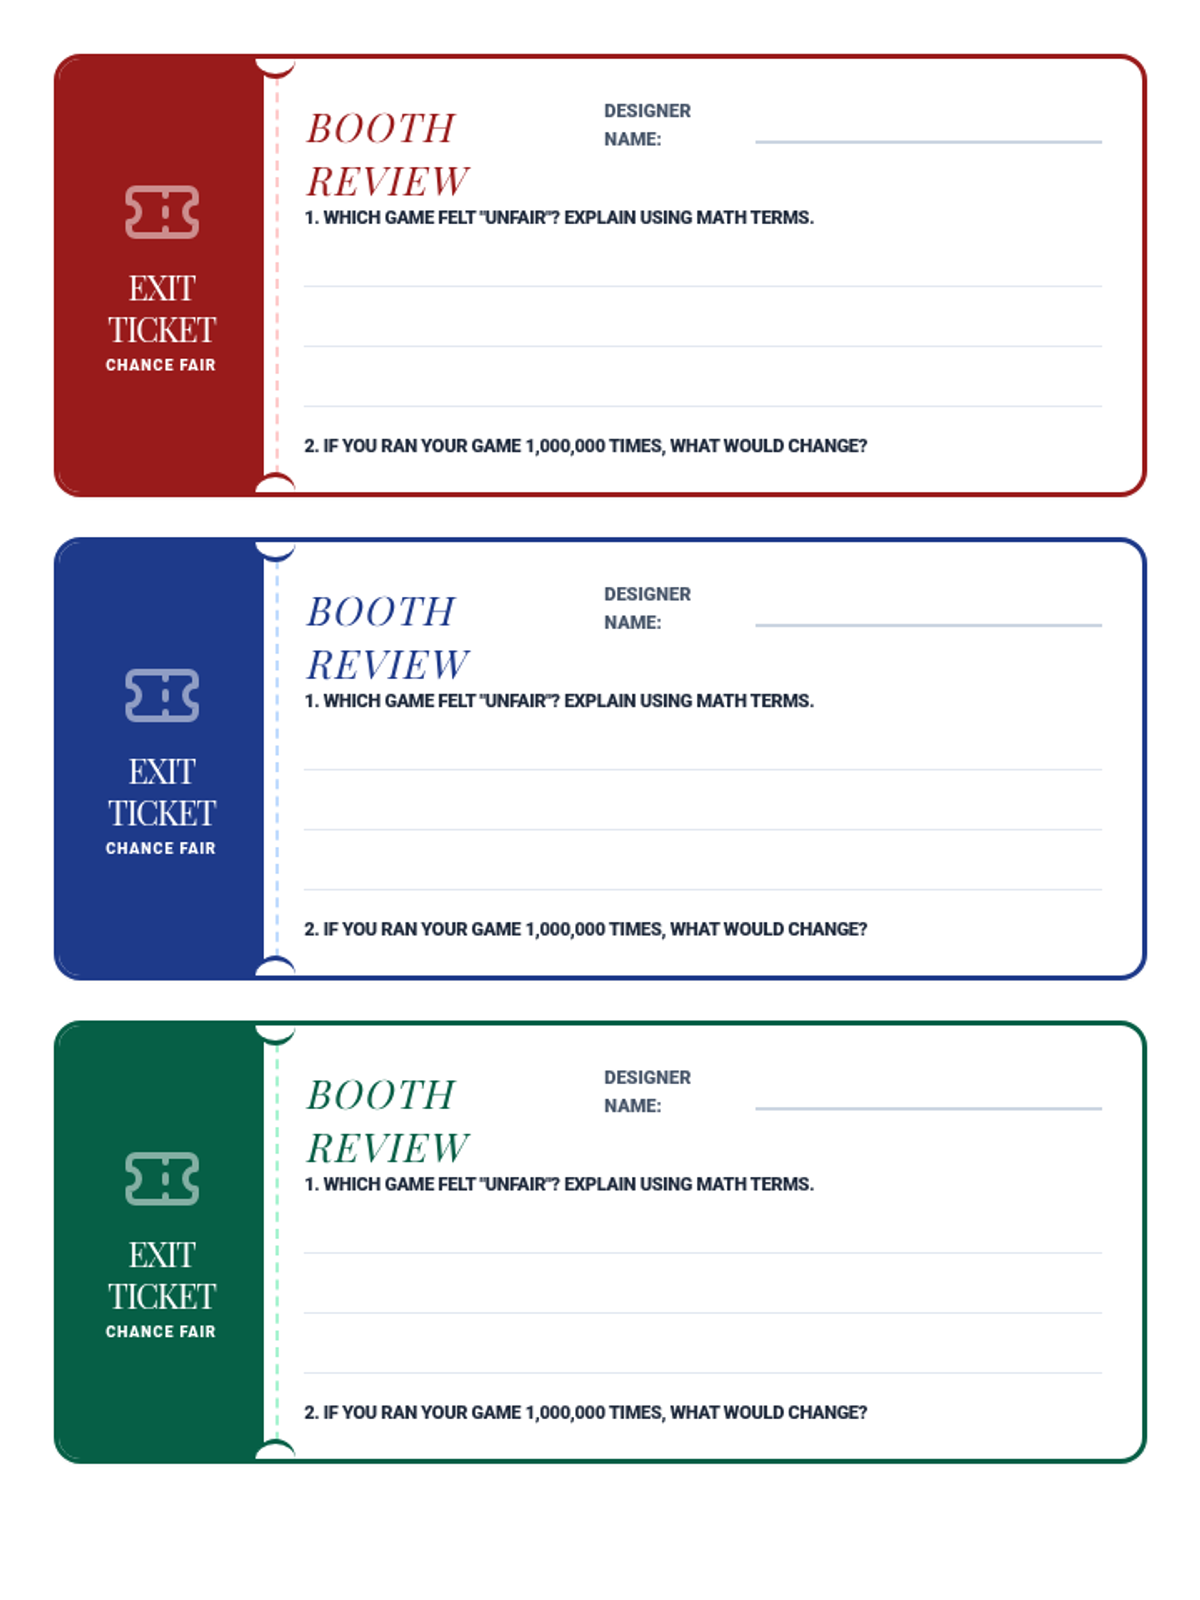
A hands-on probability project where students design, build, and test carnival games. They will calculate theoretical probability, collect experimental data, and analyze the results to understand statistical likelihood.
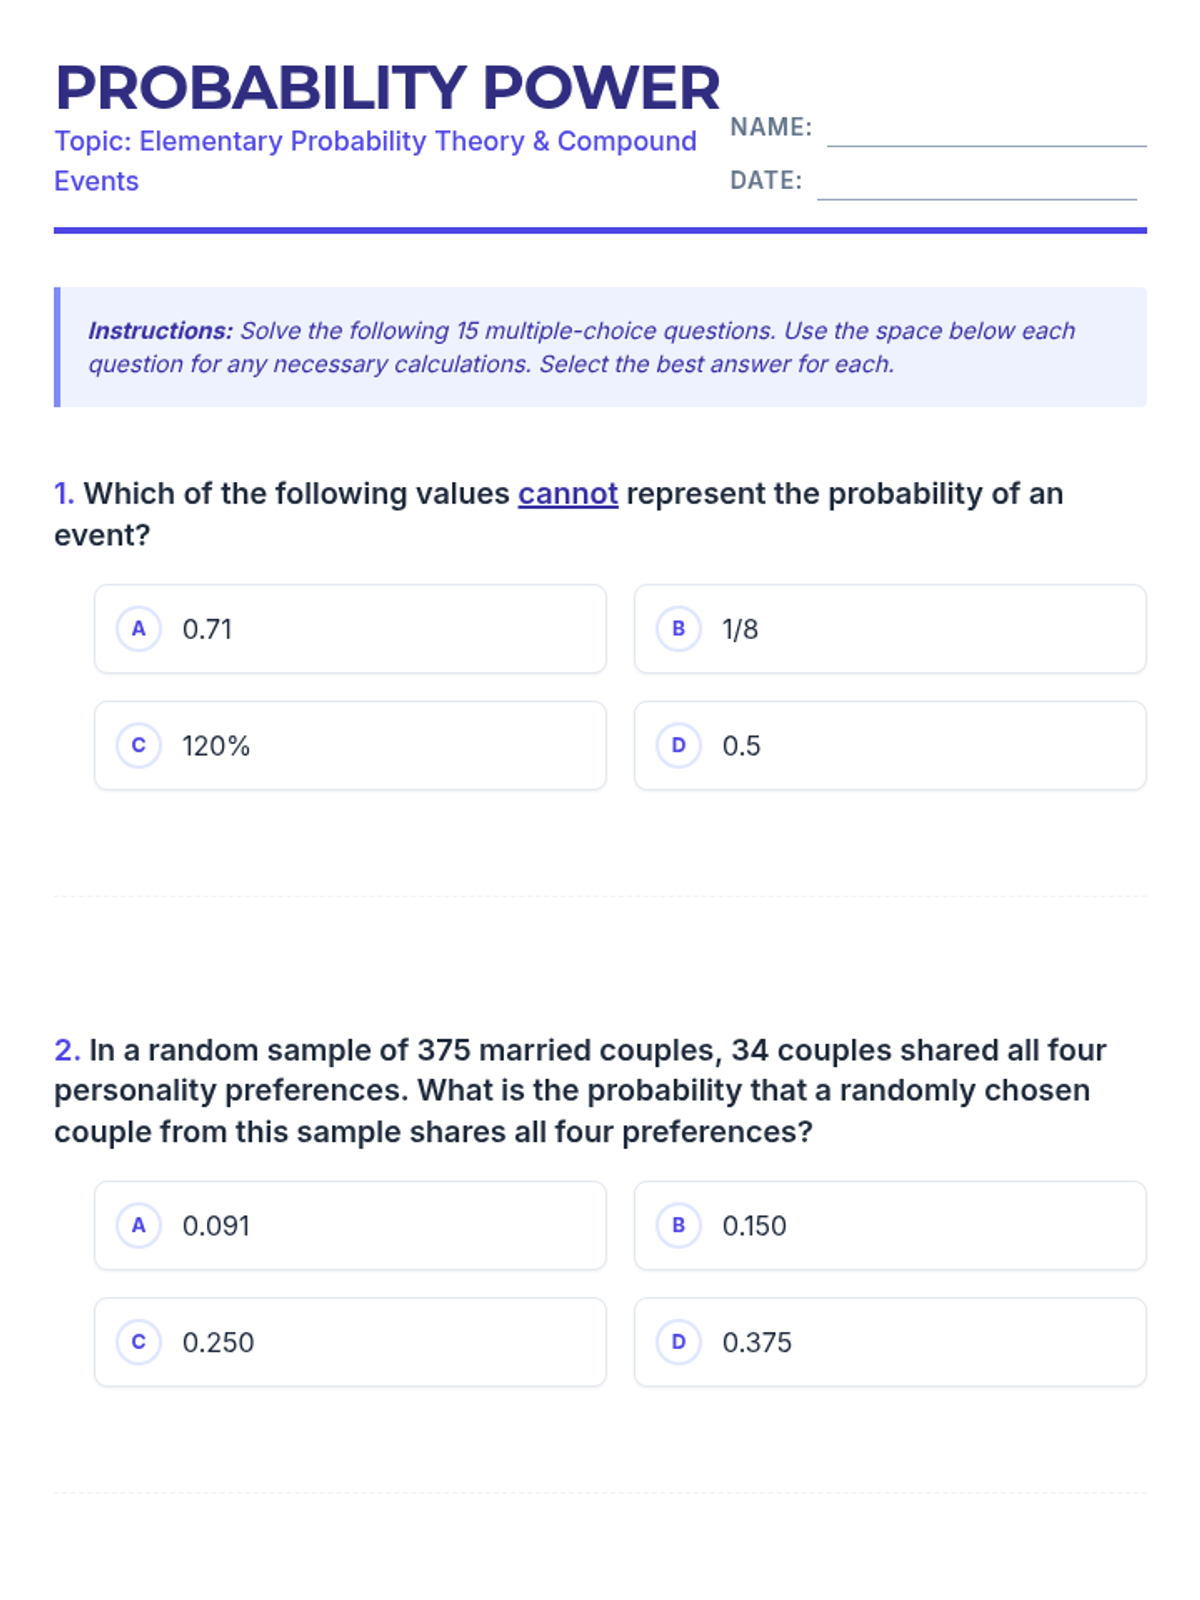
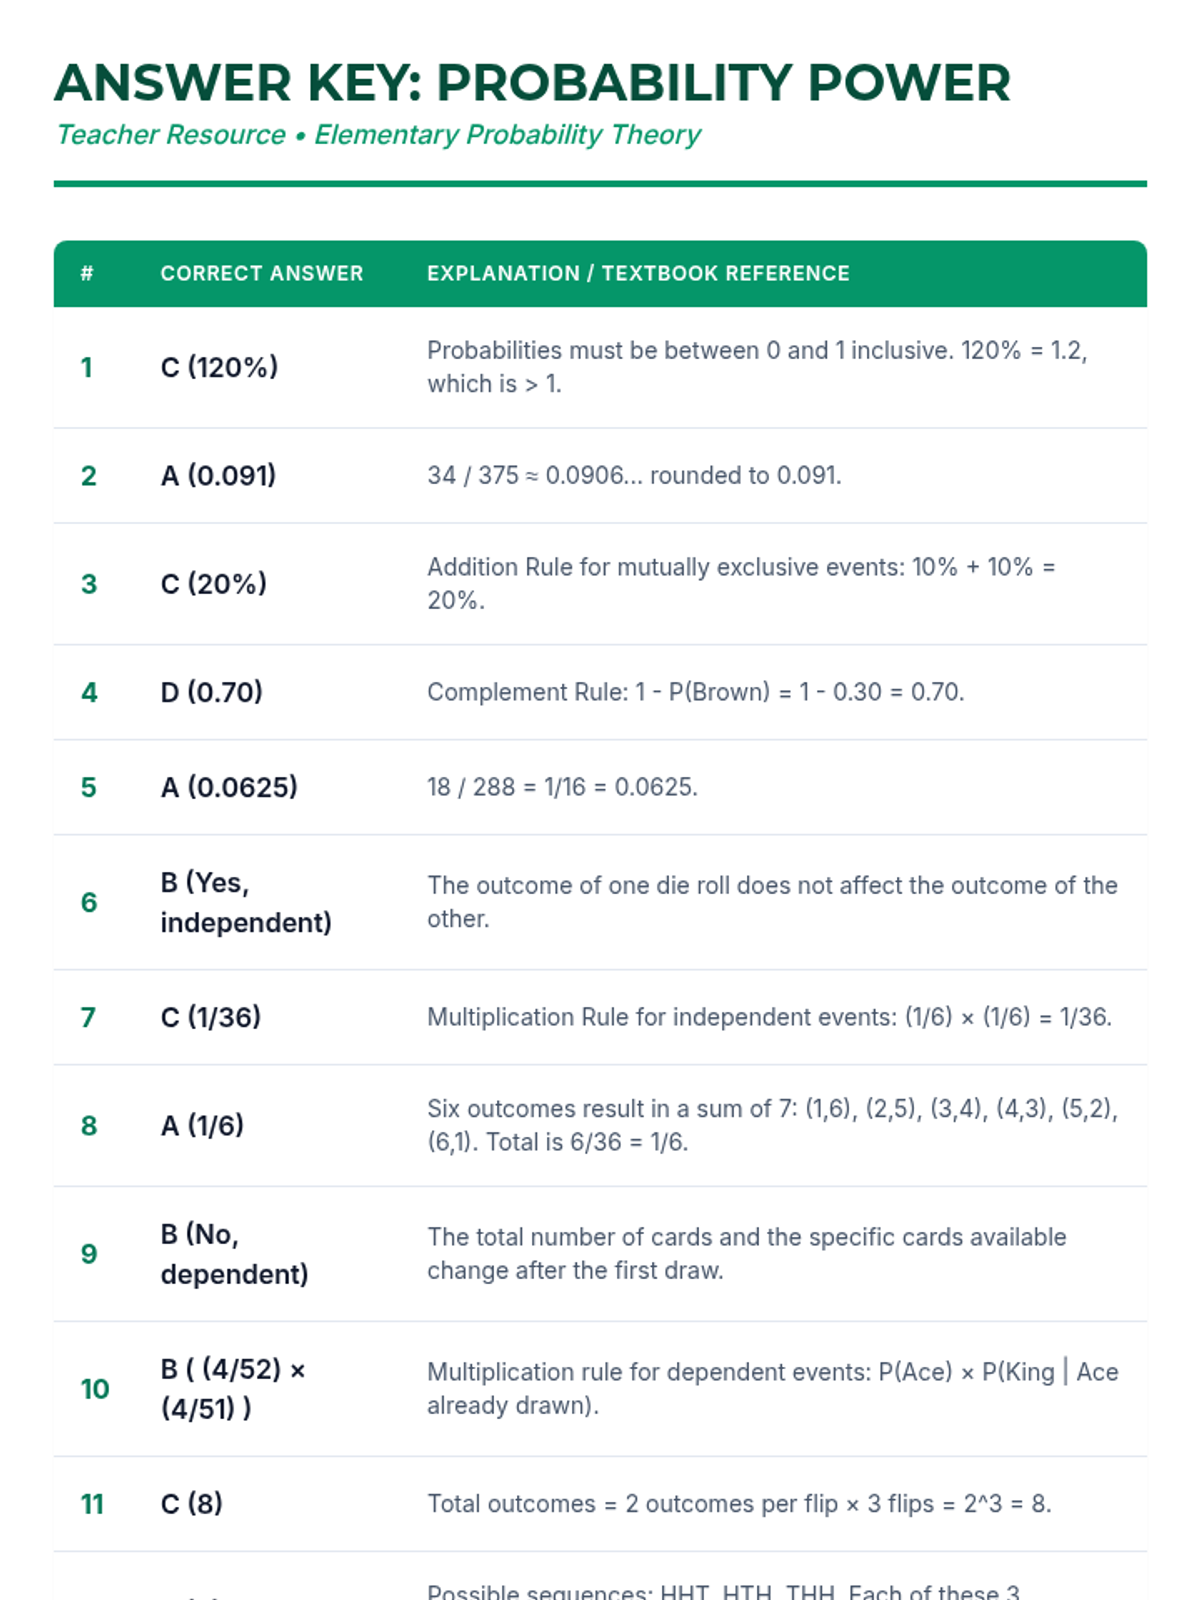
A comprehensive lesson on elementary probability theory covering valid probability ranges, compound events, independent and dependent outcomes, and tree diagrams based on textbook problems.
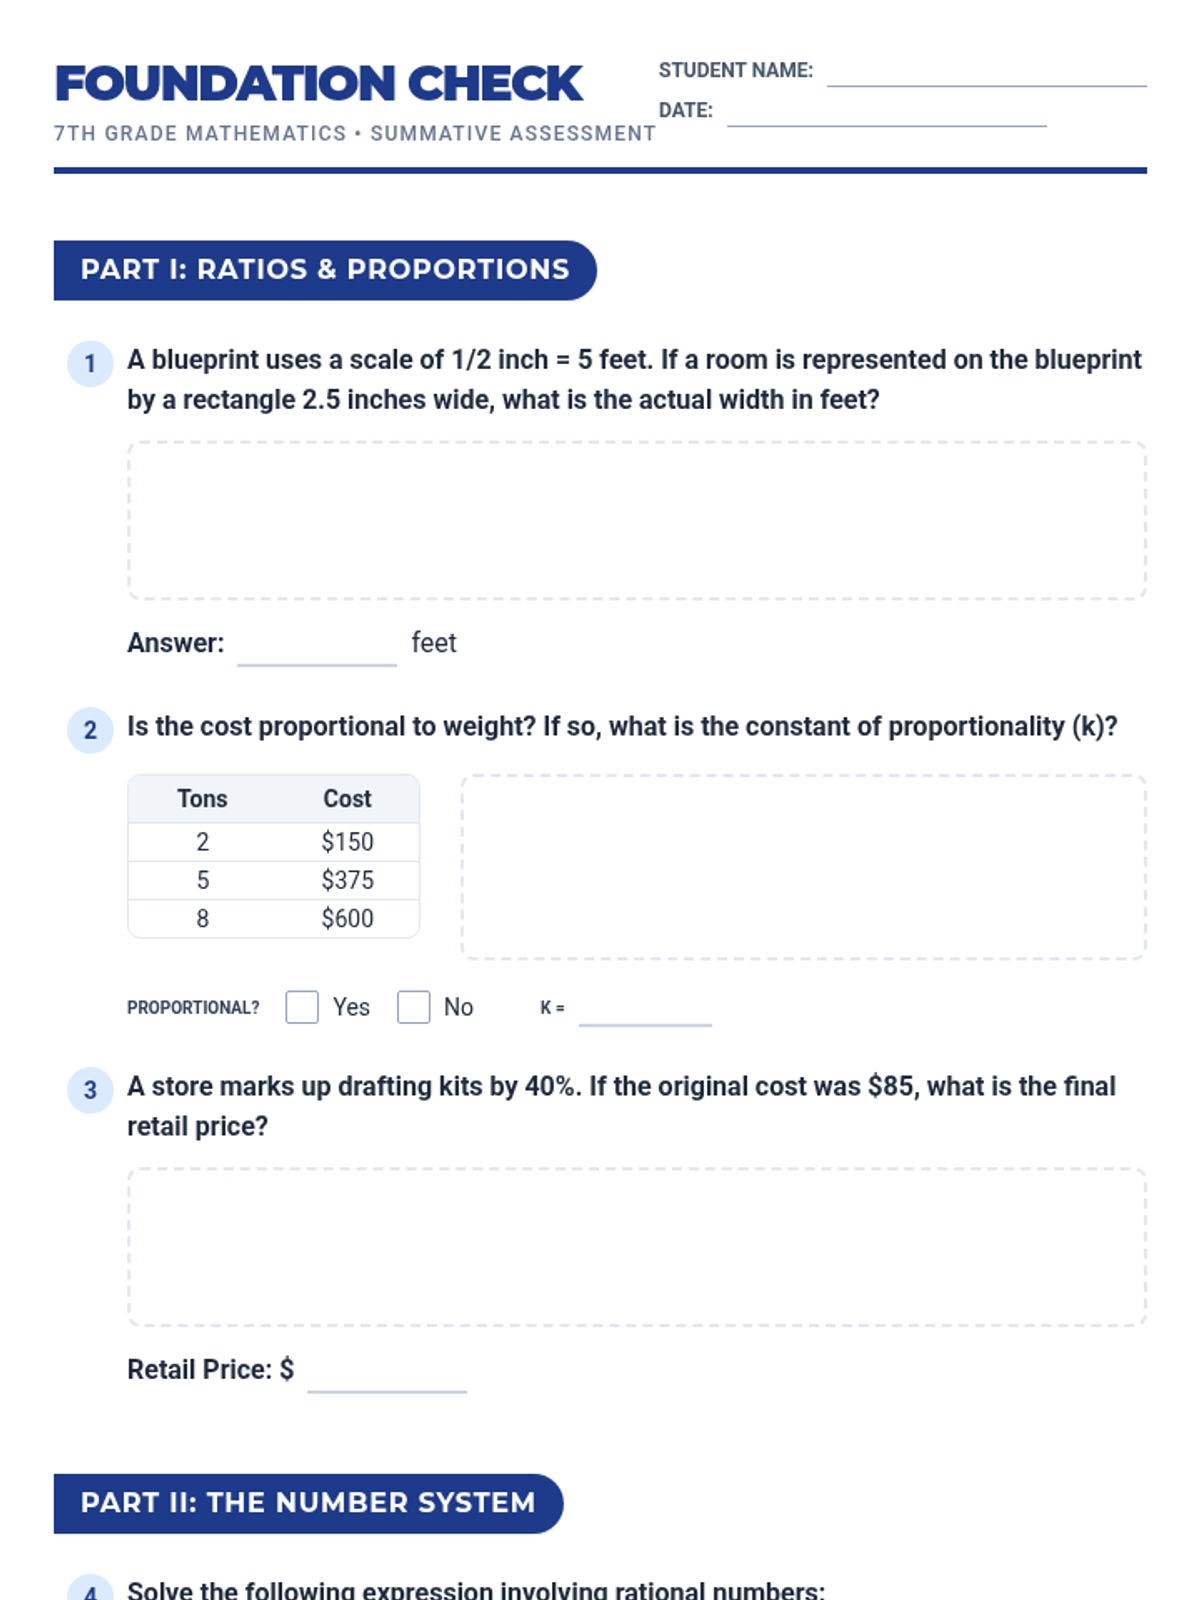
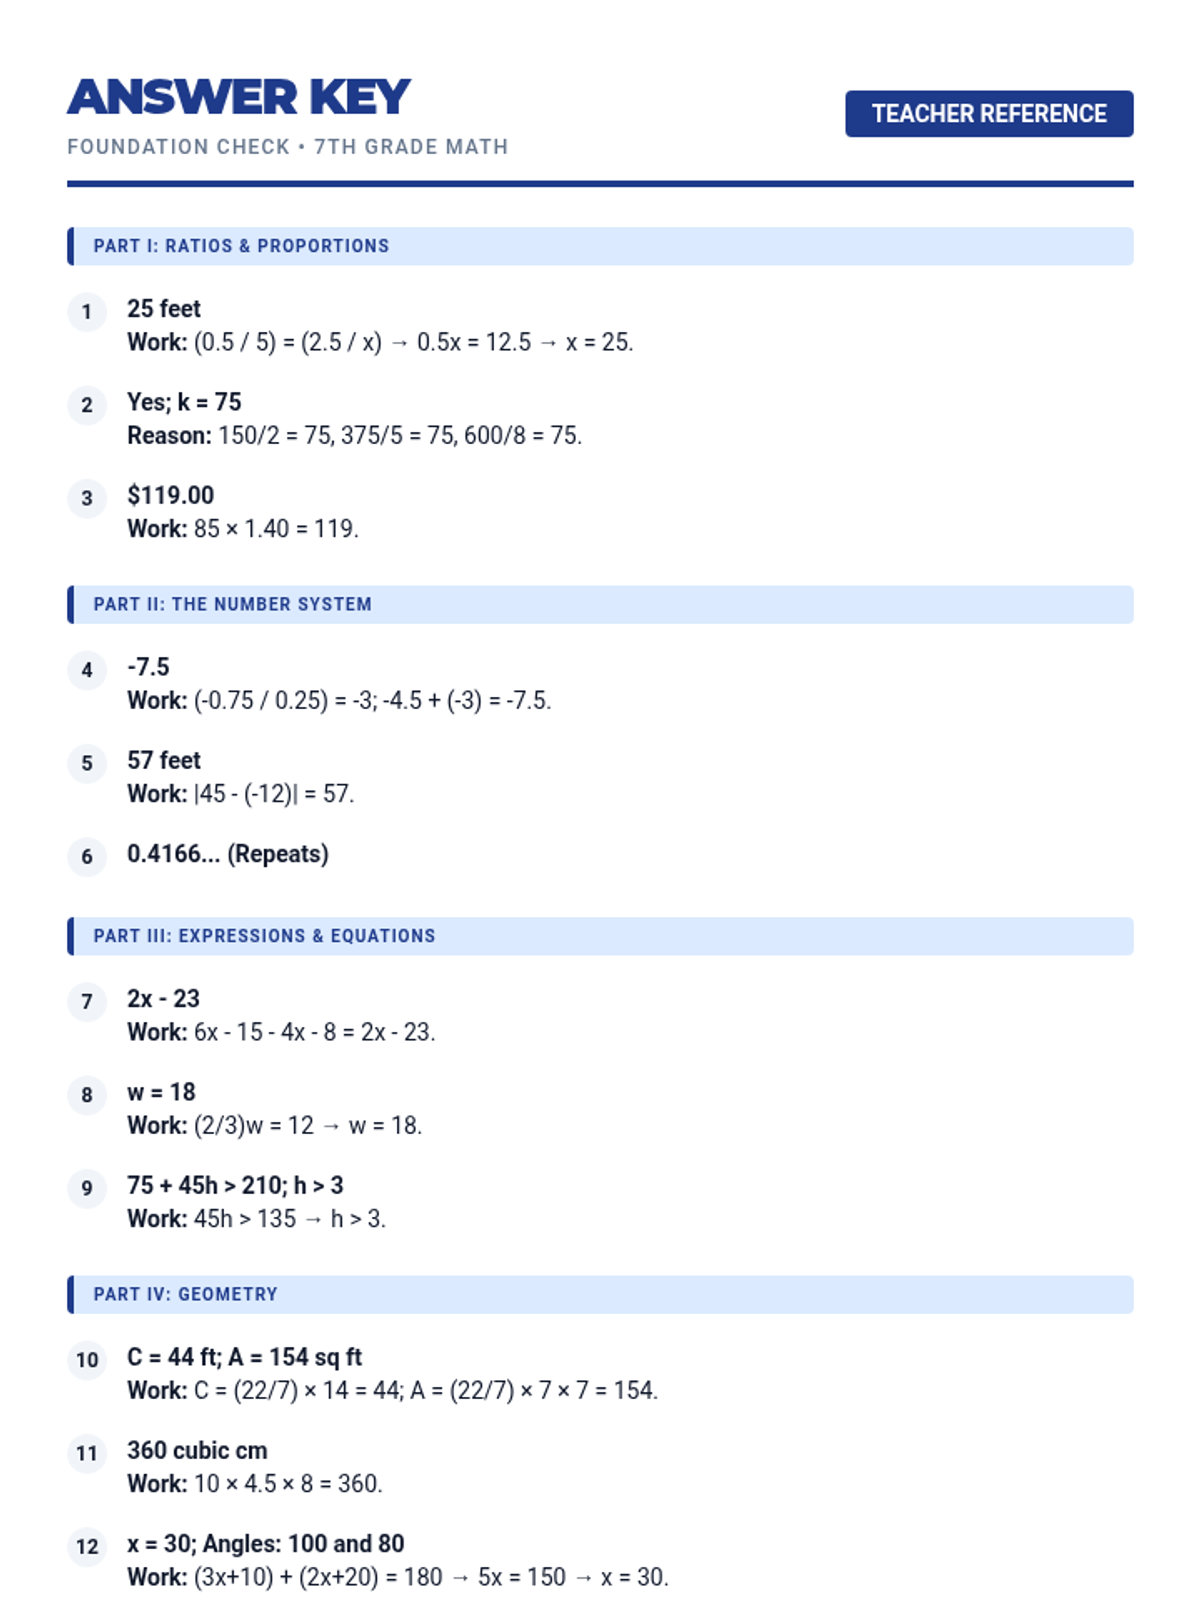
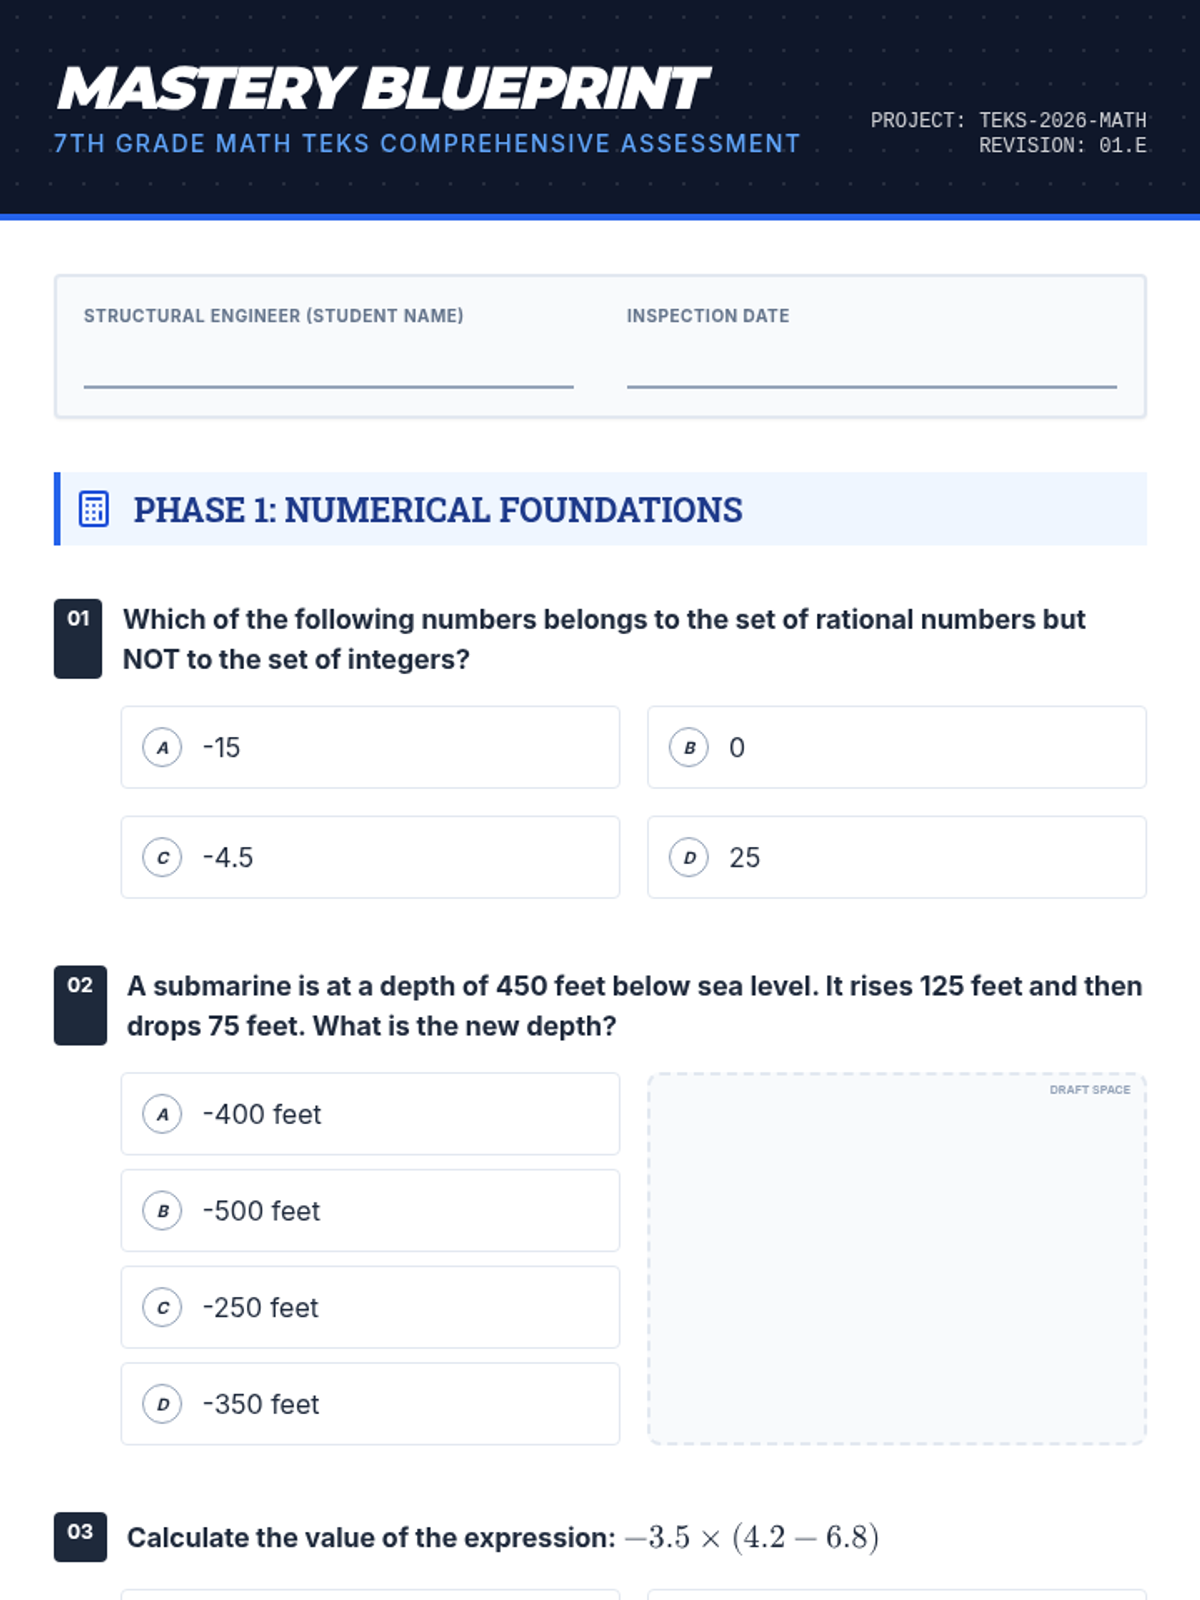
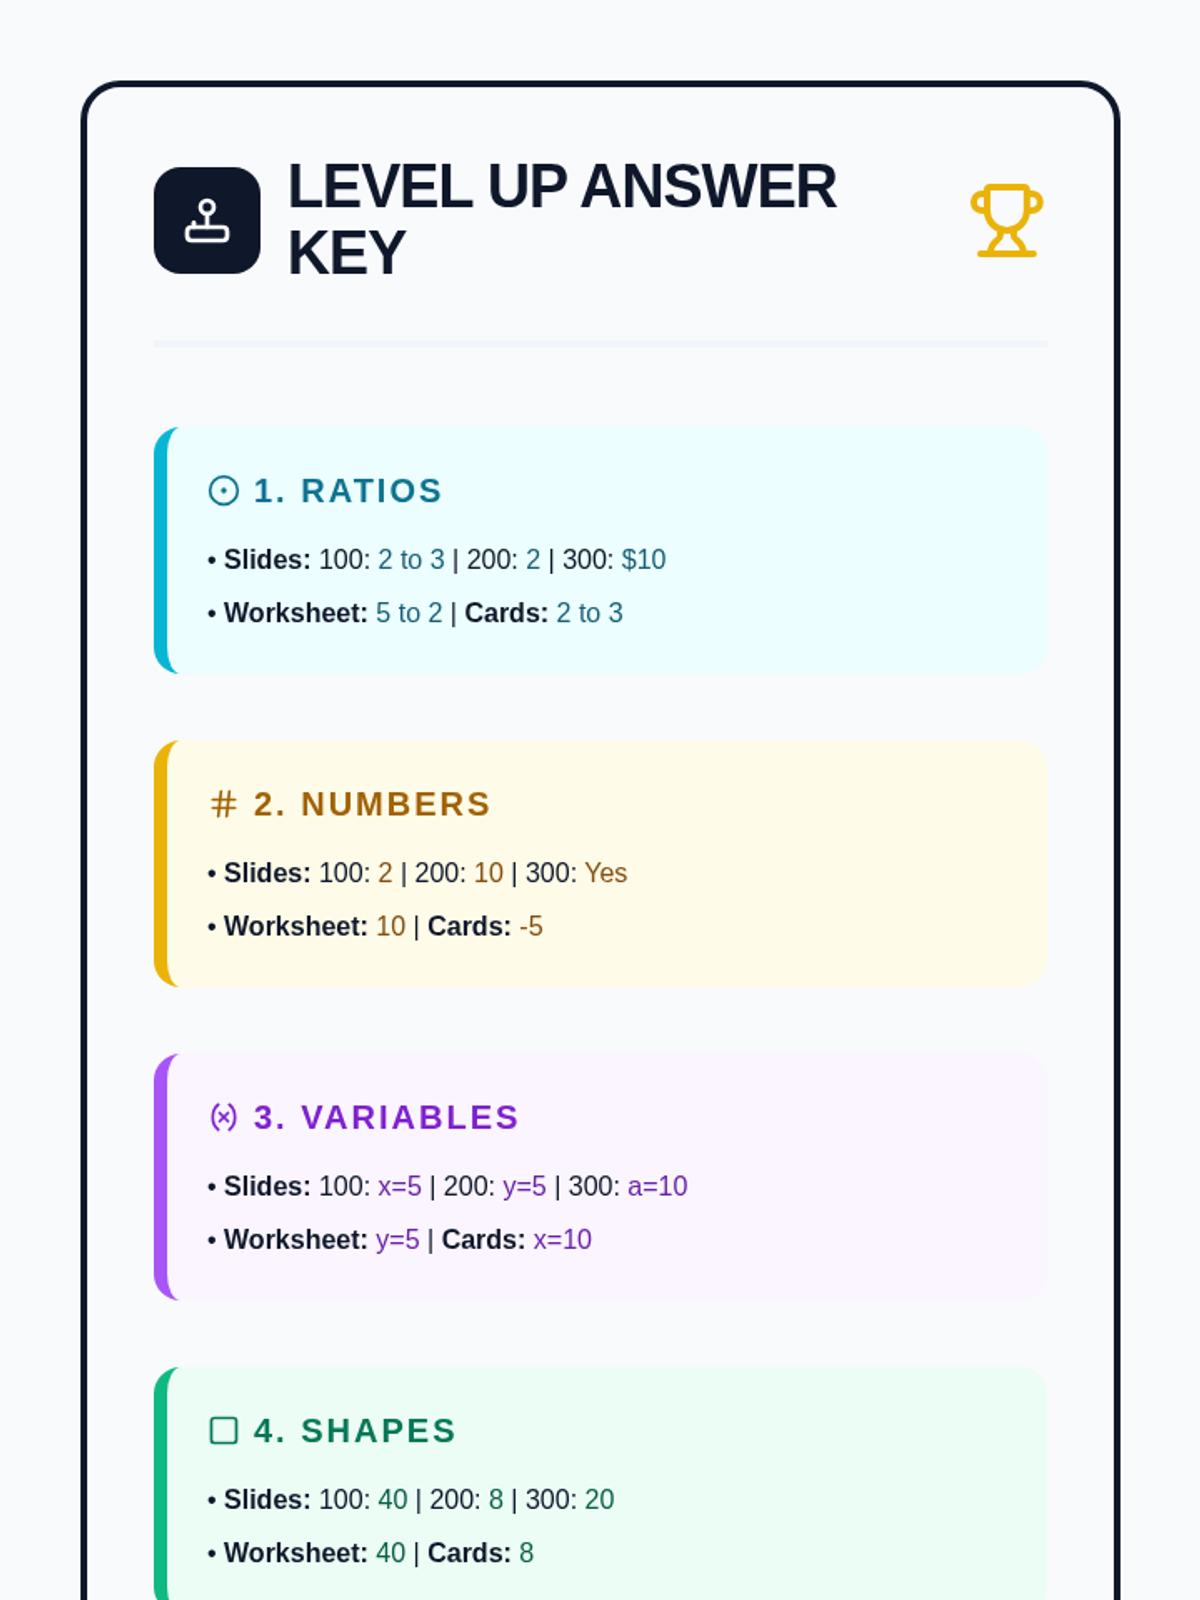
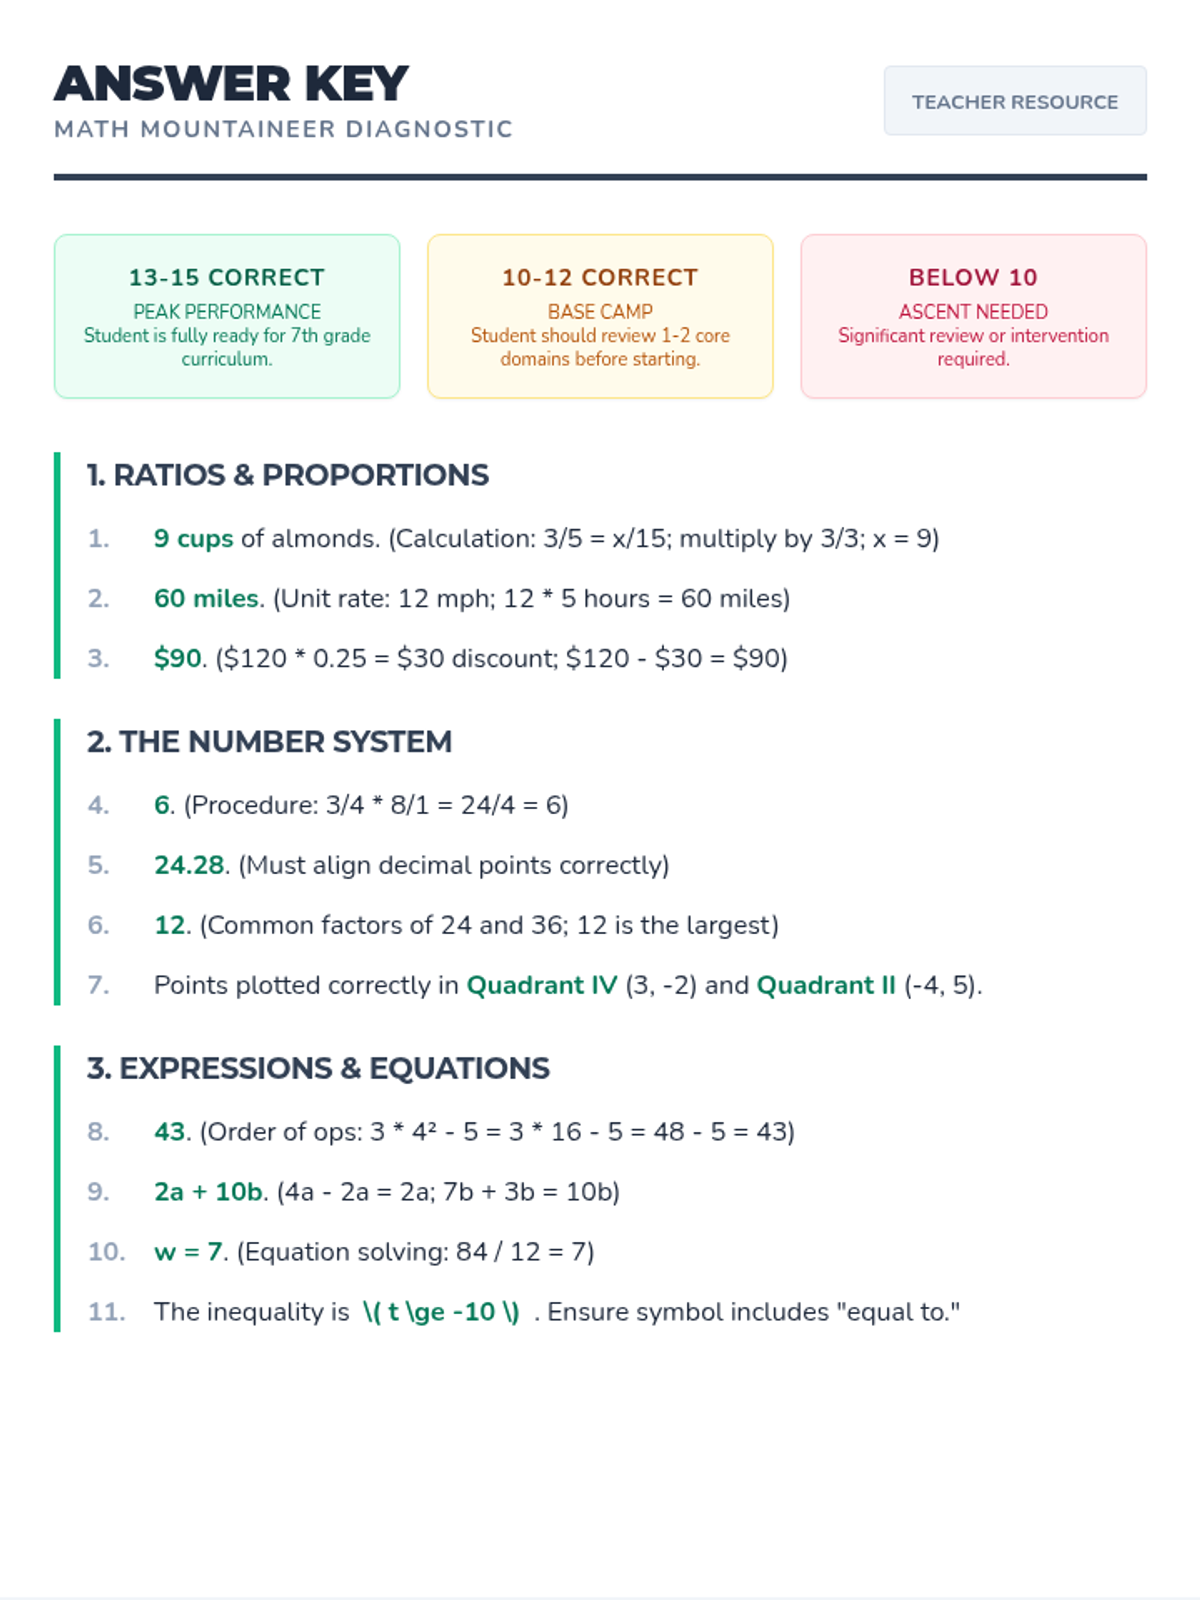
A comprehensive end-of-year assessment for 7th-grade math, covering ratios, the number system, expressions, geometry, and statistics. Includes a student test, a teacher answer key, and introductory review slides.
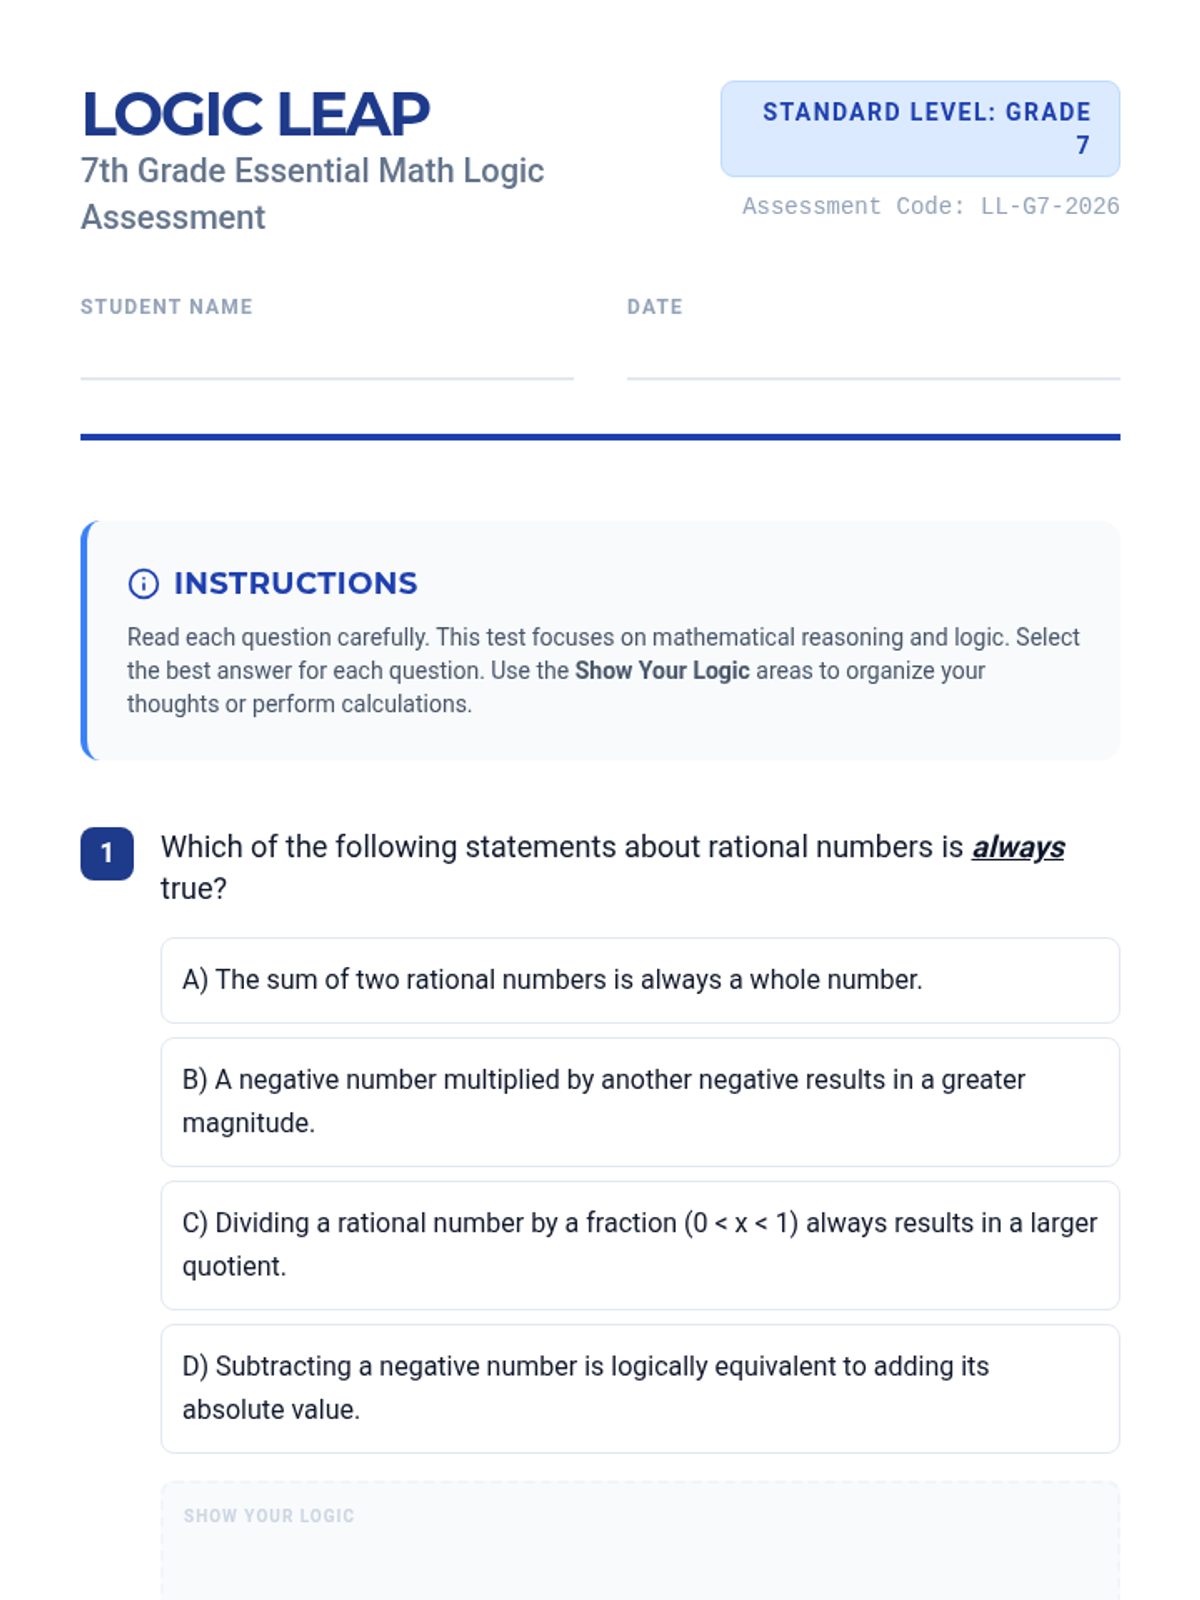
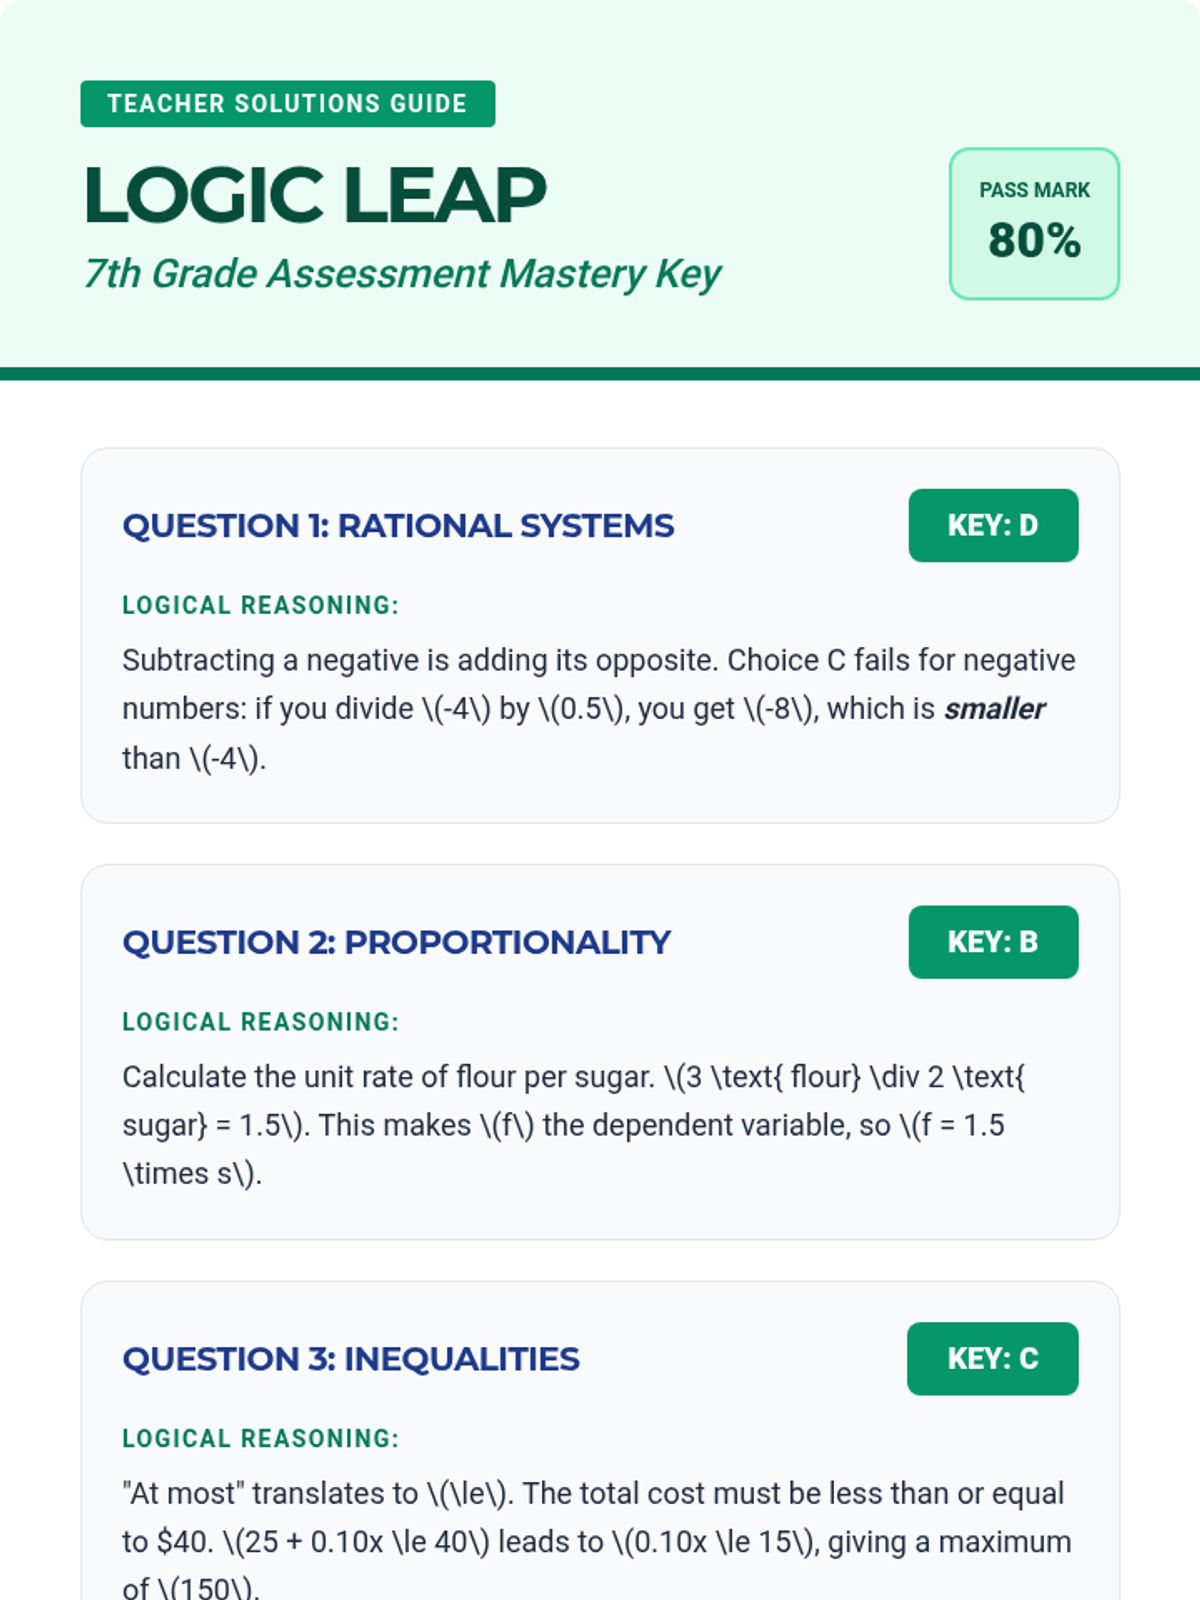
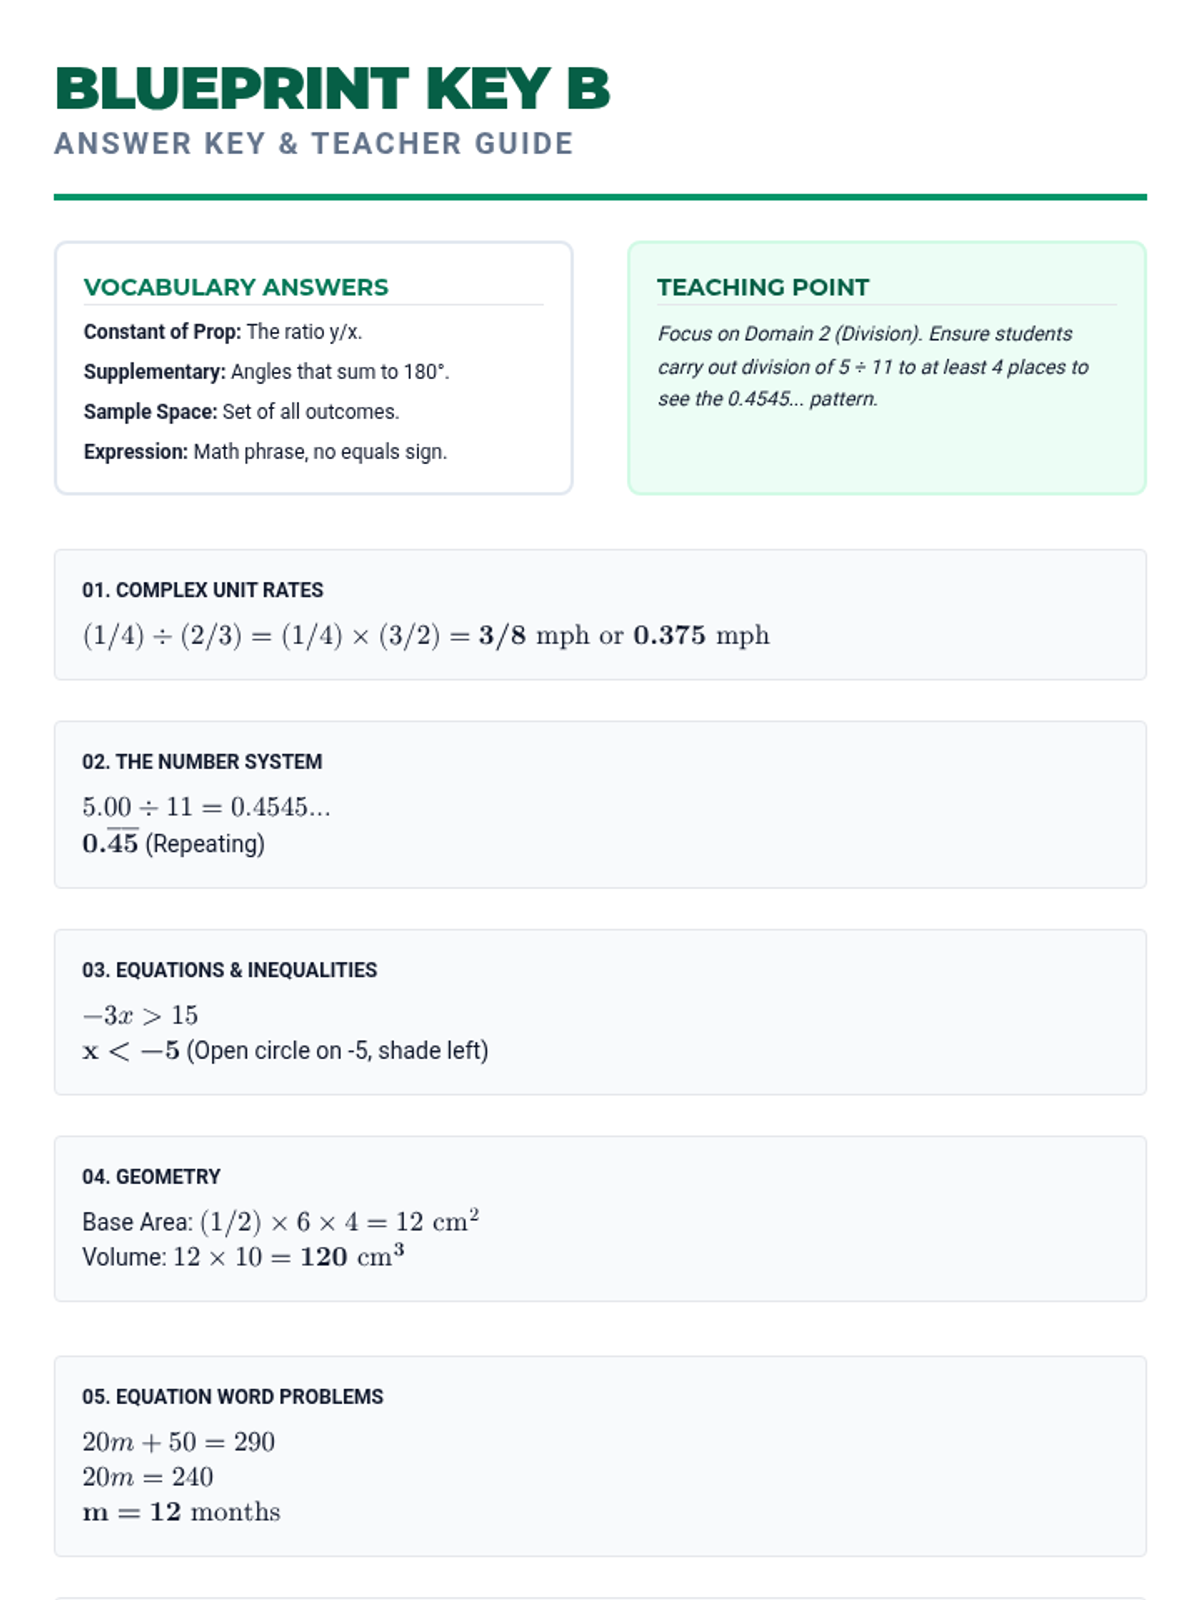
A comprehensive assessment and review lesson focusing on 7th-grade mathematical logic and reasoning across all core domains.
A hands-on probability lab where students rotate through various 'carnival' stations to explore theoretical and experimental probability, compound events, and tree diagrams.
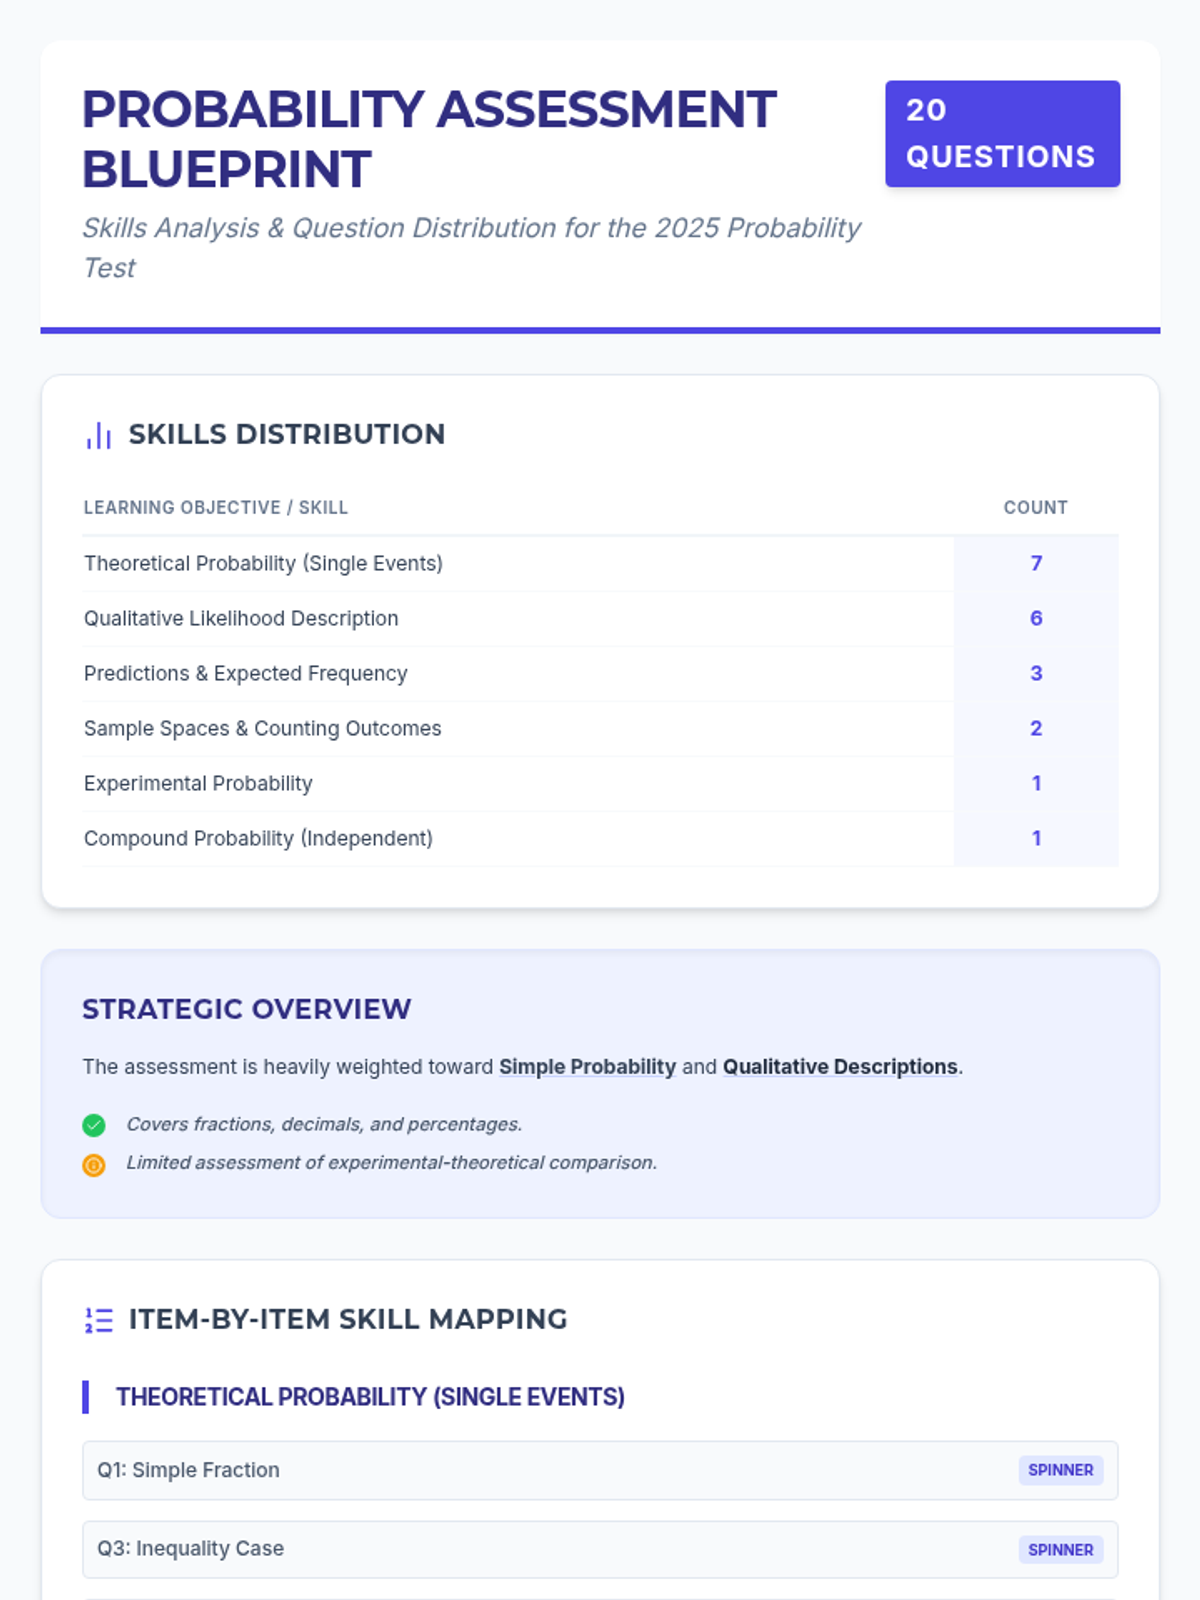
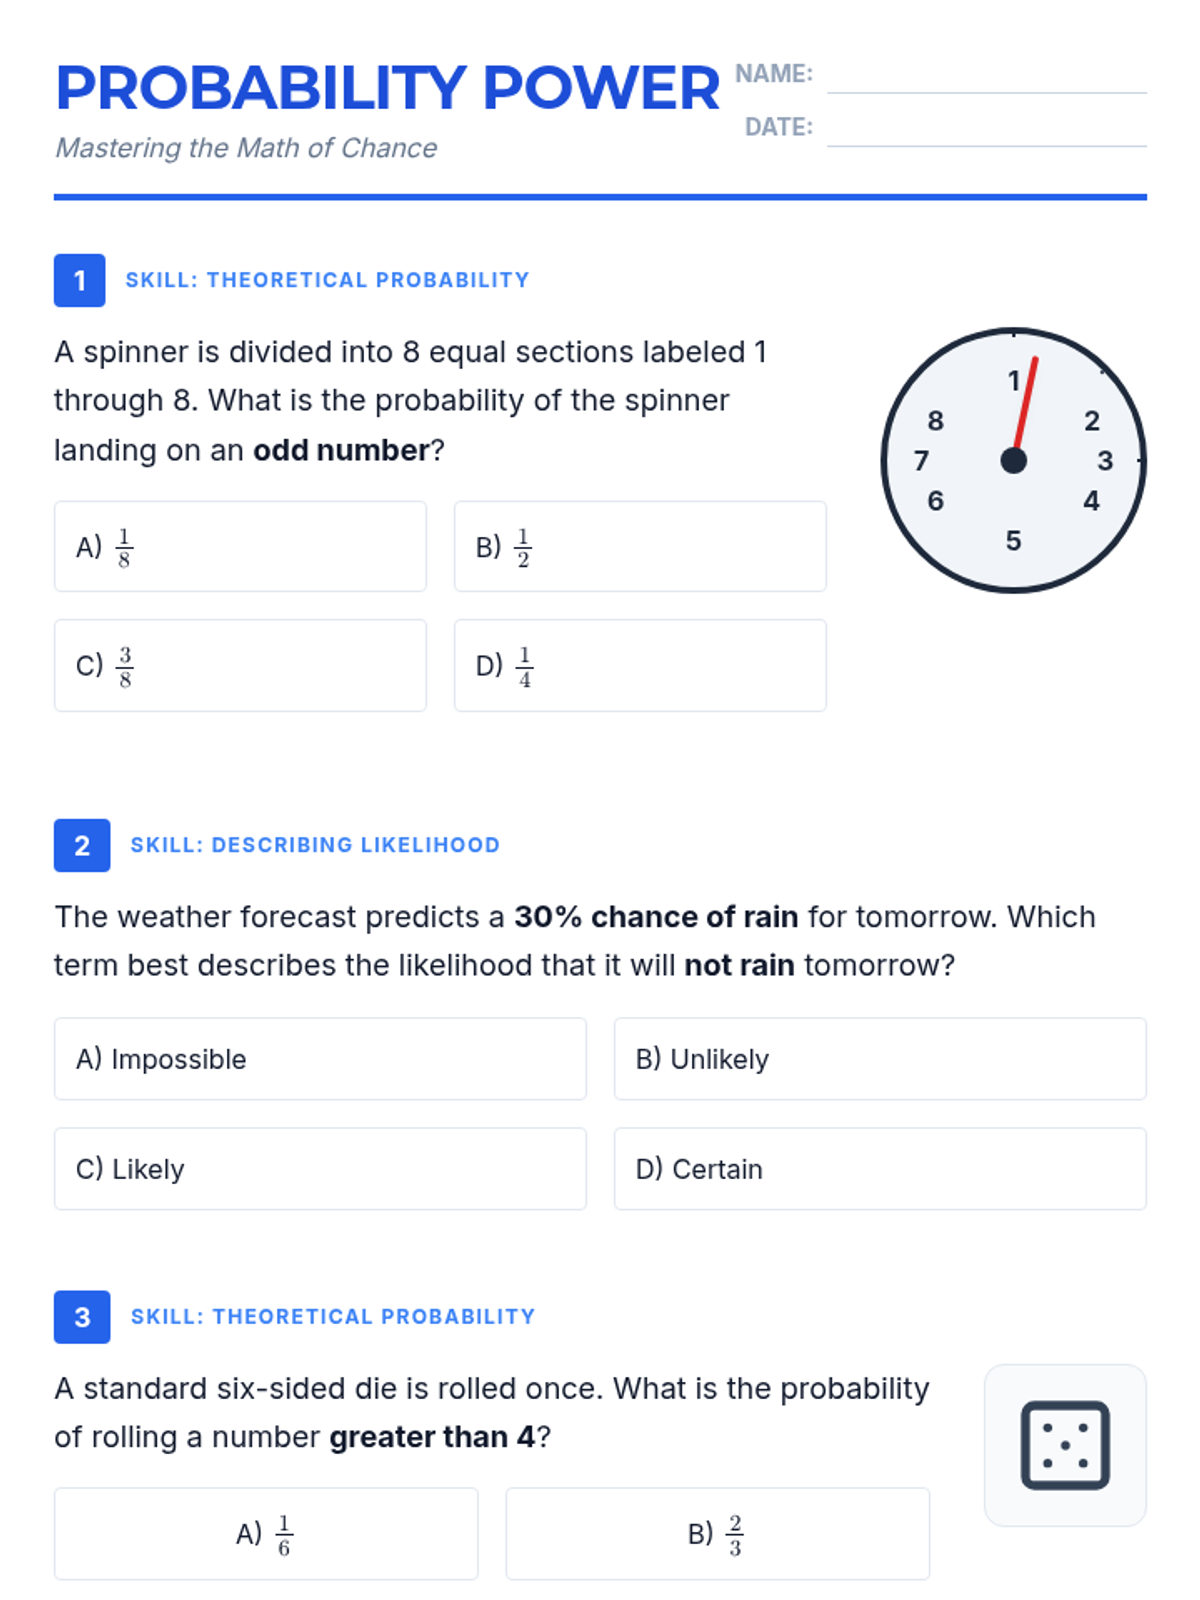
A foundational lesson on probability, covering qualitative likelihood, theoretical probability in various formats, and making predictions based on data.
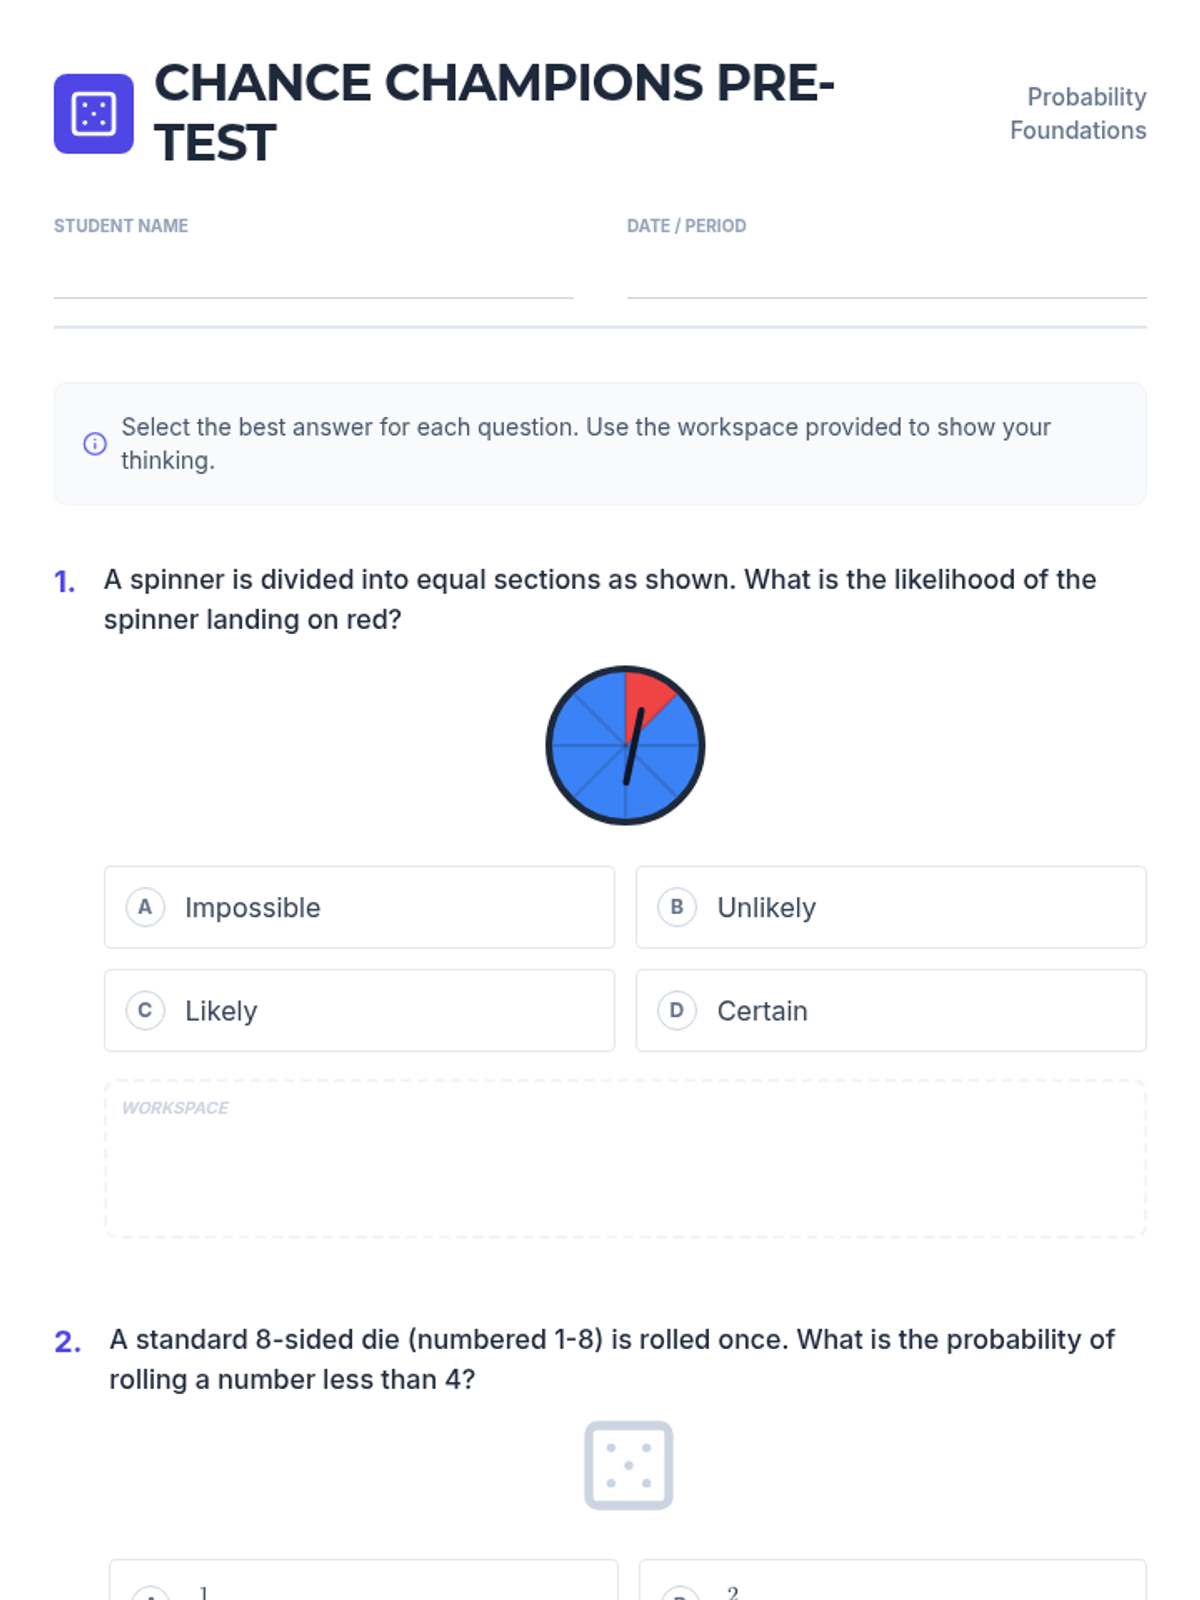
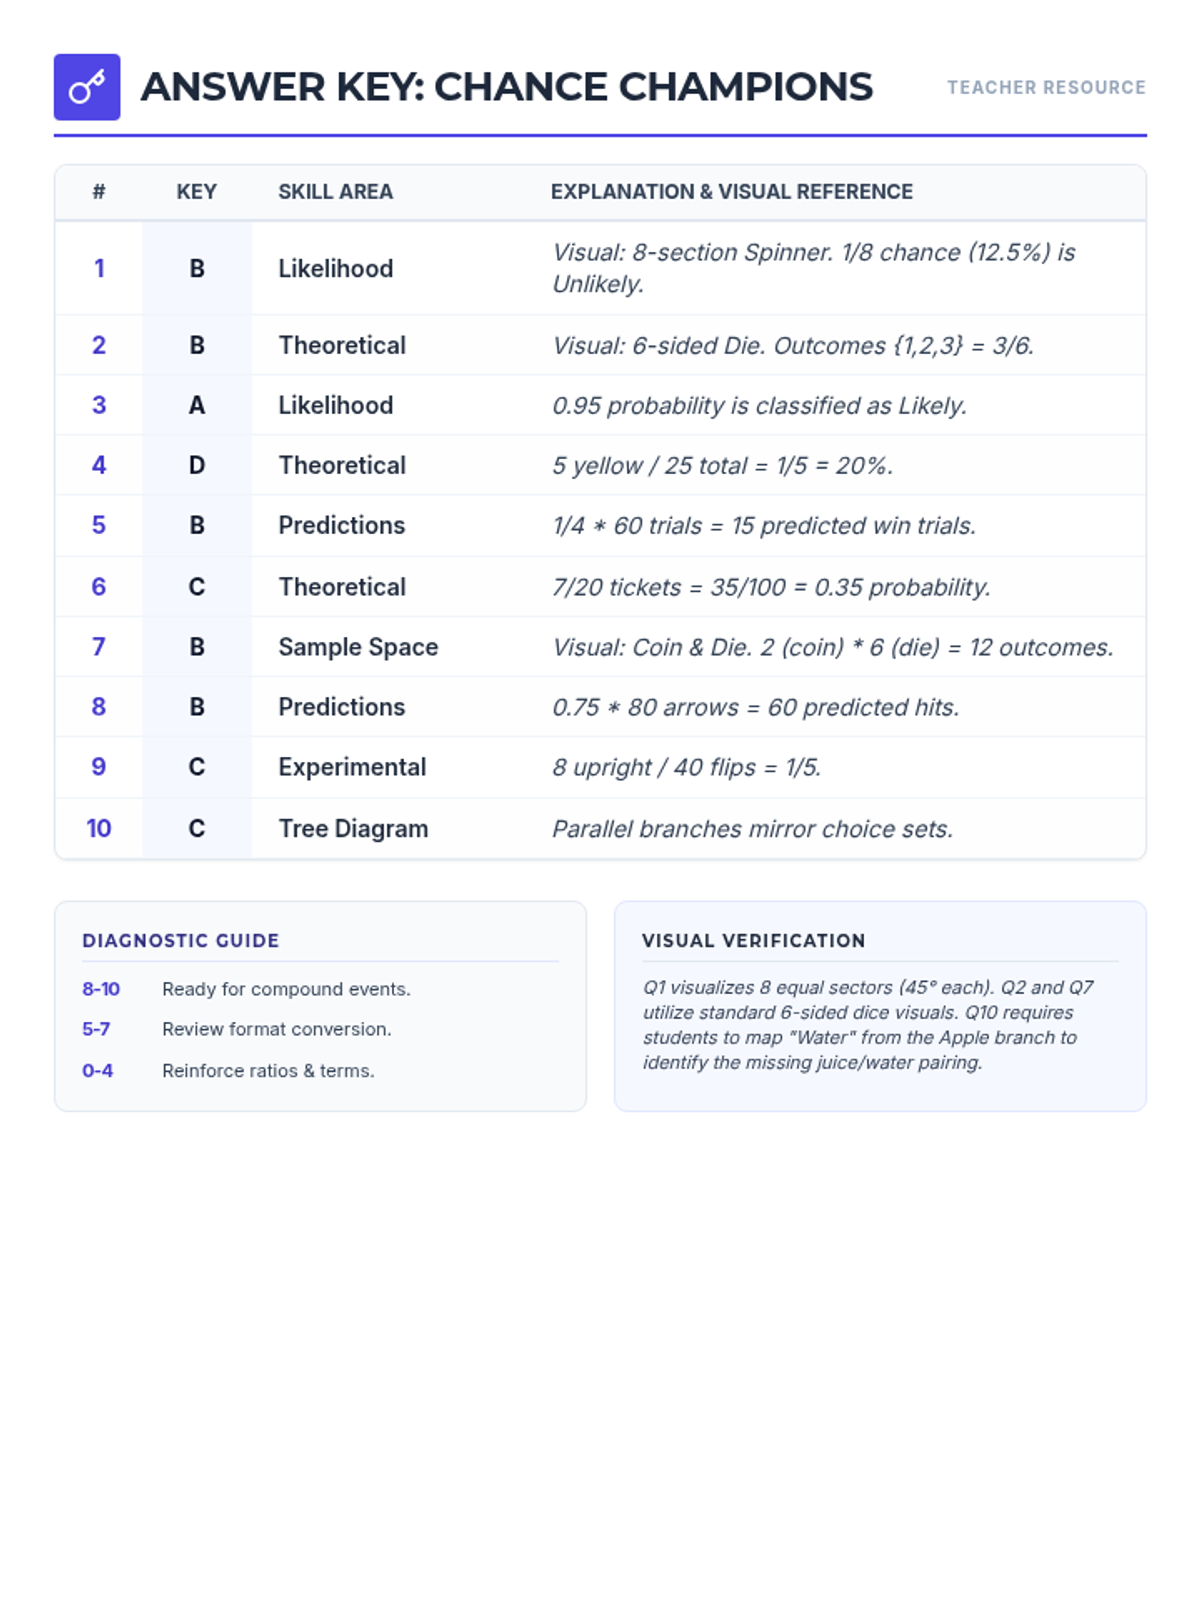
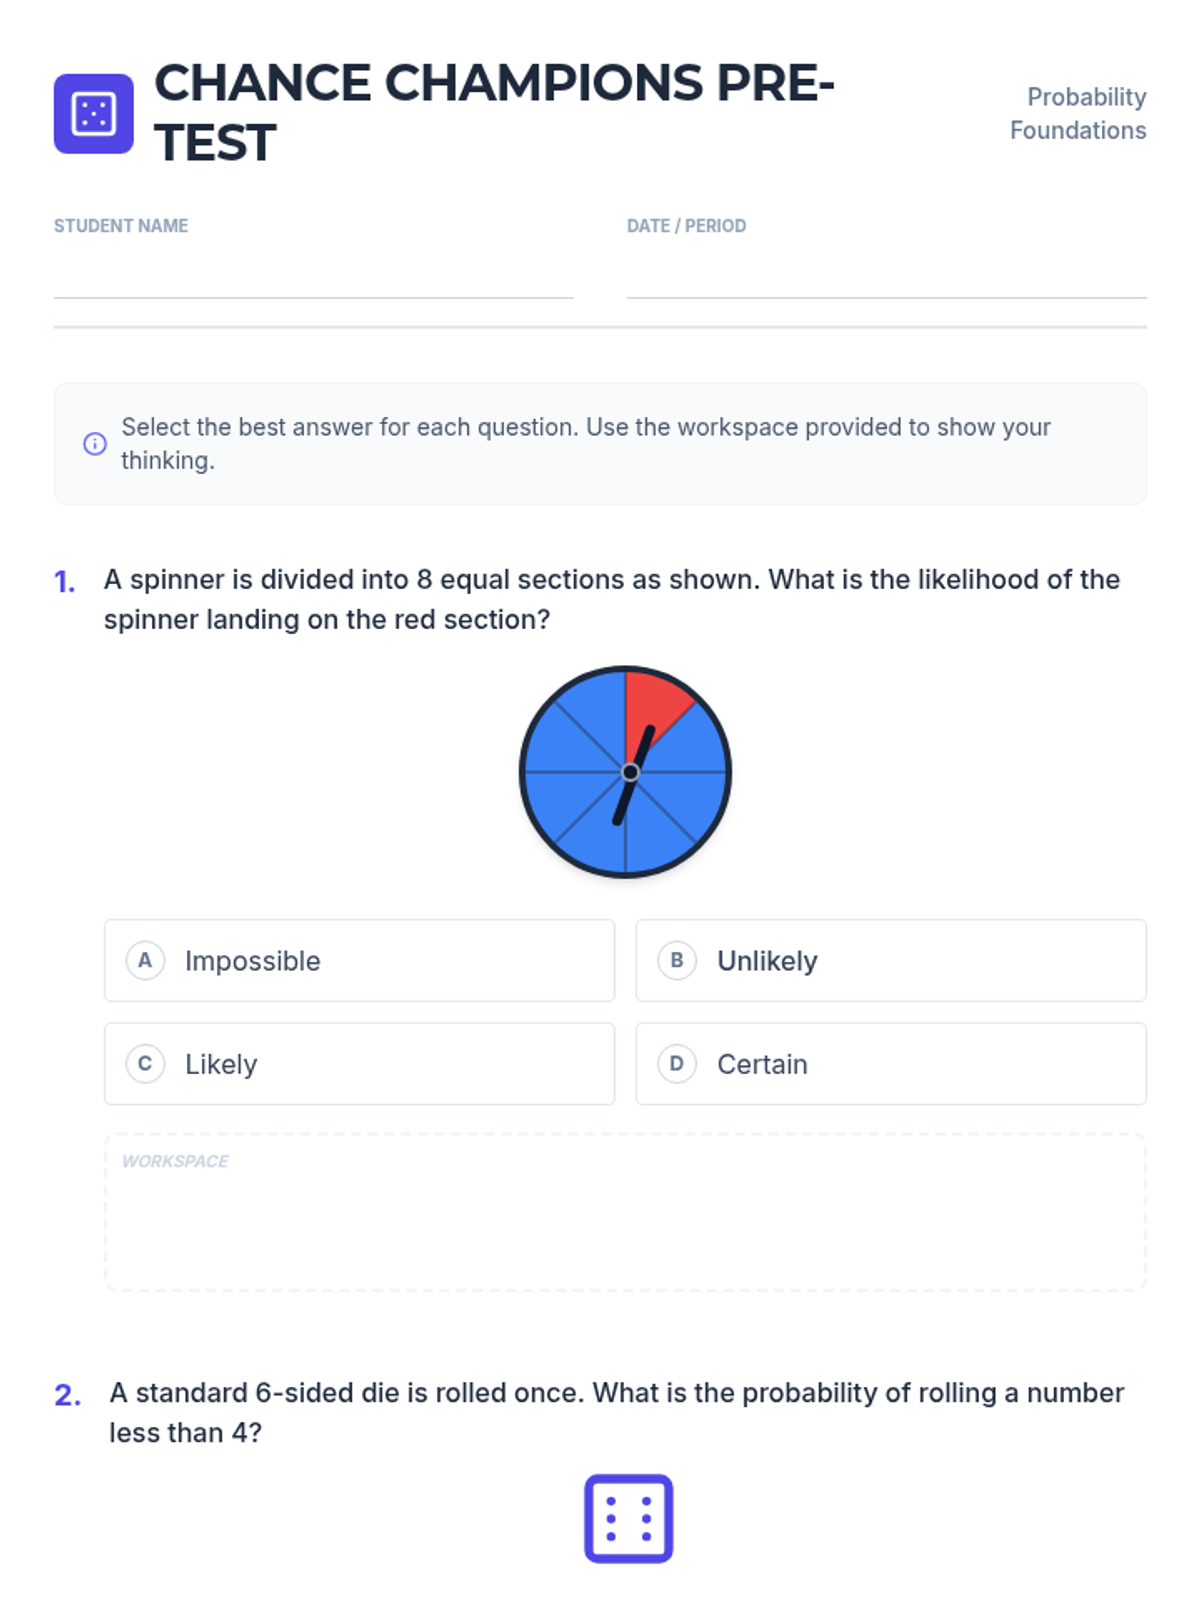
A foundational assessment on probability concepts including simple events, predictions, and sample spaces using spinners and tree diagrams.
A comprehensive lesson on 7th-grade probability covering likelihood, theoretical and experimental probability, compound events, and making predictions.
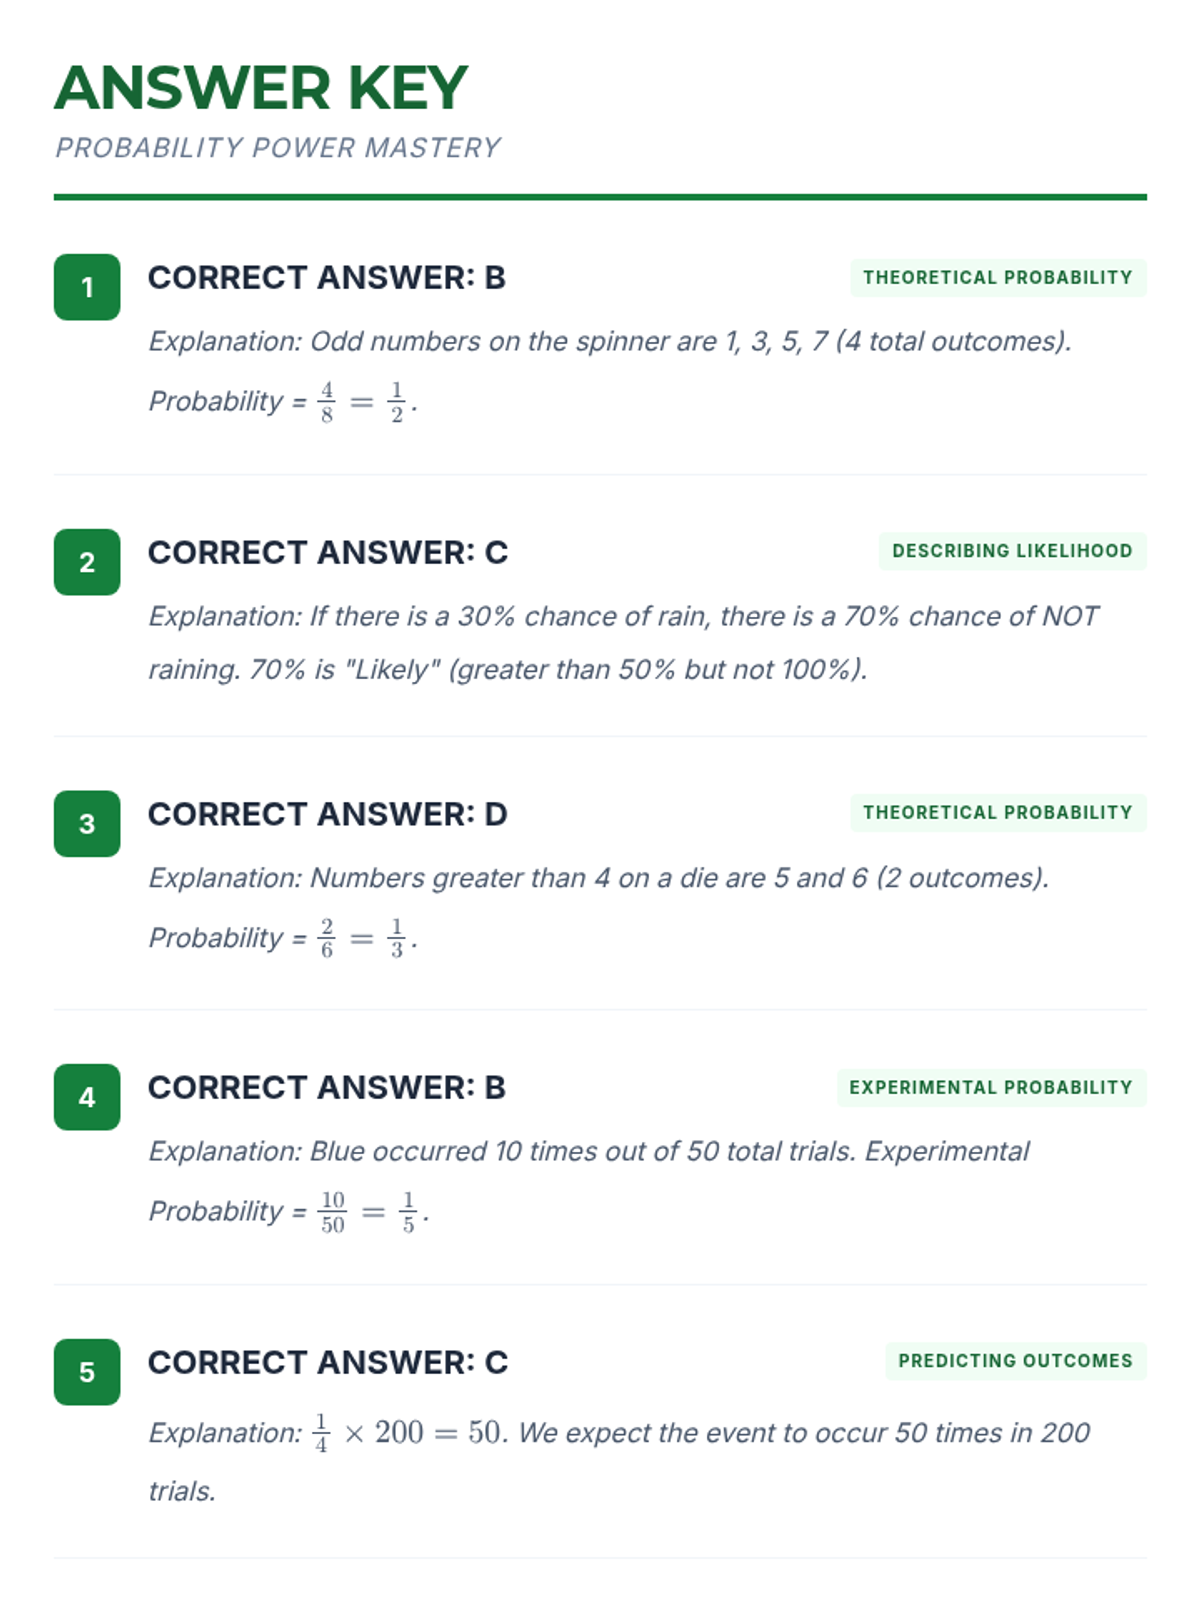
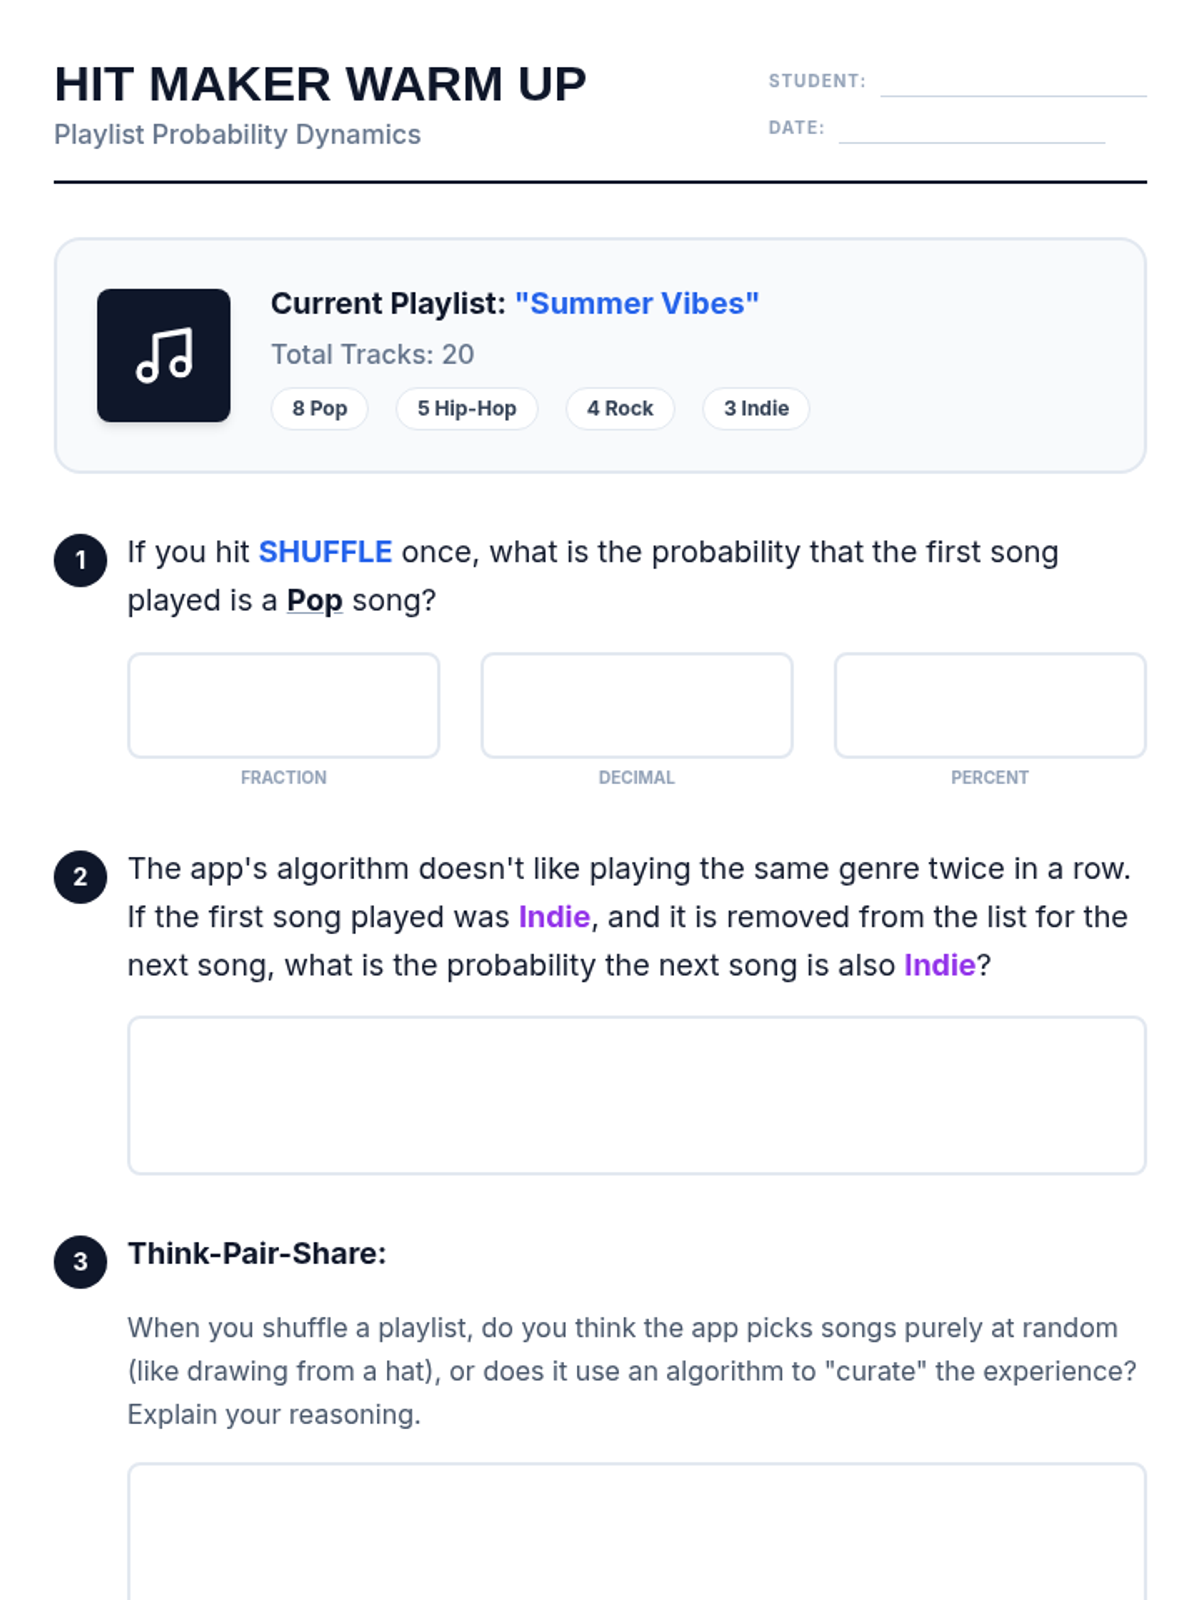
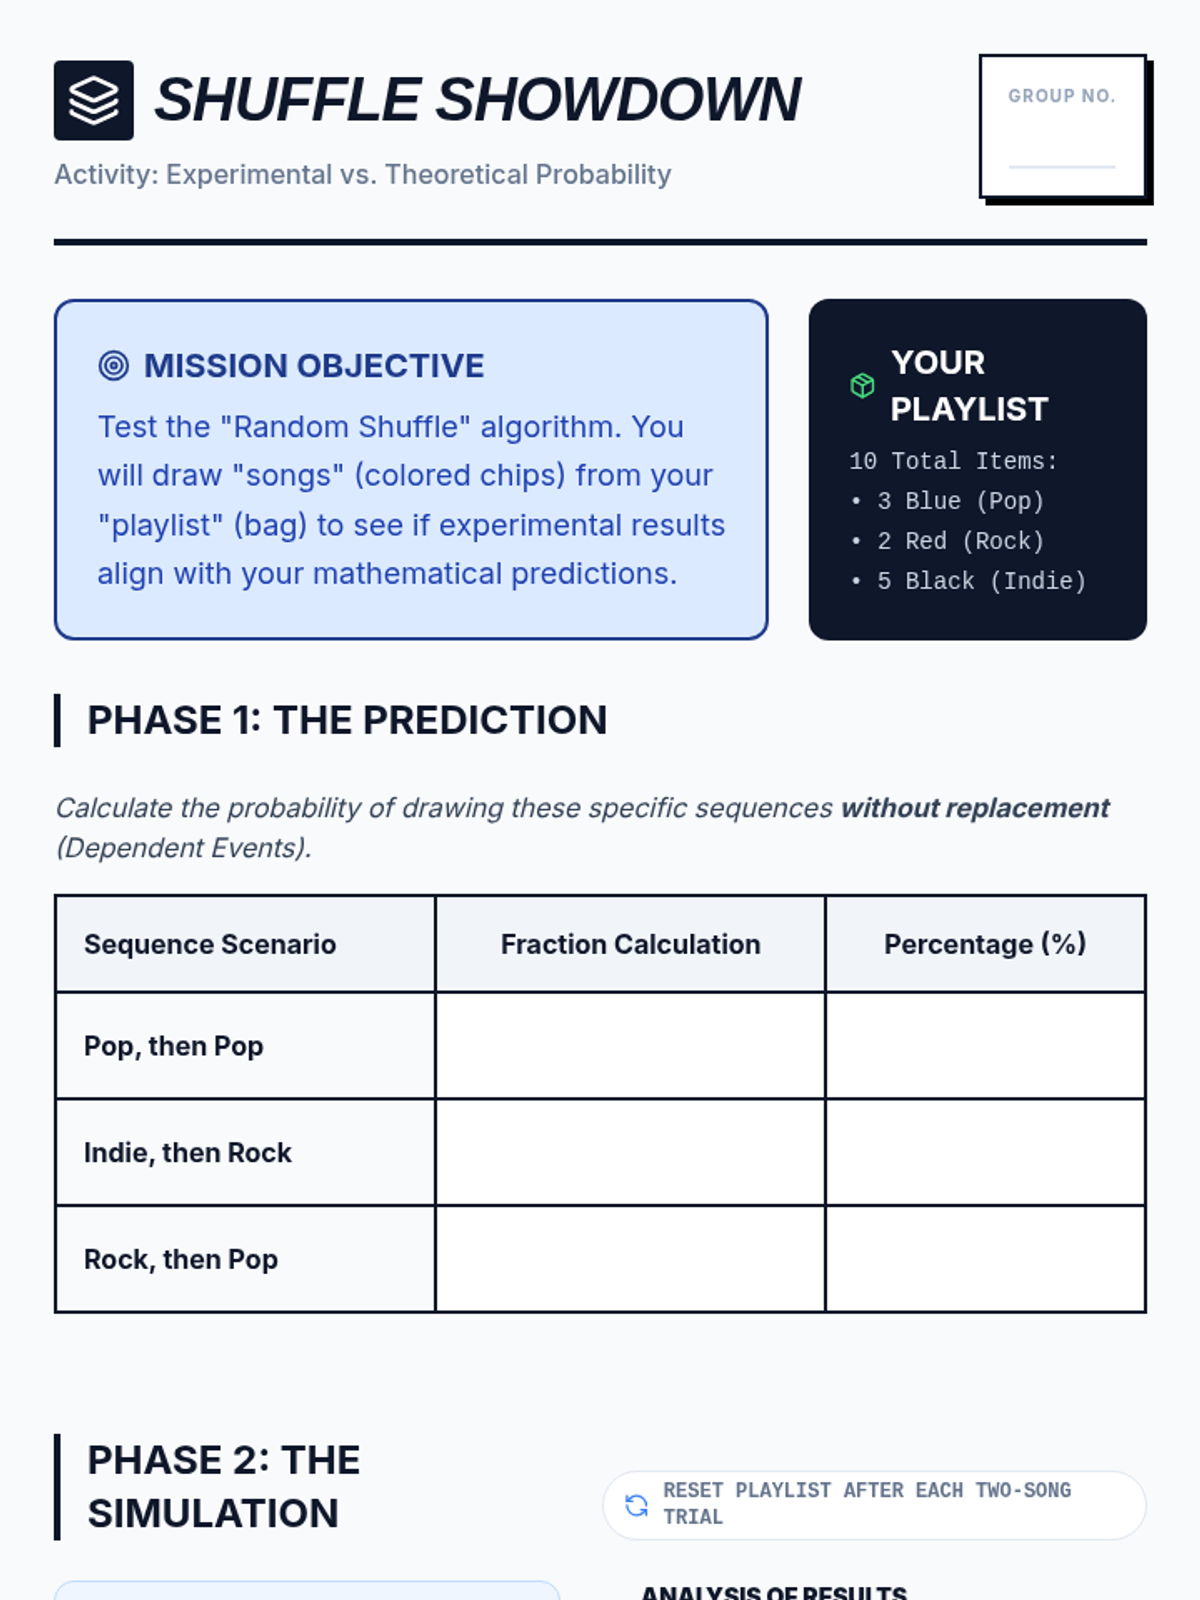
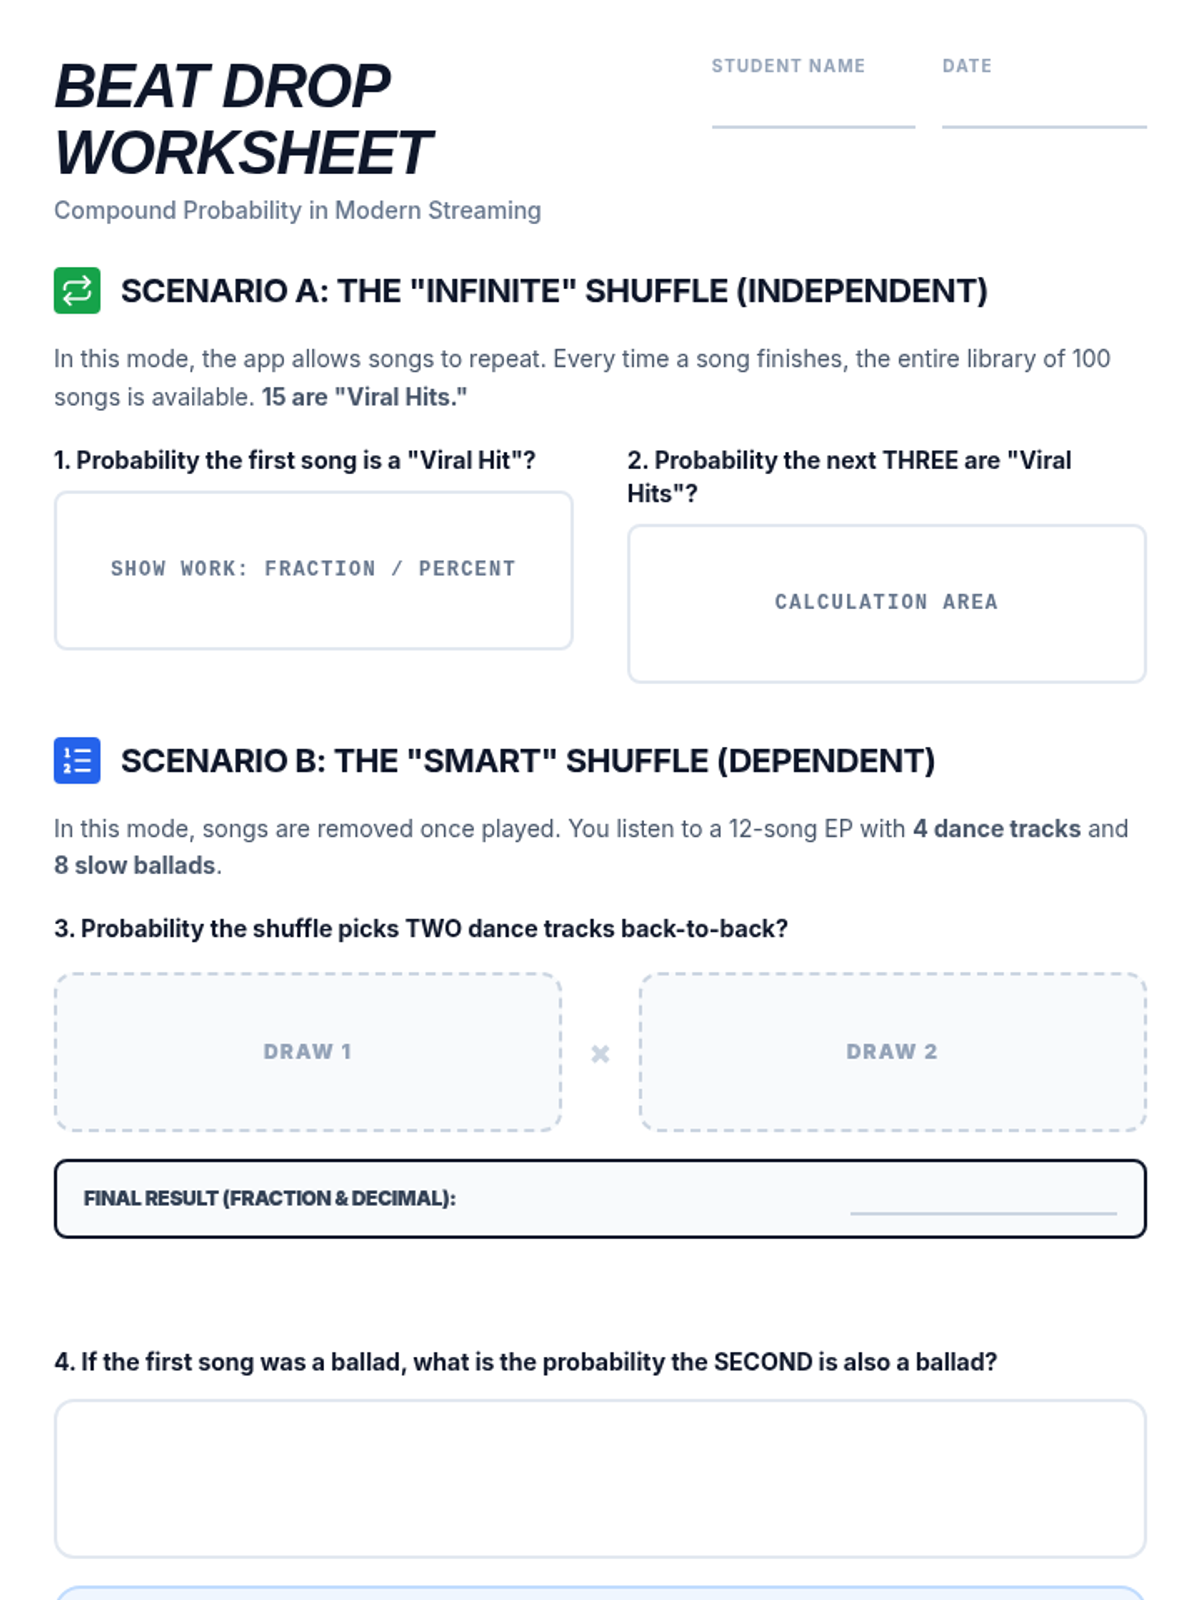
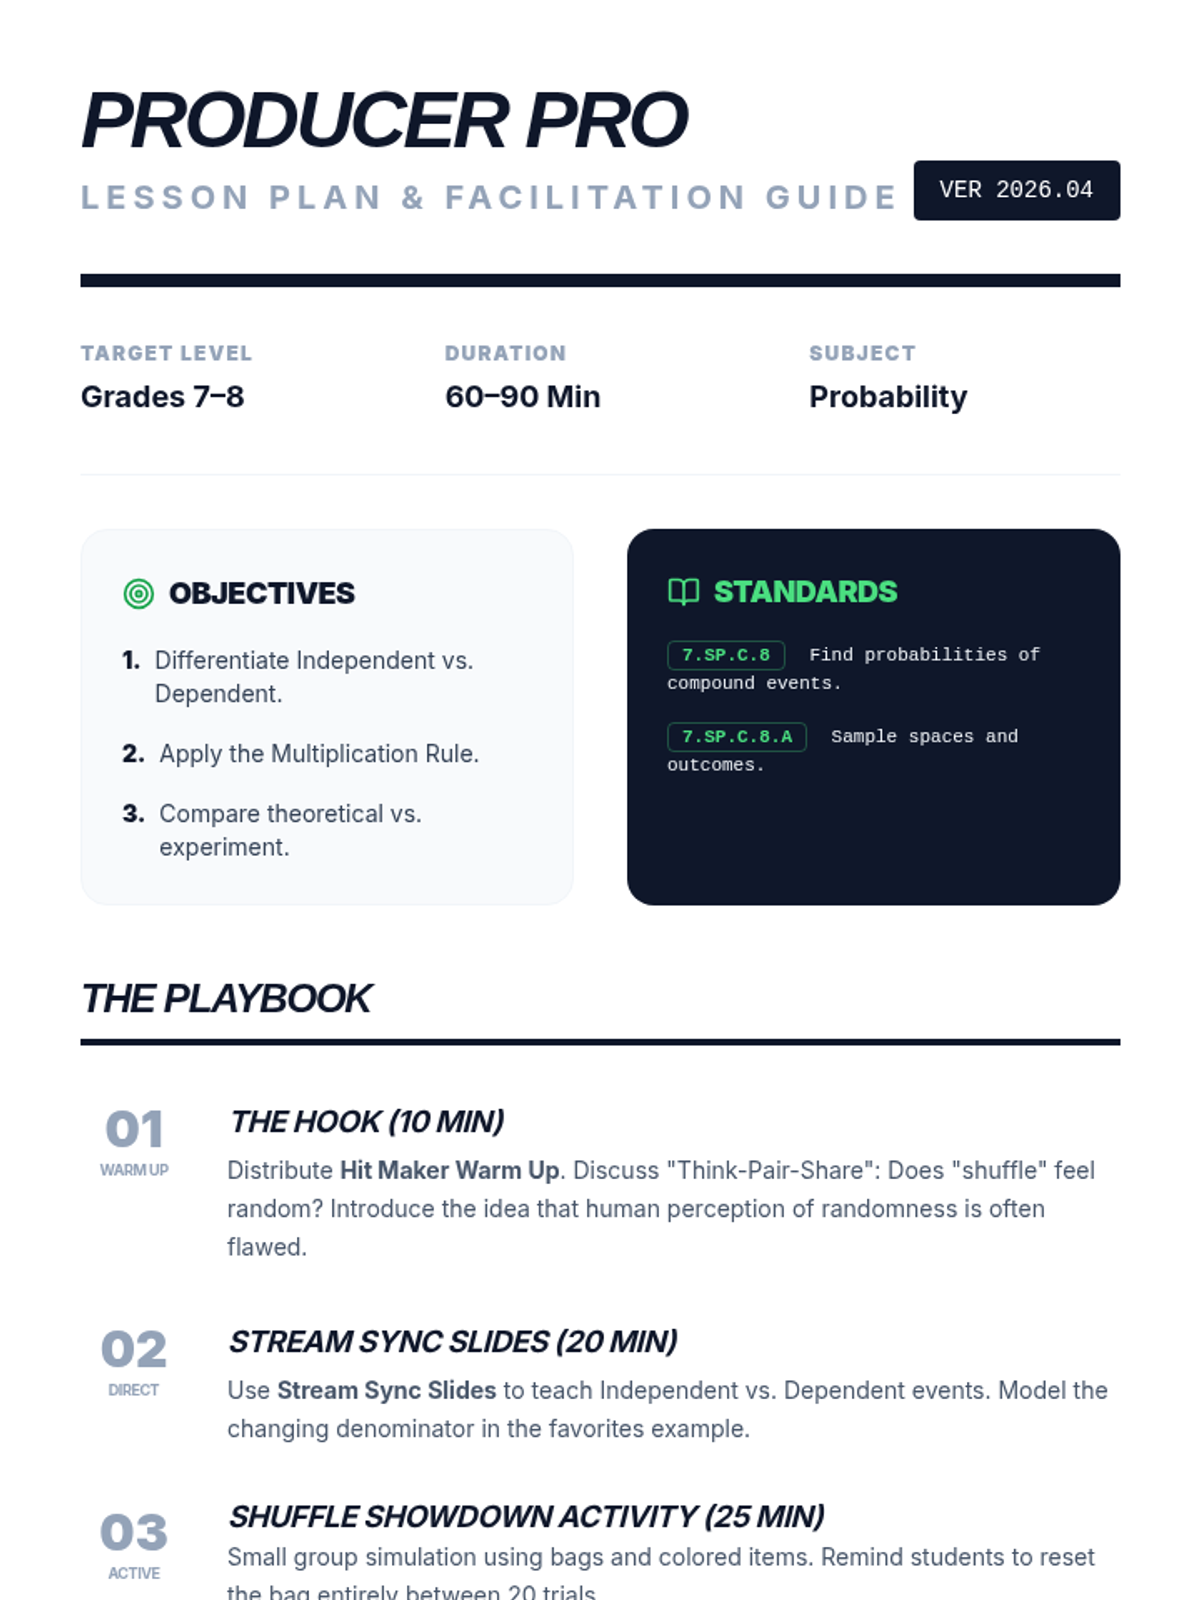
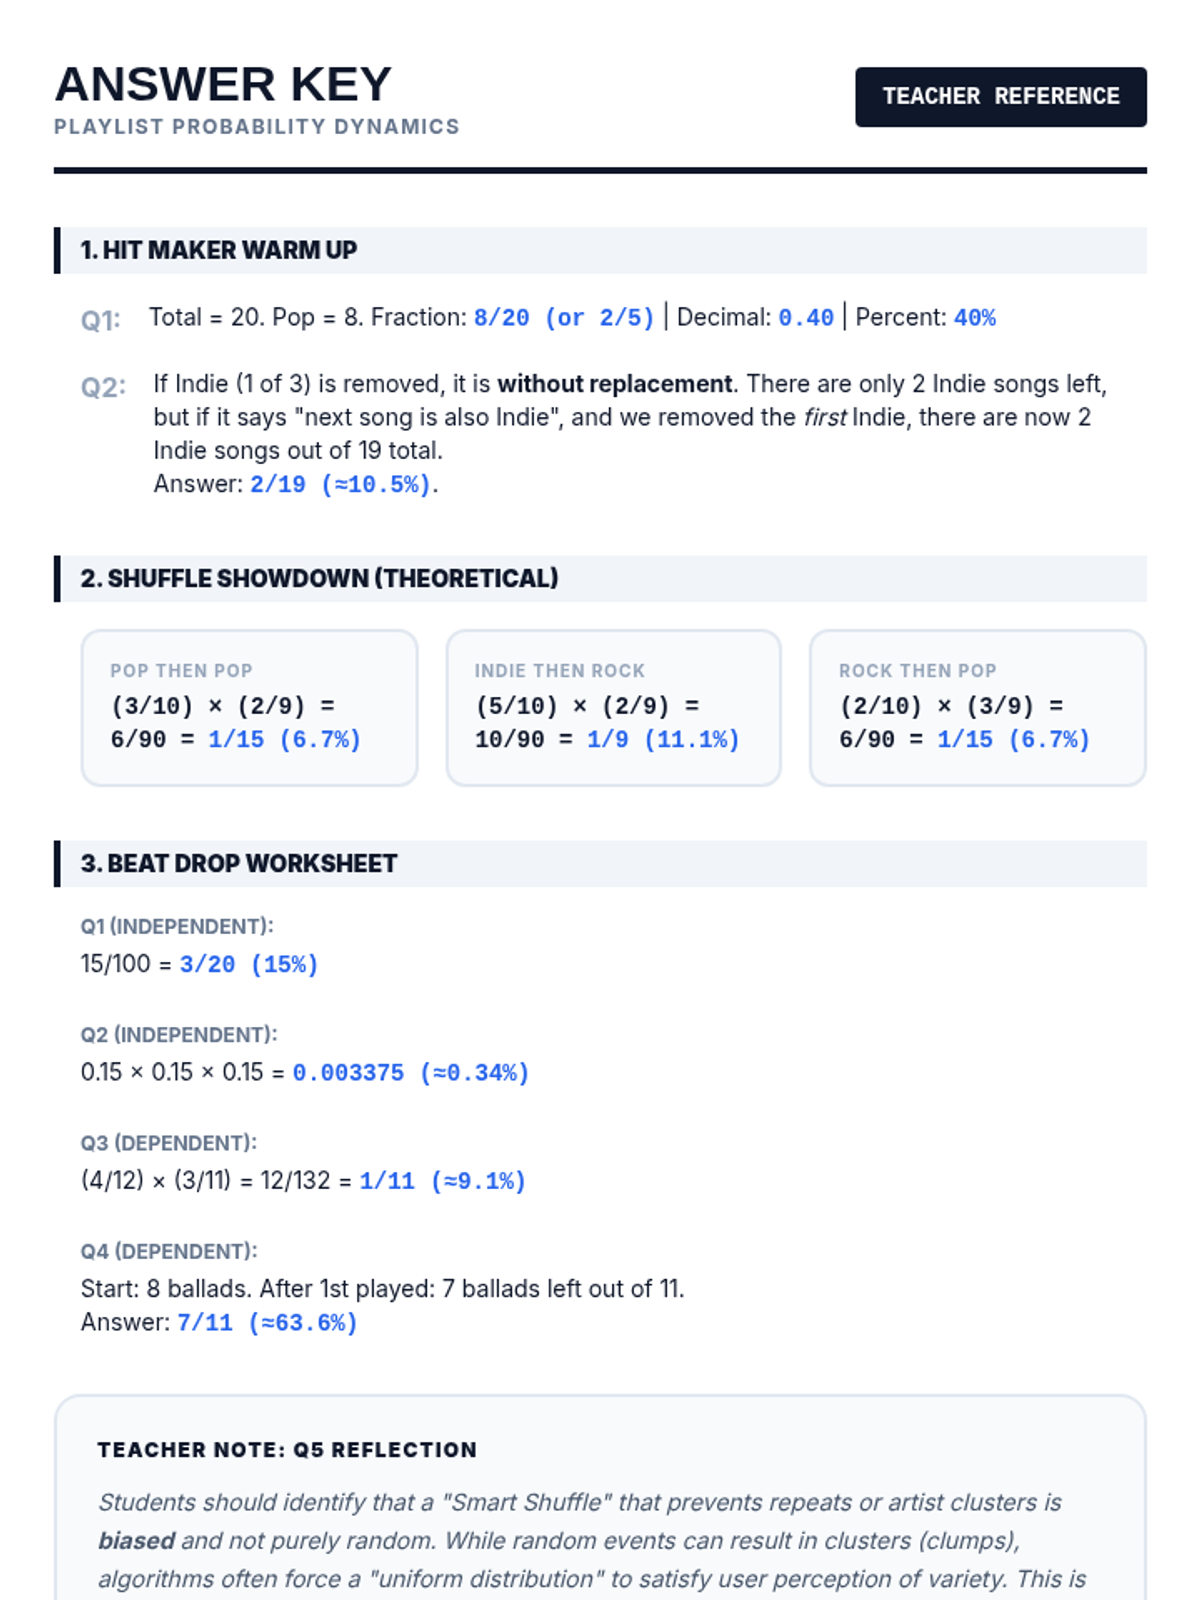
Students explore compound probability and shuffle algorithms by analyzing song frequencies and streaming data to determine the likelihood of hearing their favorite tracks.
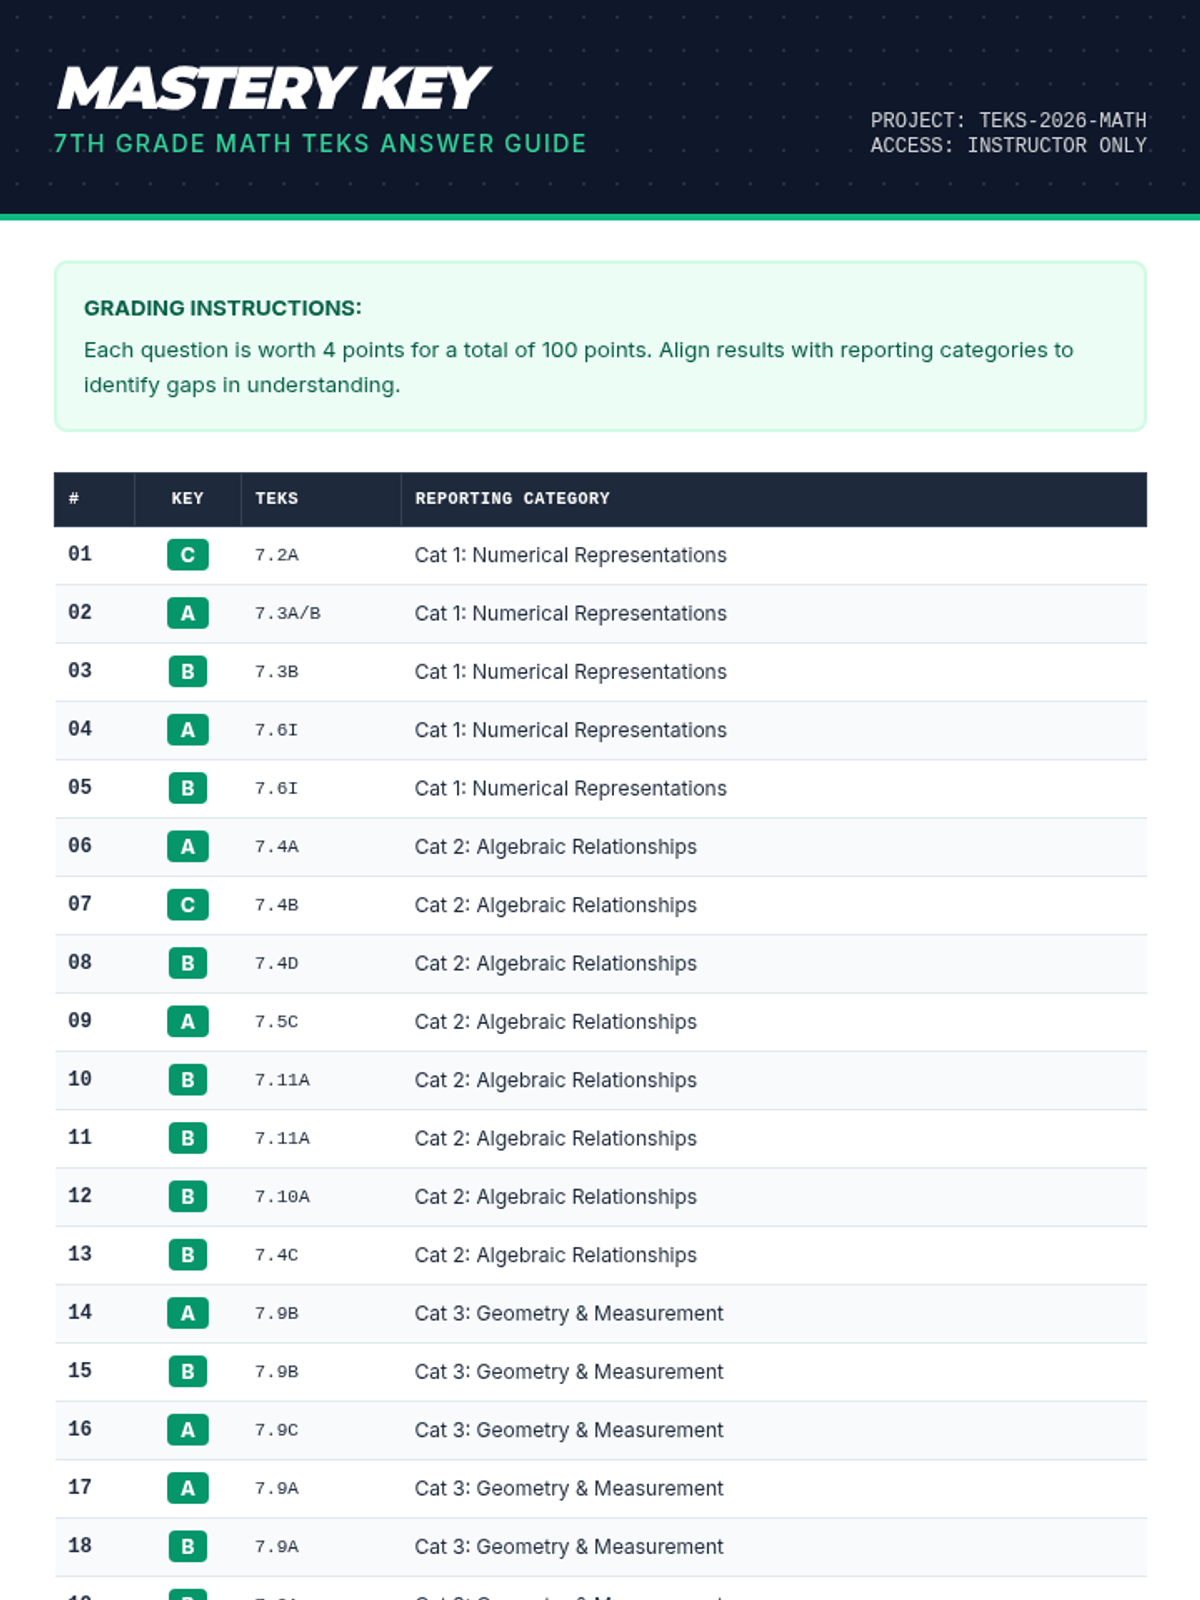
A comprehensive review of all 7th Grade Math TEKS reporting categories, featuring a 25-question cumulative assessment and detailed answer key.
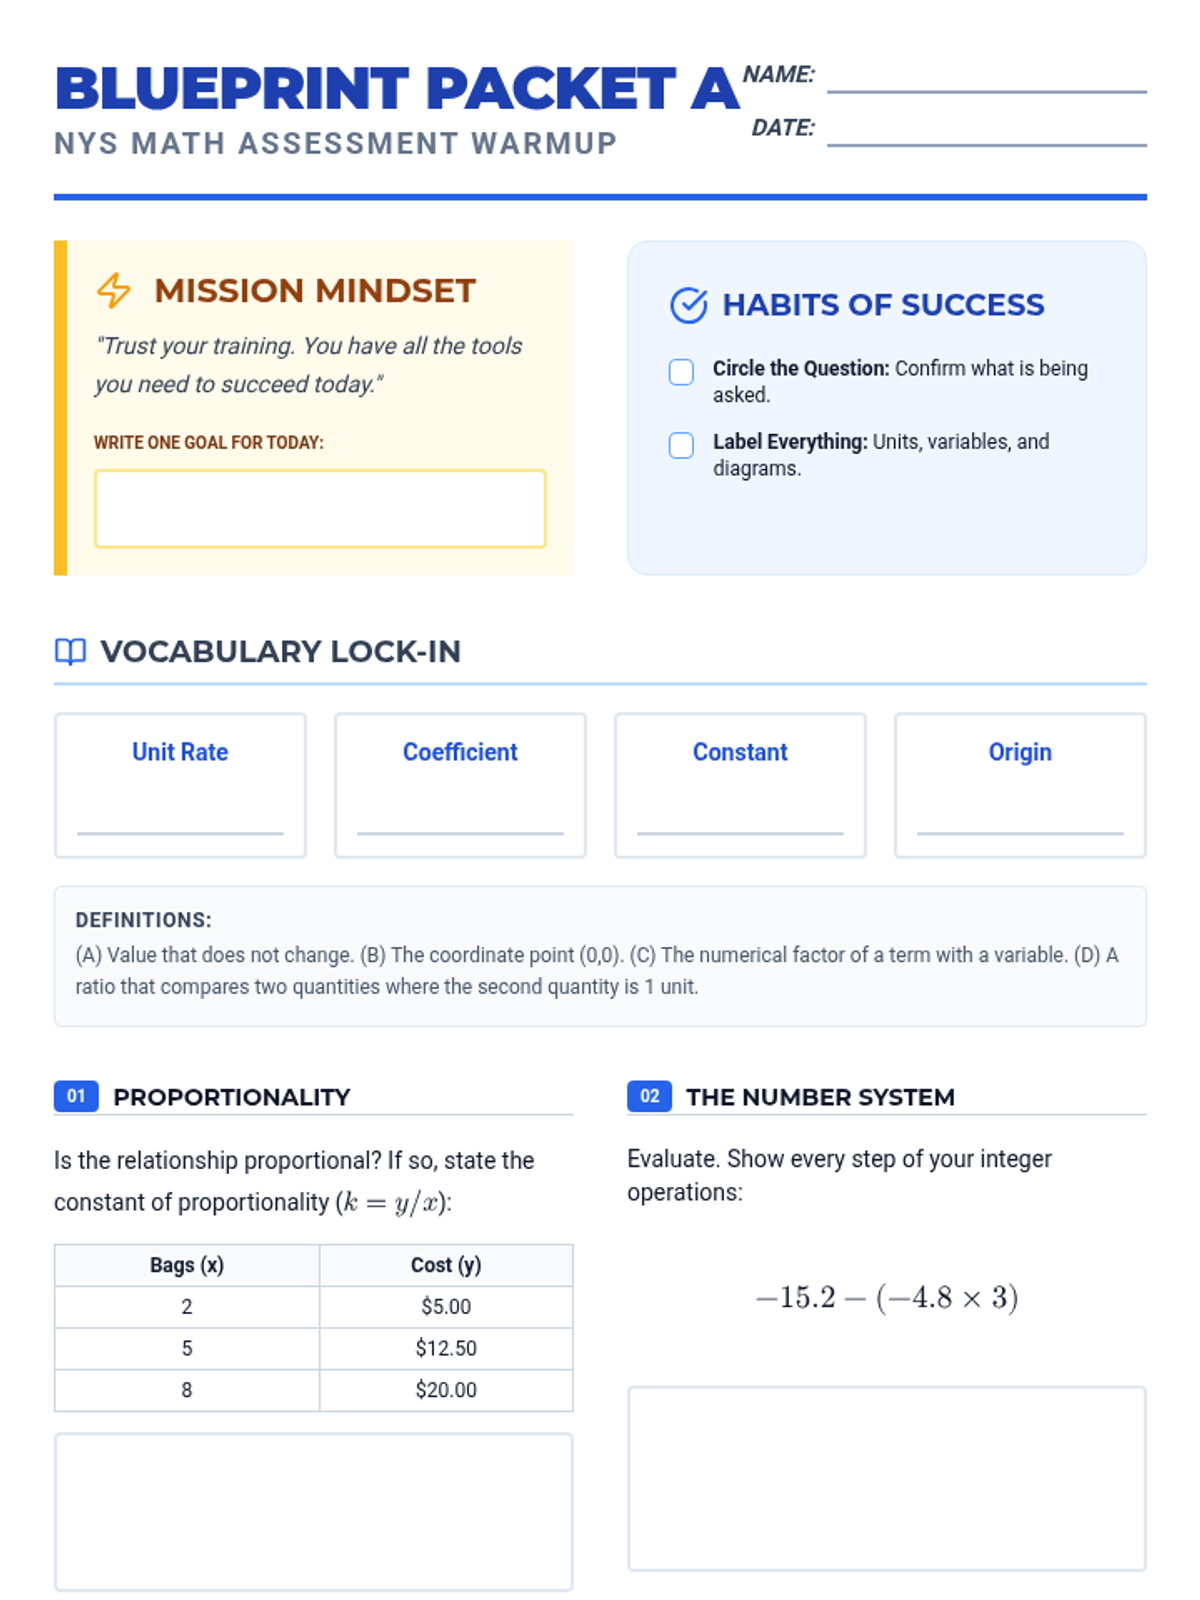
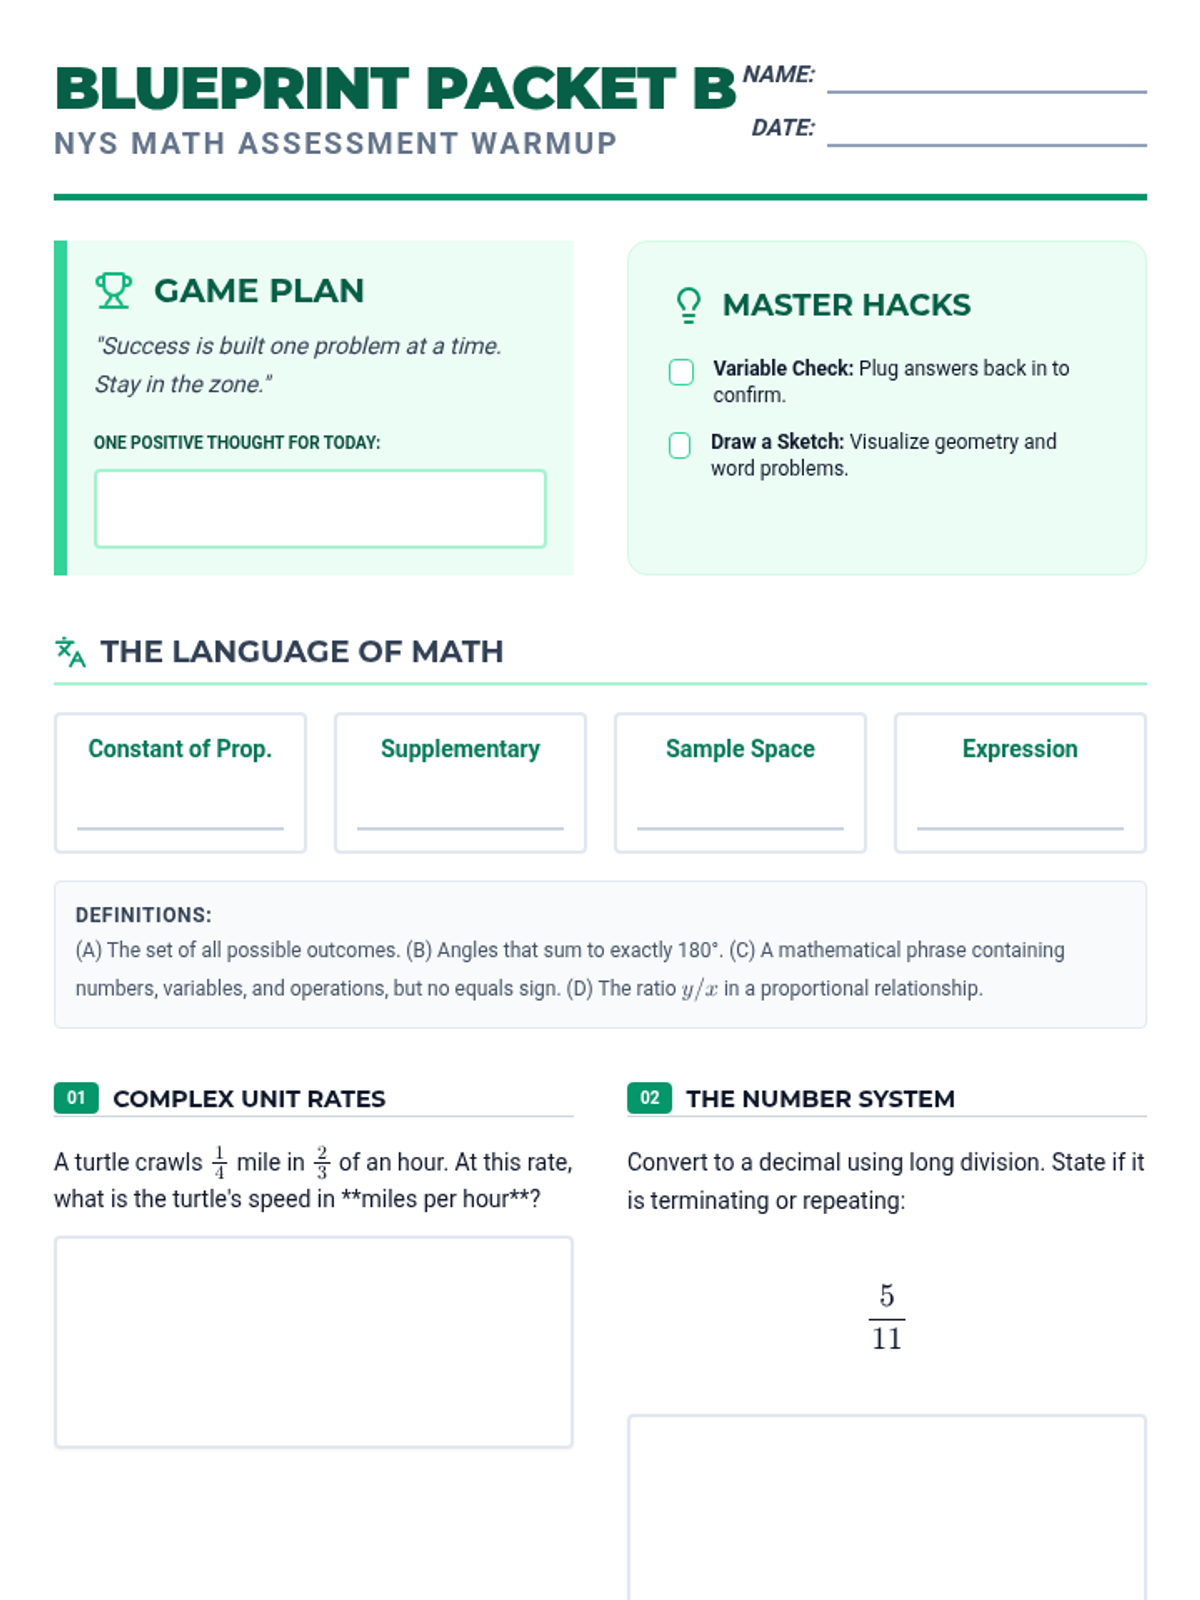
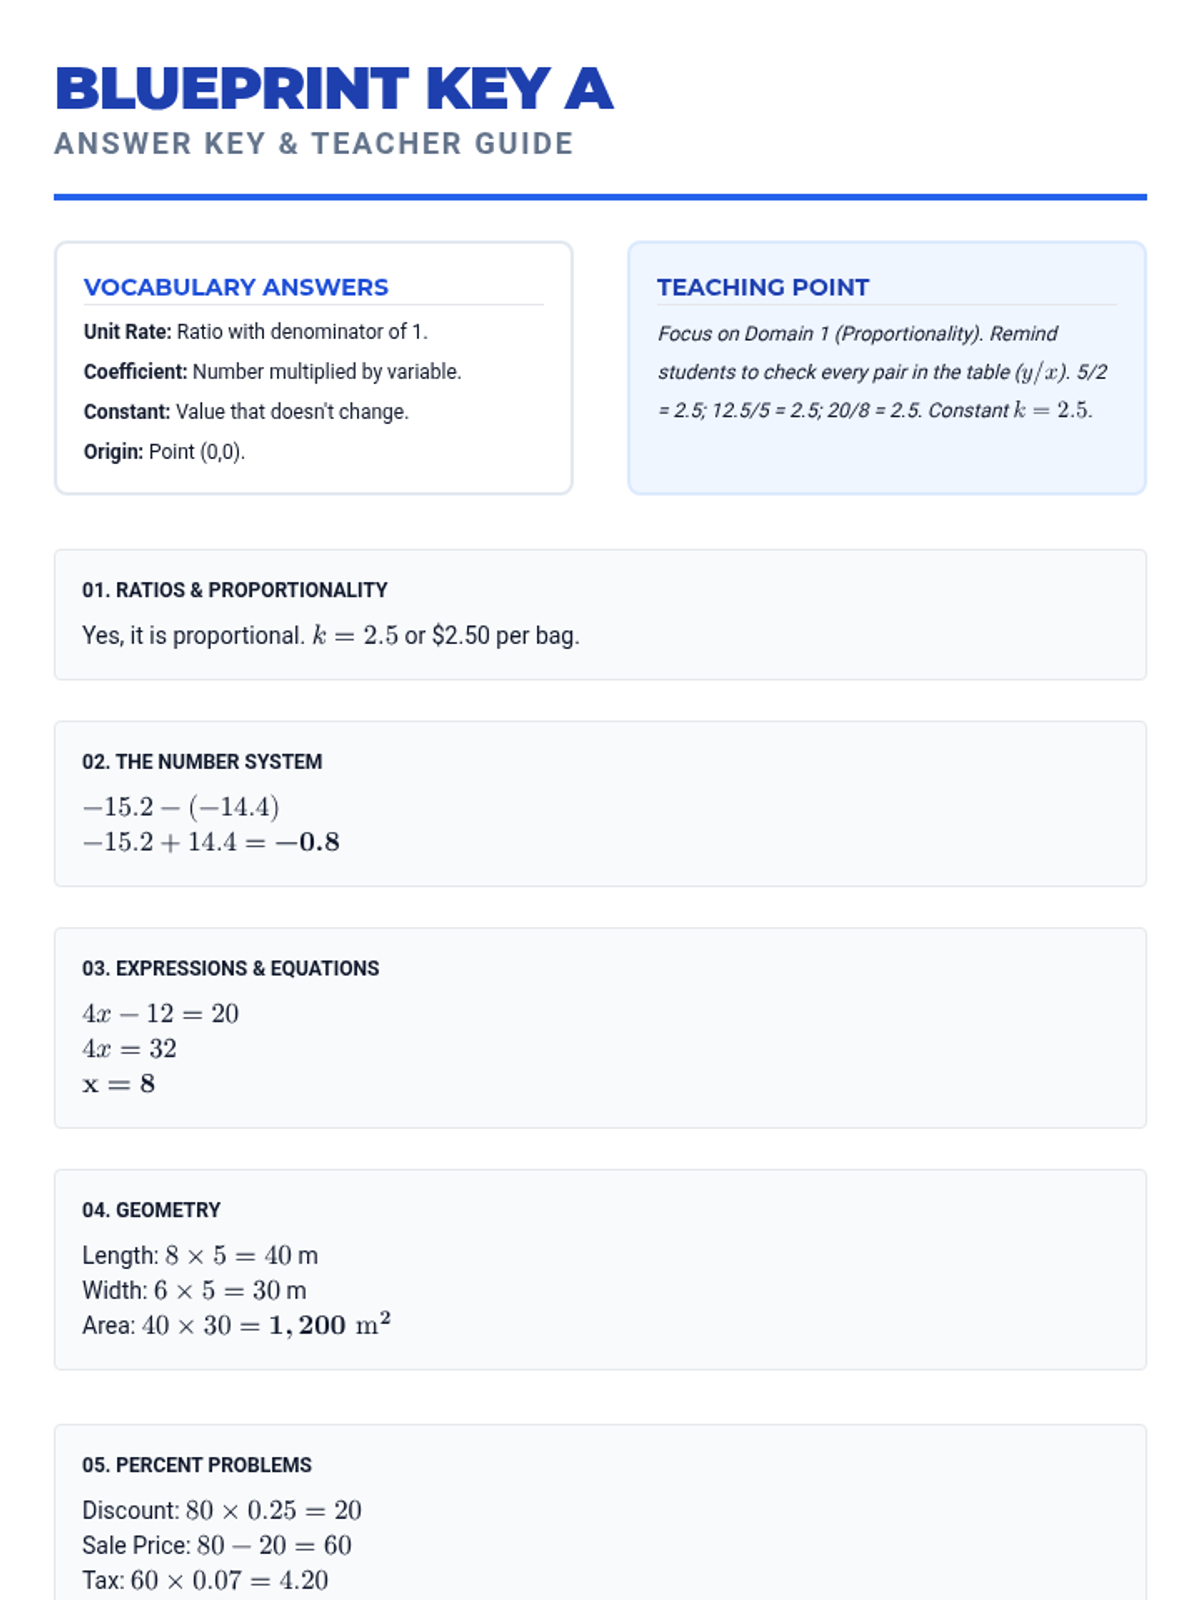
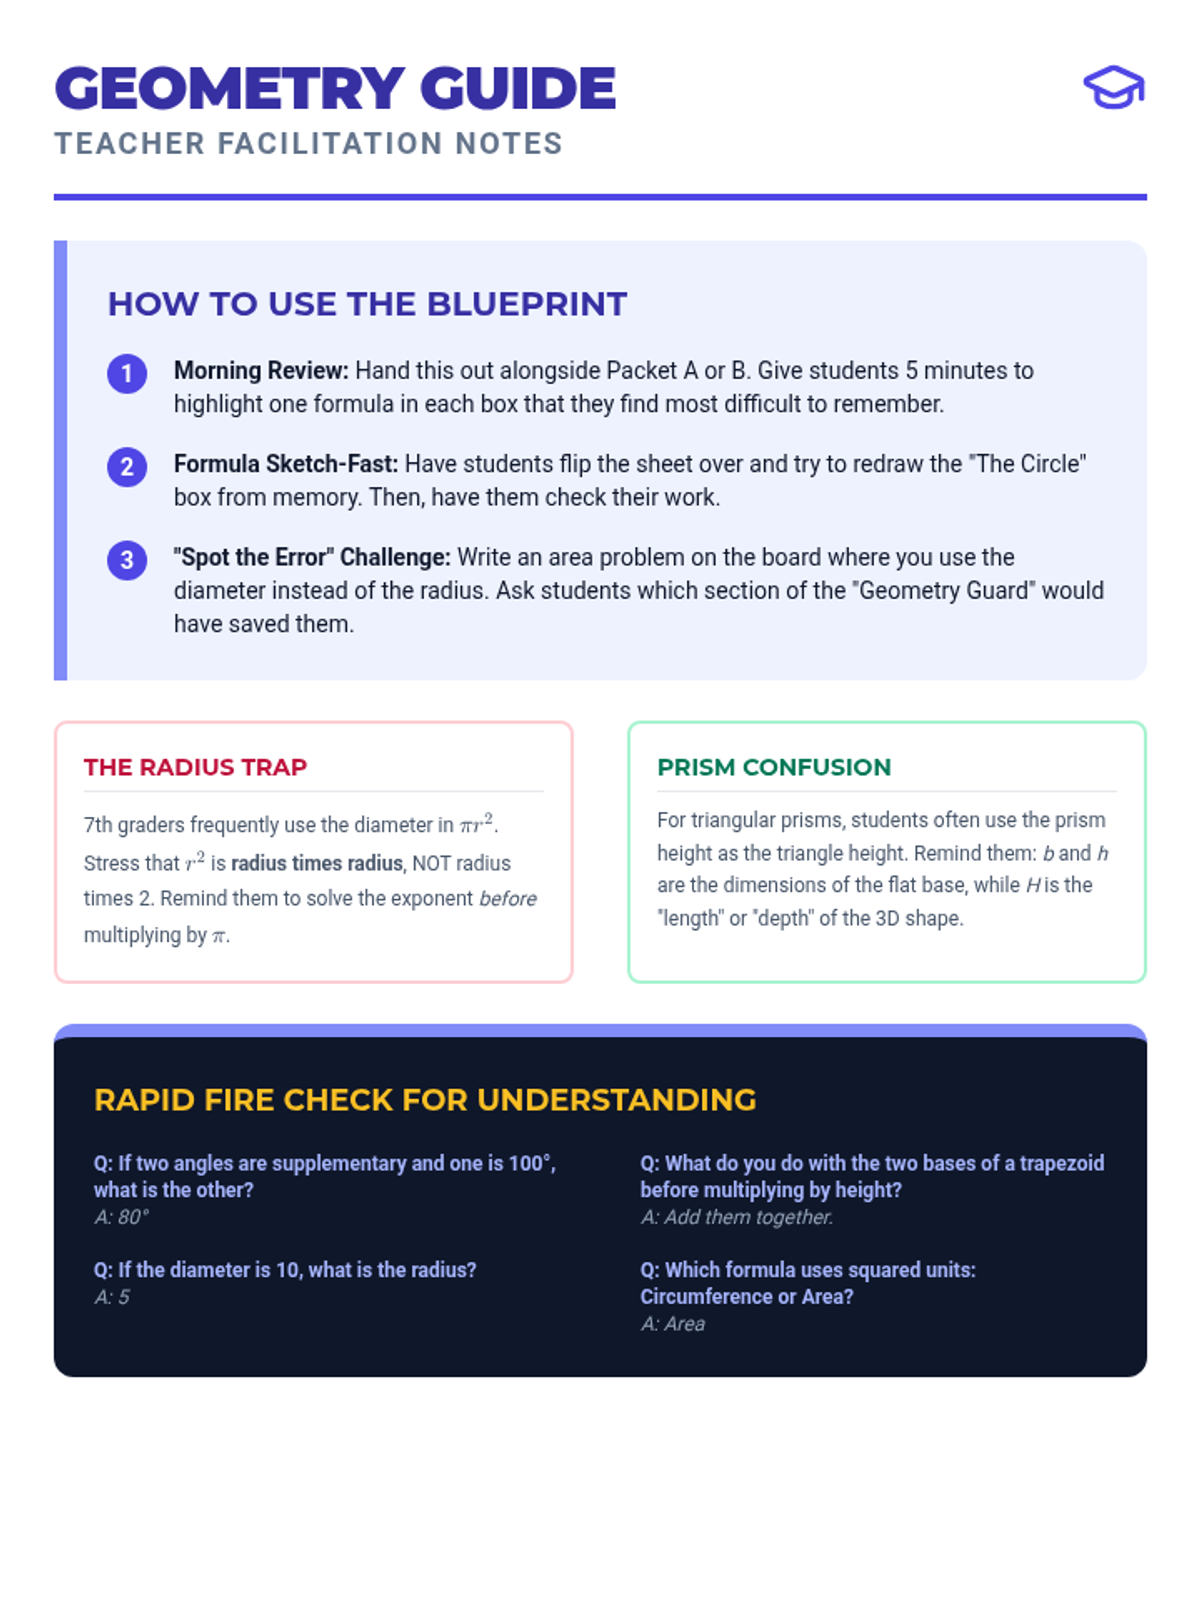
A pair of intensive, 30-minute test-prep morning work packets designed for the morning of the NYS Grade 7 Math Test, covering all major domains with a focus on confidence and strategy.
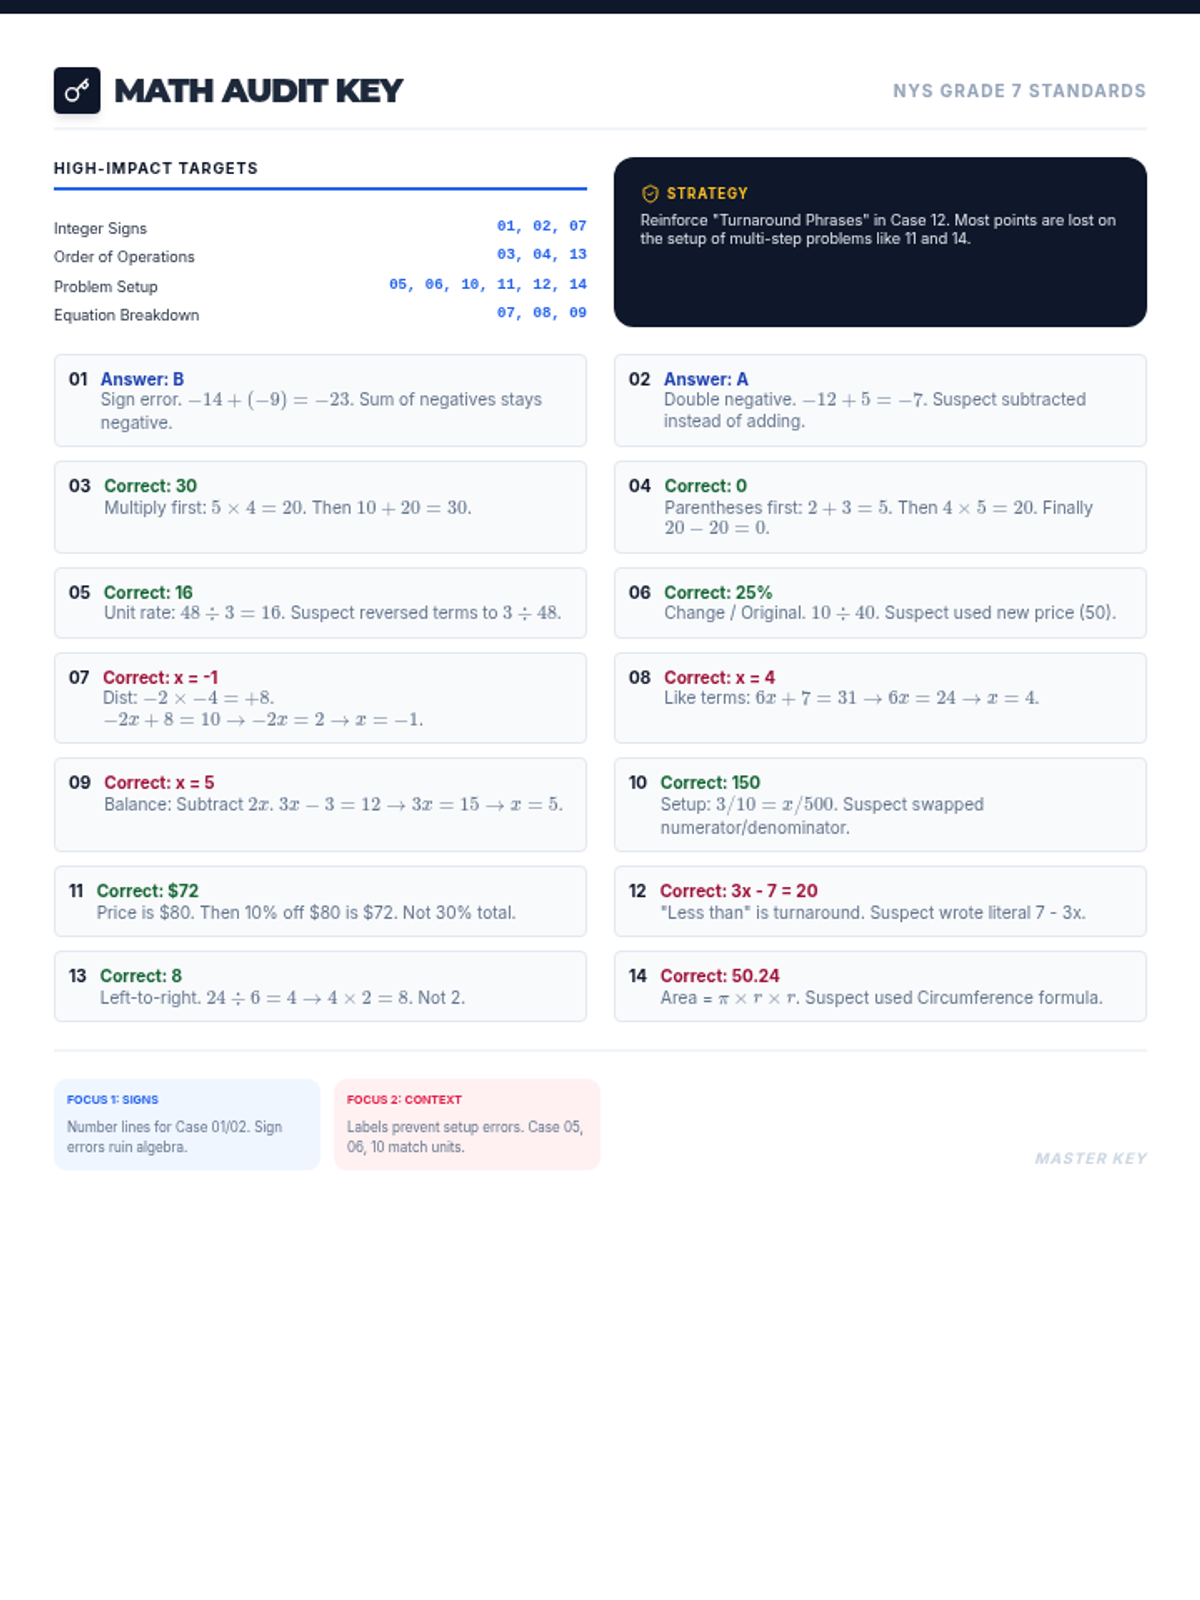
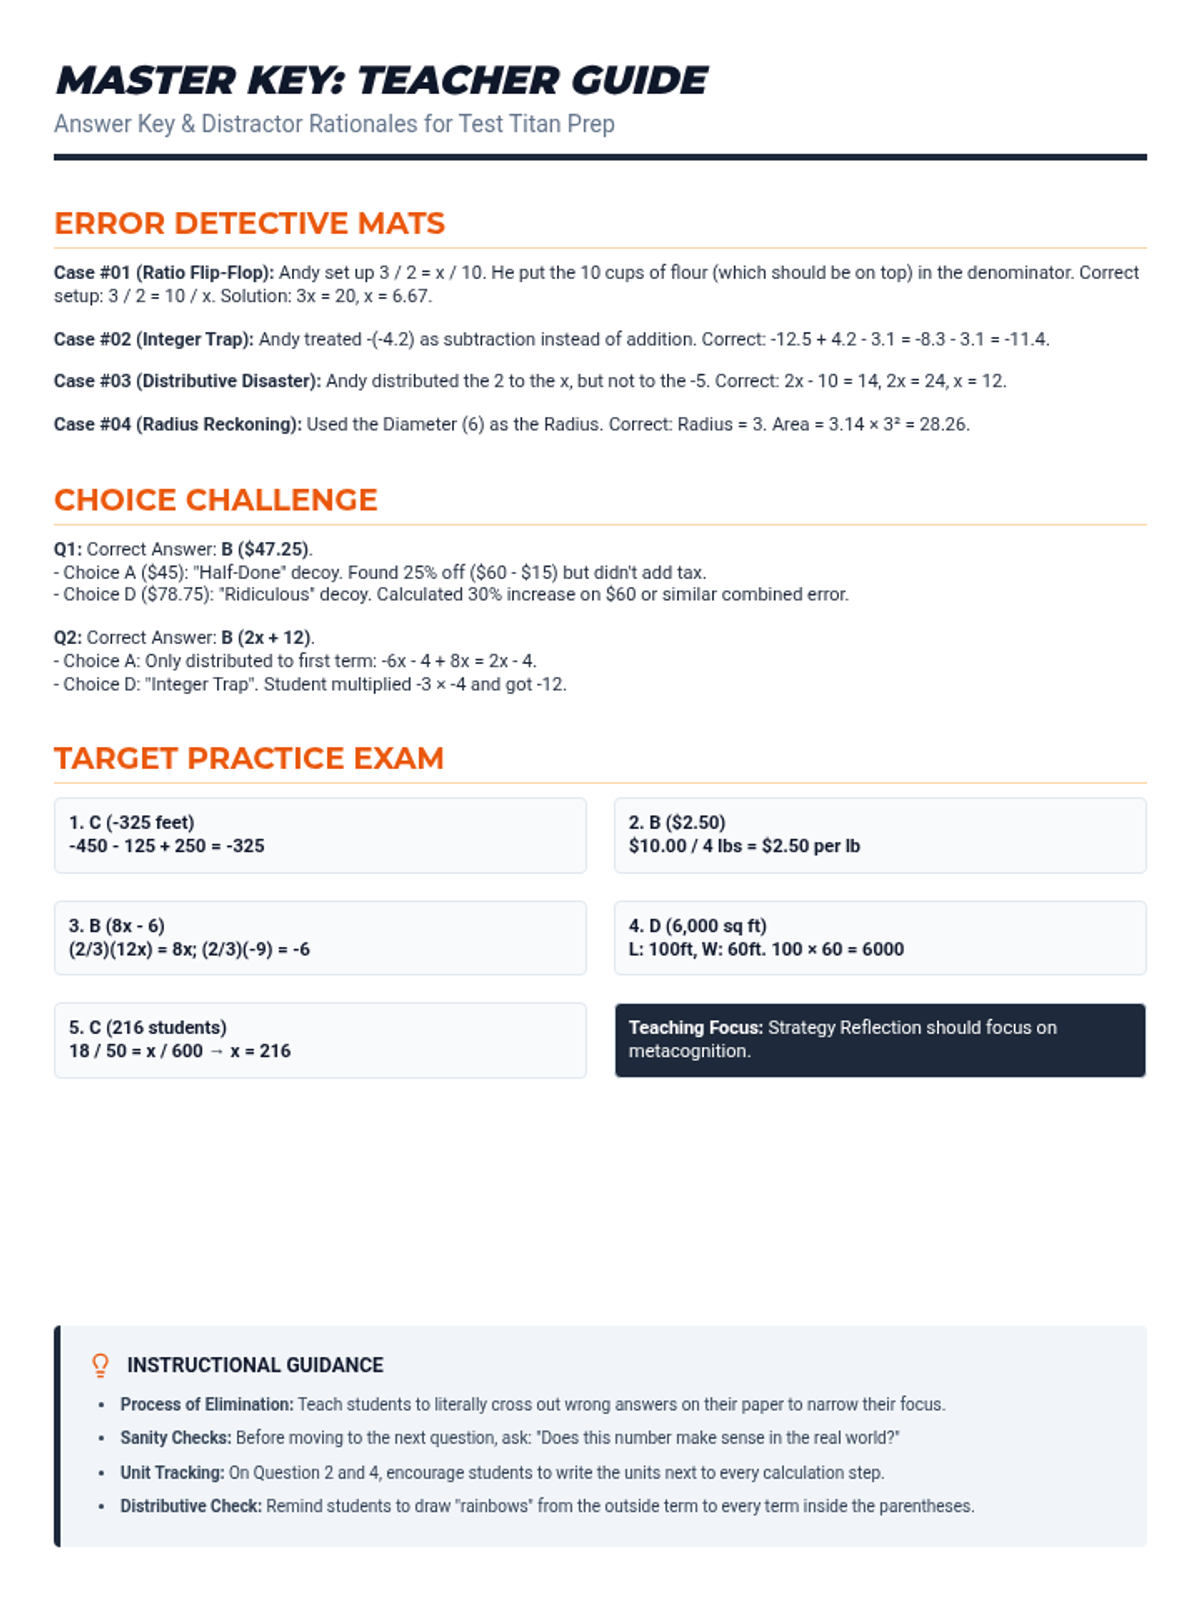
A comprehensive error analysis packet focusing on the top 14 most common mathematical misconceptions seen on 7th-grade standardized exams. Students act as 'Math Auditors' to identify, correct, and explain procedural and conceptual mistakes across all major domains.
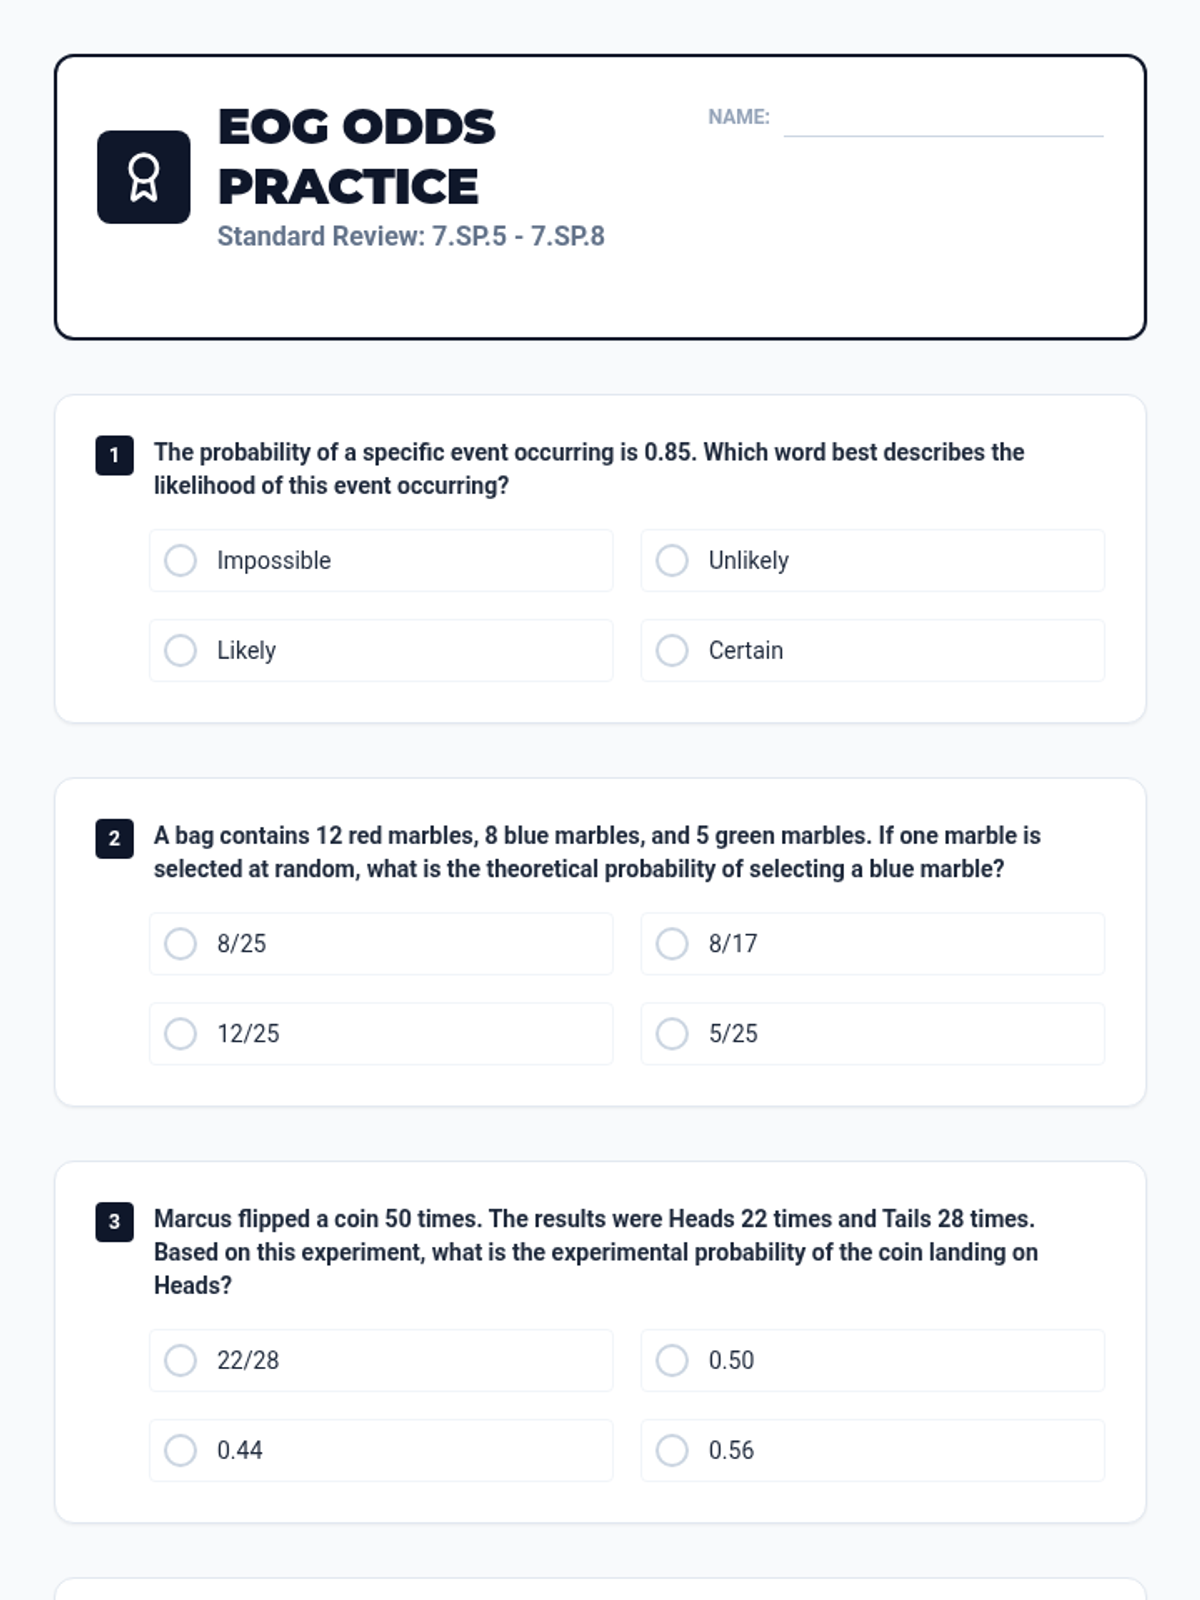
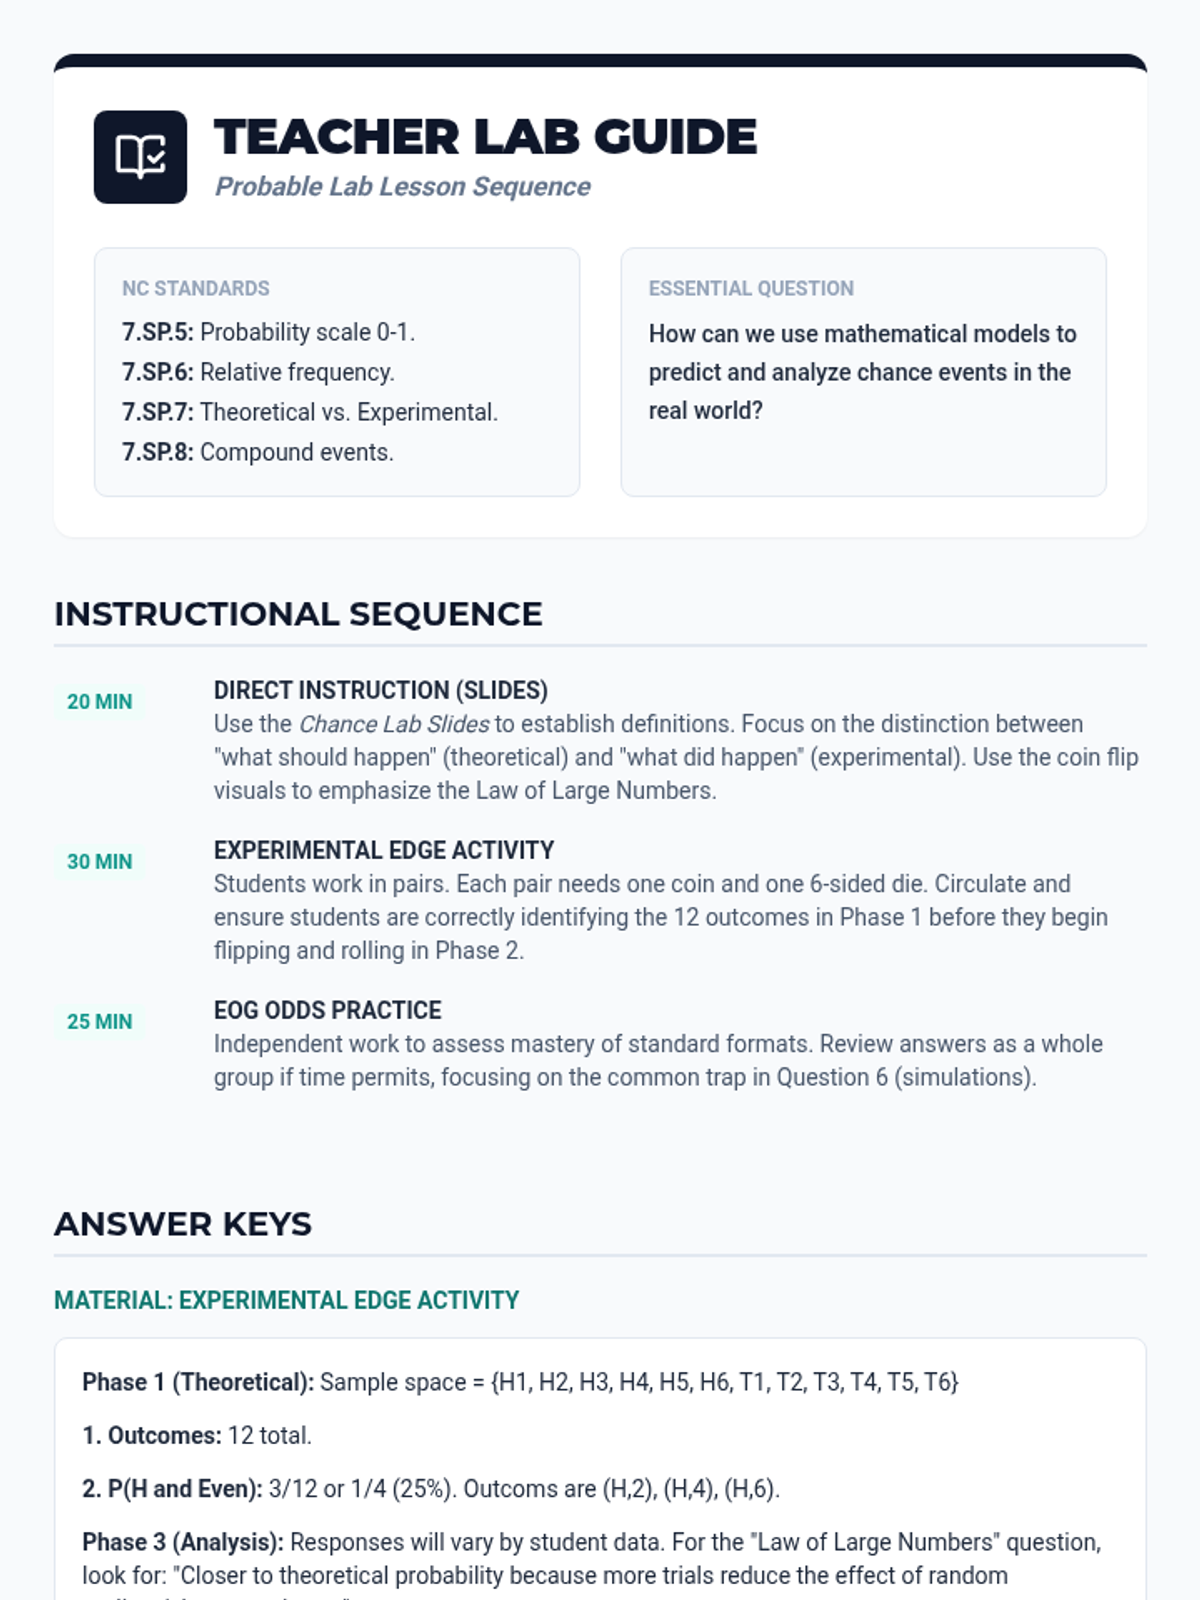
A comprehensive lesson exploring the relationship between theoretical and experimental probability through hands-on simulations and EOG-style practice. Students will move from understanding the probability scale to conducting their own chance experiments and analyzing the results.
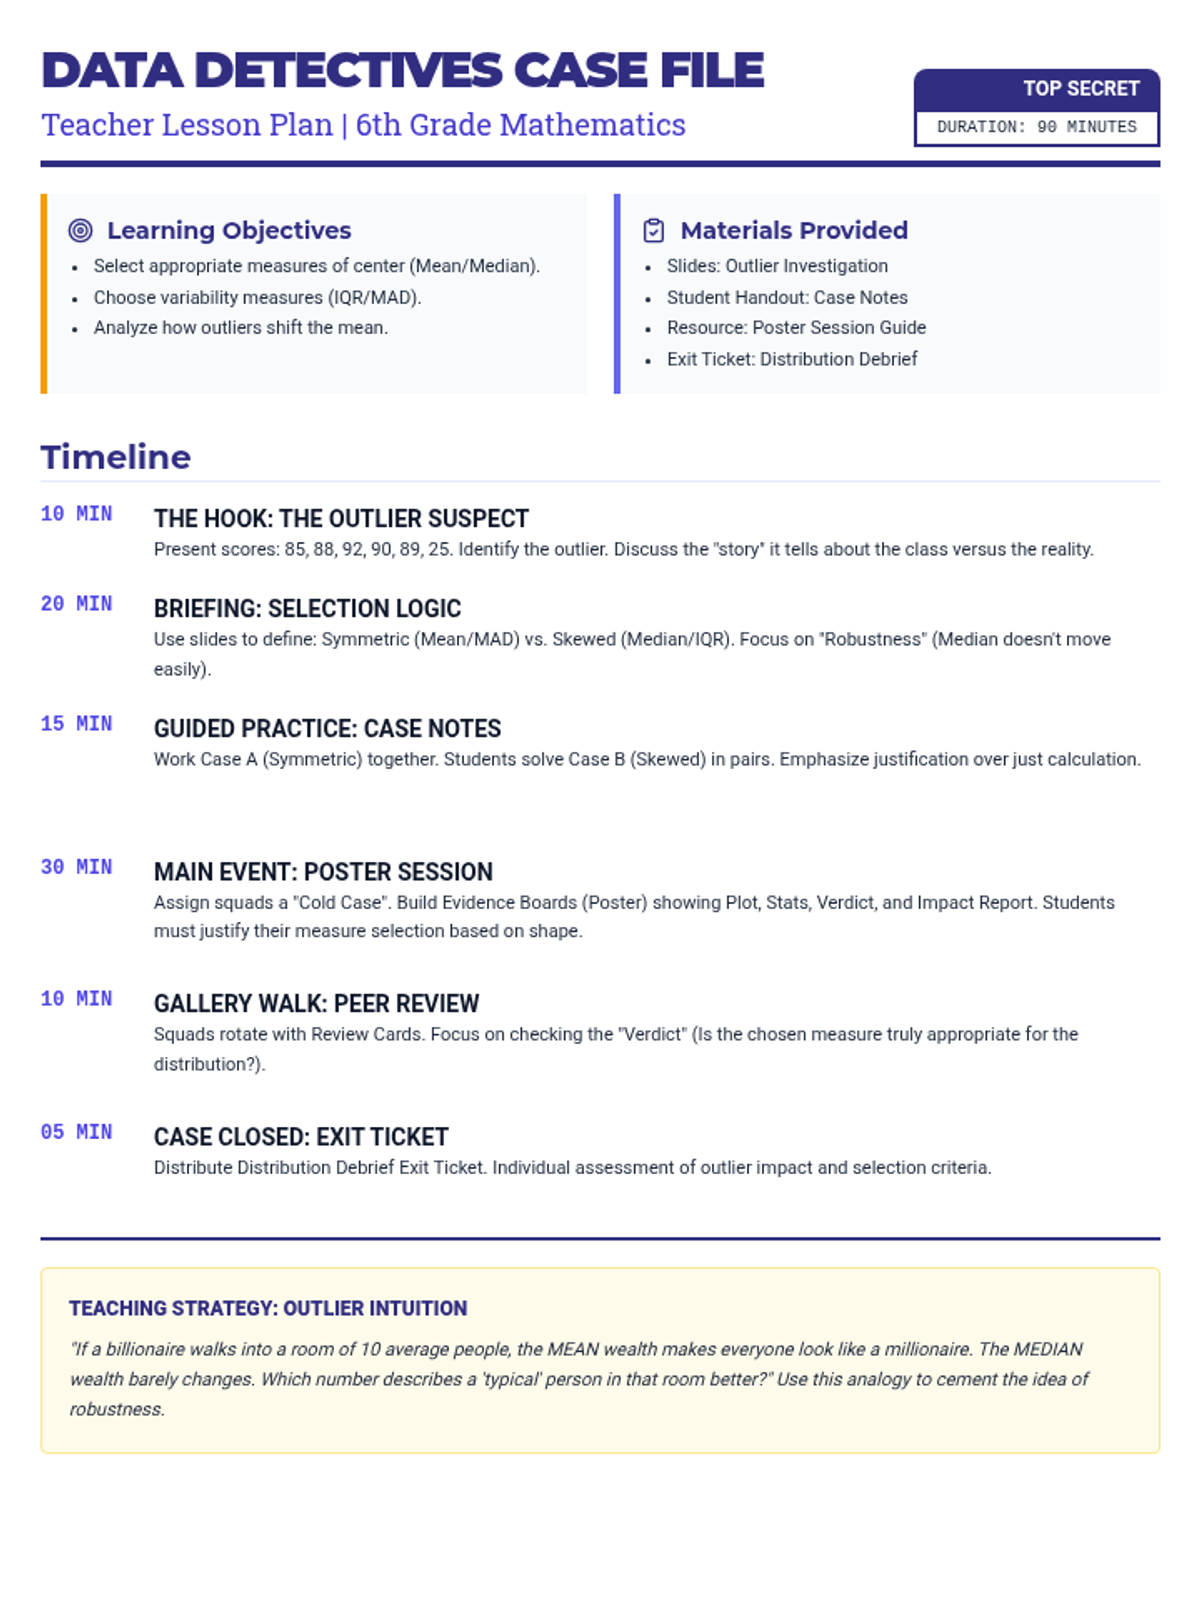
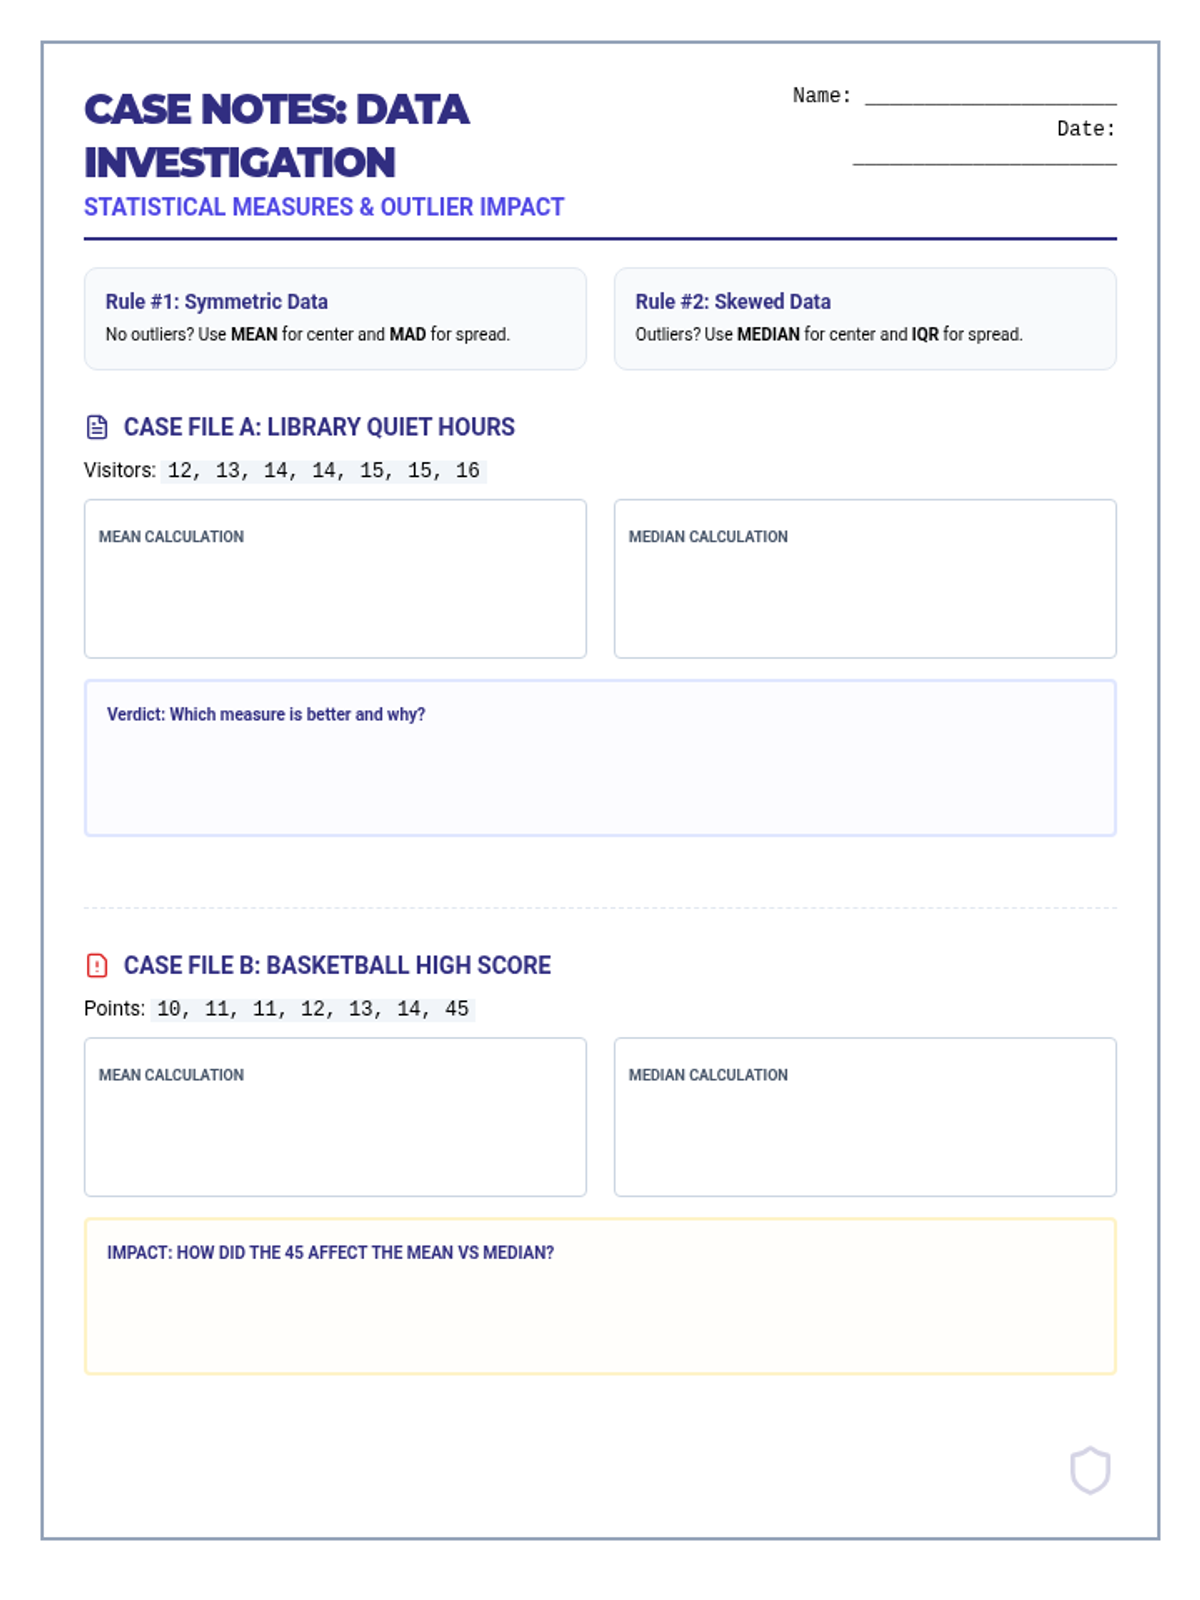
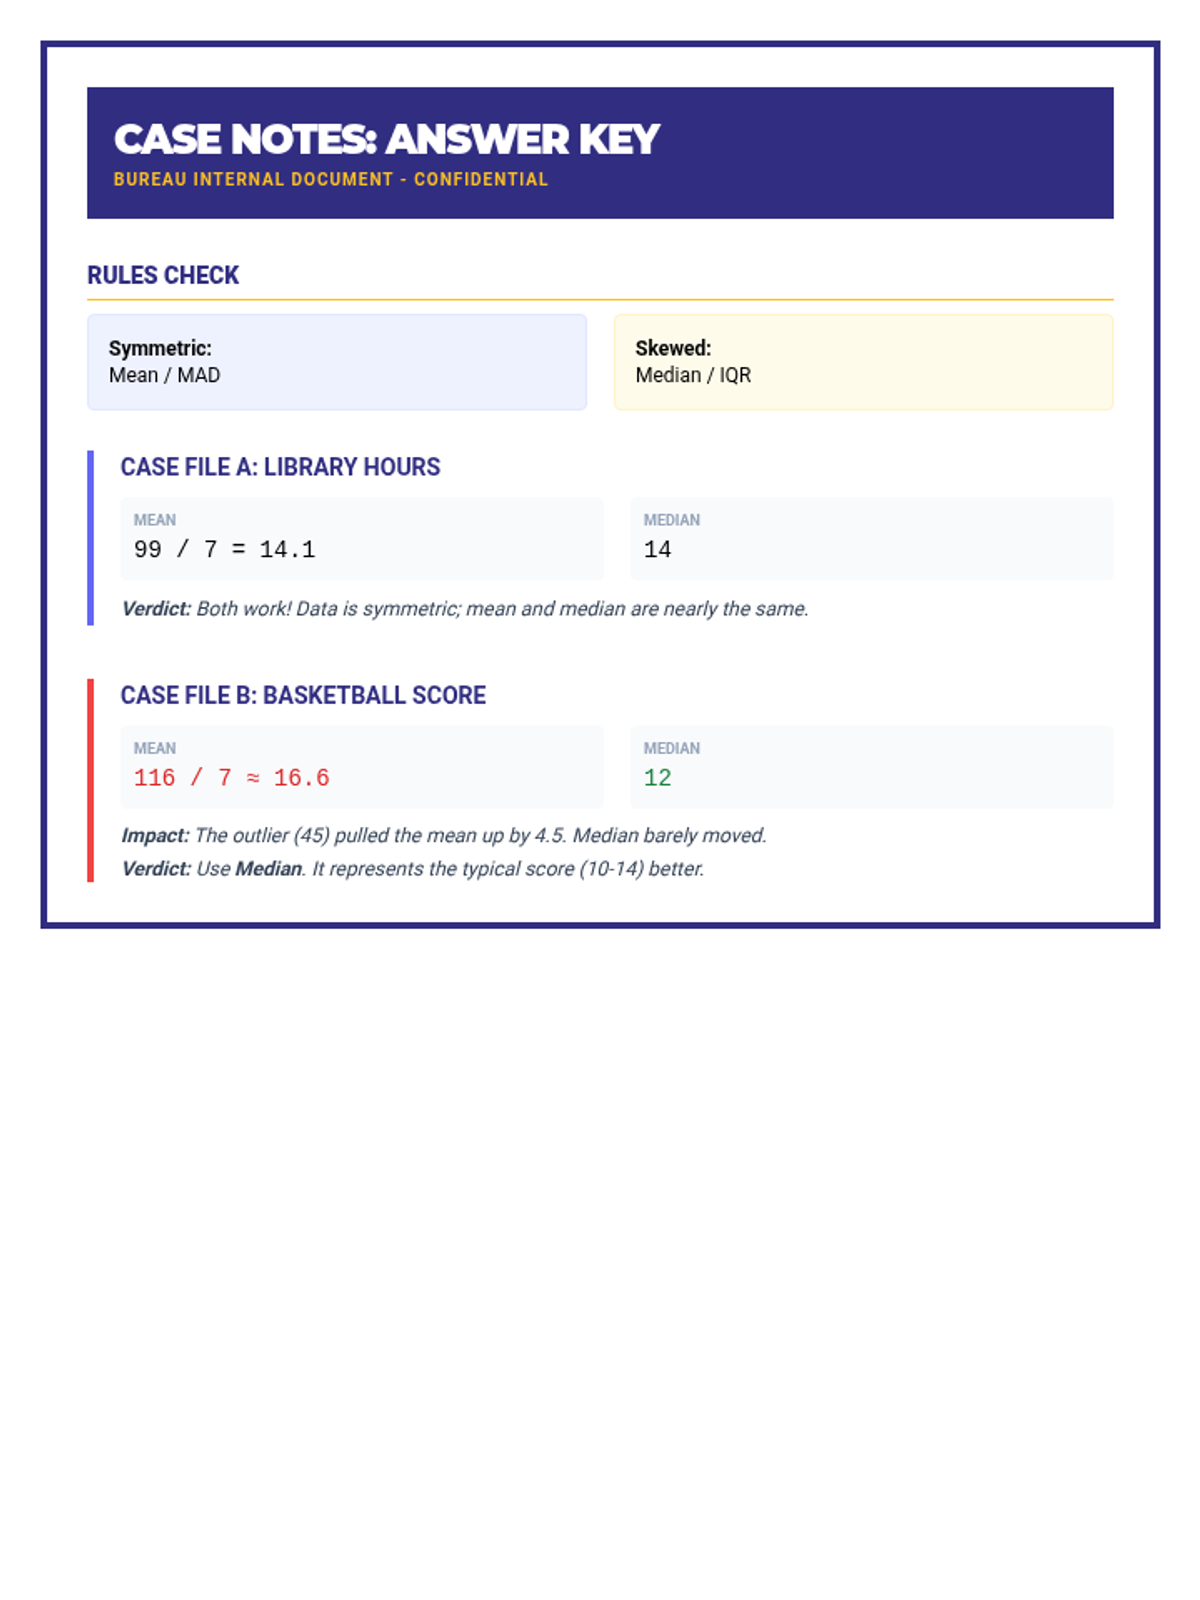
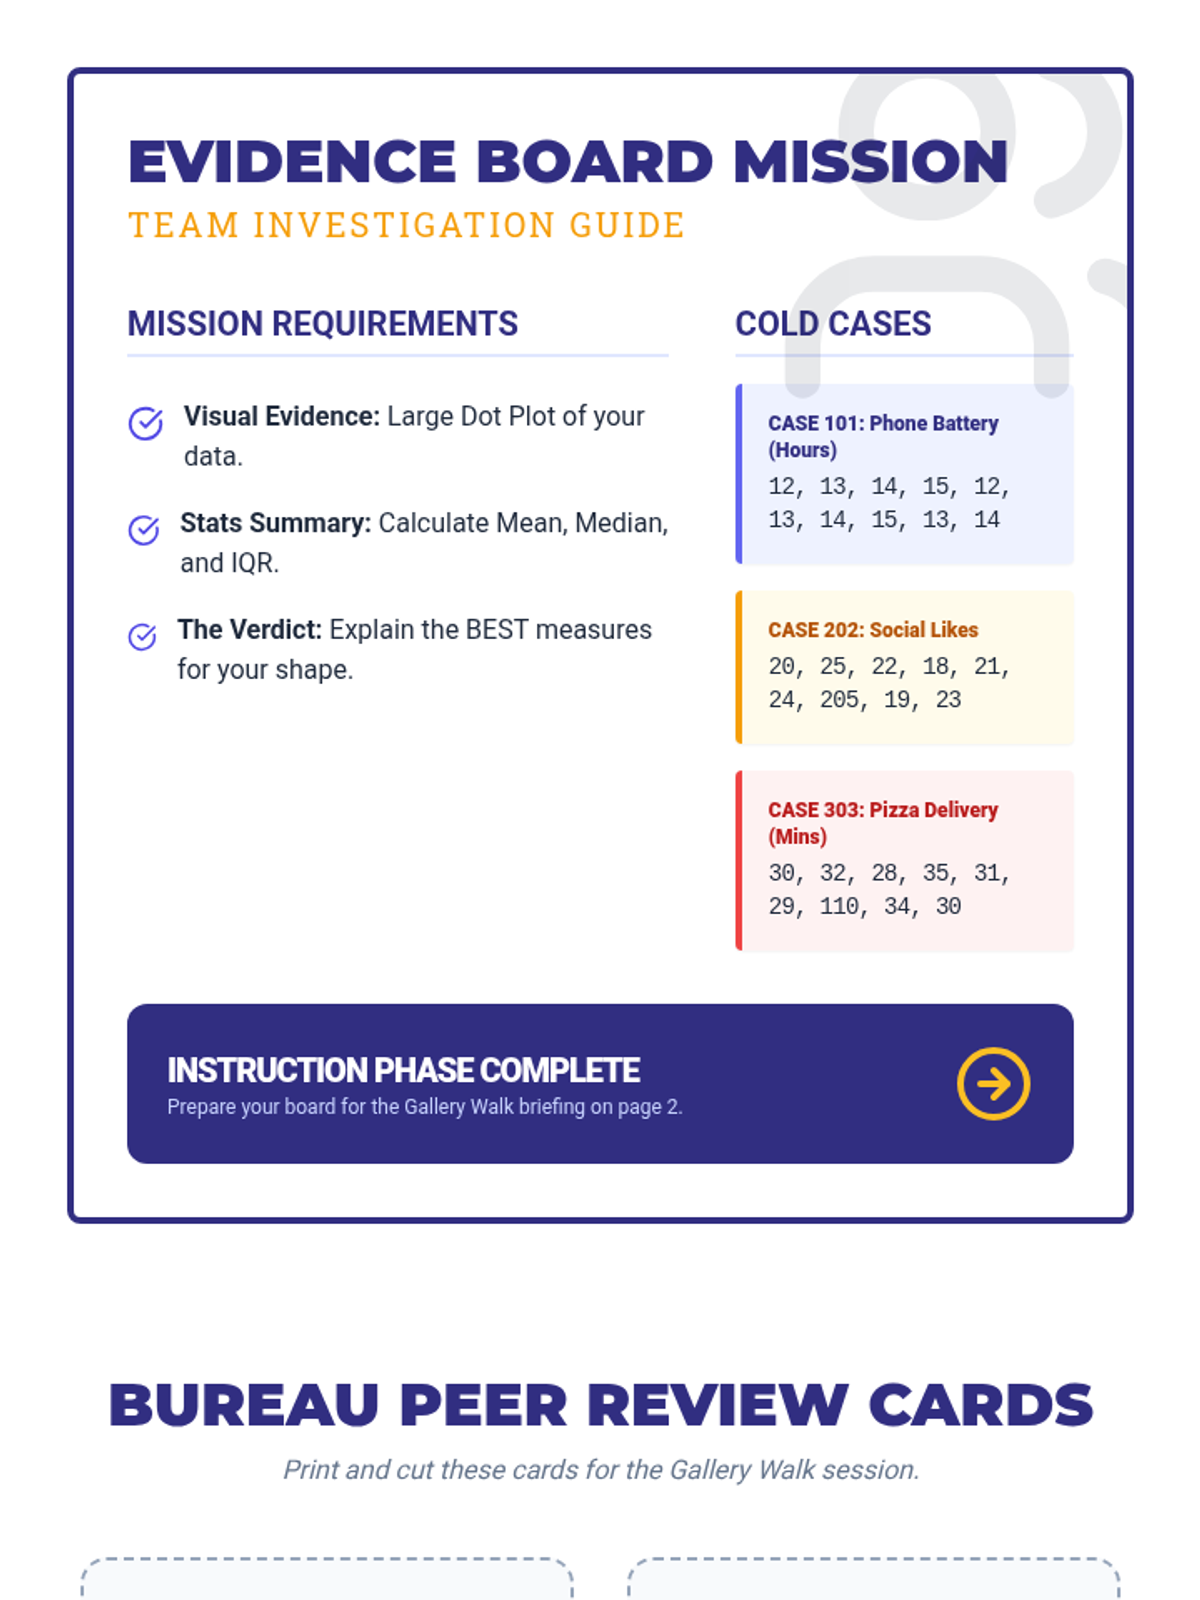
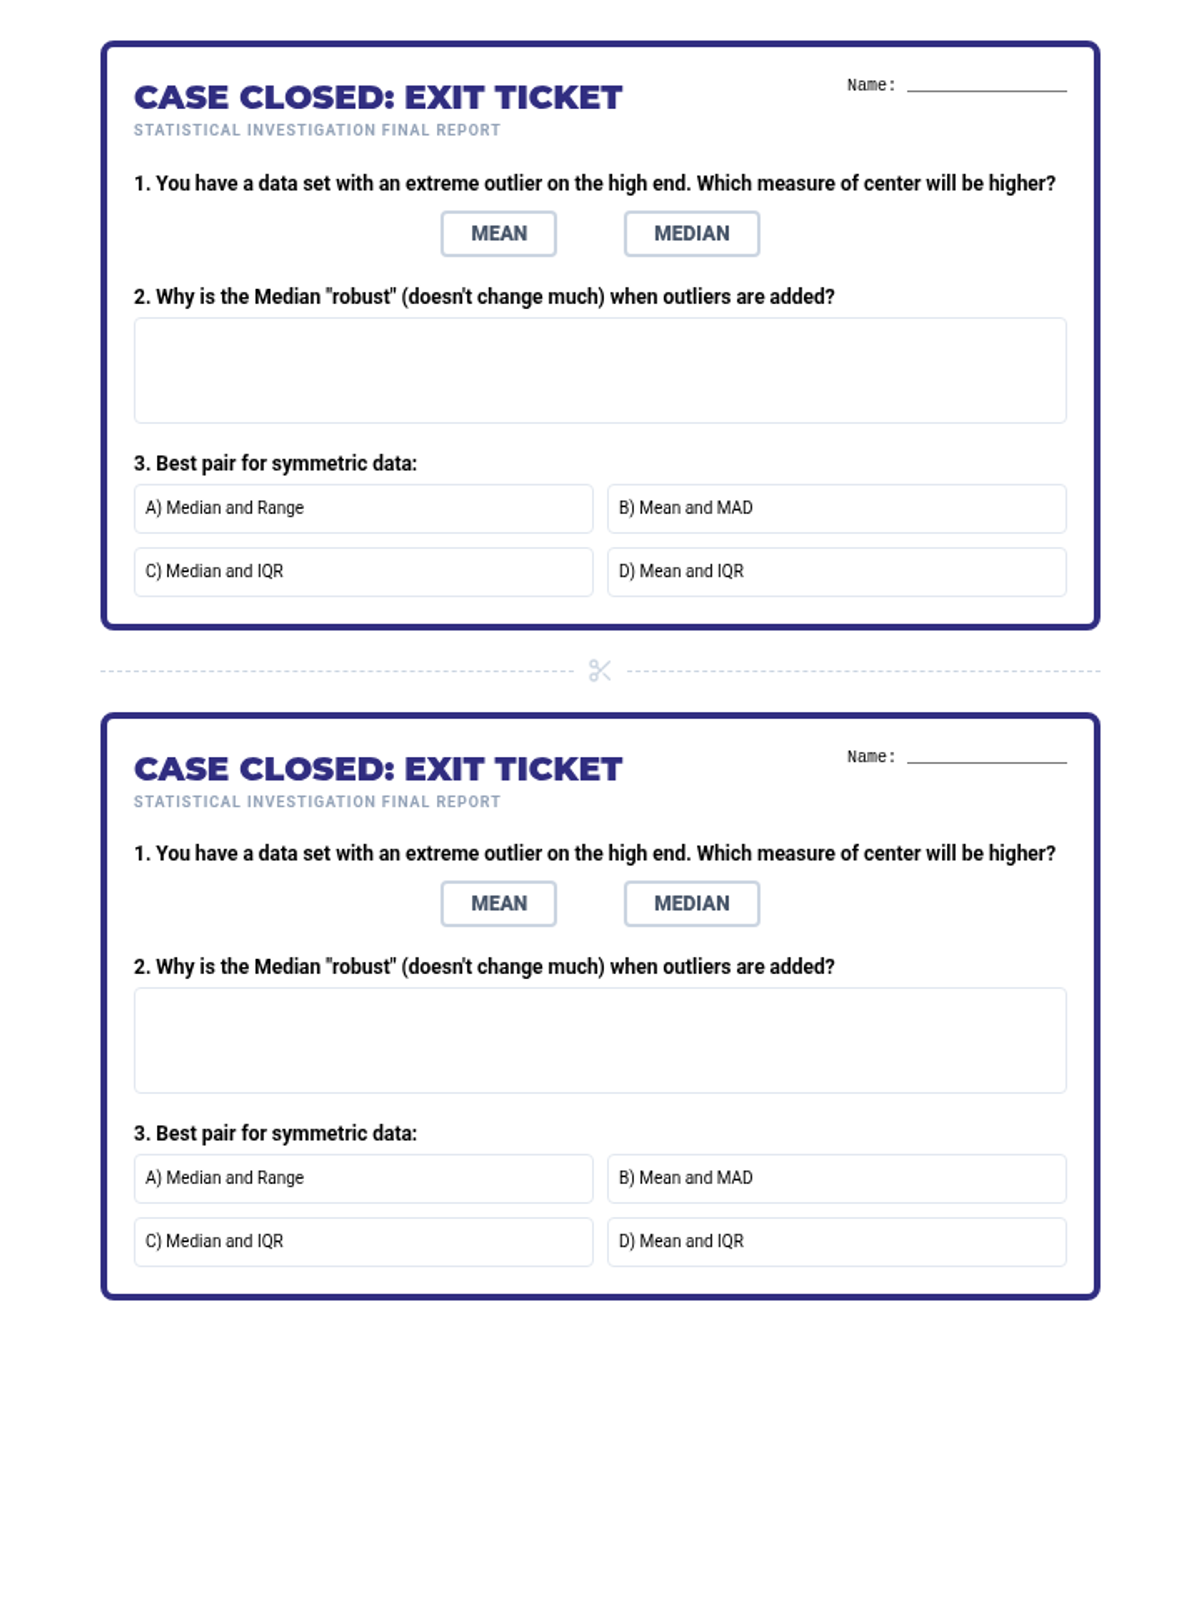
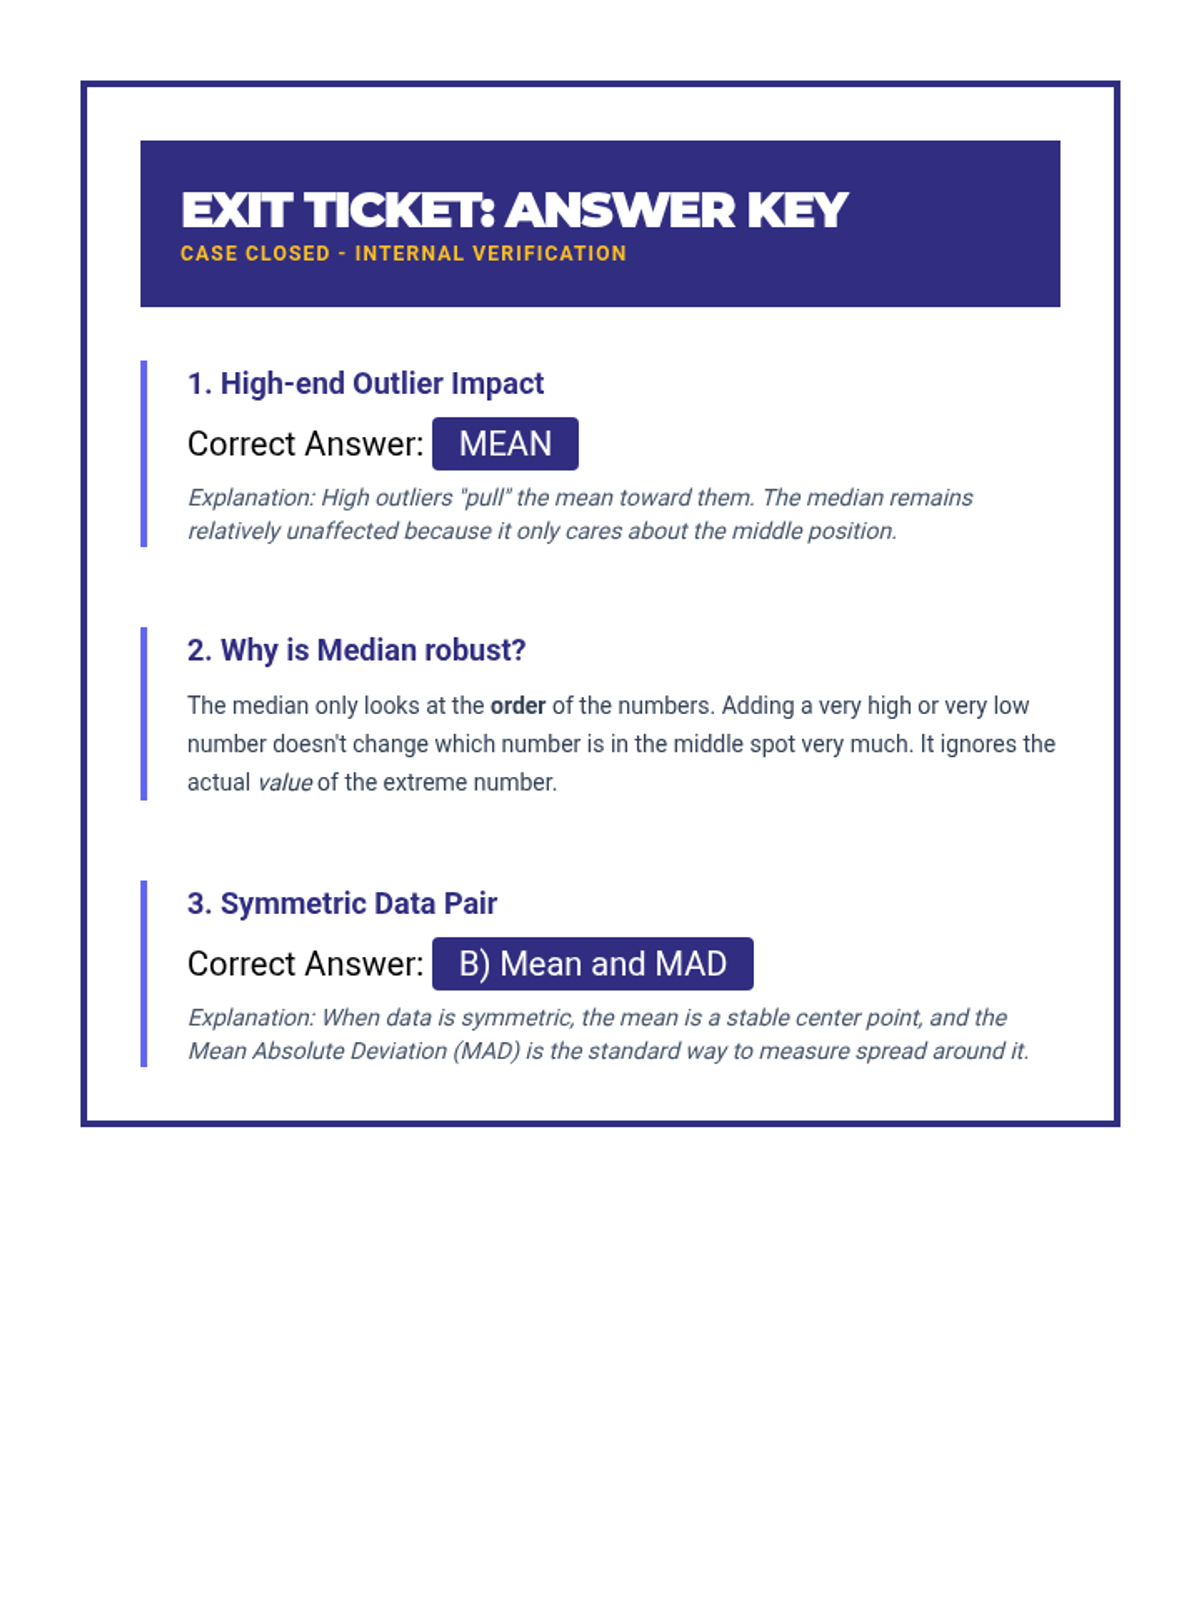
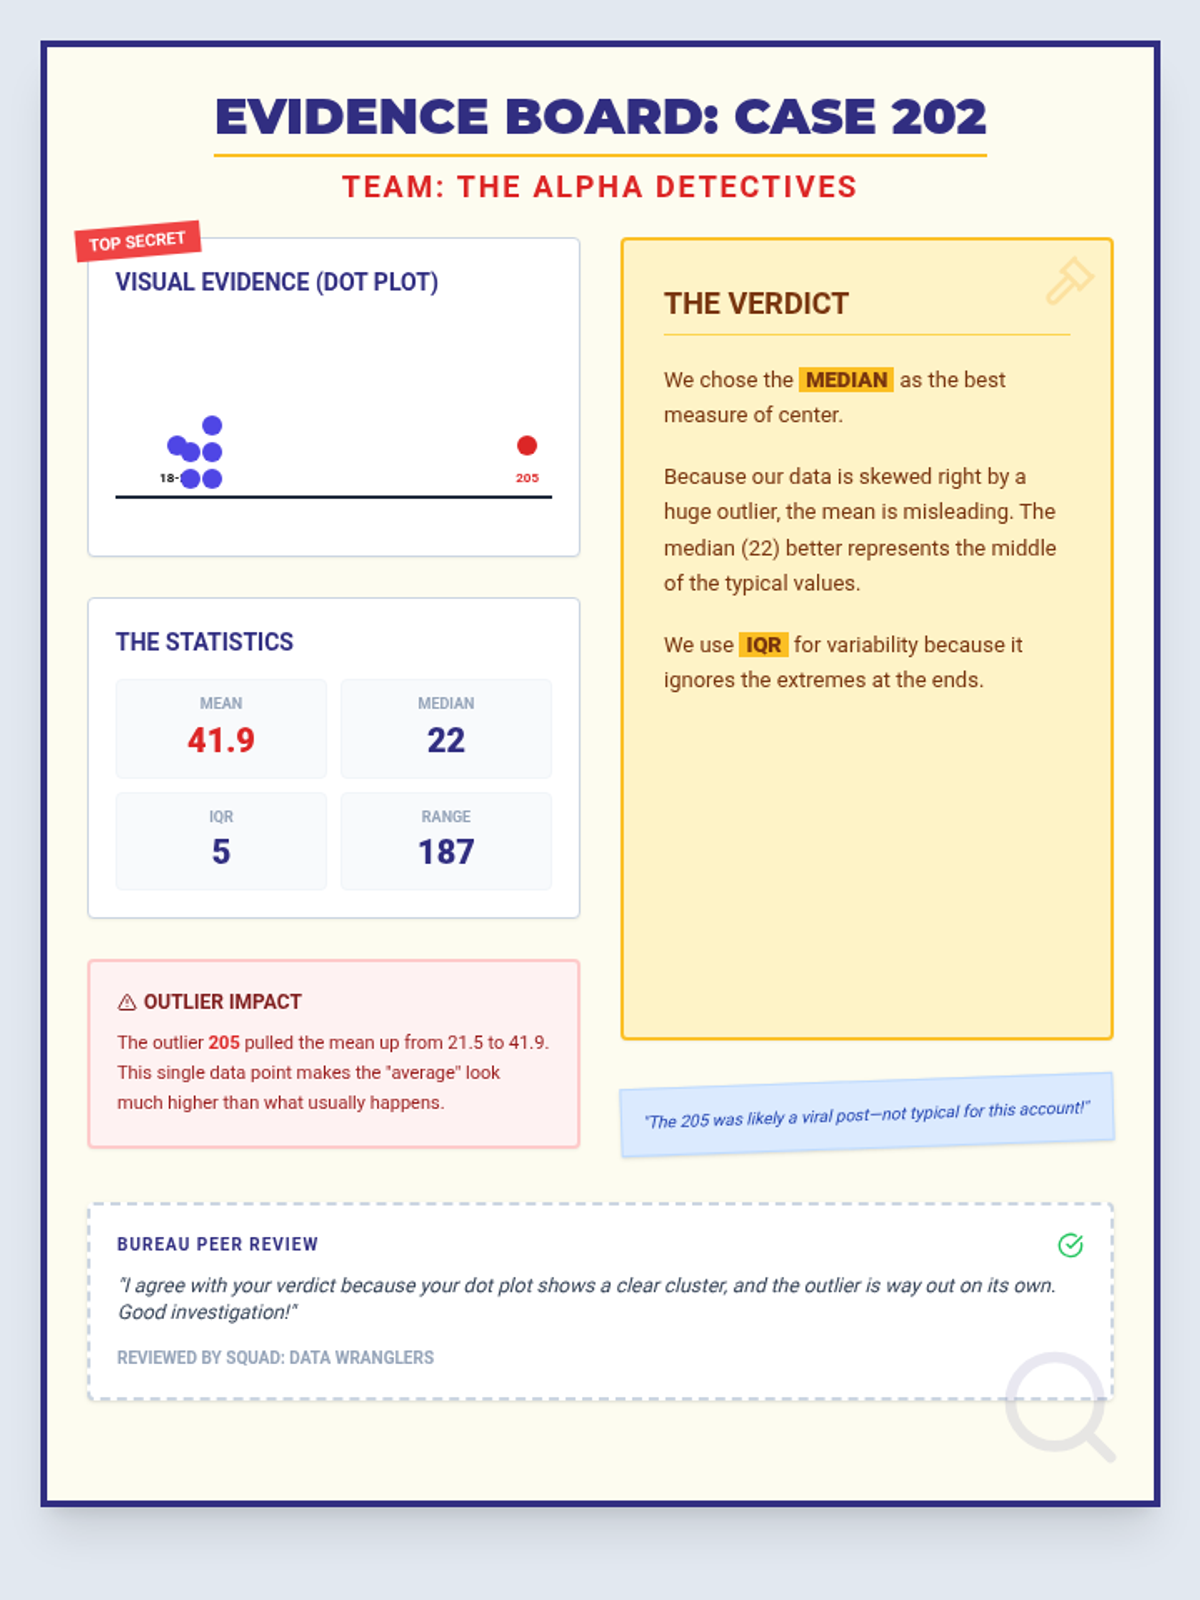
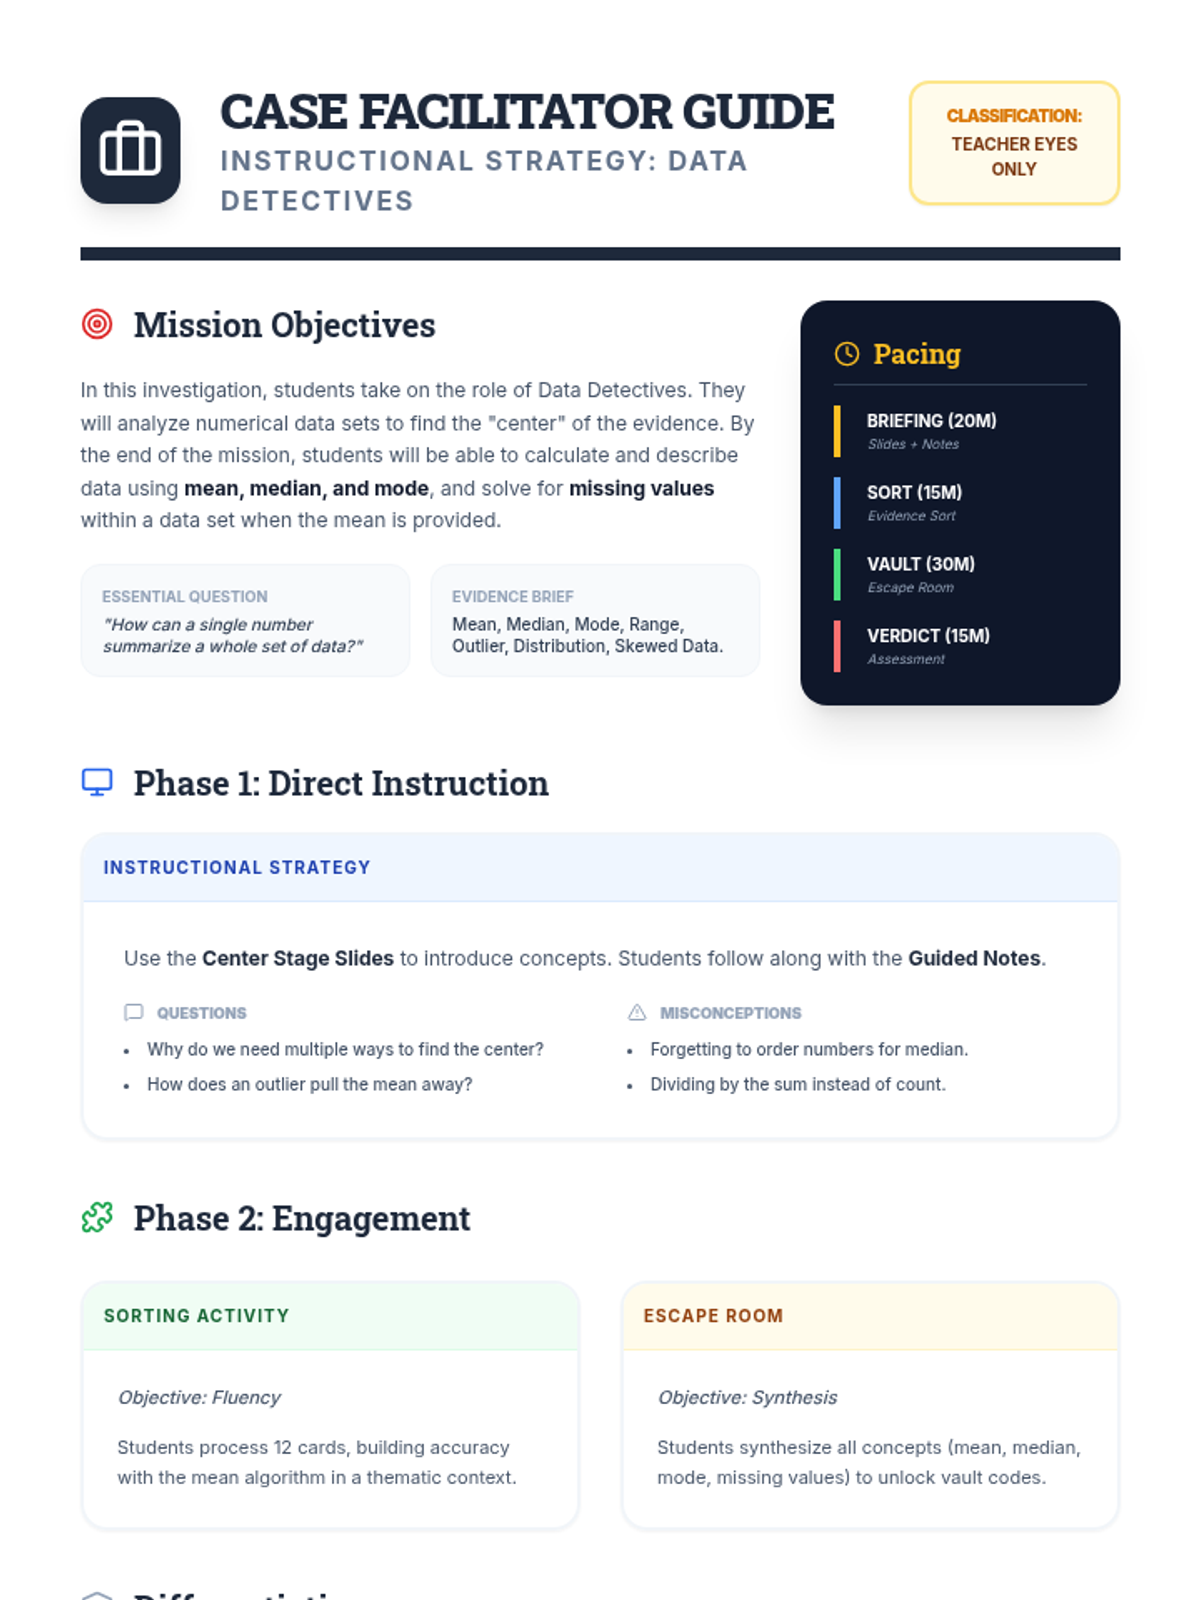
A comprehensive 90-minute lesson where students become 'Data Detectives' to investigate how outliers influence measures of center and variability, culminating in a collaborative poster session.
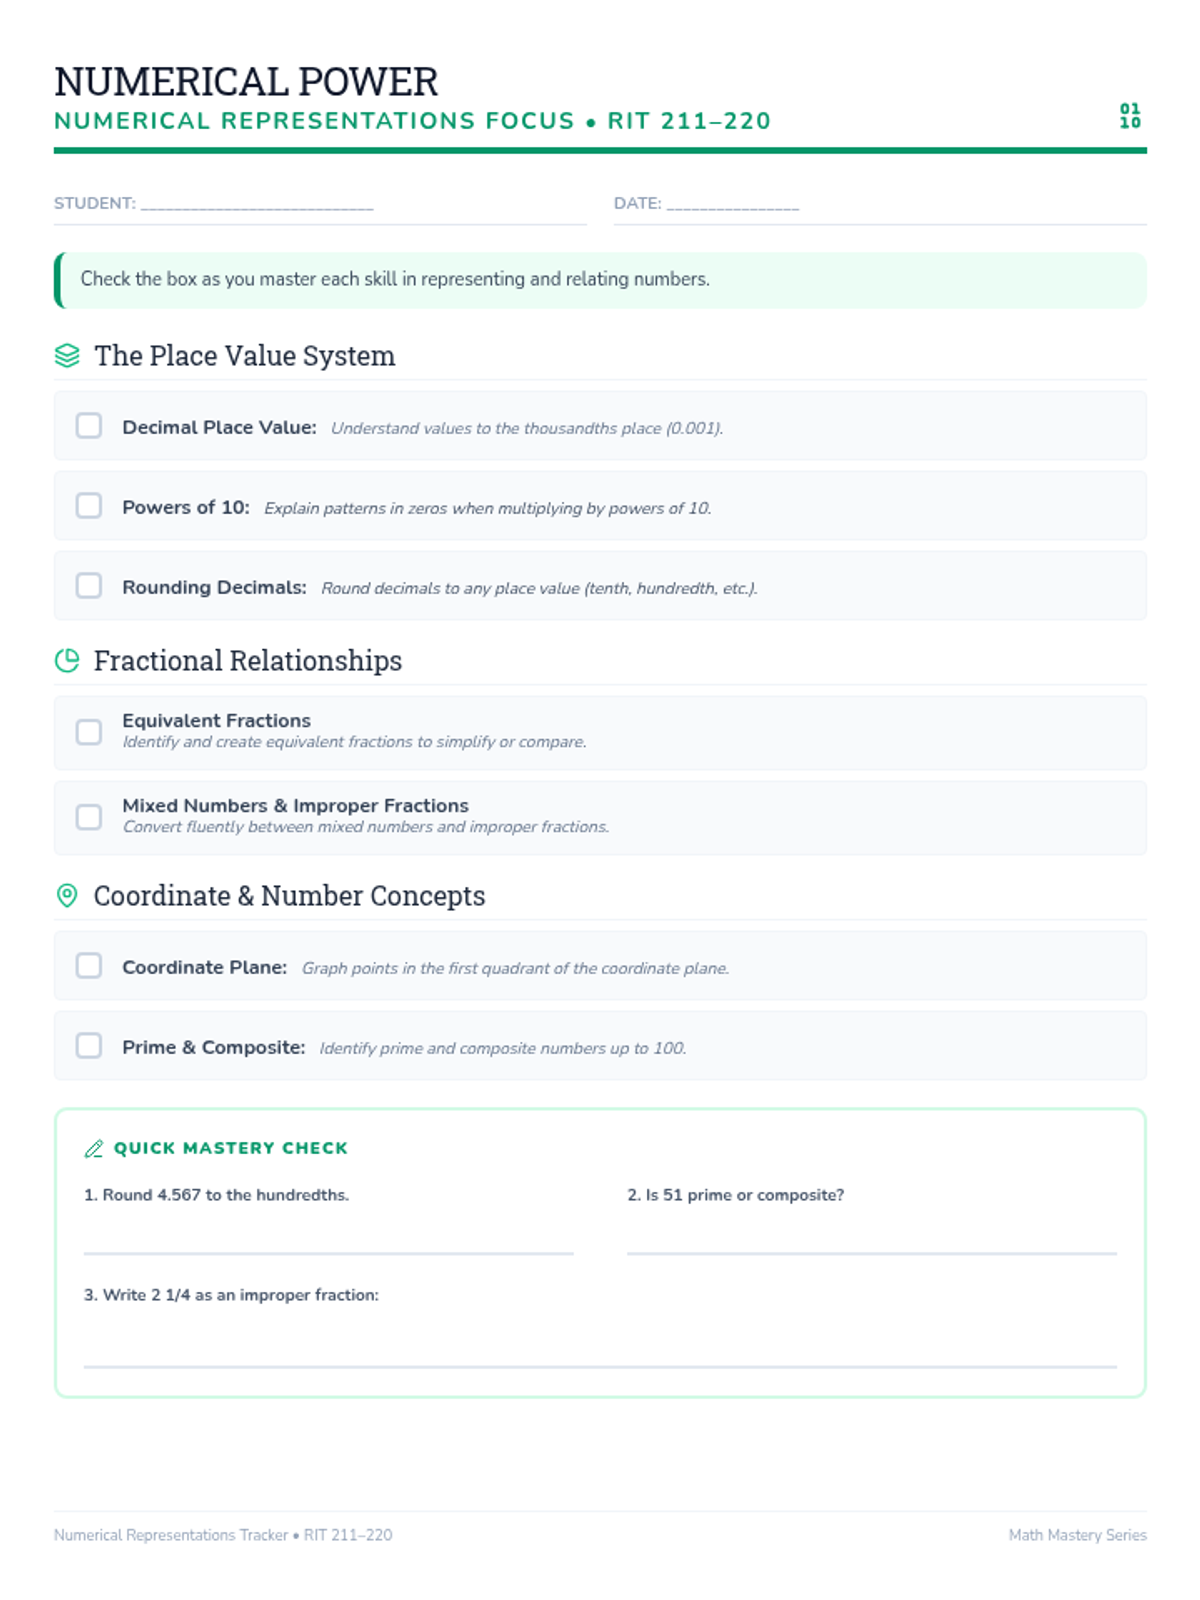
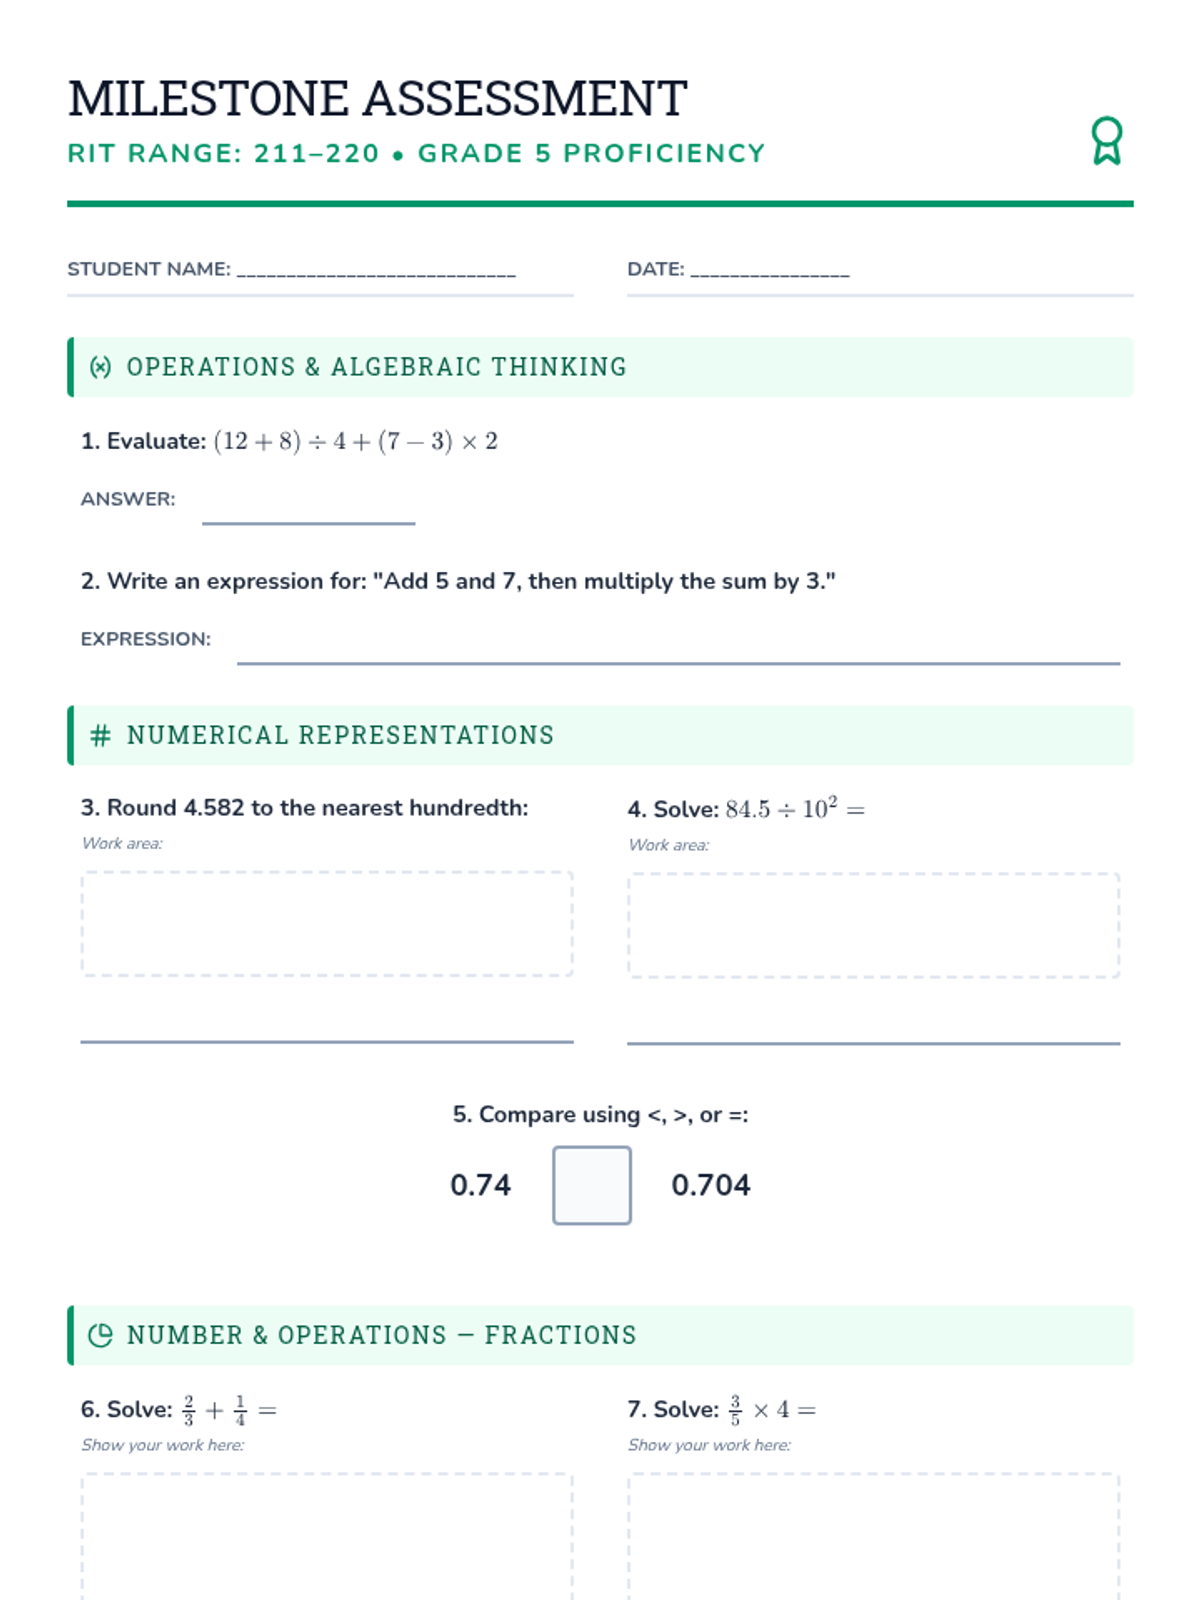
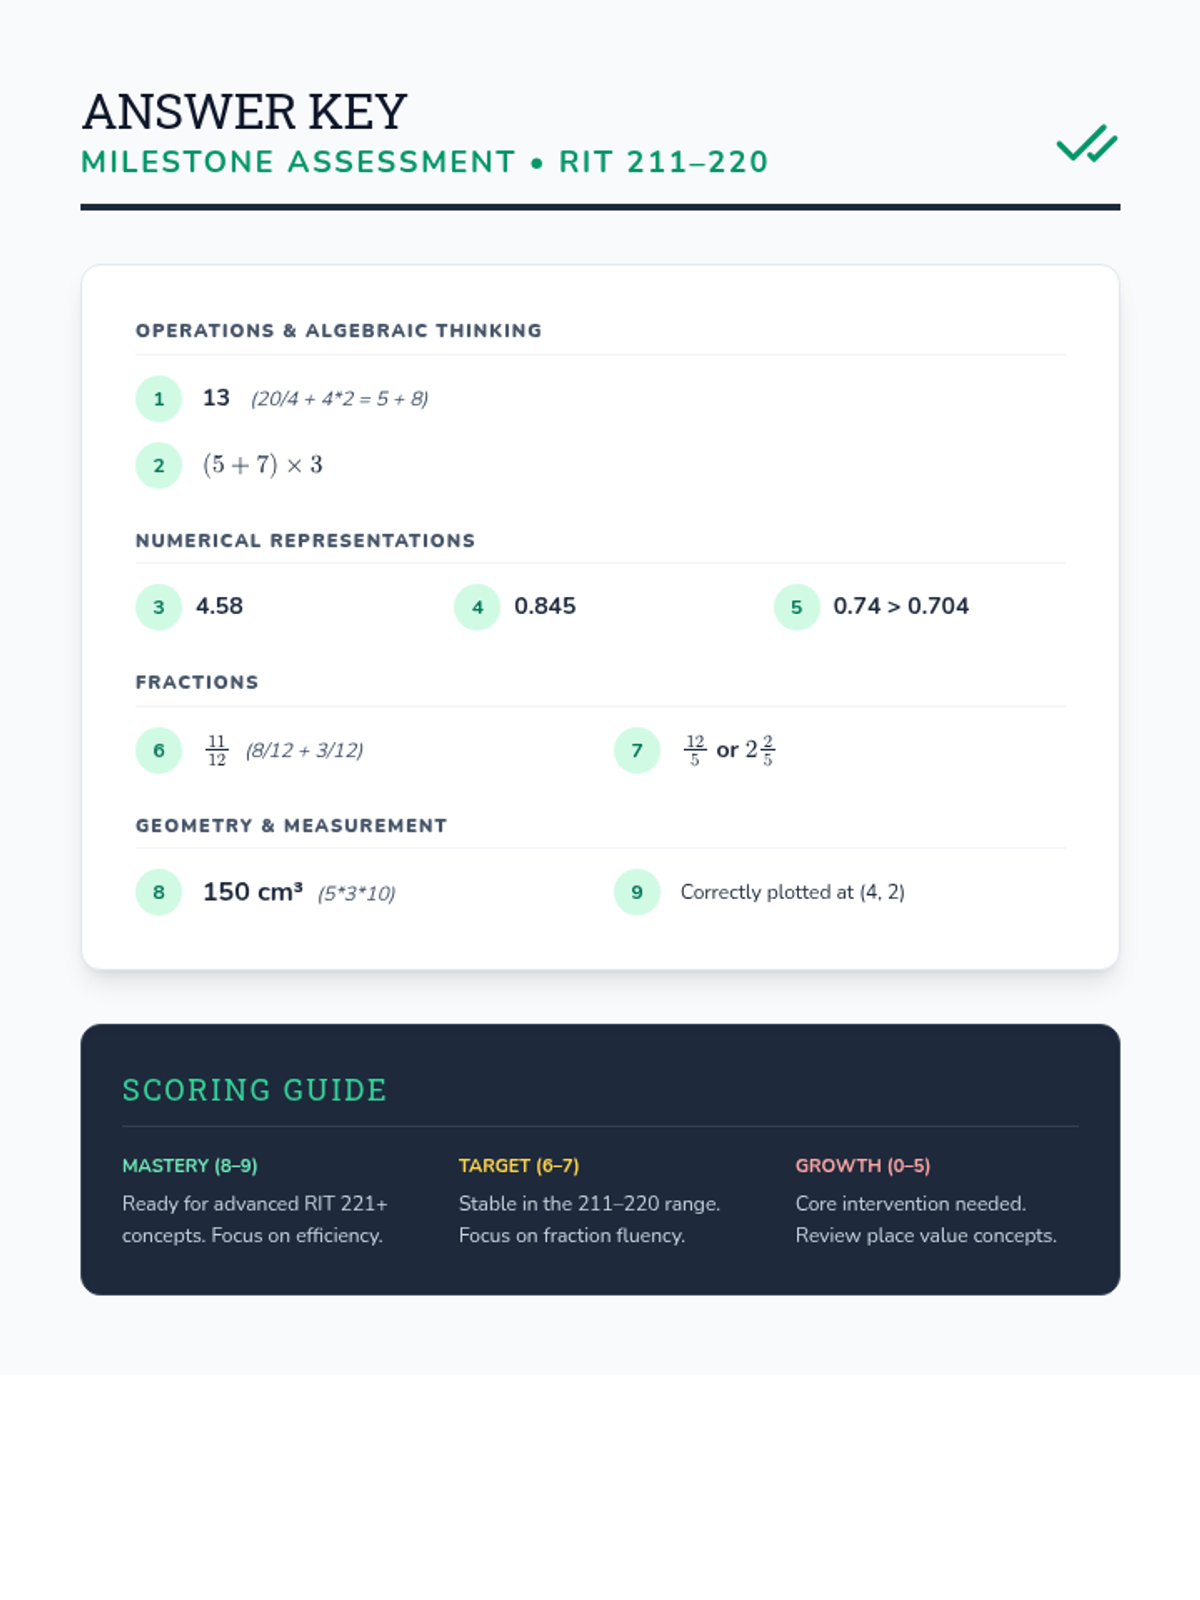
A specialized toolkit for navigating mathematical skills in the 211-220 RIT range, with a focus on foundational decimals, fractions, and place value relationships.
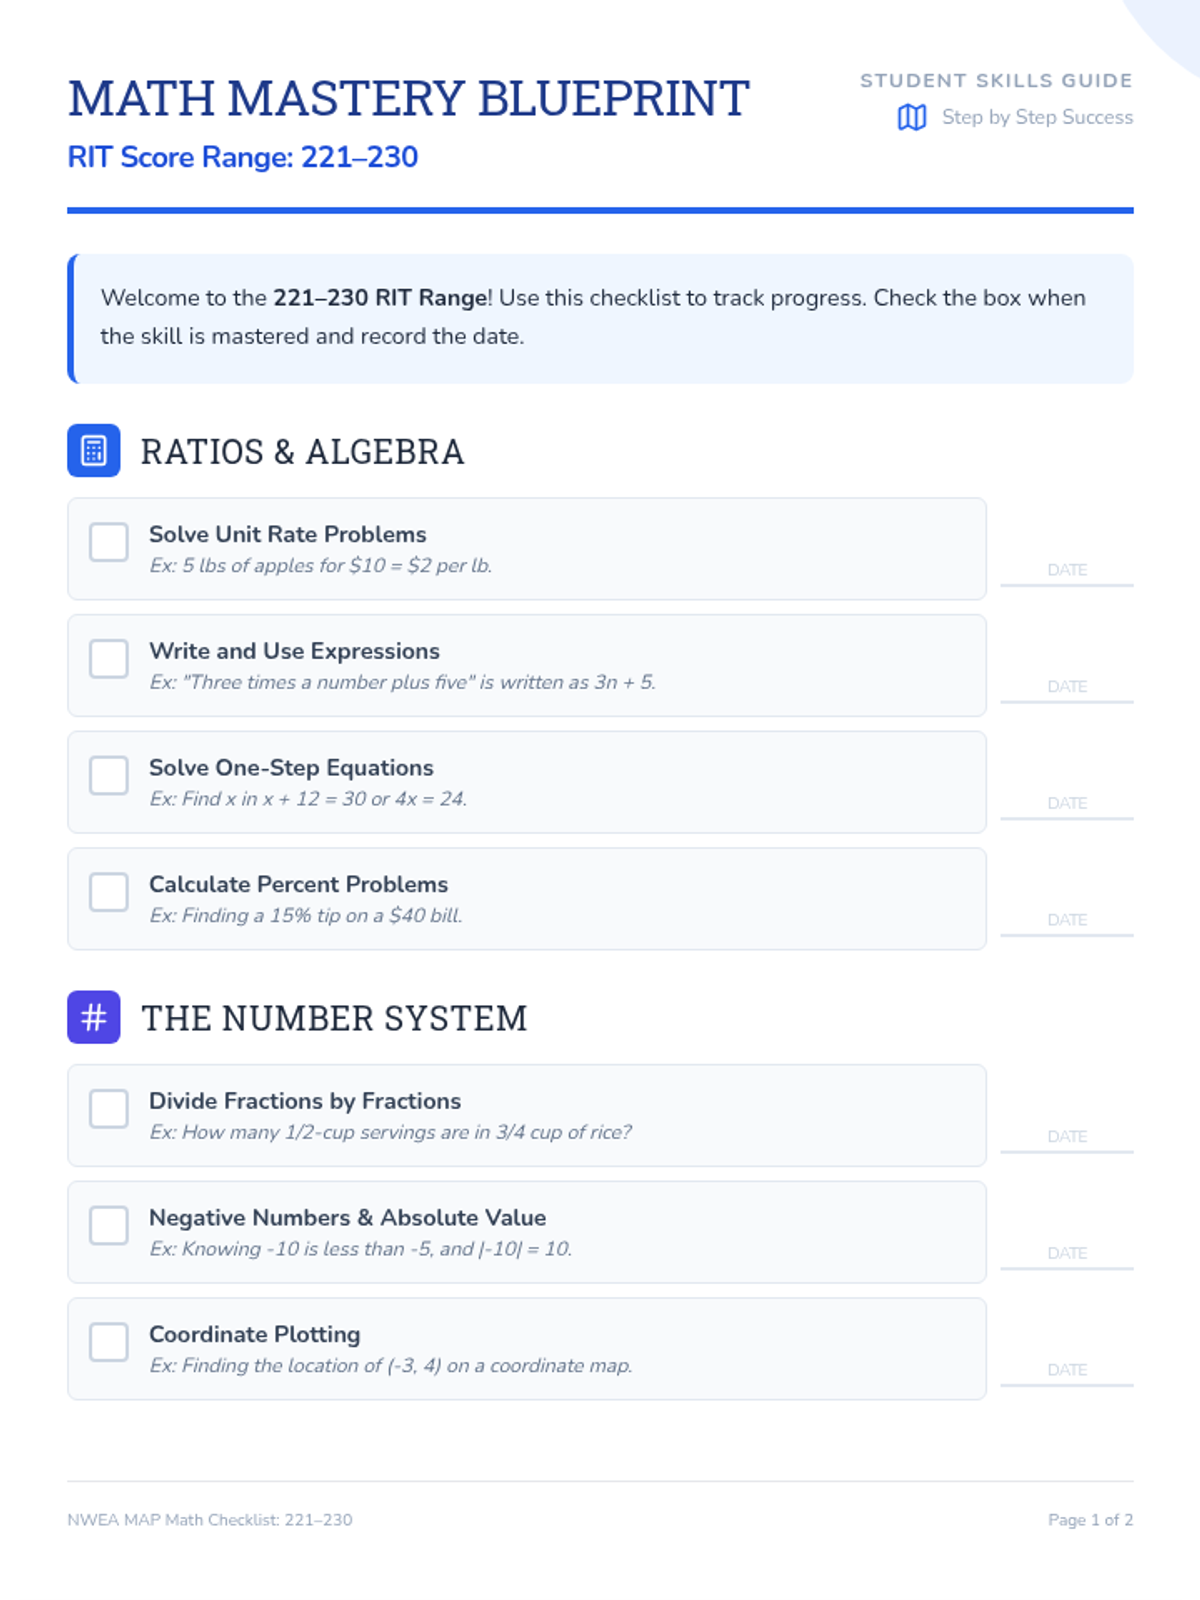
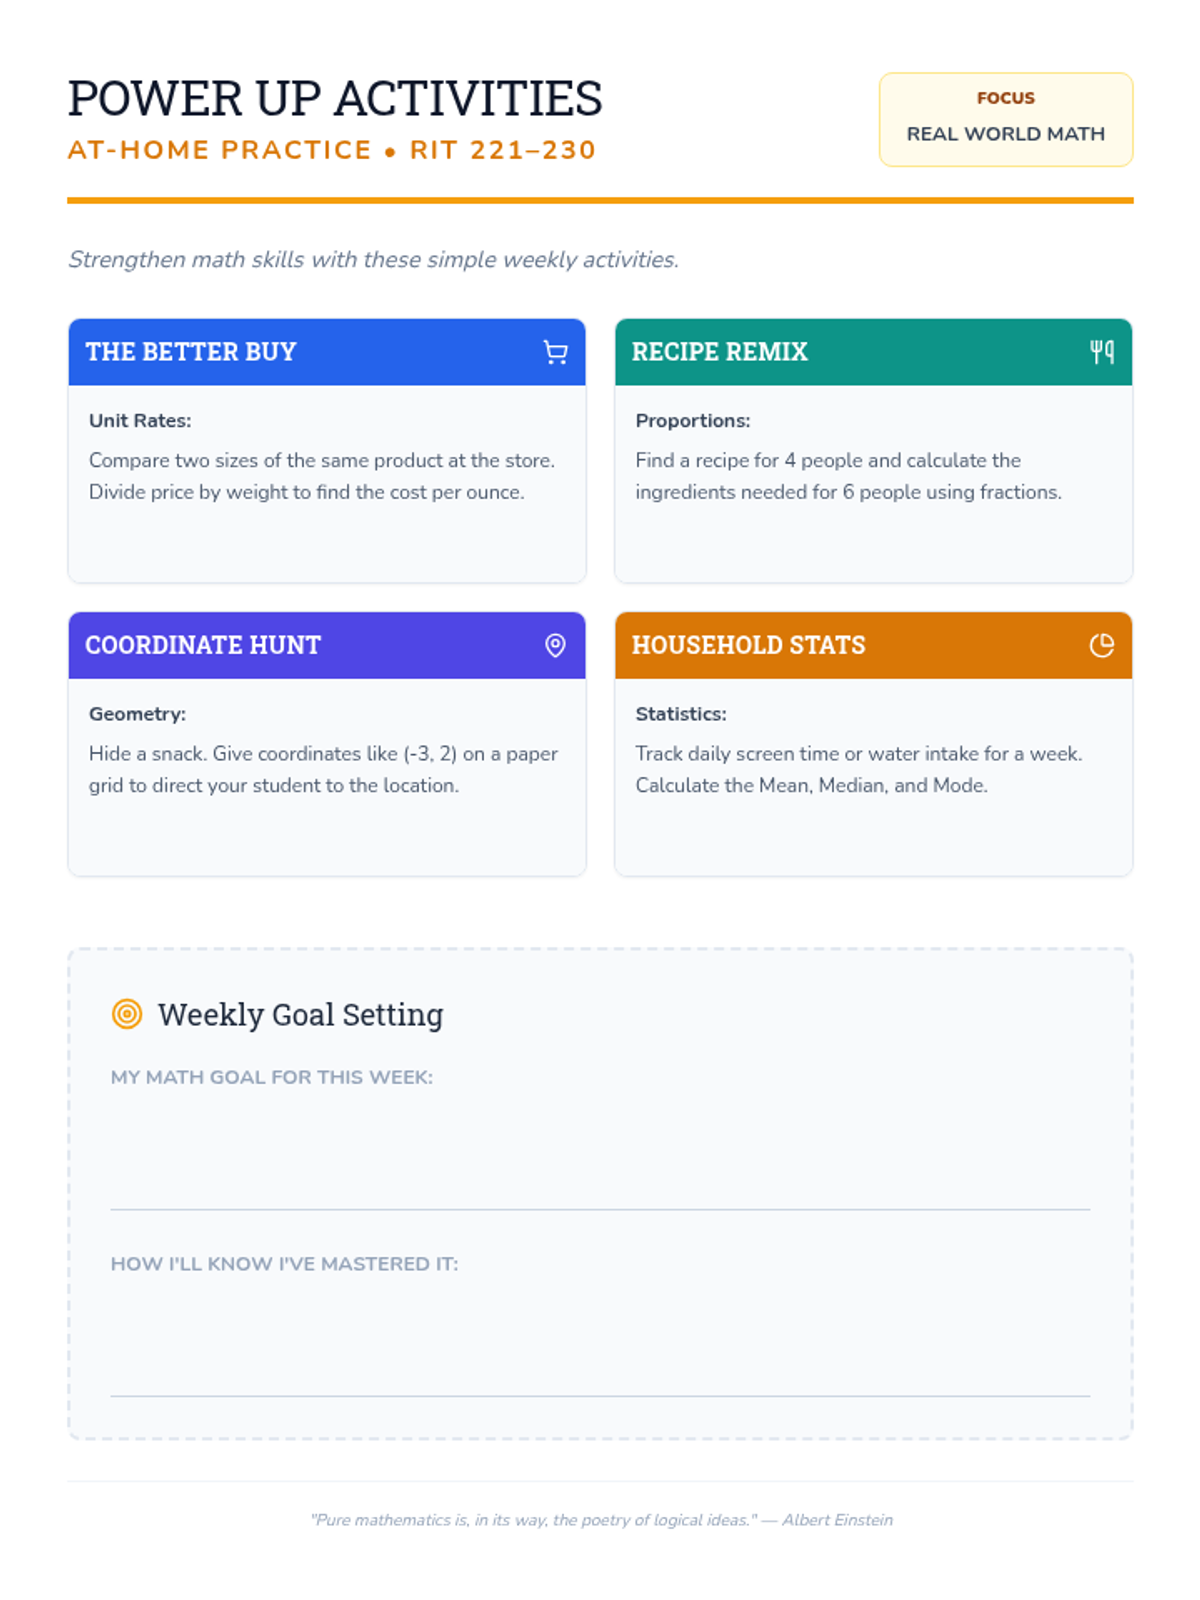
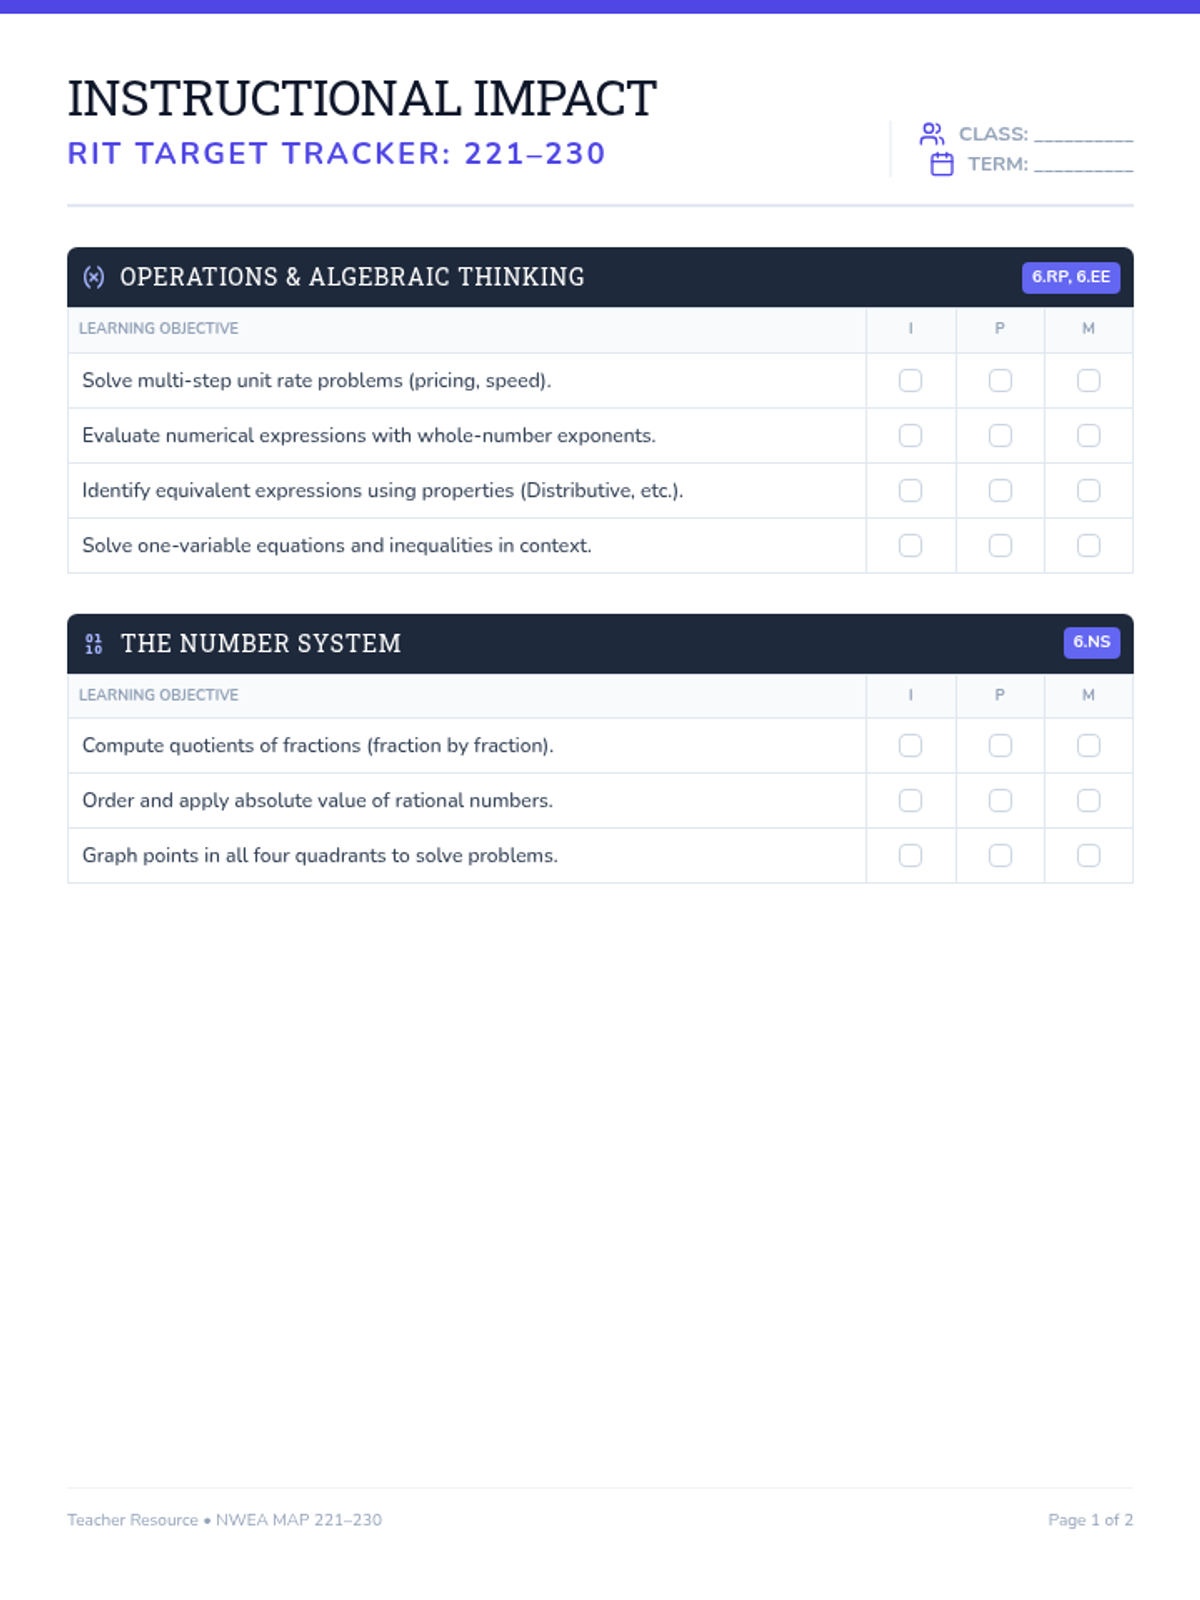
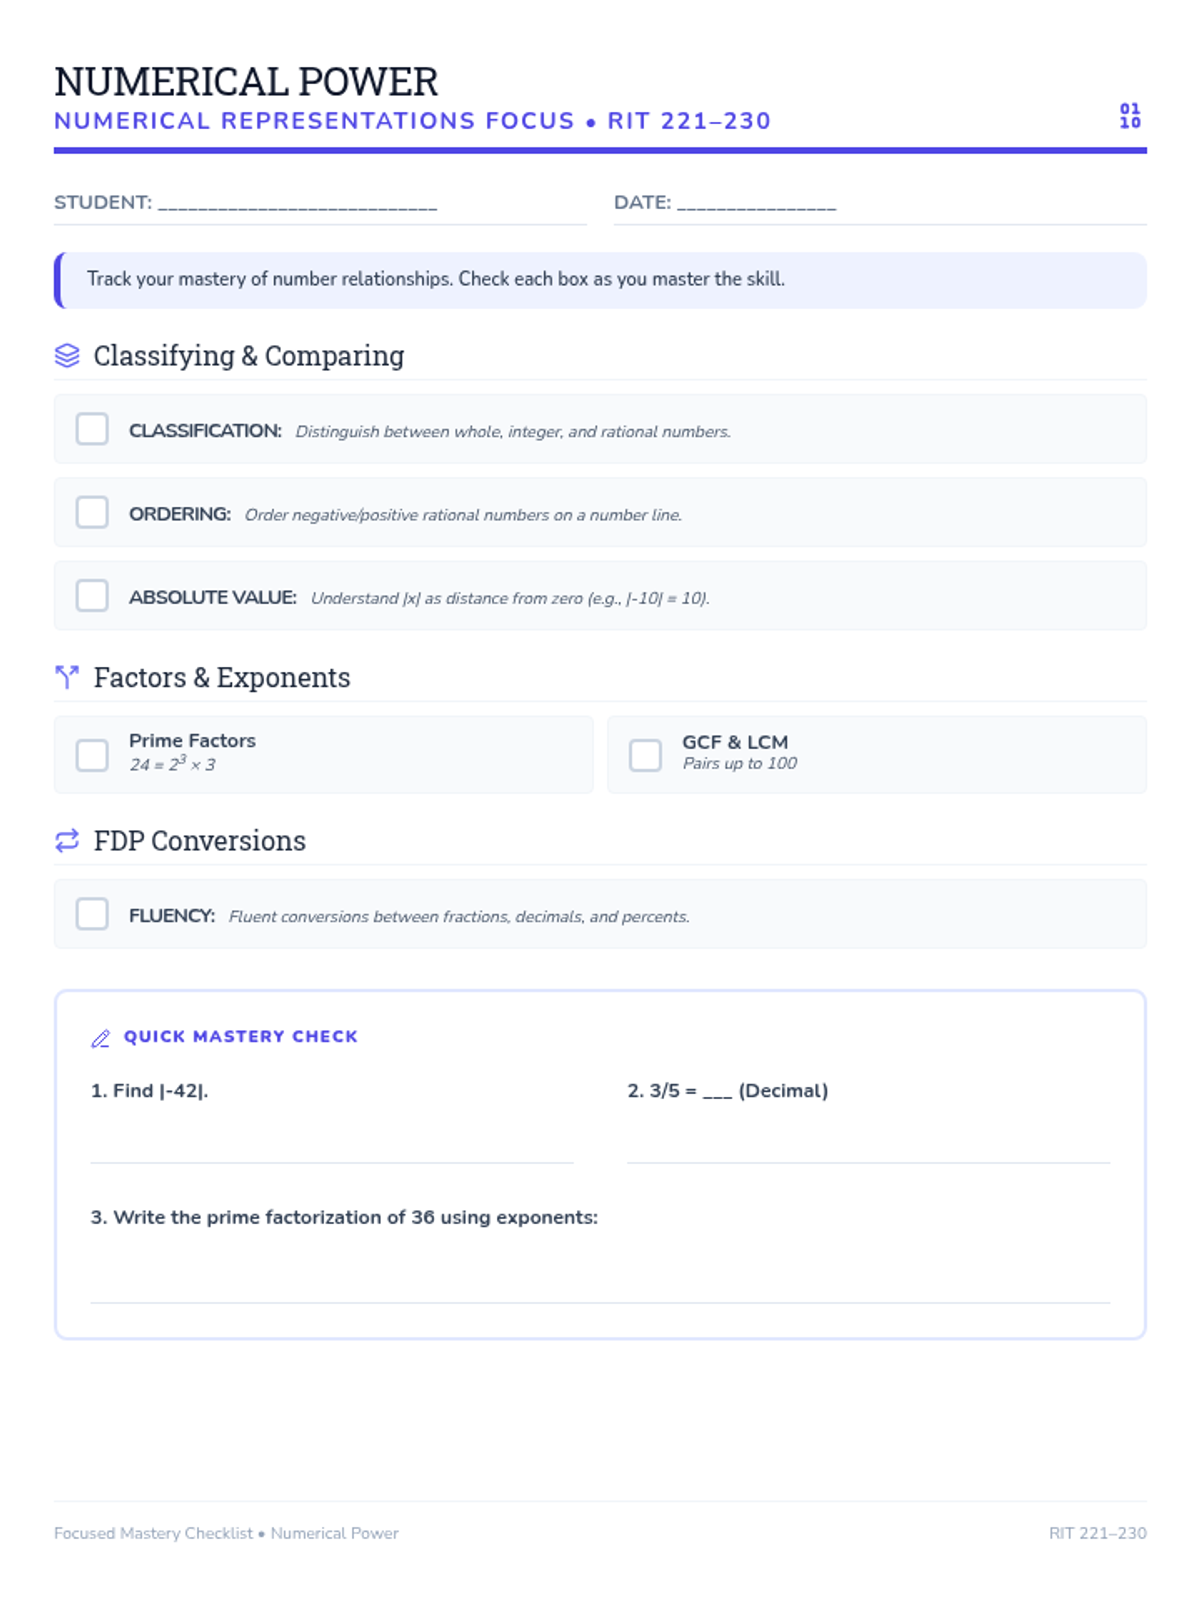
A comprehensive guide for parents and students to navigate the mathematical skills expected in the 221-230 NWEA MAP RIT range, featuring actionable checklists and home-based practice ideas.
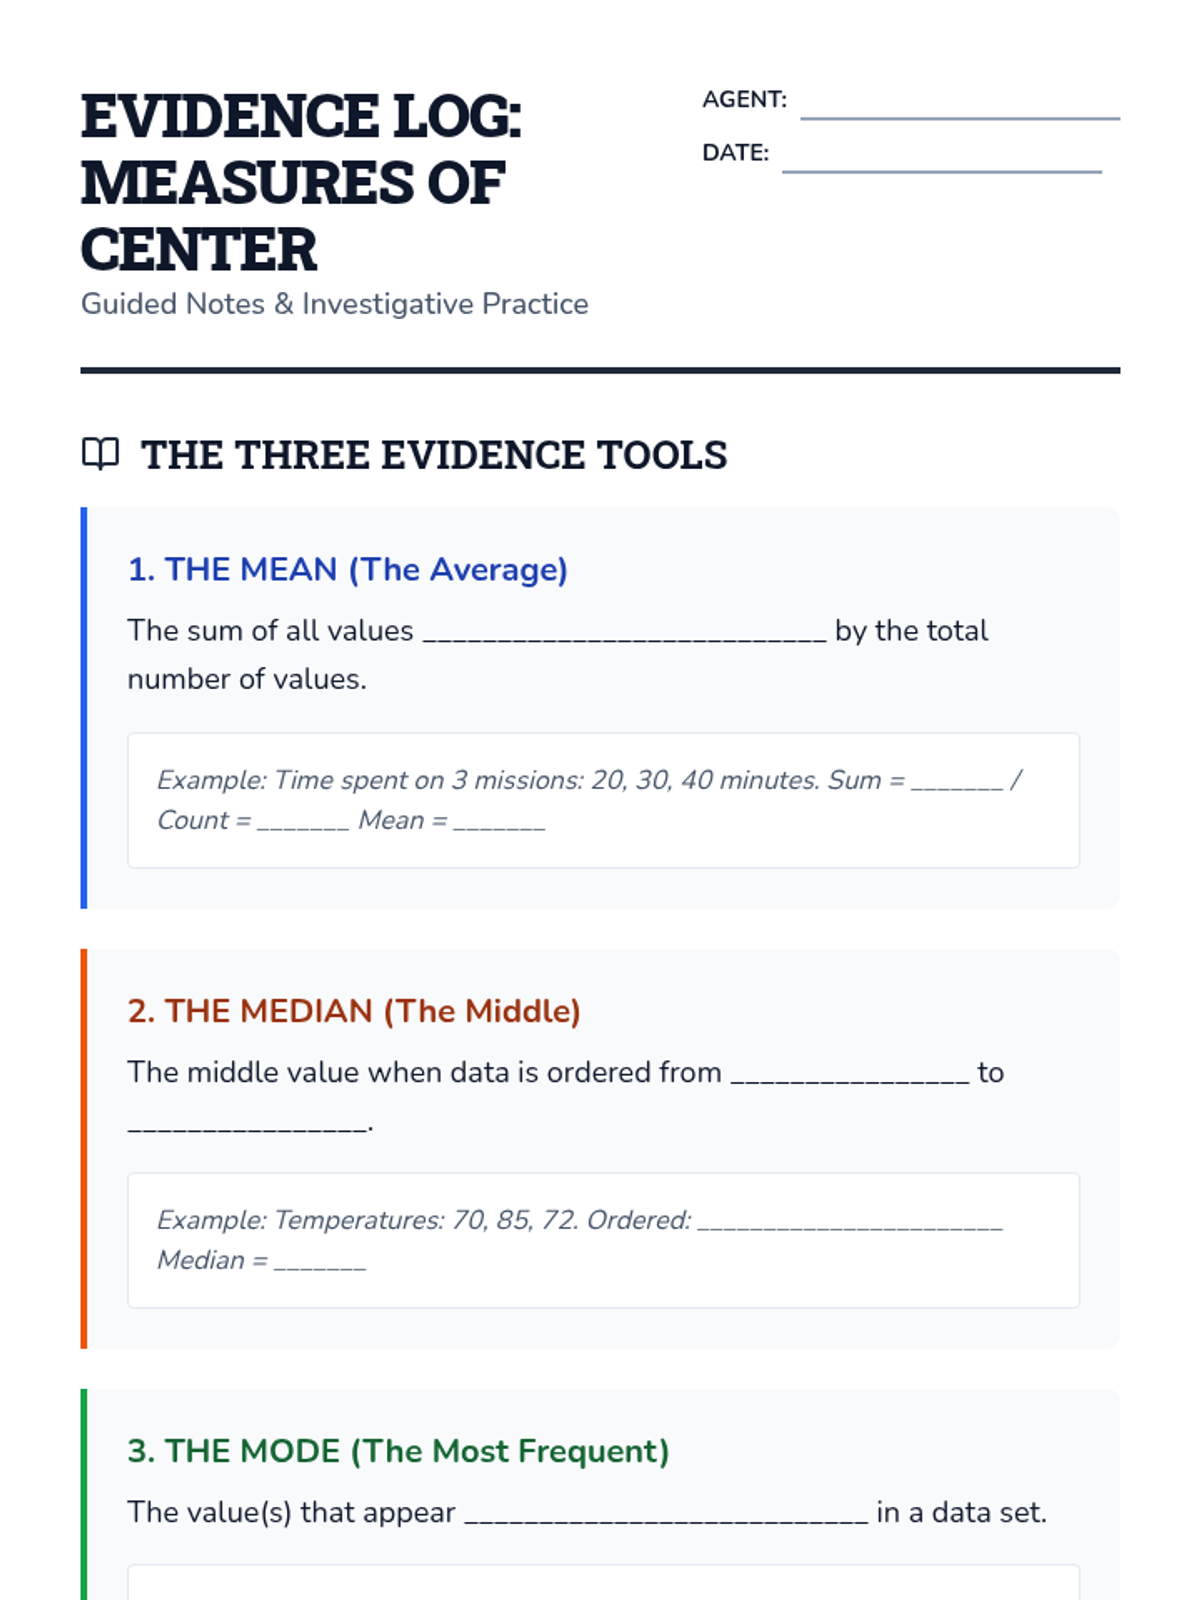
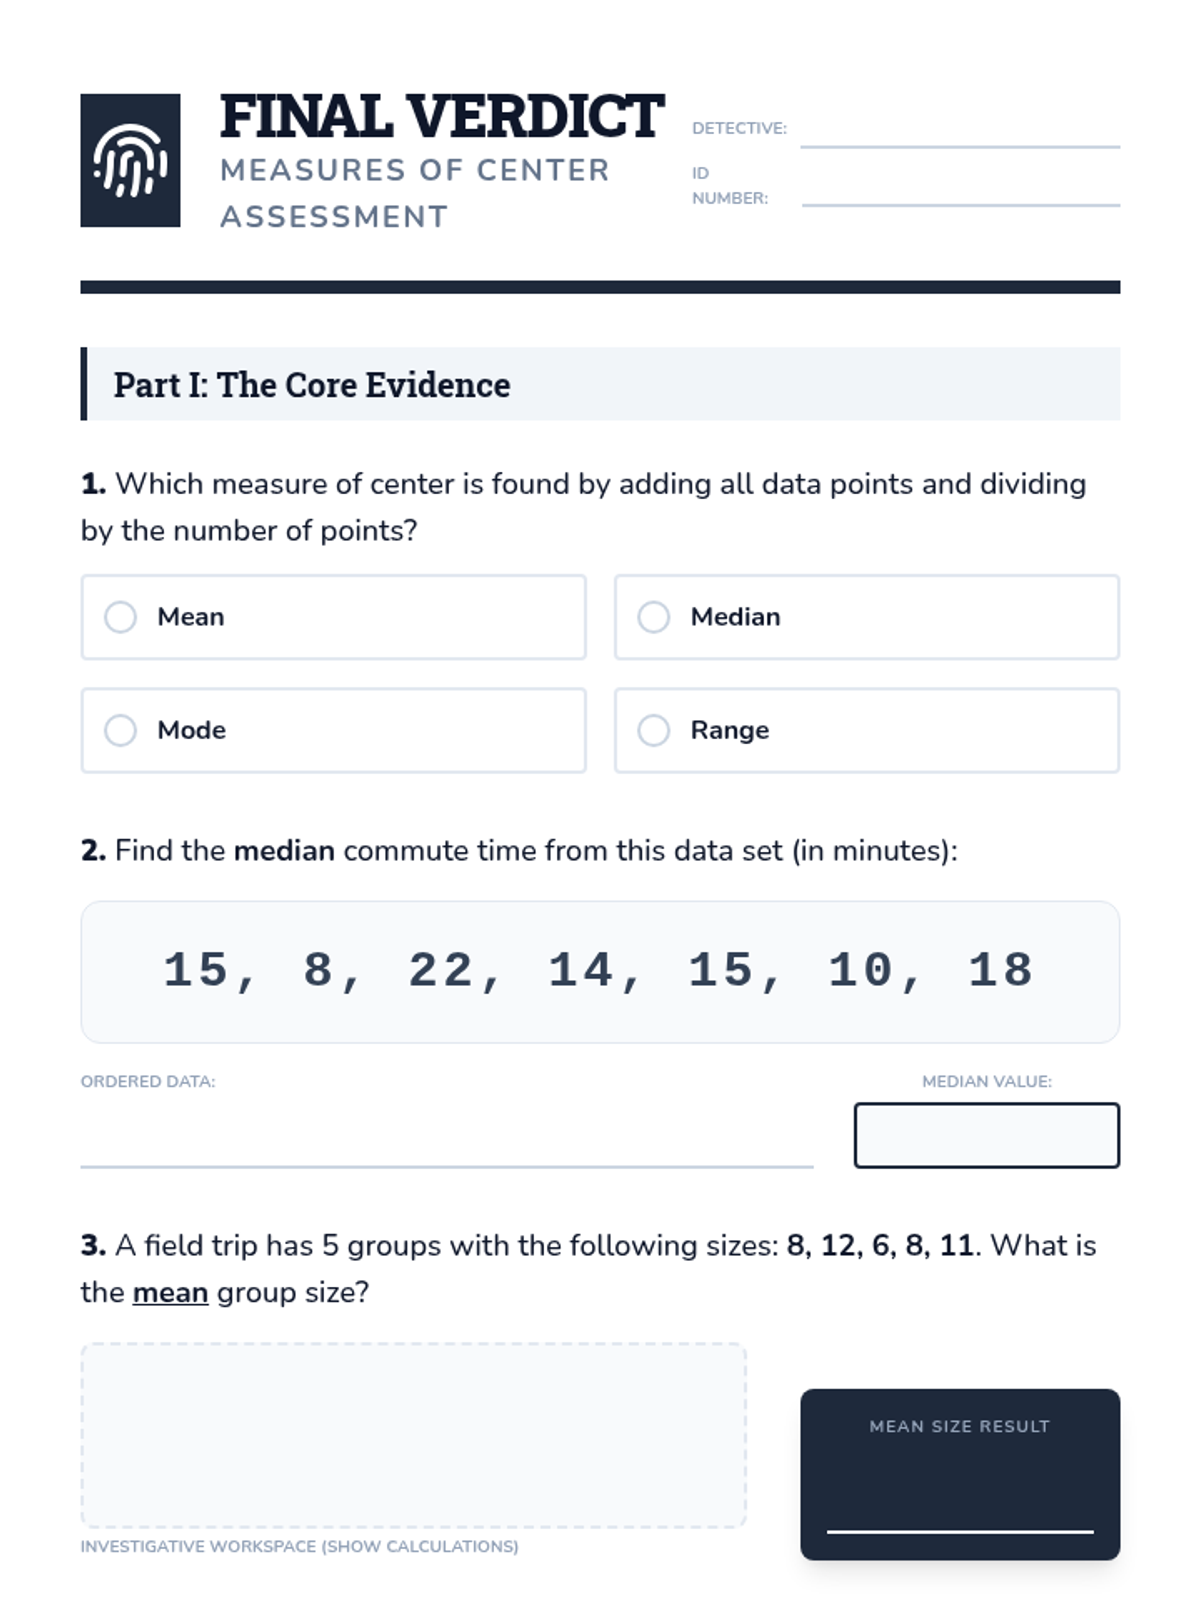
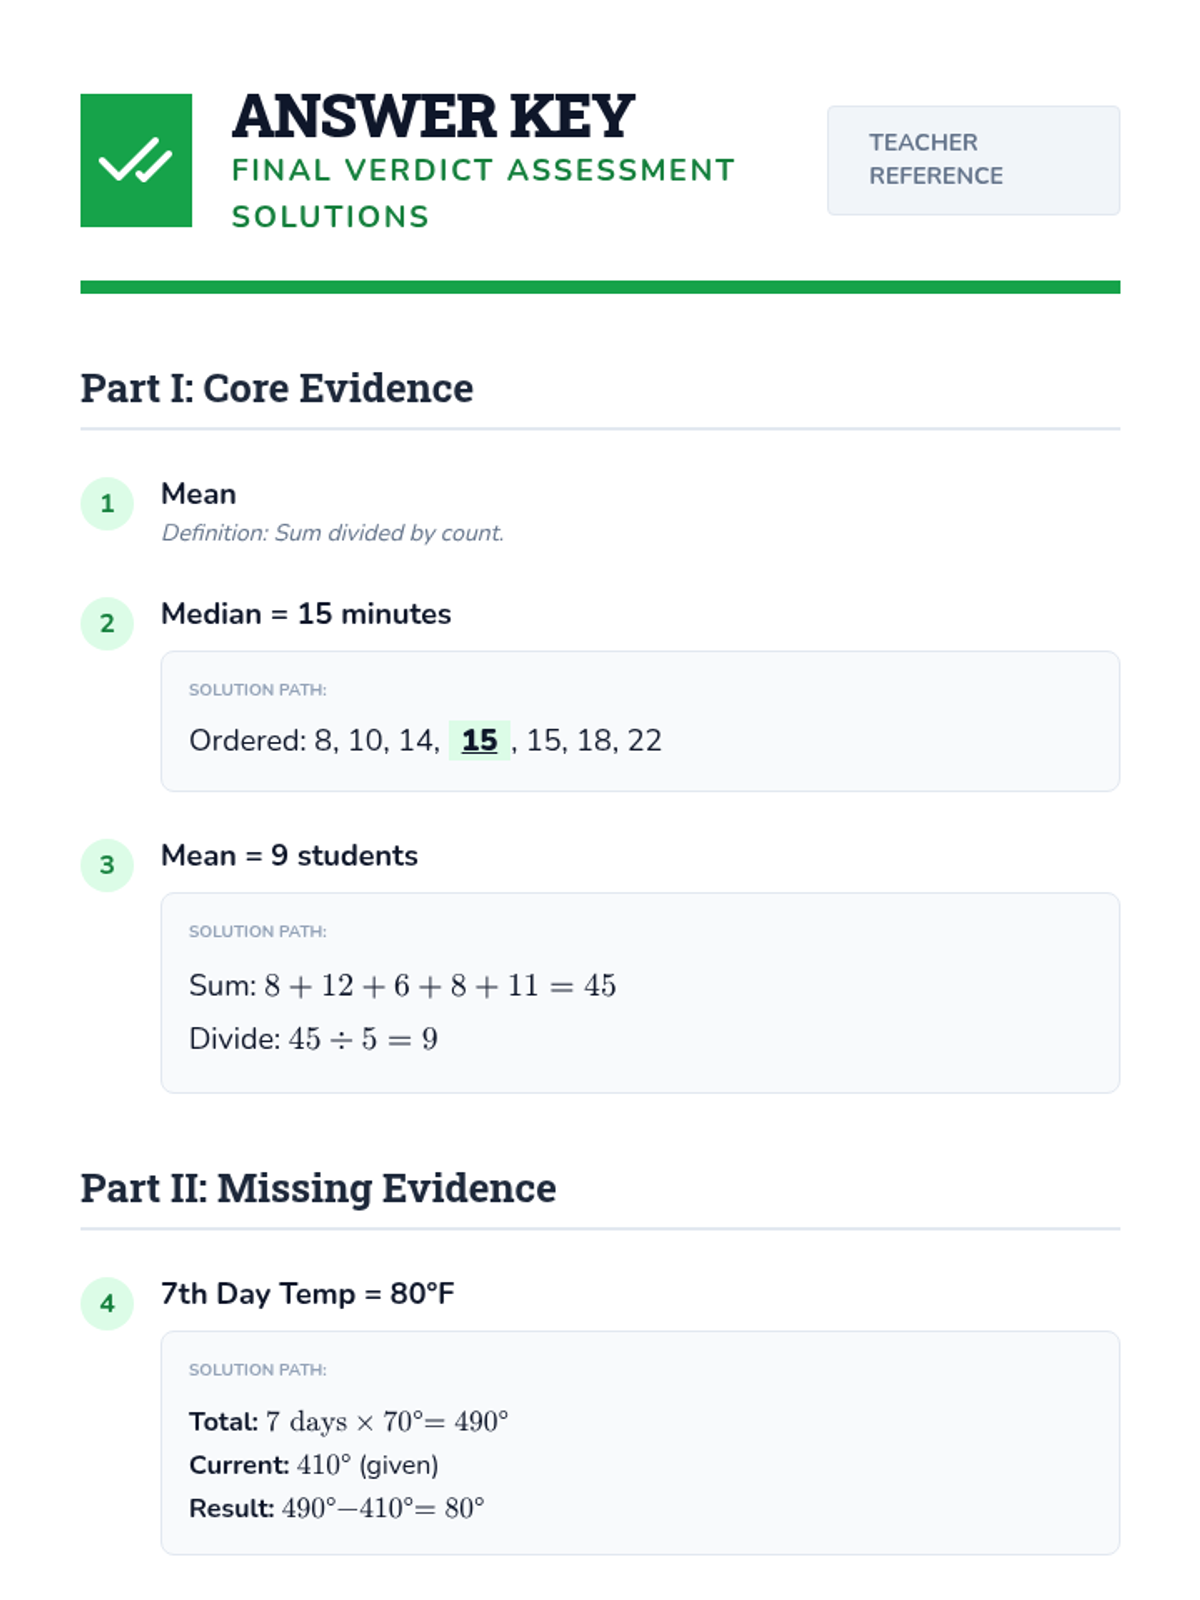
A comprehensive lesson on measures of center (mean, median, mode) where students learn to summarize numerical data and find missing values using time, temperature, and group size data.
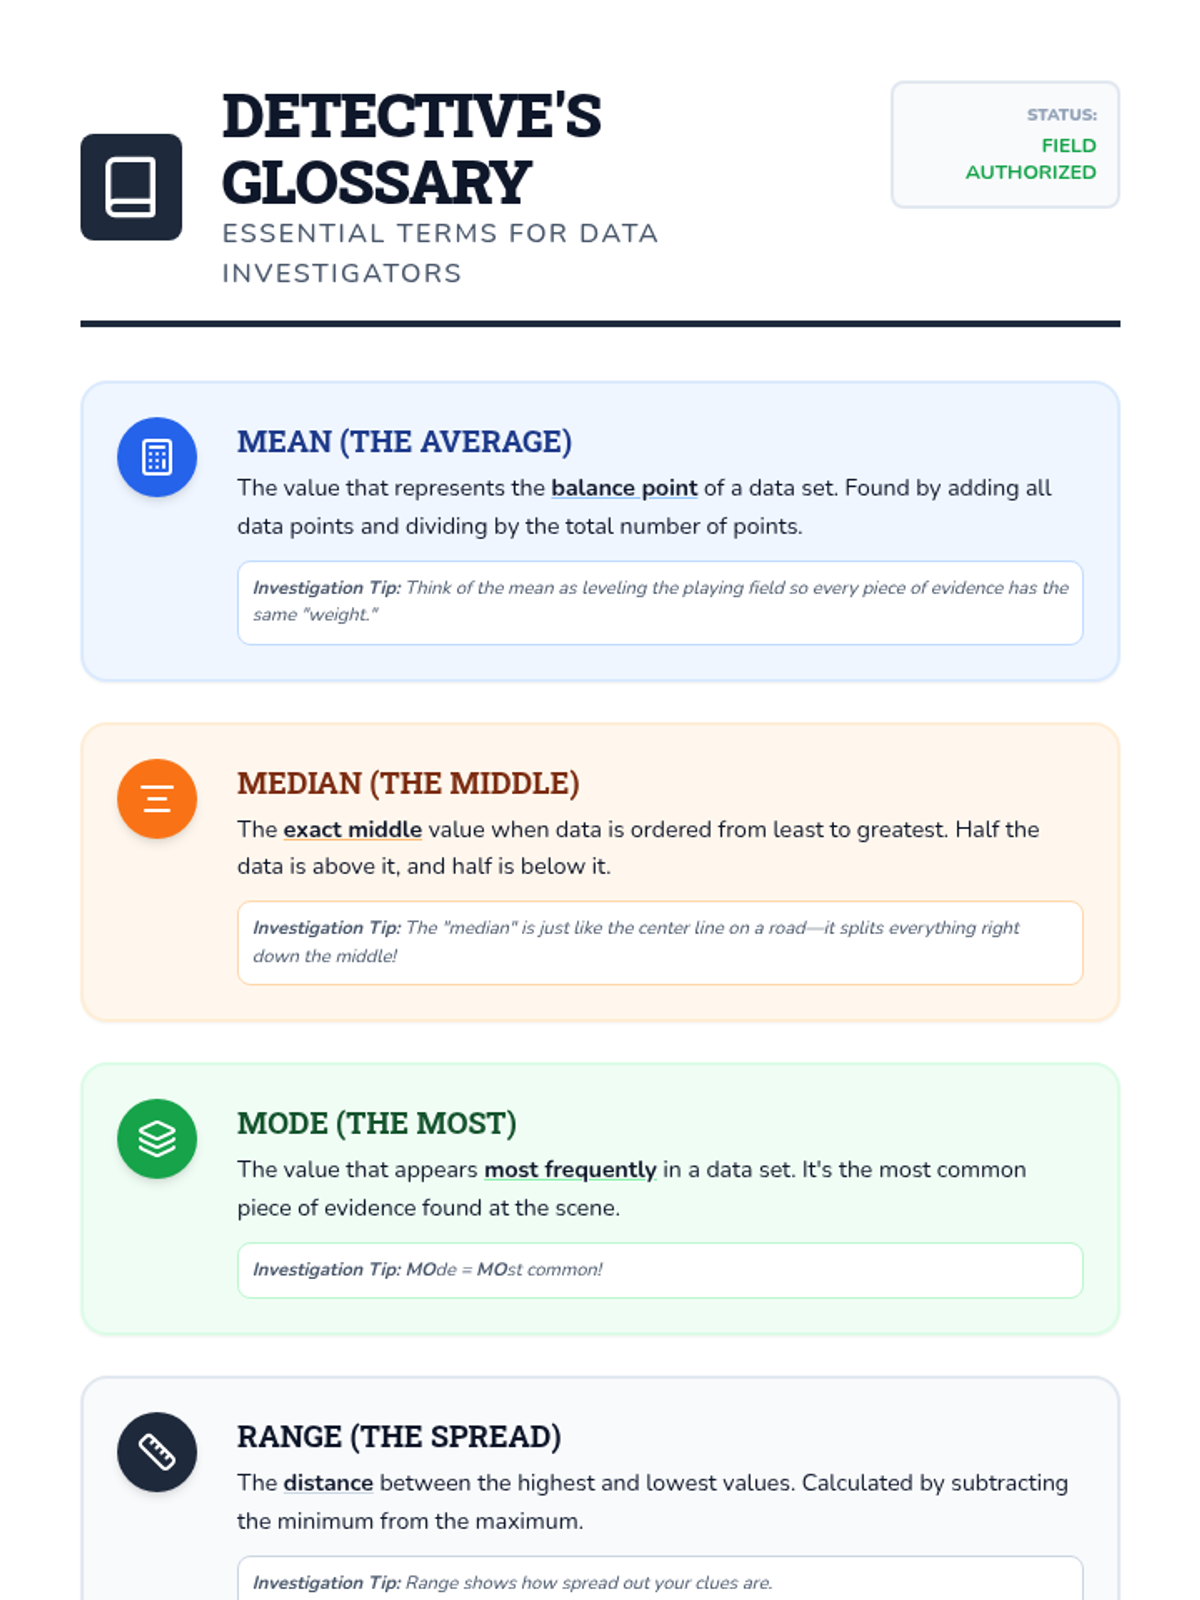
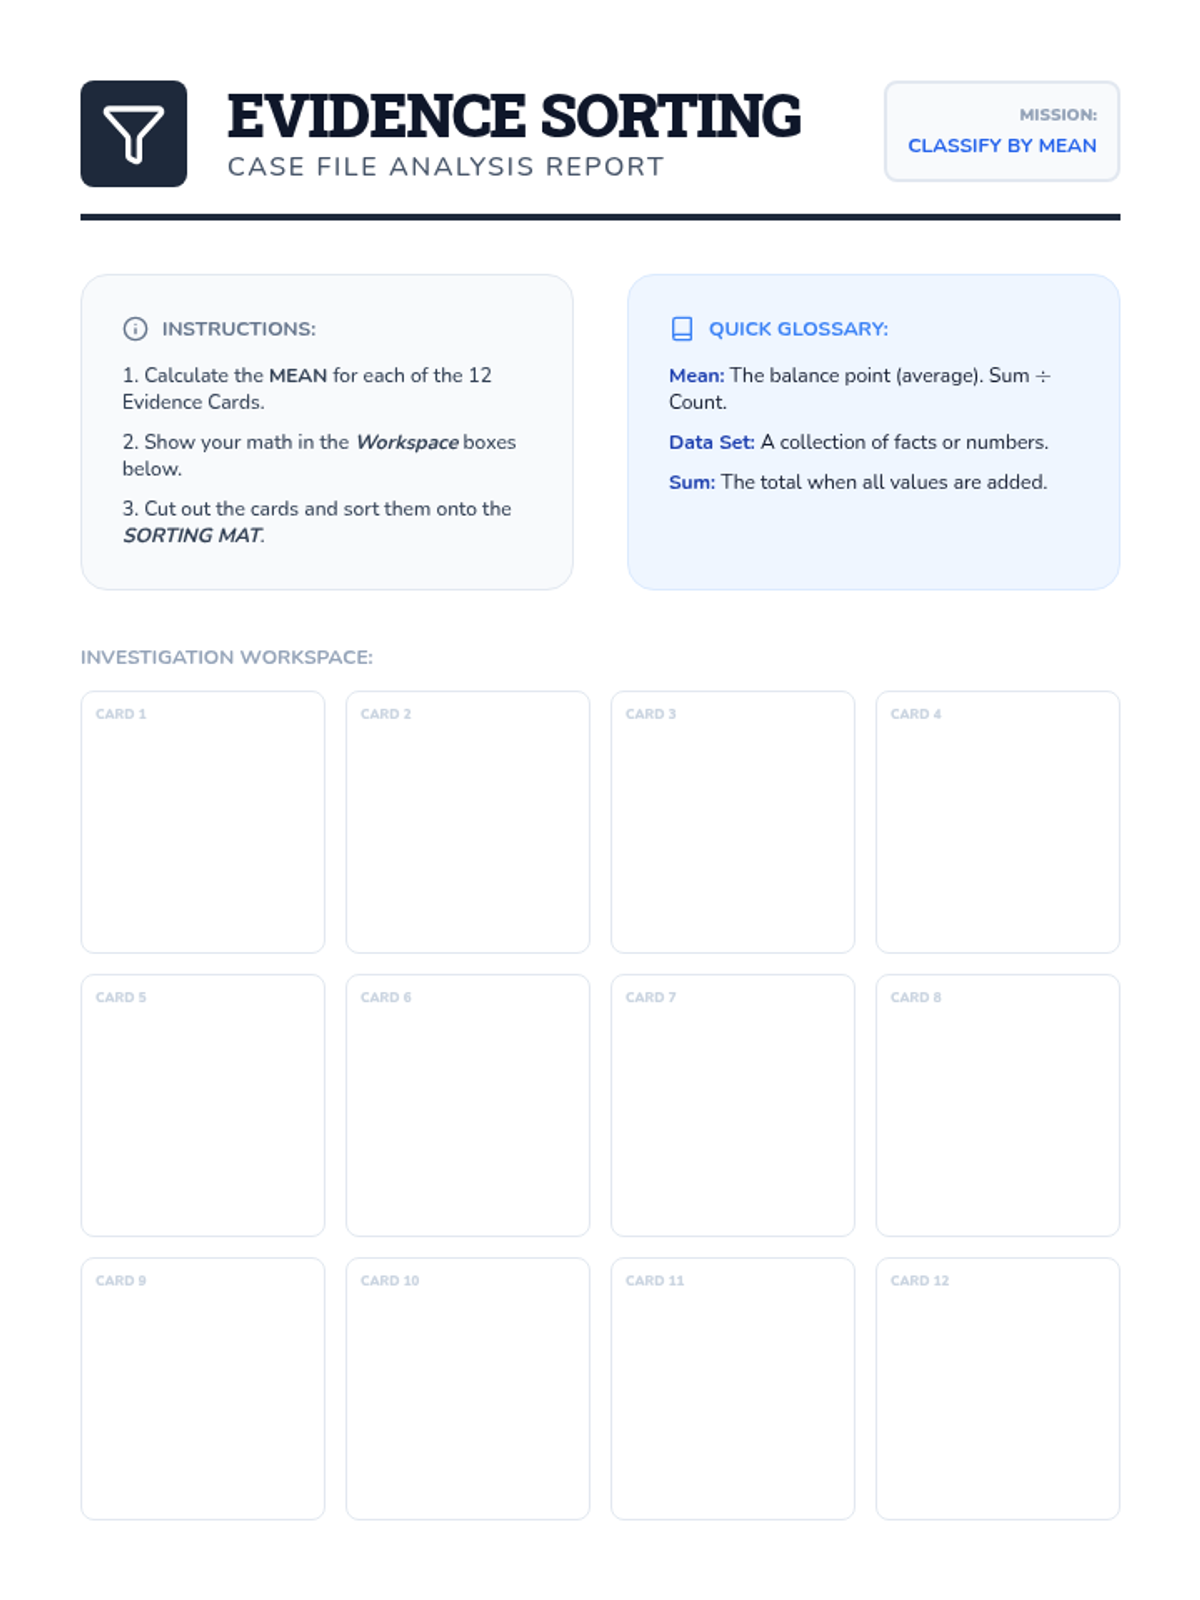
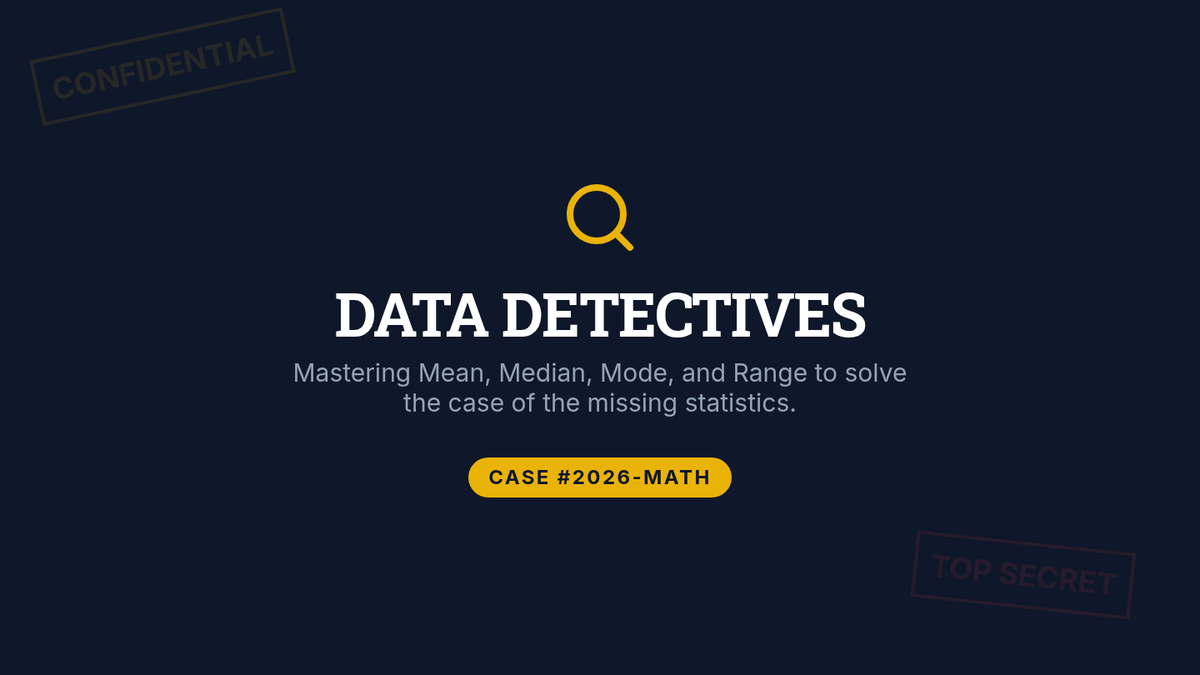
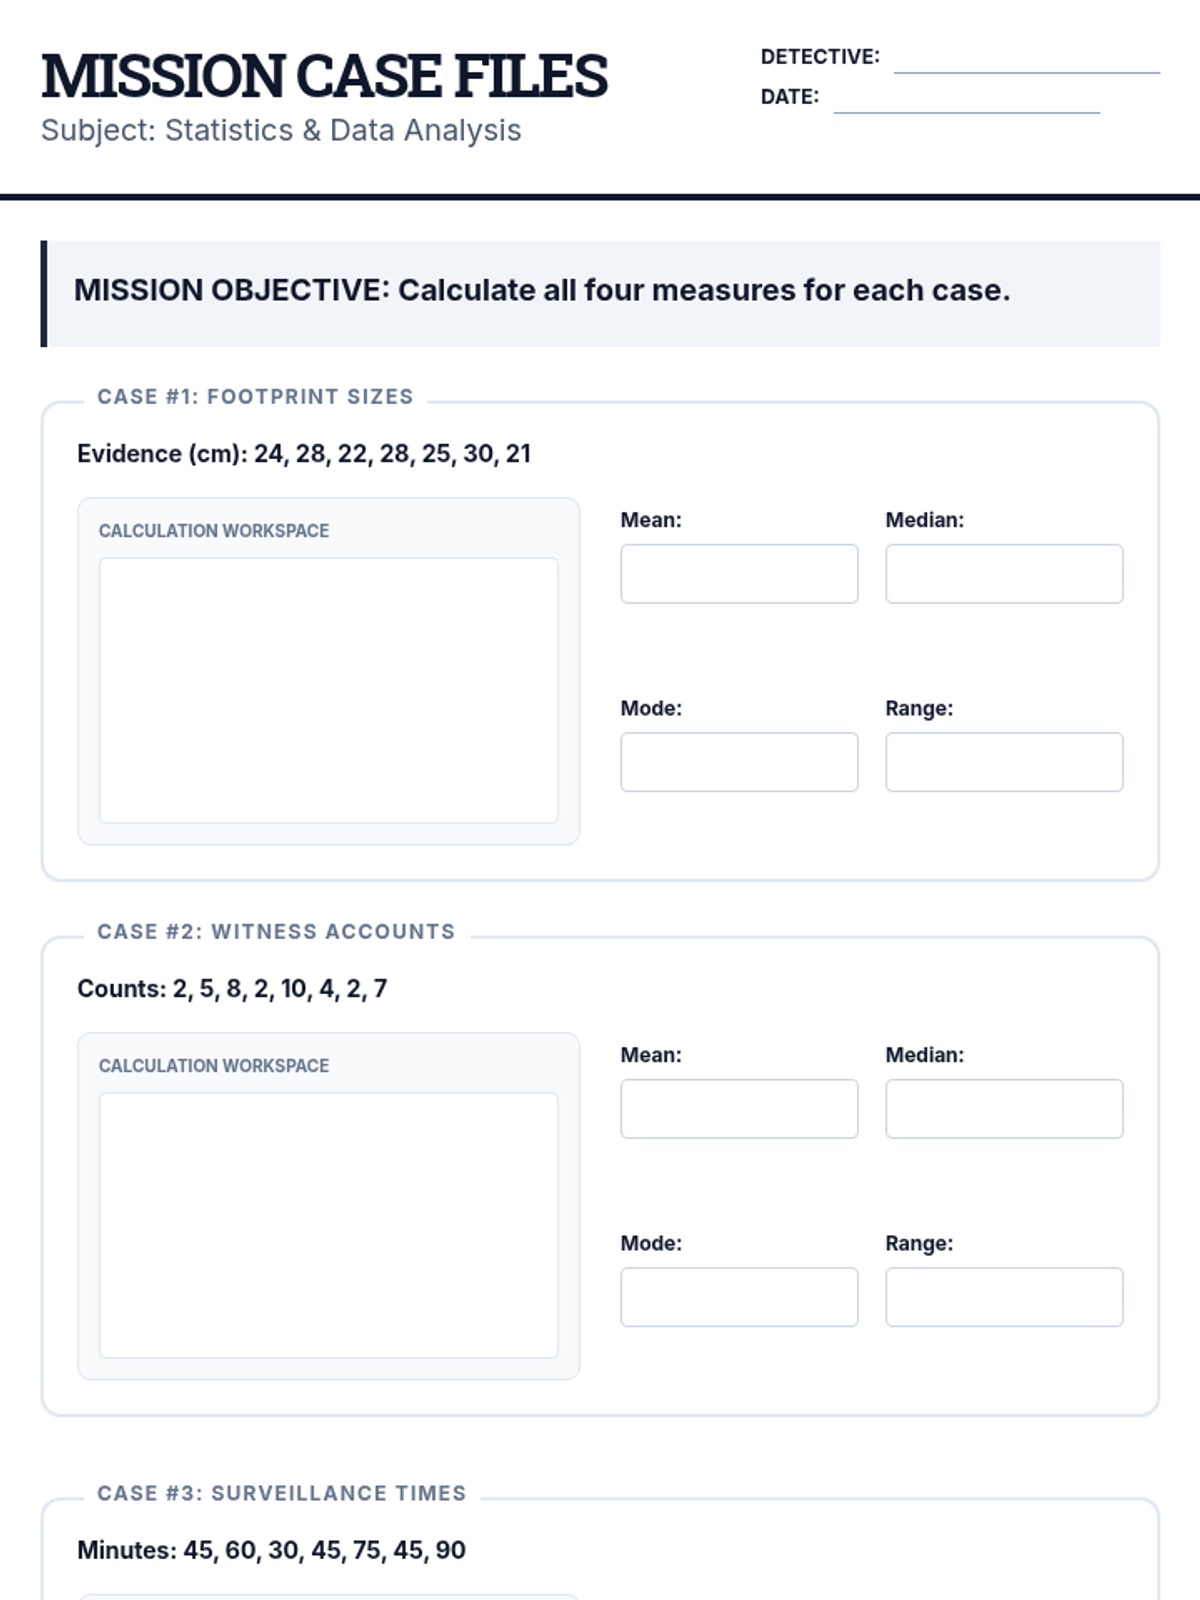
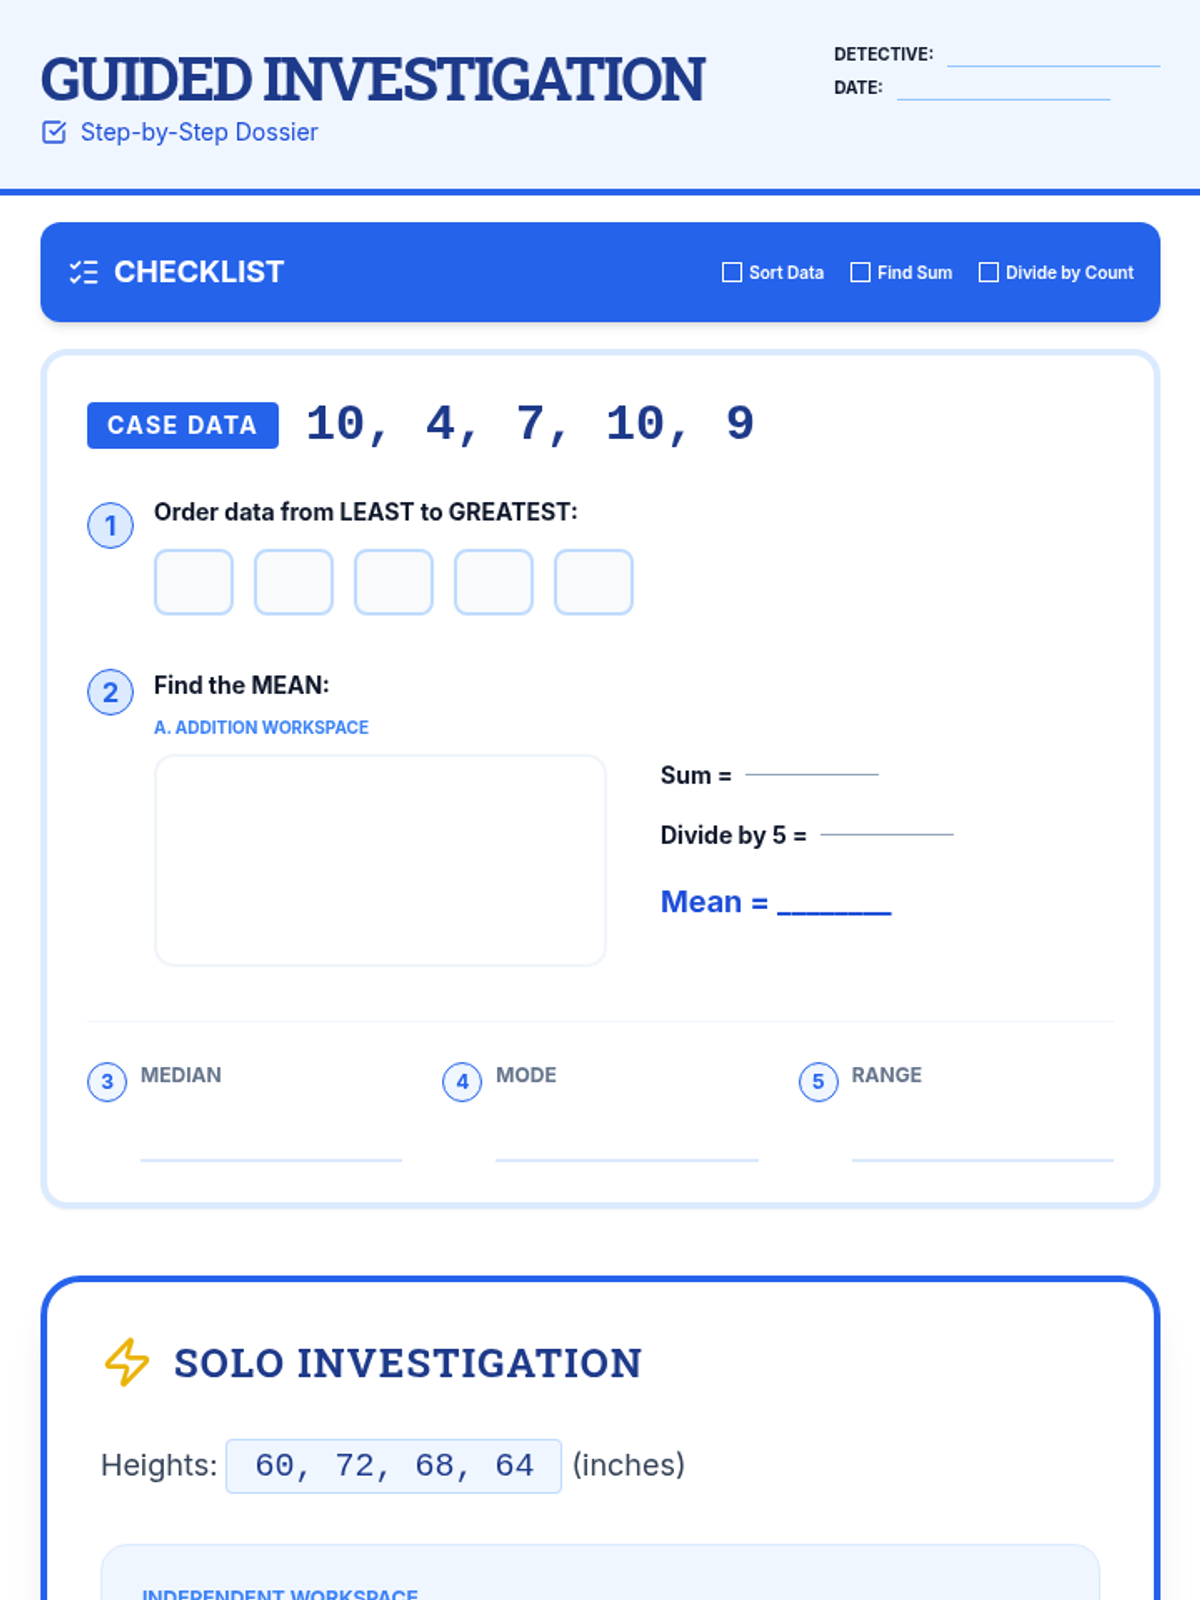
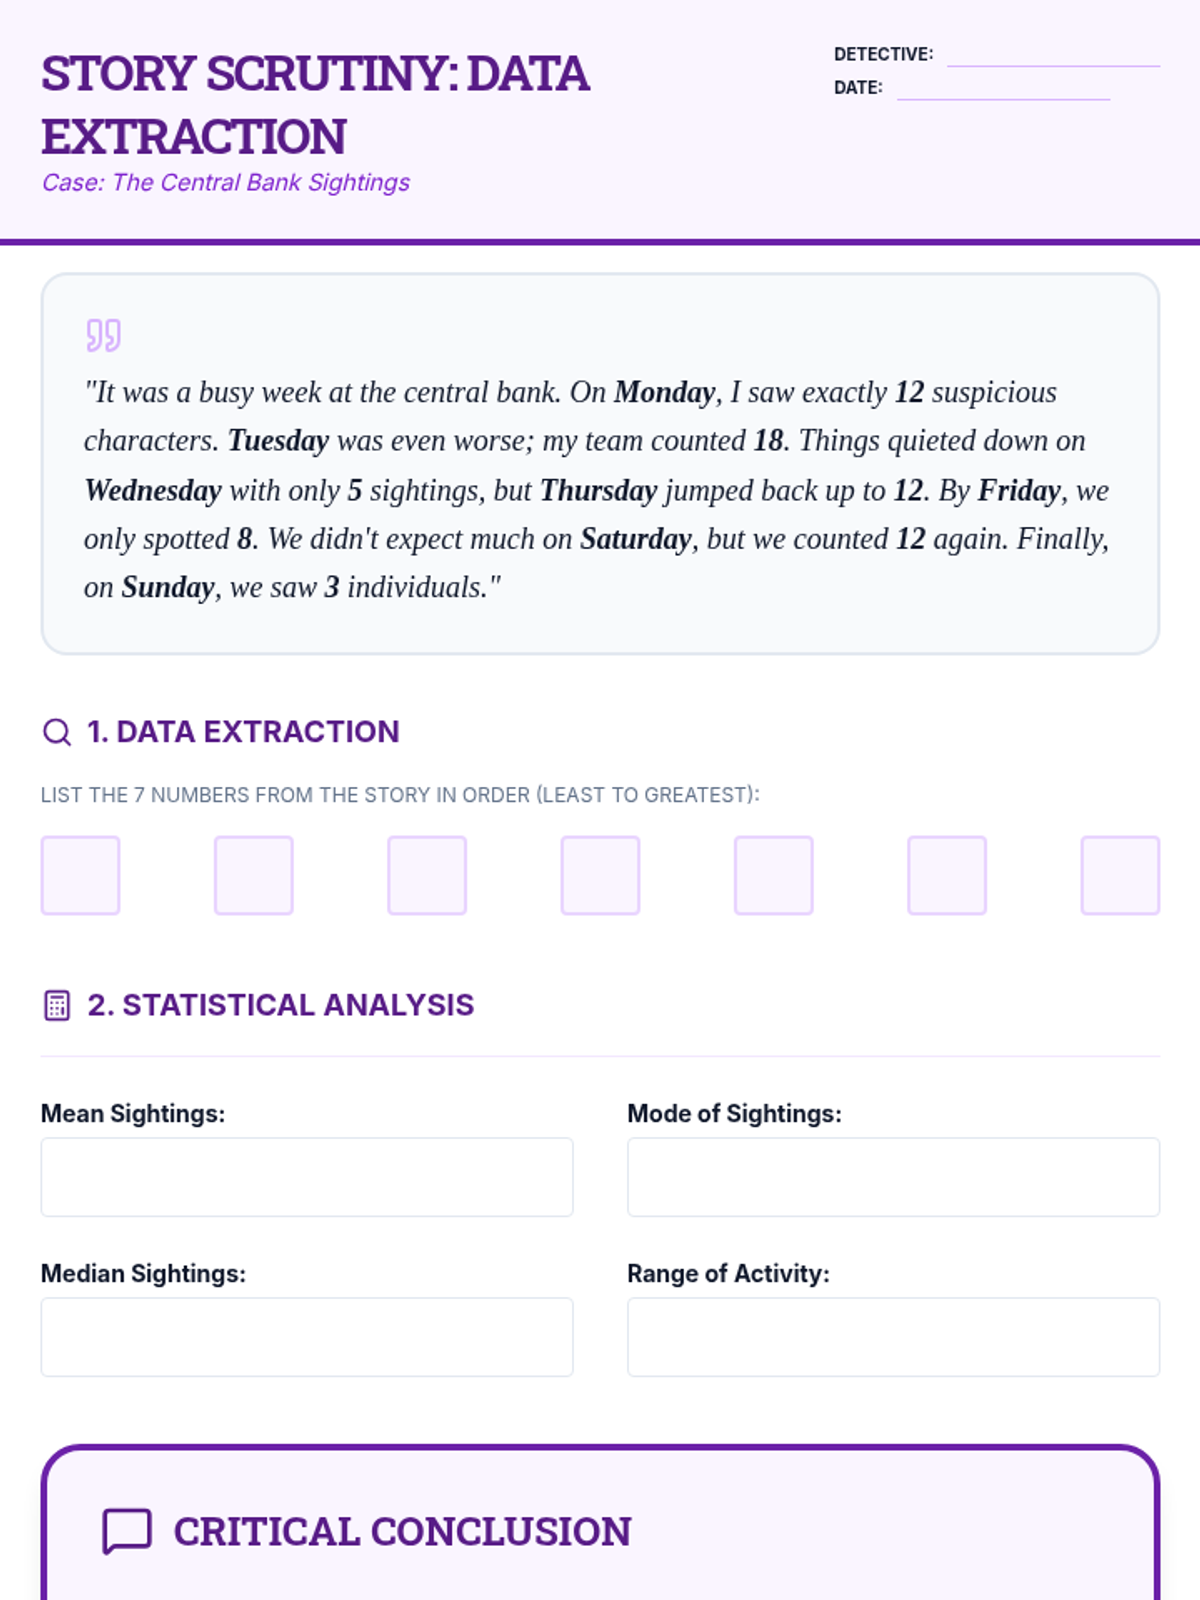
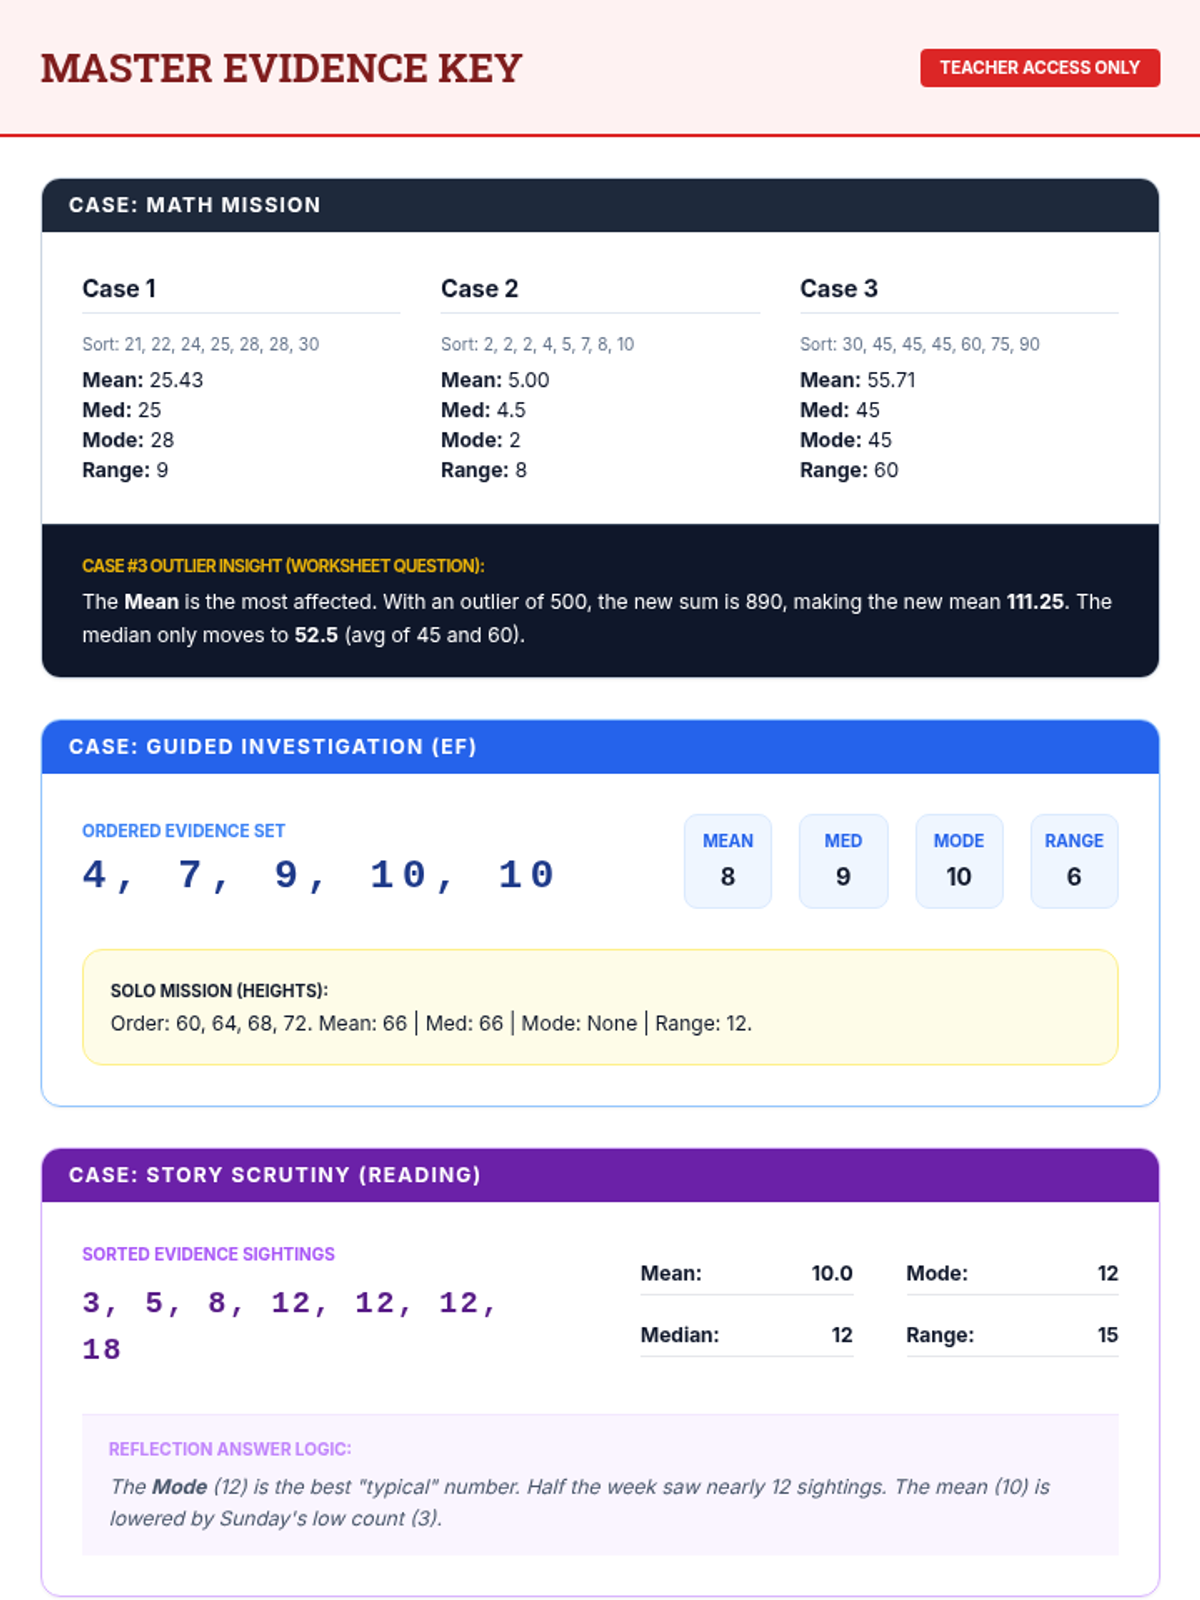
A comprehensive 7th-grade math lesson on mean, median, mode, and range, themed around a 'Data Detective' investigation. It includes differentiated materials for math, executive functioning, and reading comprehension goals.
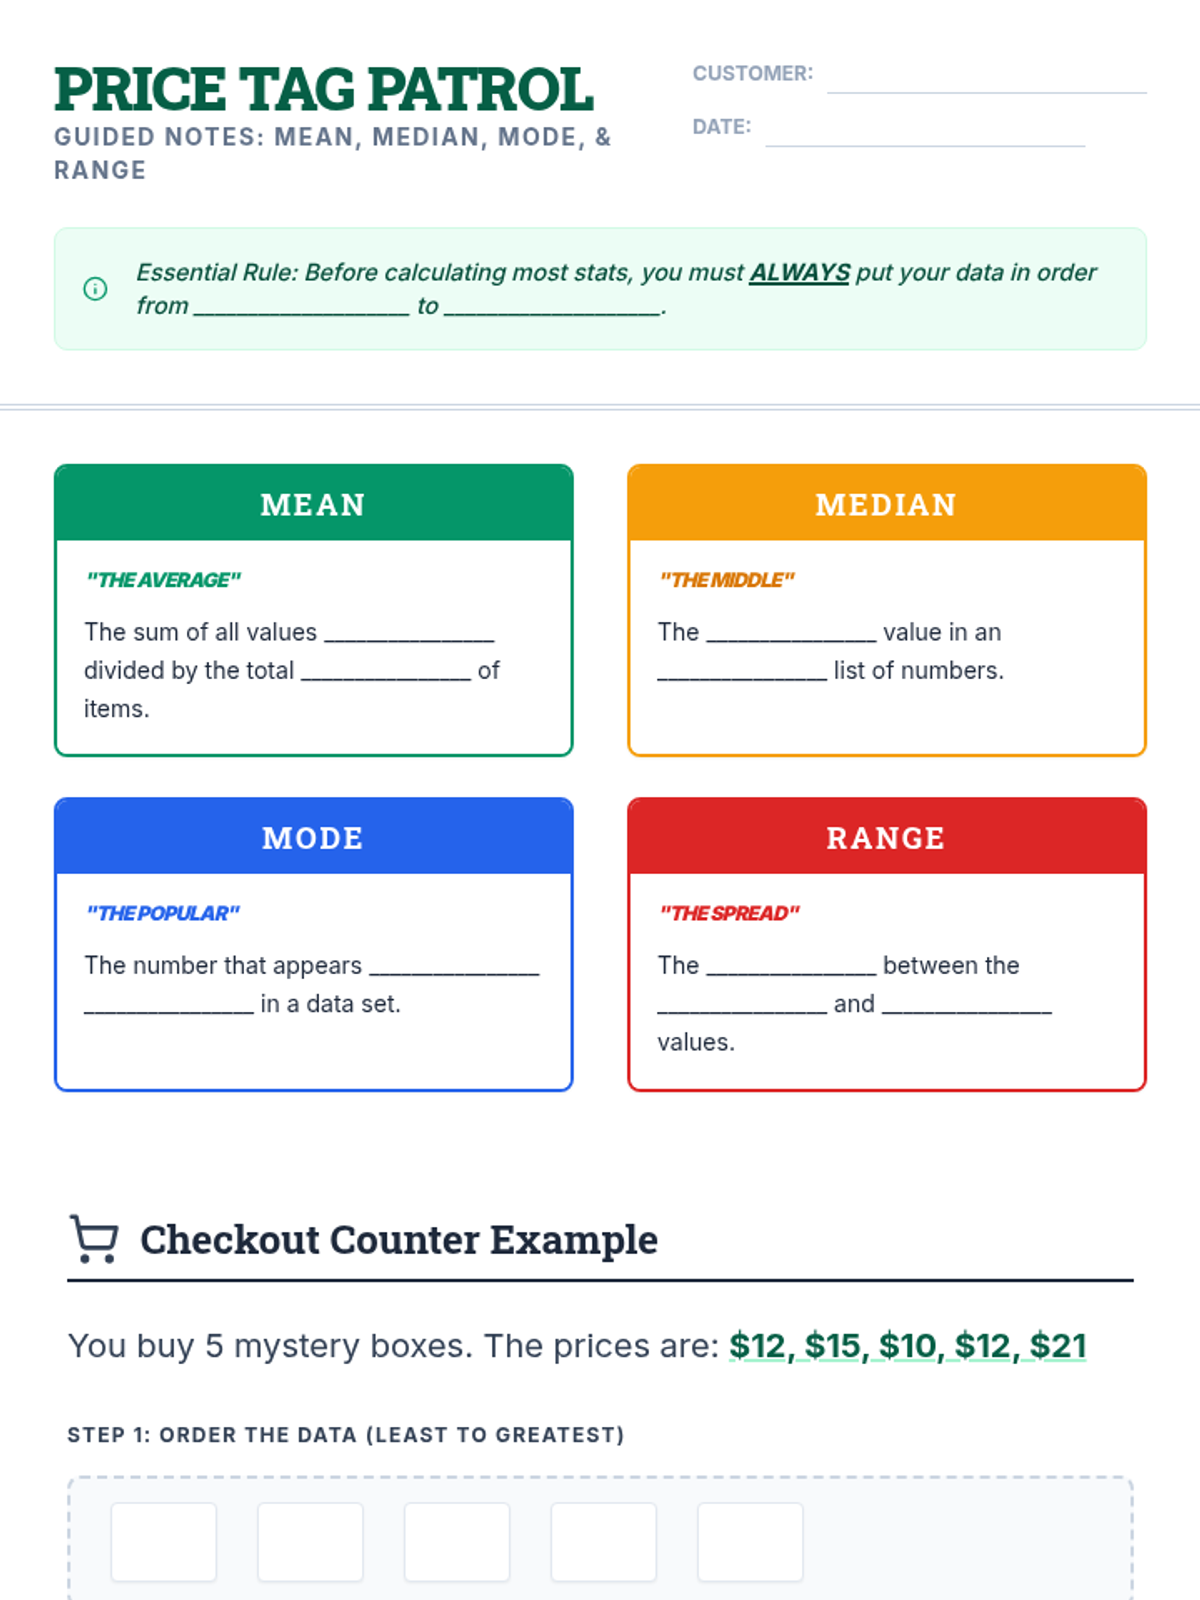
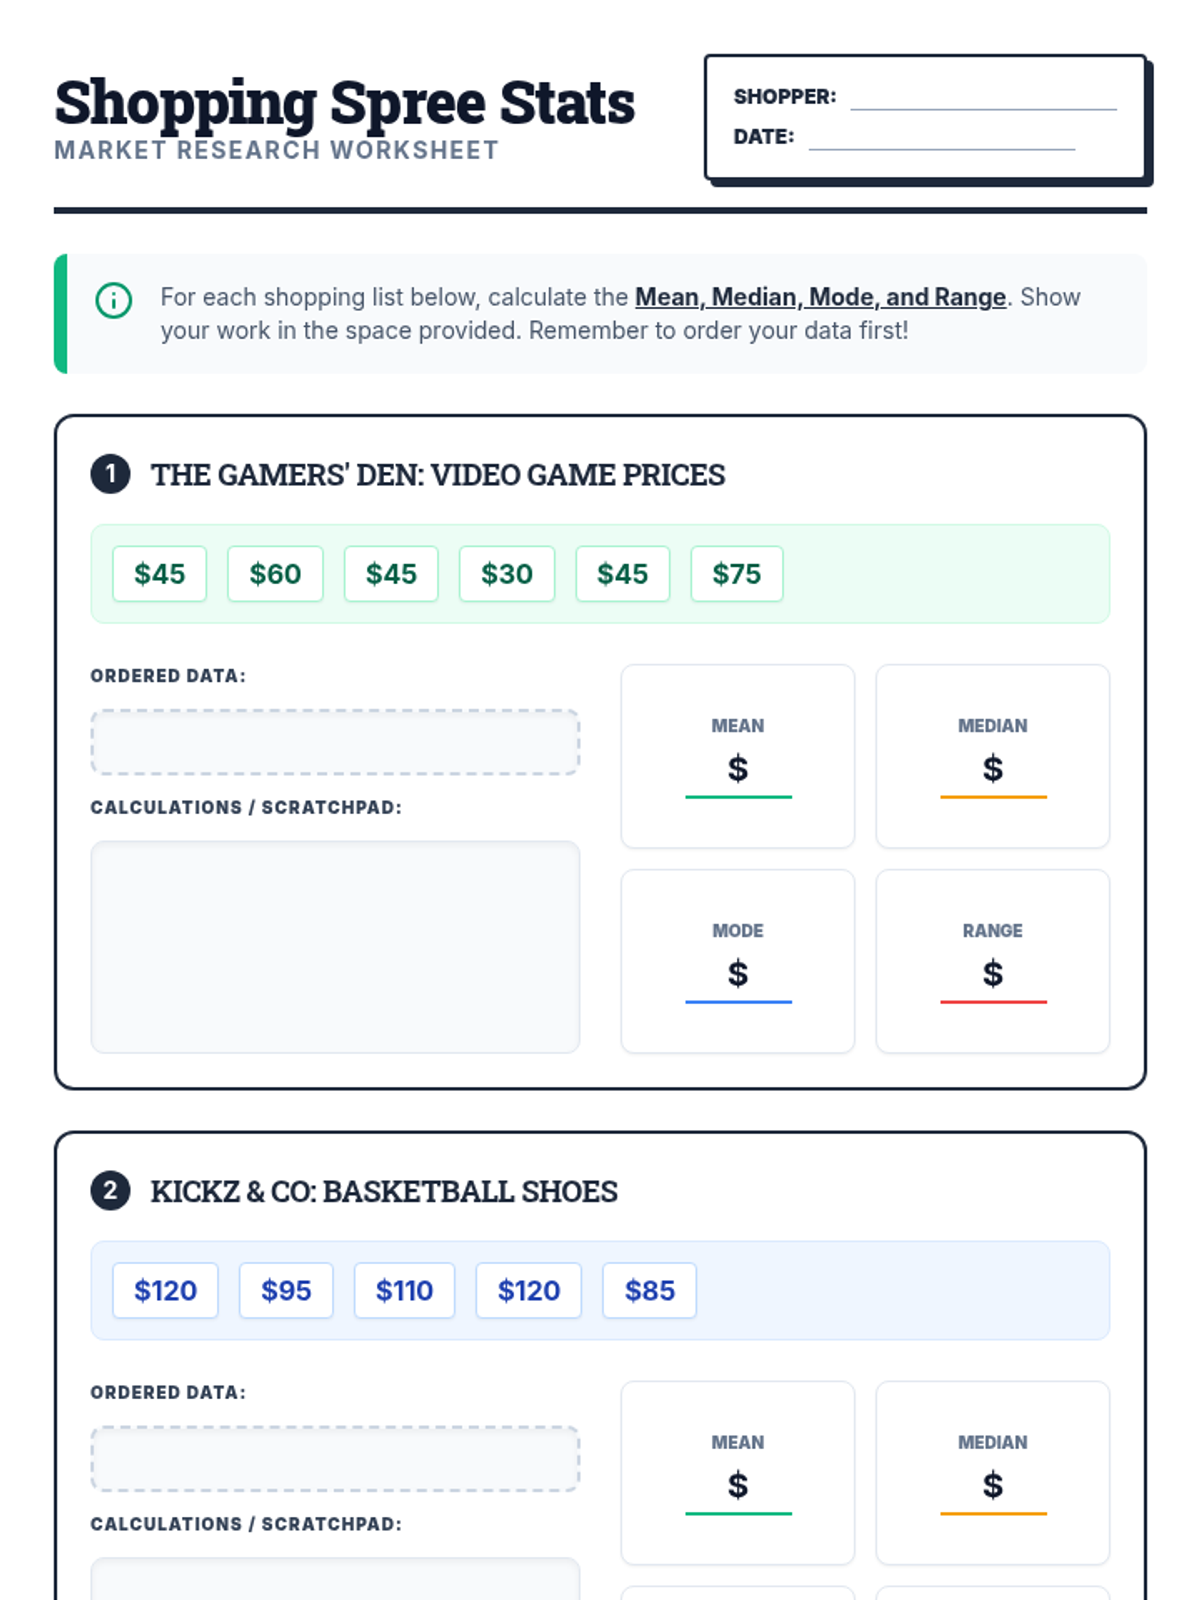
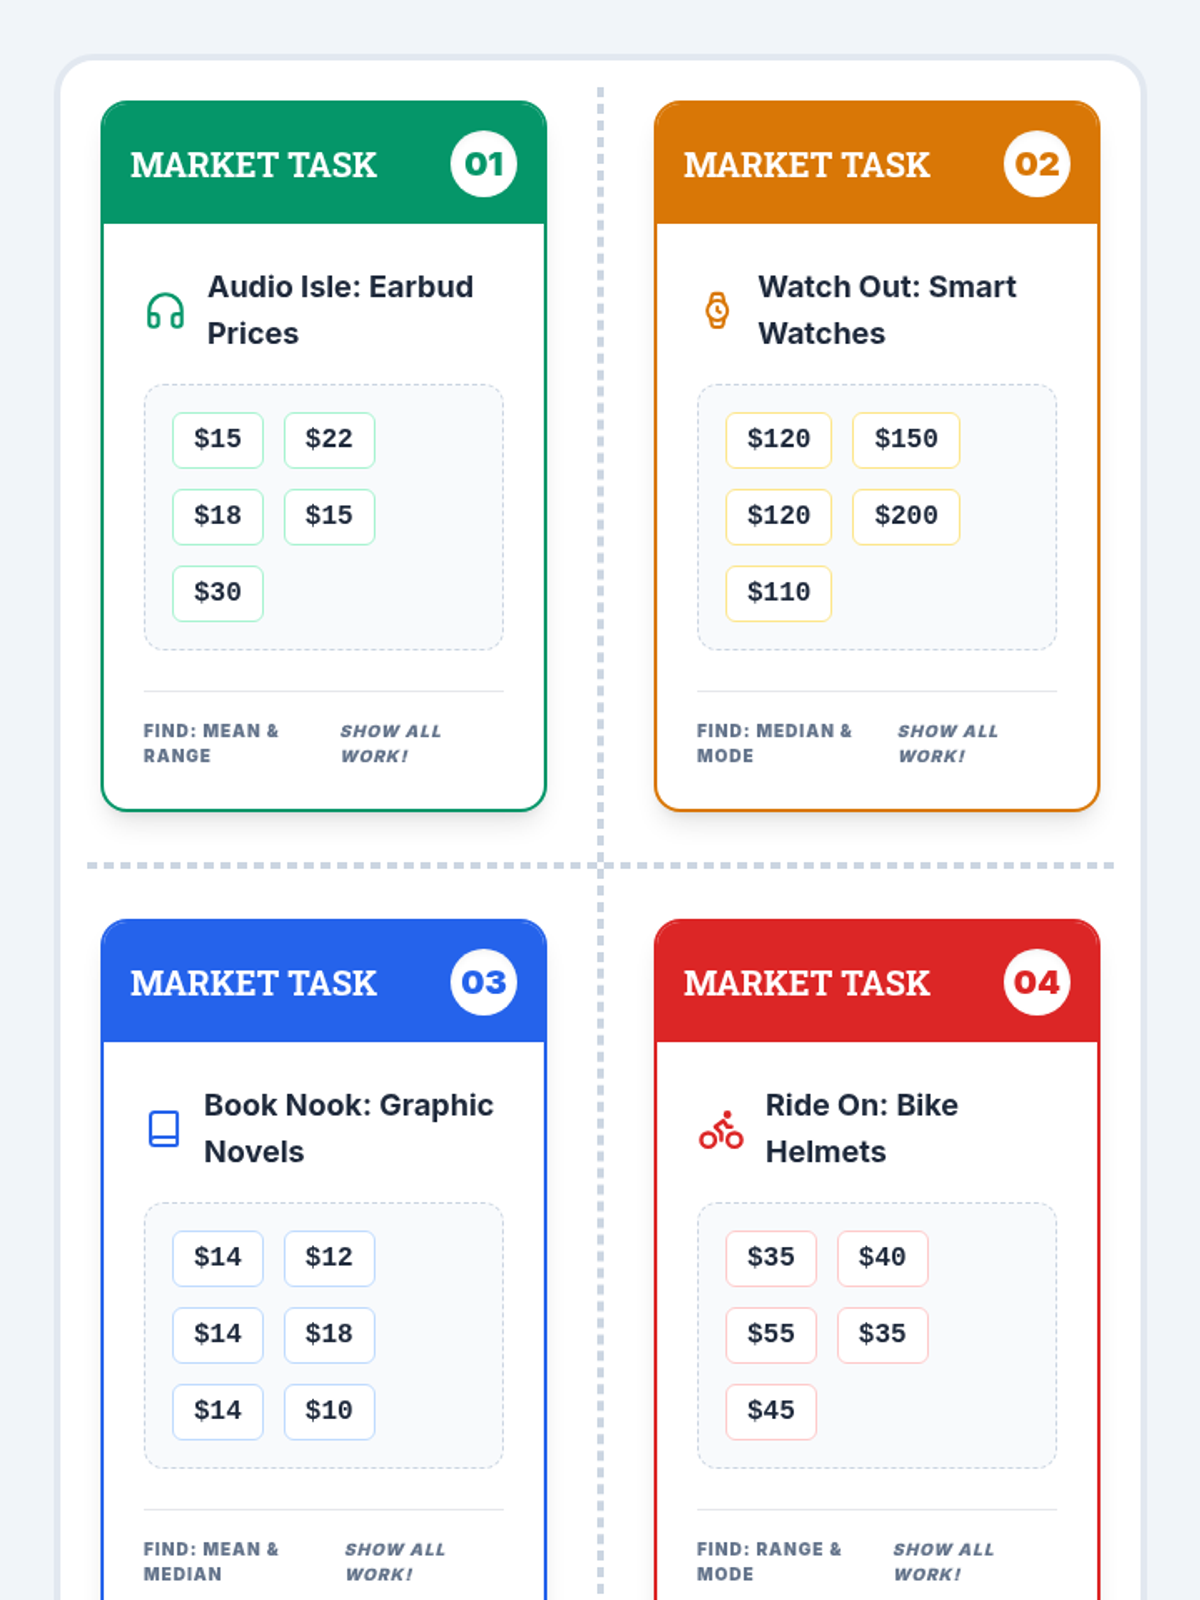
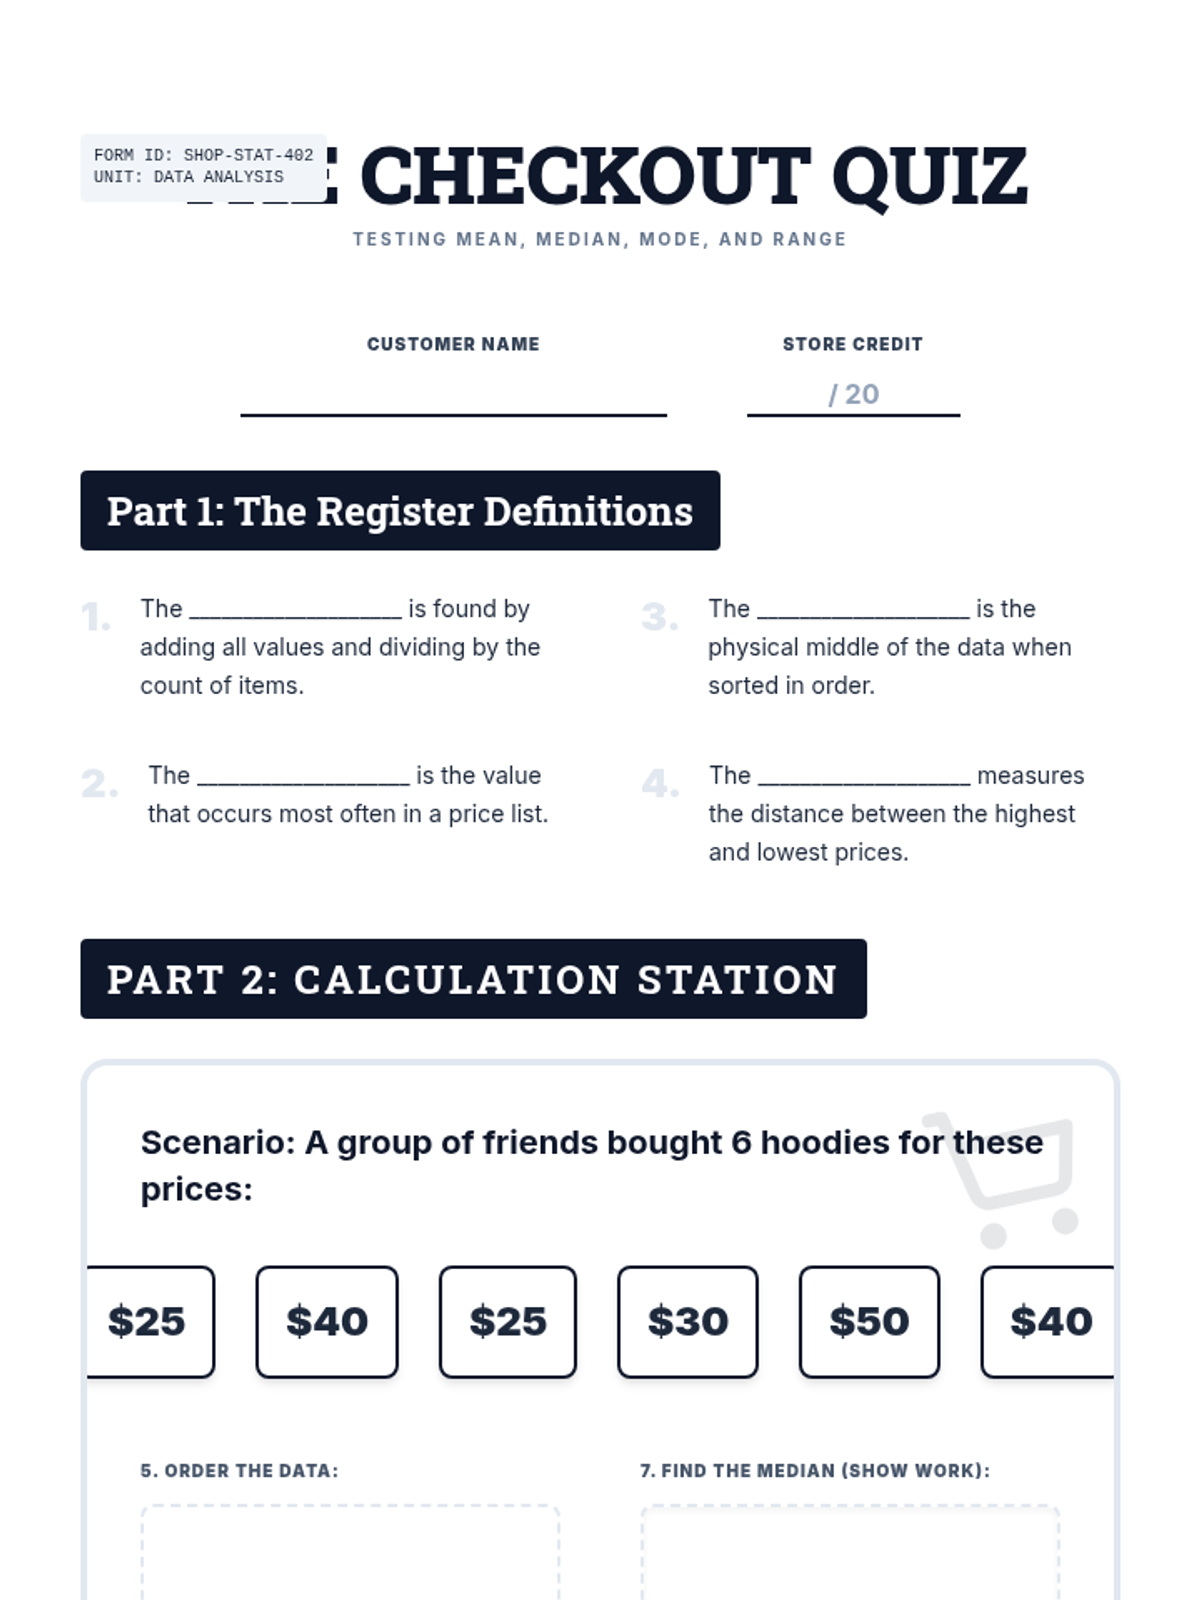
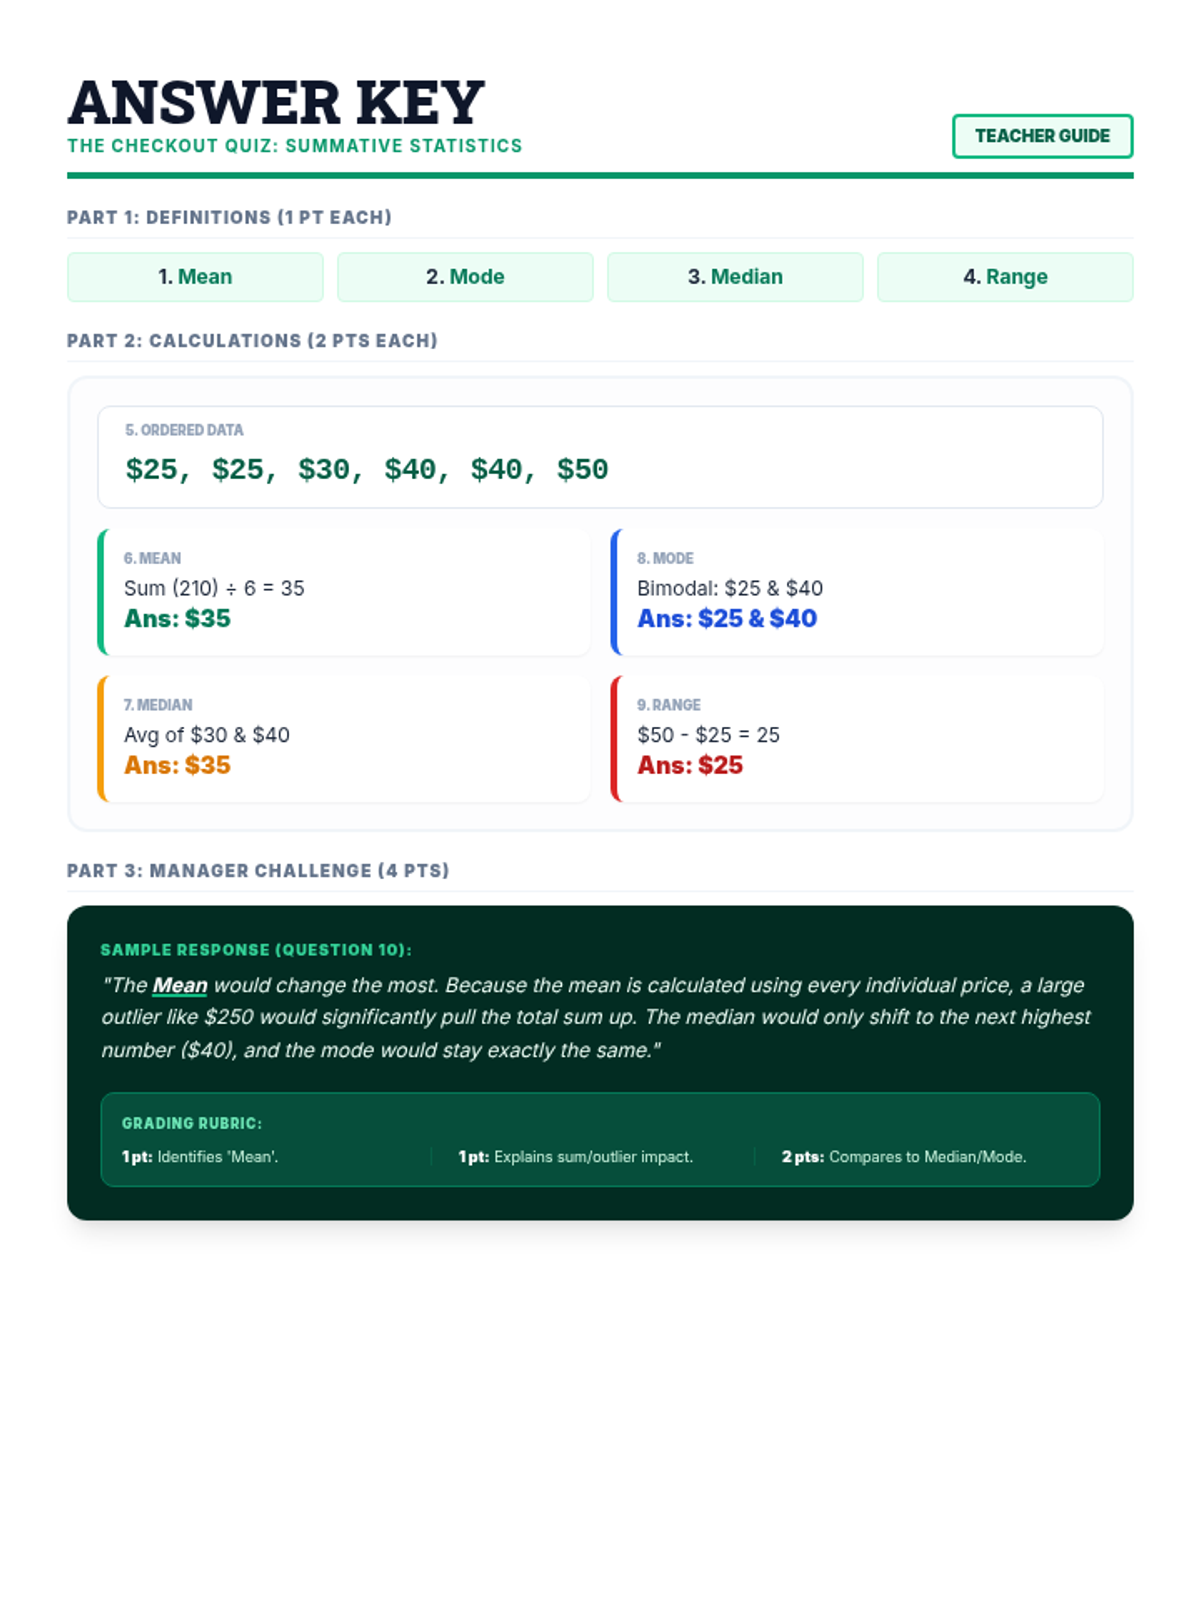
A comprehensive lesson on calculating and interpreting mean, median, mode, and range using real-world shopping and pricing data. Students will analyze price lists for various items to master basic statistics.
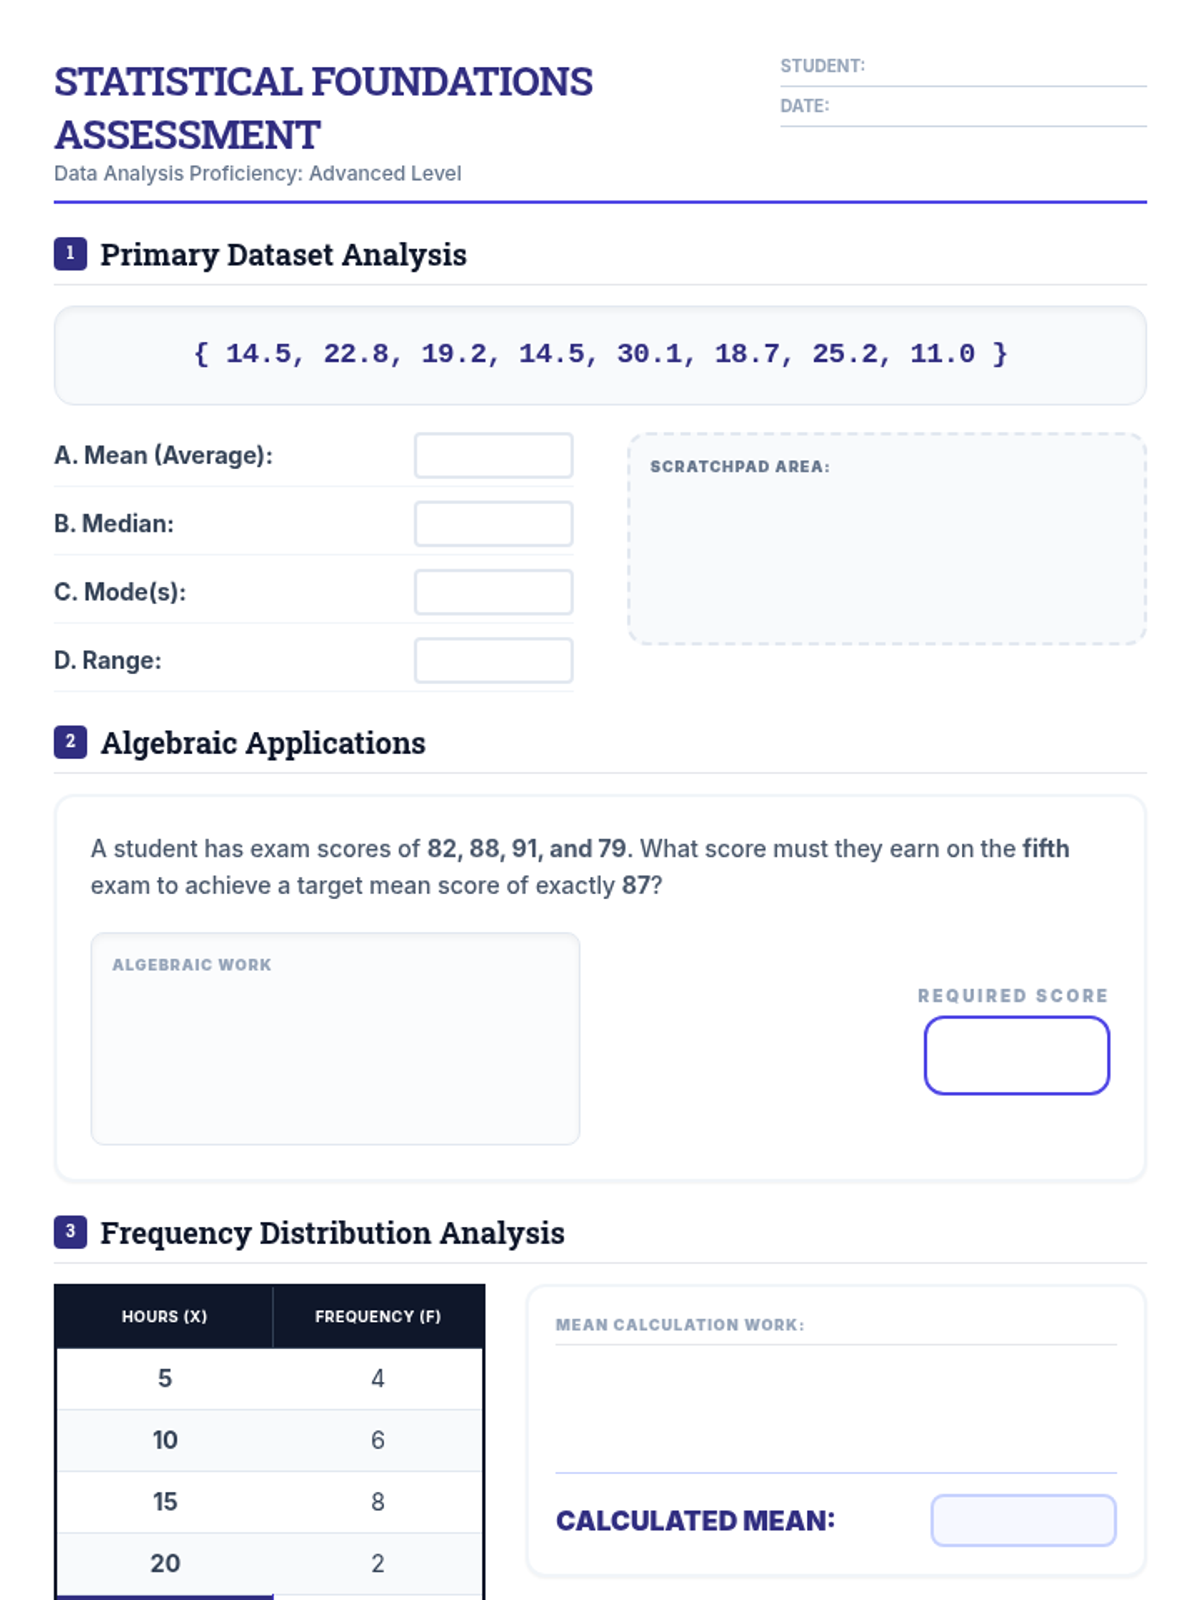
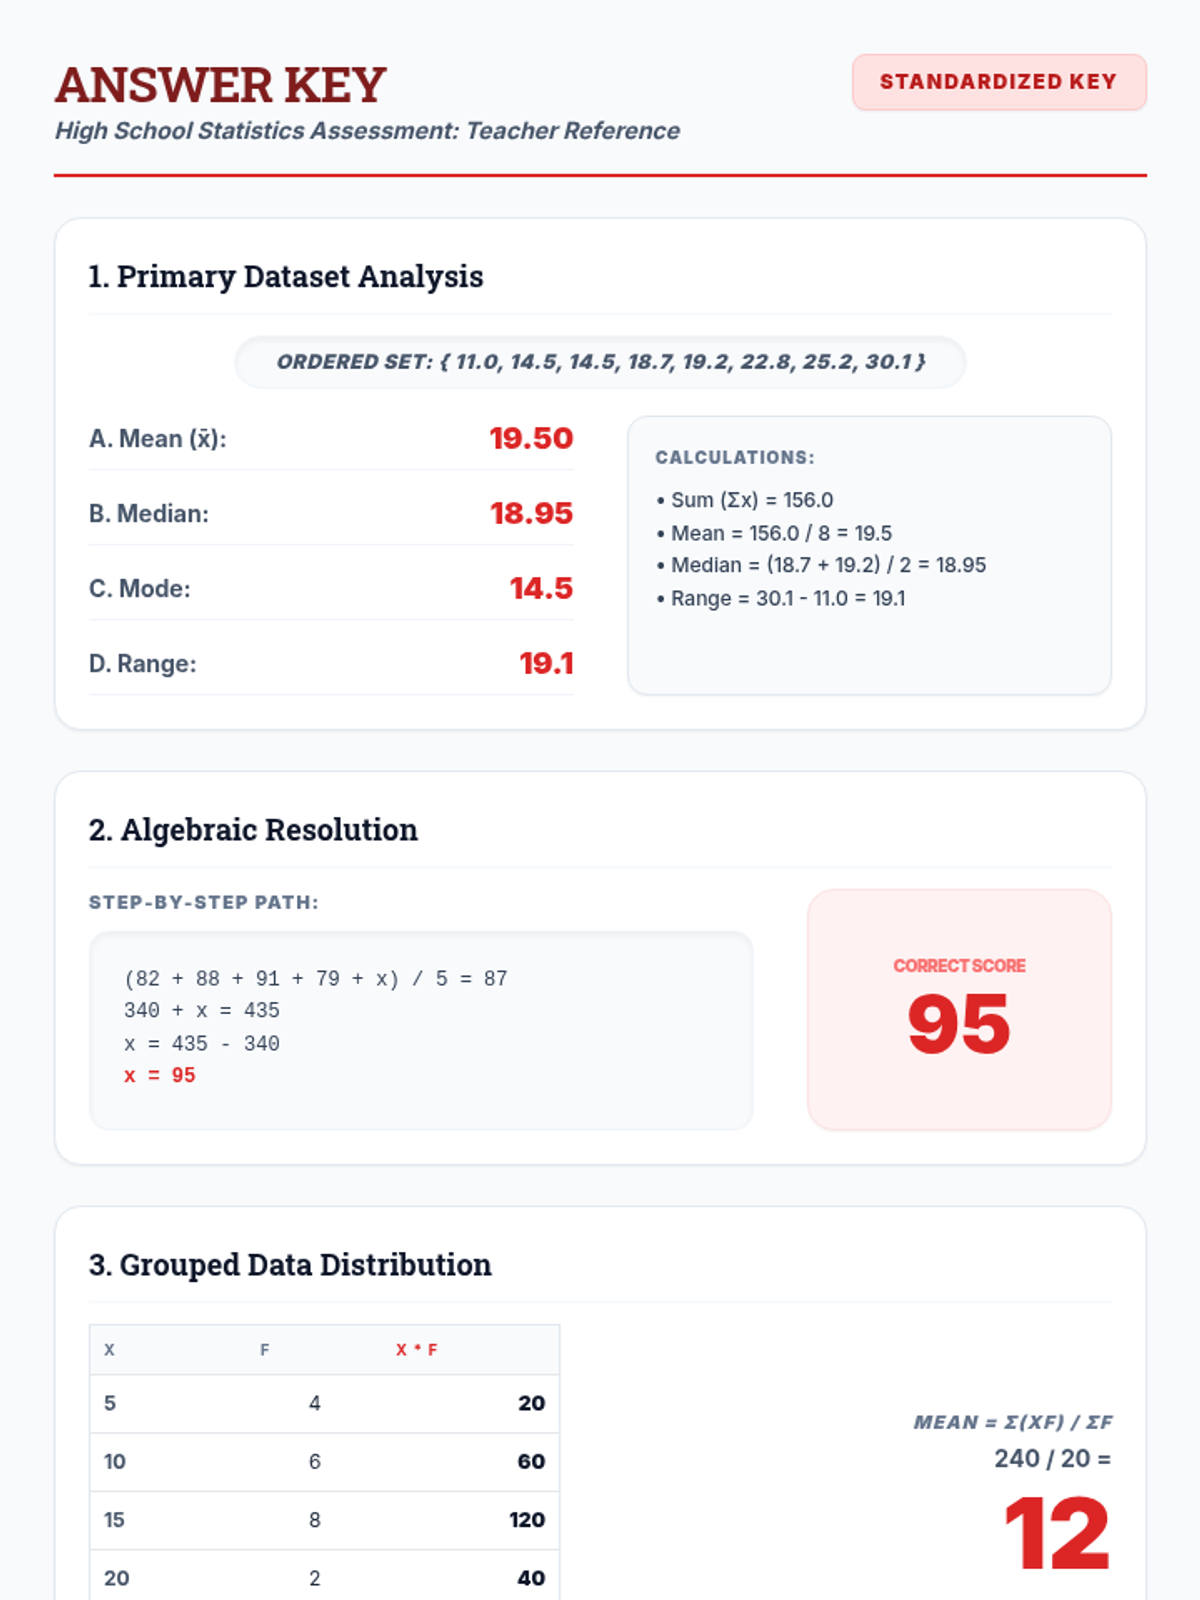
Advanced applications of central tendency and spread, including algebraic problem-solving, weighted means, and the mathematical impact of outliers for high school students.
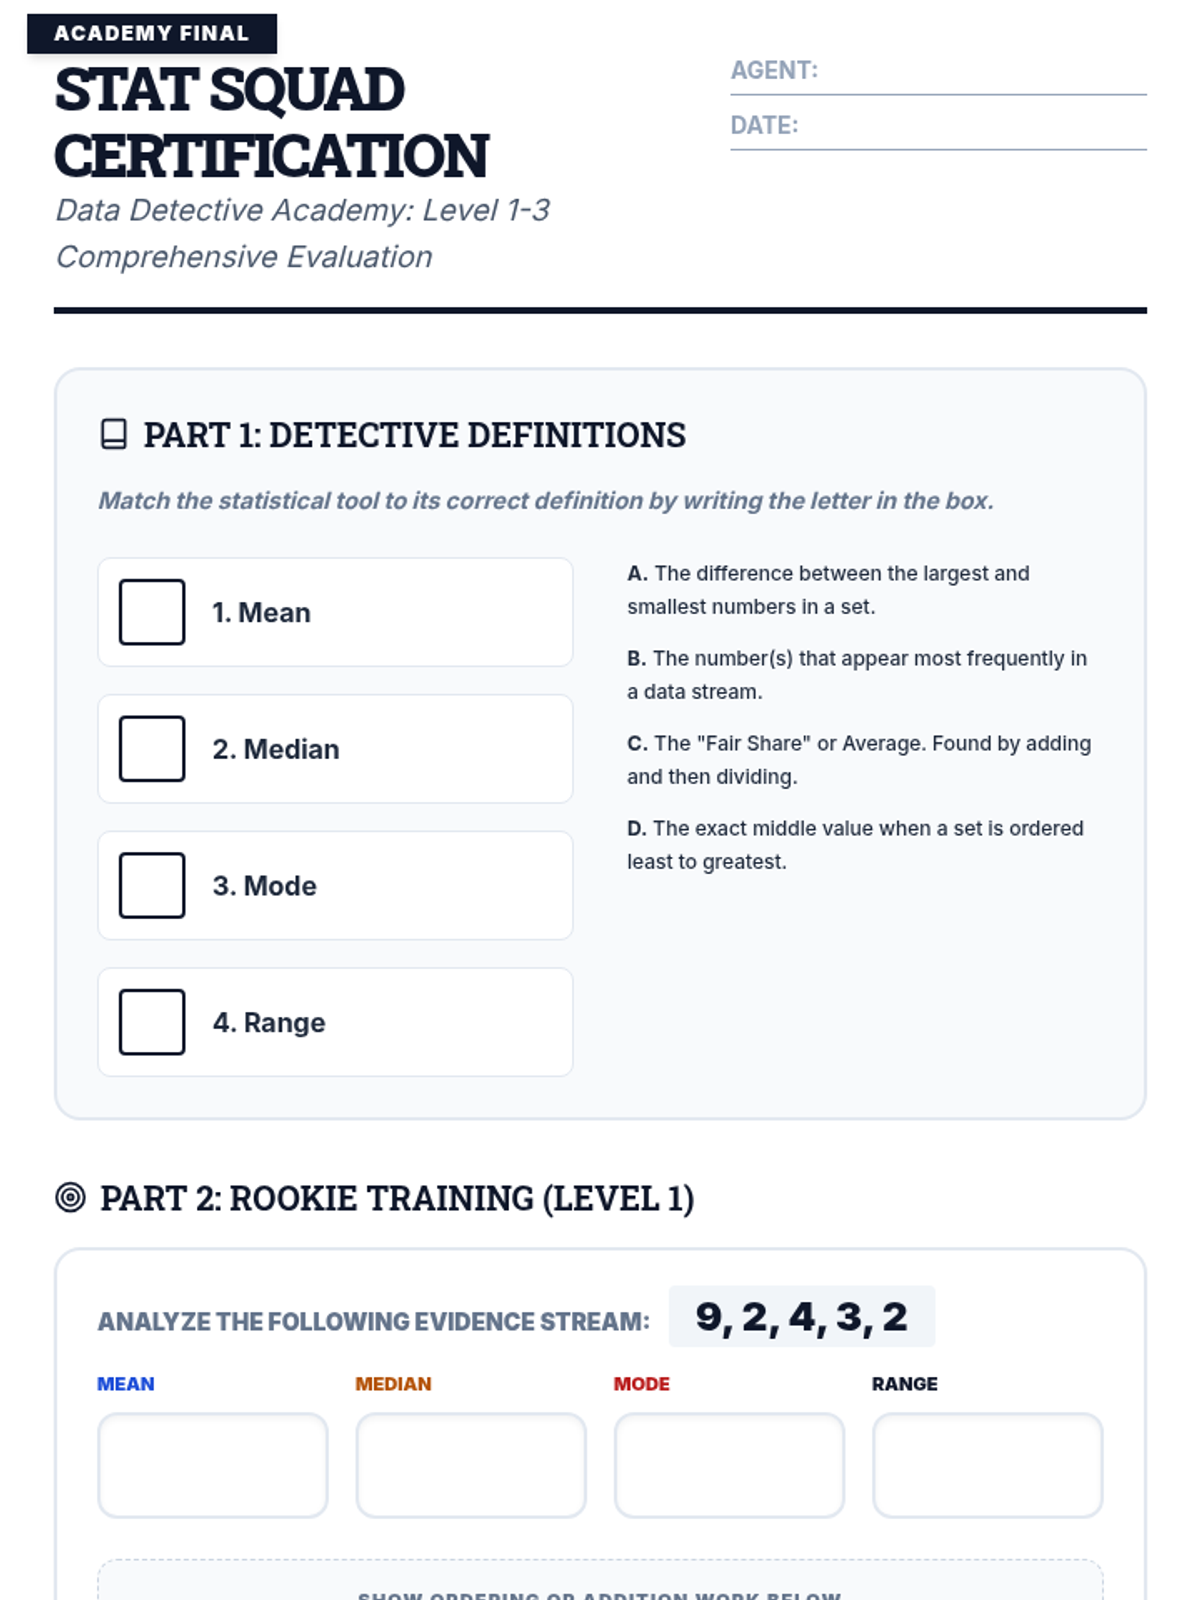
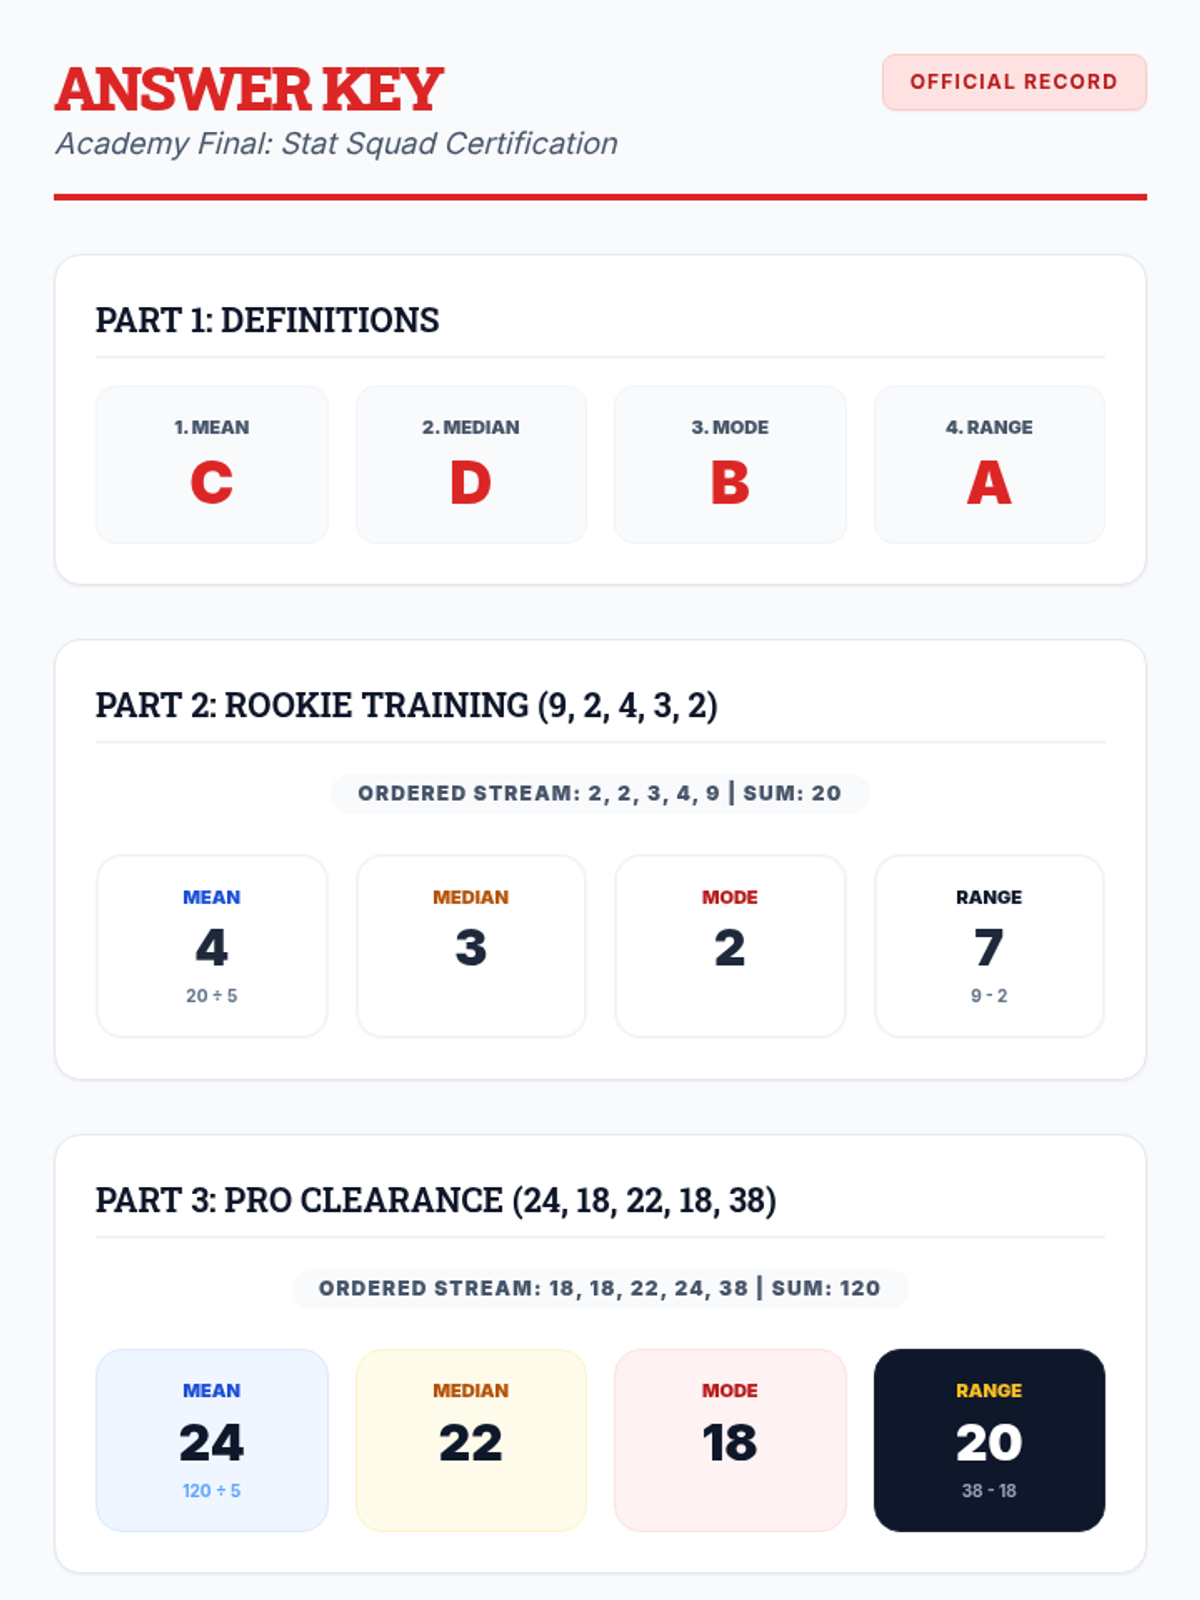
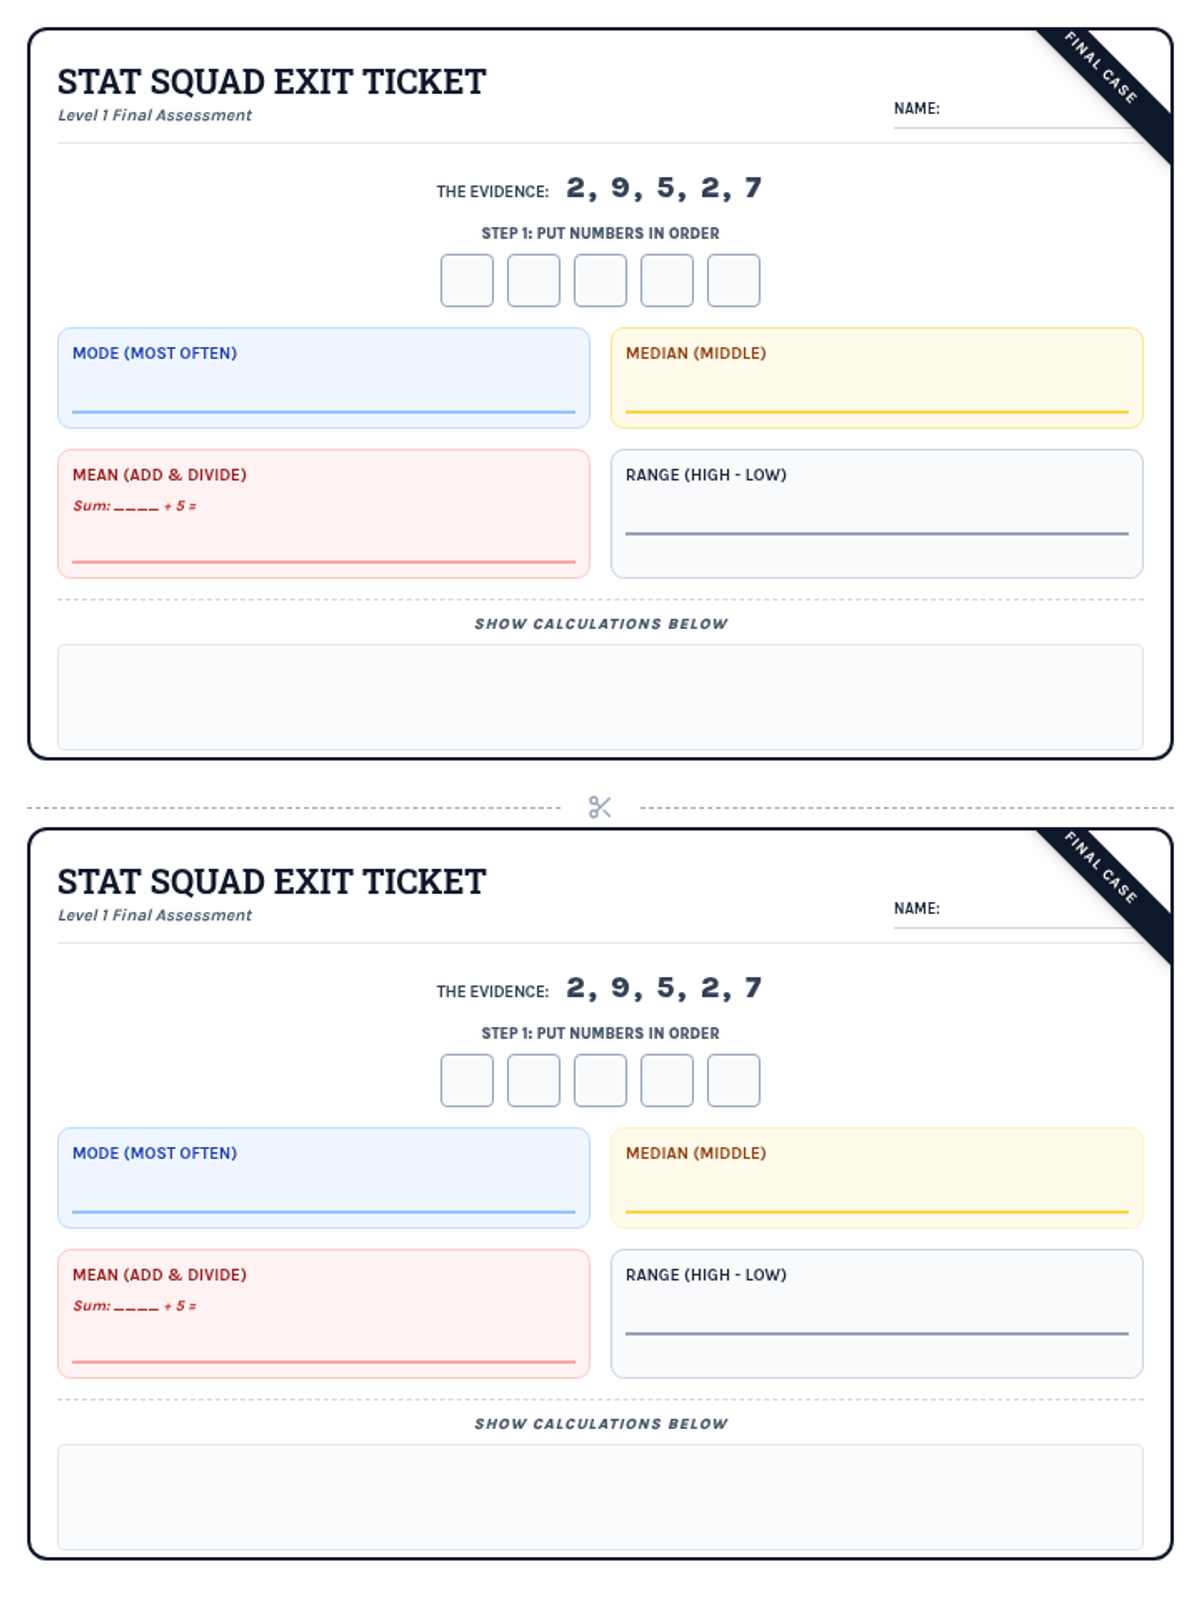
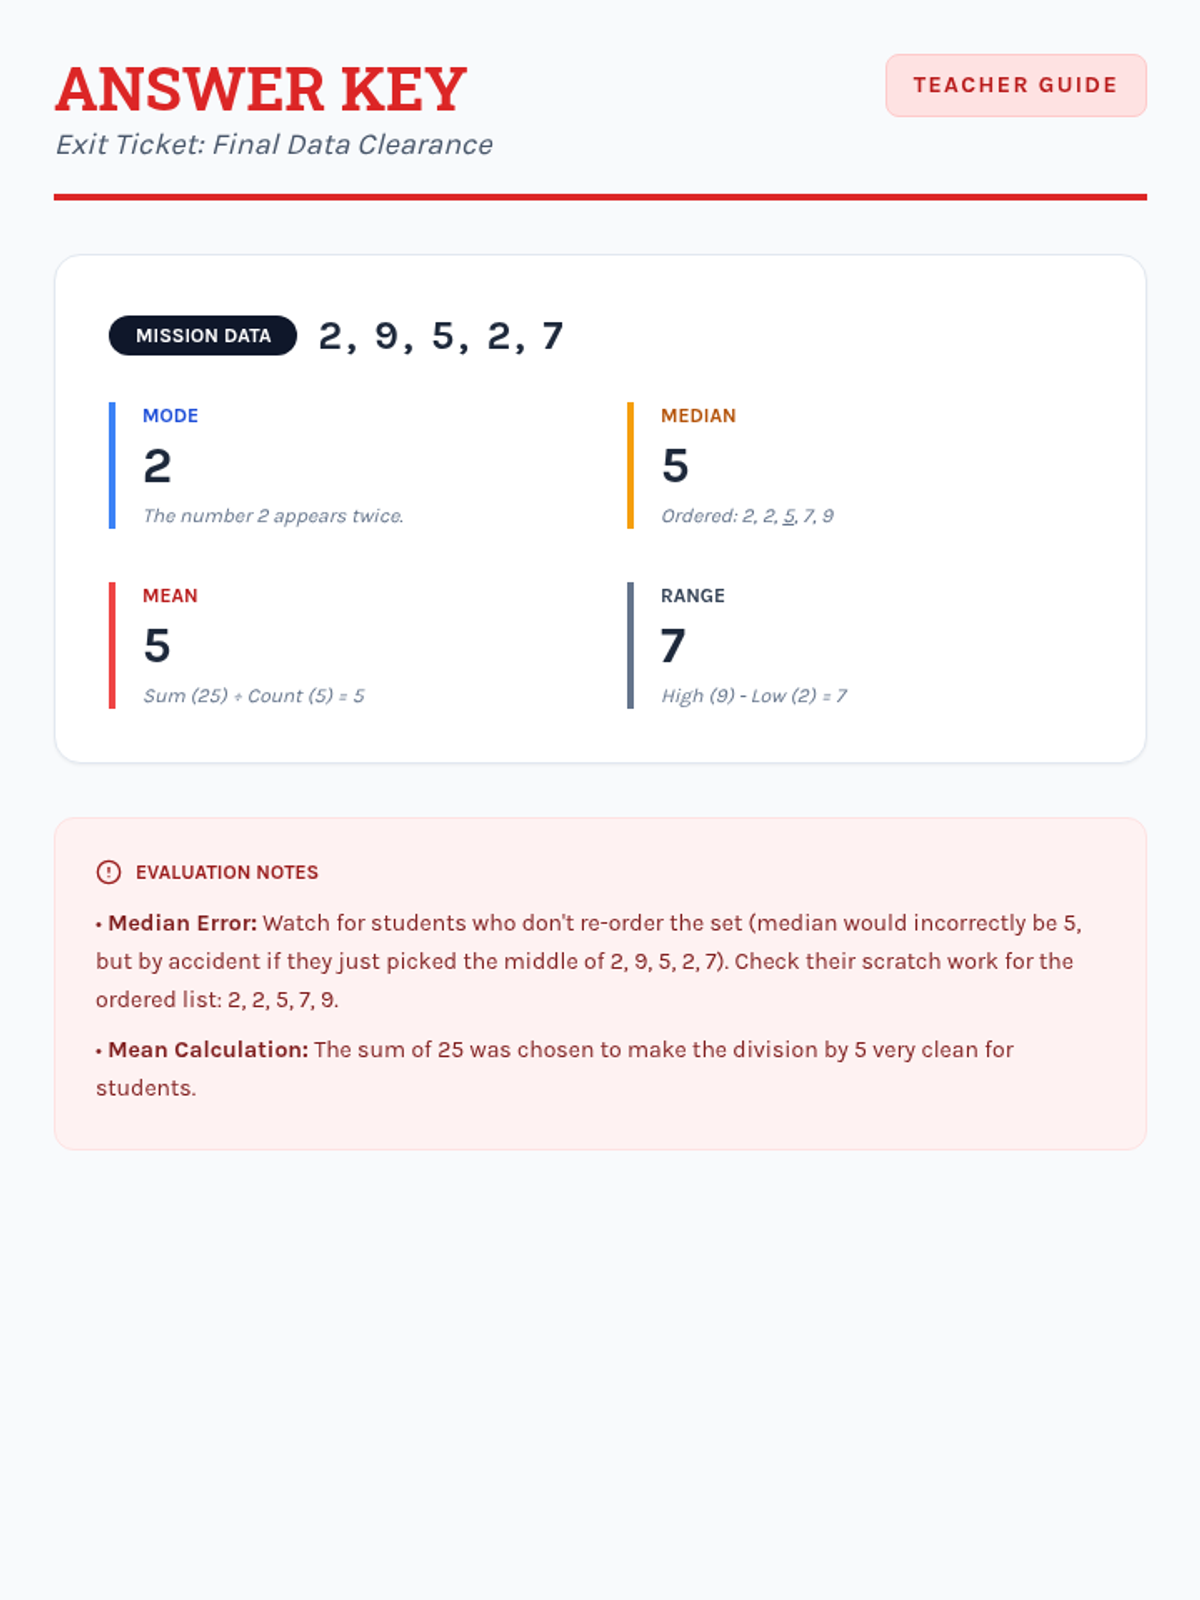
A comprehensive assessment covering Level 1, Level 2, and Level 3 data analysis, designed to evaluate mastery of mean, median, mode, and range in both numerical and narrative contexts.
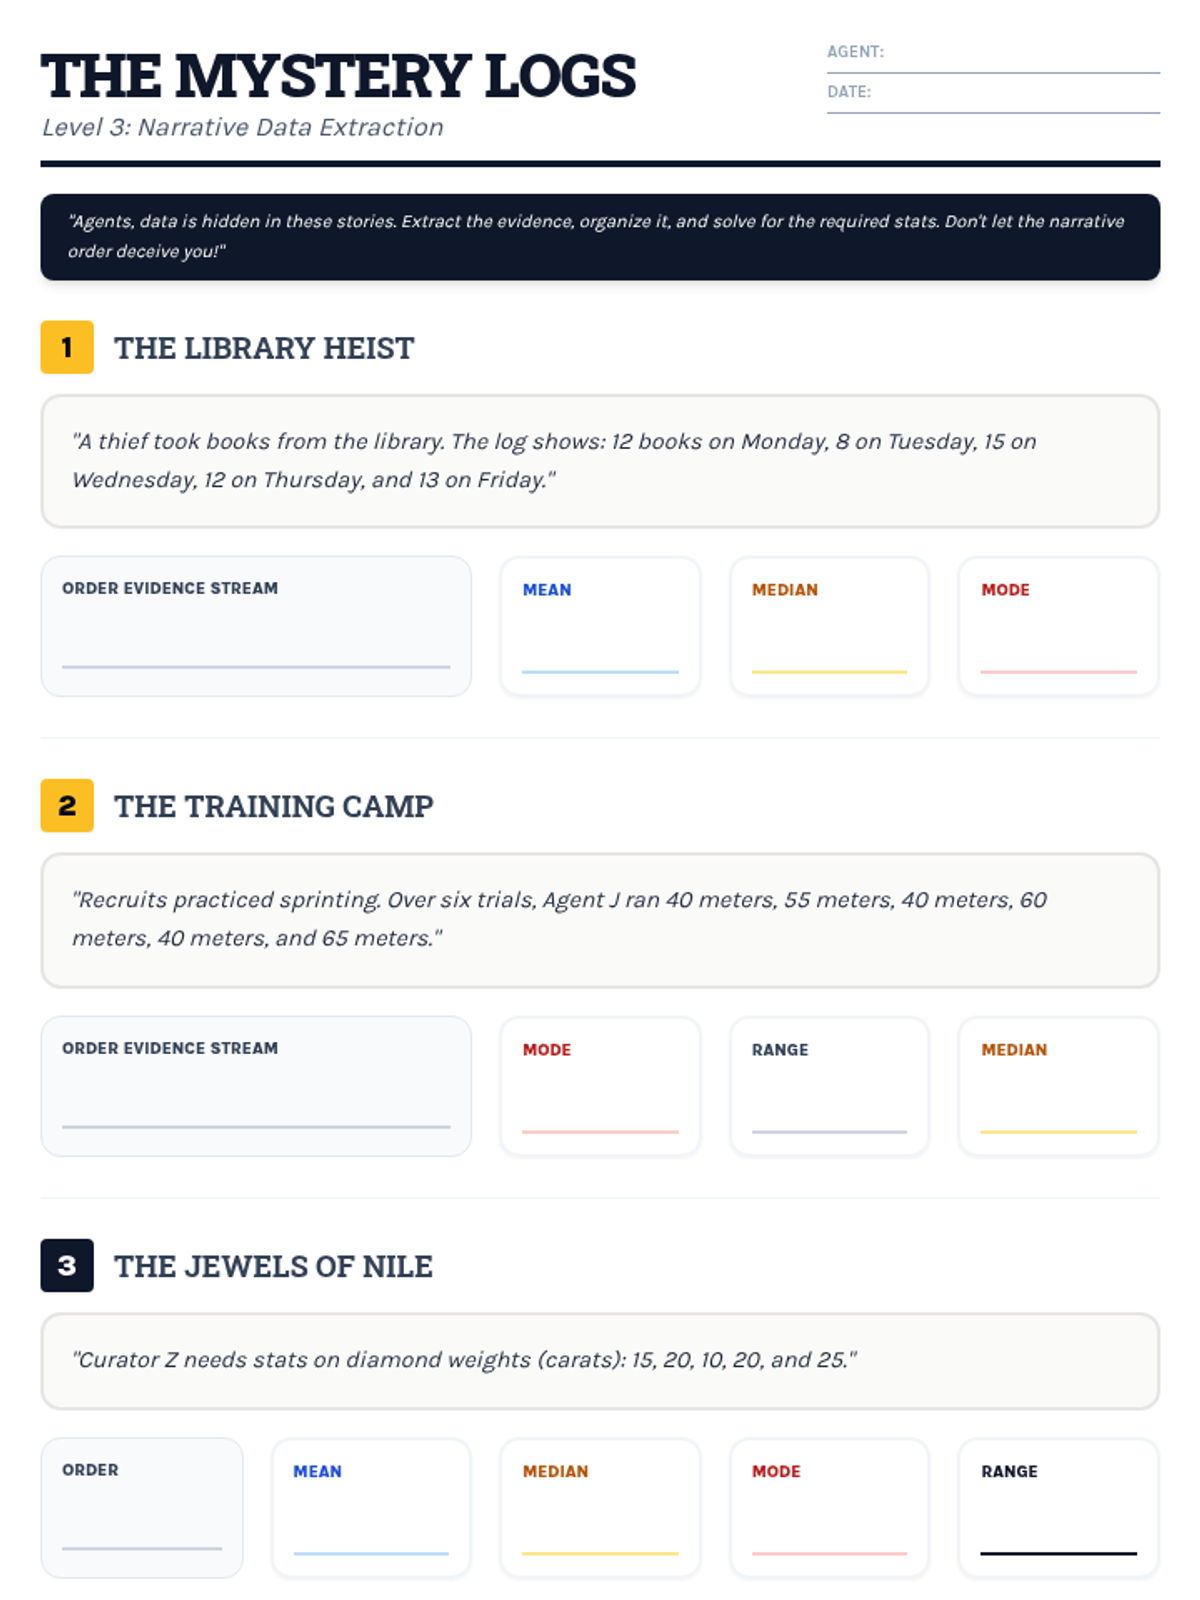
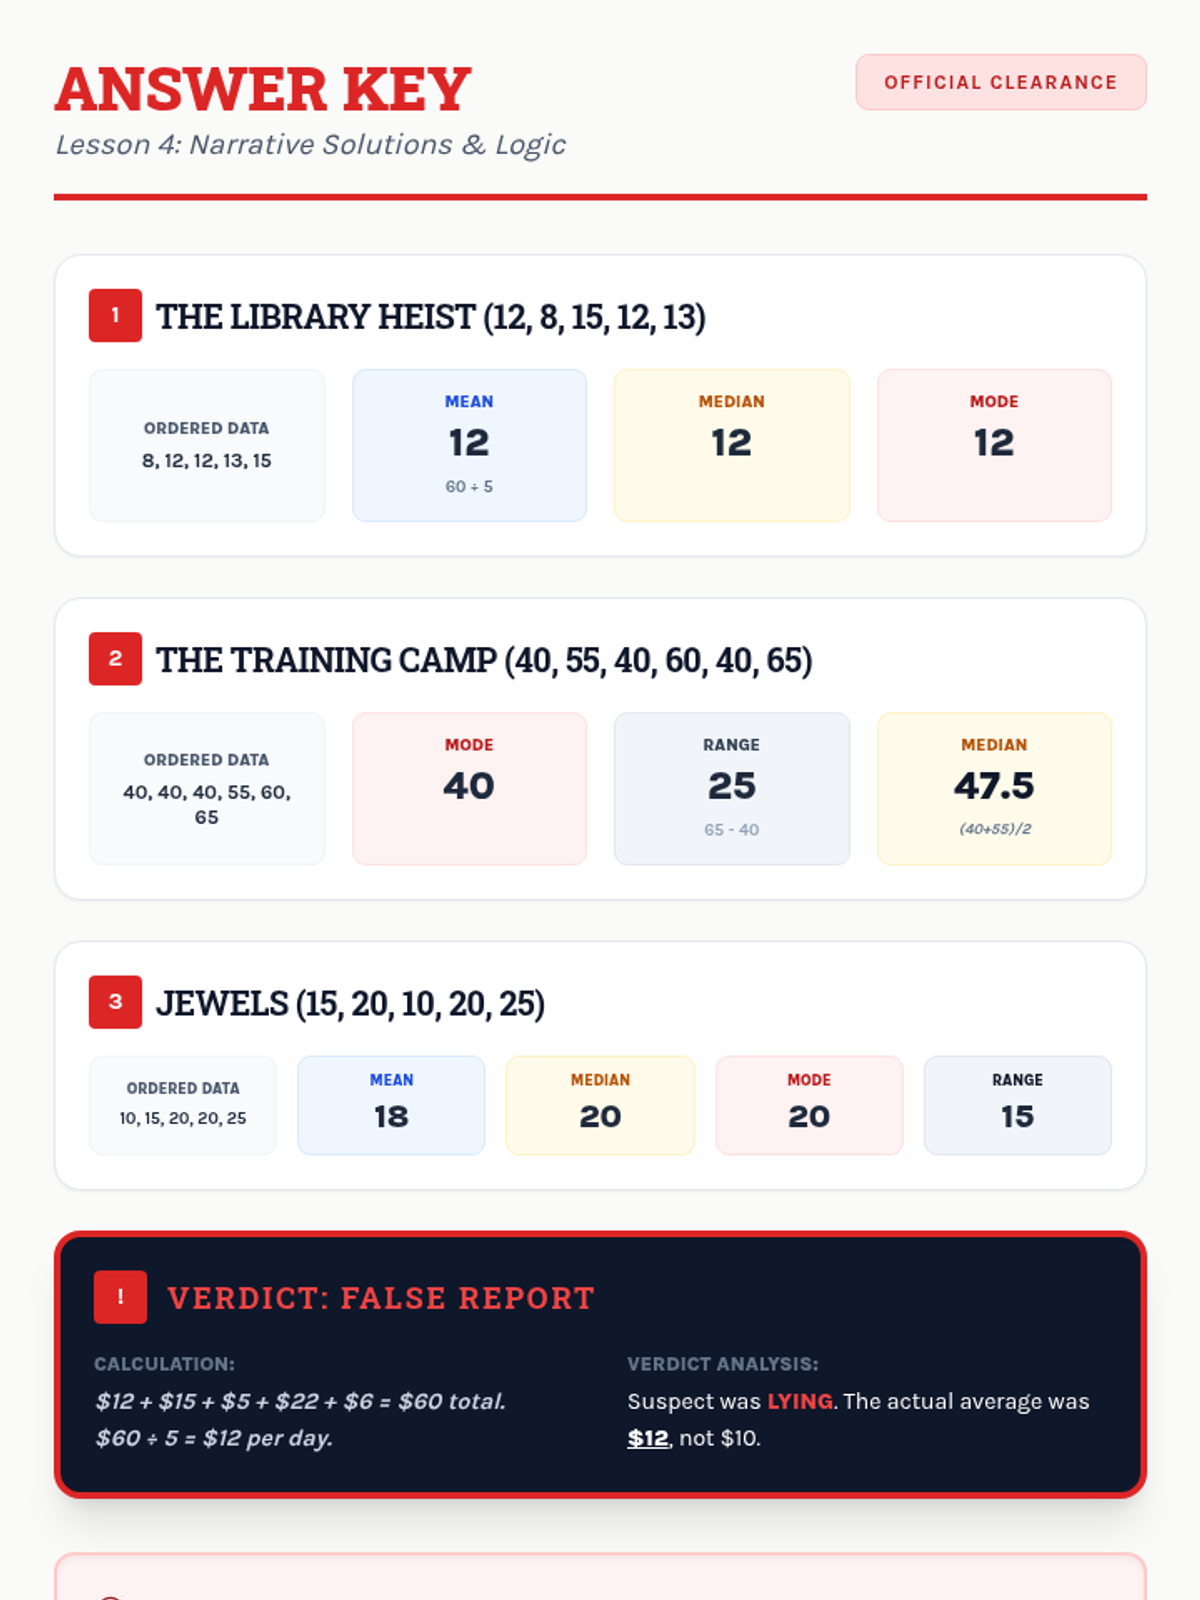
Students interpret and solve word problems involving mean, median, mode, and range, focusing on extracting data from narrative contexts and real-world scenarios.
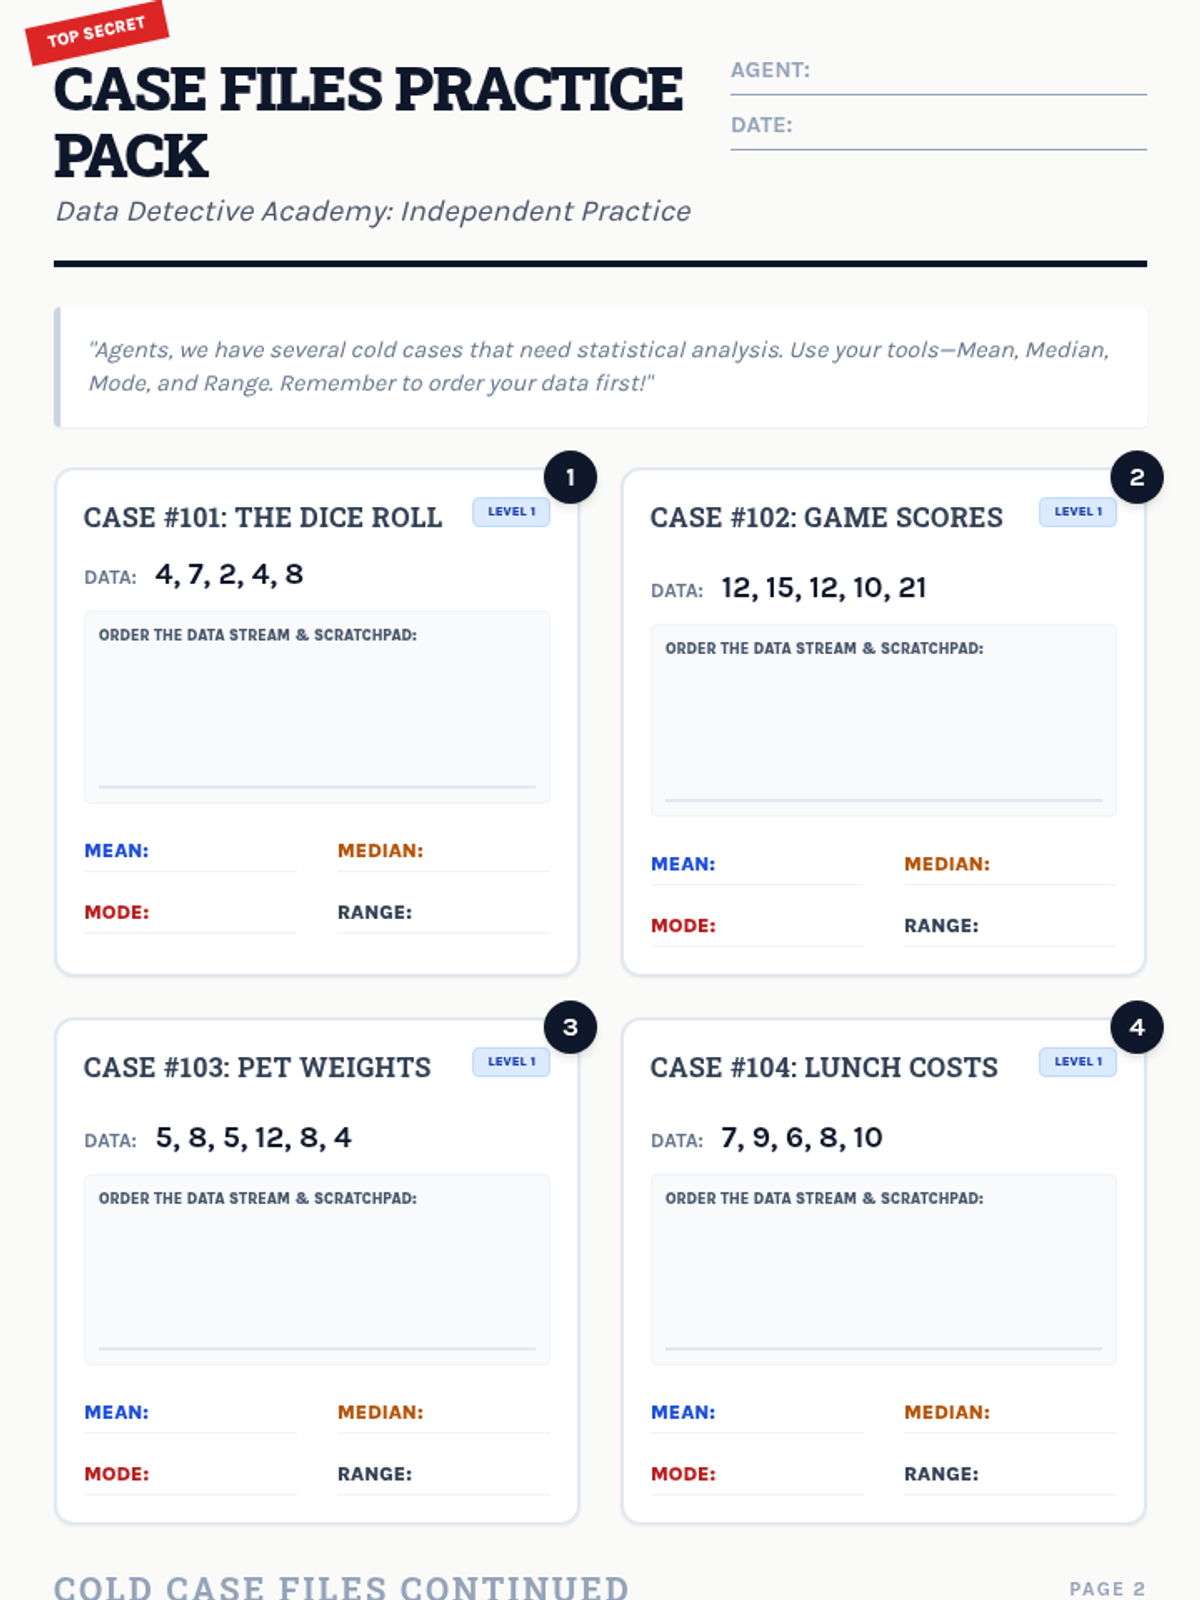
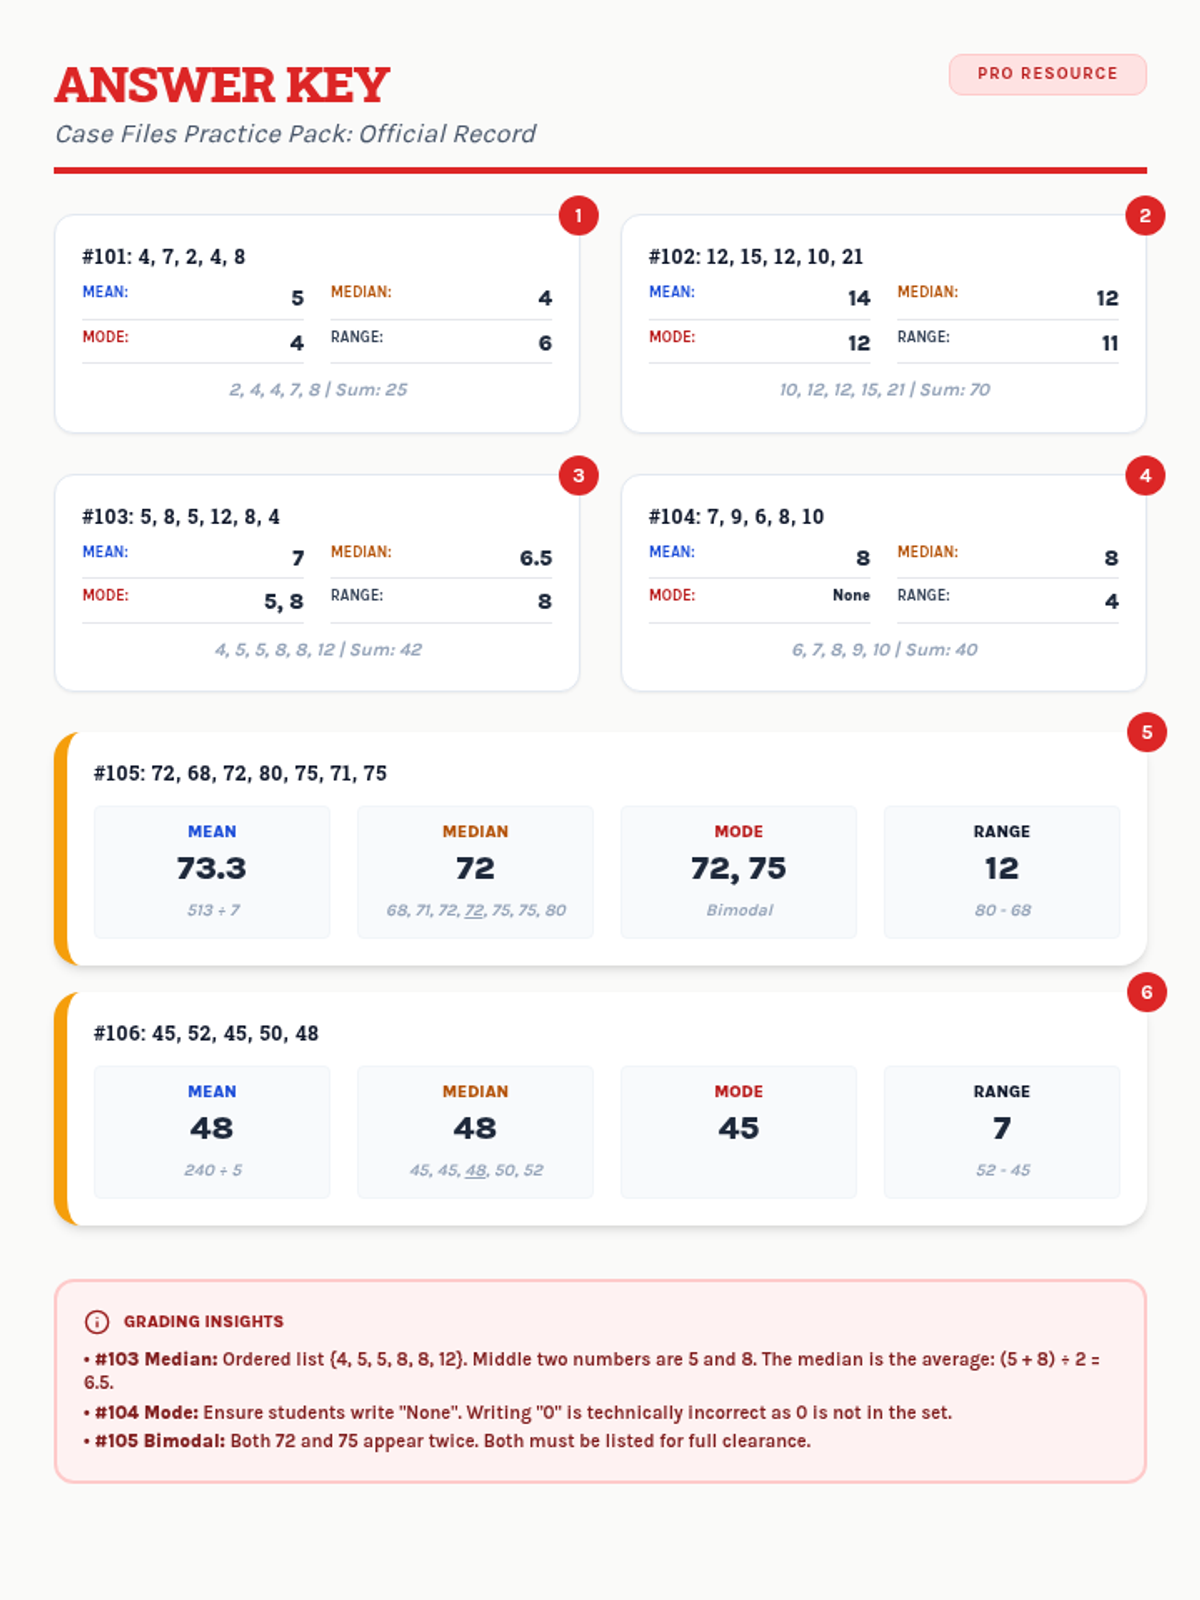
A collection of extra practice cases for mean, median, mode, and range, ranging from single-digit warmups to double-digit challenges, themed as unsolved detective files.
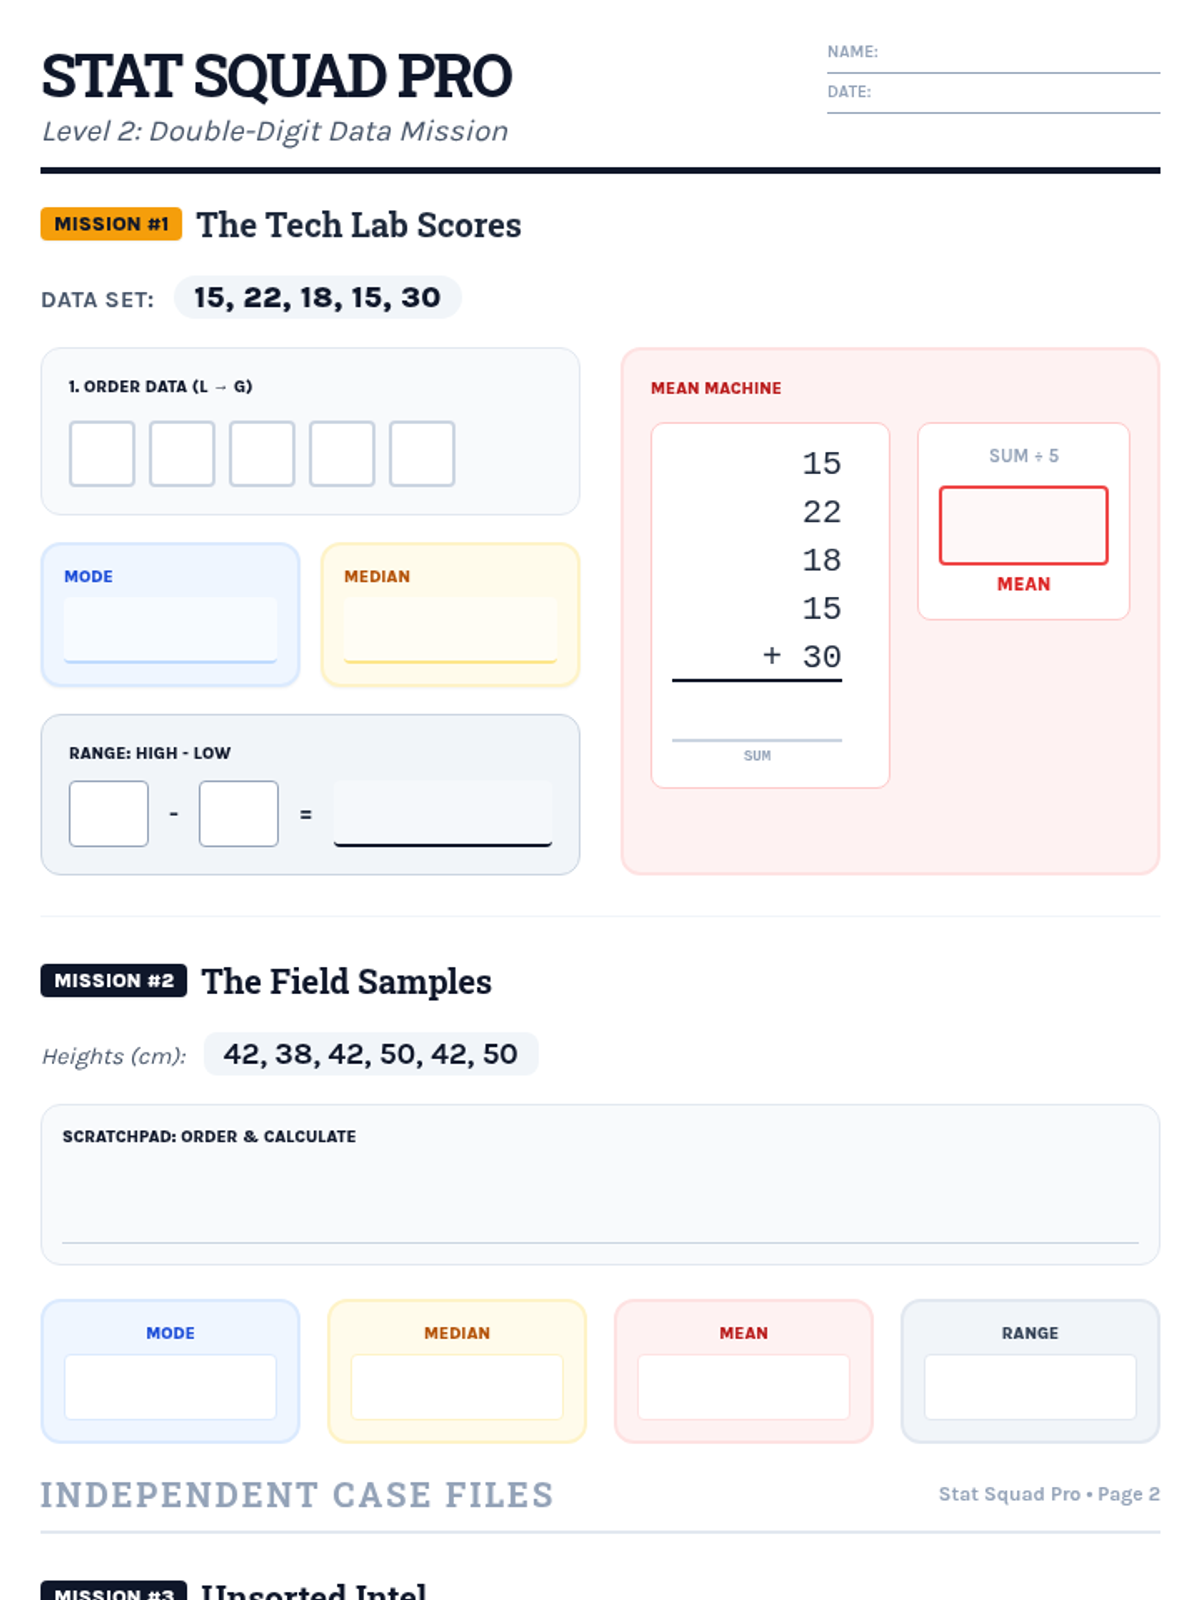
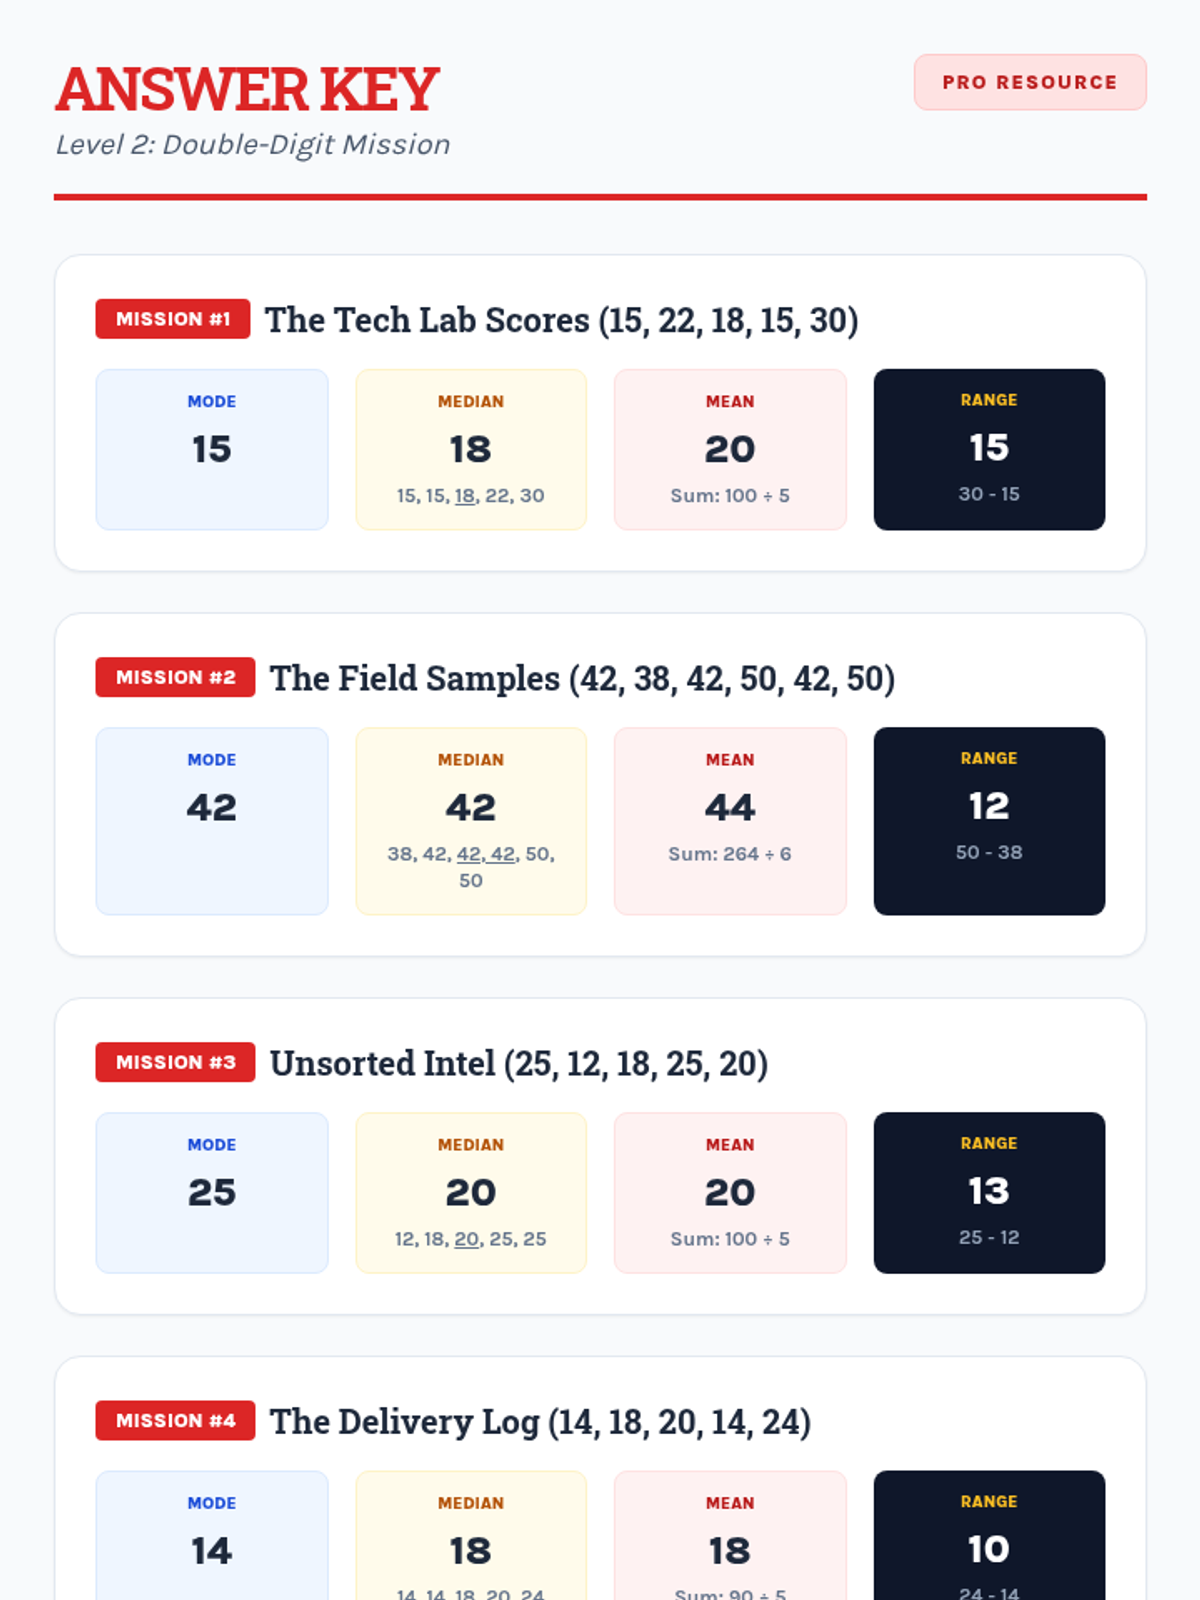
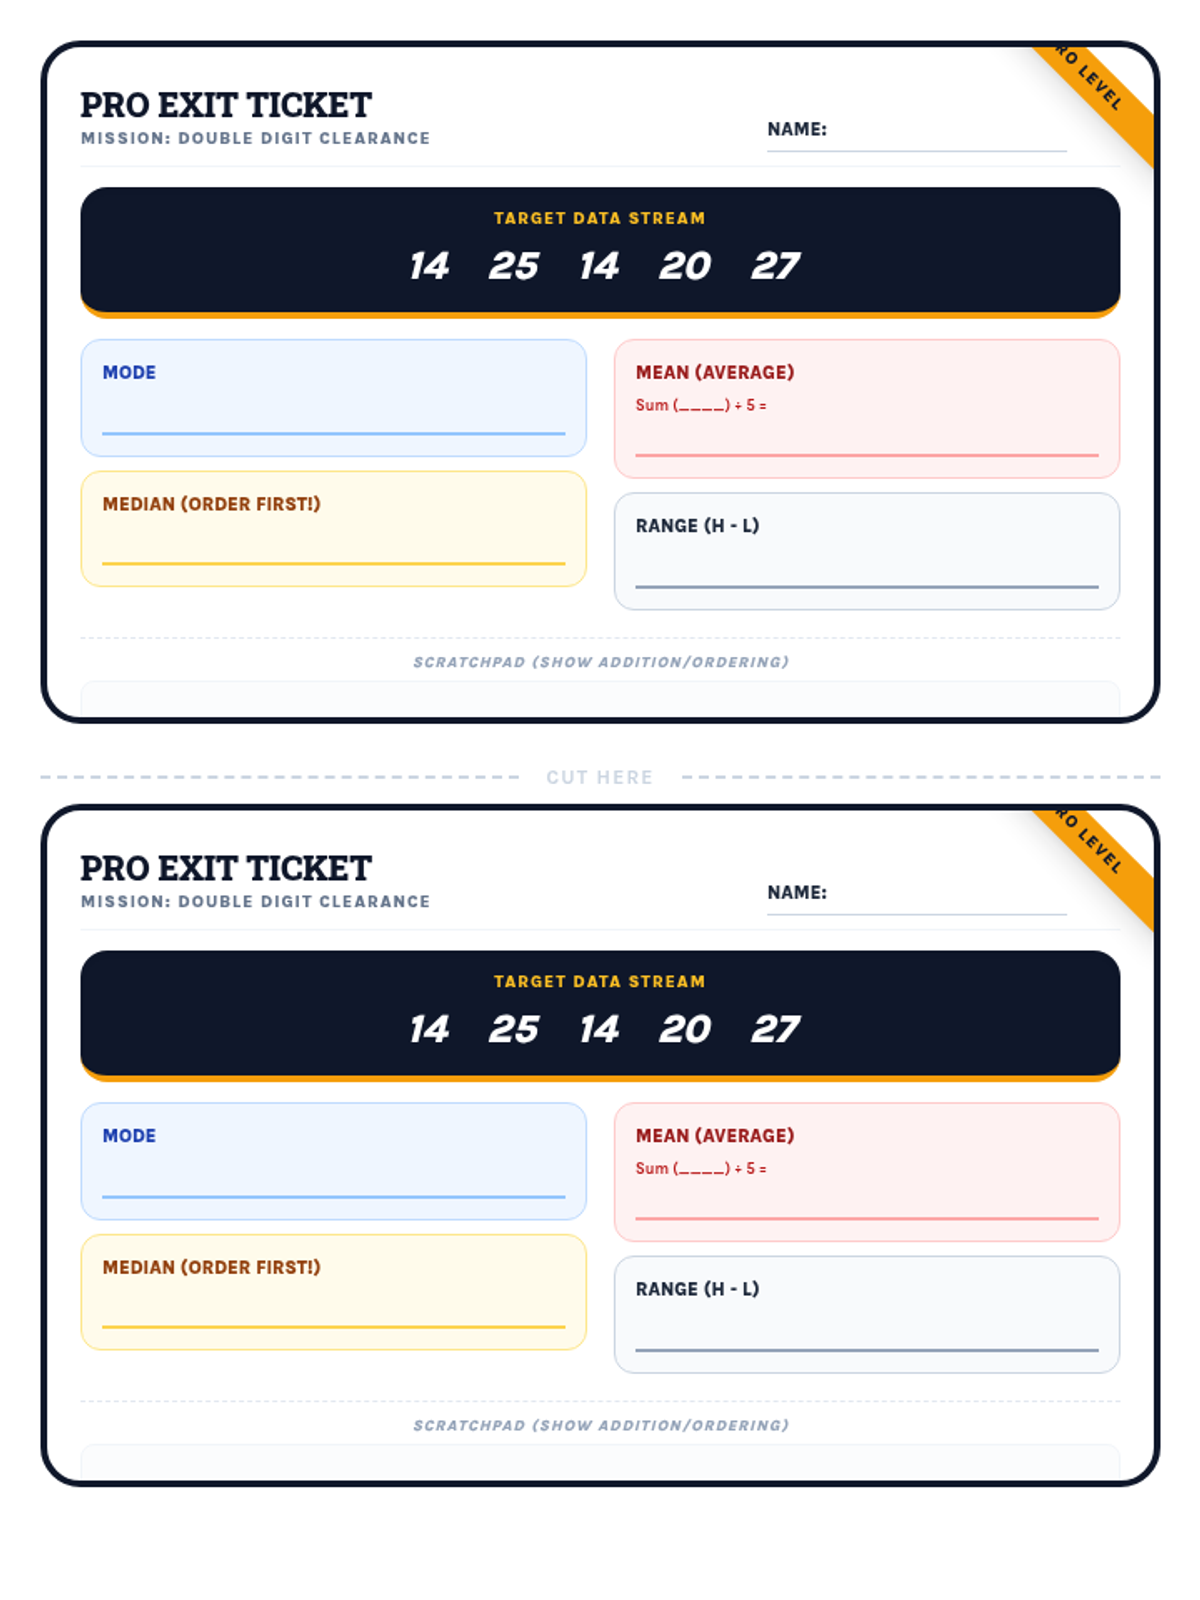
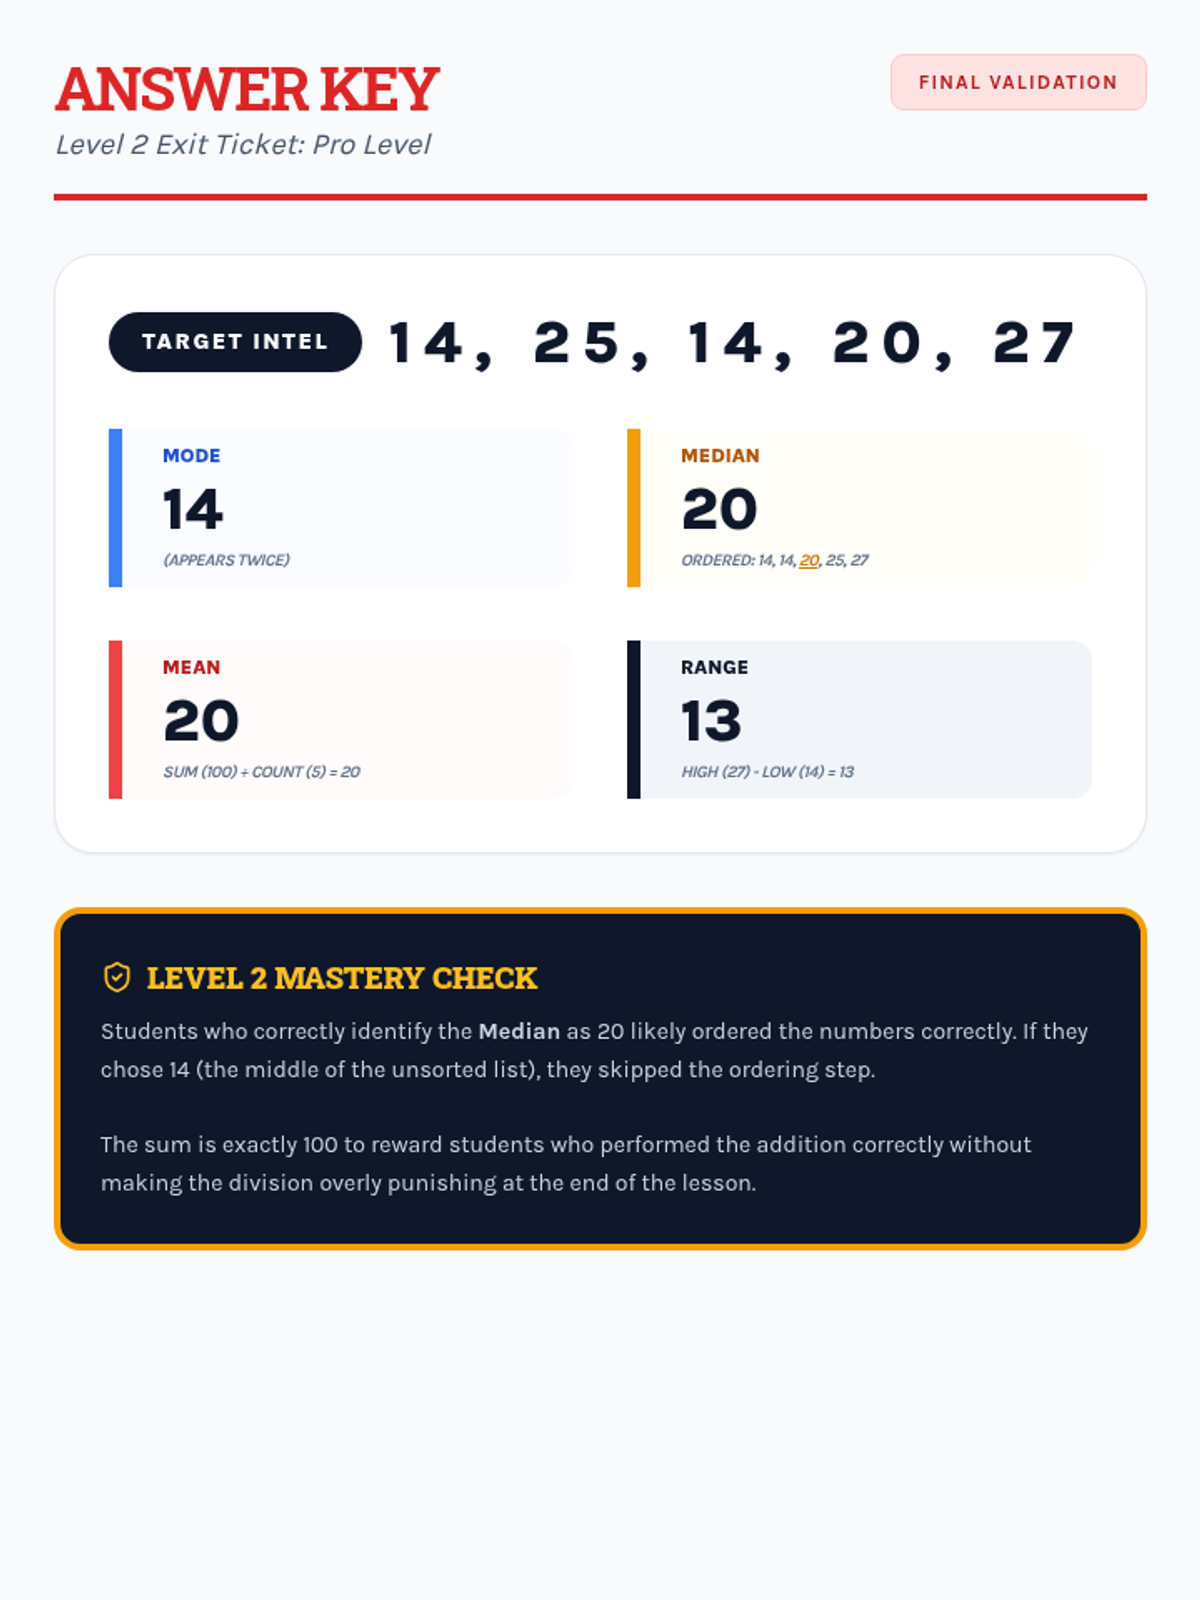
Students apply their knowledge of mean, median, mode, and range to data sets featuring two-digit numbers, focusing on multi-digit addition and division.
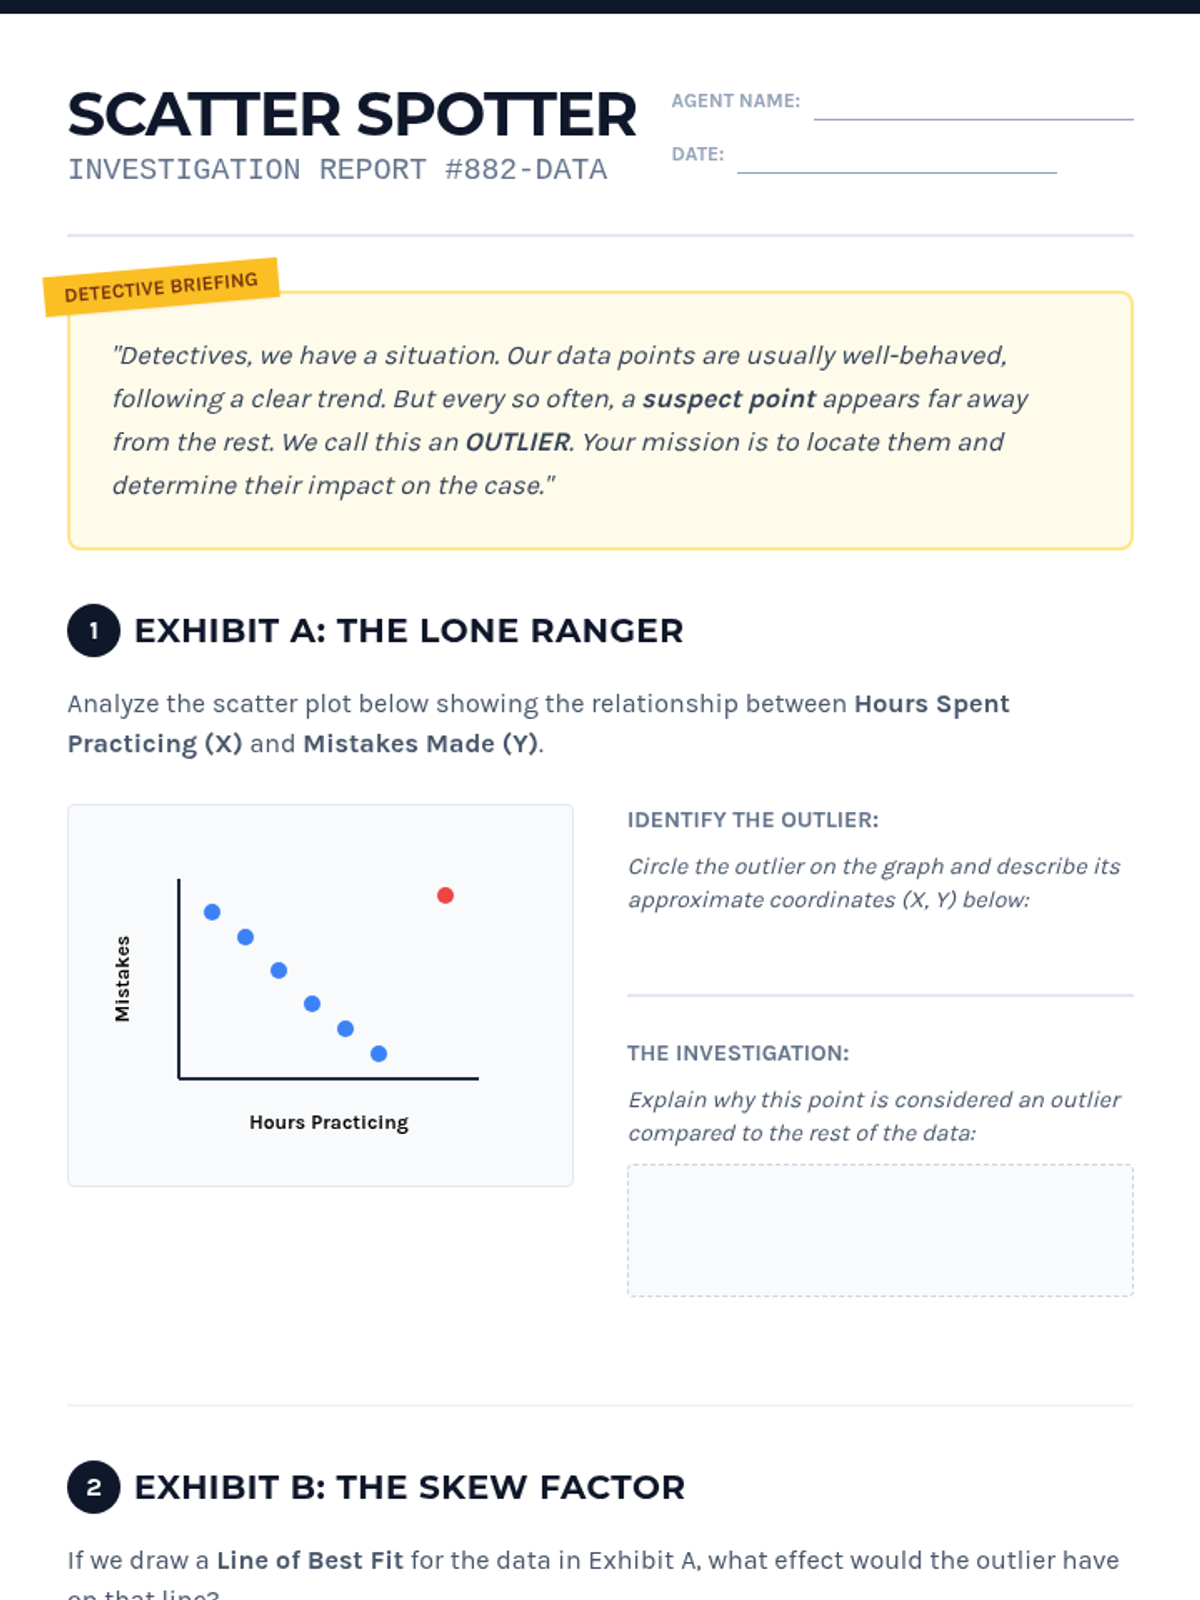
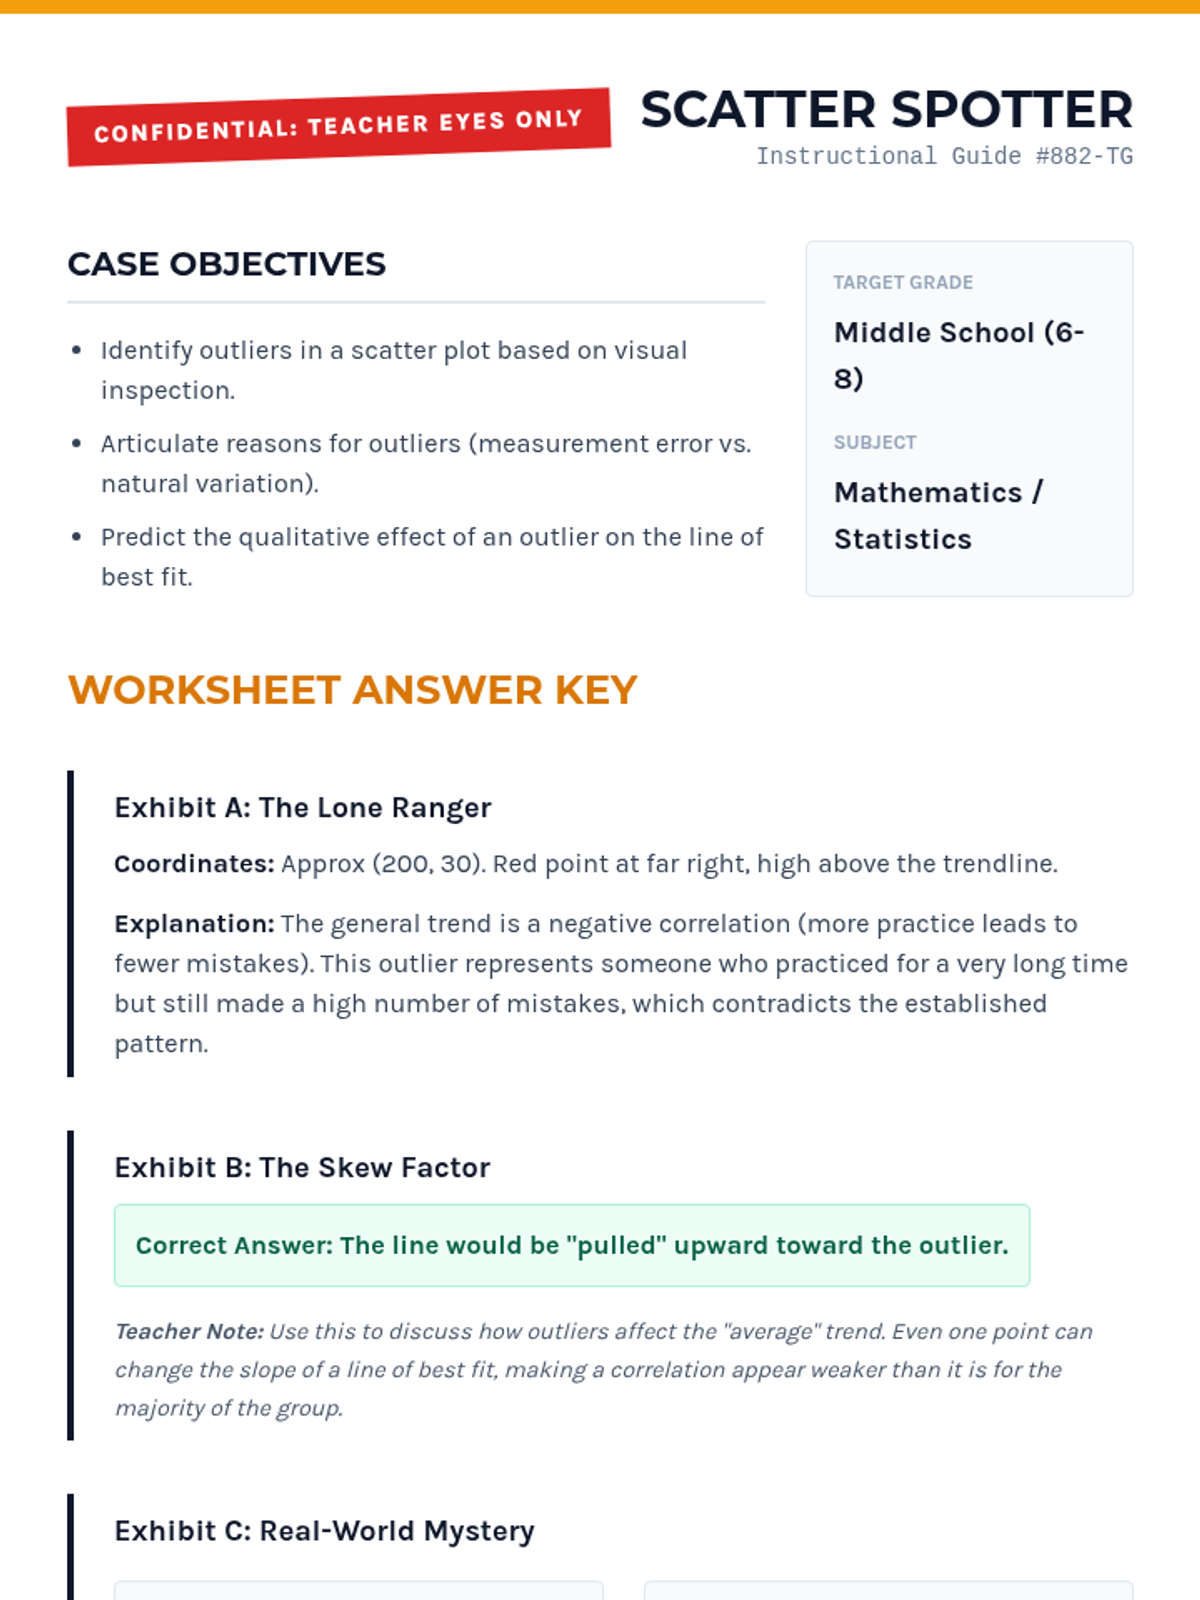
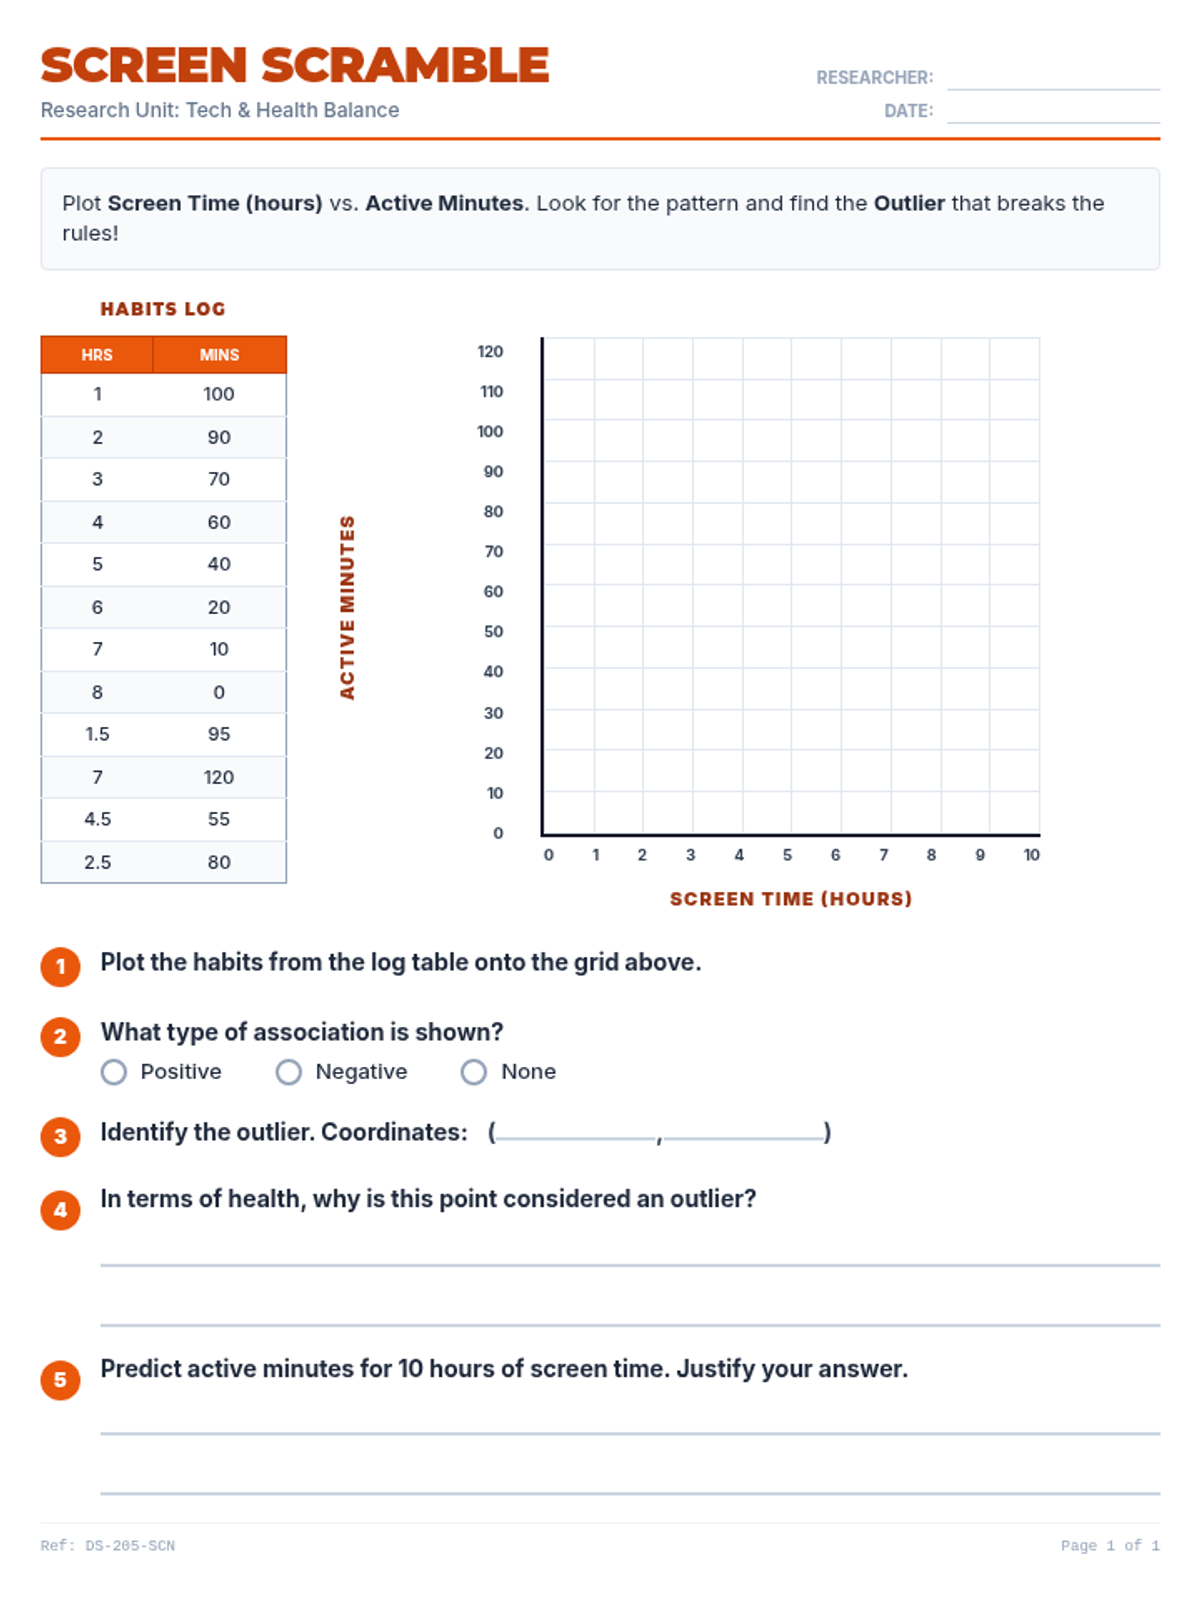
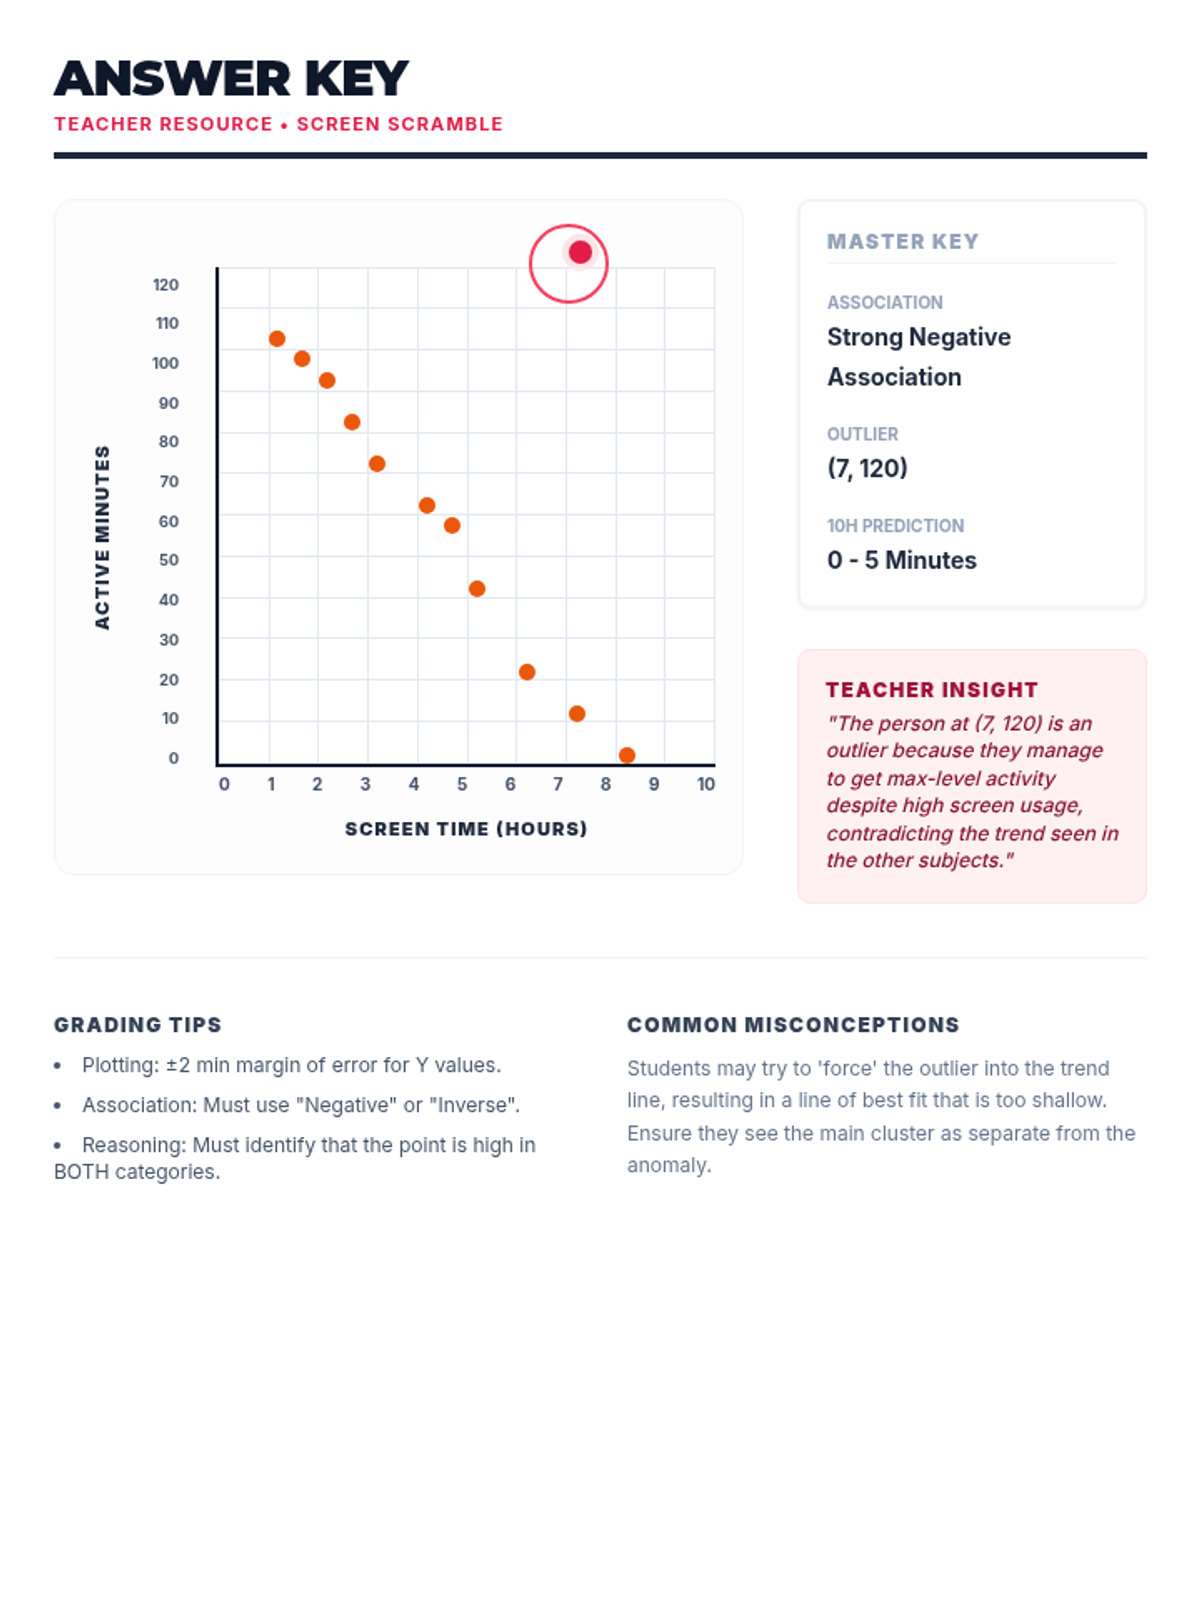
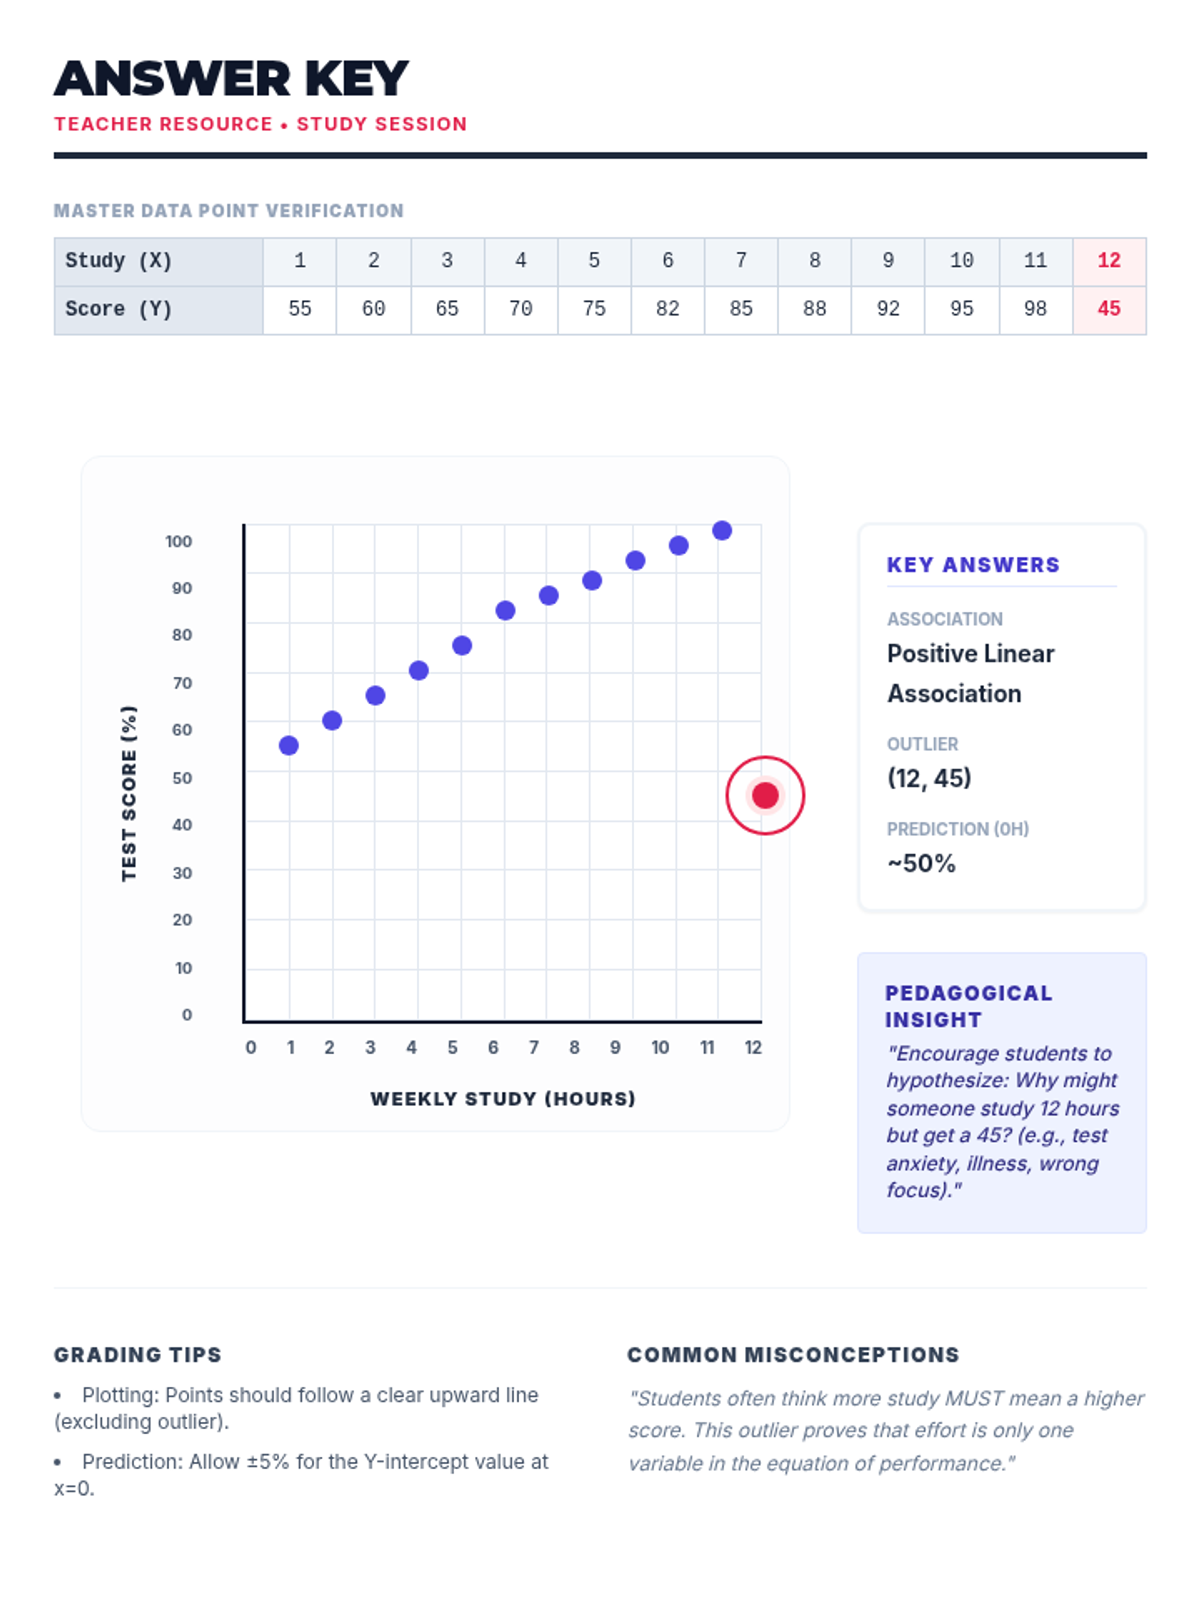
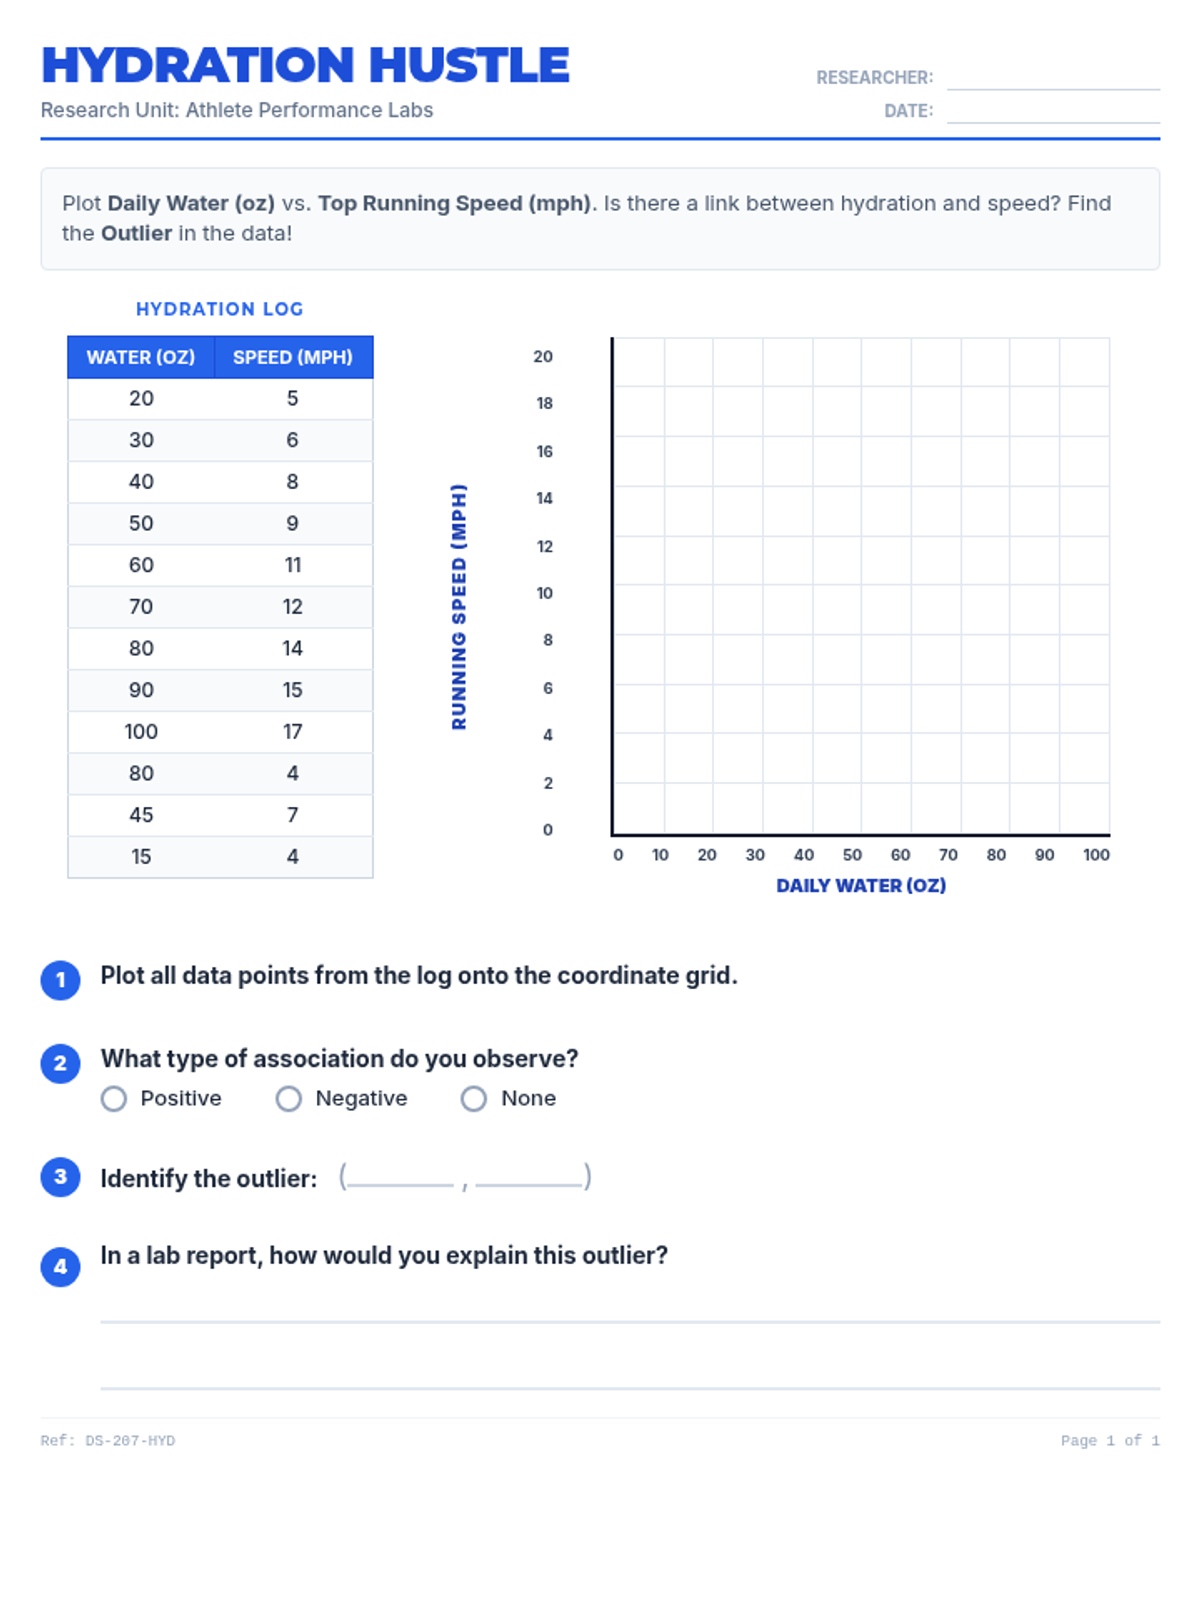
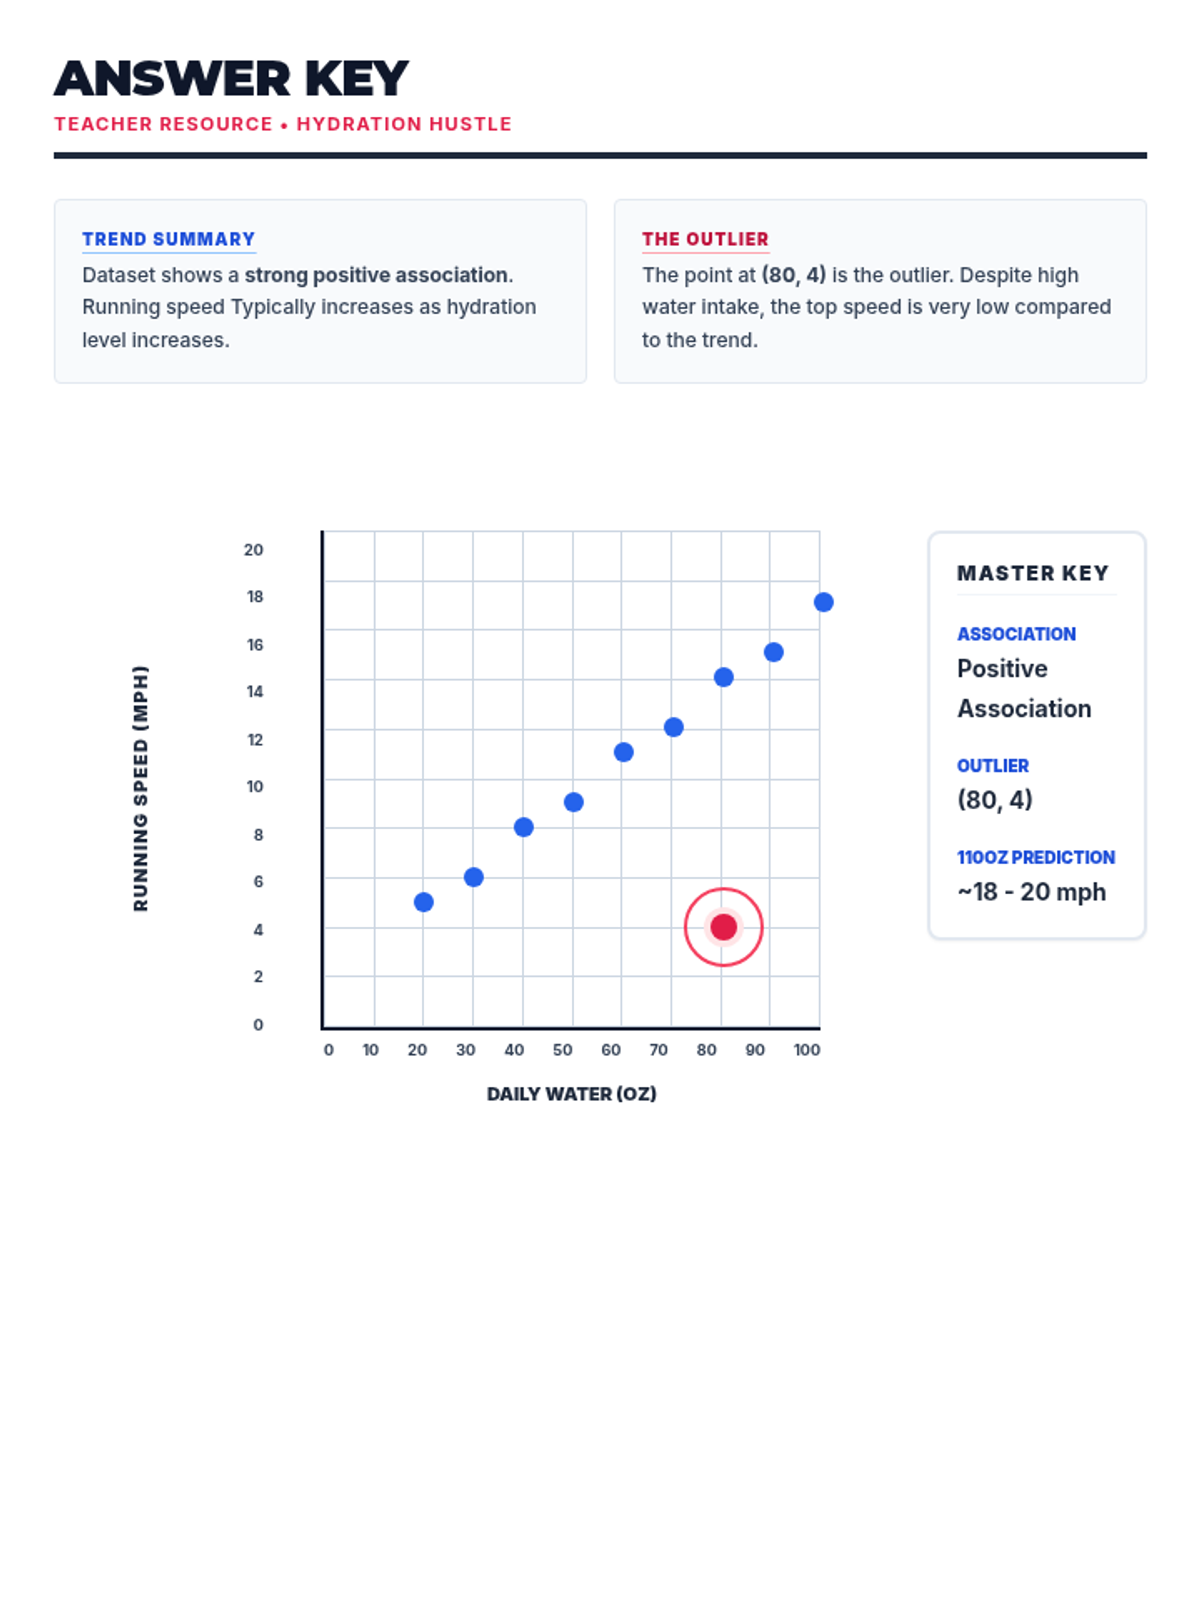
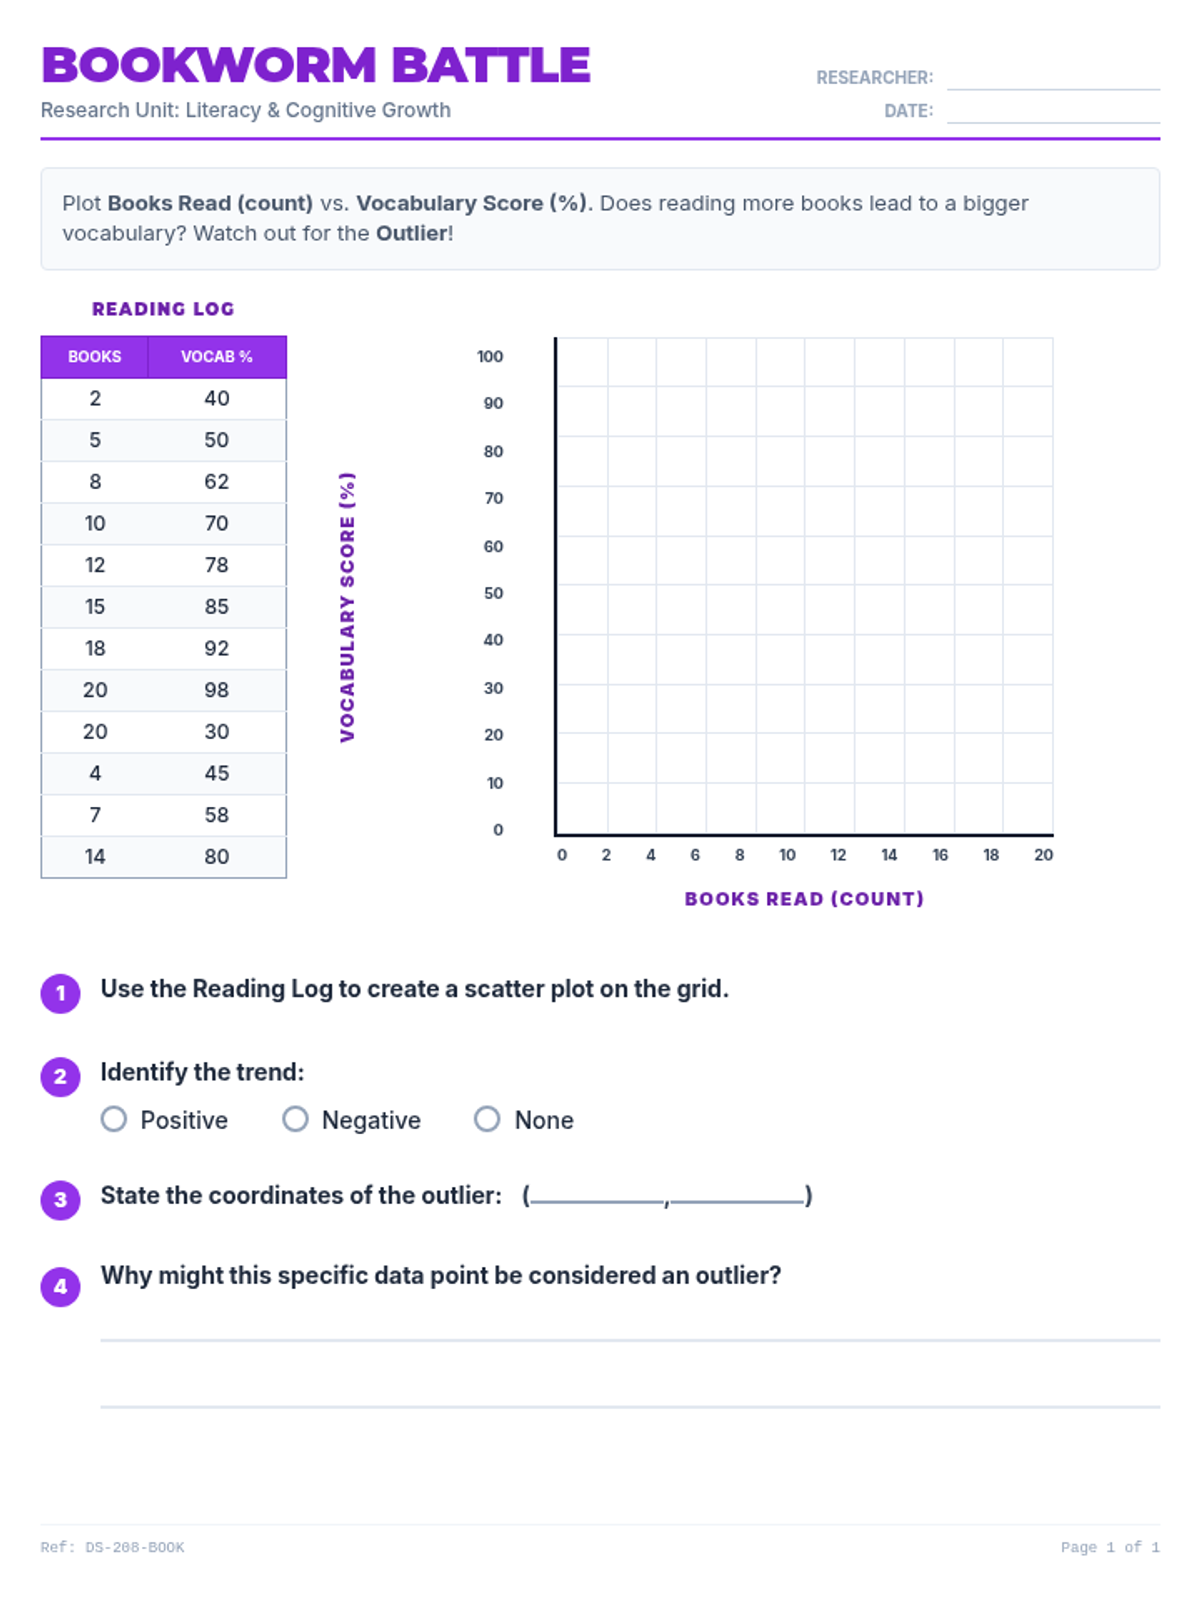
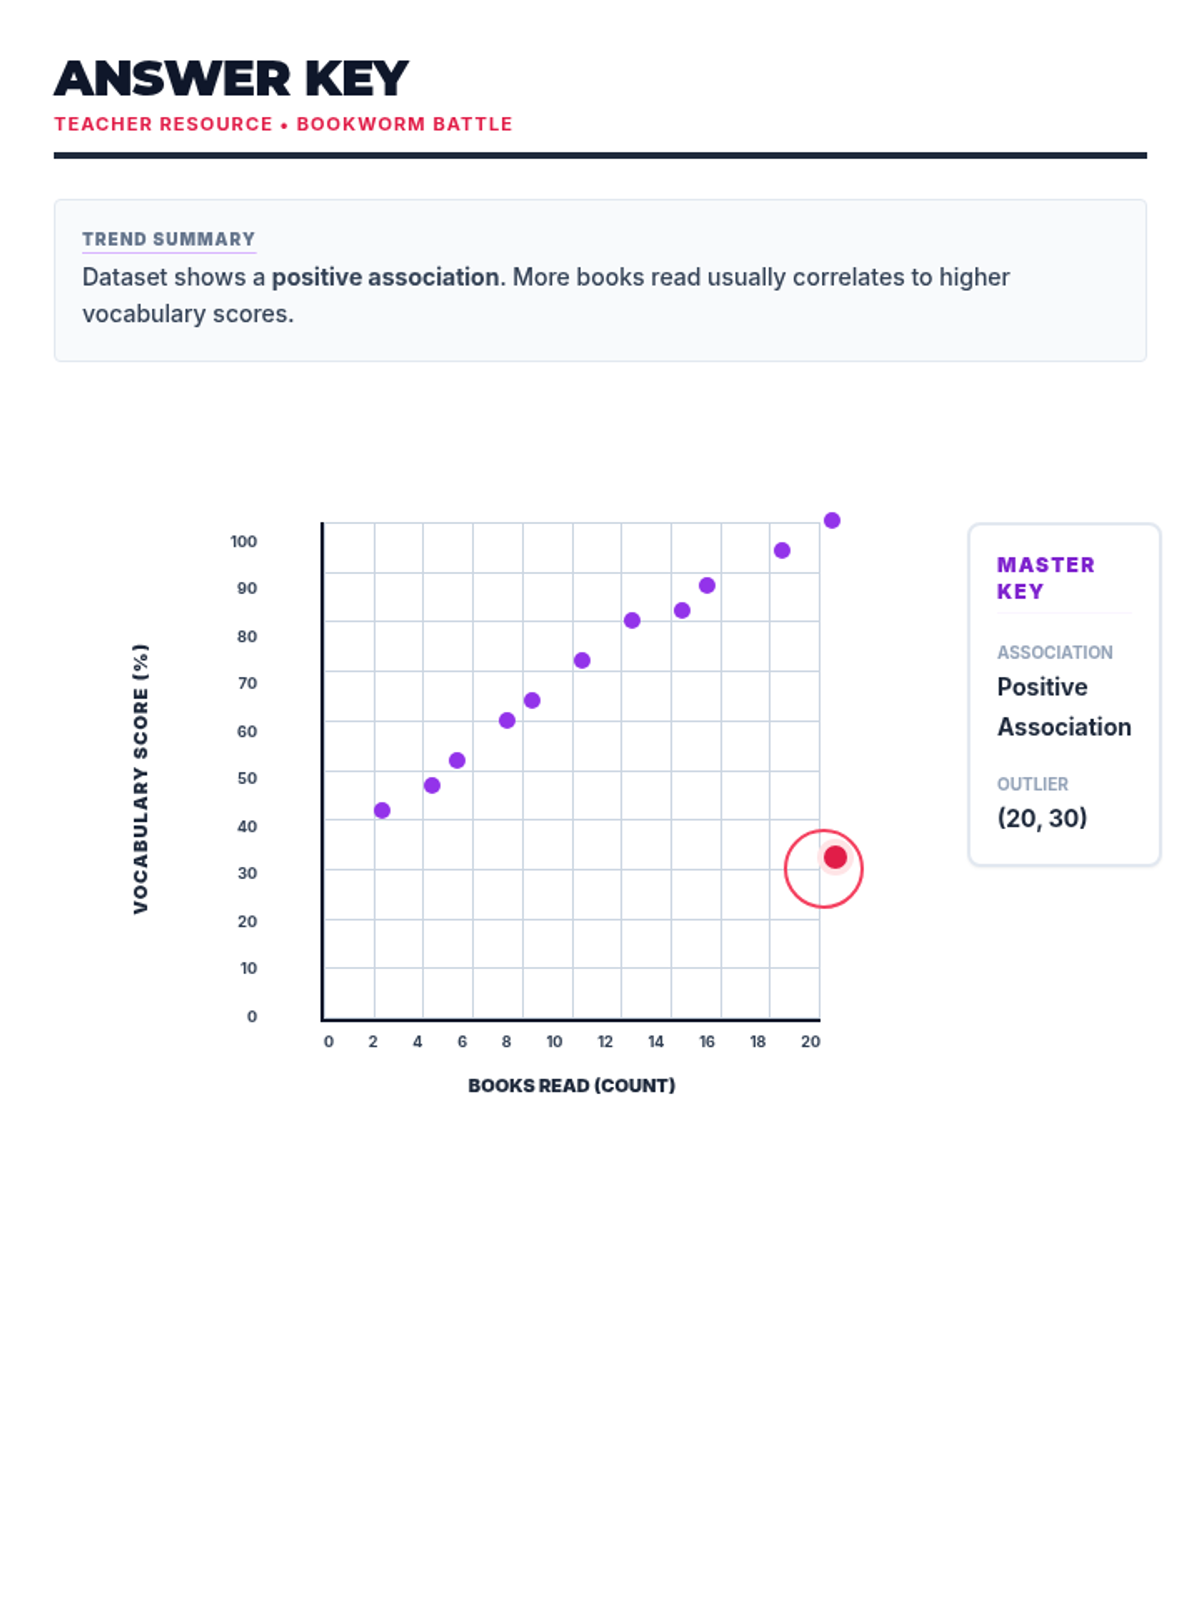
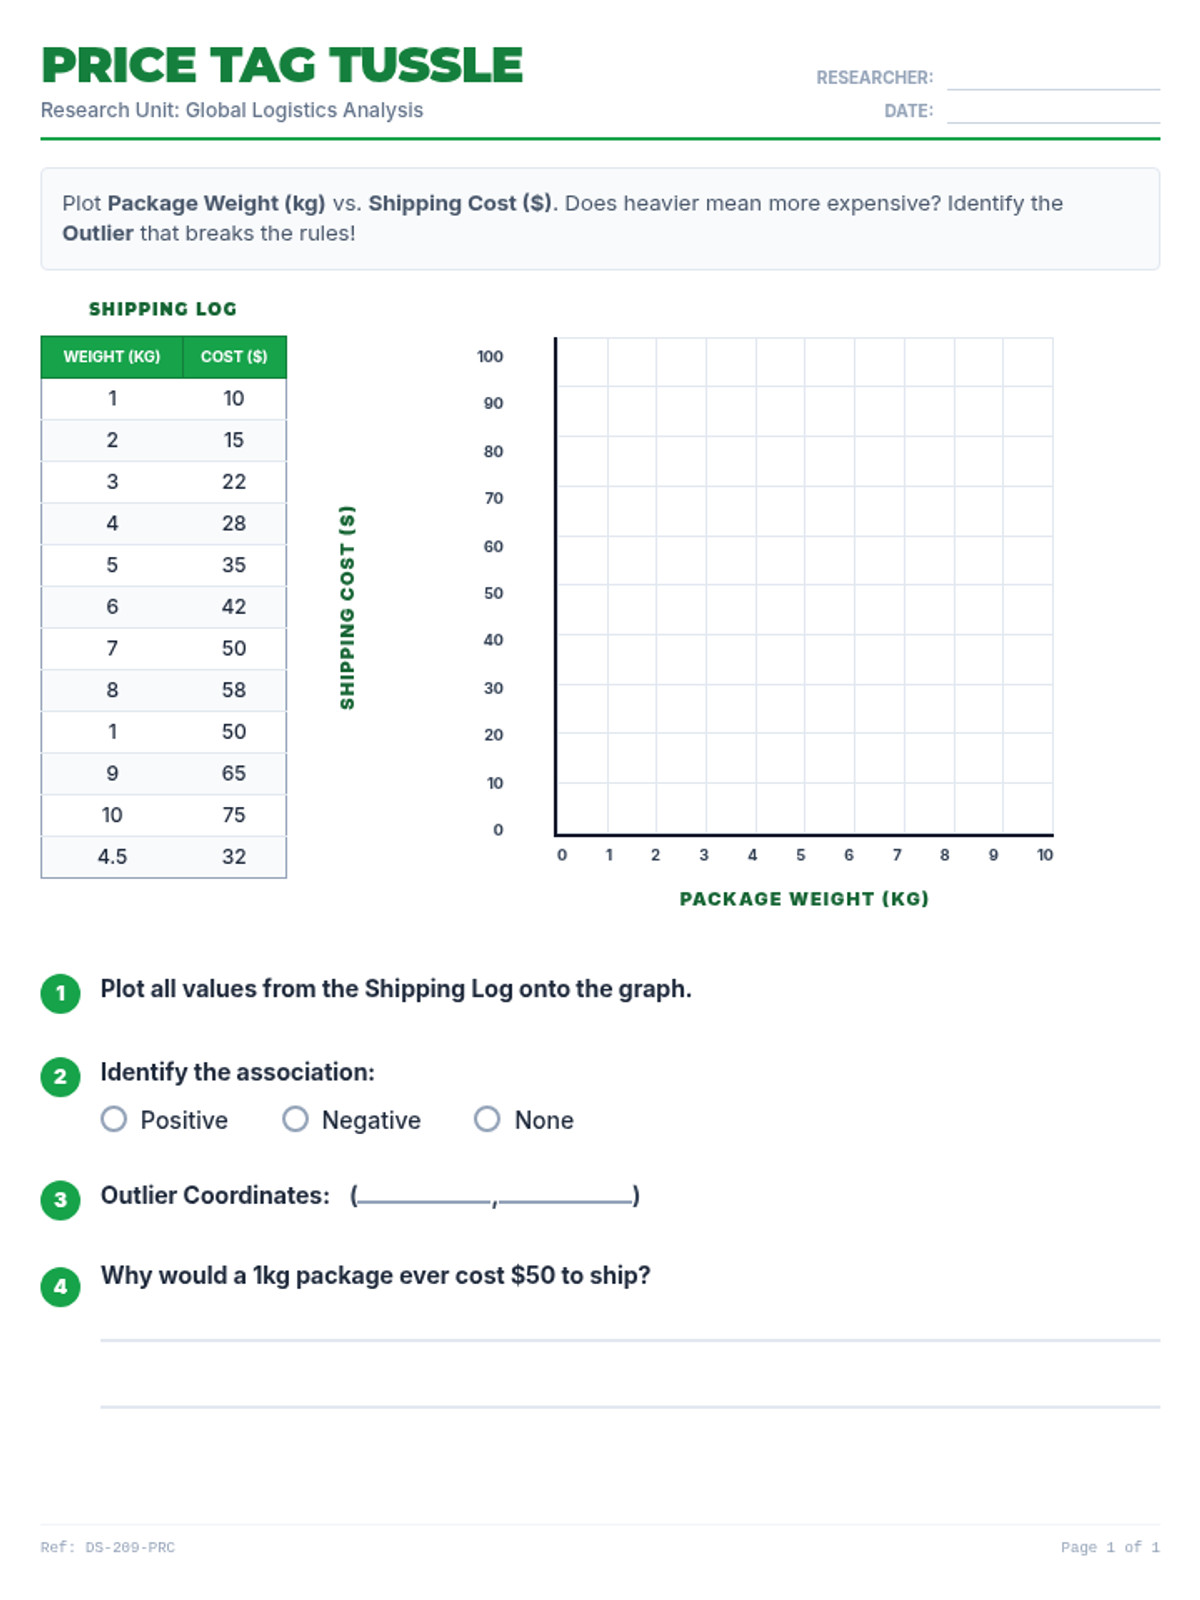
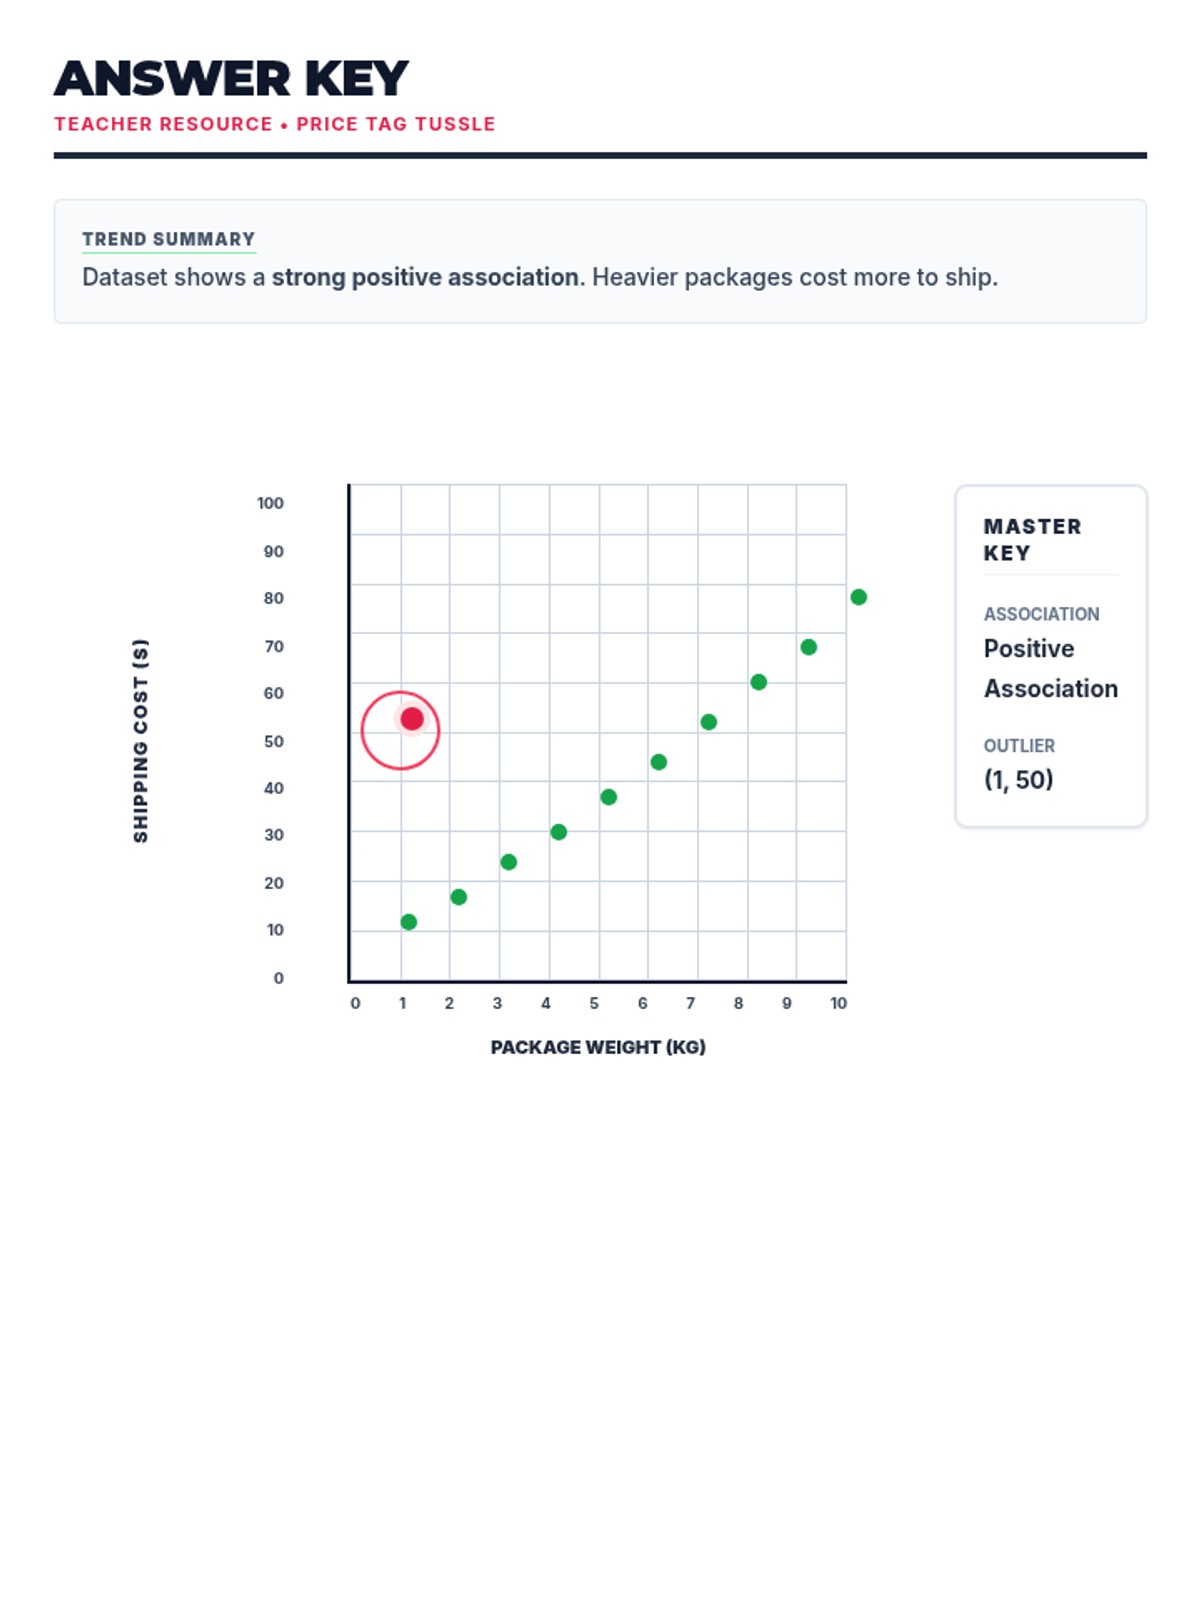
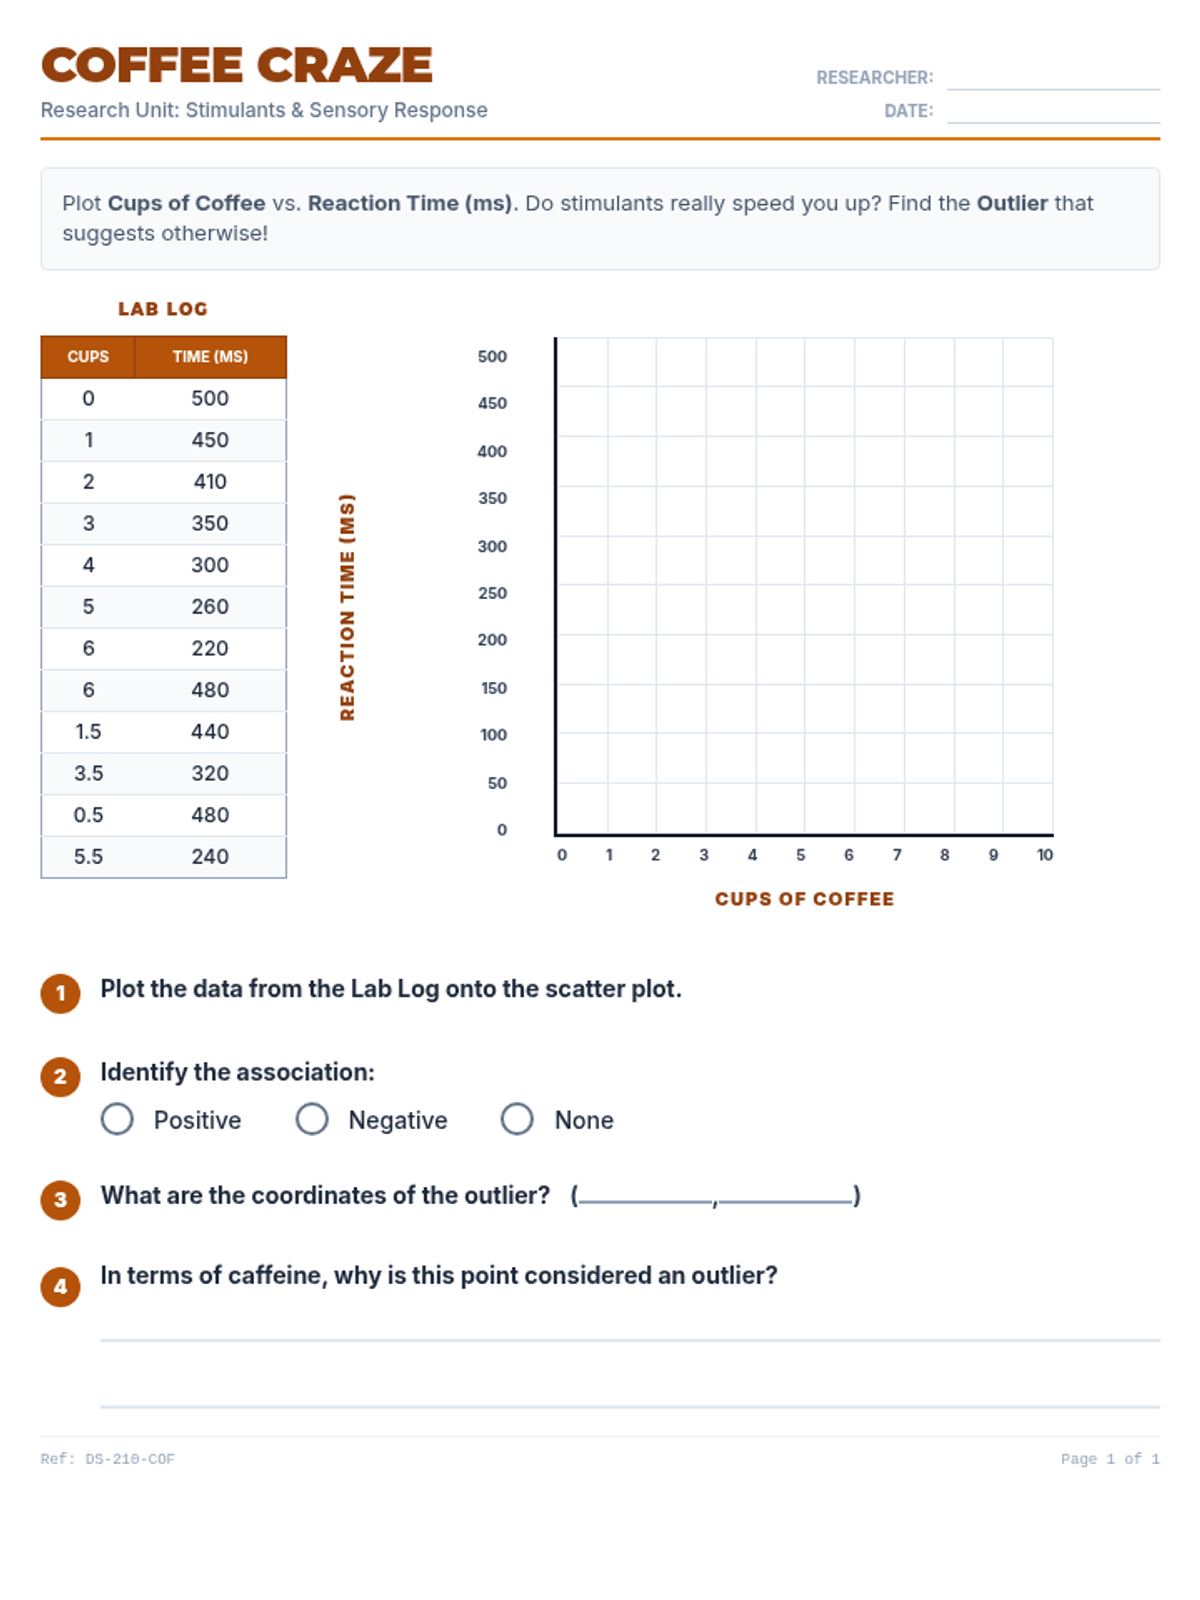
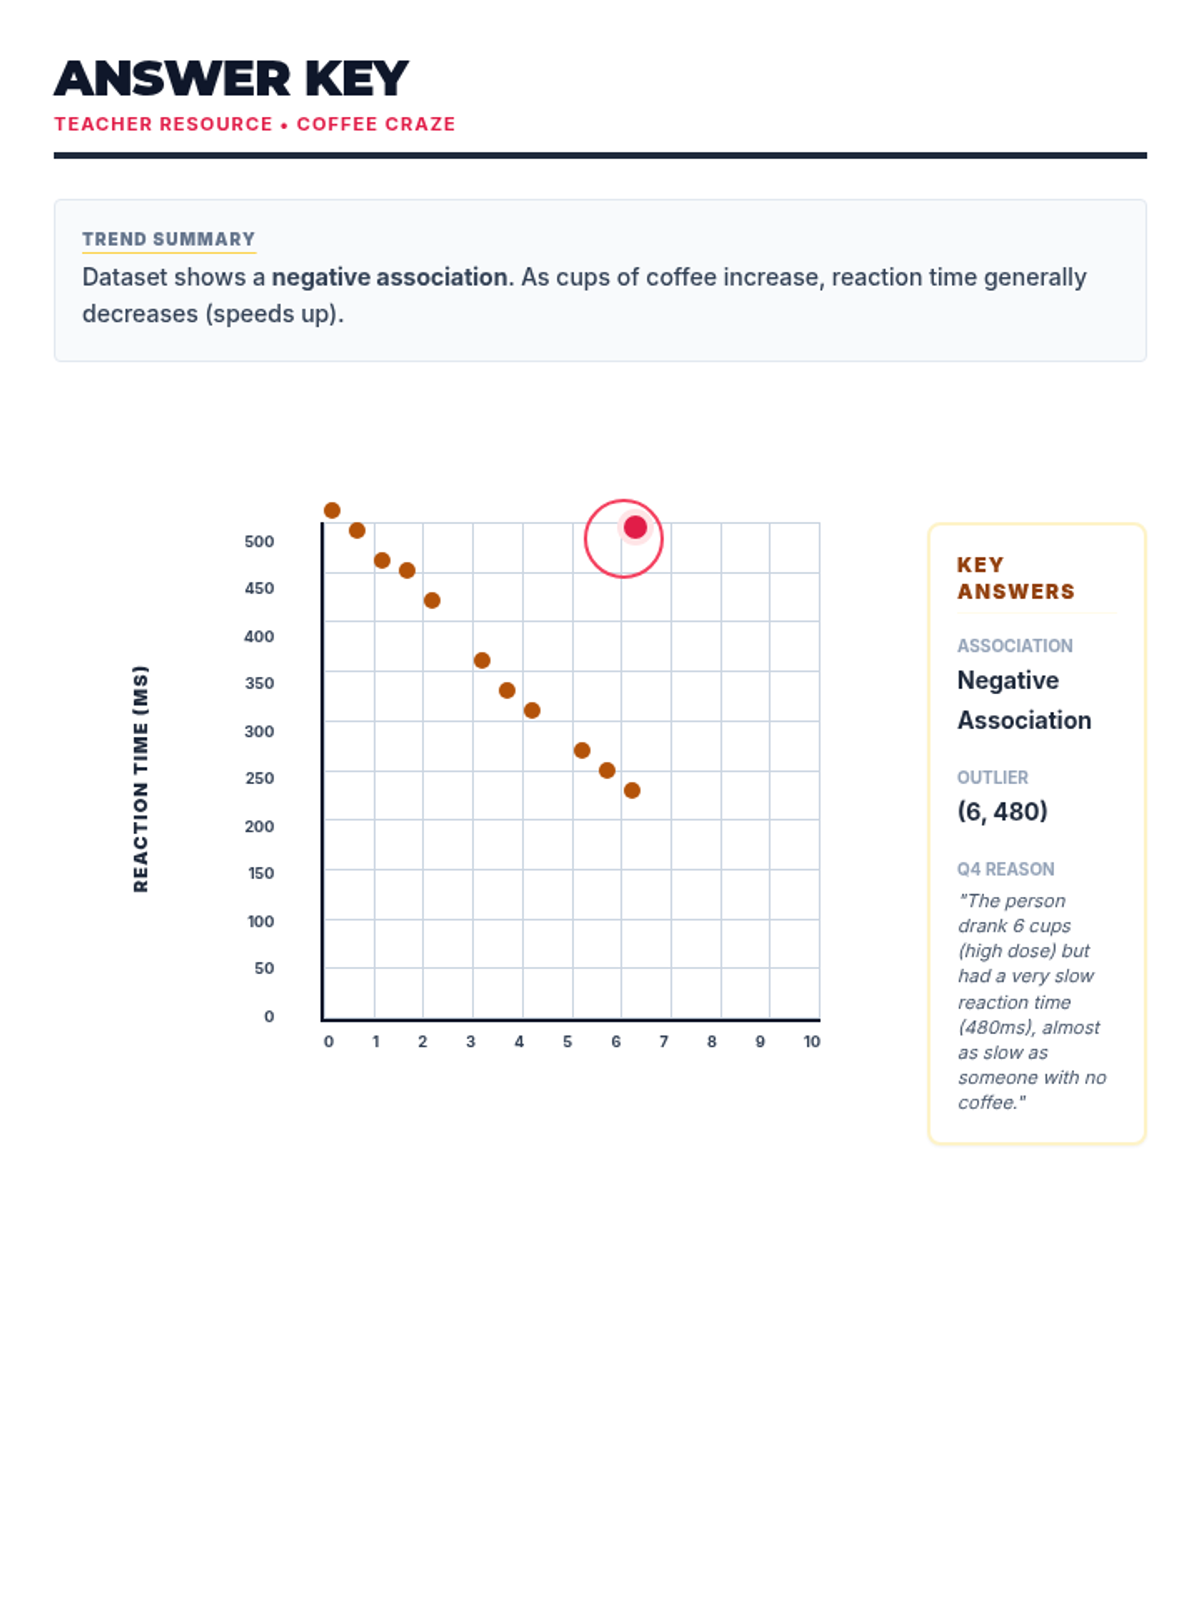
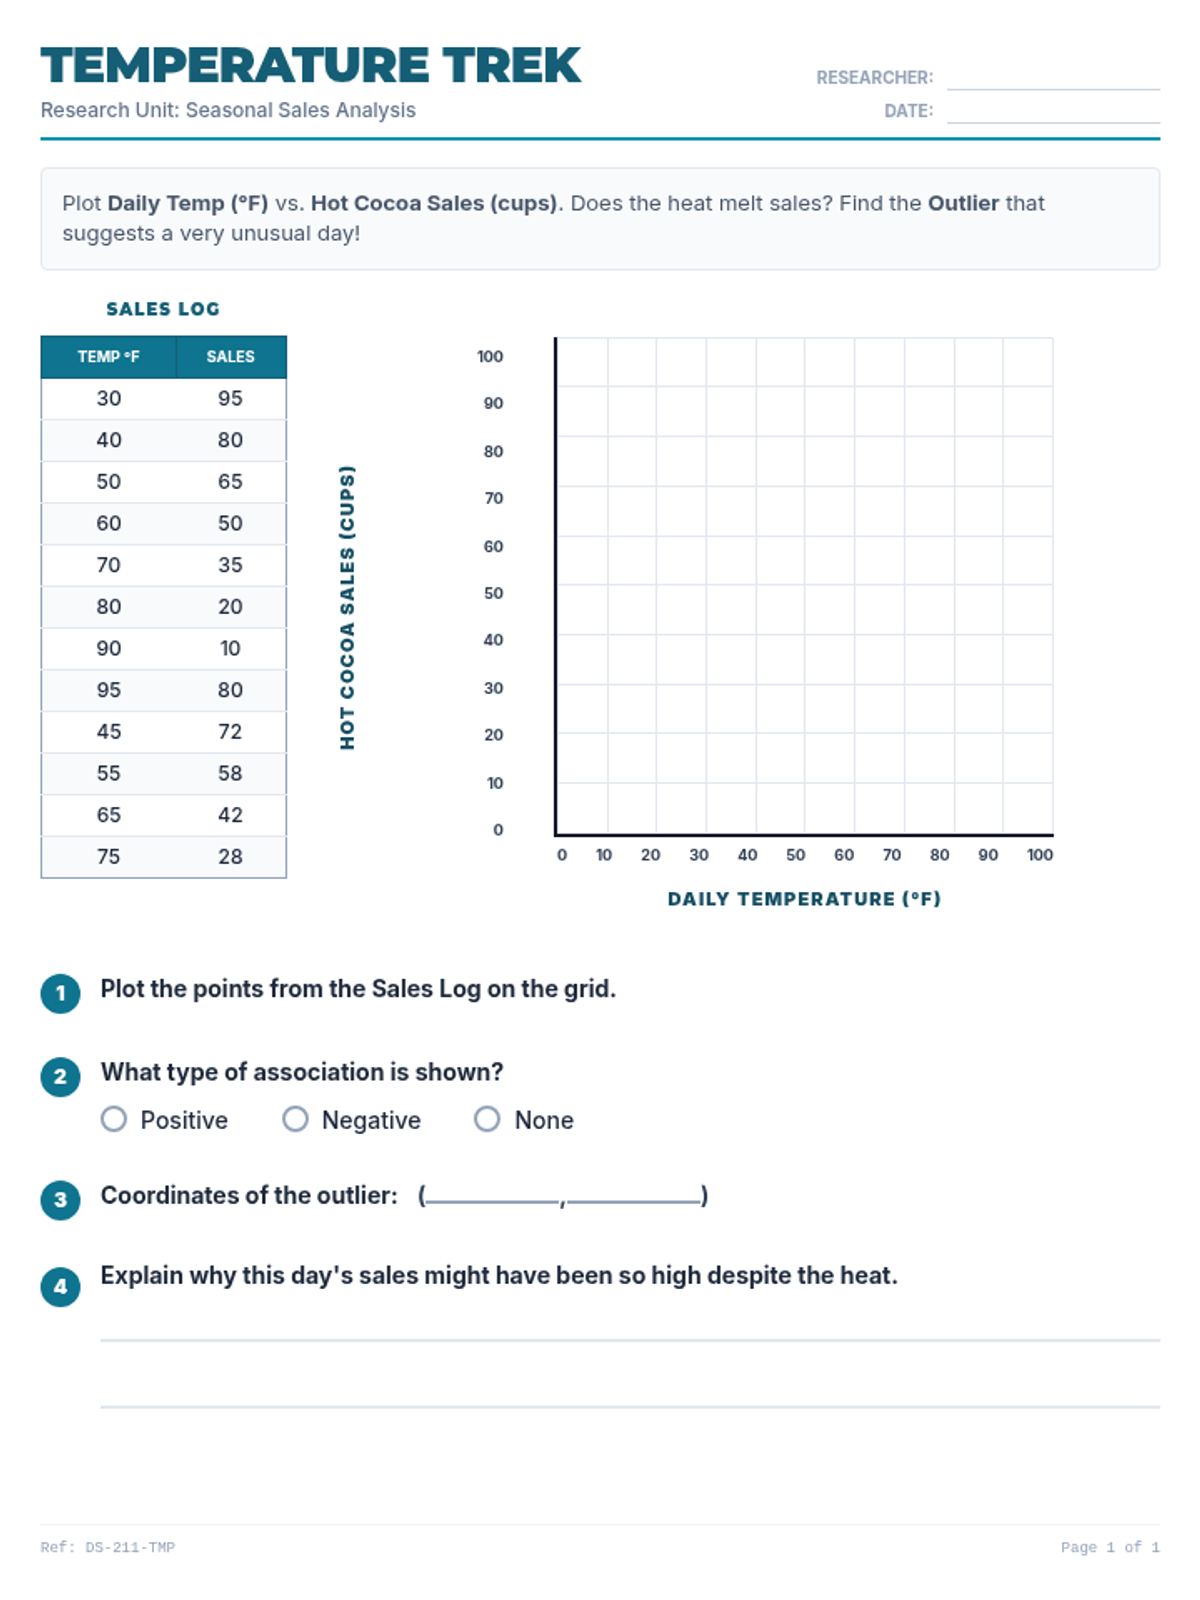
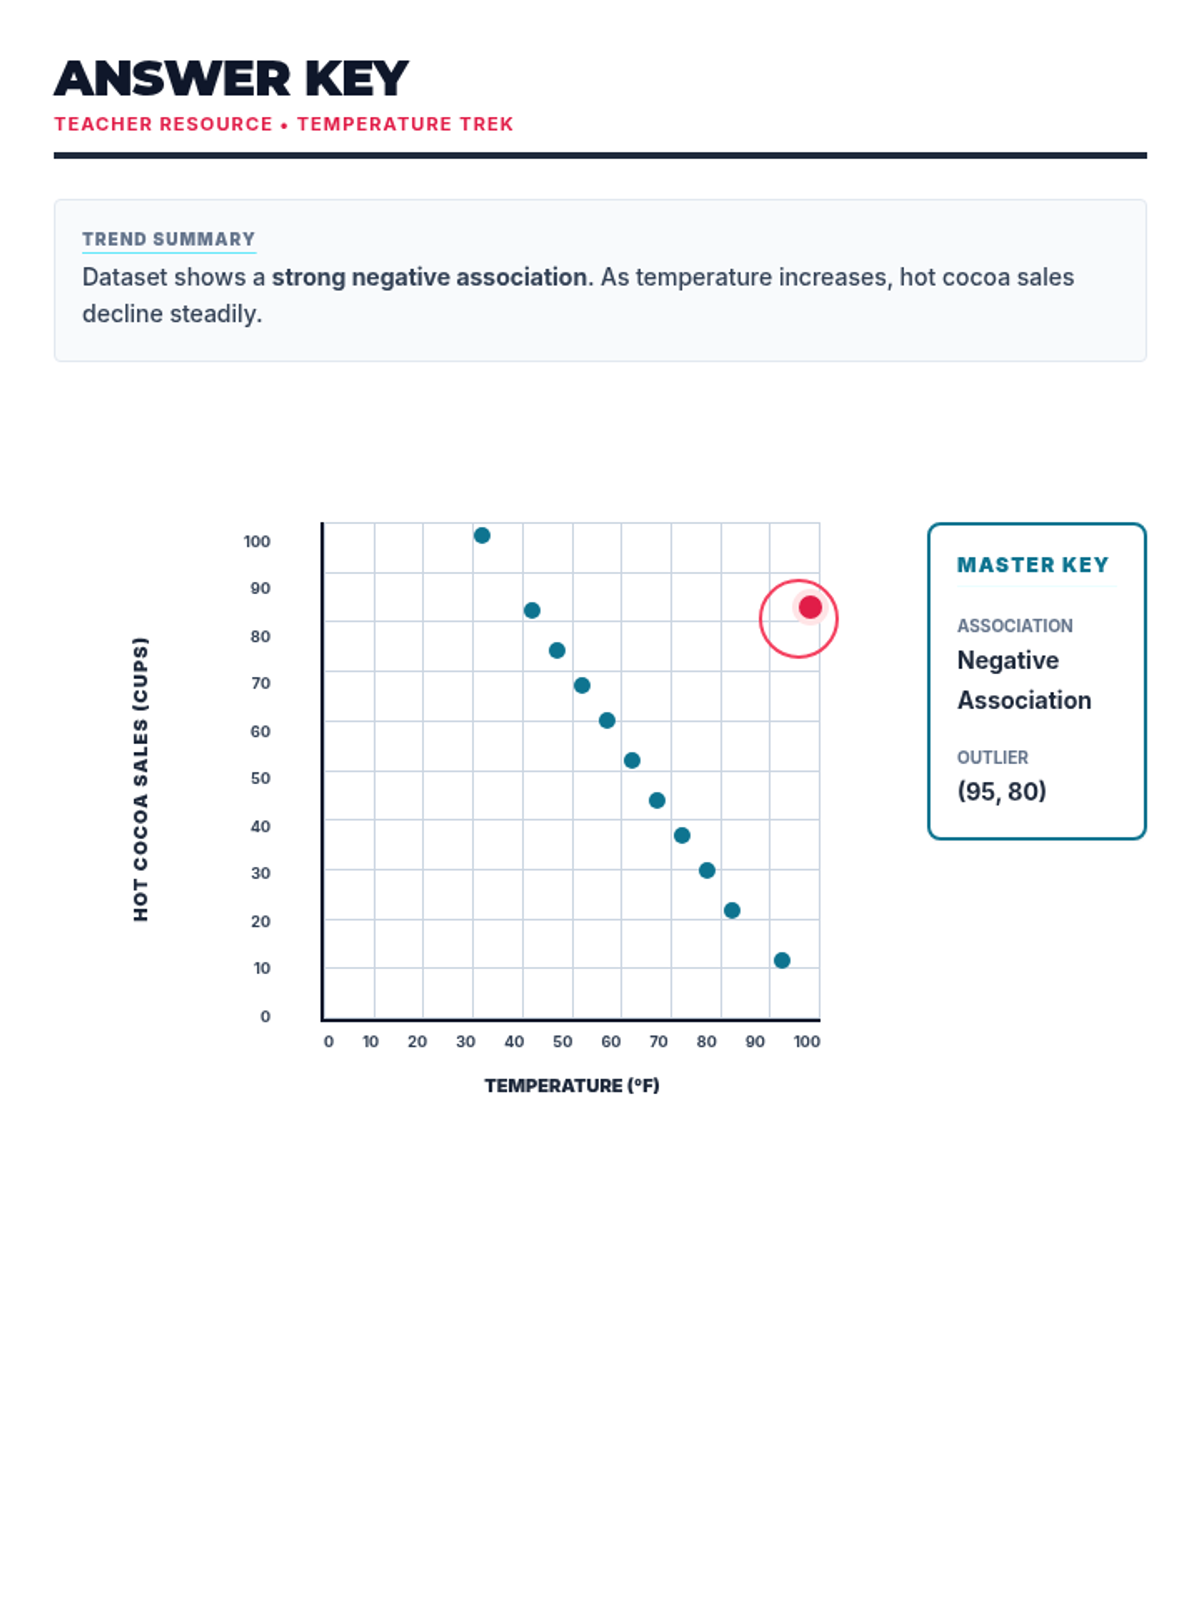
A comprehensive lesson on identifying and analyzing outliers within scatter plots using a 'Data Detective' theme. Students will learn to spot anomalous data points and understand their impact on trends.
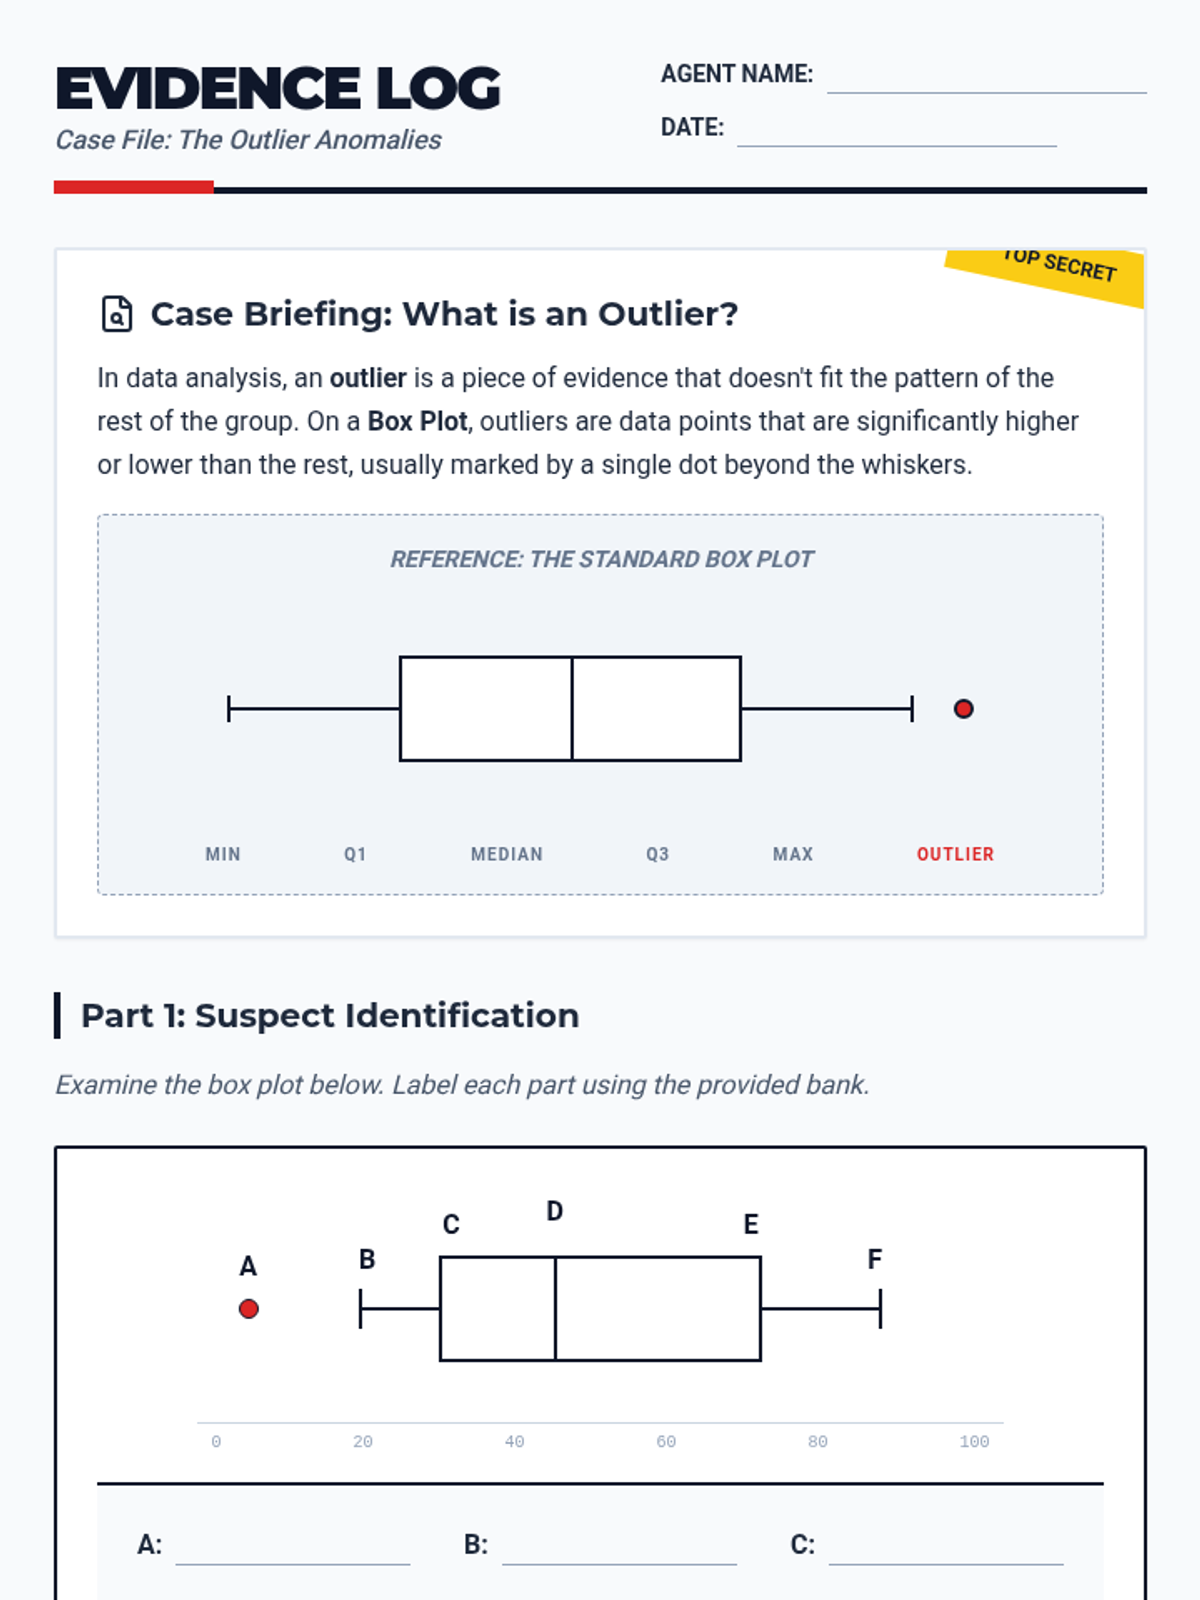
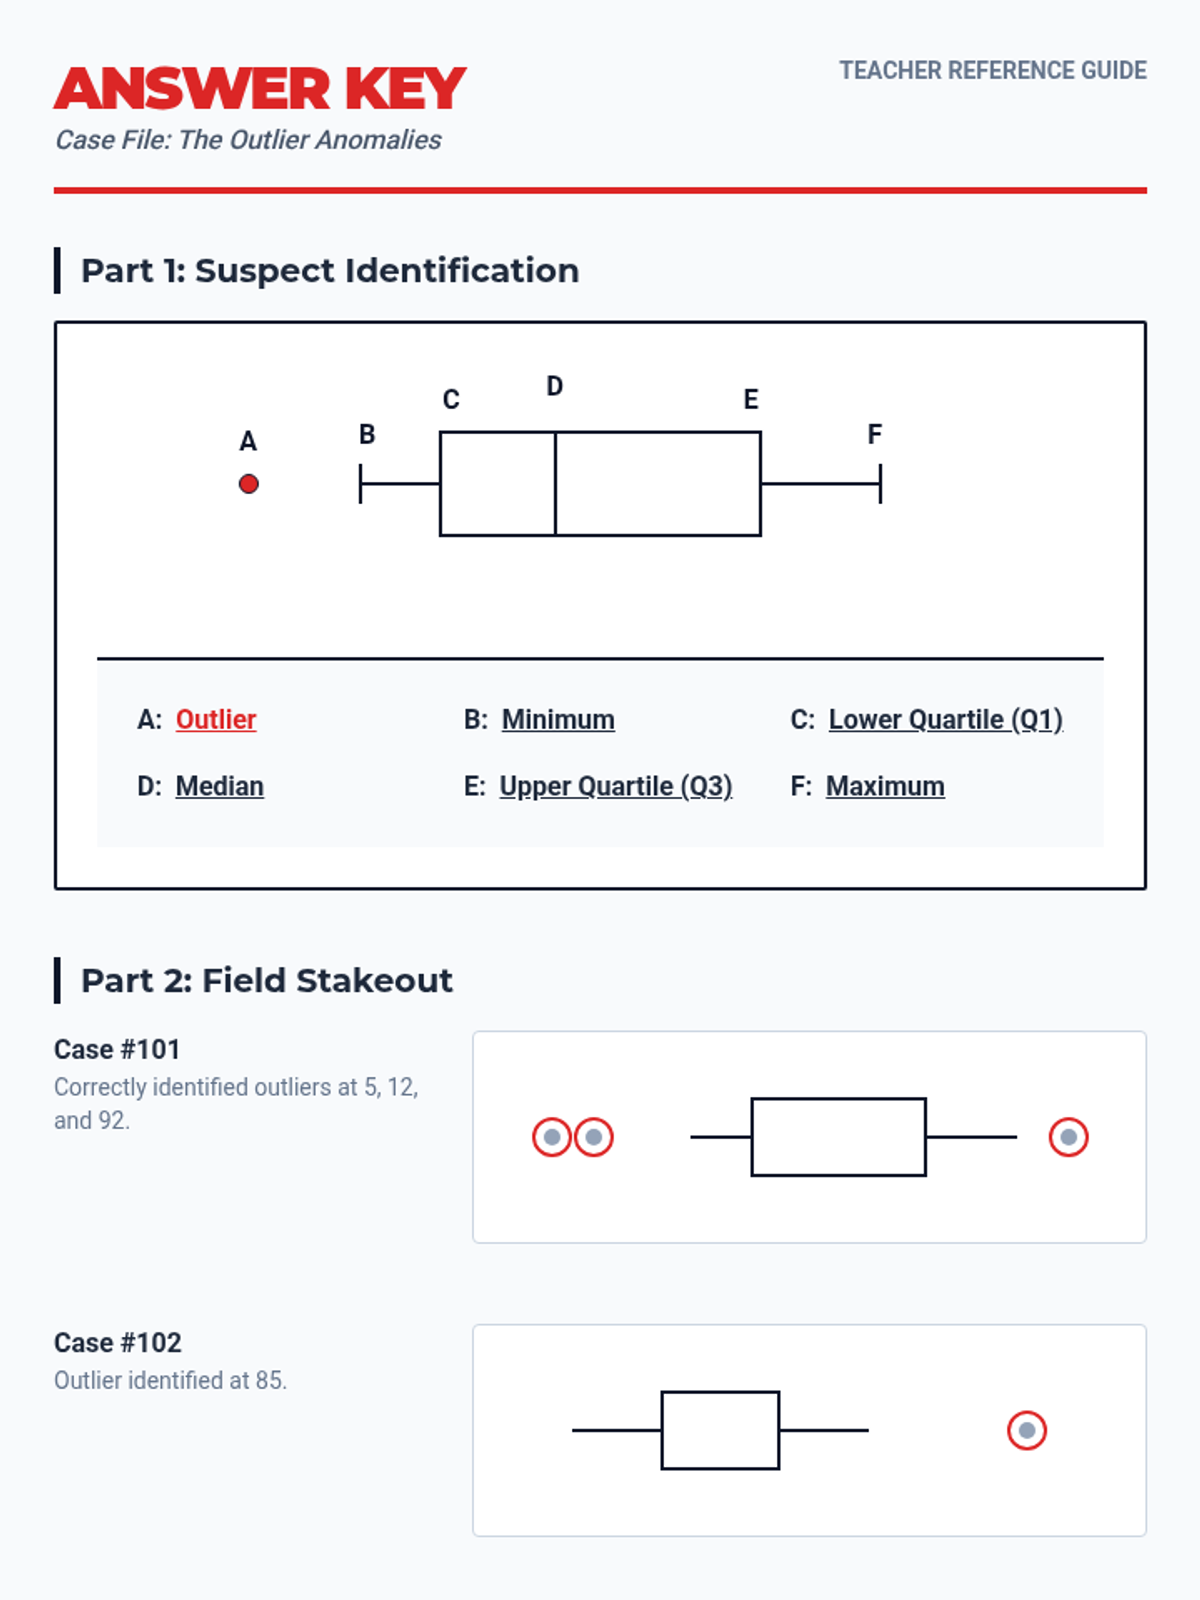
A lesson focused on identifying and interpreting outliers in box plot data visualizations, using a forensic detective theme to engage students in data analysis.
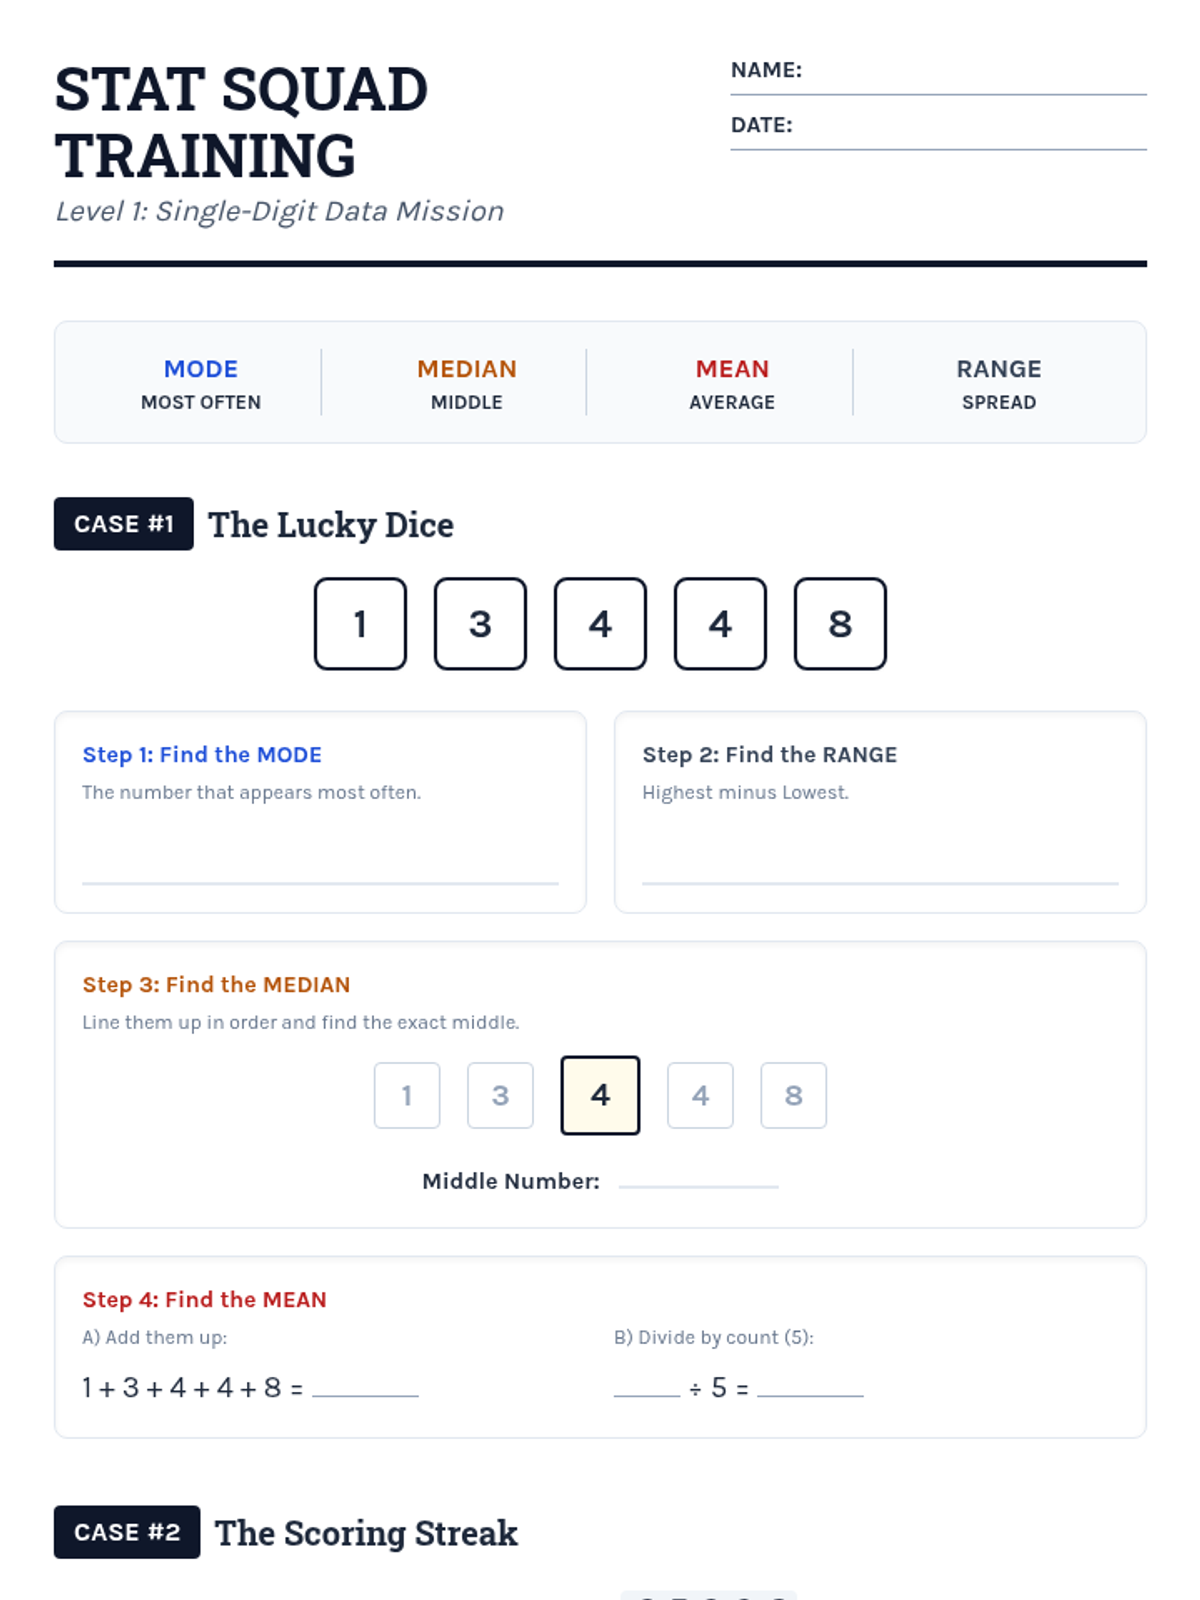
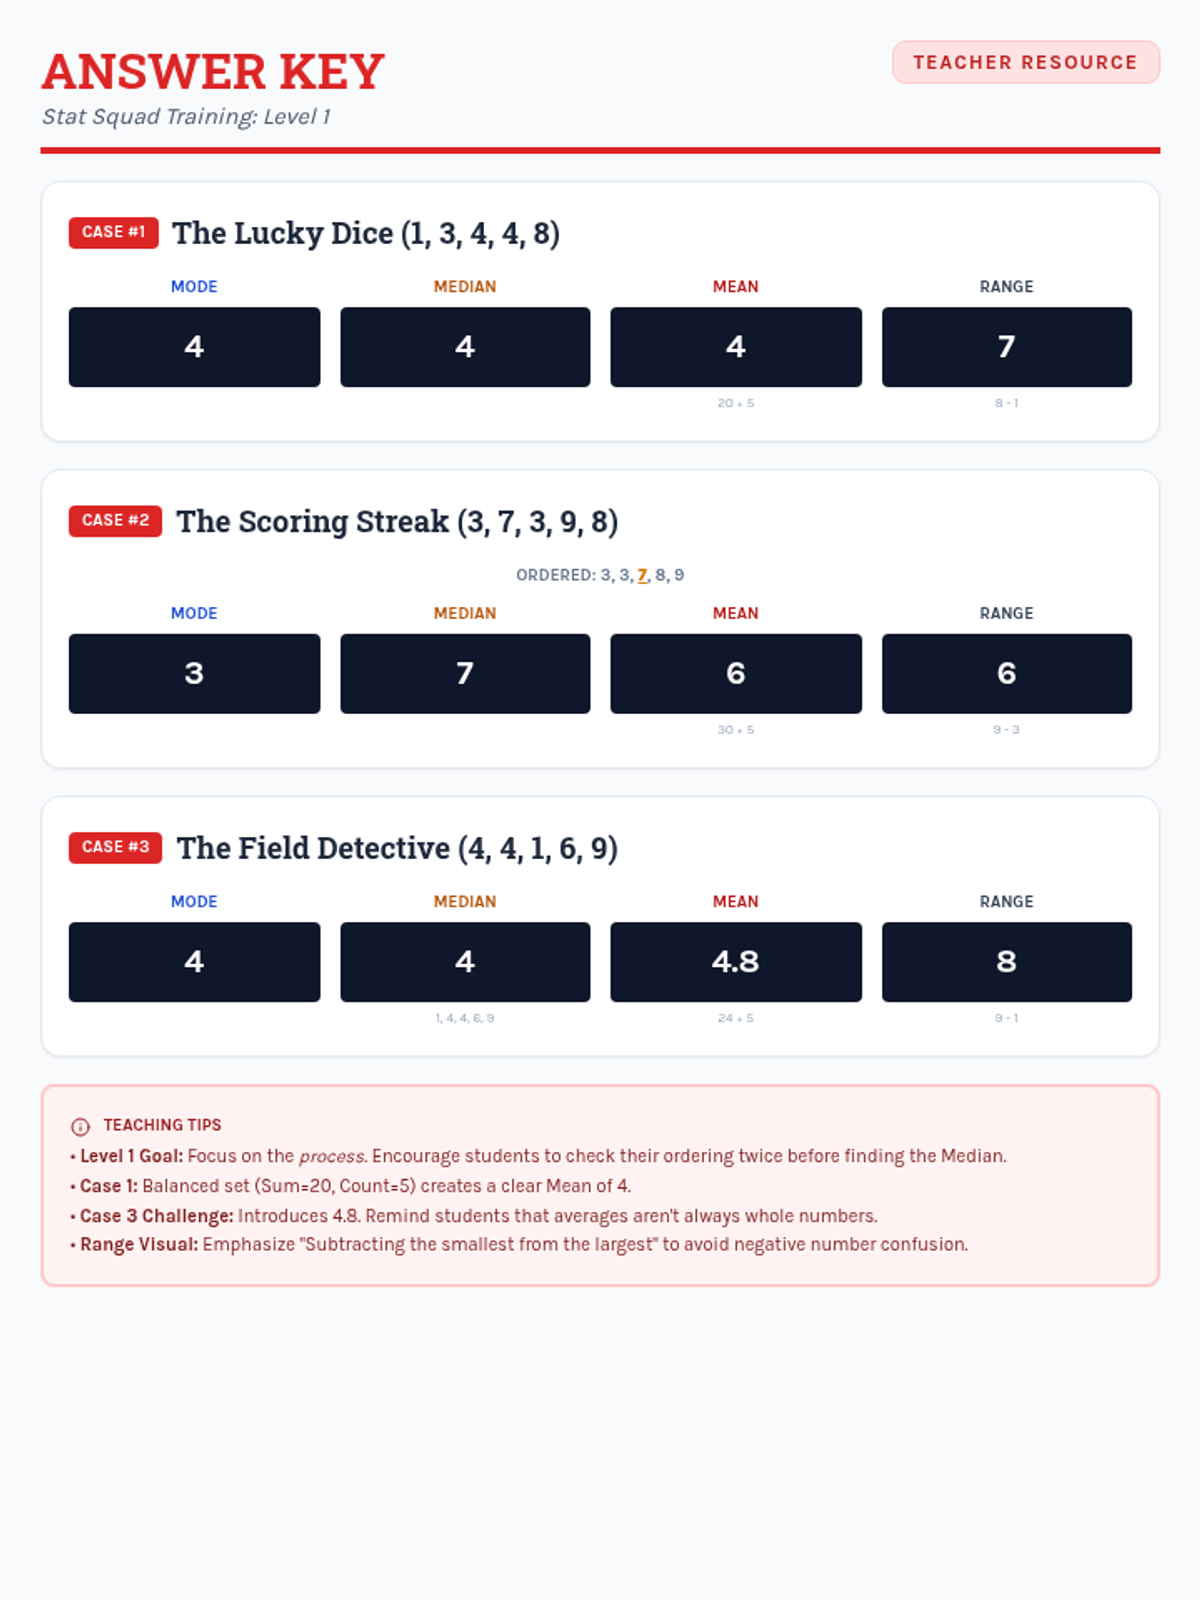
Students learn to calculate mean, median, mode, and range using single-digit data sets through structured, step-by-step guided practice and visual aids.
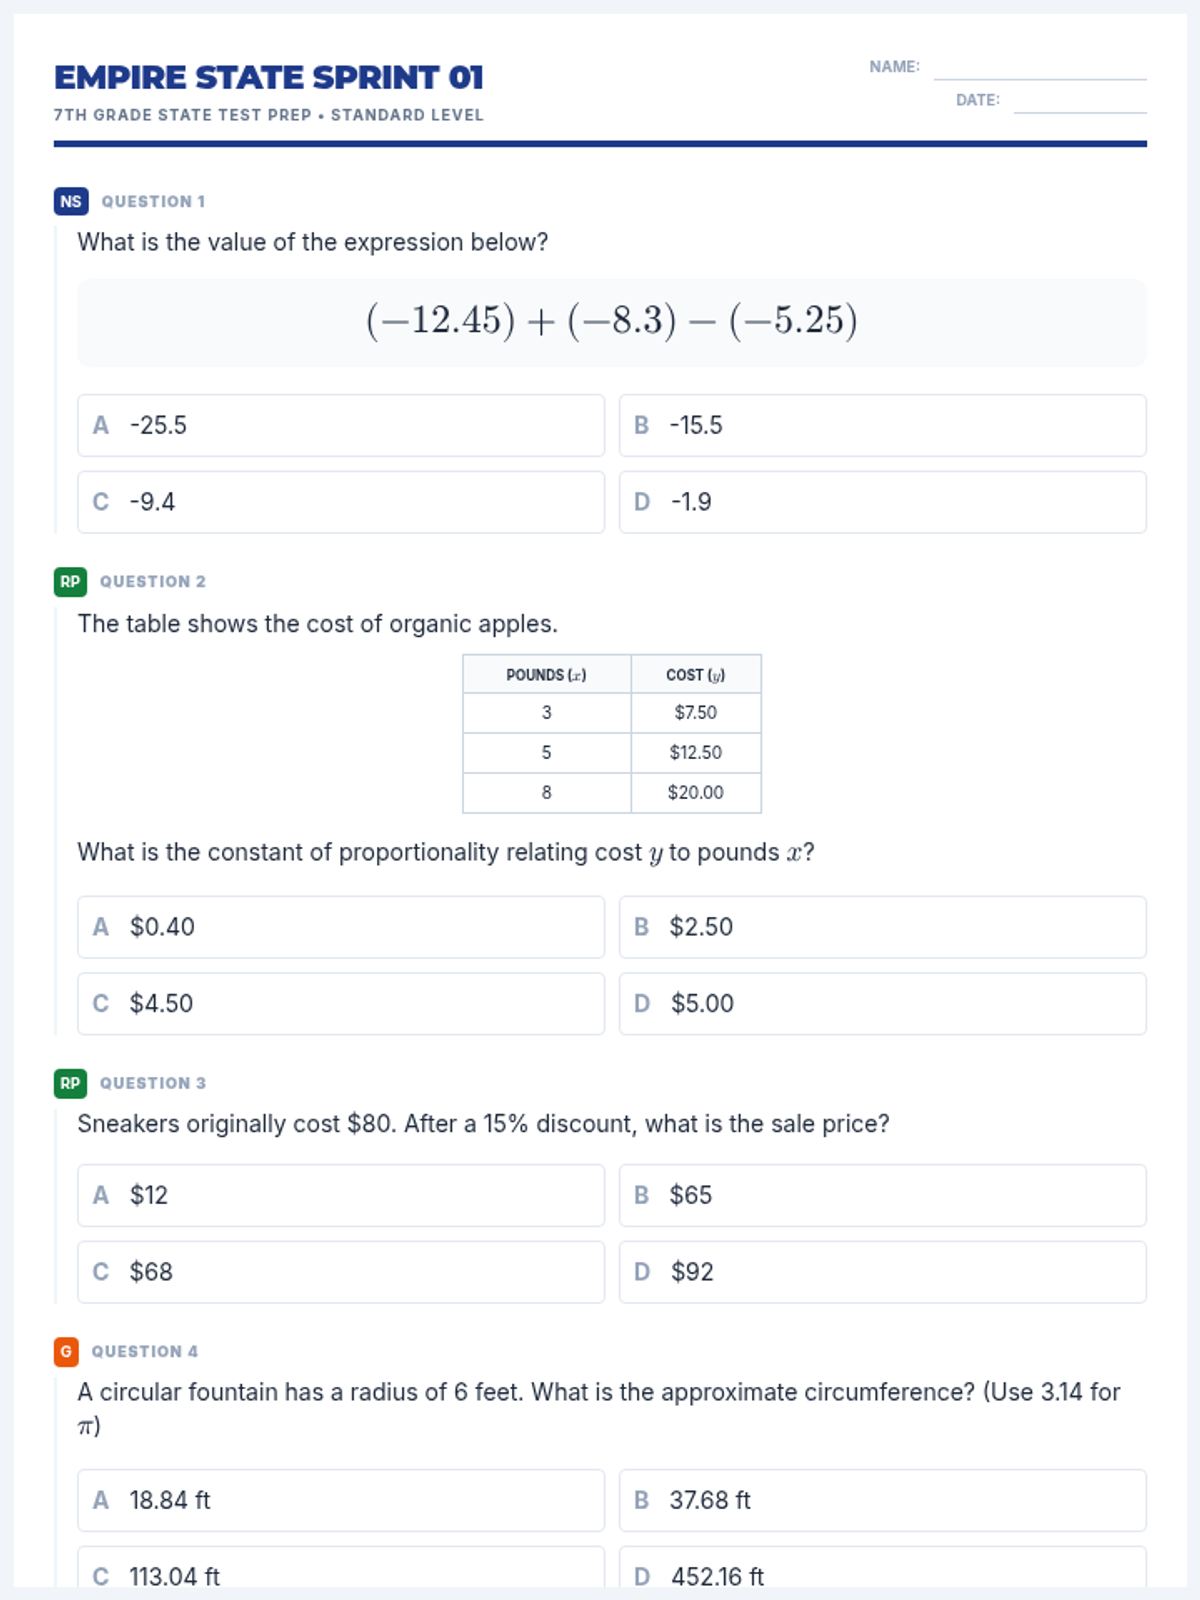
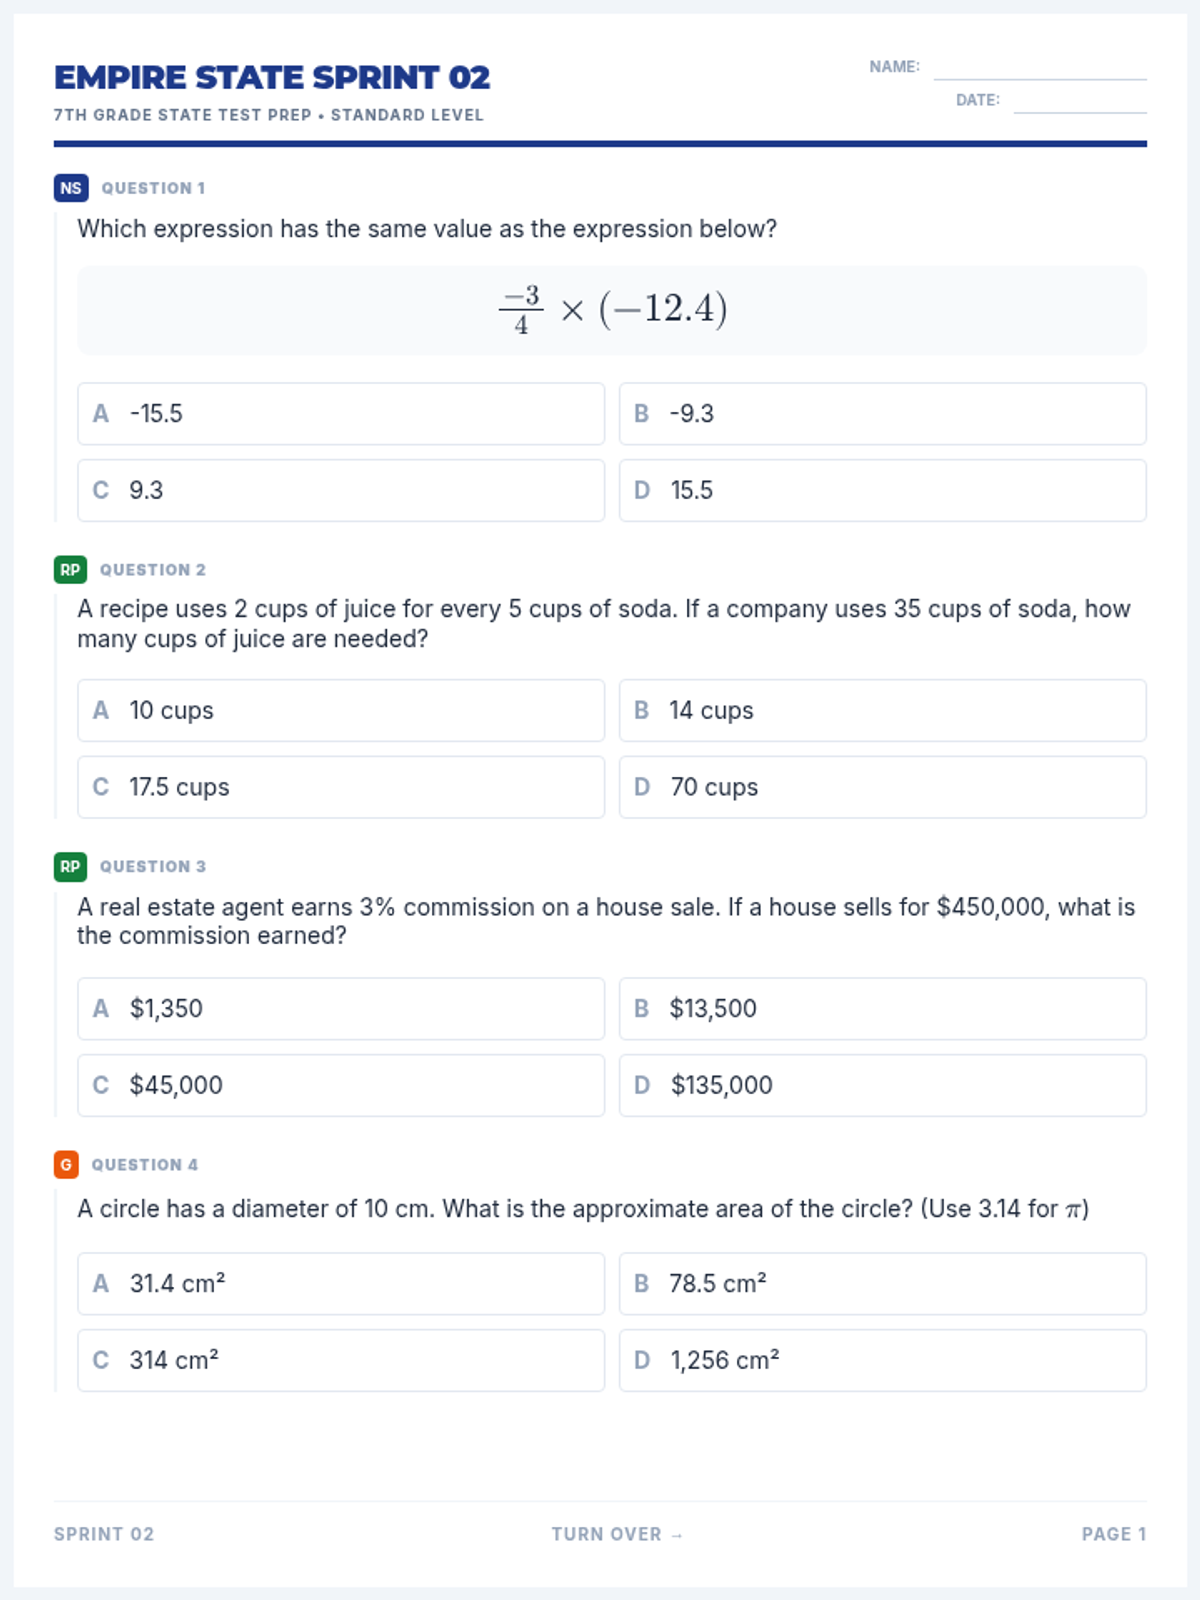
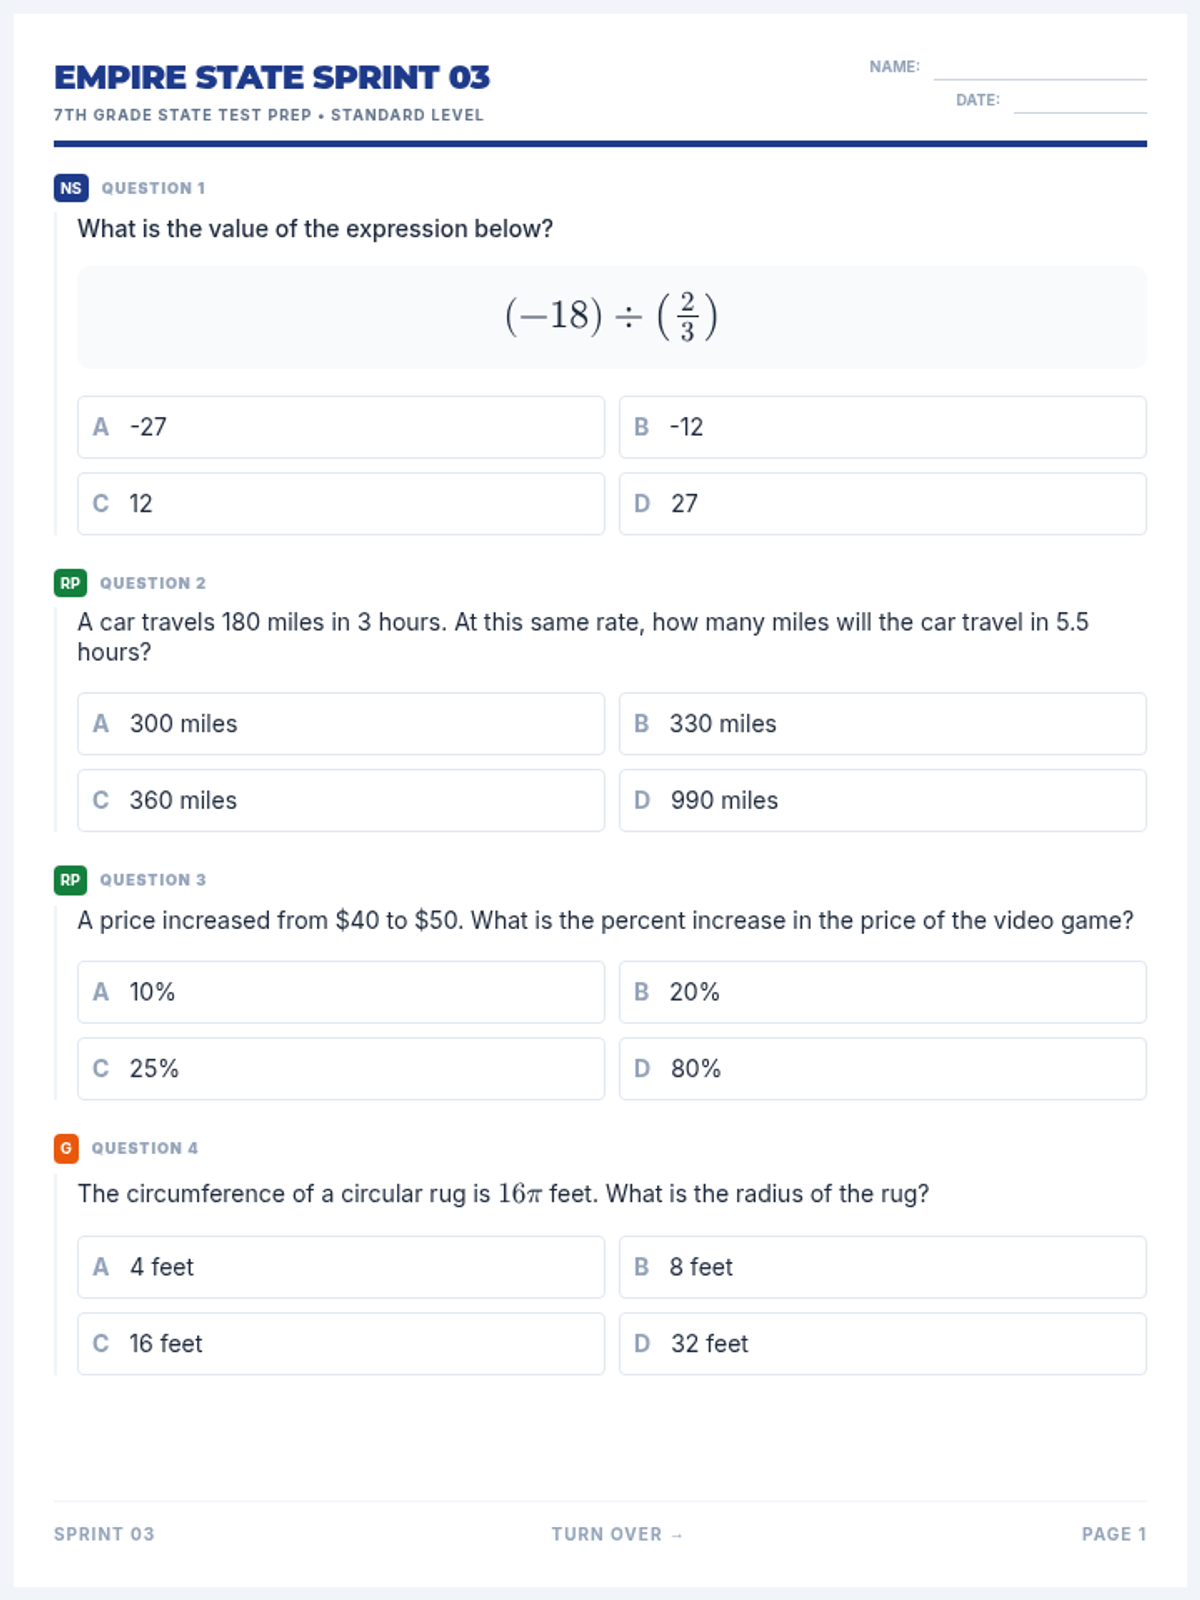
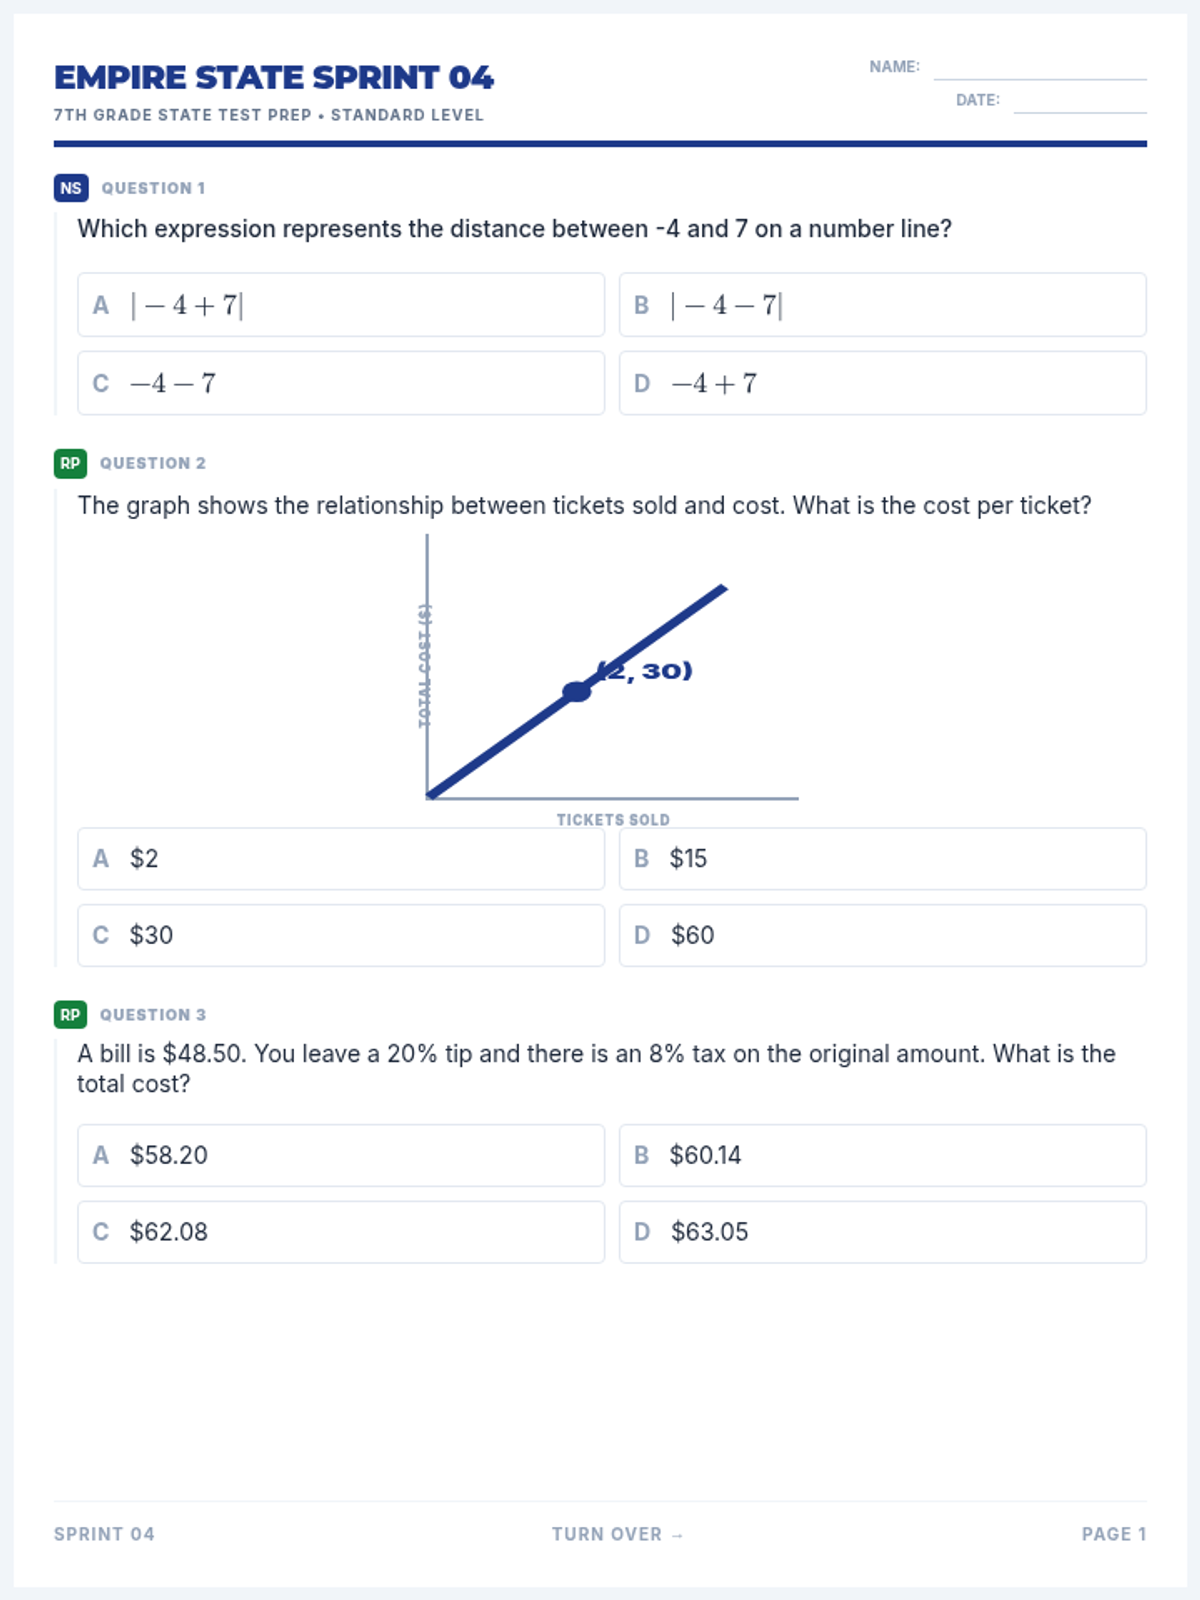
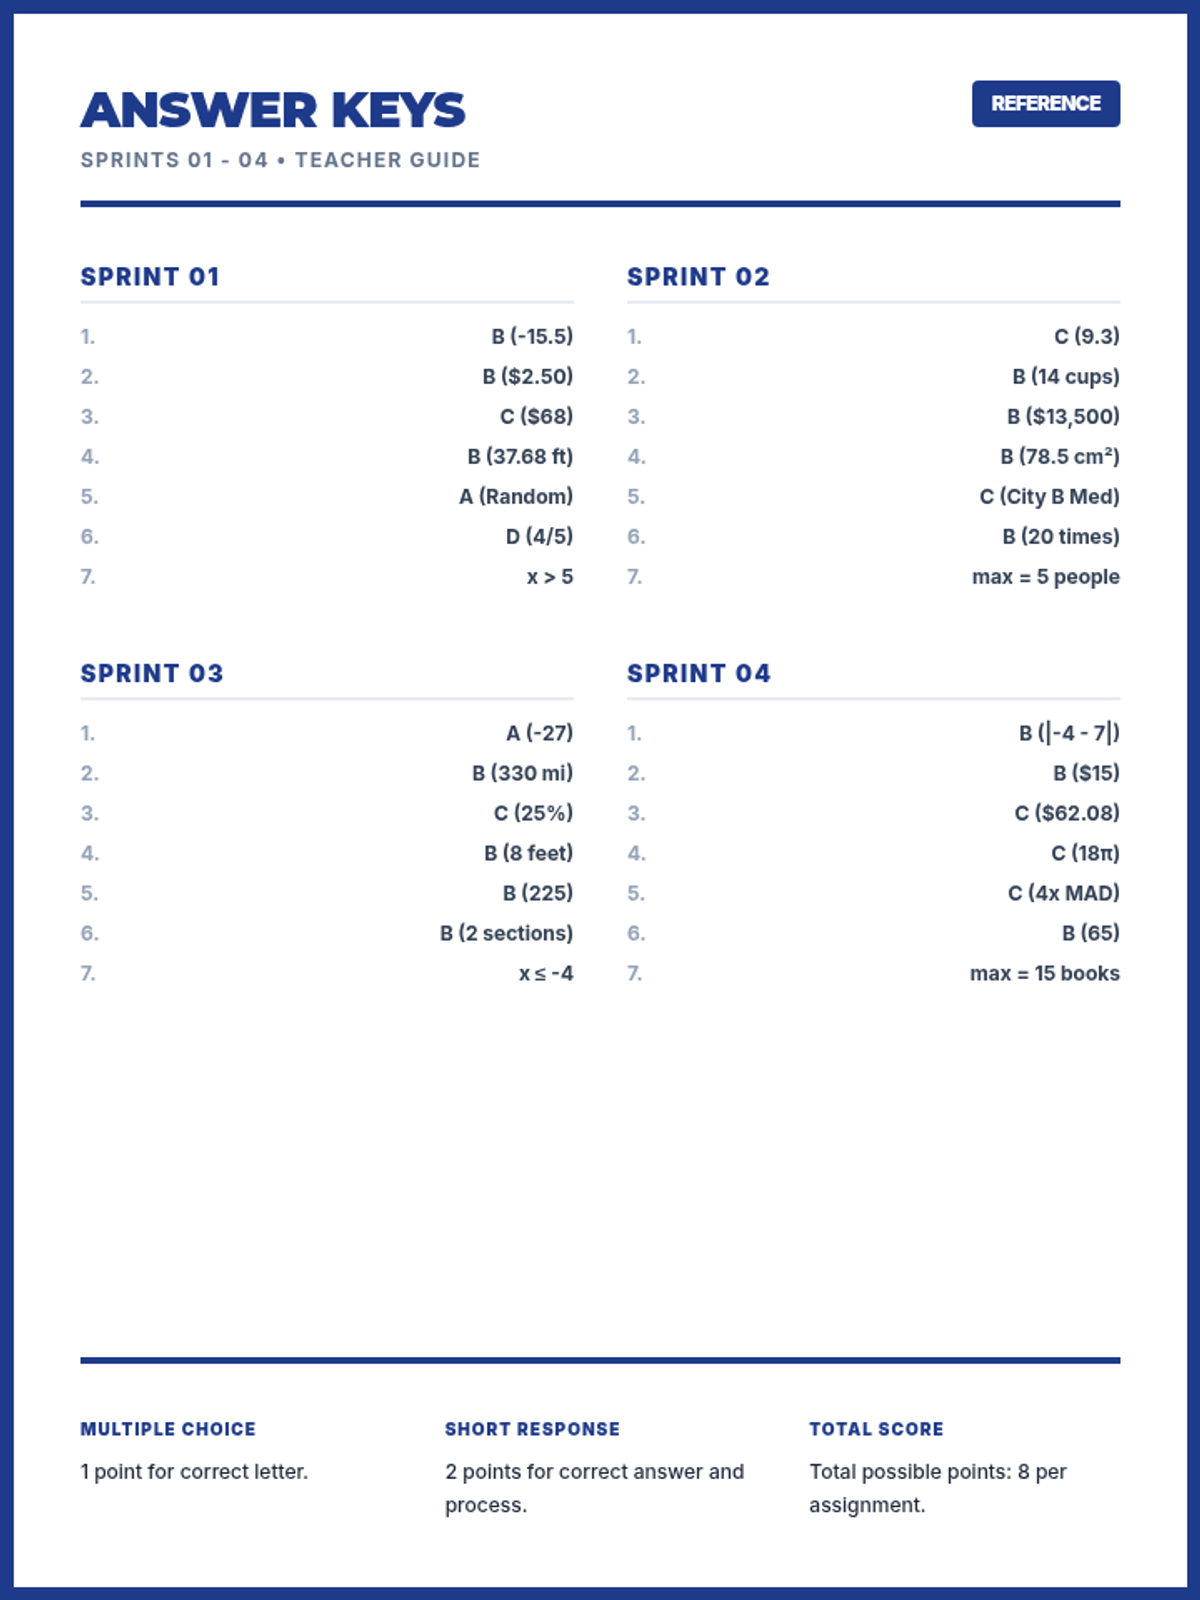
A collection of four double-sided homework assignments focusing on foundational 7th-grade math skills. Each "Sprint" contains seven standardized questions covering all major test categories to build stamina and accuracy.
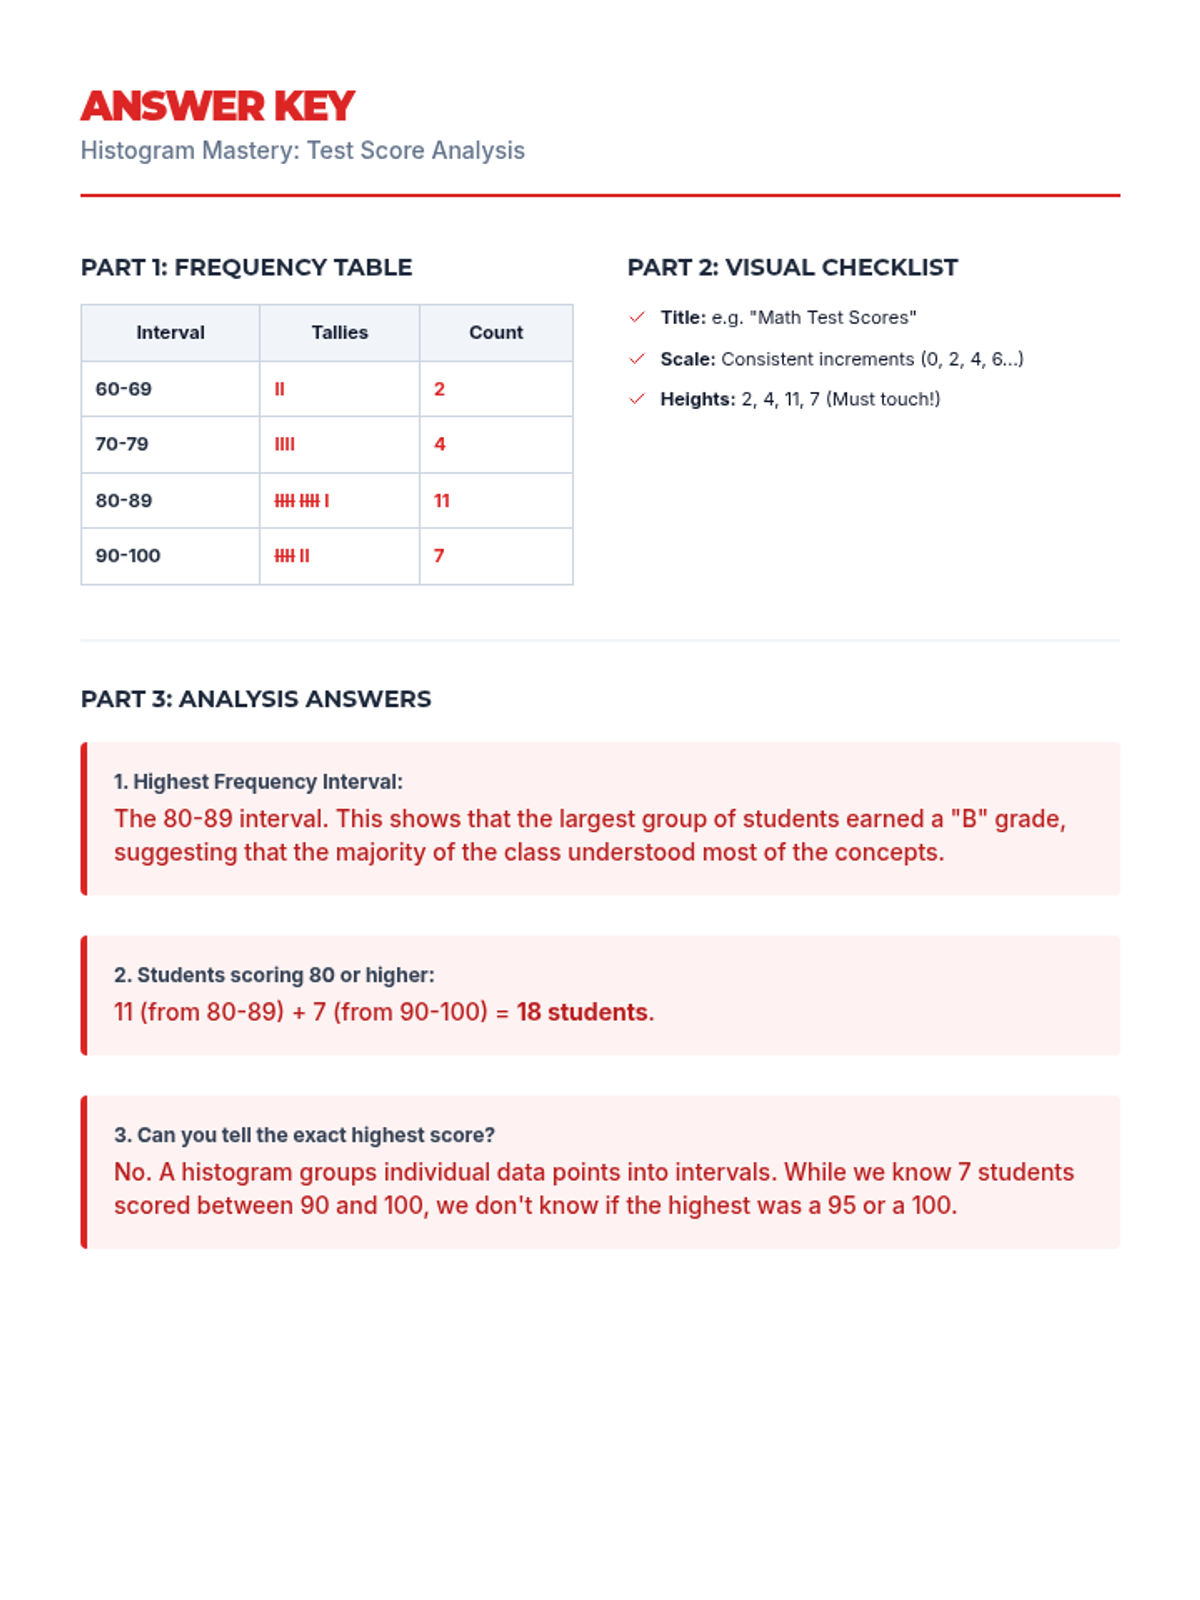
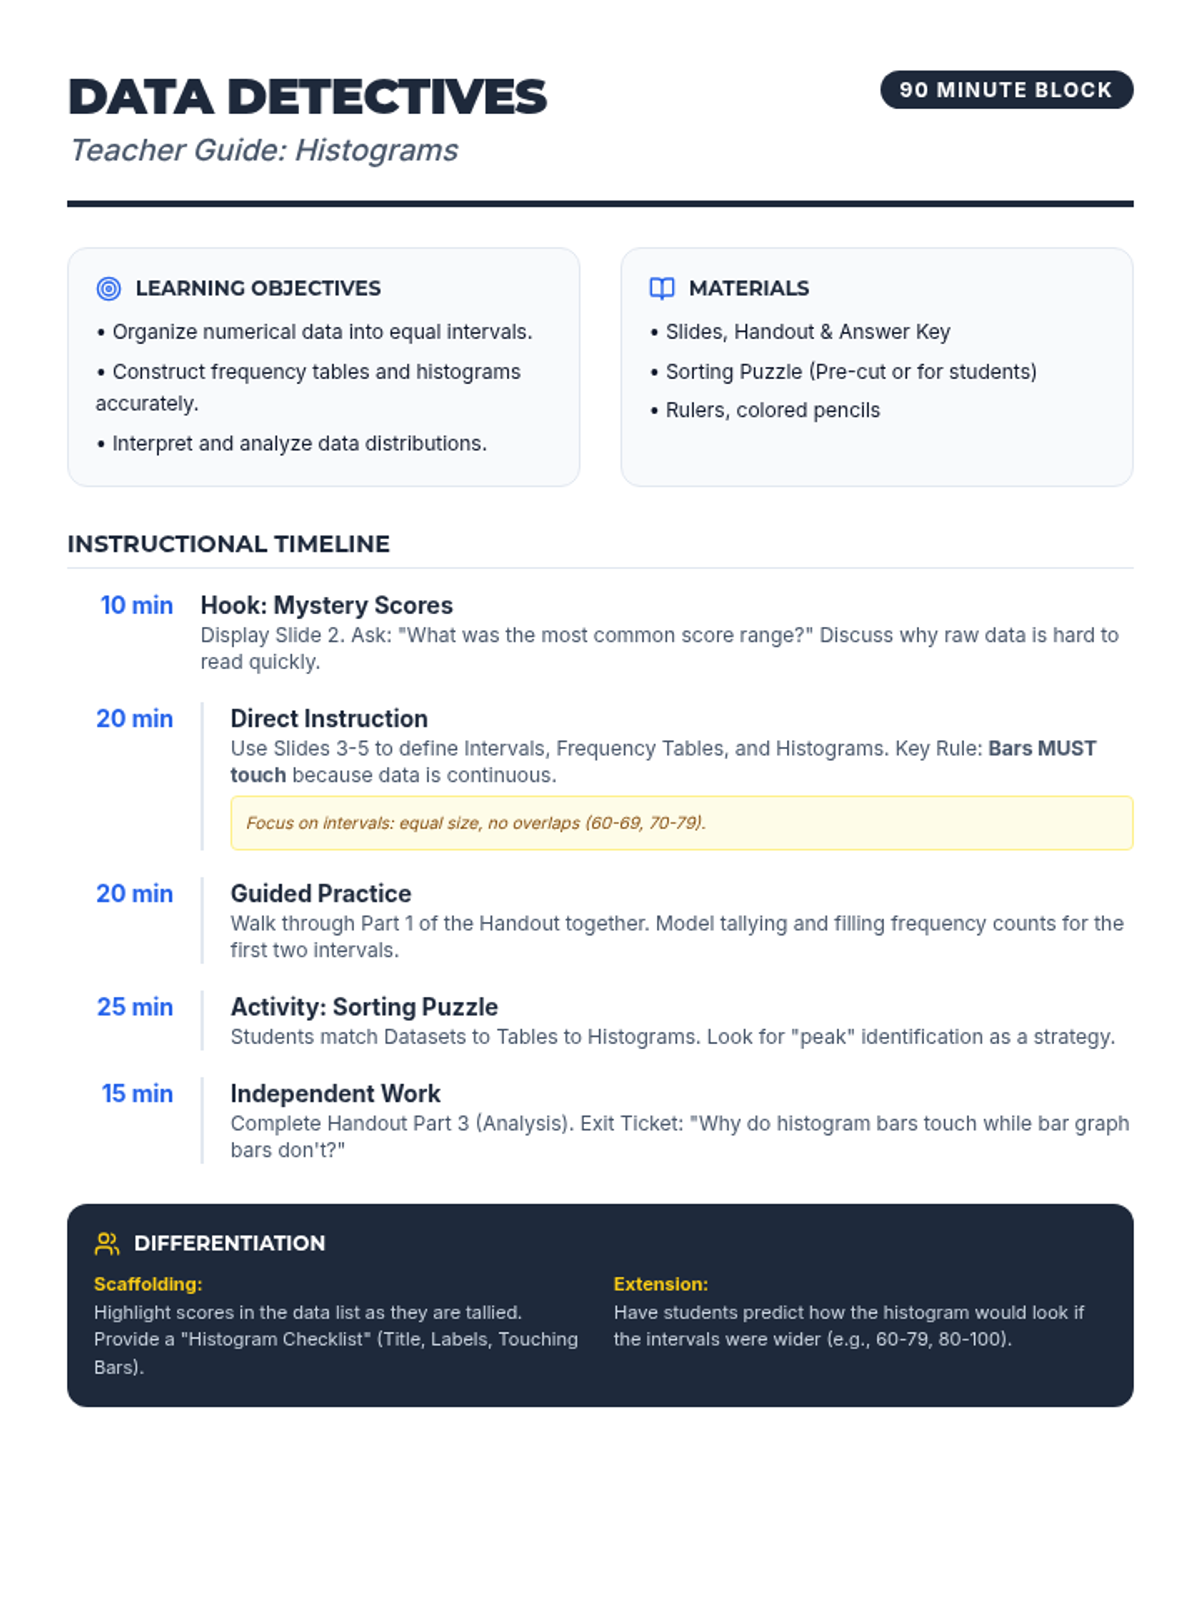
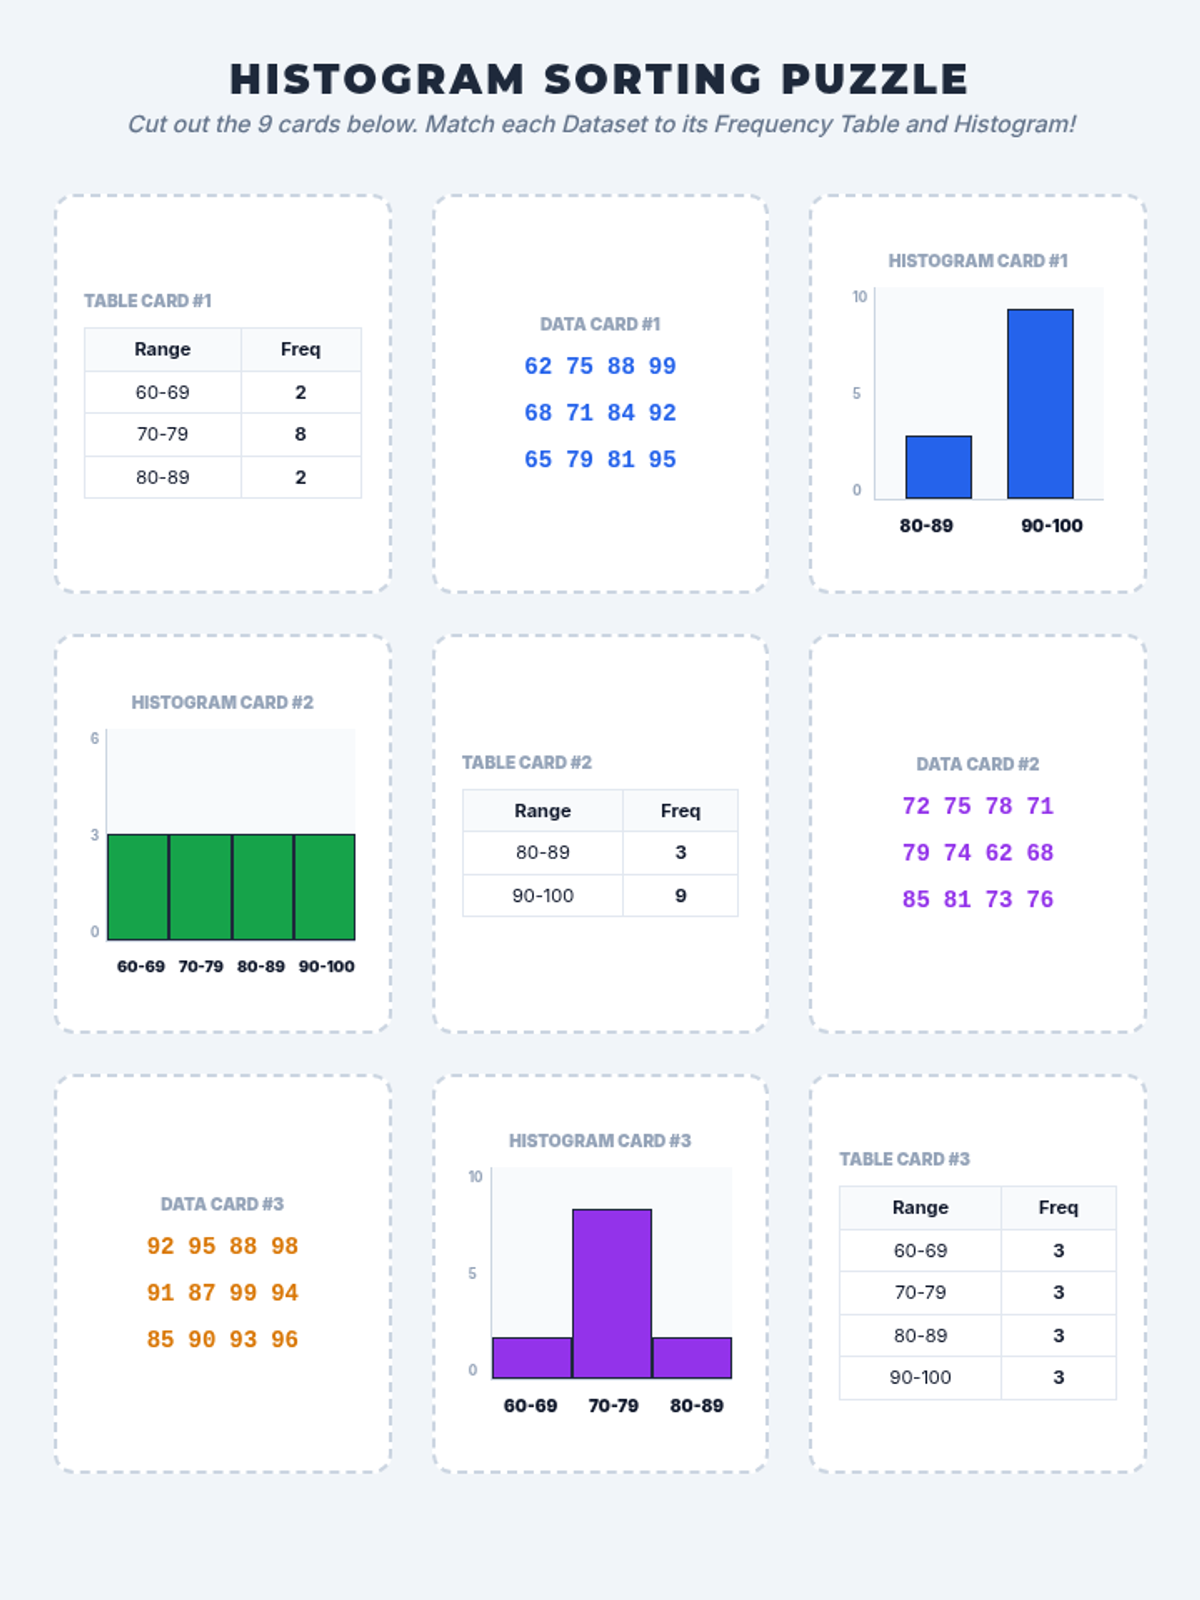
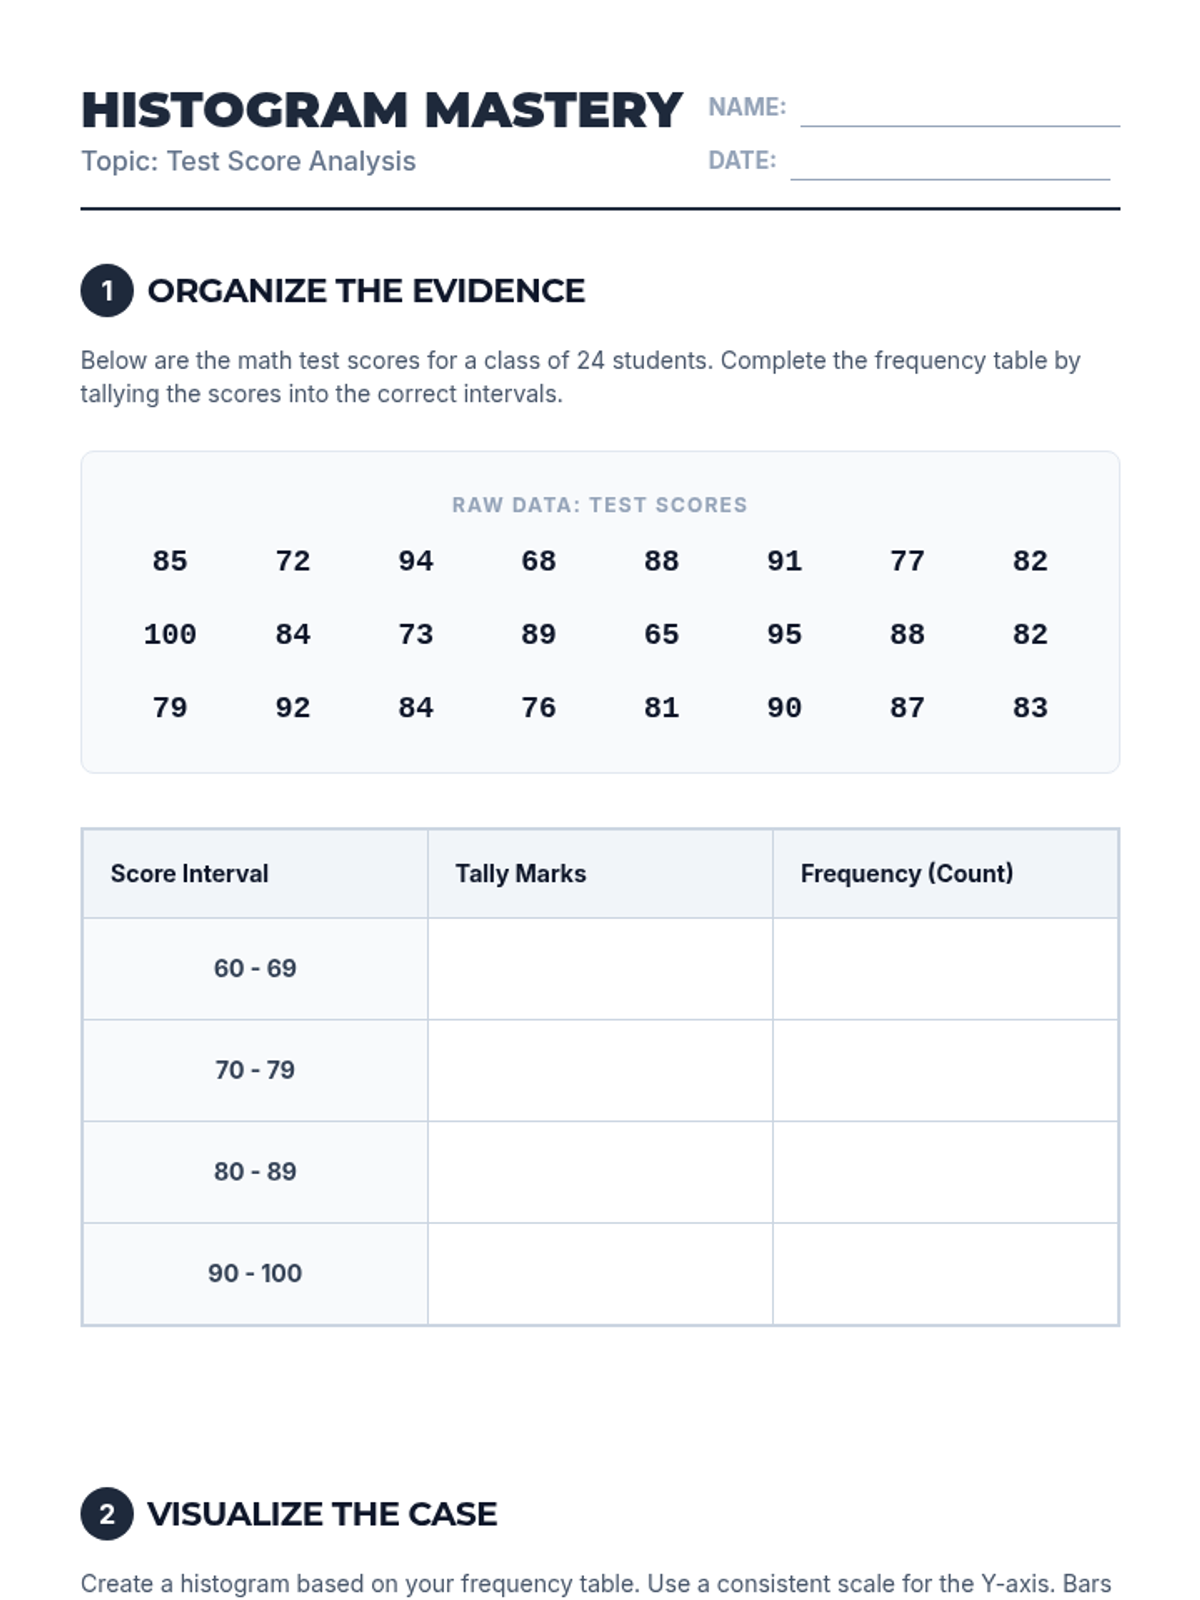
A comprehensive 90-minute math lesson focused on organizing data into intervals and creating/interpreting histograms using test score data. Students act as 'Data Detectives' to uncover trends in numerical information.
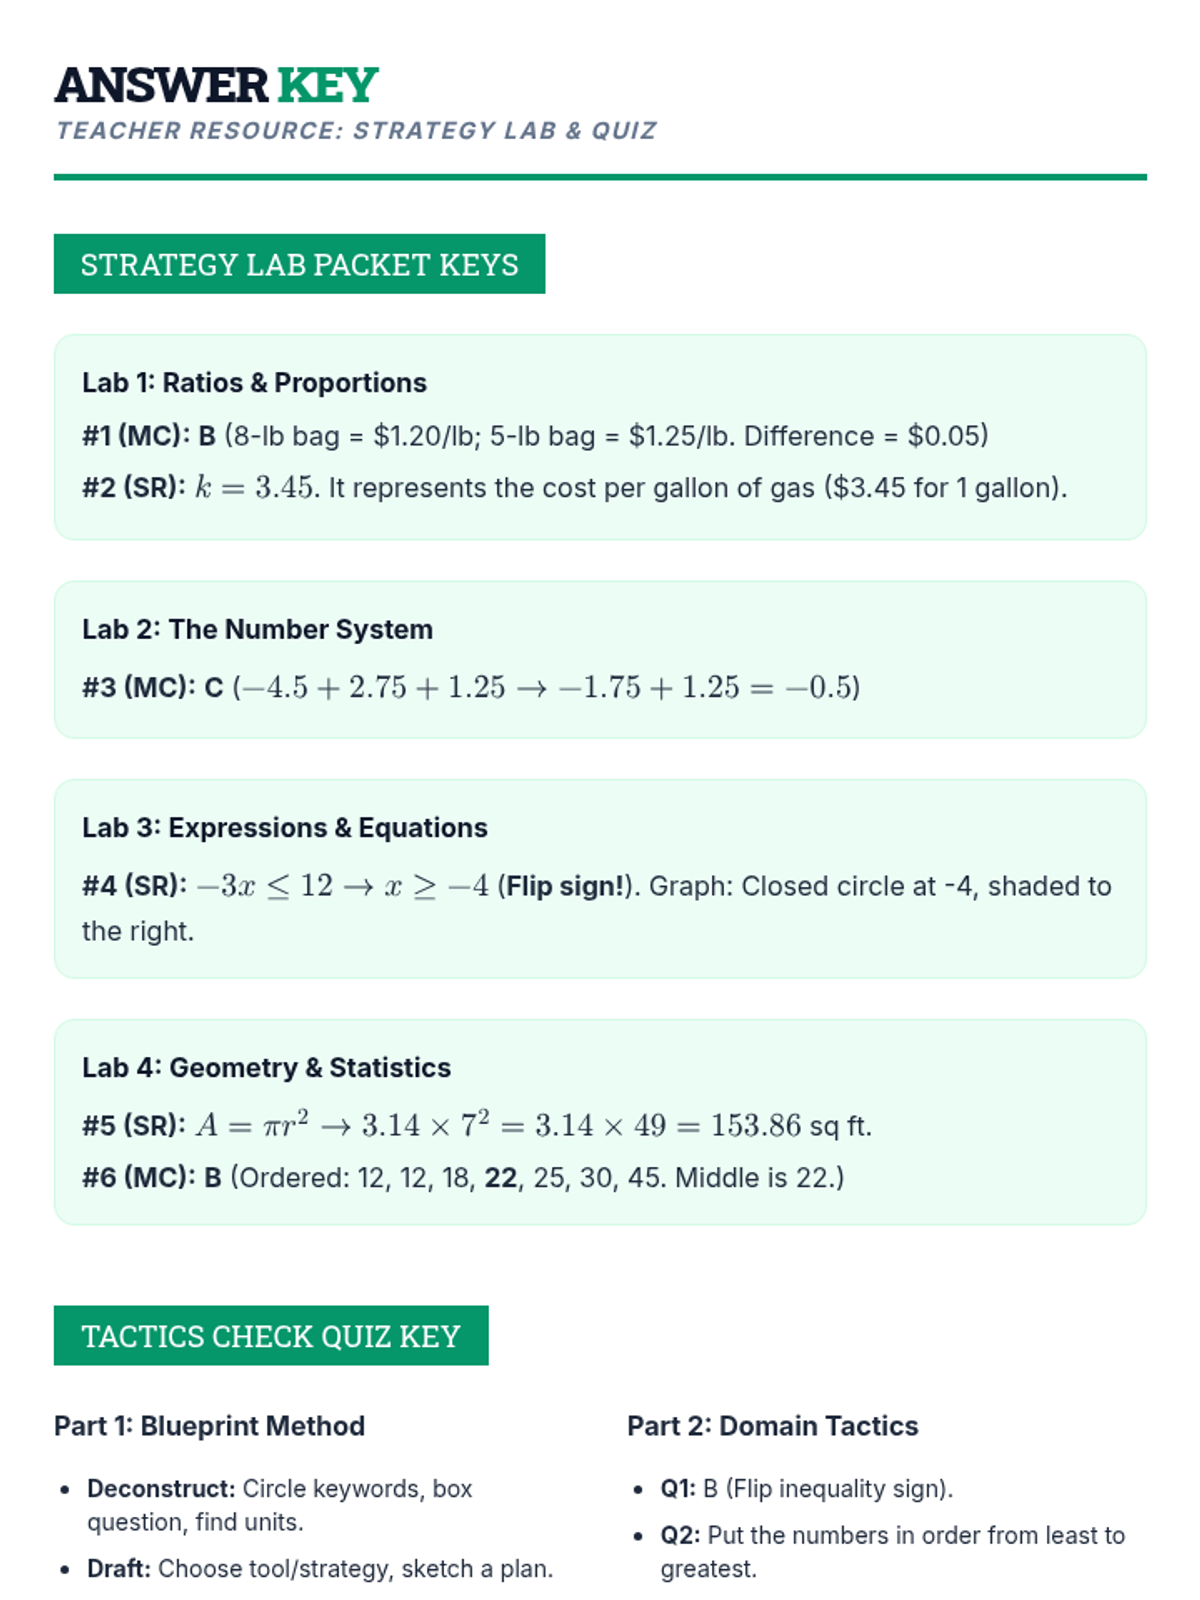
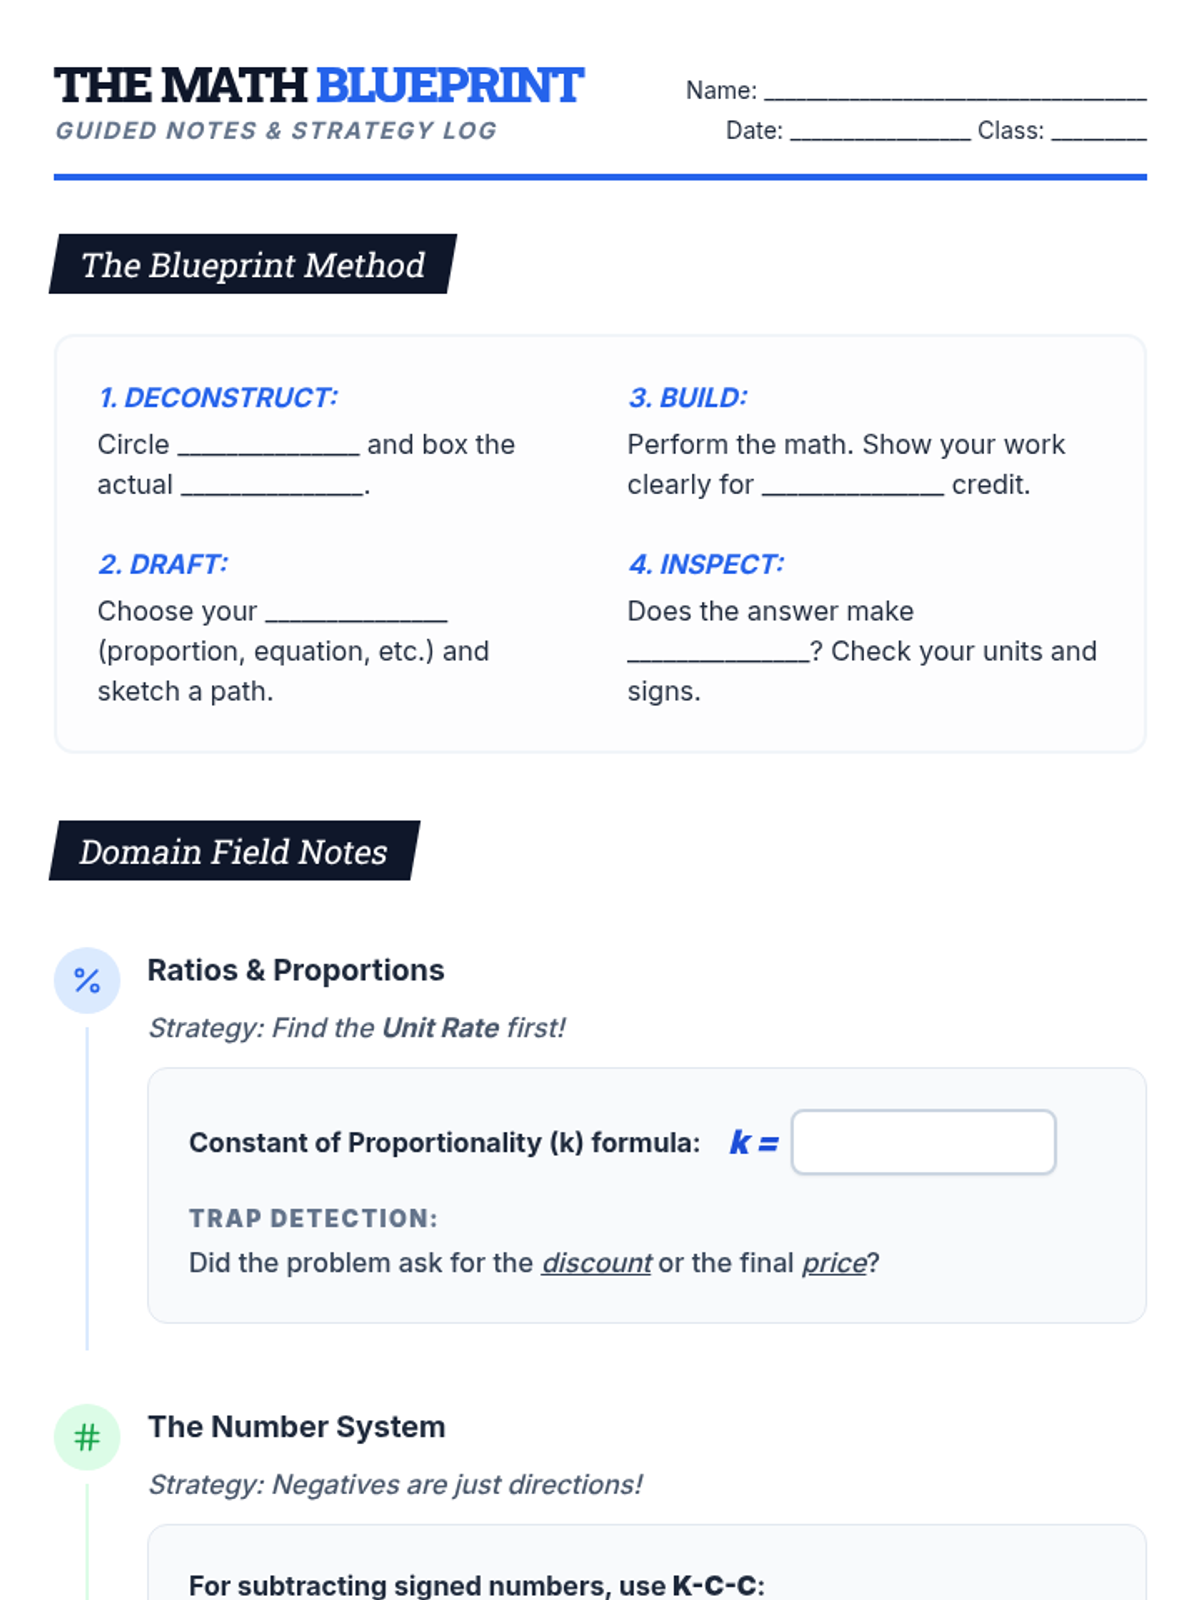
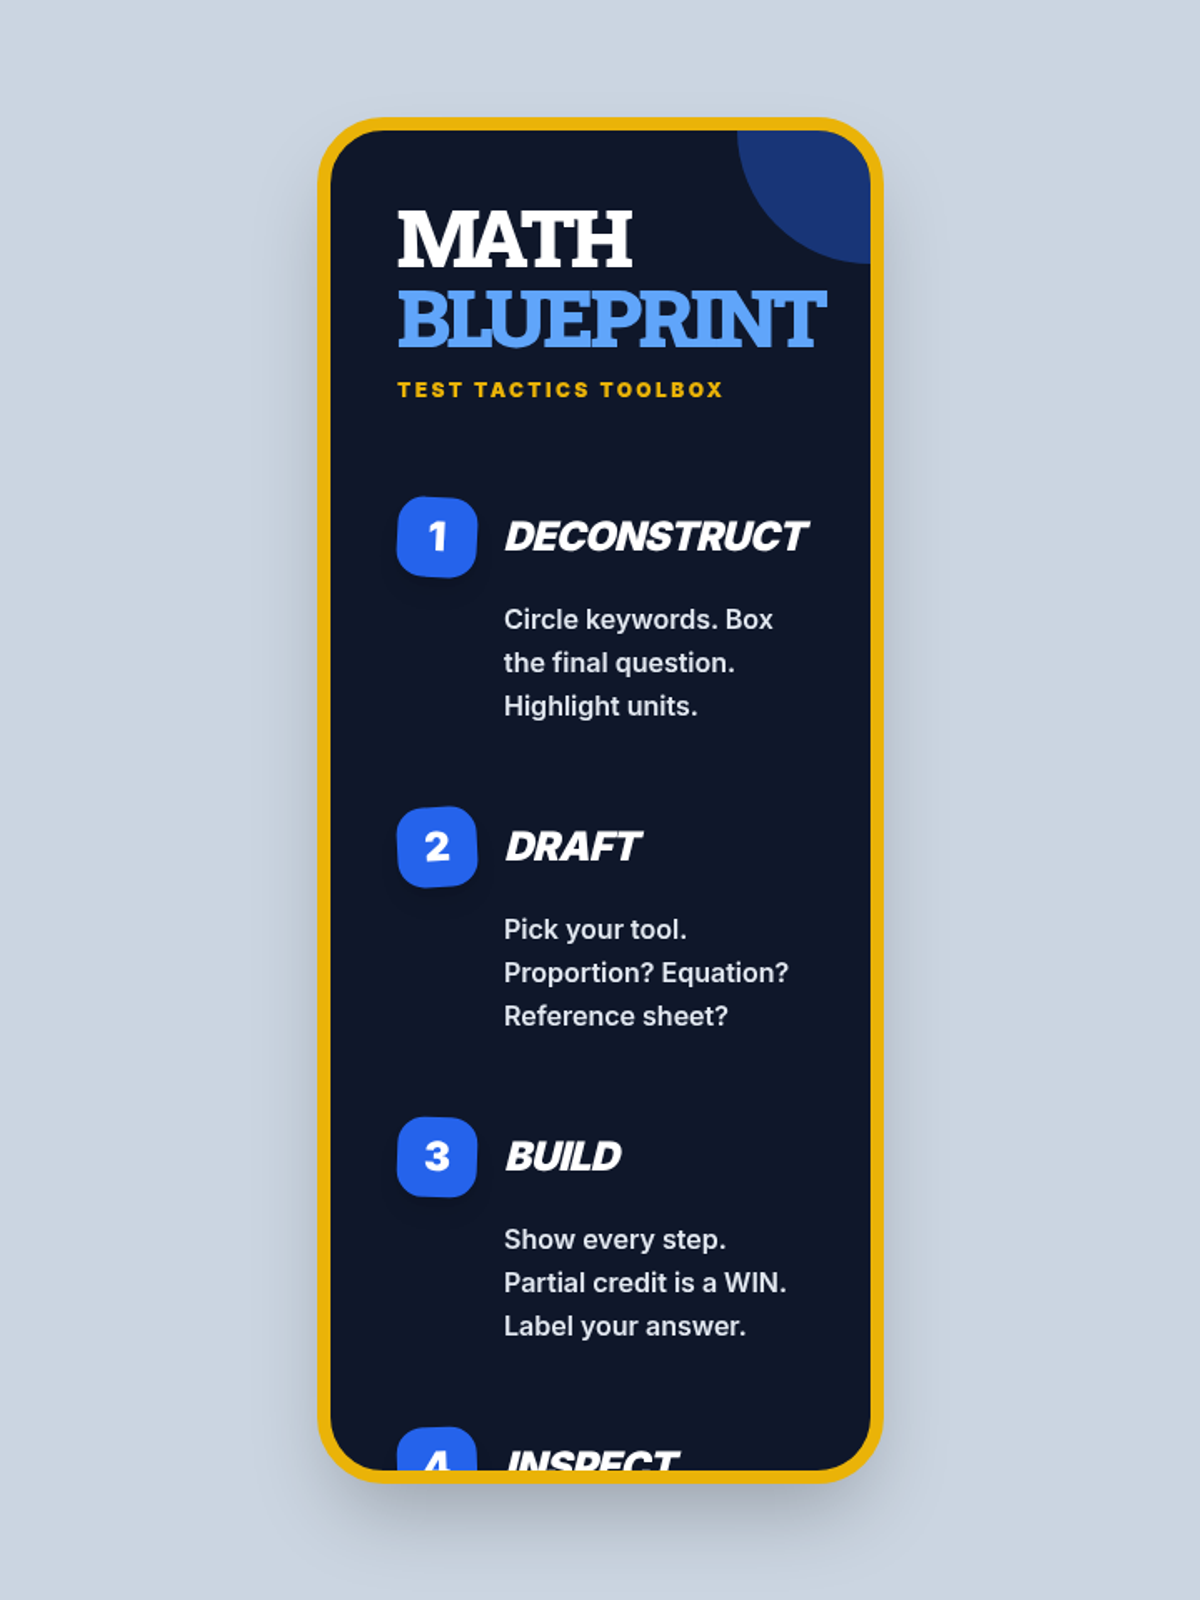
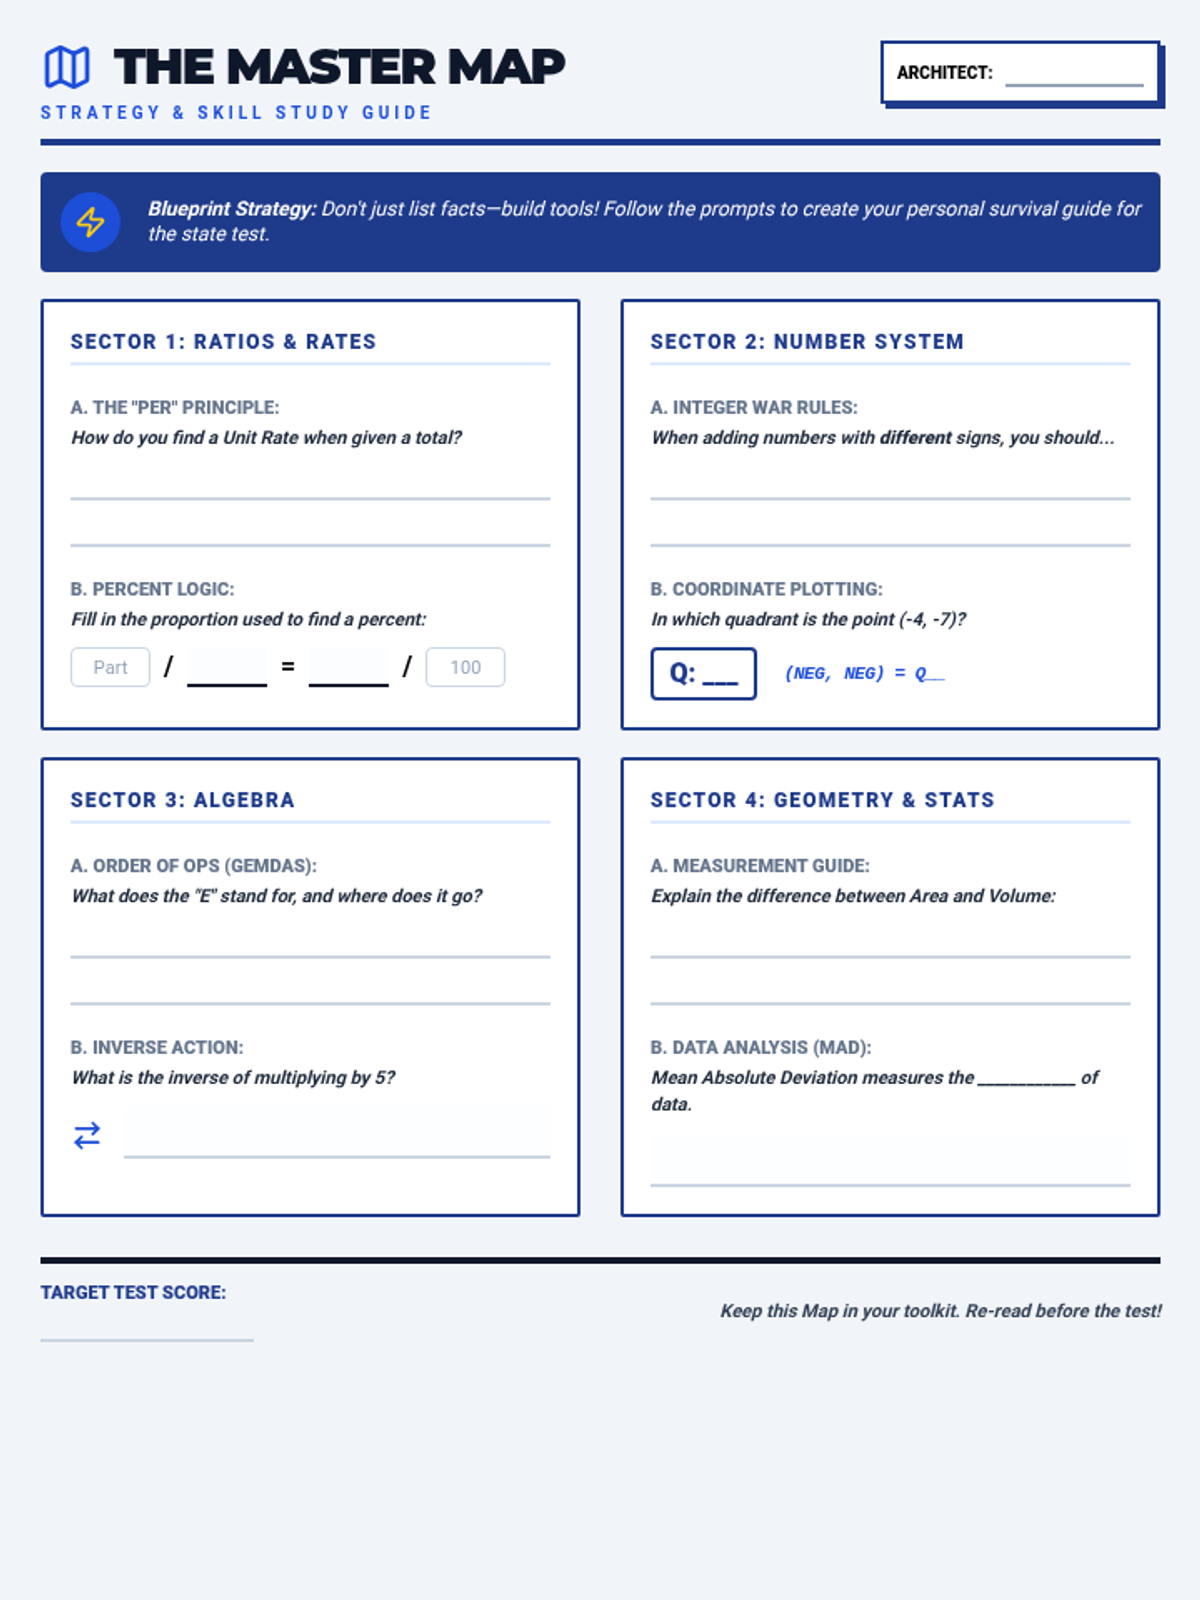
A comprehensive 7th-grade math lesson focused on test-taking strategies for the NYS exam, covering Ratios, Number Systems, Expressions, Geometry, and Statistics. Students learn the 'Blueprint Method' for deconstructing complex problems and apply specific tactics to standard-aligned questions.
An all-in-one review lesson covering the five major 6th-grade math domains. Designed for IEP support with visual scaffolds and simplified 2-option choices.
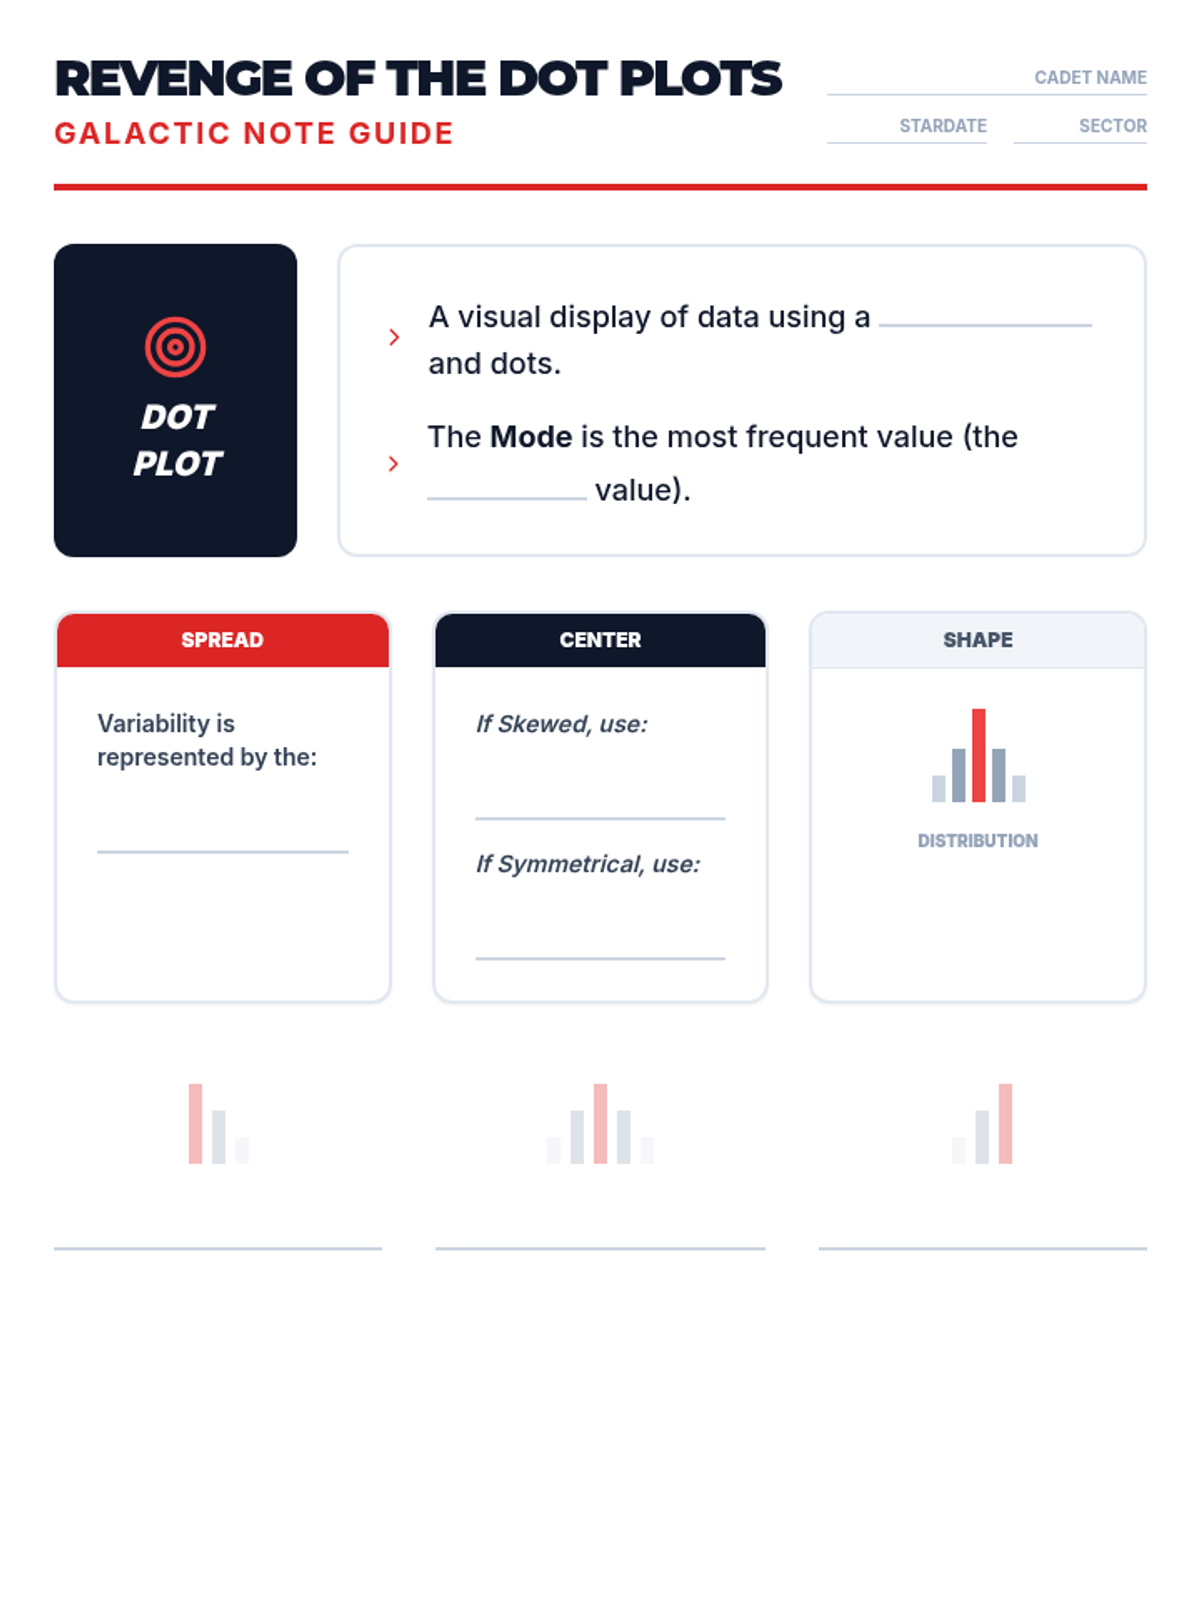
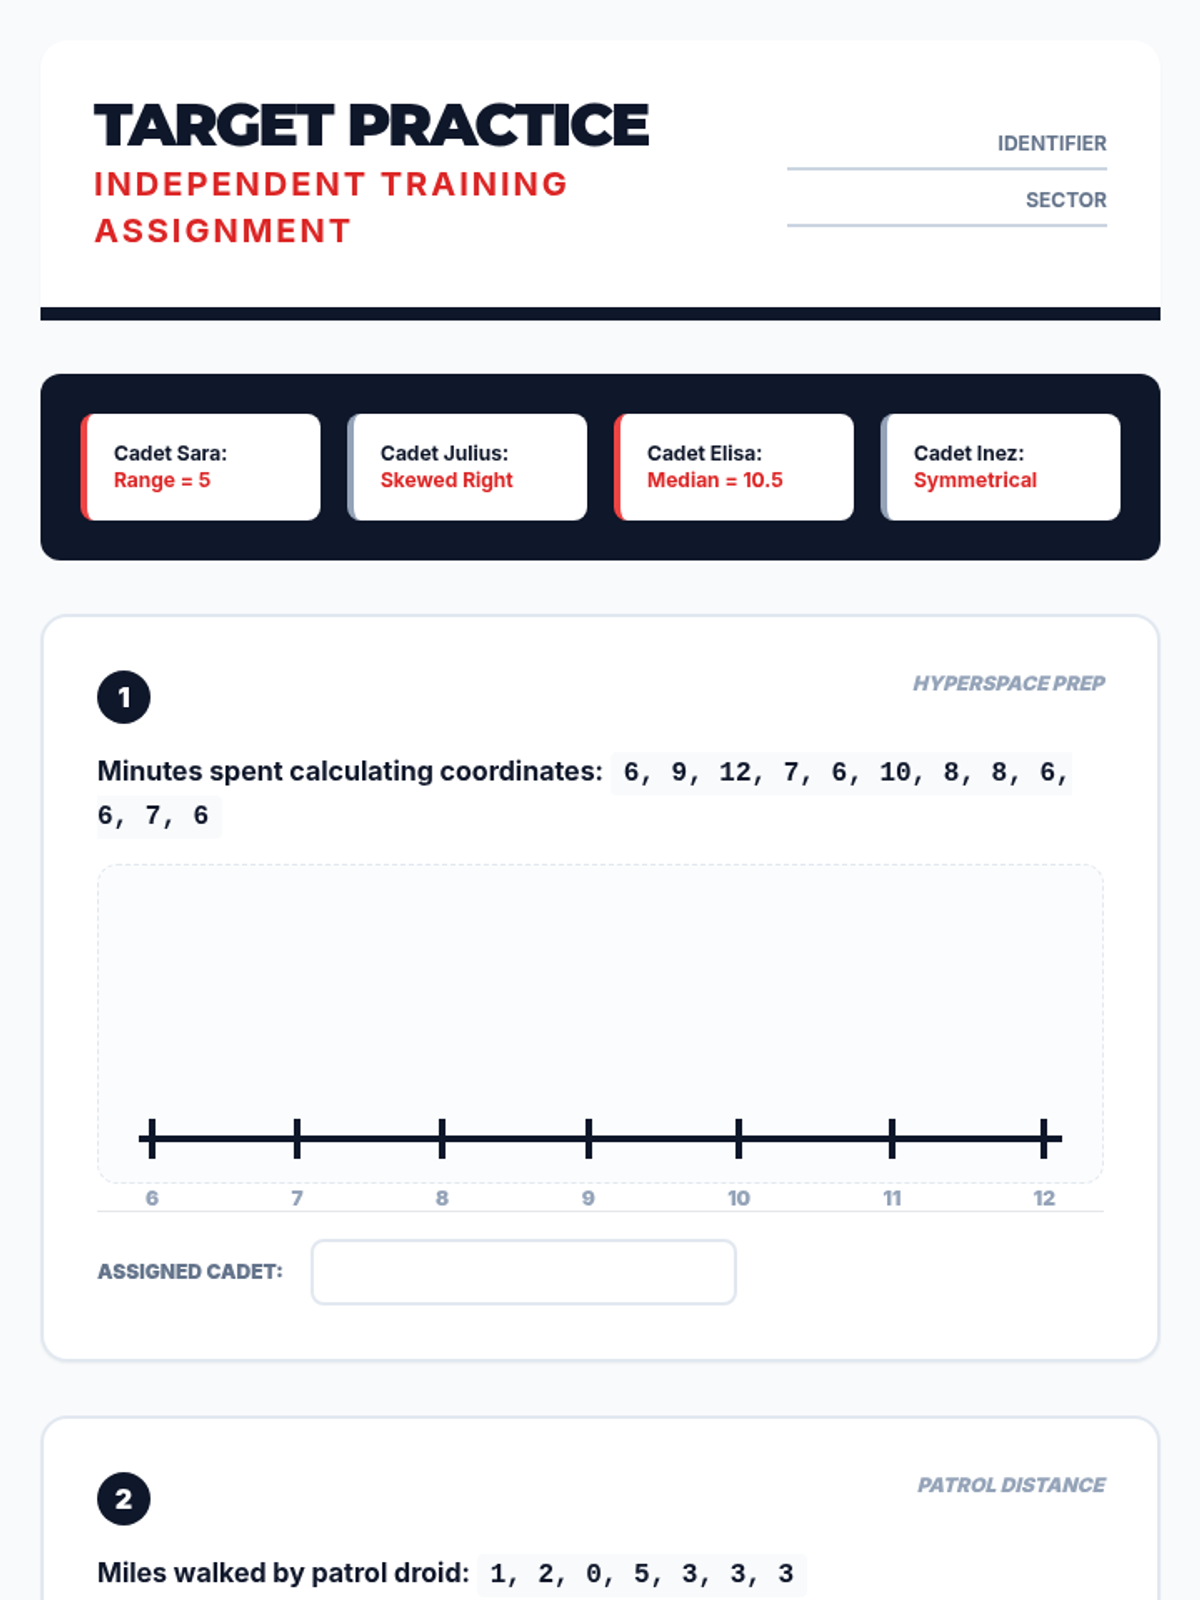
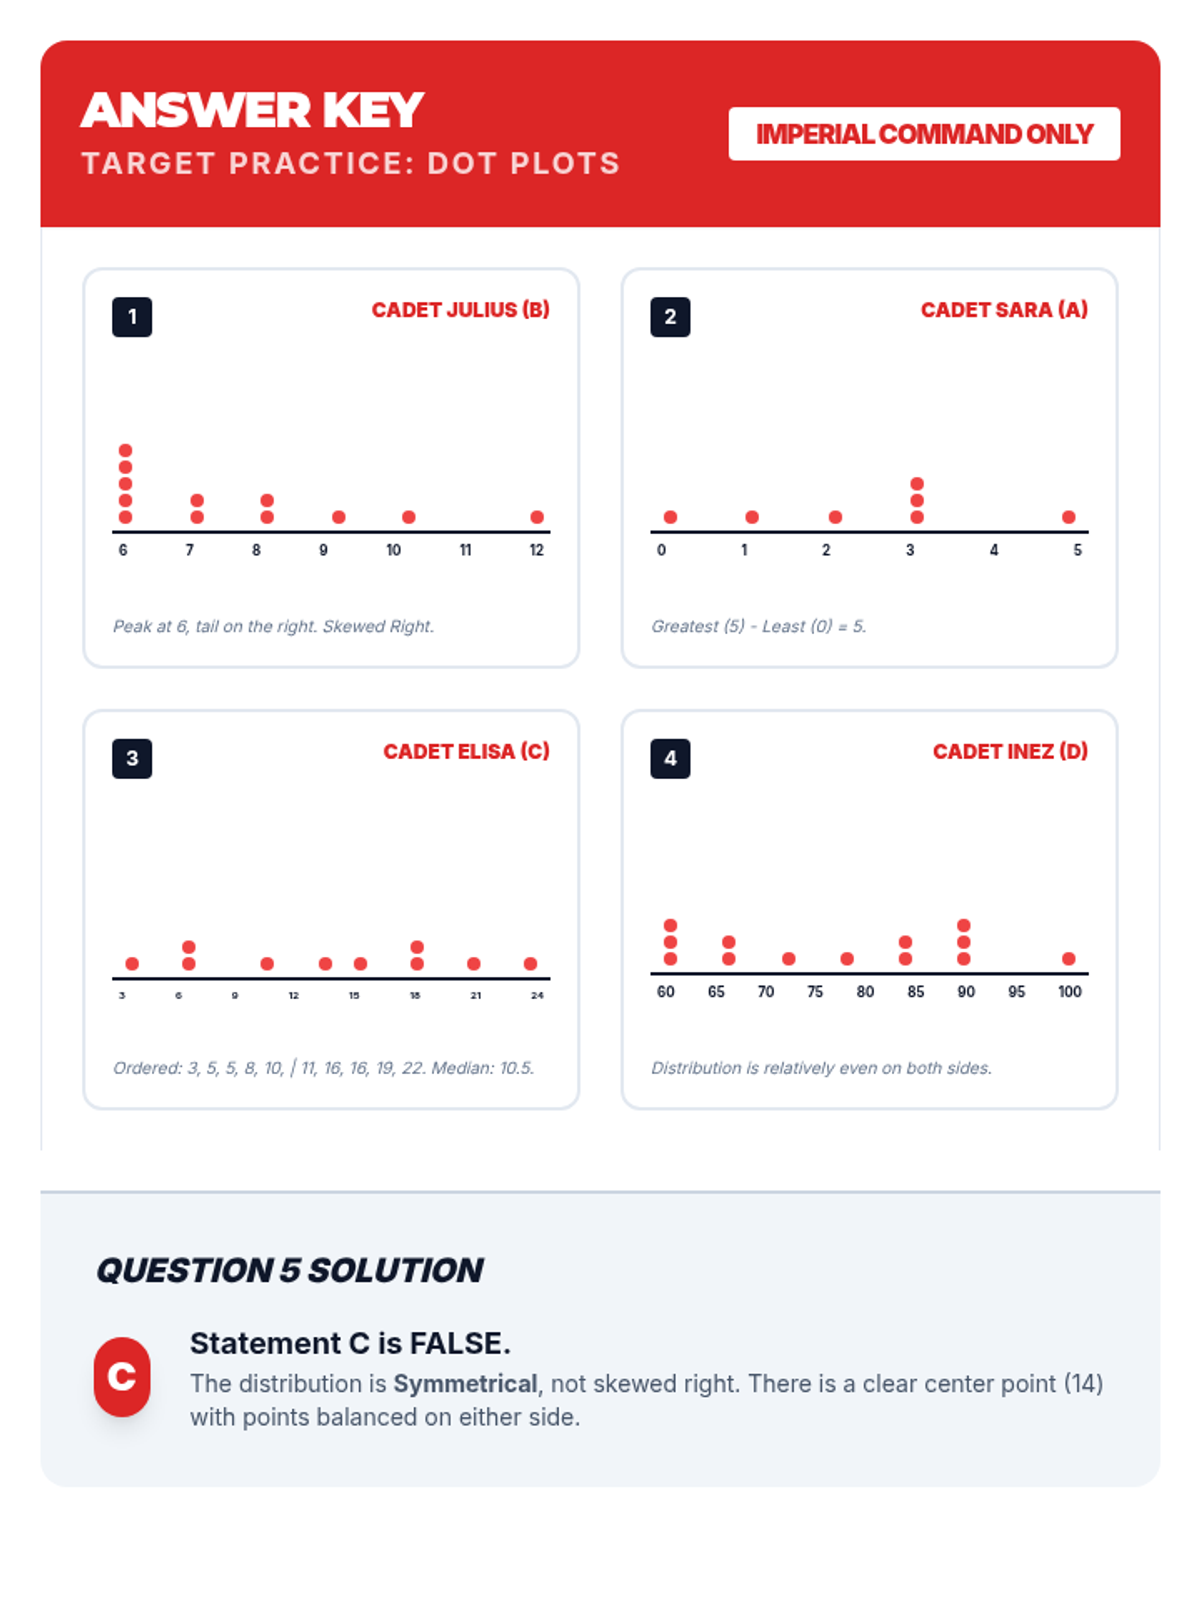
A Star Wars-themed lesson on Data and Statistics focusing on creating and interpreting dot plots, featuring Stormtrooper accuracy data and galactic scenarios.
A comprehensive diagnostic assessment designed to evaluate a student's readiness for 7th-grade mathematics, covering key 6th-grade standards including ratios, the number system, expressions, and geometry.
A hands-on math project where students design carnival games to explore theoretical versus experimental probability through data collection and analysis.
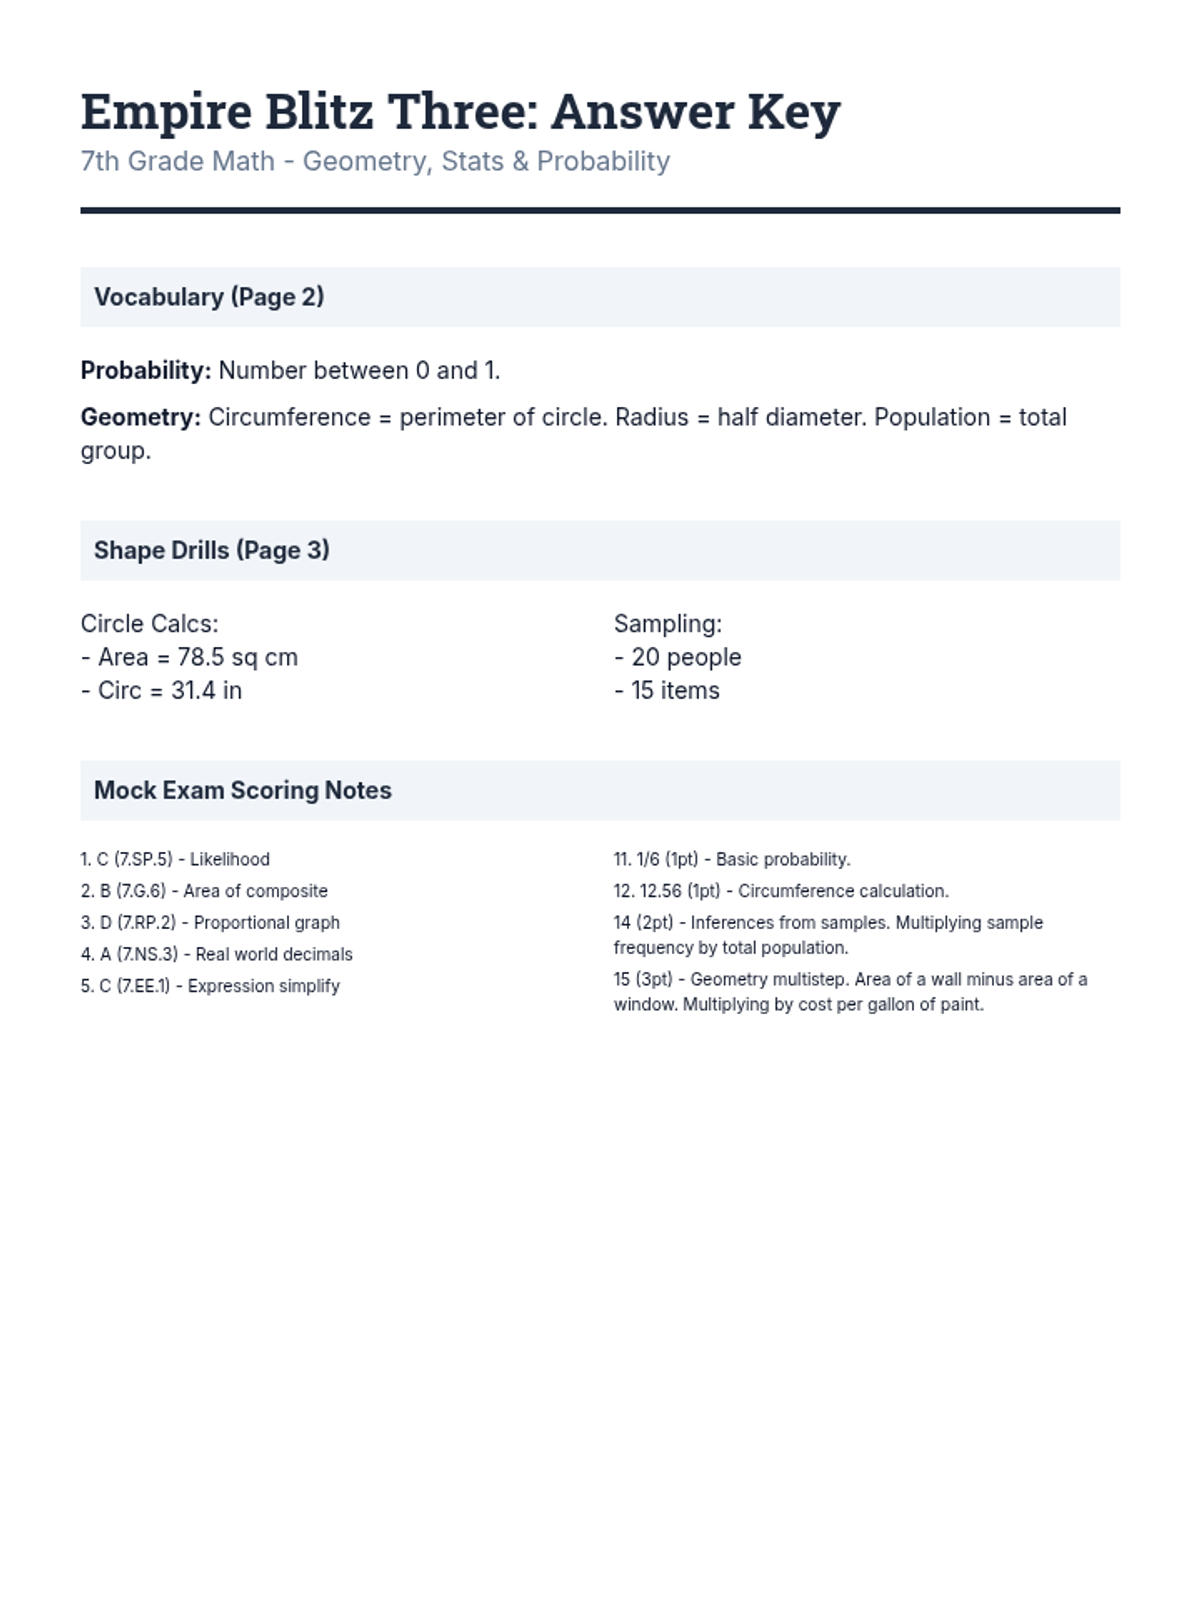
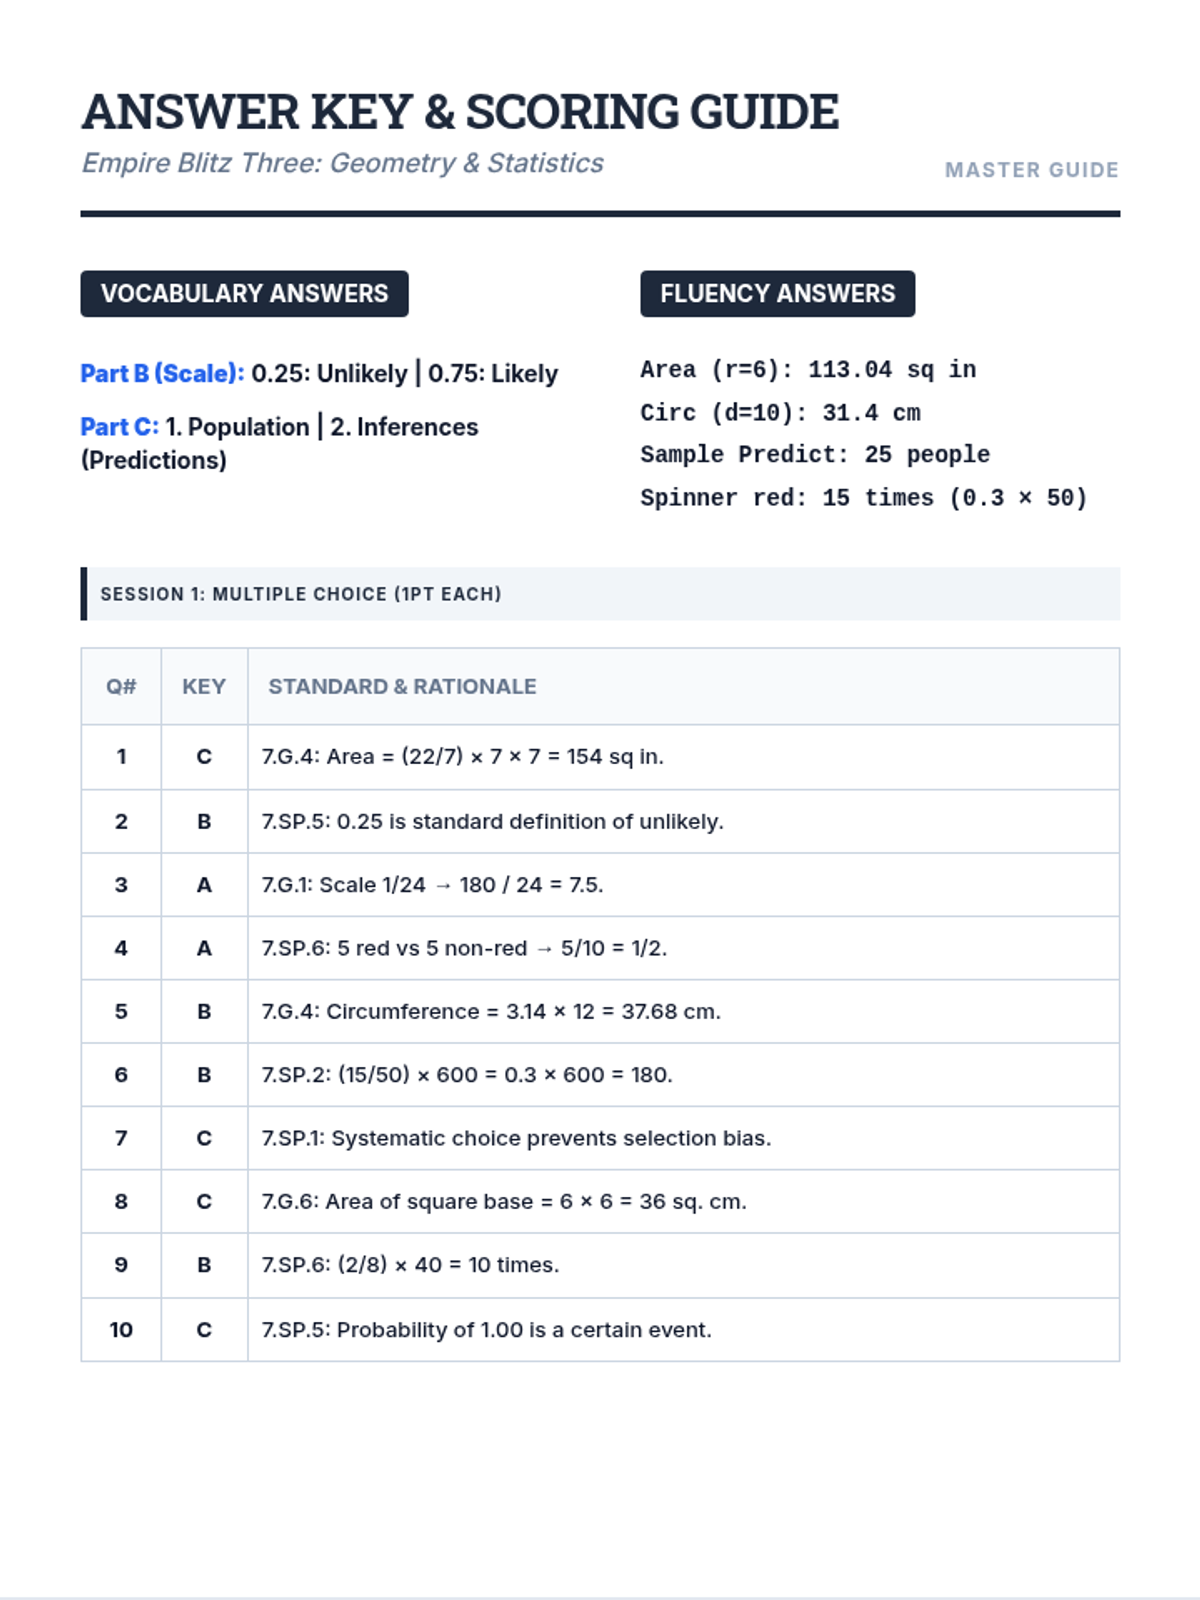
The third packet in the test prep series, highlighting Geometry and Statistics/Probability within a full-spectrum review of 7th grade math requirements.
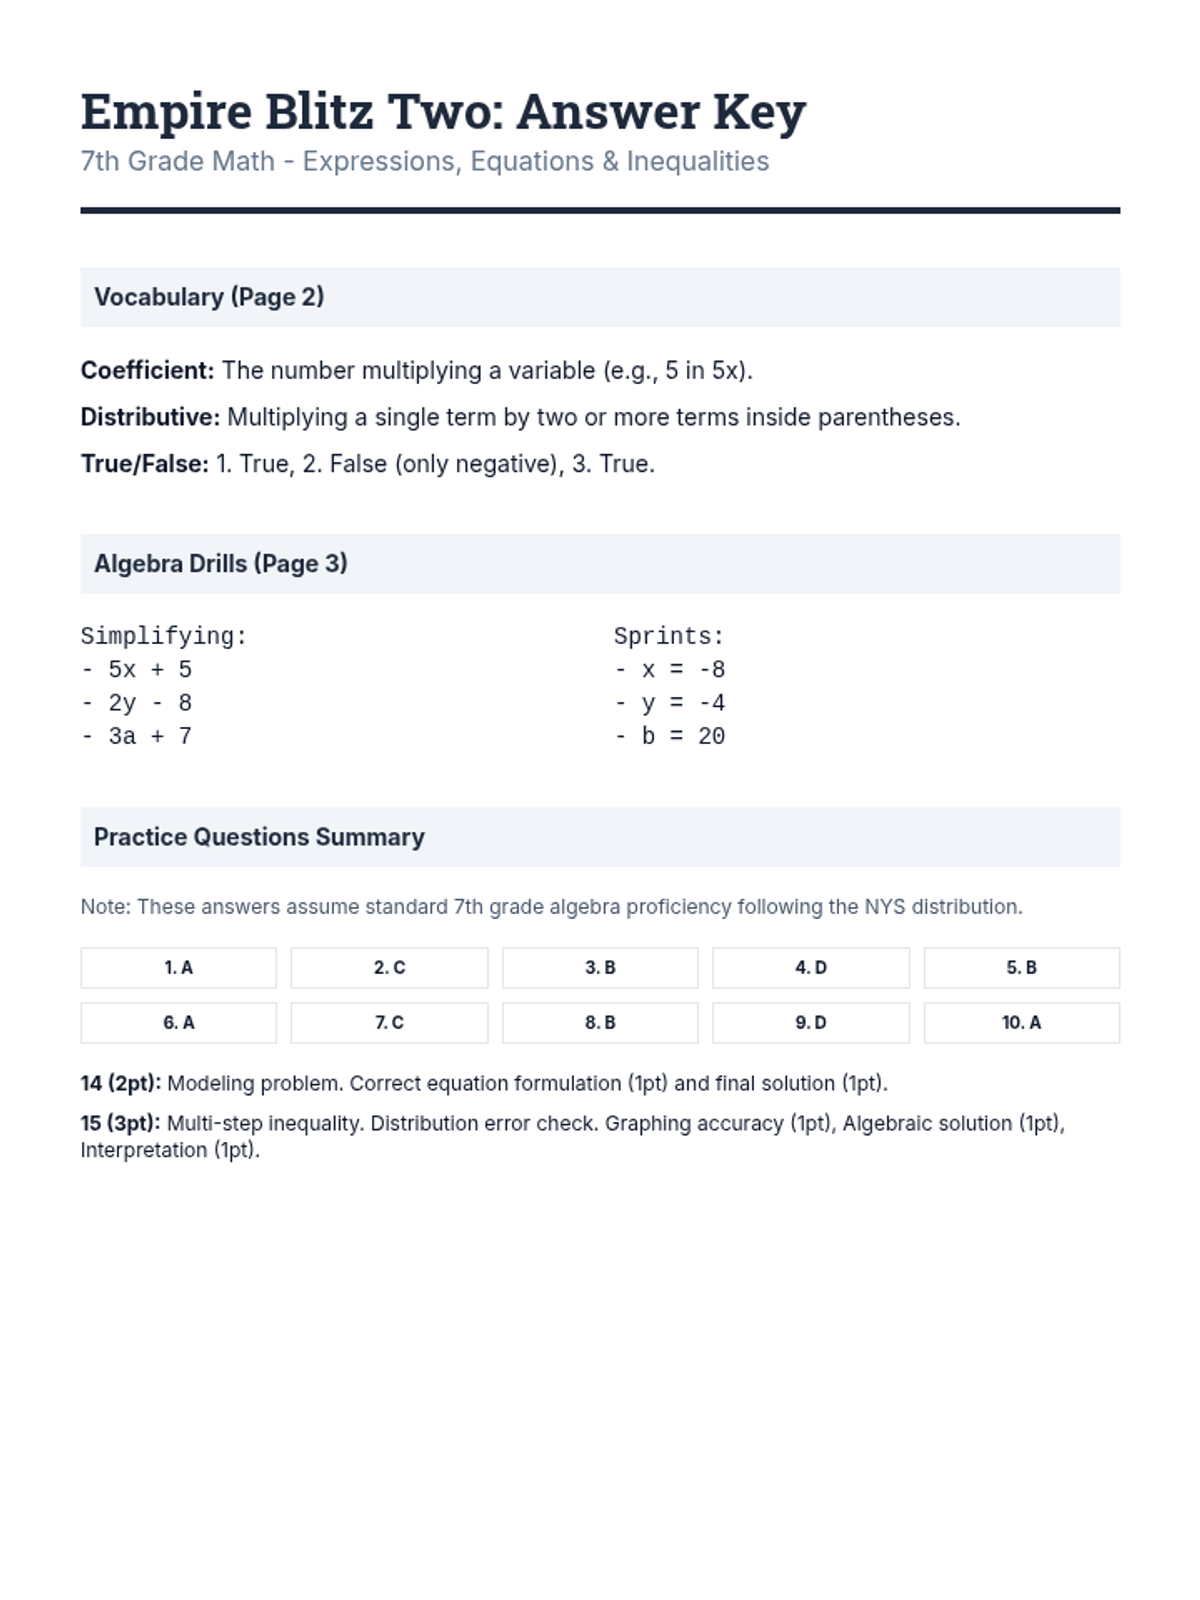
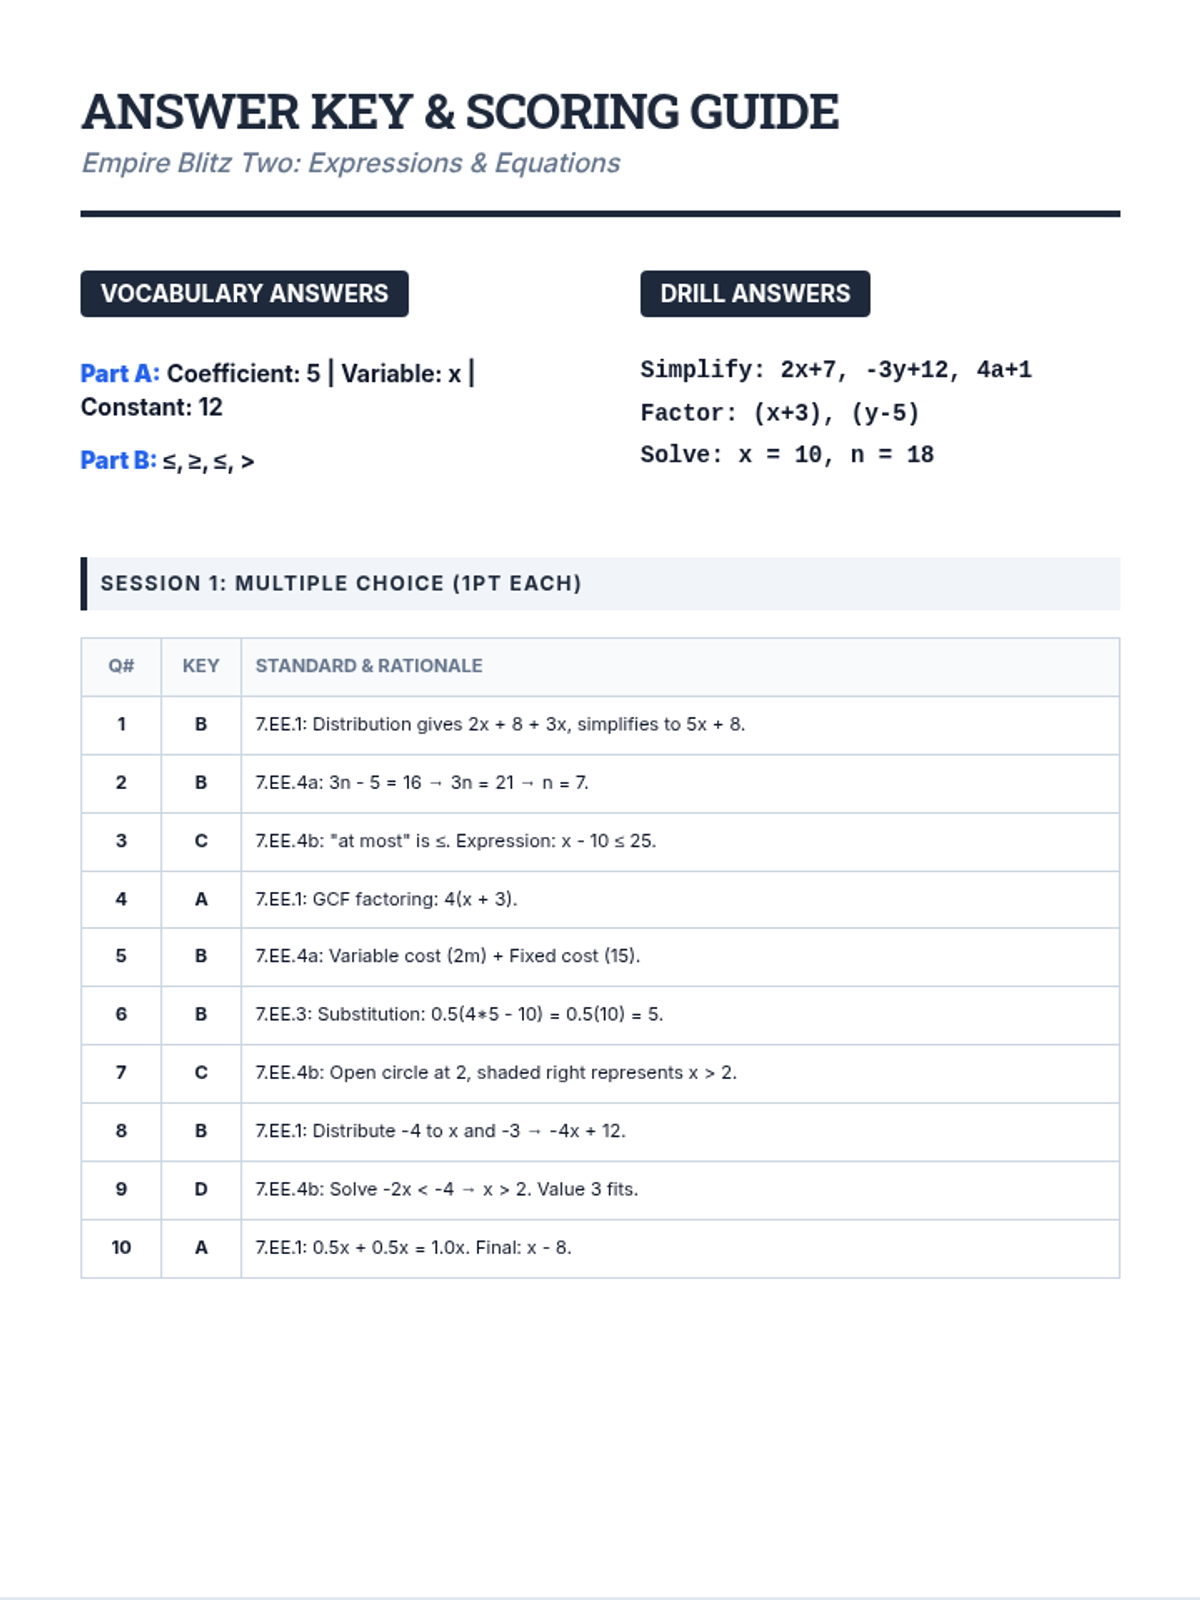
The second packet in the test prep series, with an emphasis on Expressions, Equations, and Inequalities, alongside a balanced distribution of other 7th grade standards.
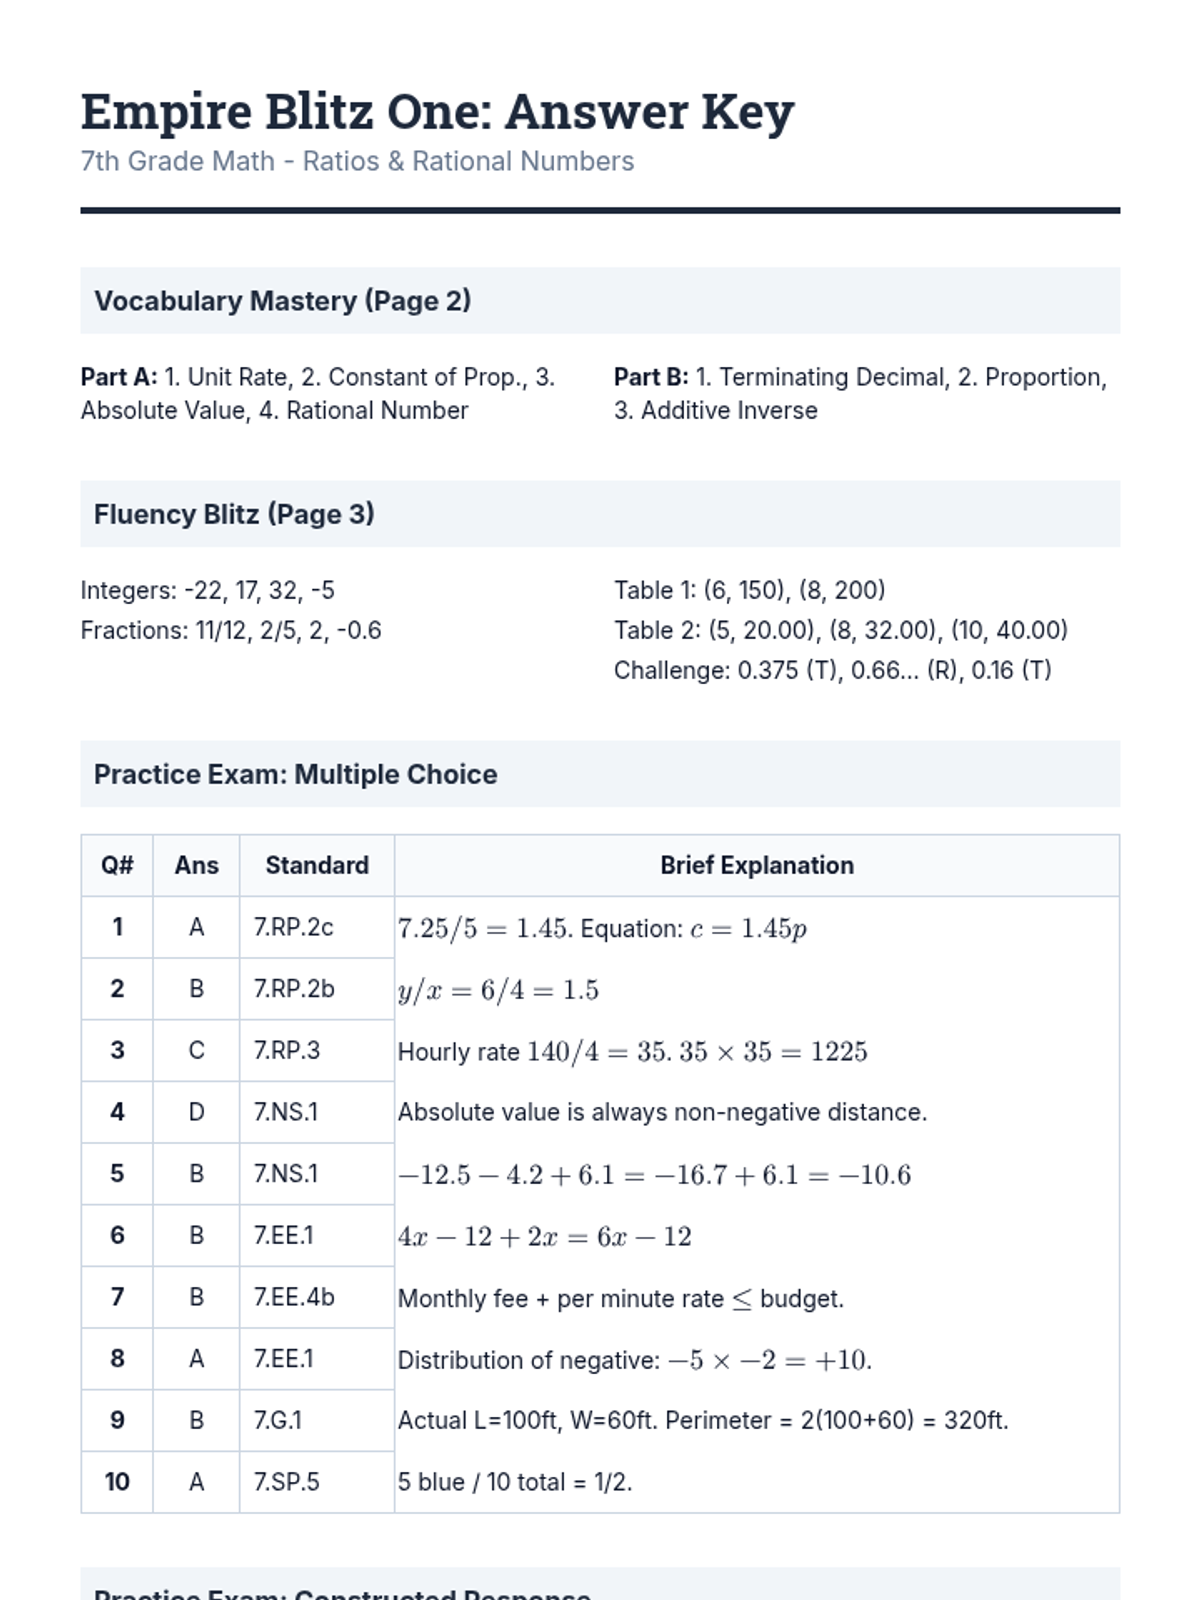
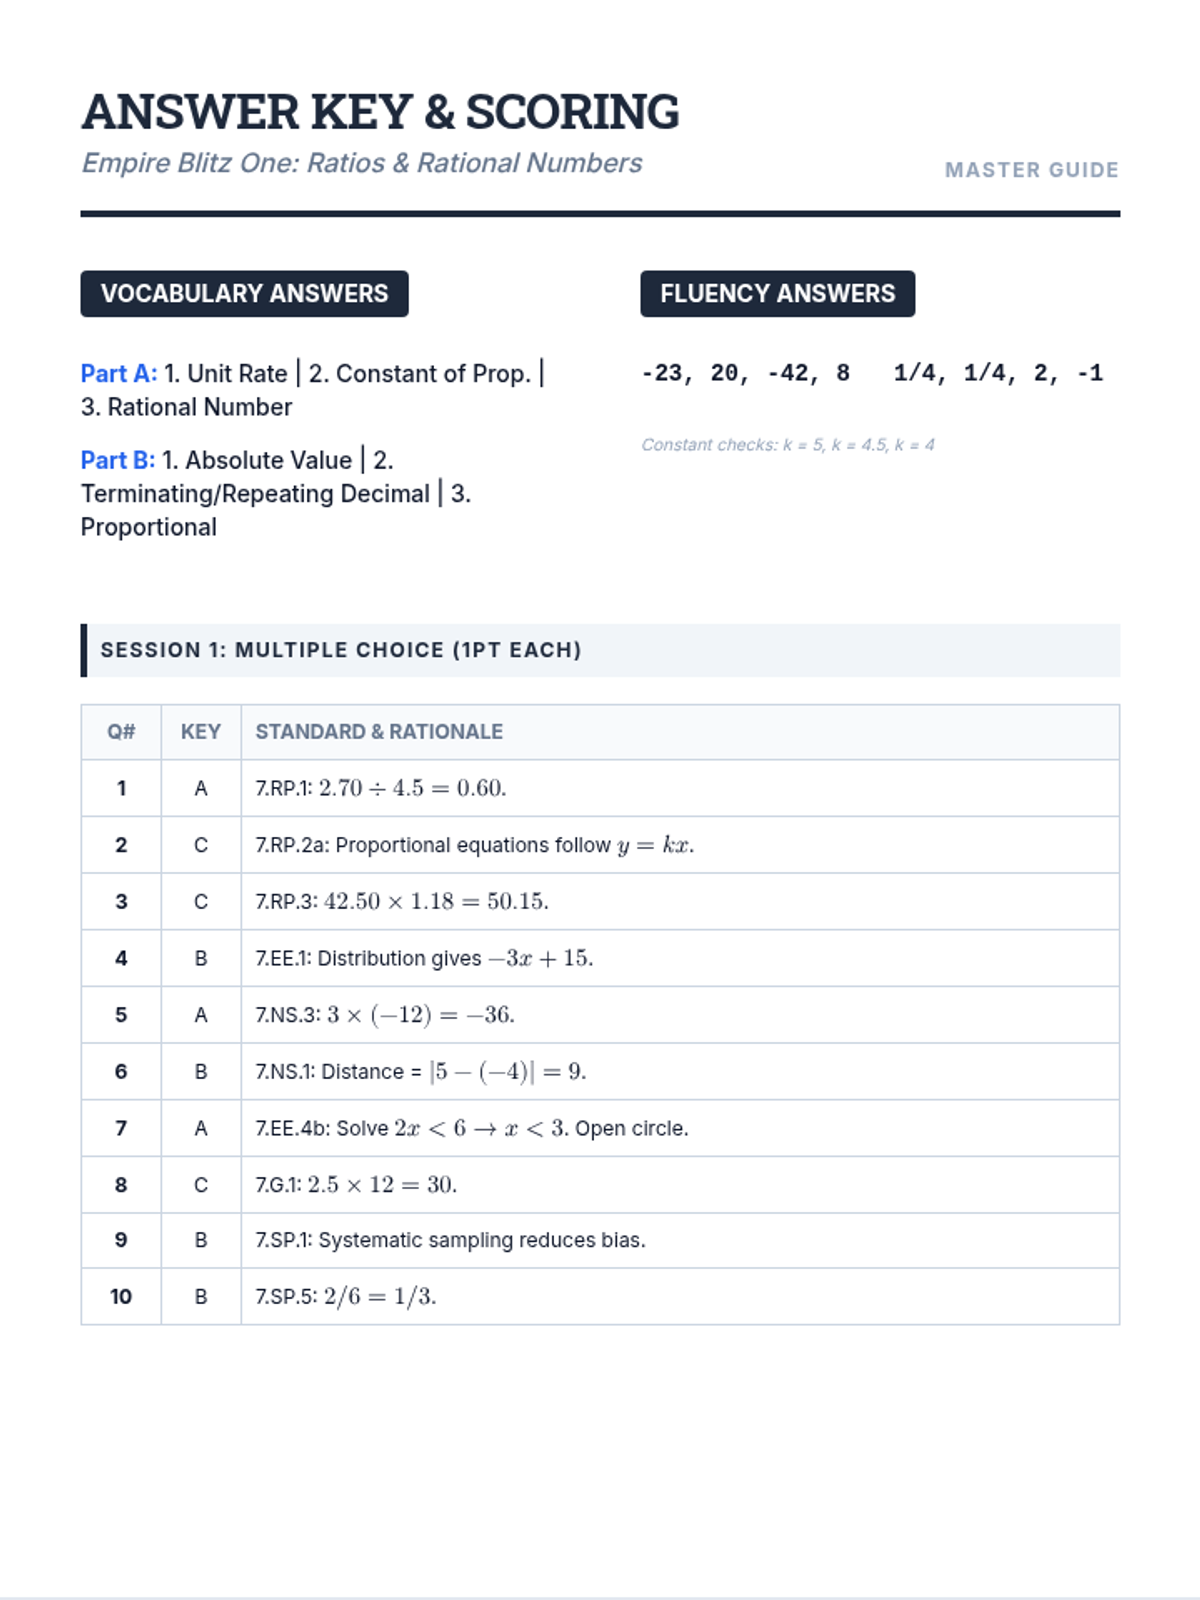
The first packet in the test prep series, focusing on Ratio and Proportional Relationships and the Number System, while maintaining a representative mix of all 7th grade domains.
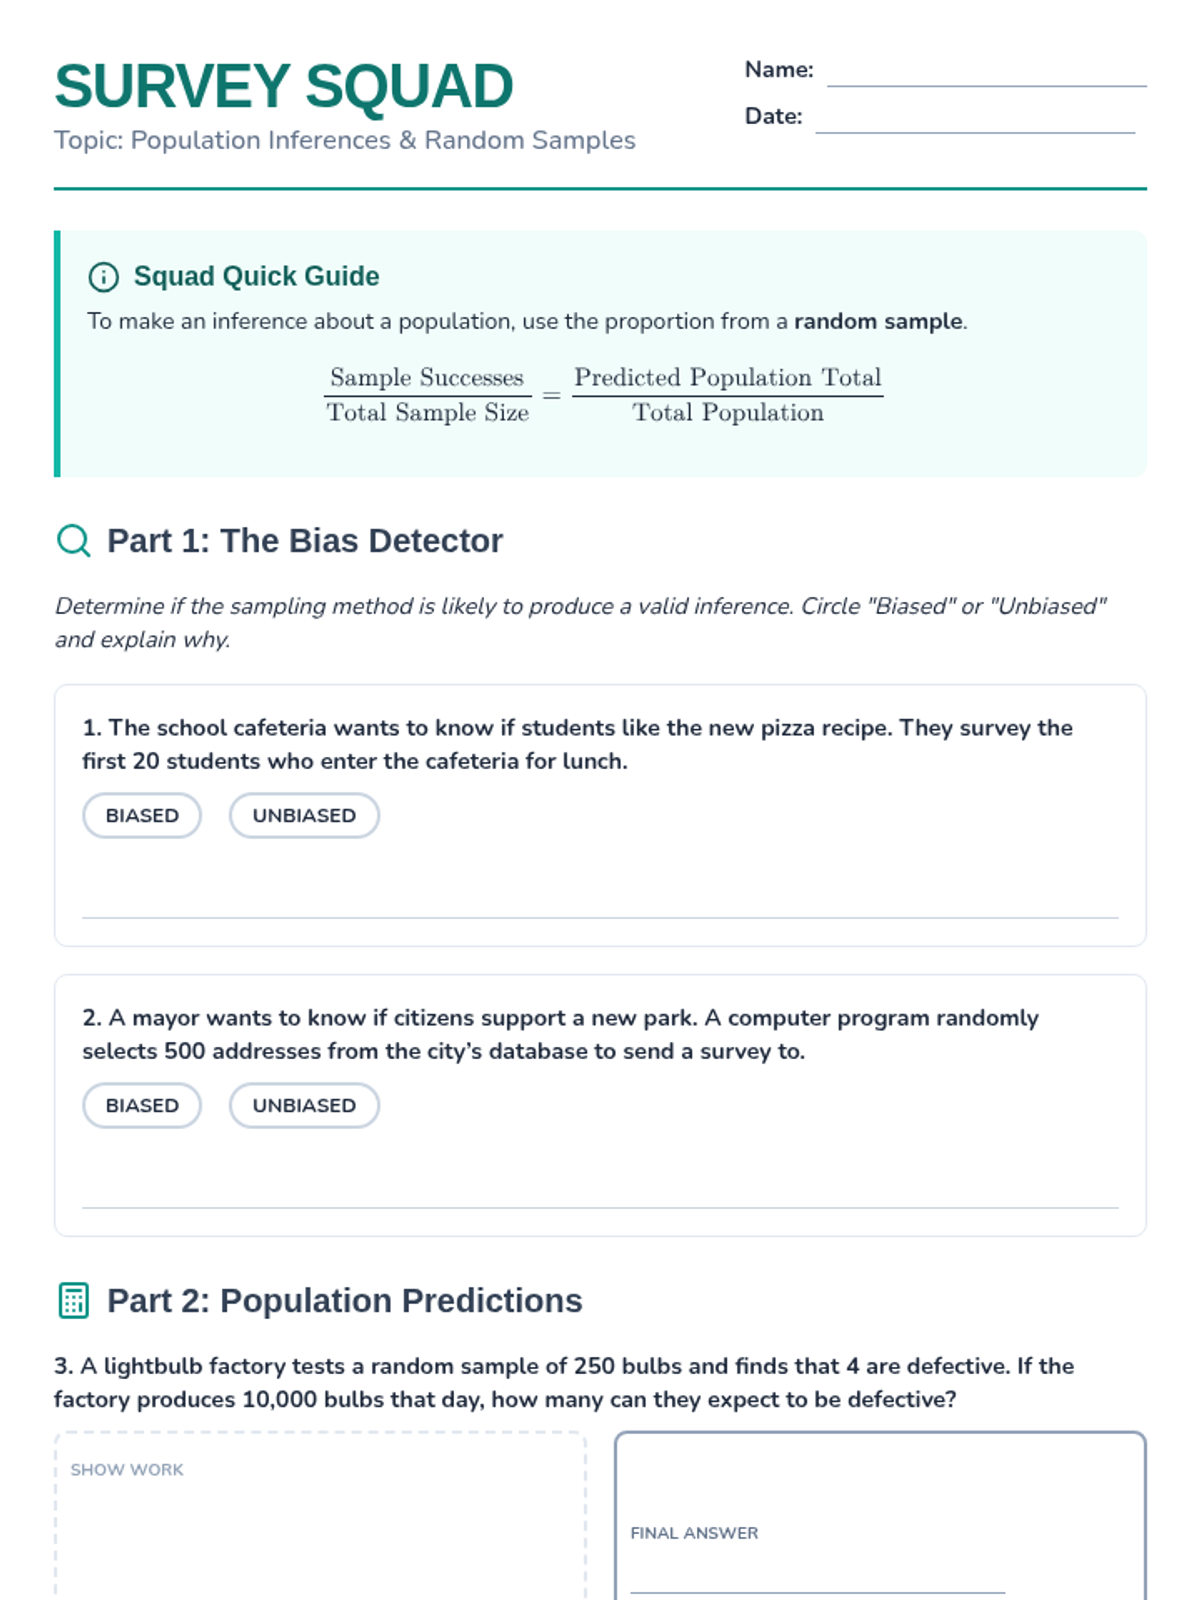
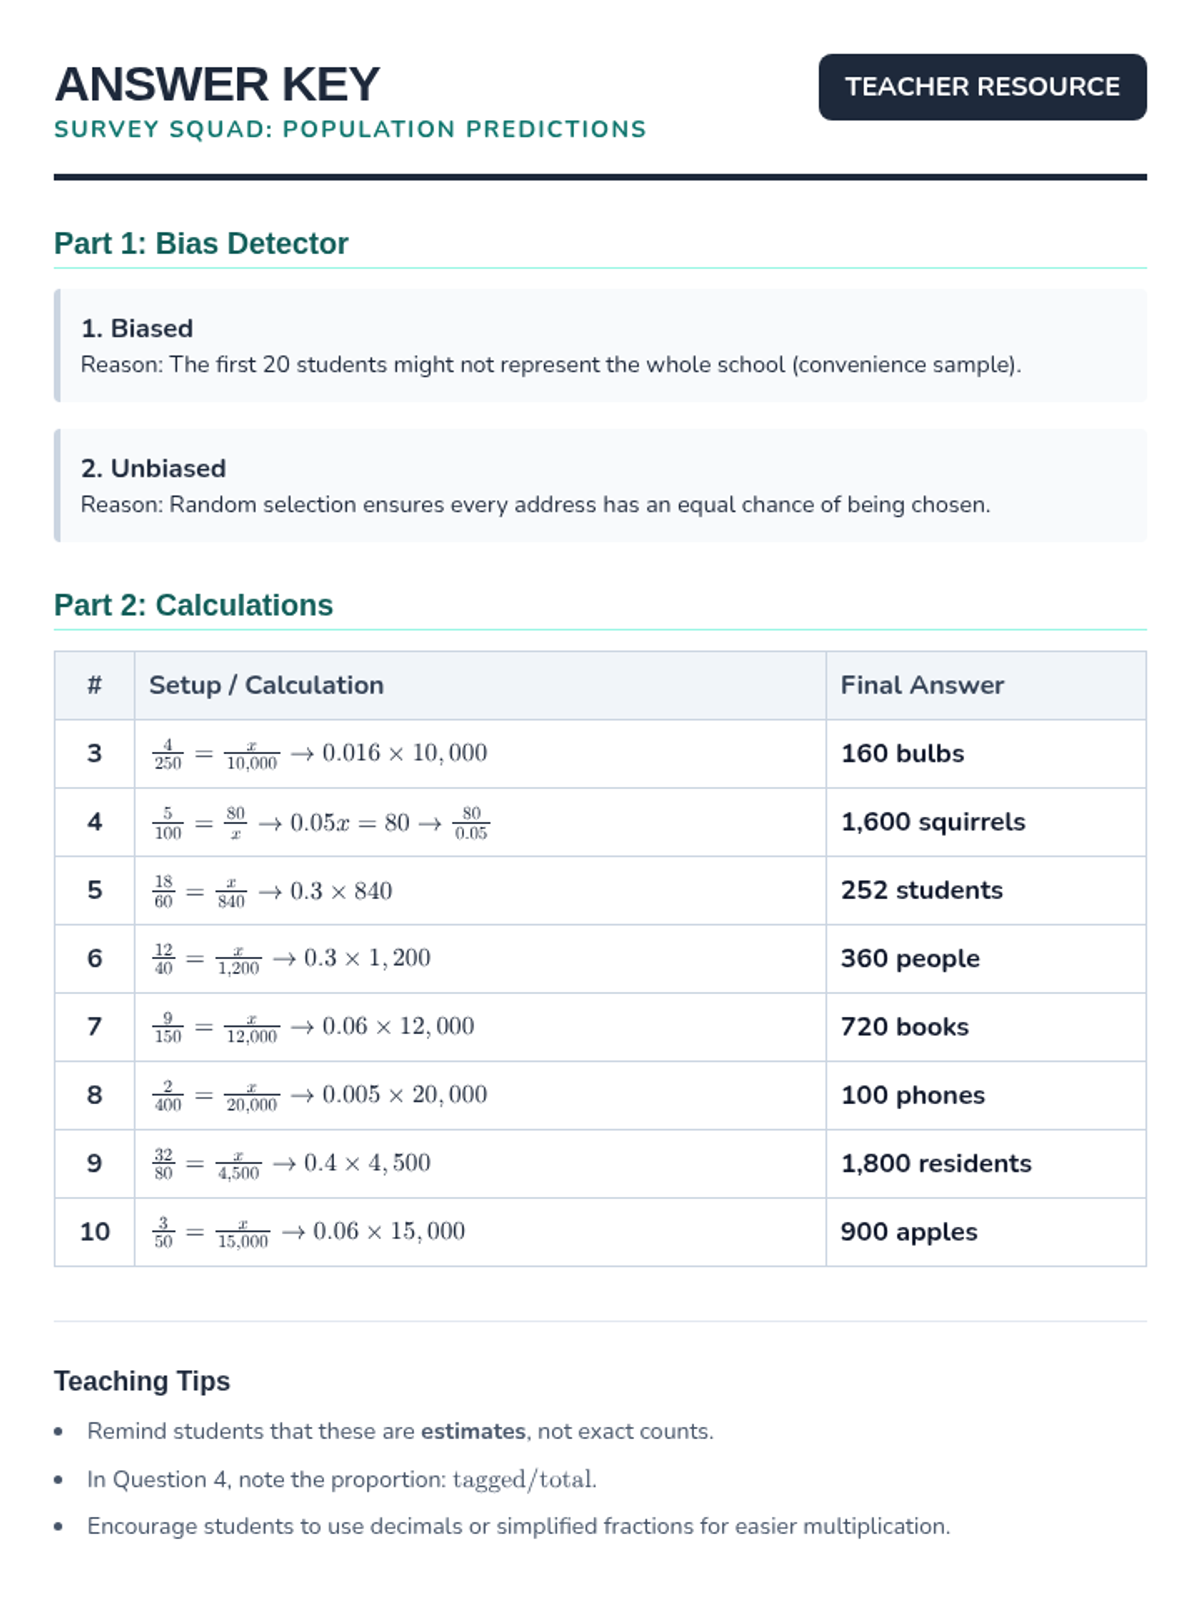
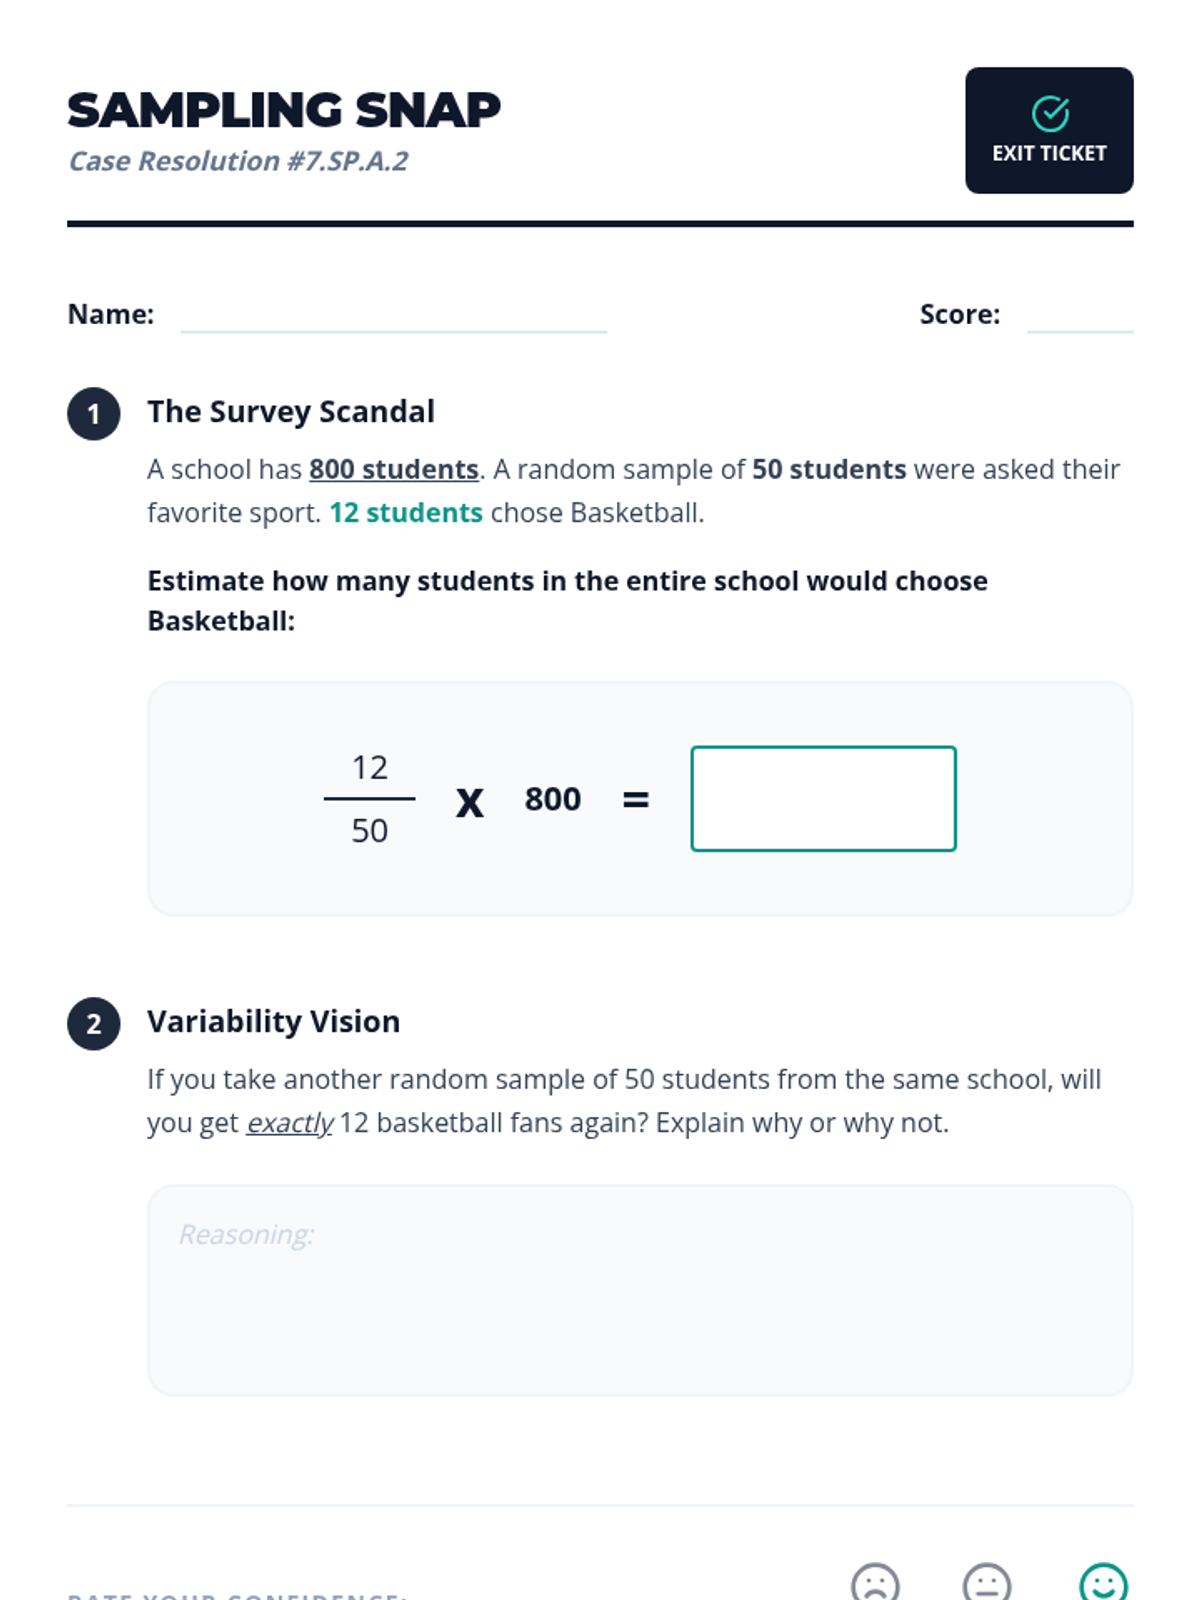
A lesson focused on using random sampling to make valid inferences about populations, including identifying bias and performing calculations.
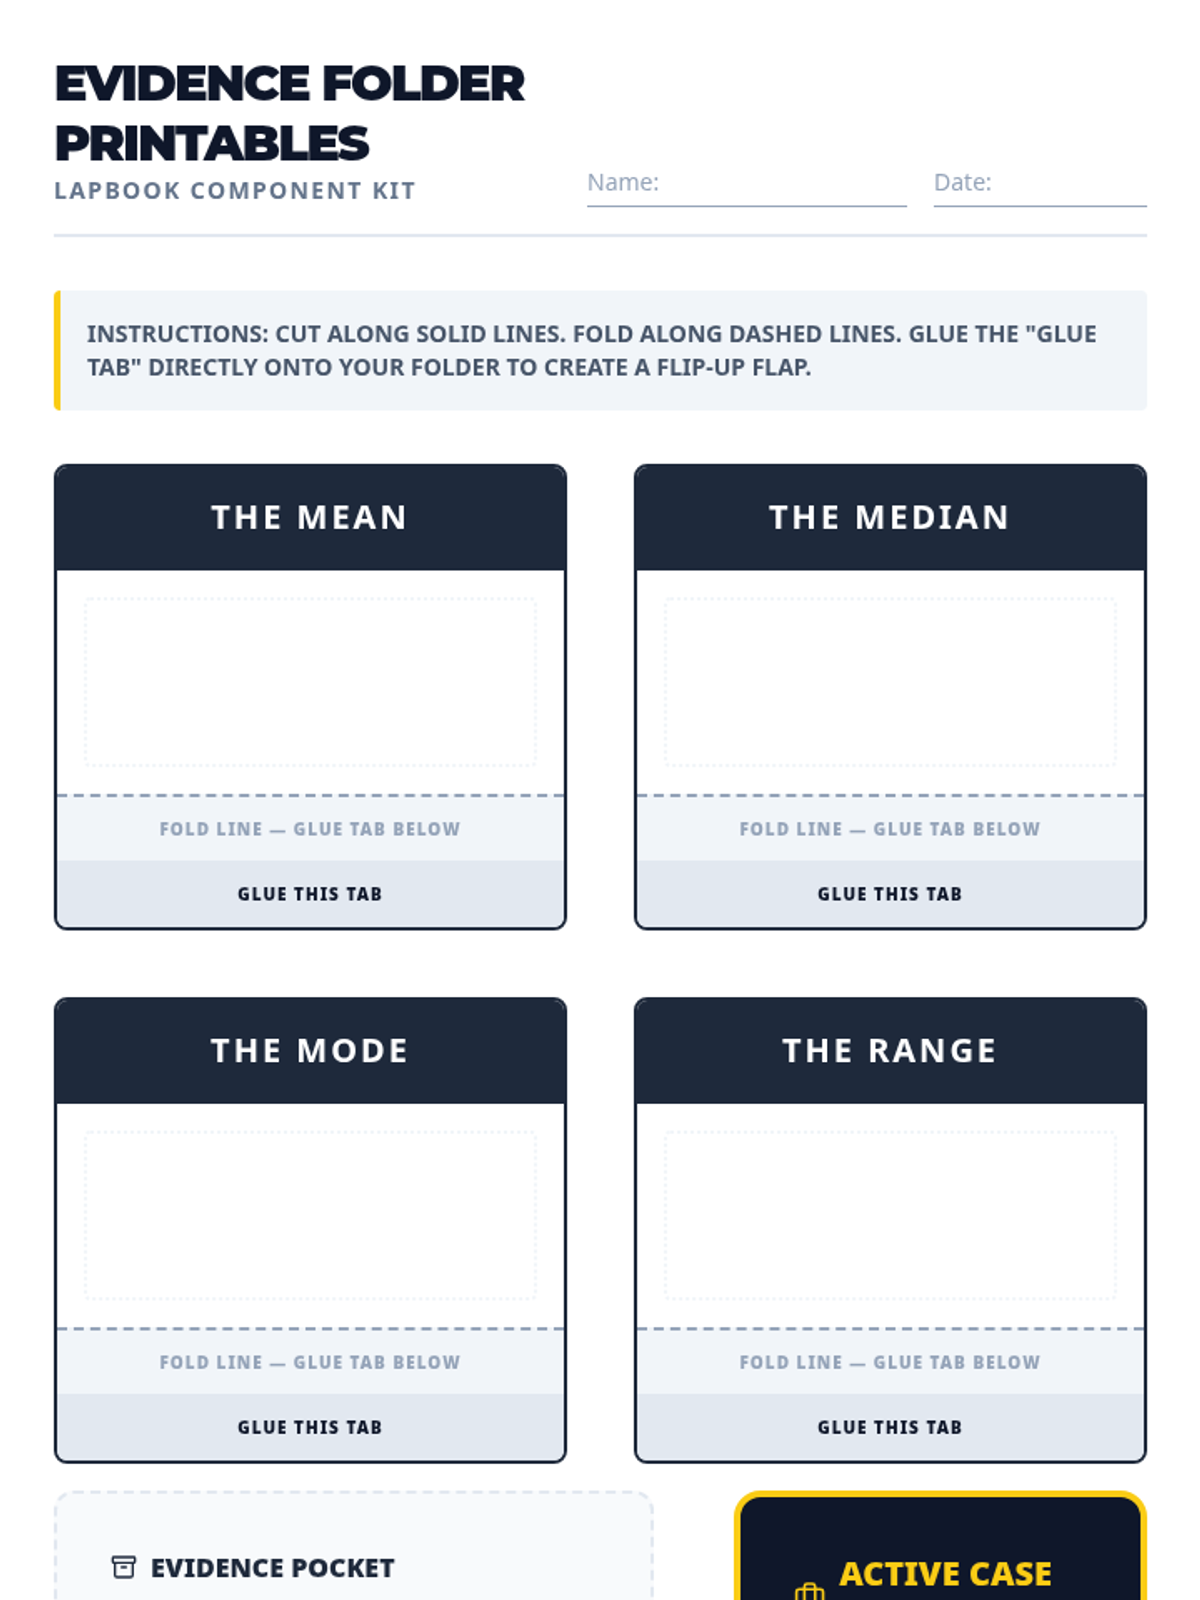
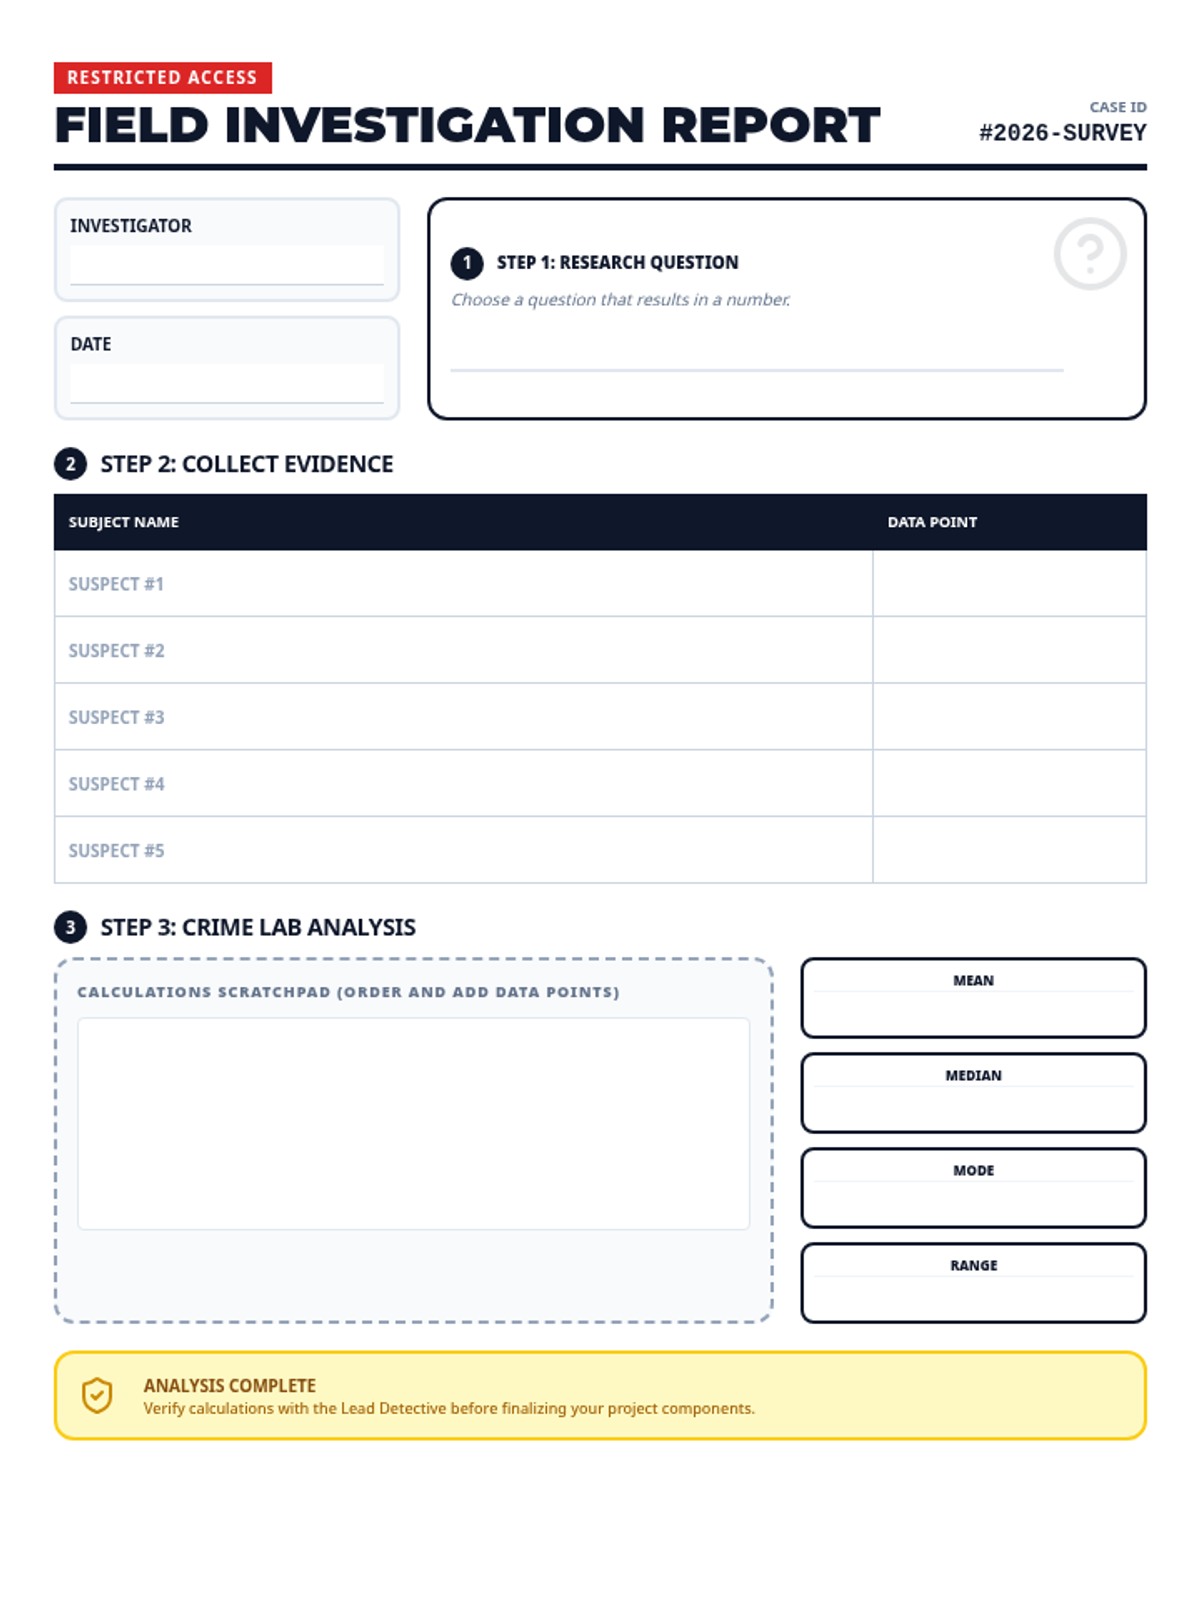
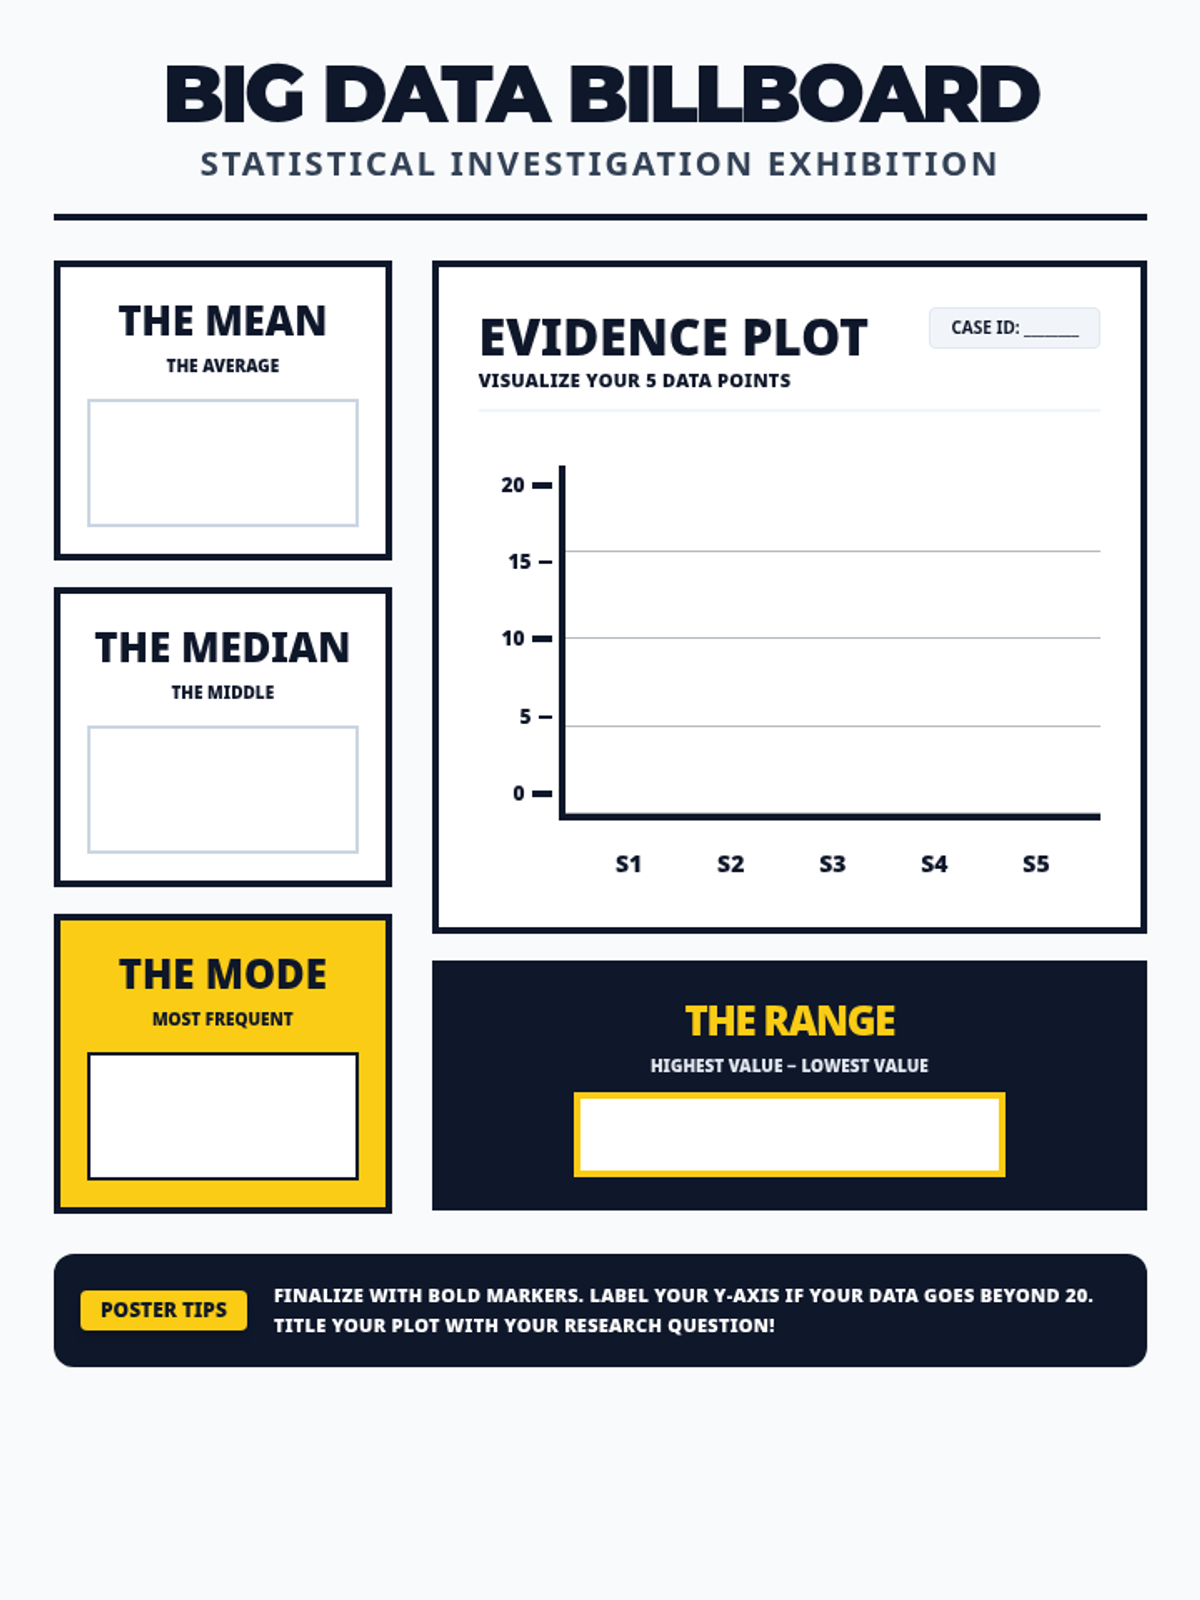
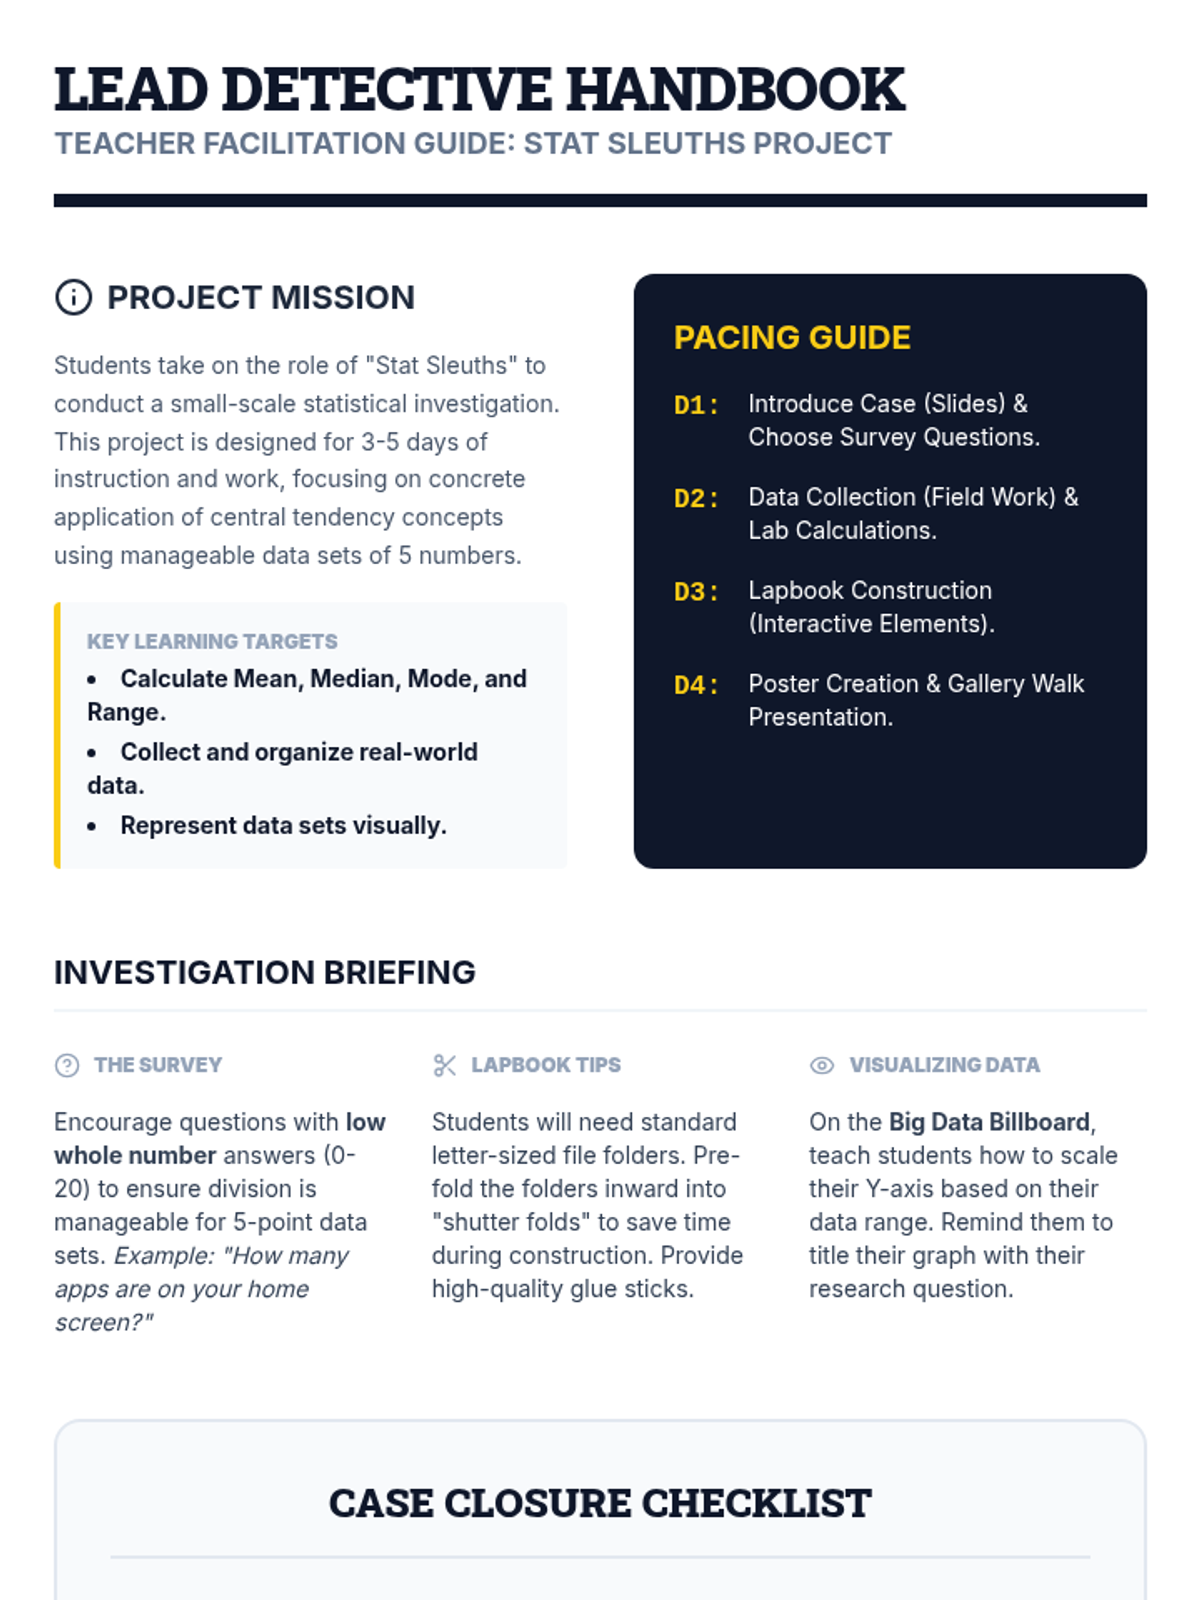
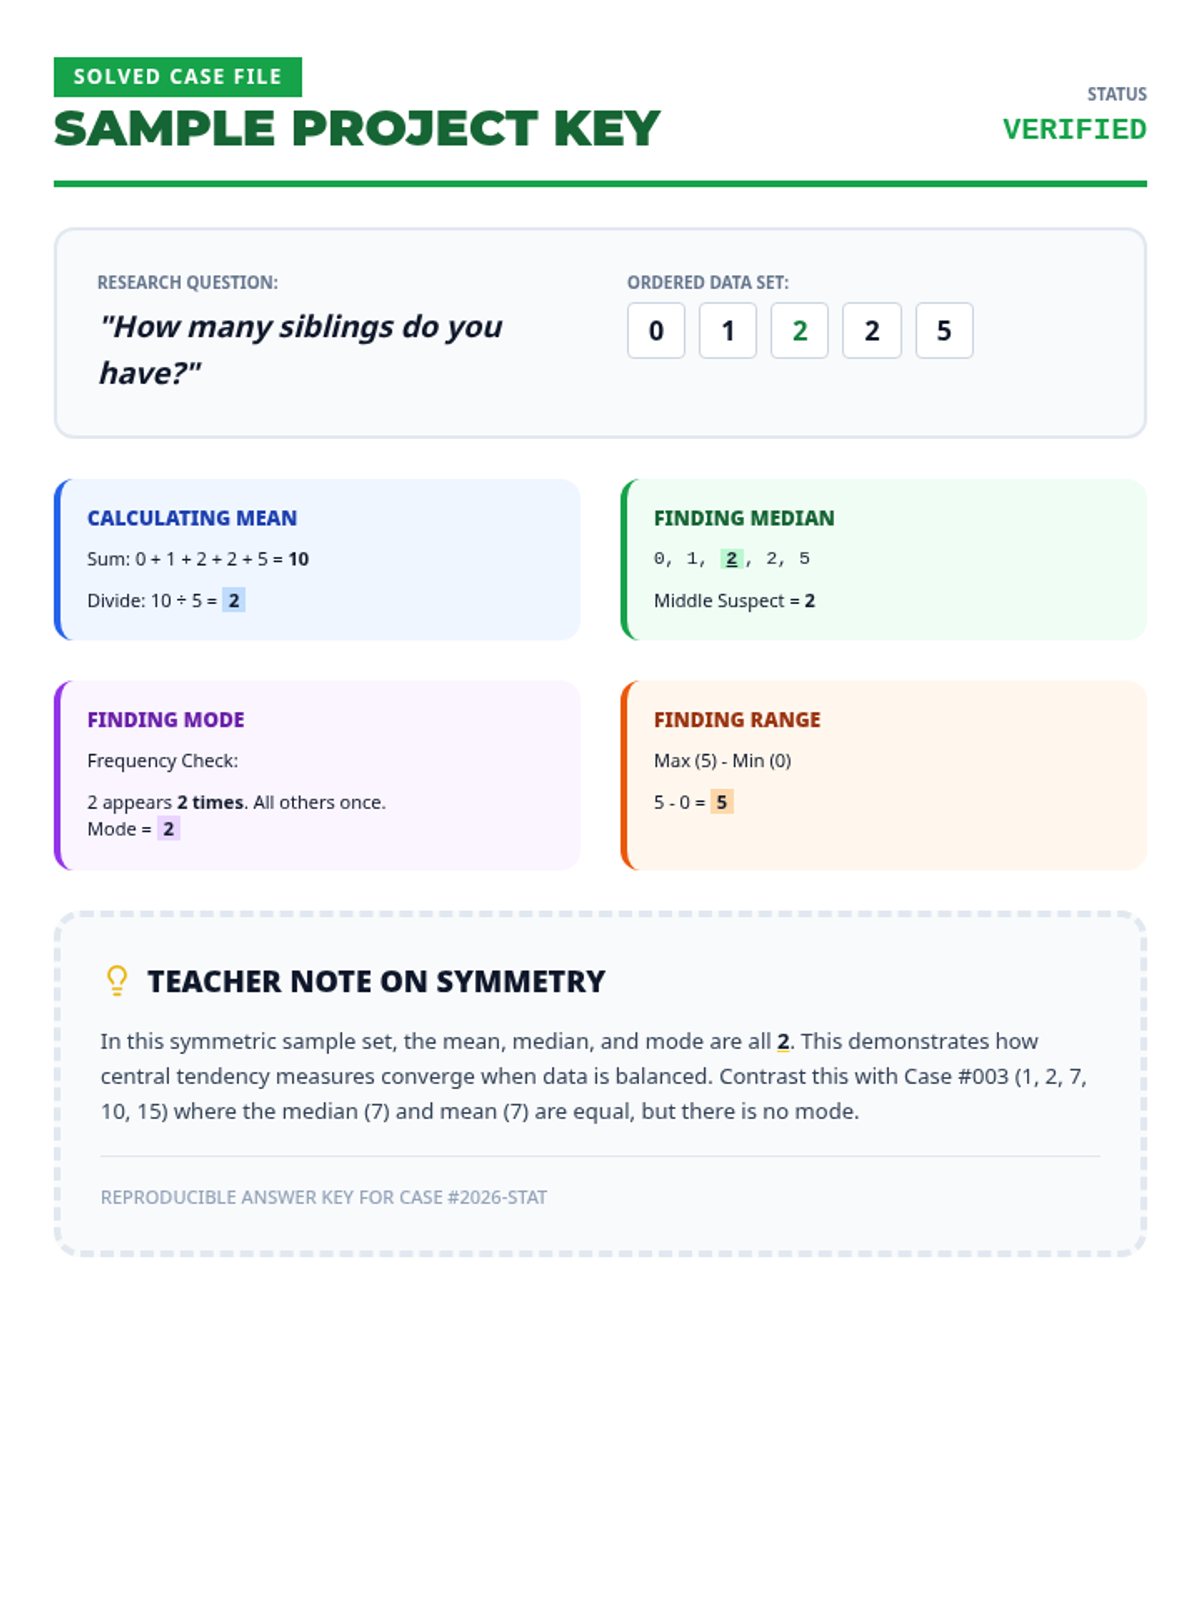
A comprehensive hands-on project where students become 'Stat Sleuths' to collect real-world data, calculate central tendencies, and present their findings through an interactive lapbook and poster.
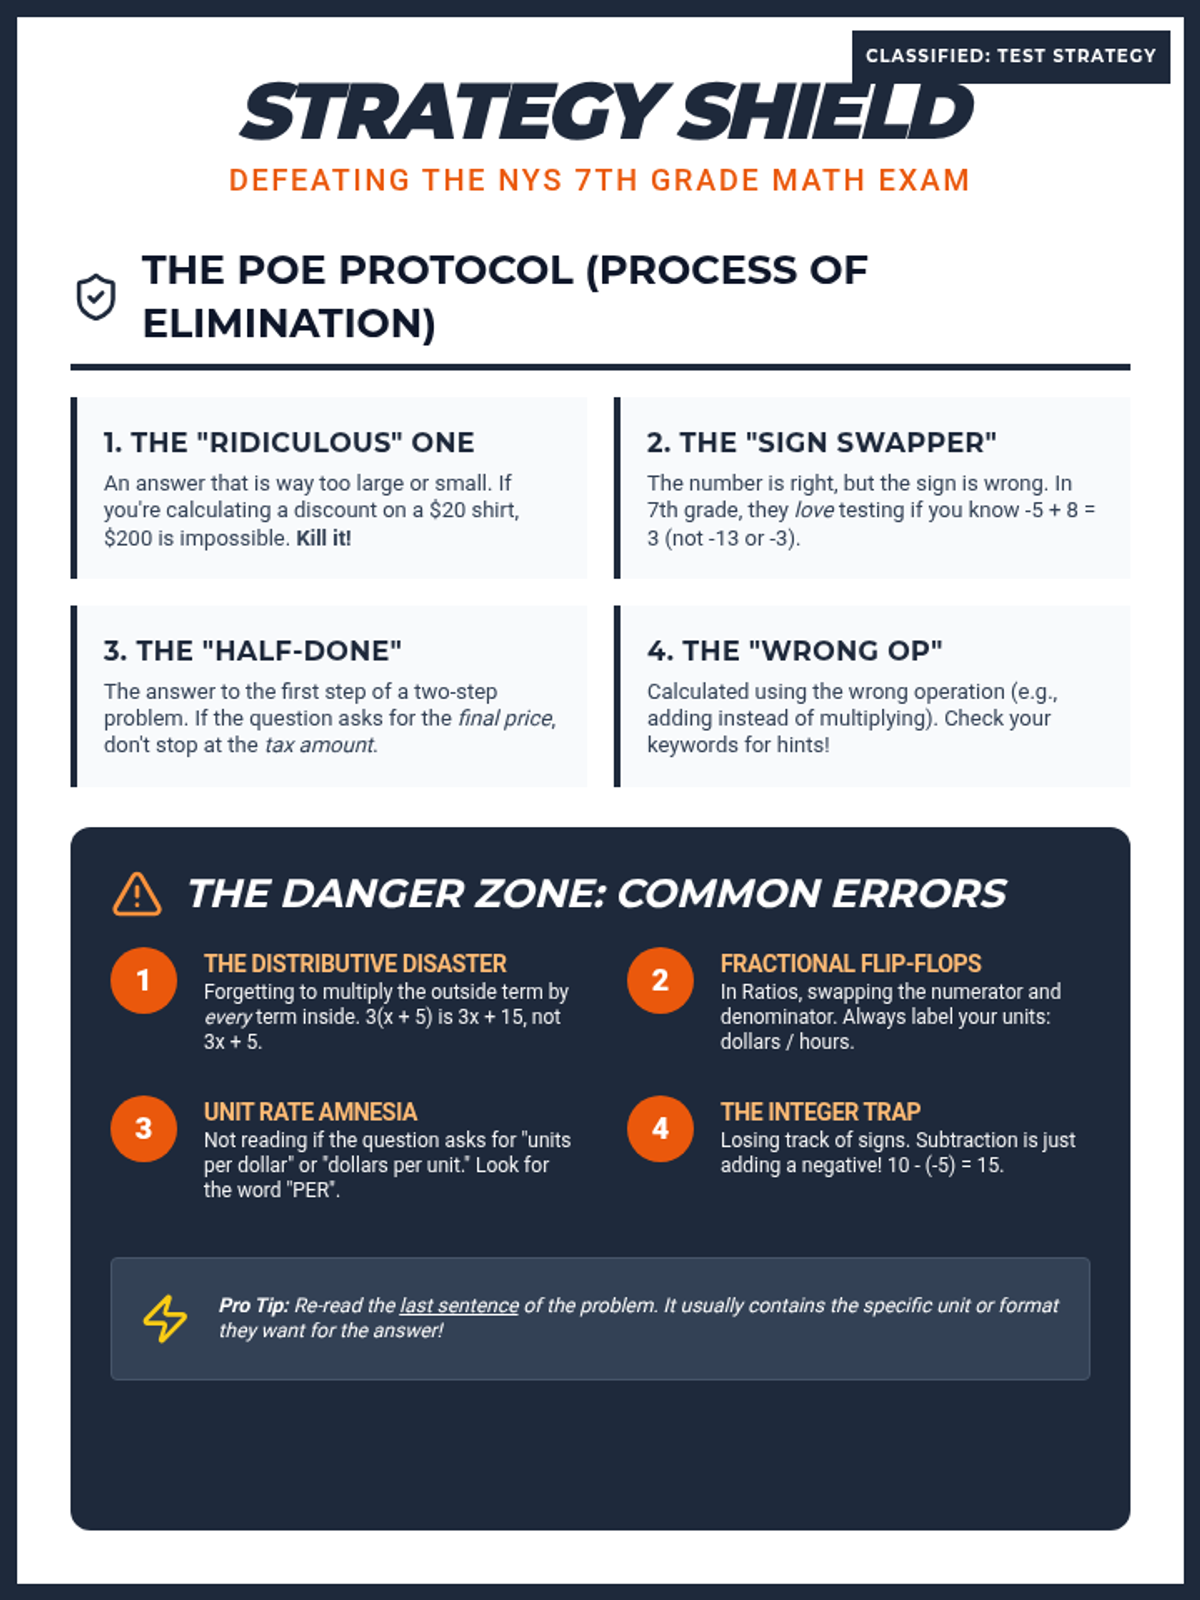
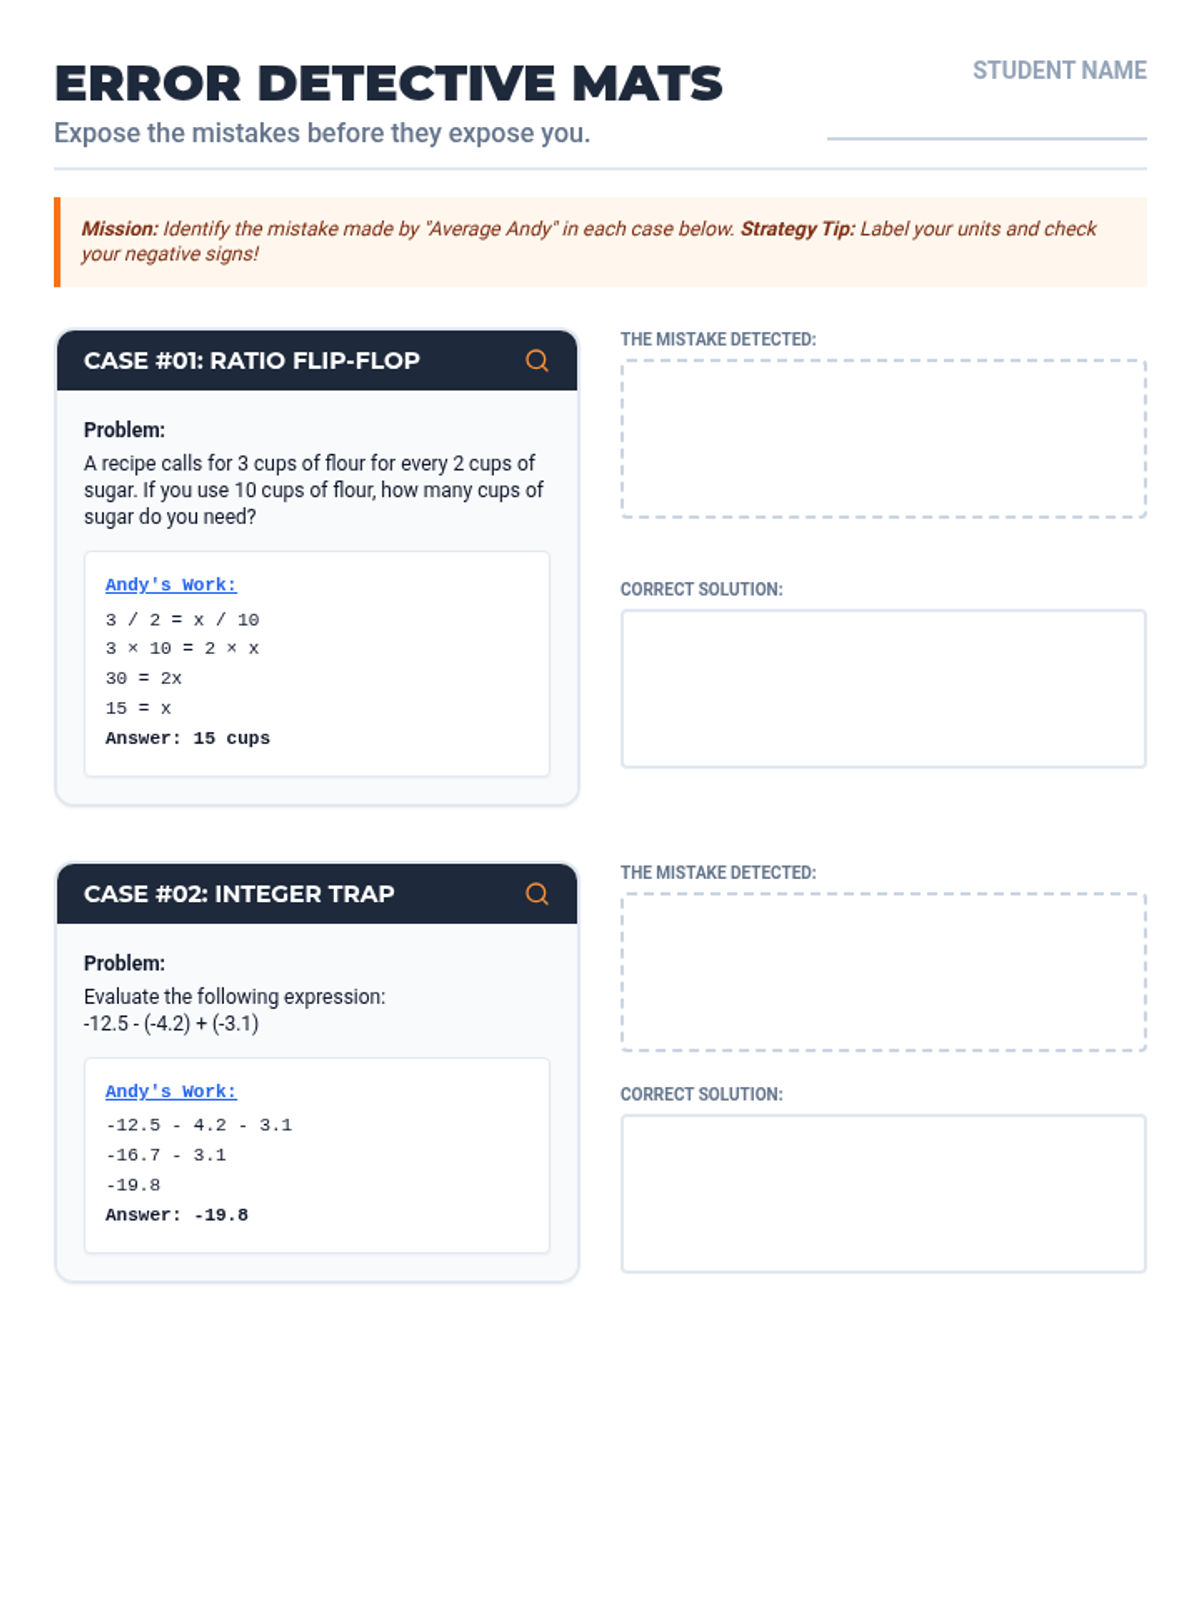
A comprehensive test-prep packet for 7th grade math focusing on the NYS exam. Includes strategy anchor charts, error analysis mats, and a practice assessment covering Ratios, Number System, Expressions/Equations, and Geometry/Statistics.
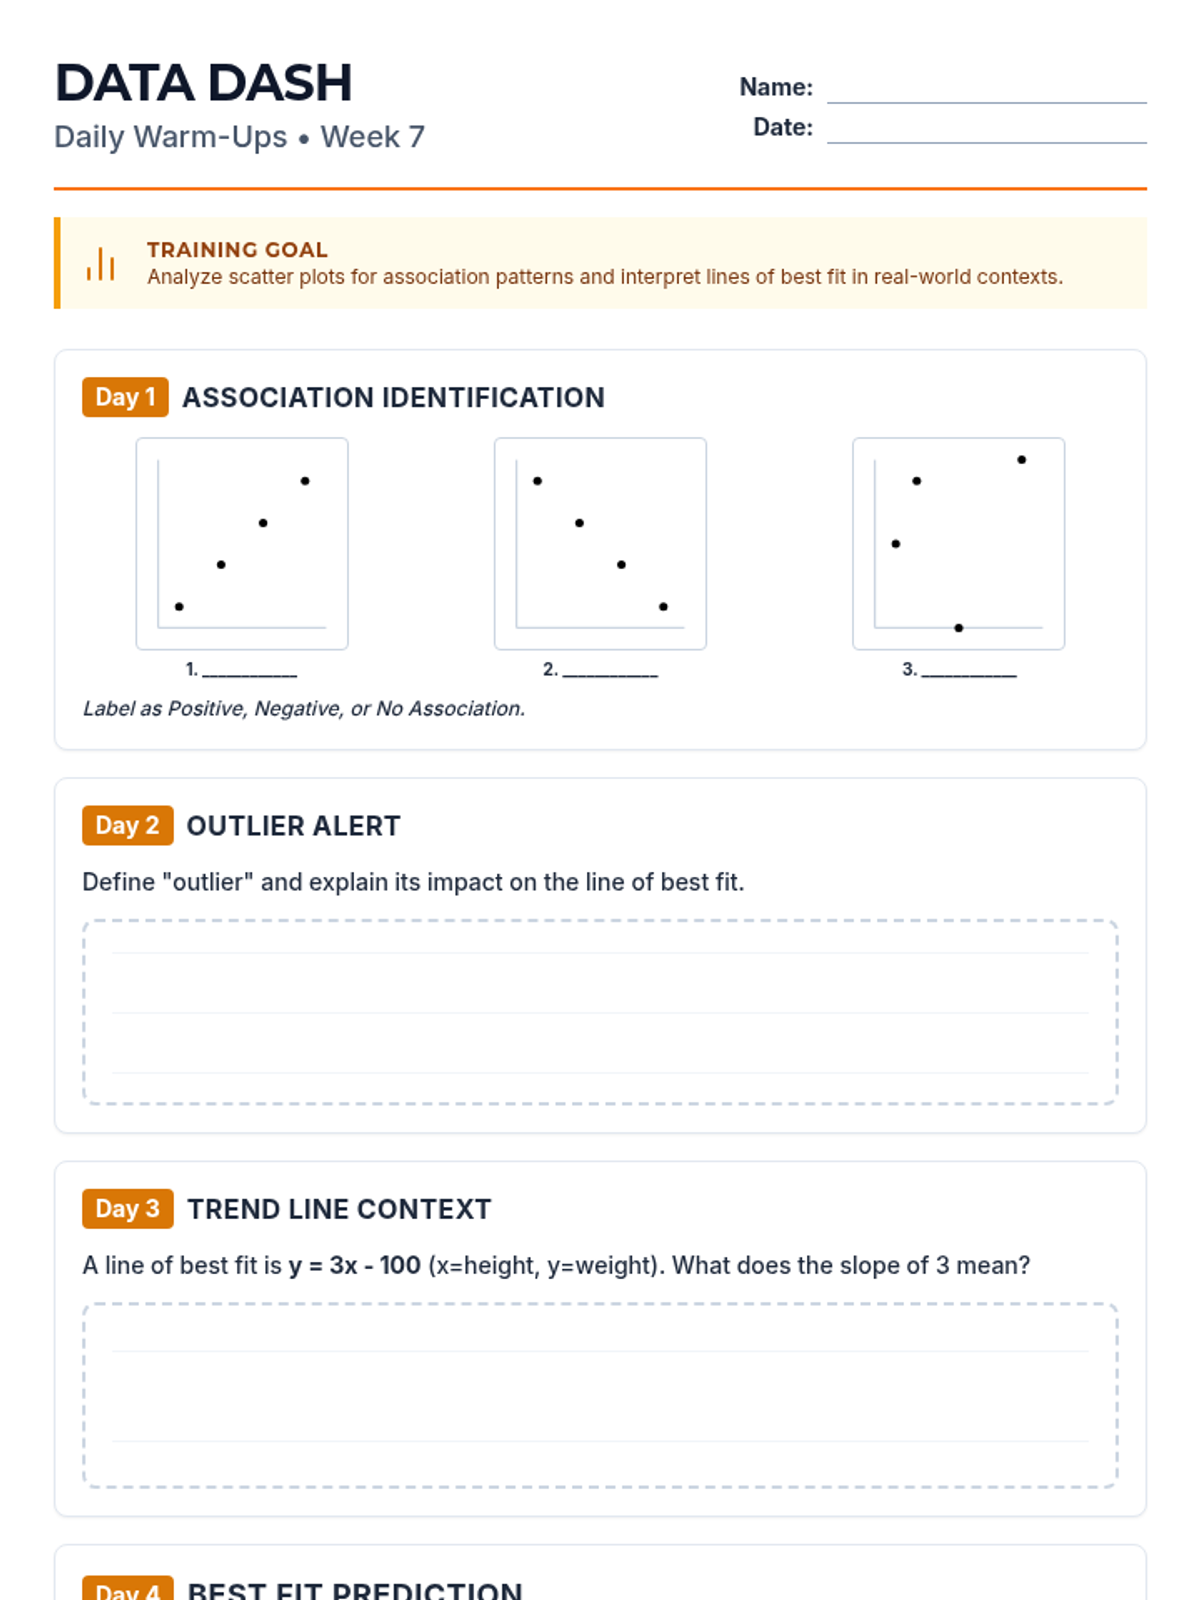
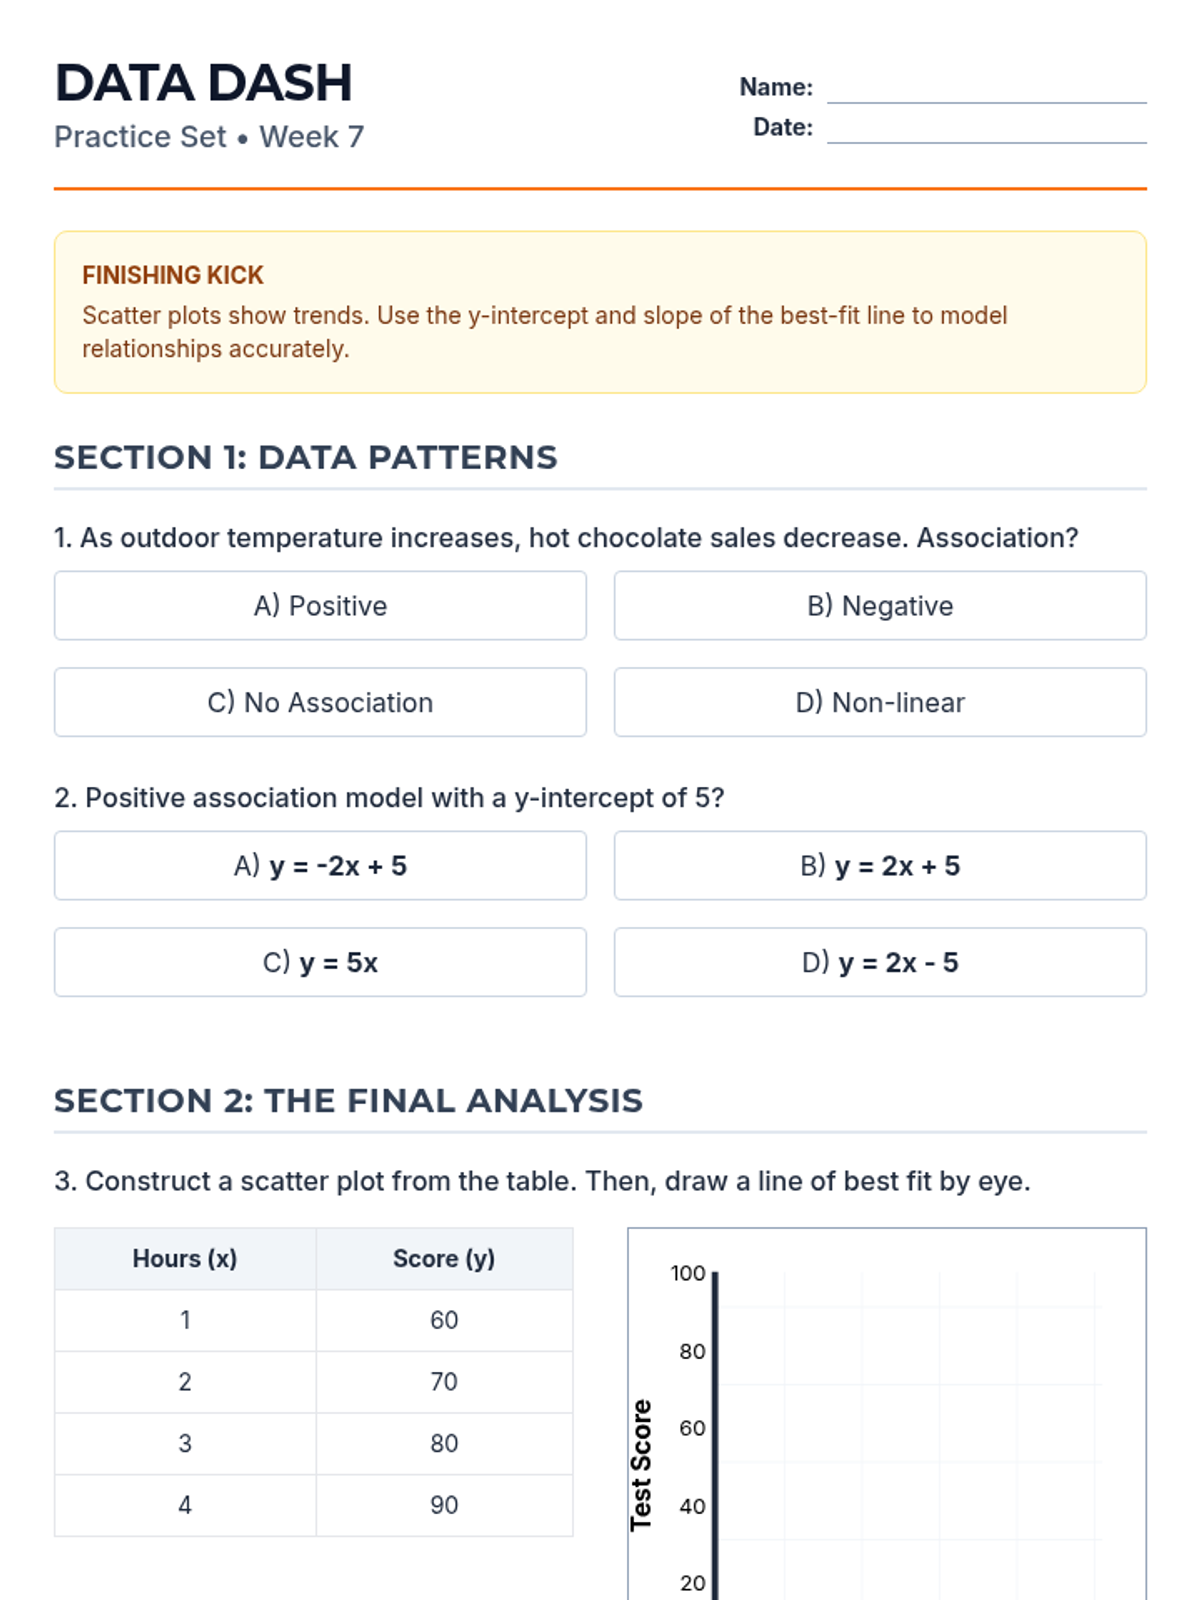
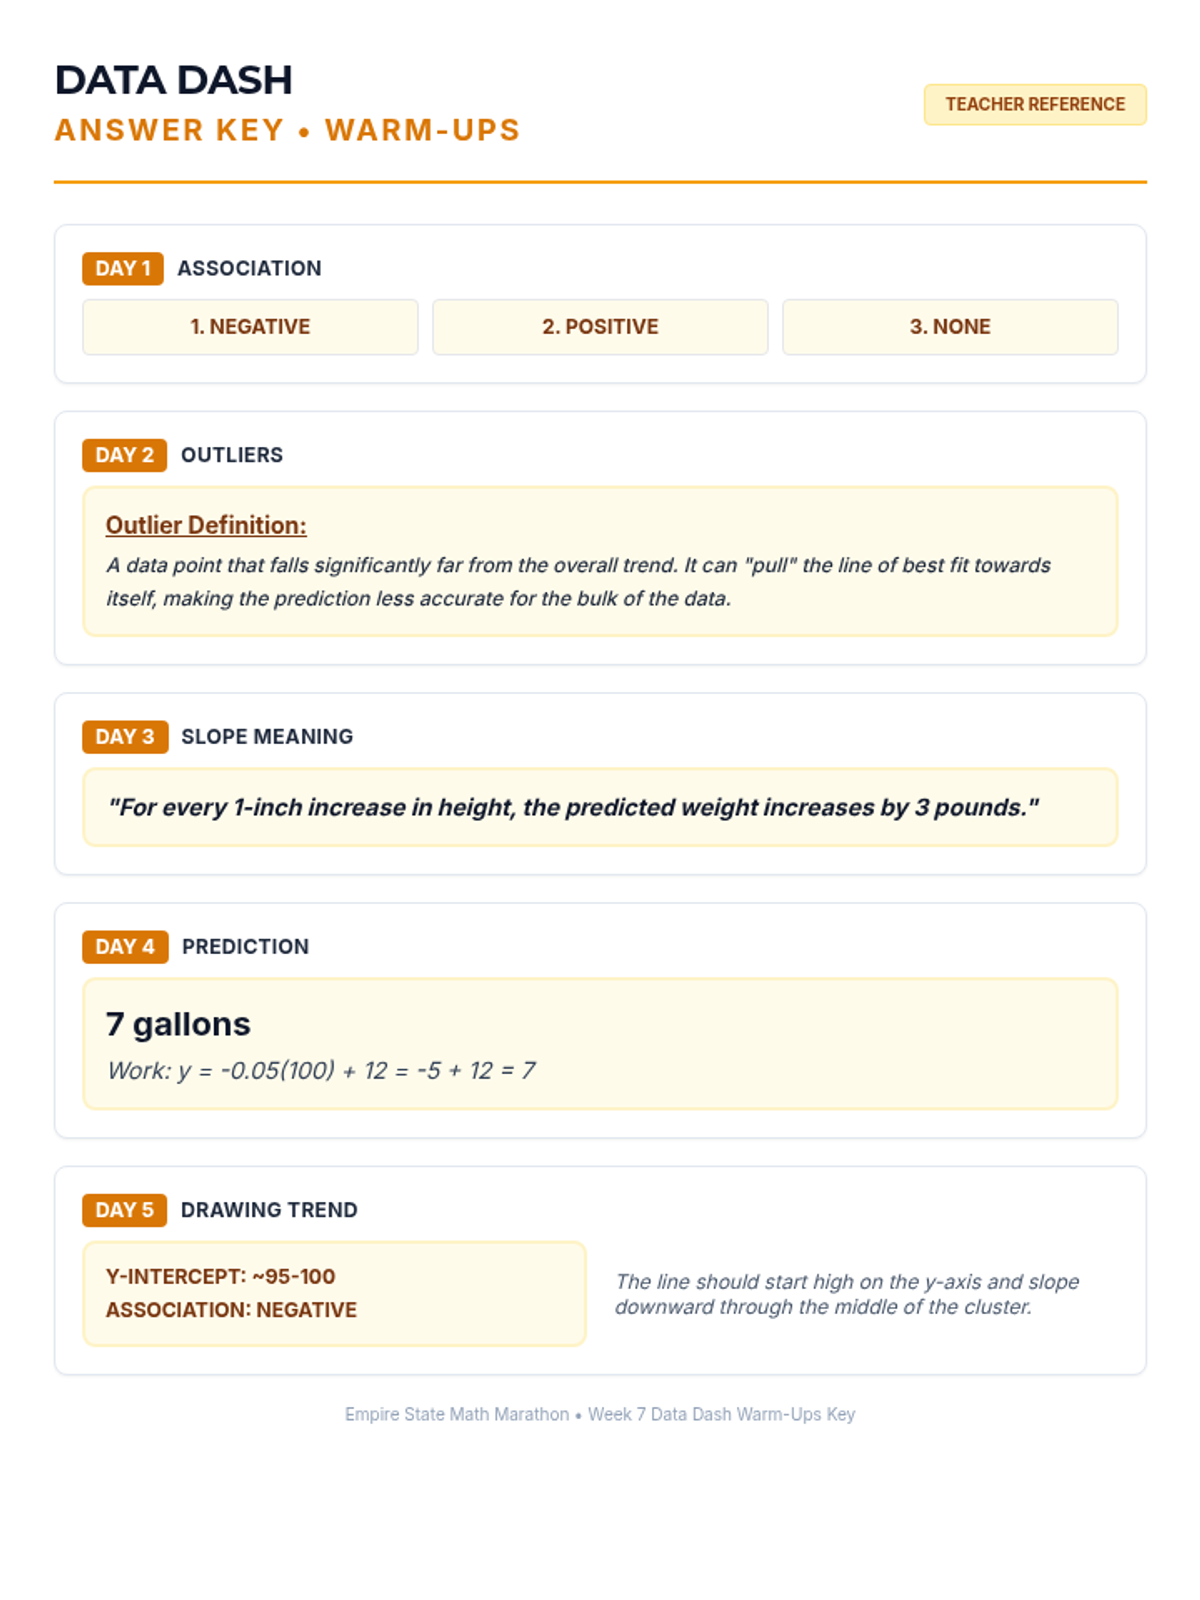
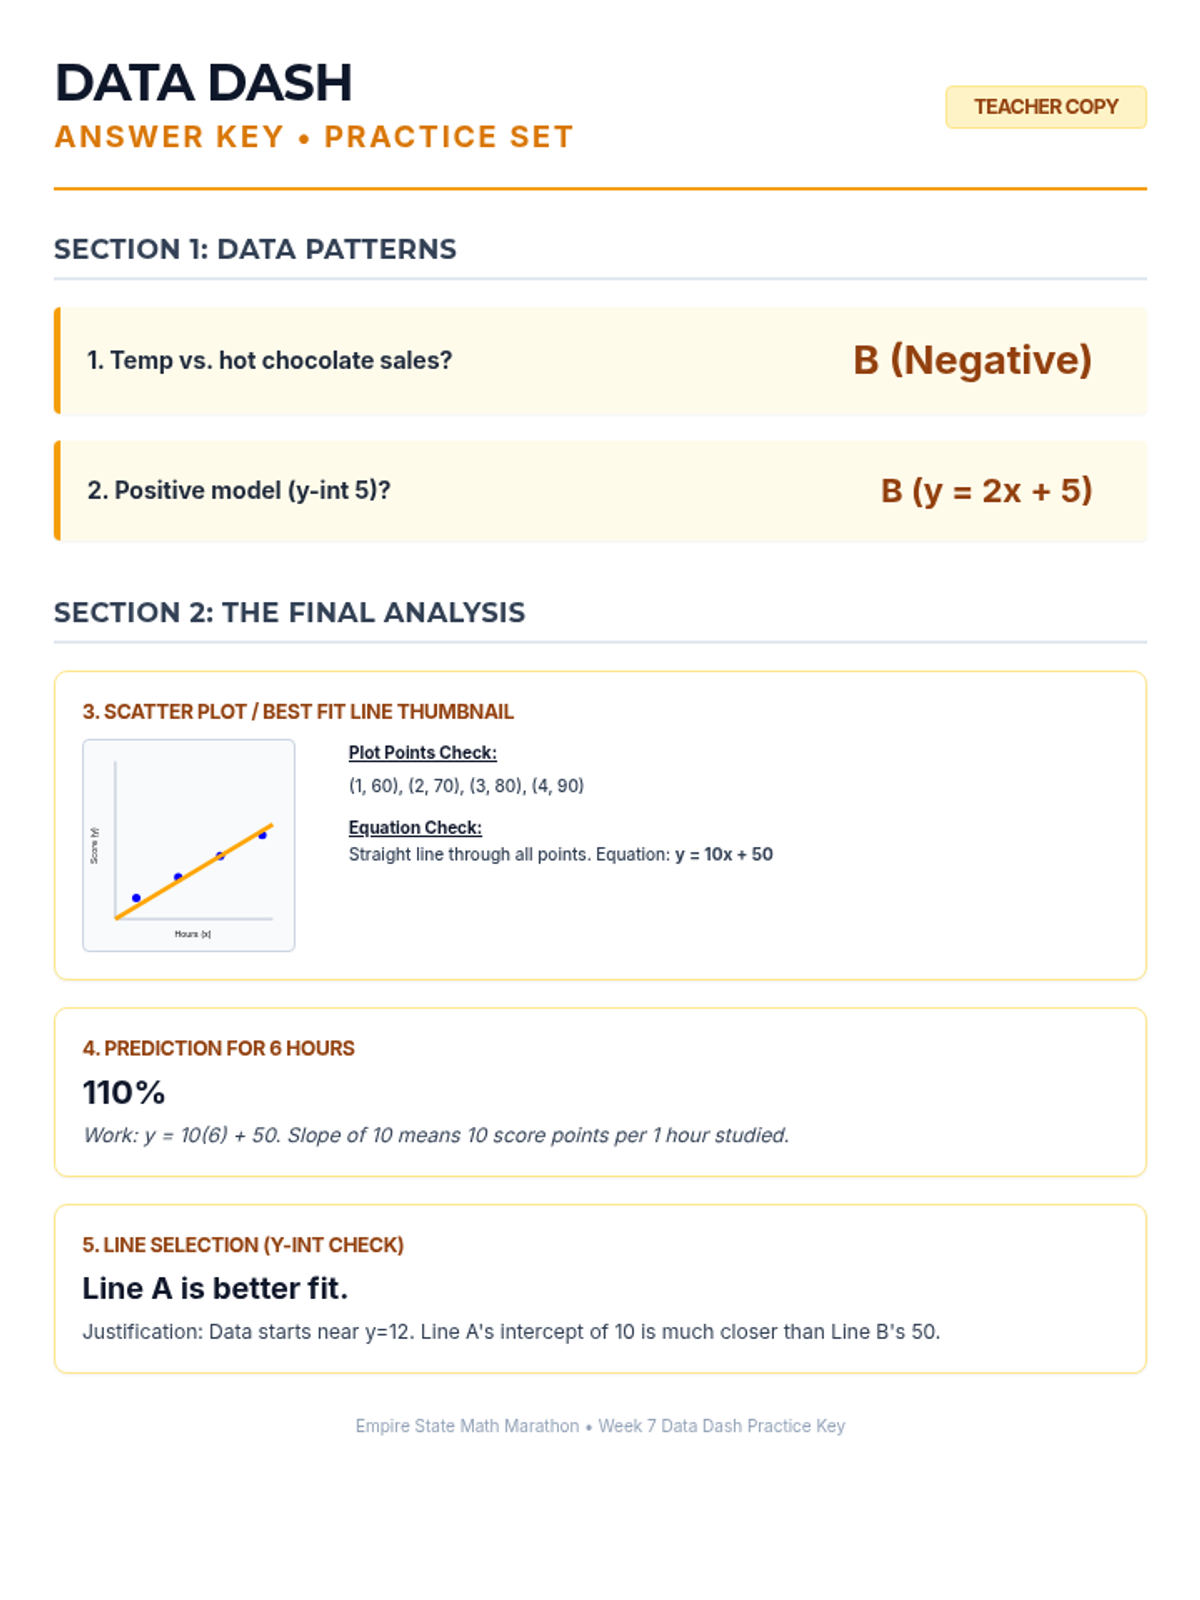
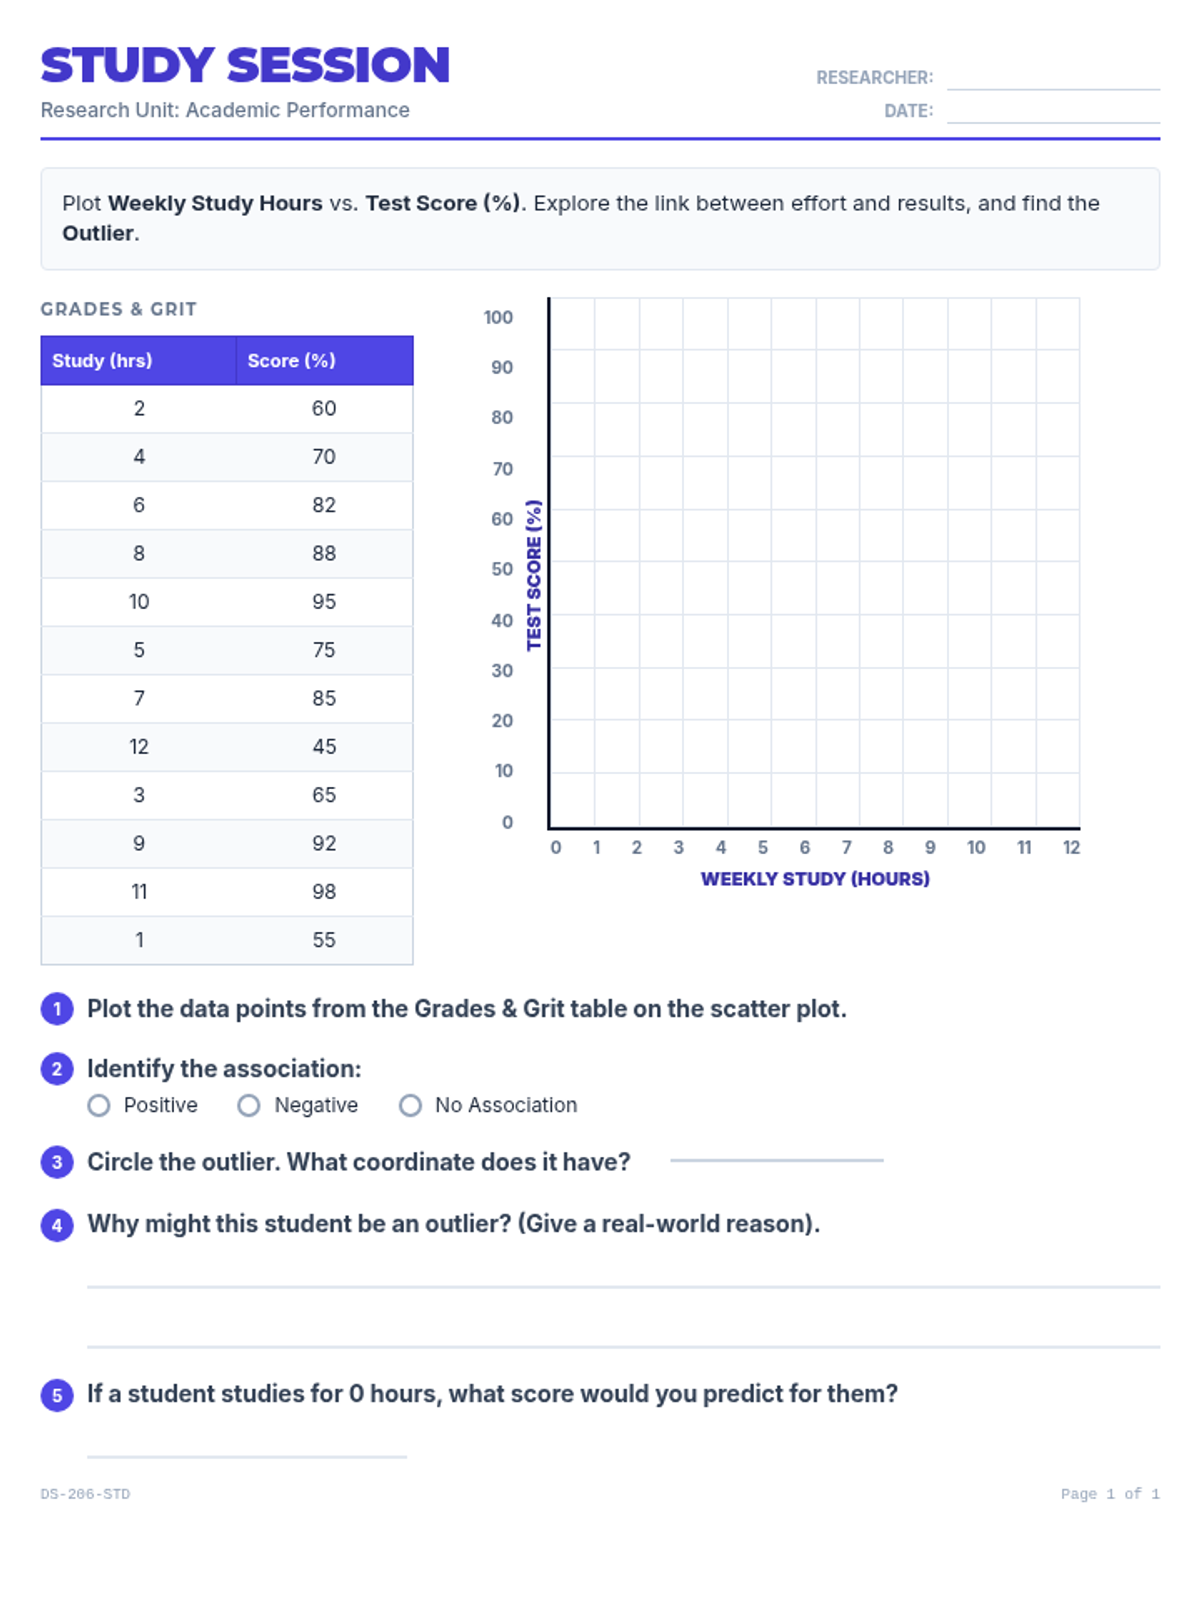
Week 7 analyzes bivariate data through scatter plots, interpreting lines of best fit, and using linear models to make predictions.
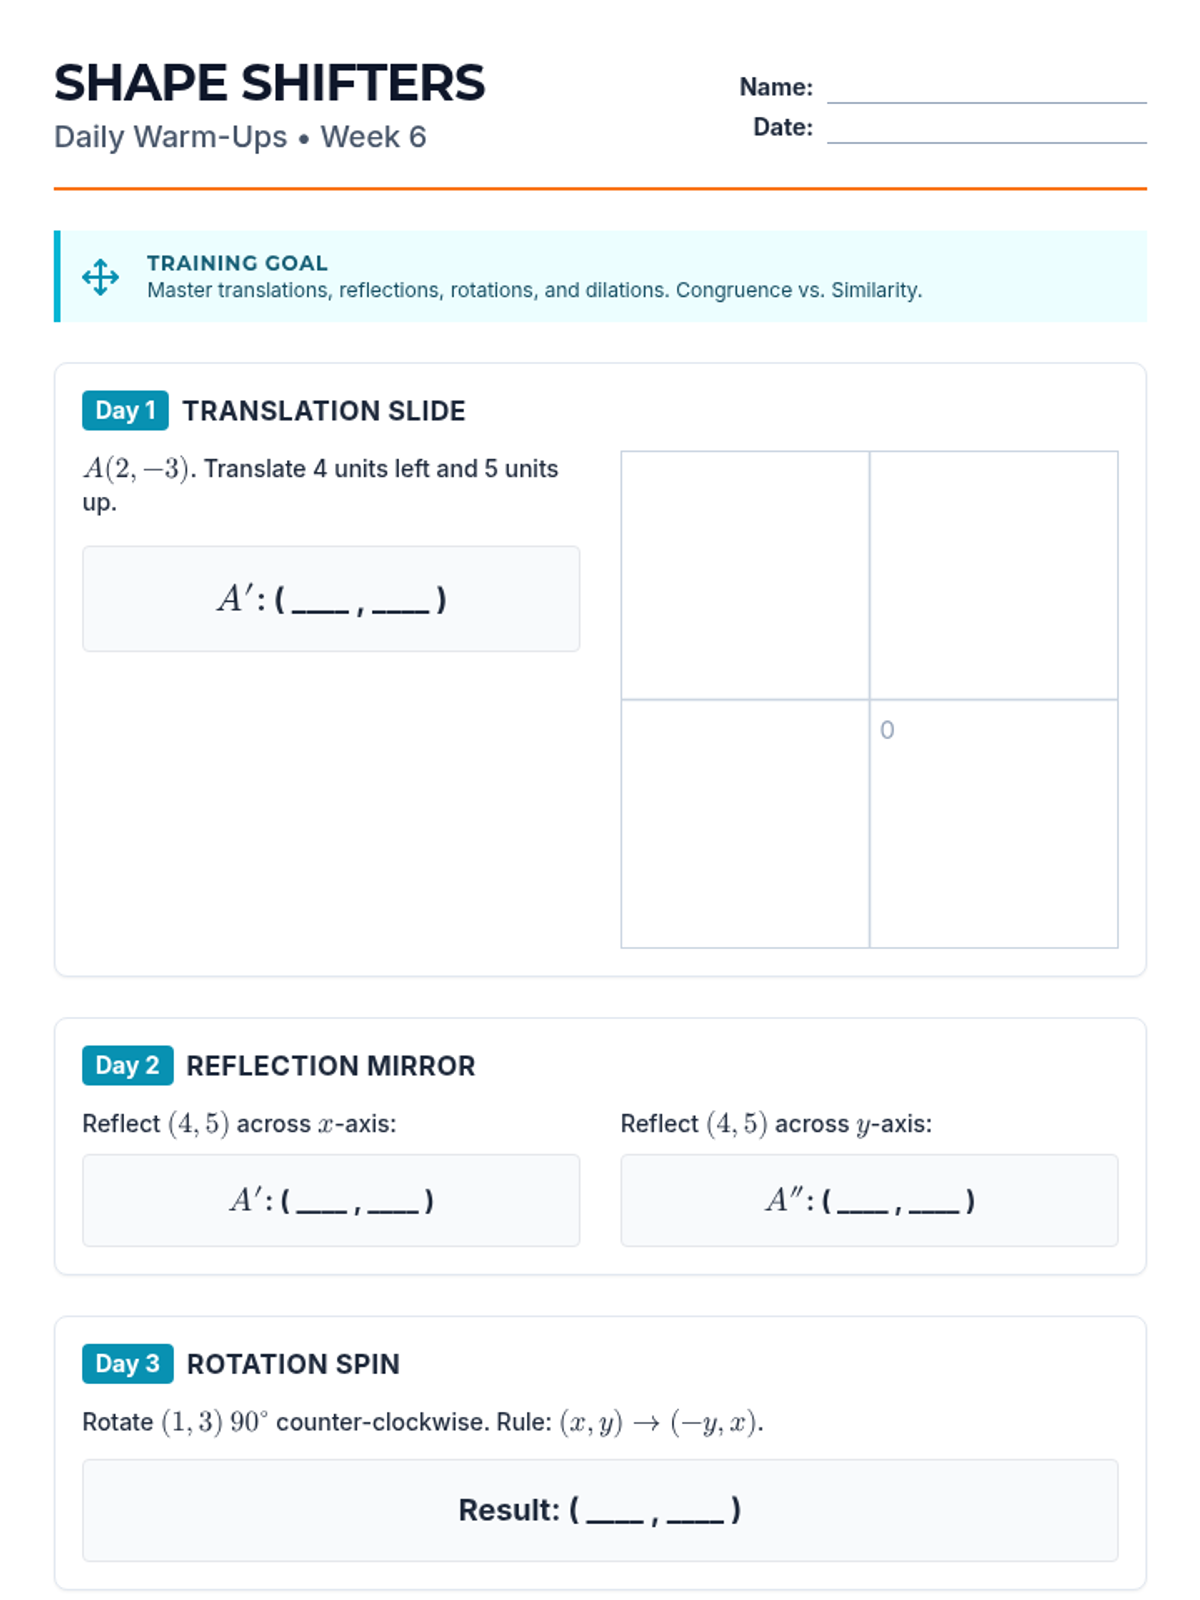
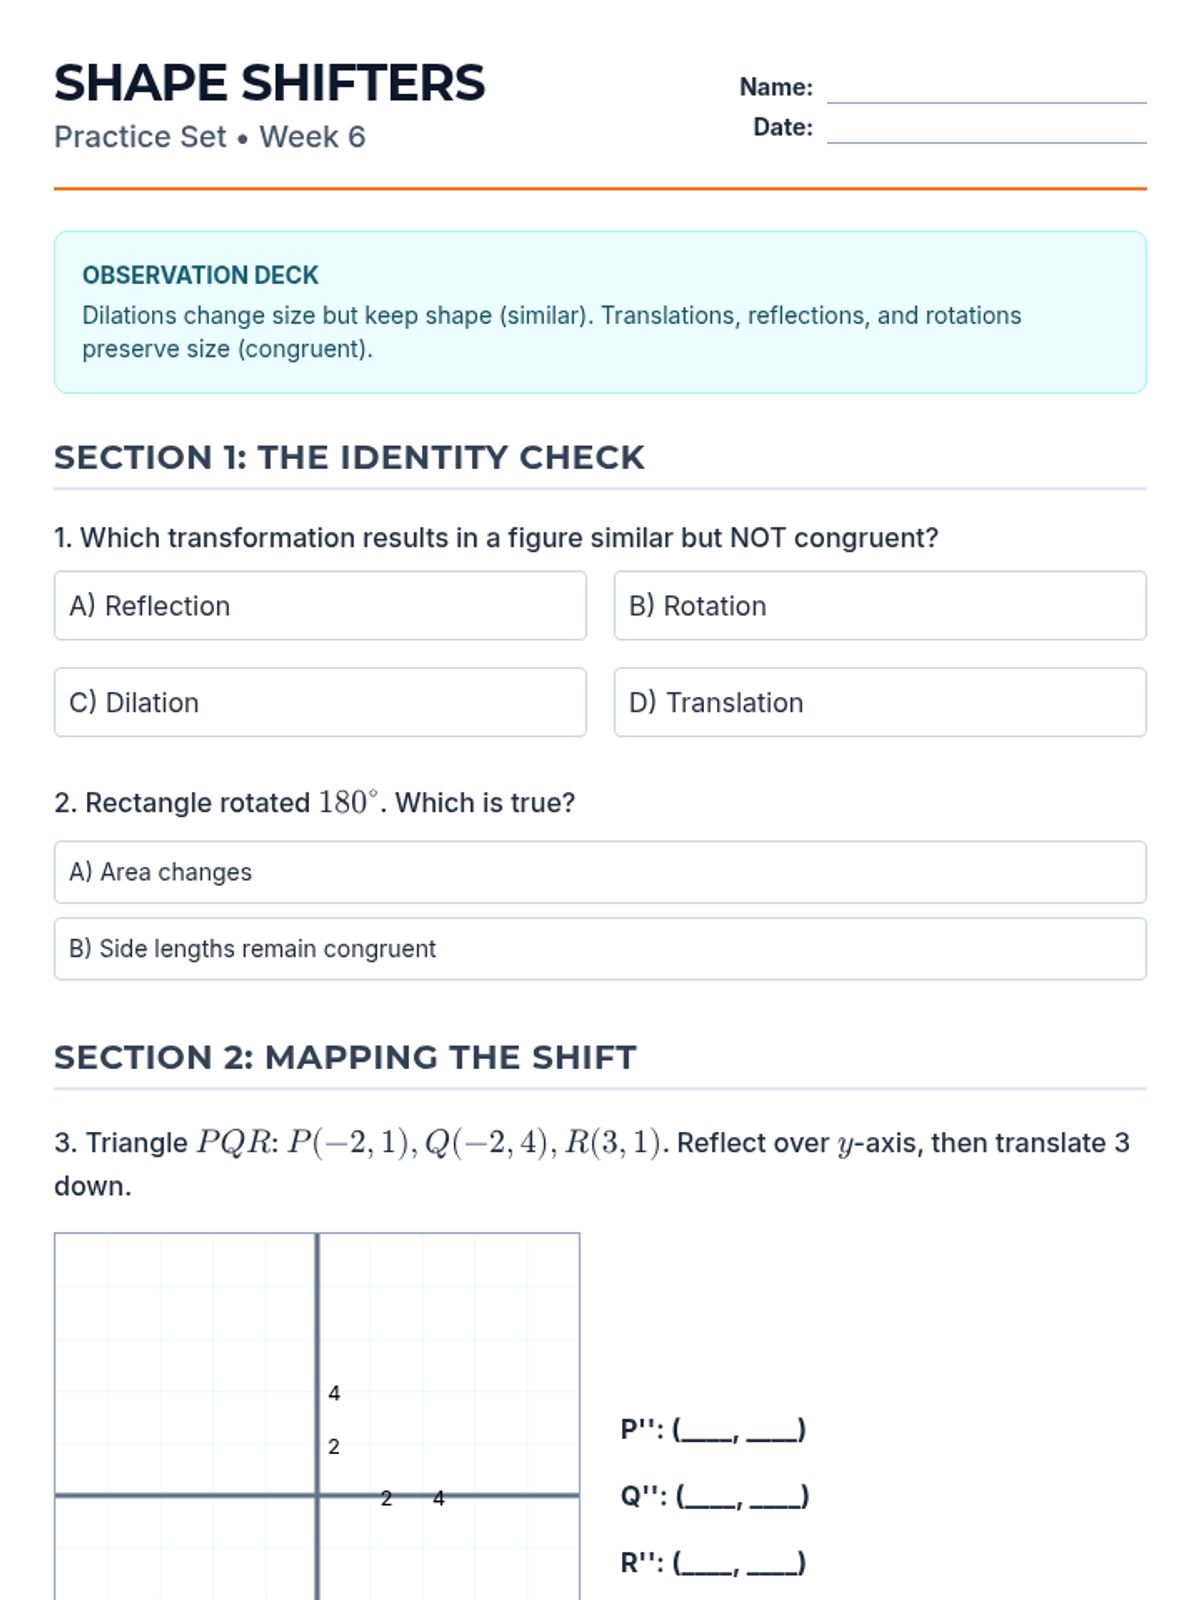
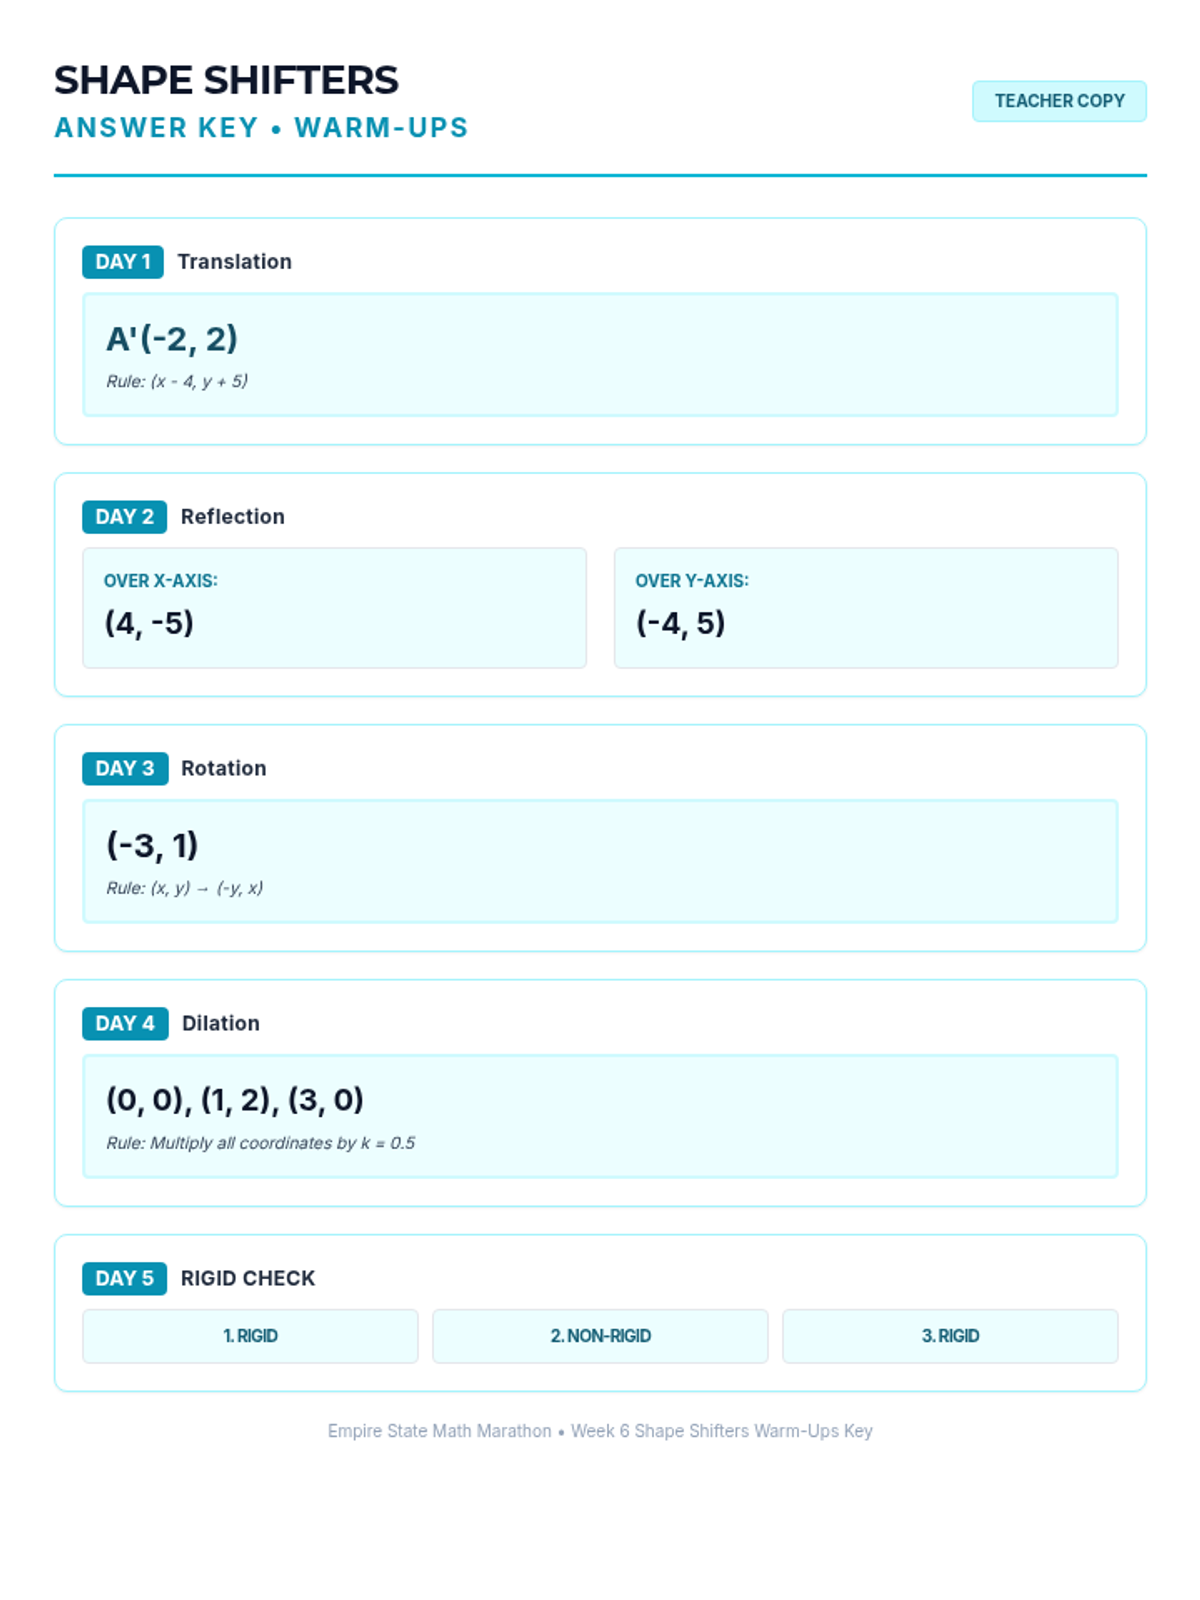
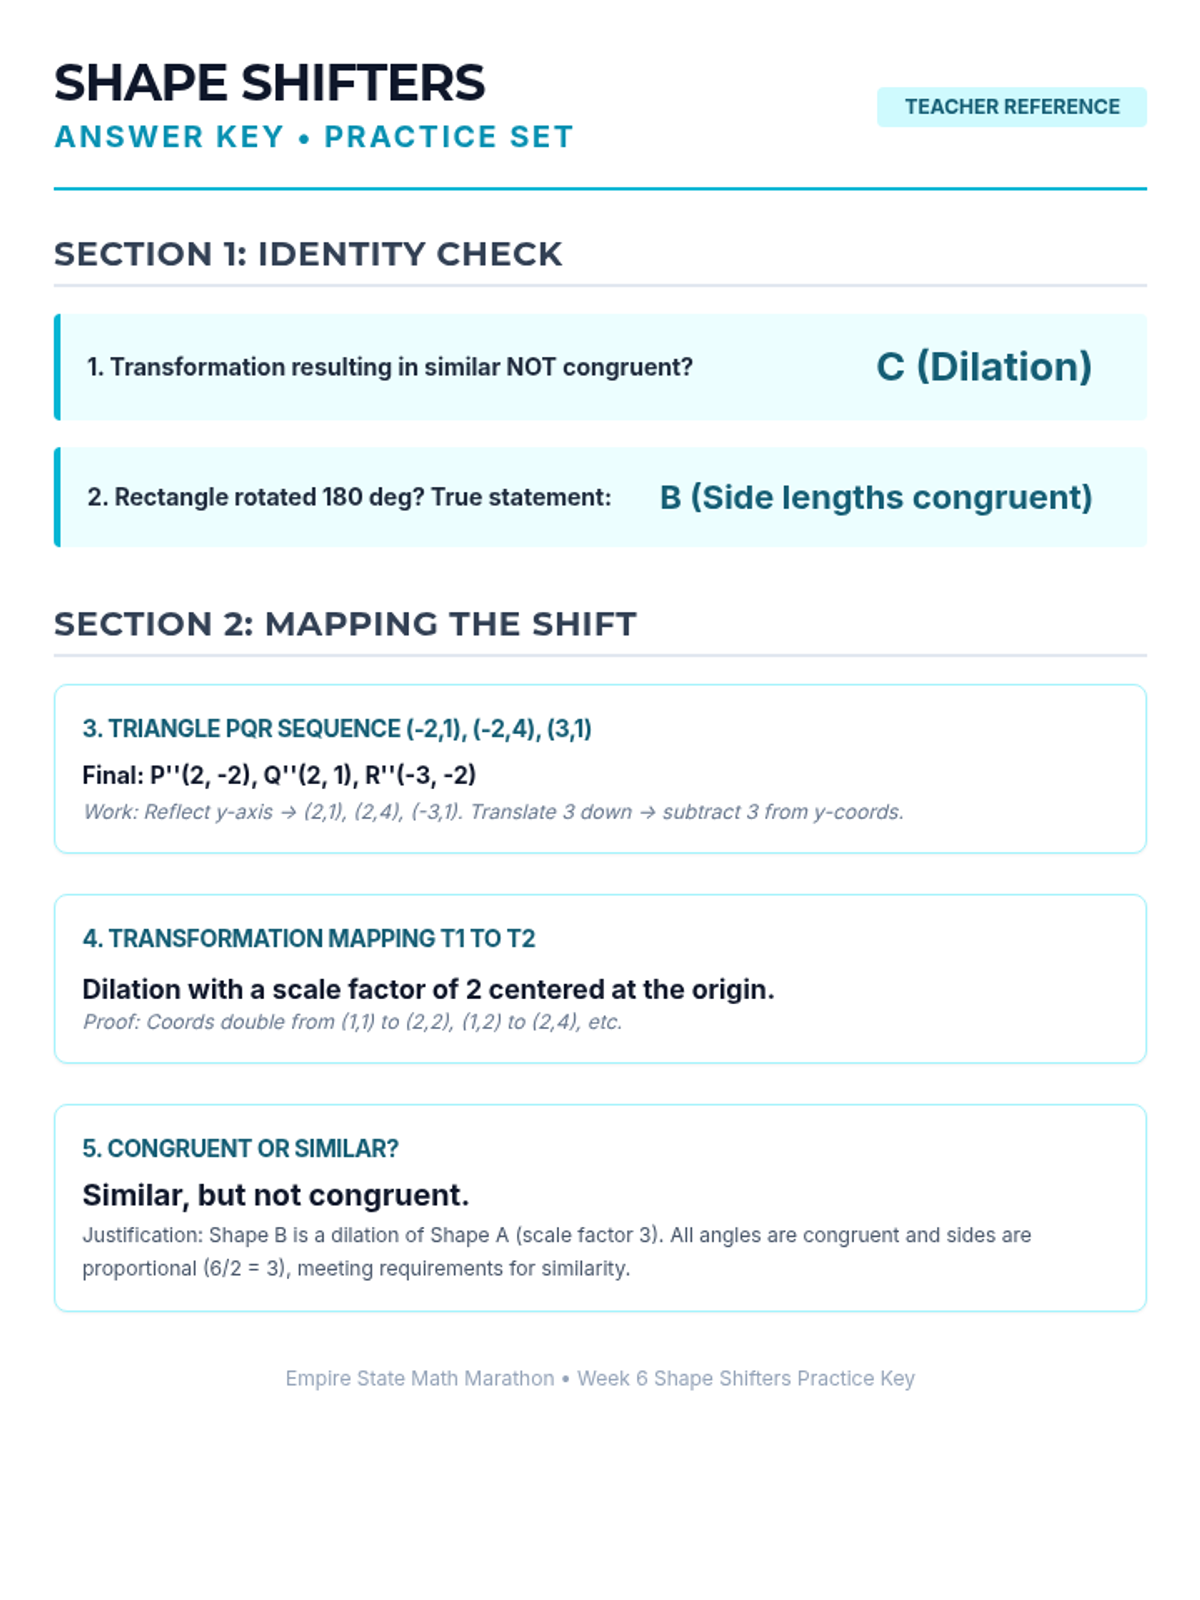
Week 6 focuses on rigid transformations (translations, reflections, rotations) and similarity transformations (dilations).
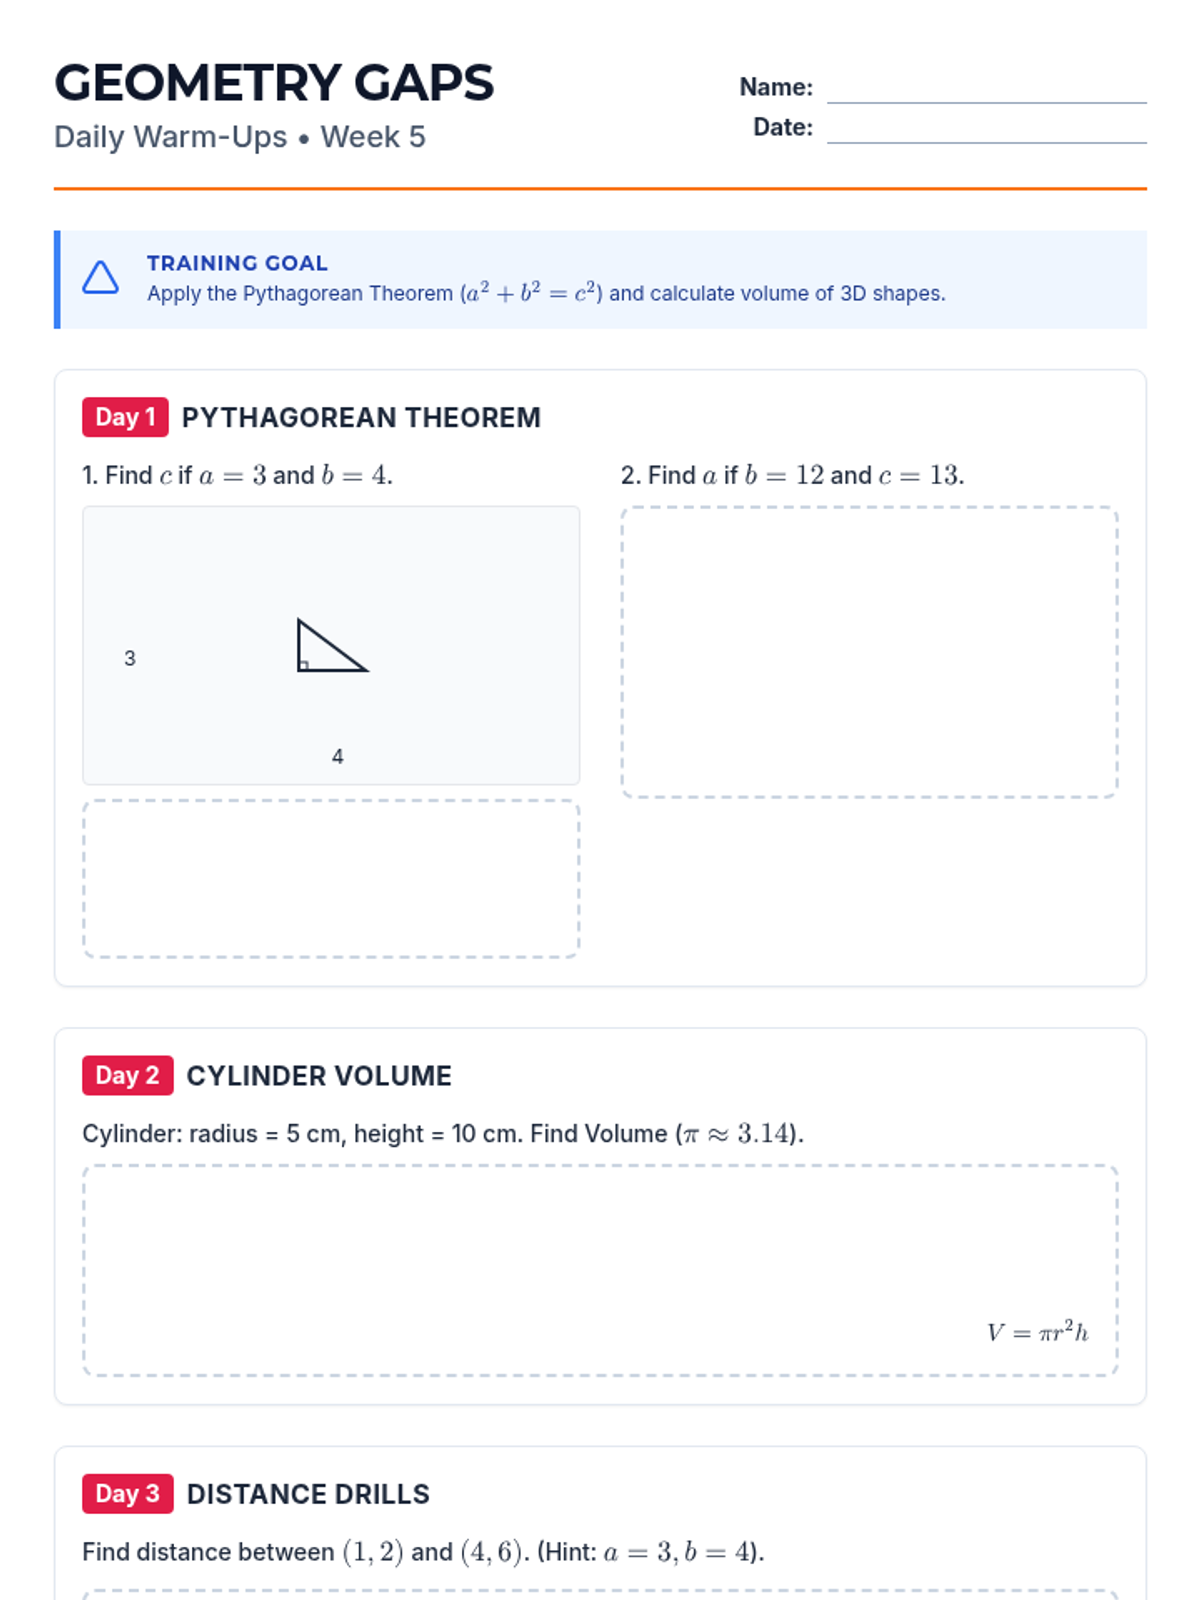
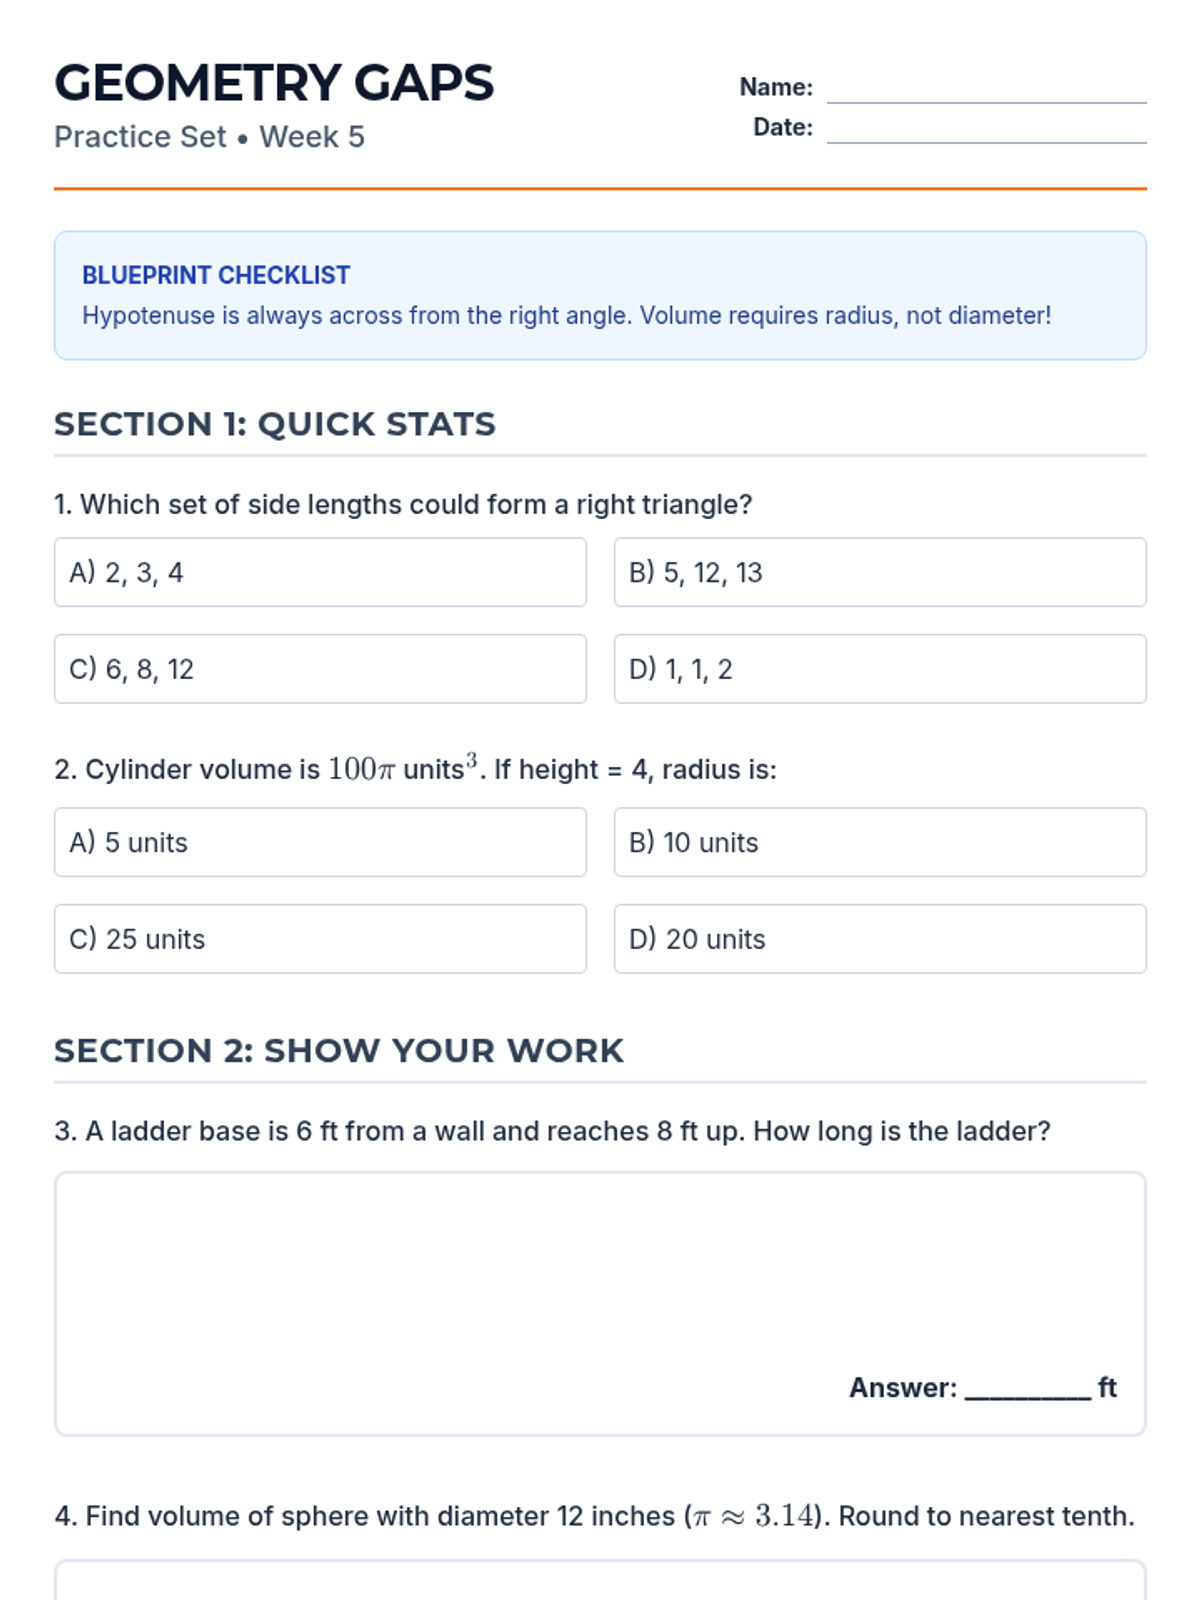
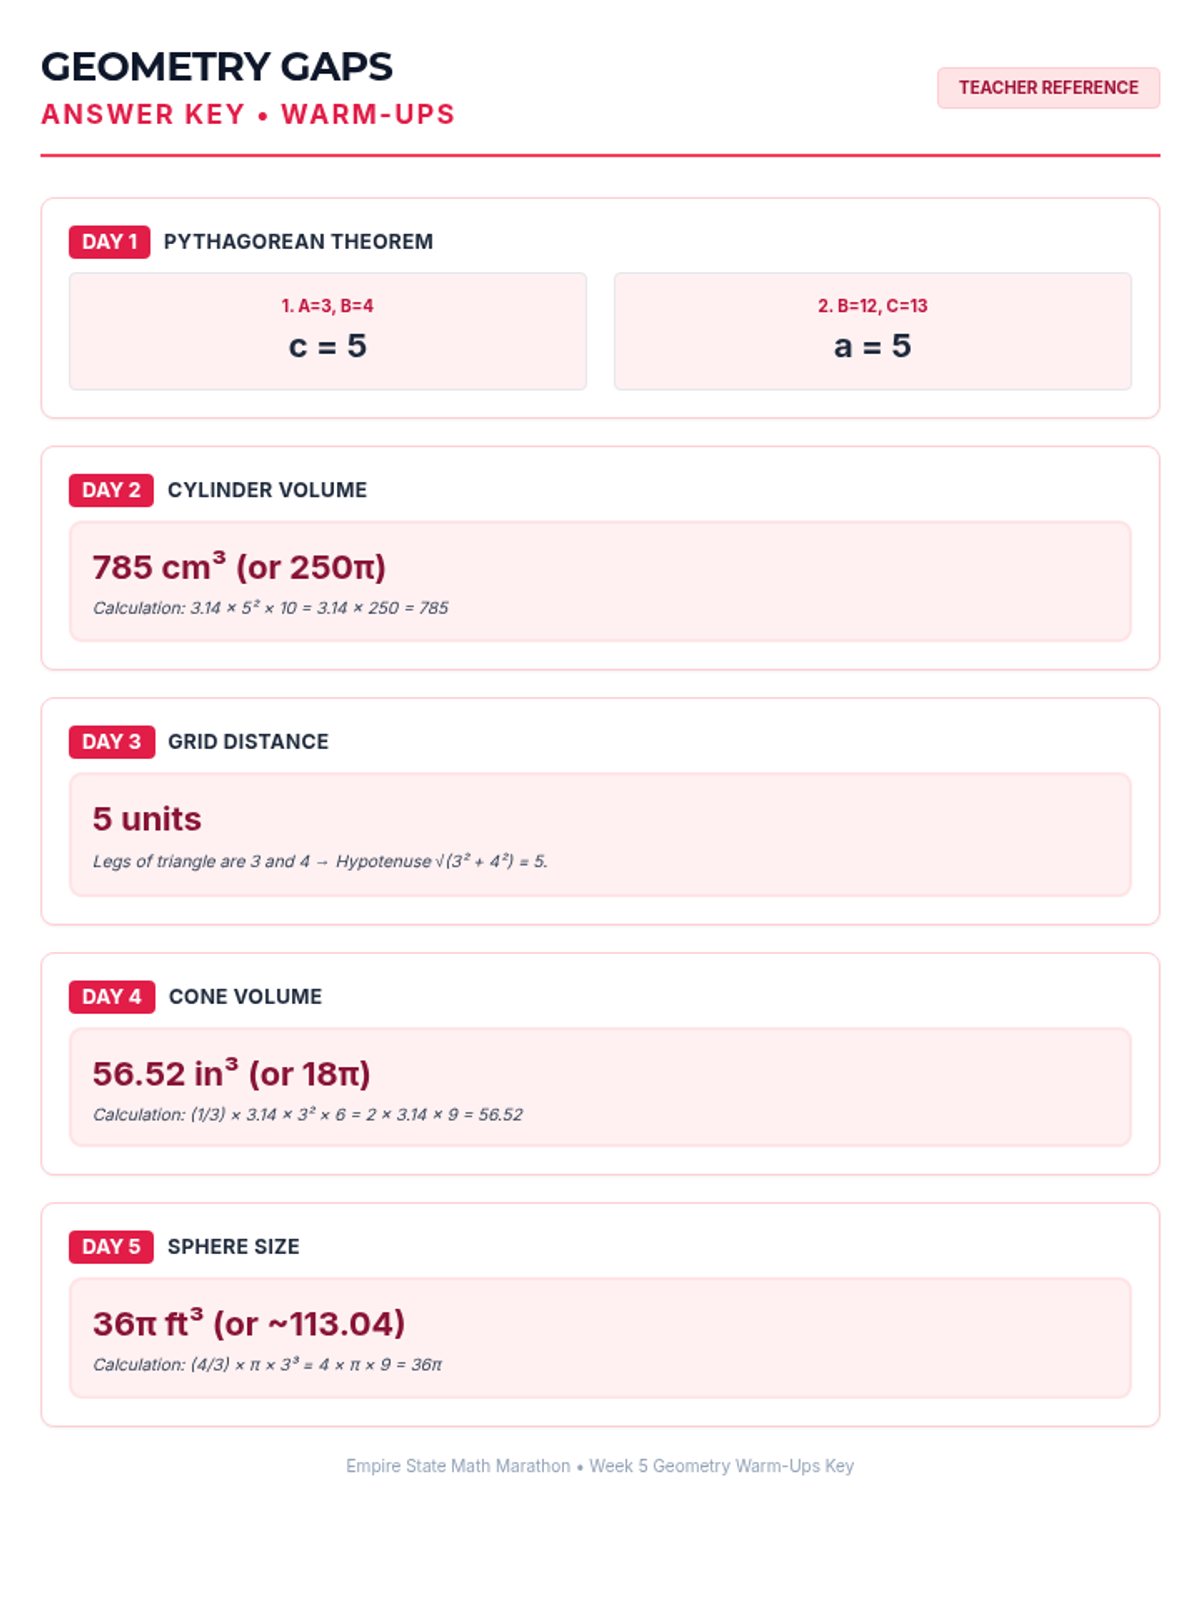
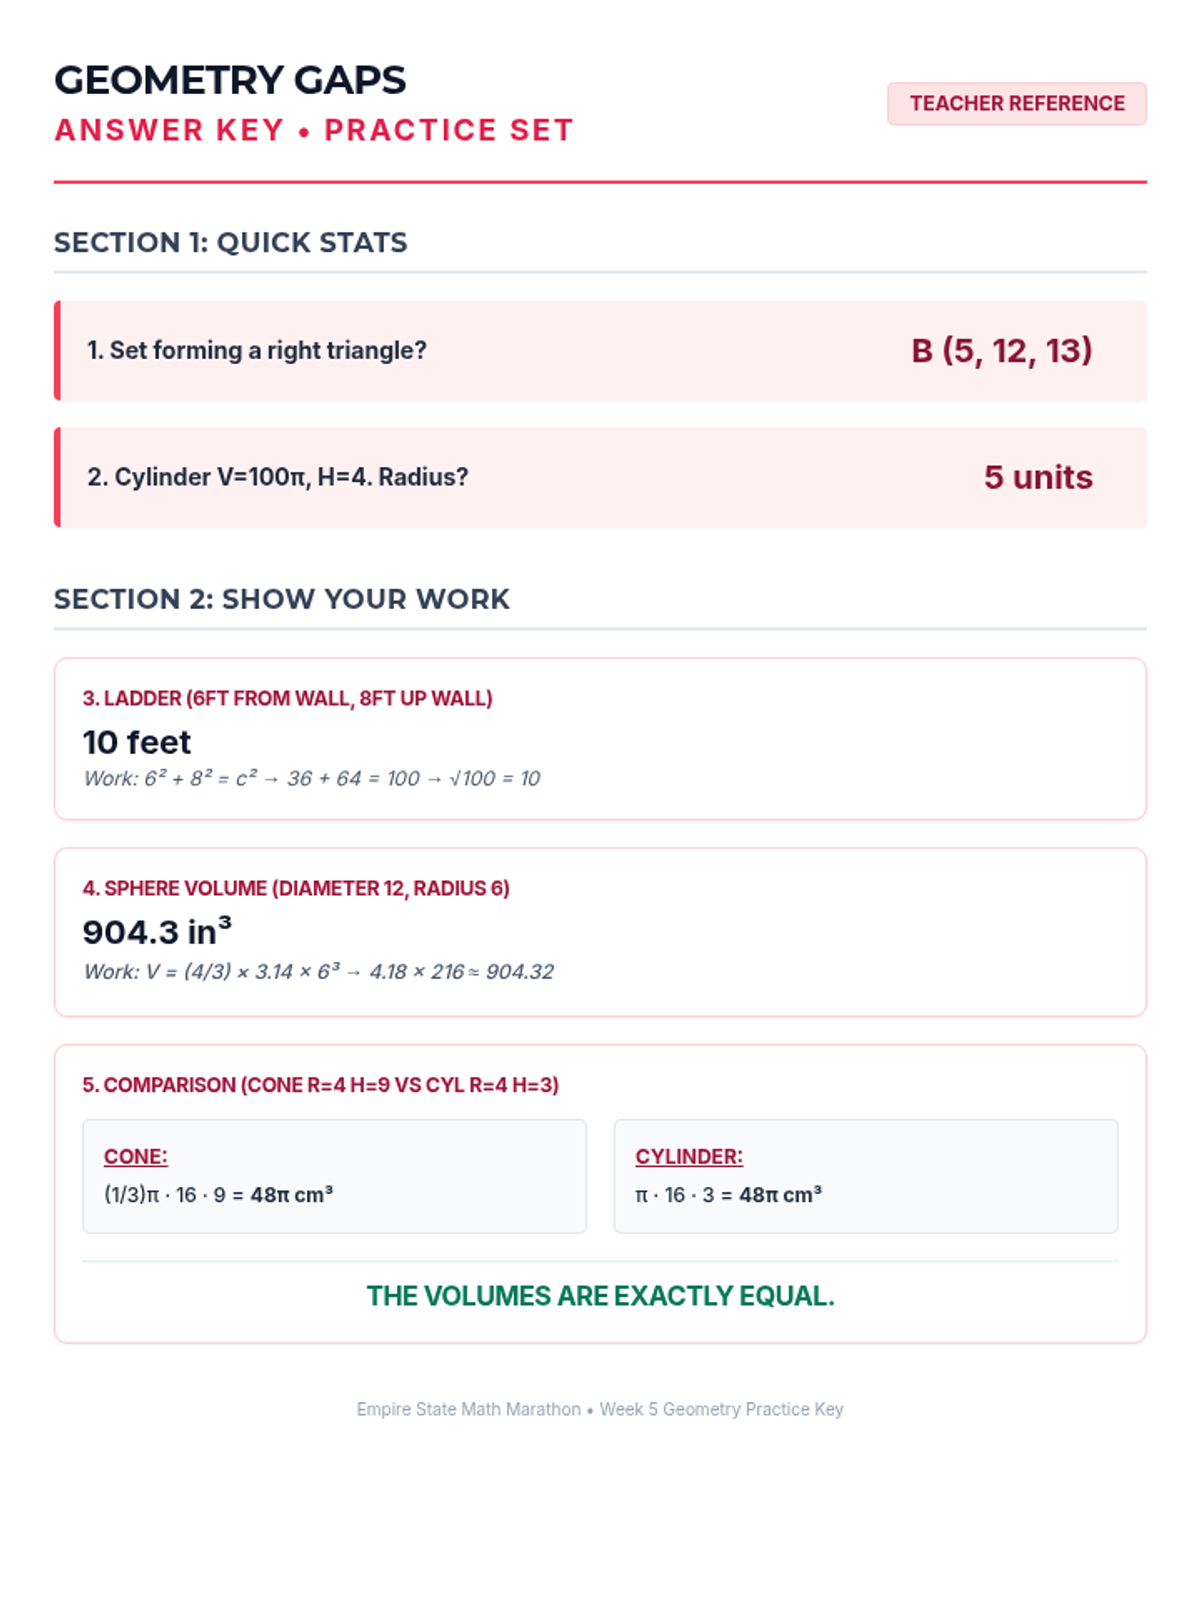
Week 5 reviews the Pythagorean Theorem and volume formulas for cylinders, cones, and spheres.
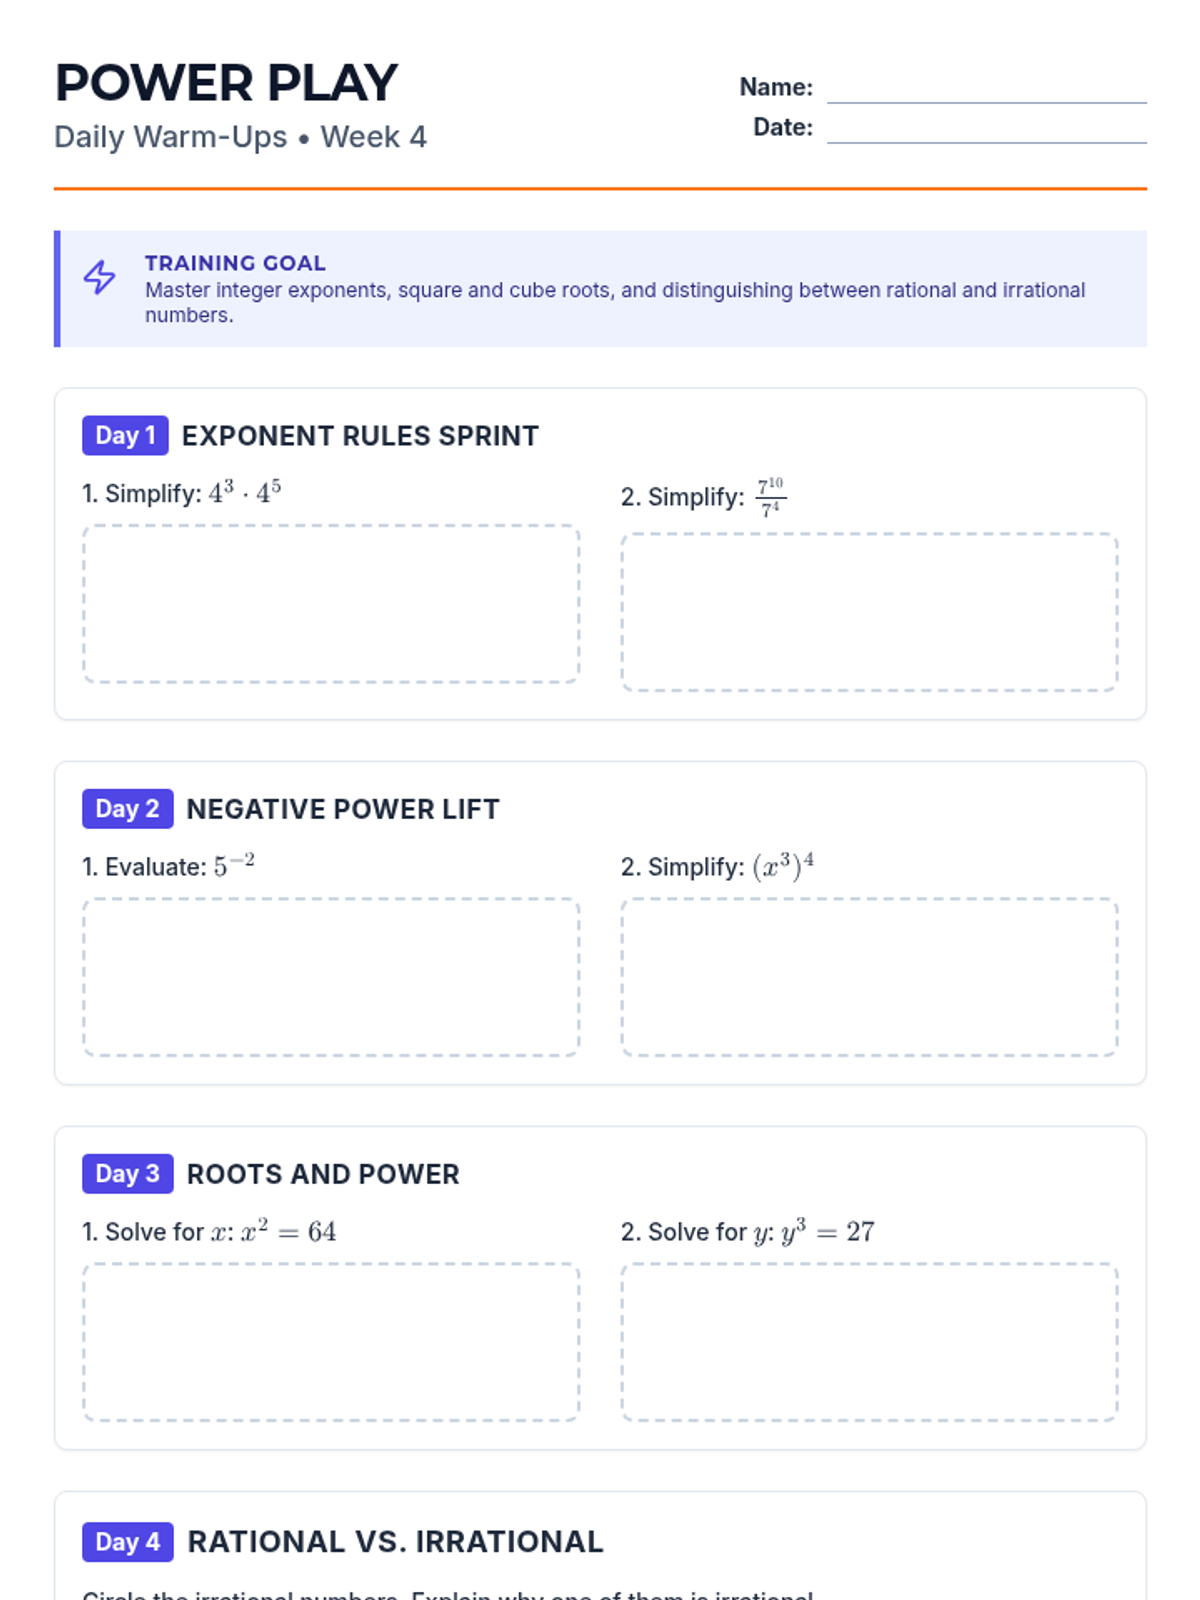
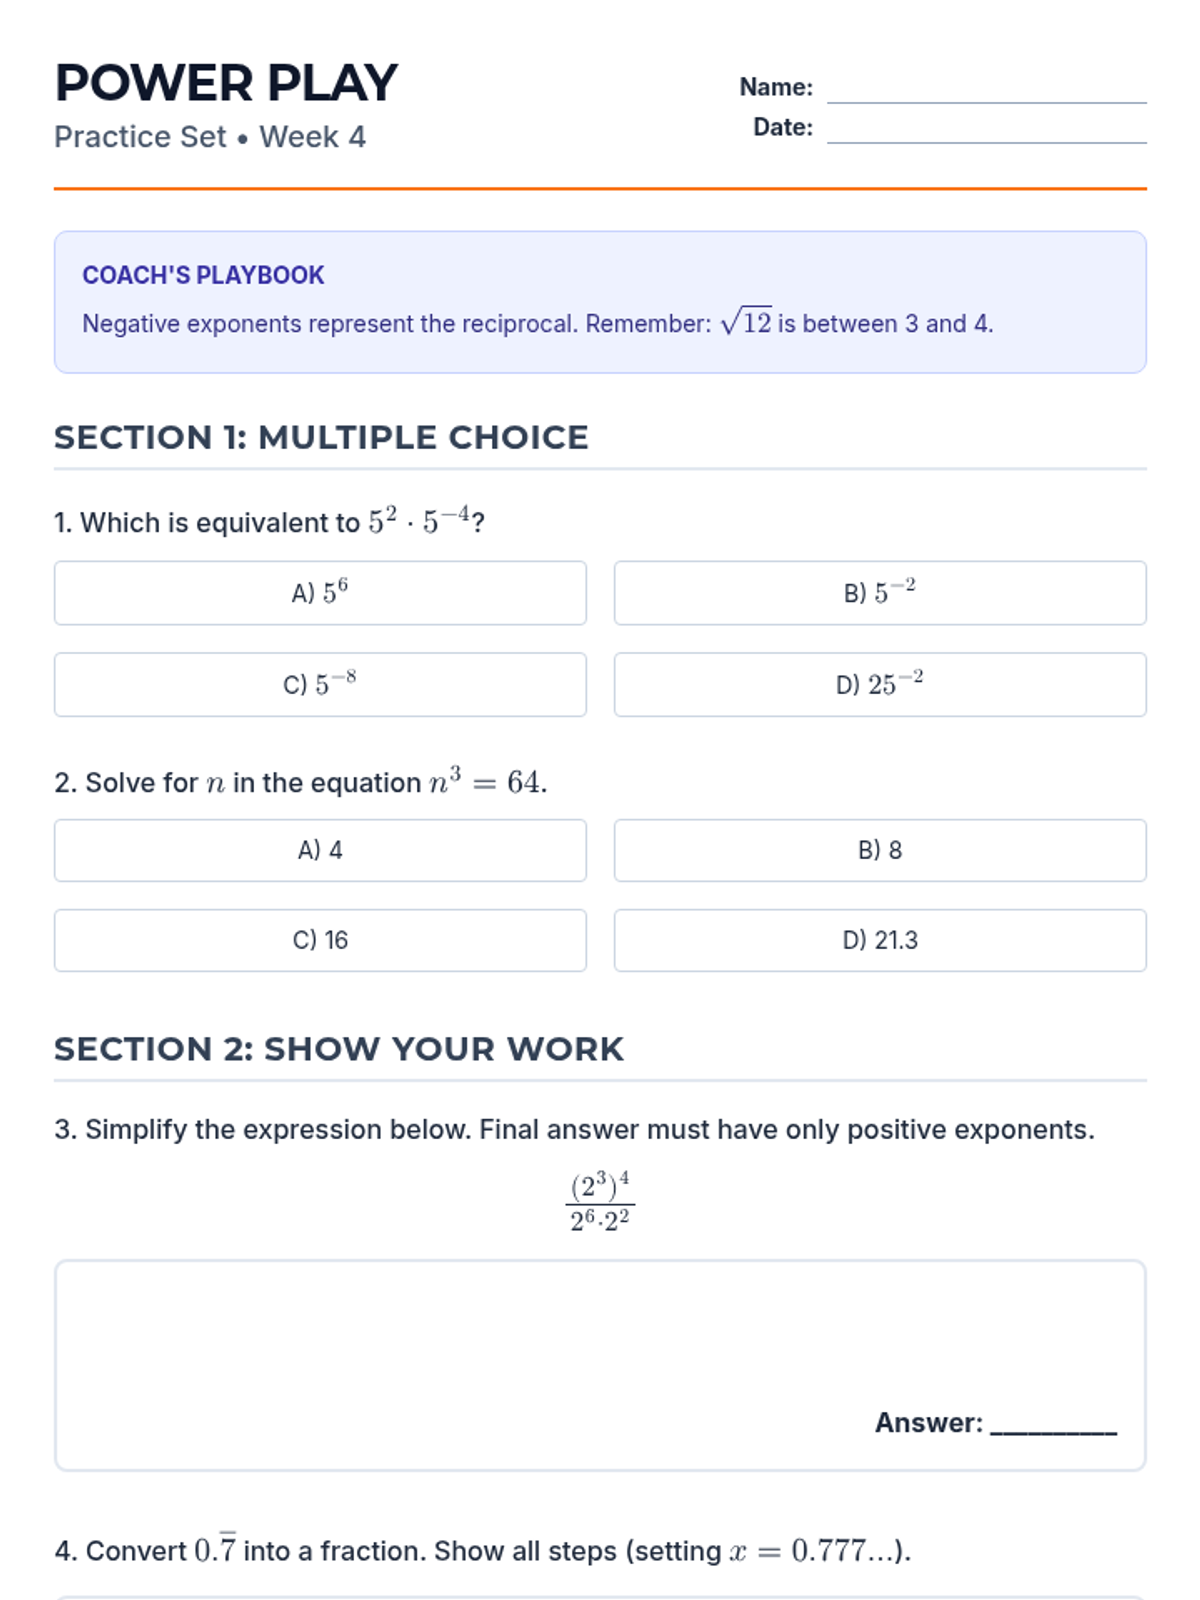
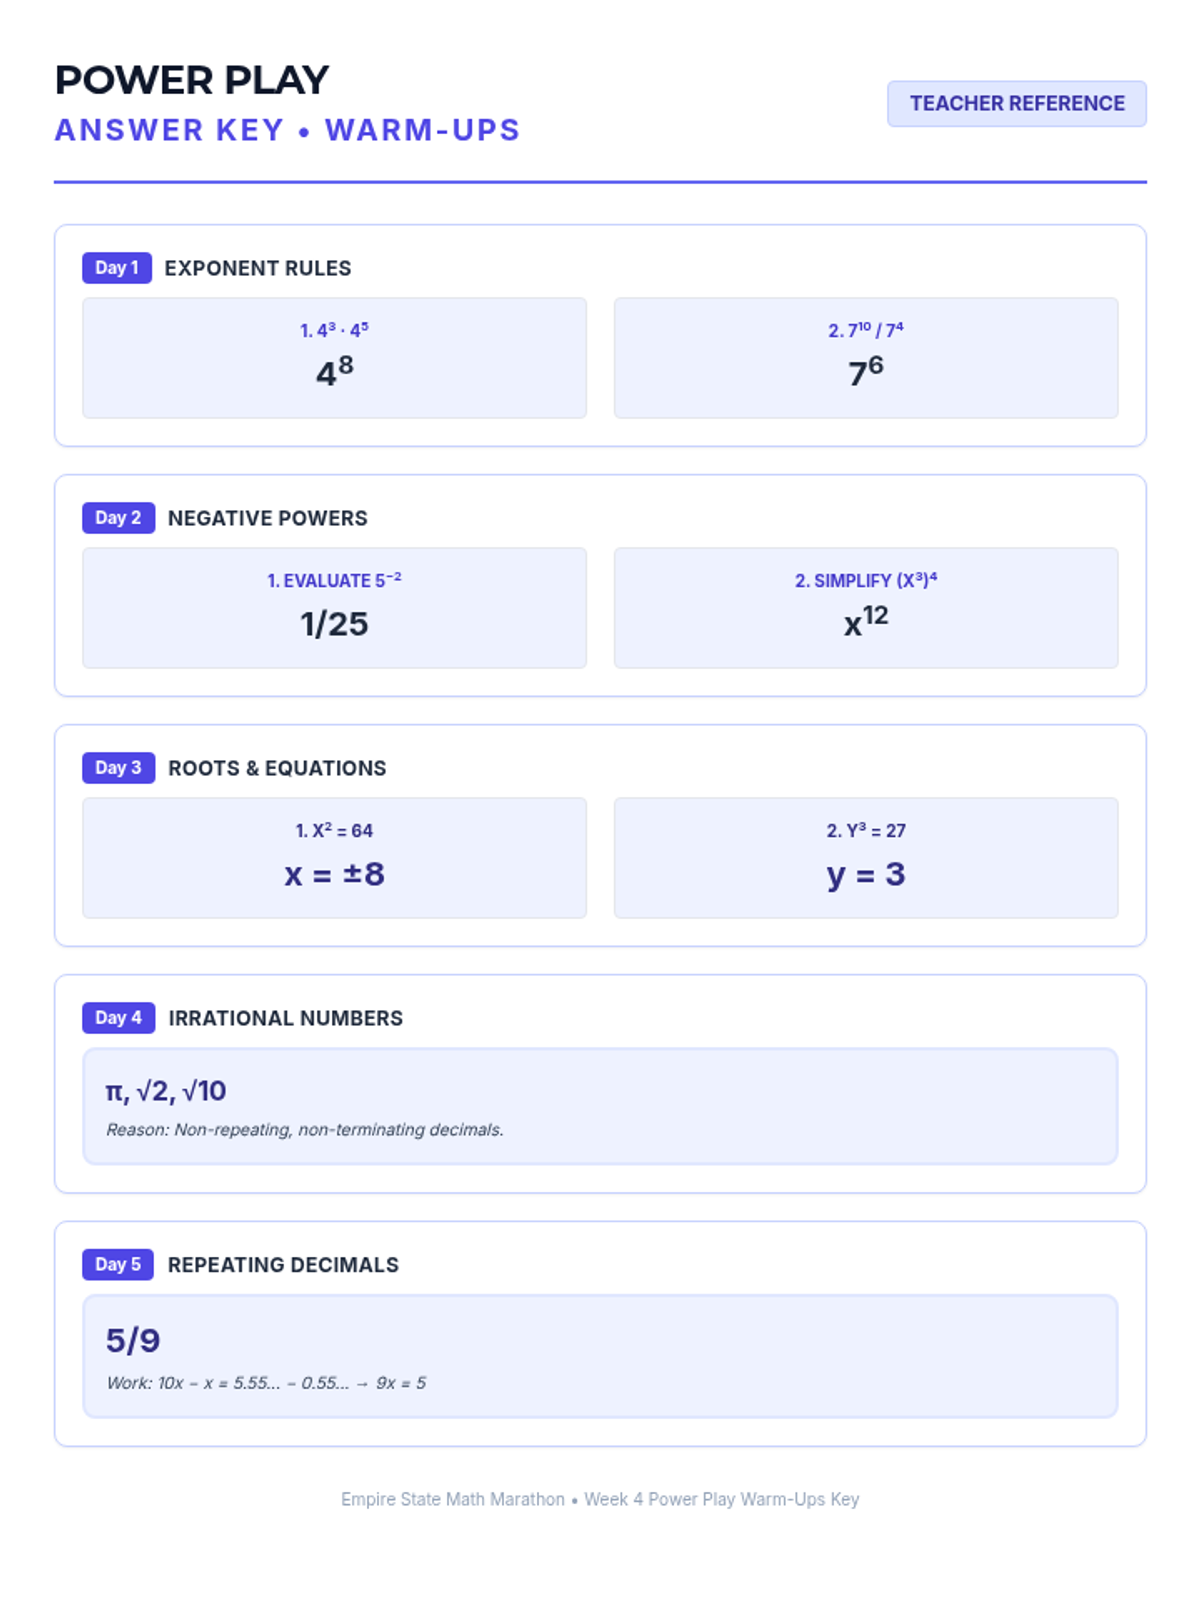
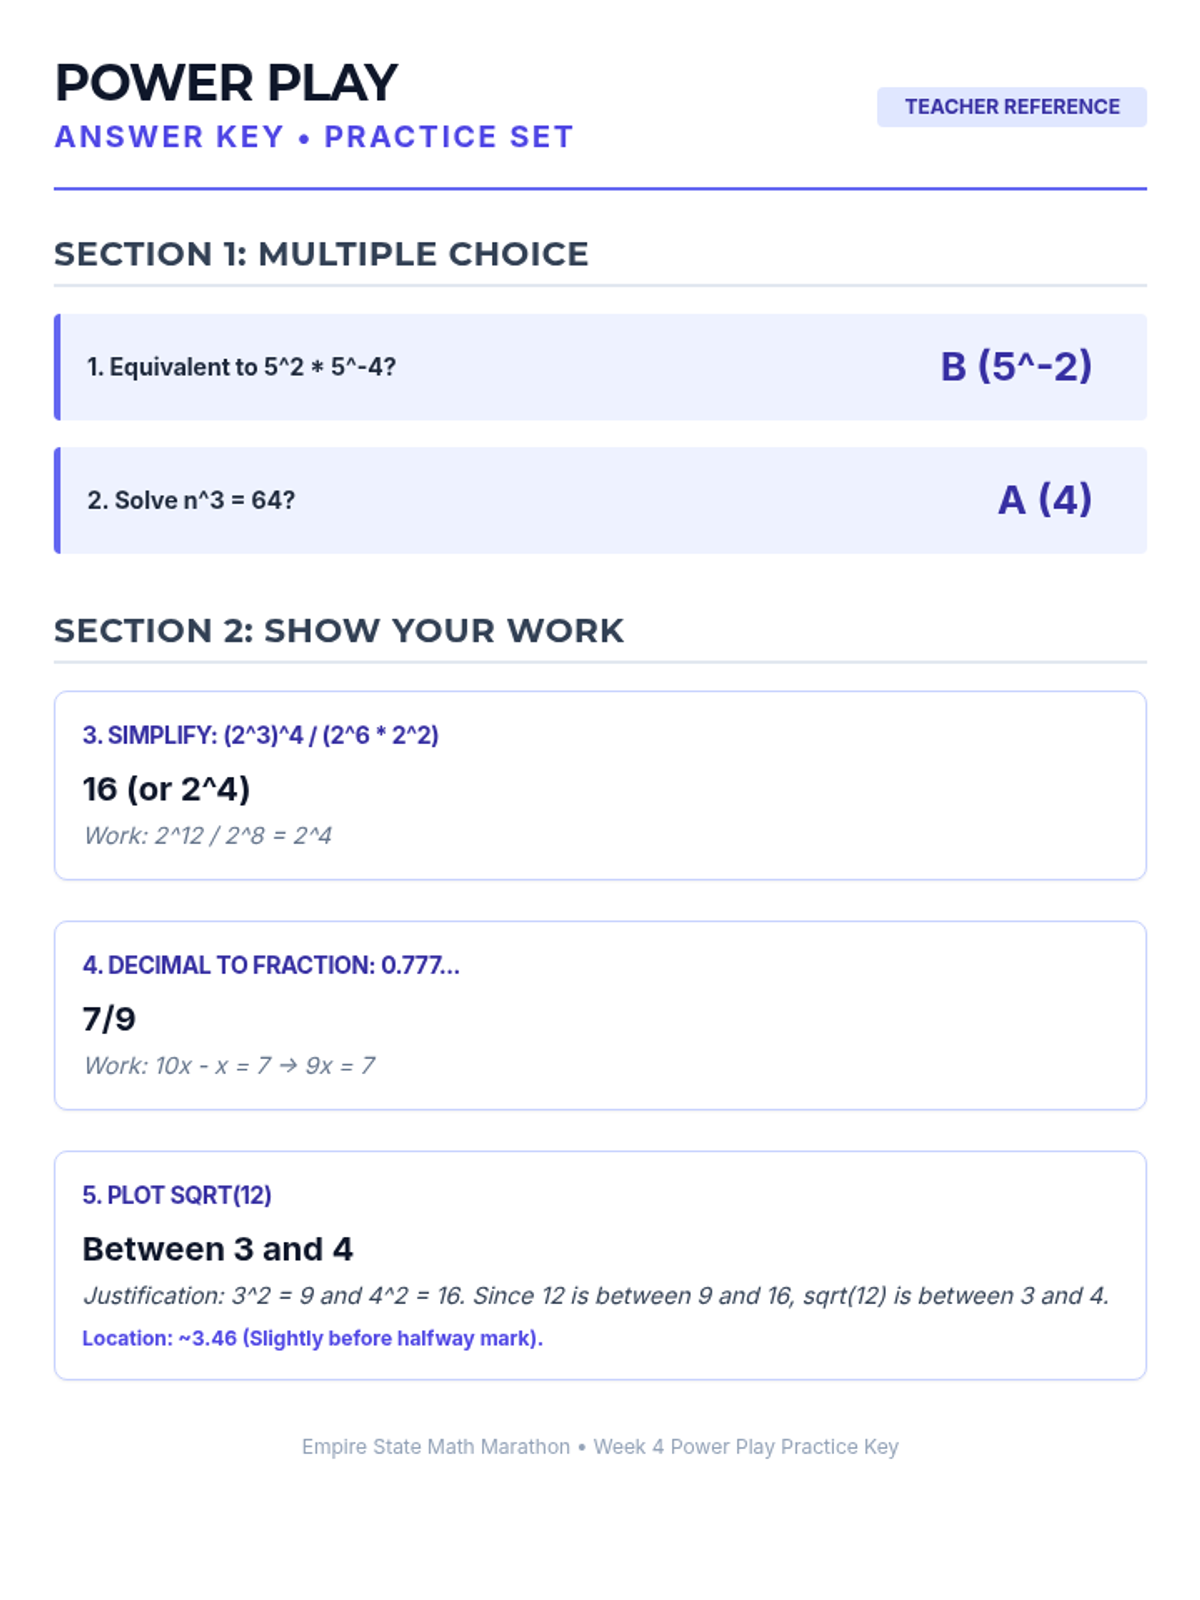
Week 4 explores integer exponent rules, perfect squares and cubes, and distinguishing between rational and irrational numbers.
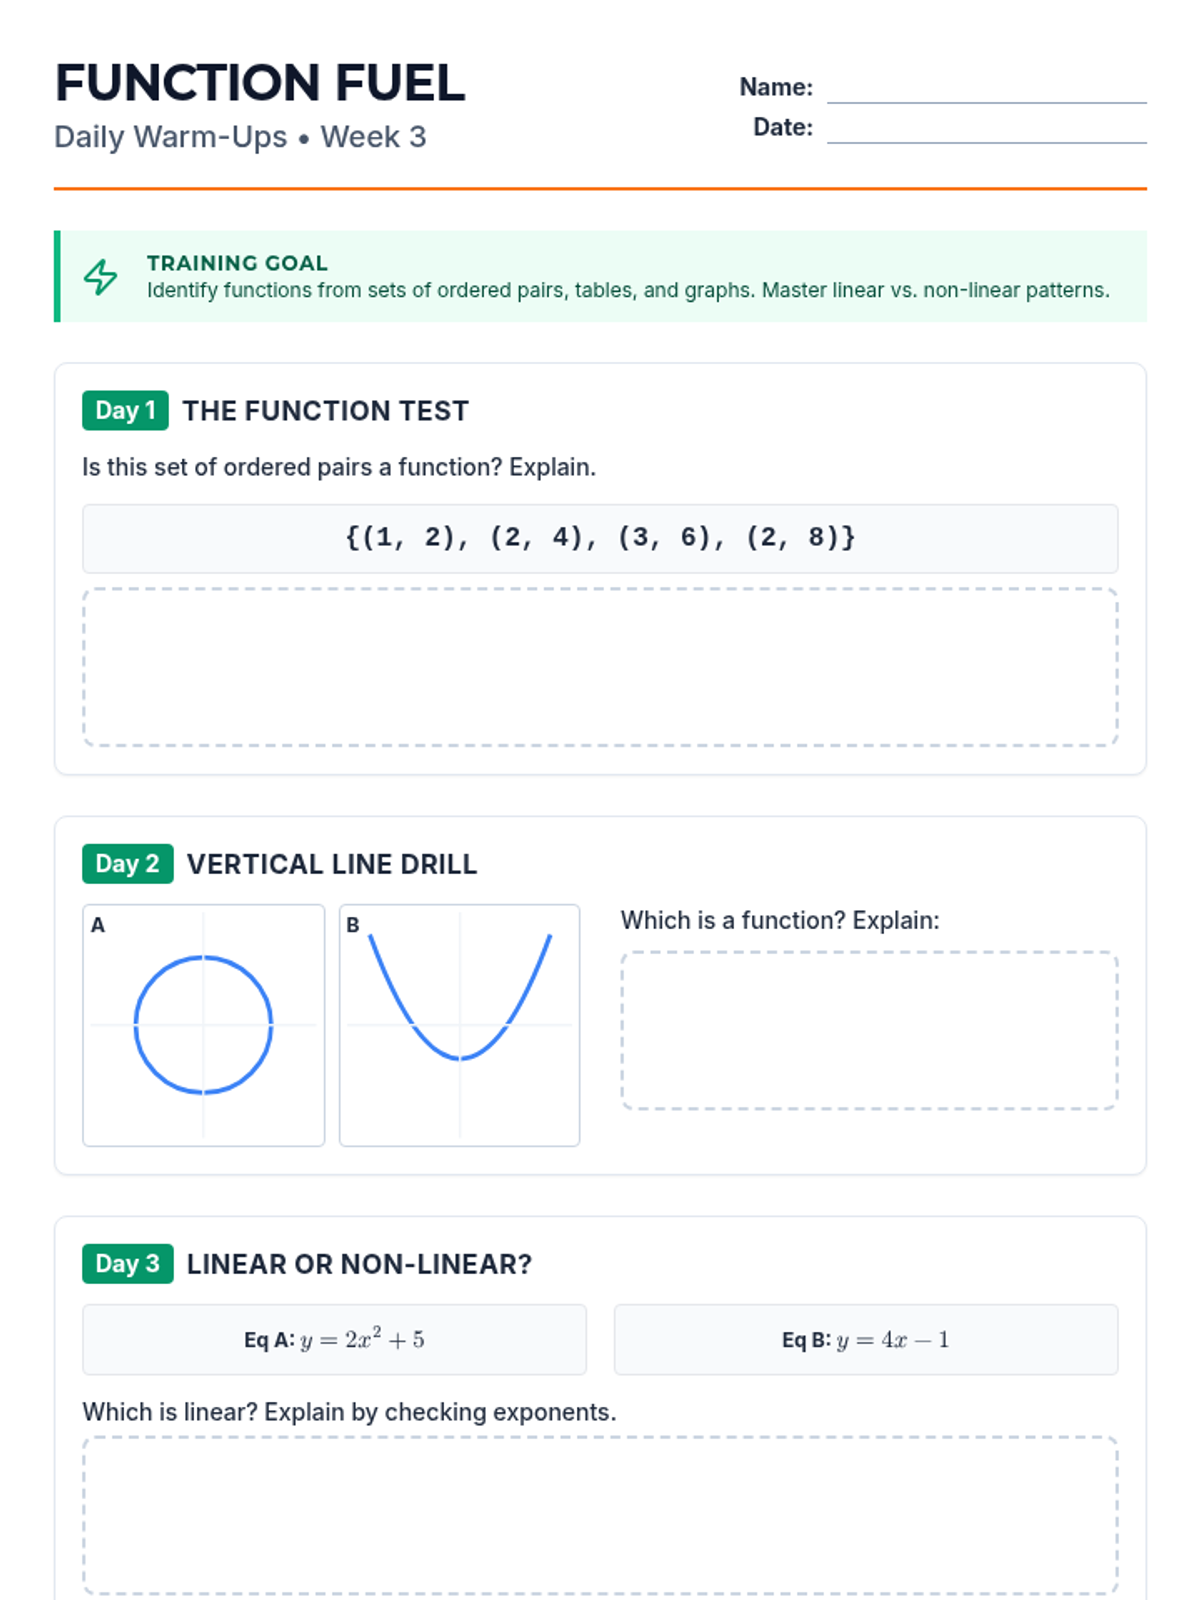
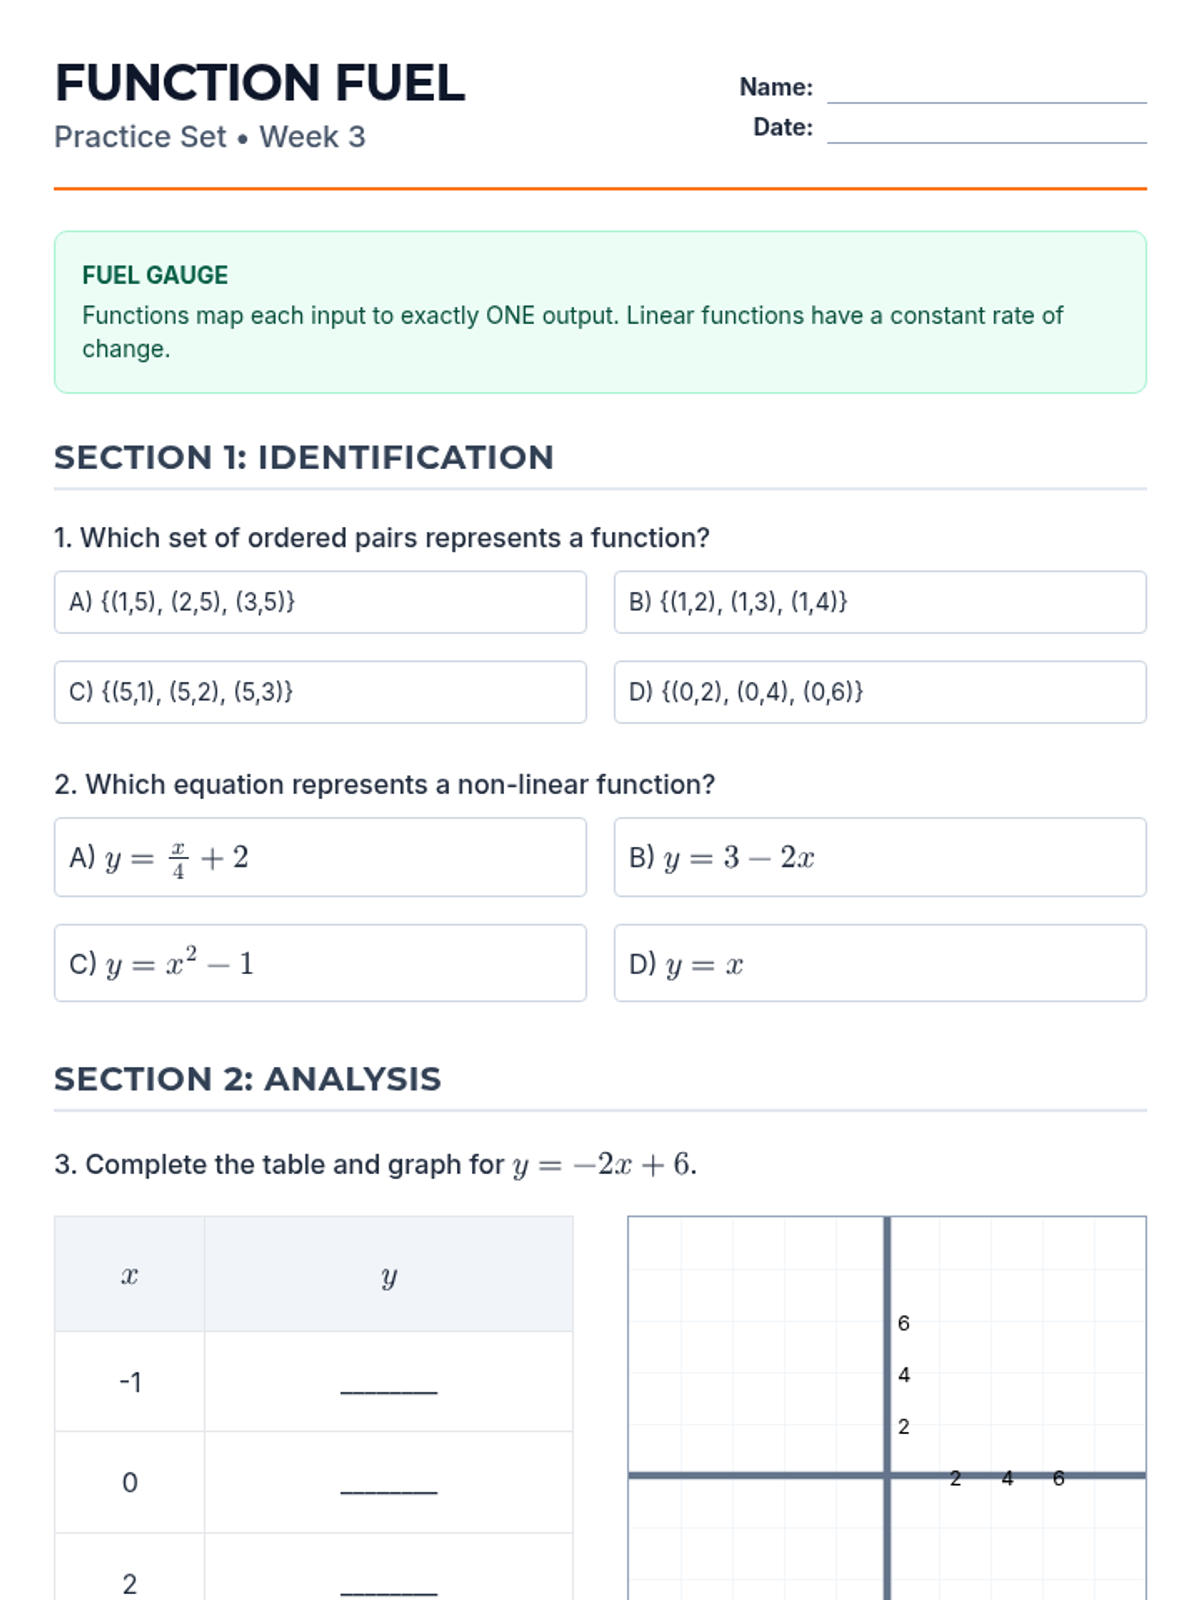
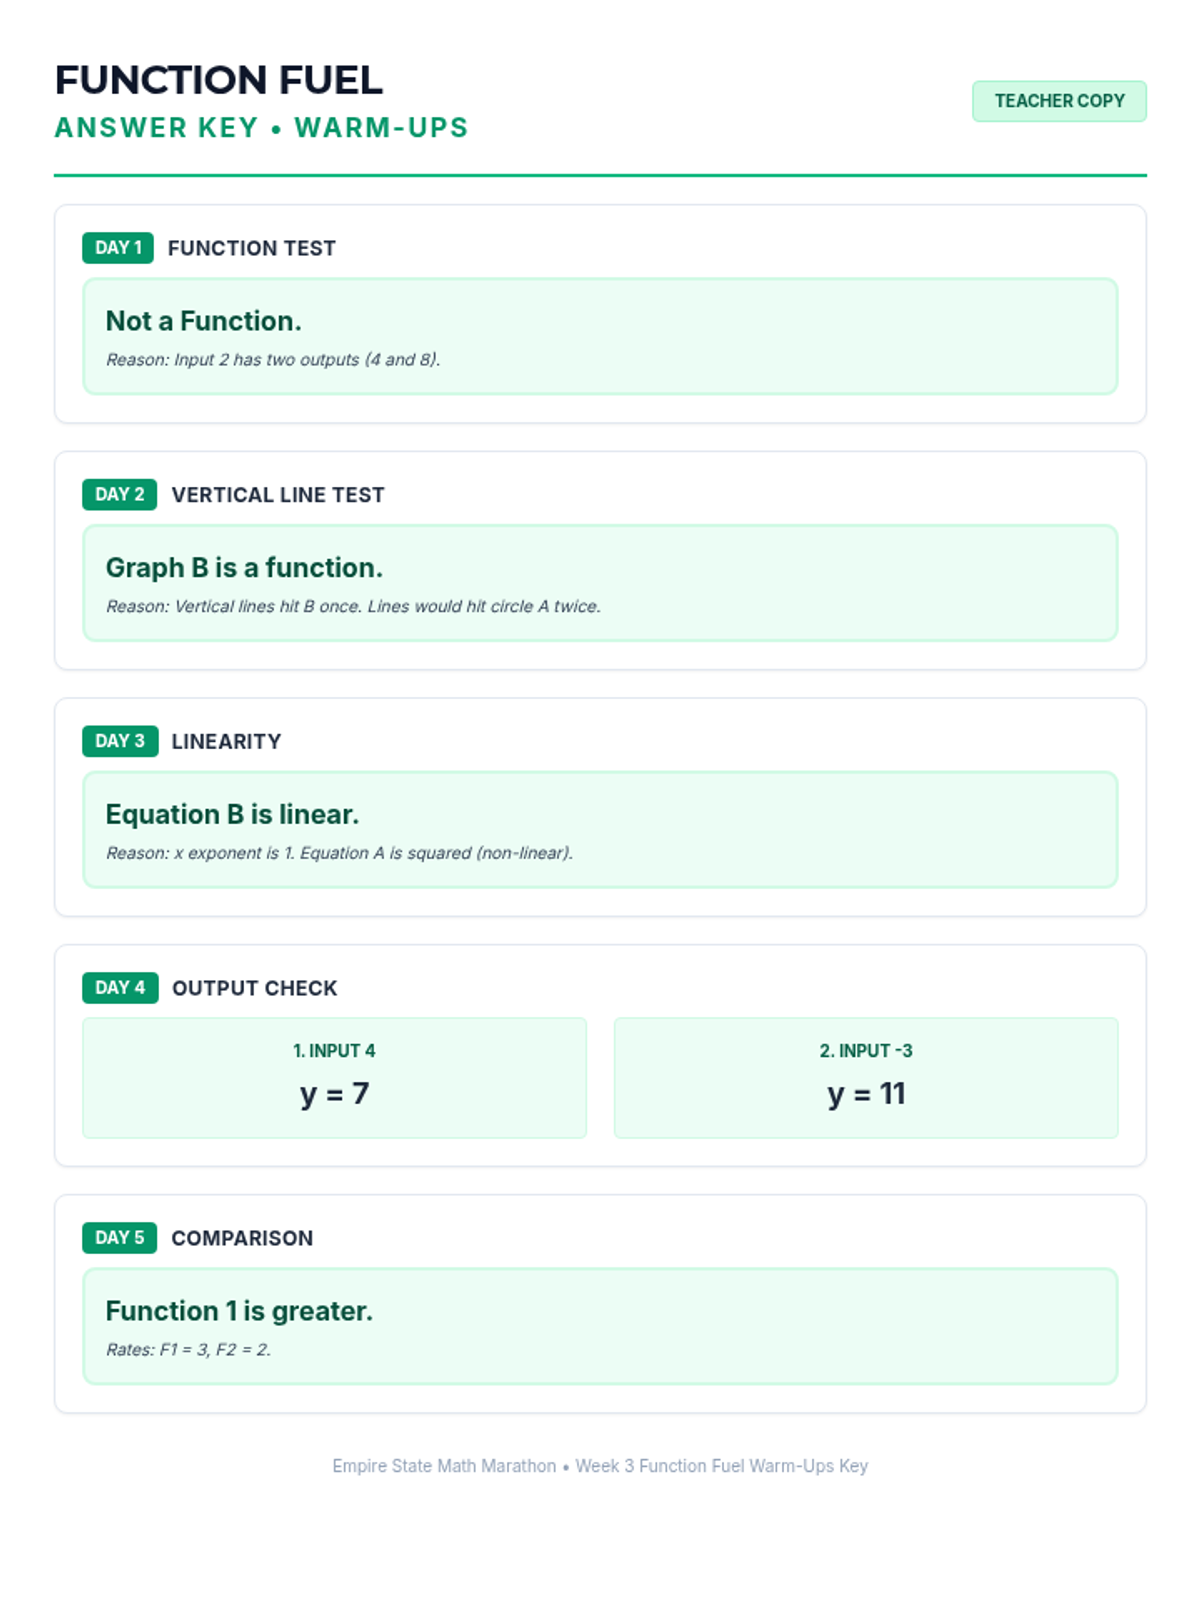
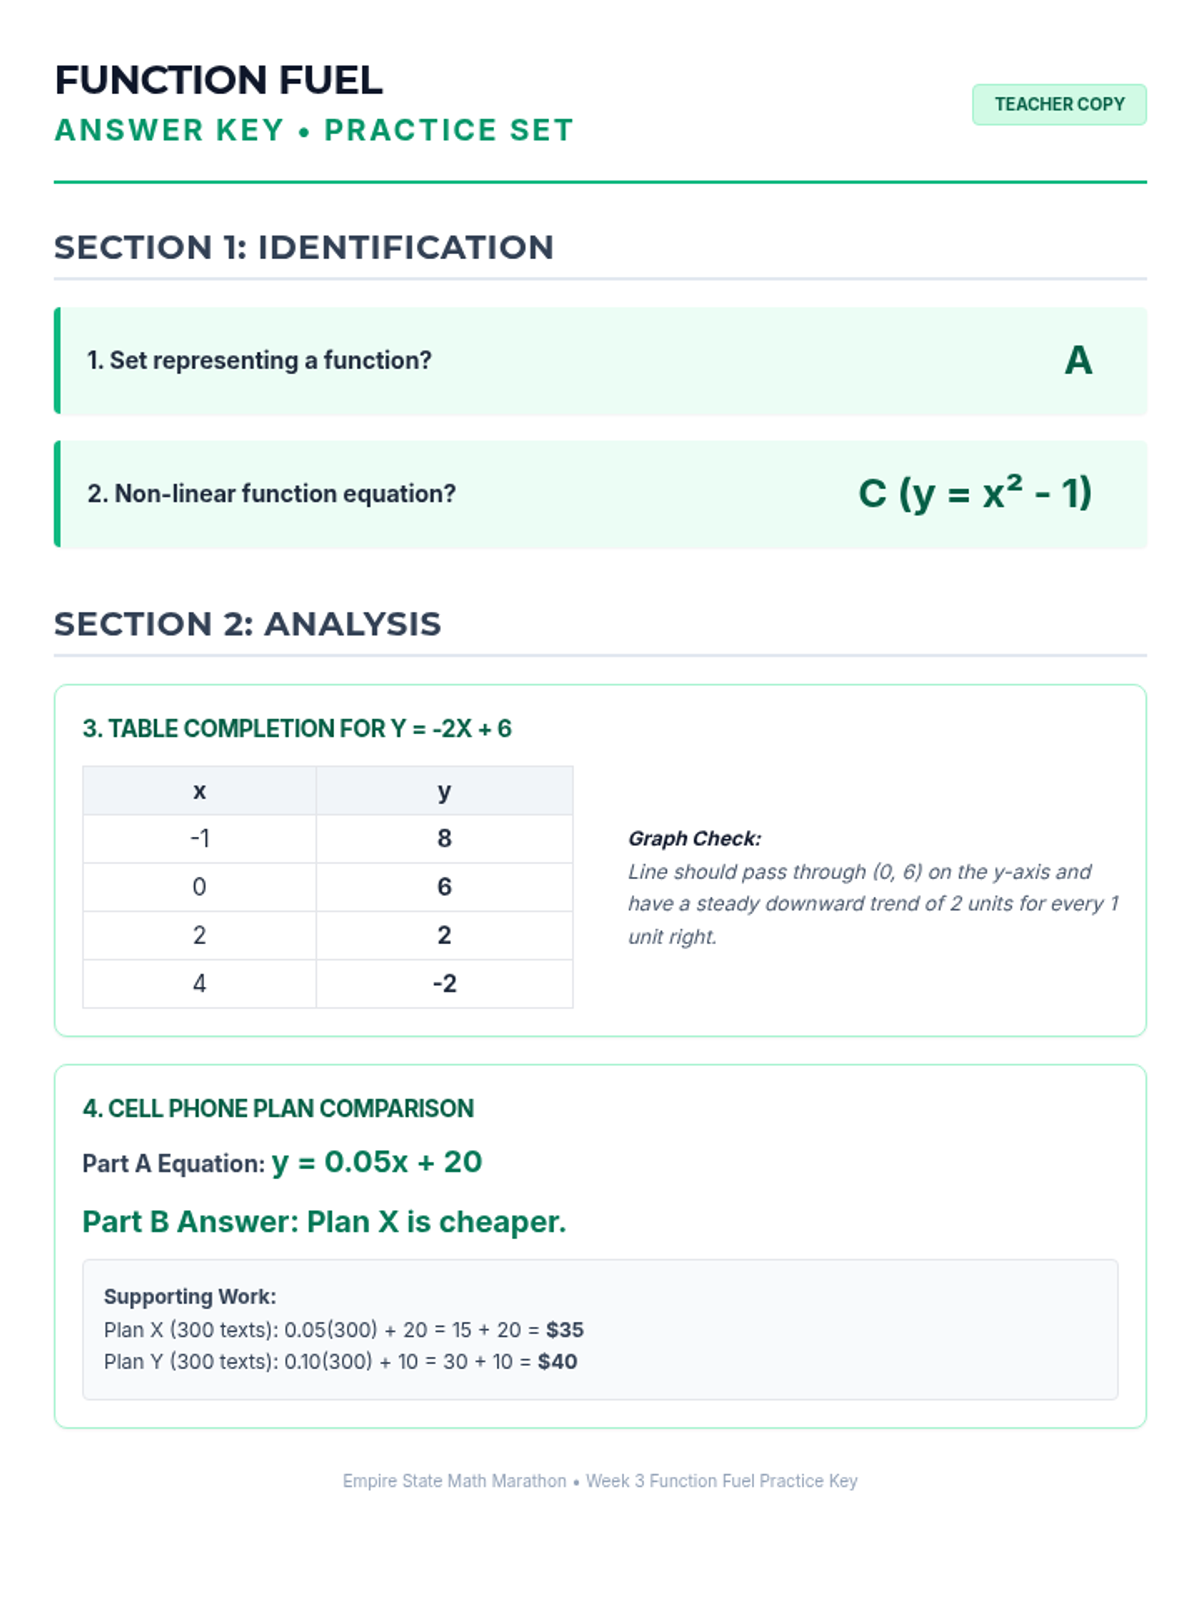
Week 3 defines, evaluates, and compares functions represented in different ways (tables, graphs, equations).
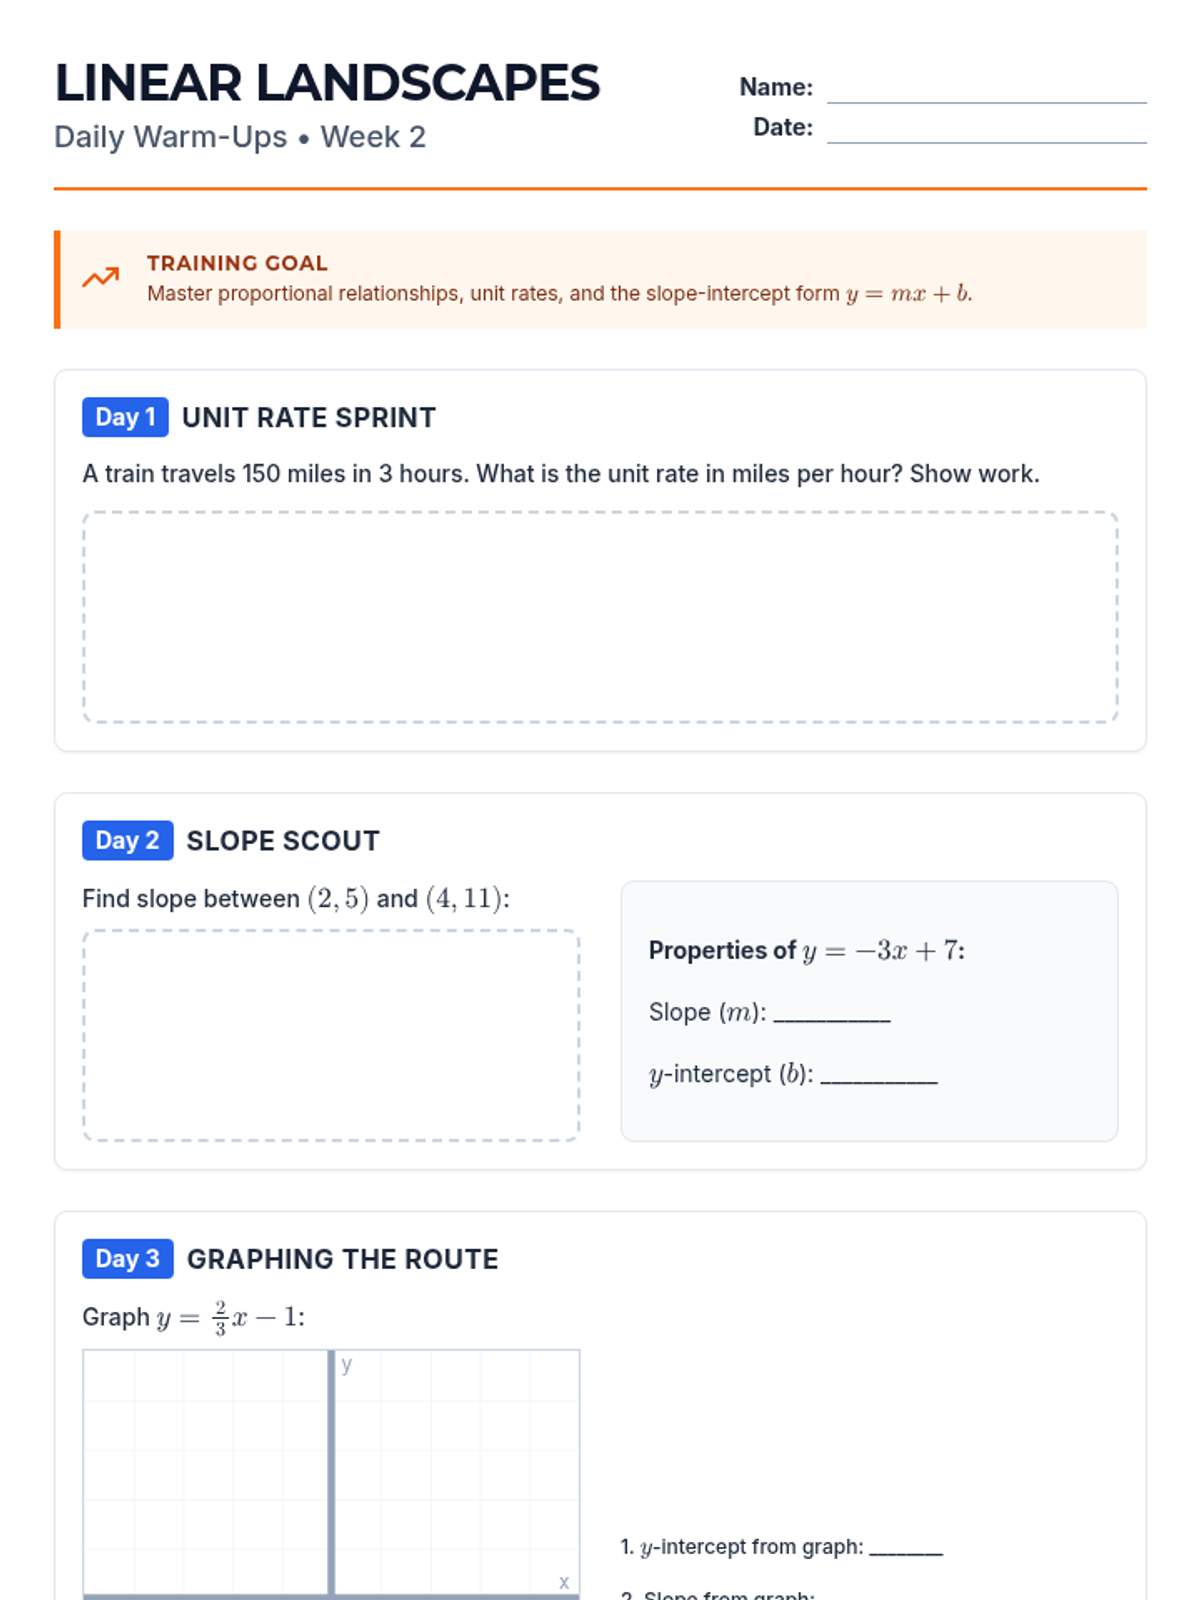
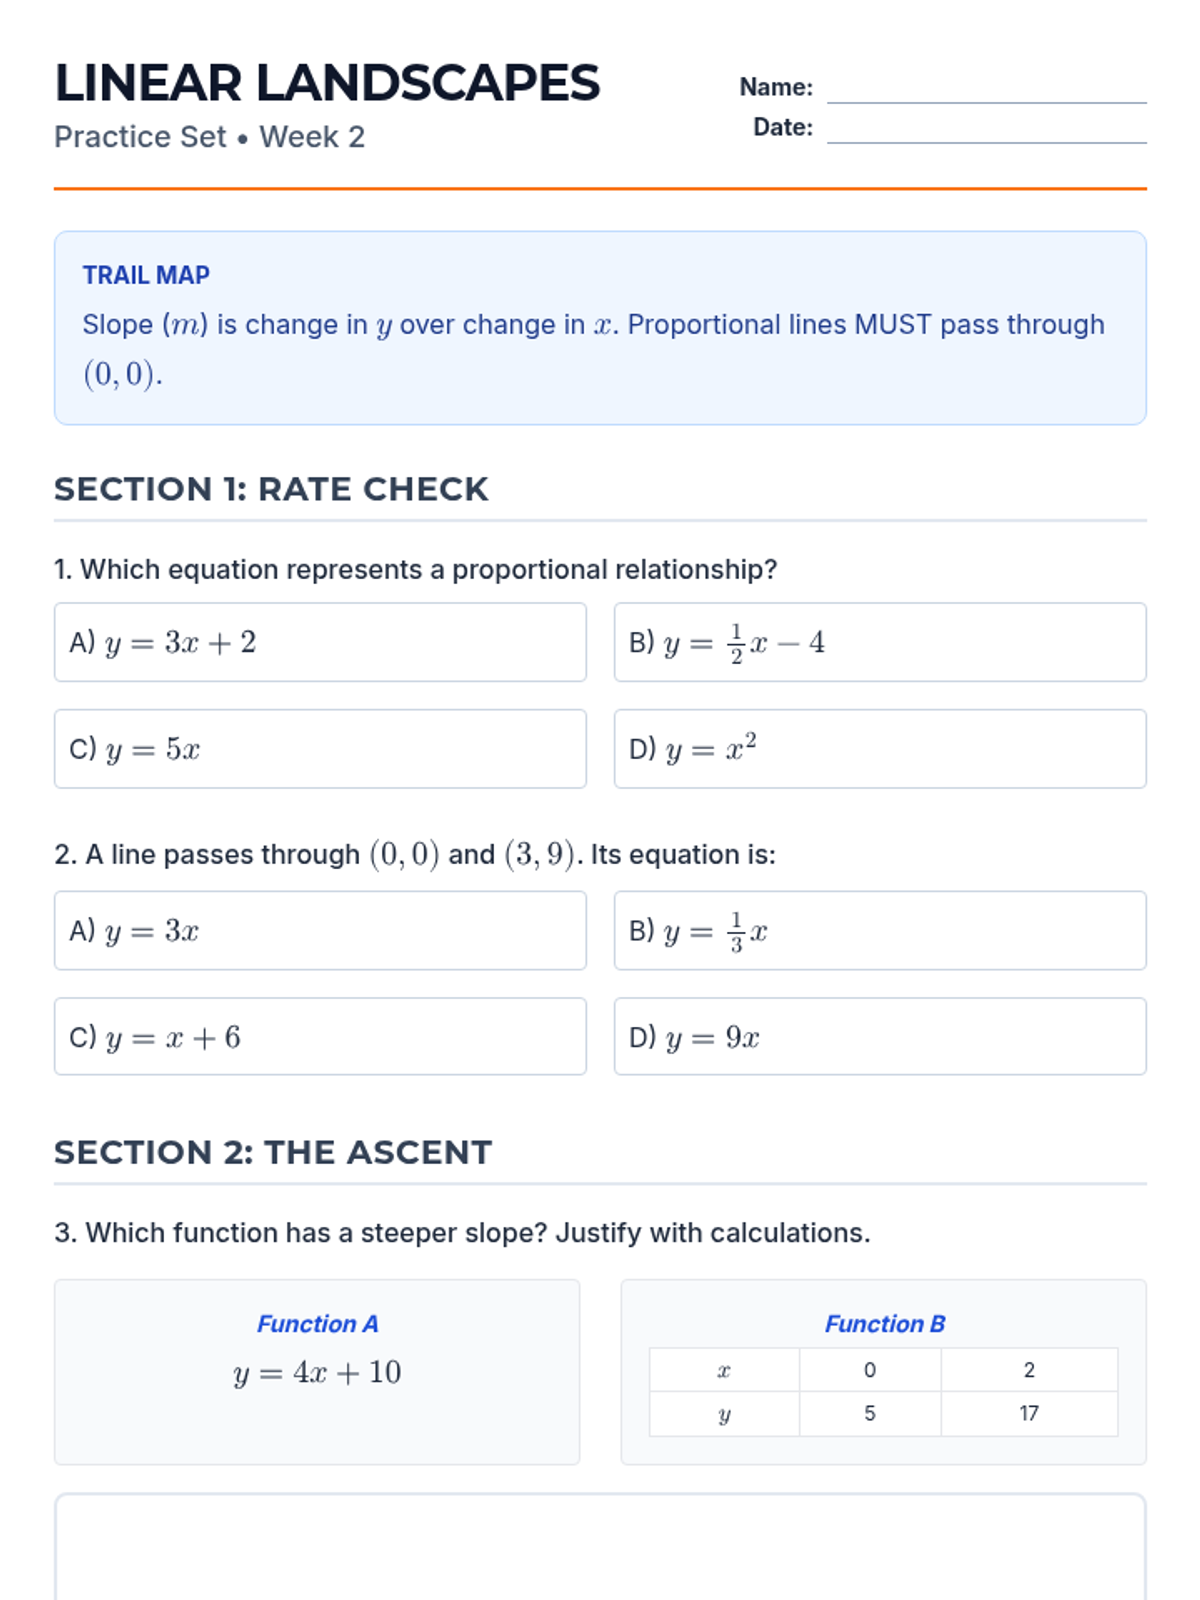
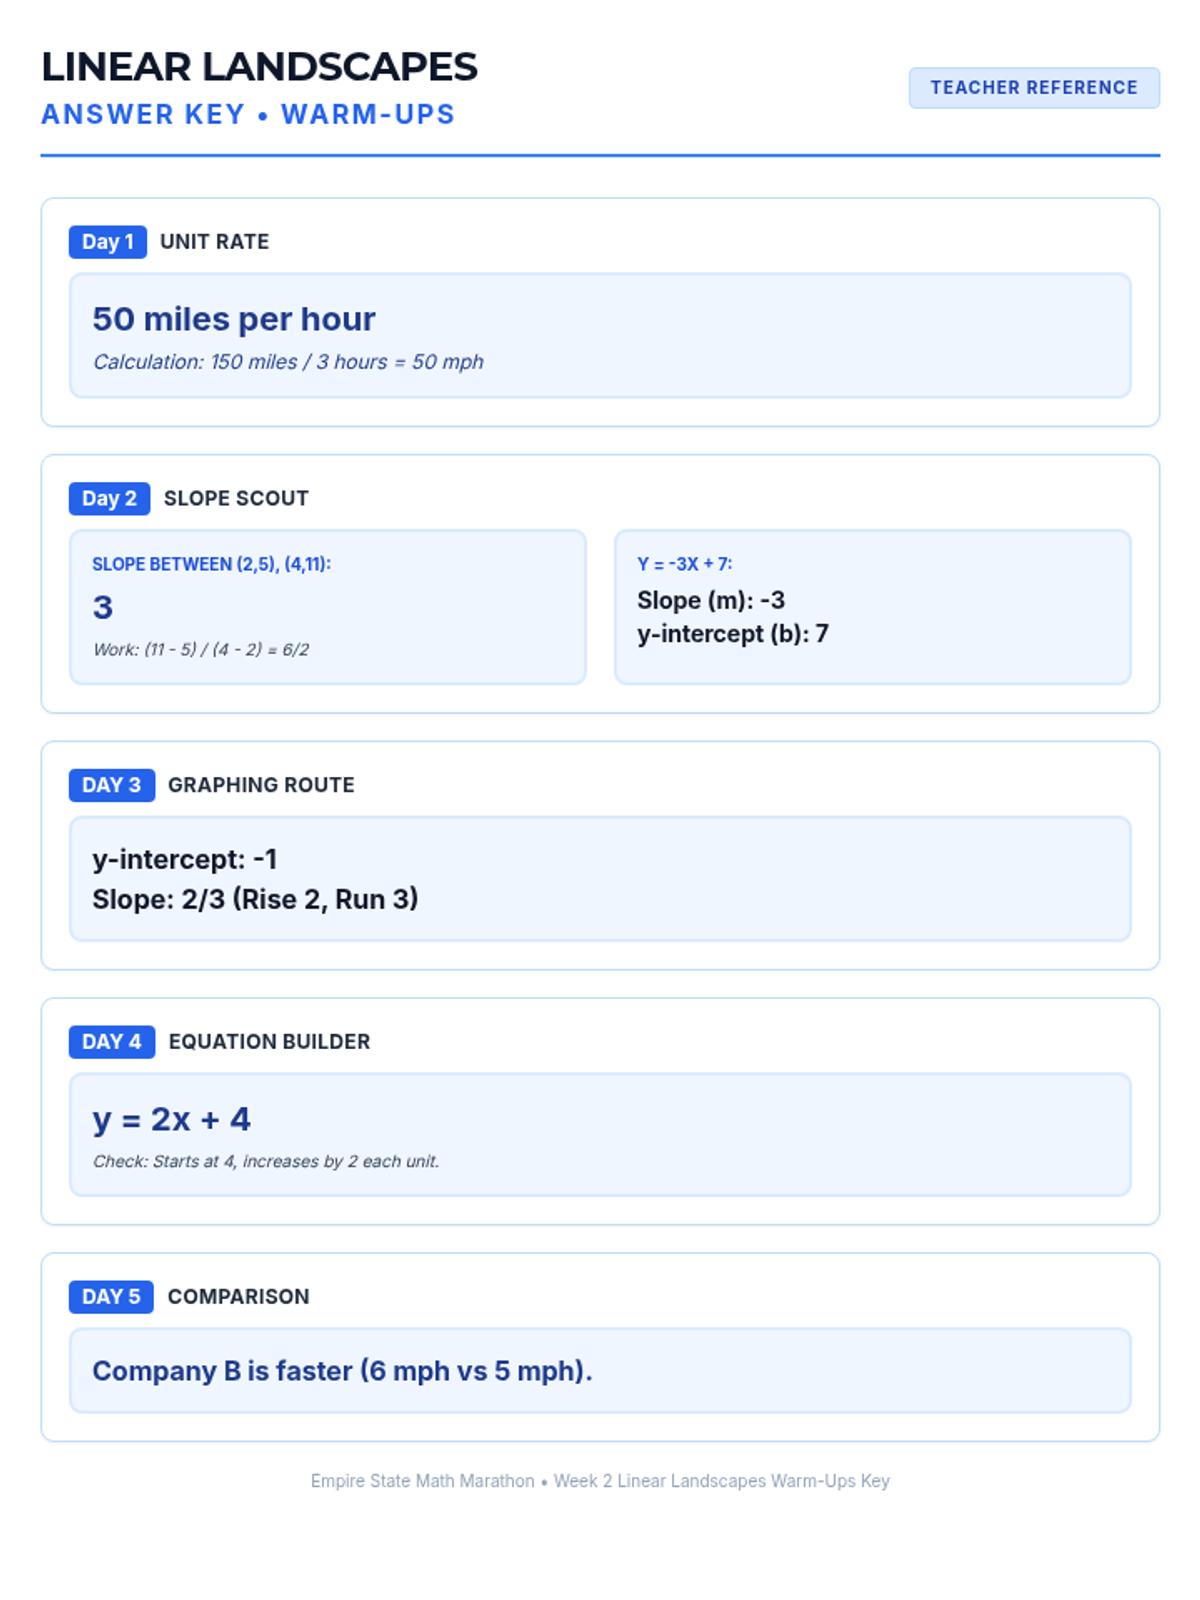
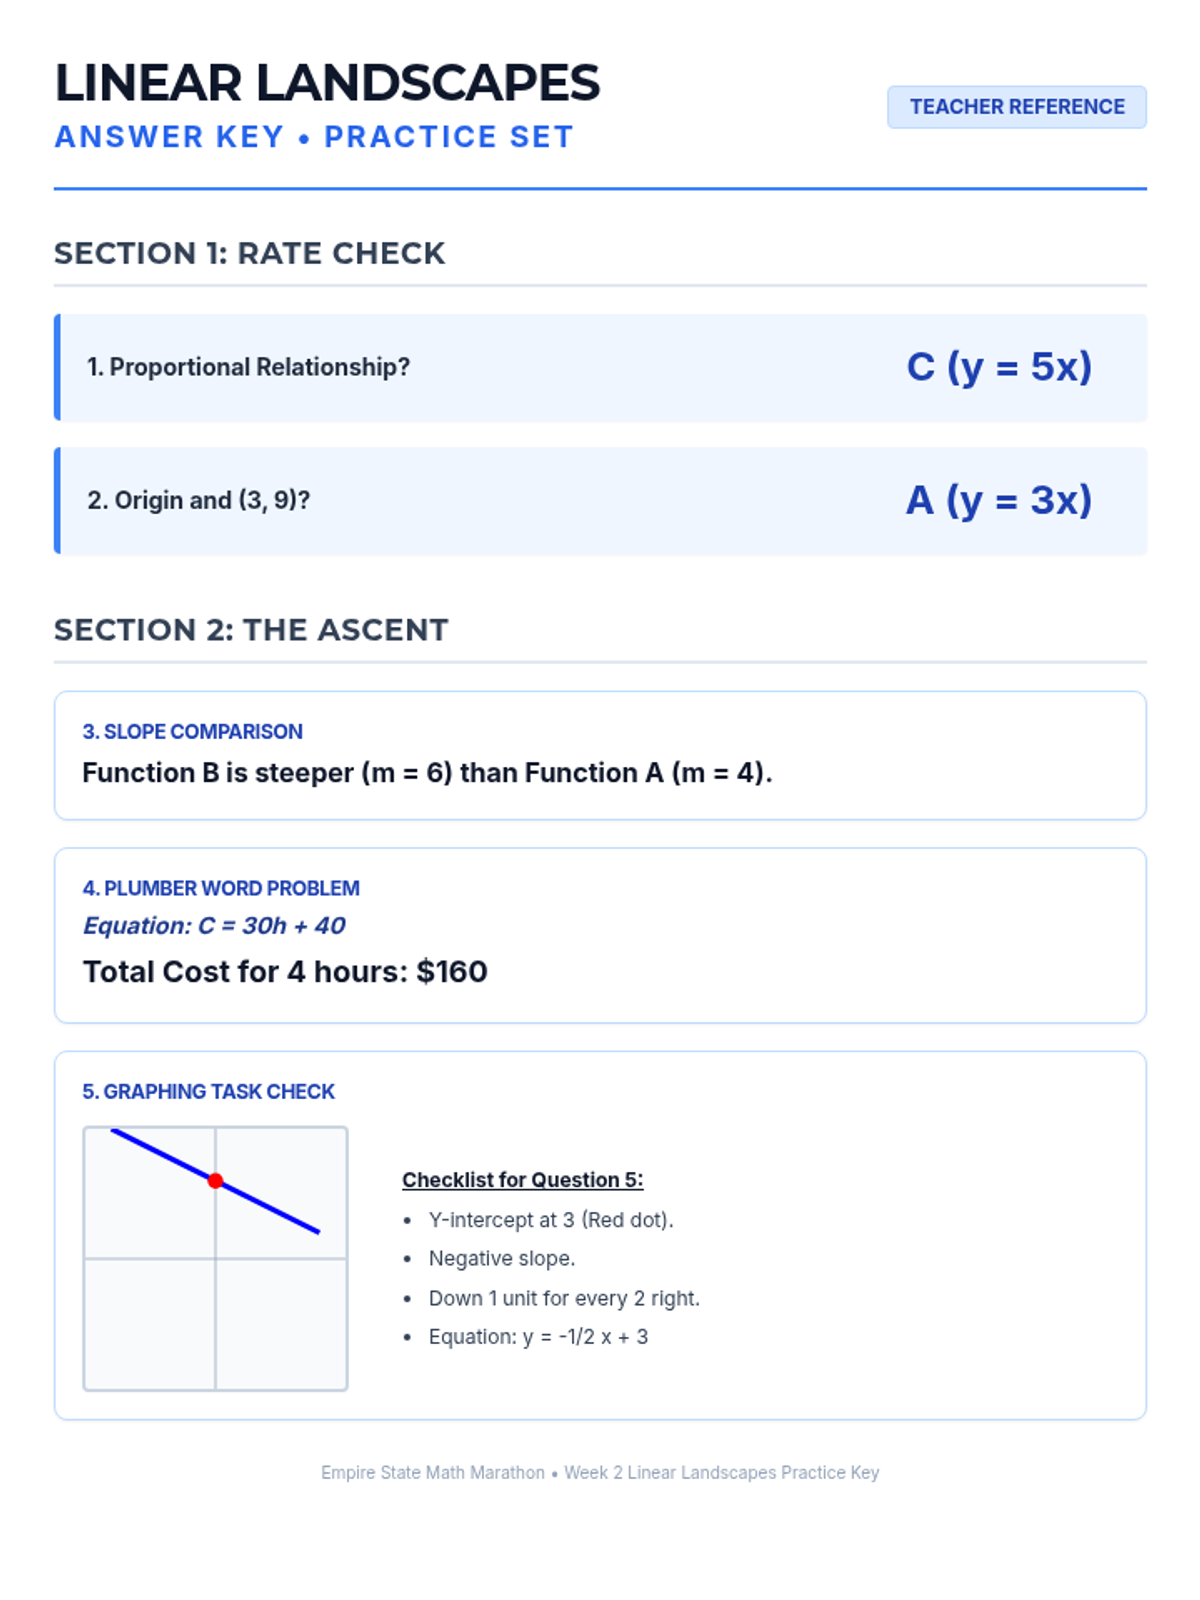
Week 2 covers proportional relationships, unit rates, and the slope-intercept form of linear equations.
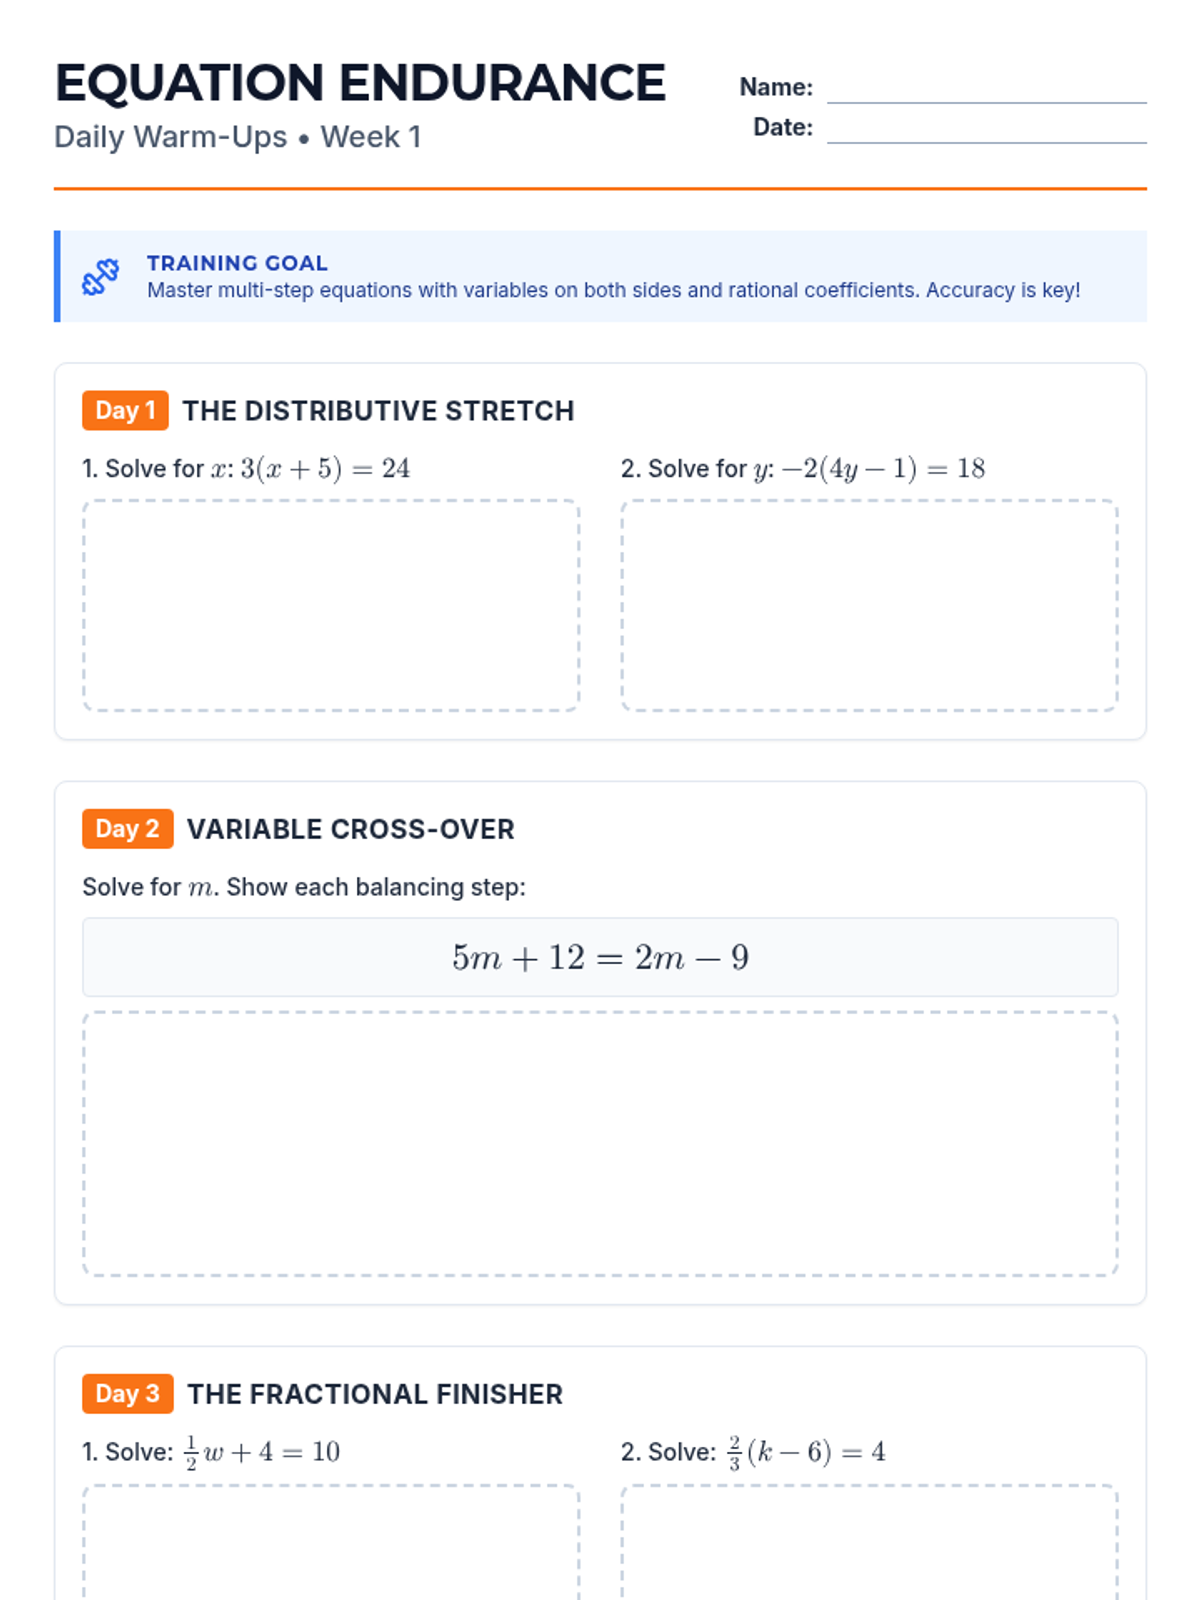
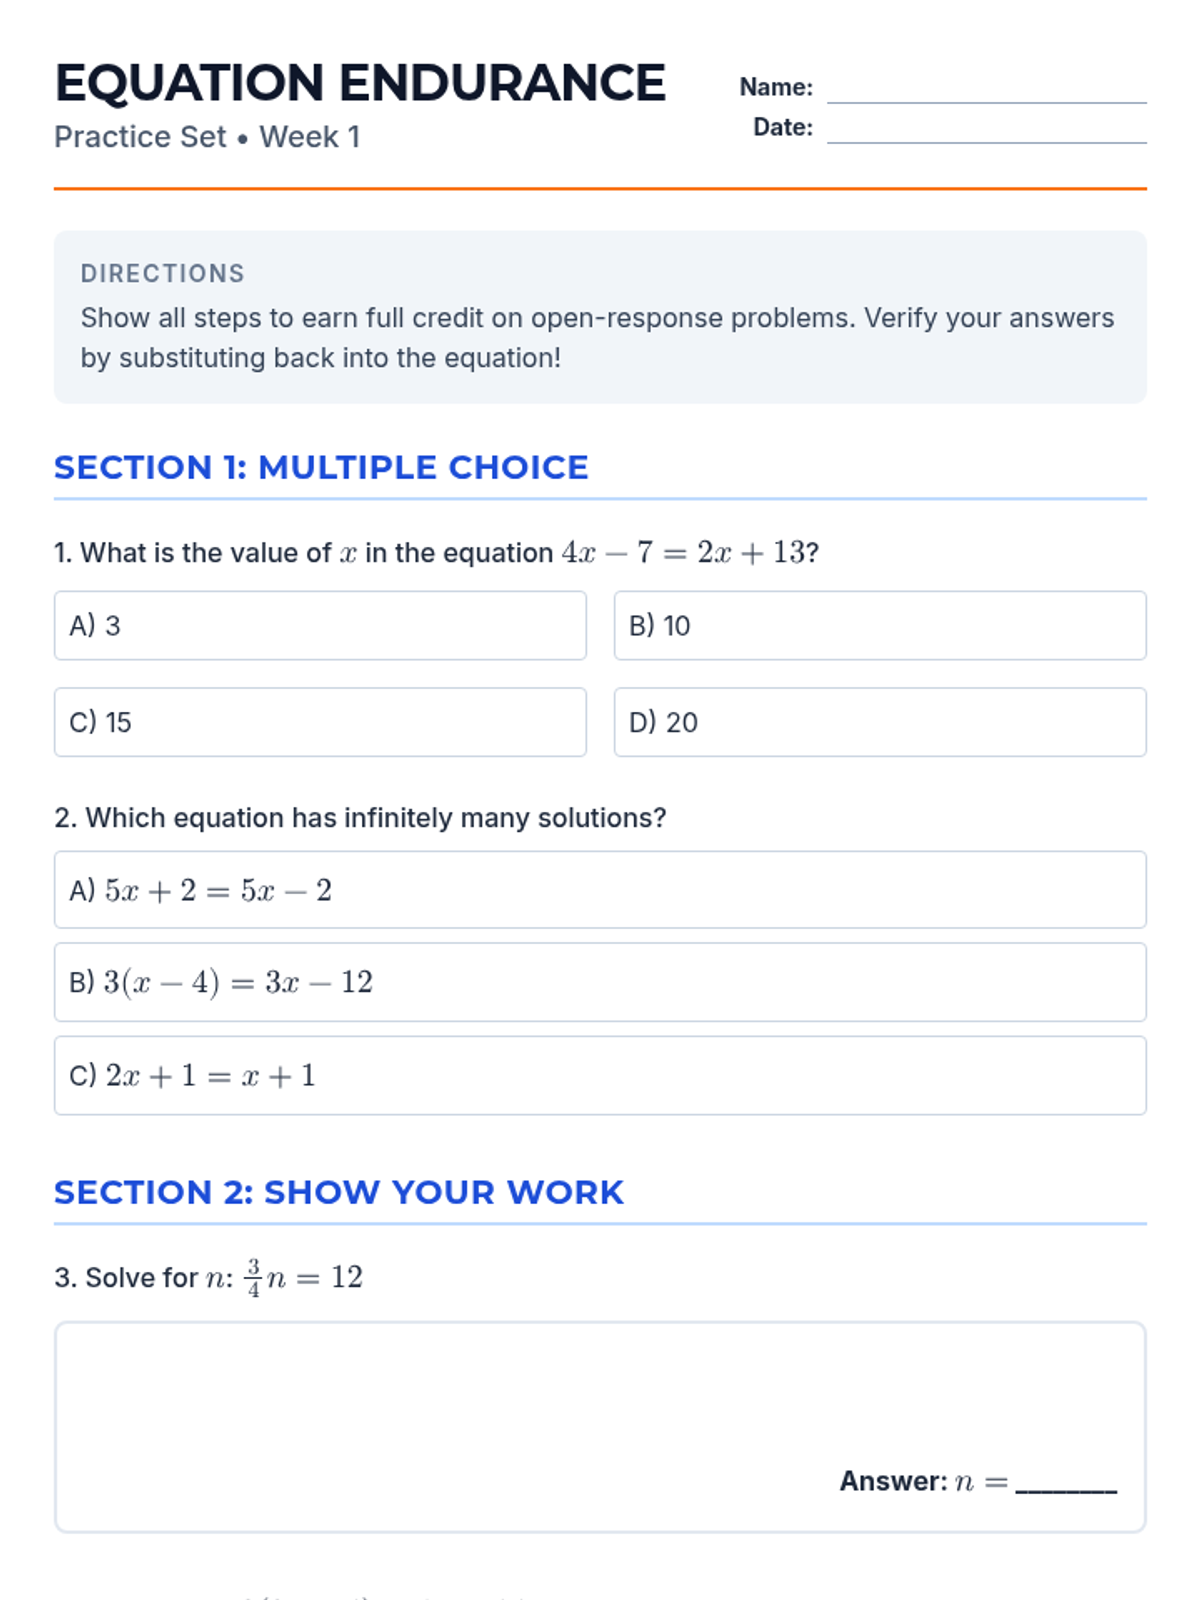
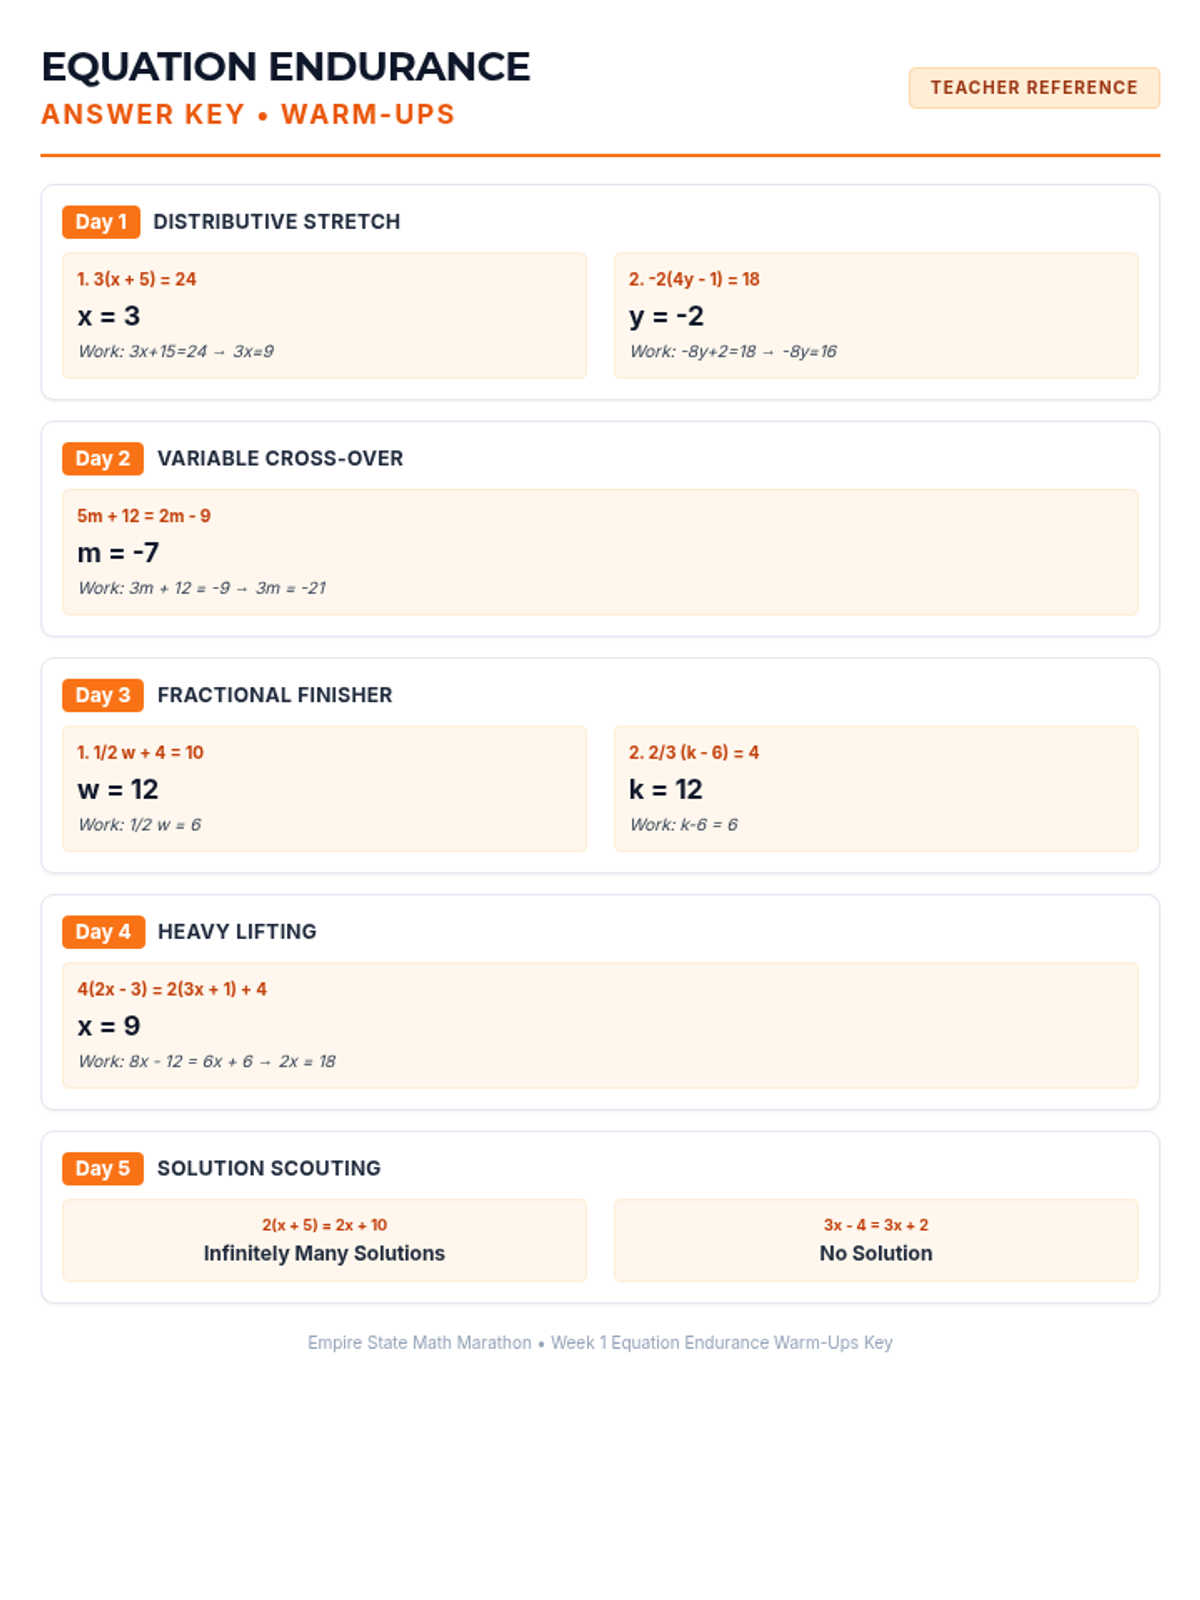
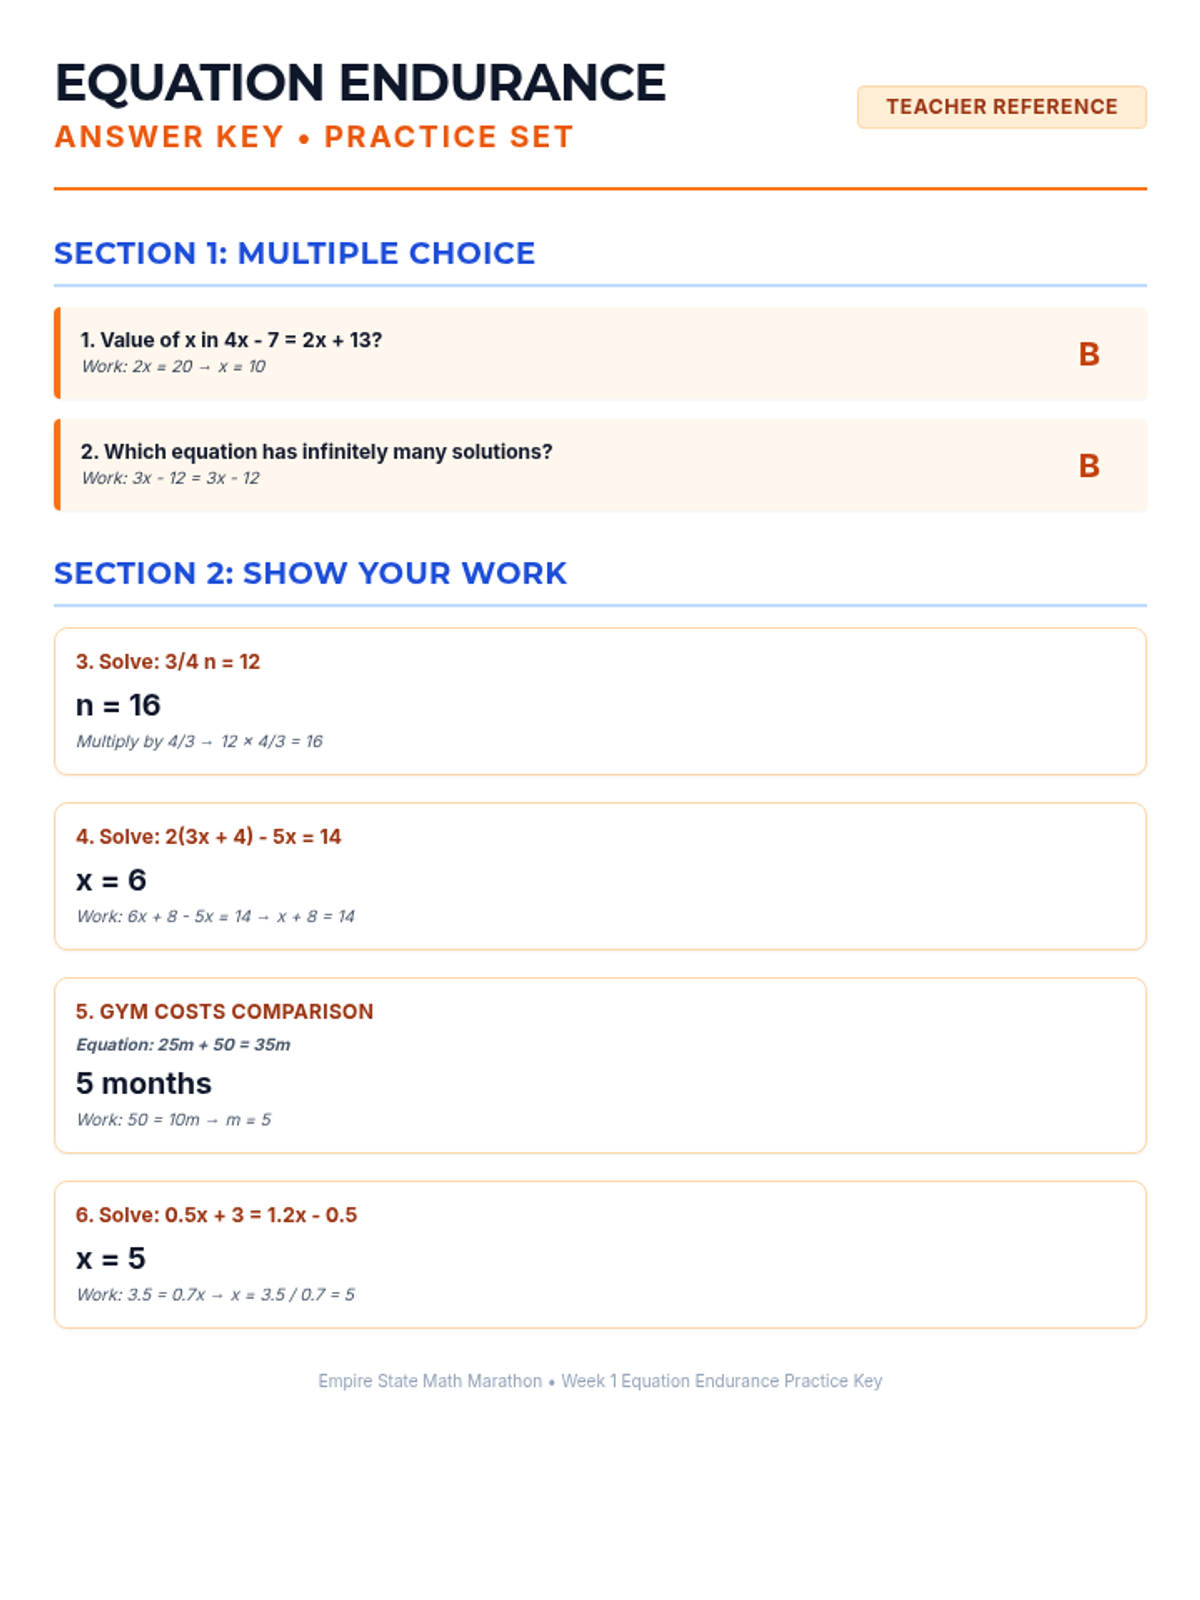
Week 1 focuses on solving multi-step equations, including those with variables on both sides, rational coefficients, and checking solutions.
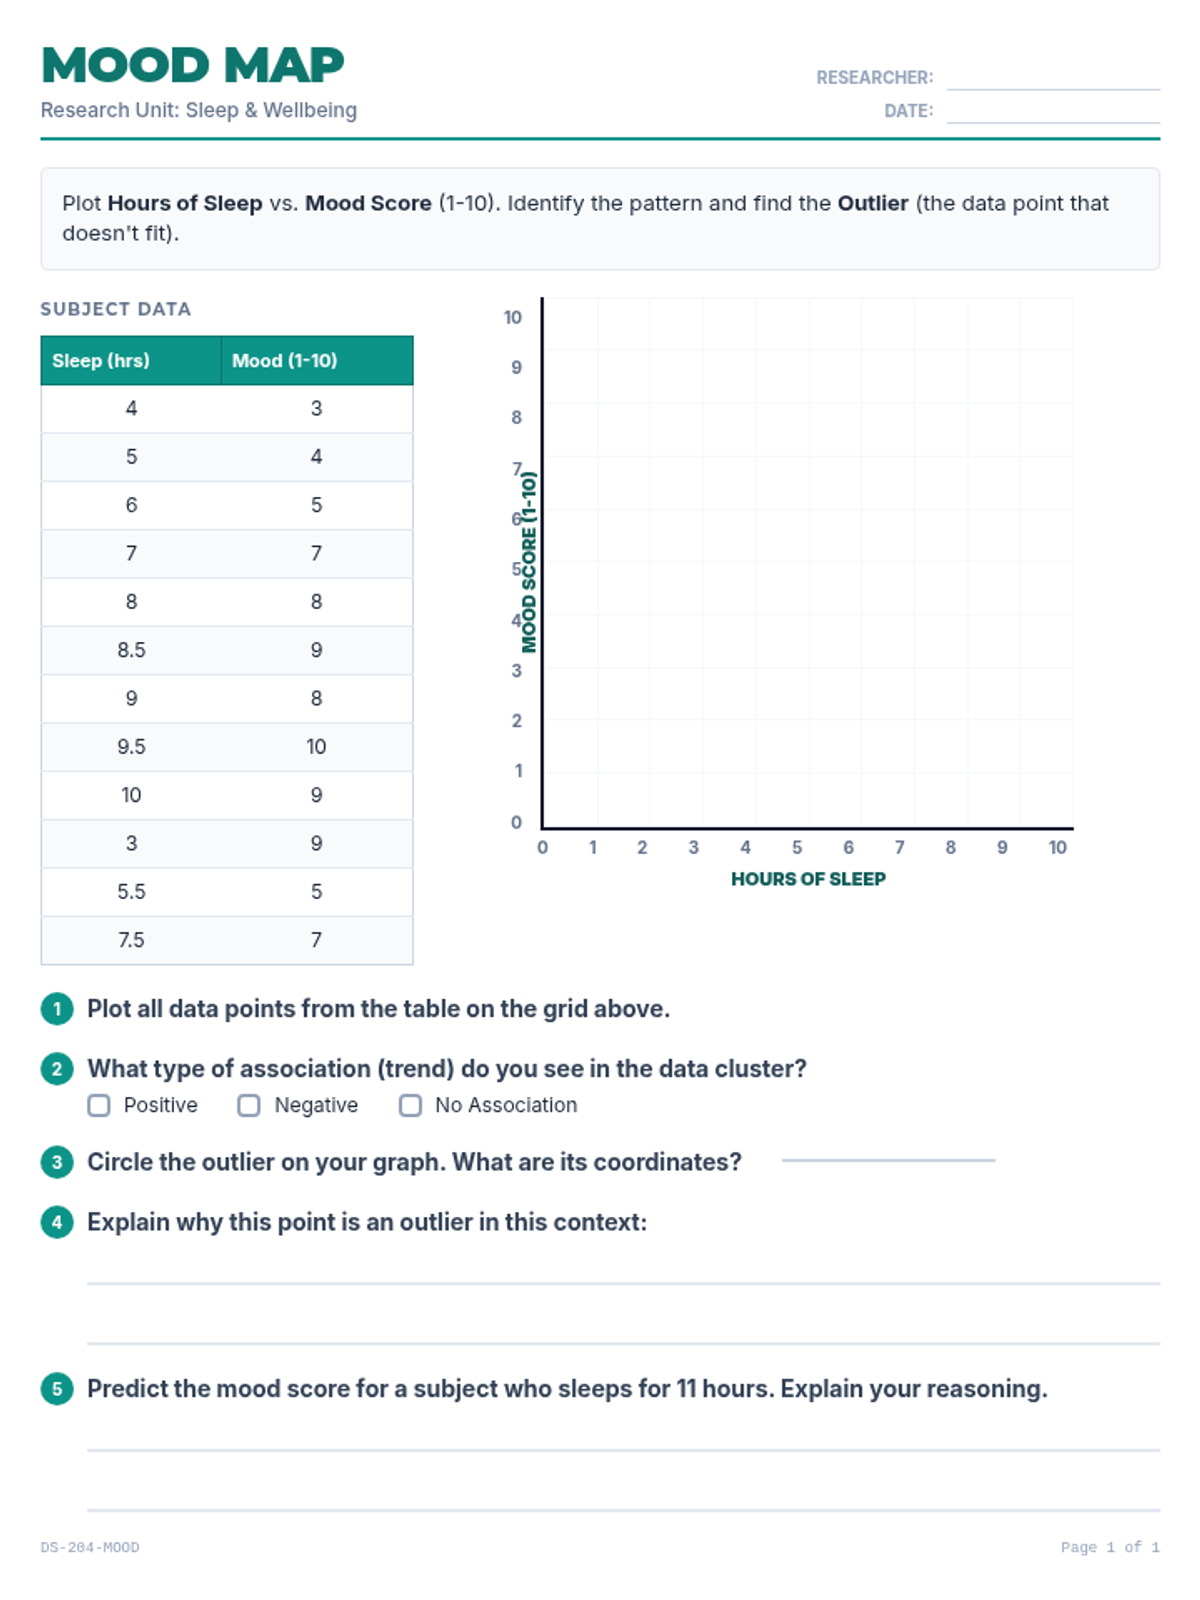
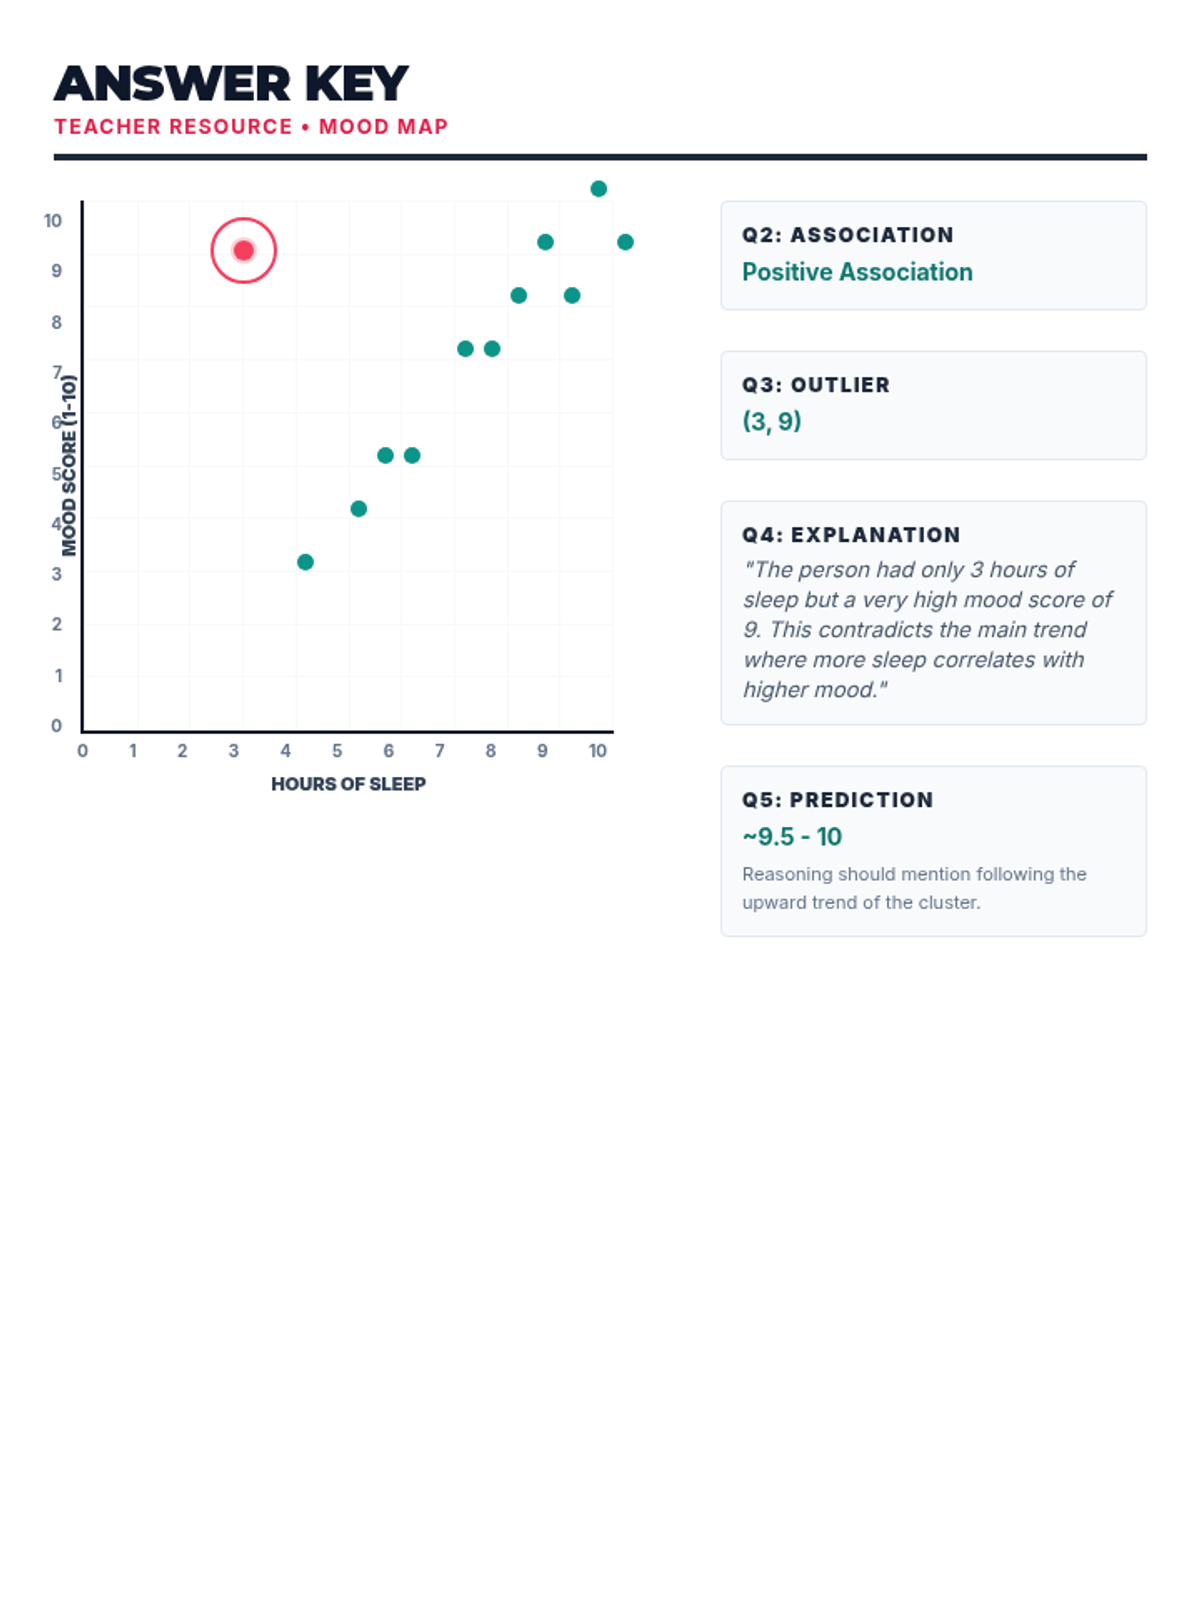
Students learn to plot bivariate data, identify trends, and spot outliers using a real-world scenario of sleep and mood.
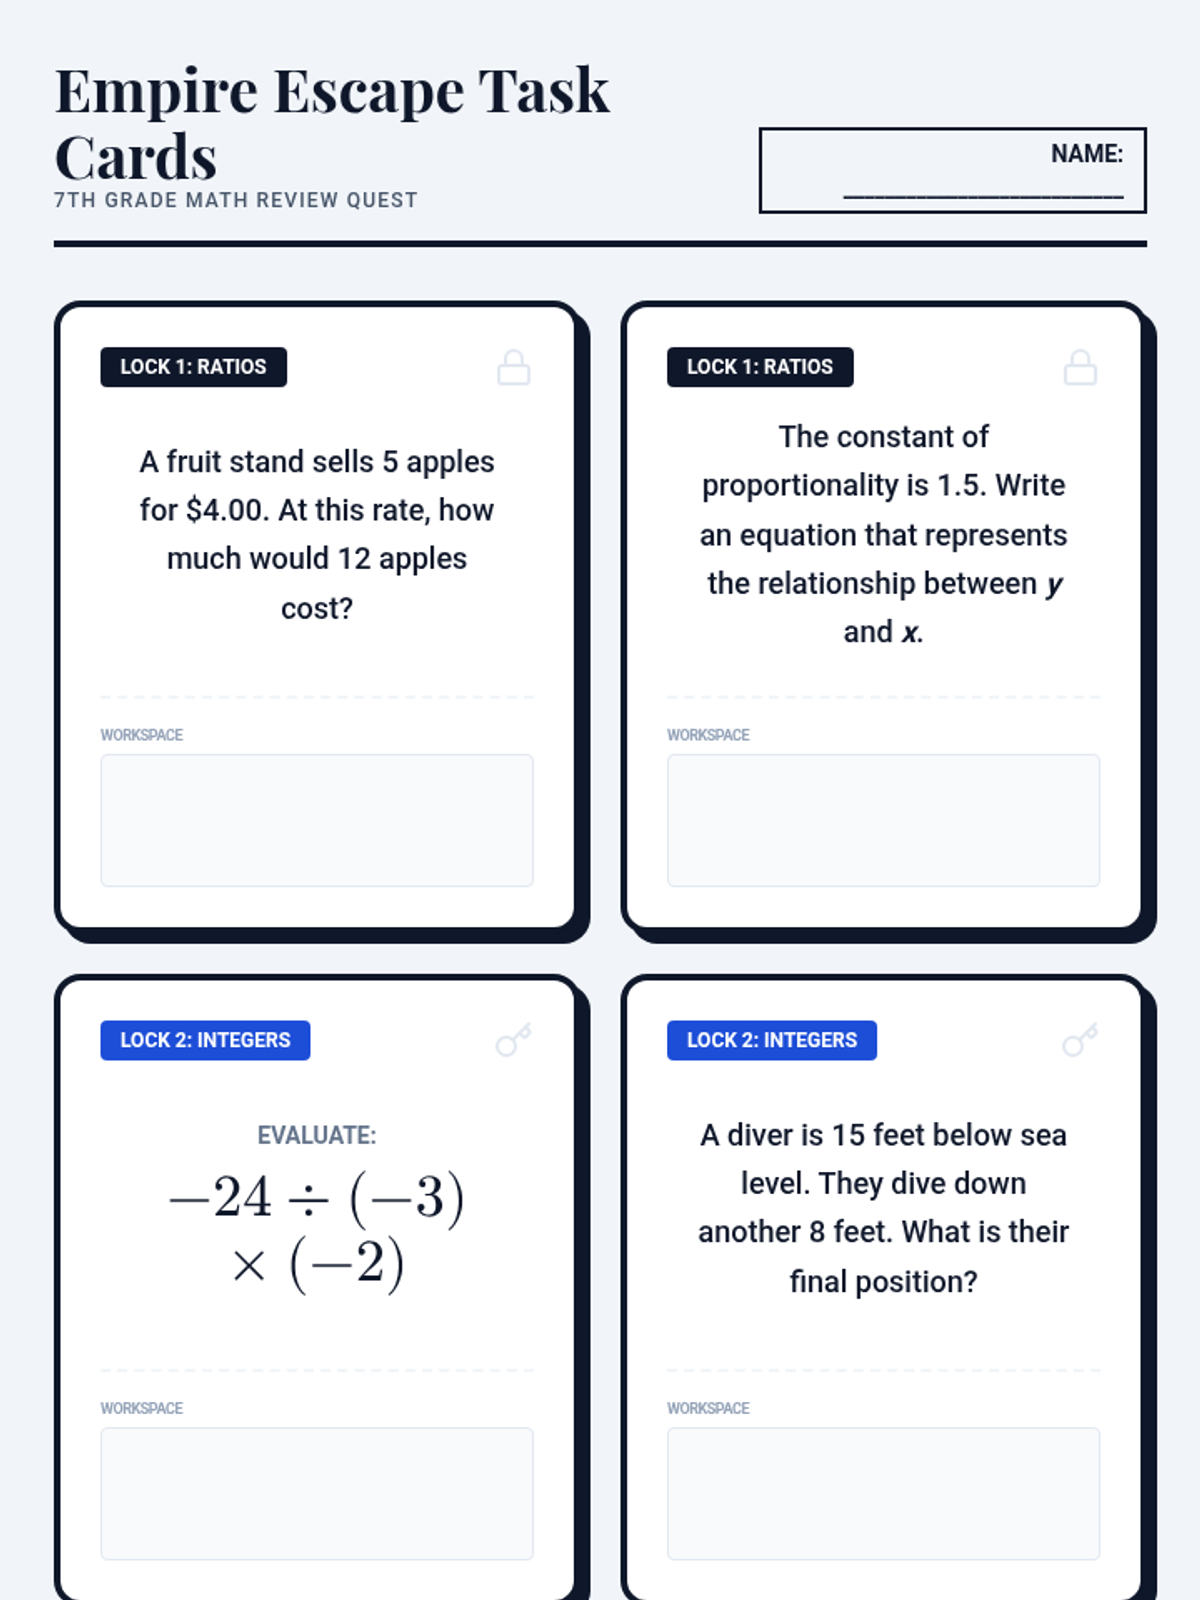
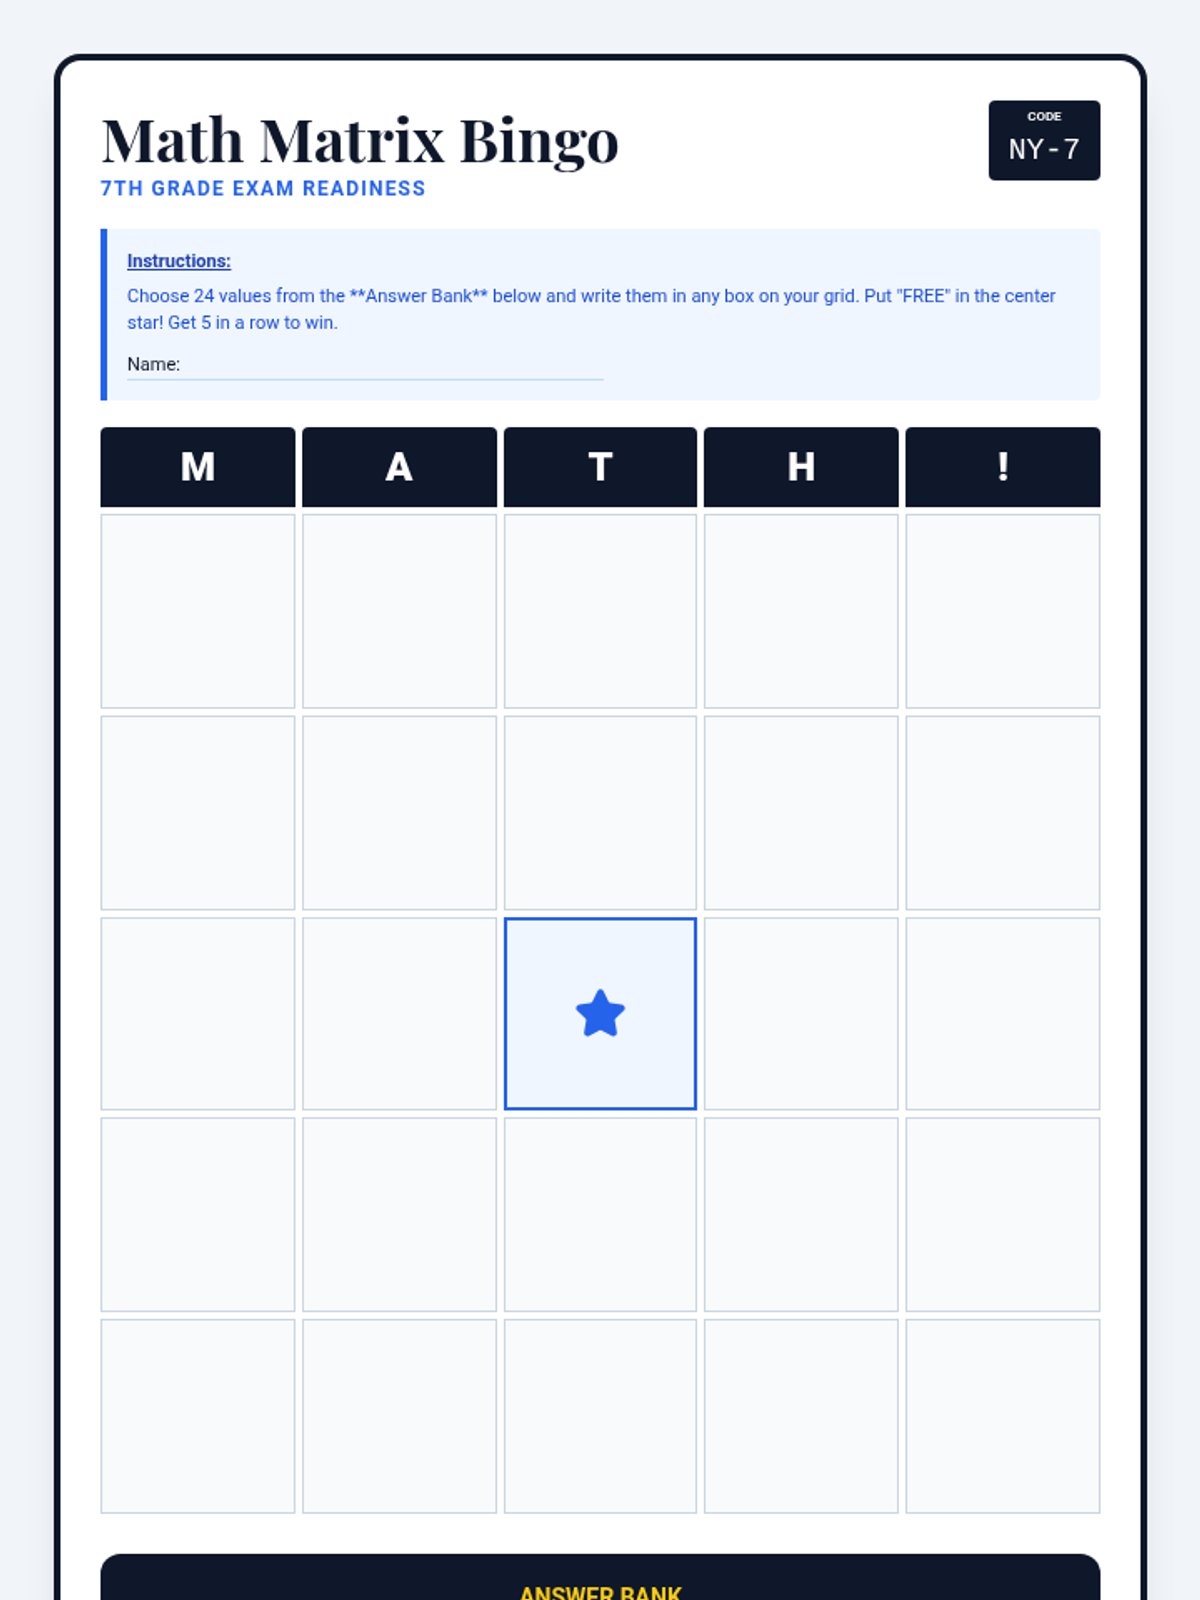
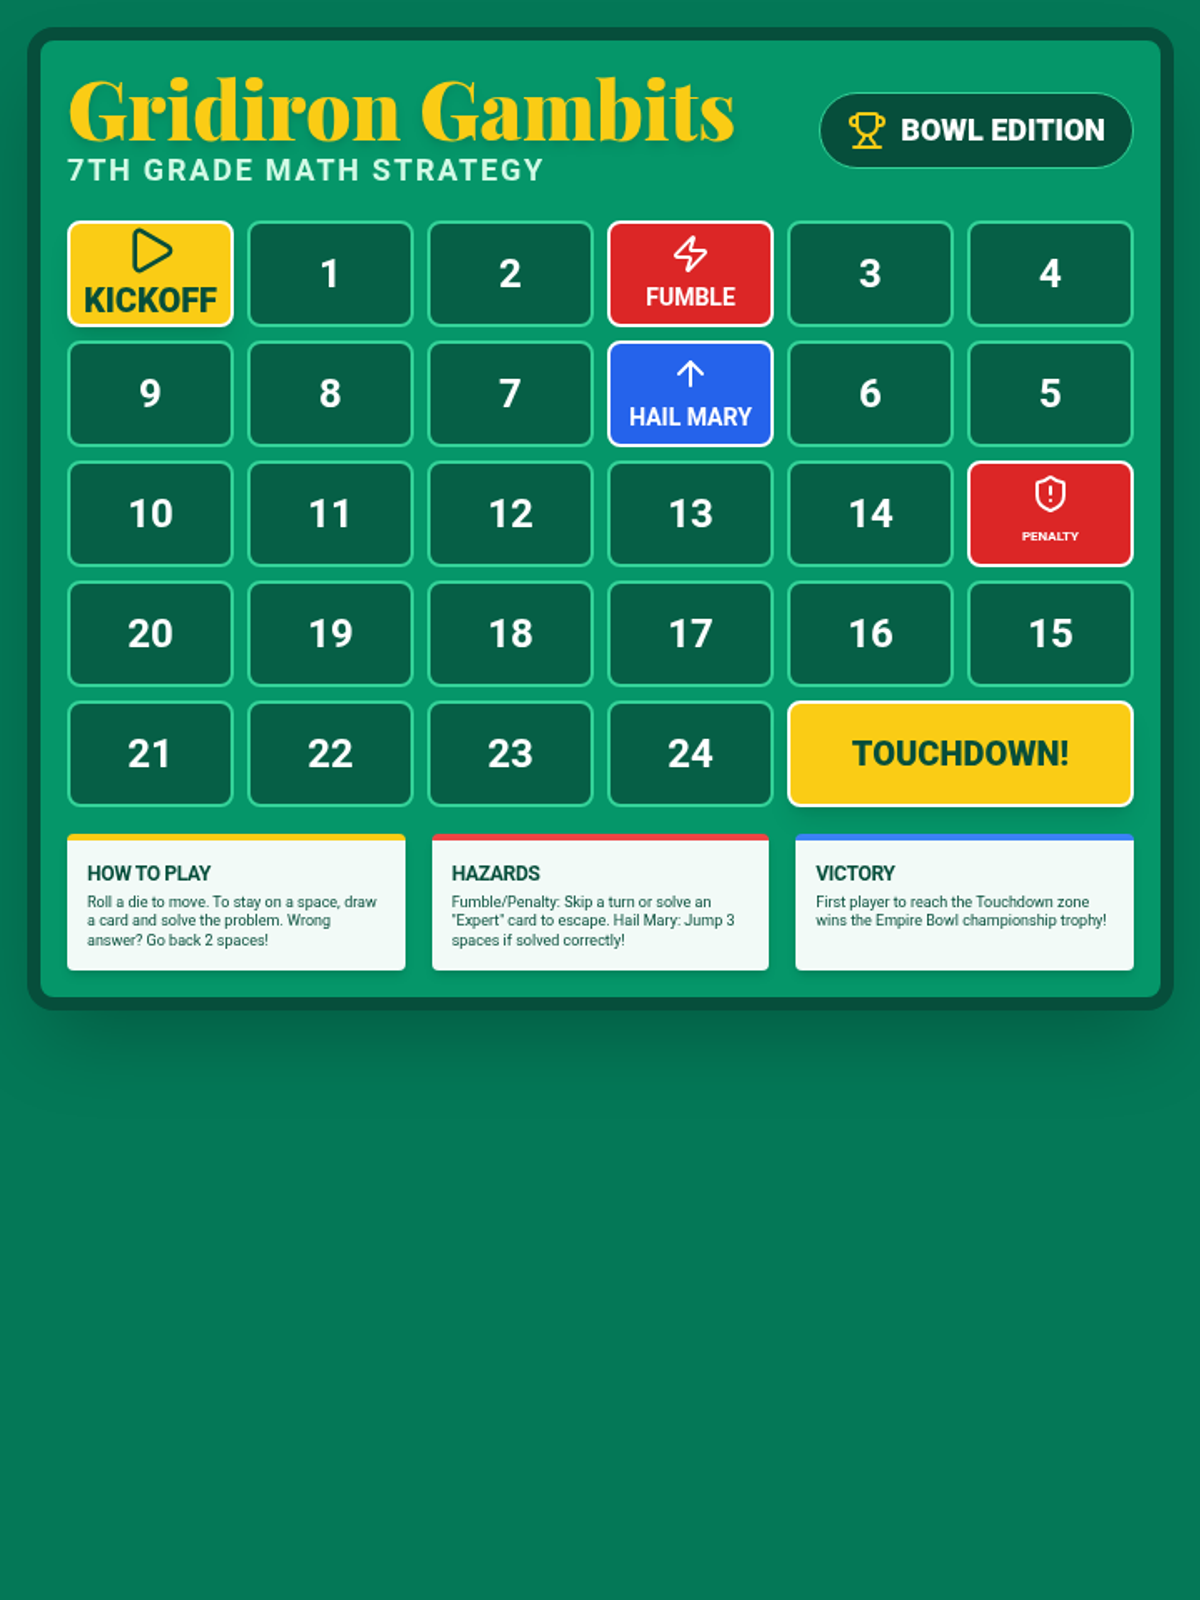
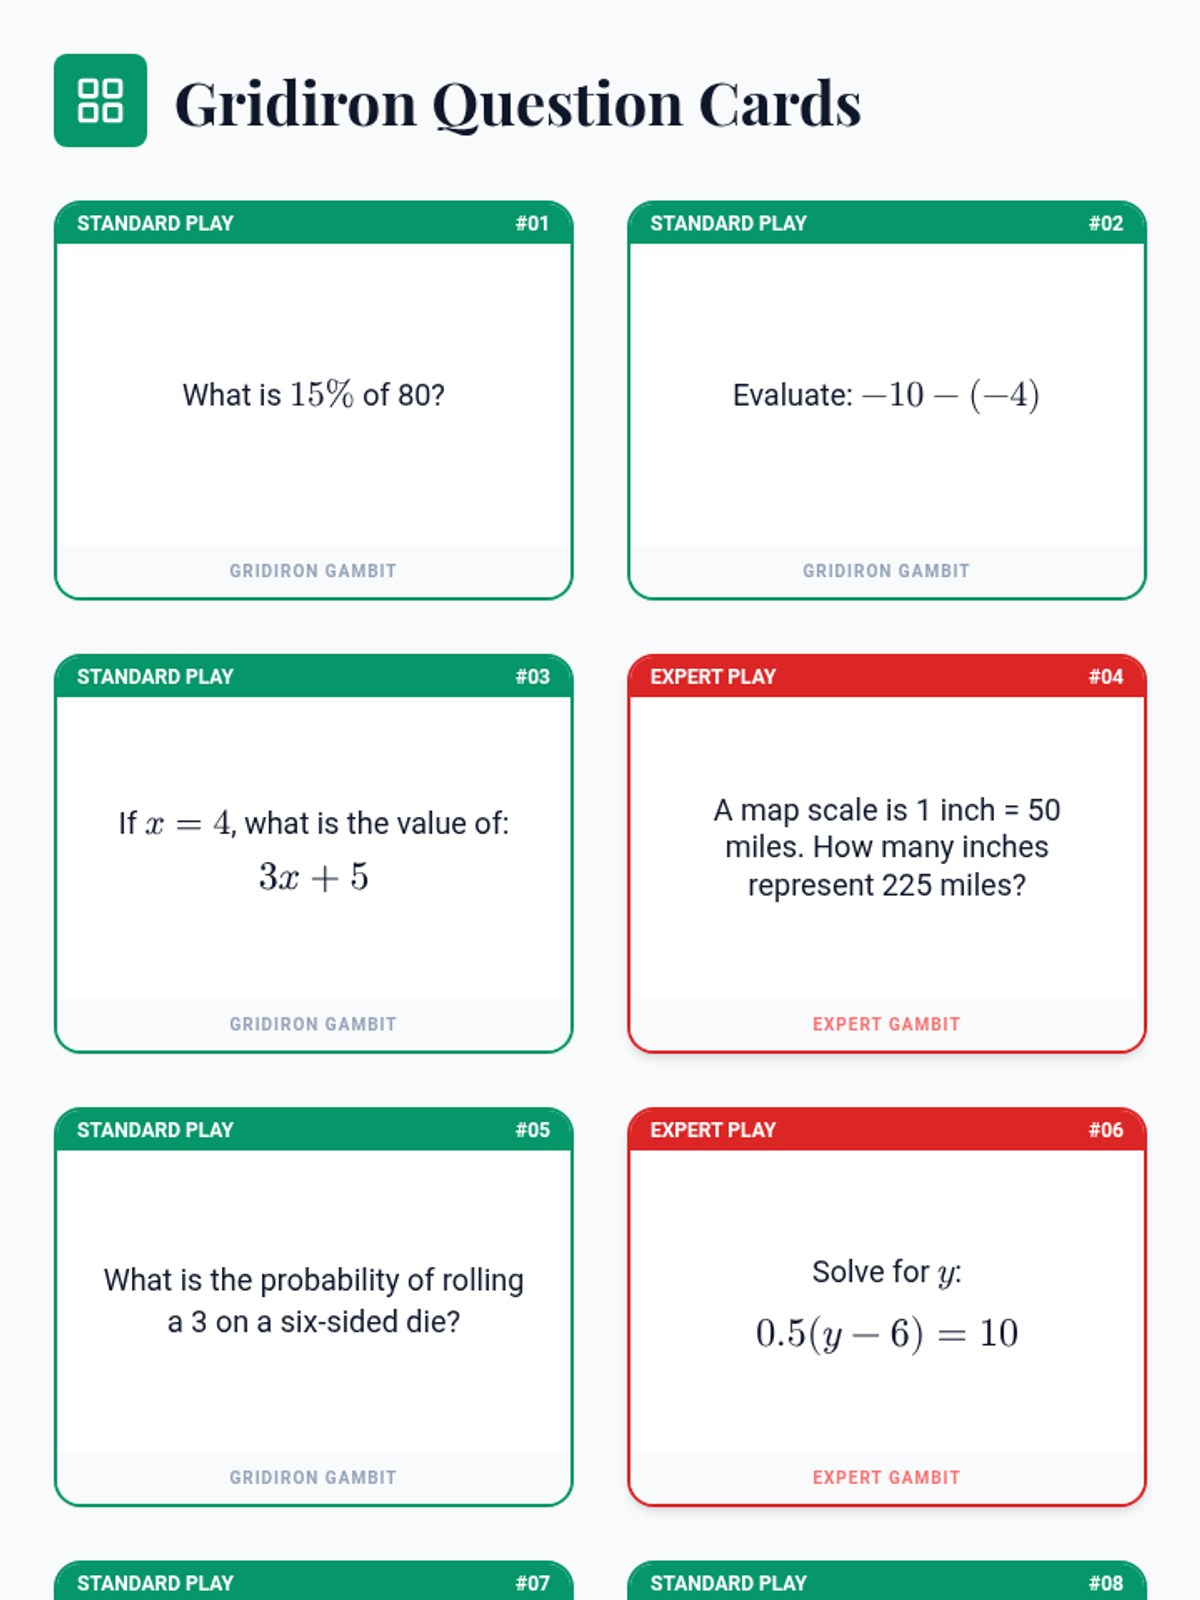
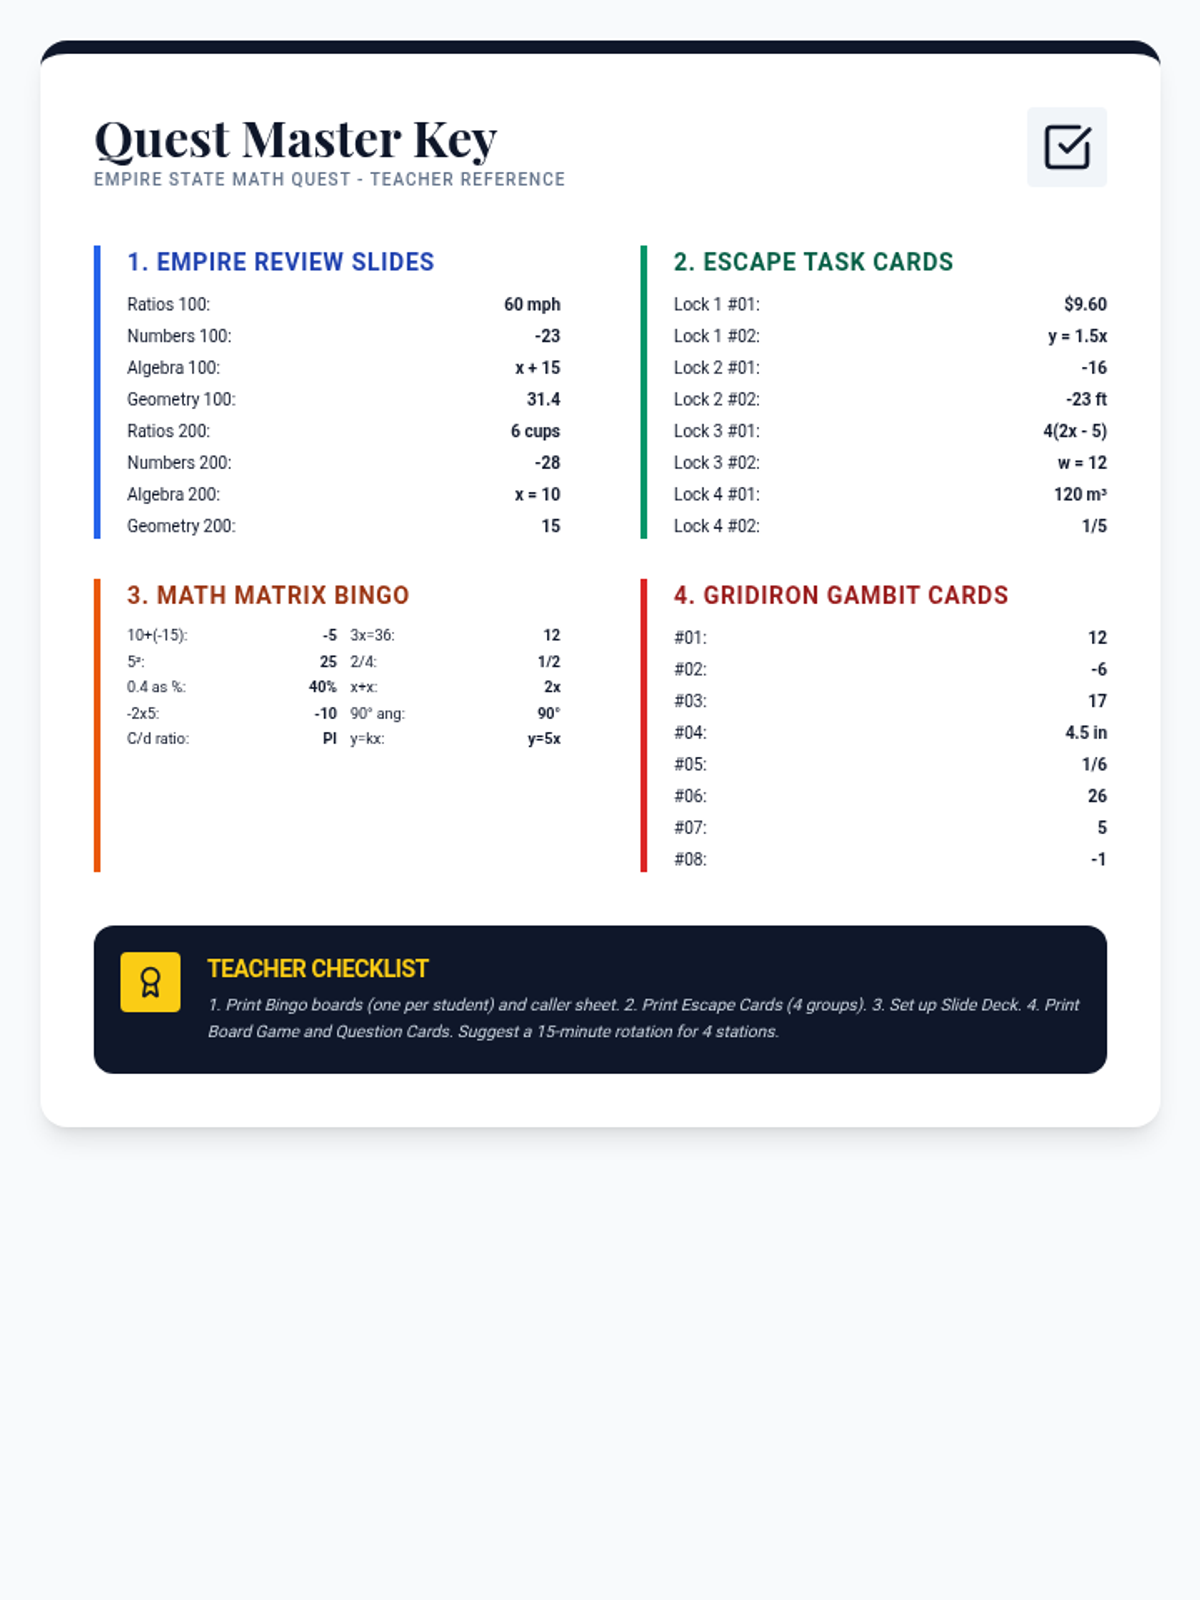
A comprehensive review session for the 7th Grade NYS Math Exam featuring four distinct games: a Jeopardy-style presentation, an escape room challenge, math bingo, and a strategic board game. Topics include Ratios & Proportional Reasoning, The Number System, Expressions & Equations, and Geometry & Statistics.
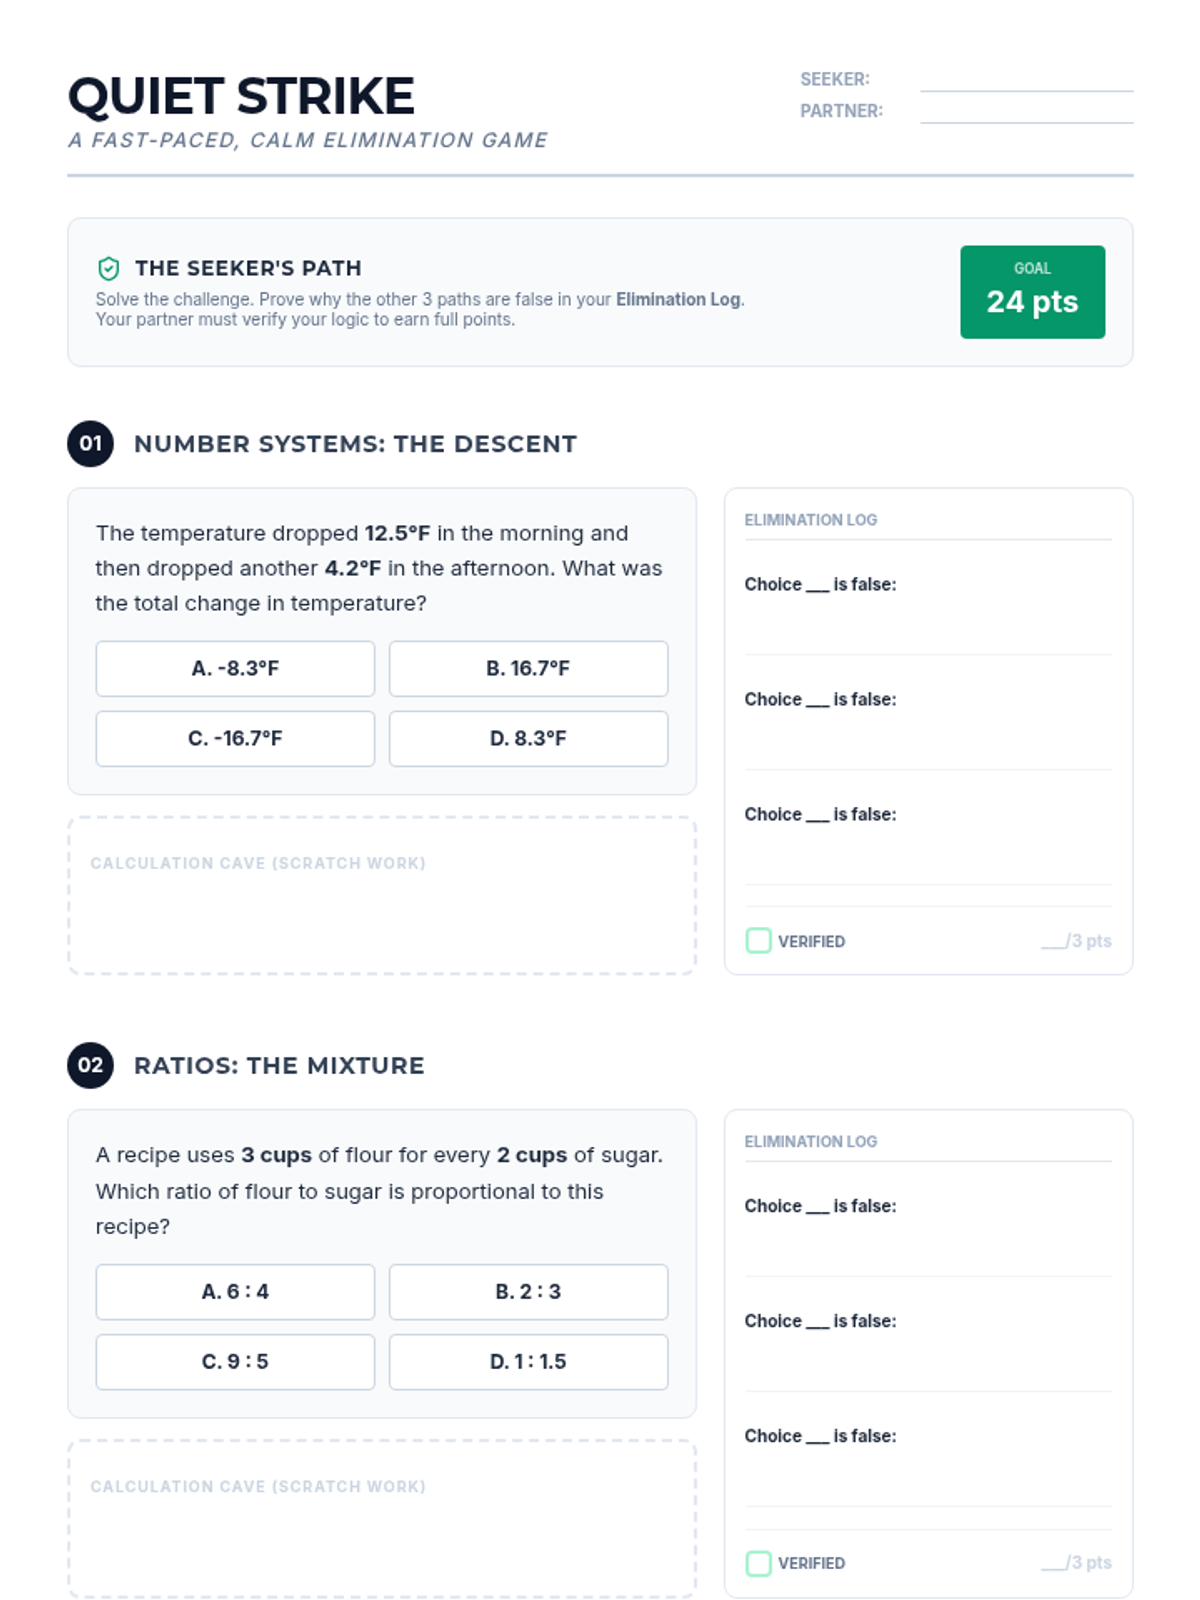
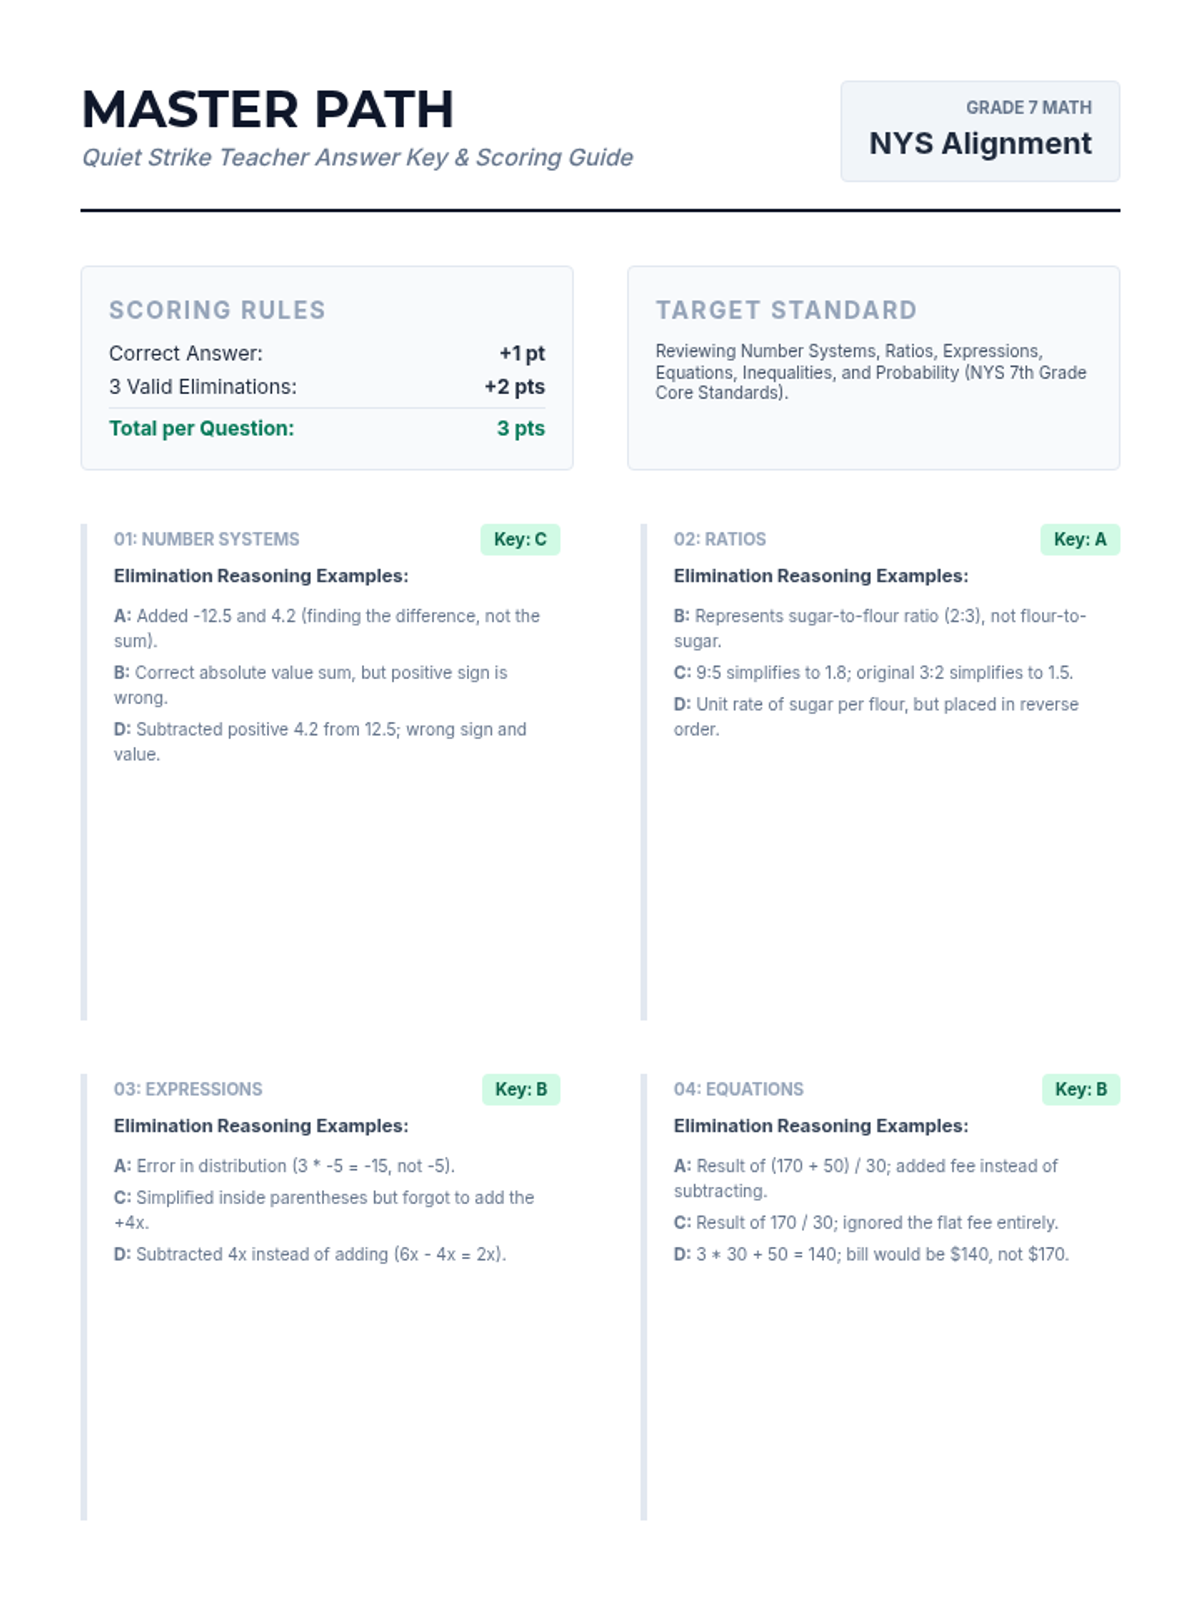
A fast-paced yet calm math elimination game focusing on 7th Grade NYS standards. Students solve multiple-choice questions, provide reasoning for eliminating wrong answers, and engage in partner verification for points.
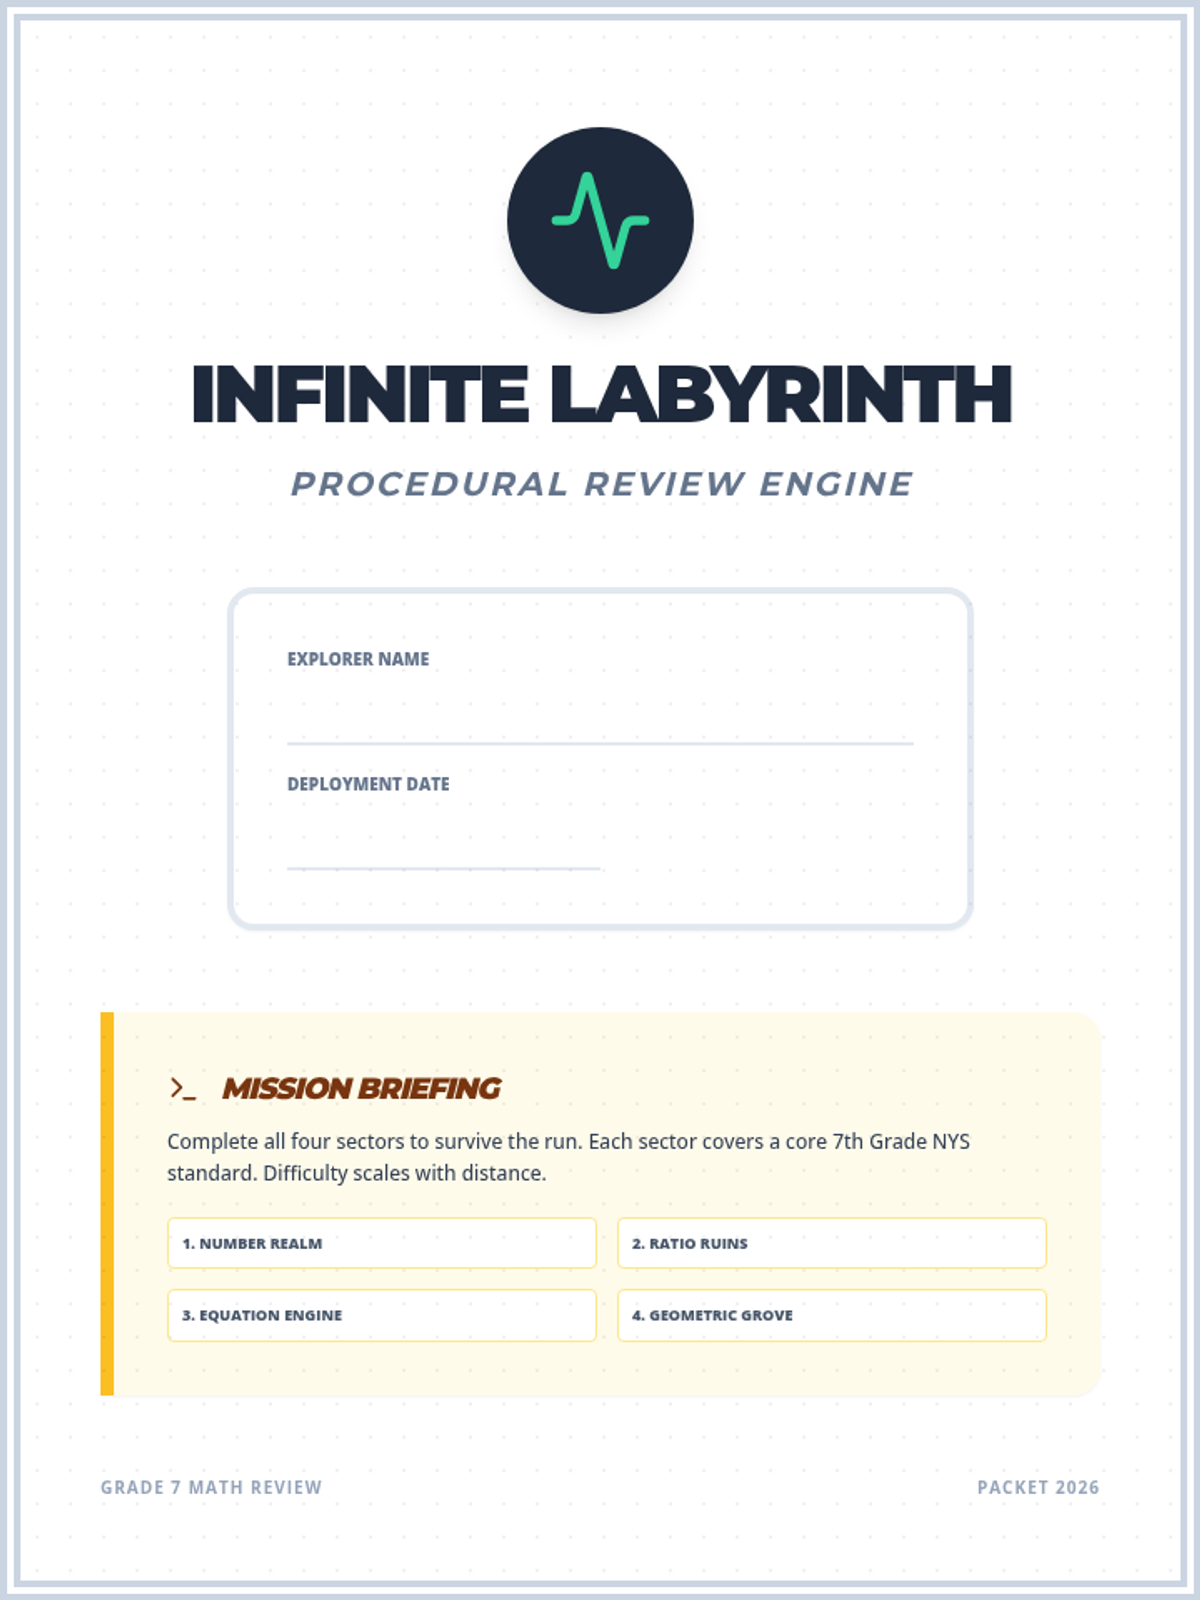
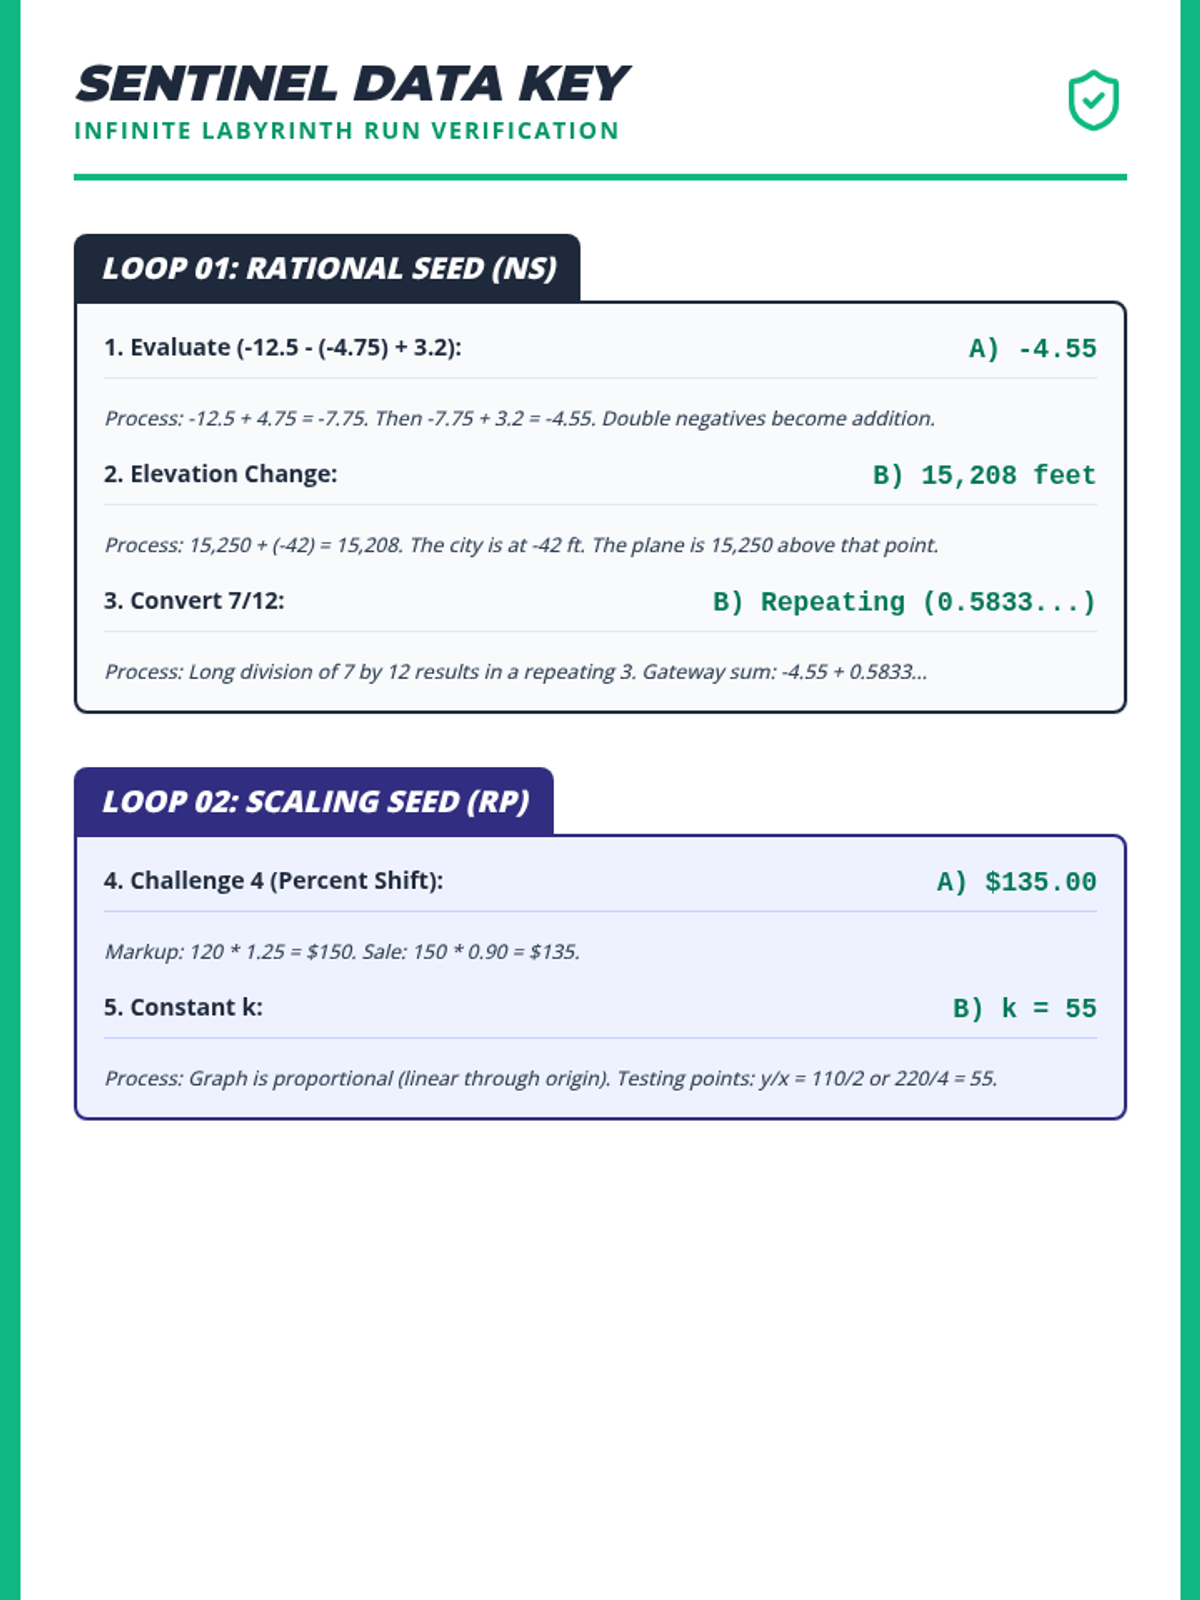
A comprehensive multi-page review packet for 7th grade NYS Math standards, themed as an 'Infinite Labyrinth' where students solve problems to navigate their way through different mathematical domains.
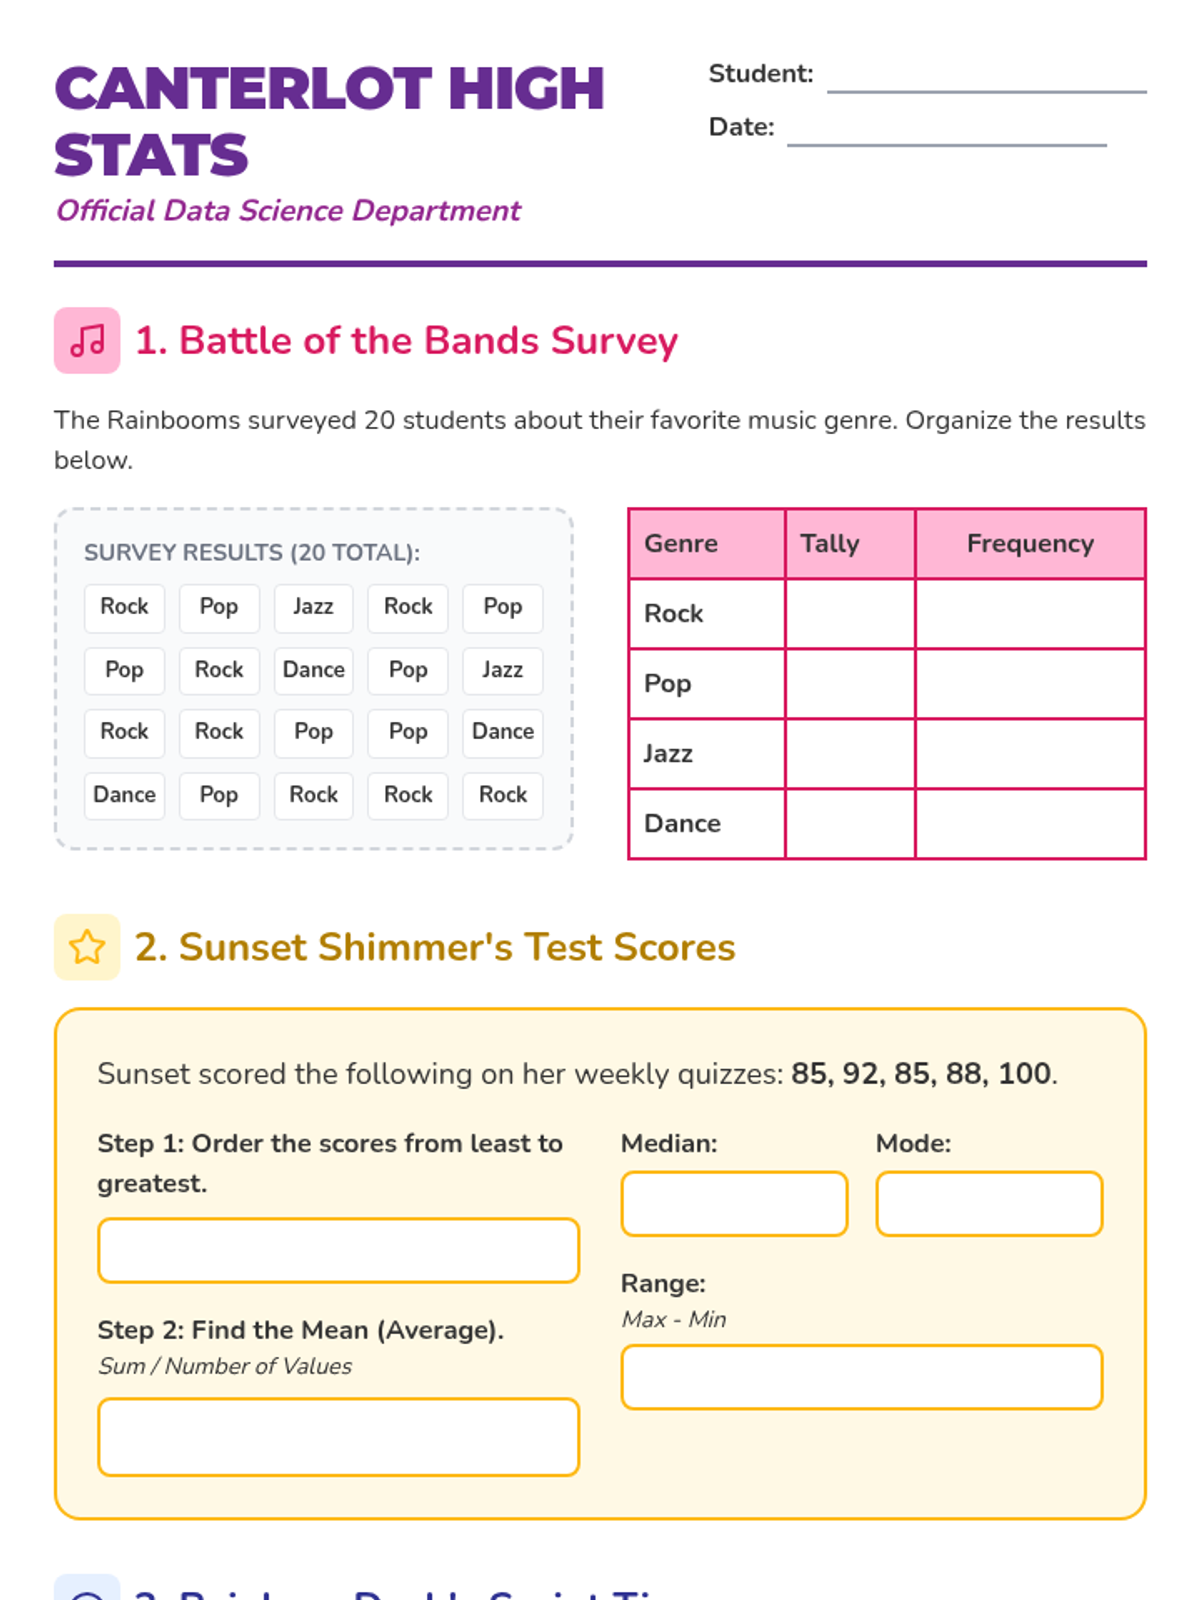
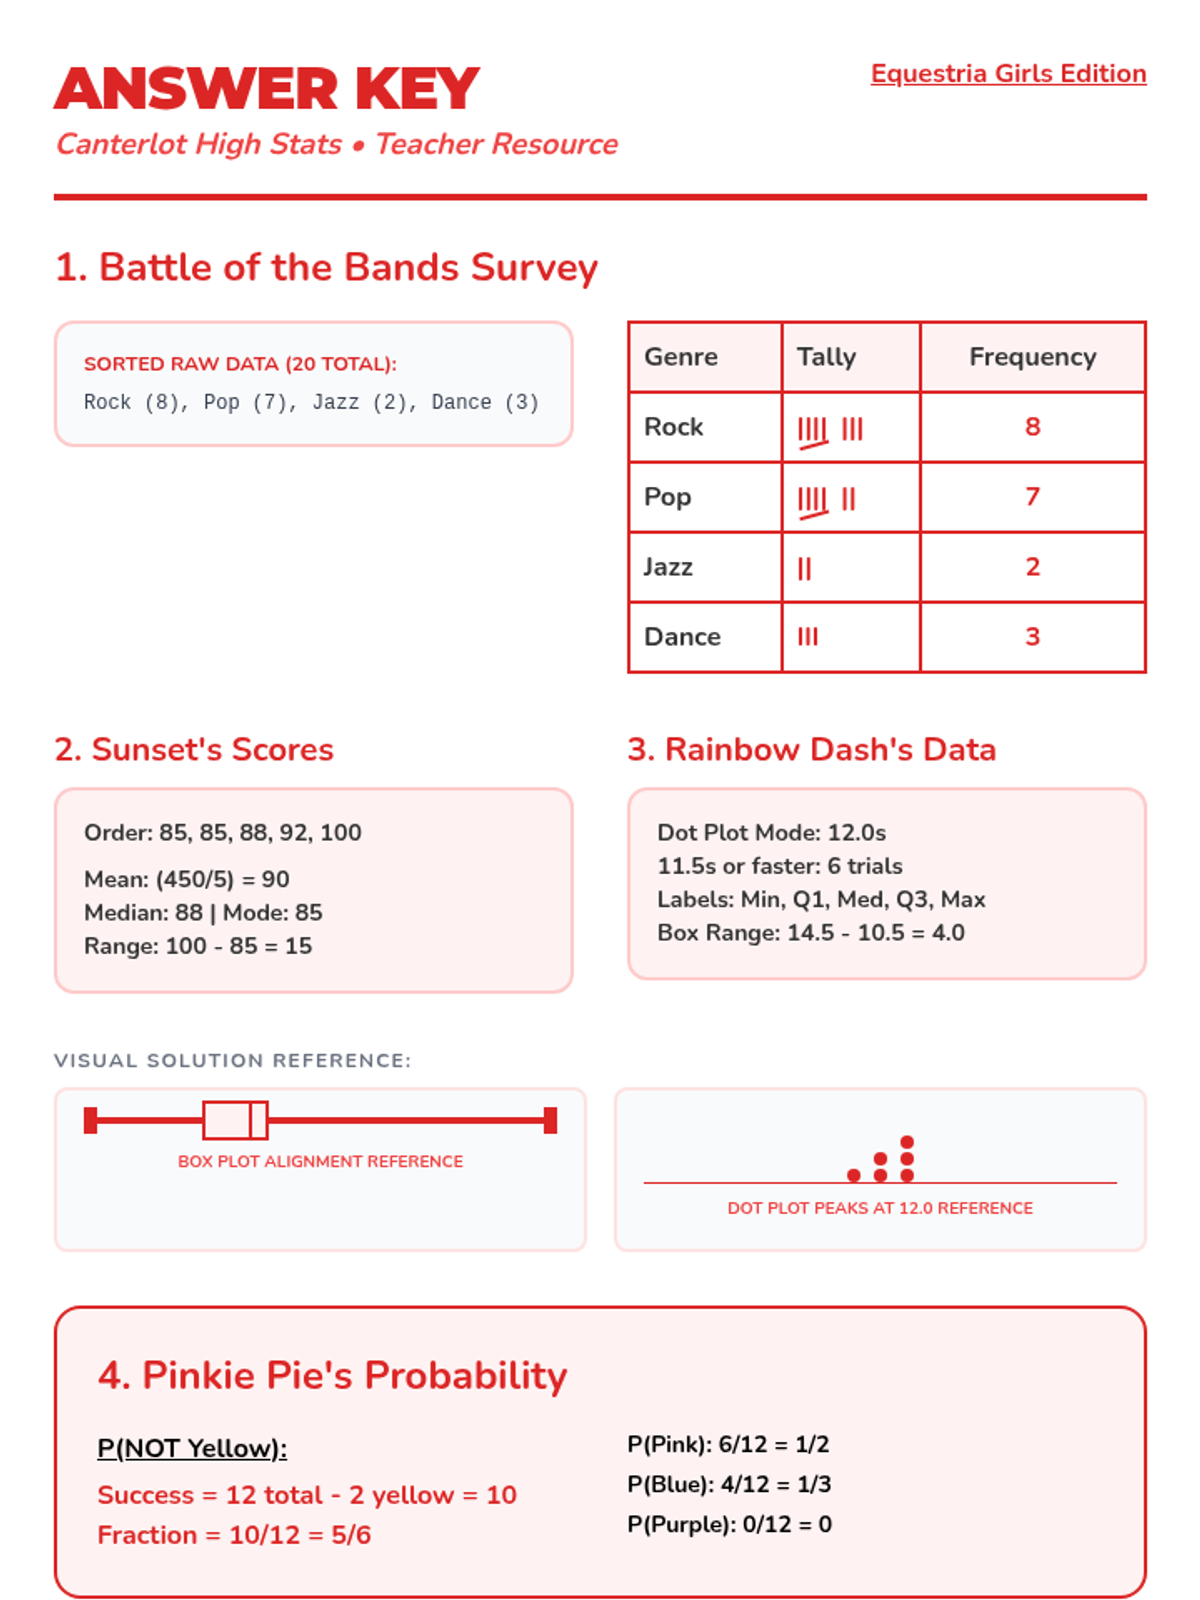
A statistics lesson themed around Canterlot High and the Equestria Girls, covering measures of center, data visualization, and simple probability. Students will help their favorite characters analyze school data through engaging, themed problems.
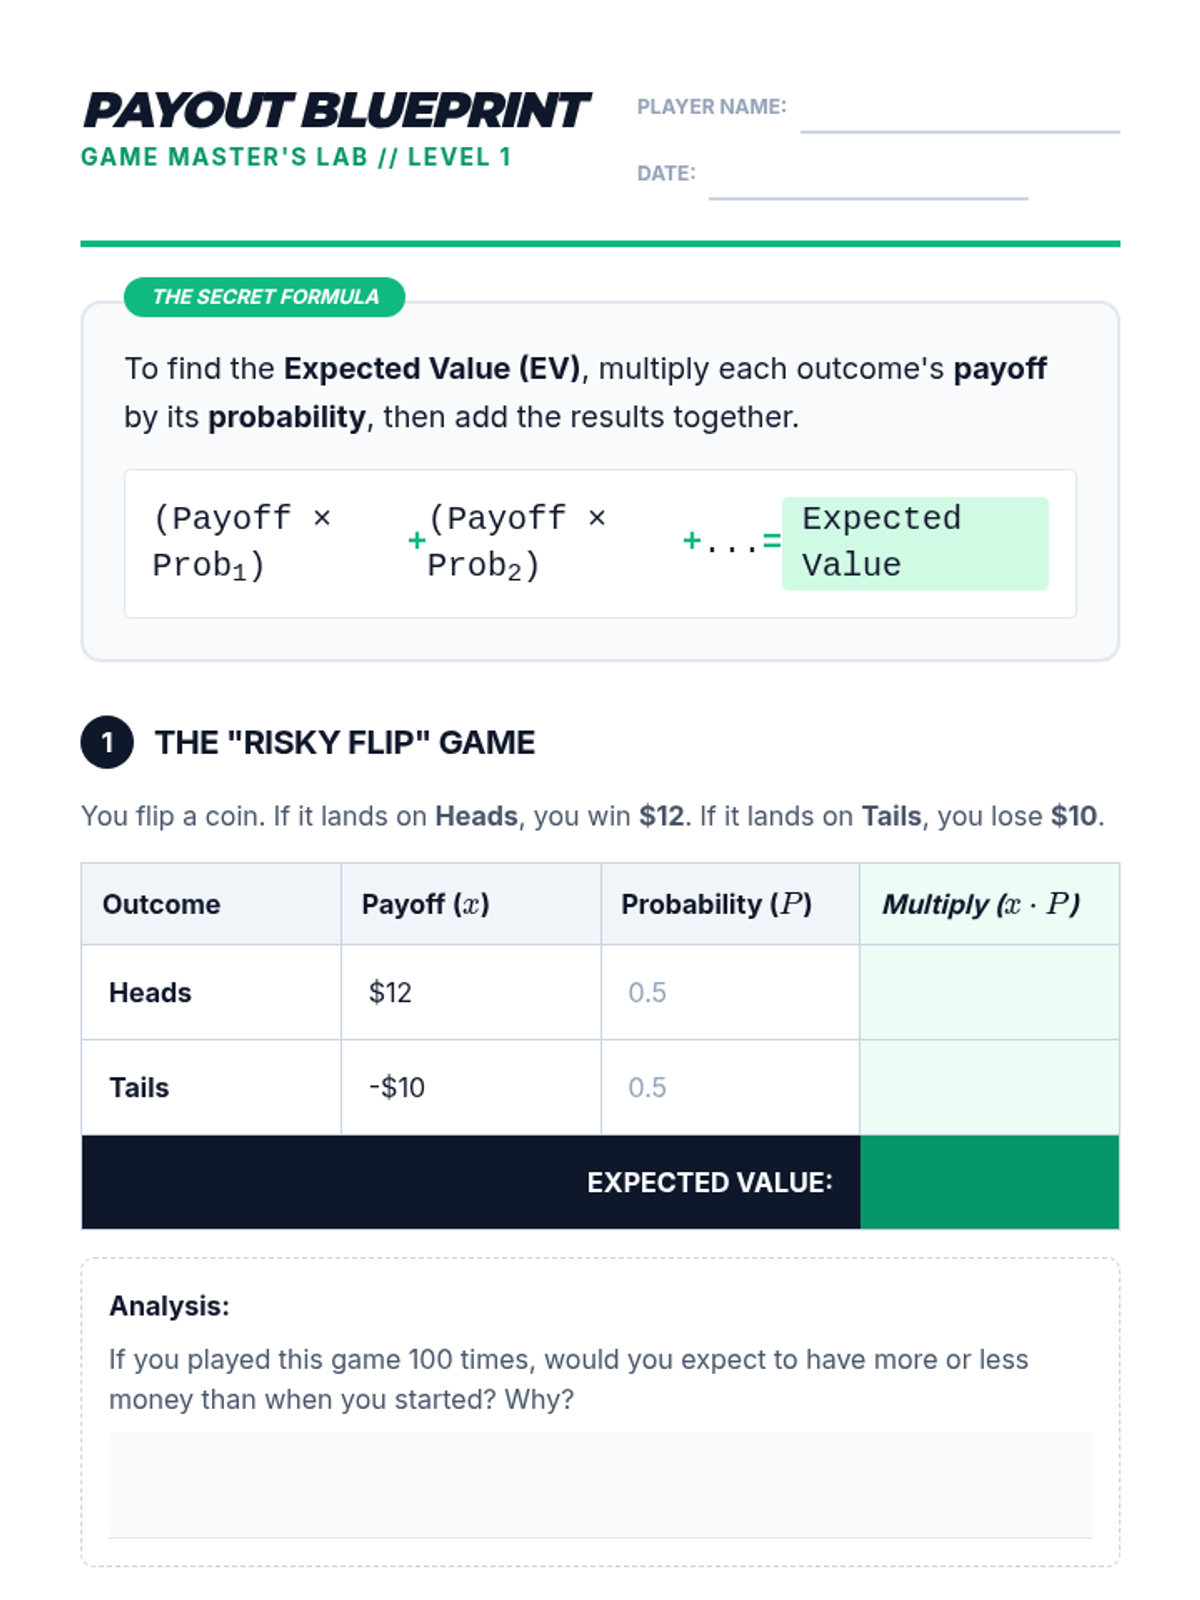
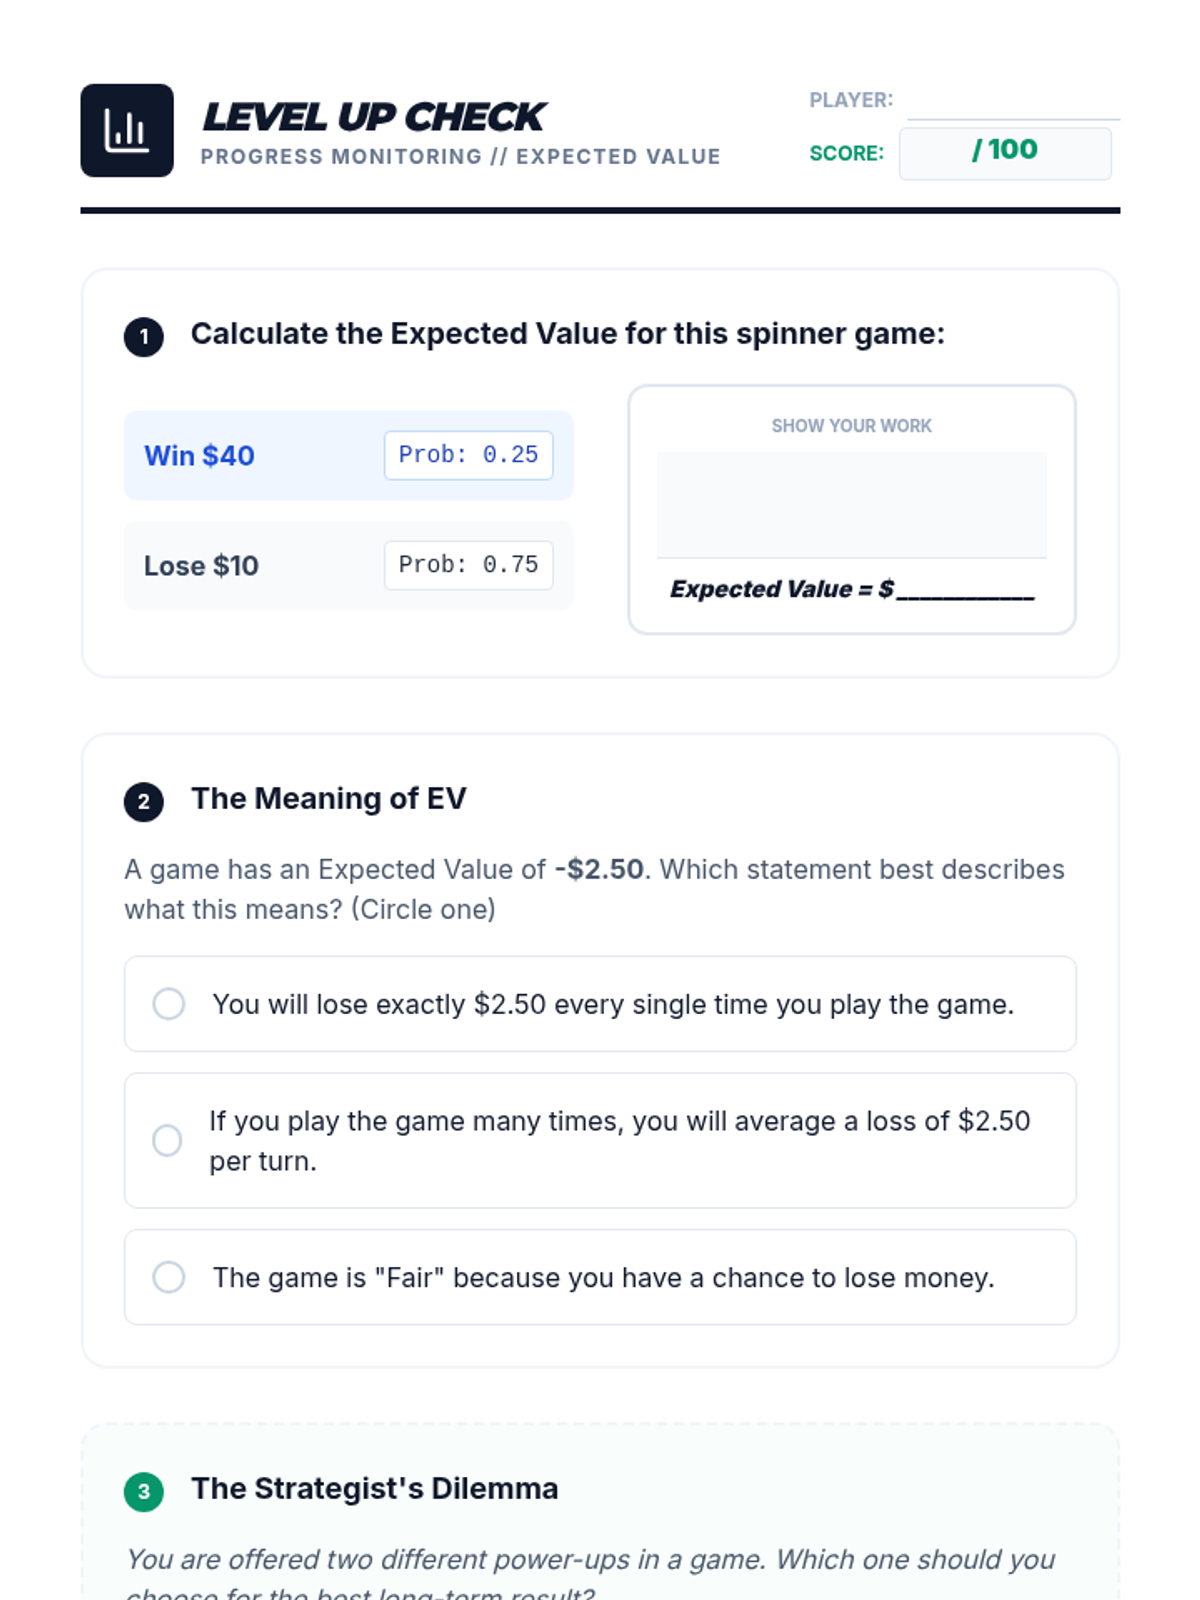
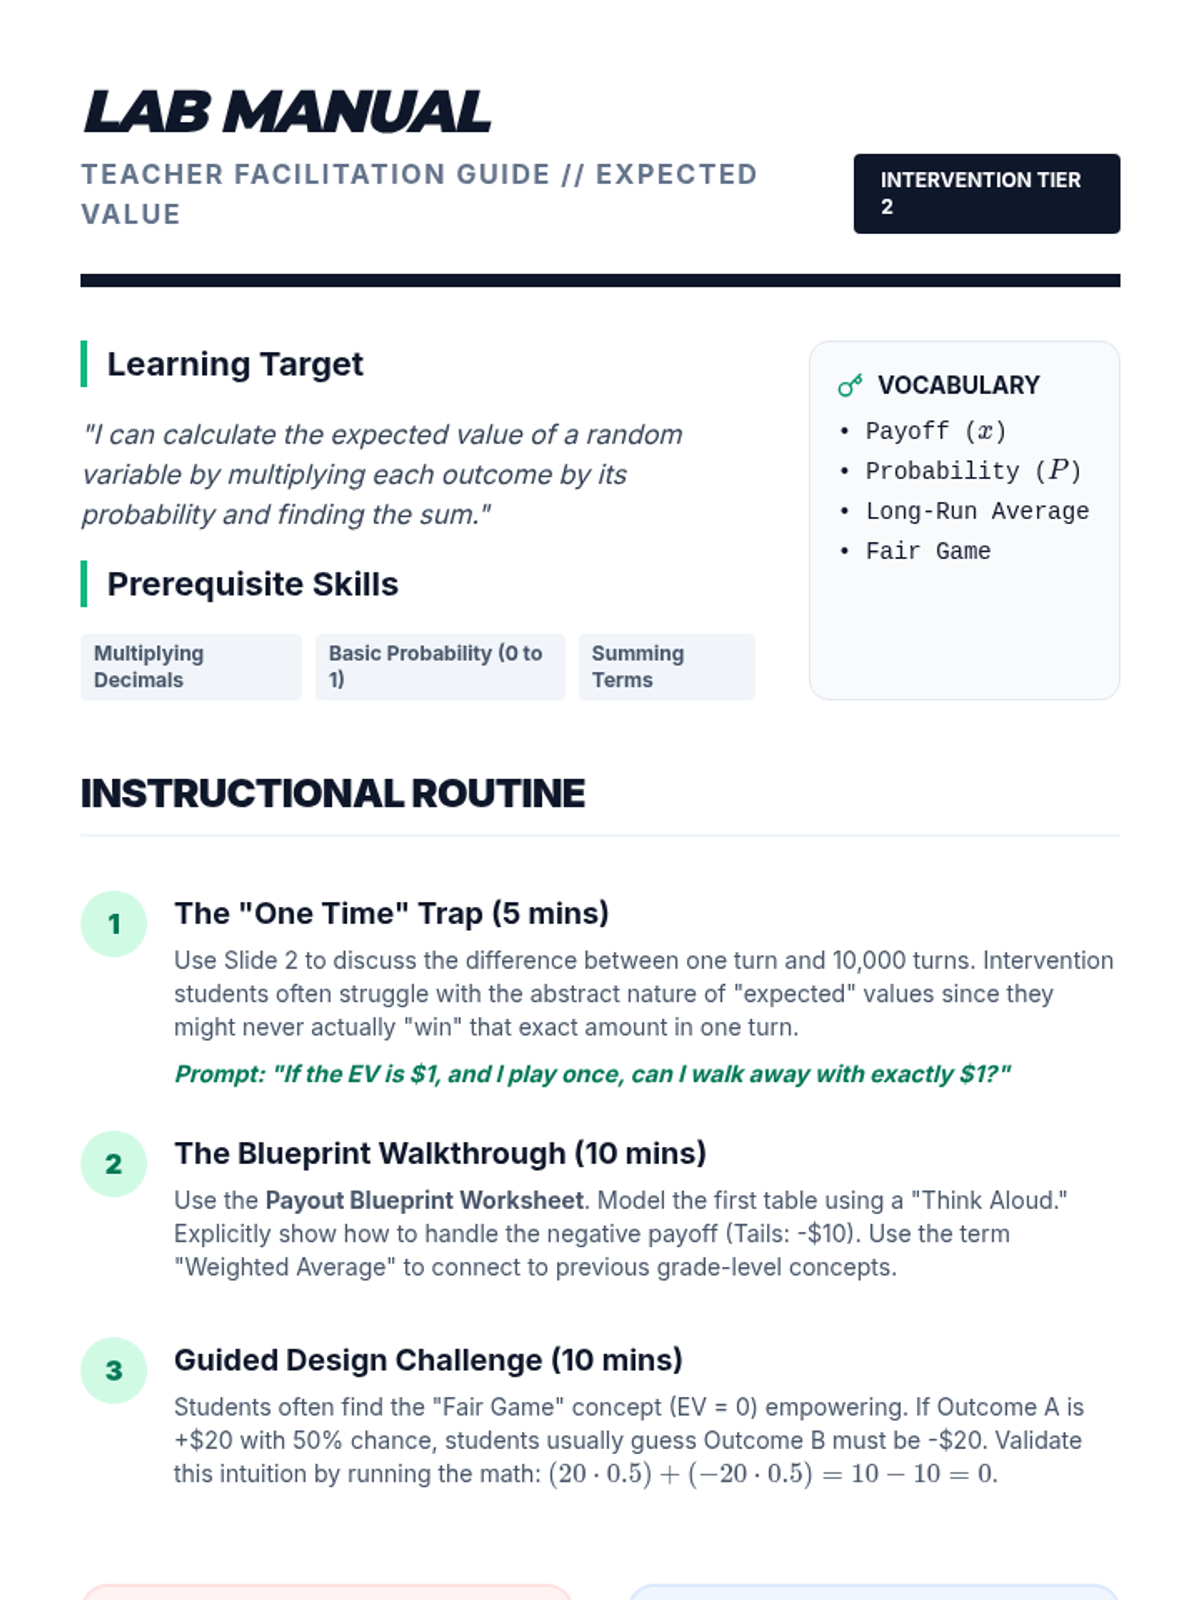
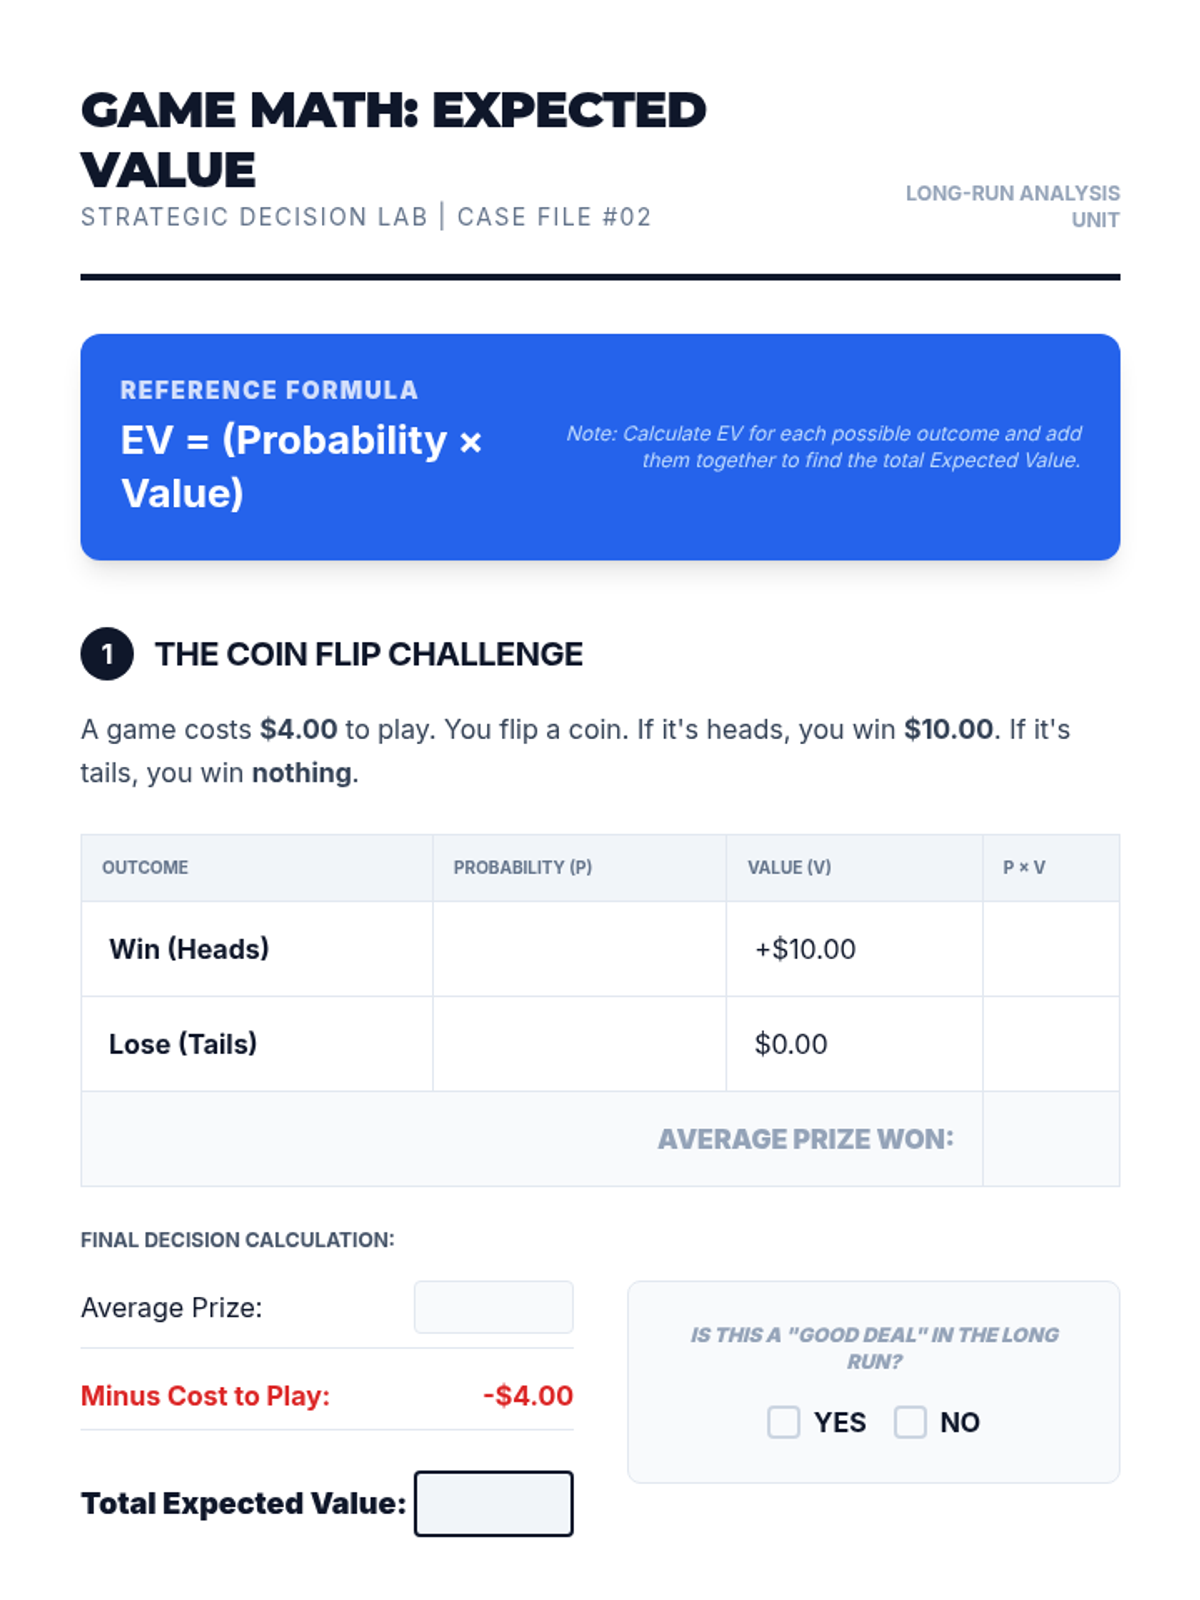
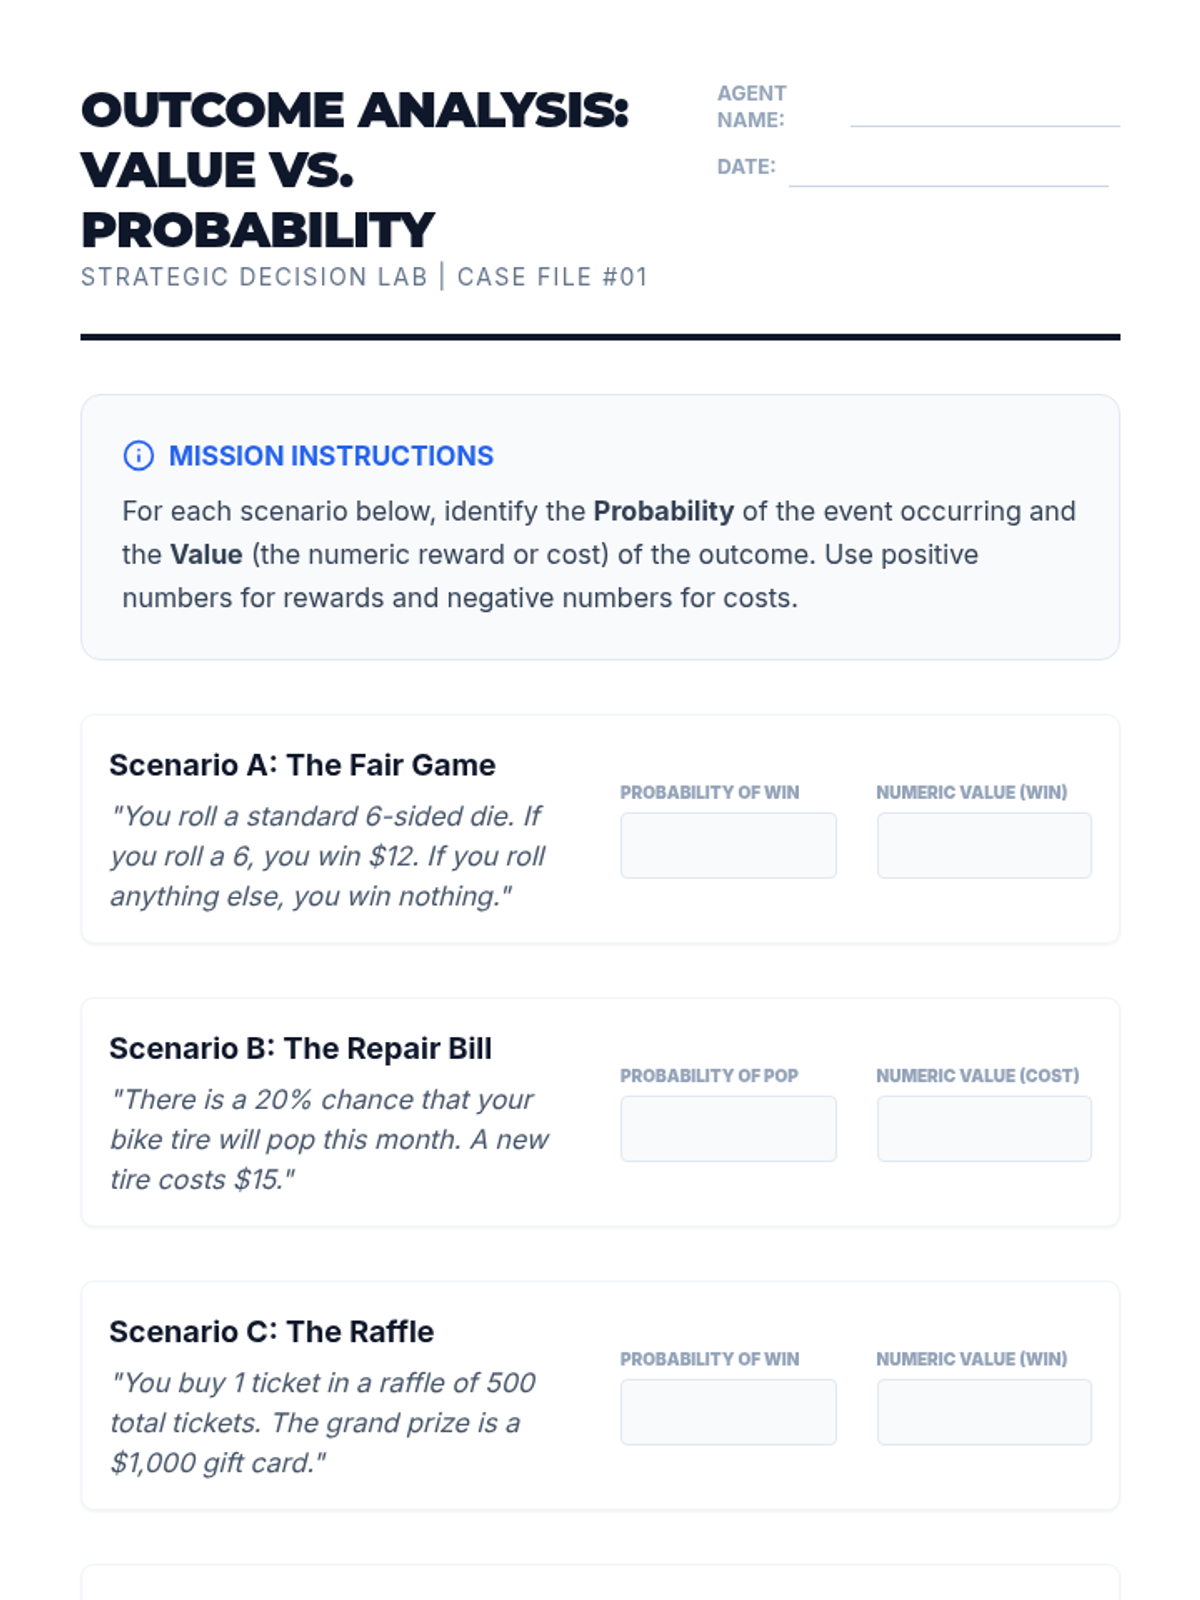
A targeted intervention lesson focused on calculating expected value through game design. Students learn to weigh outcomes by multiplying payoff values by their probabilities to make data-driven decisions.
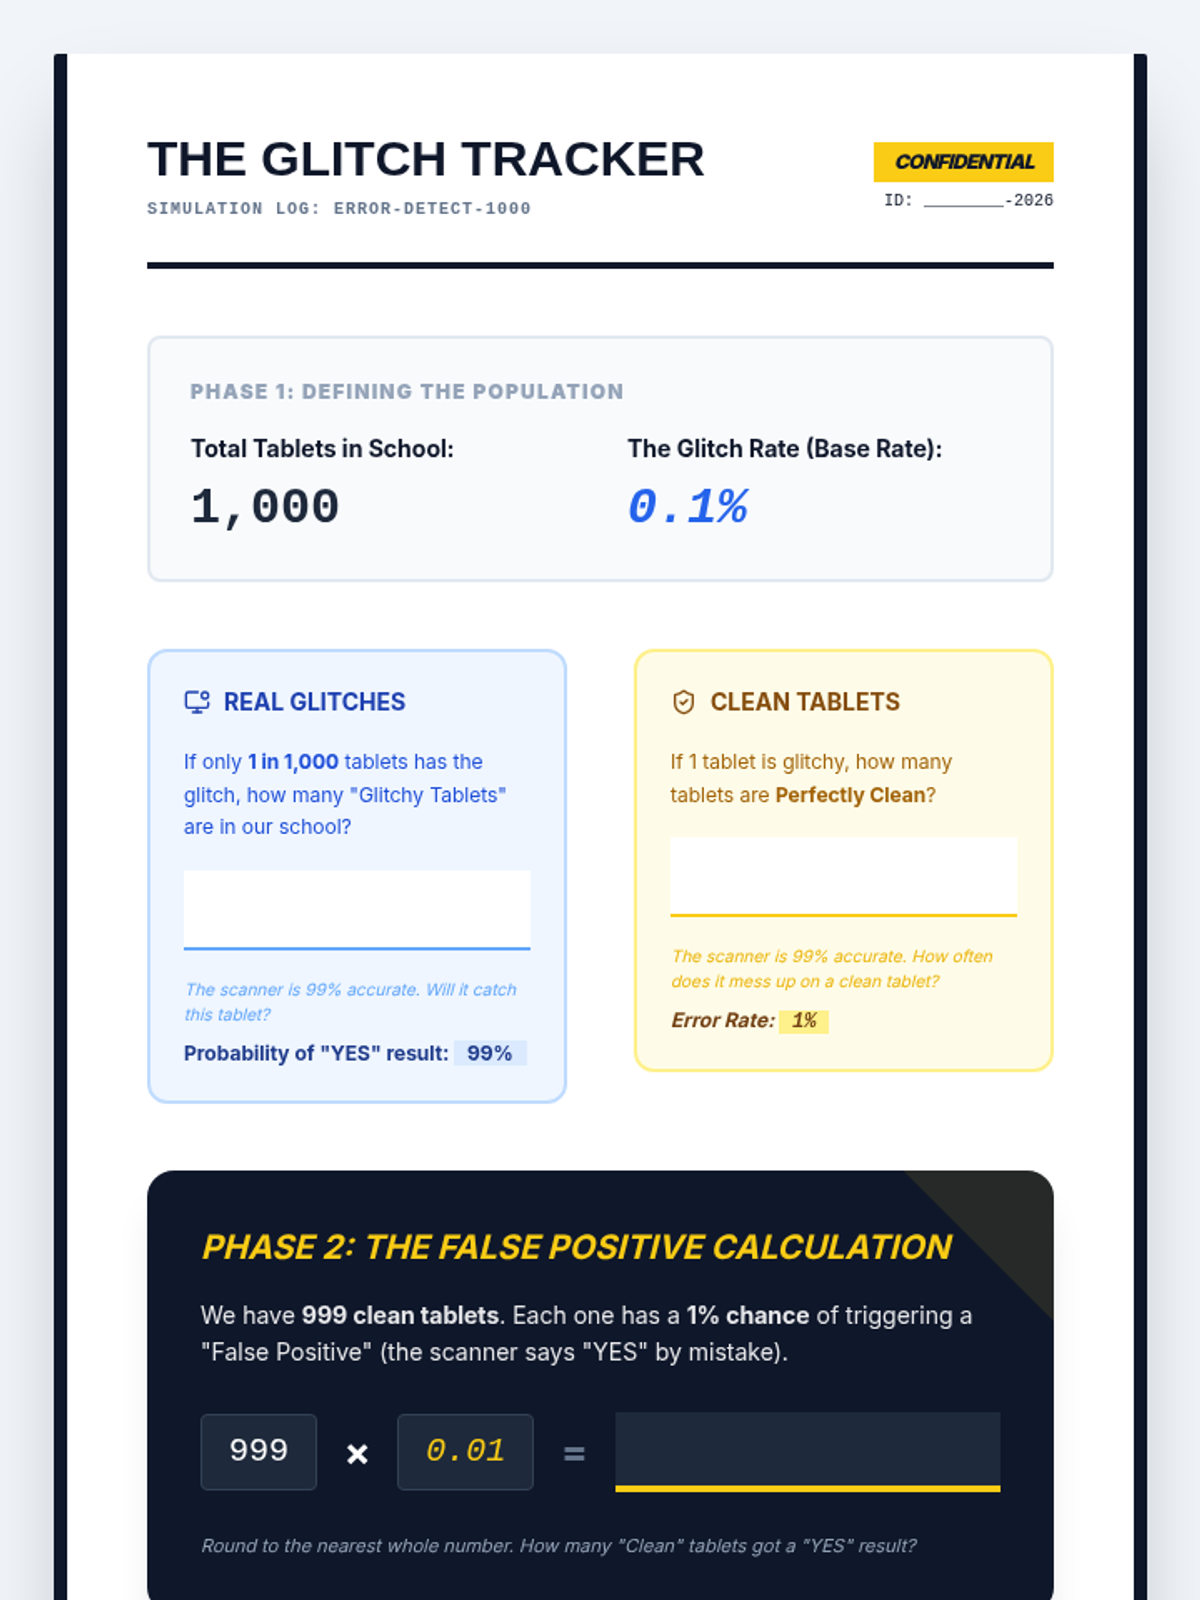
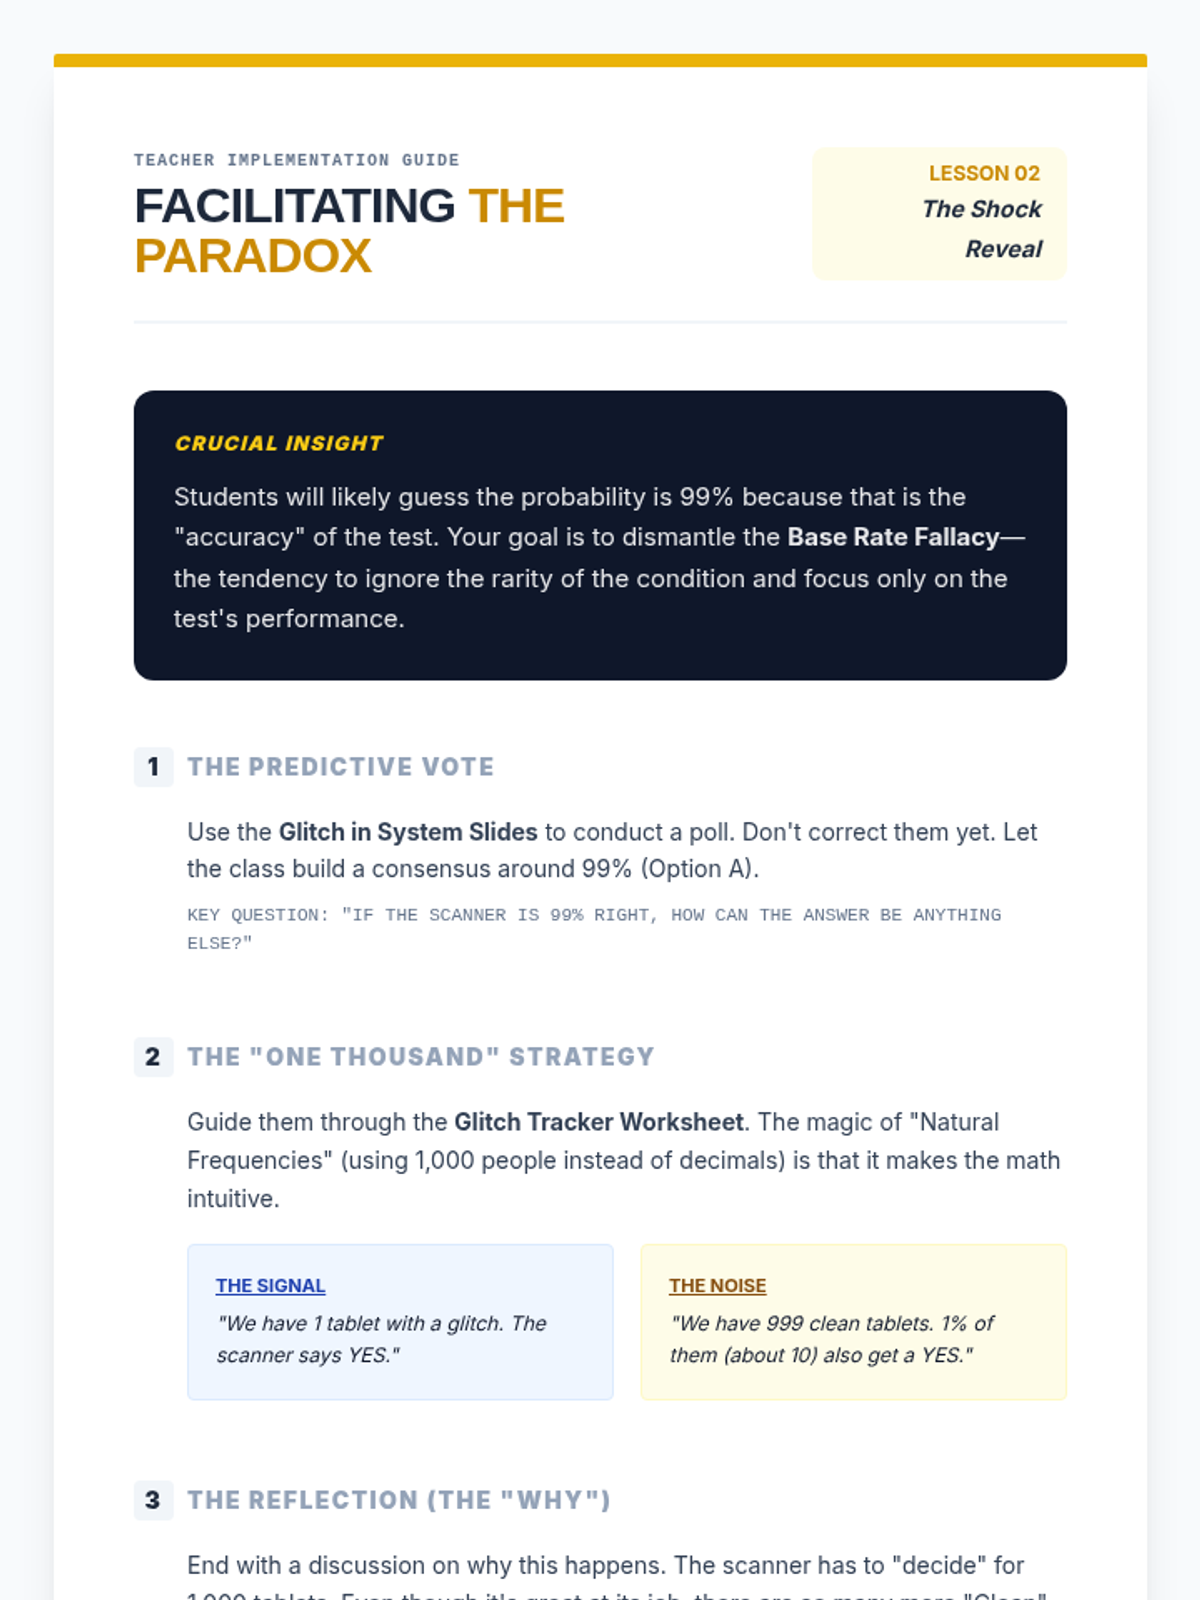
Students engage in a simulation where they 'test' a population for a rare trait using a 99% accurate test. They discover that rare traits result in many false alarms, introducing the base rate fallacy.
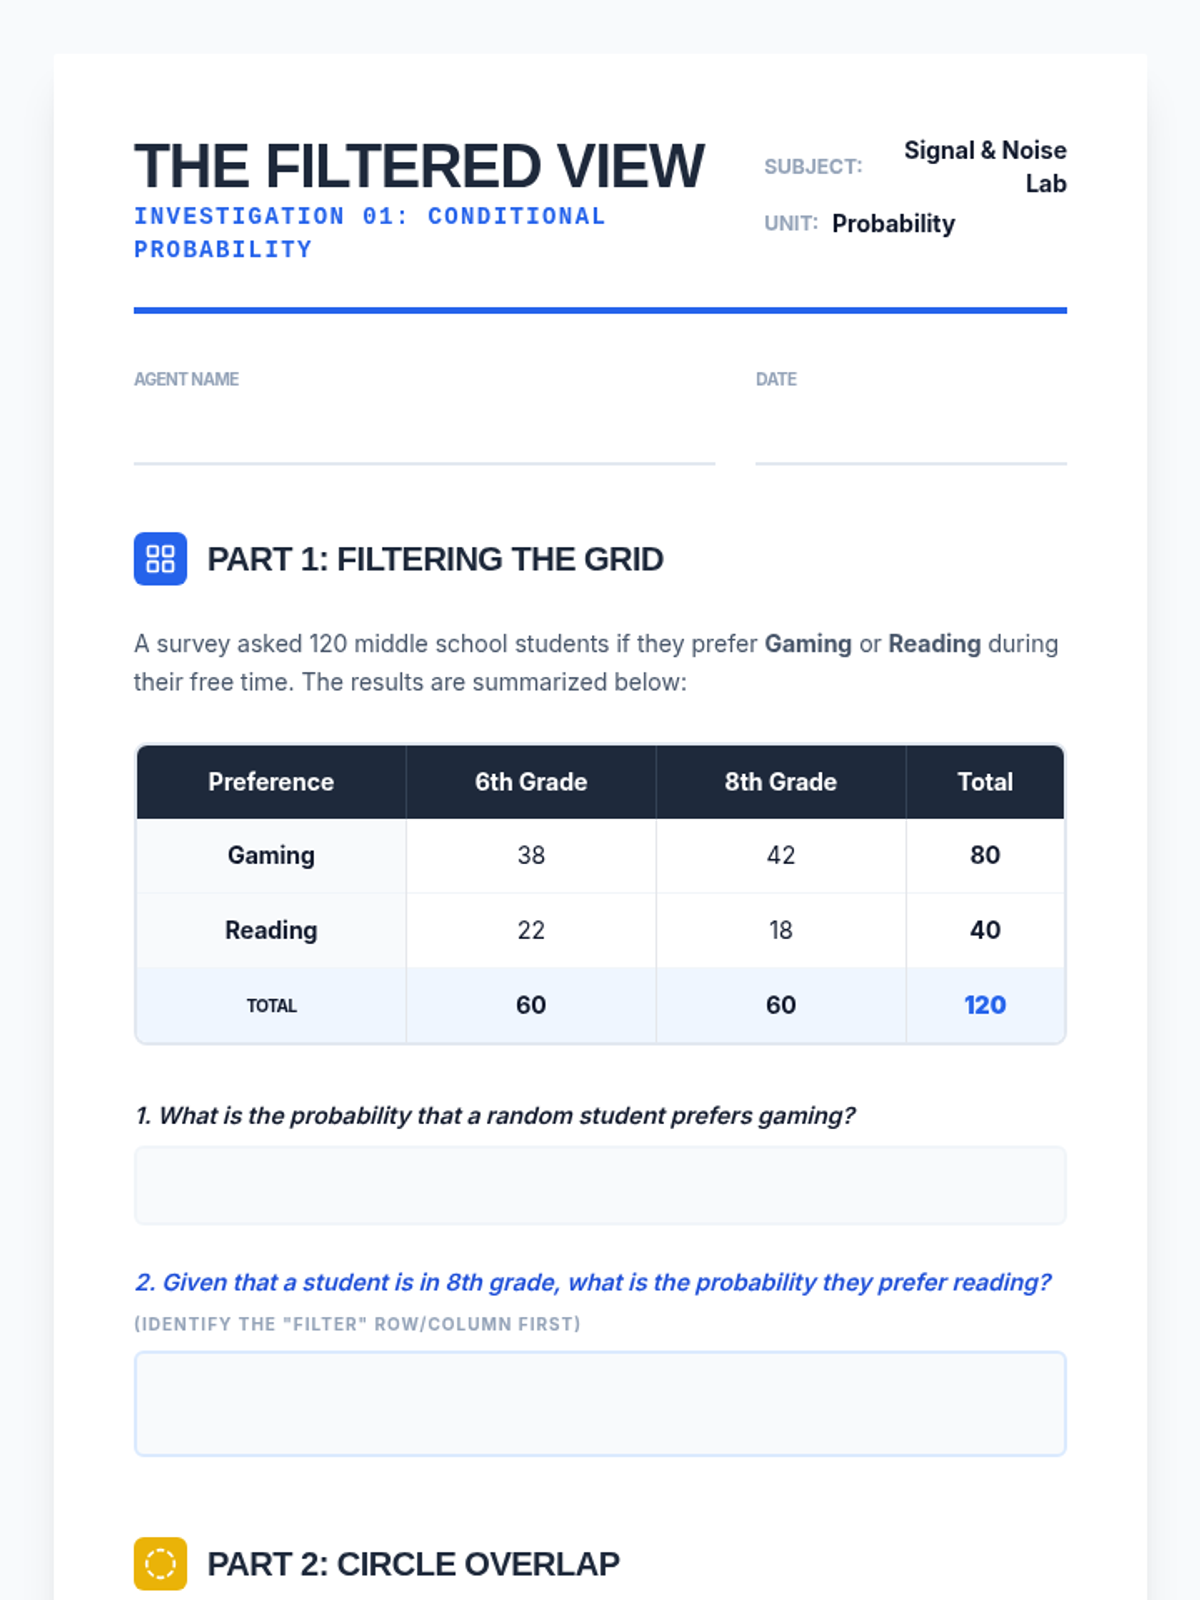
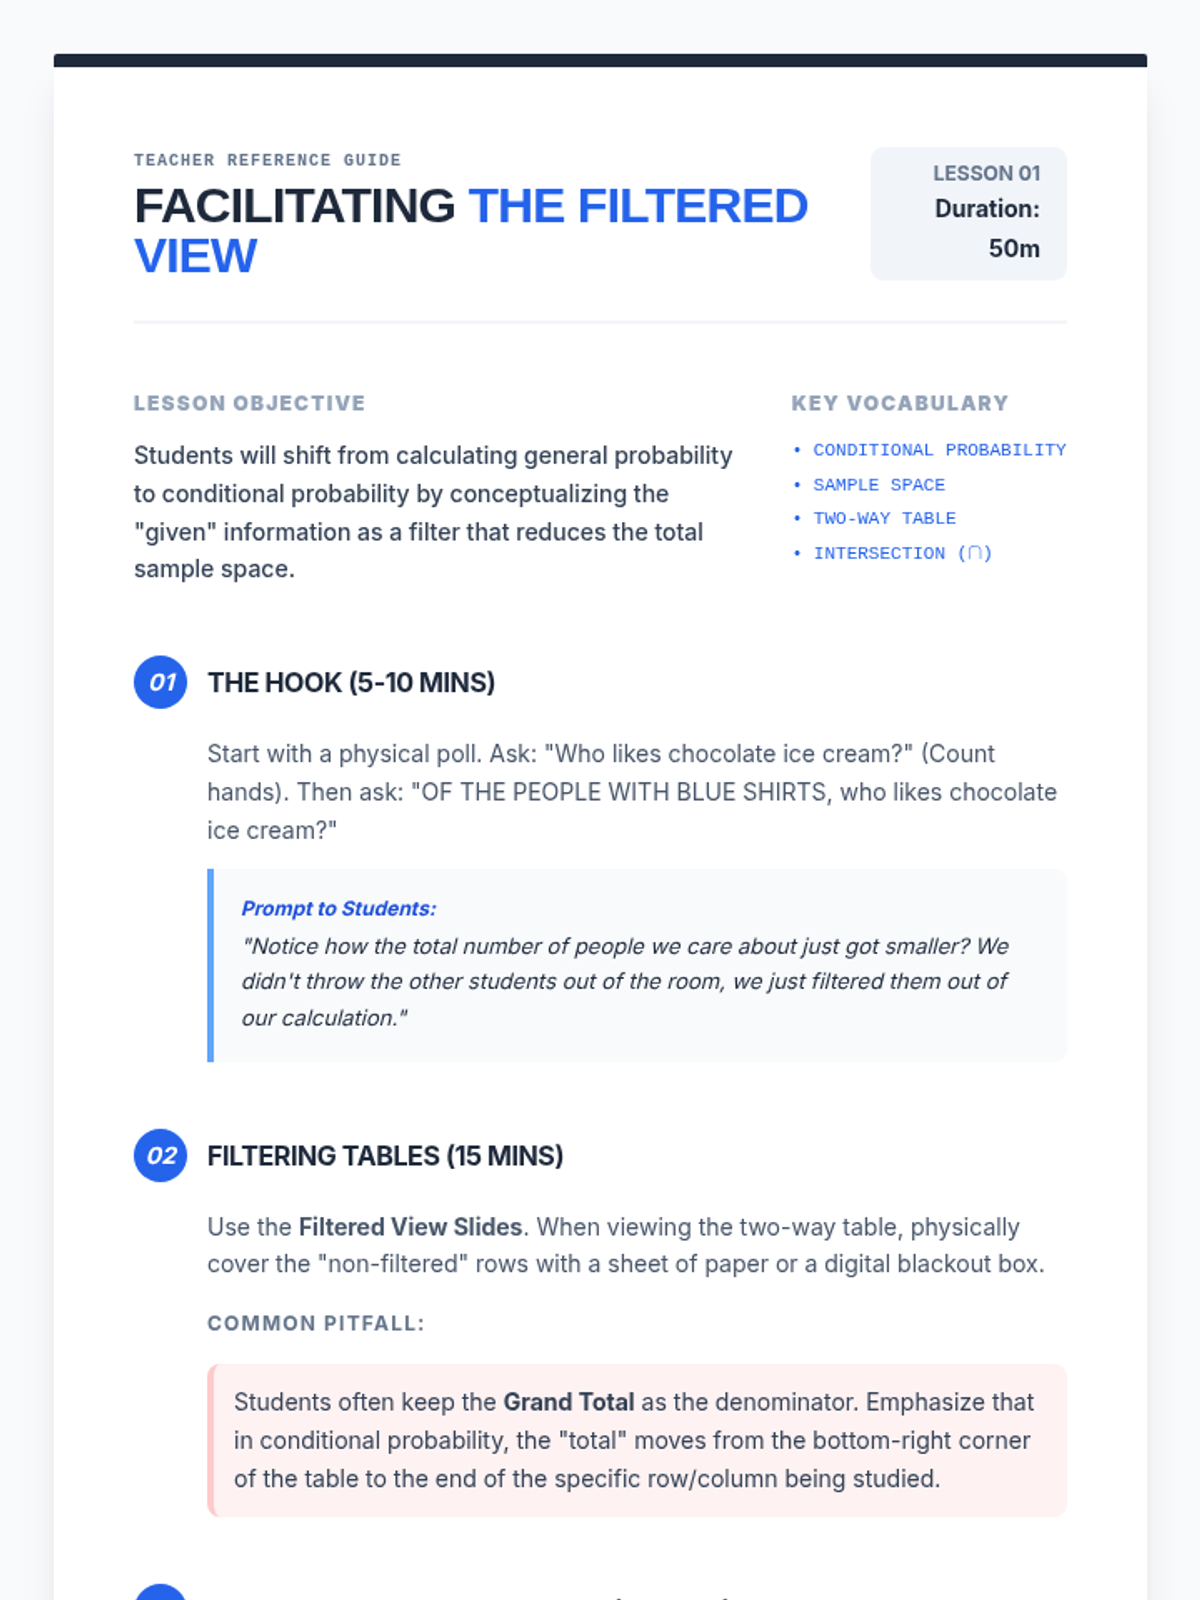
Students use two-way tables and Venn diagrams to find probabilities of an event given a specific condition, practicing how to 'filter' the sample space.
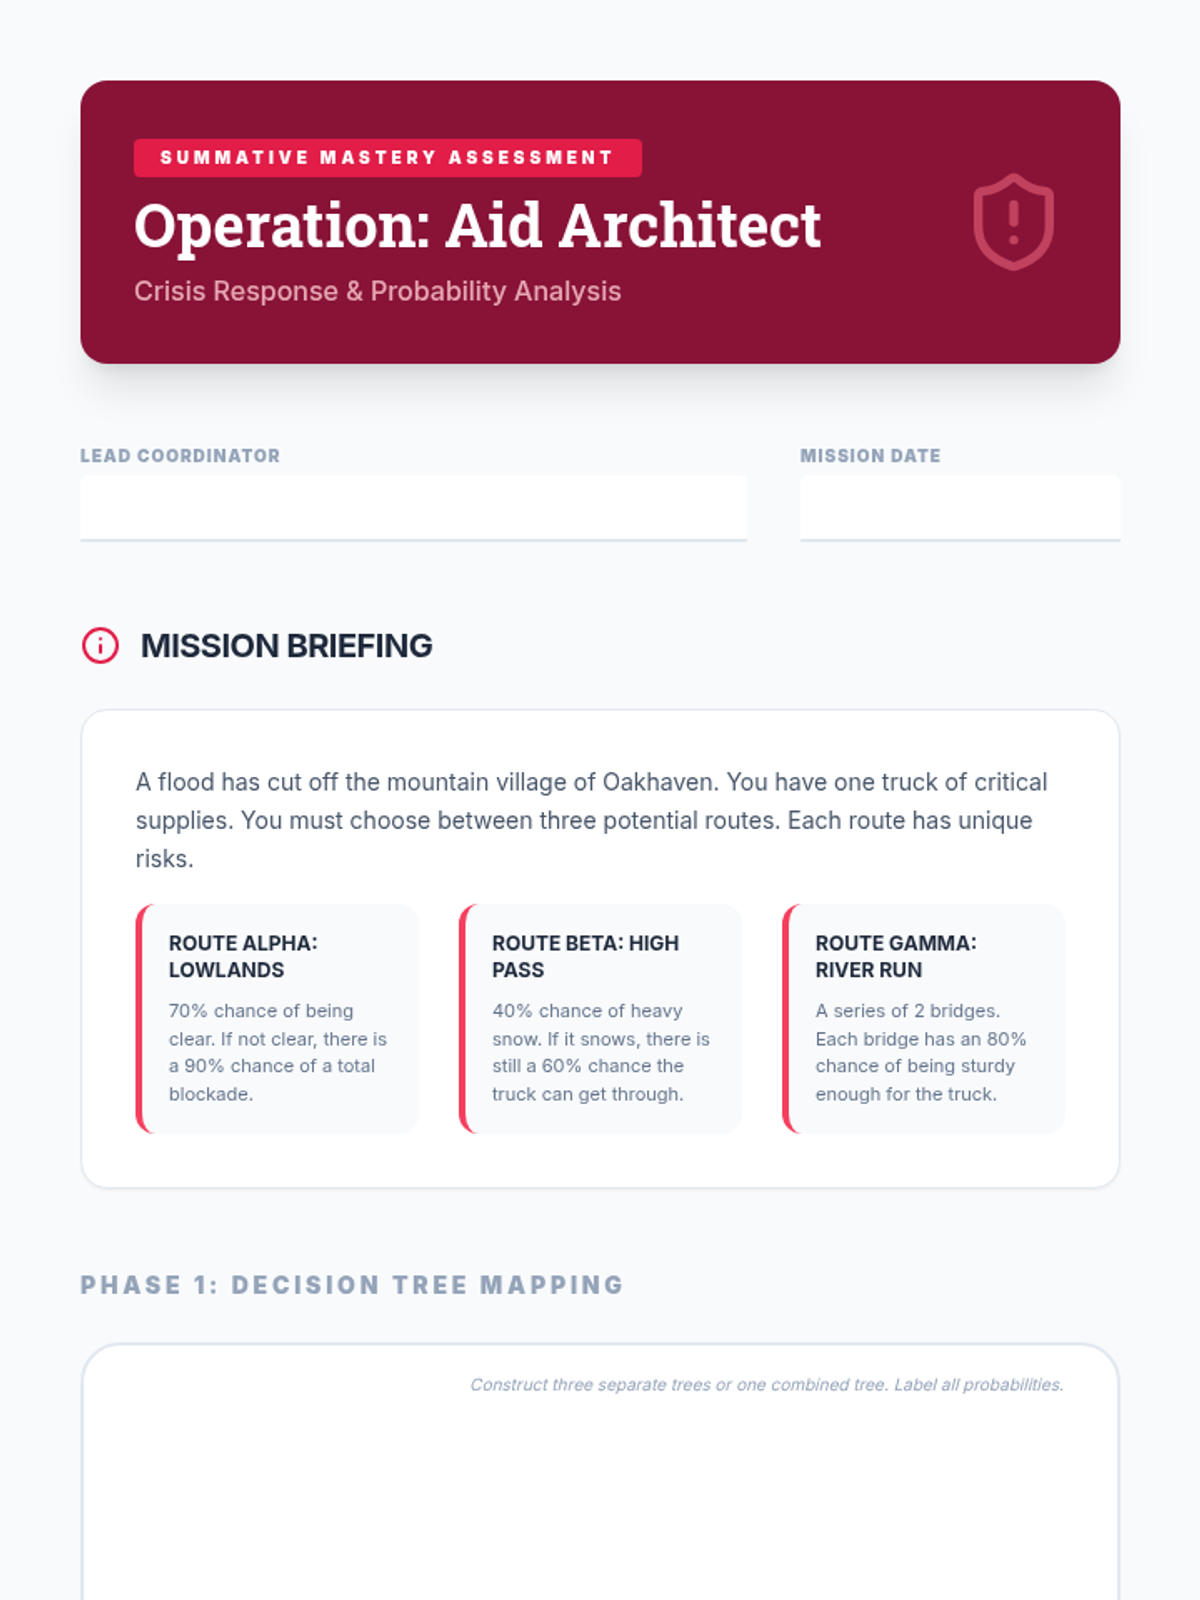
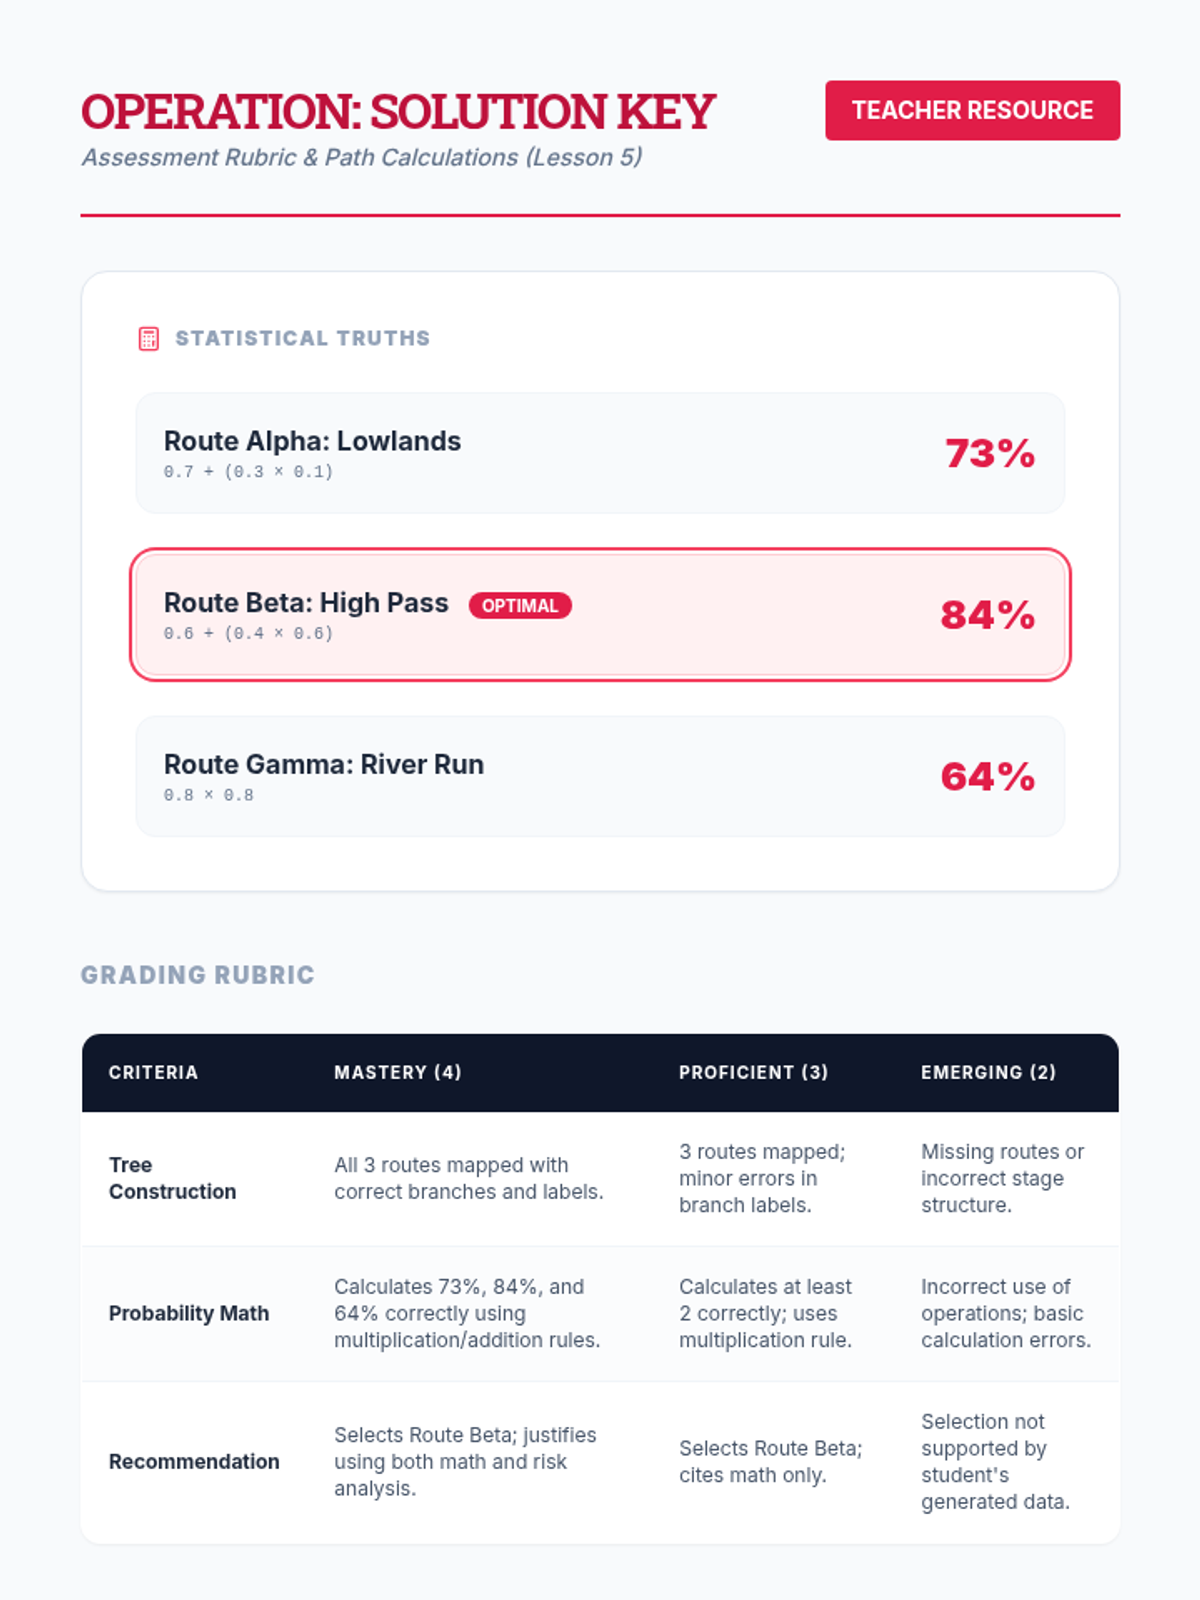
In a culminating assessment, students are given a complex scenario with three different decision paths. They must construct a tree, calculate probabilities for success for each path, and write a recommendation.
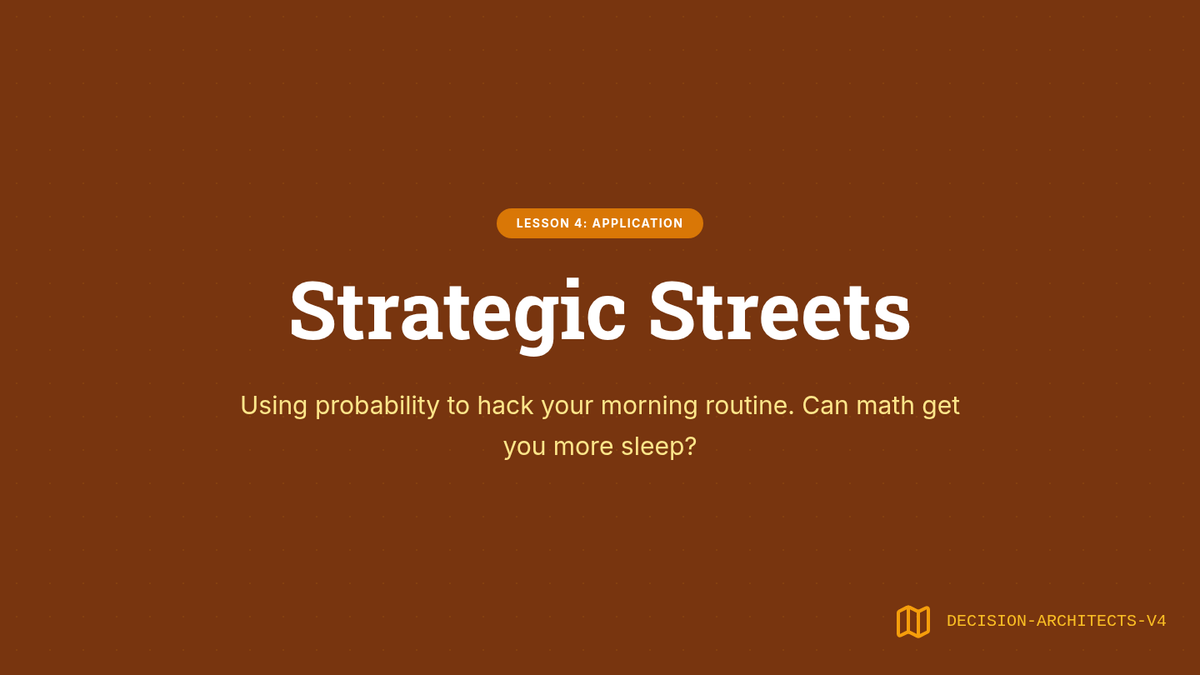
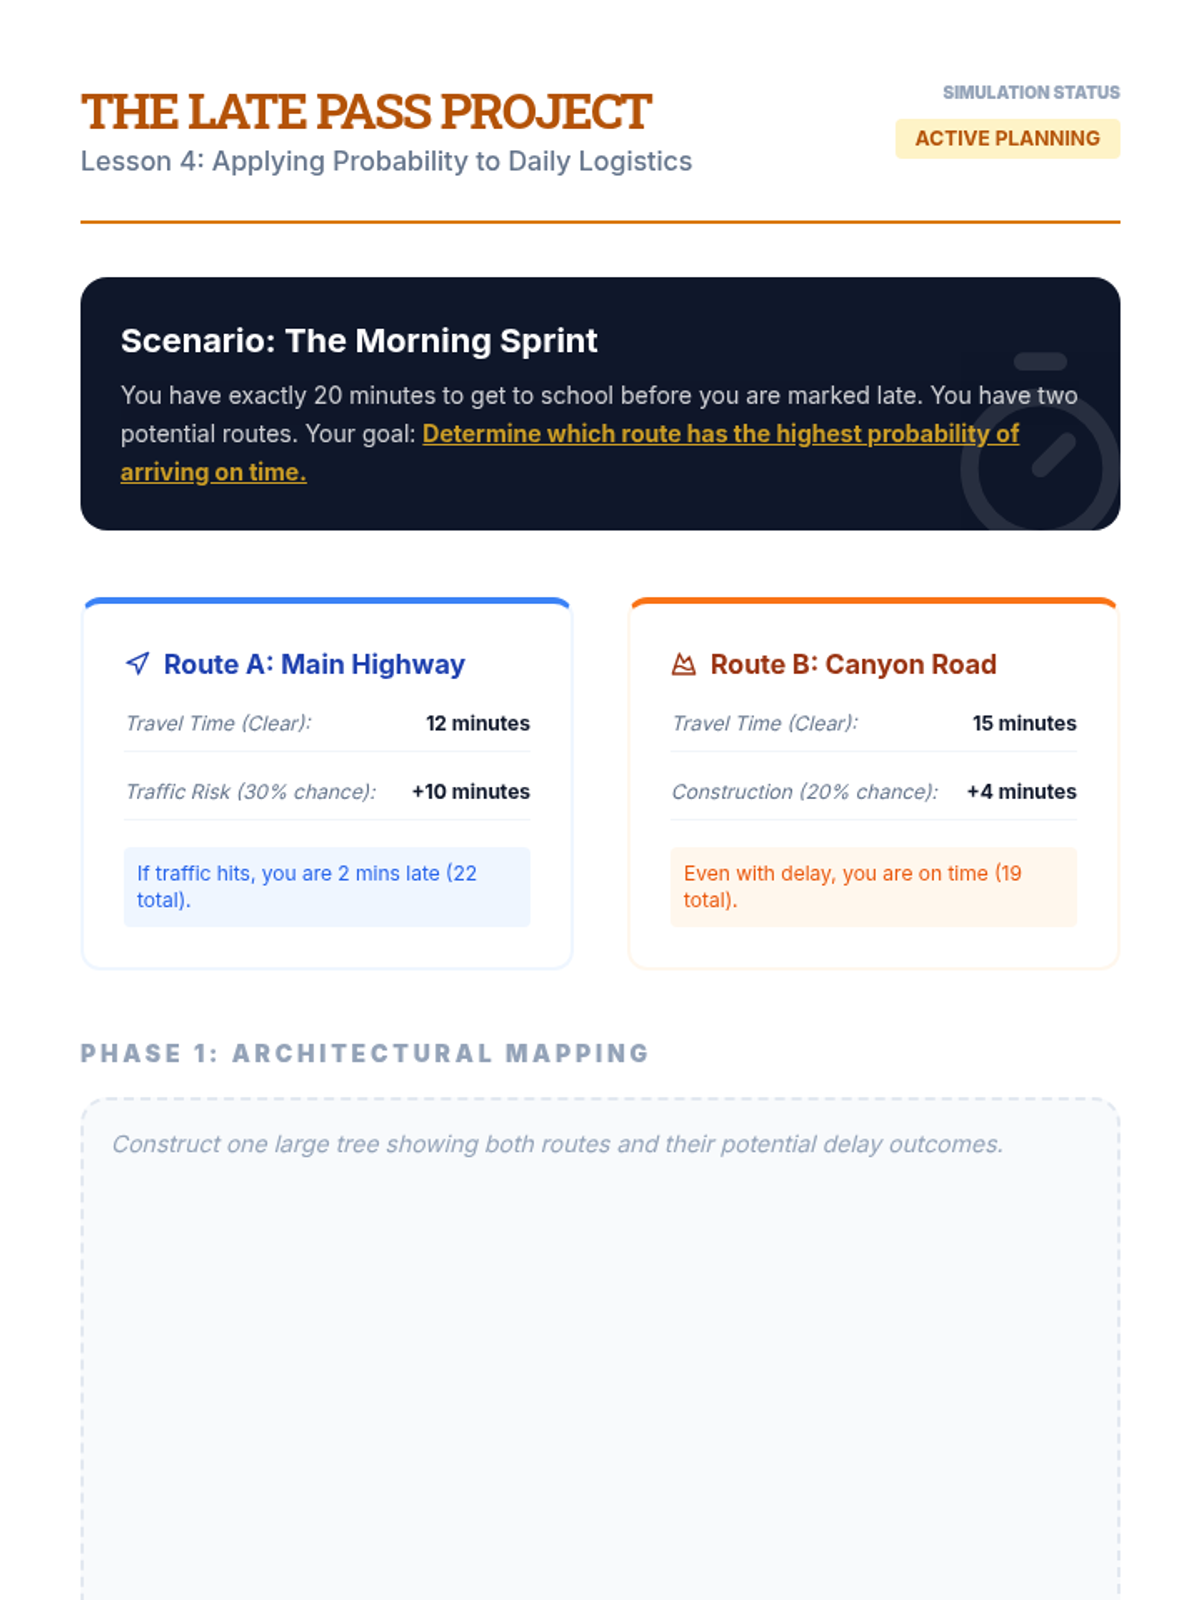
Students apply their skills to a real-world scenario, such as choosing a route to school based on traffic lights and train crossings. They map the probabilities of delays to choose the most efficient path.
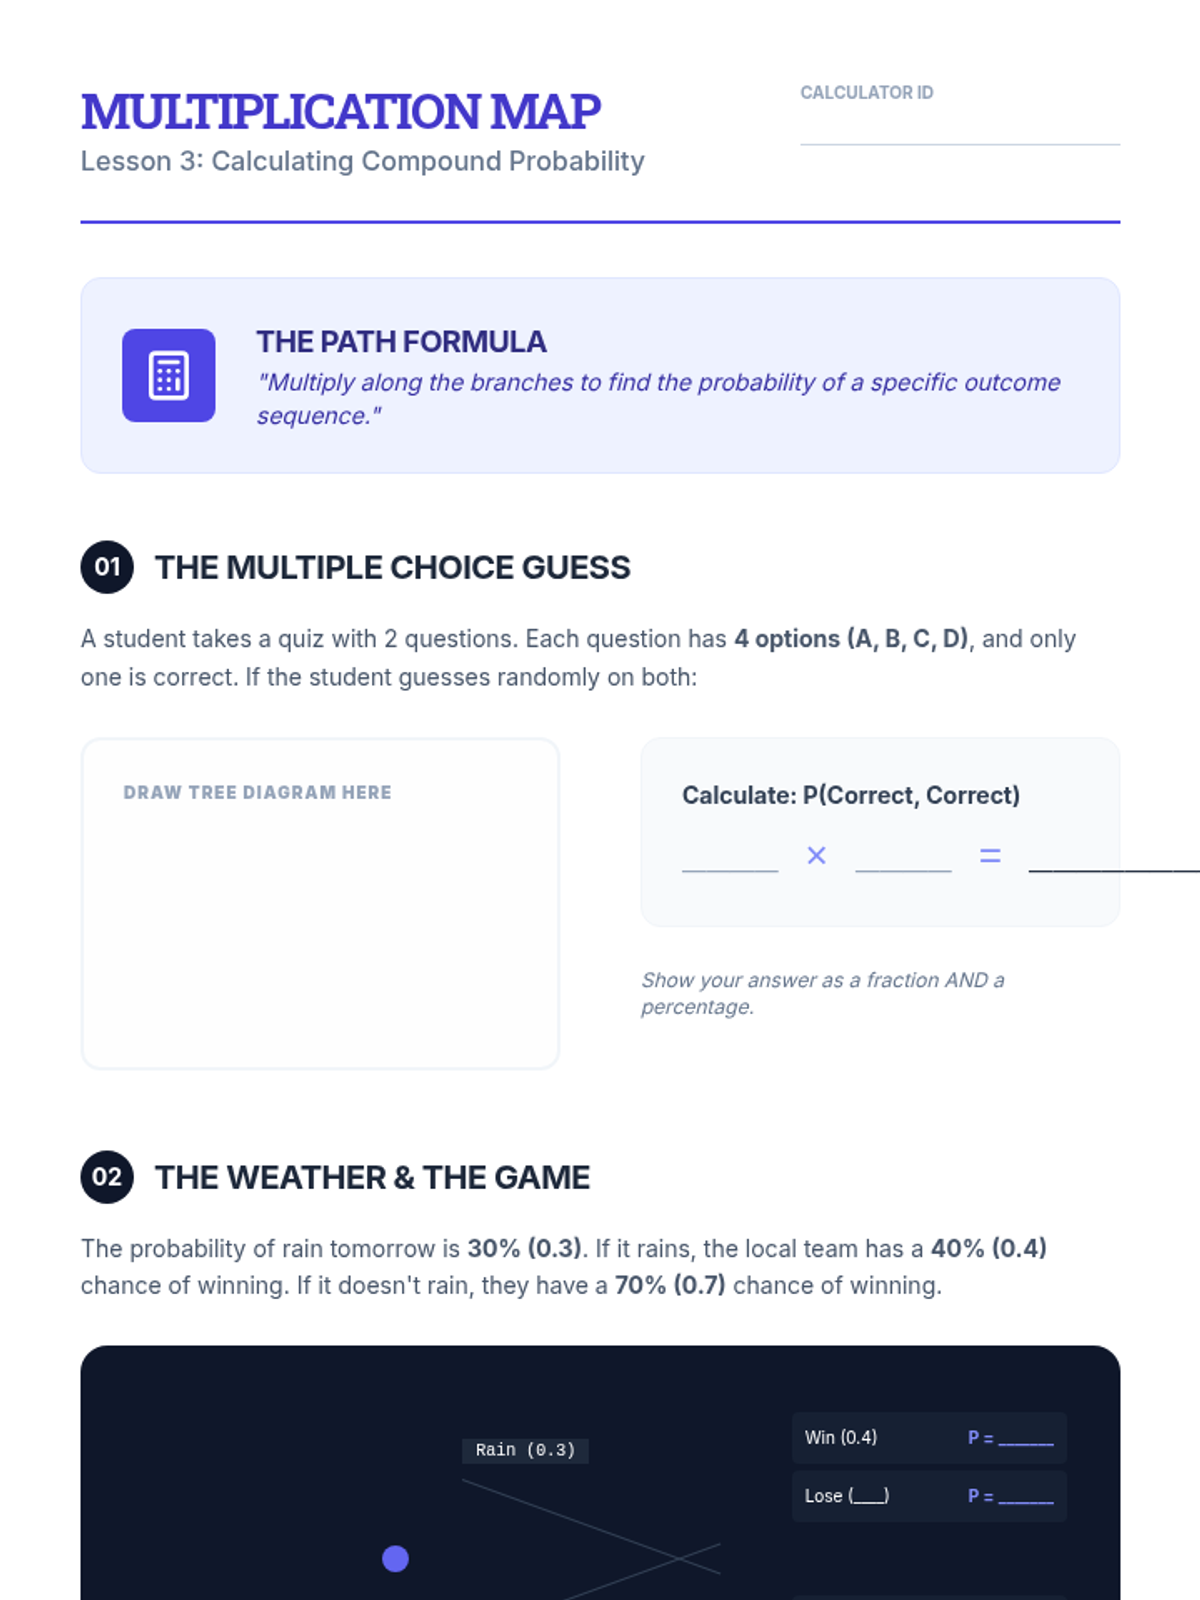
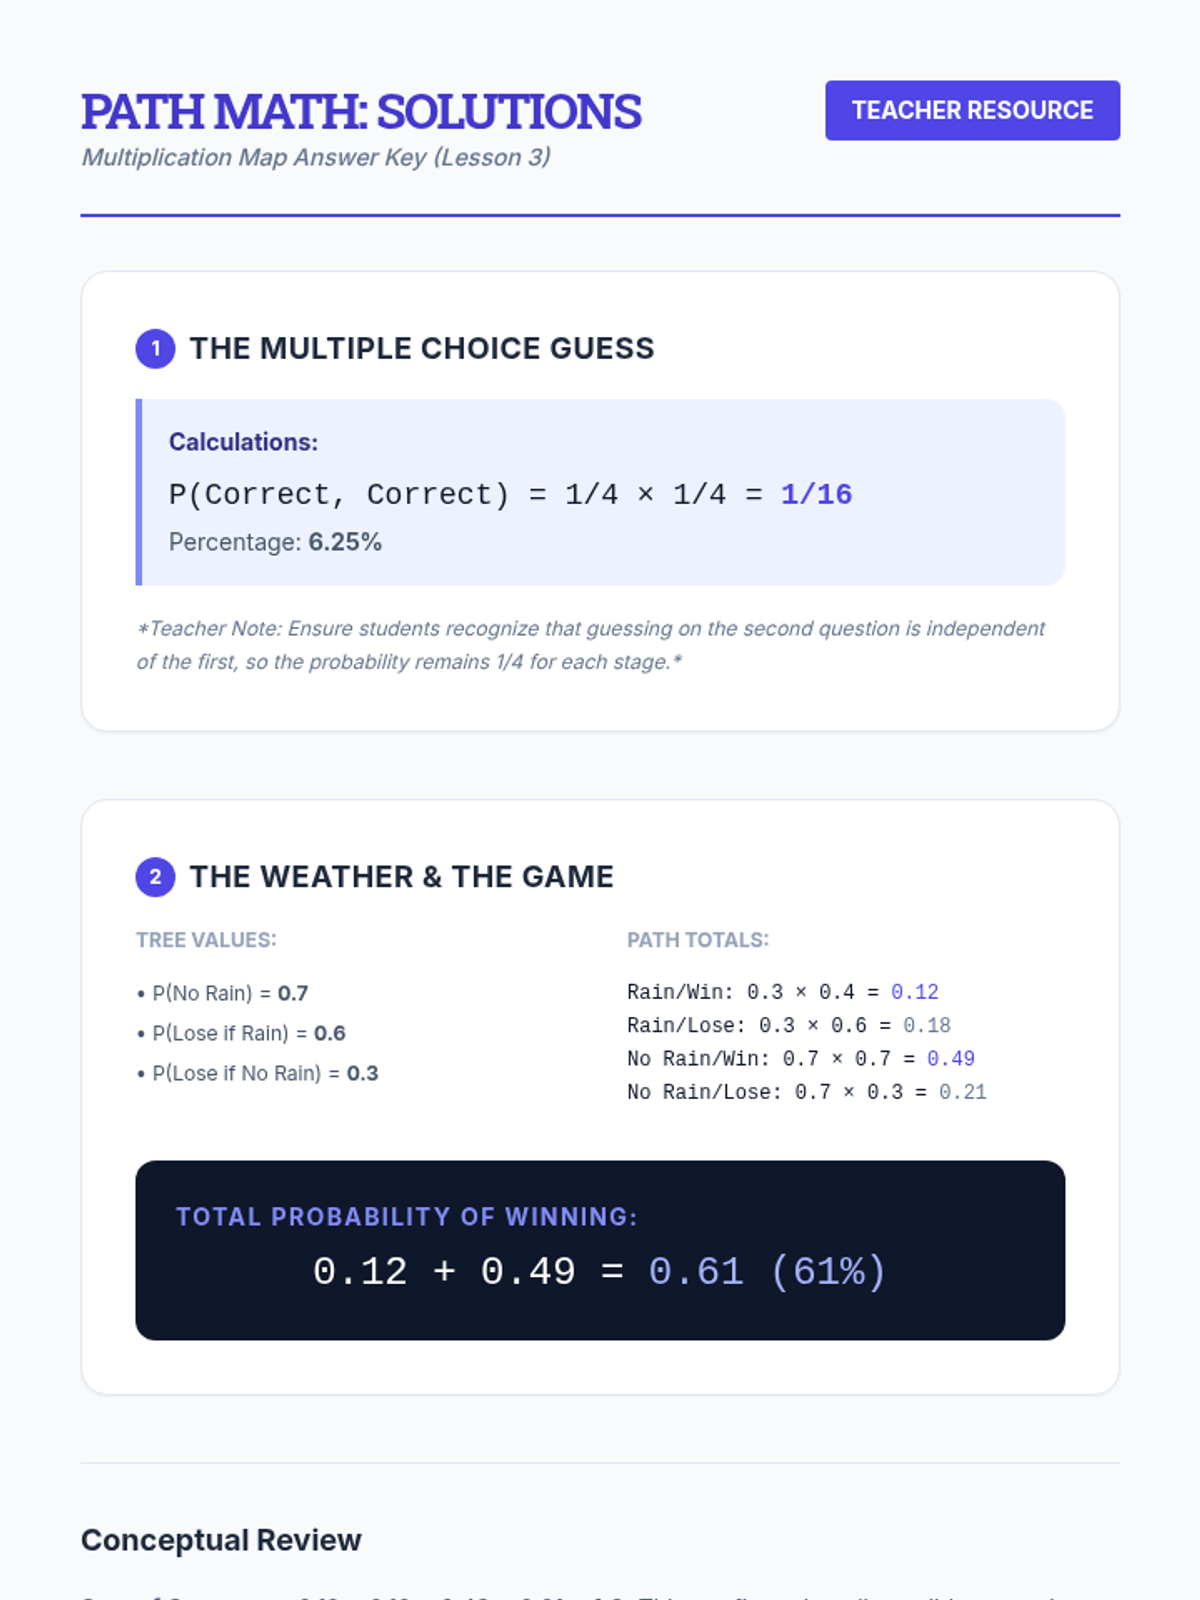
Students move from counting branches to calculating probabilities along the branches using multiplication. They determine the likelihood of specific paths (e.g., outcome A then outcome B).
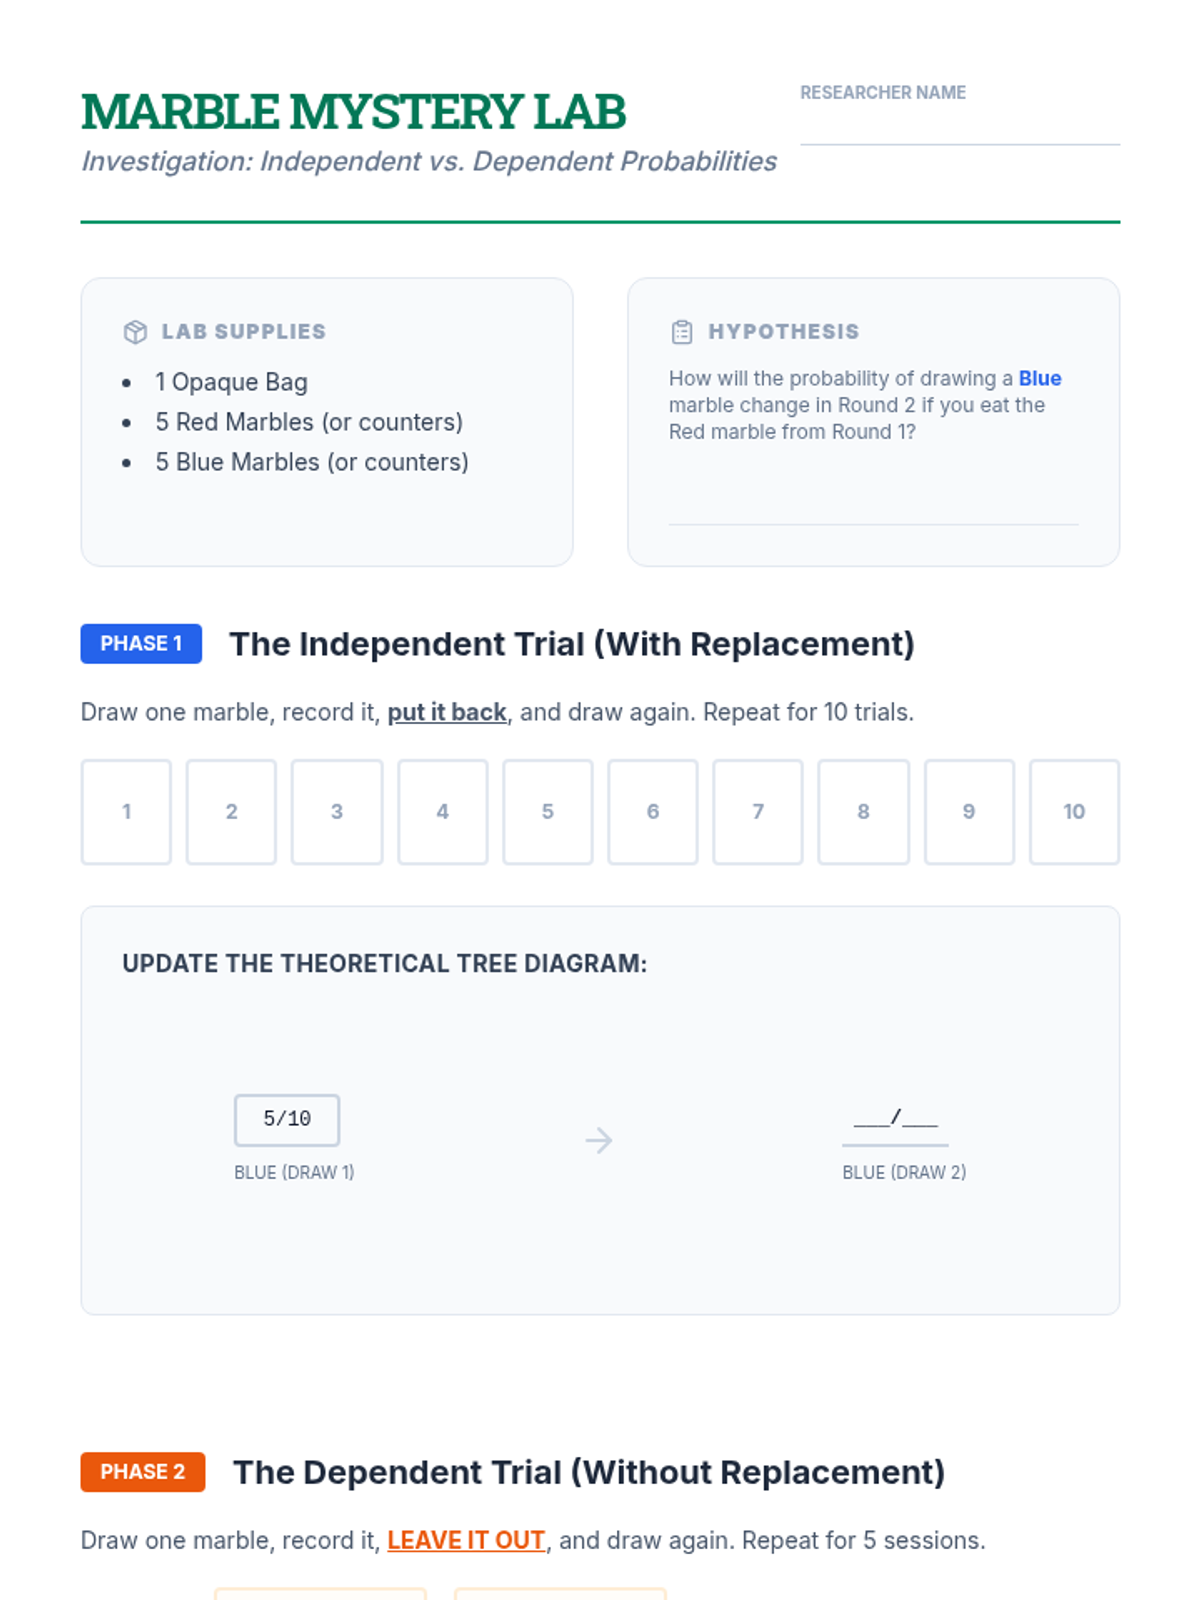
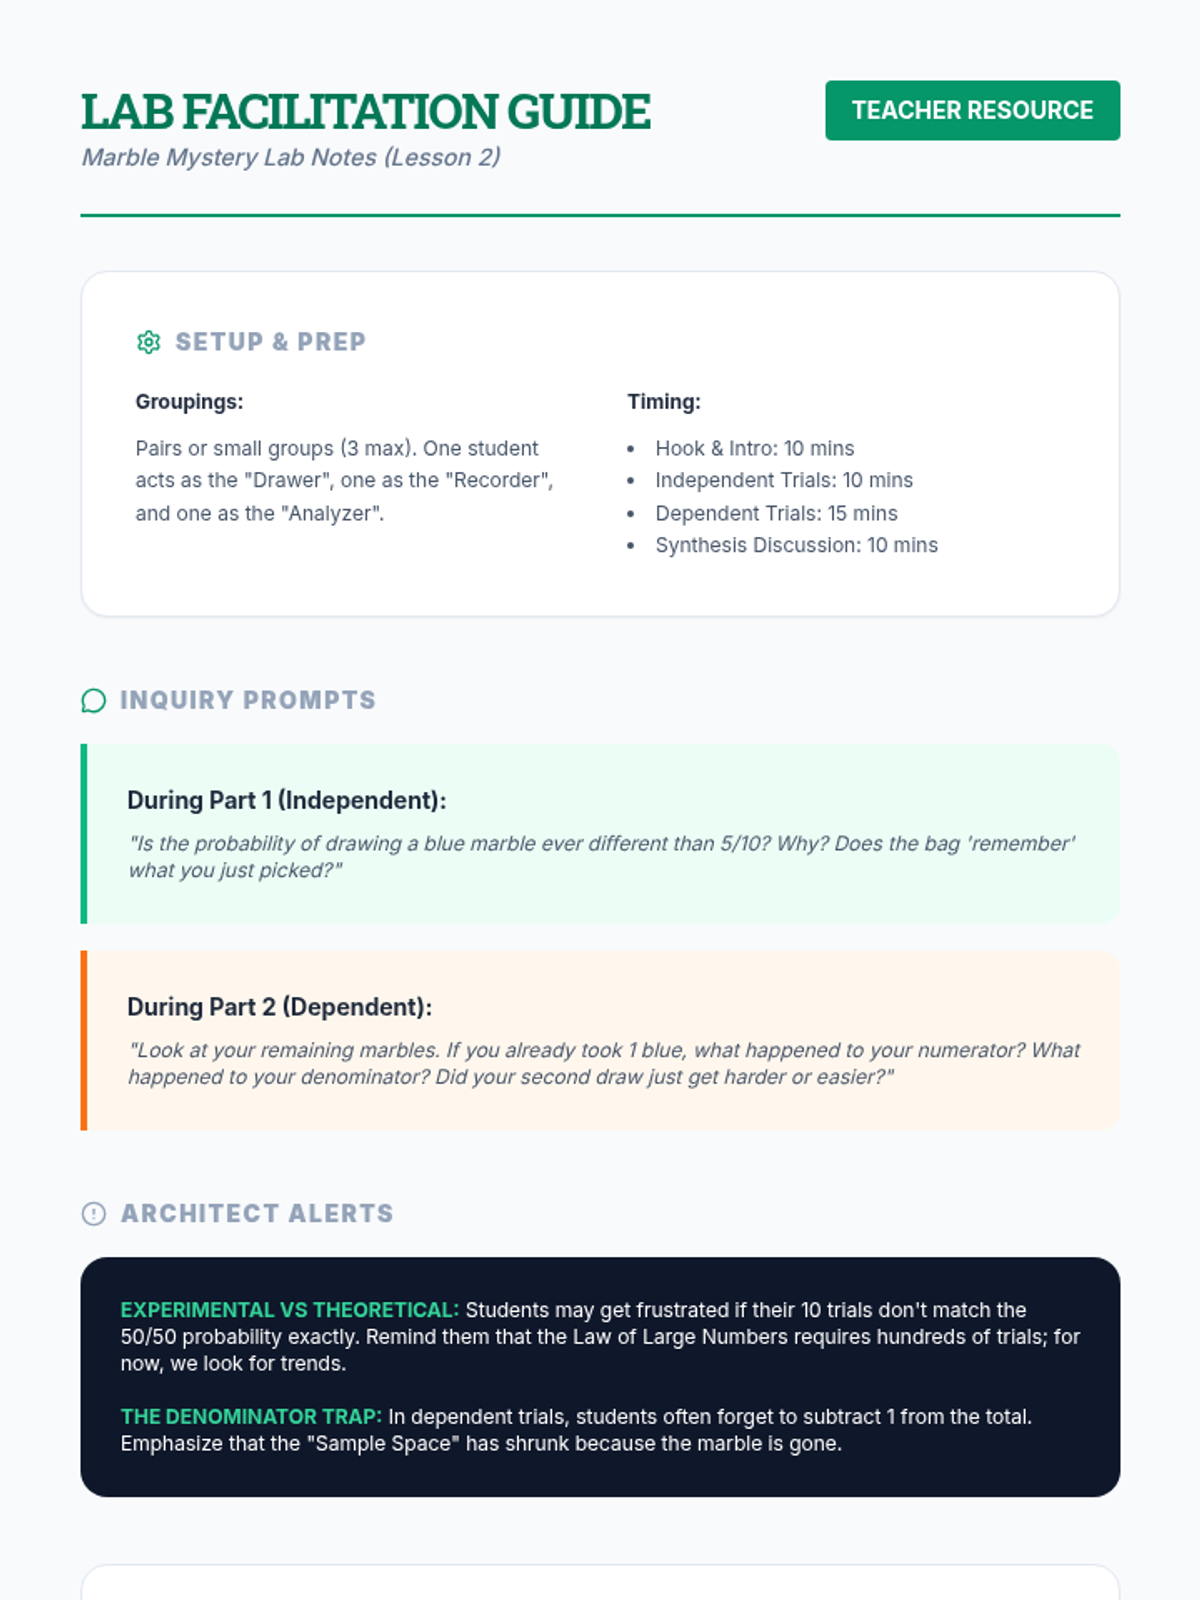
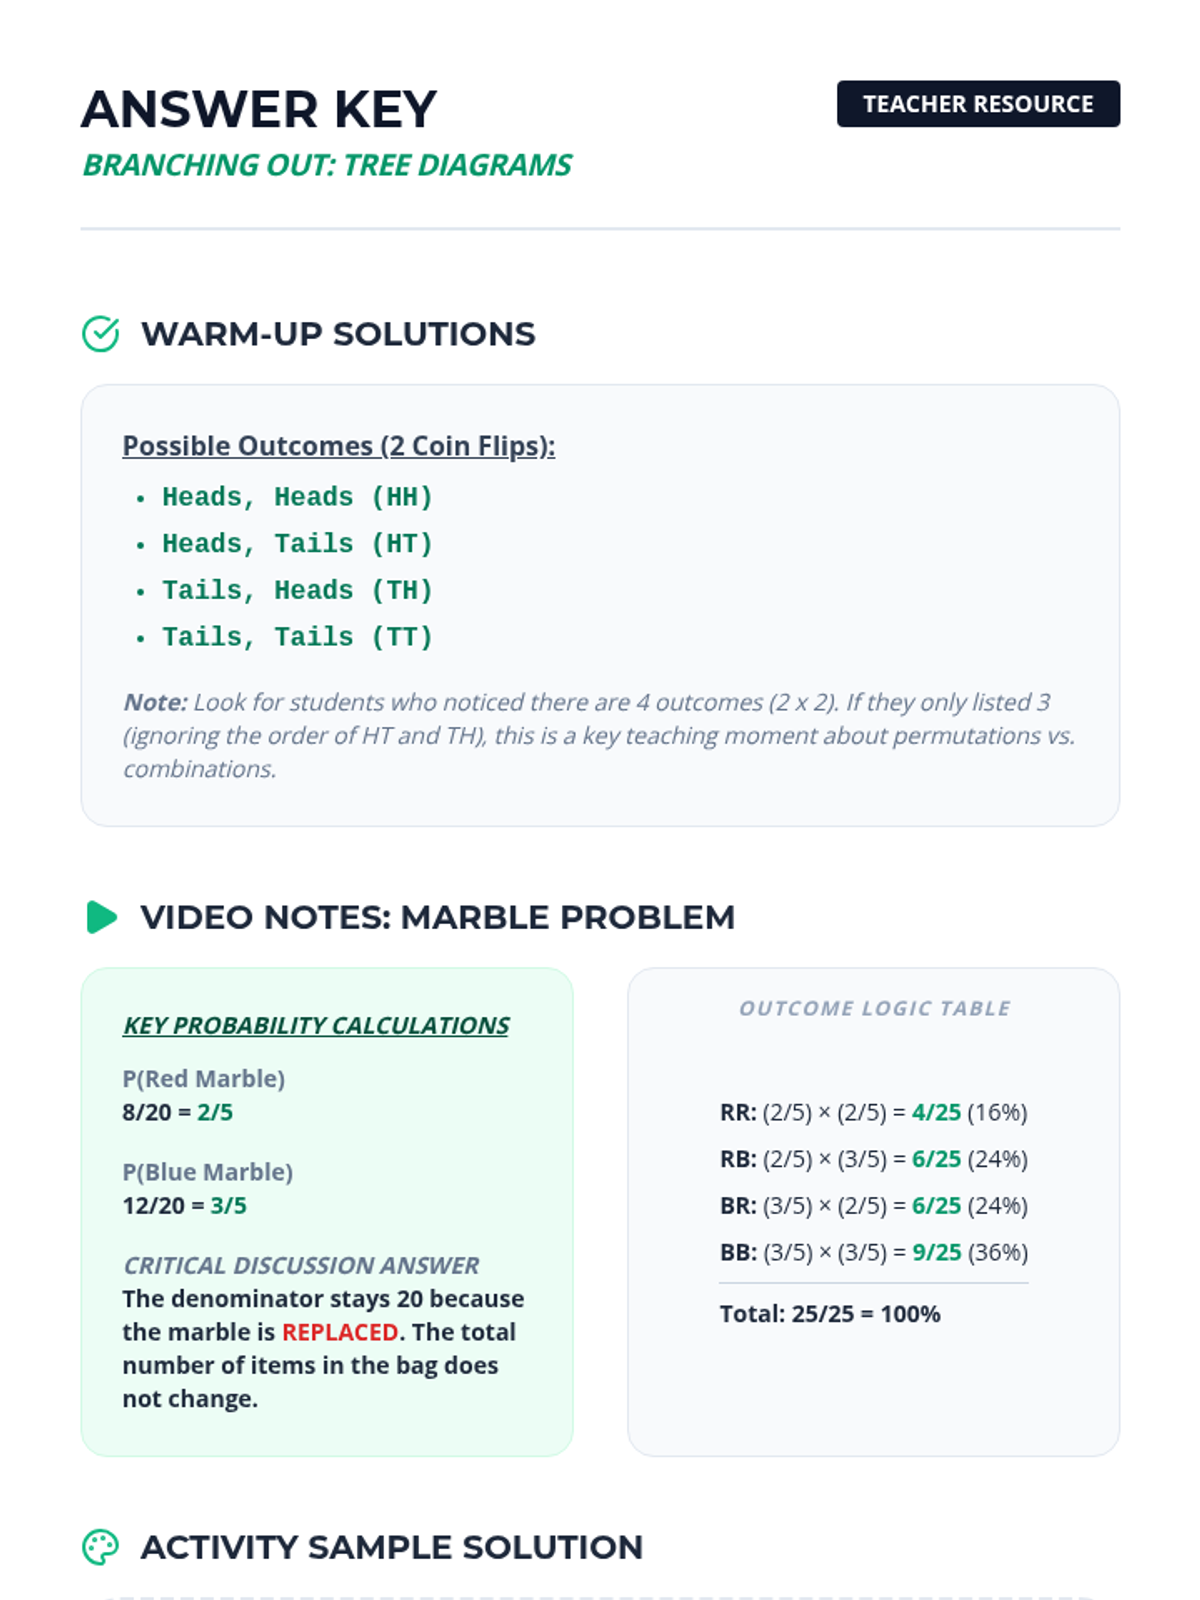
Through a marble-drawing experiment (with and without replacement), students discover how one event affects the probability of the next. They update their tree diagrams to reflect changing probabilities.
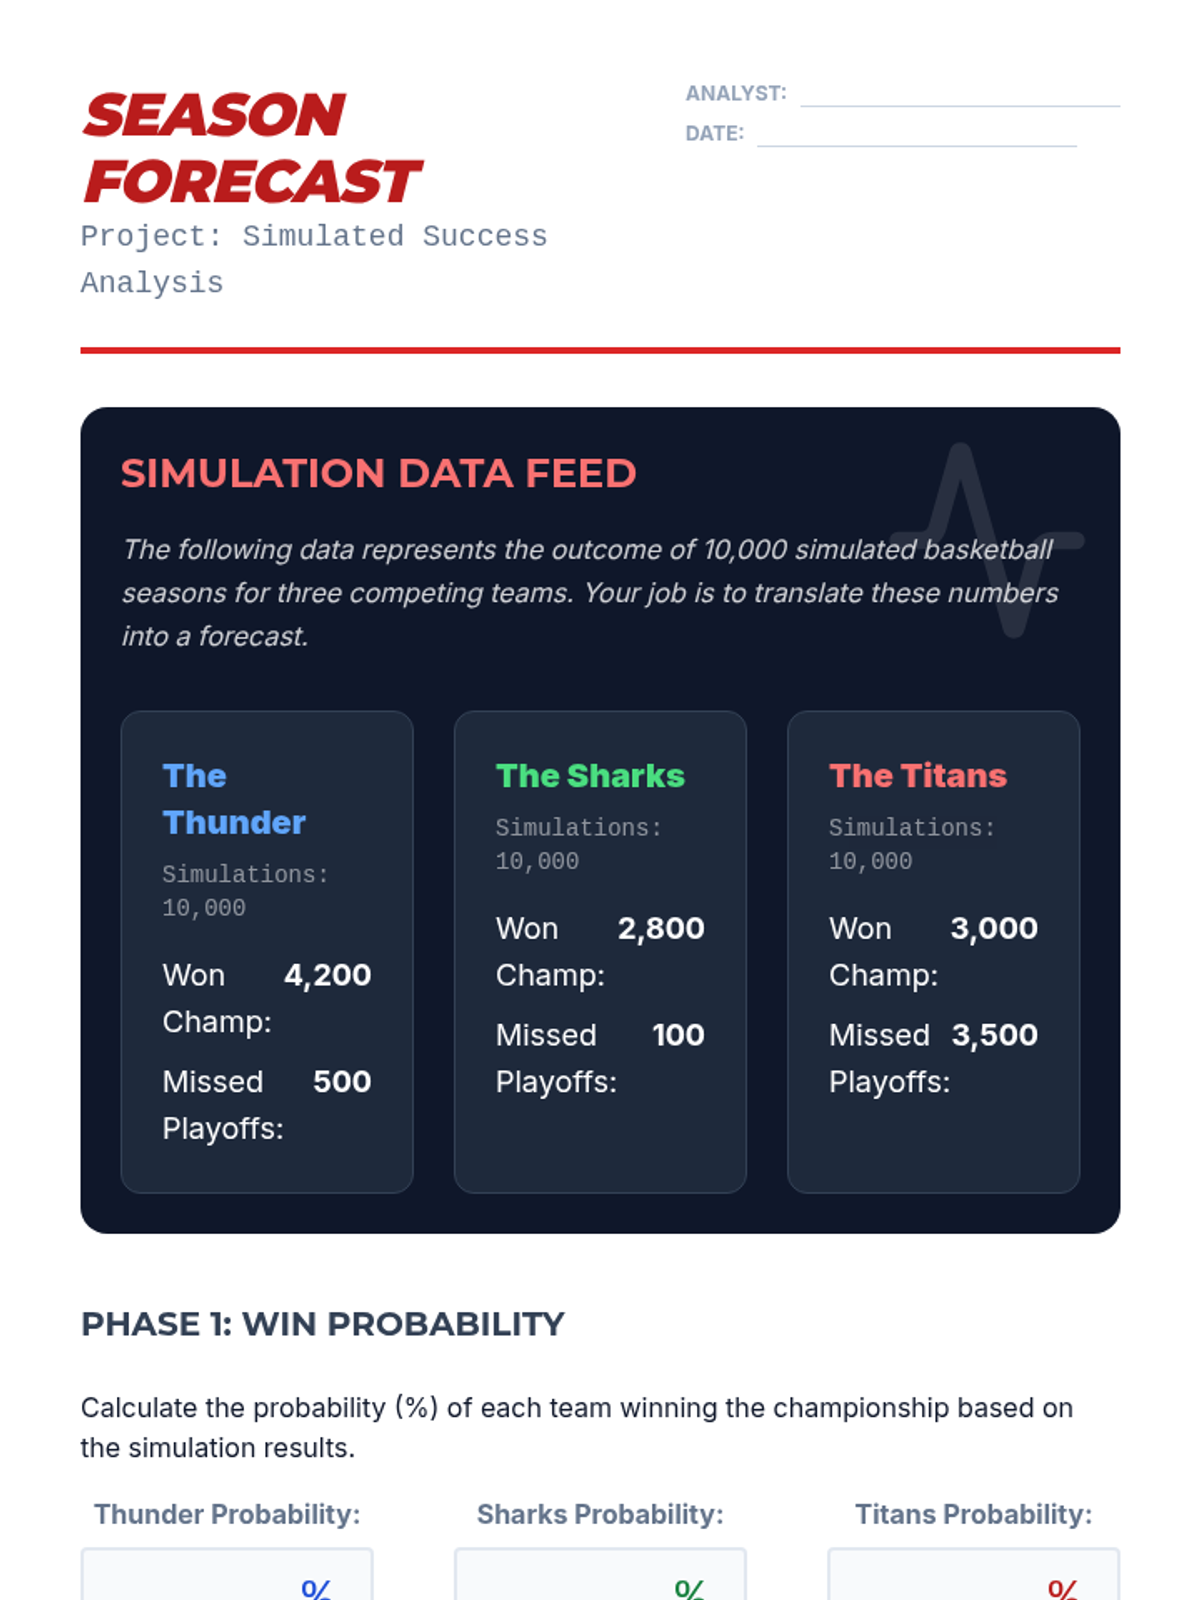
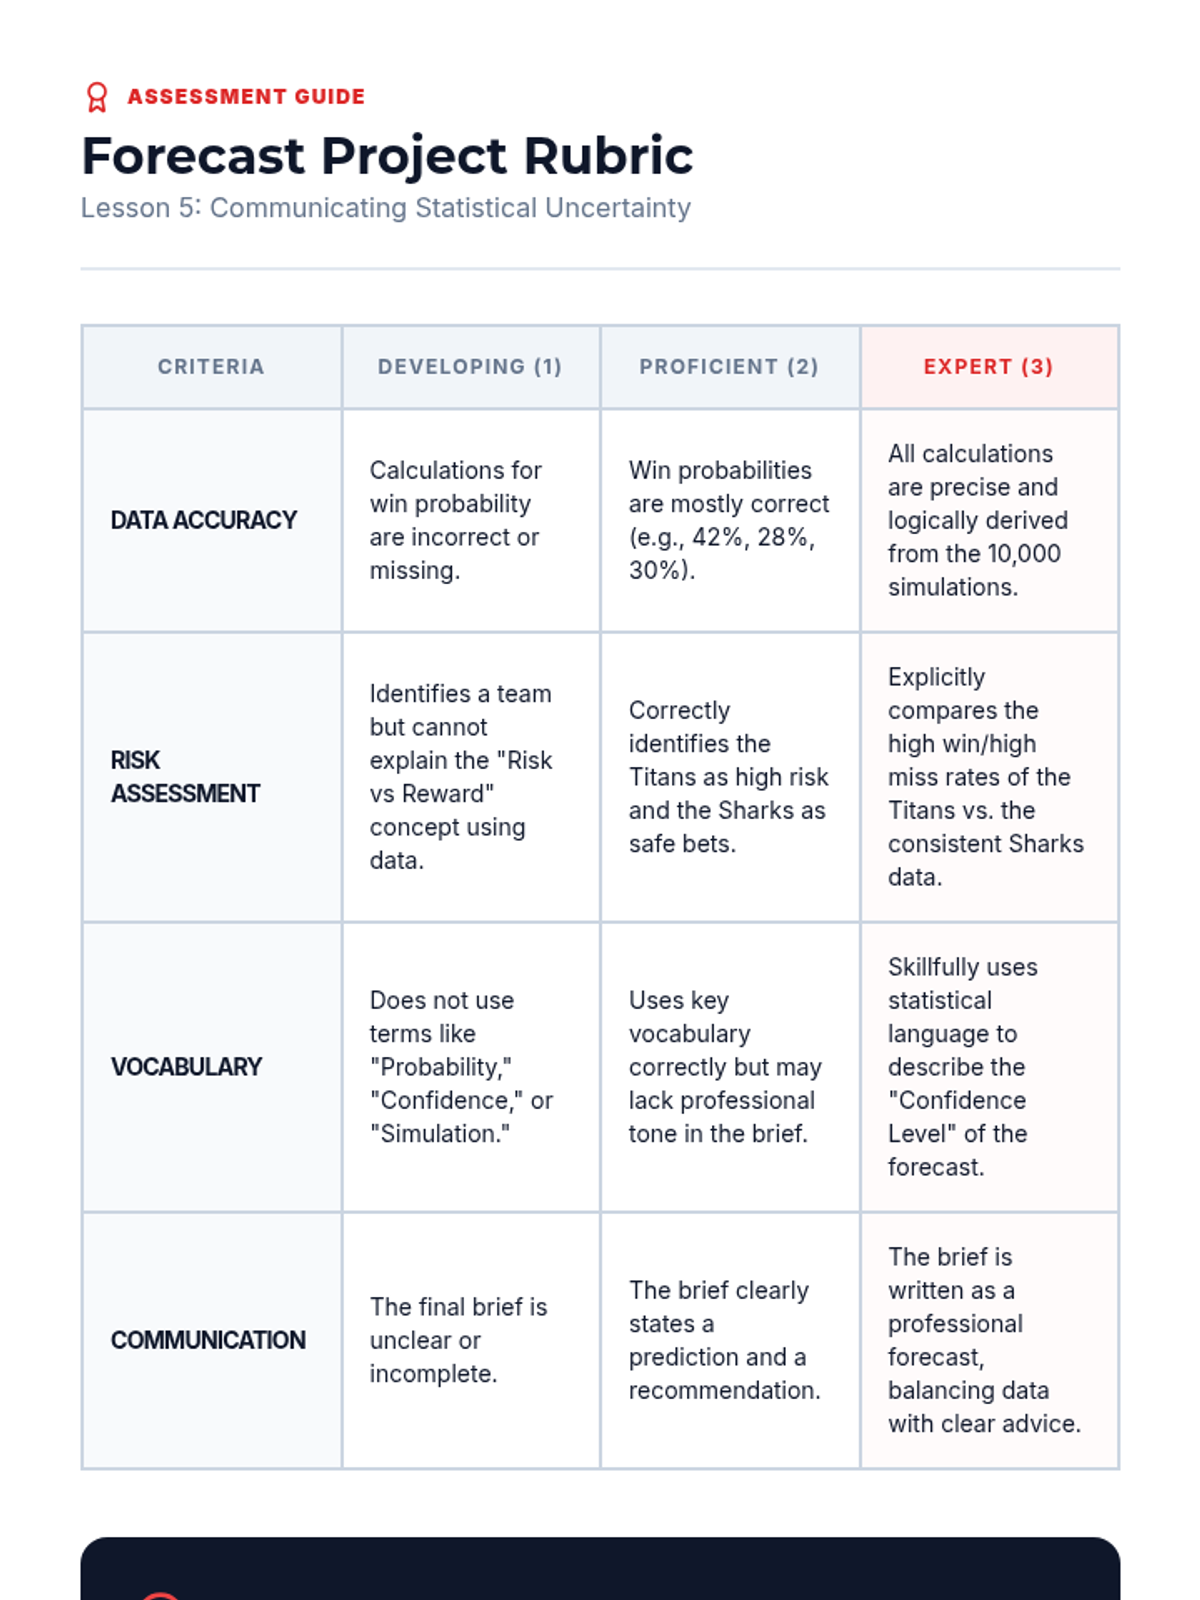
Students explore how digital simulations run thousands of trials to create forecasts with confidence levels, like weather or sports models.
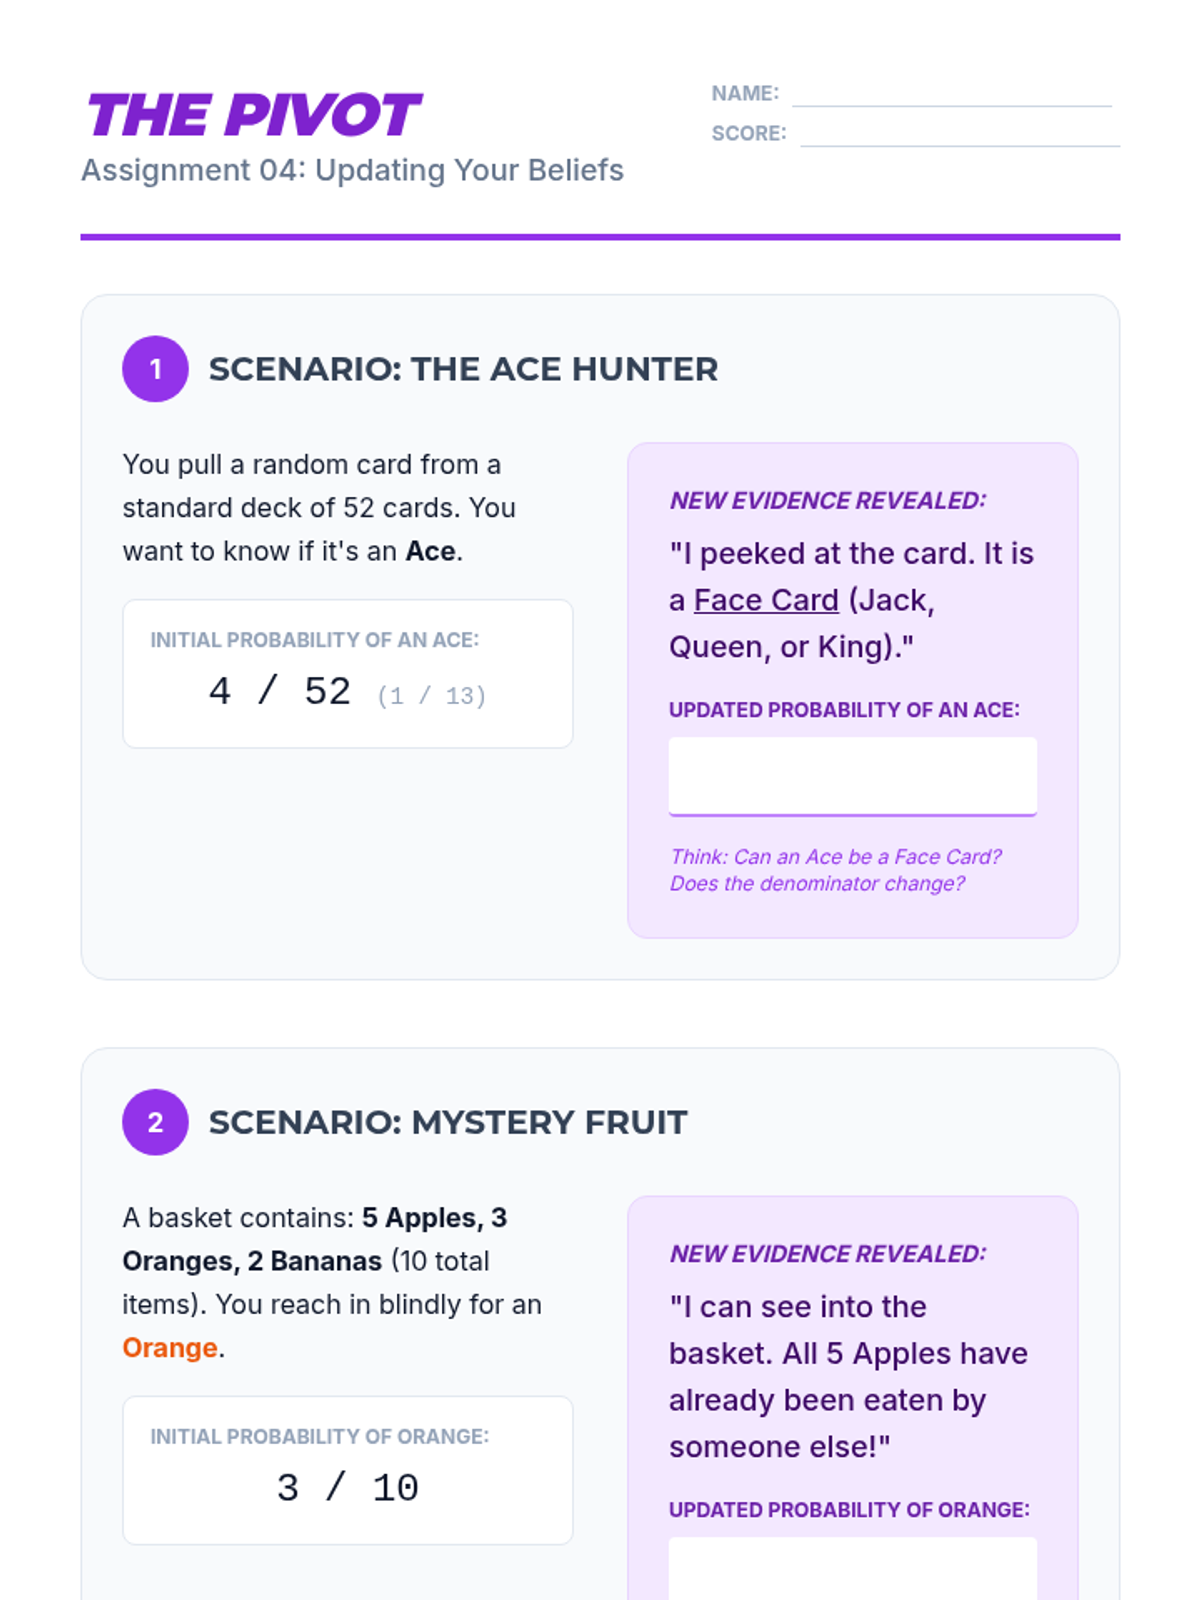
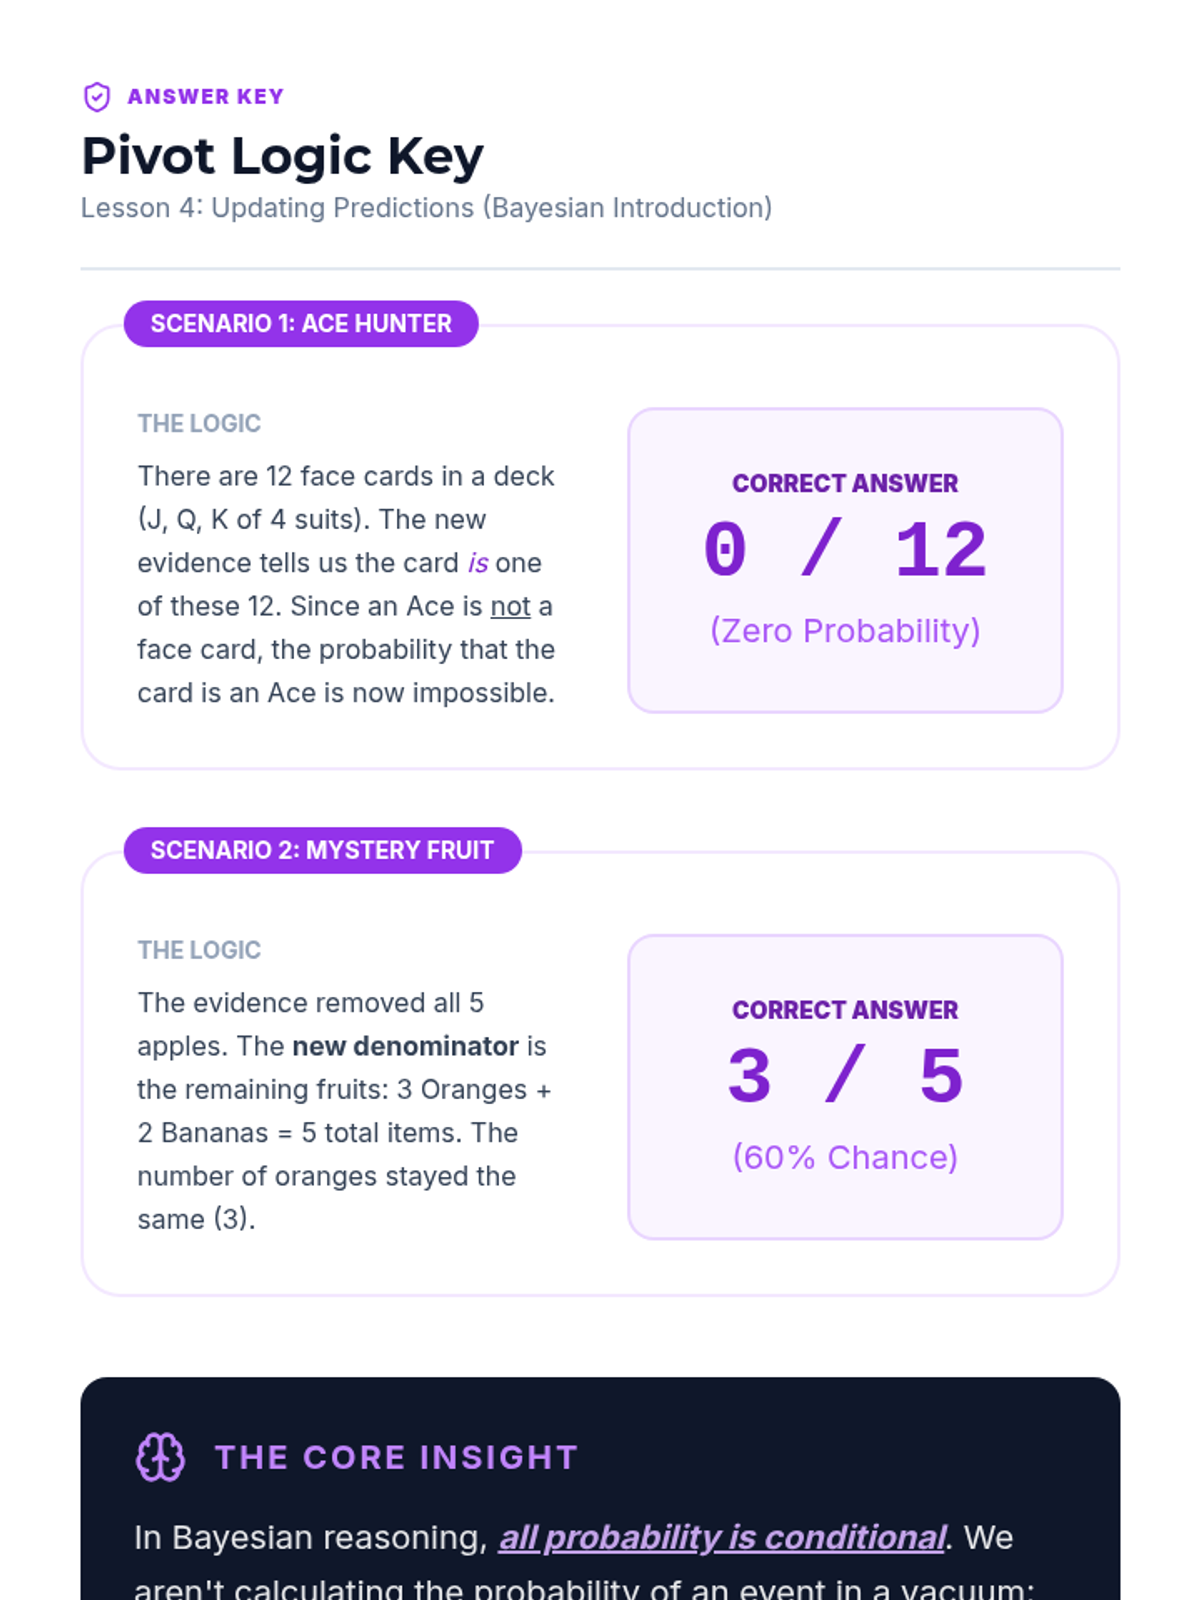
An introduction to updating probabilities based on new evidence, teaching students to pivot their predictions when conditions change.
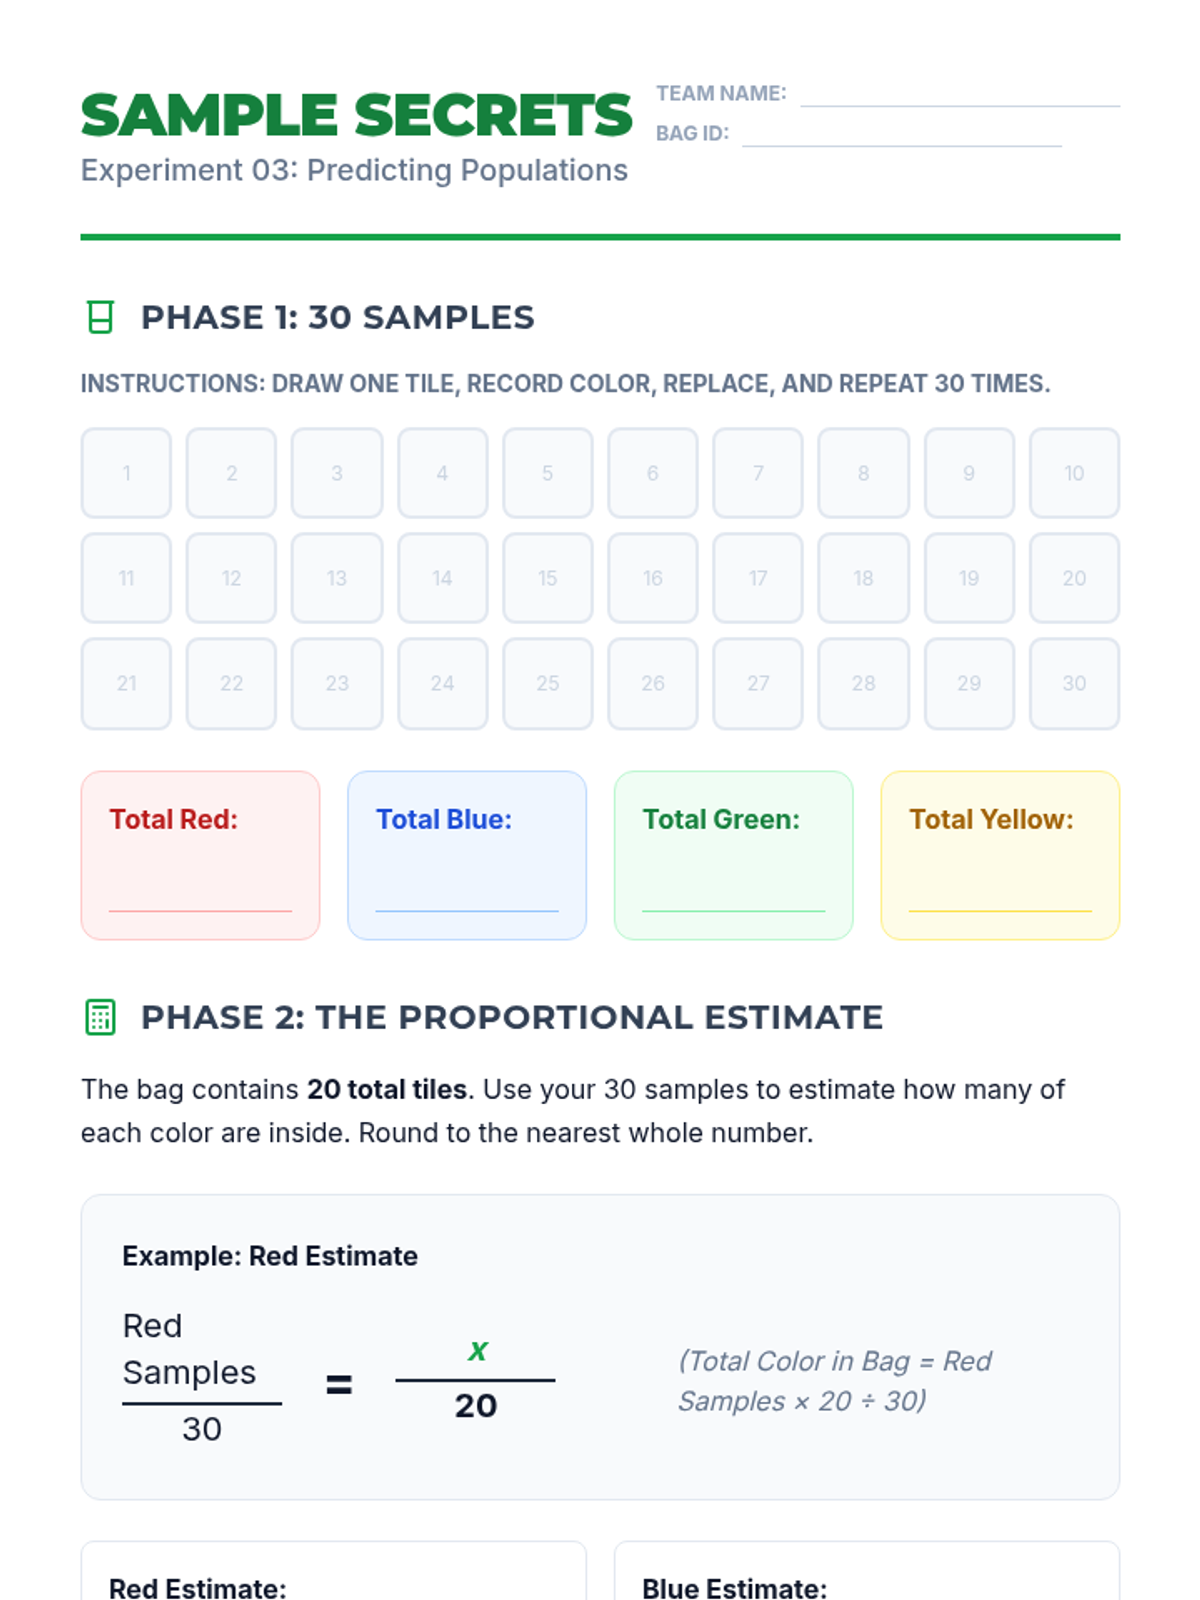
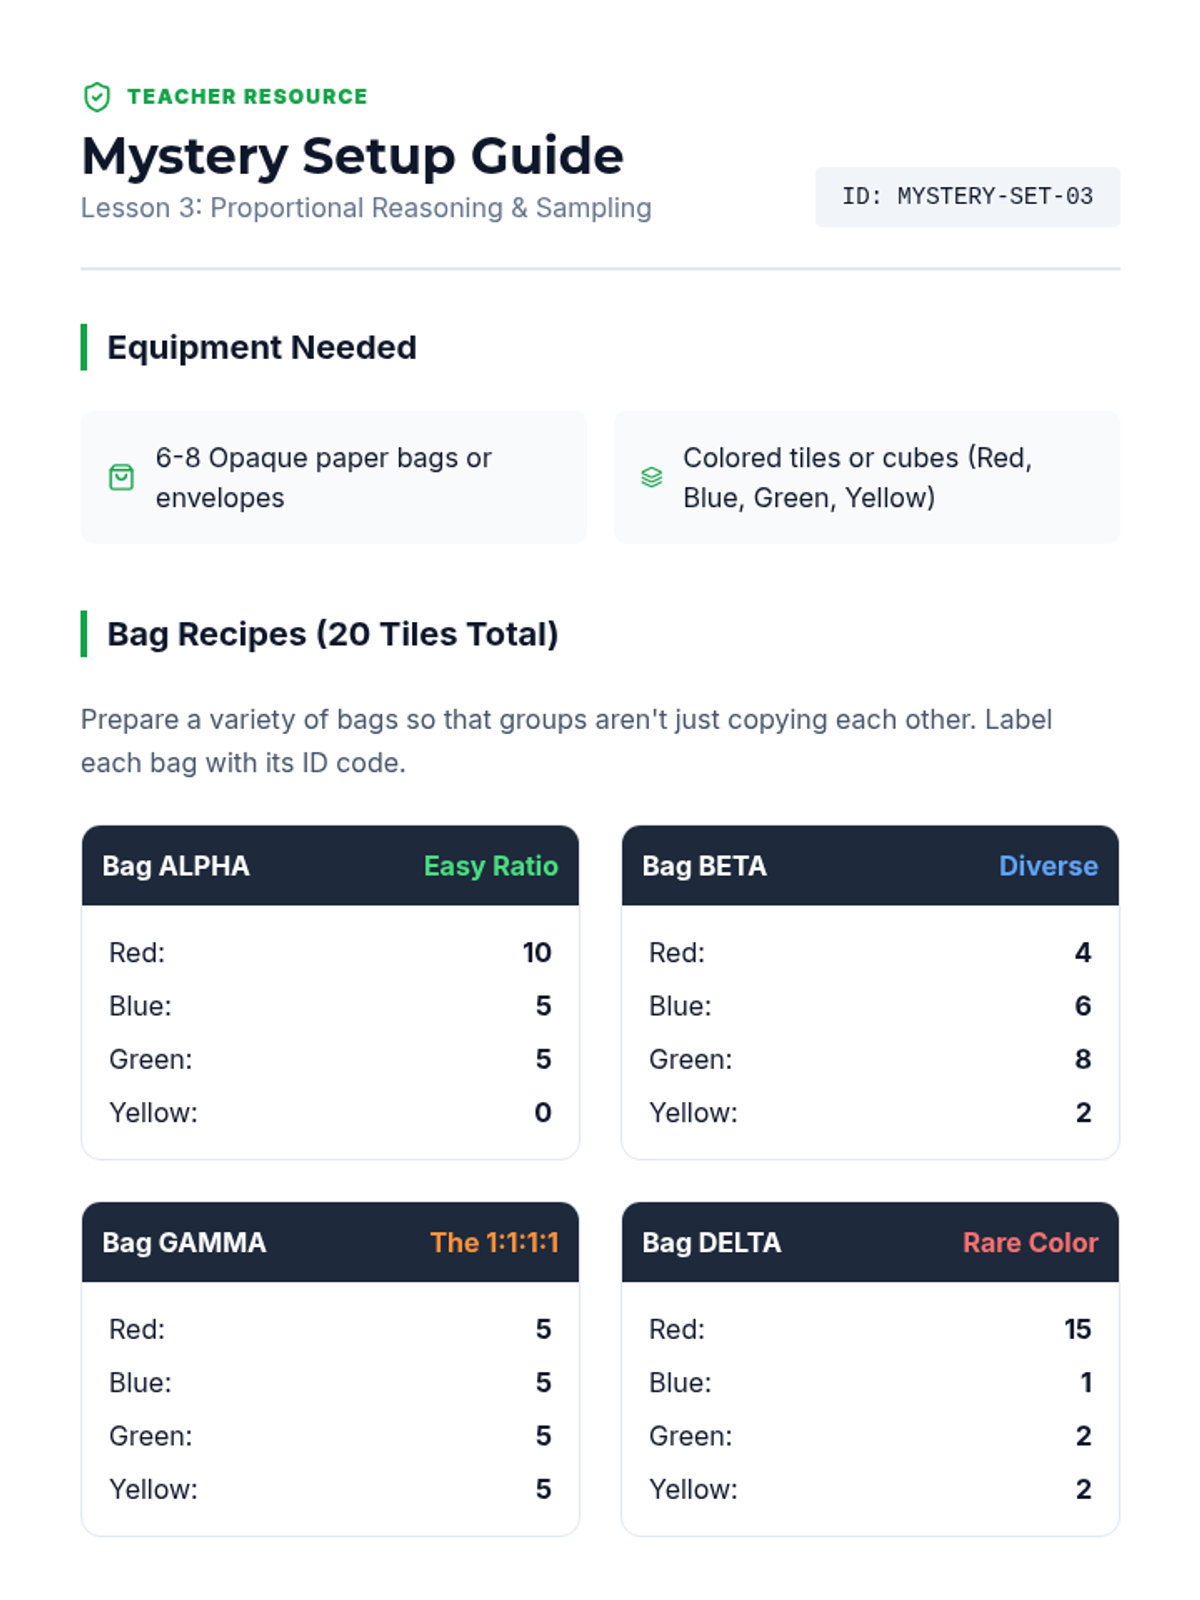
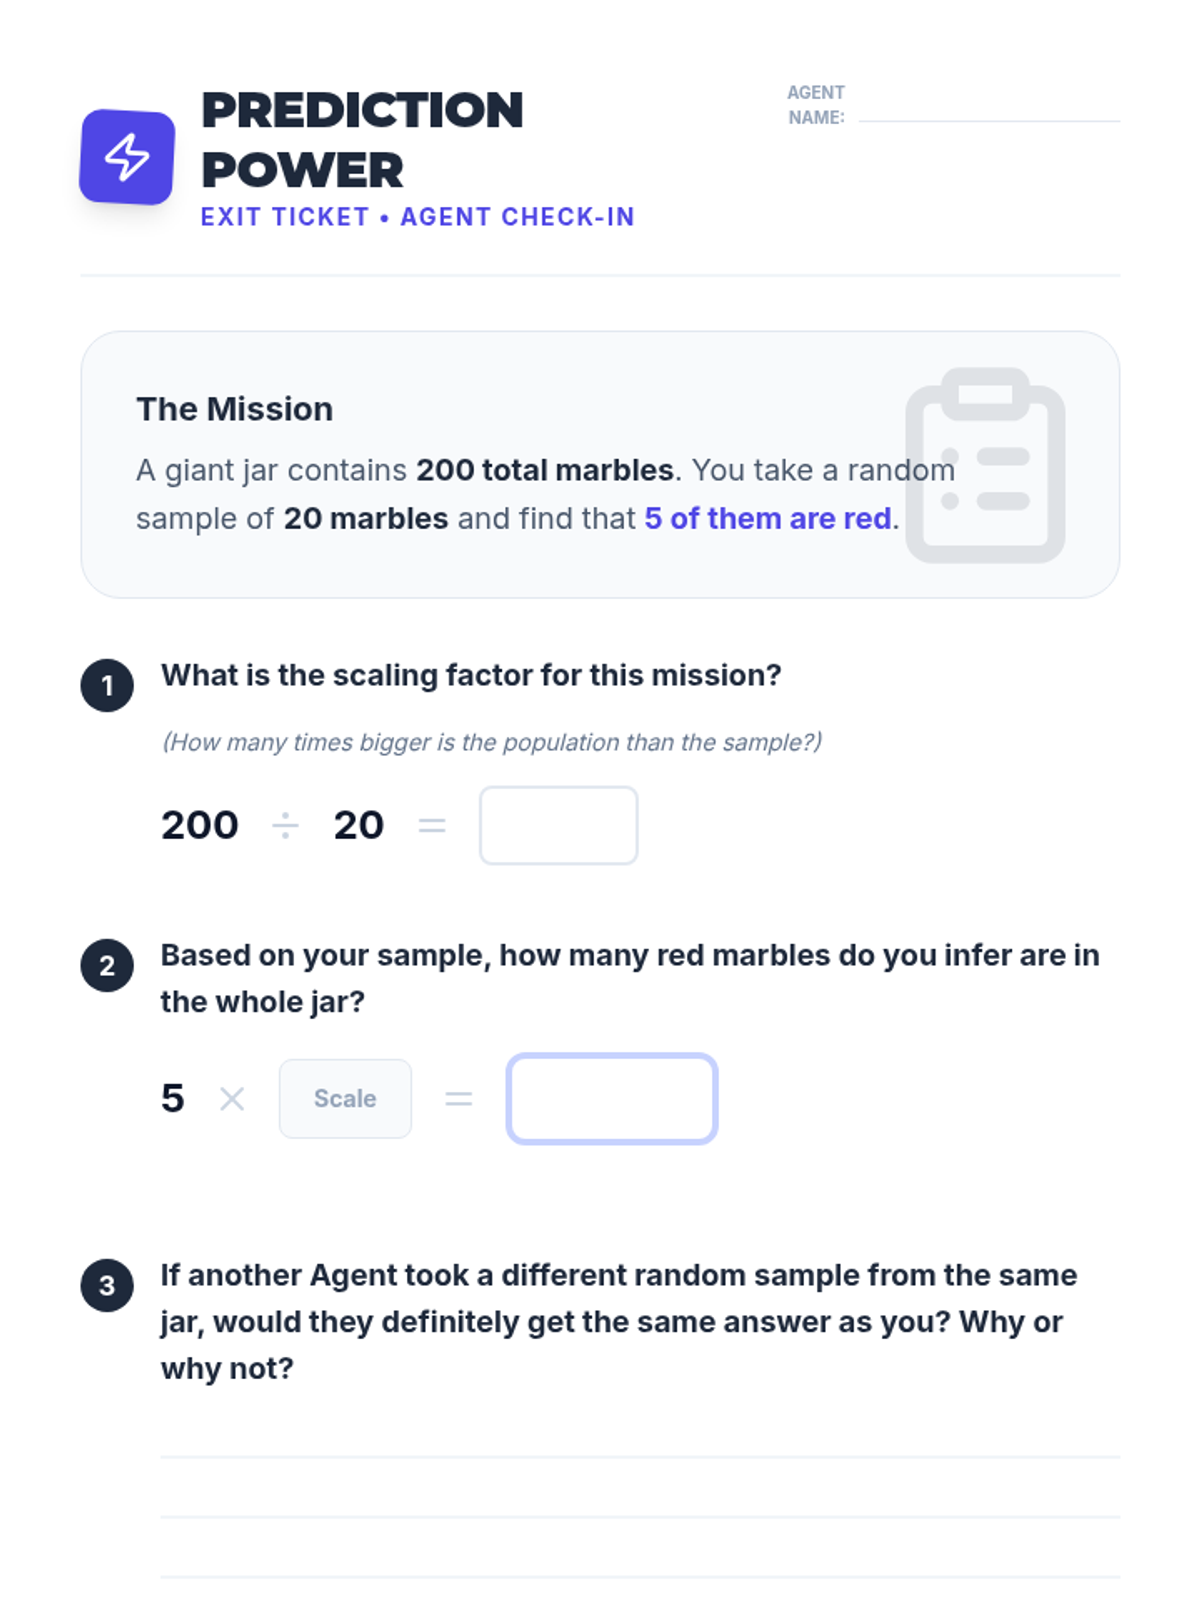
Students use samples from 'mystery bags' to estimate the total population of items, applying proportional reasoning to real-world data.
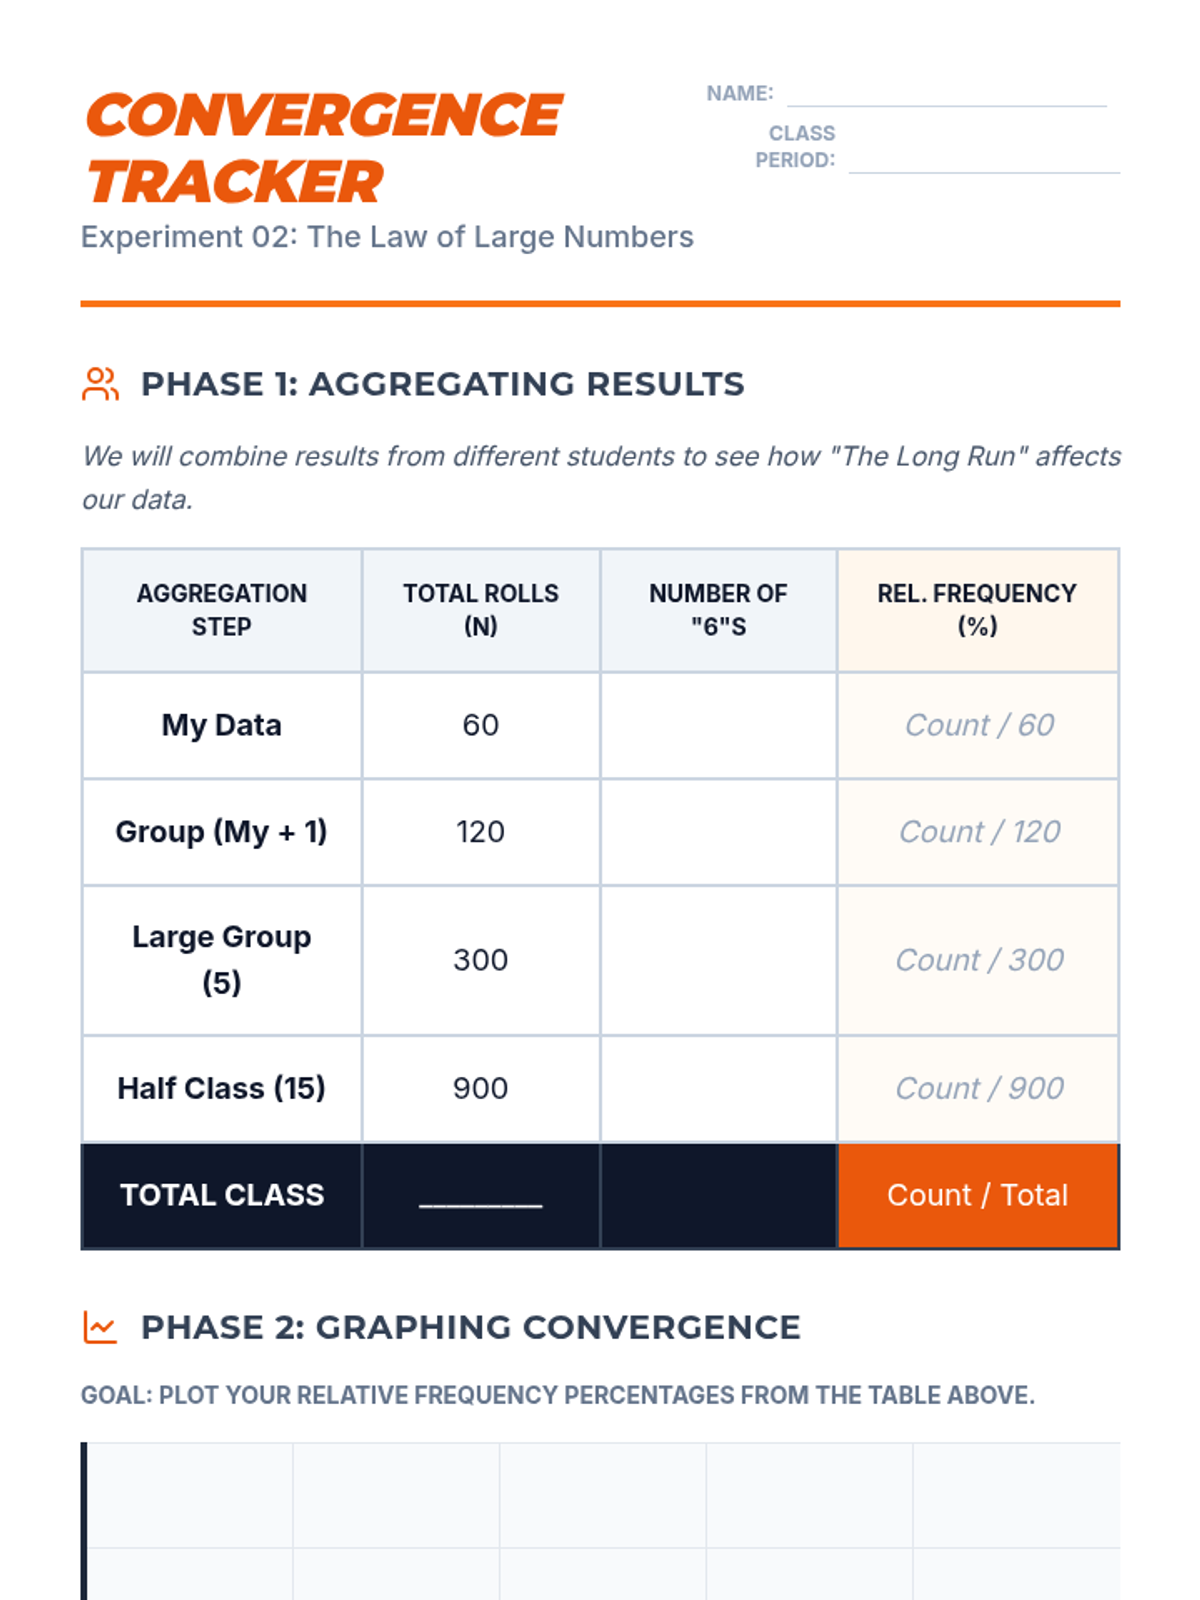
Students aggregate class data to observe how relative frequency converges on theoretical probability as the number of trials increases, illustrating the Law of Large Numbers.
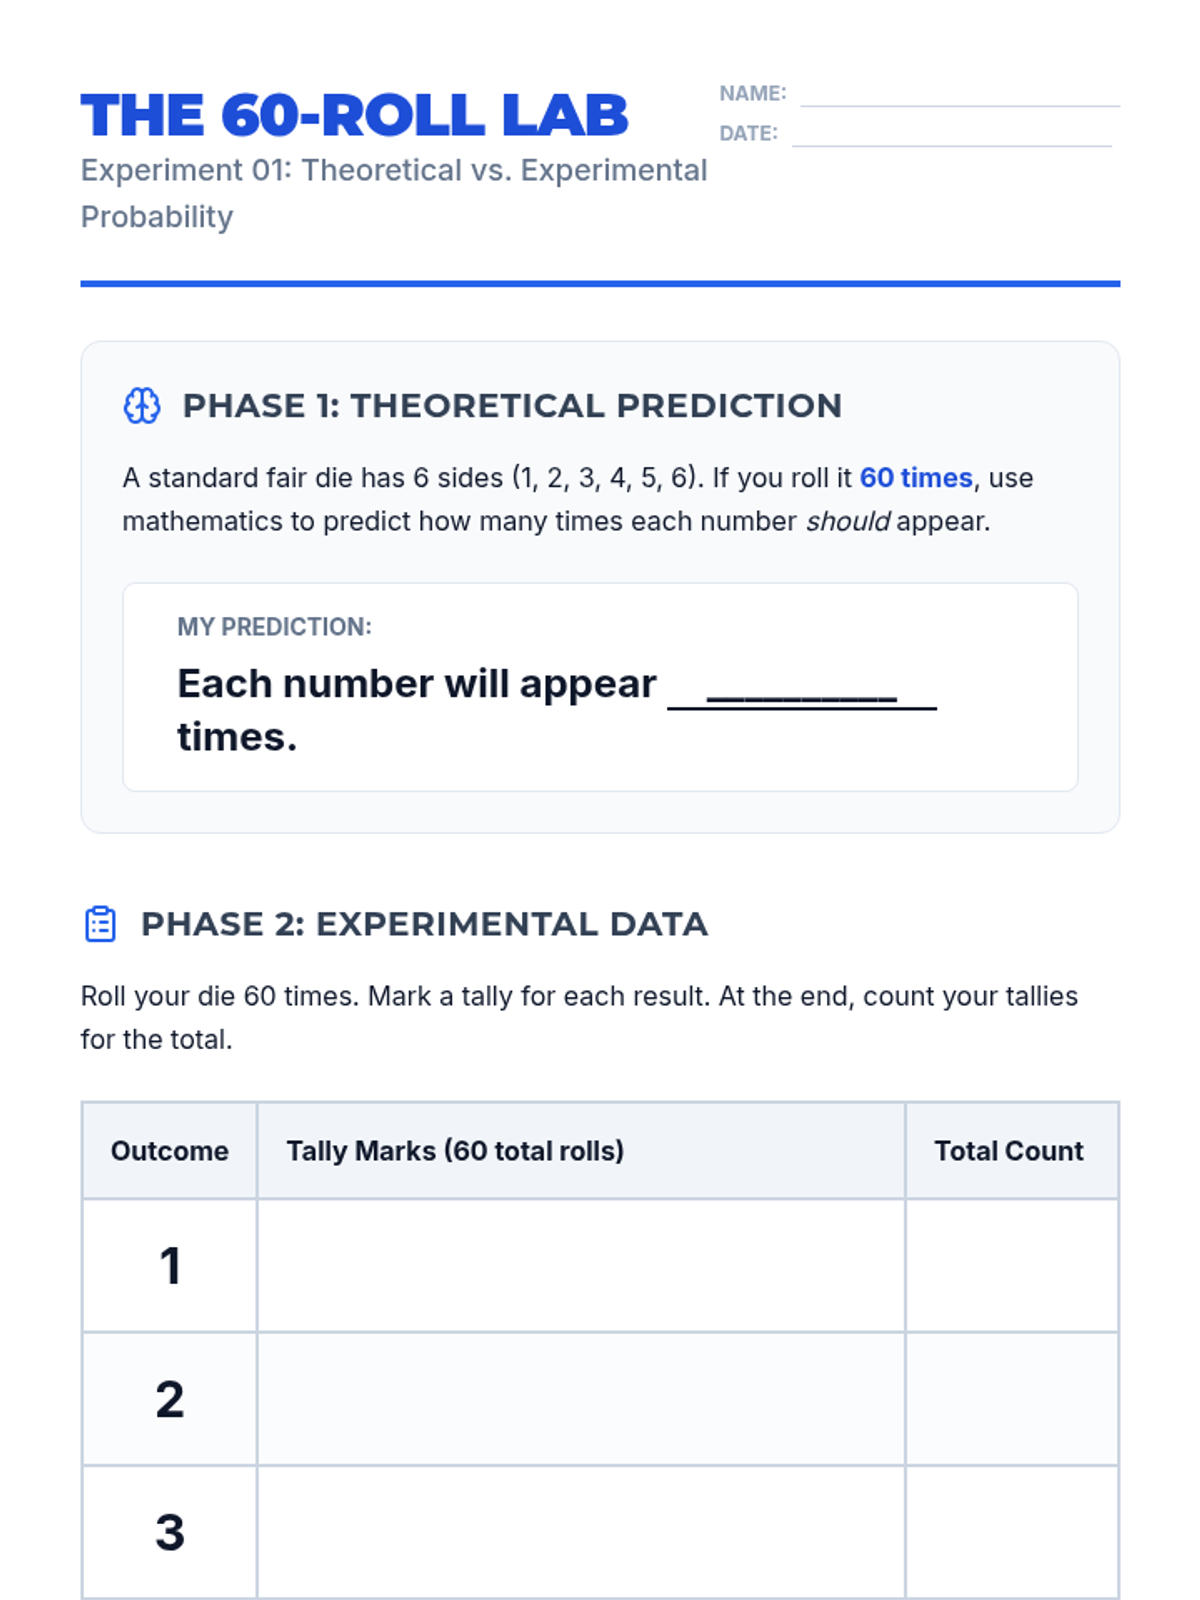
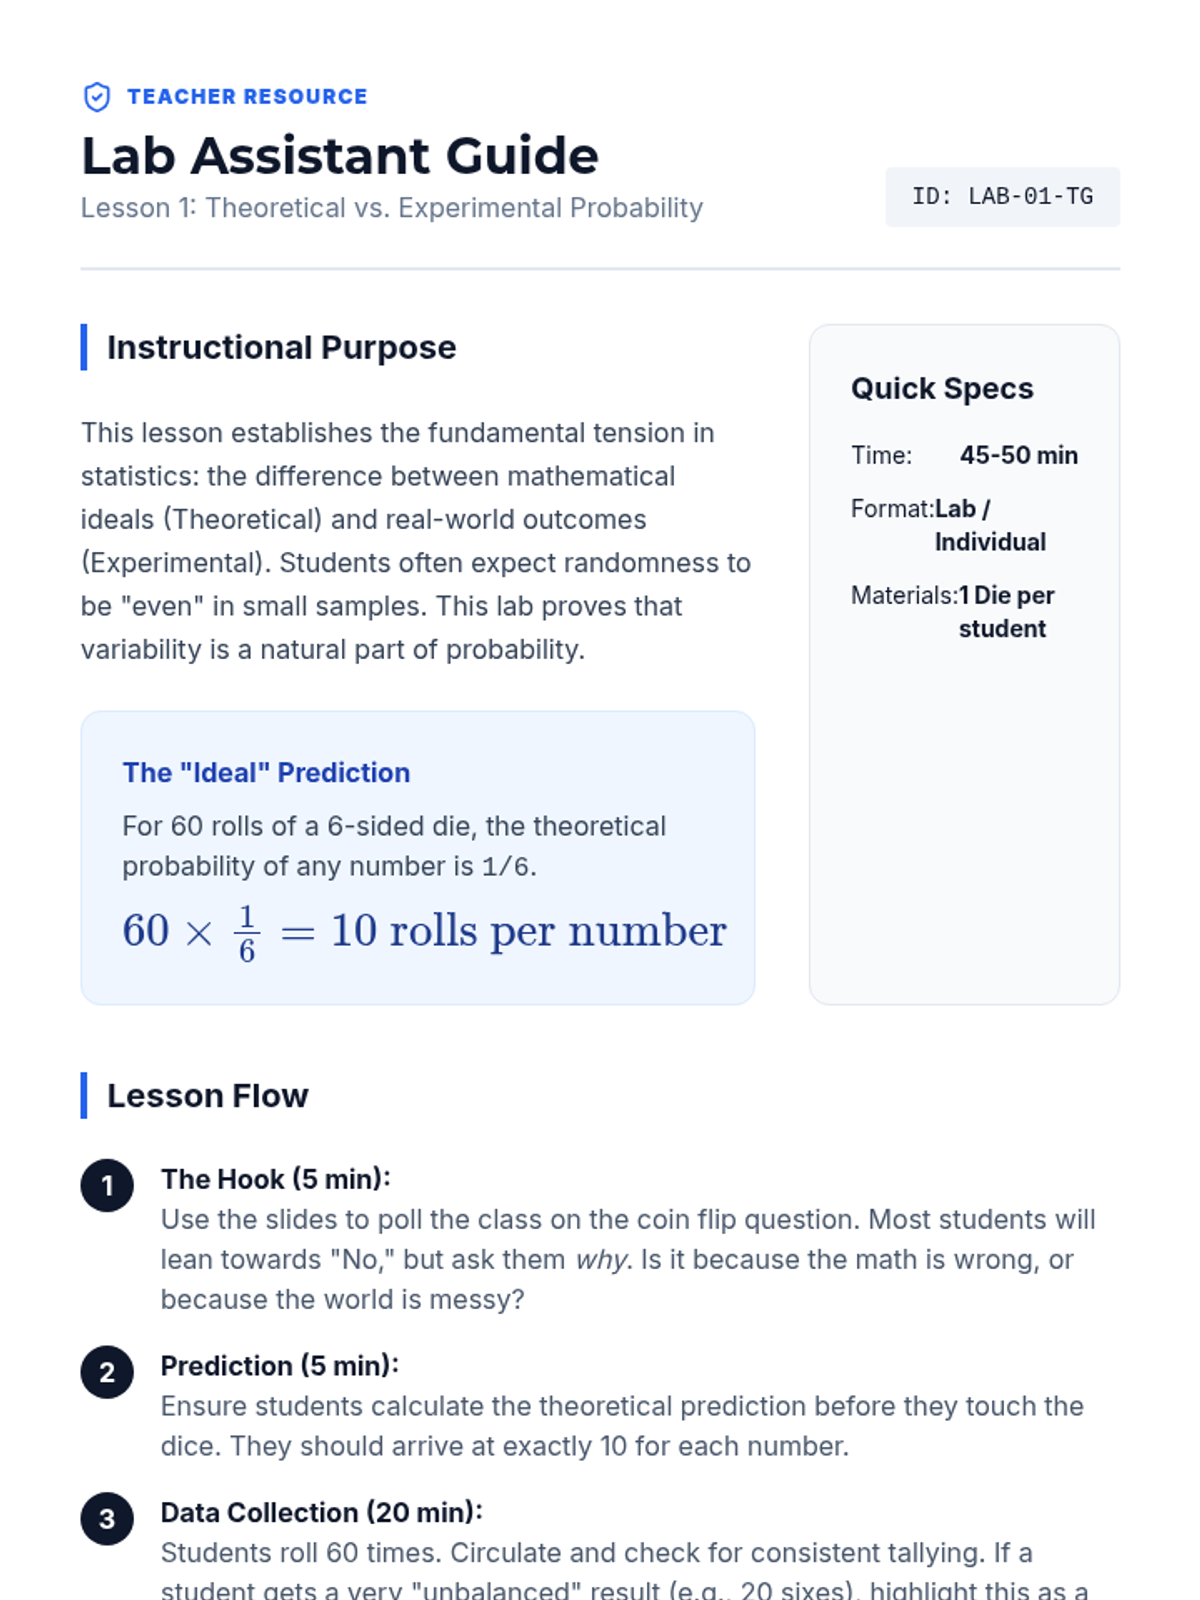
Students compare theoretical and experimental probability by rolling dice and analyzing why real-world results differ from mathematical predictions.
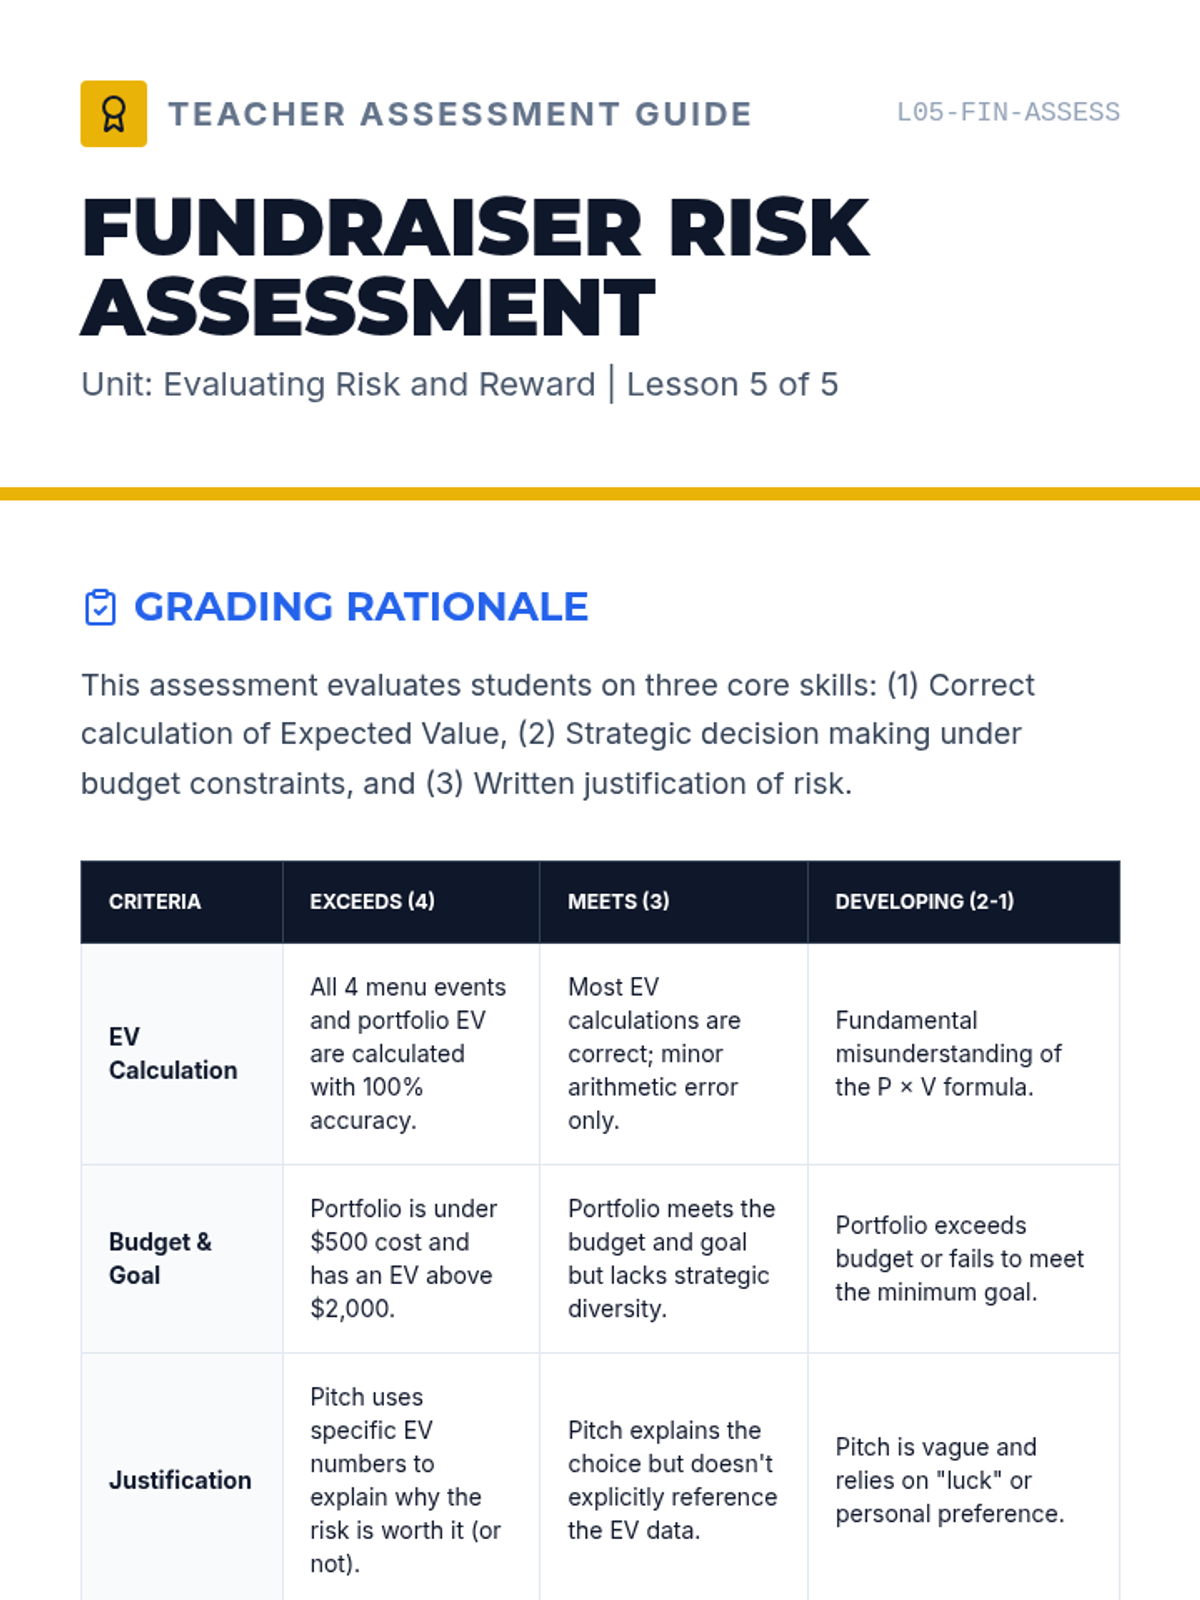
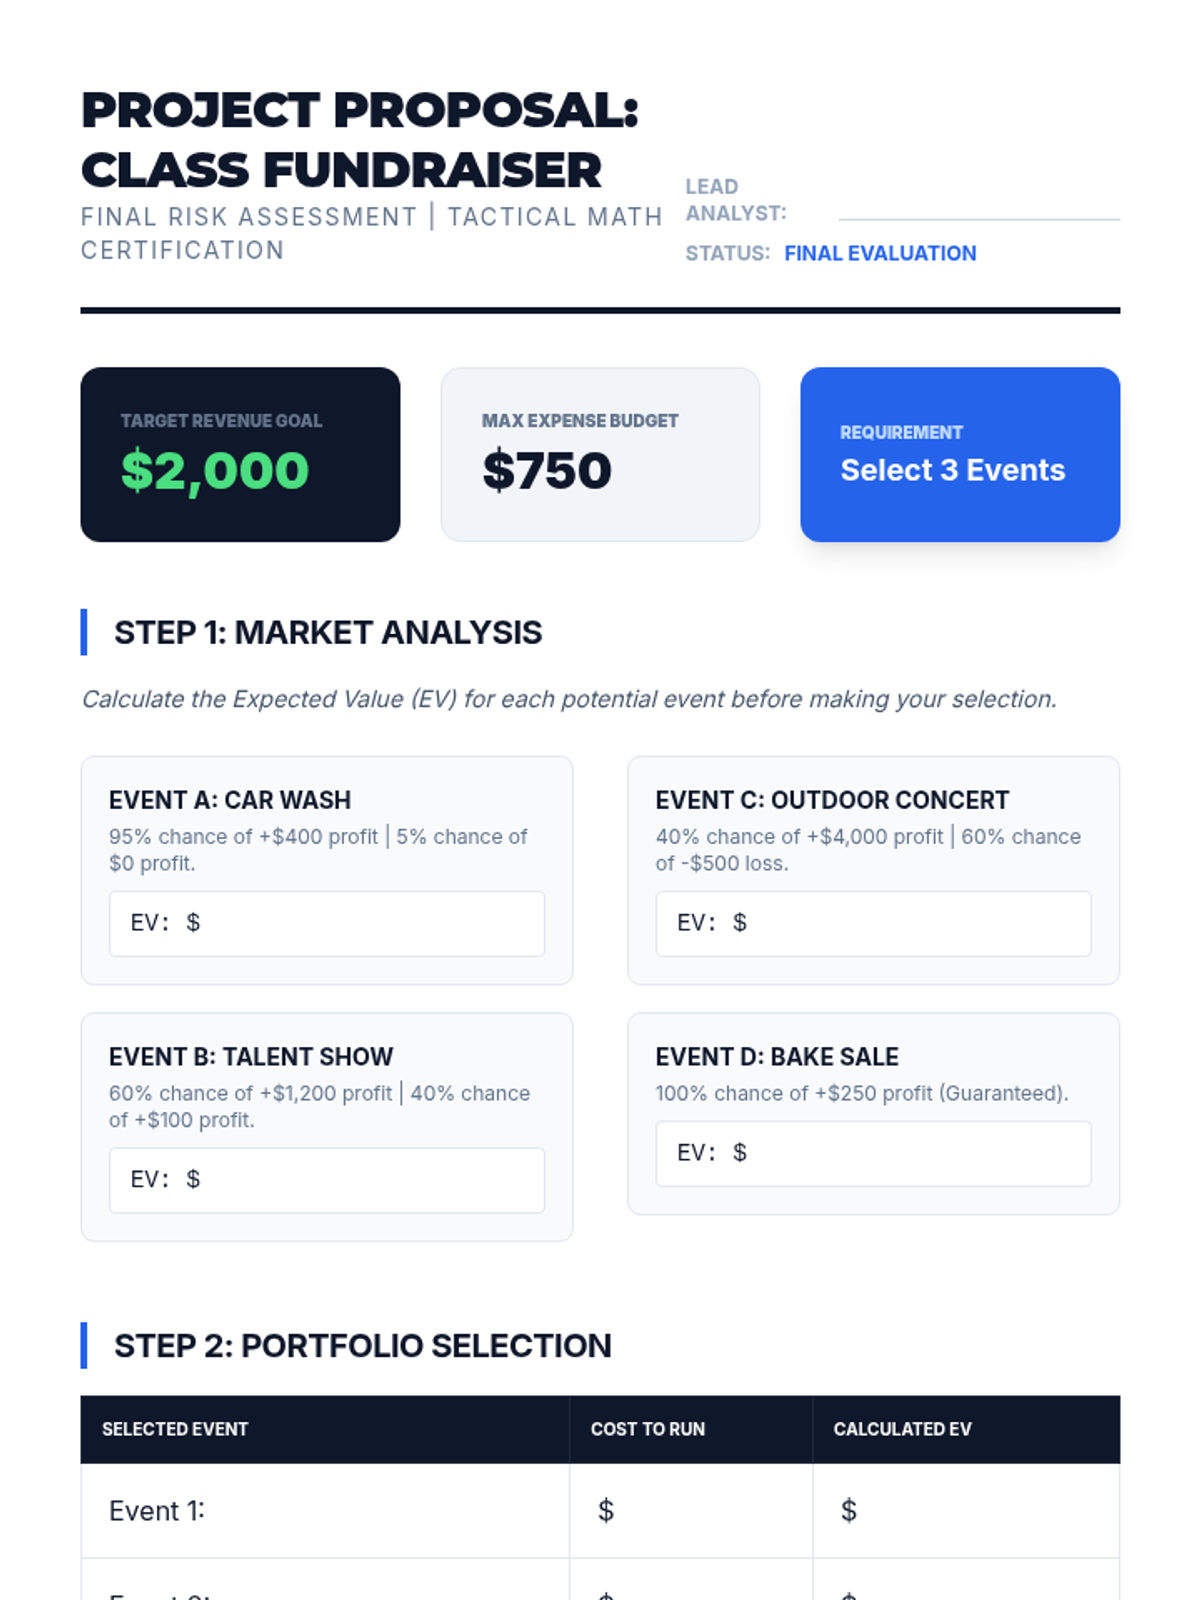
Students evaluate investment opportunities to build a portfolio that maximizes return within a specific risk budget.
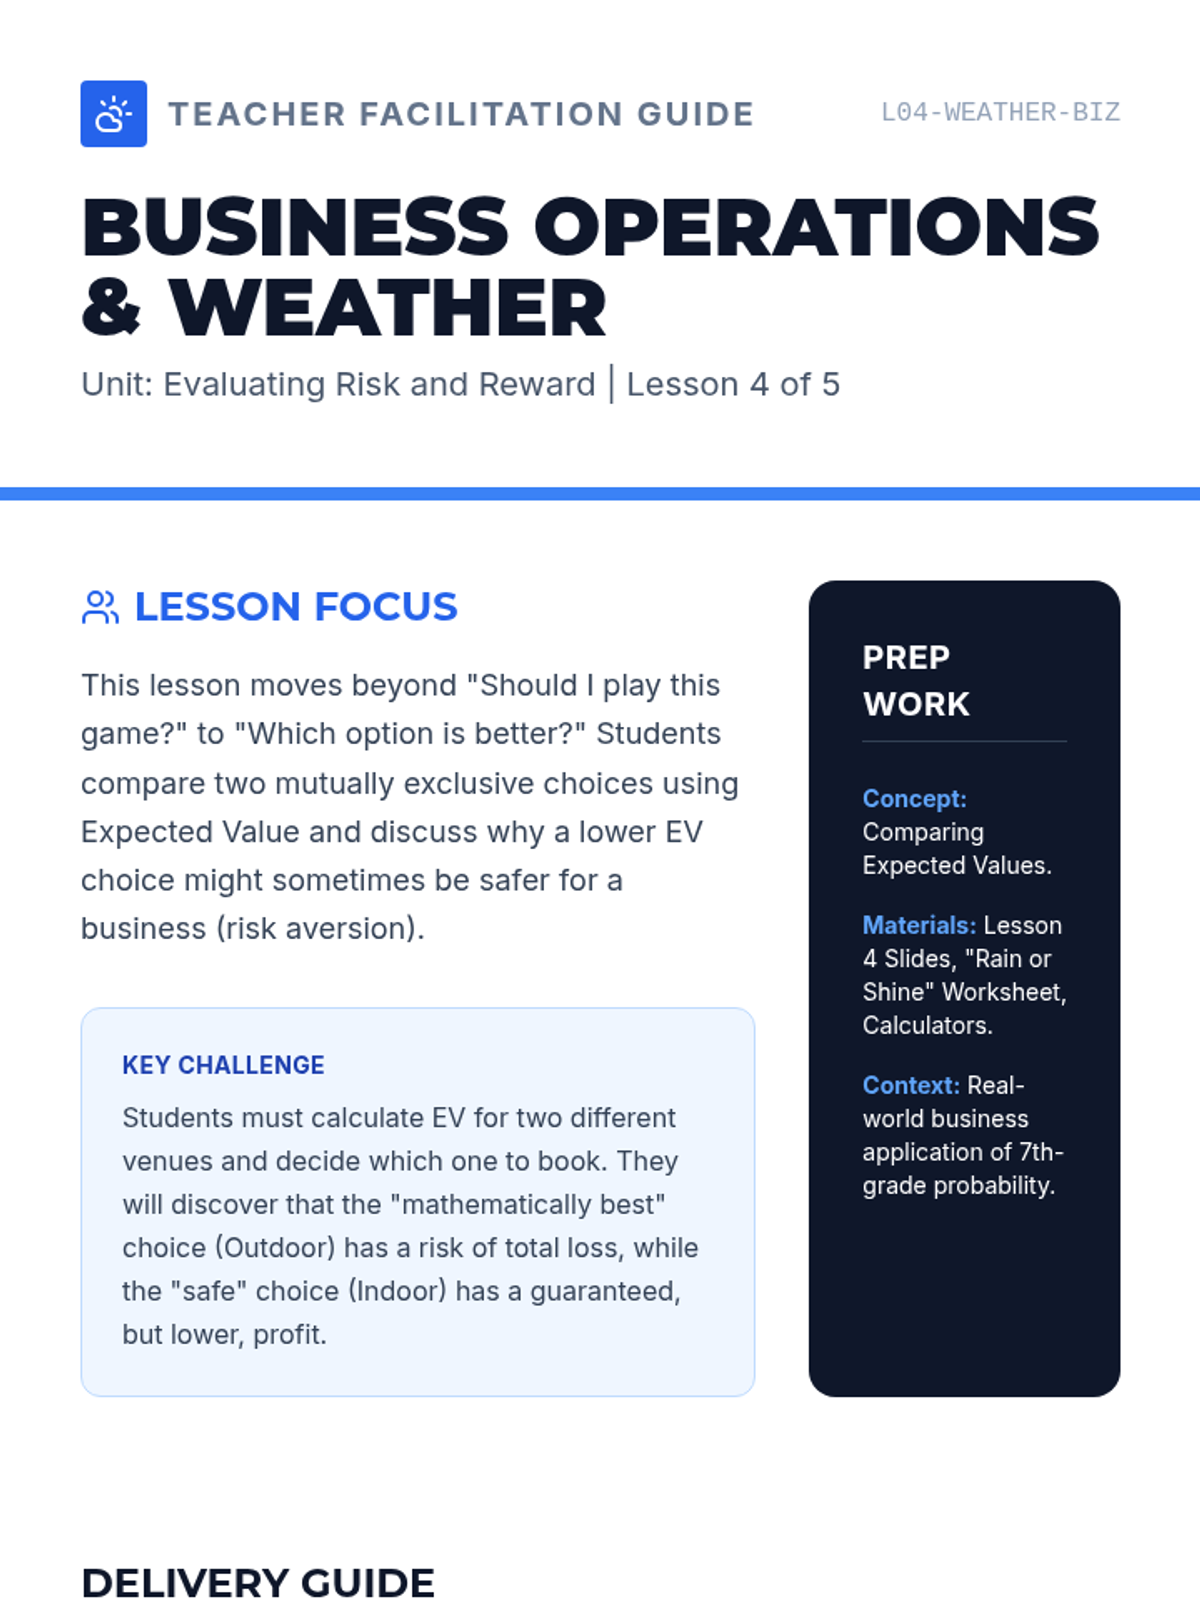
Applying expected value to business scenarios, specifically choosing between indoor and outdoor event venues based on weather forecasts.
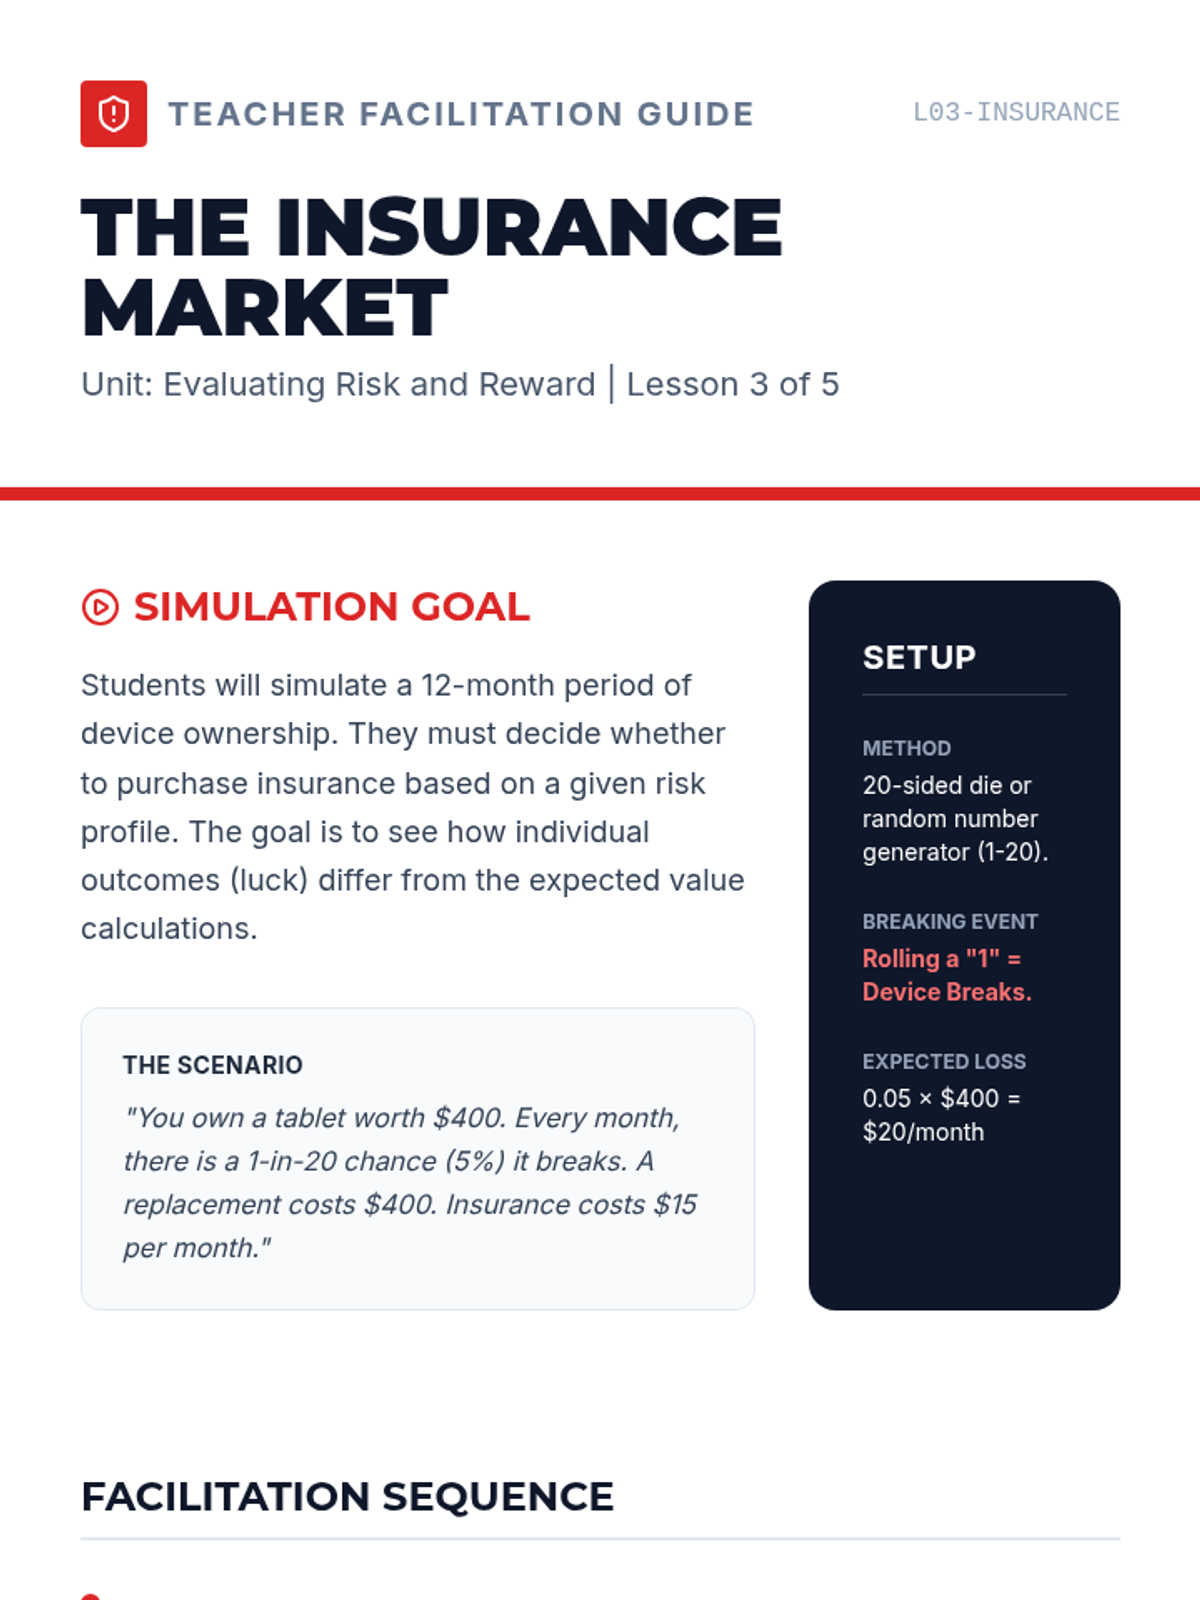
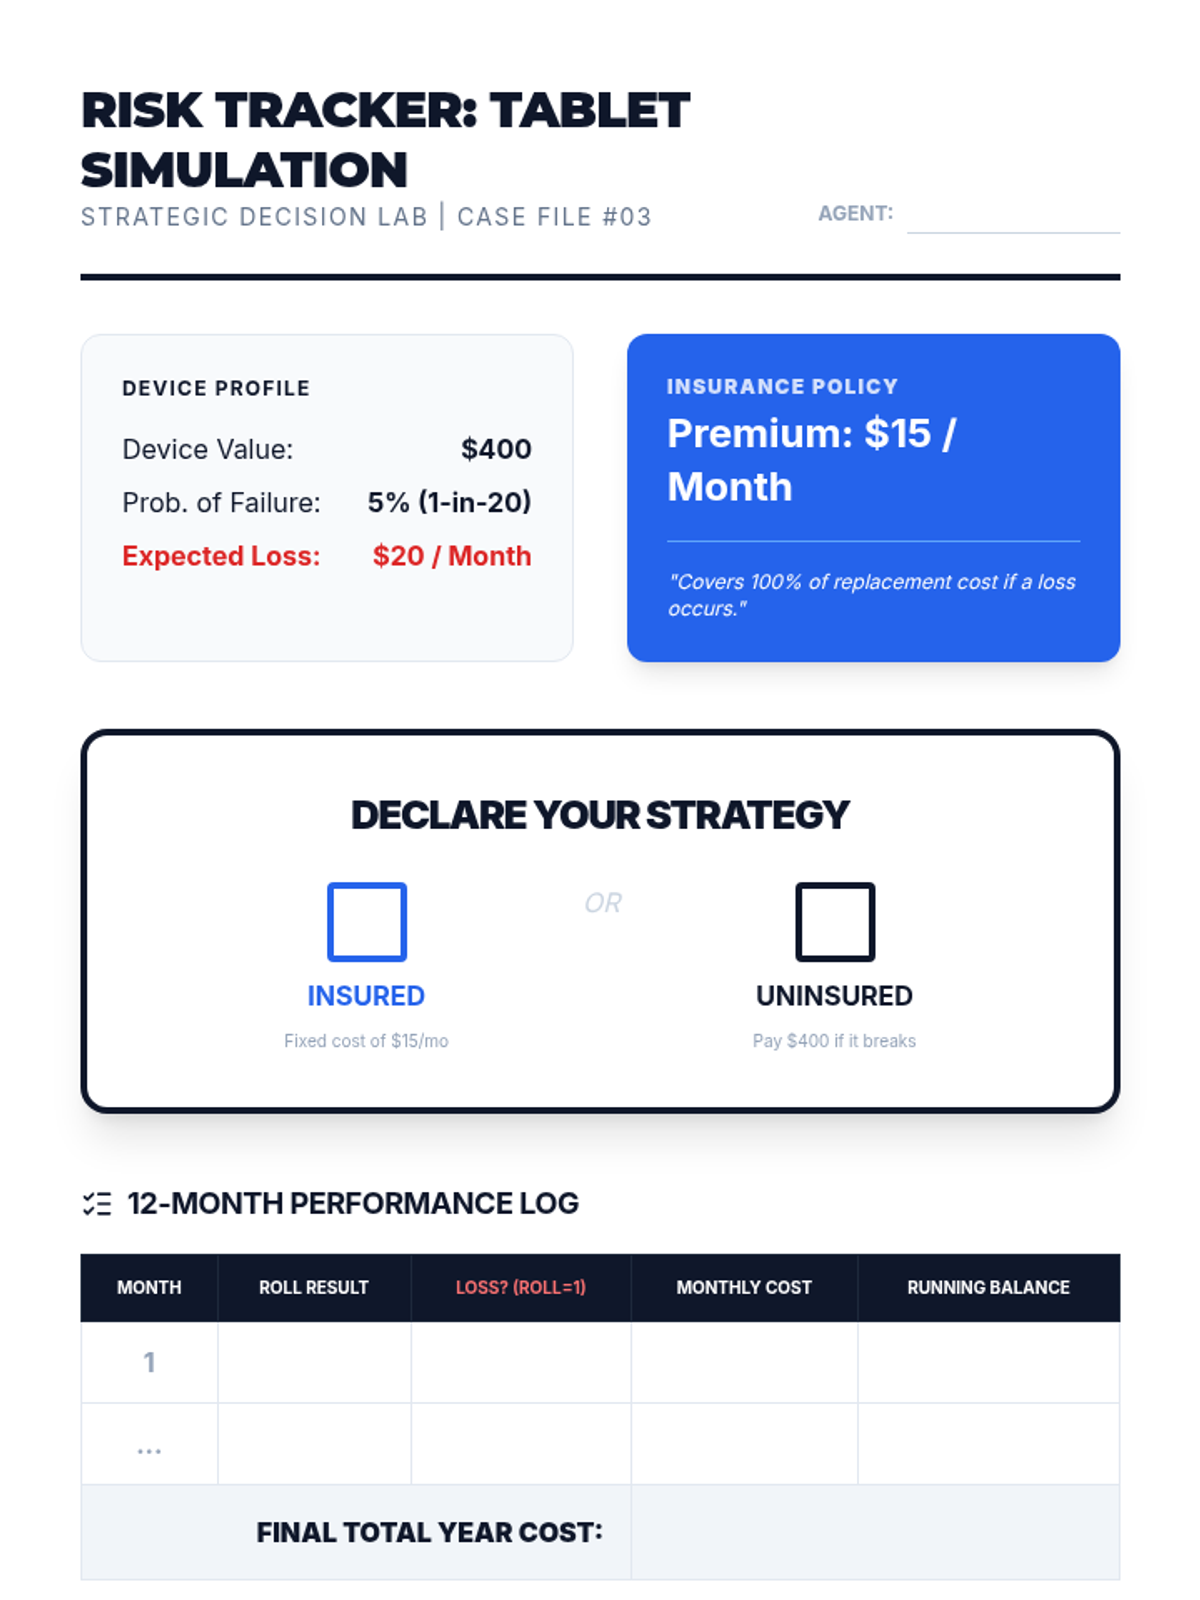
A simulation where students decide whether to purchase insurance for a device based on risk probability and replacement costs.
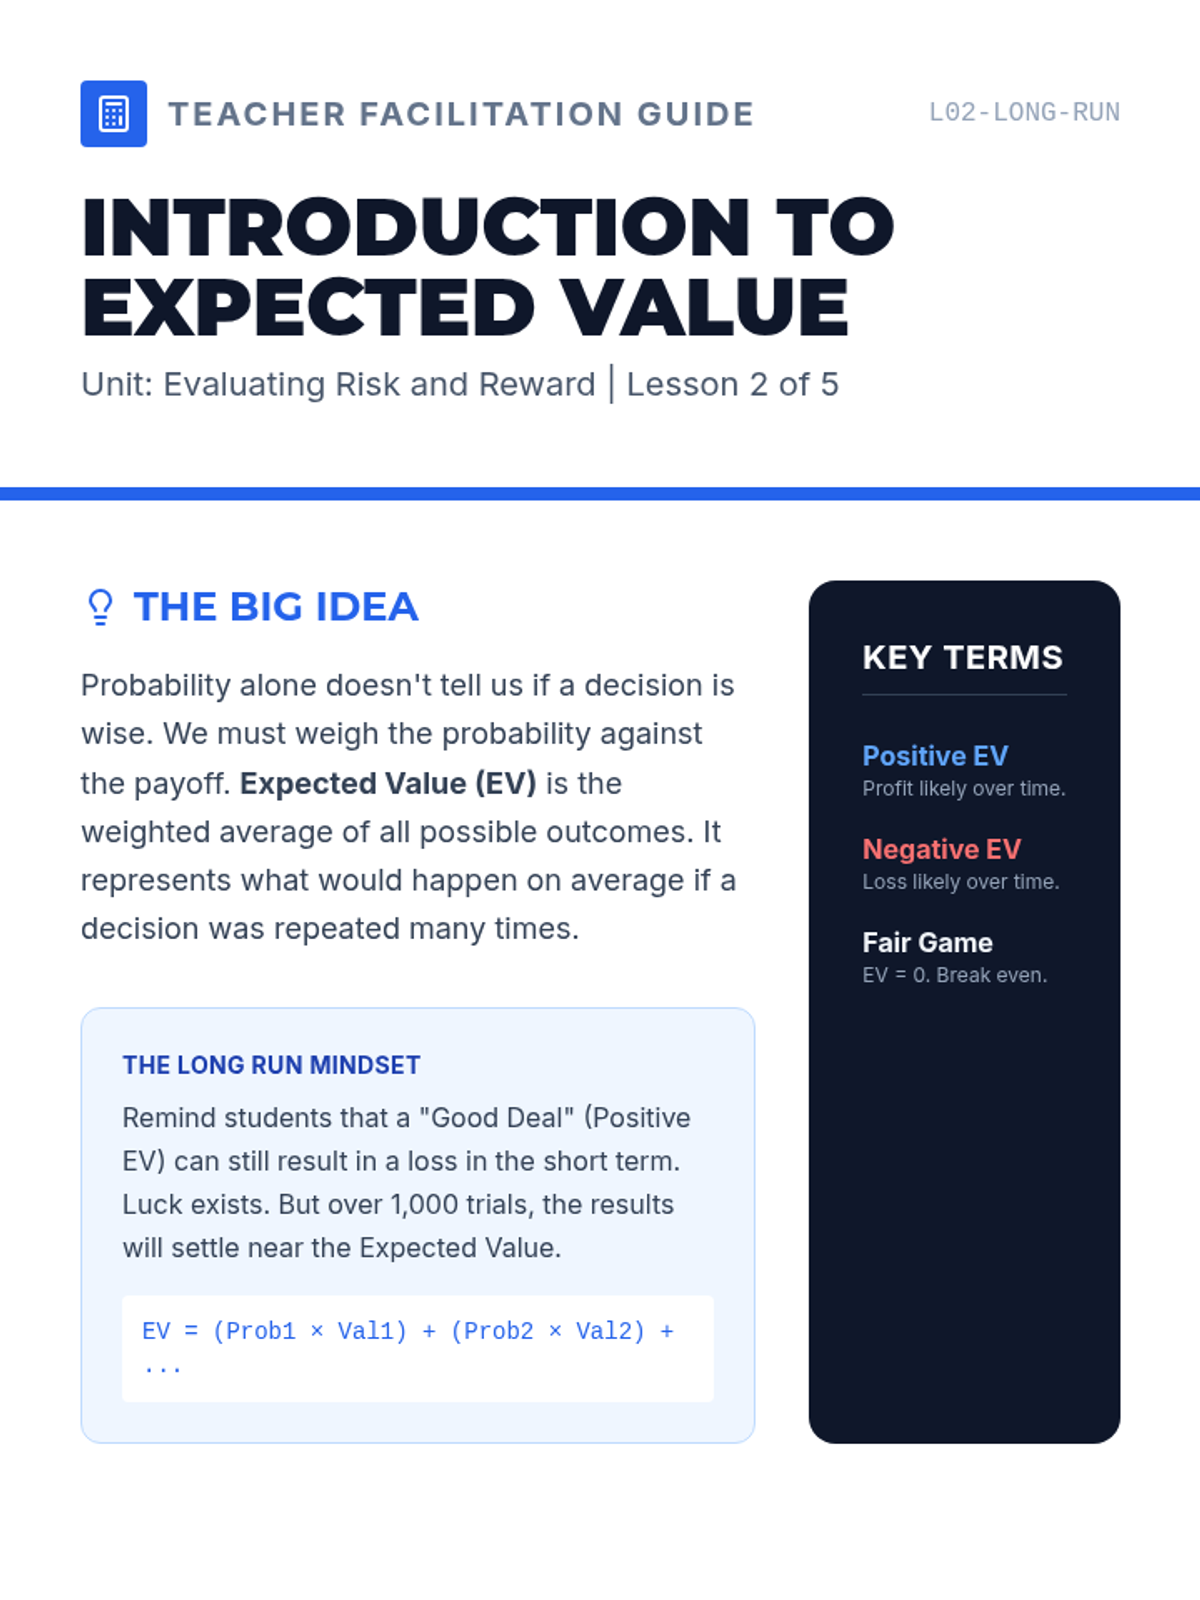
Introduction to expected value as a long-run average, calculating simple scenarios to determine if a decision is a 'good deal.'
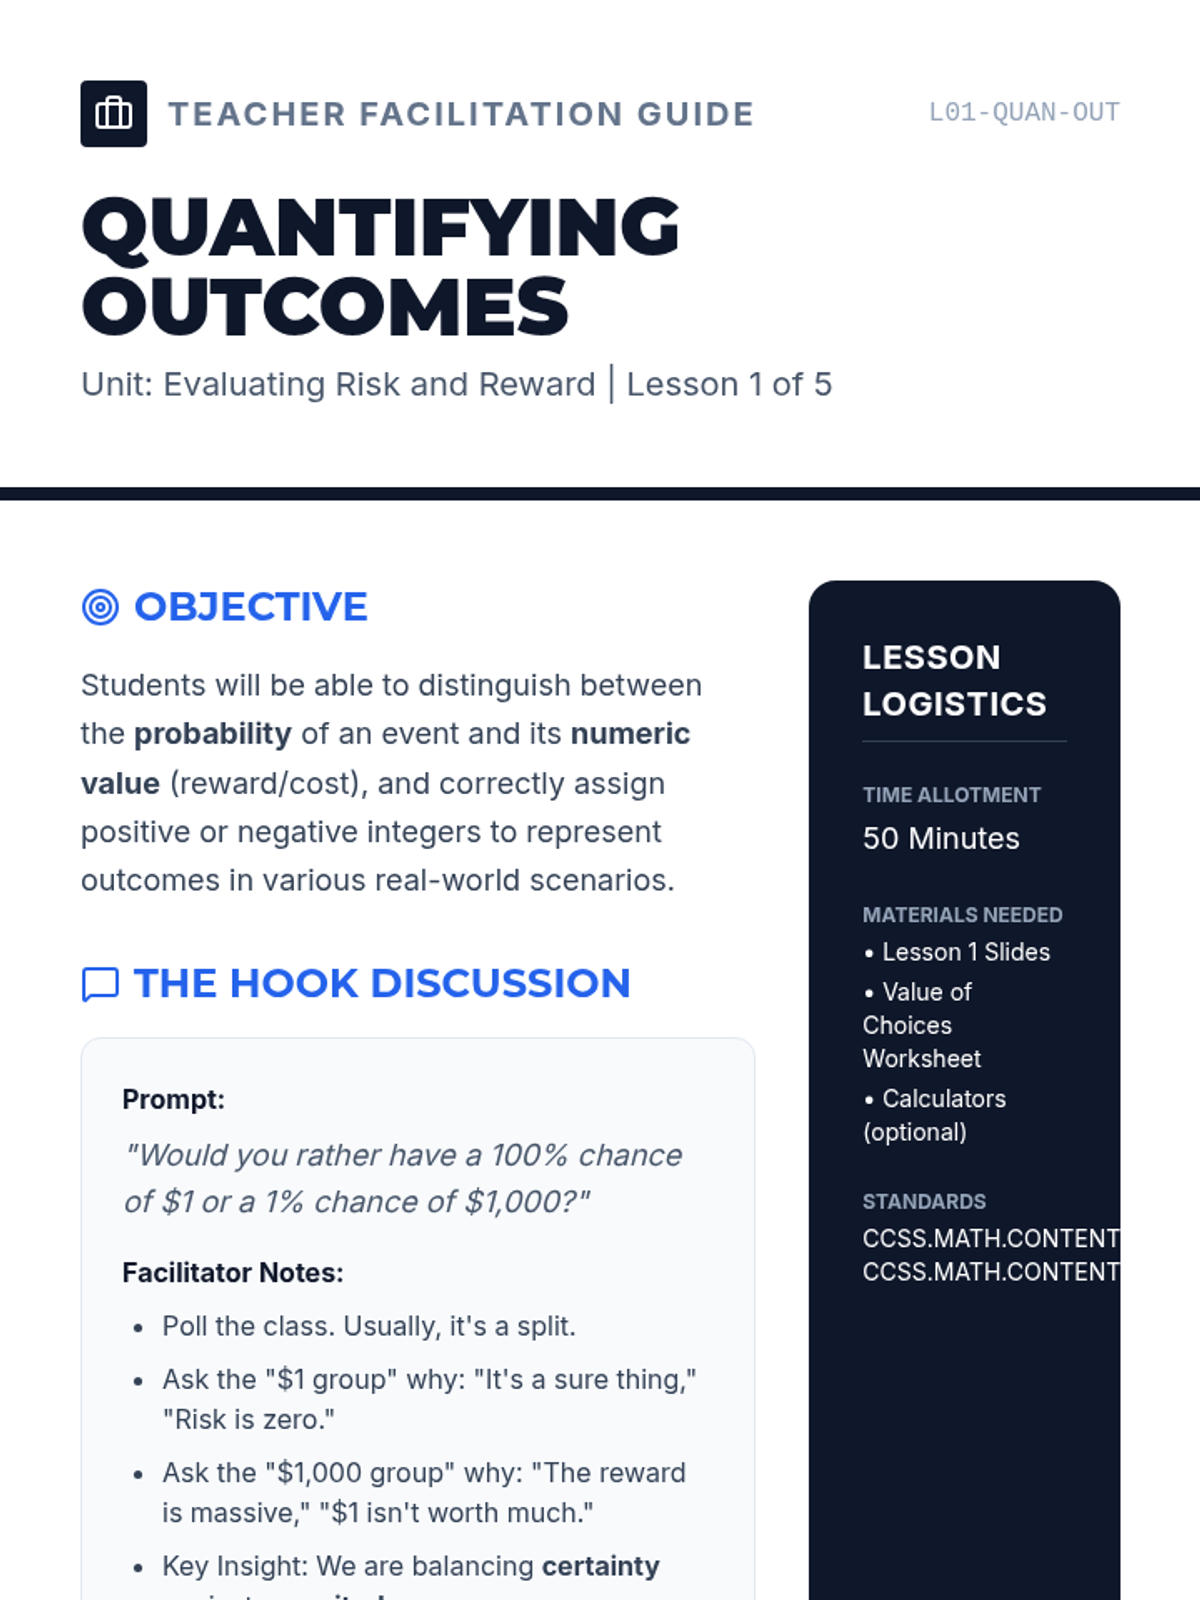
Students learn to assign numerical values to outcomes, differentiating between the probability of an event and the value of its result.
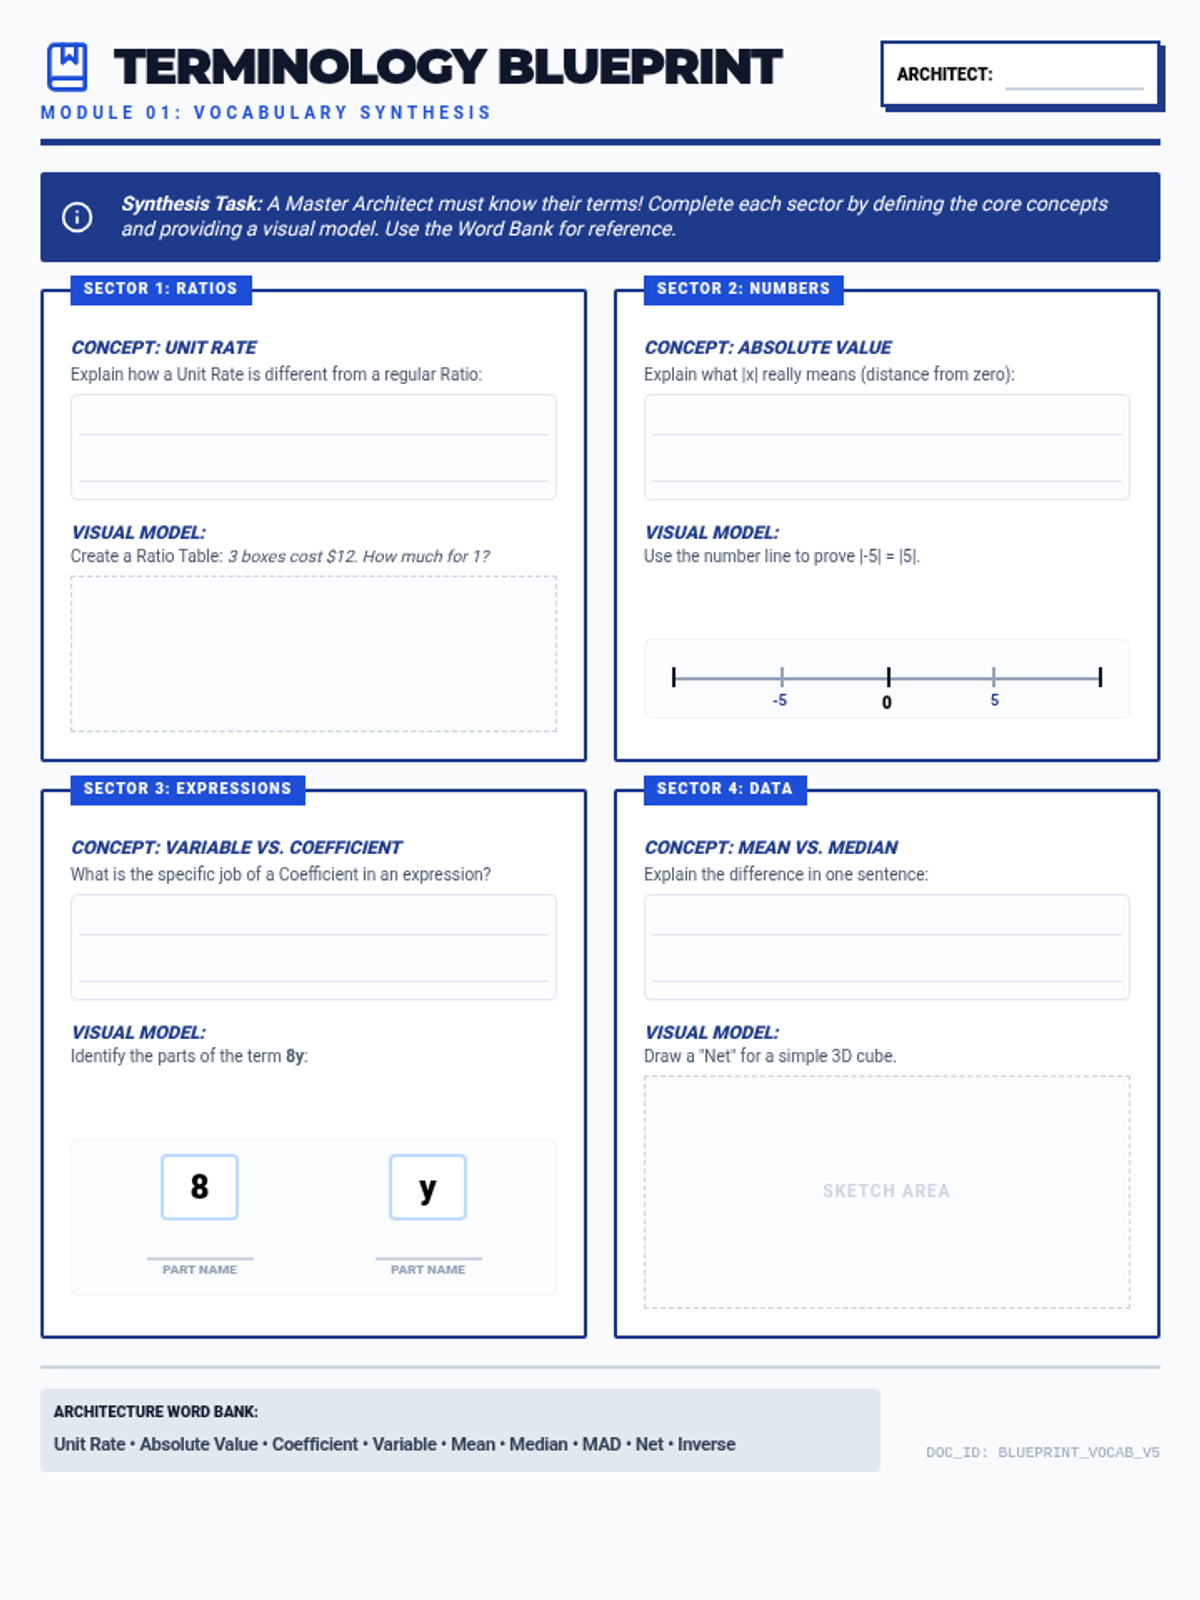
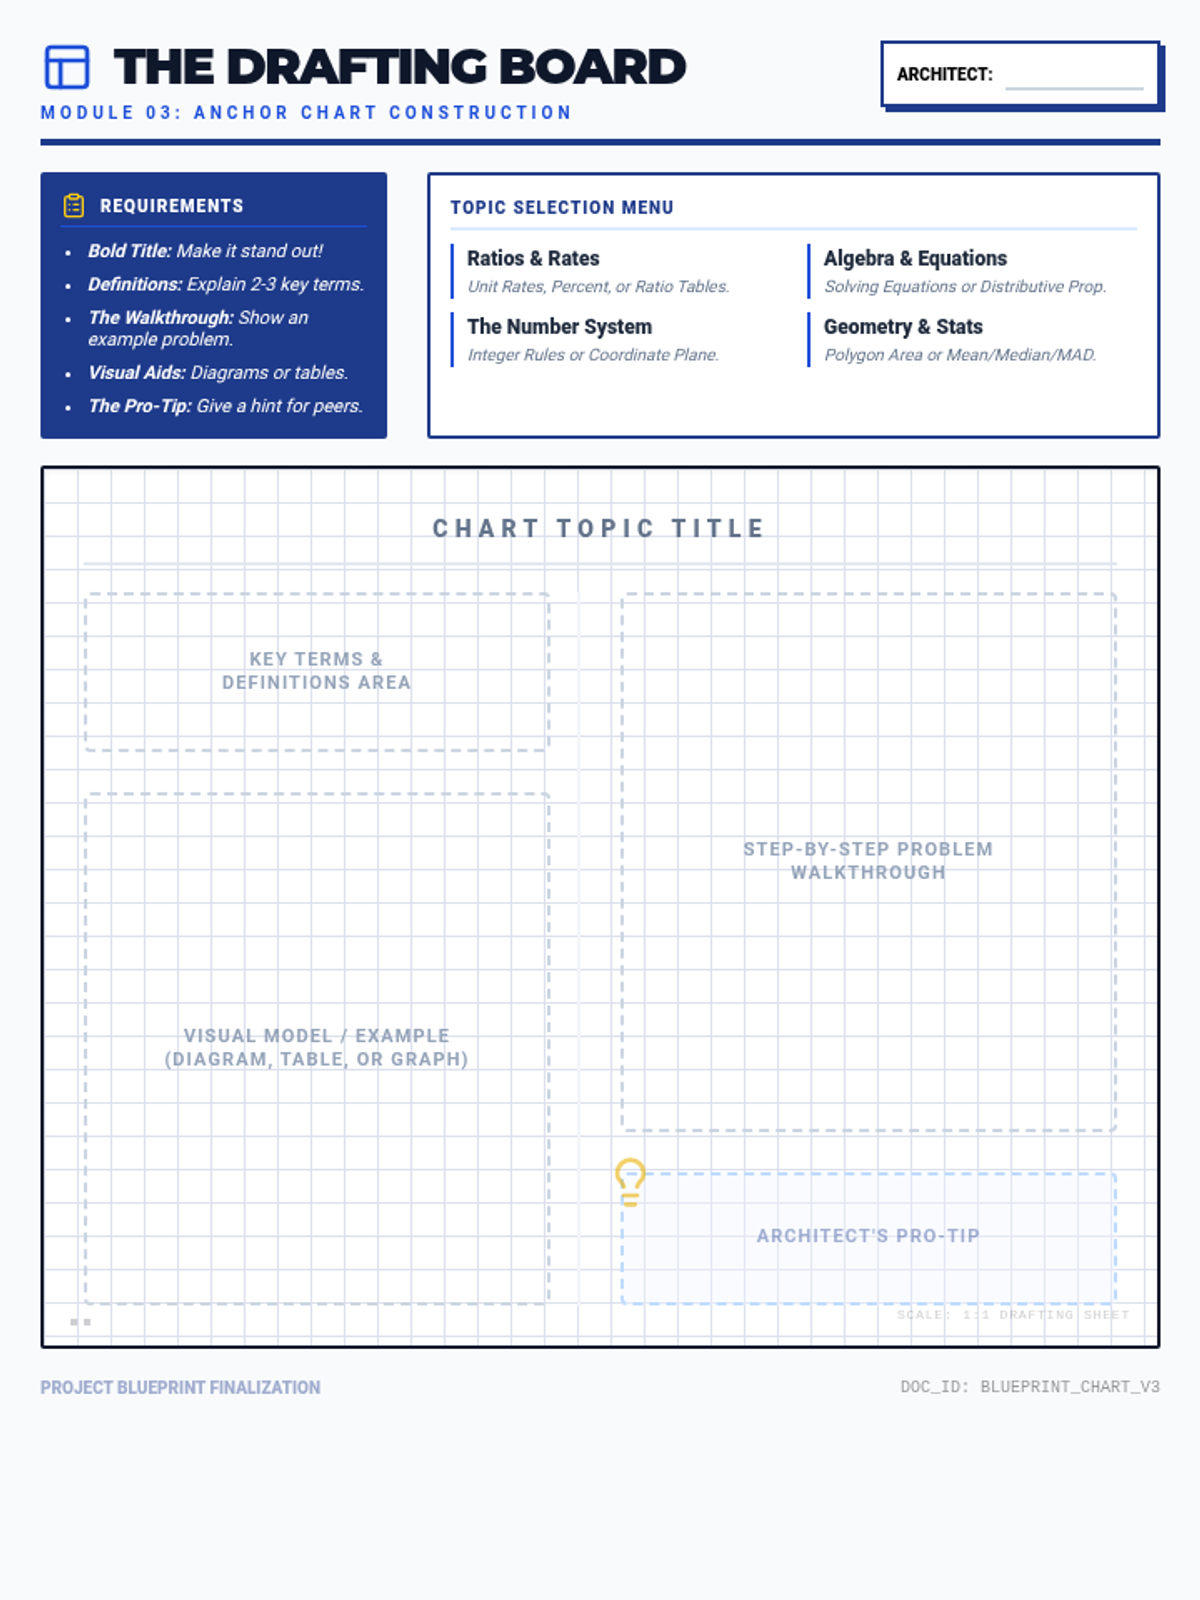
A set of interactive study resources designed to help students review key domains for the NYS Math Test through active creation and synthesis of information.
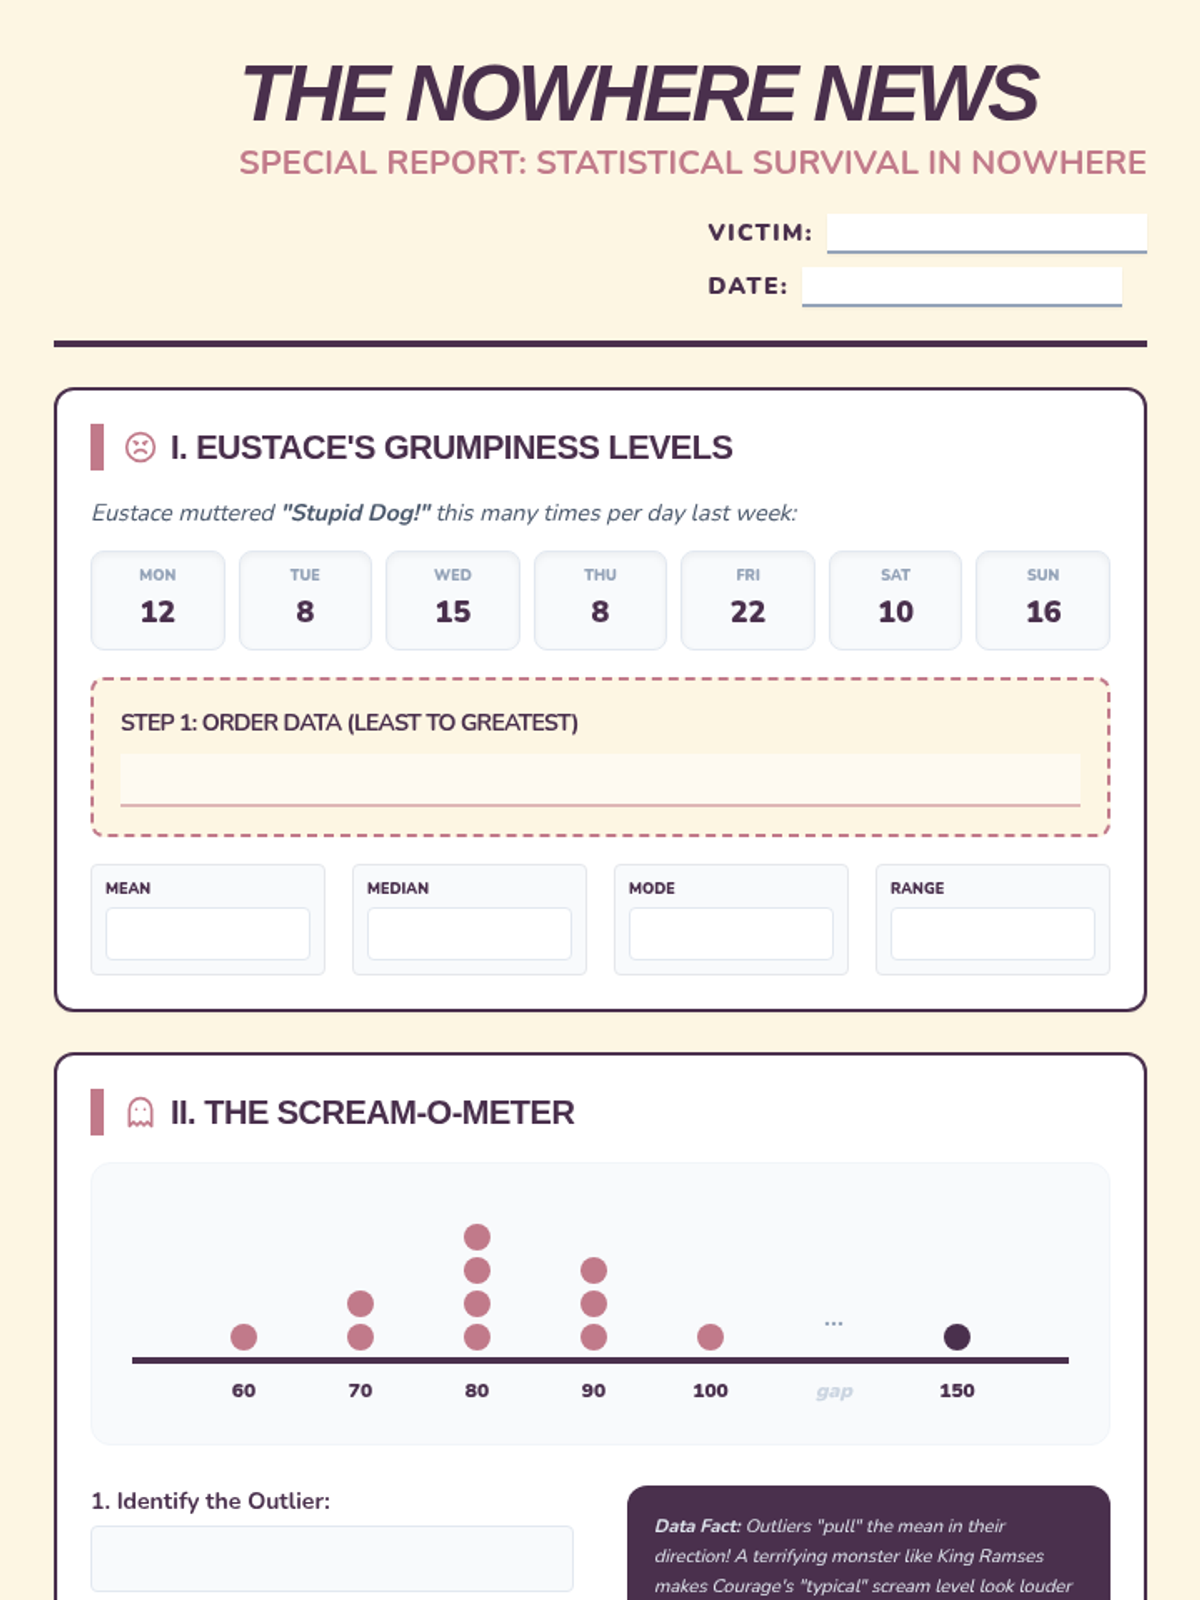
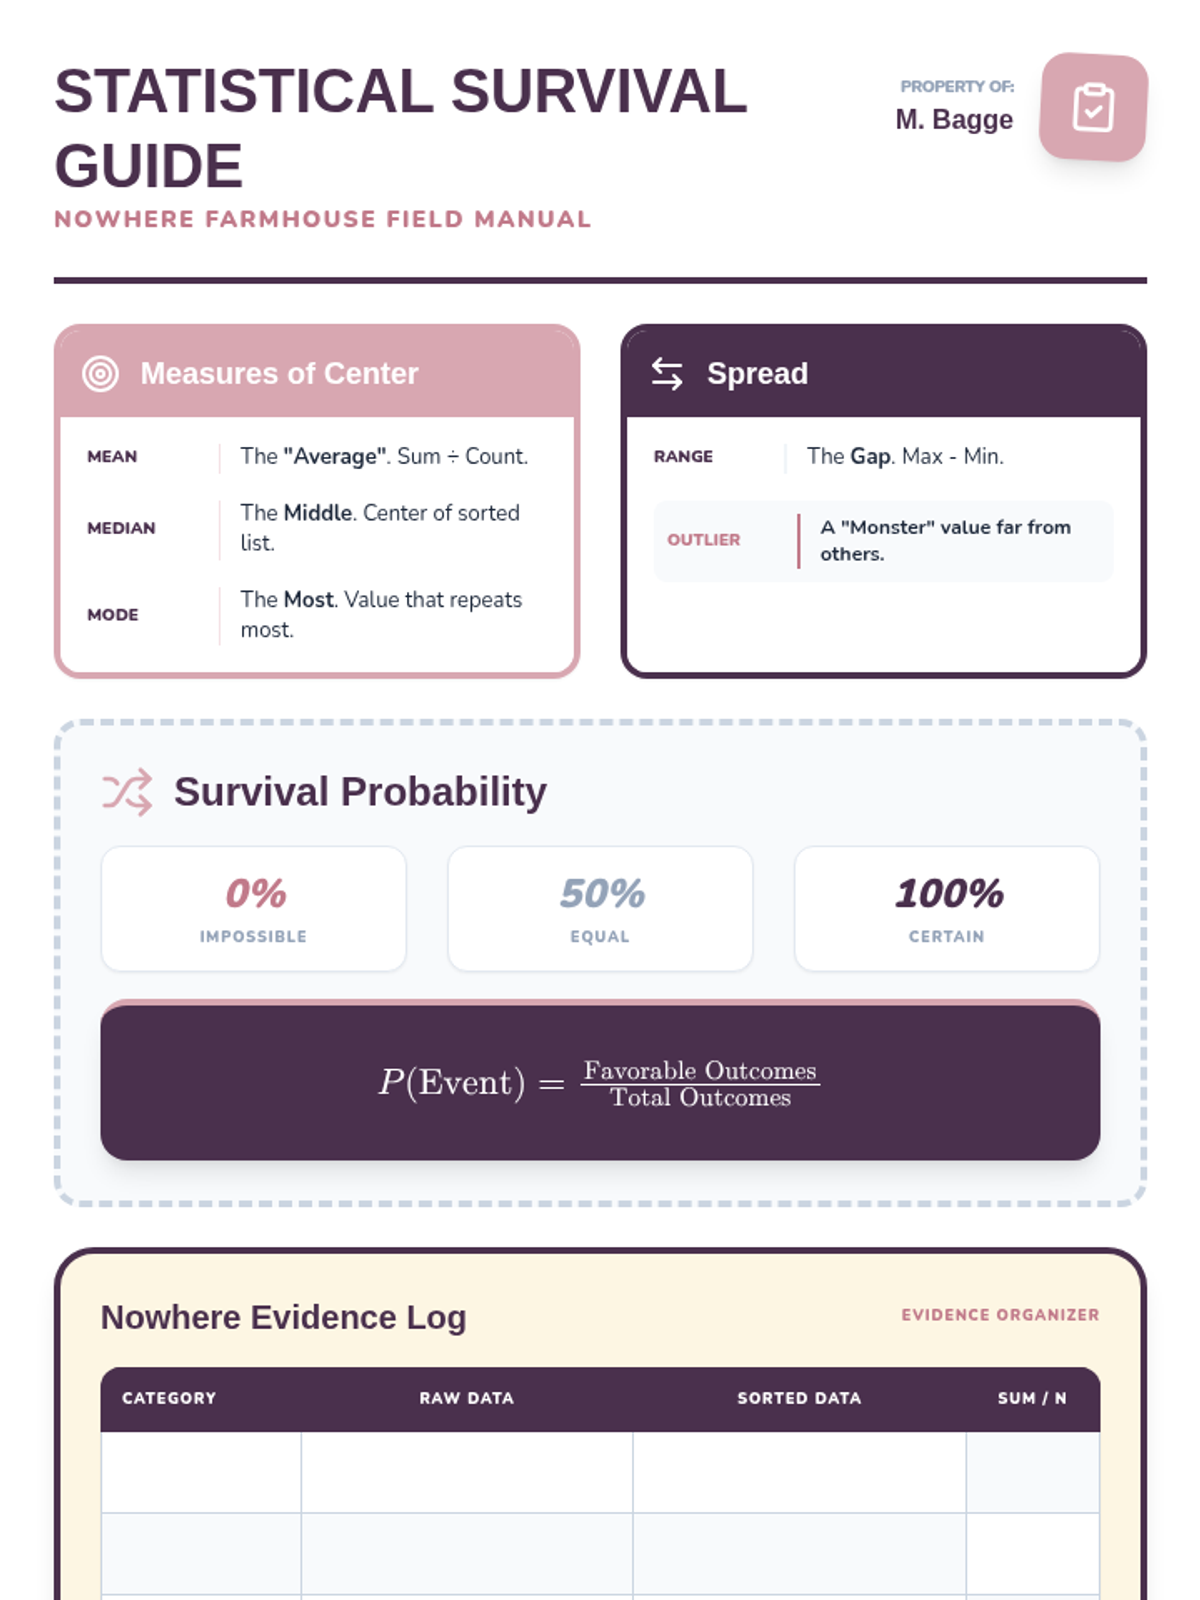
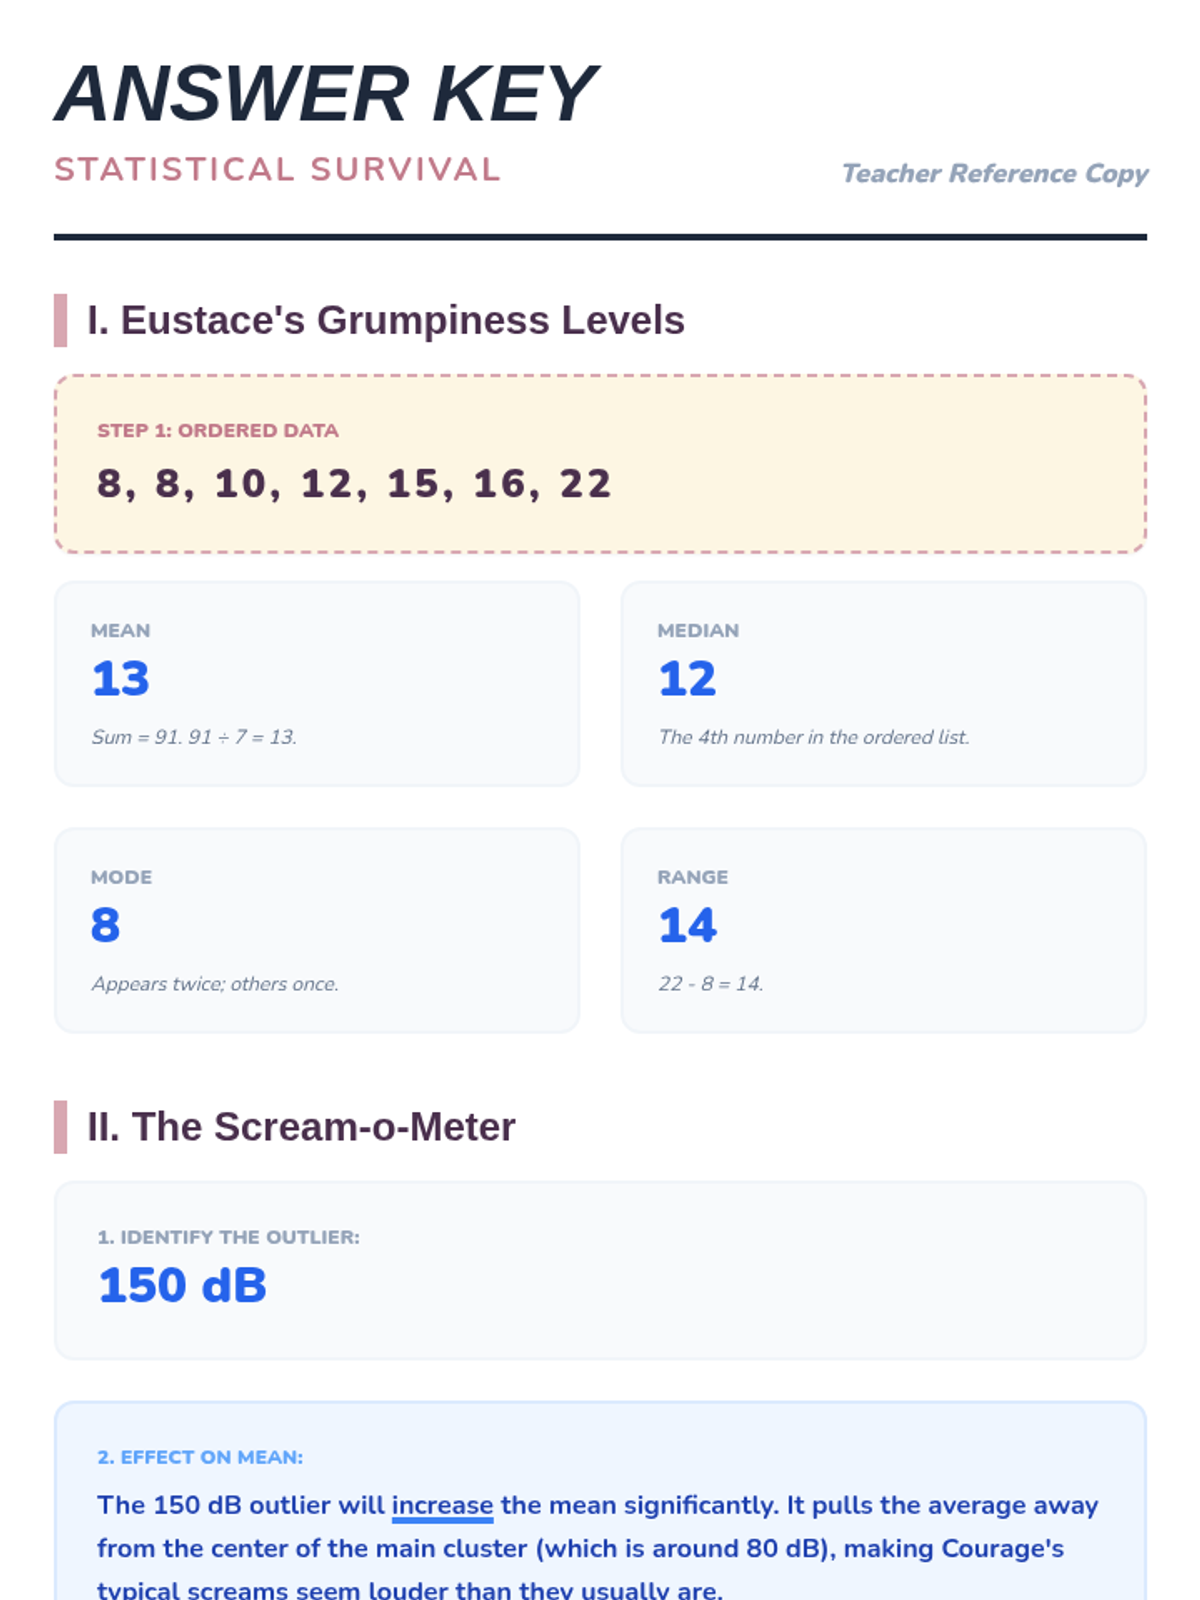
A statistics lesson themed around Courage the Cowardly Dog, covering central tendency, dot plots, and probability.
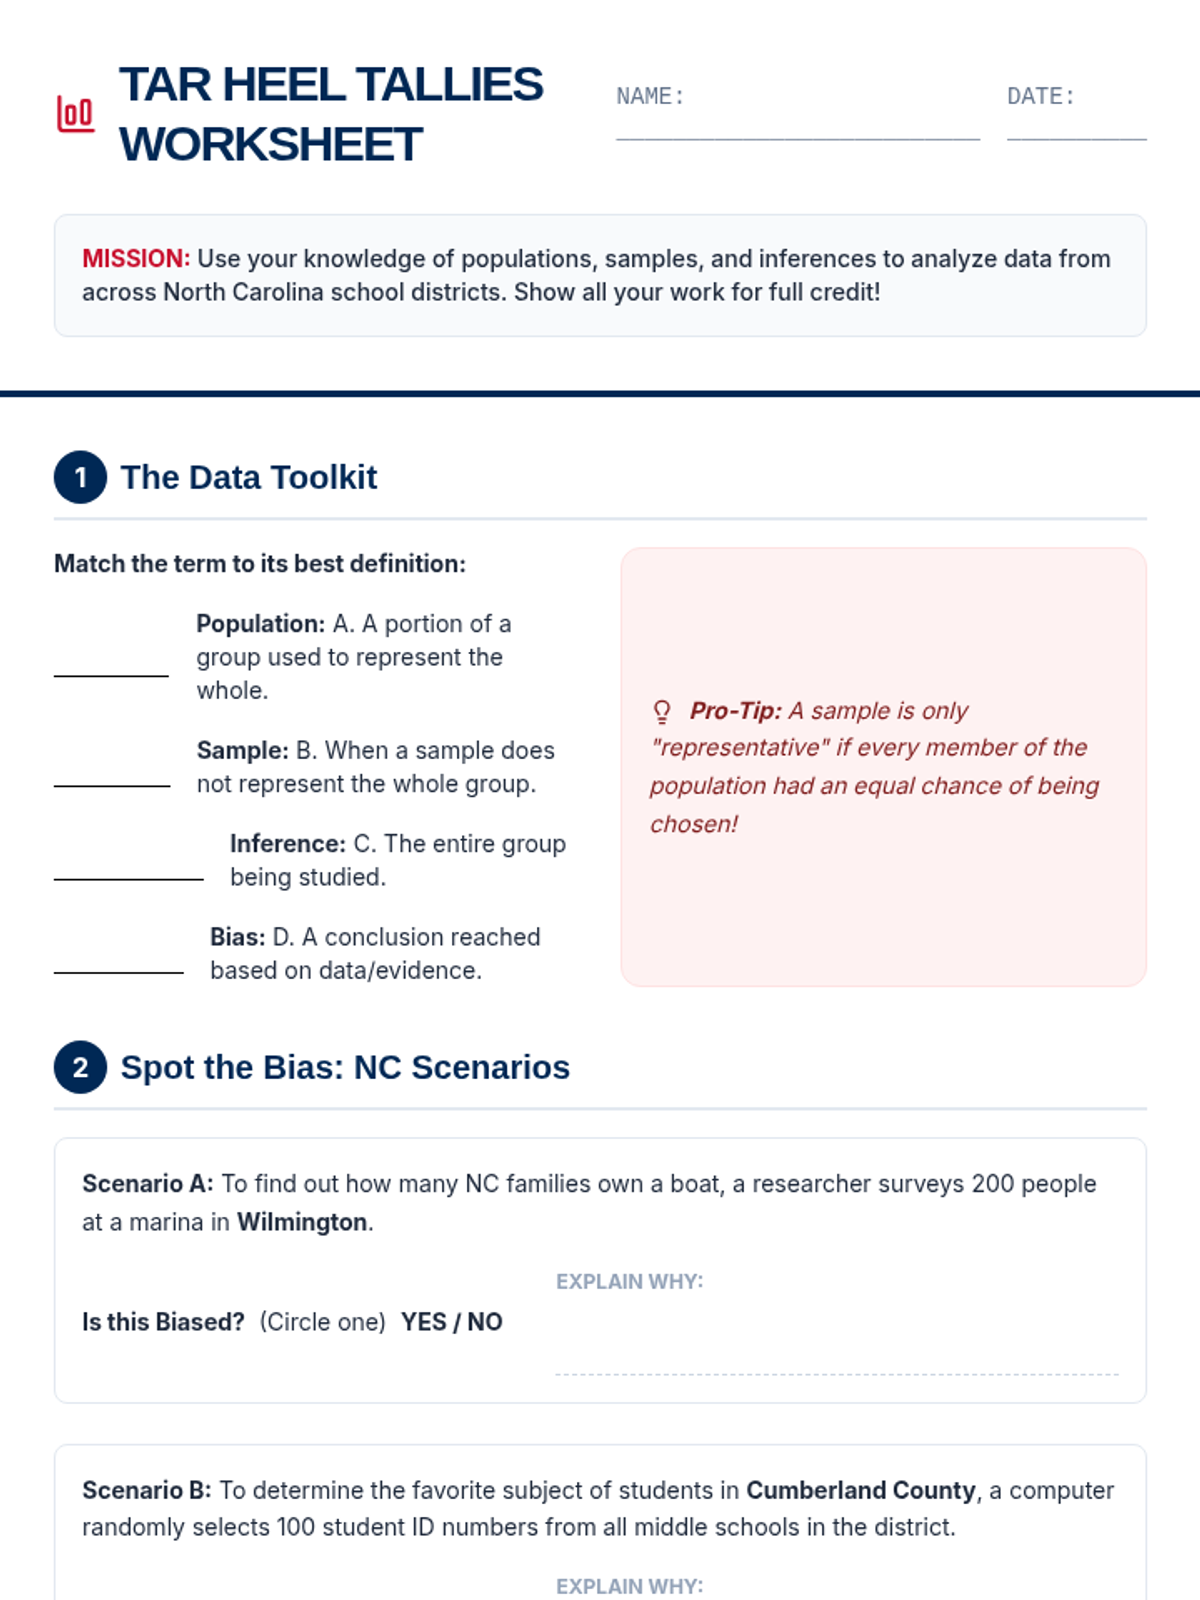
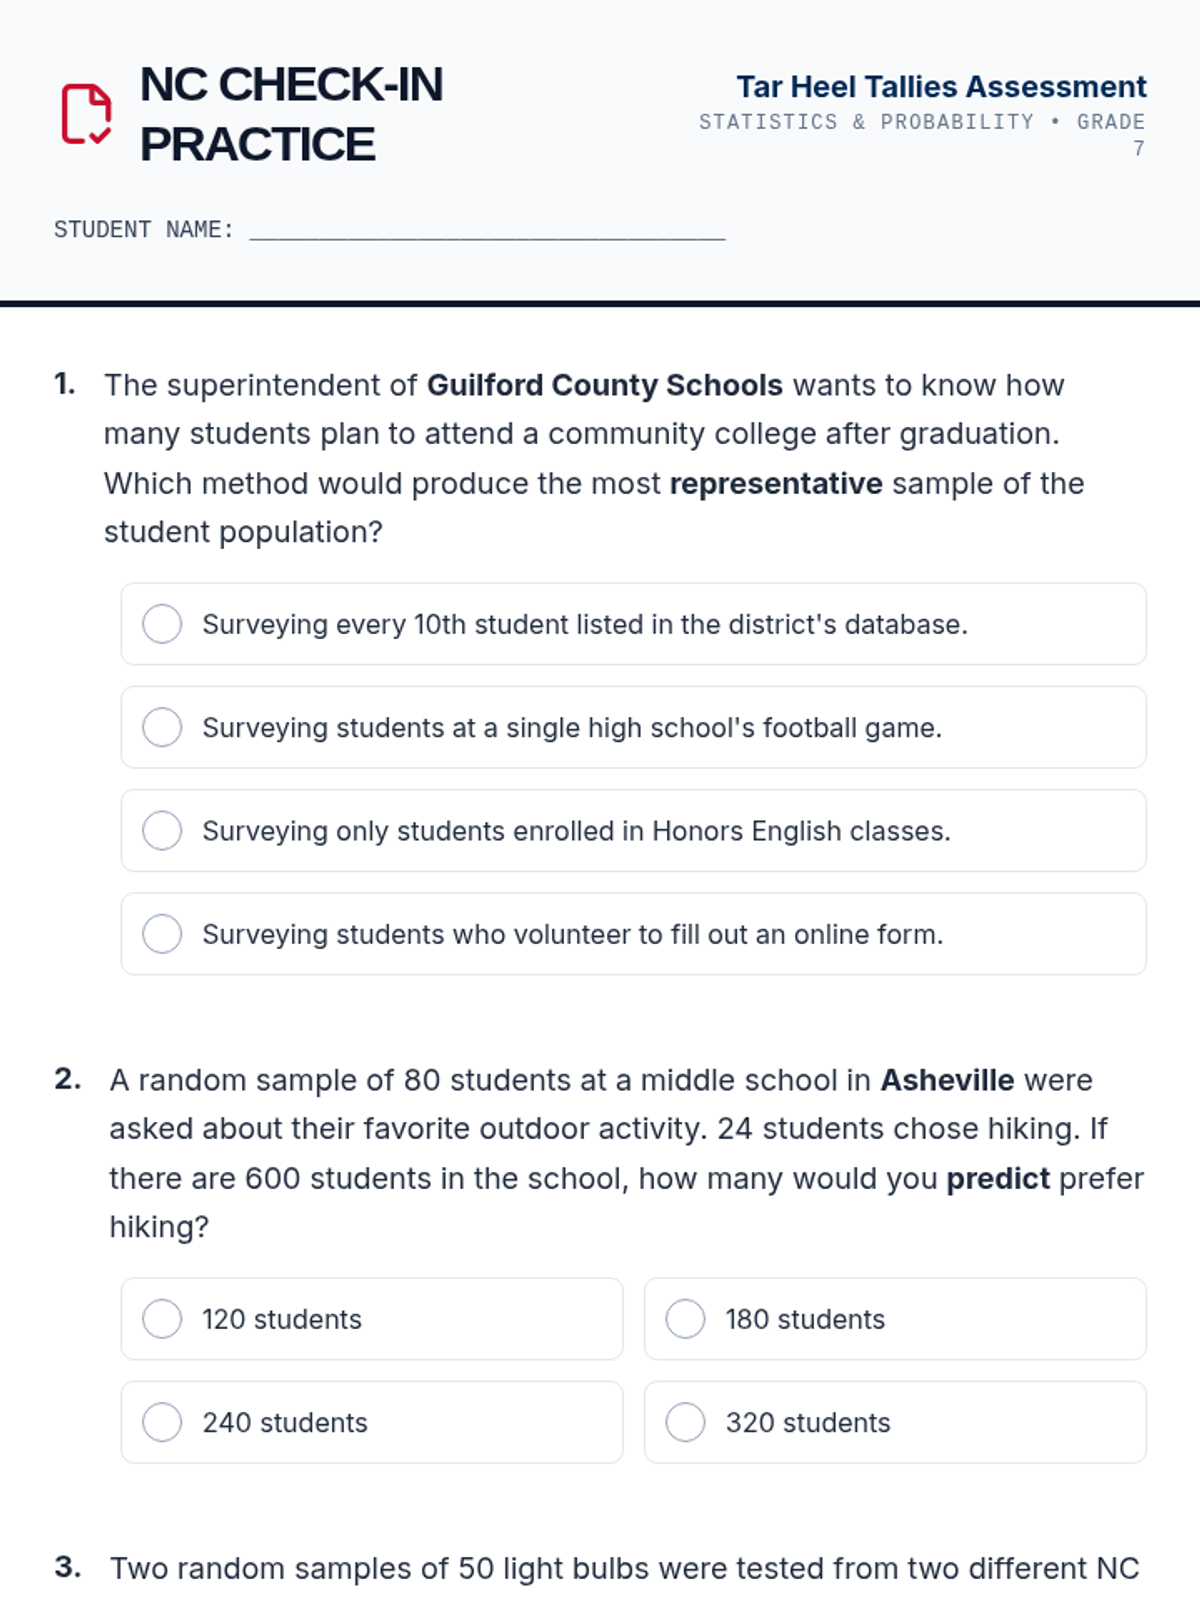
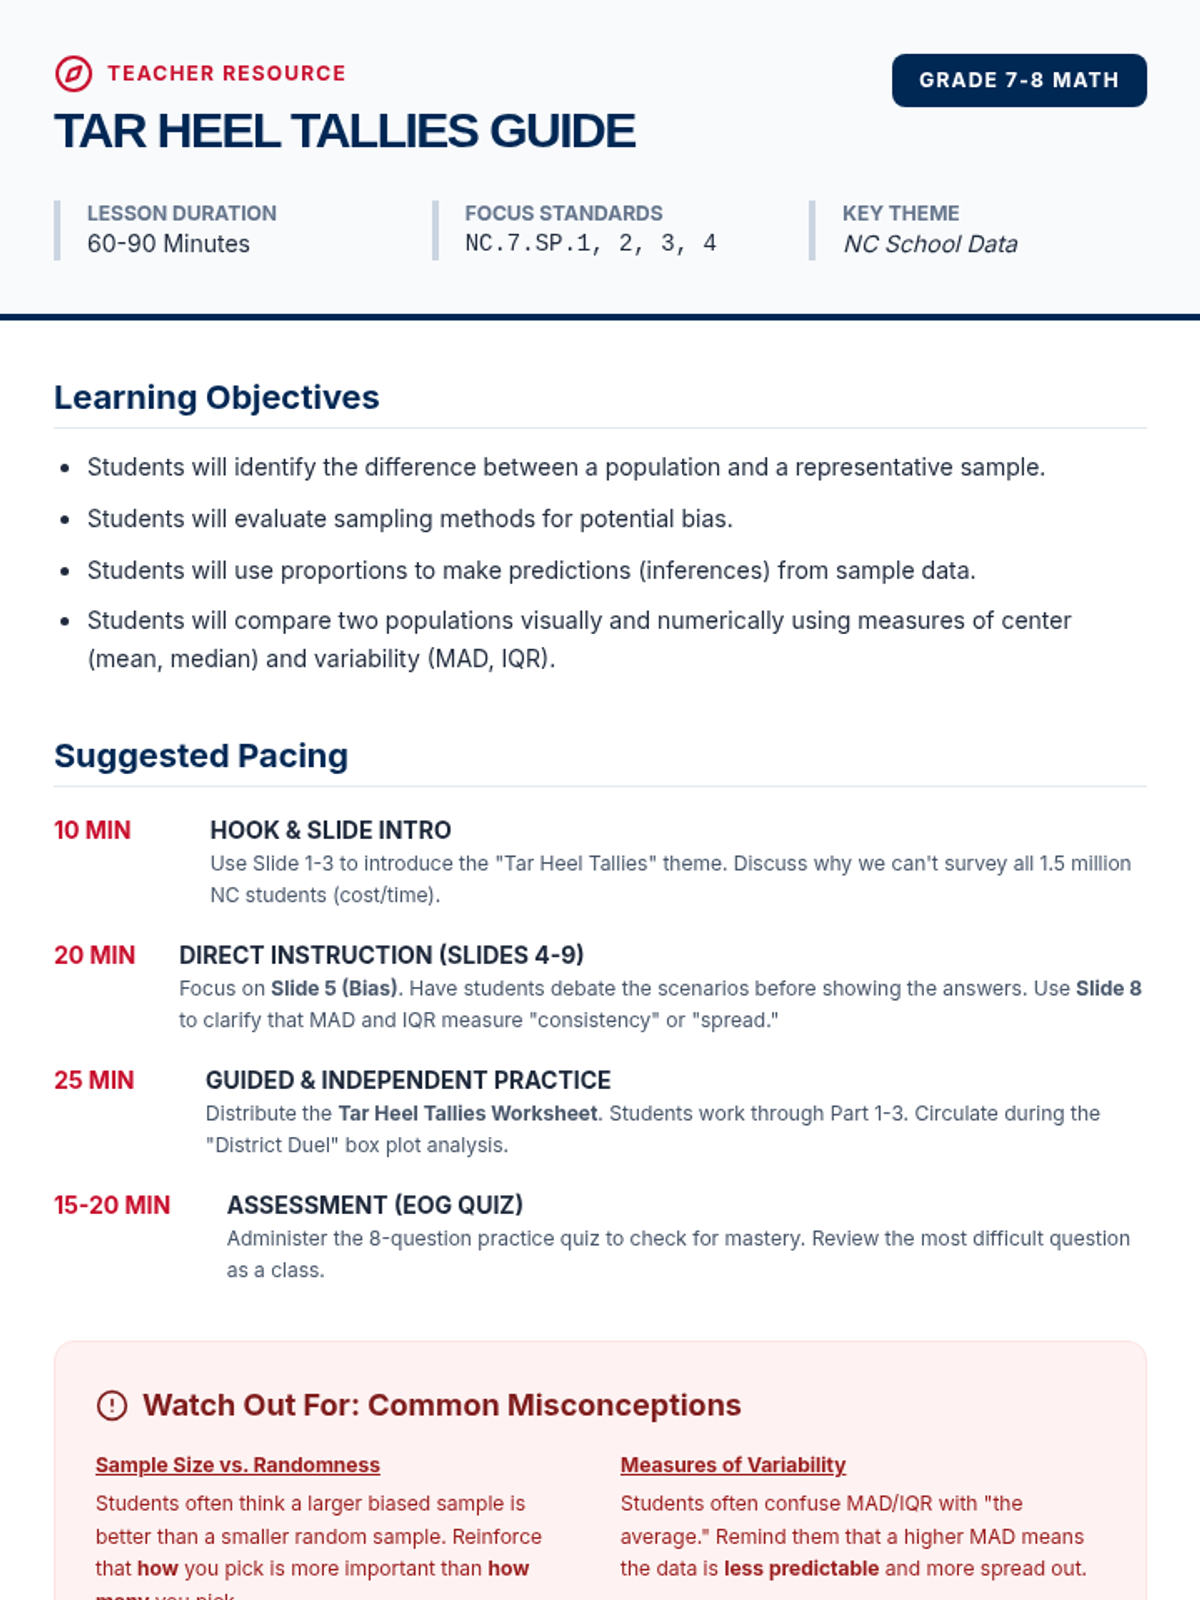
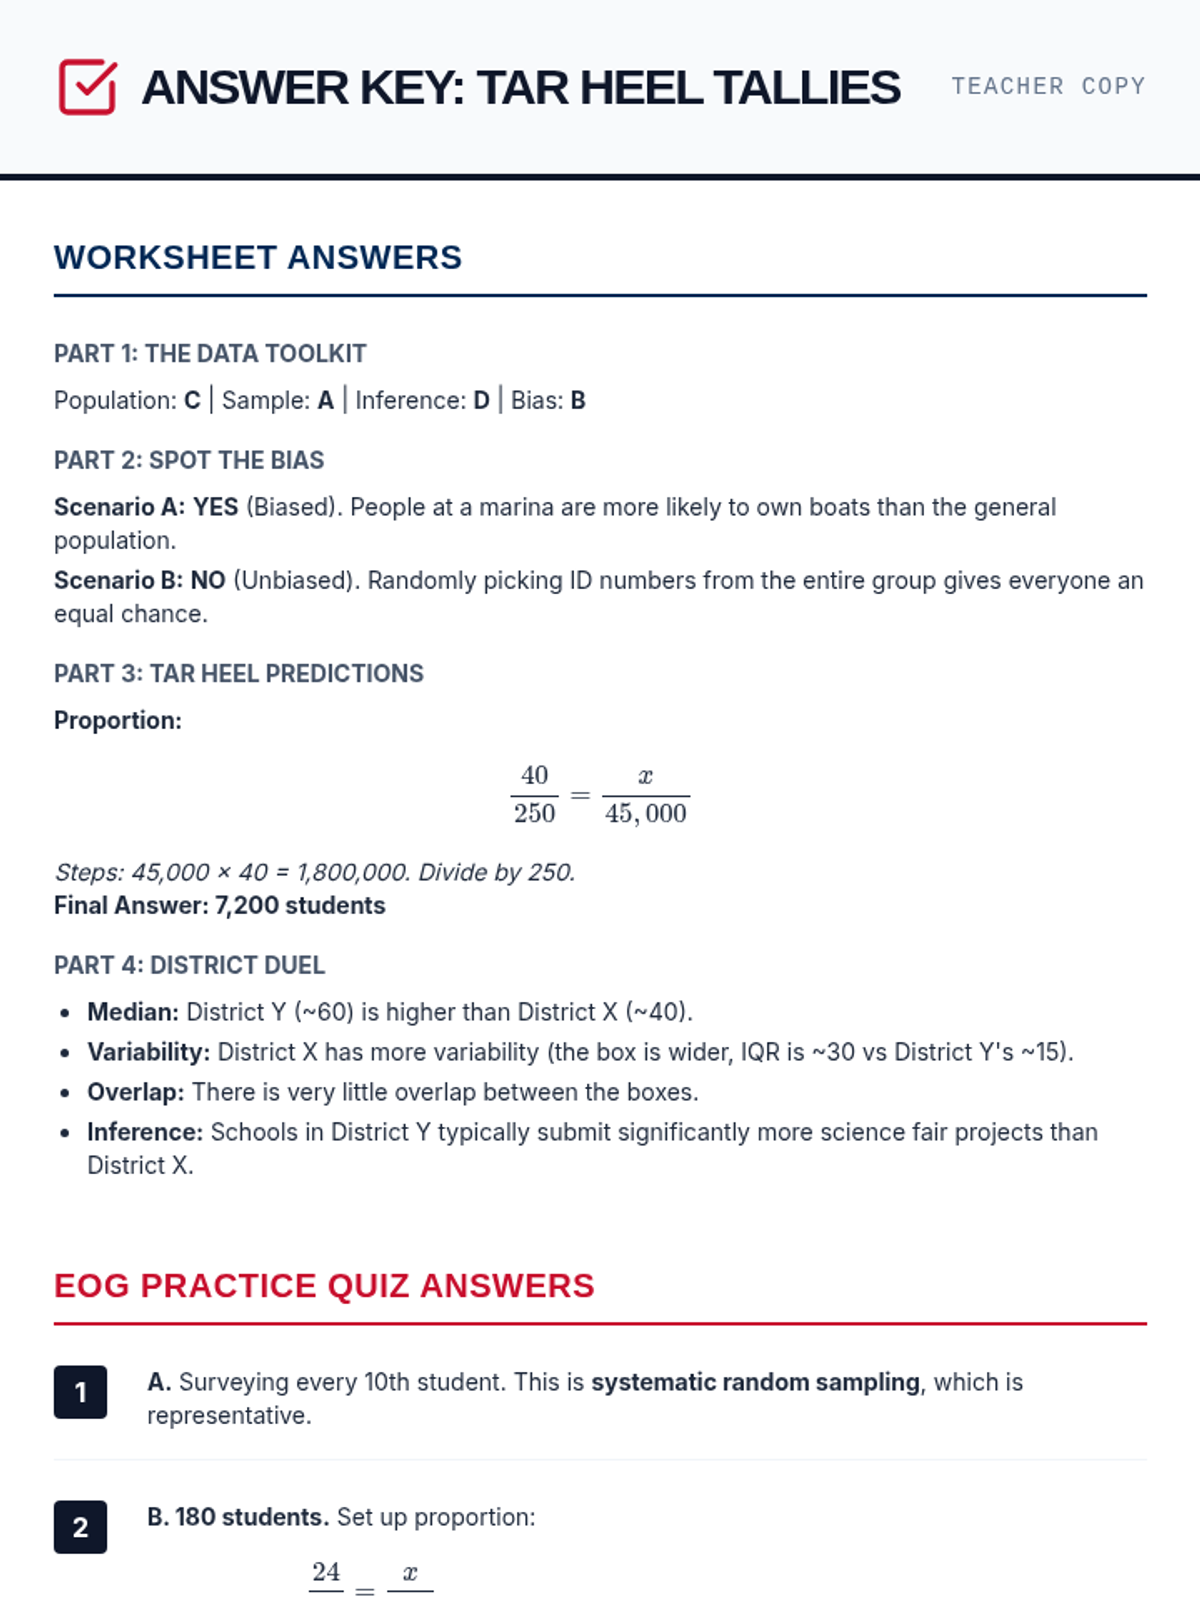
A comprehensive lesson on sampling techniques, population inferences, and data comparison using North Carolina school district data. Students will learn to identify biased sampling, make predictions from representative samples, and compare two populations using measures of center and variability.
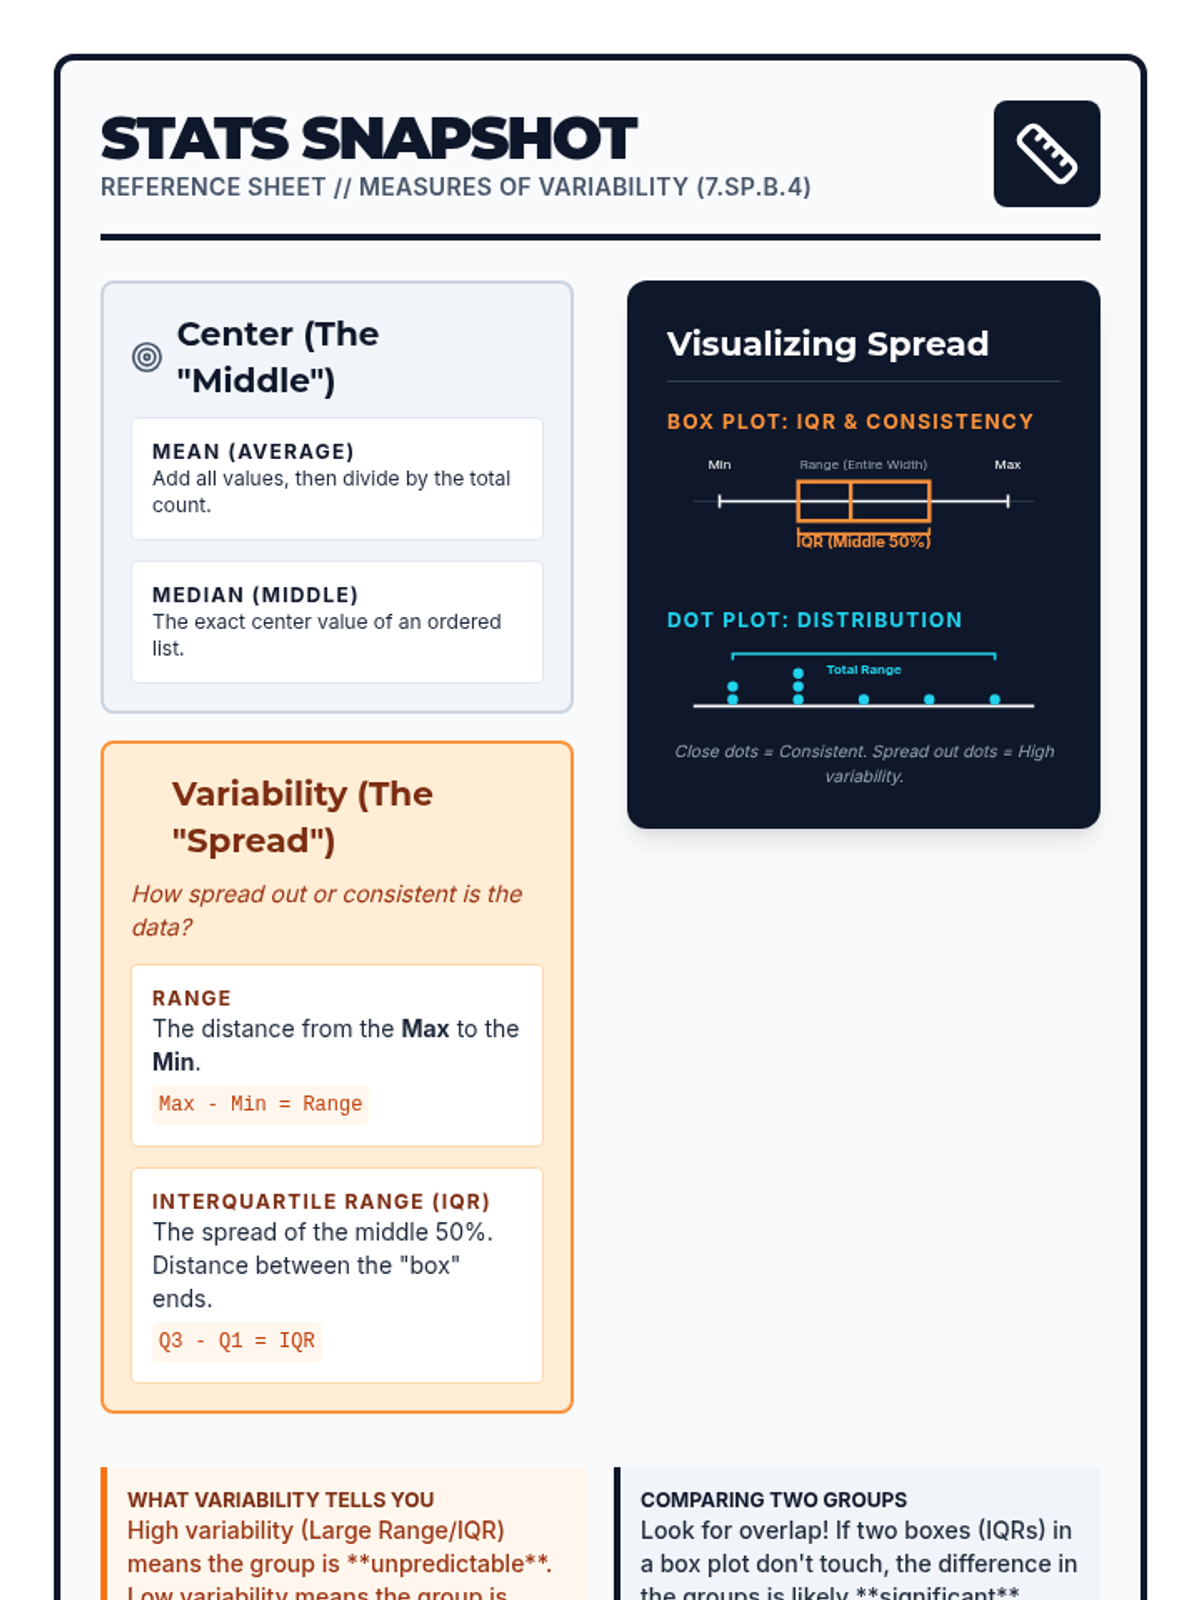
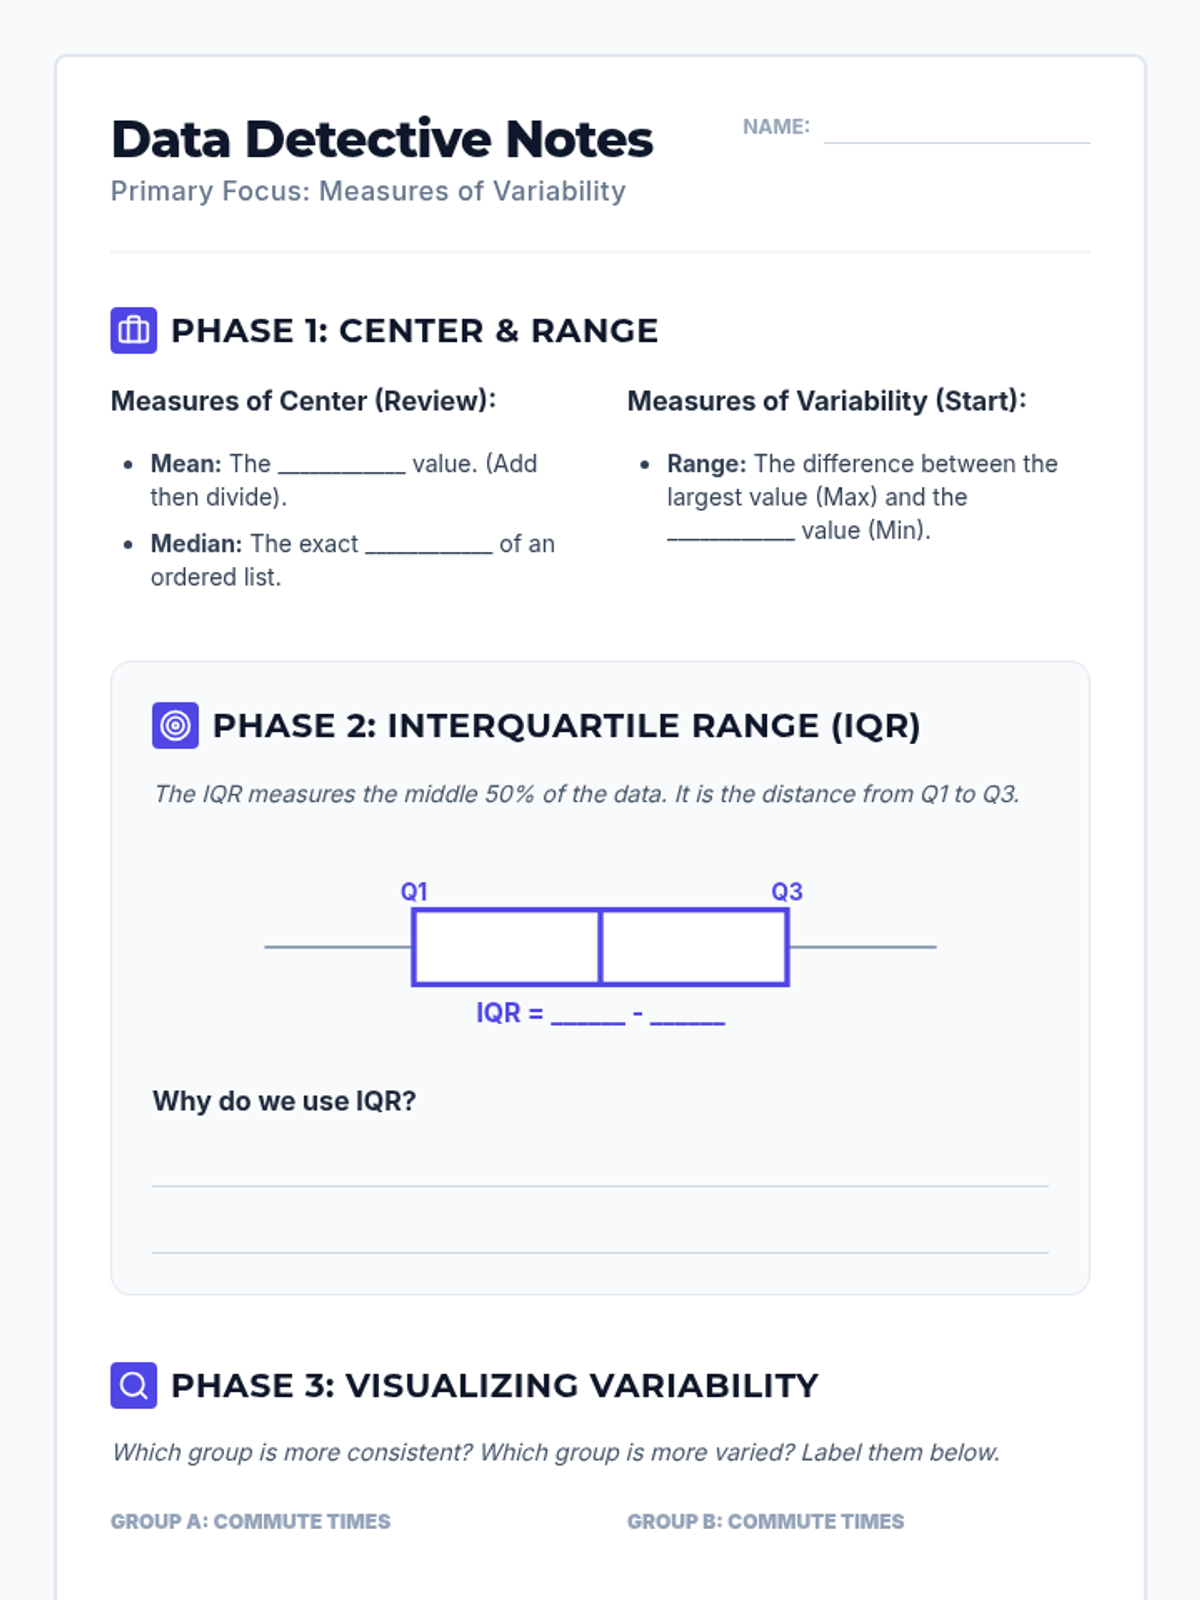
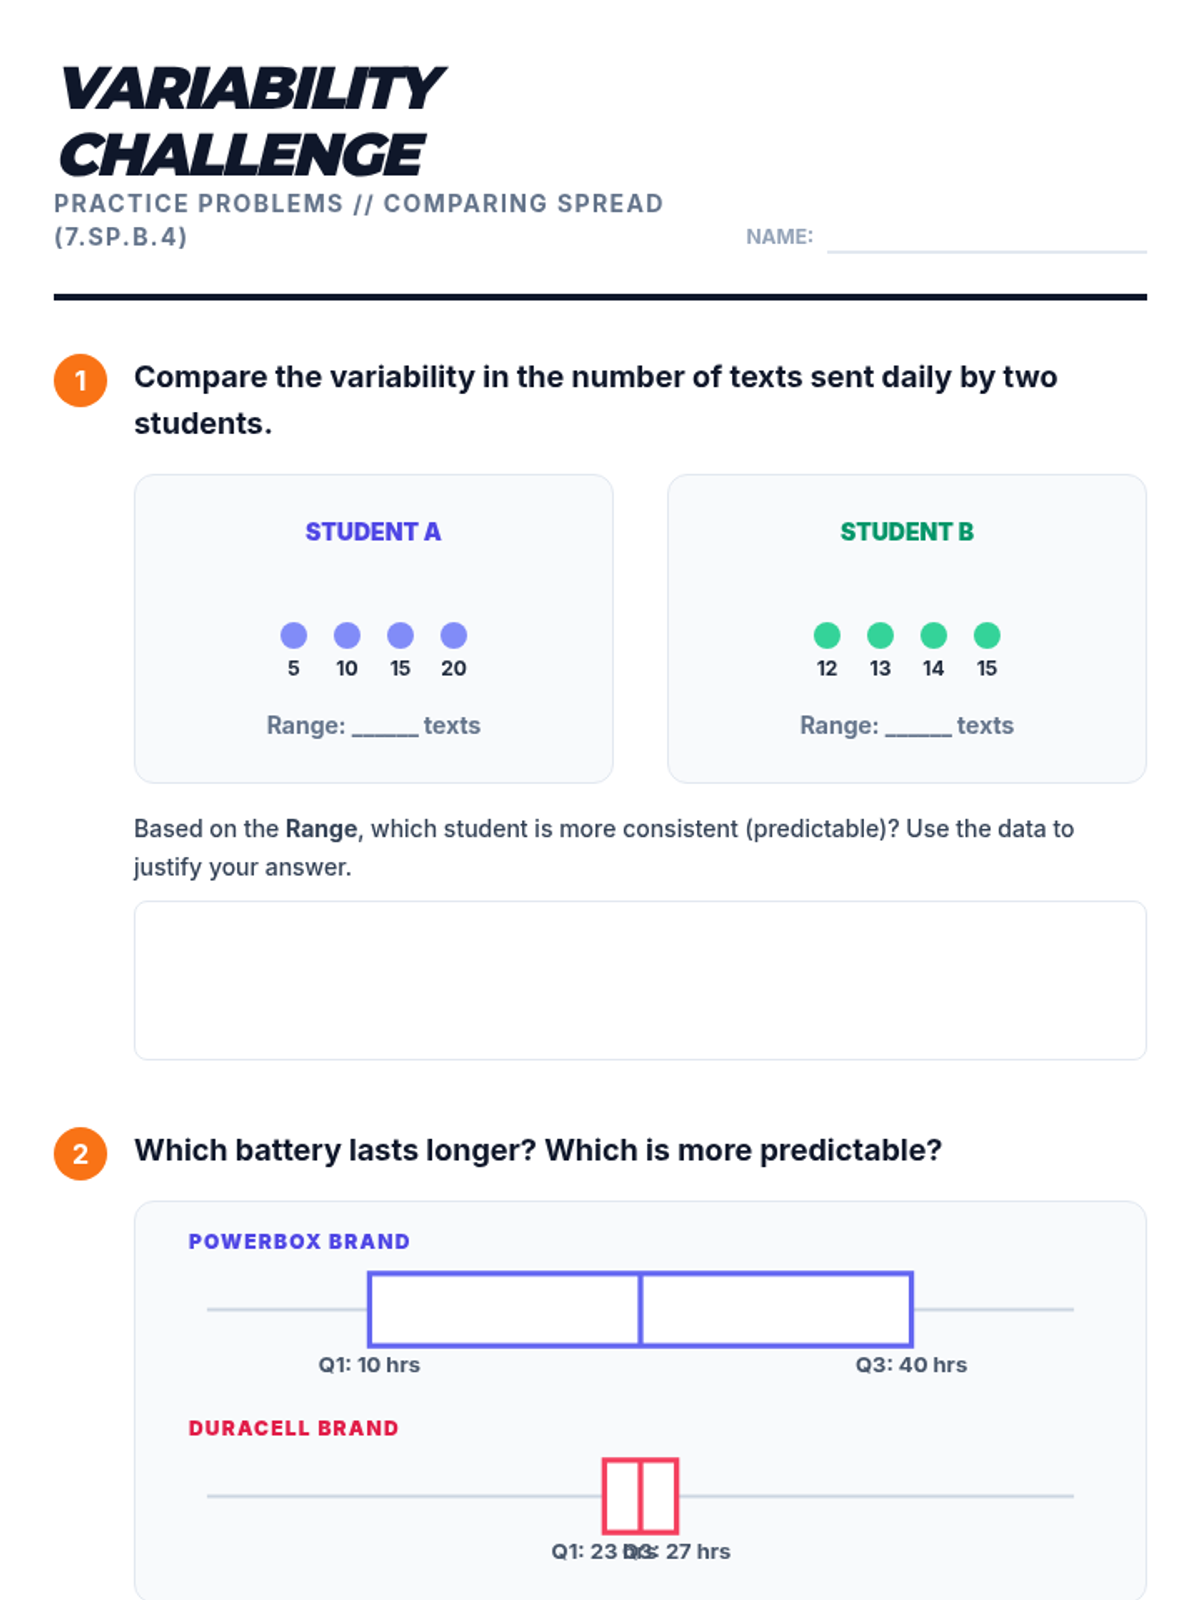
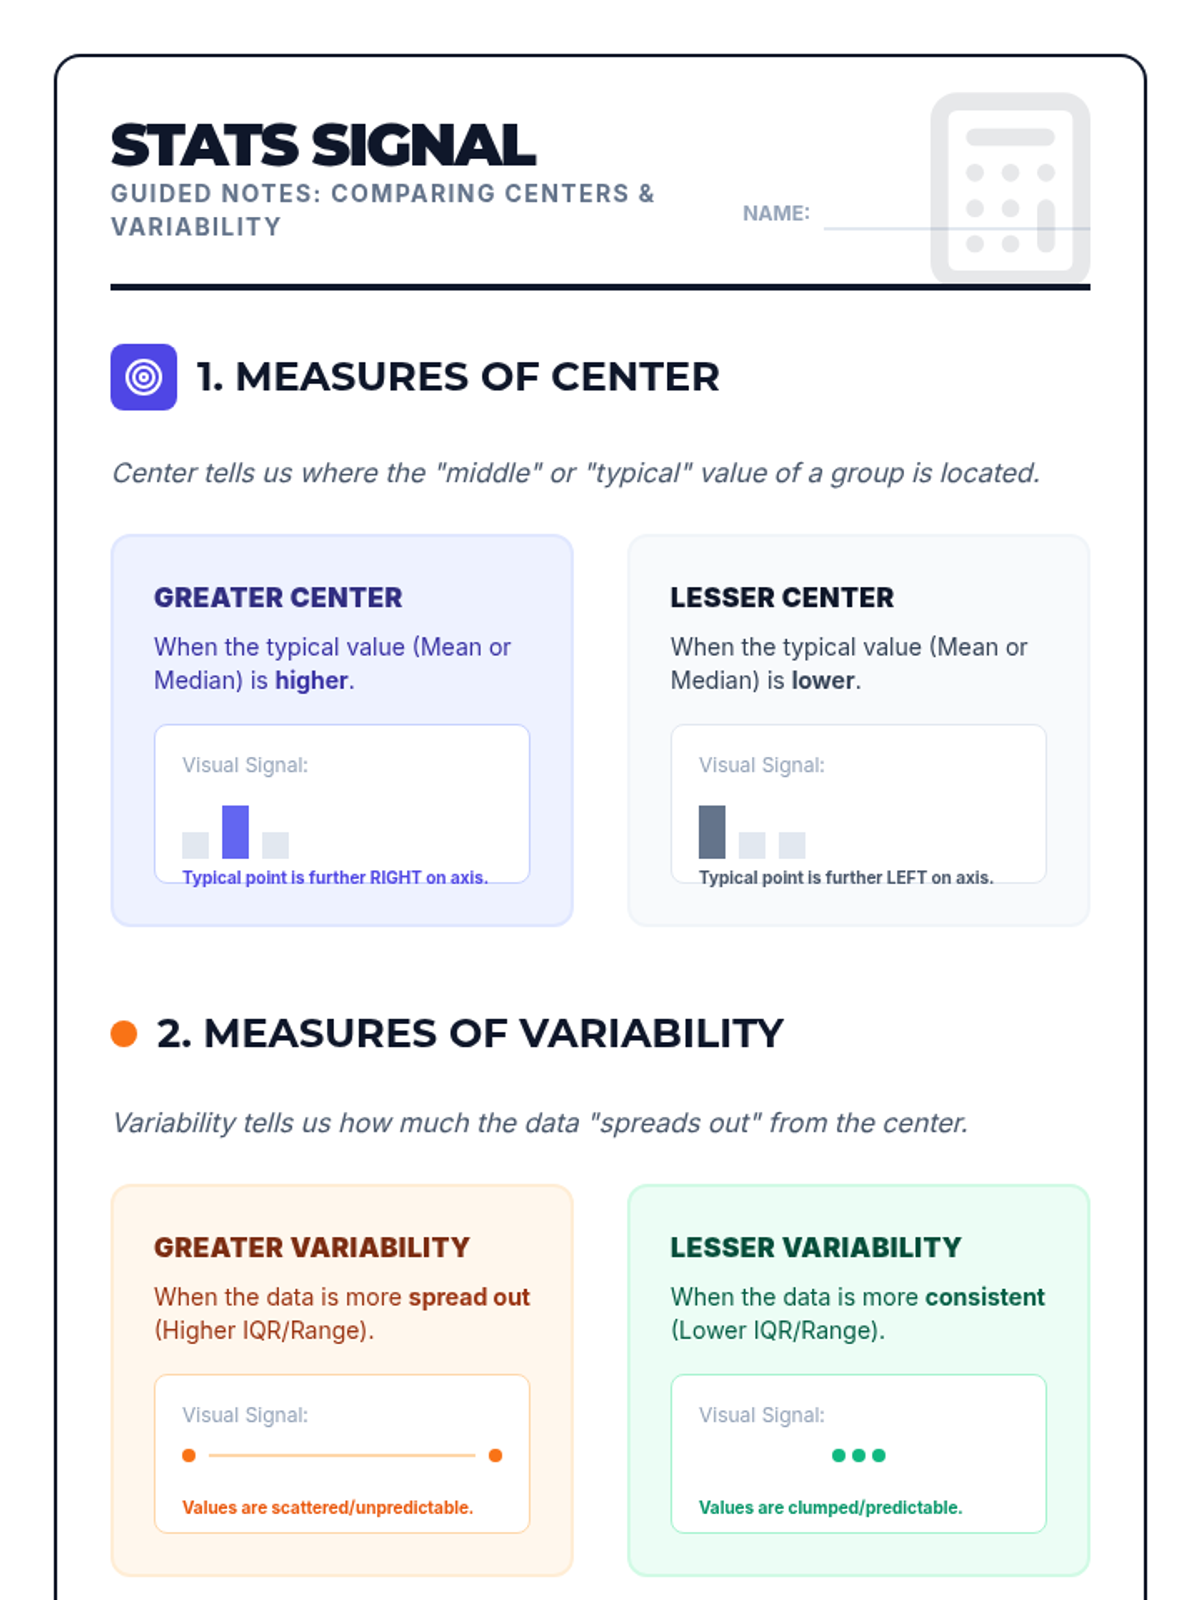
A mini-lesson on comparing two populations using measures of center (mean, median) and variability (IQR) based on CCSS 7.SP.4. Includes guided notes, practice problems, and a reference sheet.
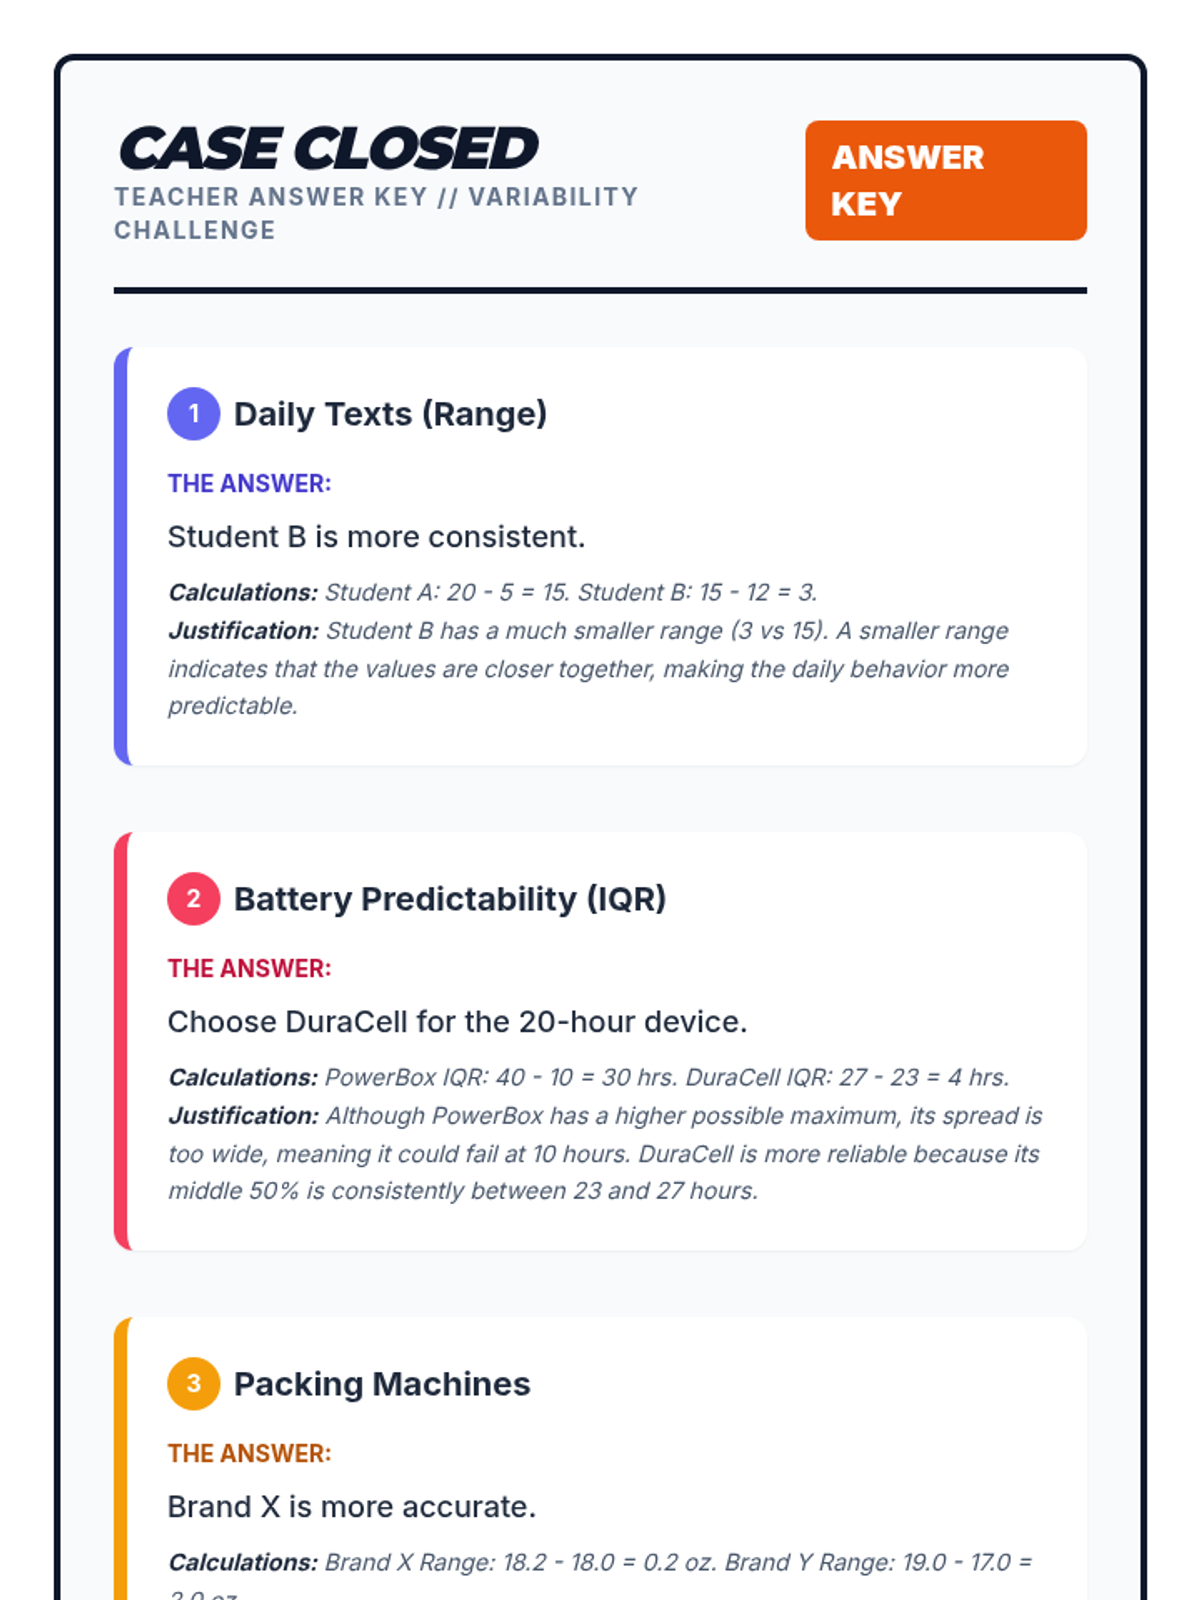
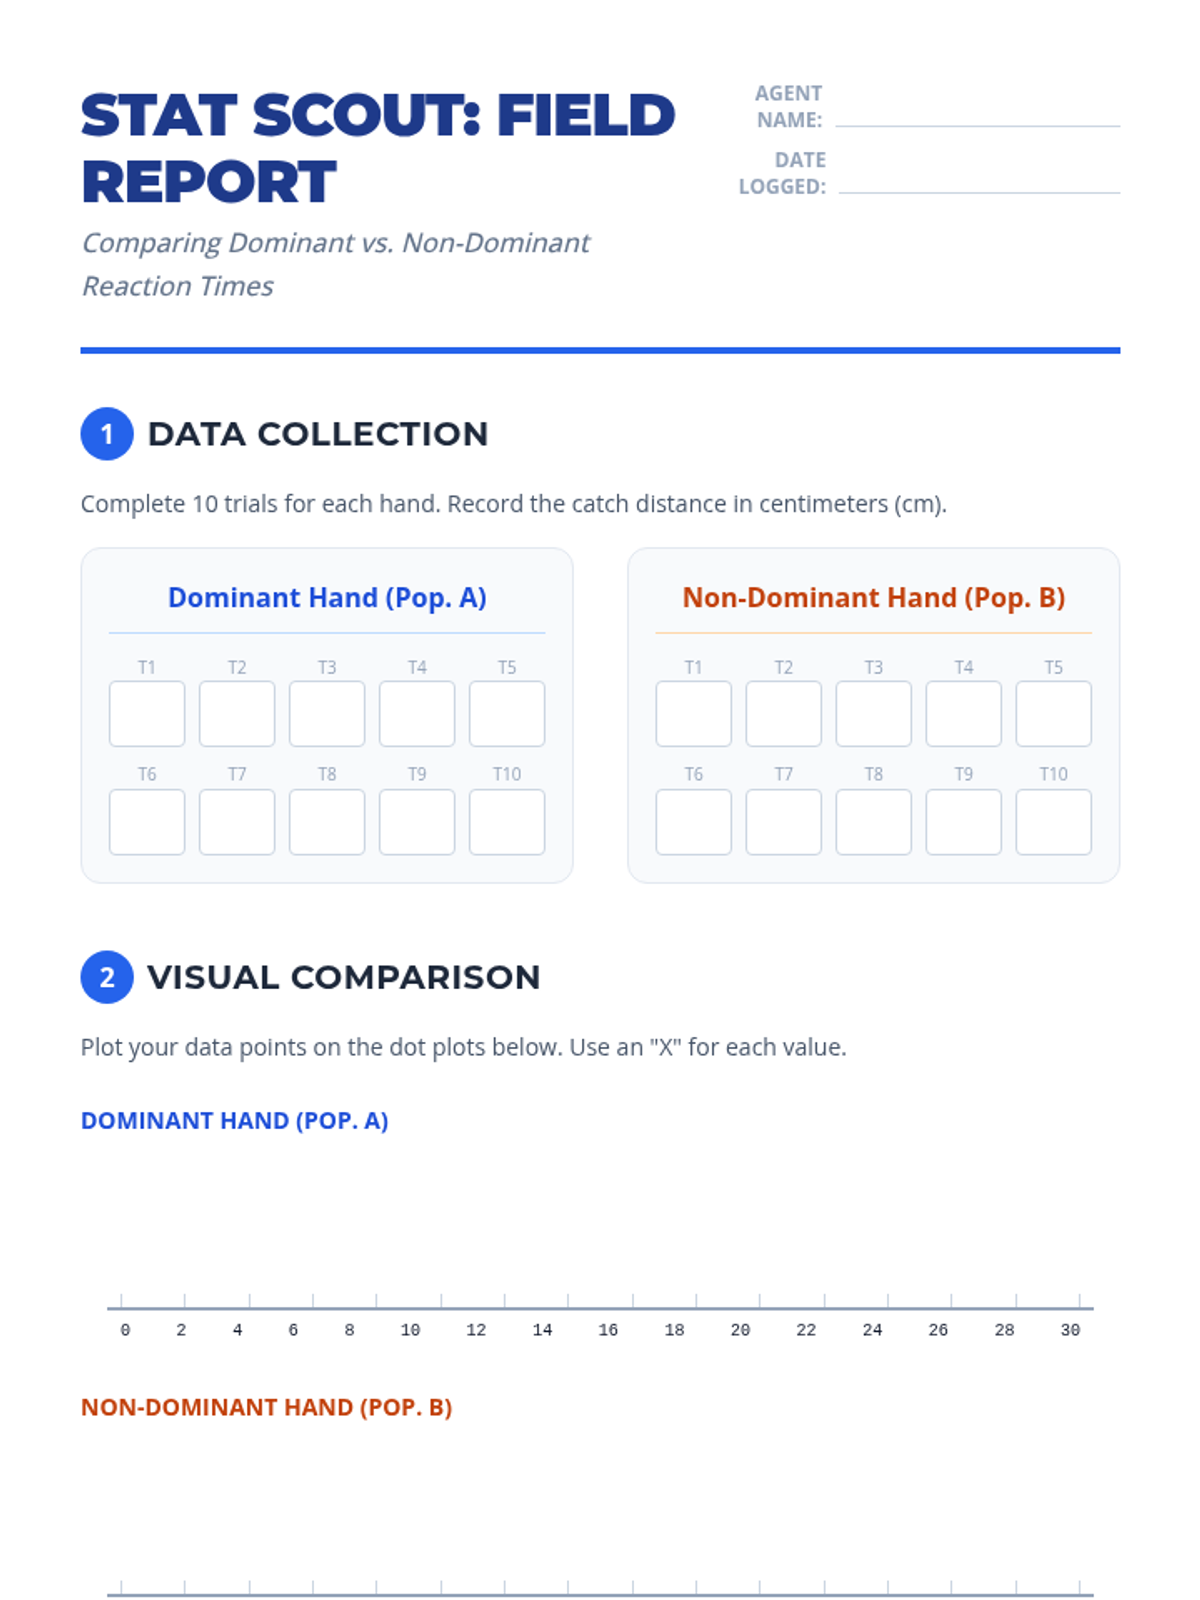
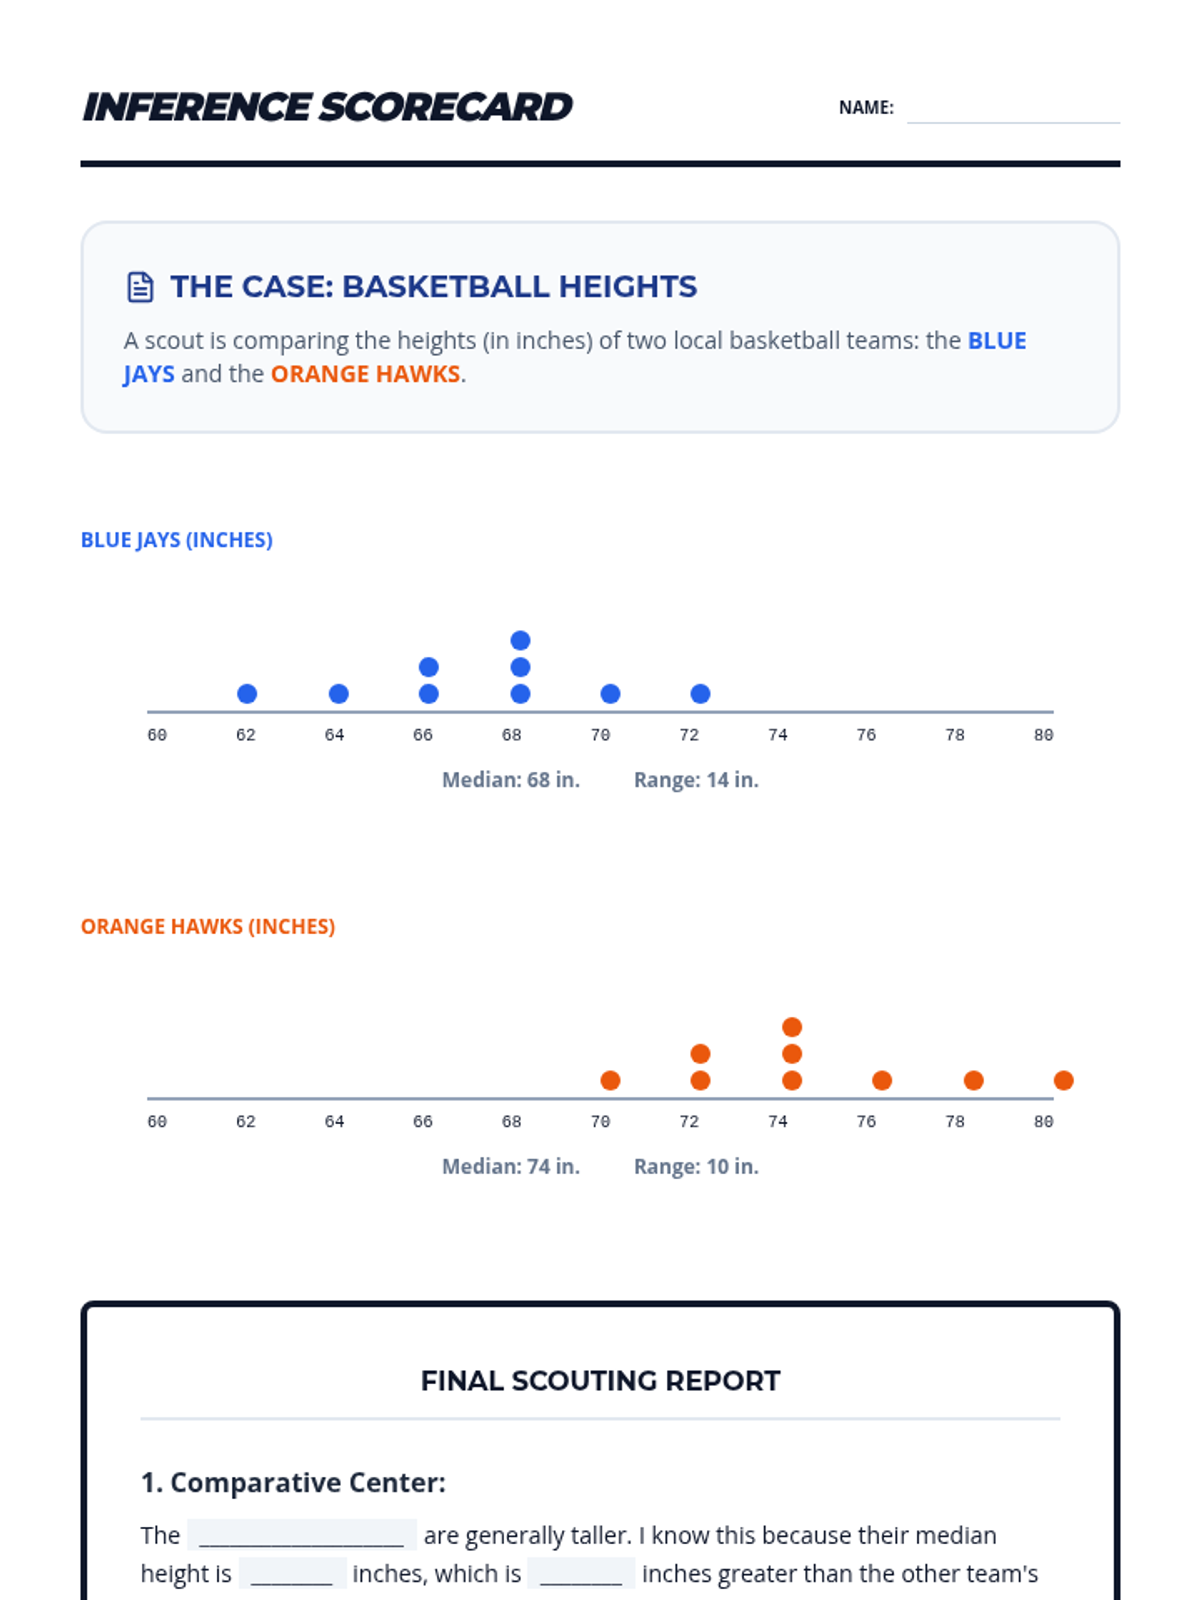
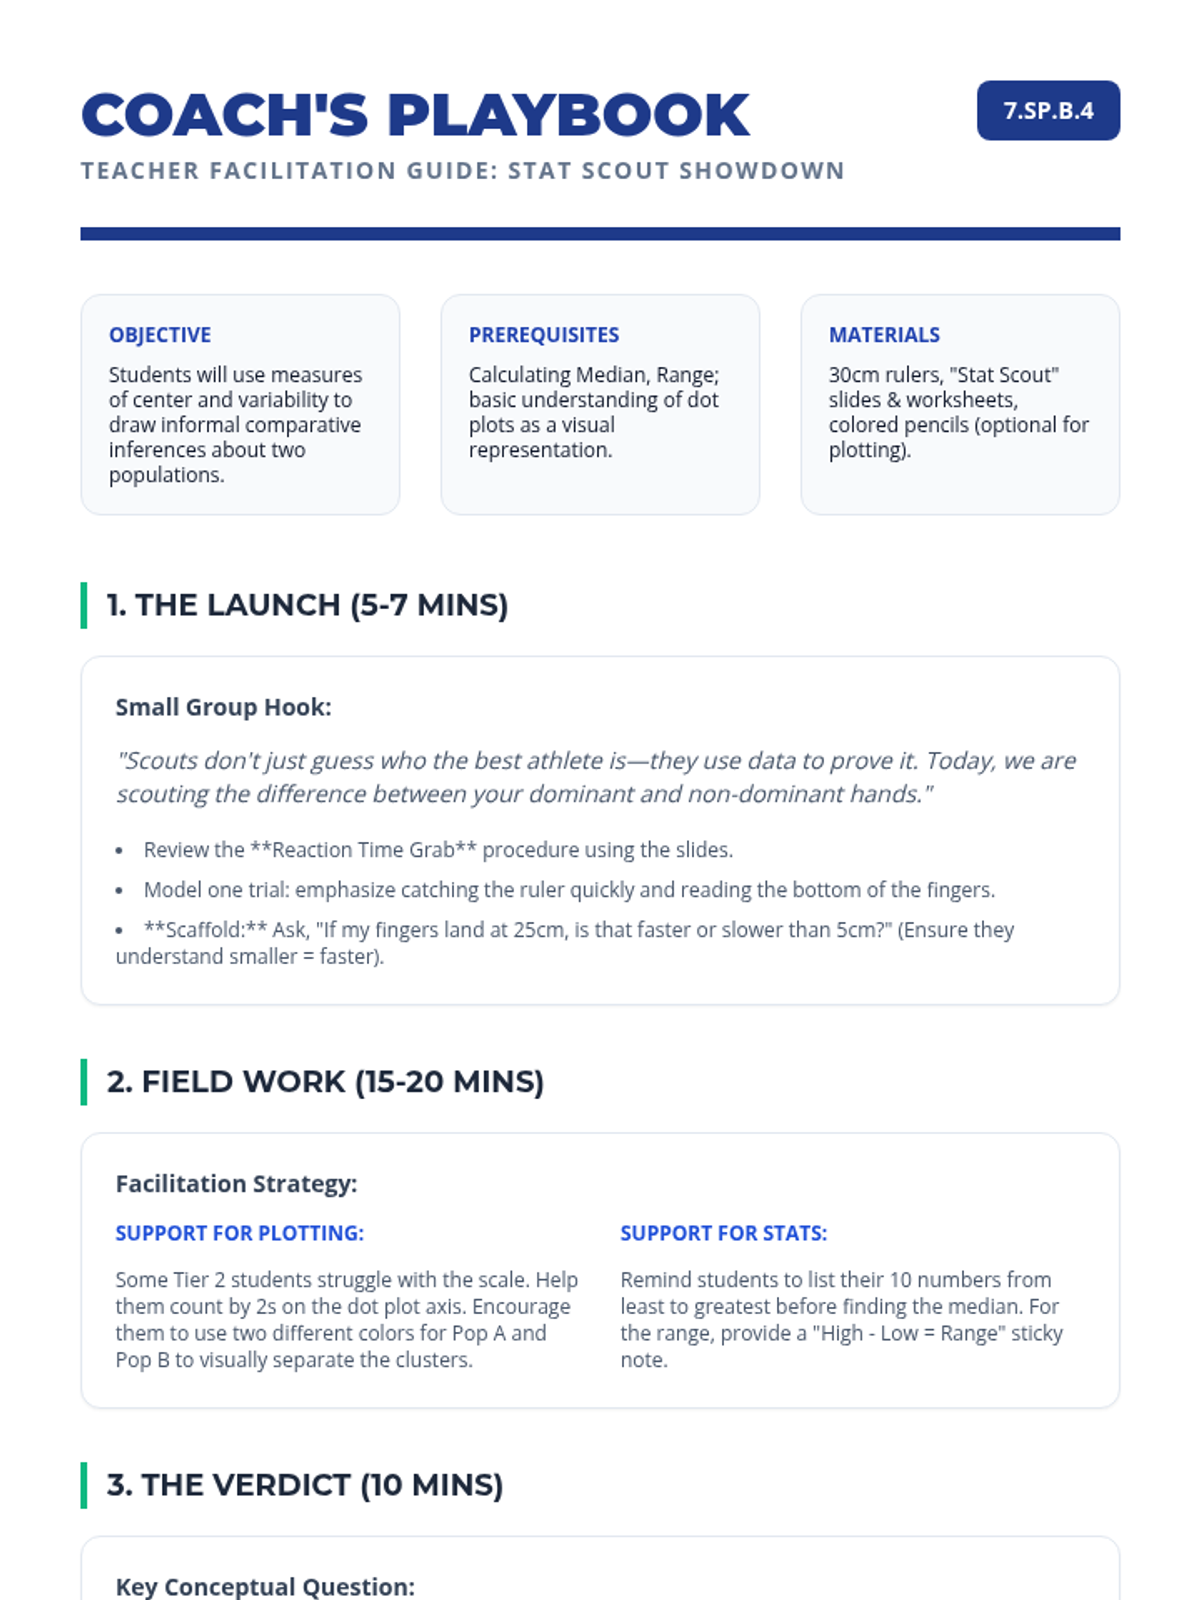
A Tier 2 intervention lesson focusing on drawing comparative inferences about two populations using measures of center and variability through a hands-on reaction time experiment.
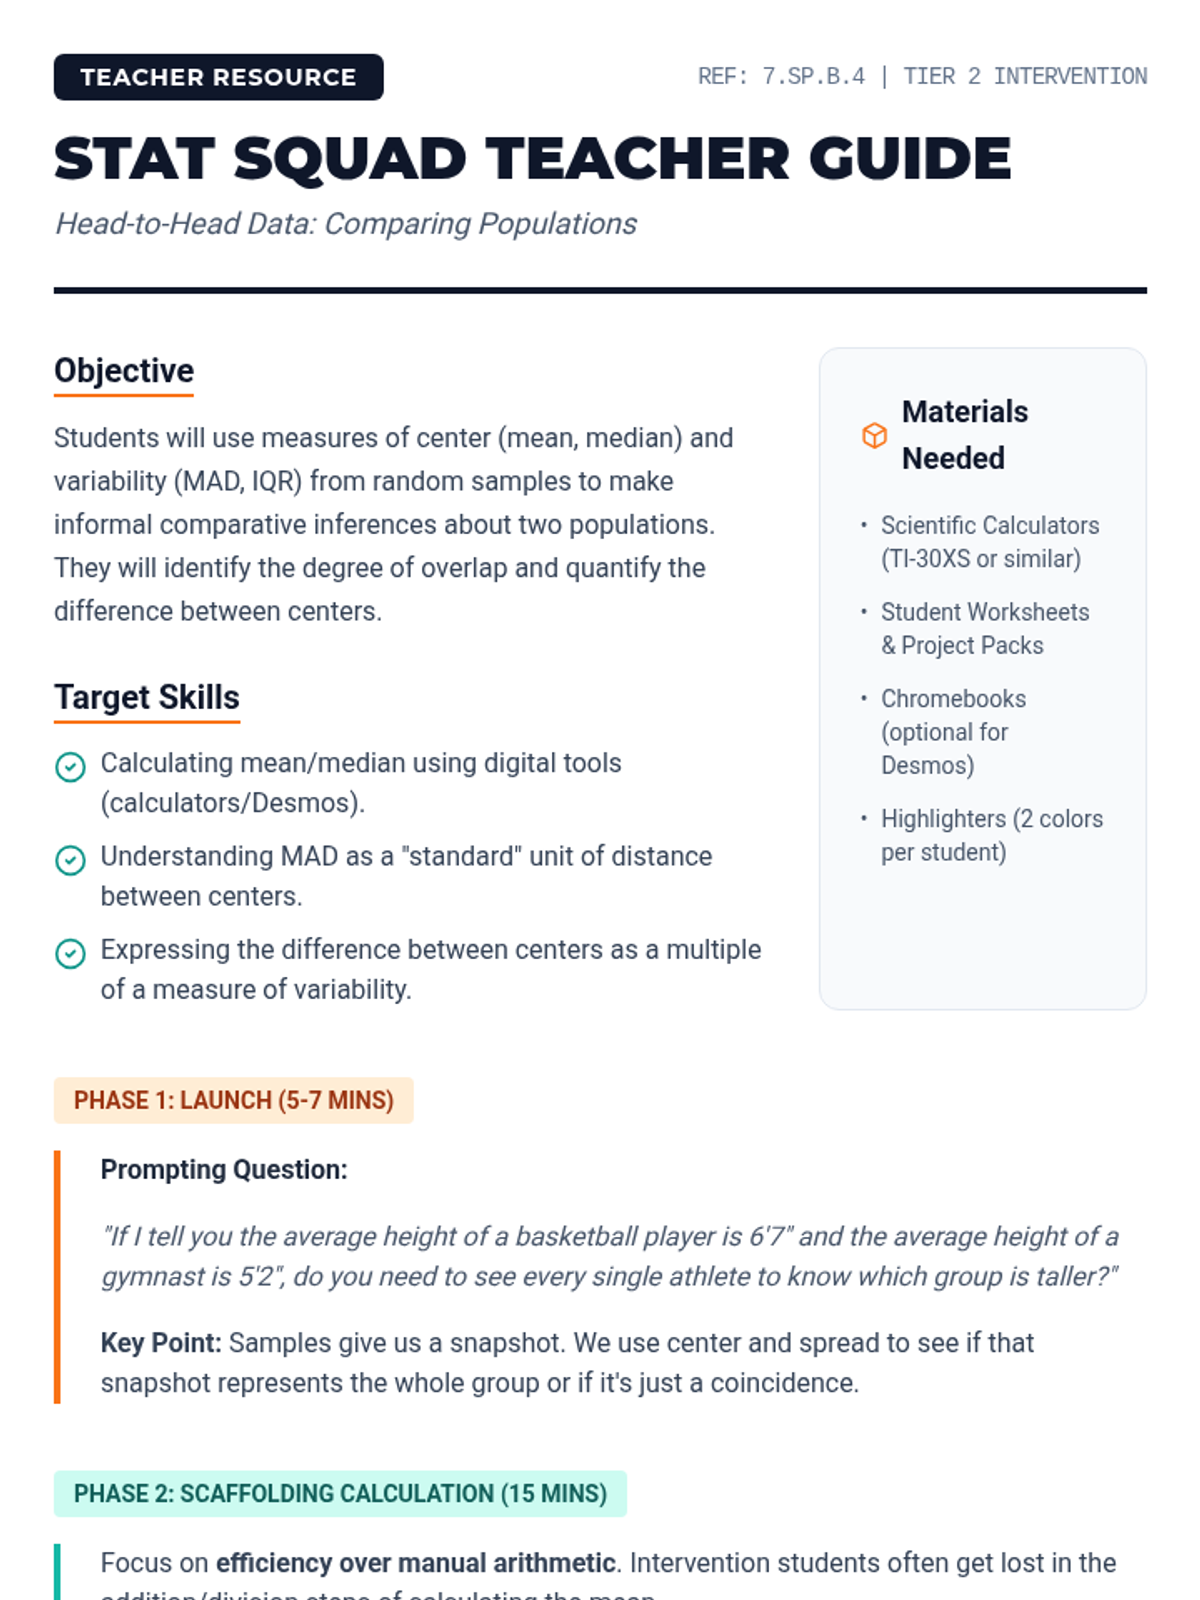
A scaffolded intervention lesson where students compare two populations using mean, median, MAD, and IQR. Includes guided calculator practice and a collaborative data investigation.
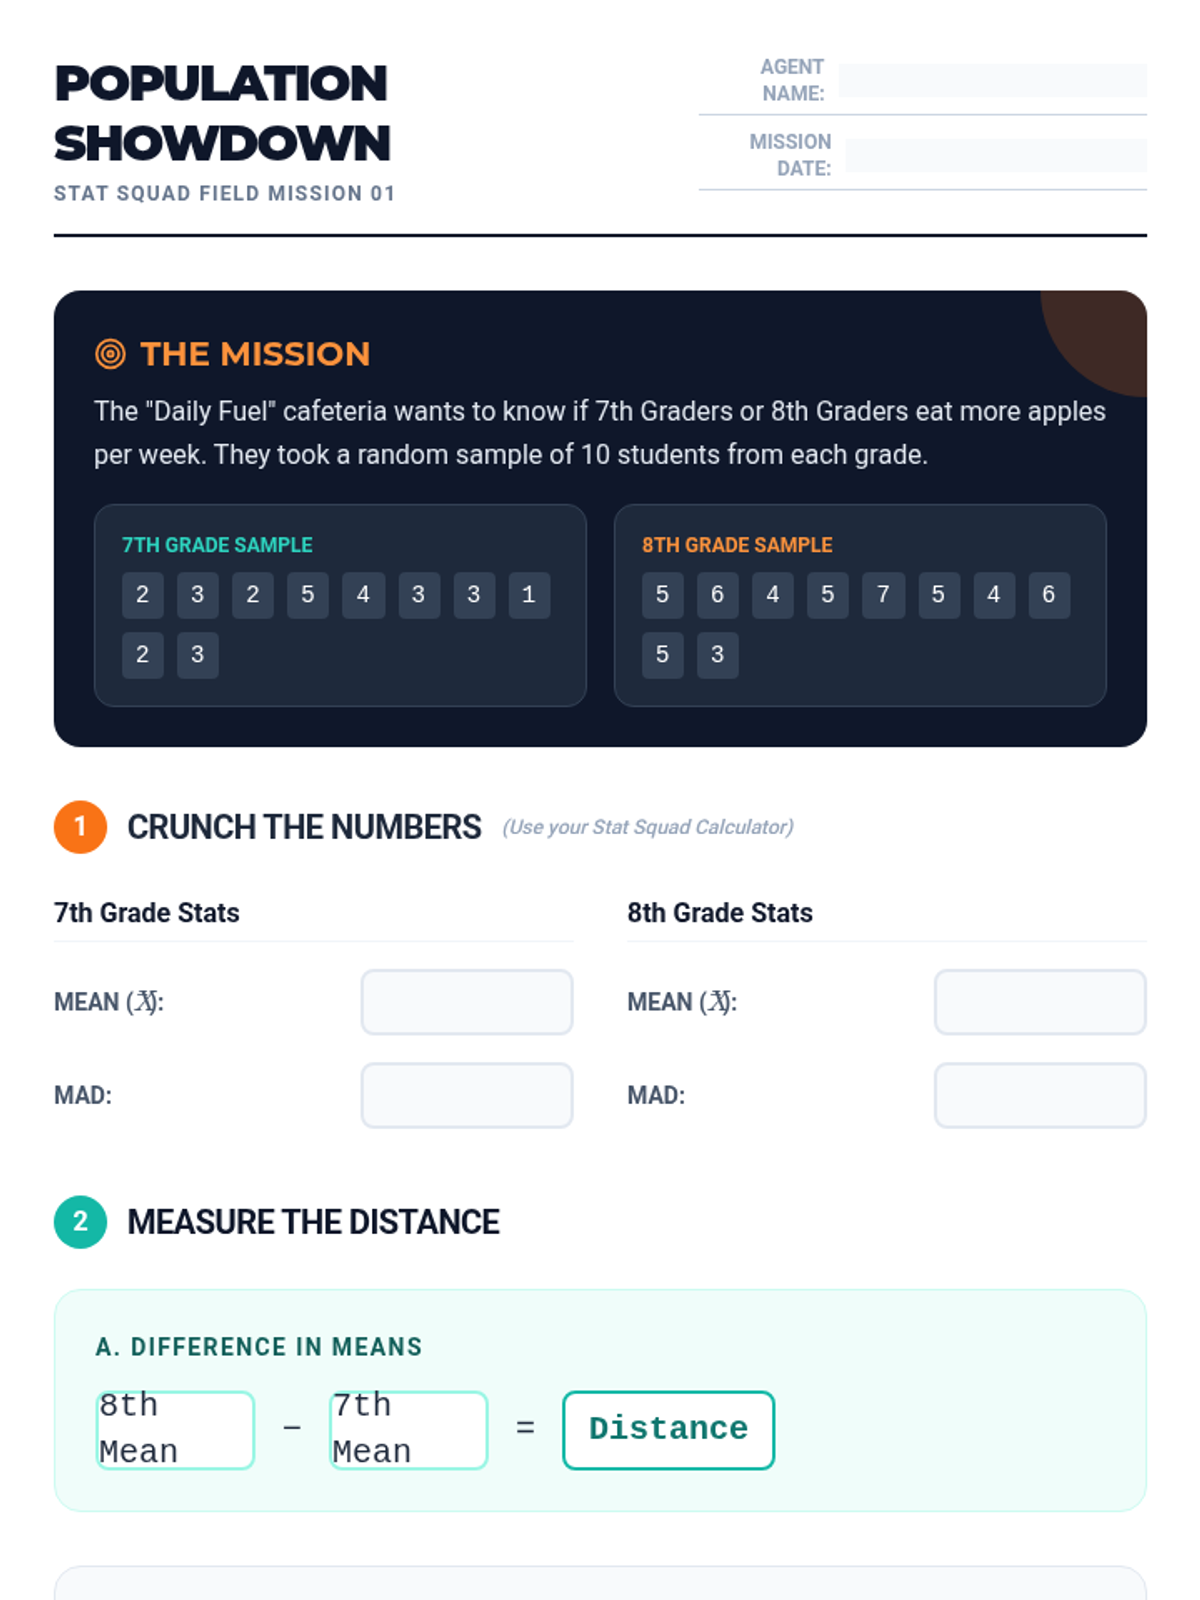
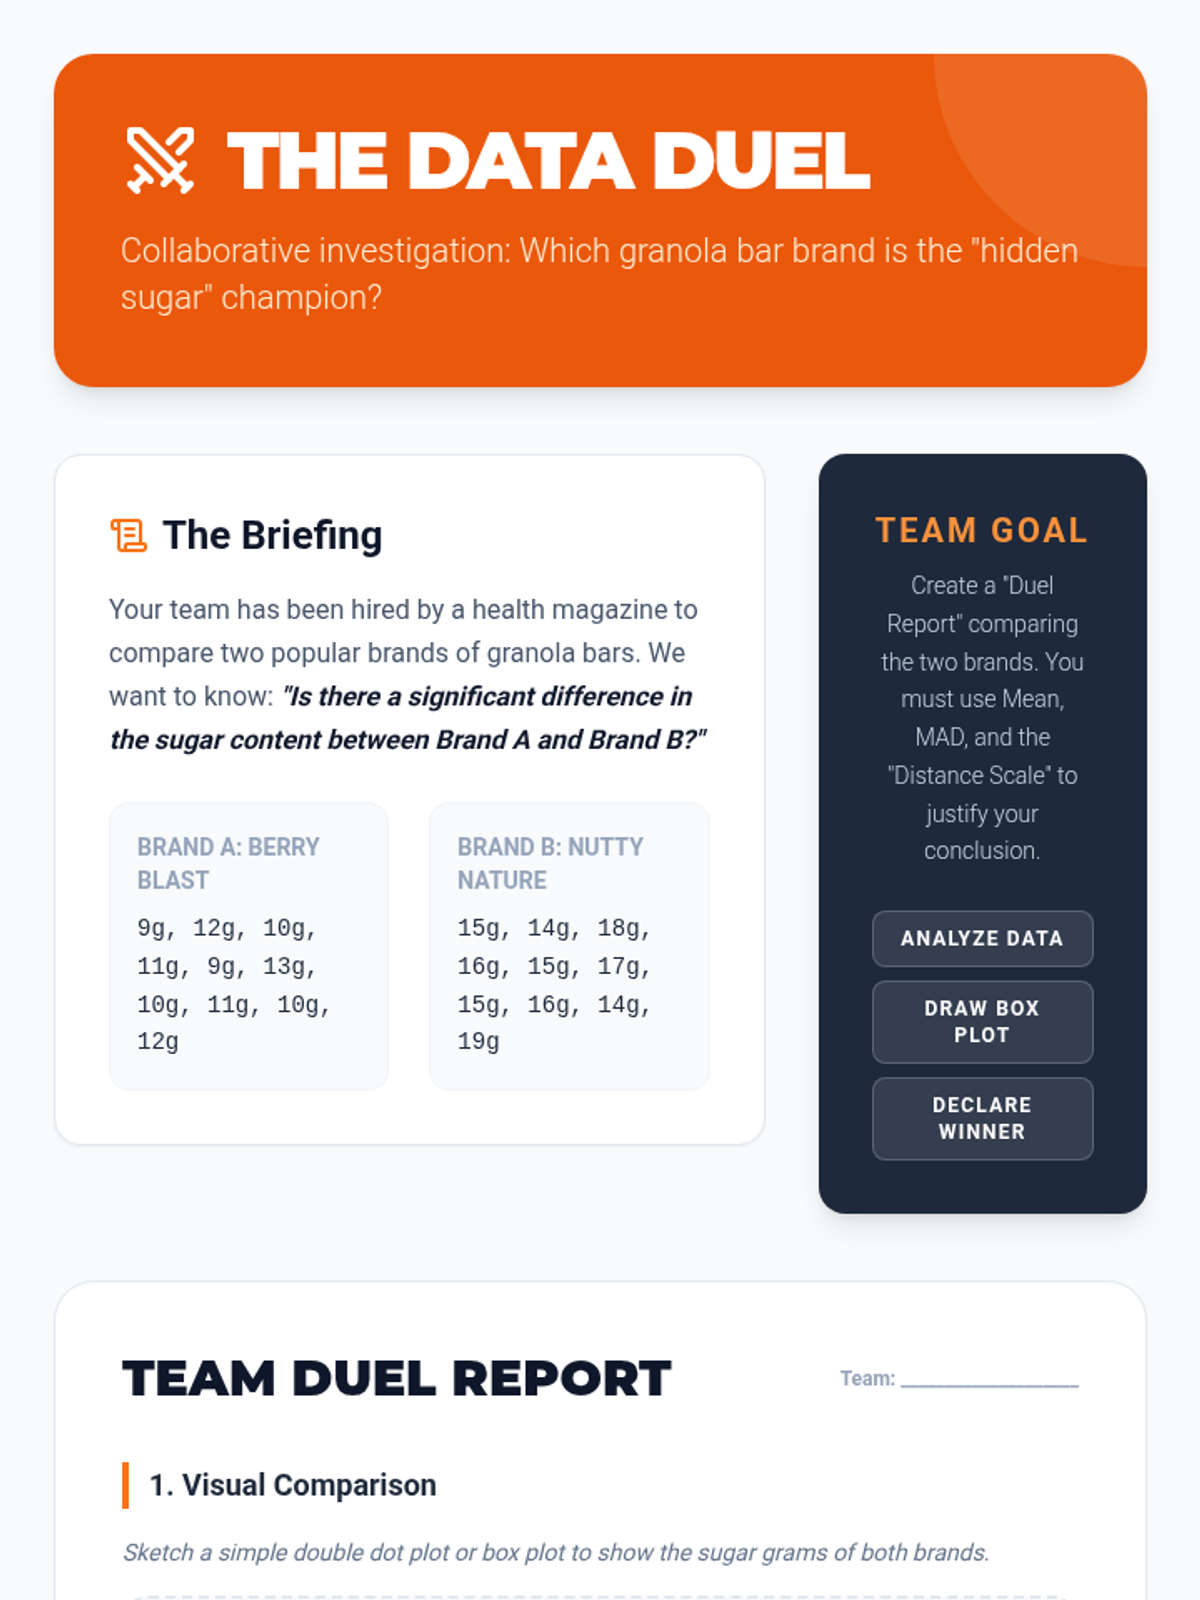
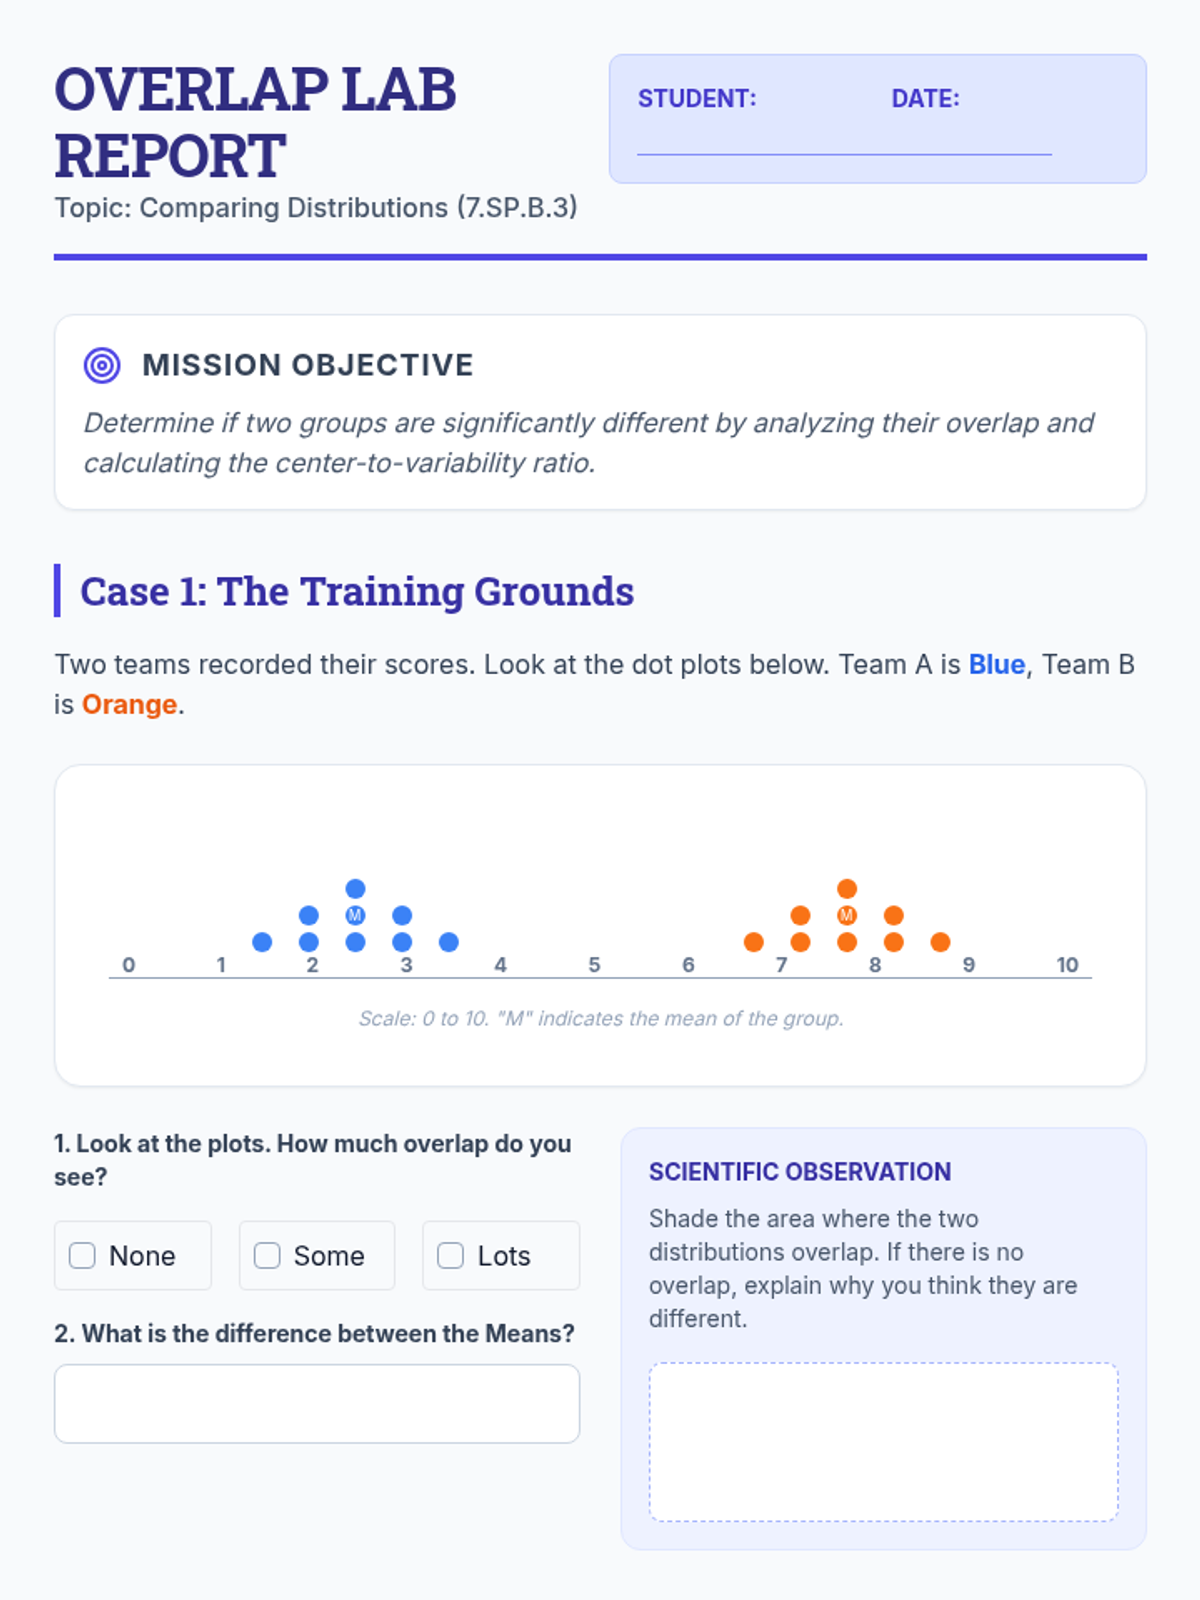
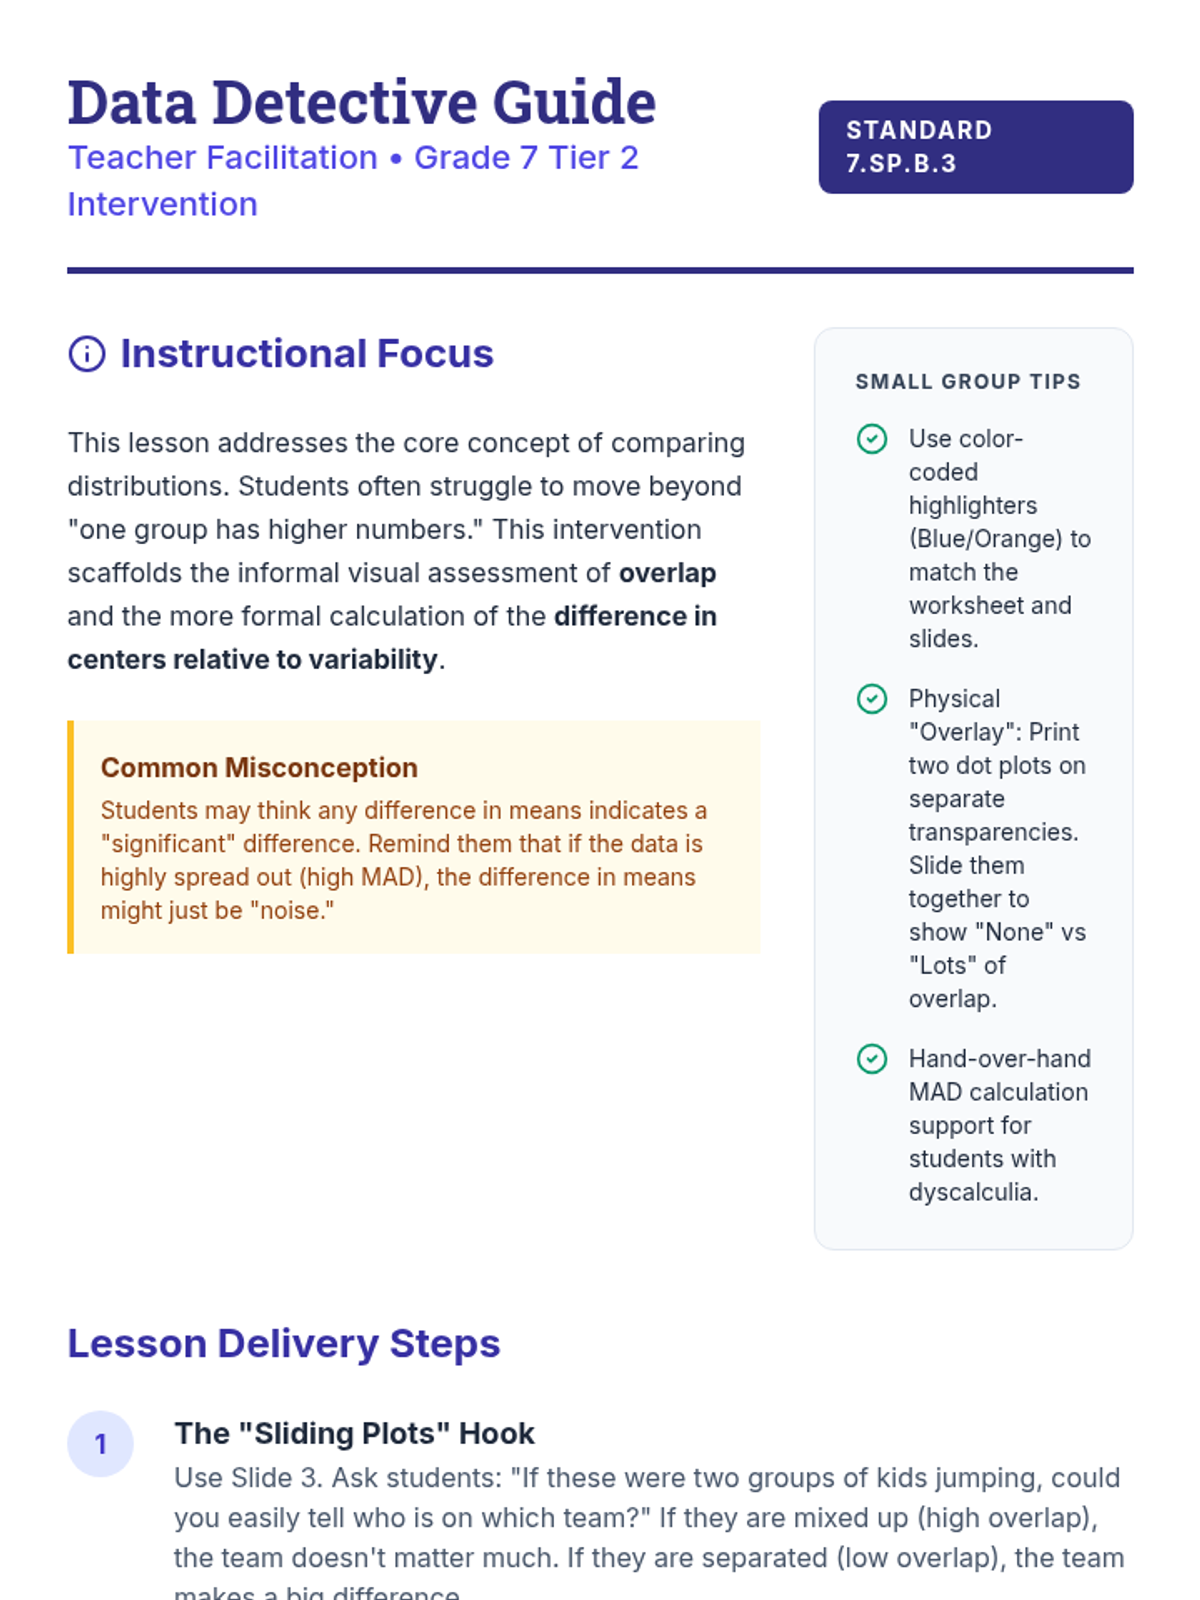
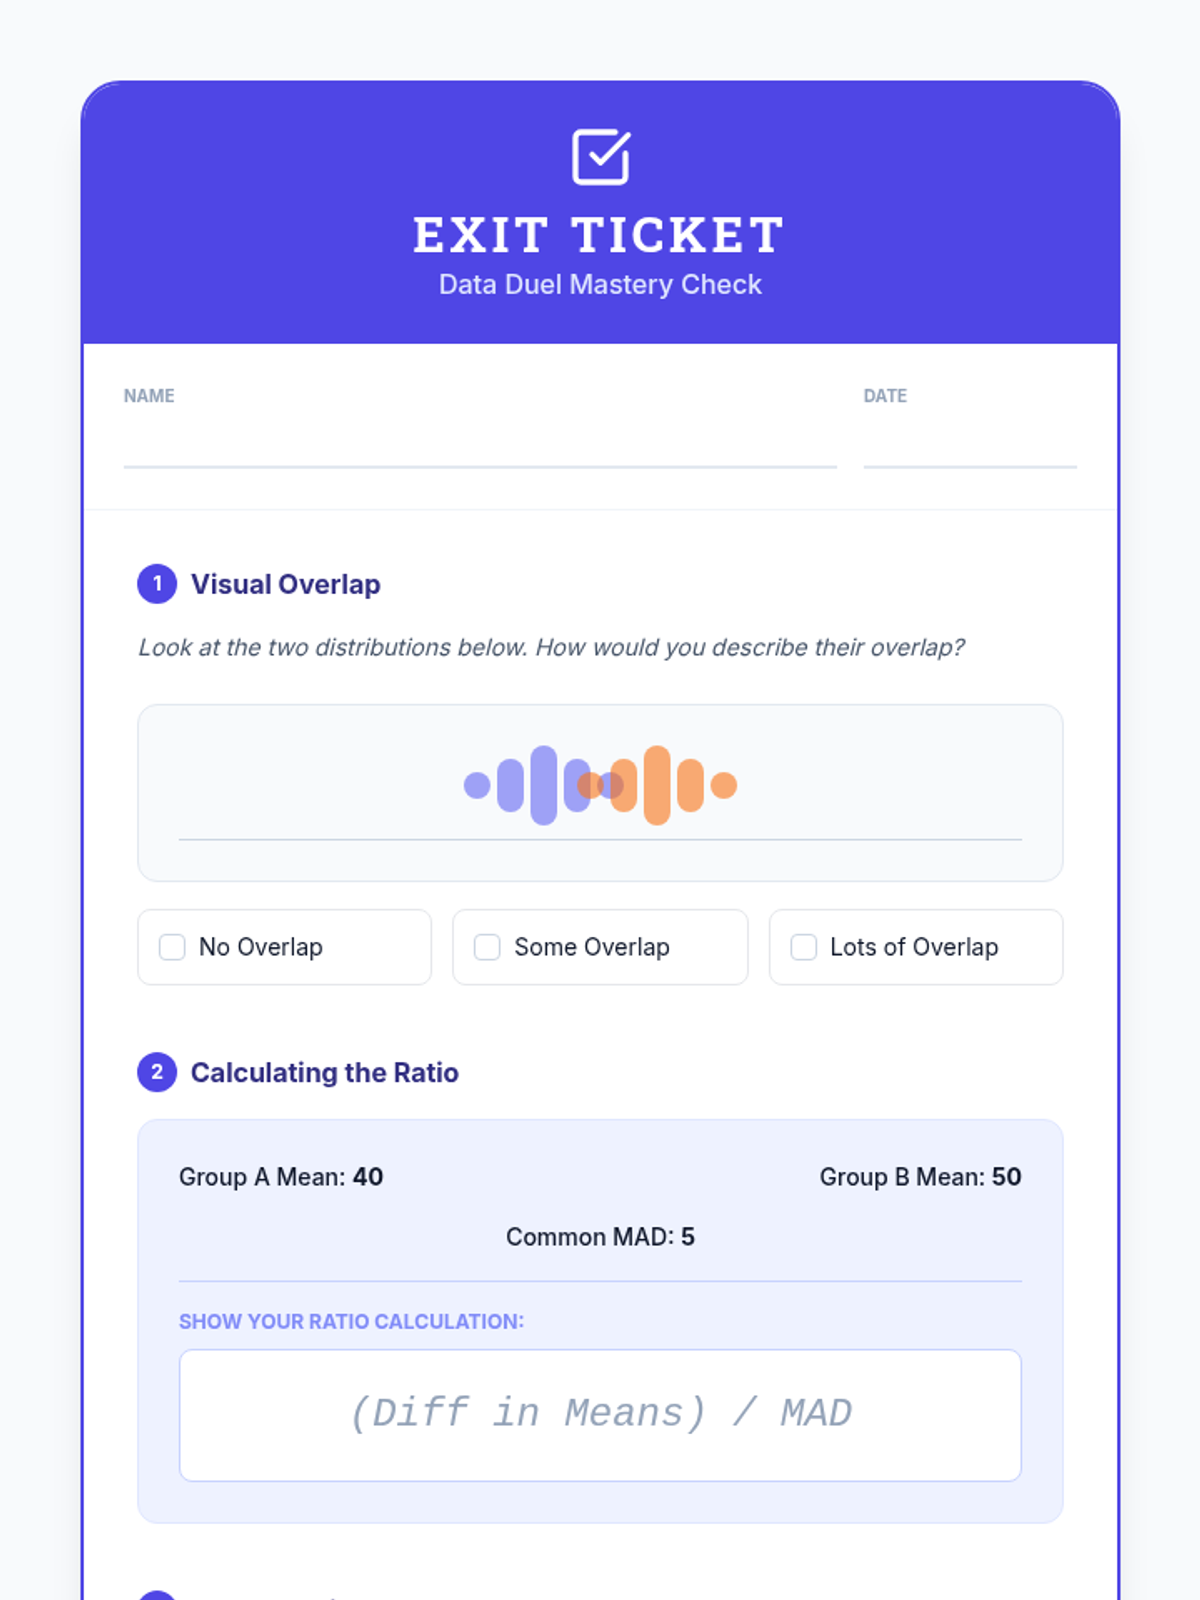
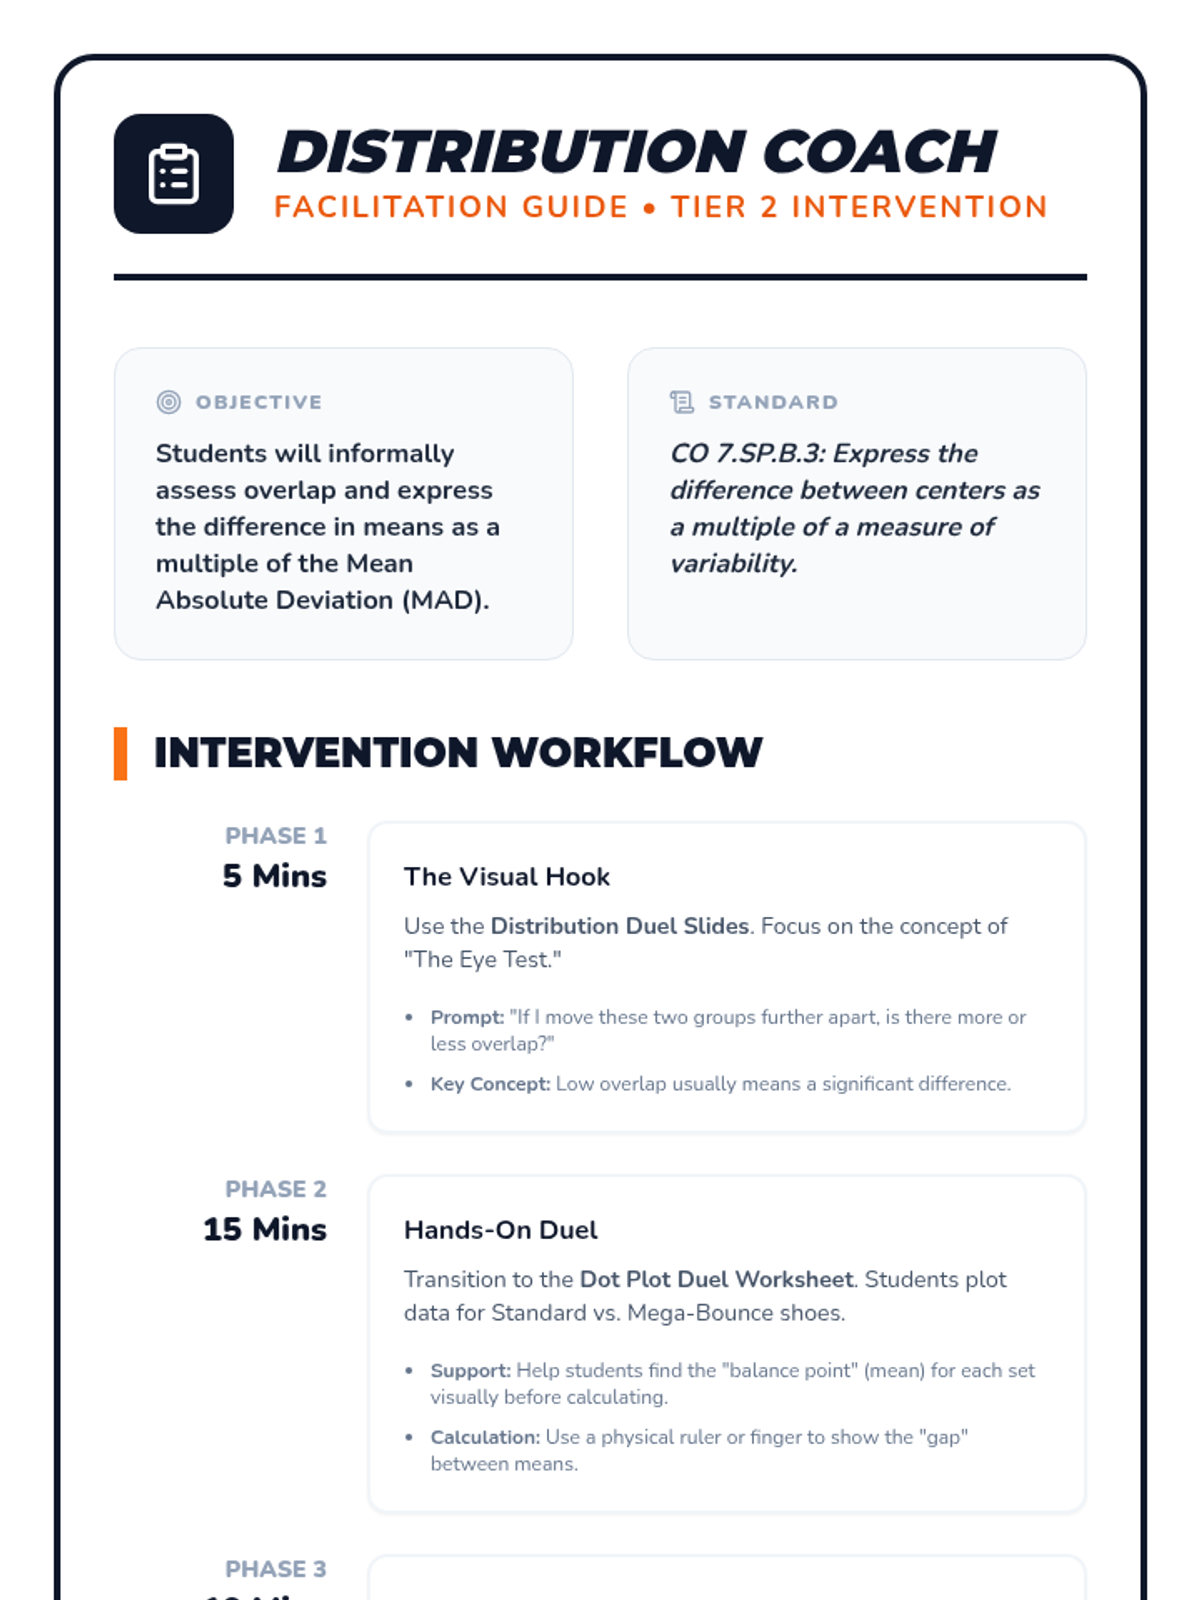
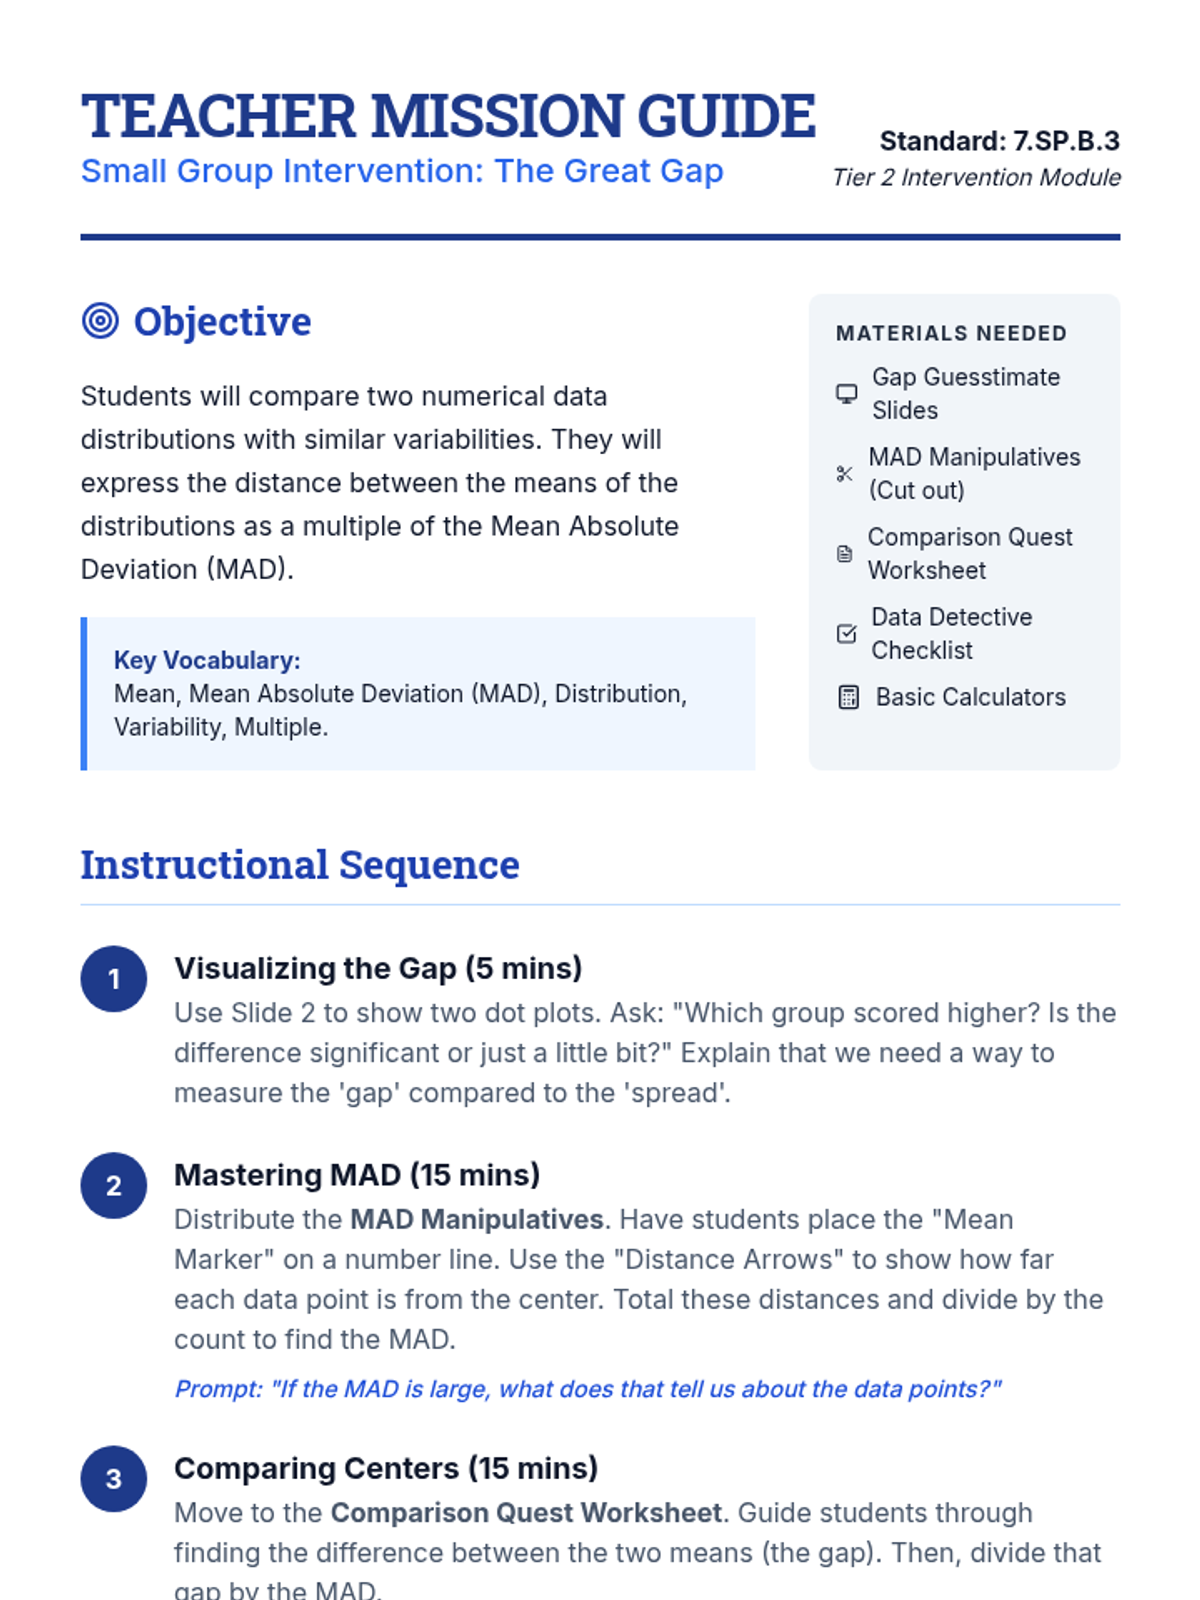
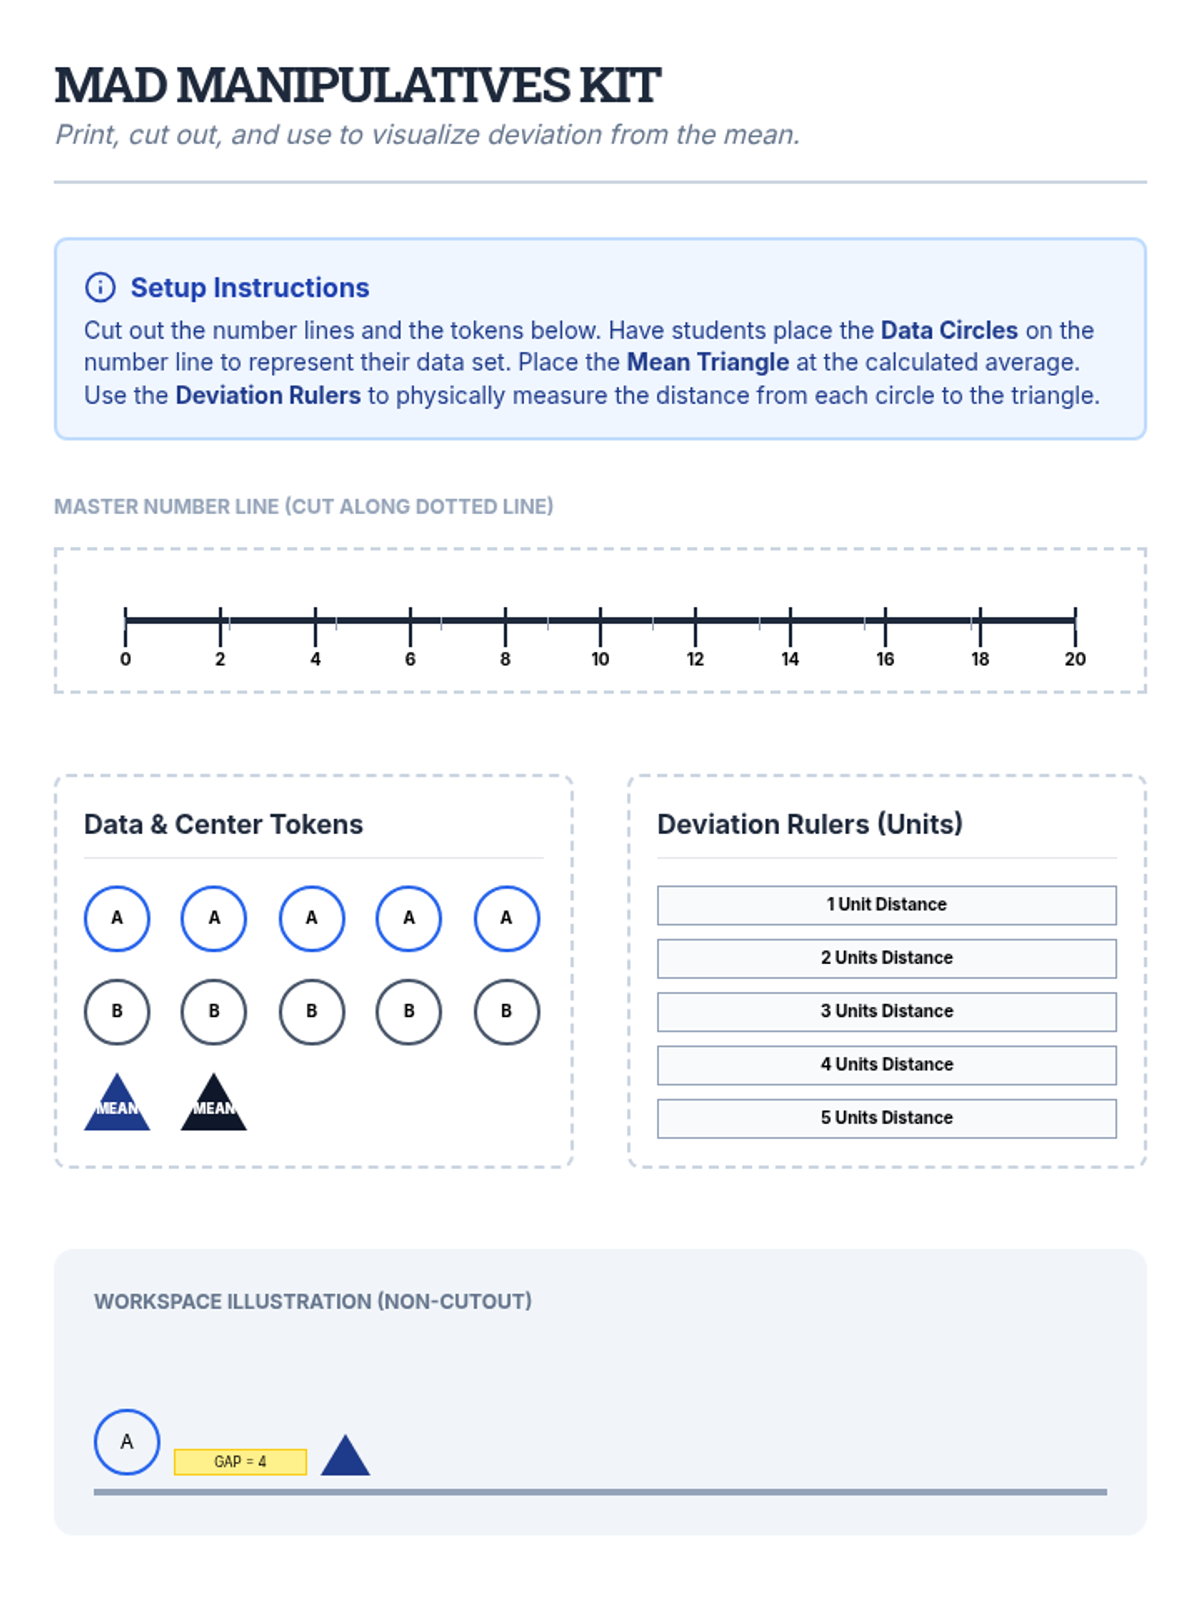
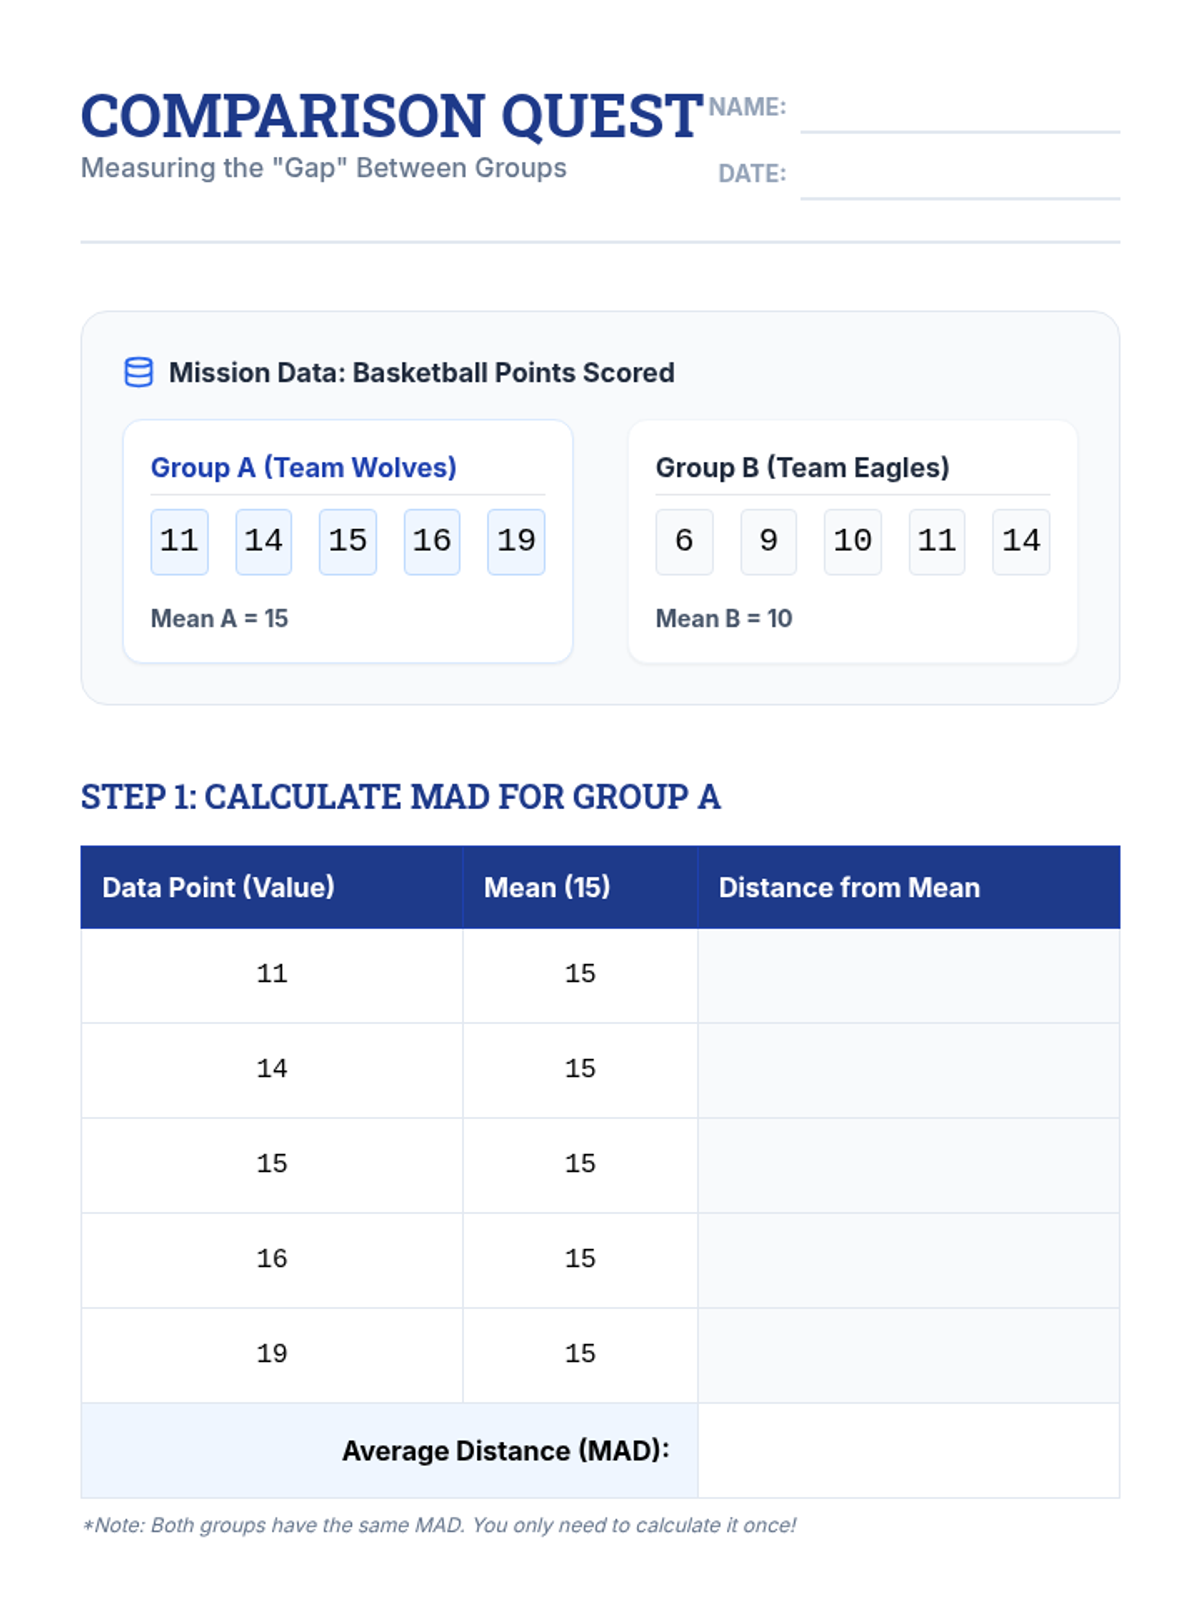
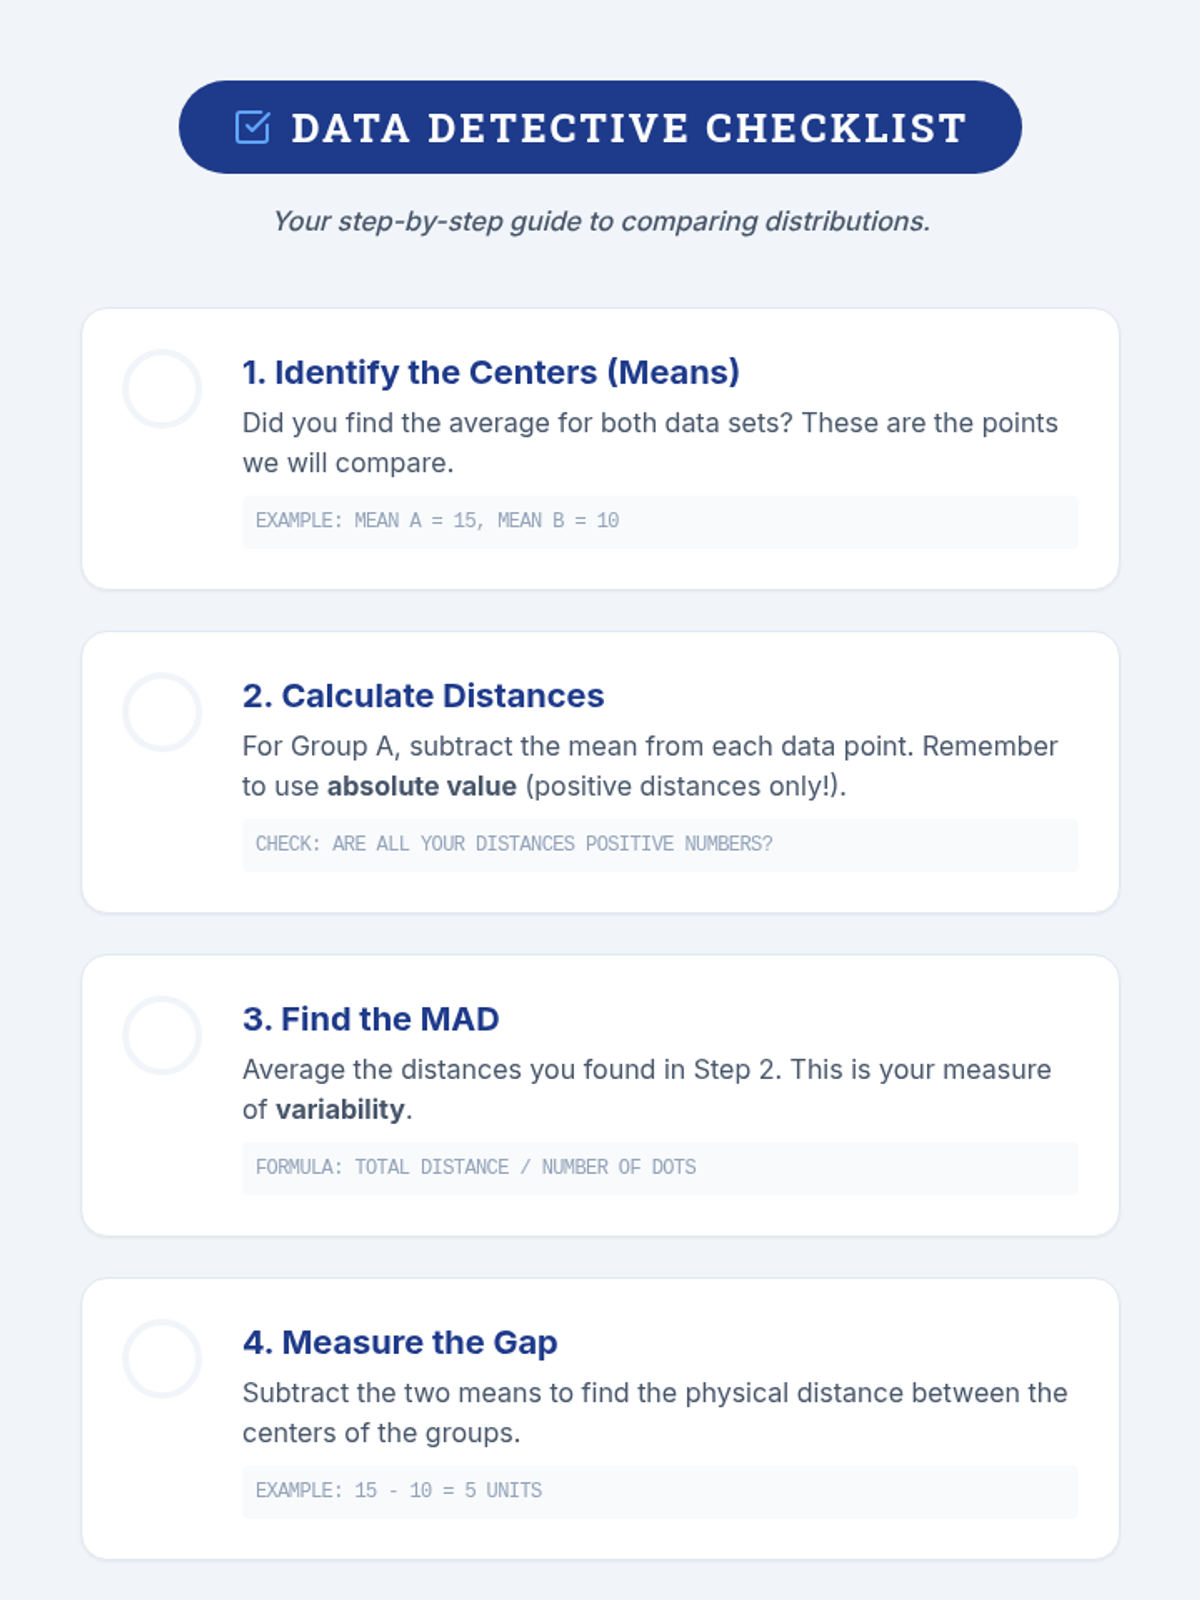
A Tier 2 intervention lesson focusing on comparing two numerical data distributions. Students will learn to informally assess visual overlap and express the difference between centers as a multiple of variability (MAD).
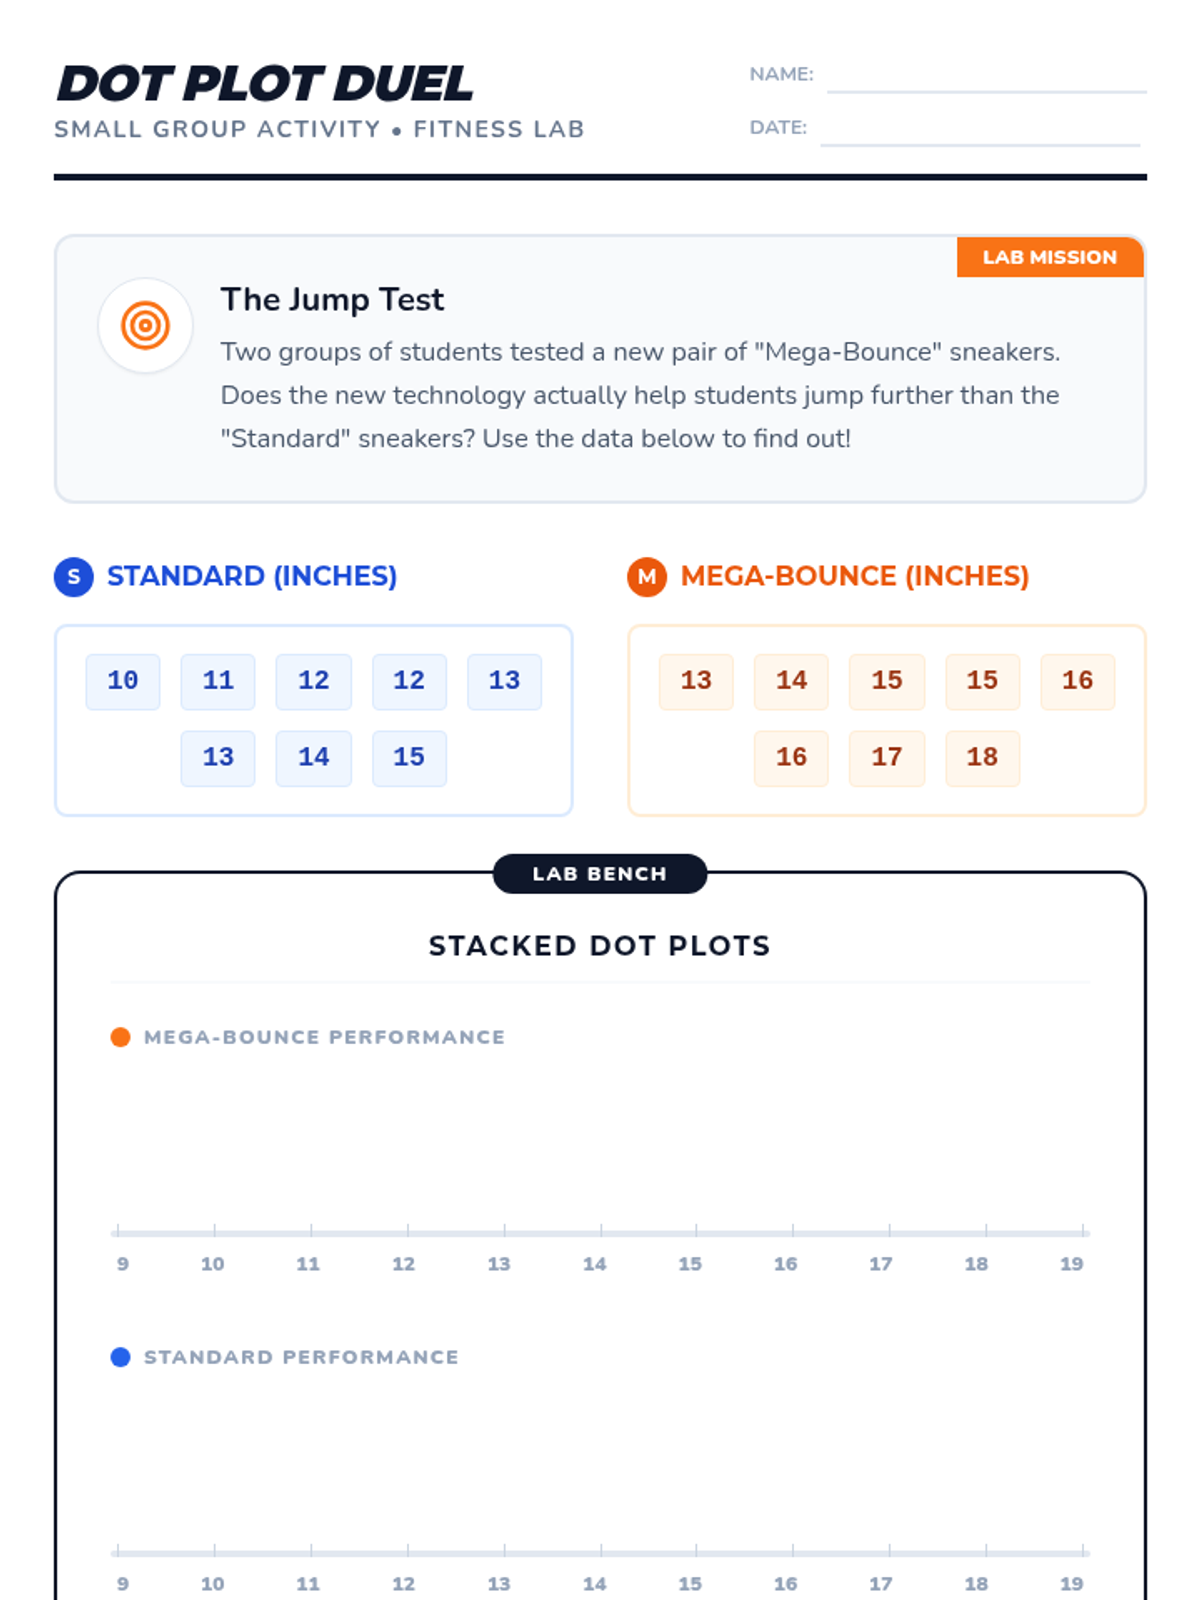
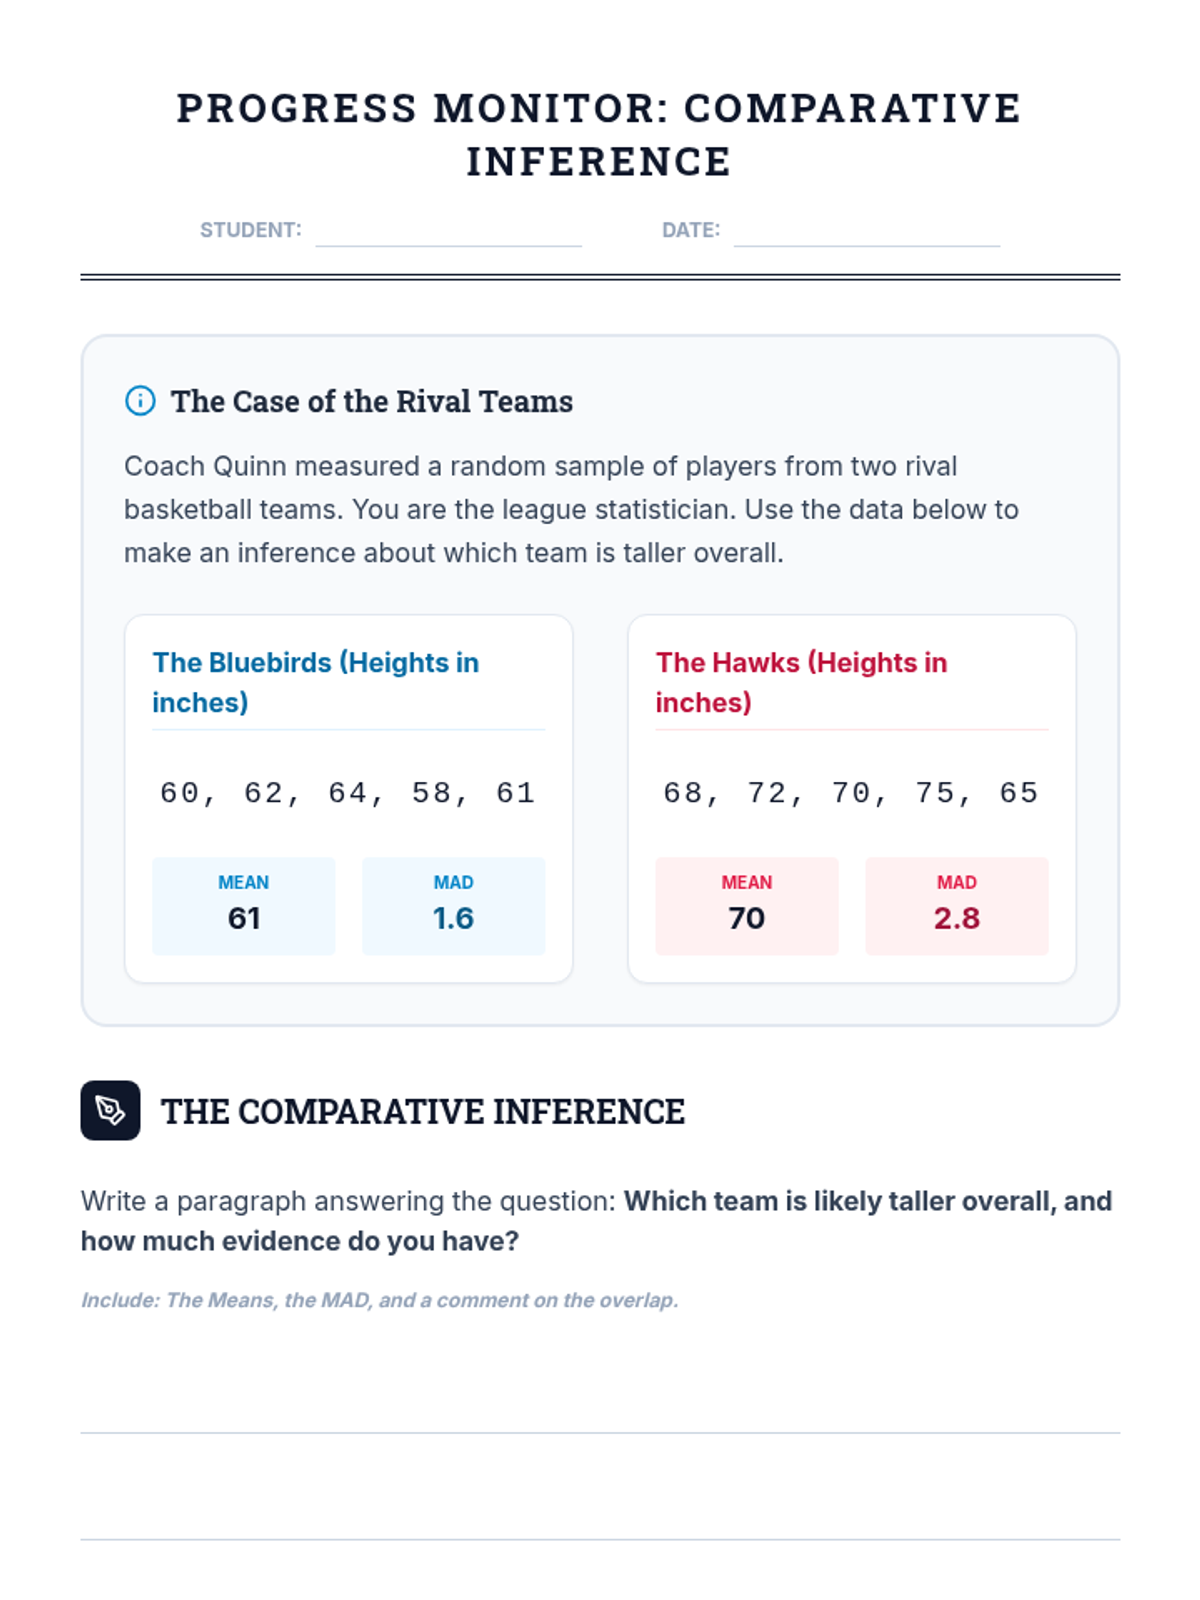
A targeted intervention lesson focusing on comparing two data distributions using back-to-back dot plots, visual overlap, and measures of center and variability. Students will gain hands-on experience calculating differences in means relative to the Mean Absolute Deviation (MAD).
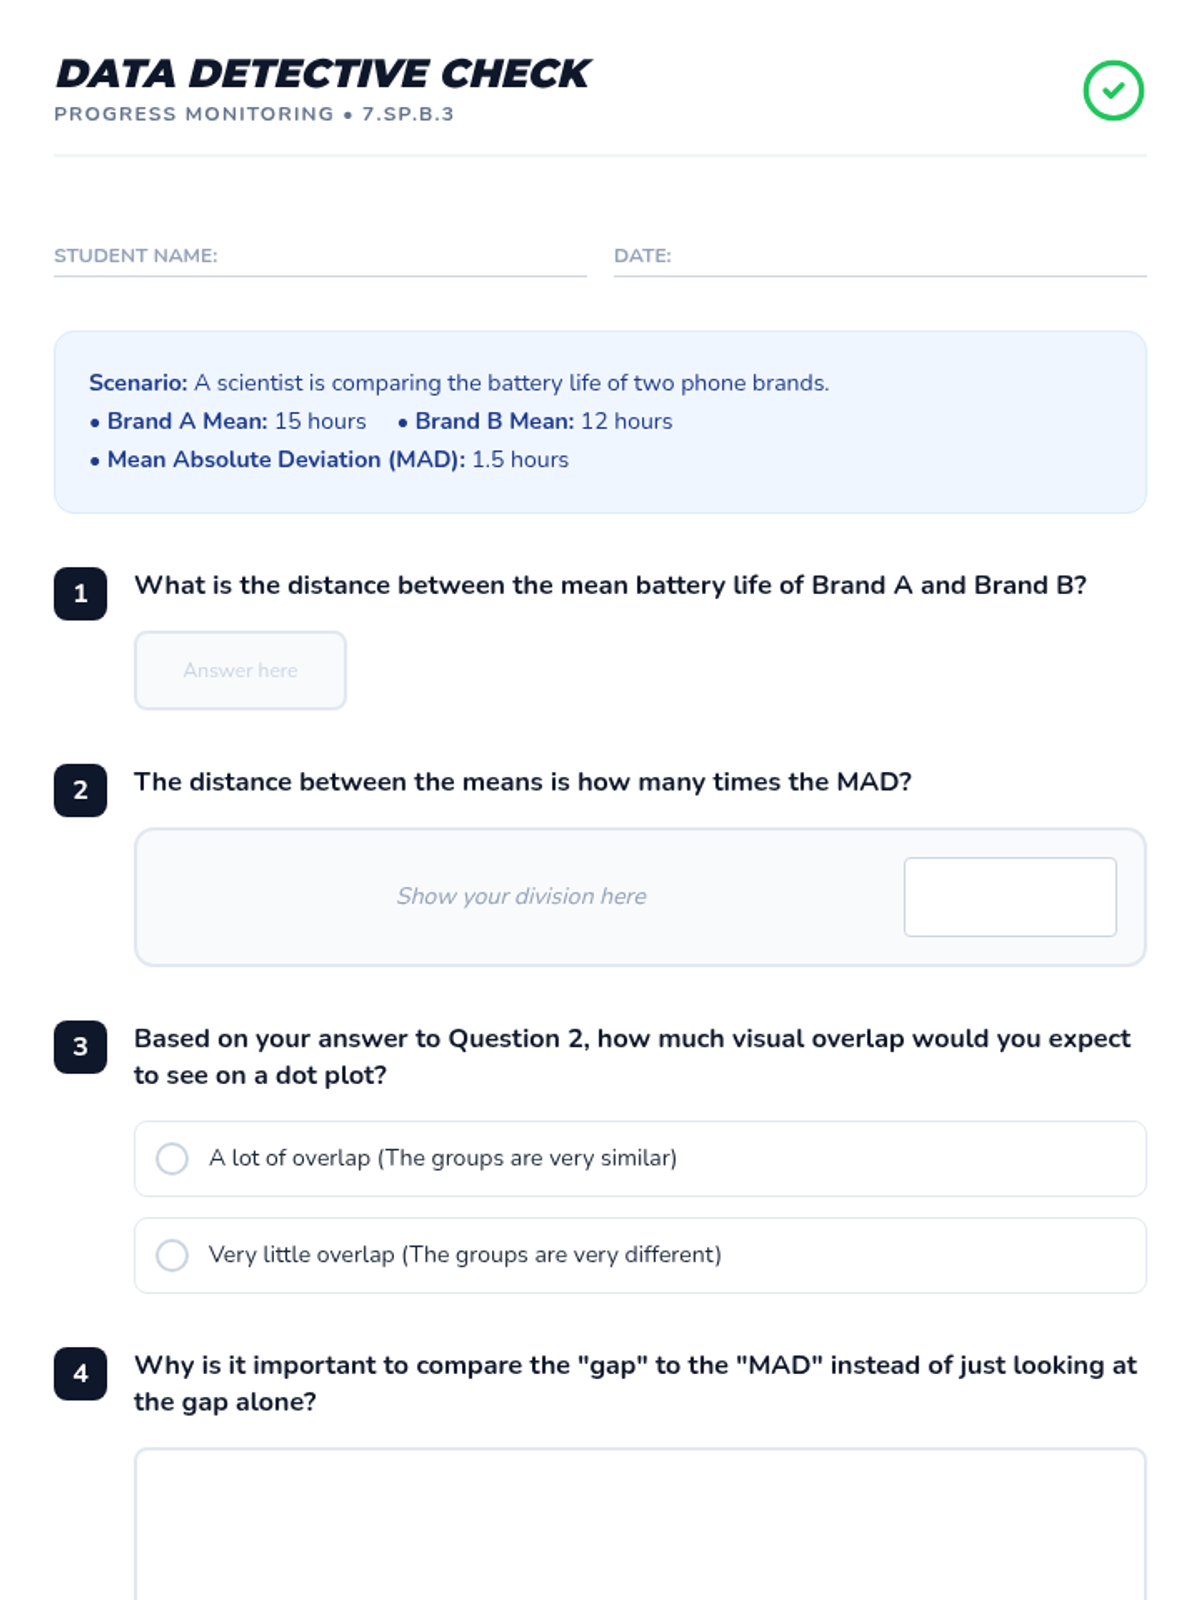
A Tier 2 intervention lesson for 7th grade students focusing on comparing data distributions. Students learn to calculate Mean Absolute Deviation (MAD) and express the difference between centers as a multiple of that variability.
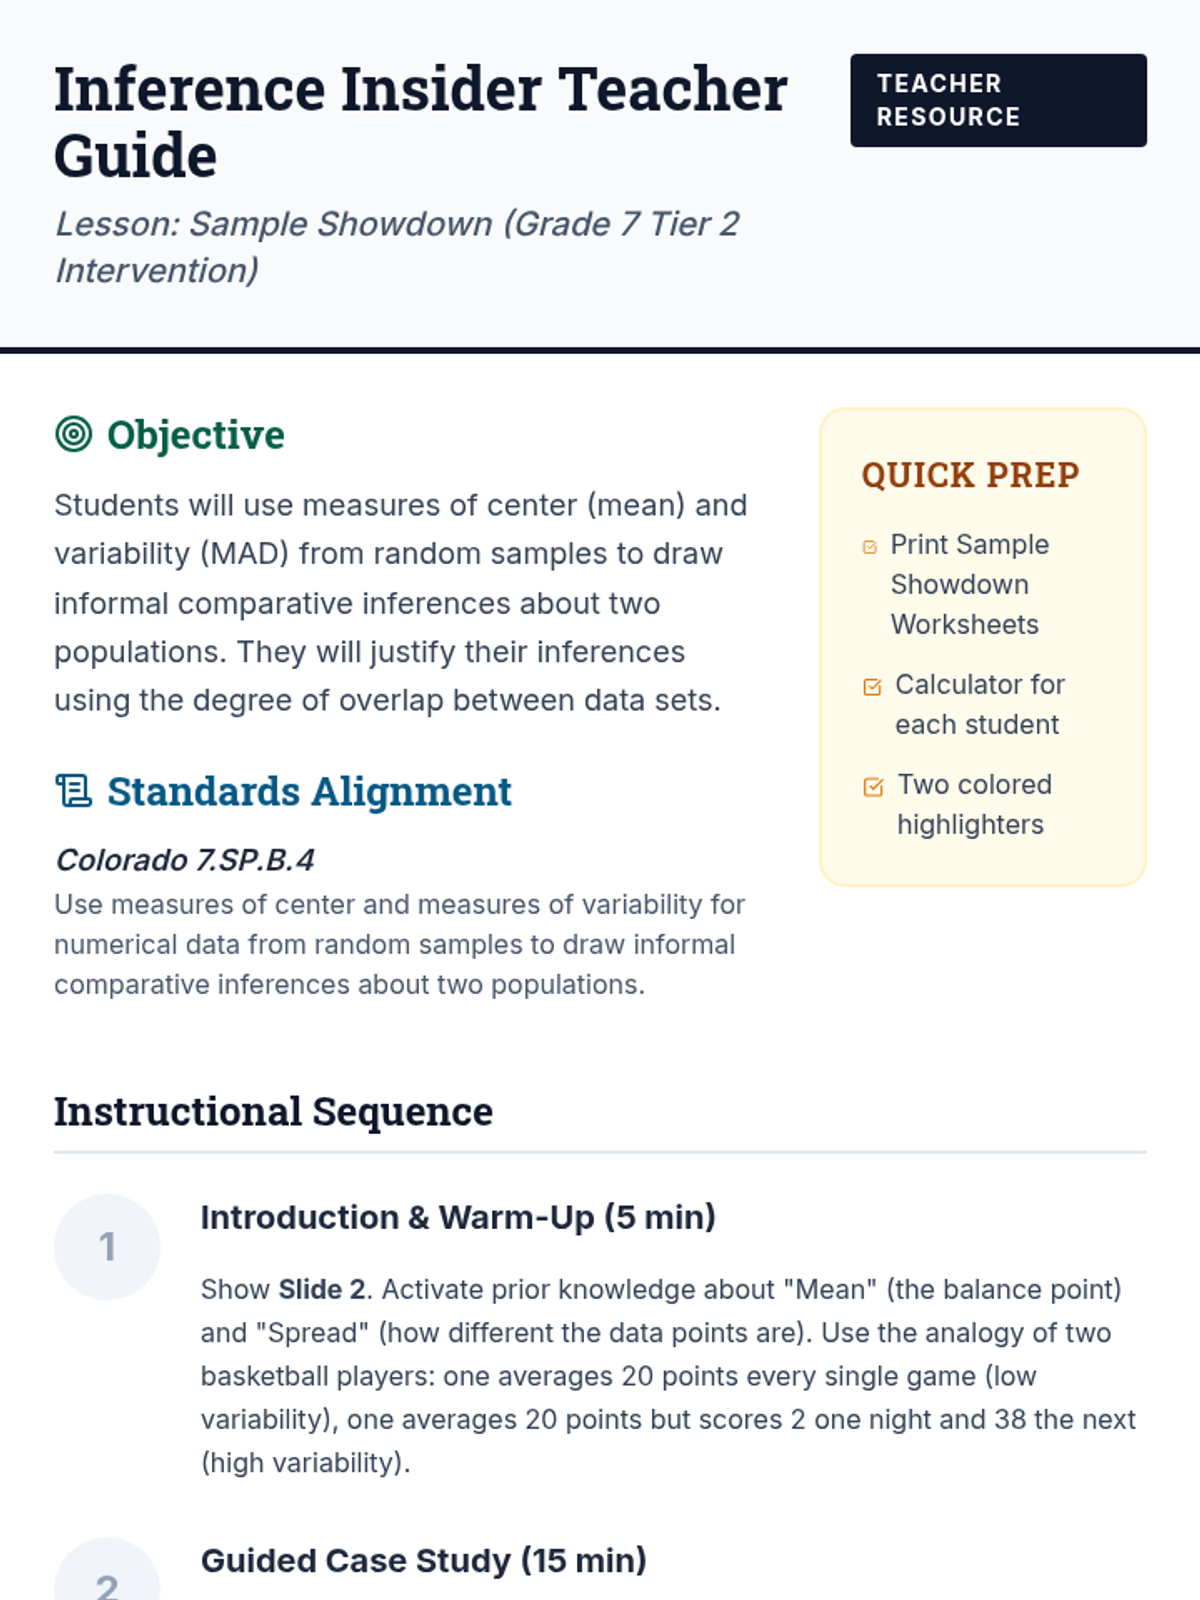
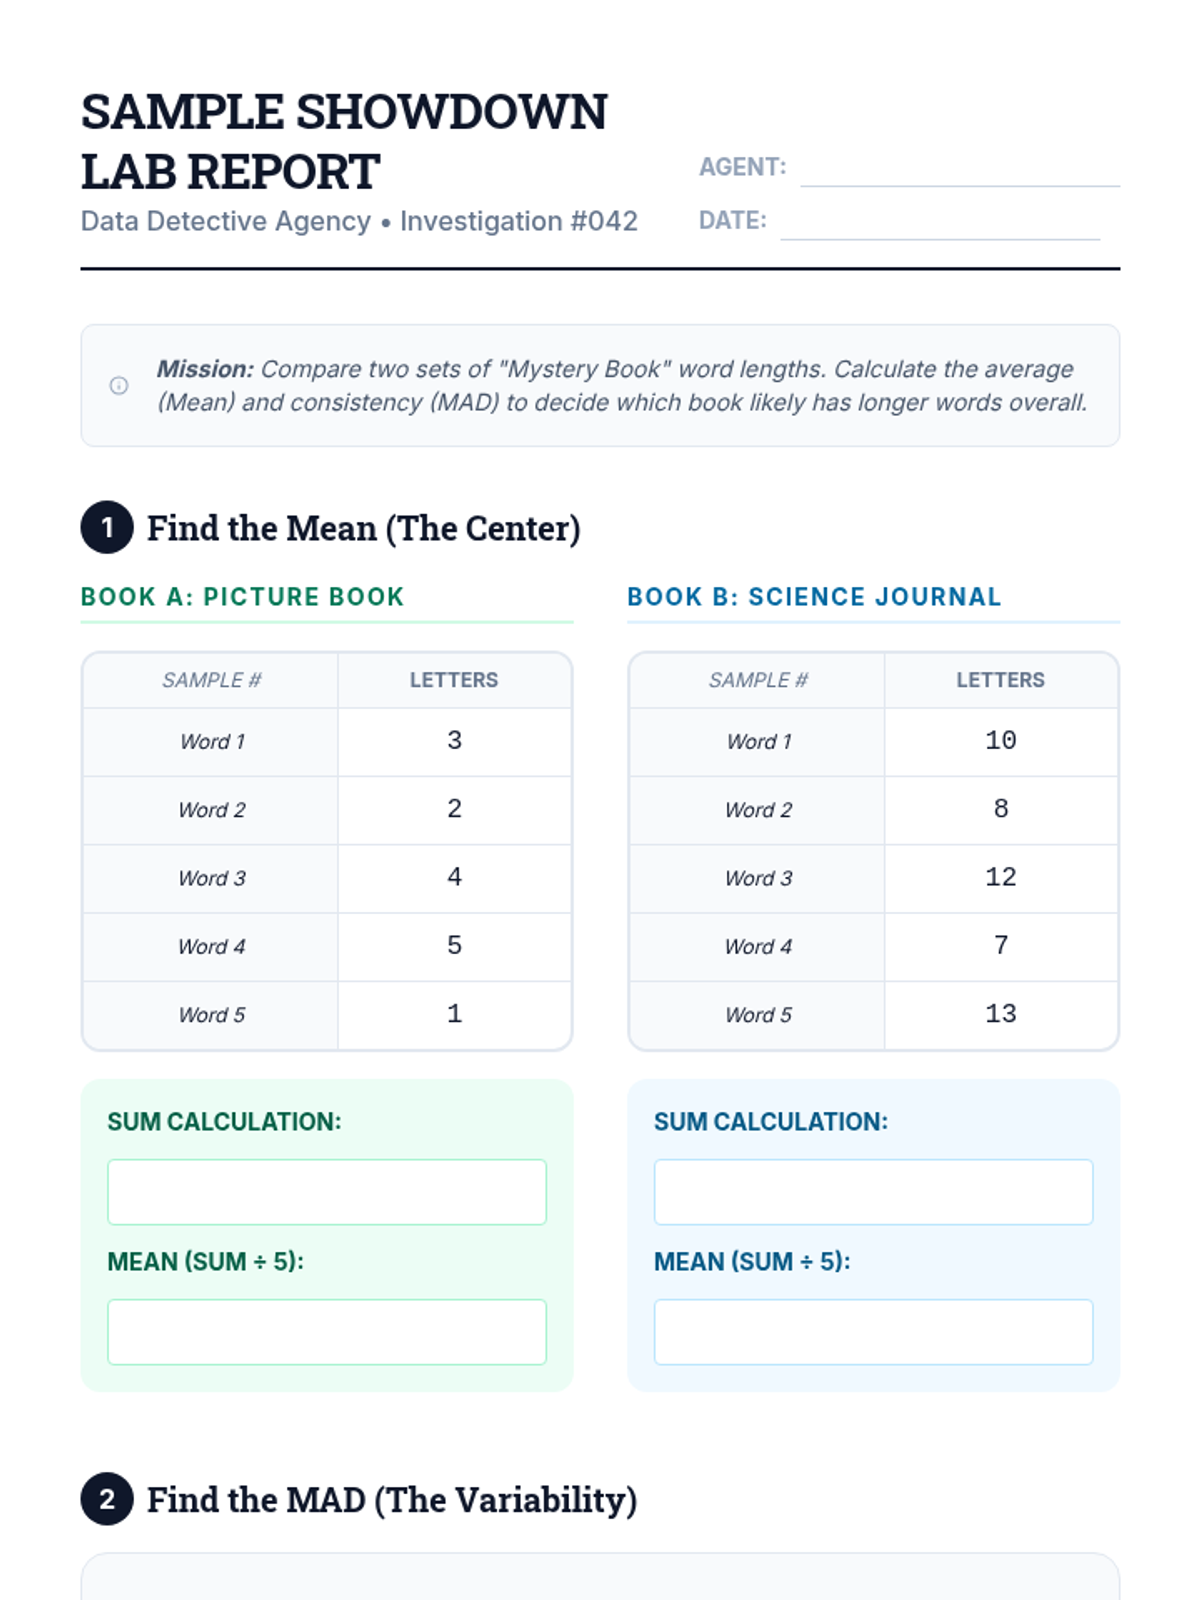
A targeted intervention lesson for Grade 7 students on using mean and Mean Absolute Deviation (MAD) from random samples to make comparative inferences about two populations, specifically word lengths in different texts.
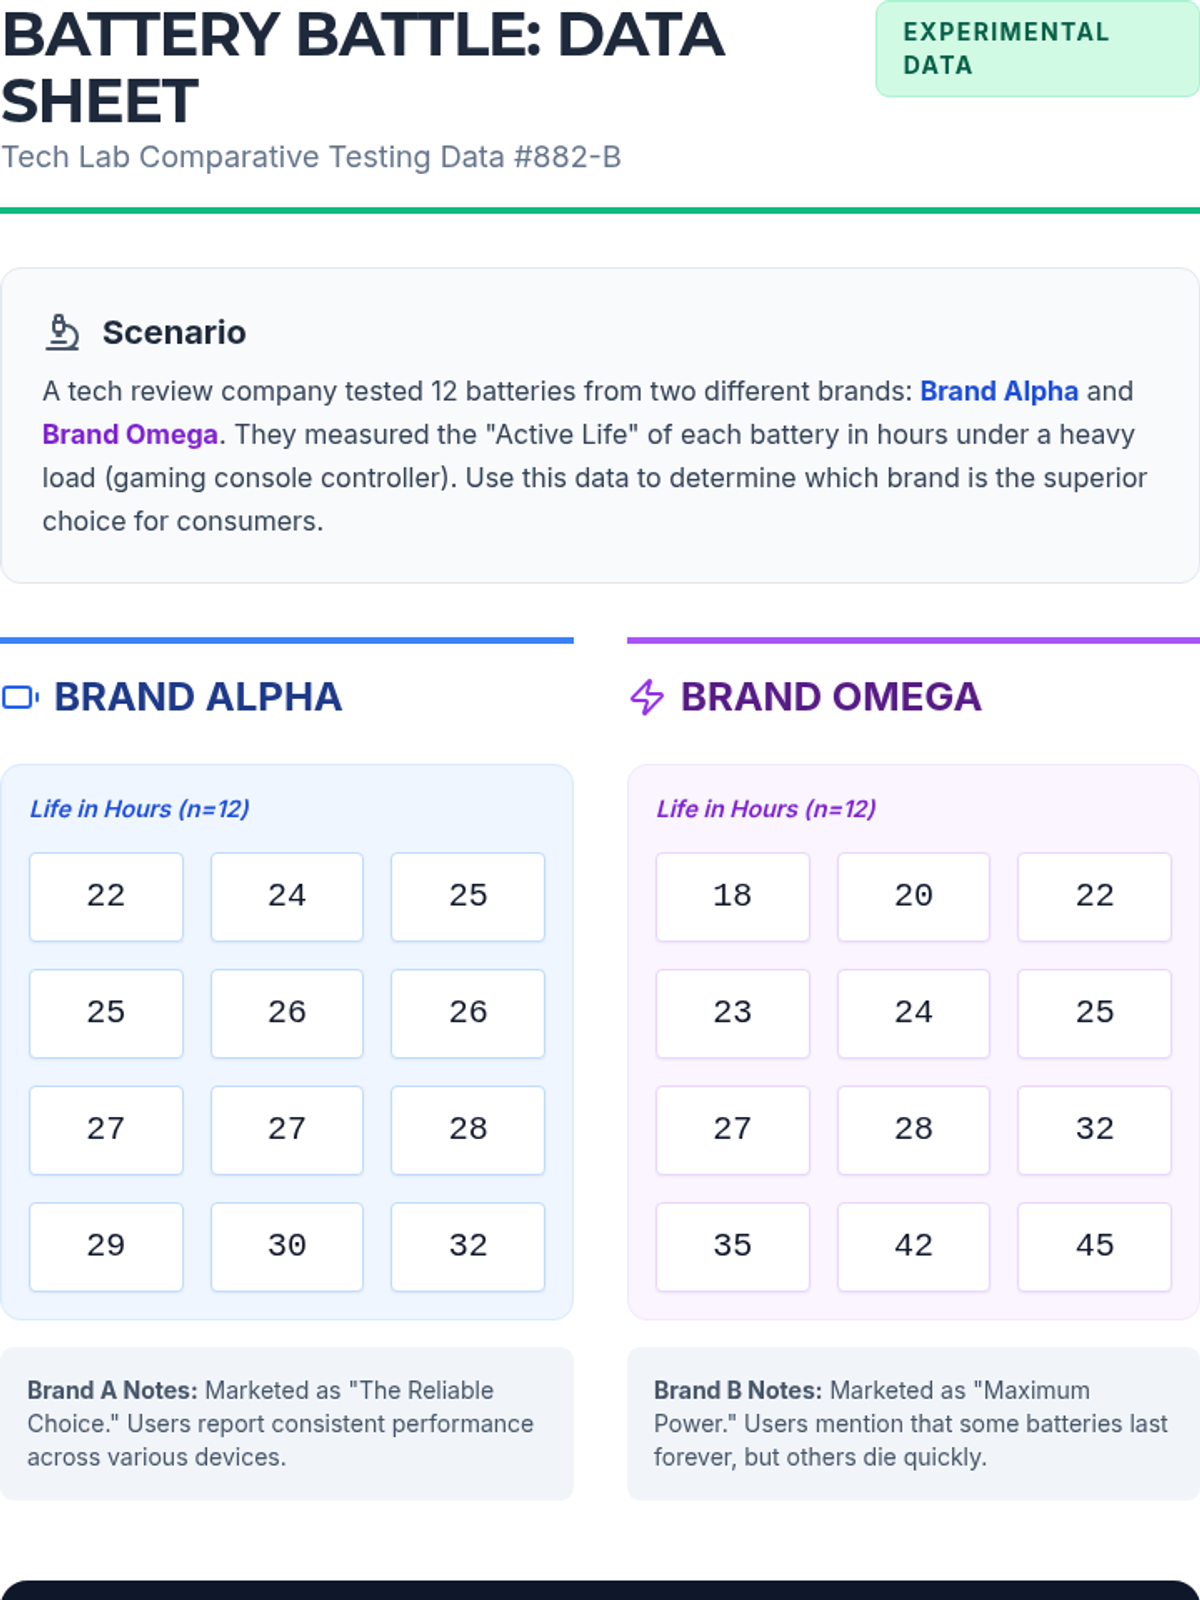
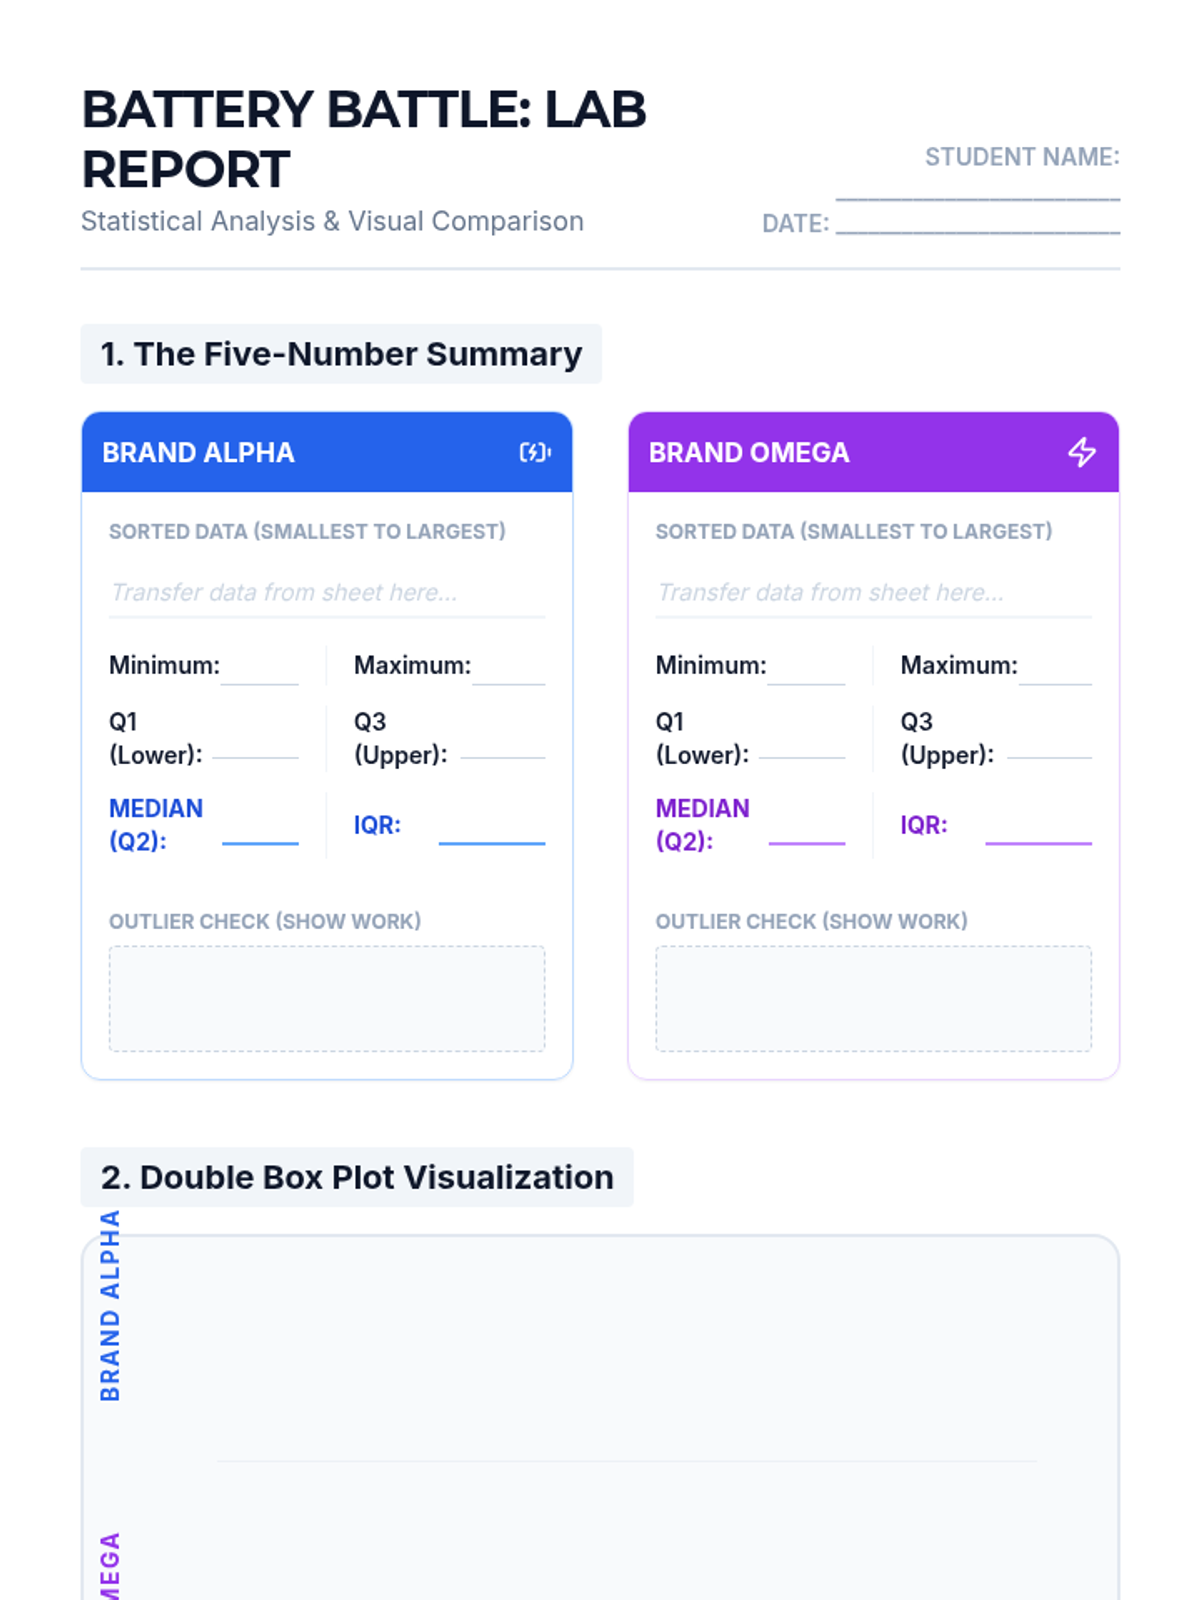
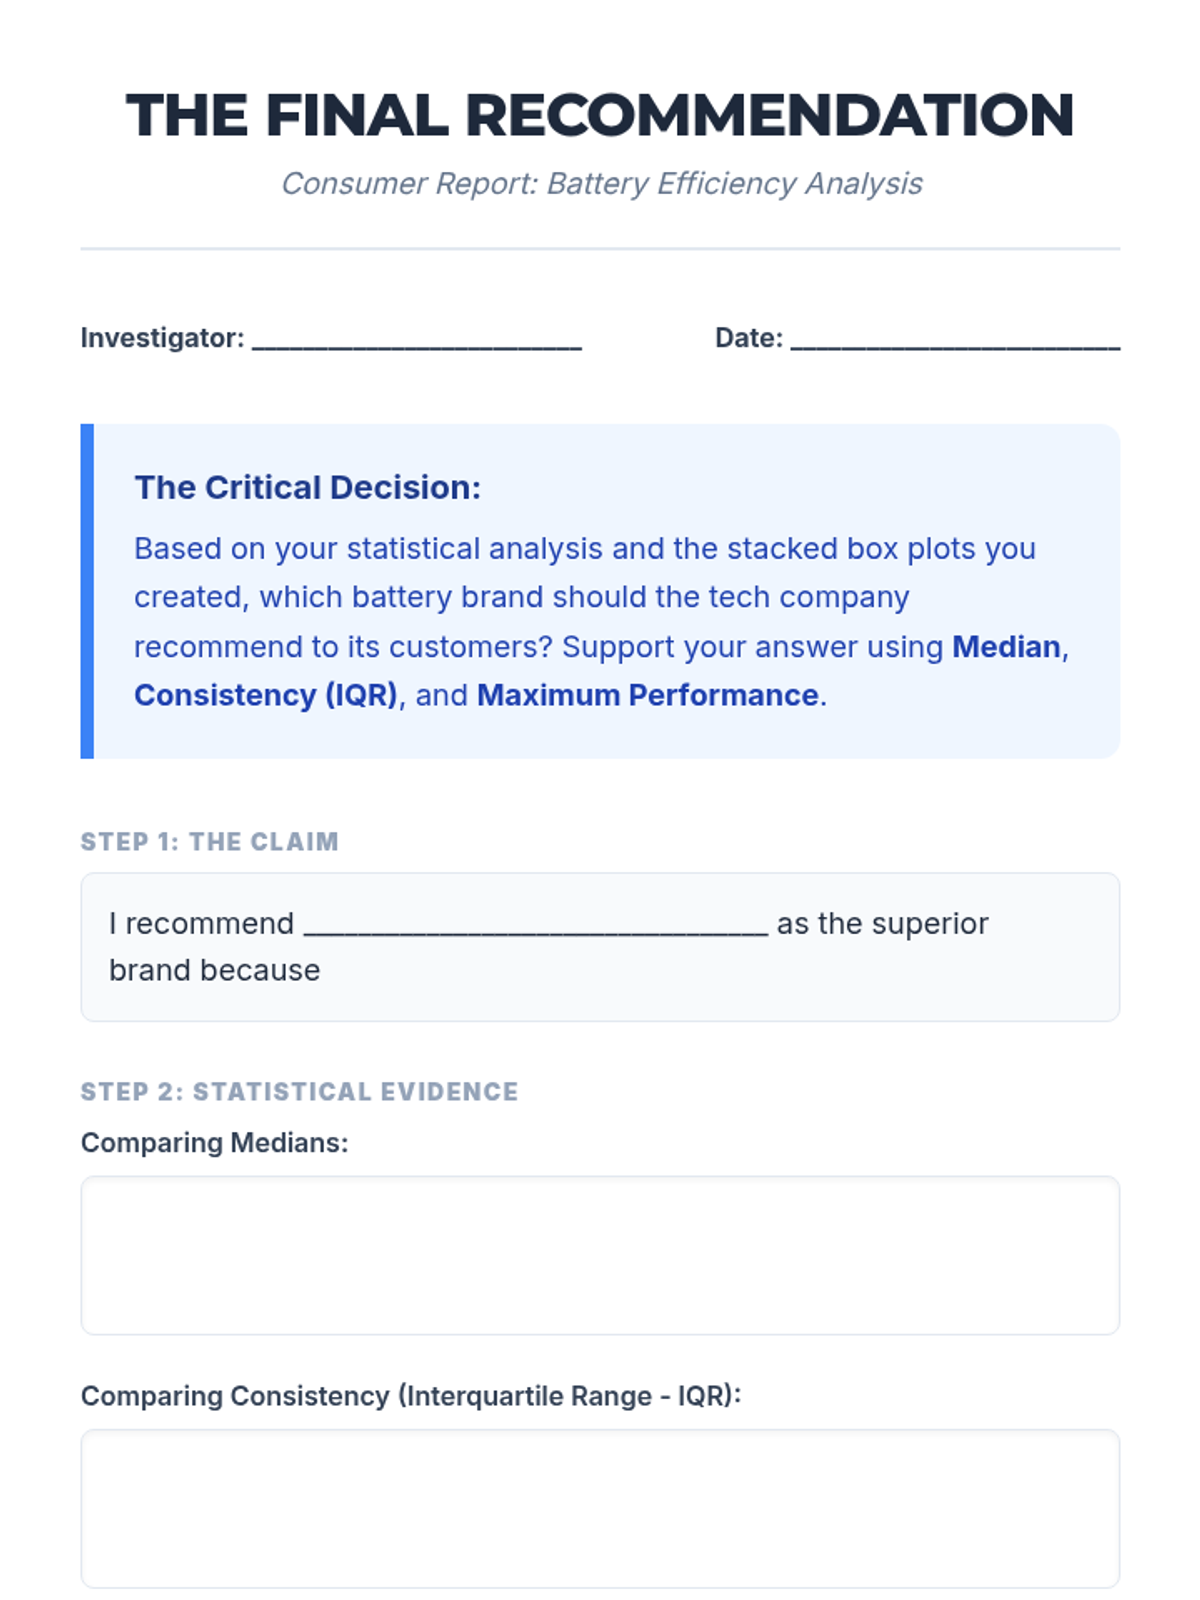
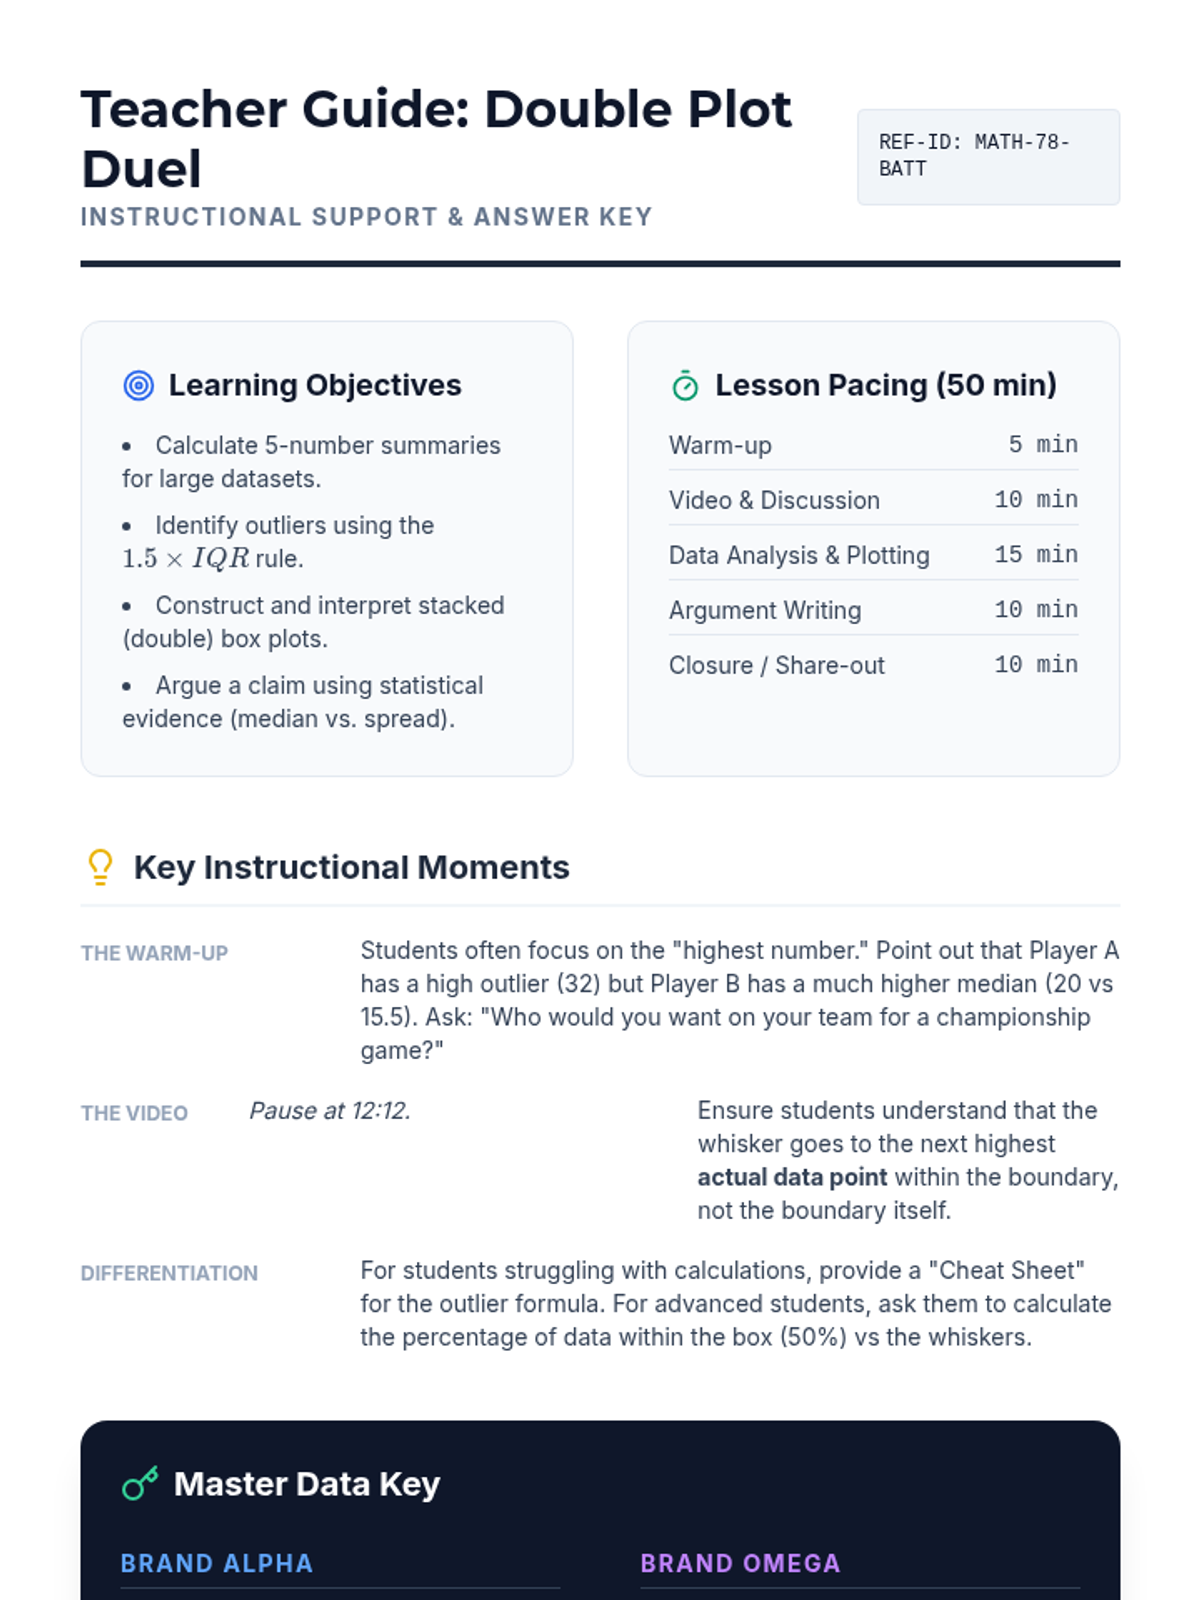
A lesson where students compare two battery brands using double box plots to determine which is 'better' based on median performance, consistency (IQR), and maximum range. Students will learn to calculate five-number summaries and construct stacked box plots on a single number line.
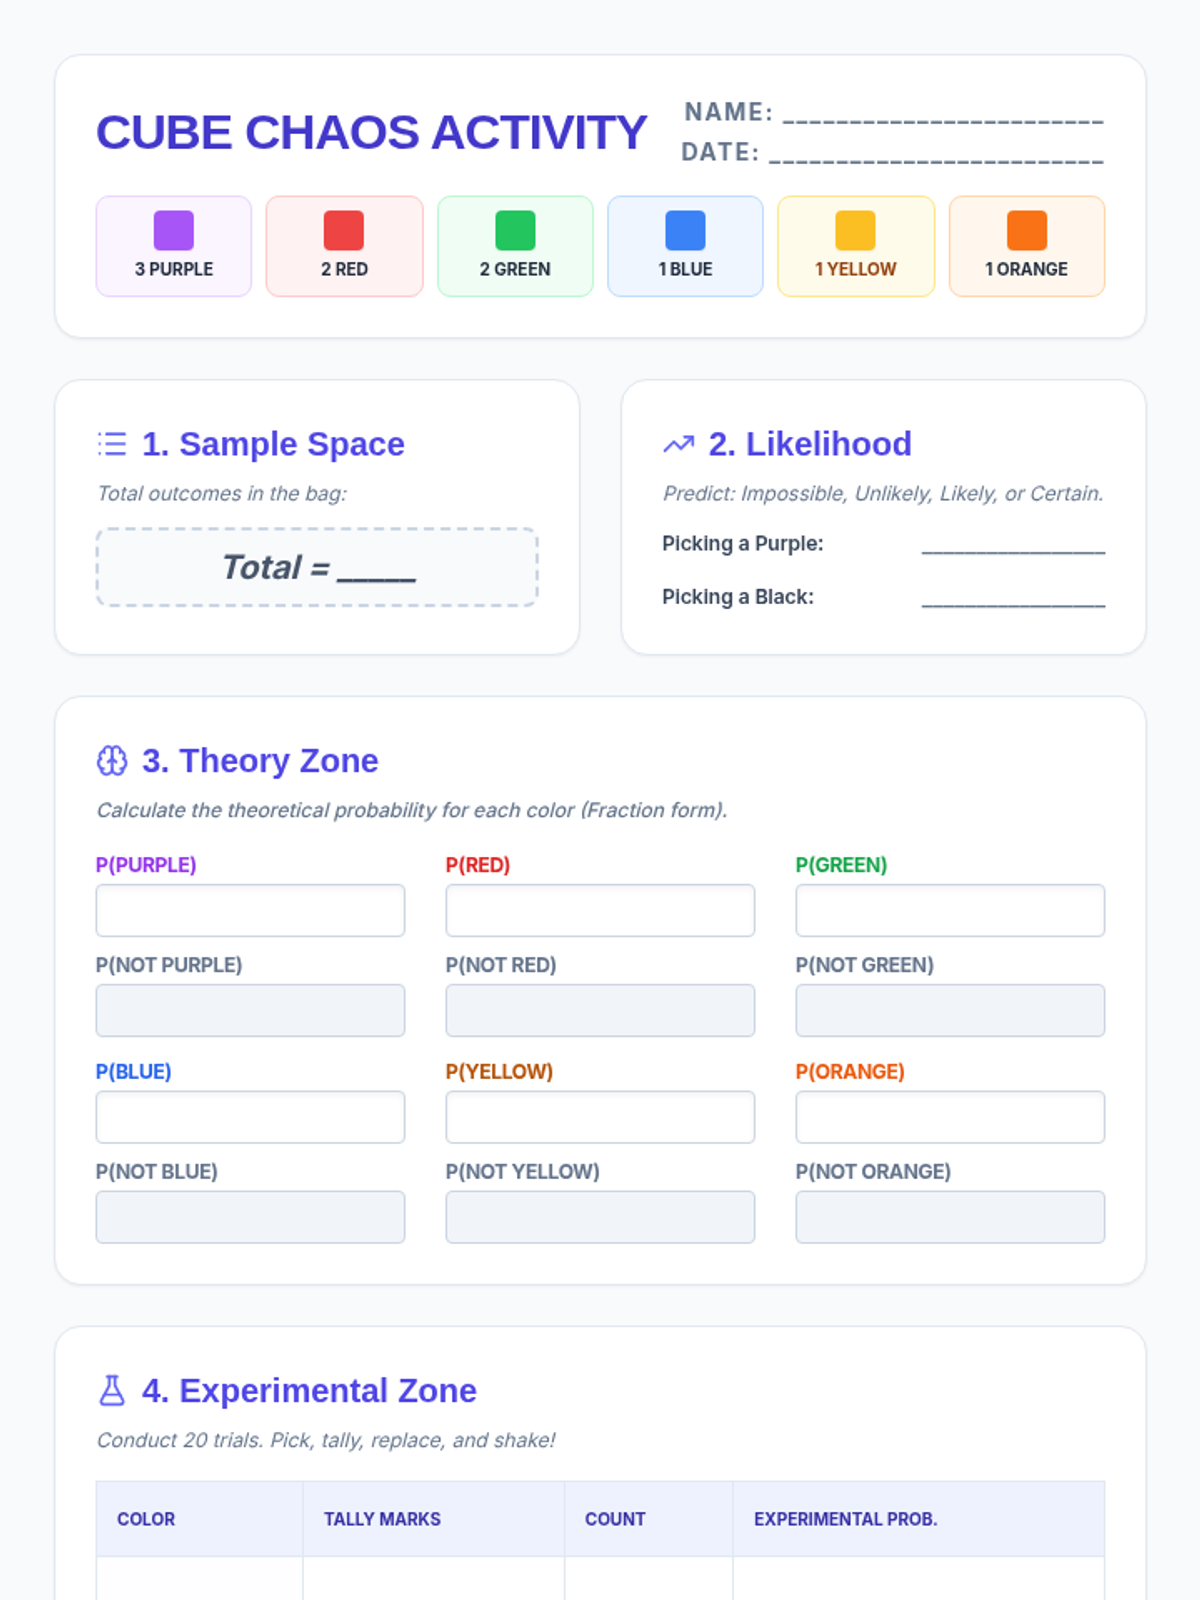
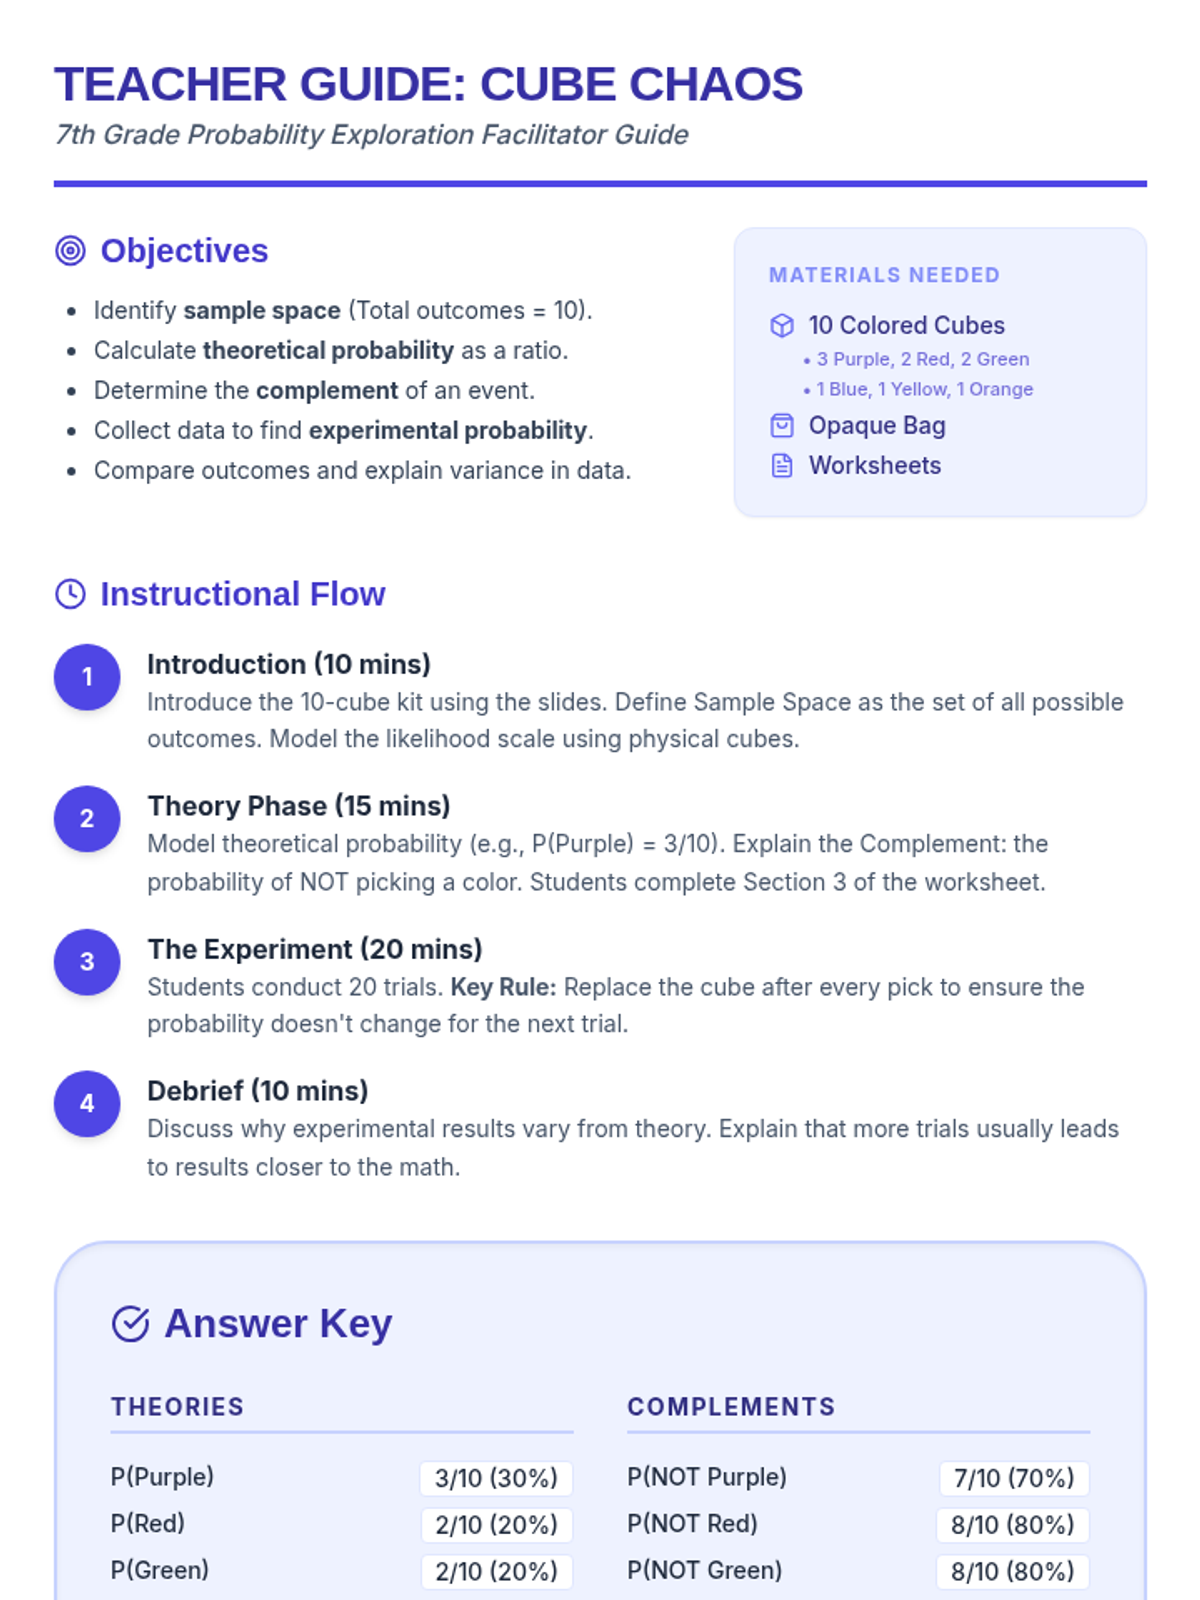
A hands-on exploration of probability concepts using a specific set of 10 colored cubes. Students learn to calculate theoretical and experimental probability, identify sample spaces, and understand complements.
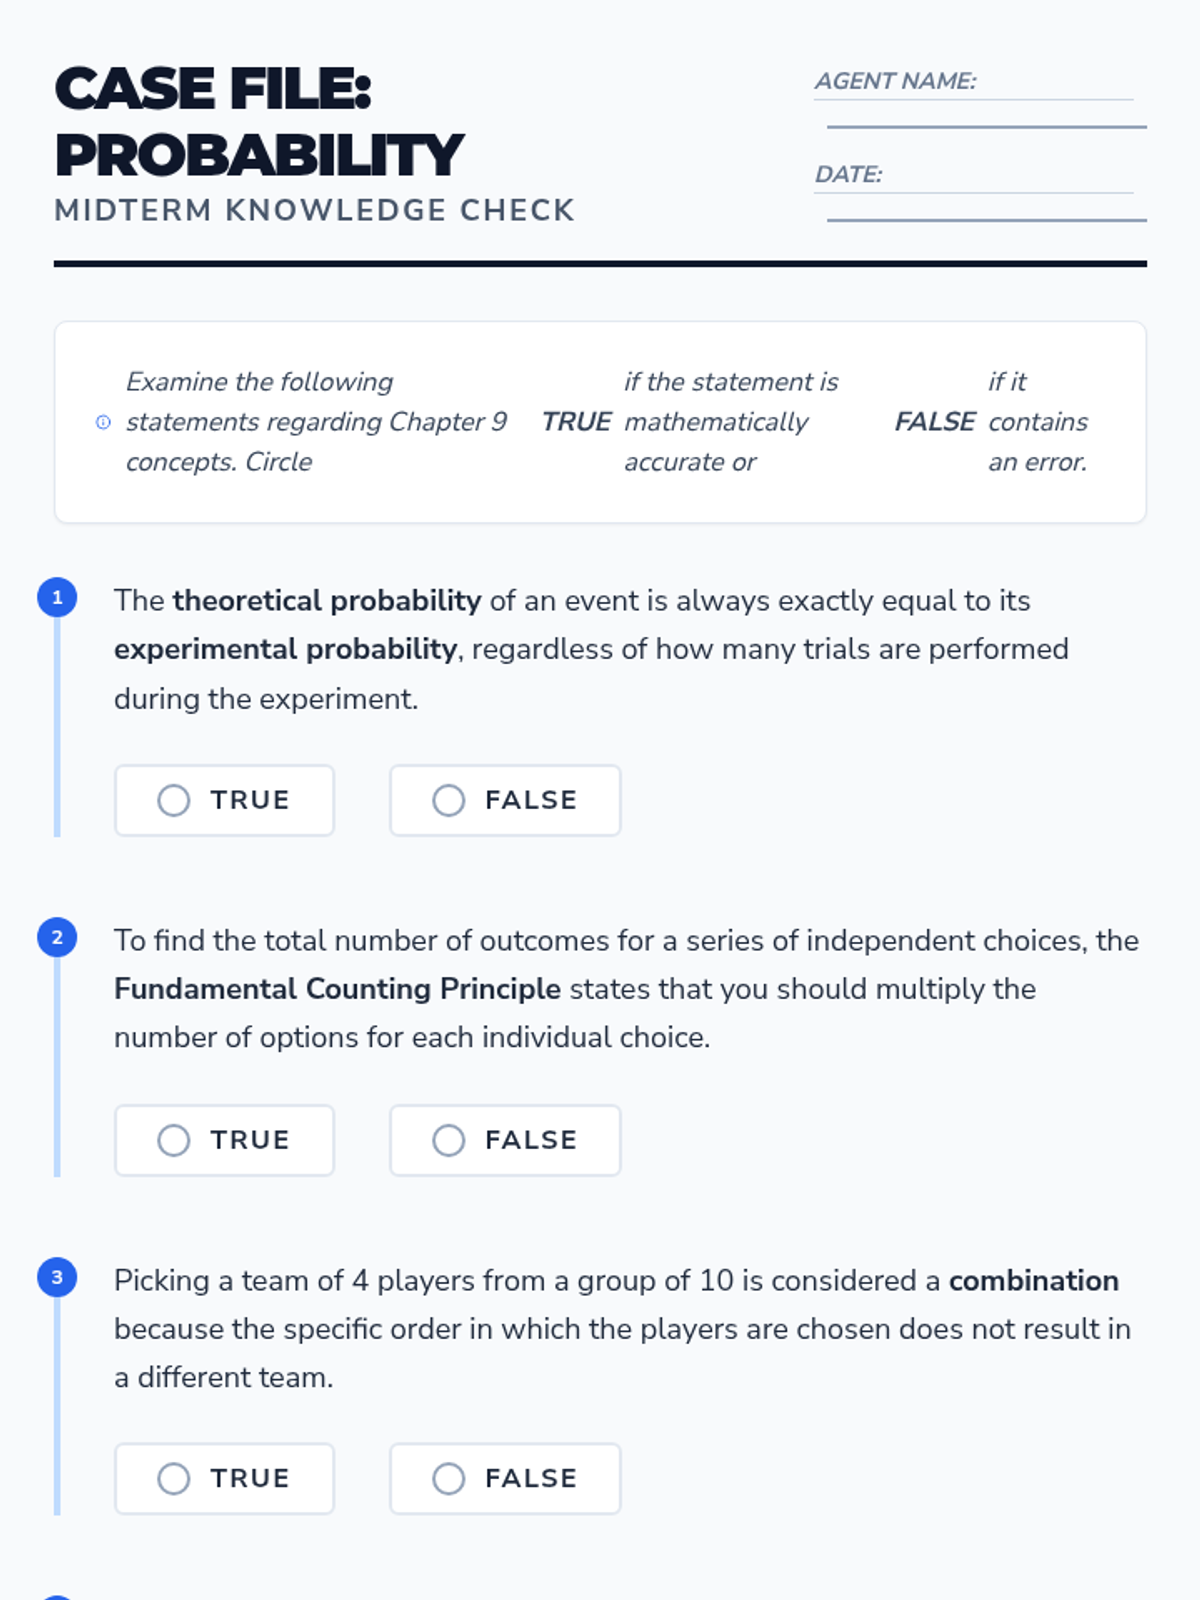
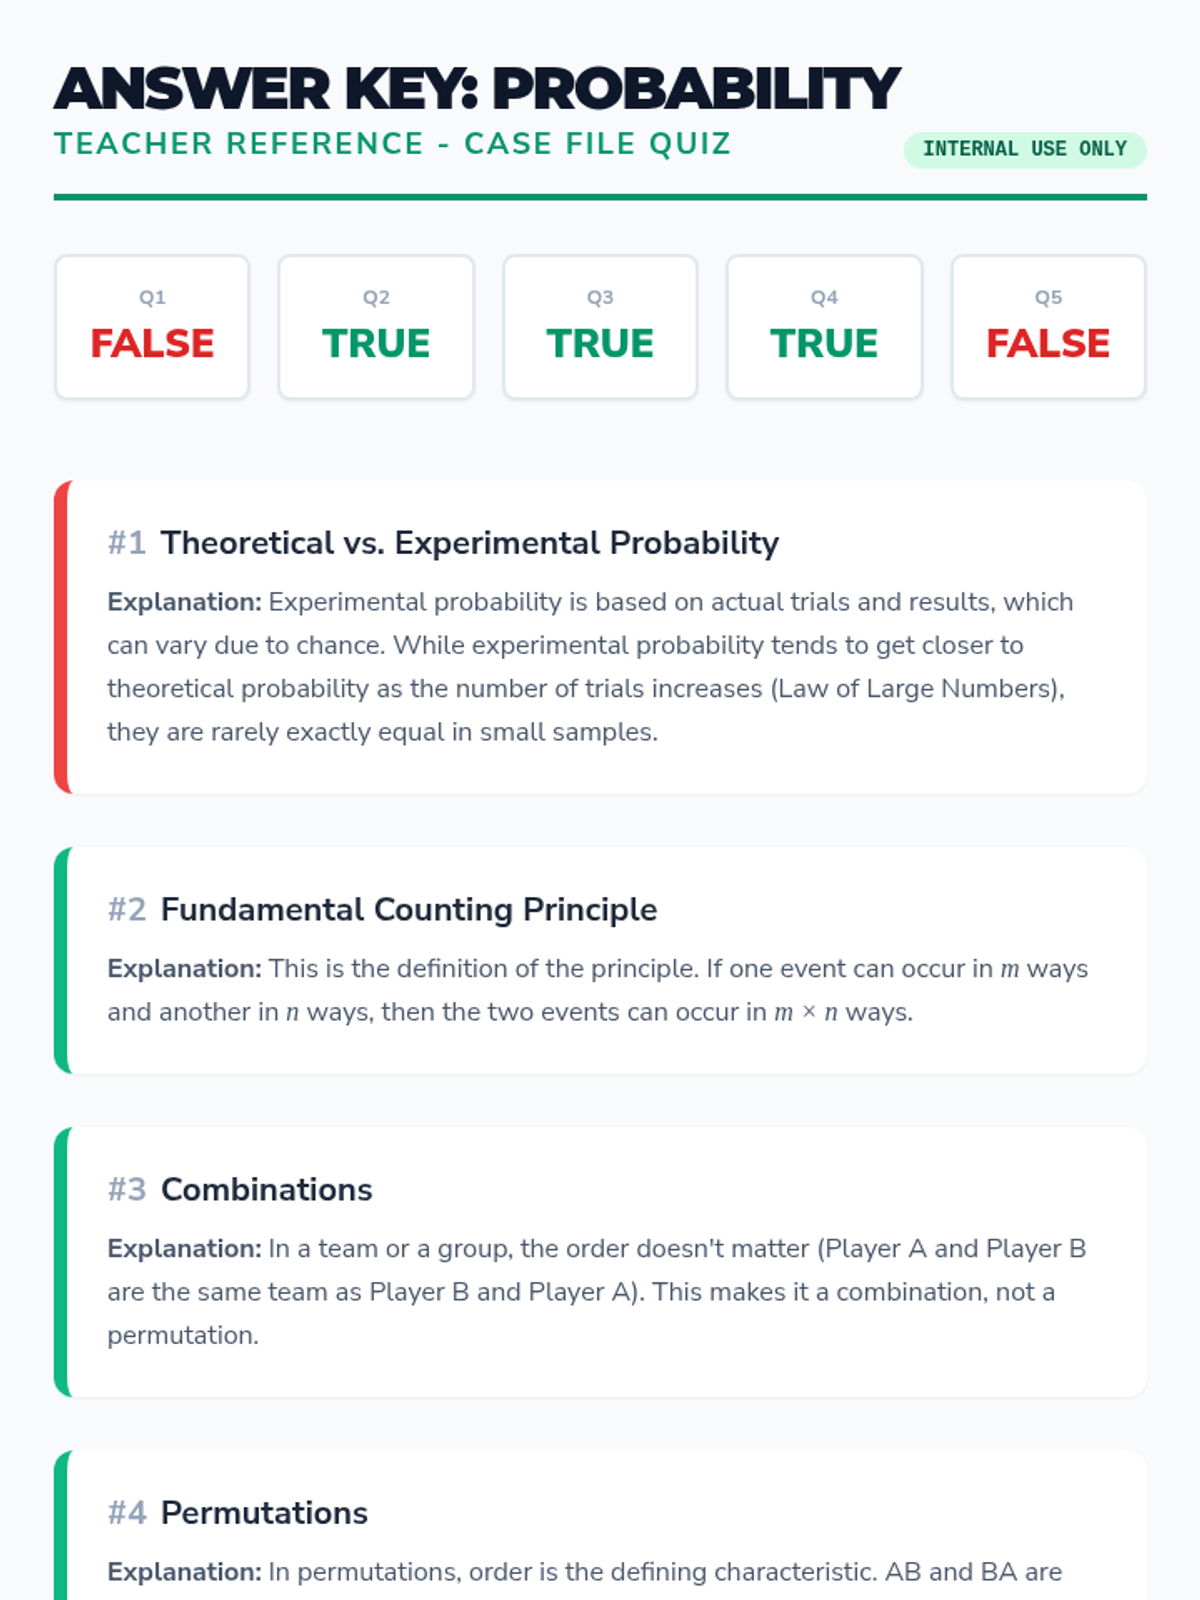
A focused review lesson covering the core concepts of probability, counting principles, and event types from Pre-Algebra Chapter 9.
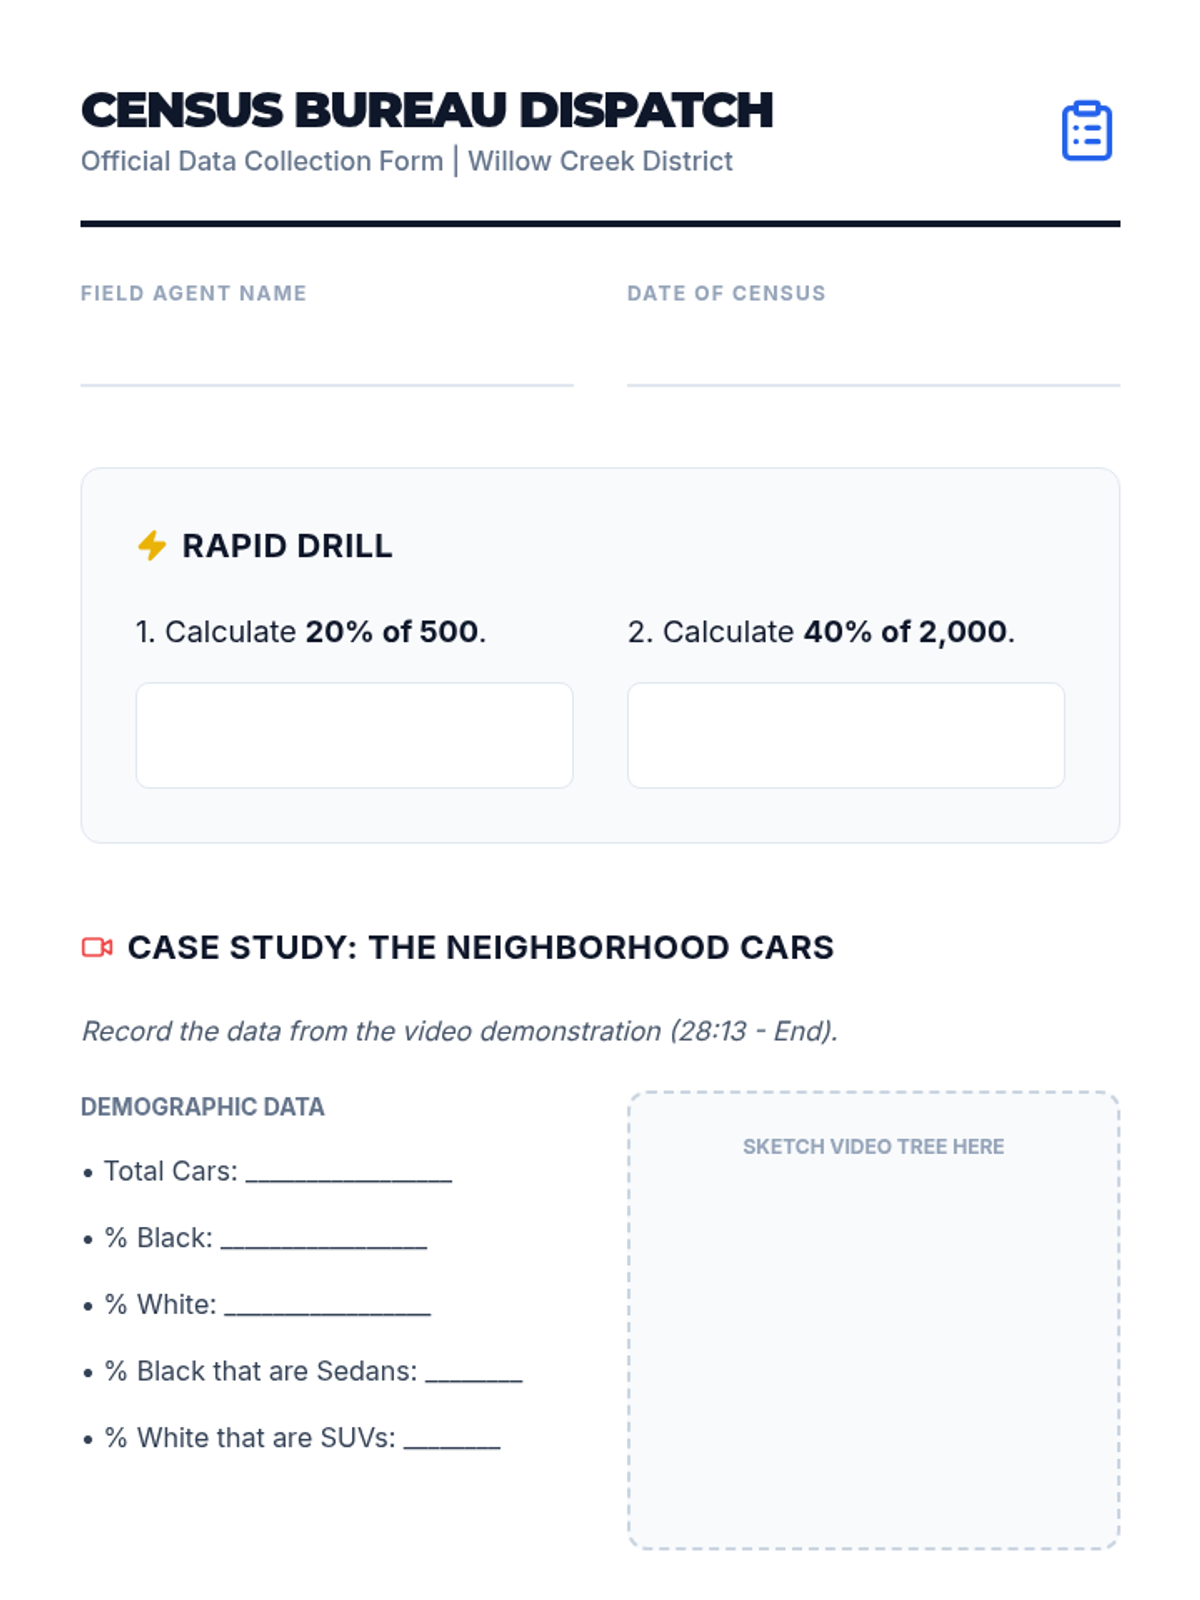
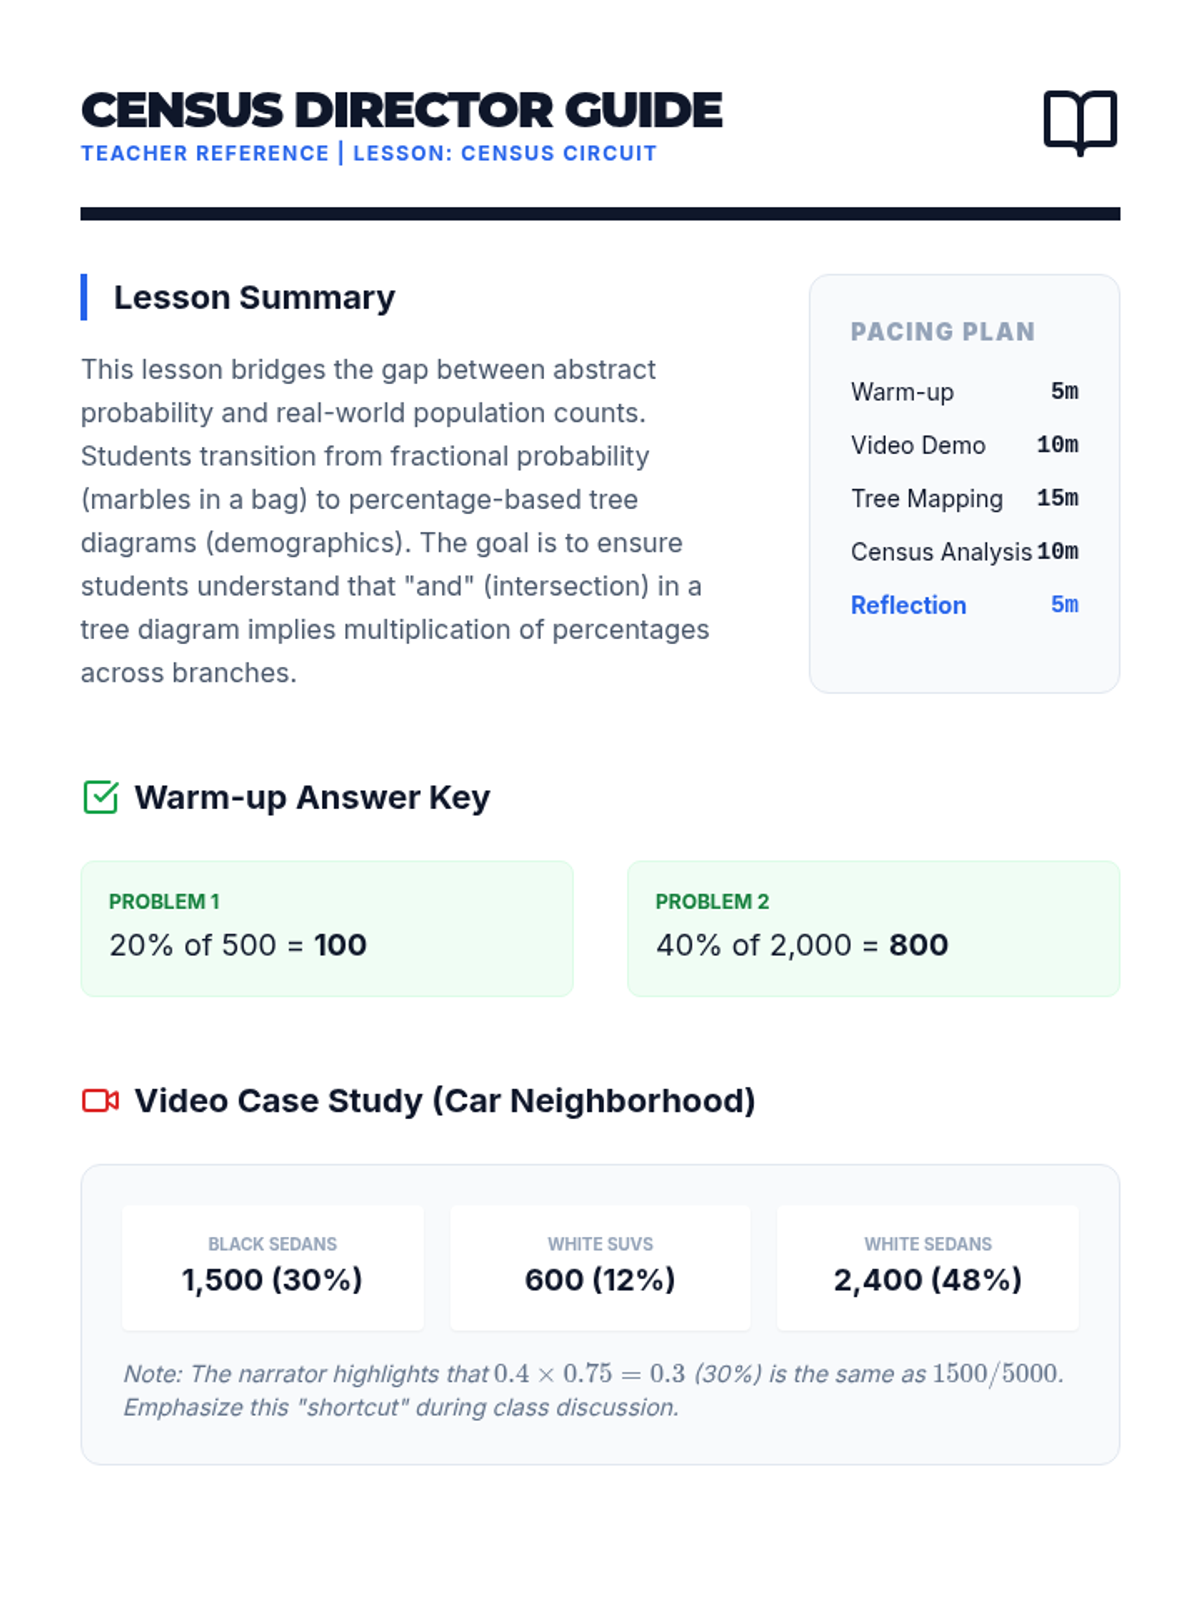
Students learn to construct and interpret probability tree diagrams using percentages and counts, grounded in a real-world census-themed activity. The lesson utilizes a detailed math tutorial video for direct instruction followed by a hands-on data interpretation task.
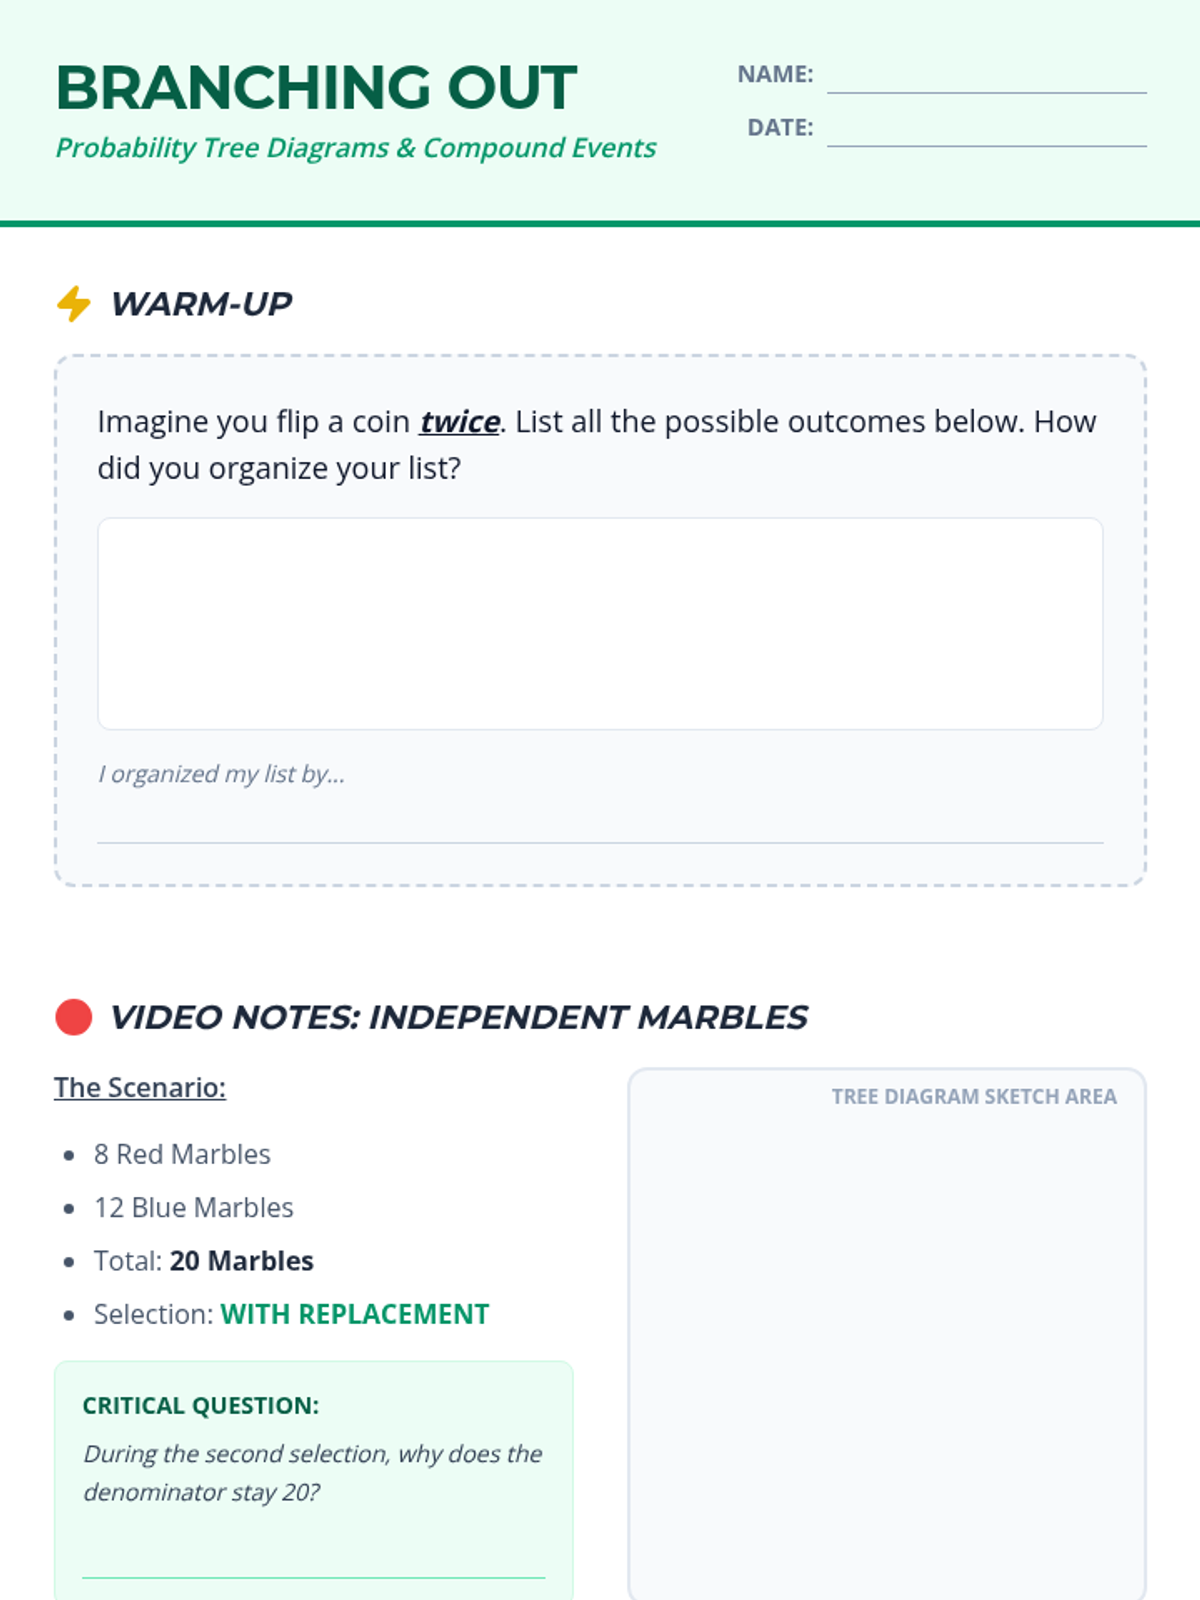
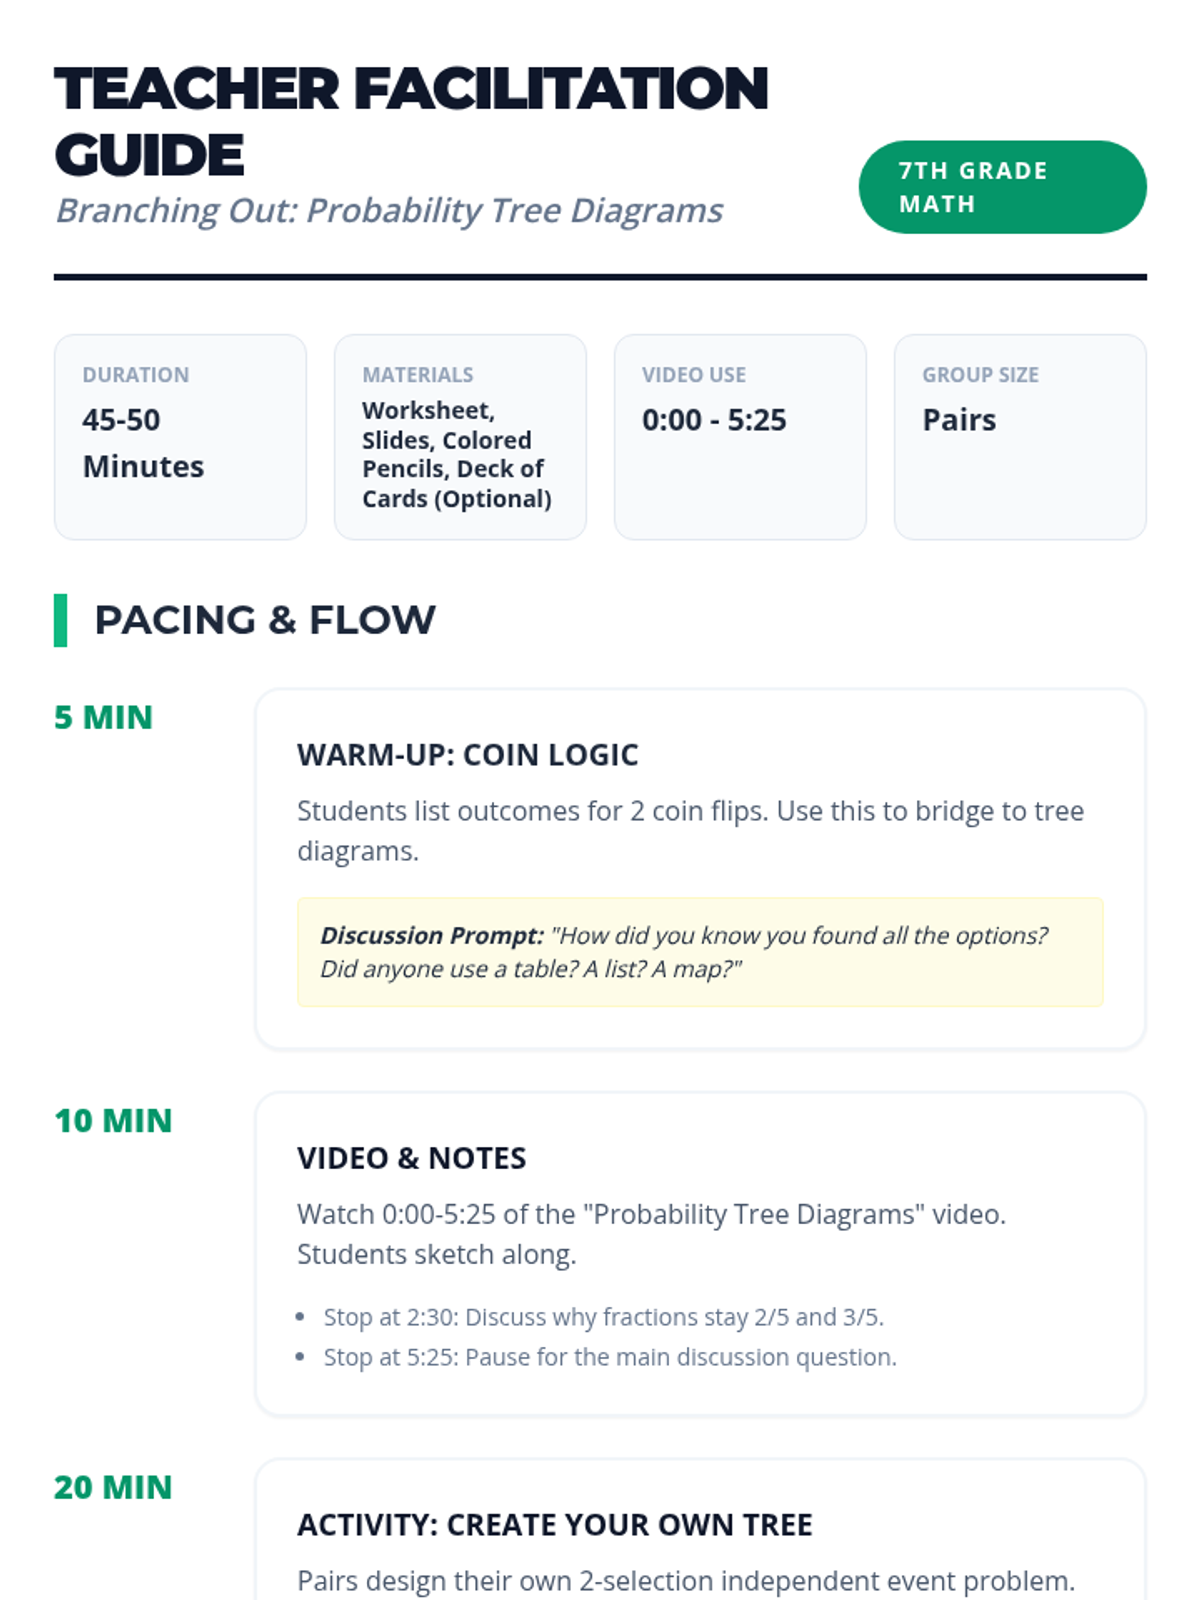
A comprehensive lesson on probability tree diagrams and compound events for 7th-grade students, featuring a video-based exploration of independent events and a hands-on creative activity.
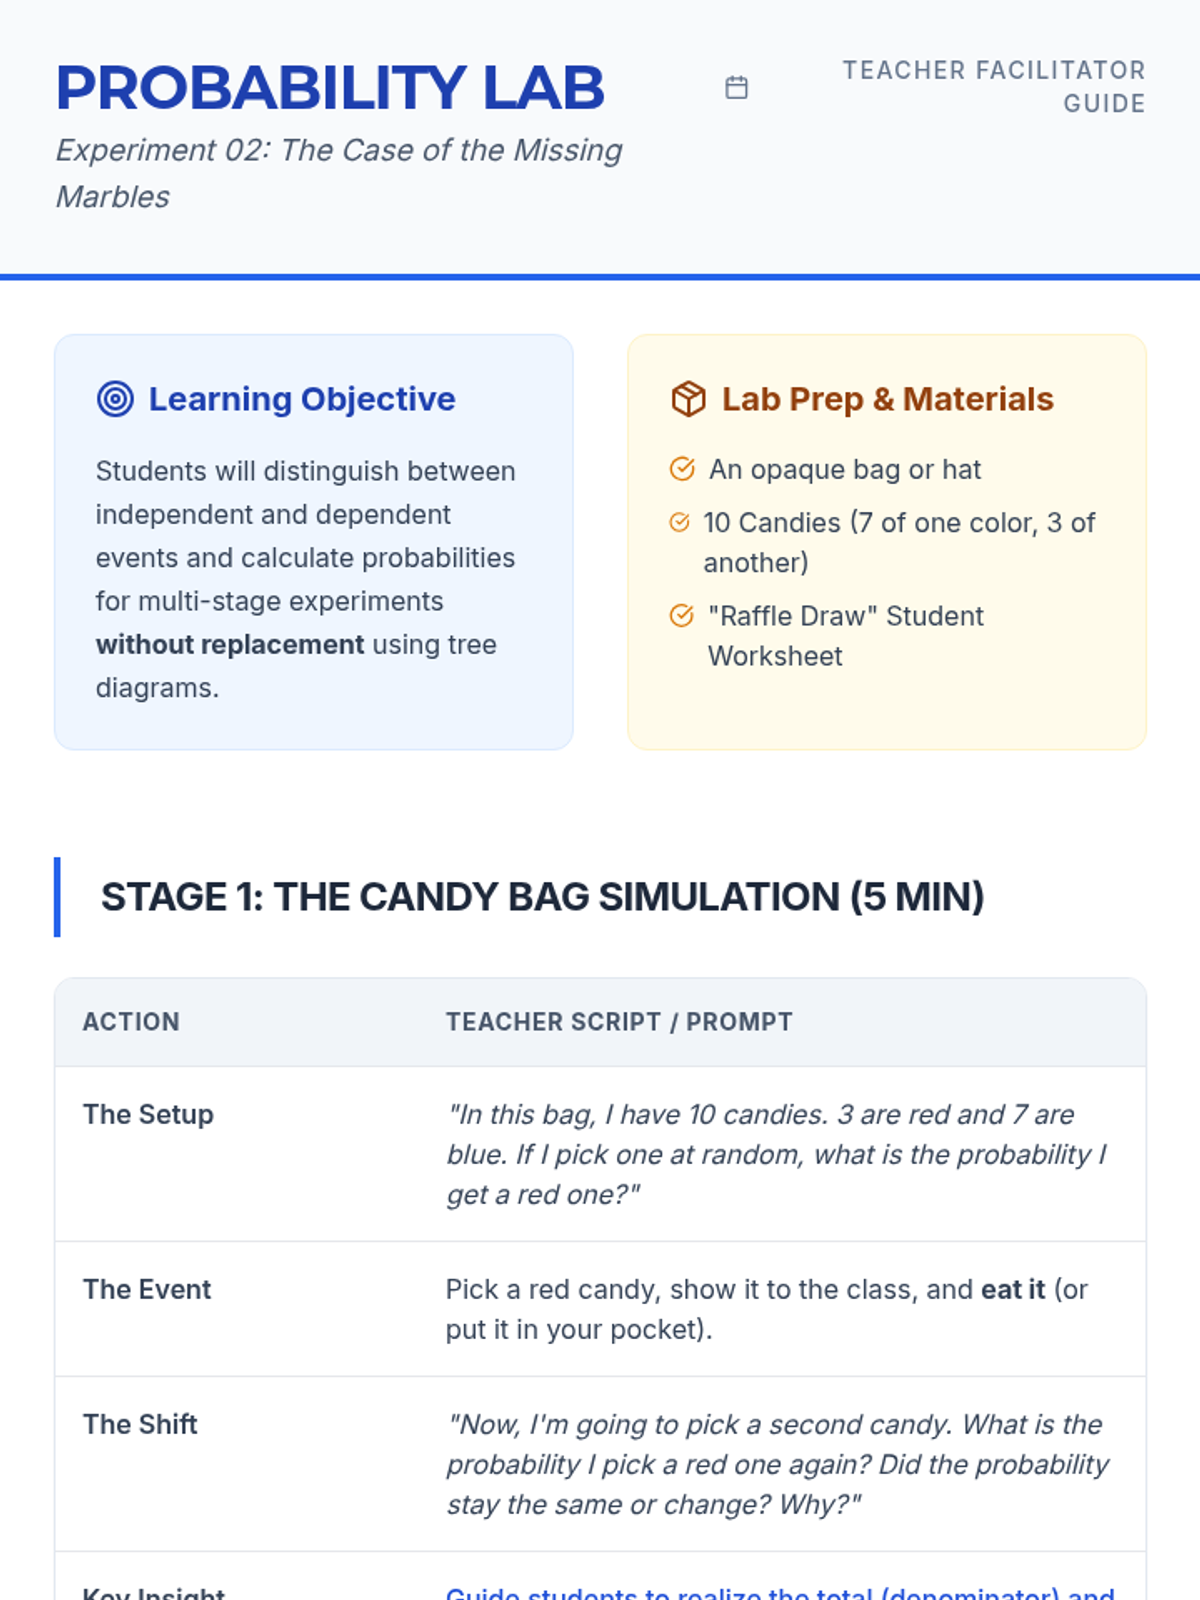
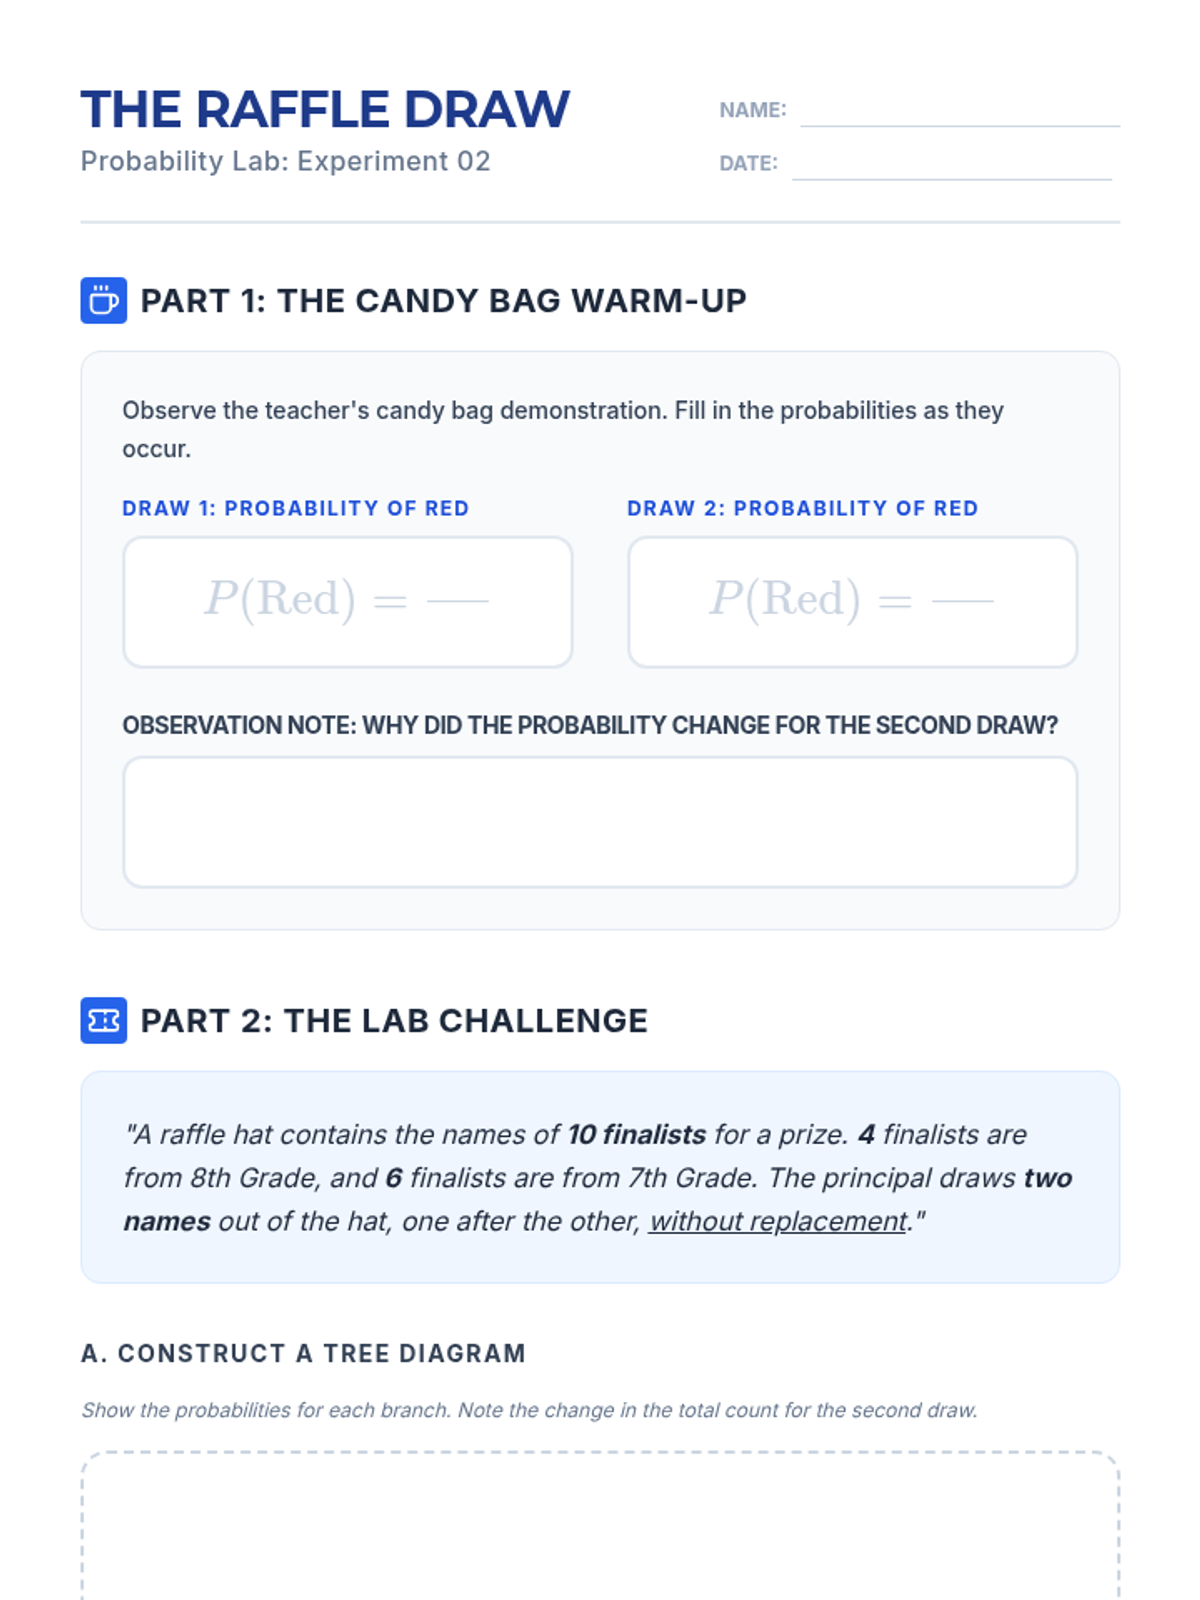
Students will learn to distinguish between independent and dependent events by exploring how probabilities change when items are not replaced, using tree diagrams to visualize outcomes.
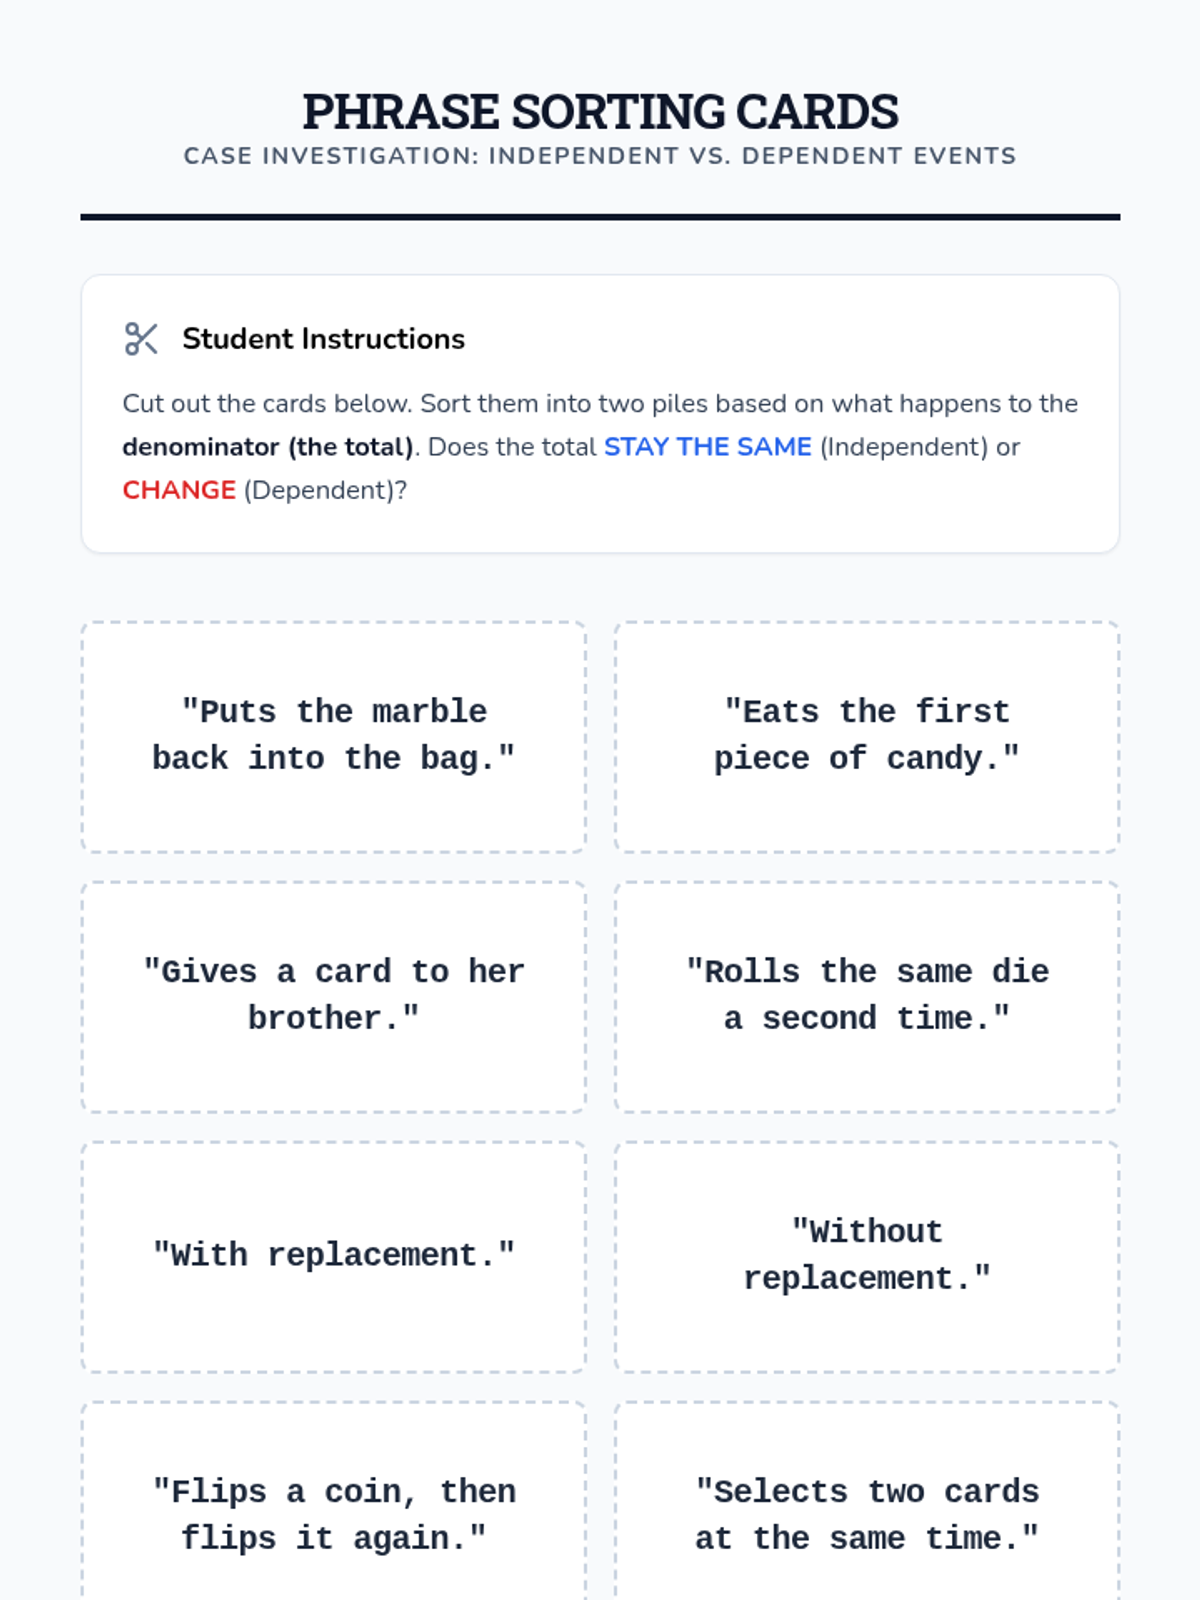
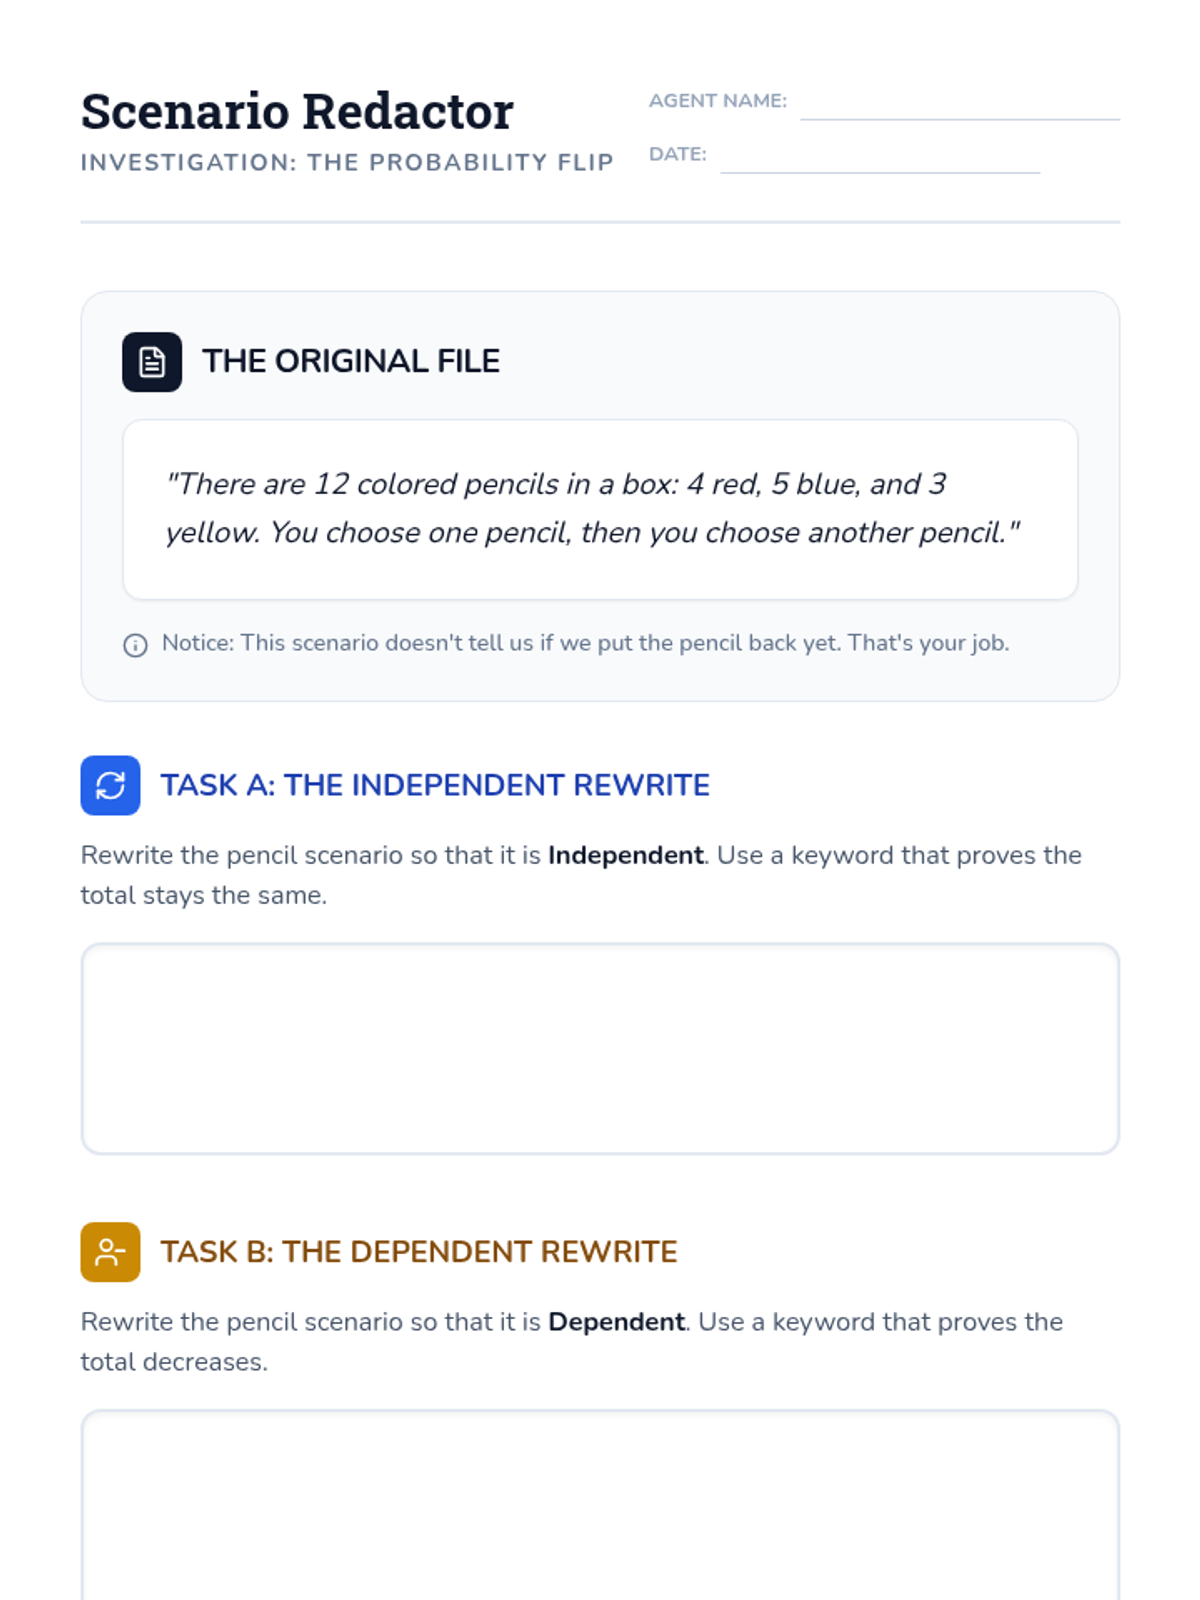
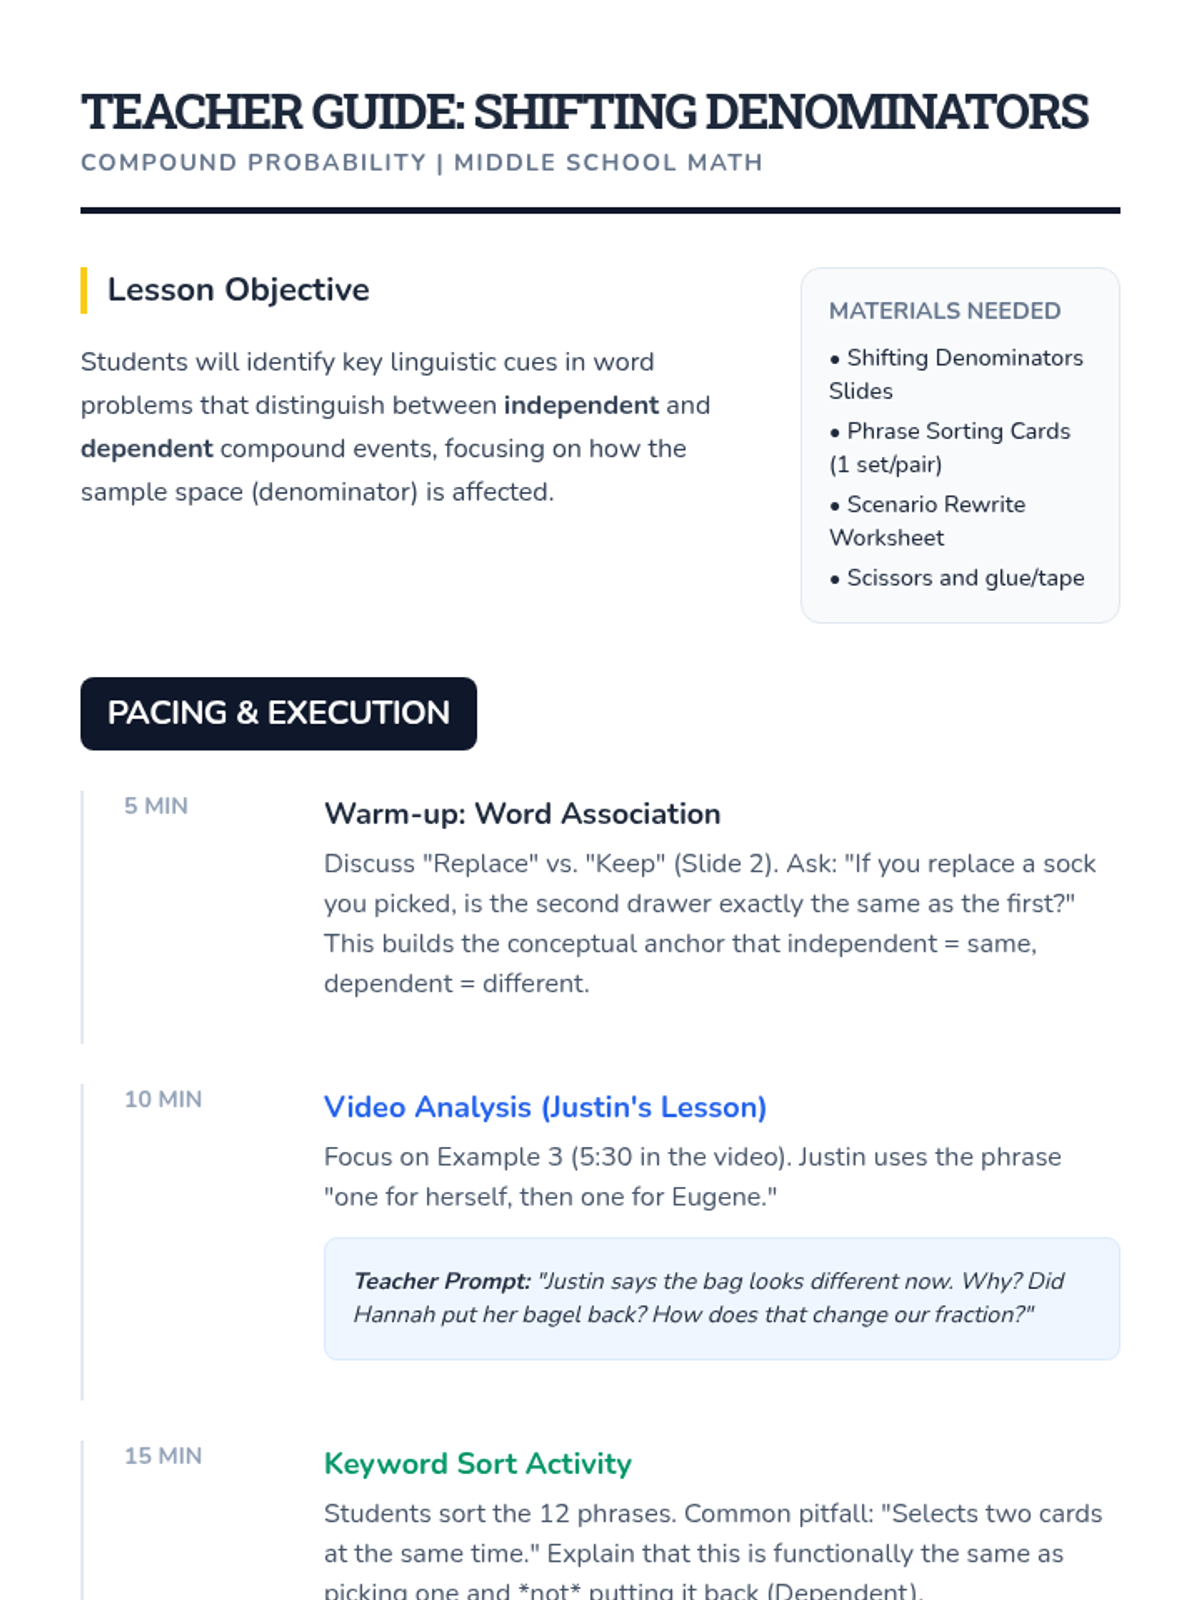
A middle school math lesson focused on identifying the linguistic cues that distinguish independent from dependent compound events in word problems. Students analyze scenarios to see how the sample space changes (or doesn't) based on specific keywords.
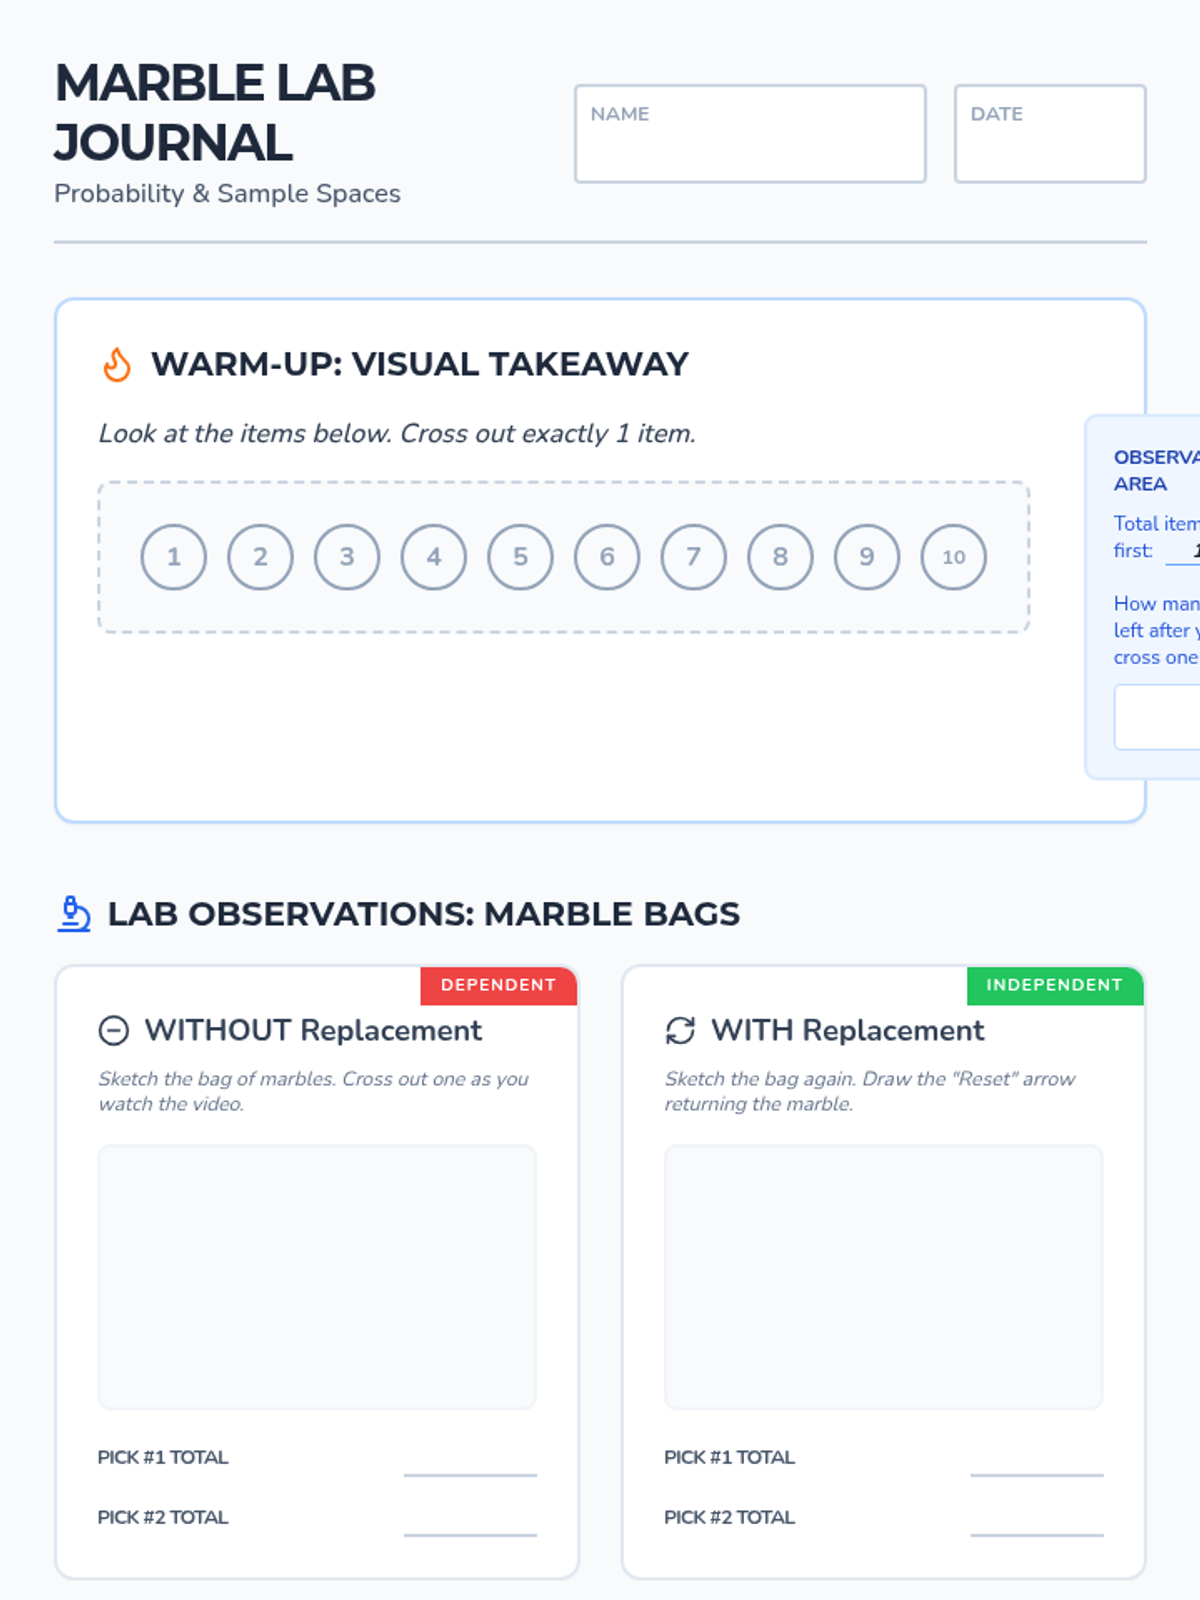
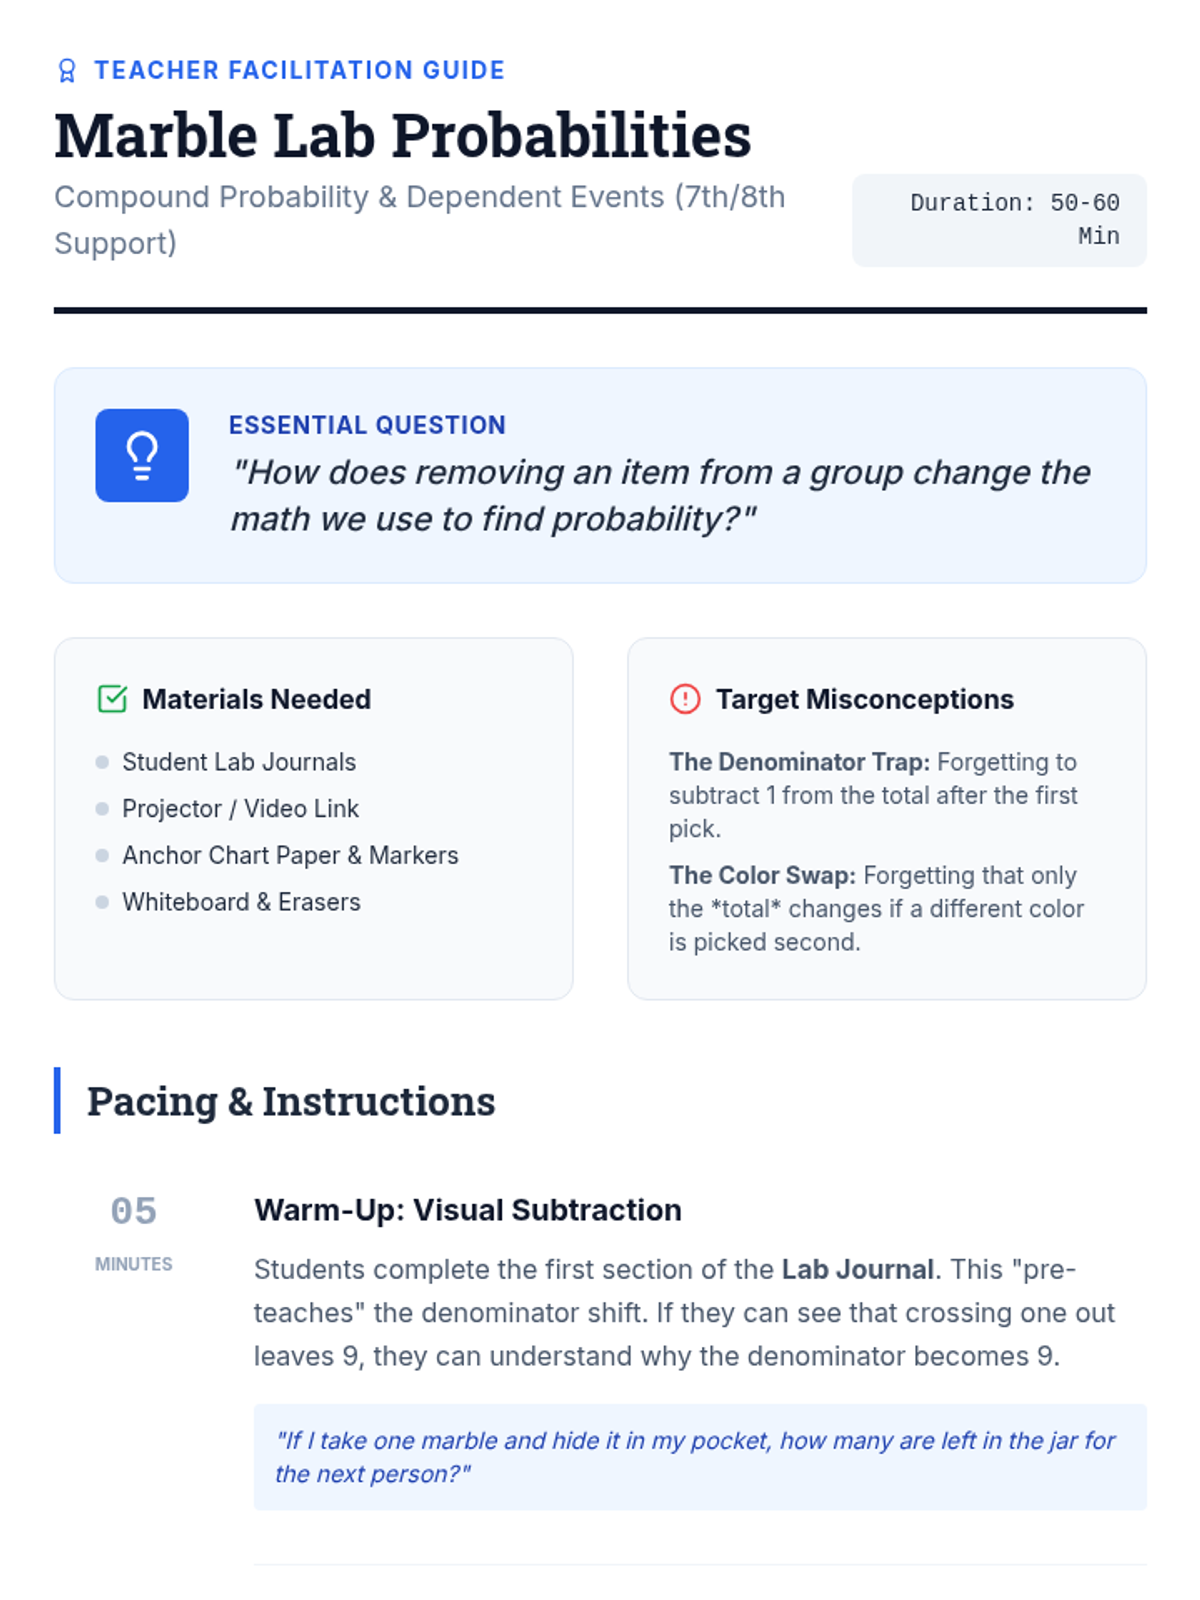
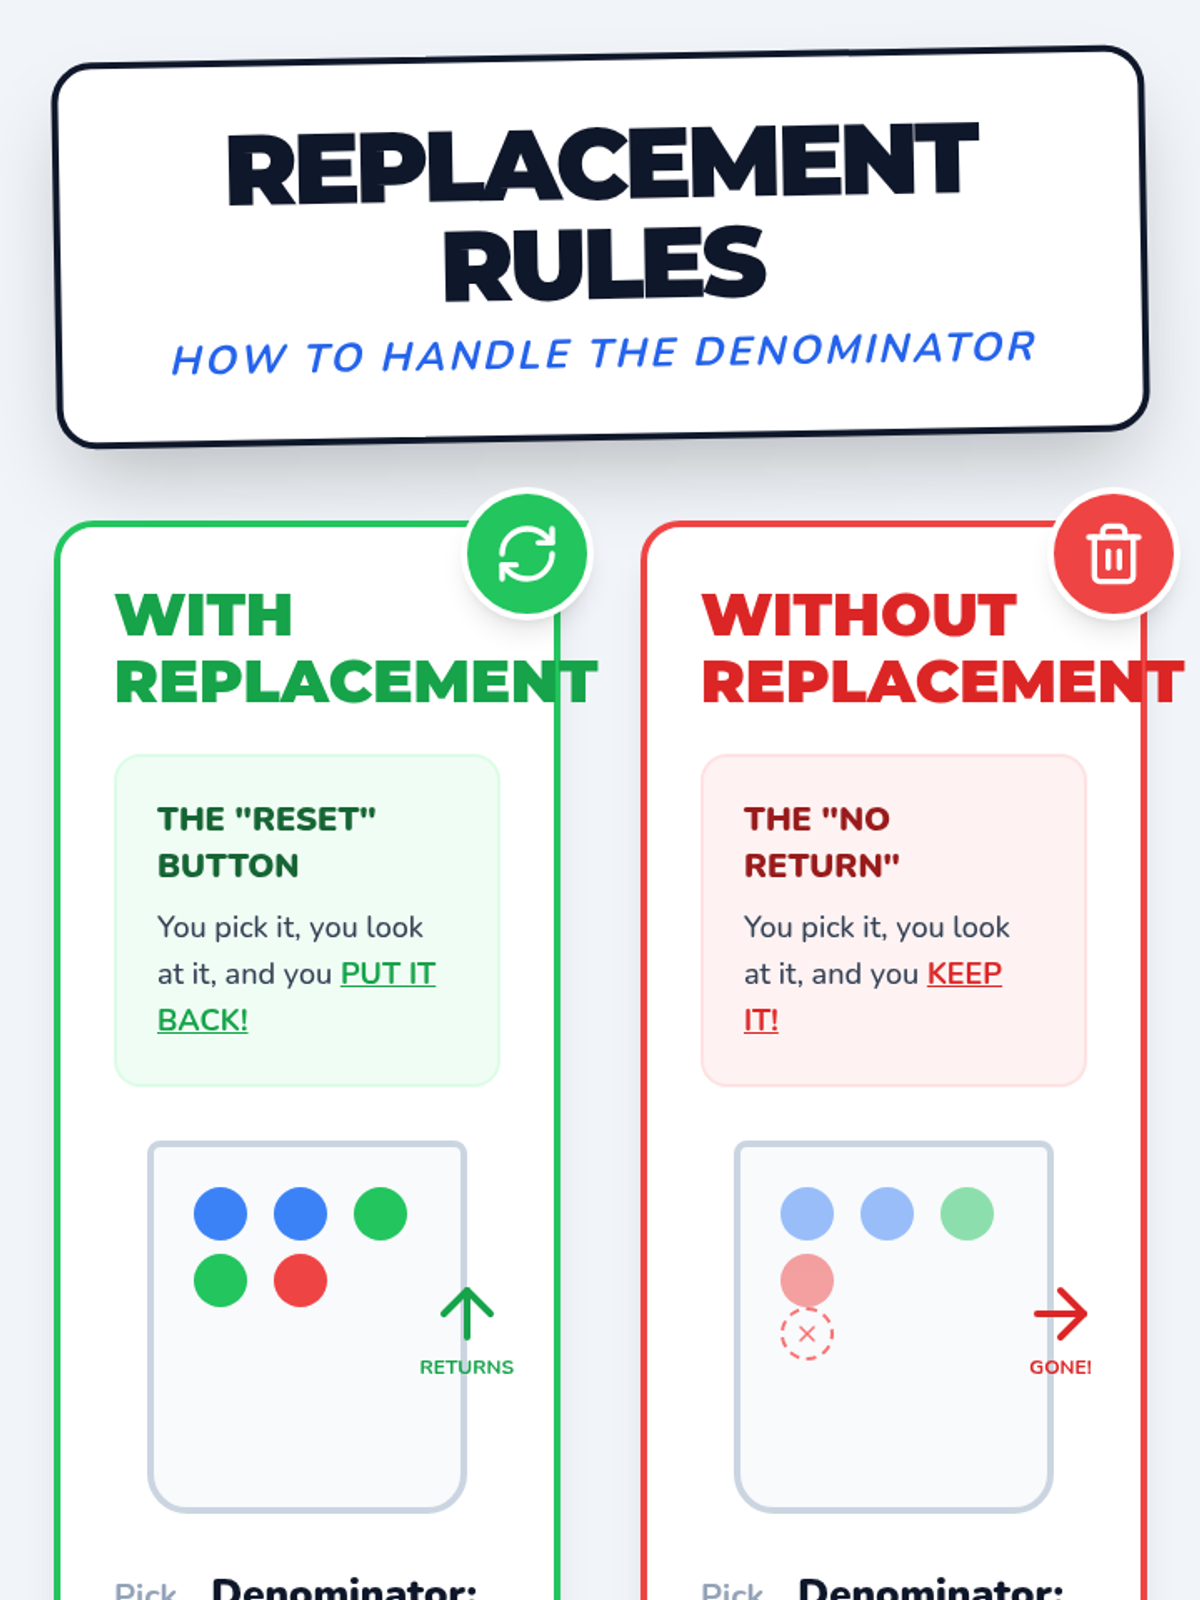
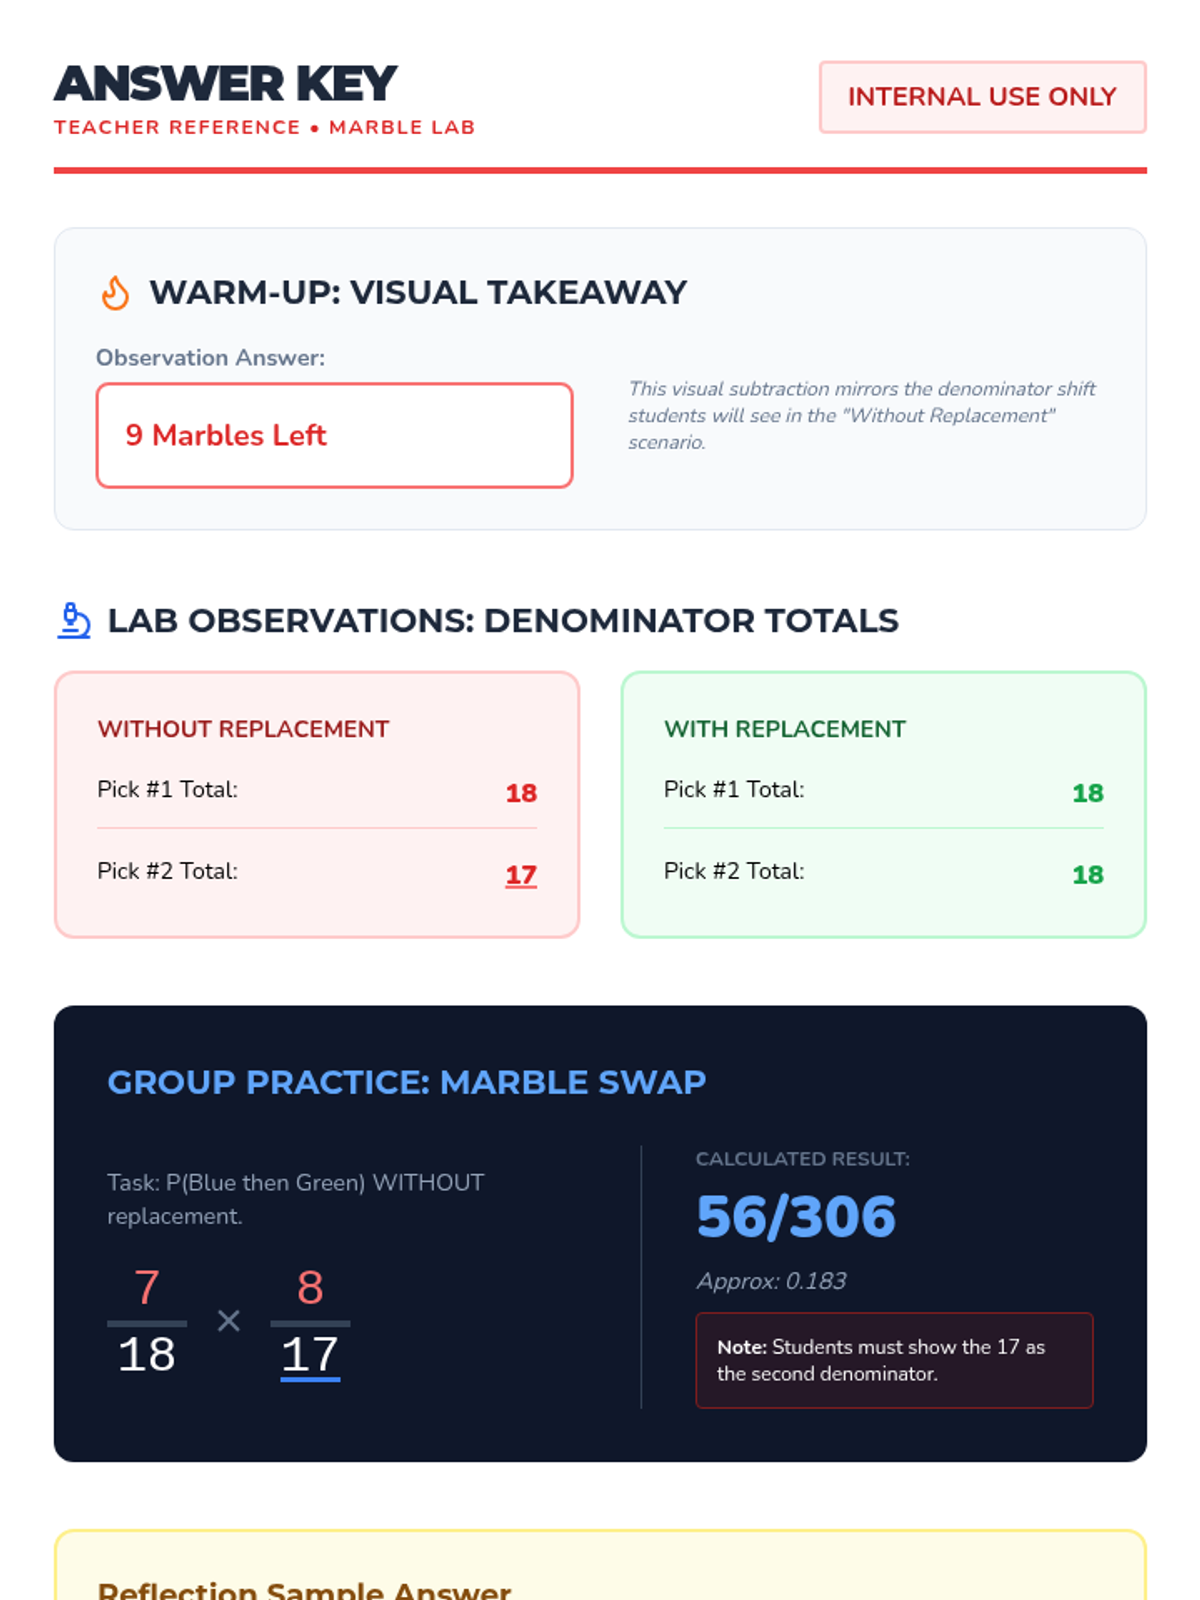
A visual exploration of compound probability, focusing on how 'without replacement' scenarios change the sample space. Students use a marble jar motif to track denominator shifts during a guided video viewing and collaborative practice.
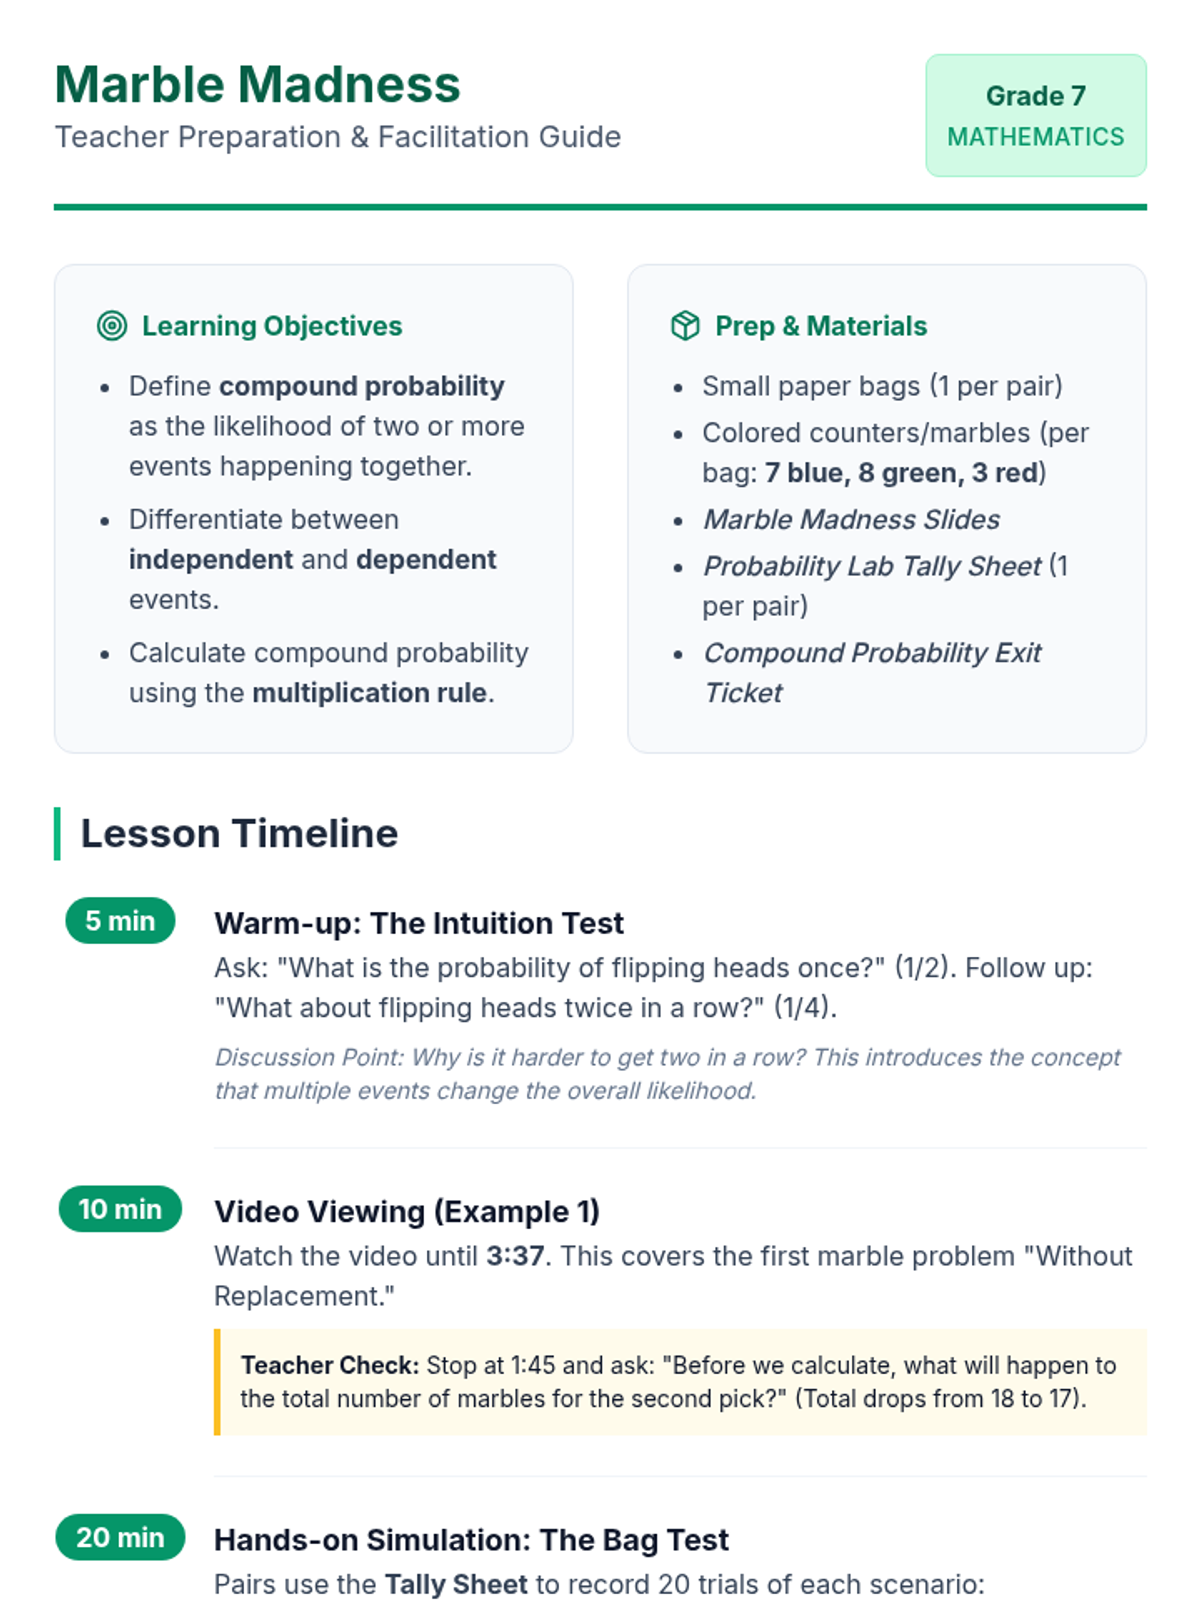
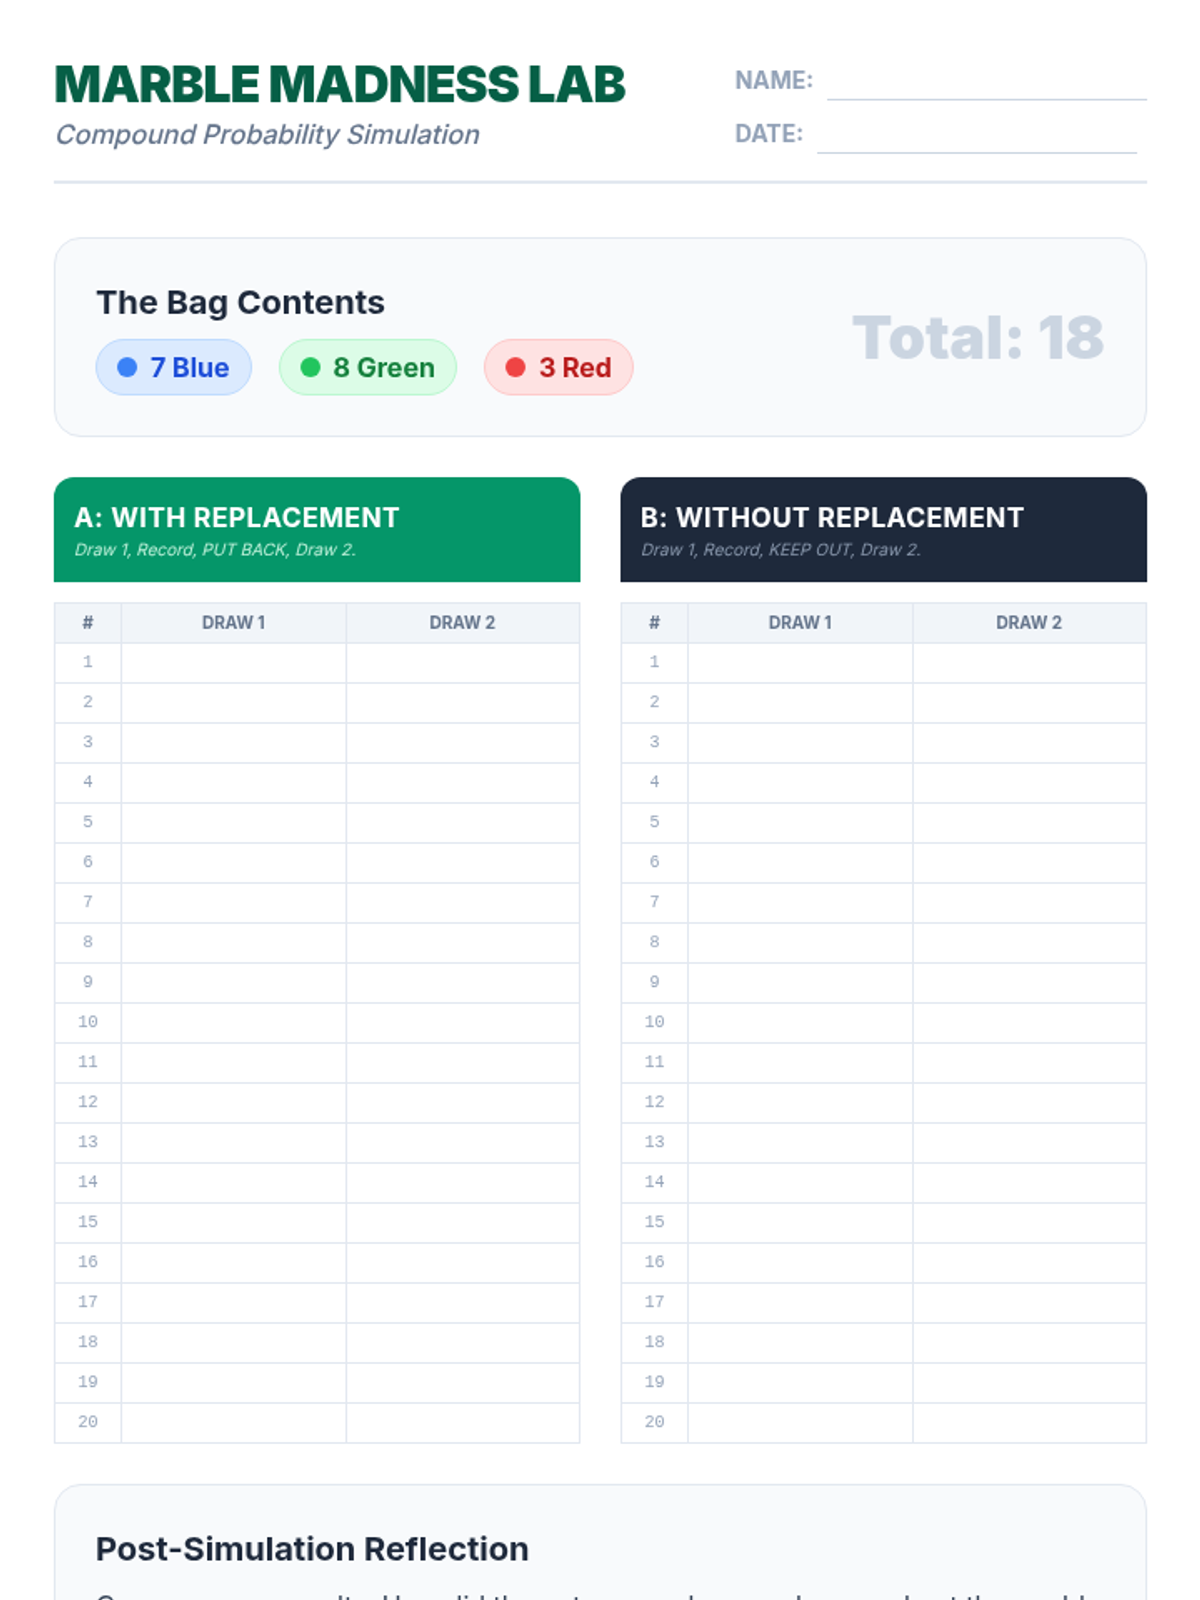
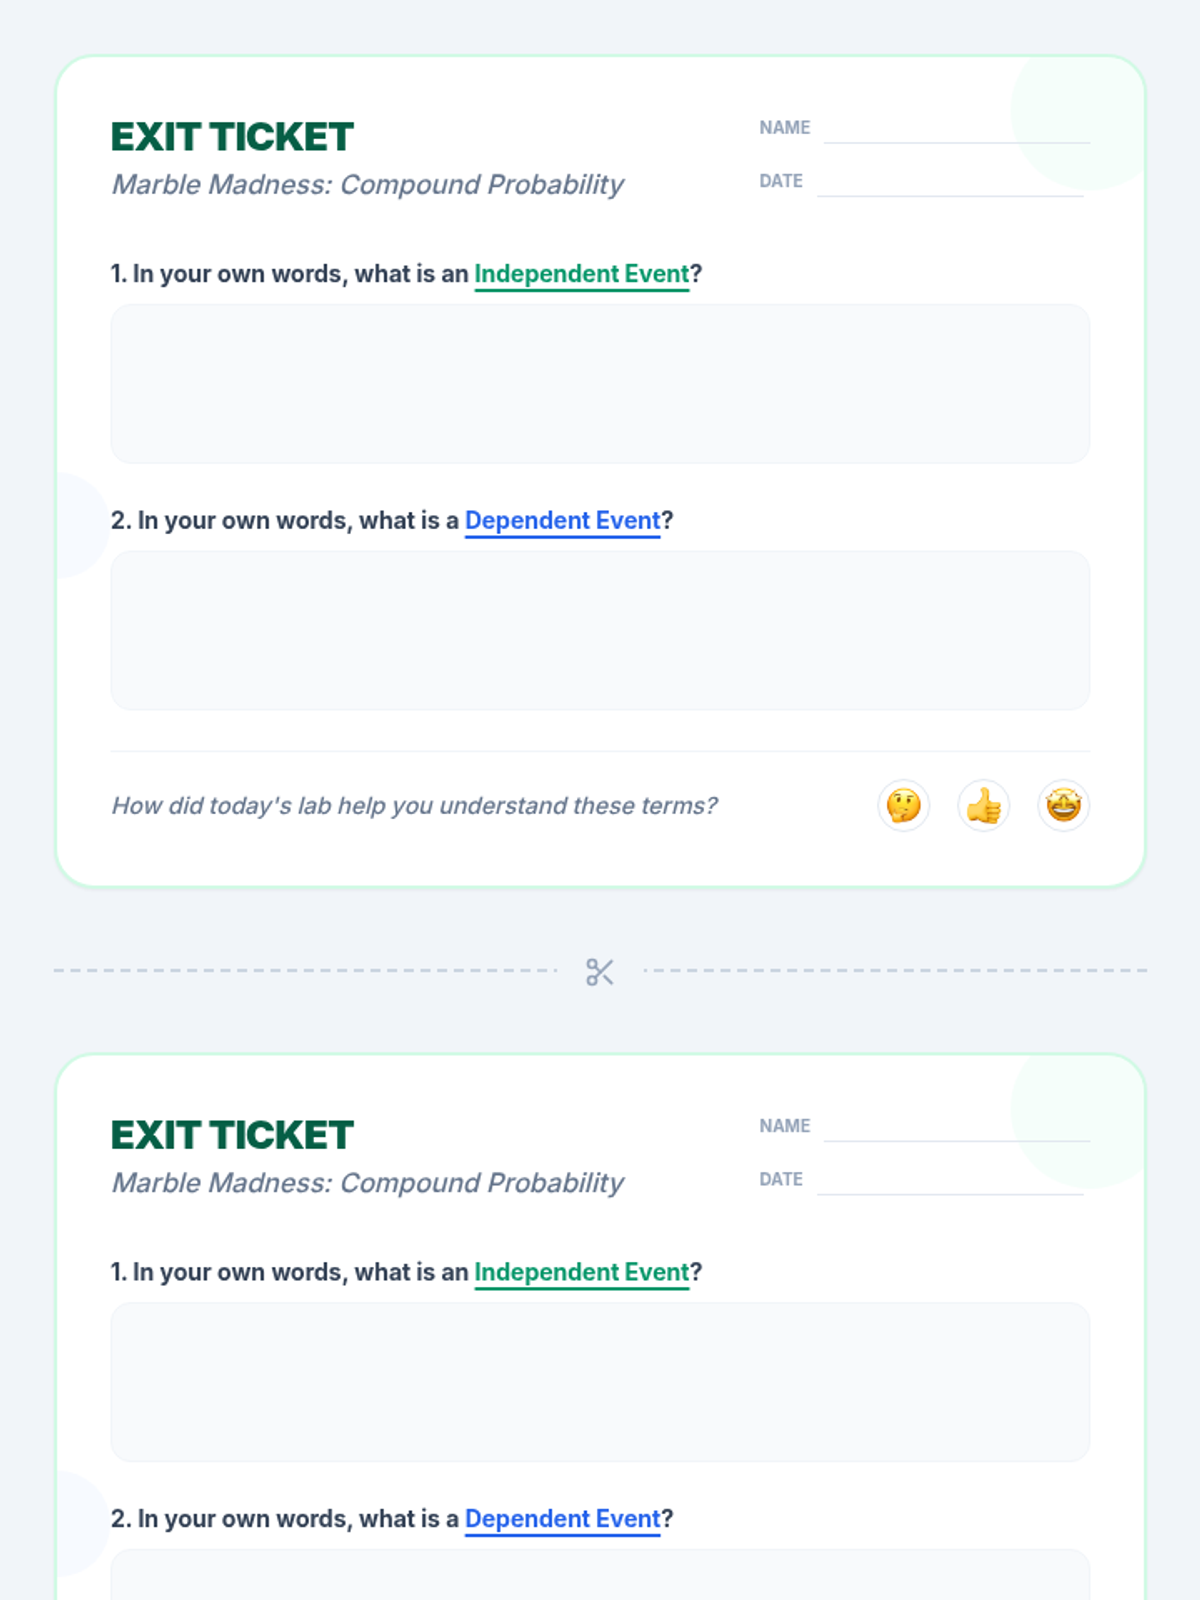
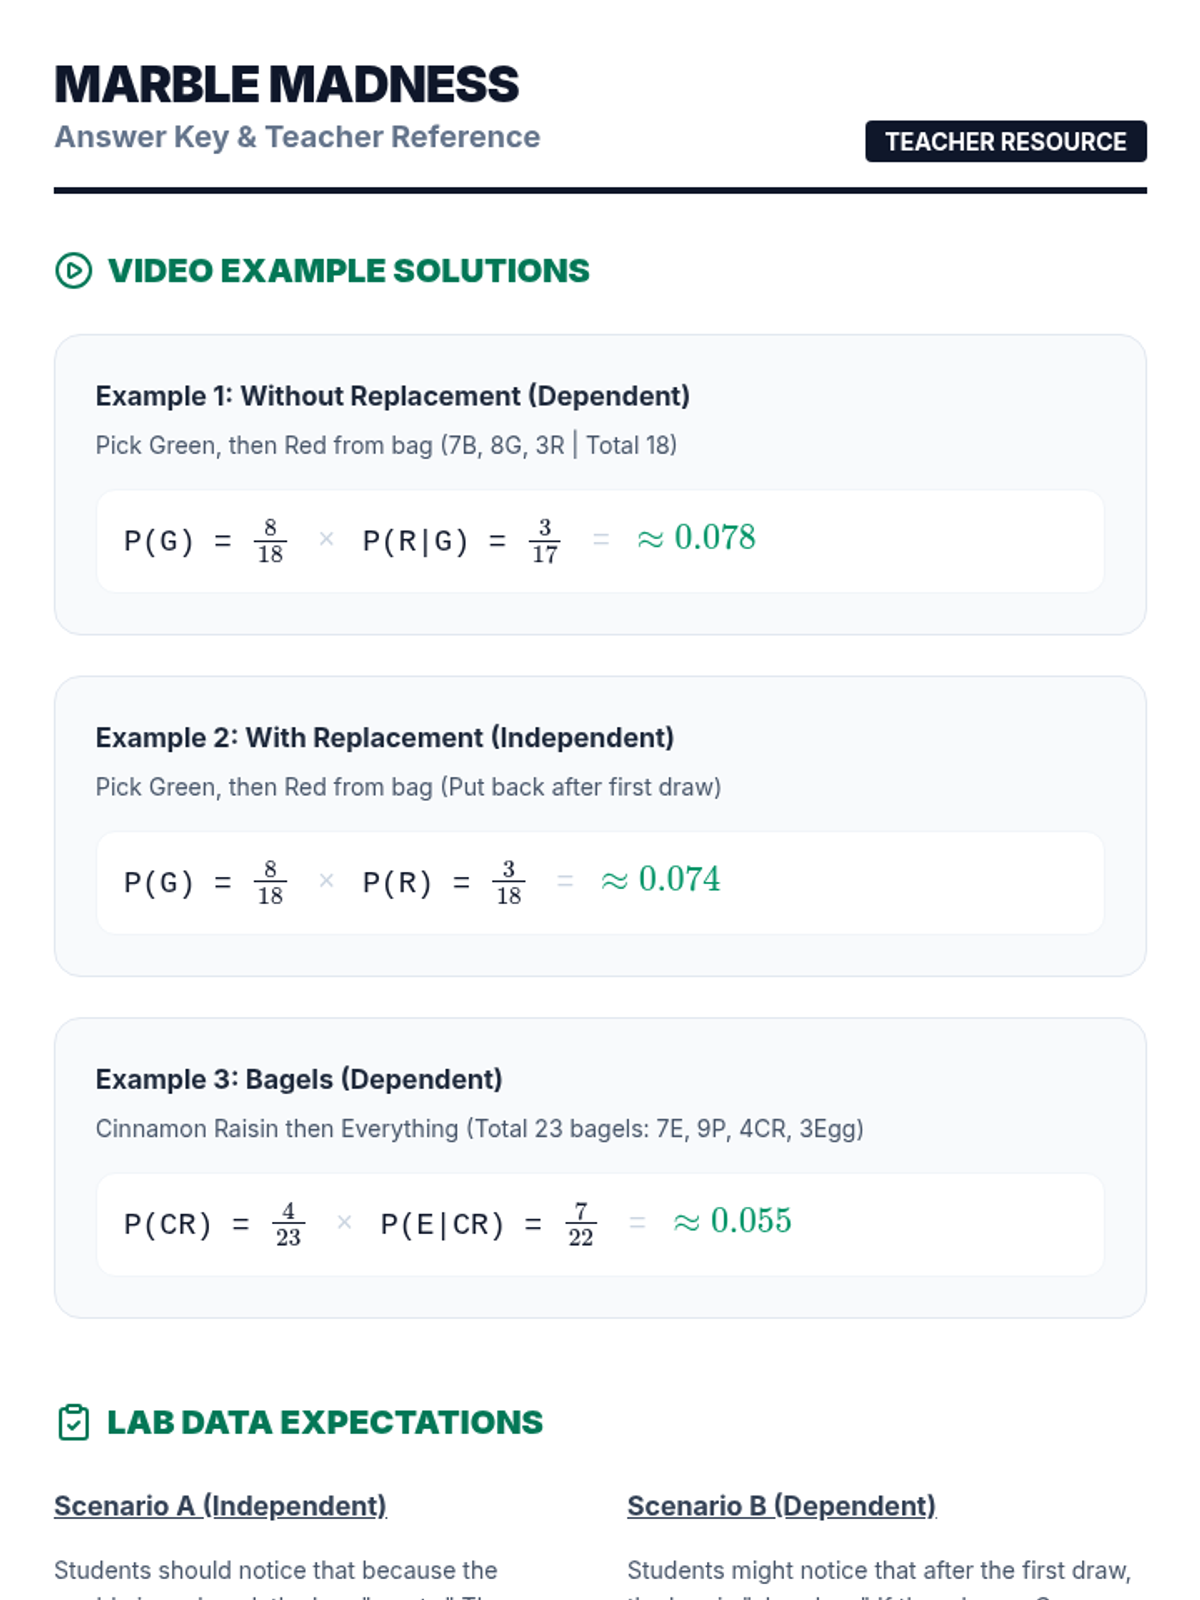
A hands-on 7th-grade math lesson where students use colored counters to discover the difference between independent and dependent compound events, supported by a video walkthrough and data collection.
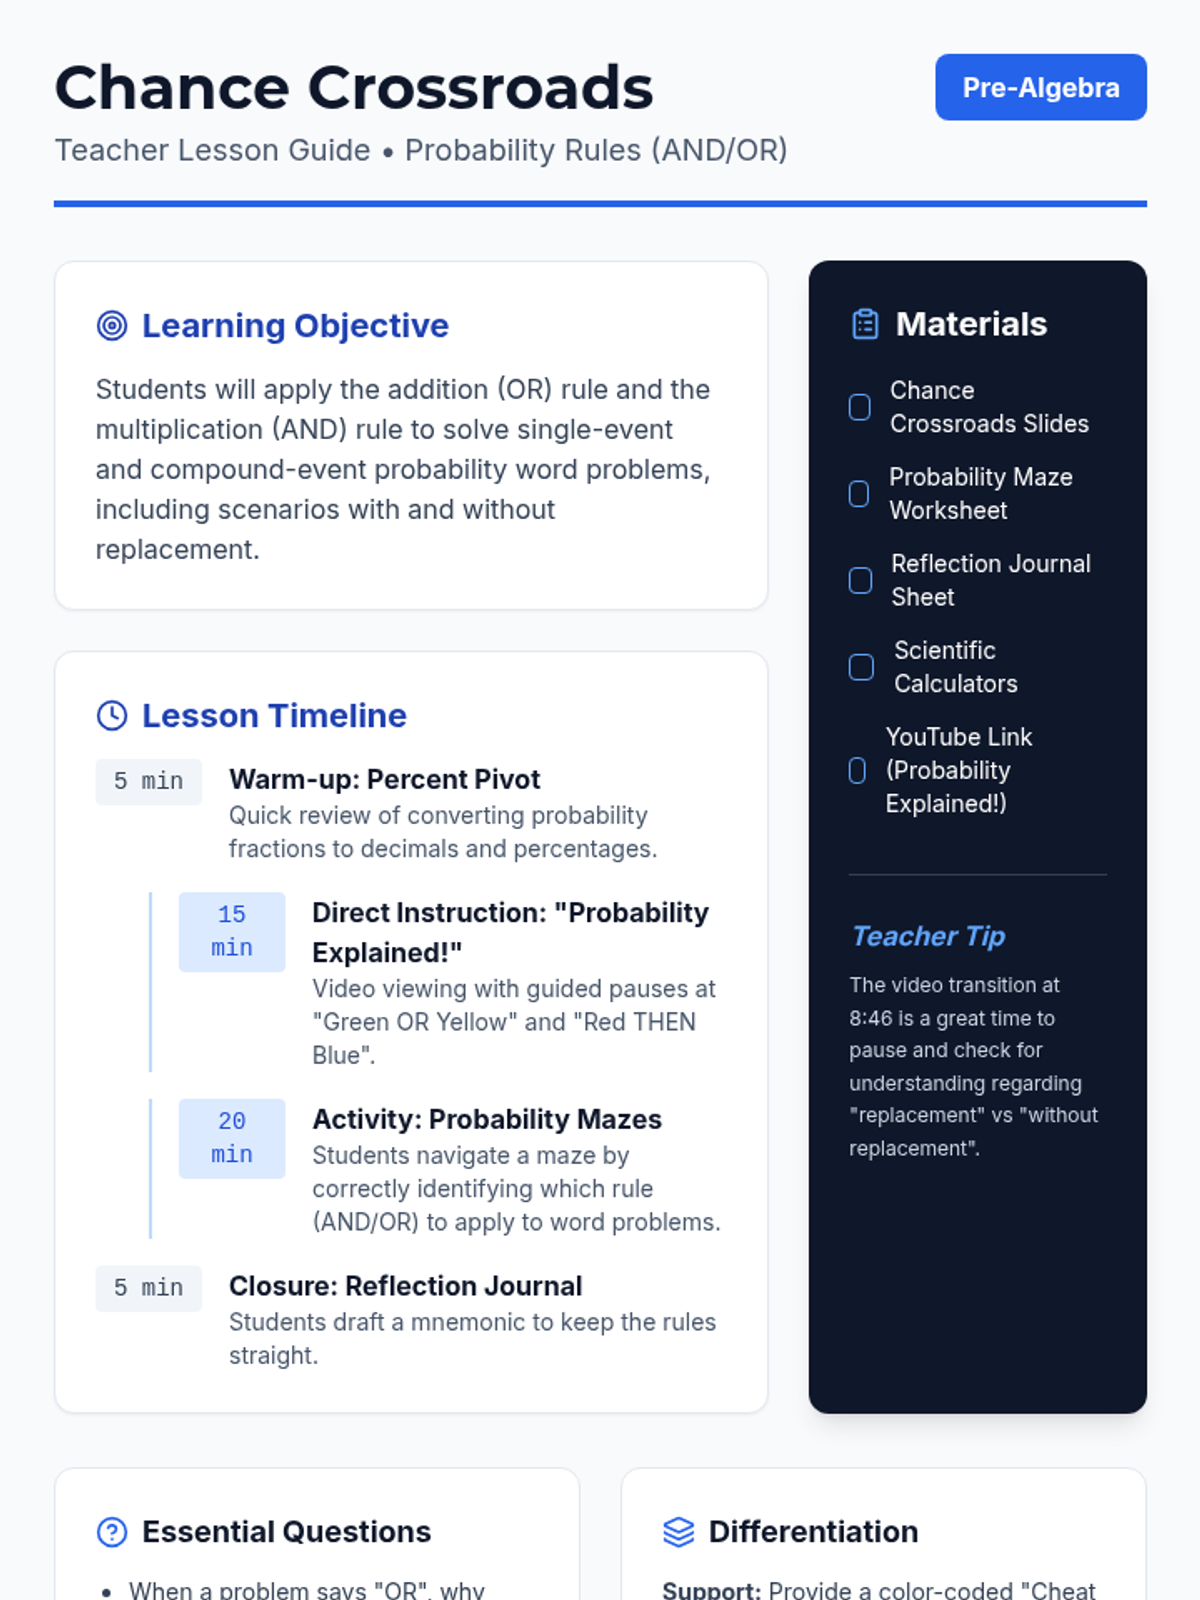
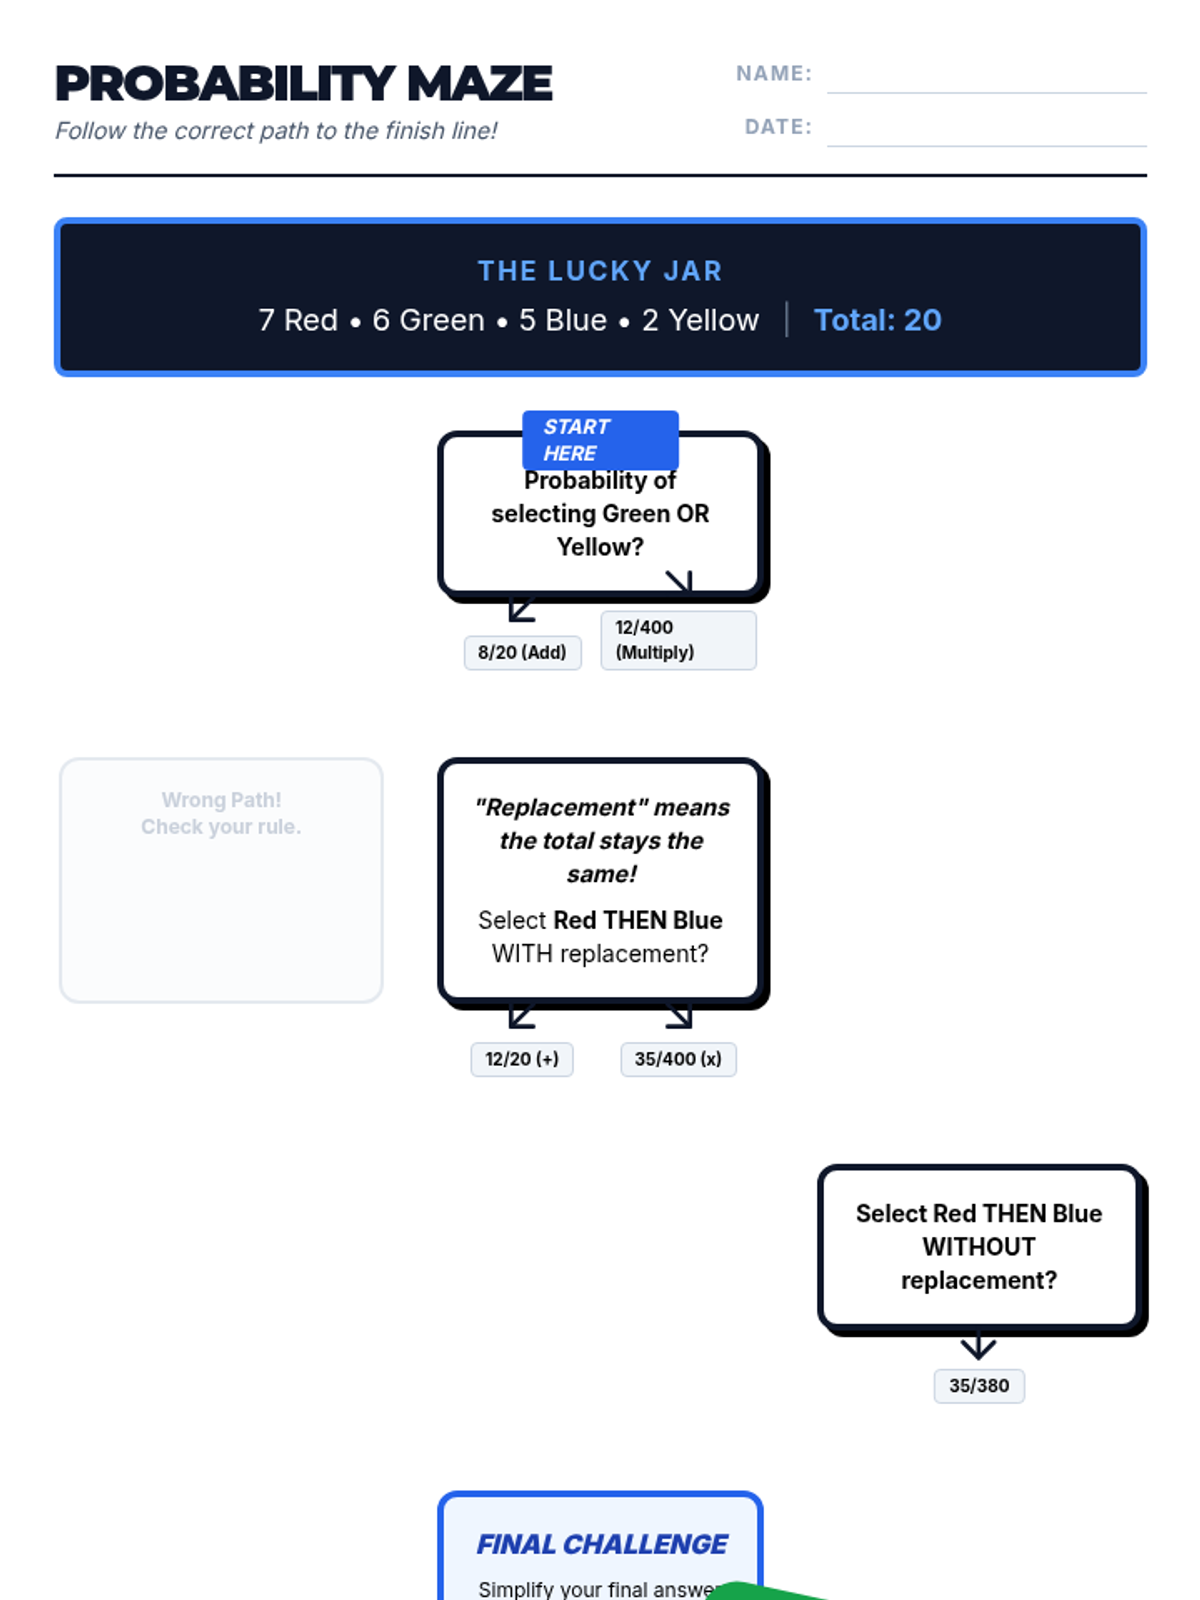
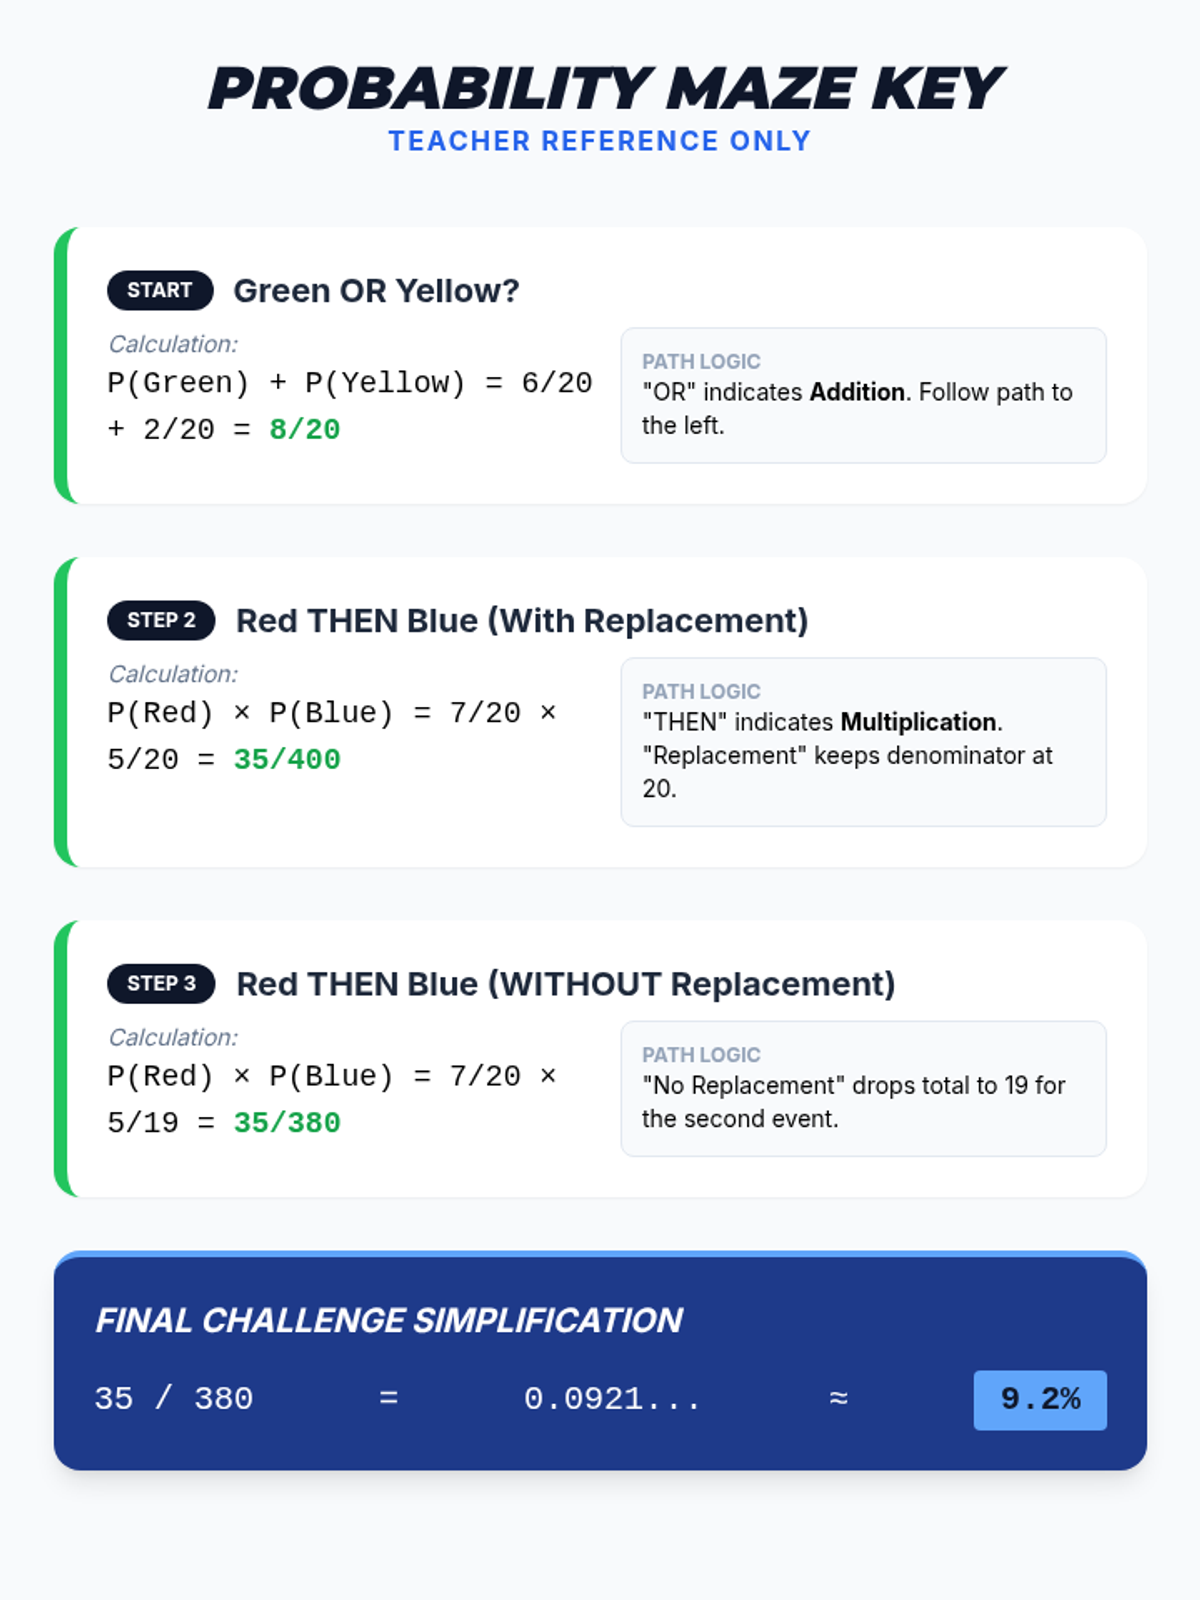
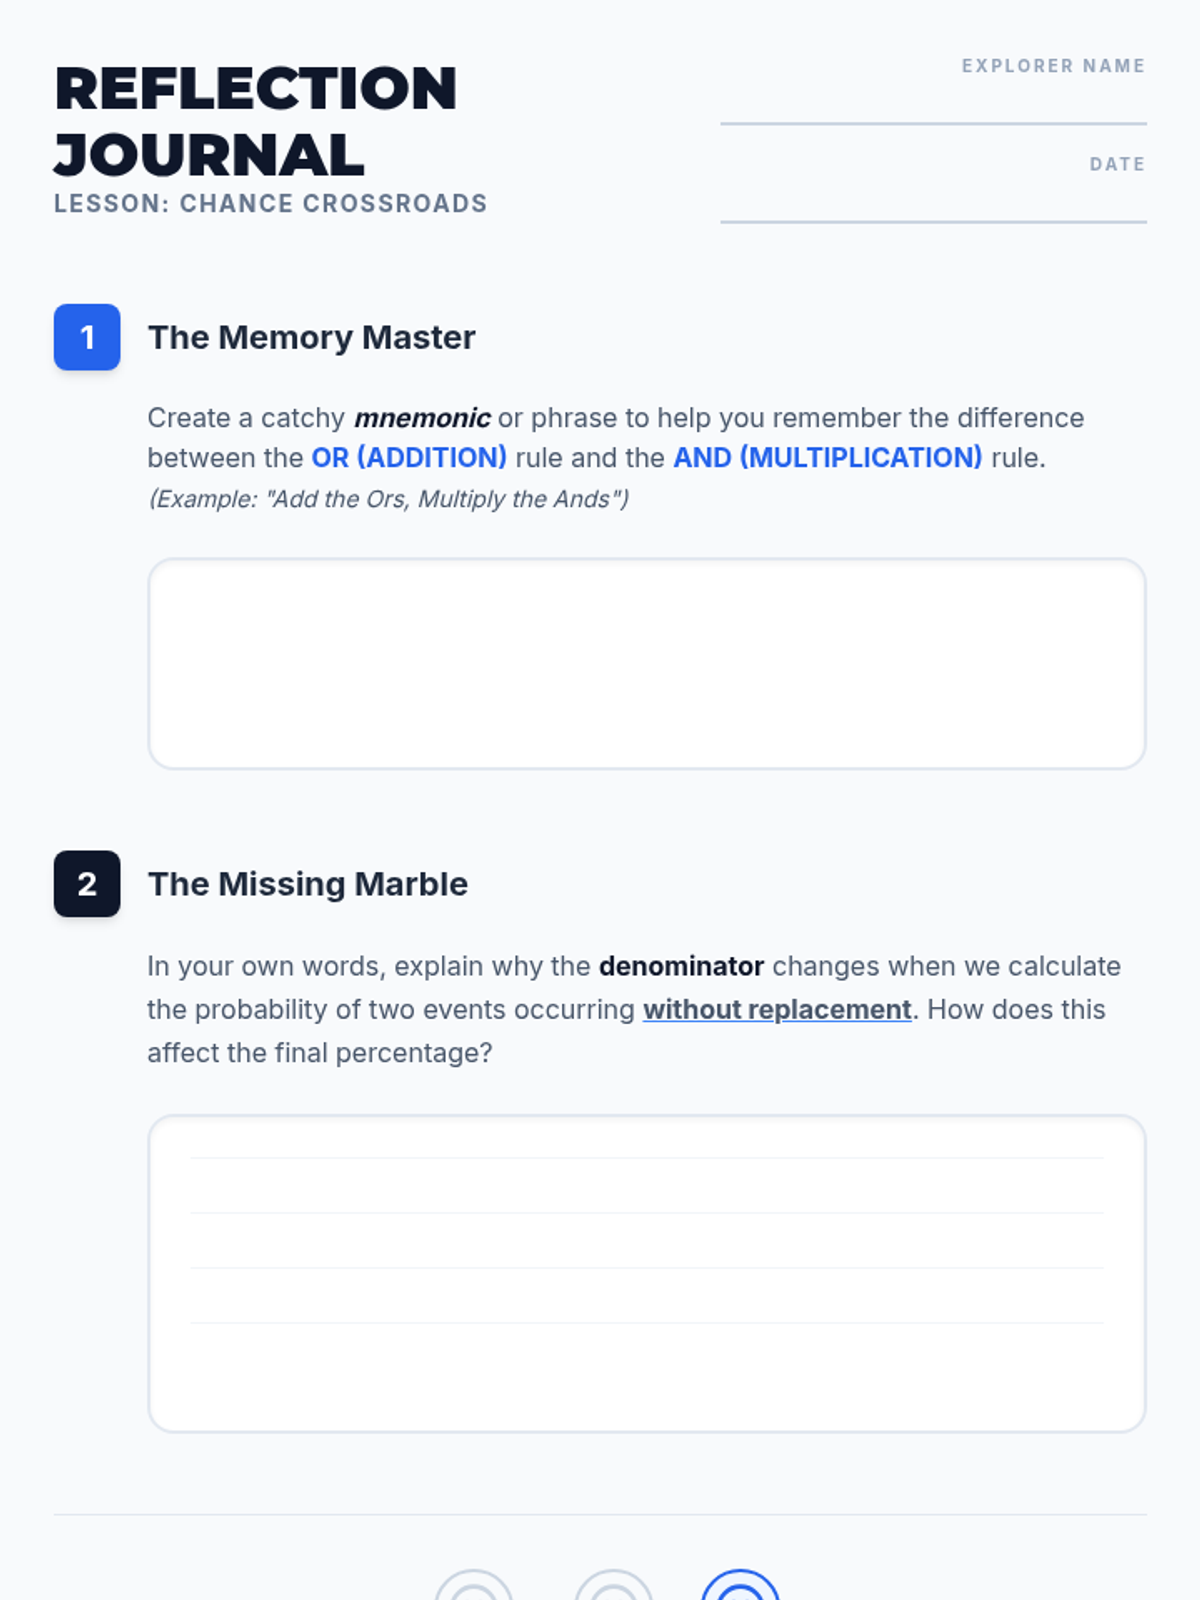
A Pre-Algebra lesson focusing on the addition (OR) and multiplication (AND) rules of probability, featuring a video-based instruction, a probability maze activity, and a reflective journal.
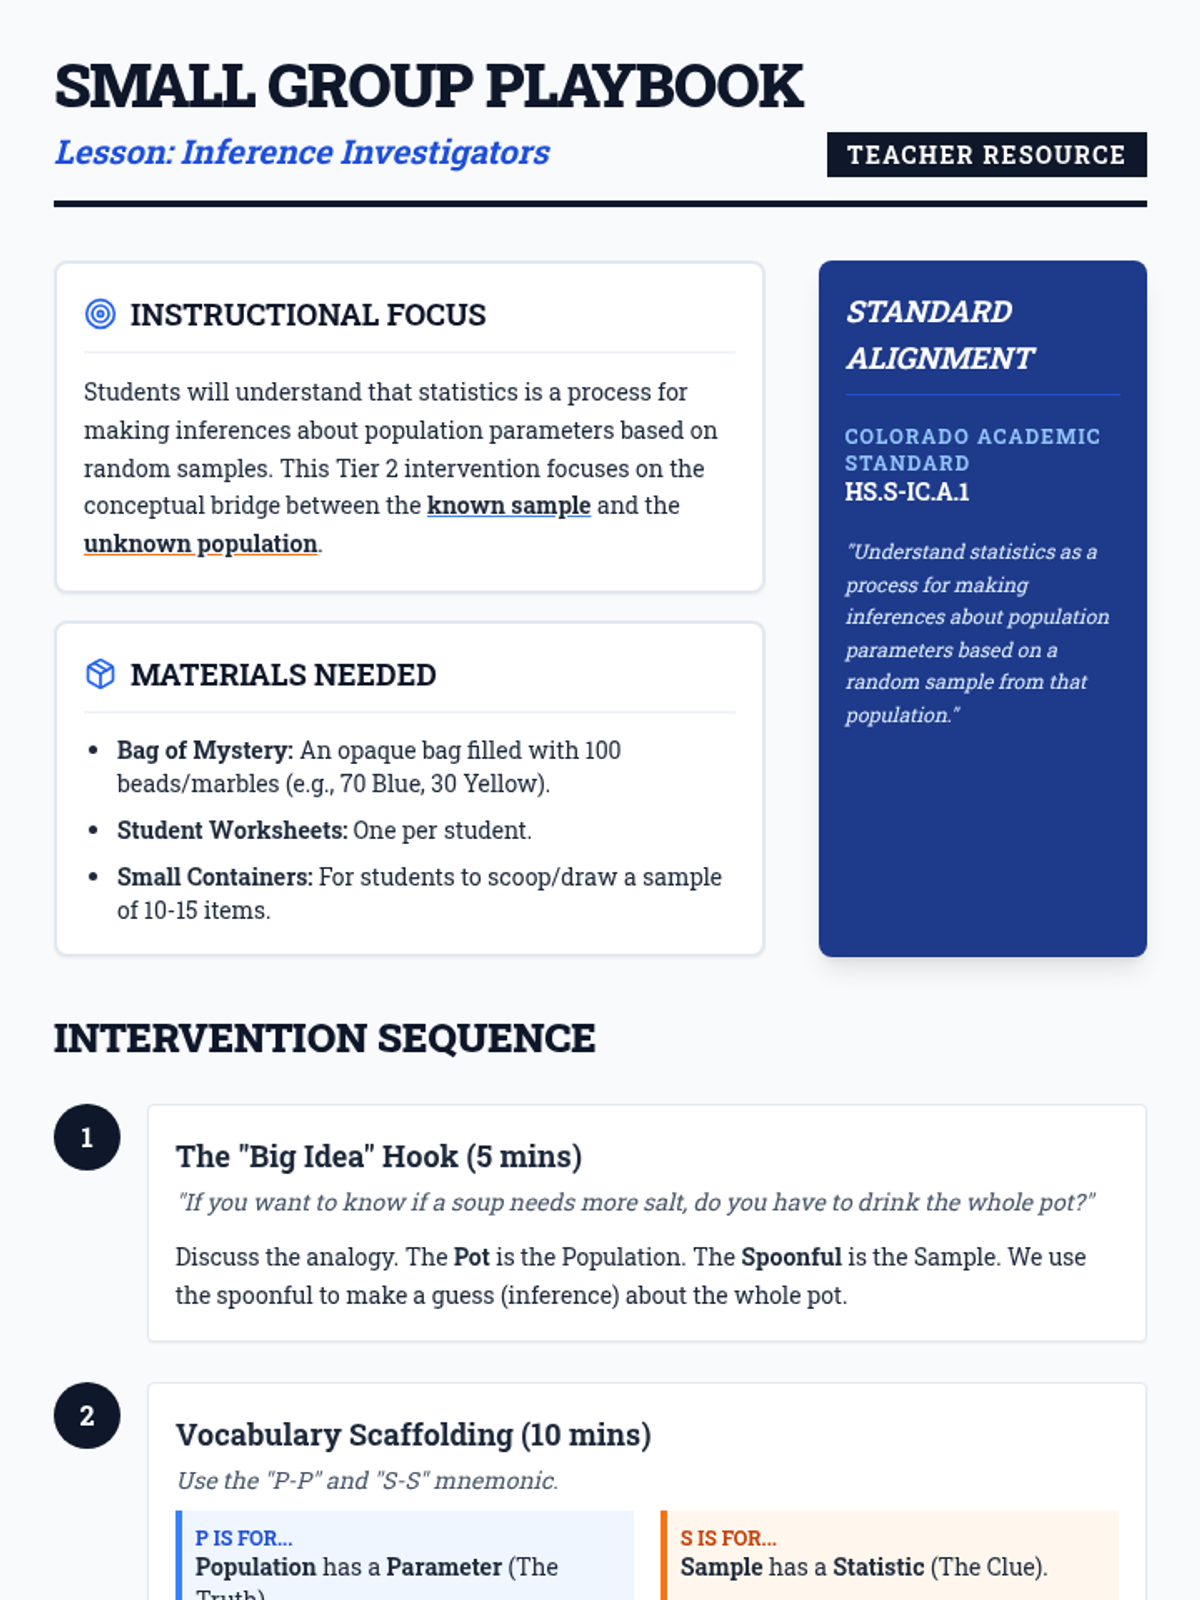
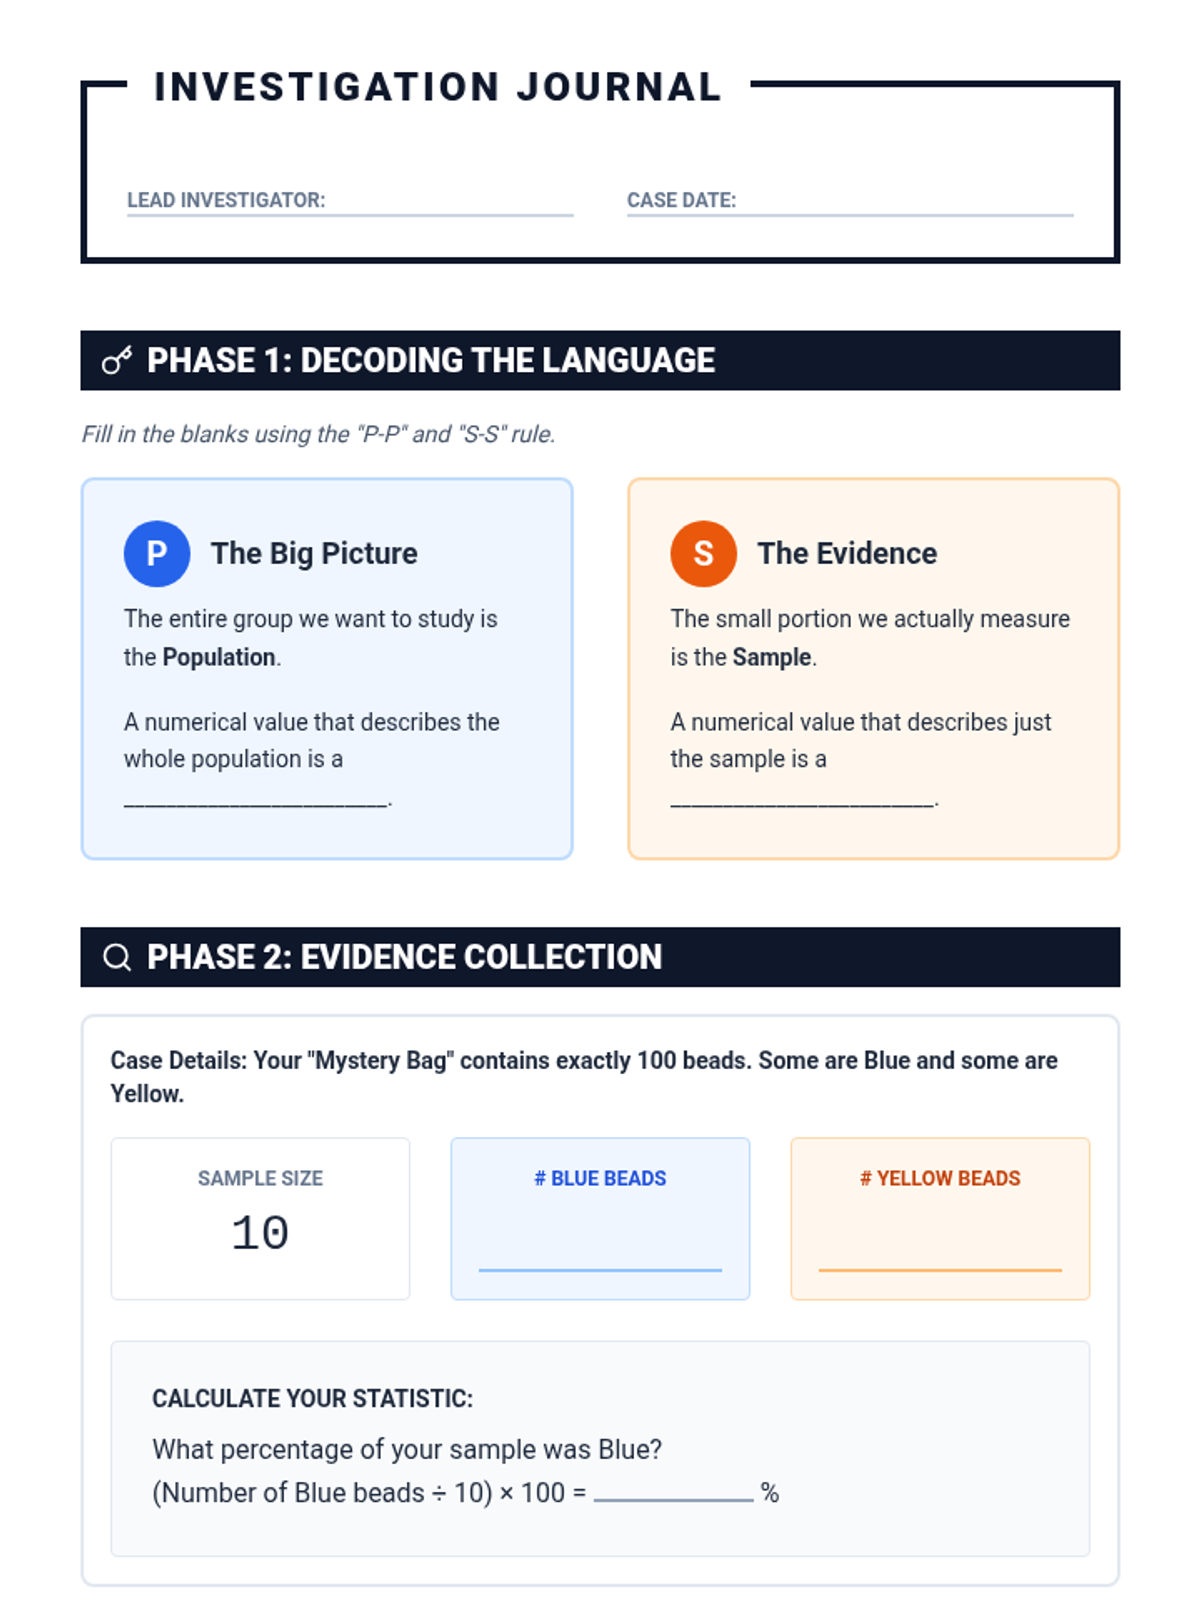
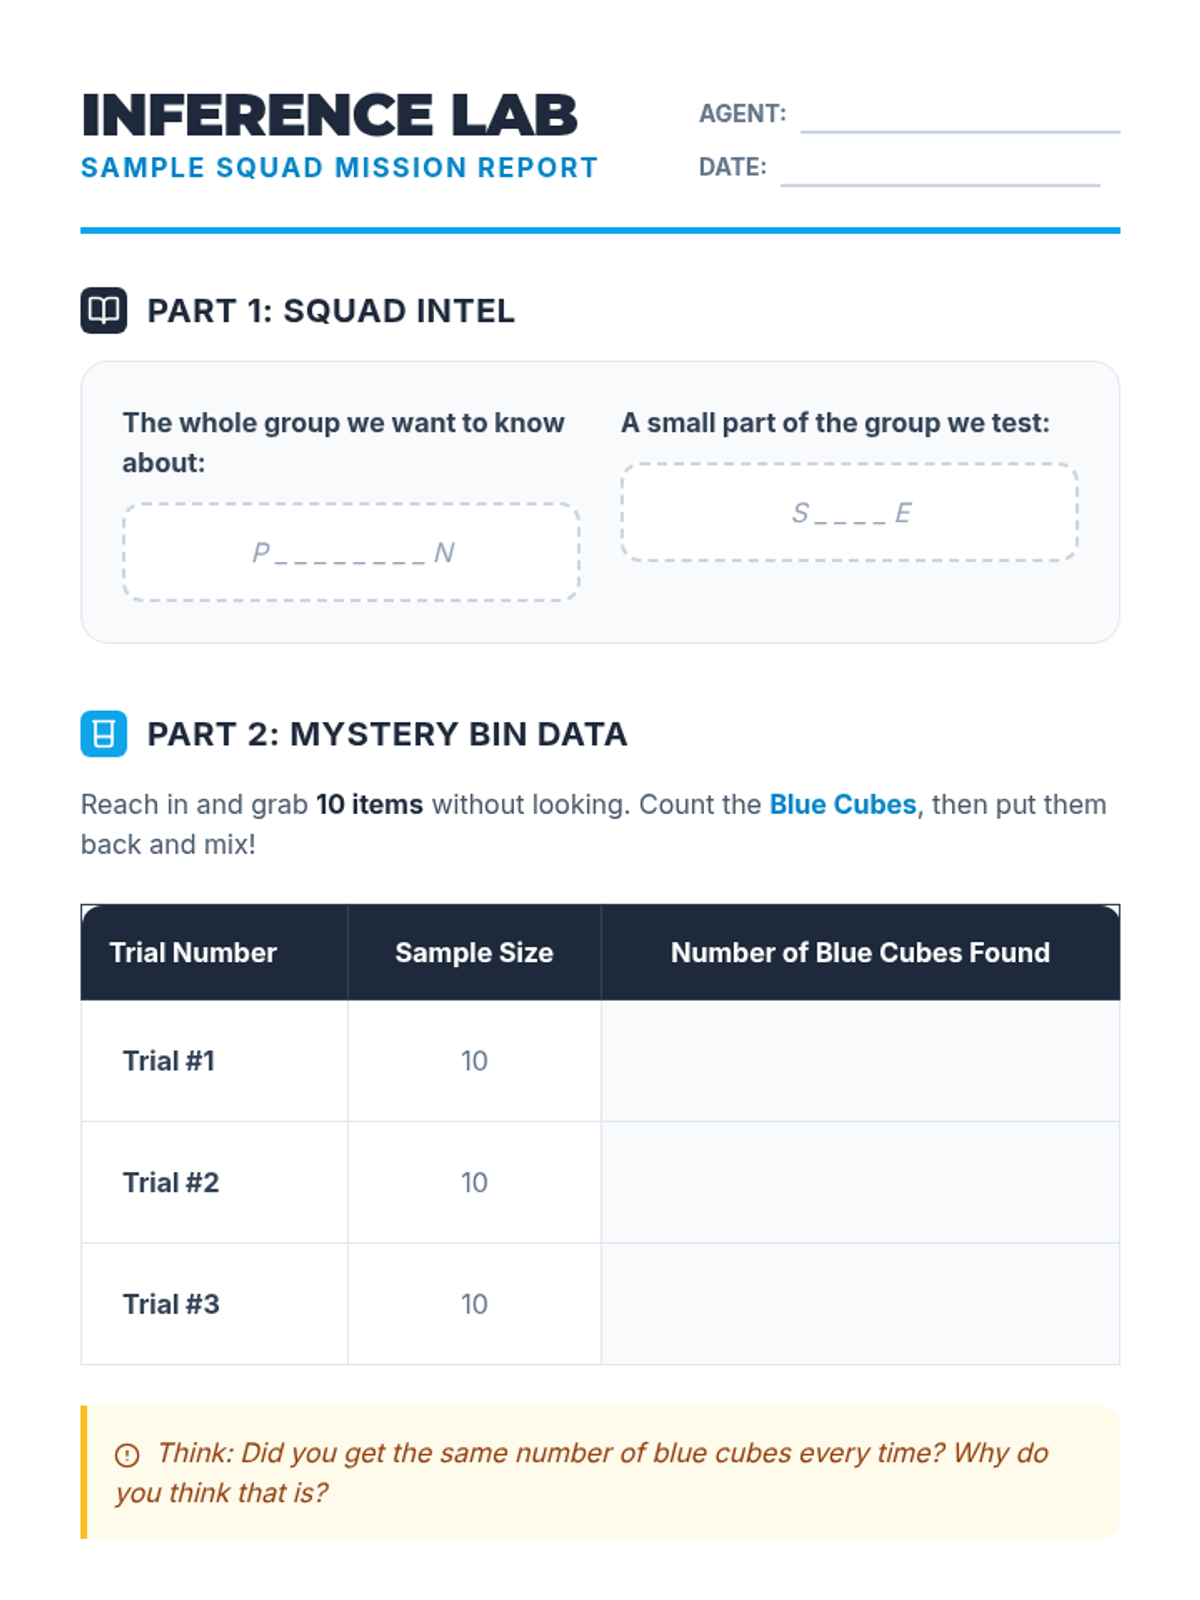
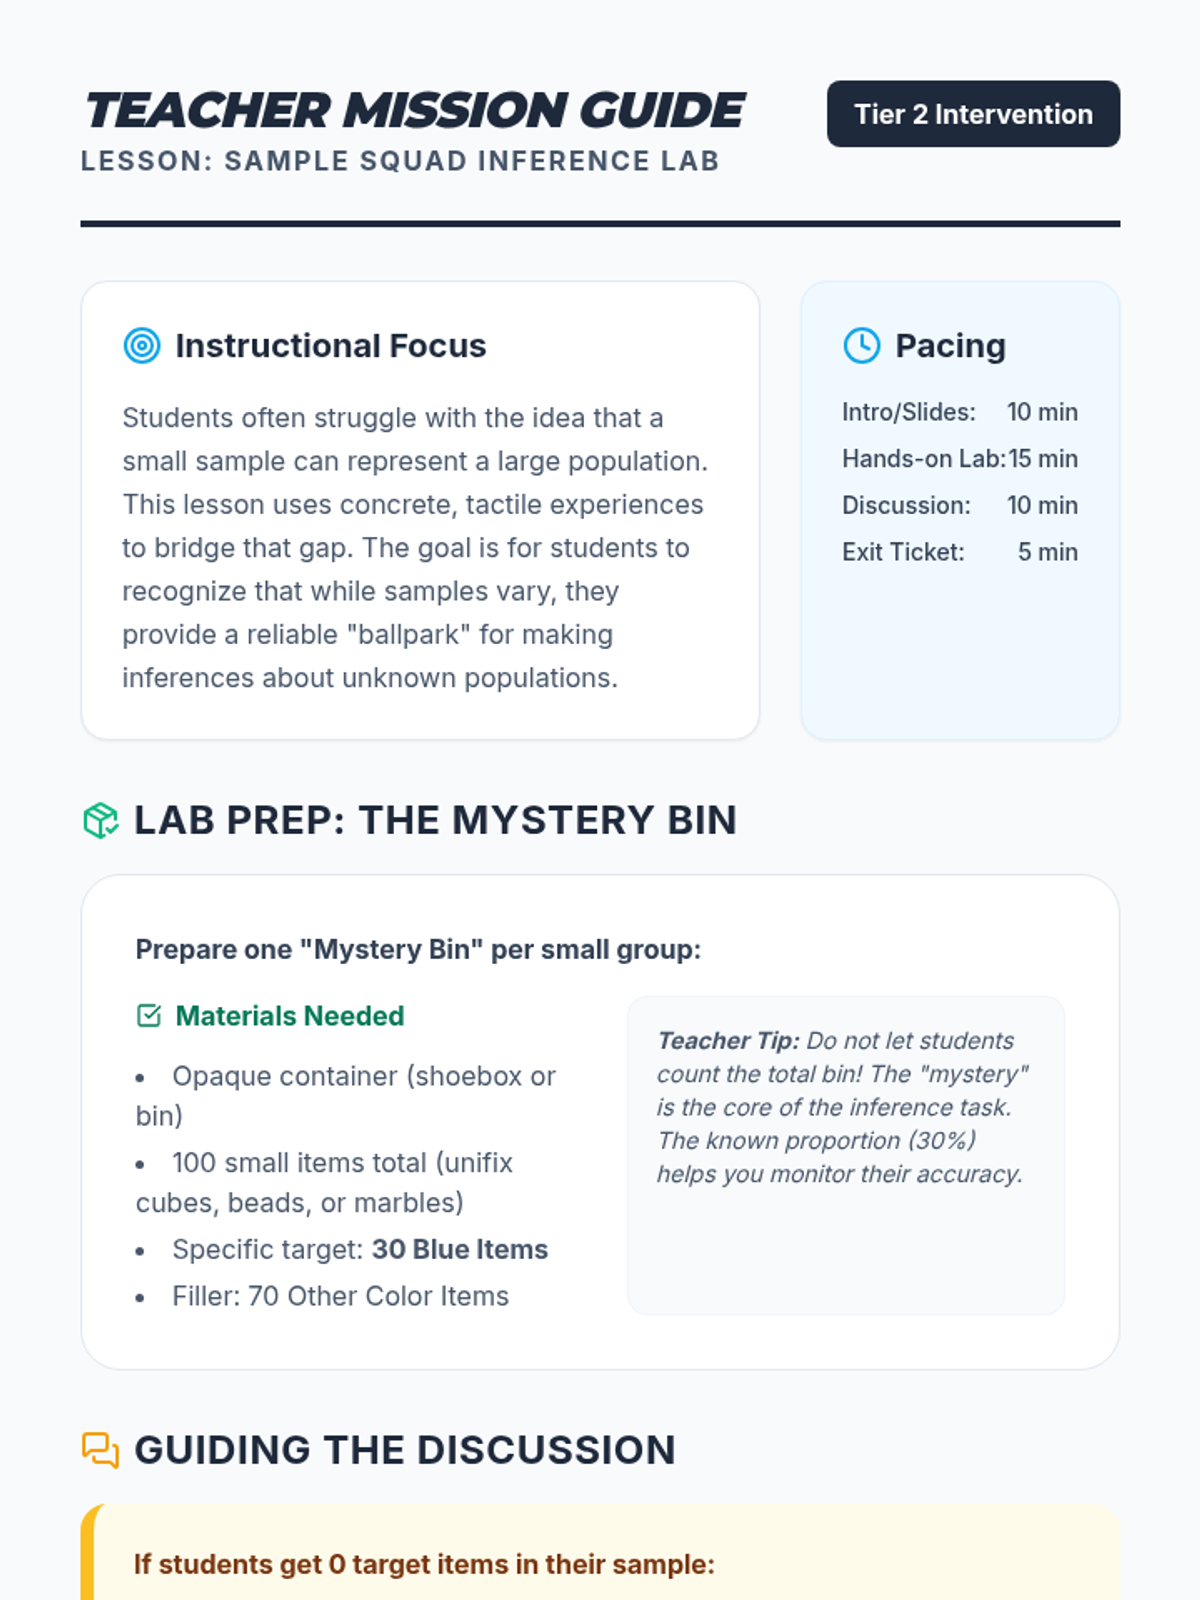
A Tier 2 intervention lesson focusing on the core logic of statistical inference. Students move from physical sampling to conceptual understanding of how samples represent populations.
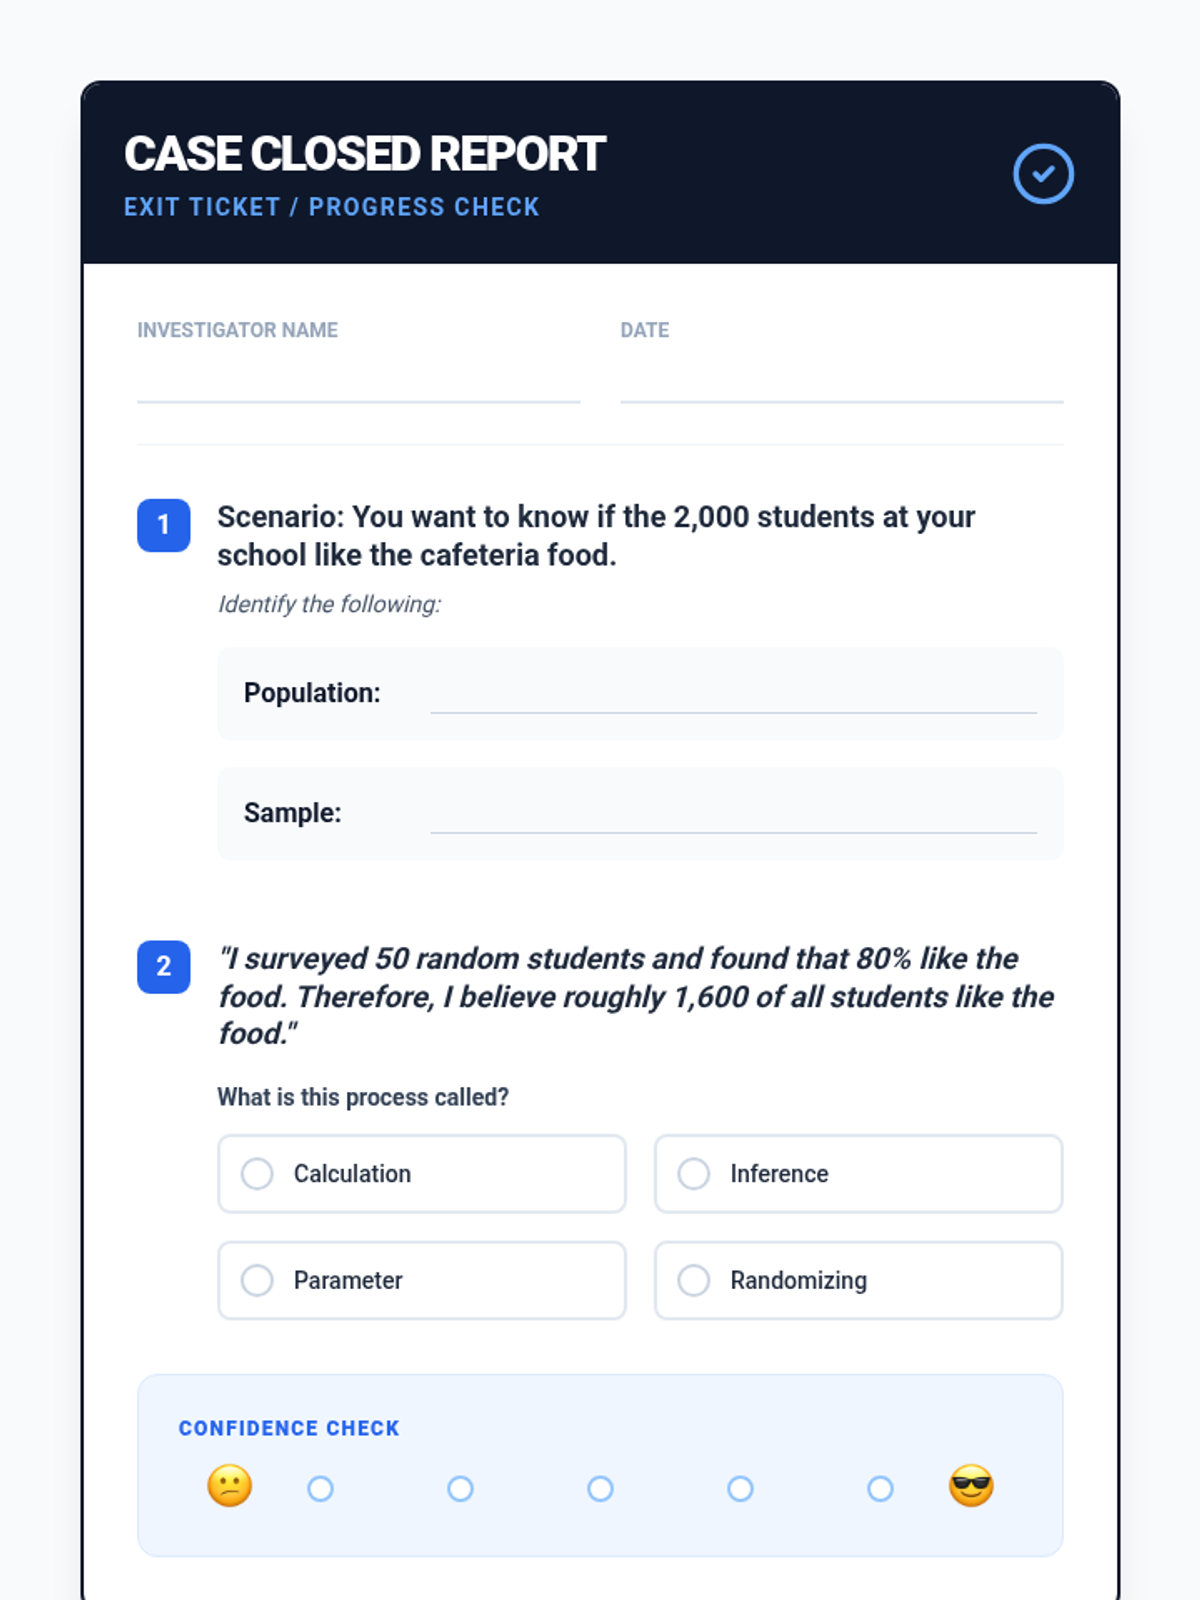
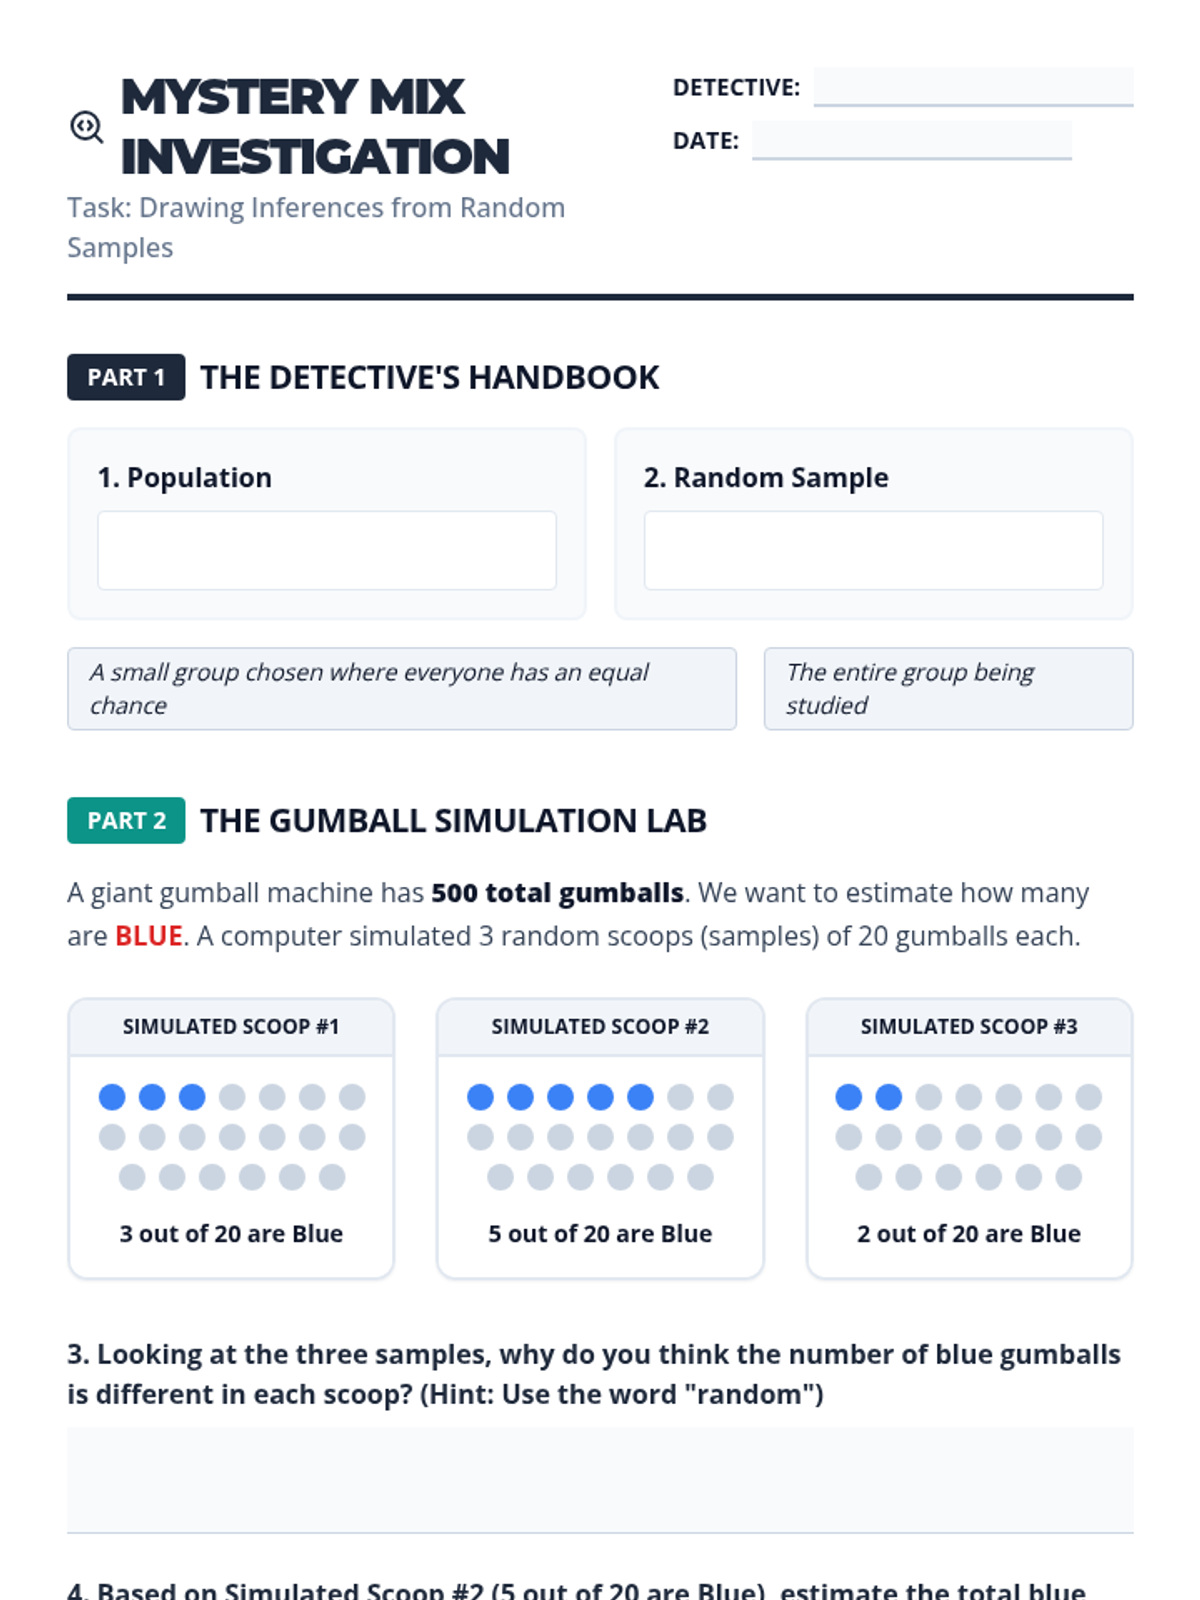
A Tier 2 intervention lesson focused on using random samples to make population inferences and understanding why different samples produce different results. Students analyze simulated data to gauge variability and develop reasoning skills for predicting population characteristics.
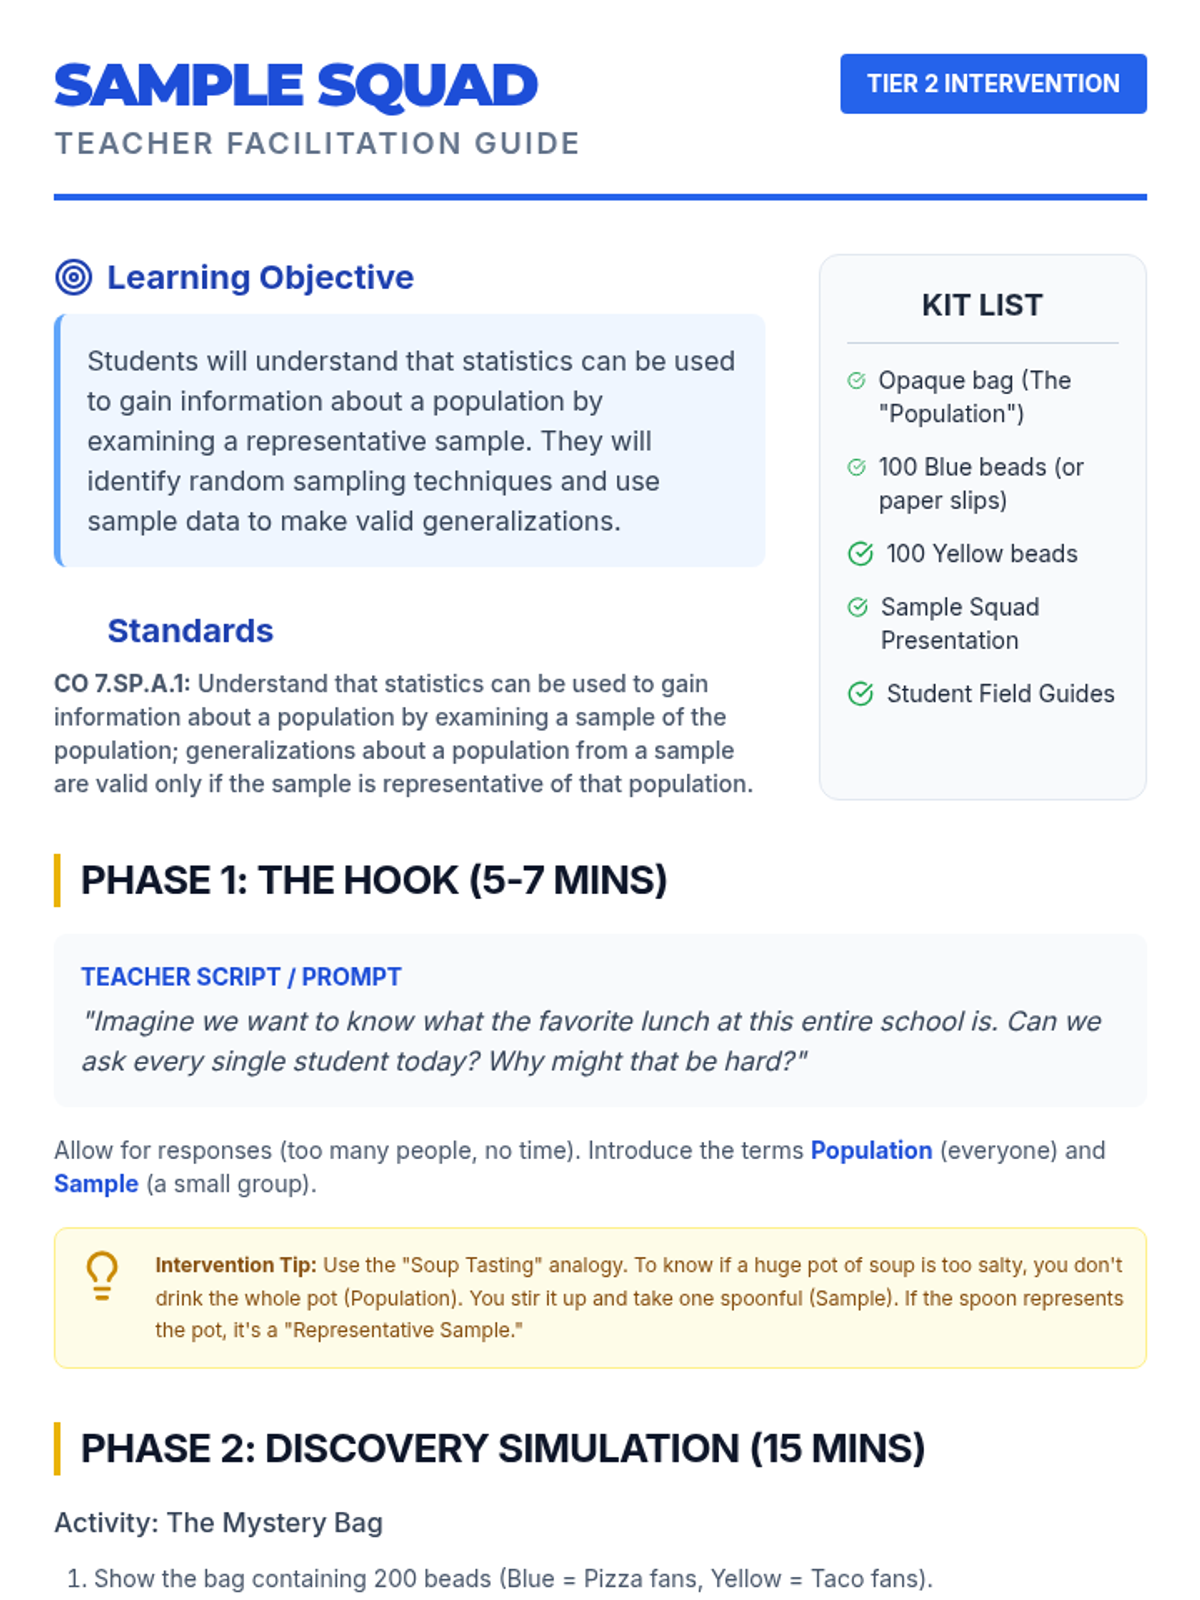
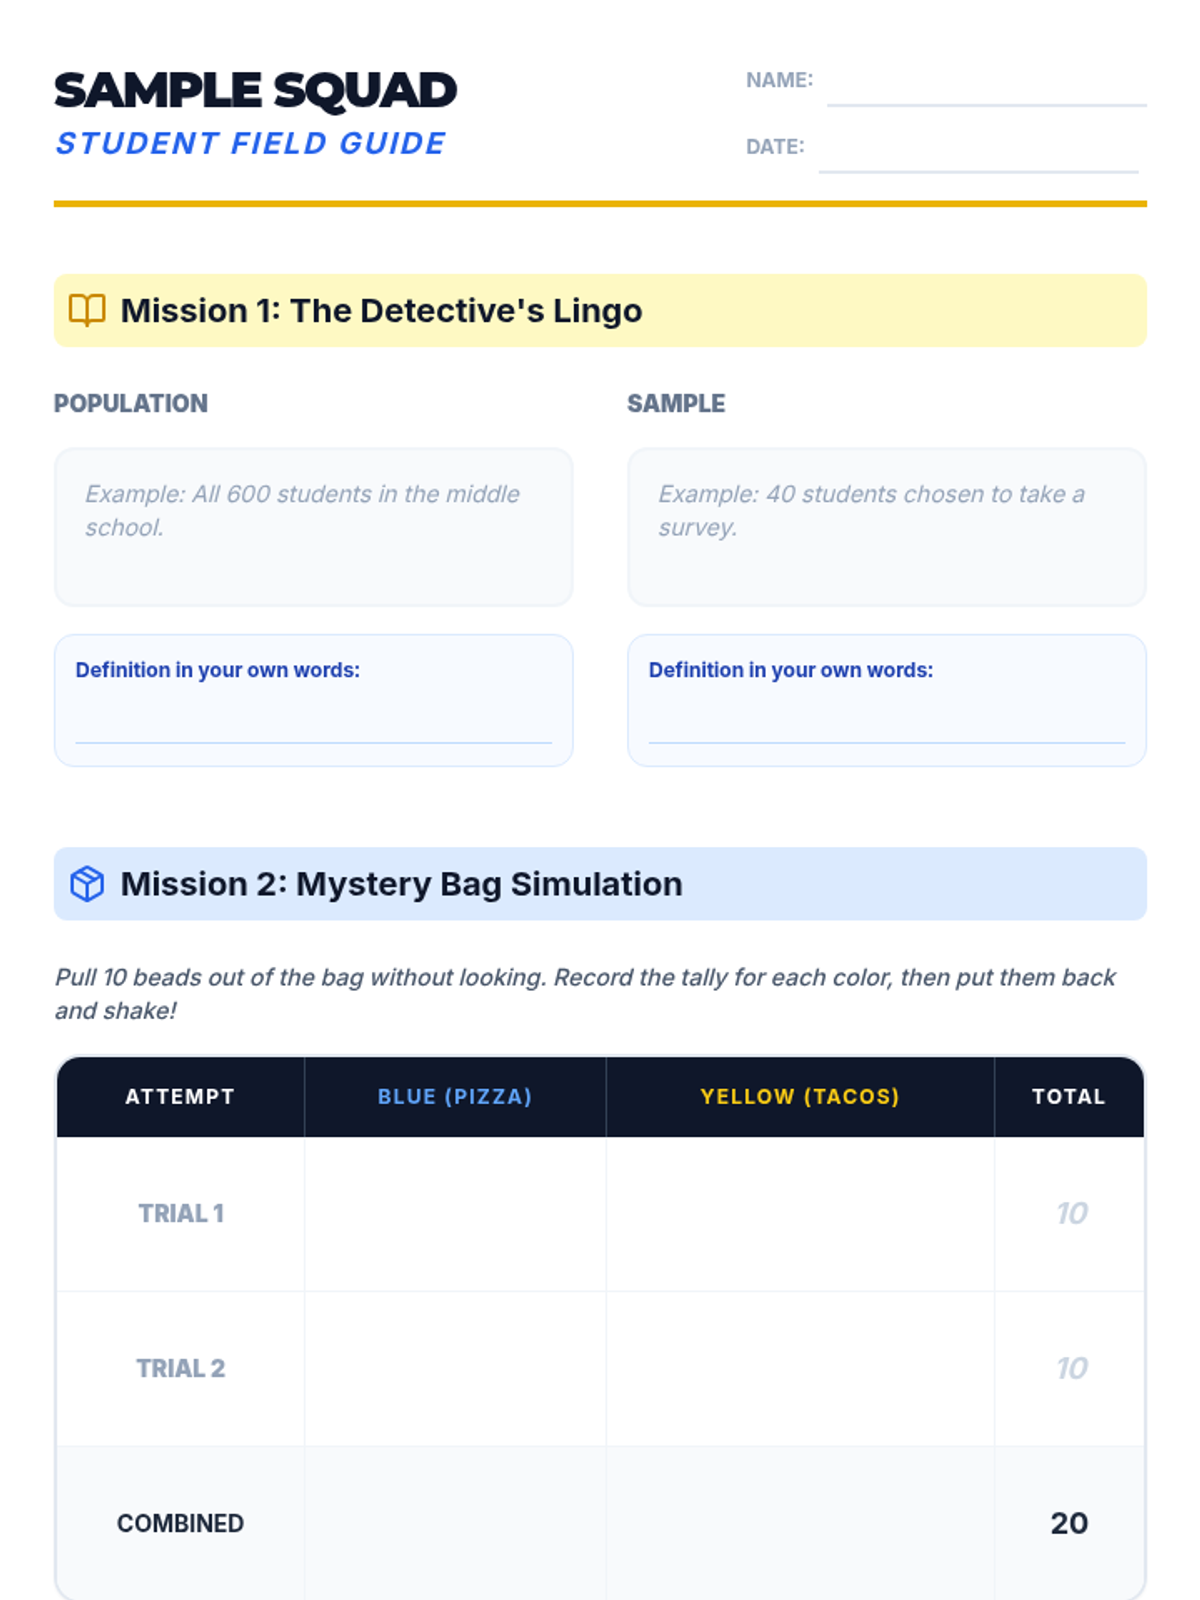
A Tier 2 intervention lesson designed for small groups to master the concepts of representative sampling and valid generalizations through scaffolded real-world scenarios and hands-on simulation.
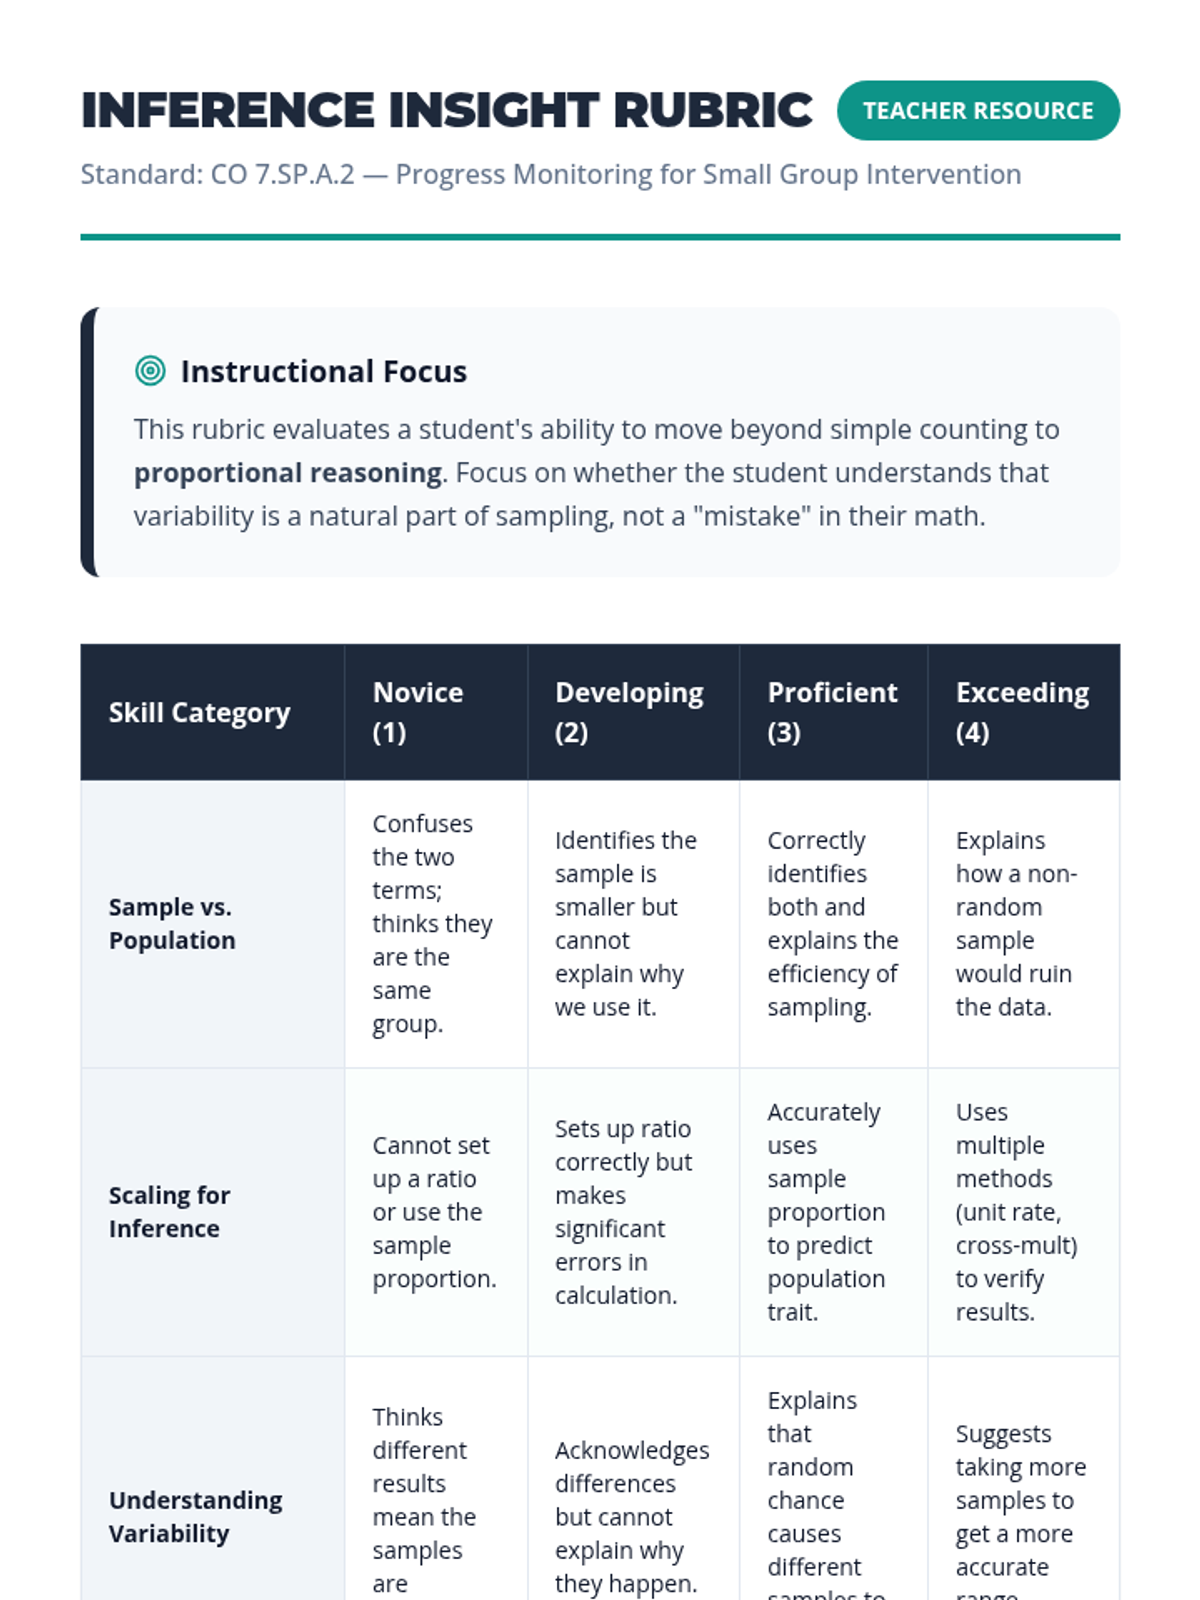
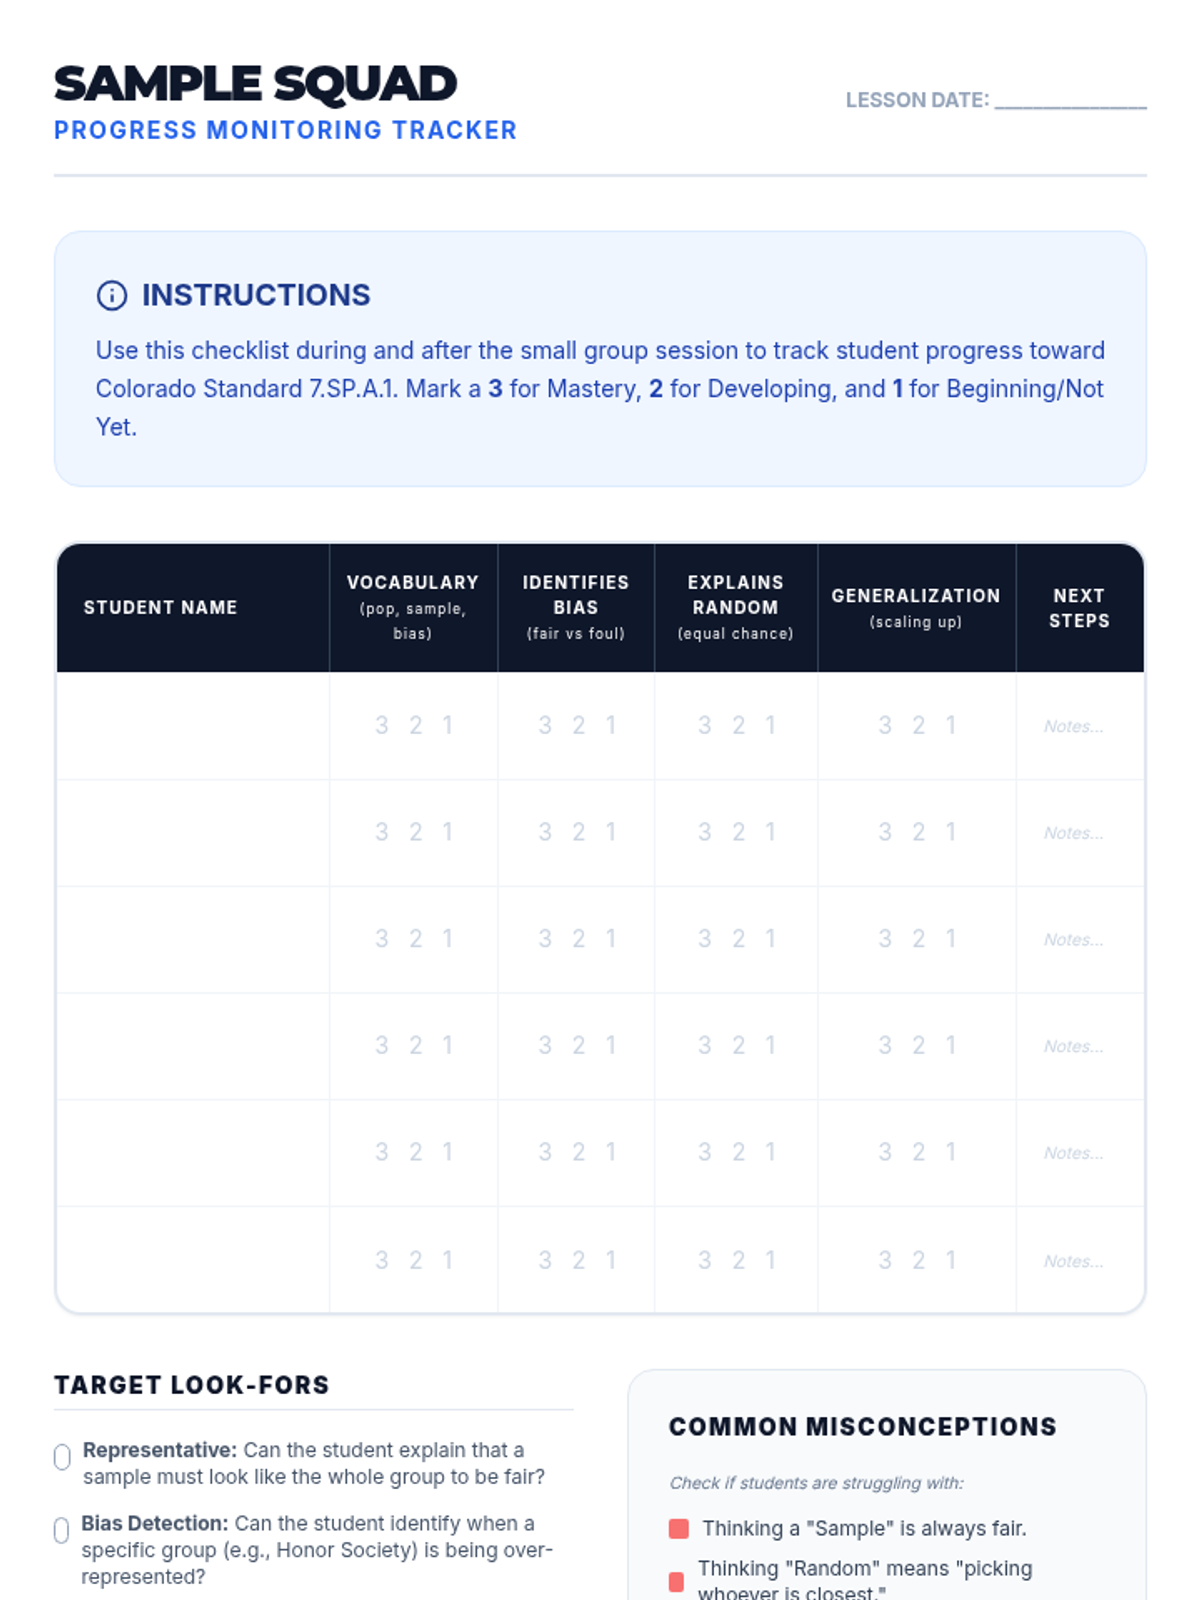
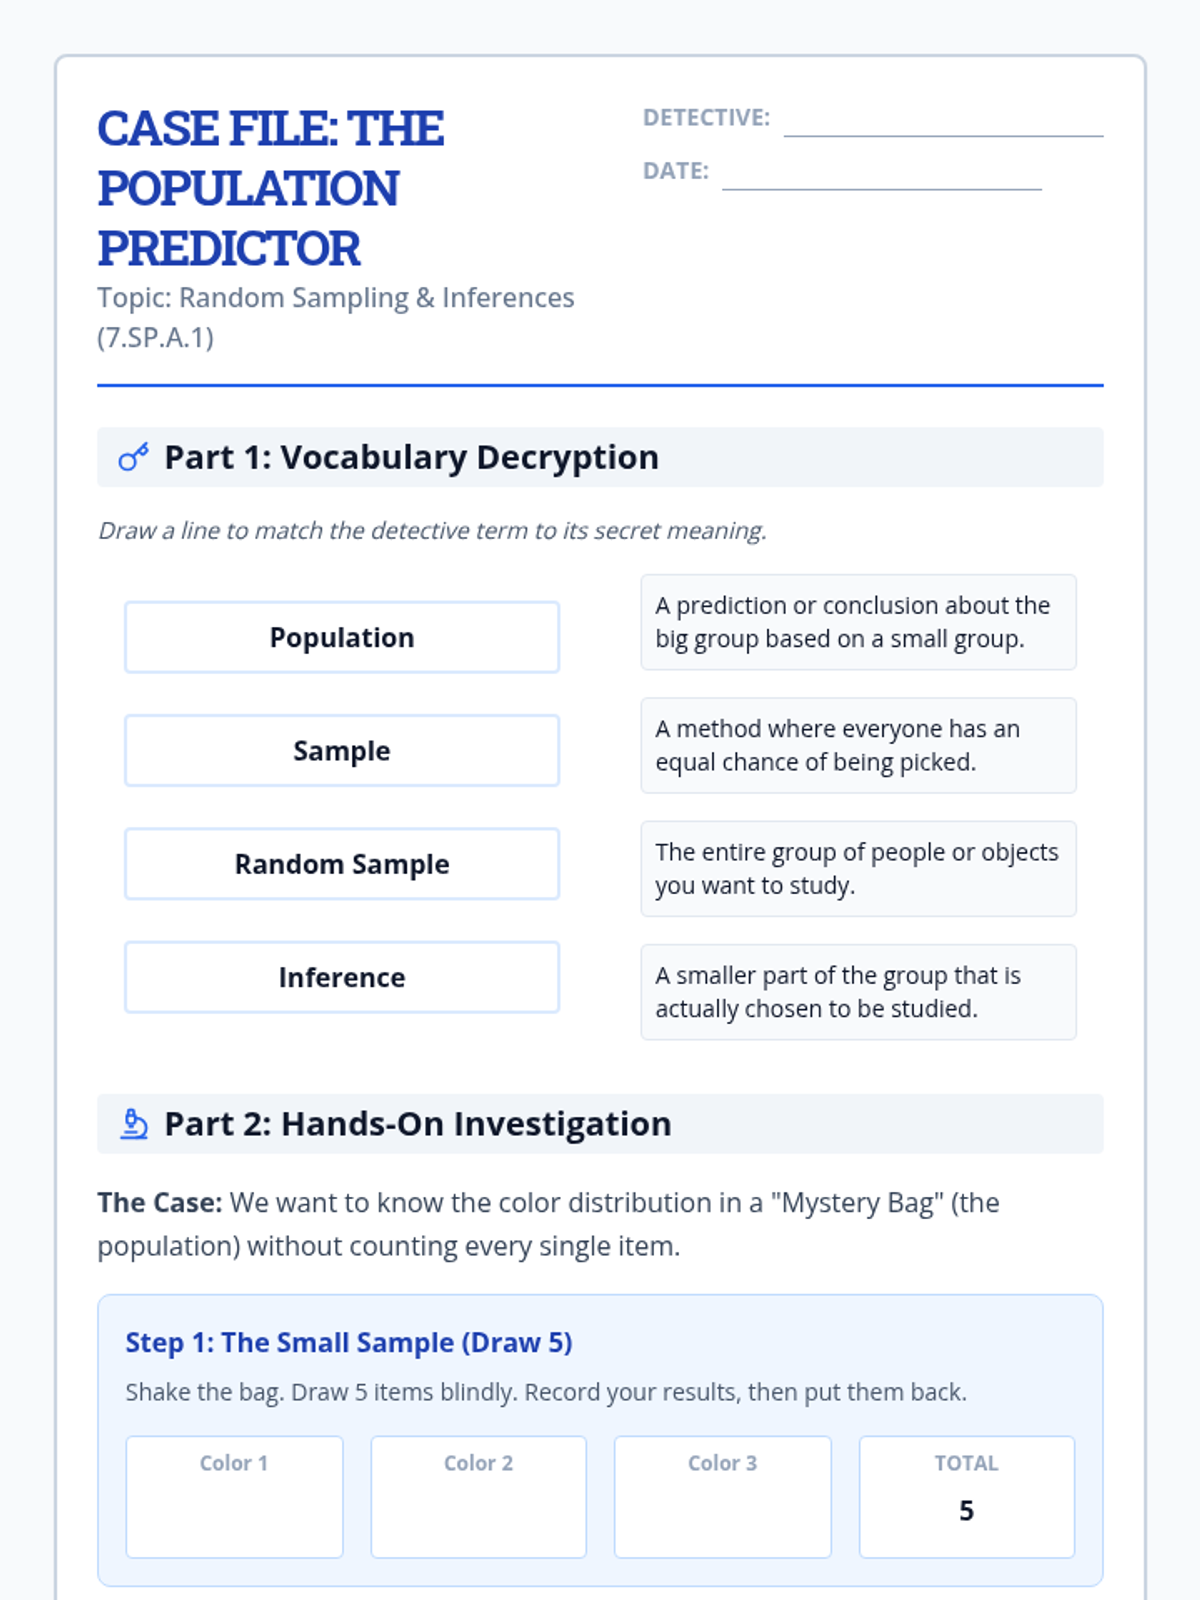
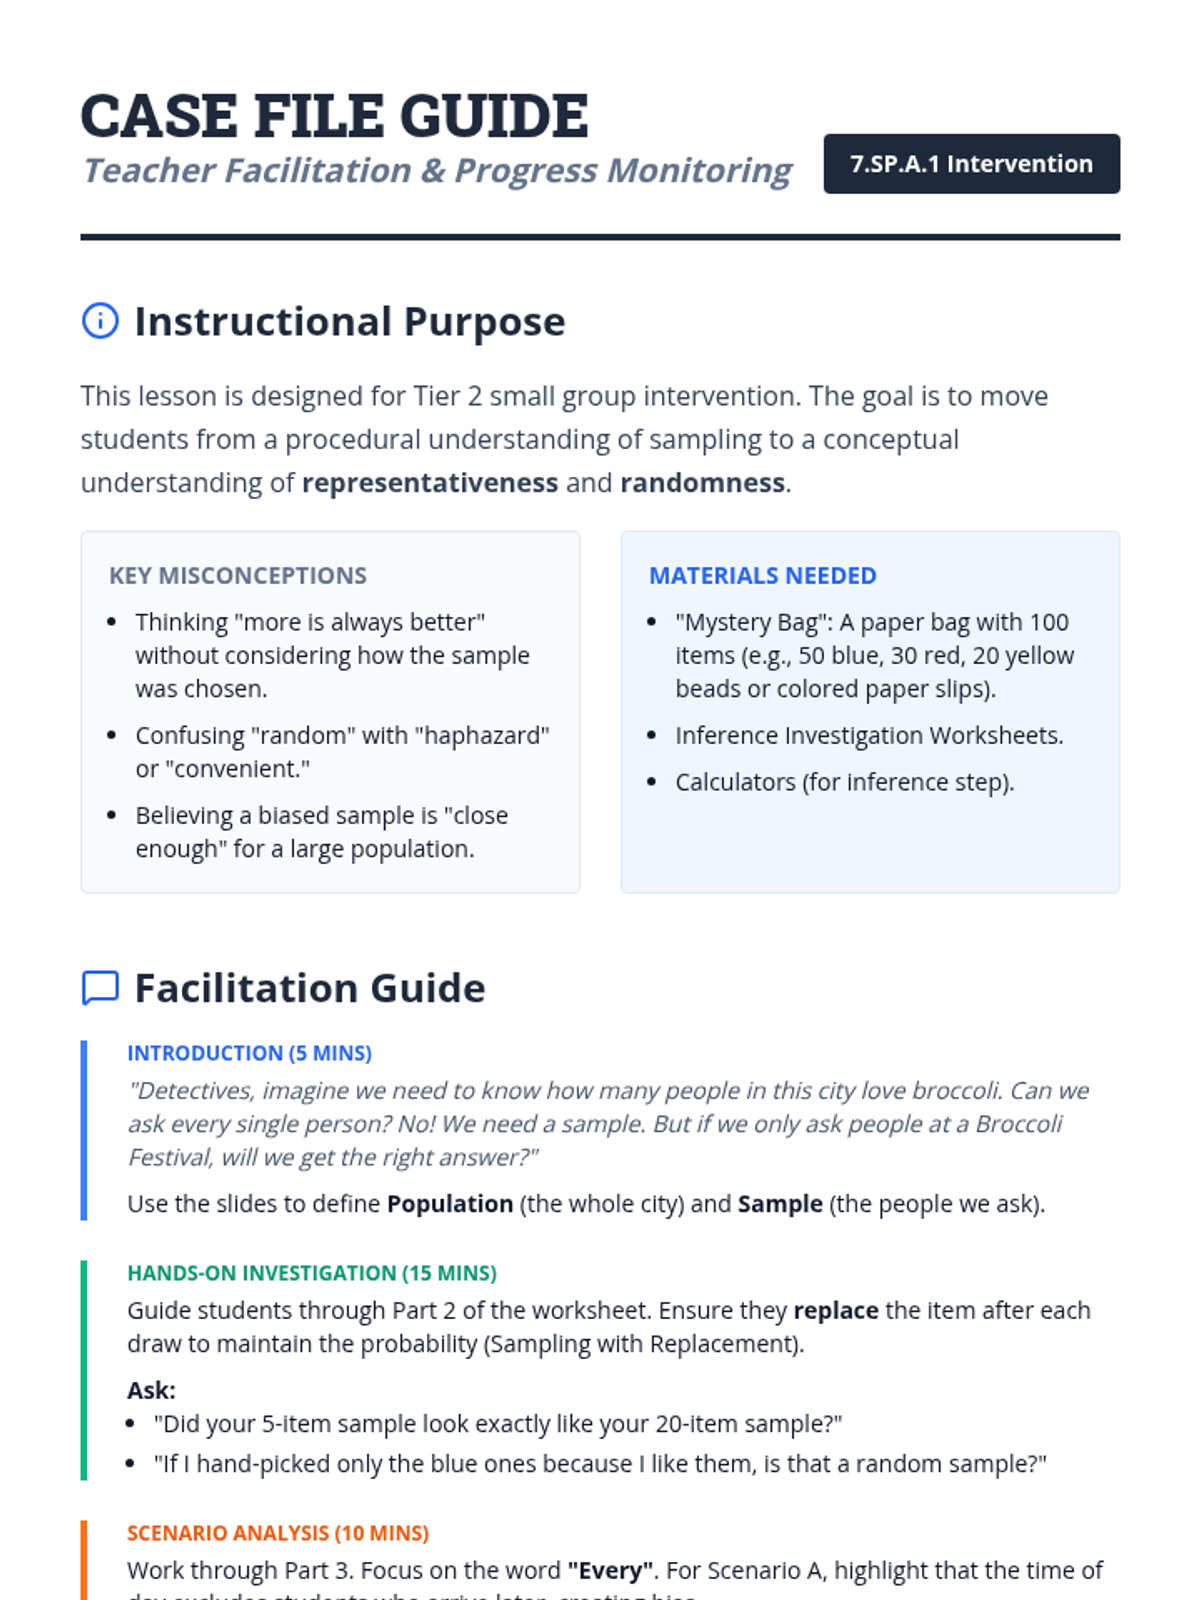
A Tier 2 small group intervention lesson focusing on the foundations of random sampling, representative samples, and making valid inferences about a population. Students act as 'Data Detectives' to investigate how different sampling methods affect the reliability of their conclusions.
A Tier 2 intervention lesson focused on using random sampling to make inferences about a population. Students engage in hands-on data collection and compare multiple samples to understand variation and prediction accuracy.
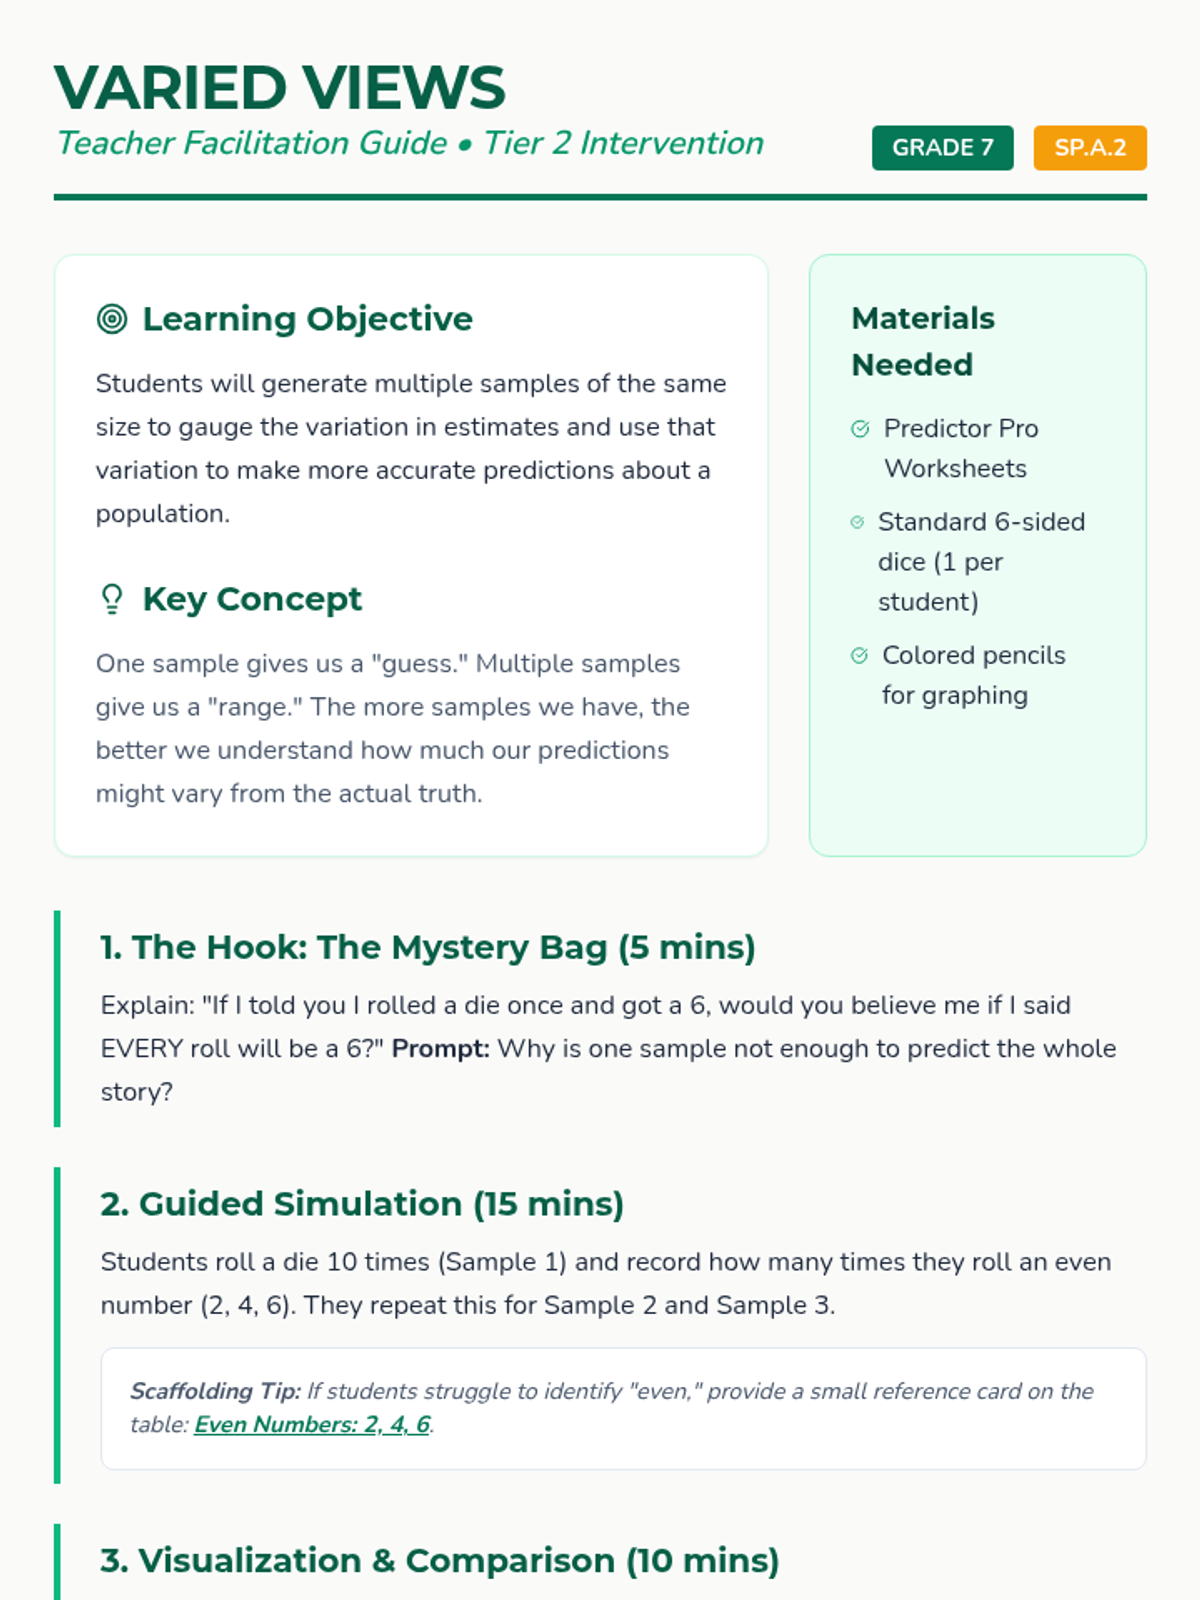
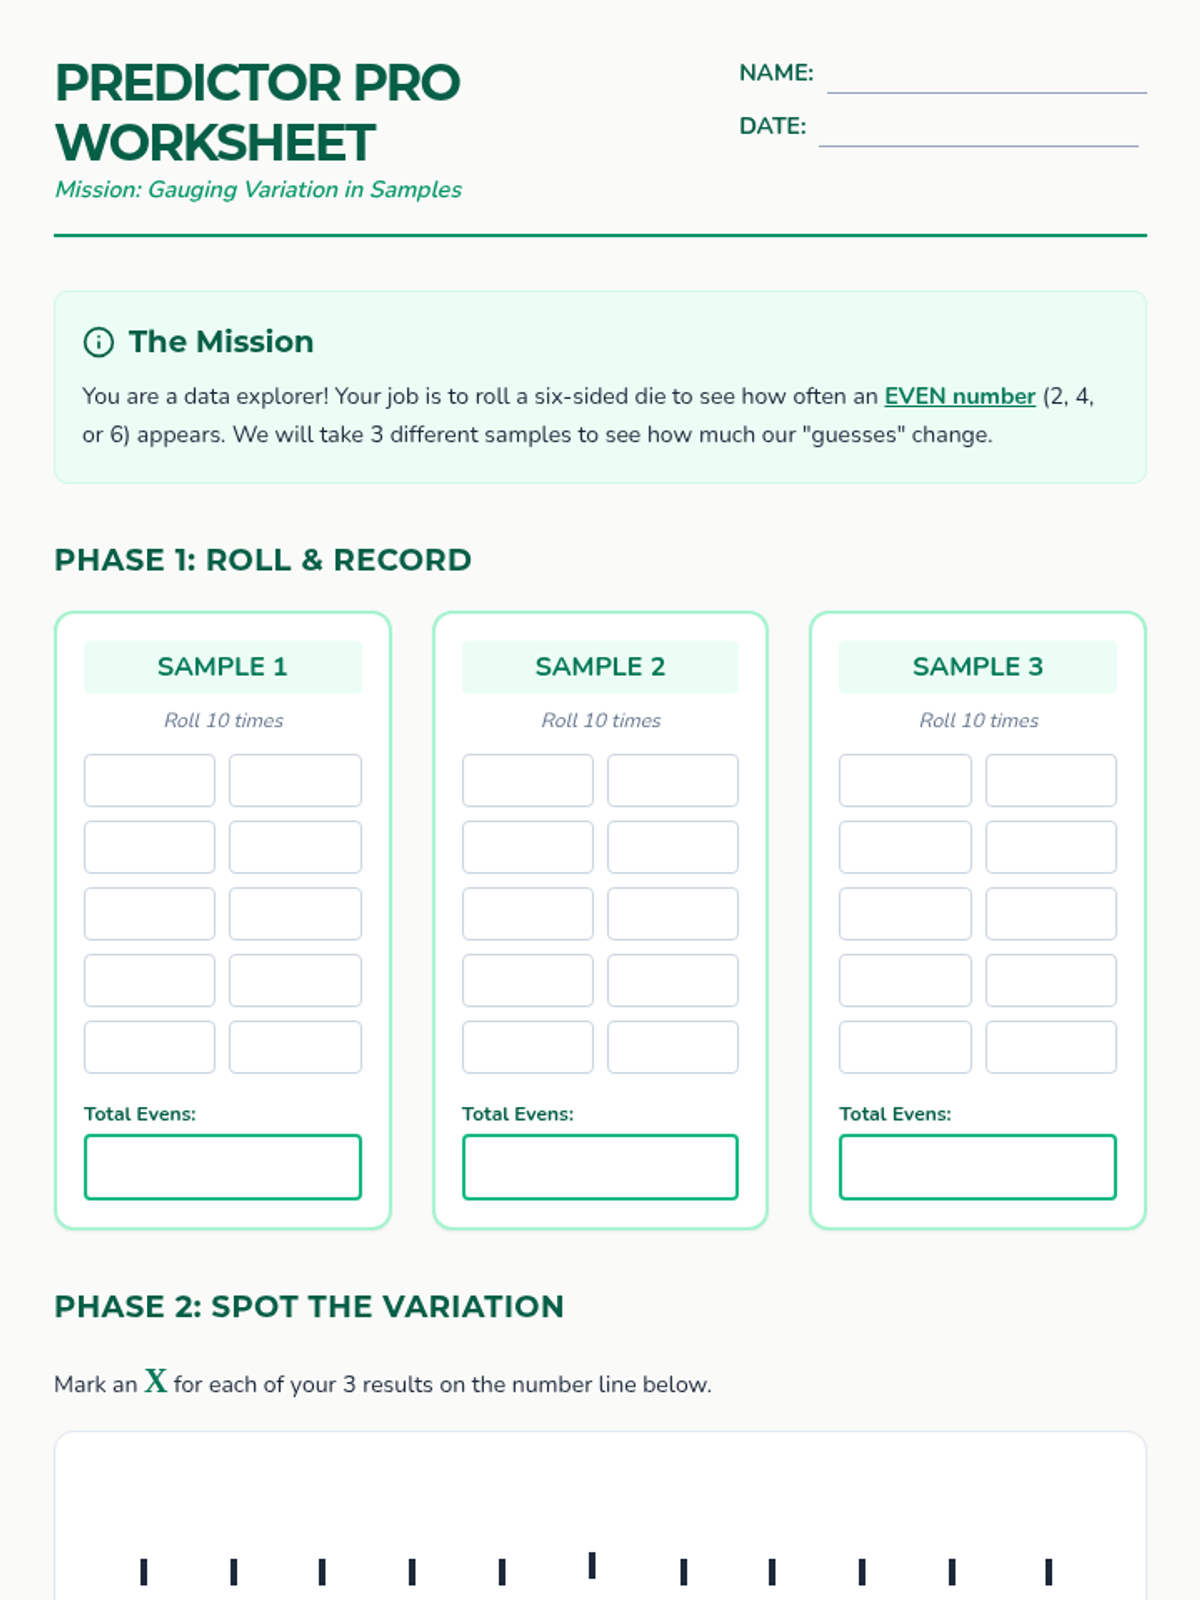
A targeted intervention lesson where students generate multiple samples using dice simulations to observe variation in estimates and make data-backed predictions about a population.