Data representation, distributions, and statistical variability using sampling and inference techniques. Integrates probability models, compound events, bivariate patterns, and linear models to guide data-driven decision making.
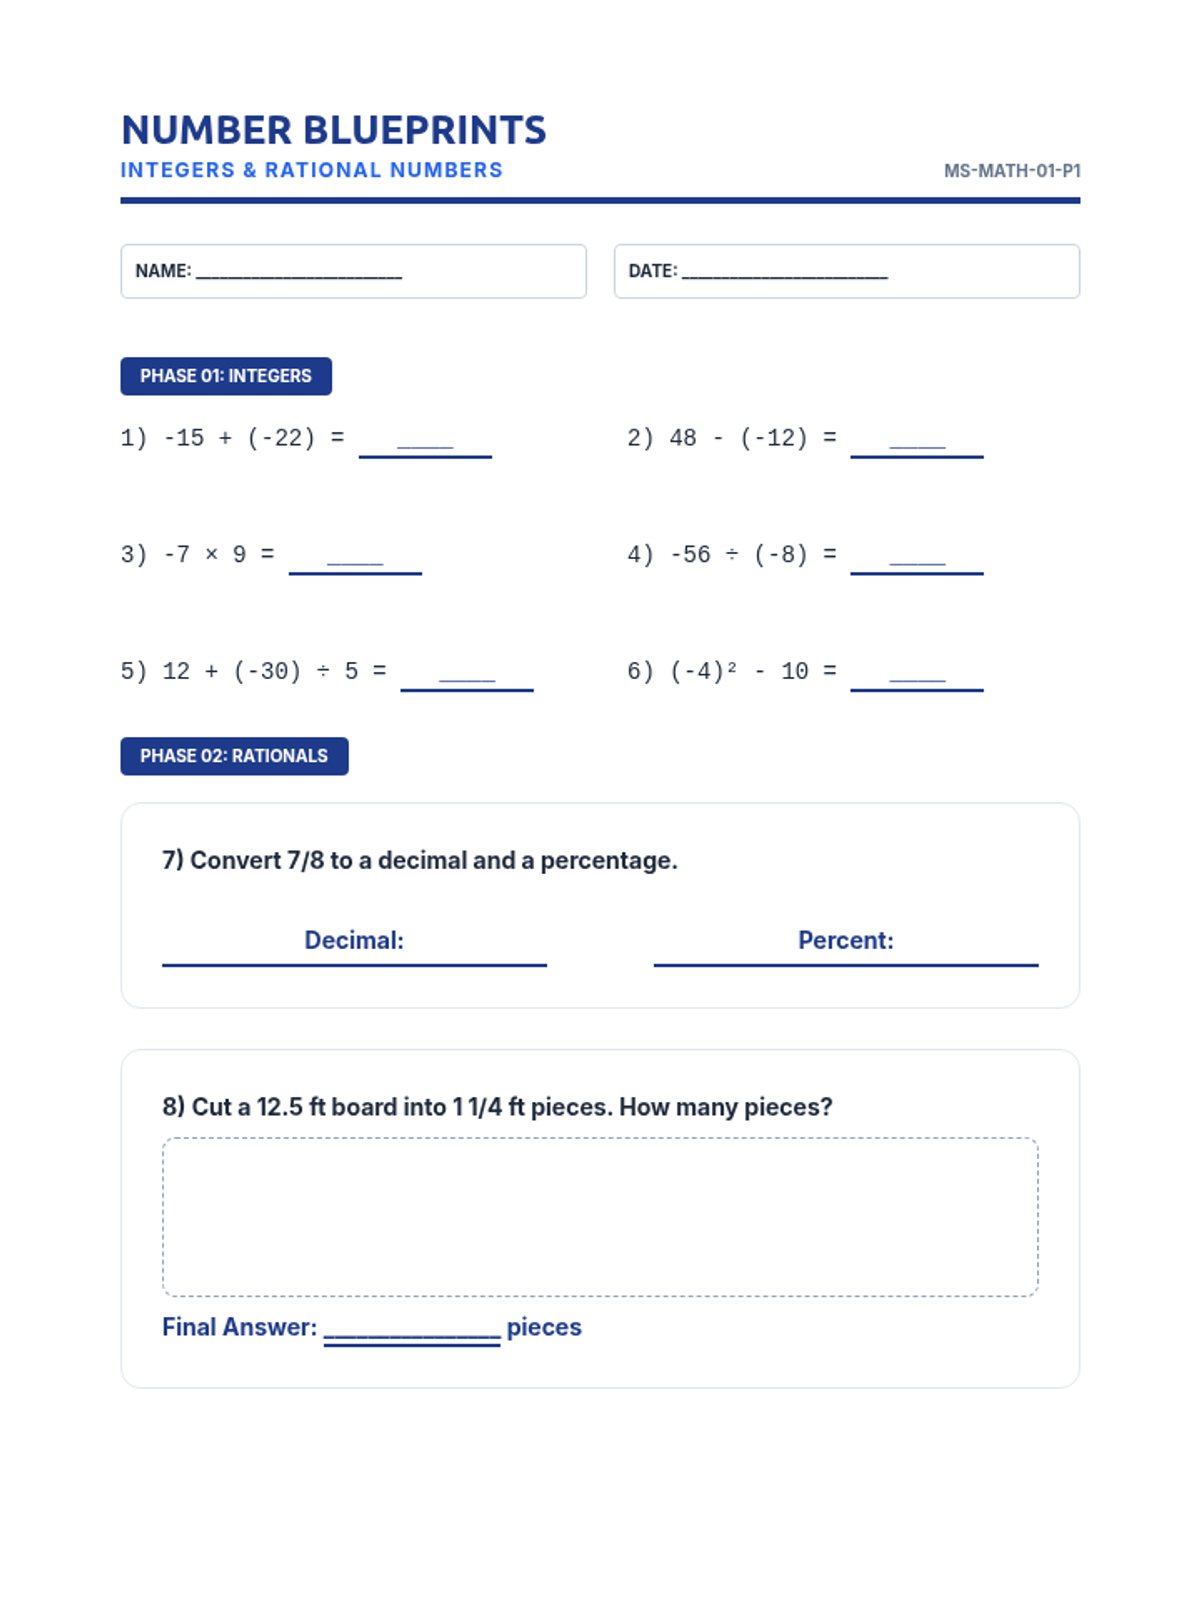
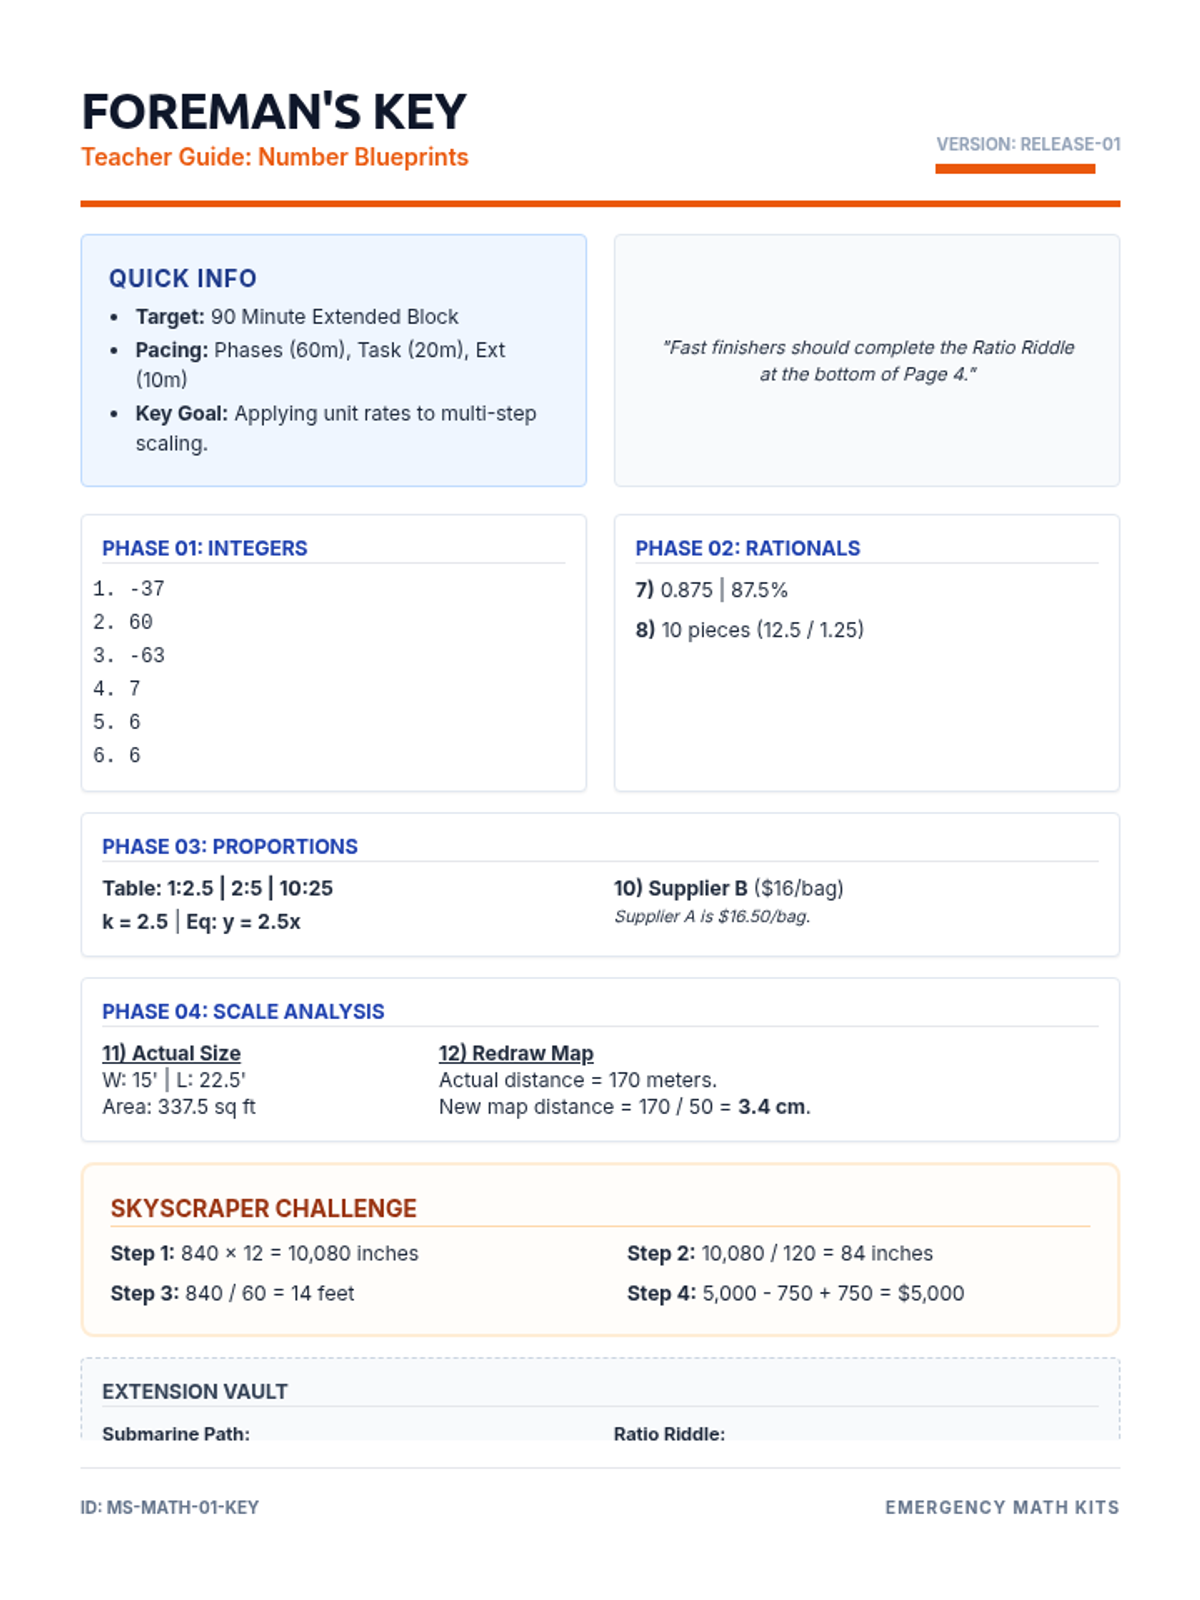
A set of two comprehensive 90-minute substitute teacher packets covering middle school math topics. Each packet includes review exercises, application problems, and extension activities designed for independent student work.
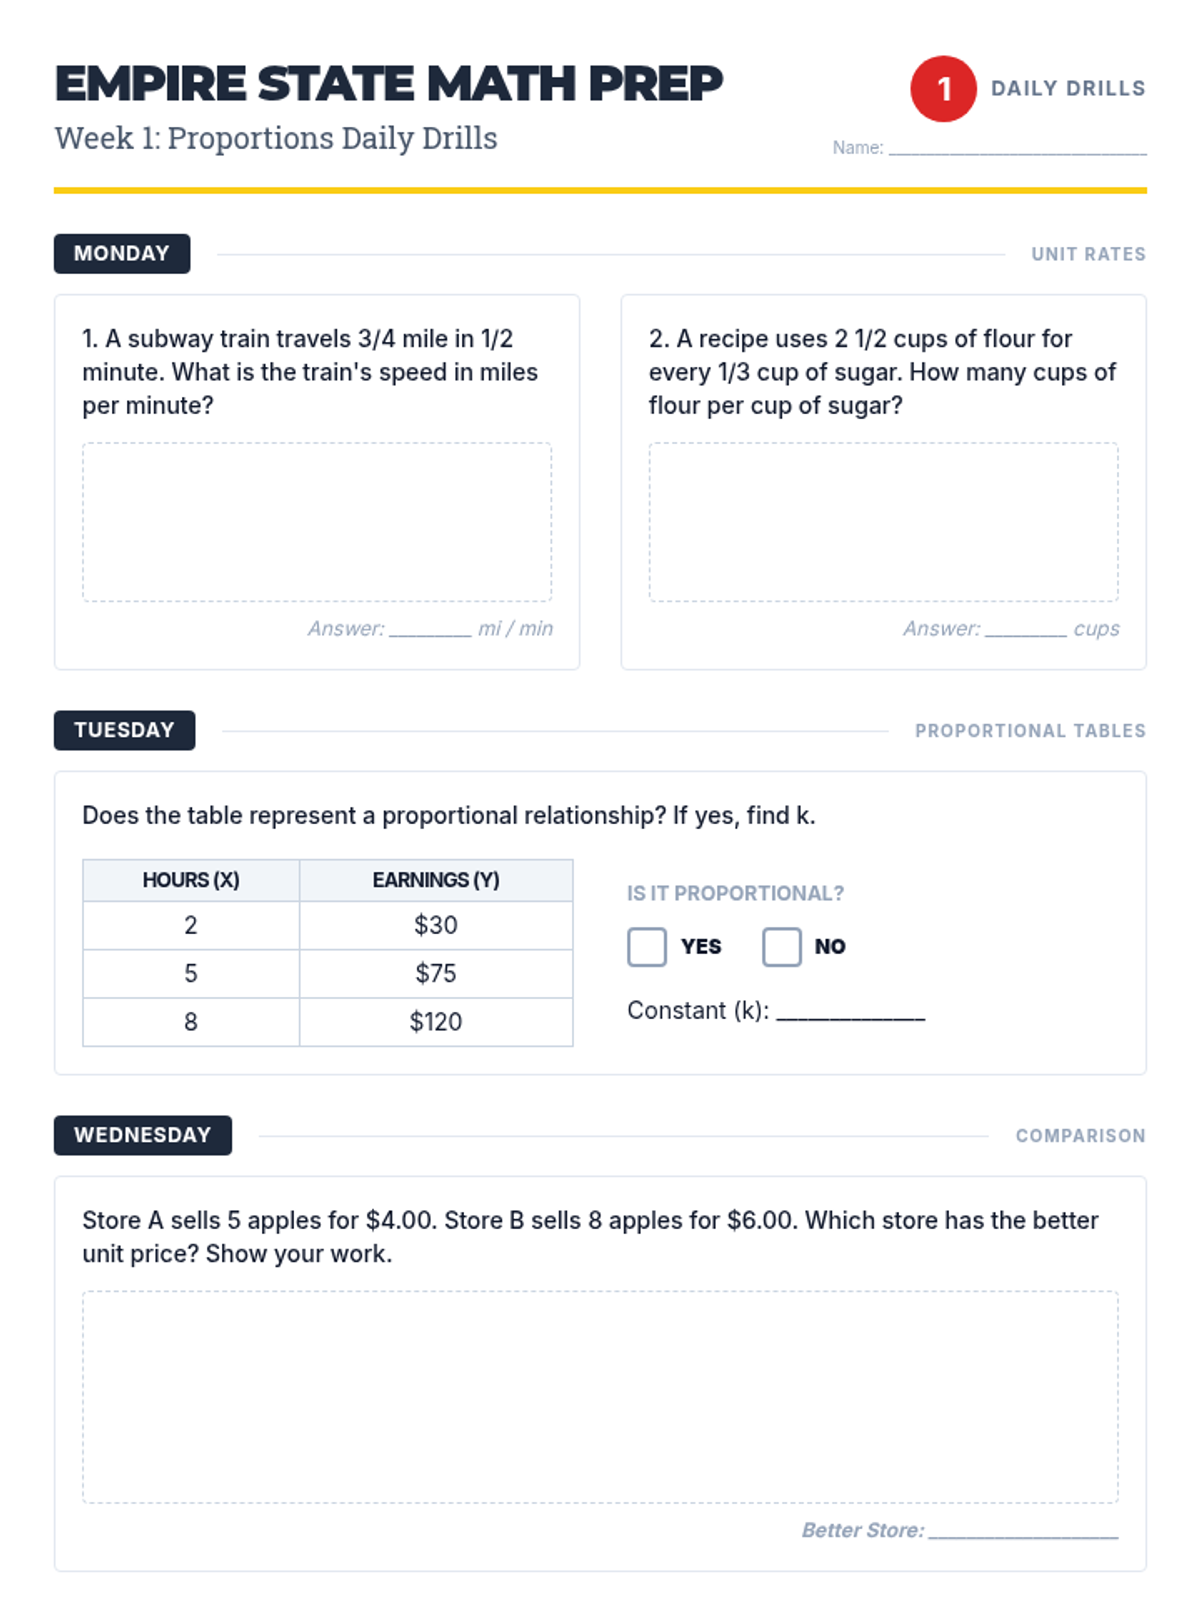
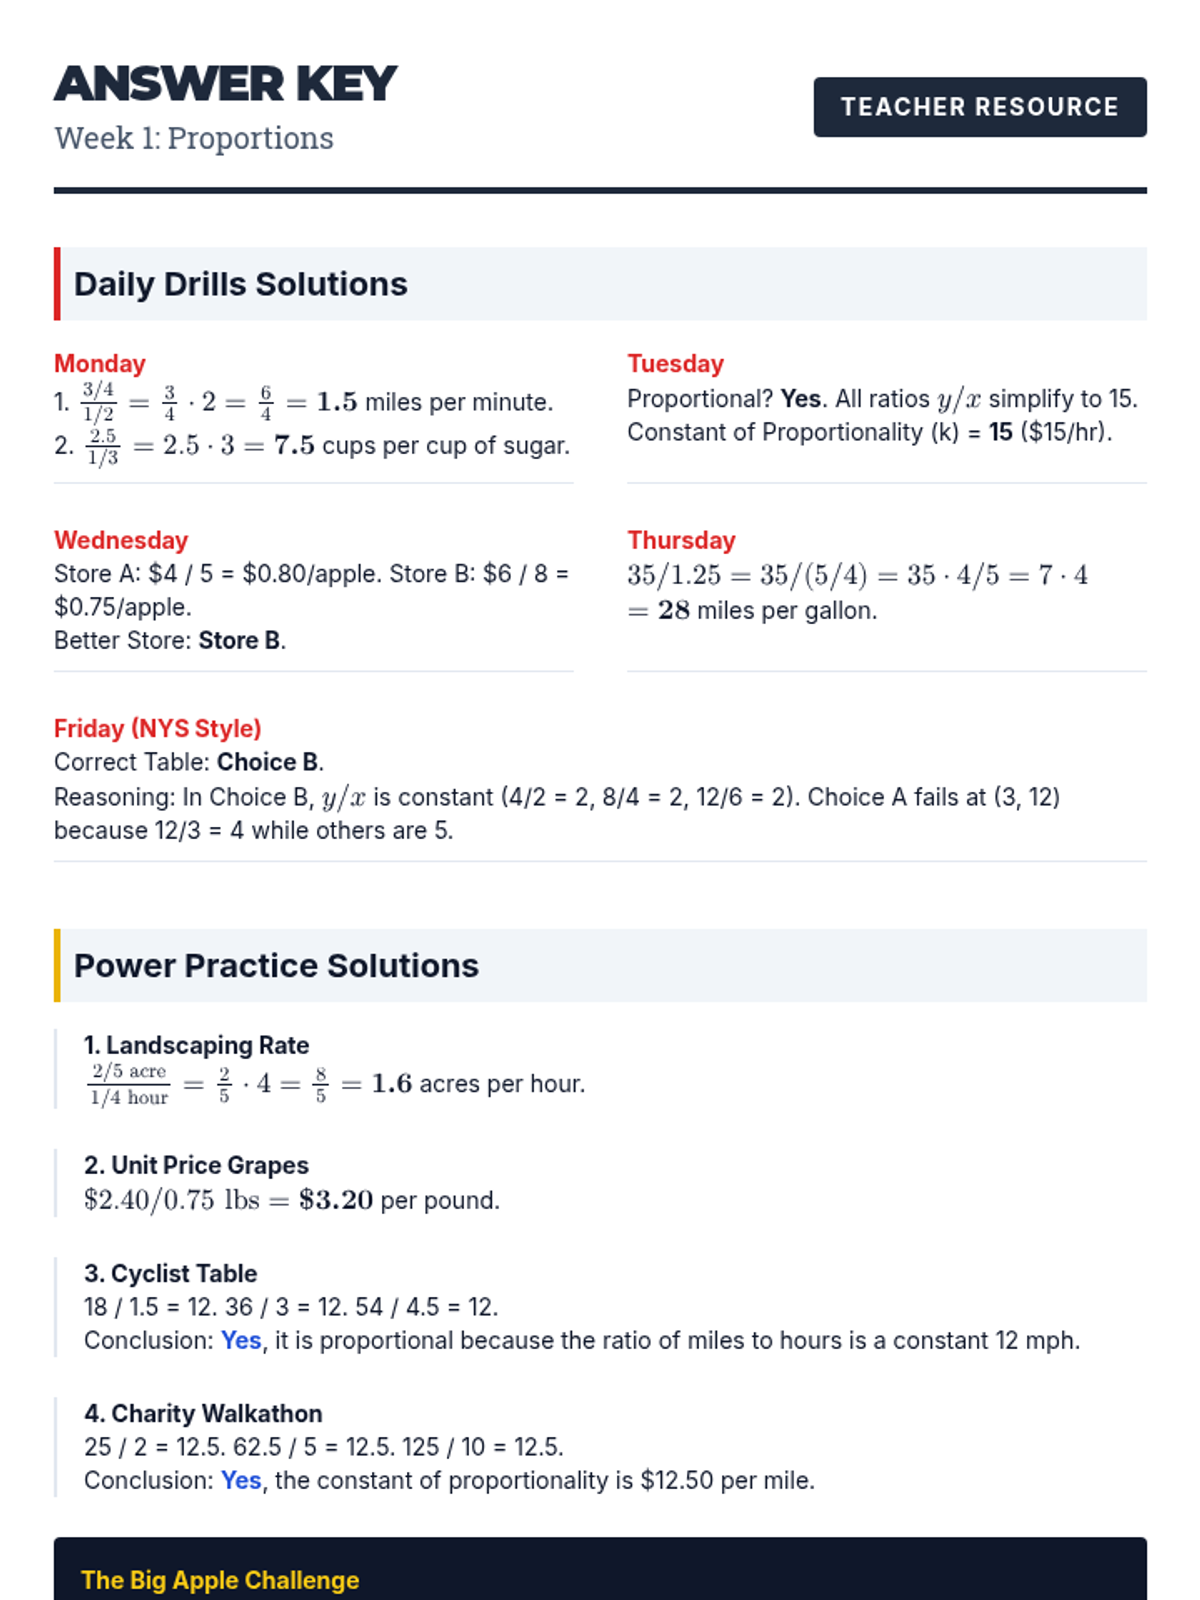
A 7-week math review sequence for 7th-grade students preparing for the NYS Math Assessment, covering proportional relationships, percents, algebraic expressions, inequalities, scale drawings, and statistics/probability.
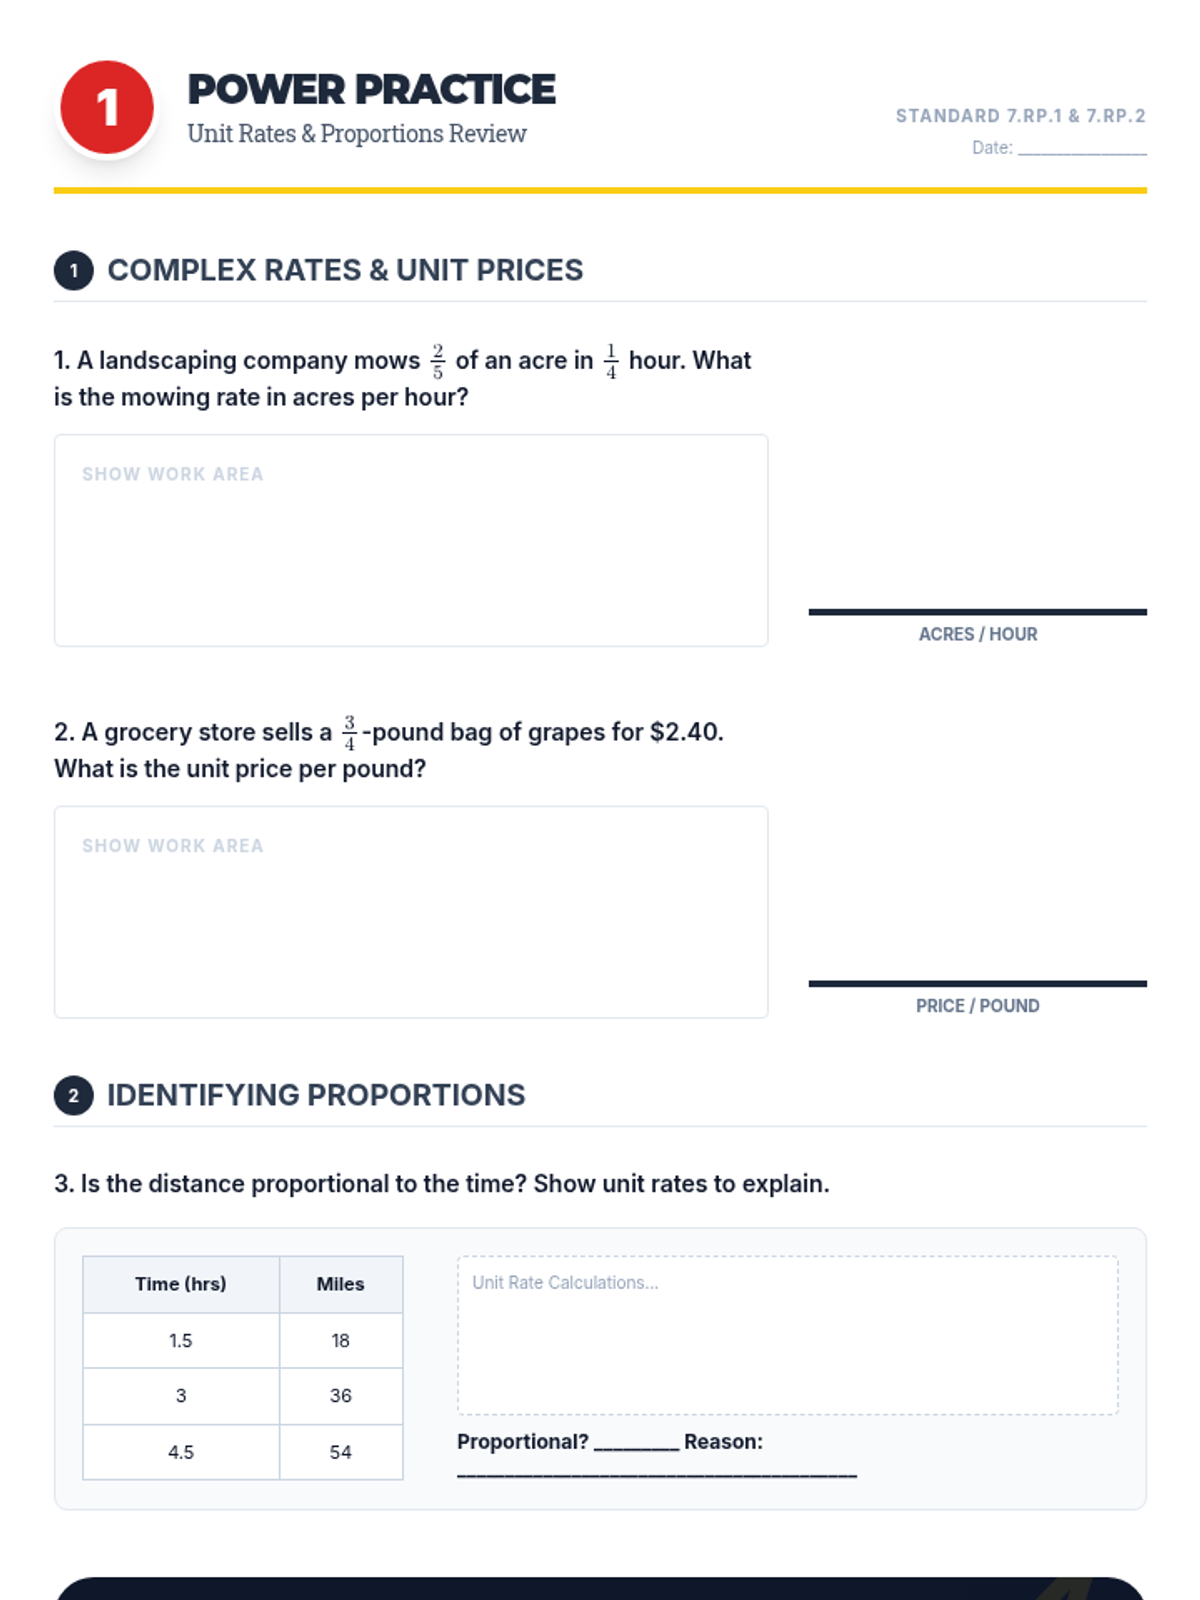
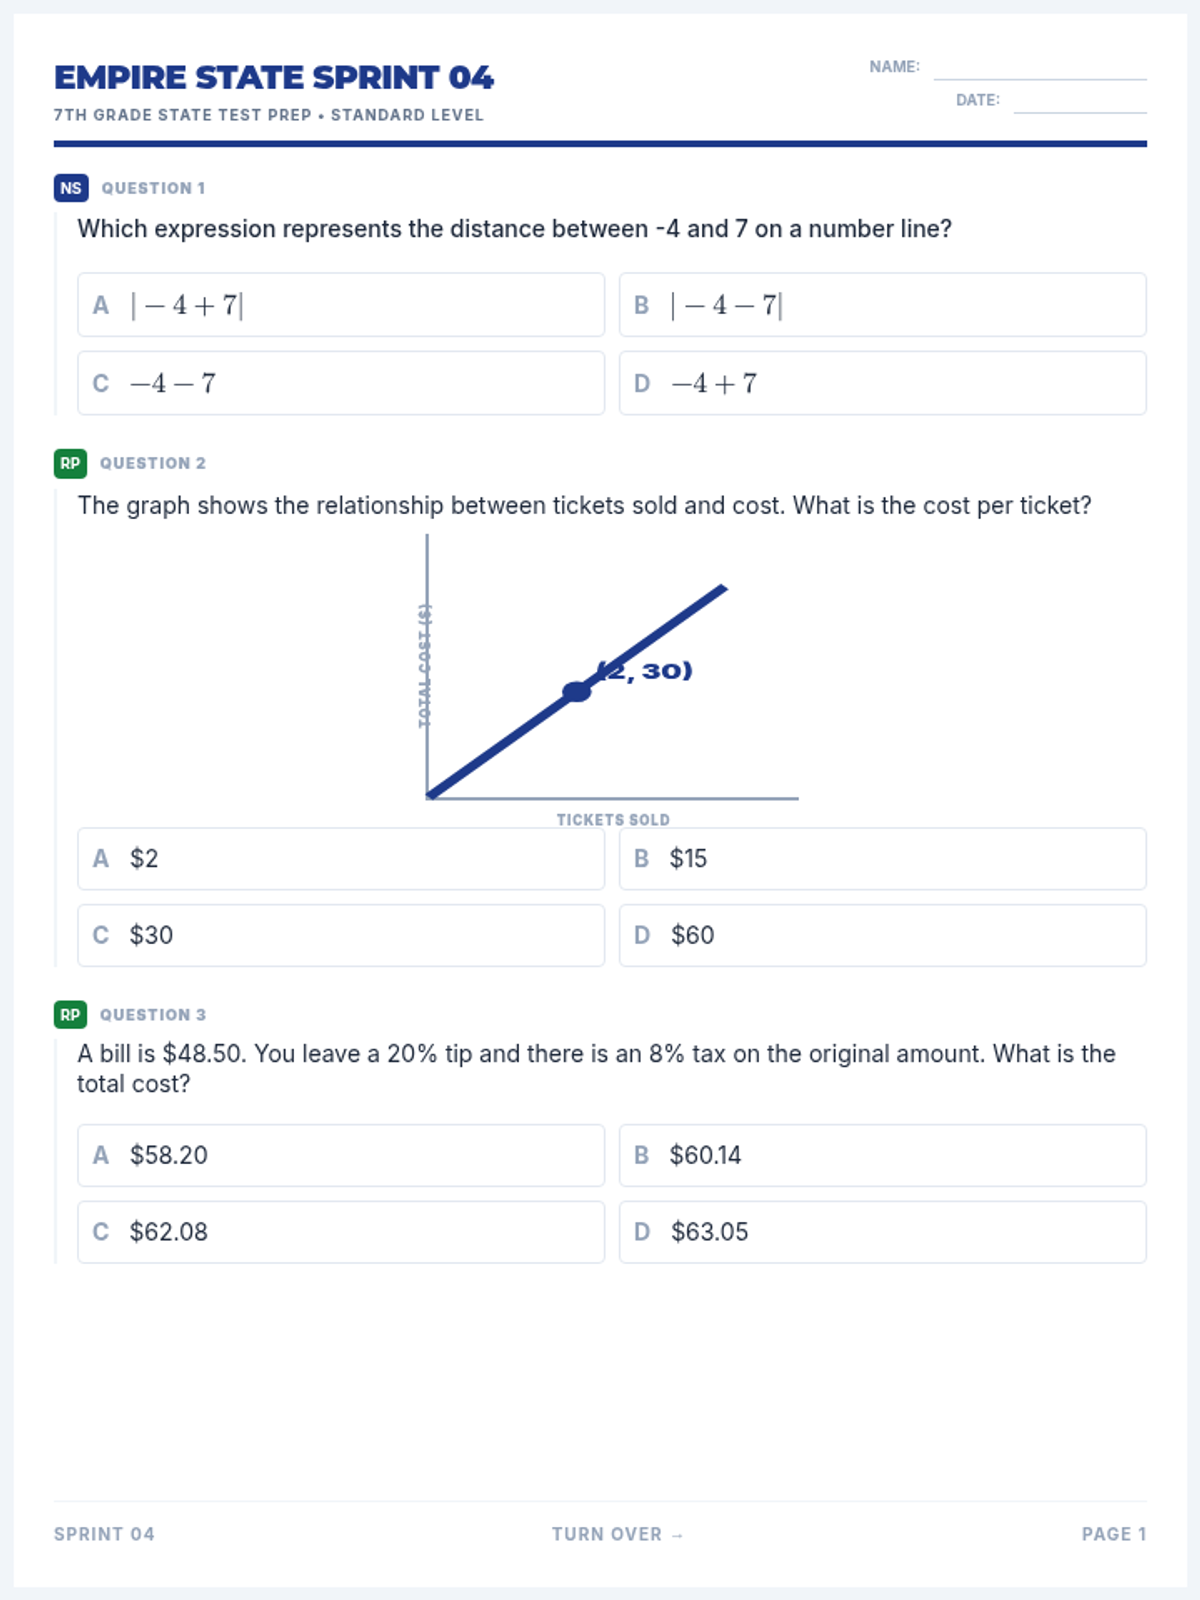
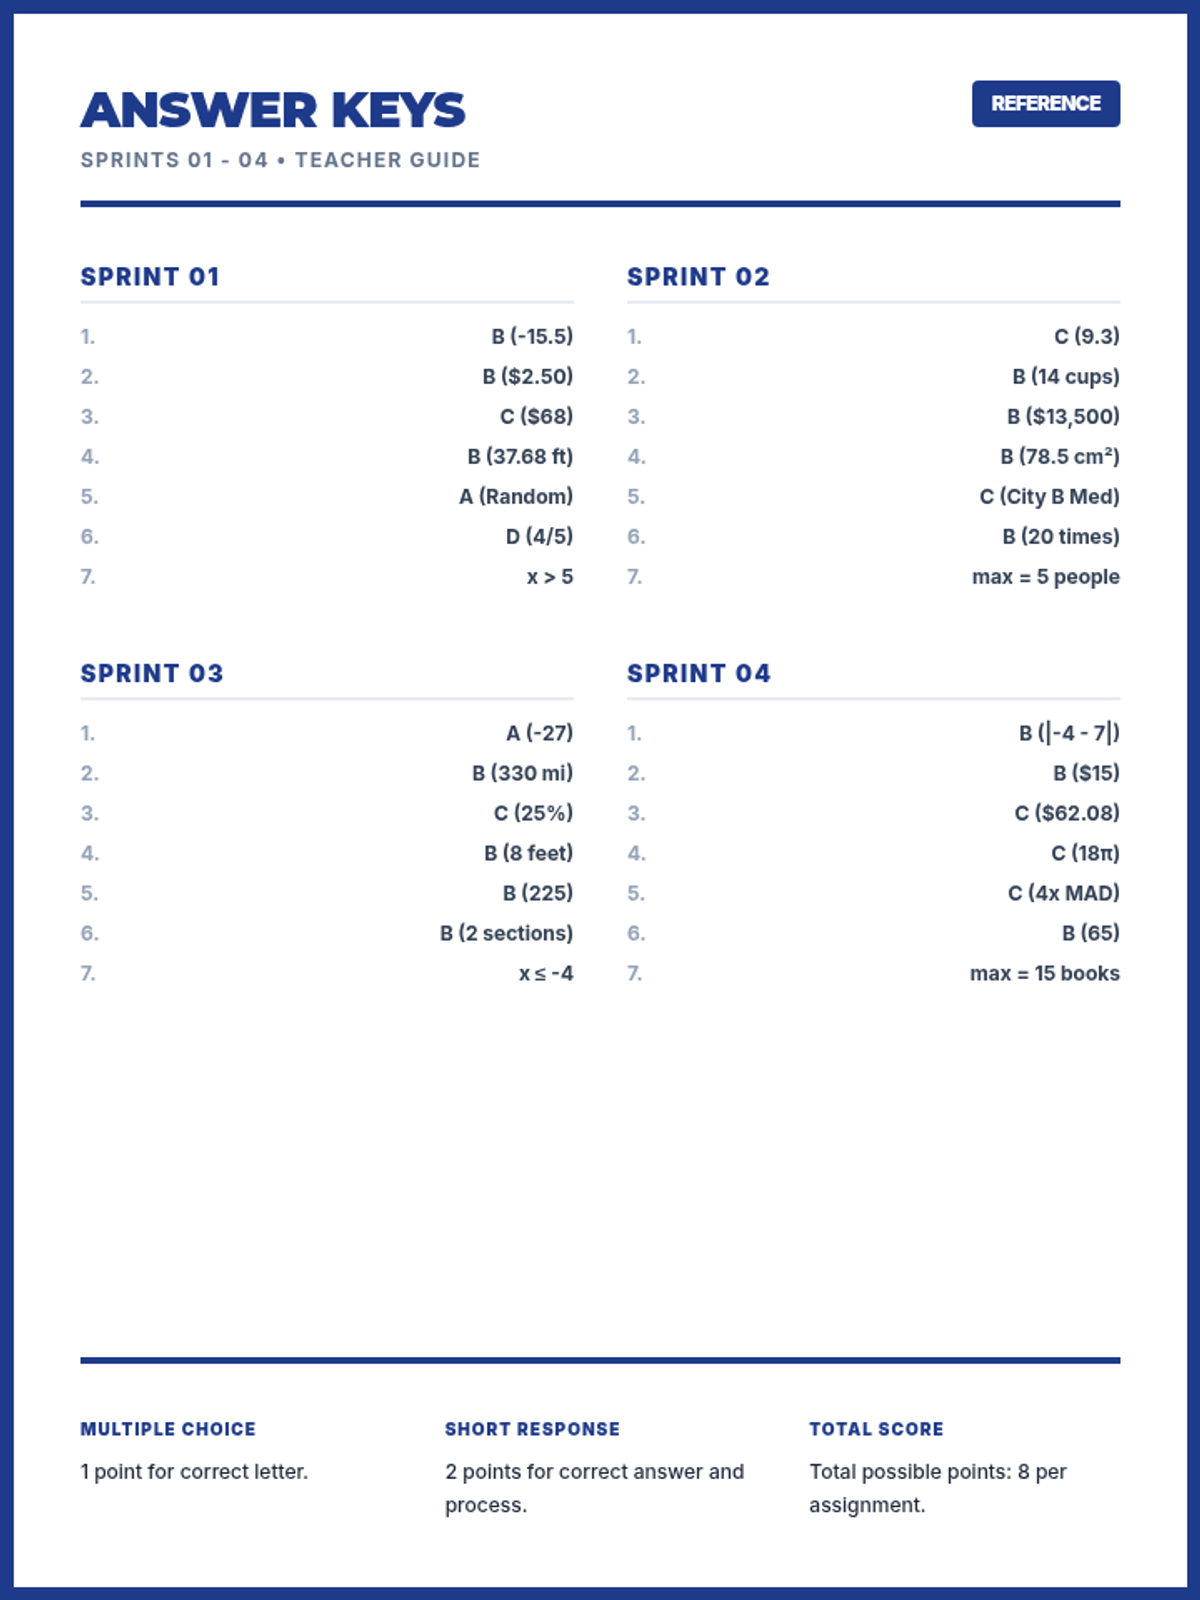
A series of four targeted homework assignments designed to prepare 7th-grade students for the New York State Mathematics Test. Each assignment covers key domains including Number Systems, Ratios and Proportions, Geometry, Statistics, and Probability in a standardized format.
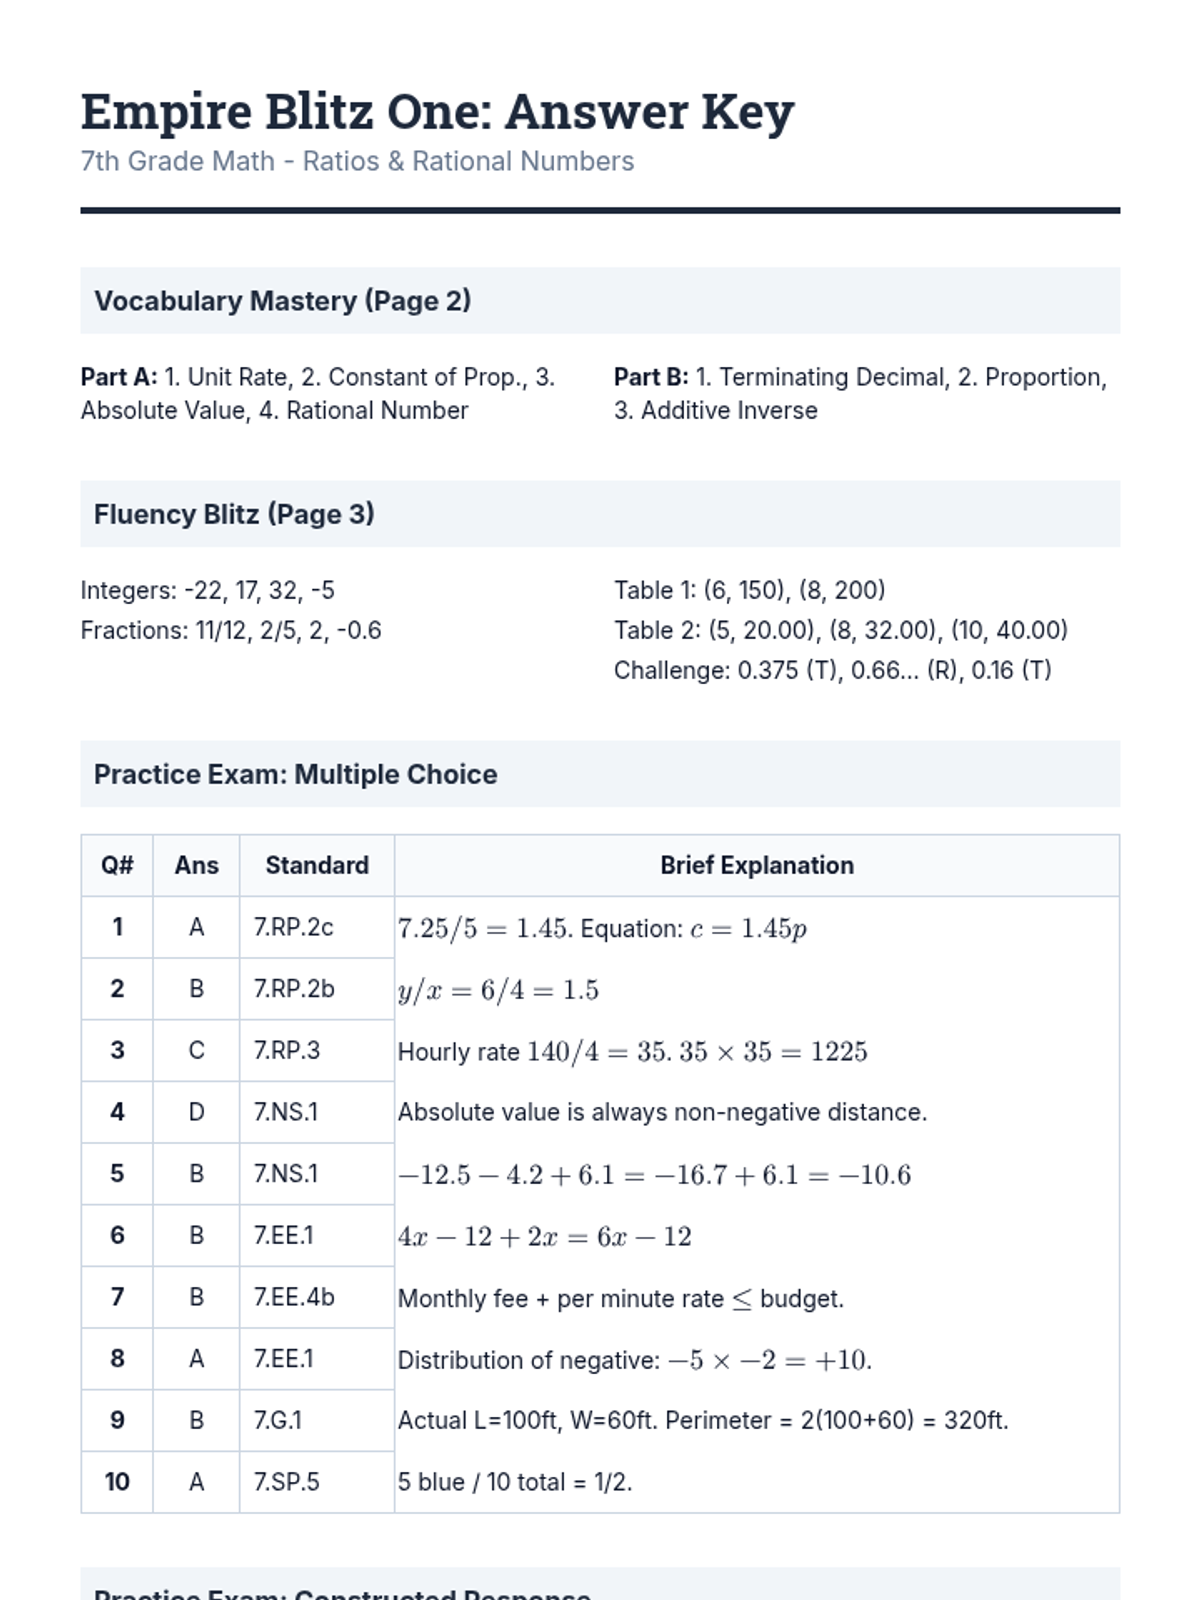
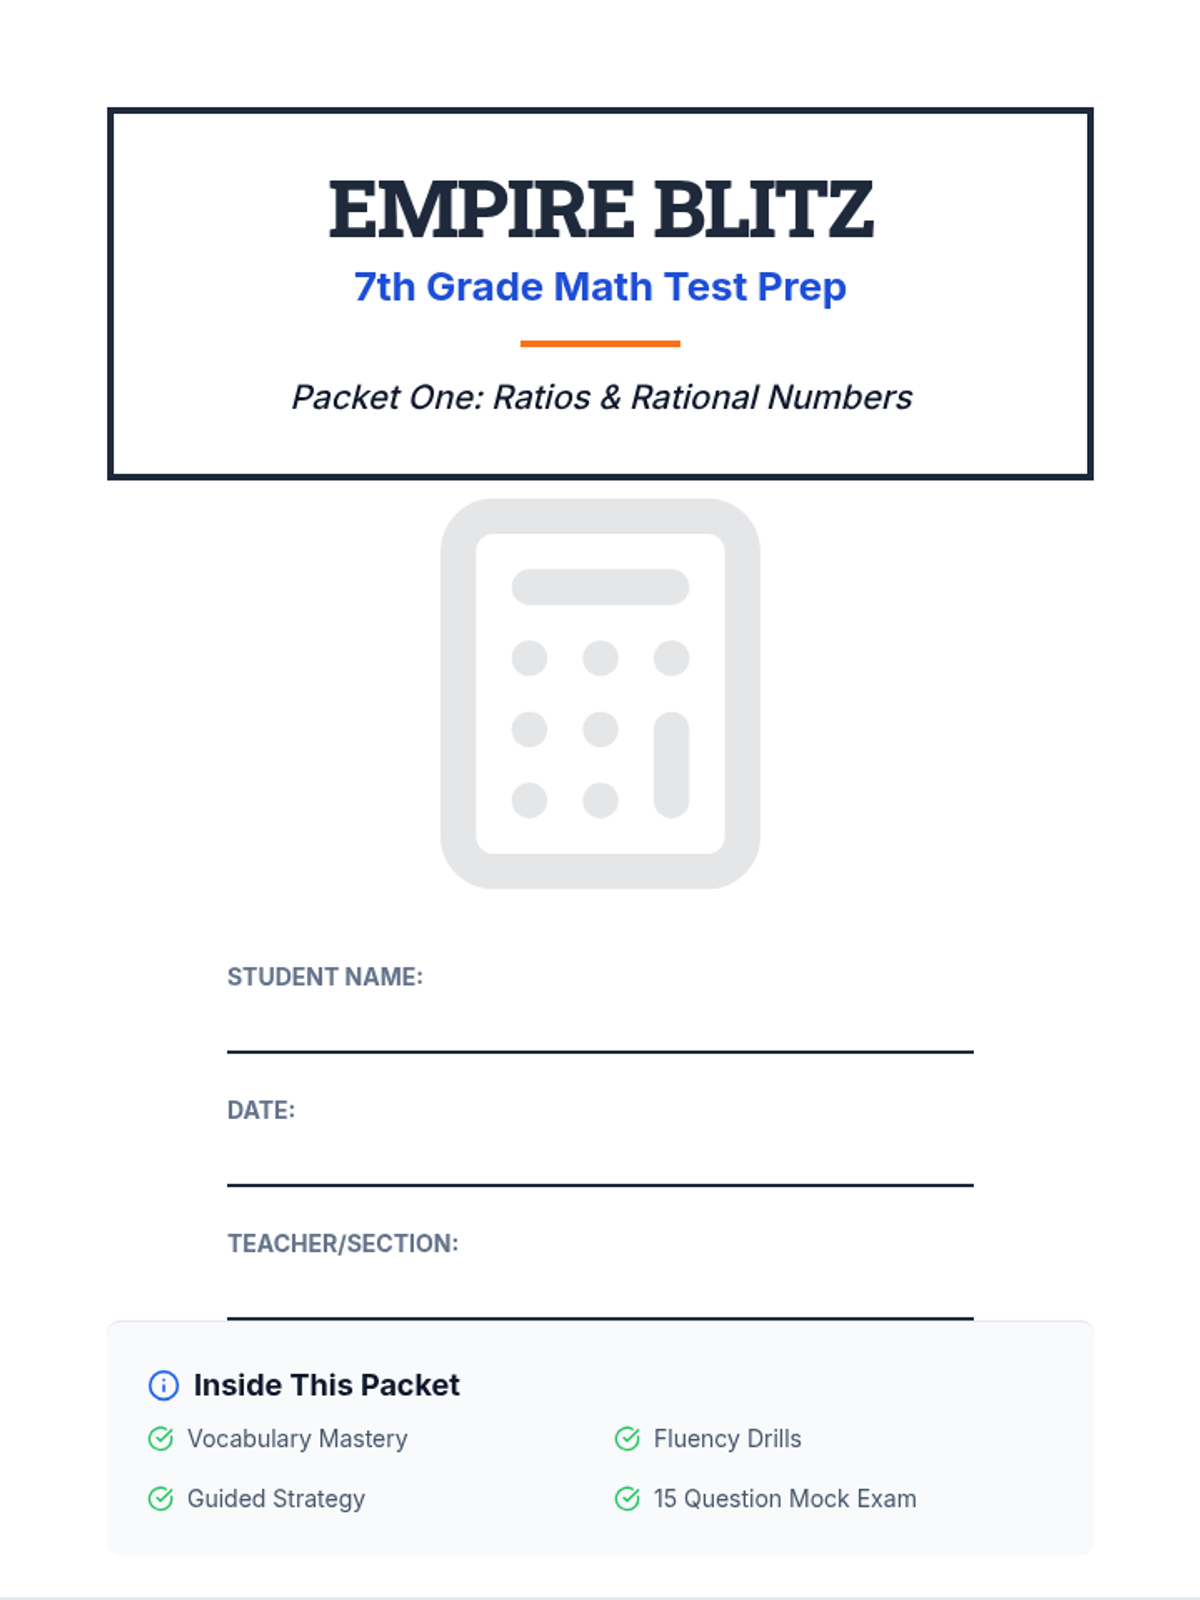
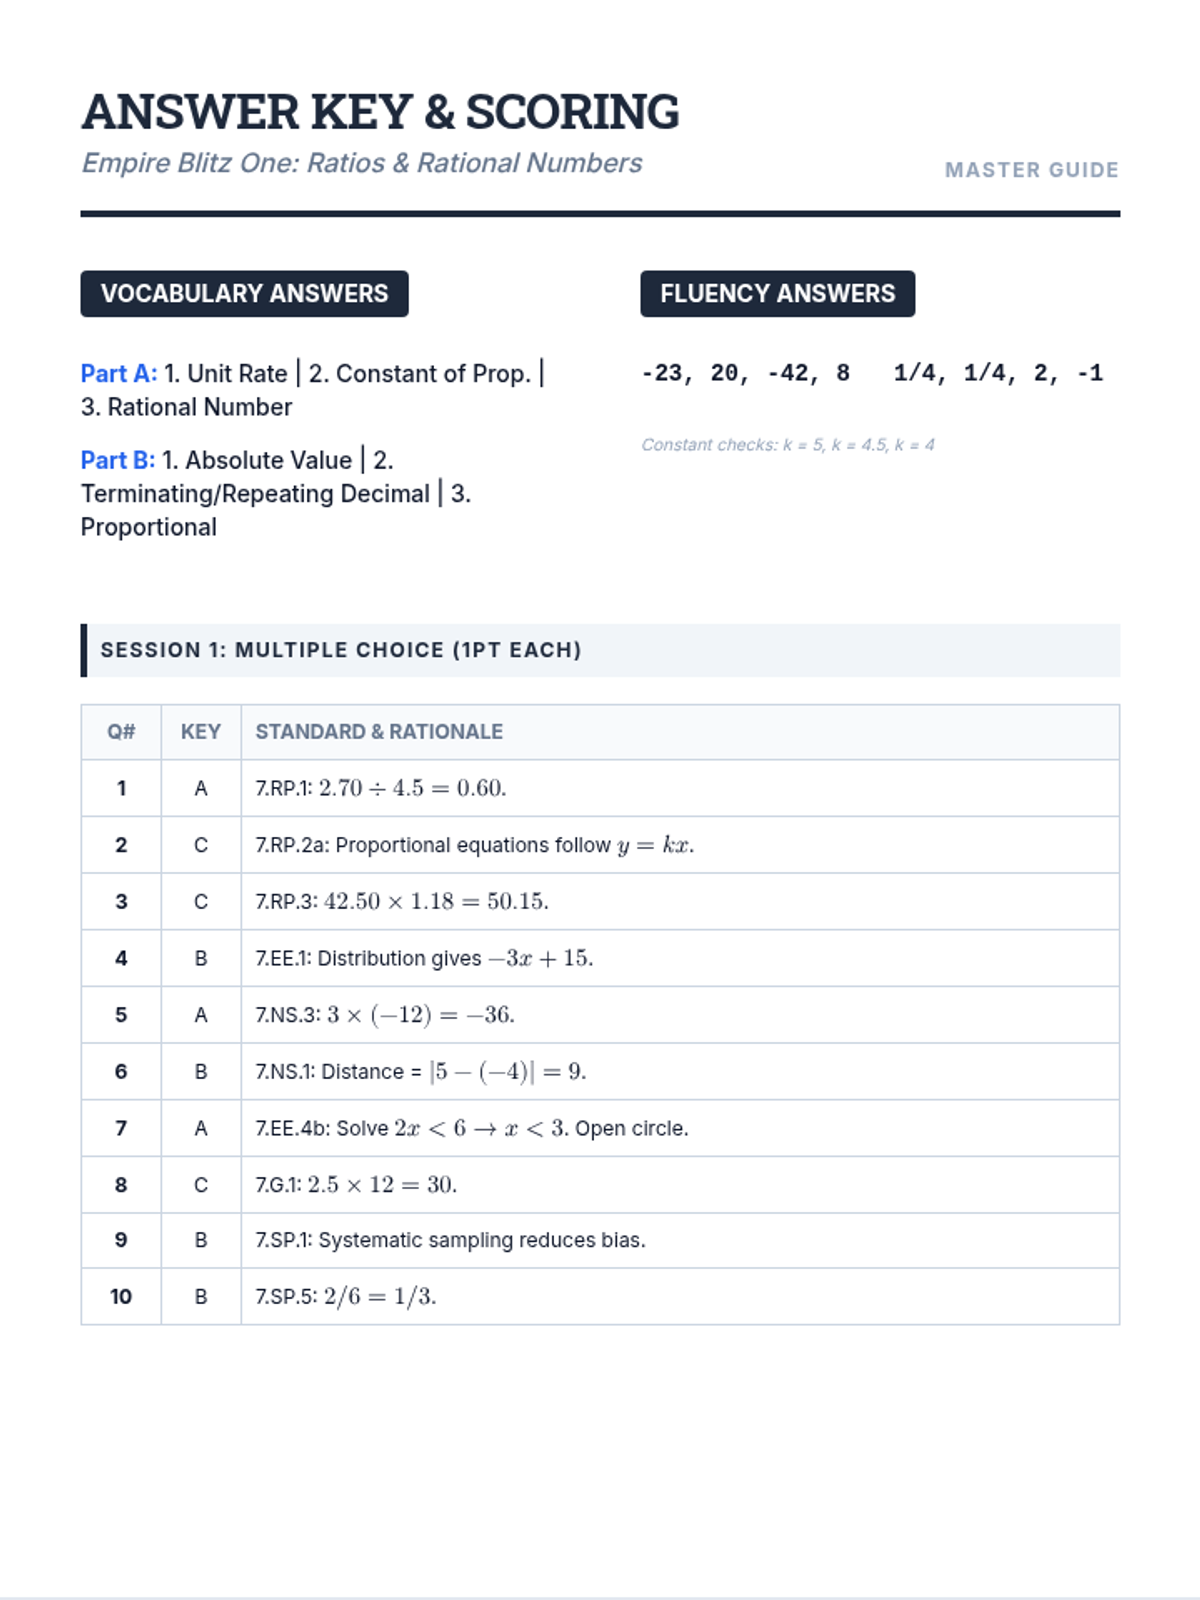
A comprehensive 3-packet New York State test prep series for 7th grade math, covering all major domains including Ratios, Number Systems, Expressions, Equations, Geometry, and Statistics. Each packet includes vocabulary, fluency, guided practice, and a 15-question mock exam.
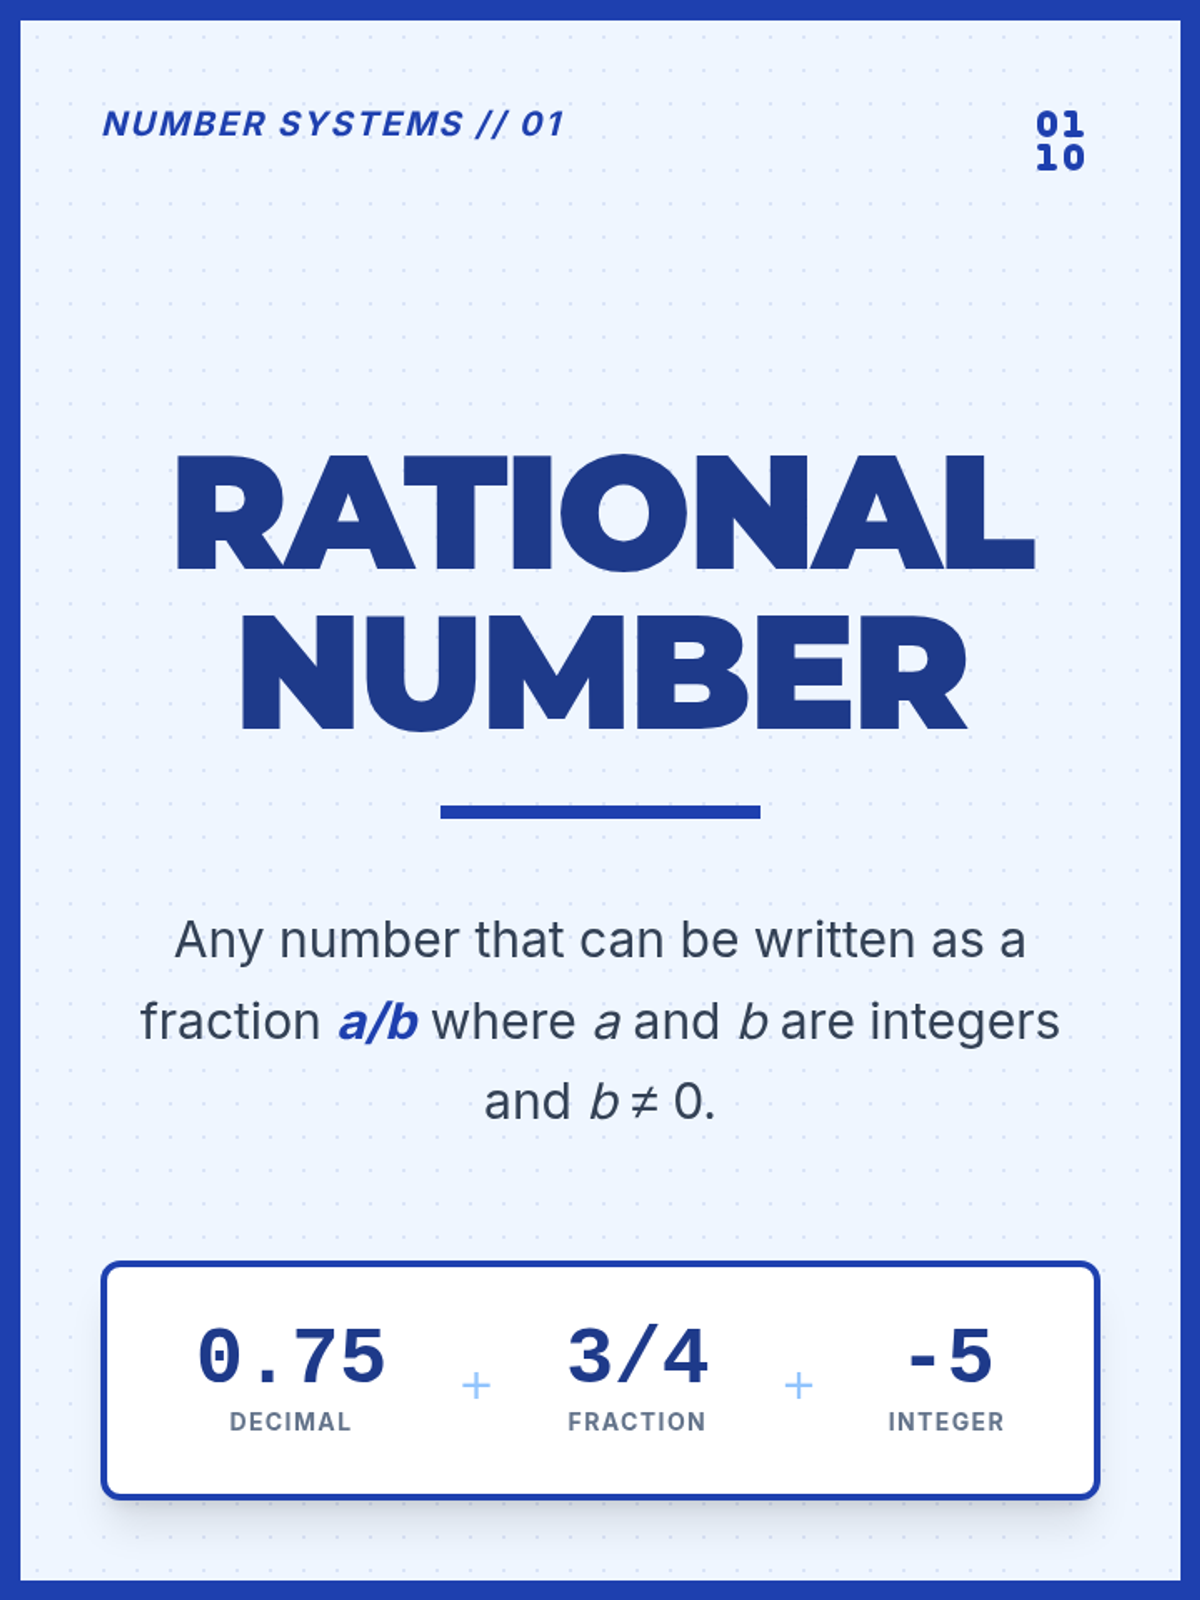
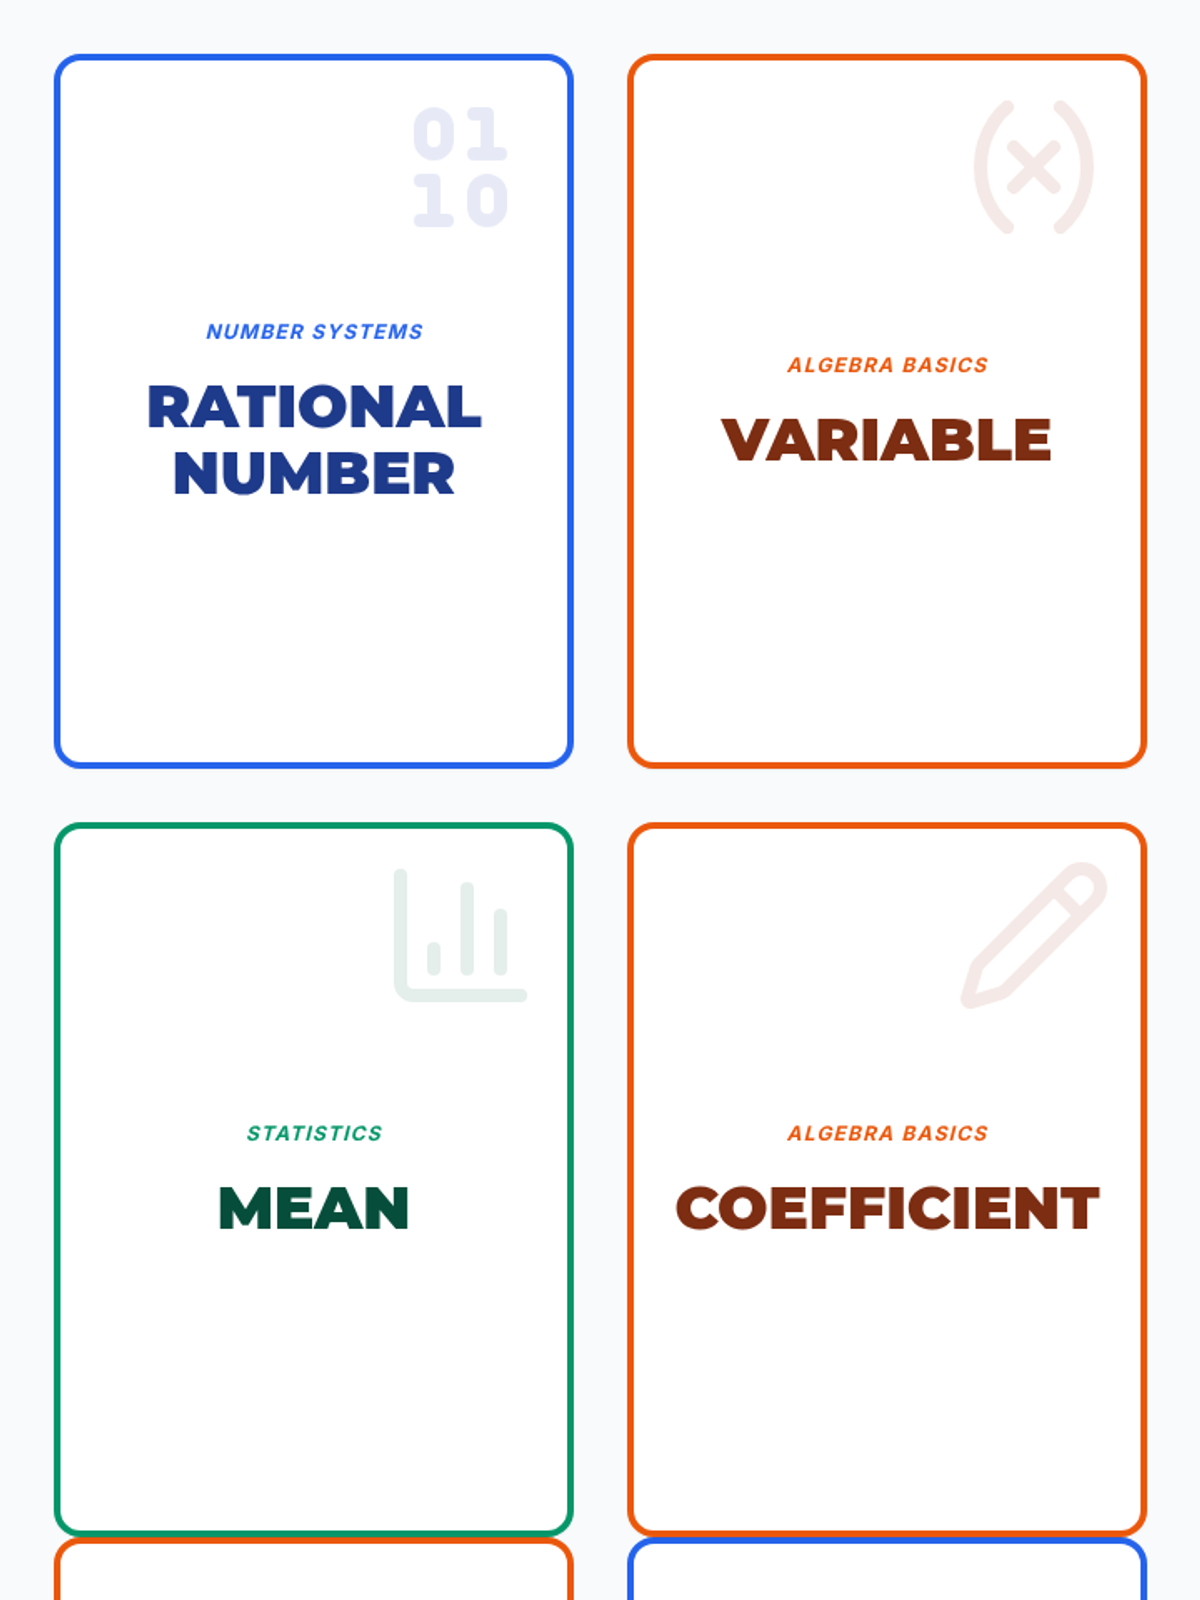
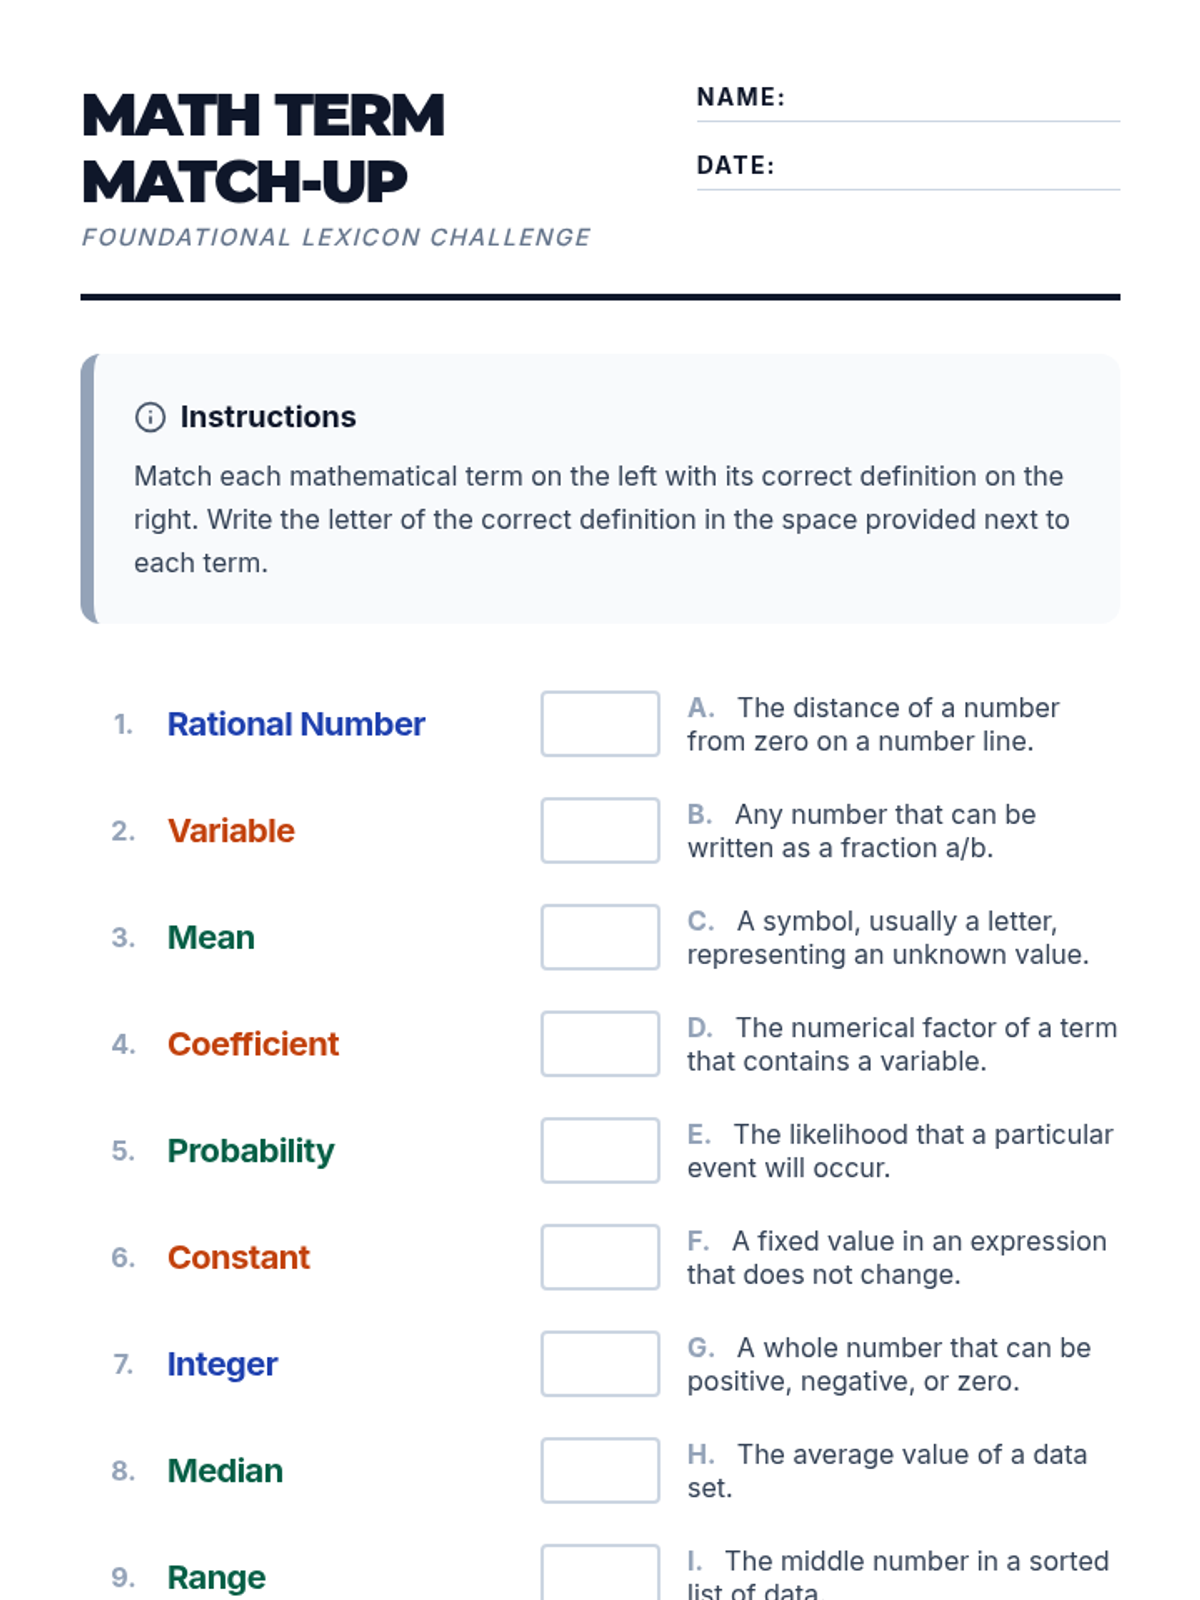
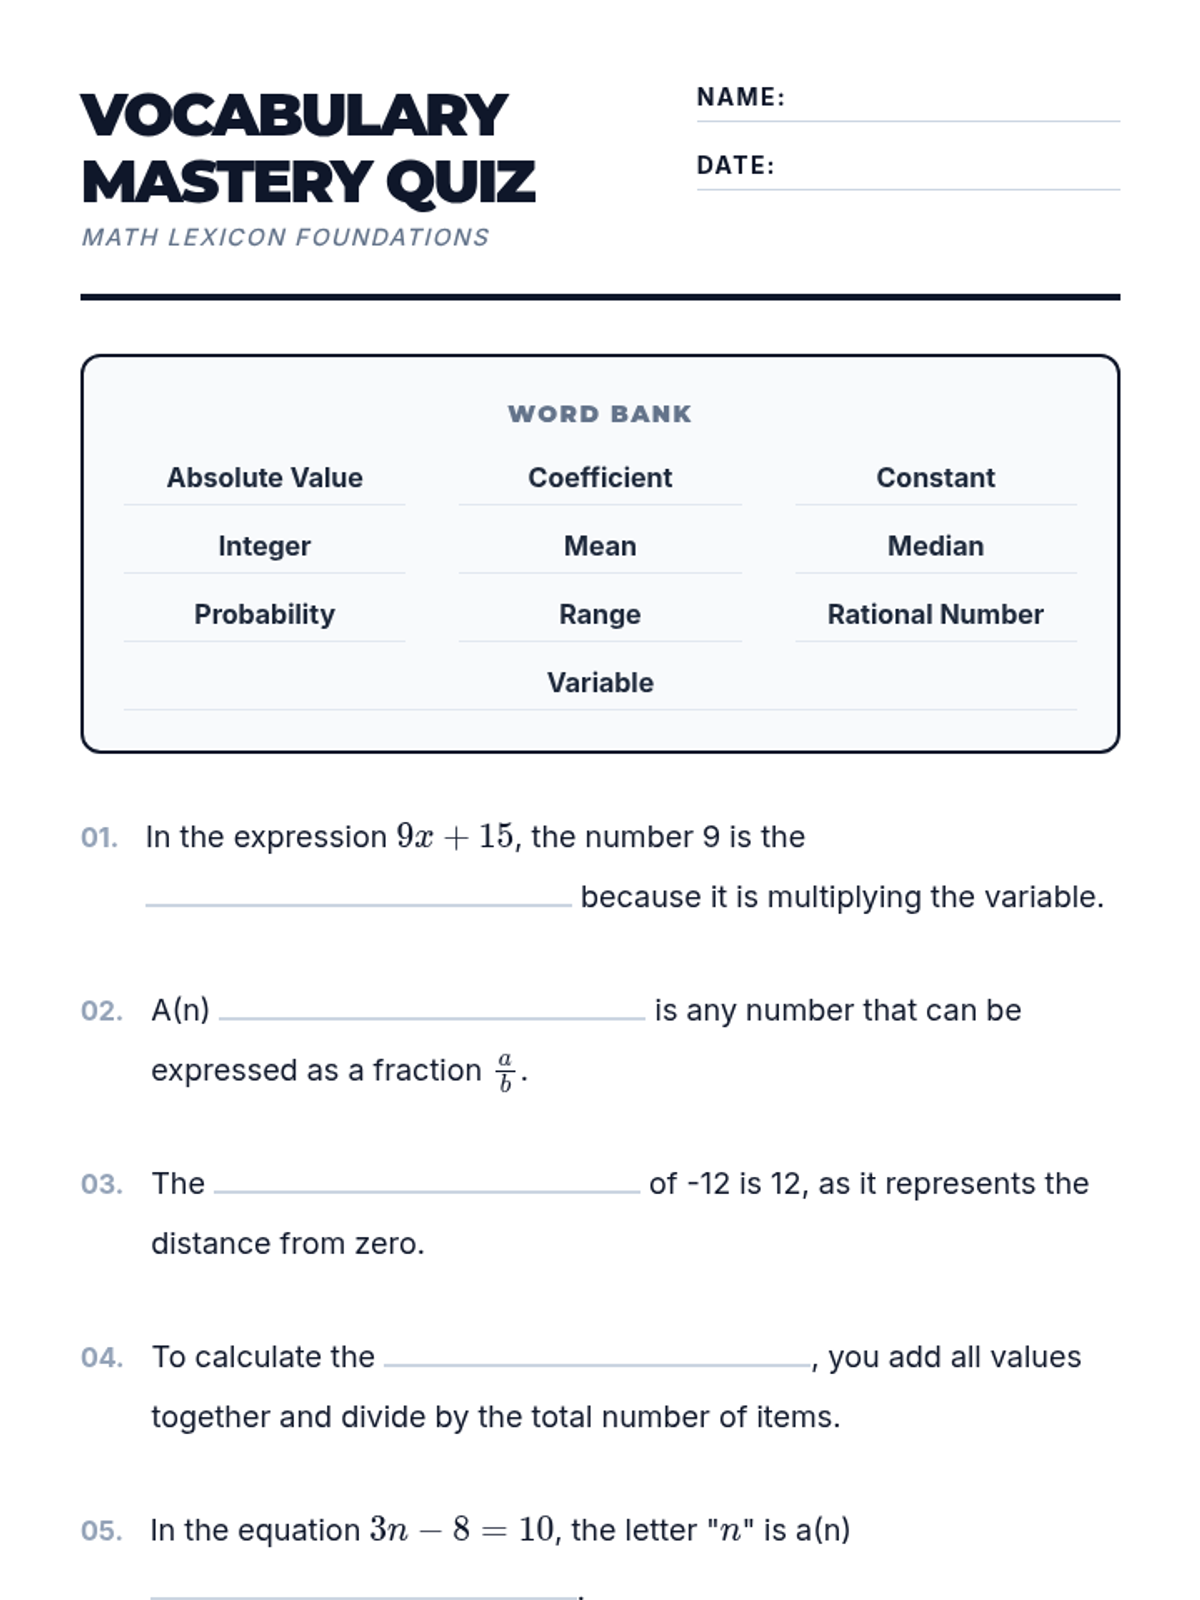
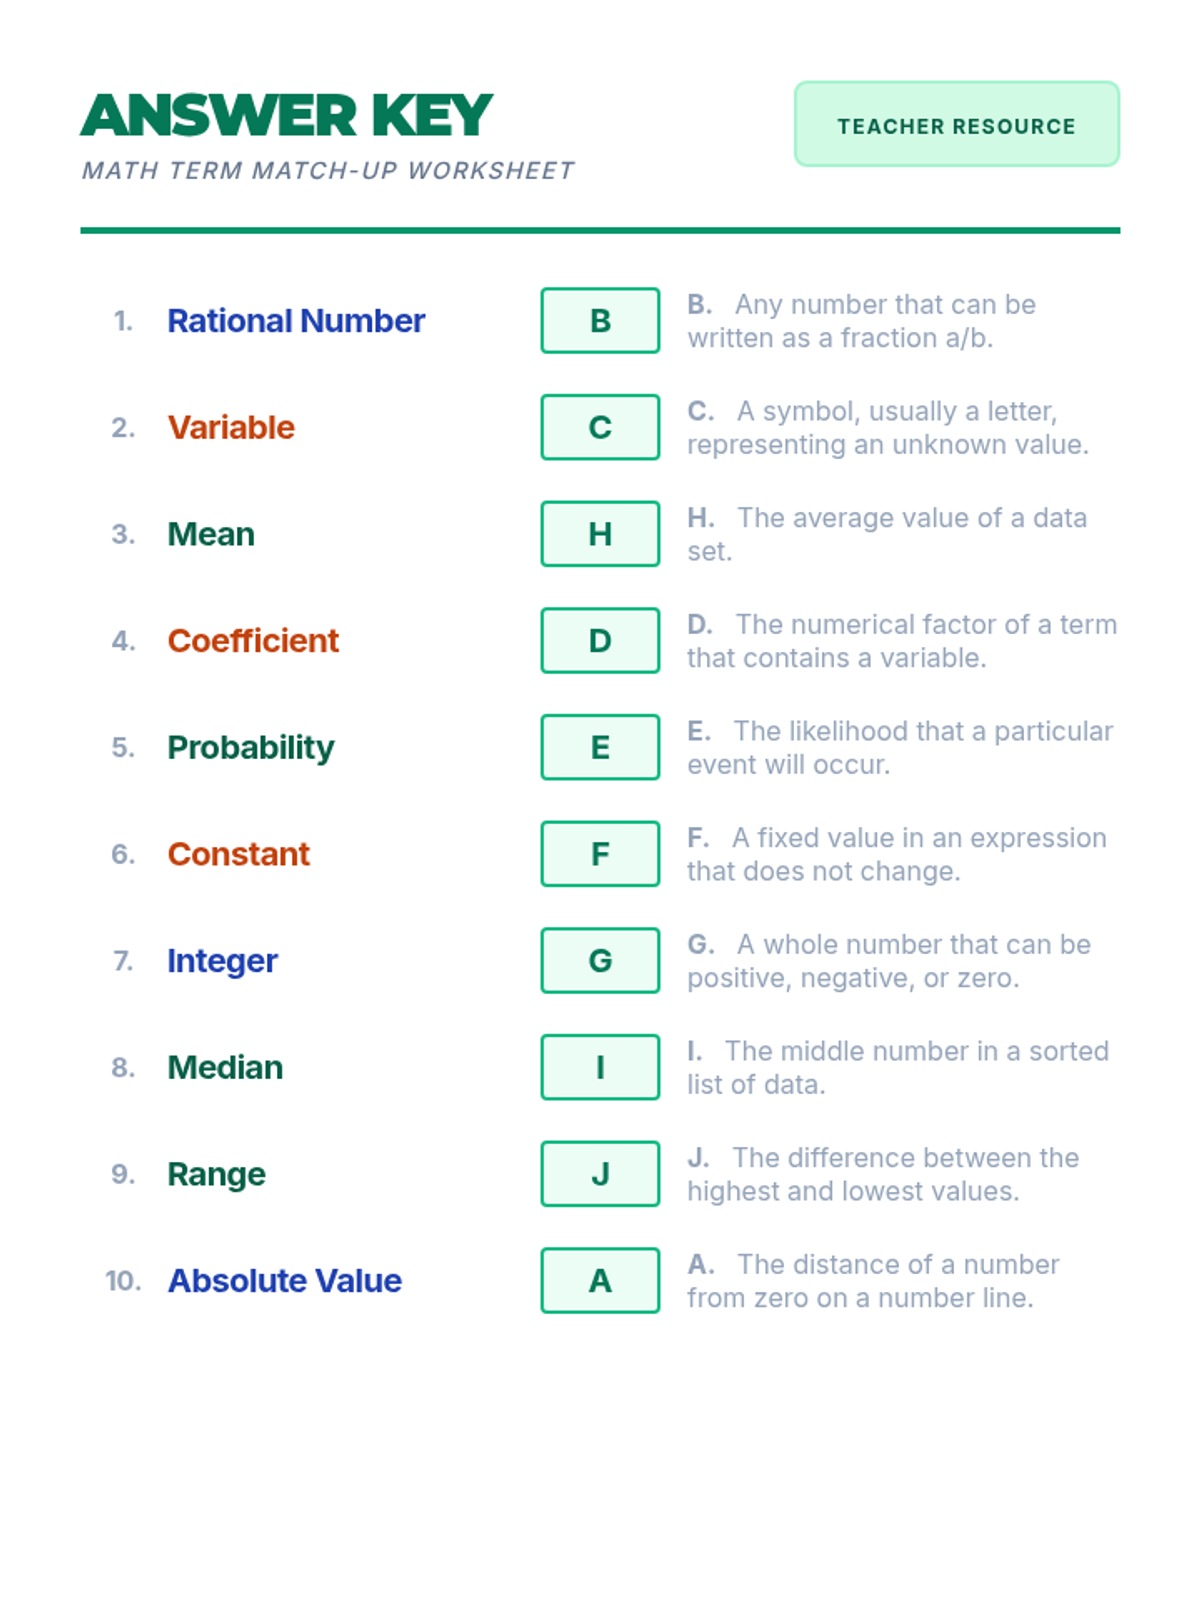
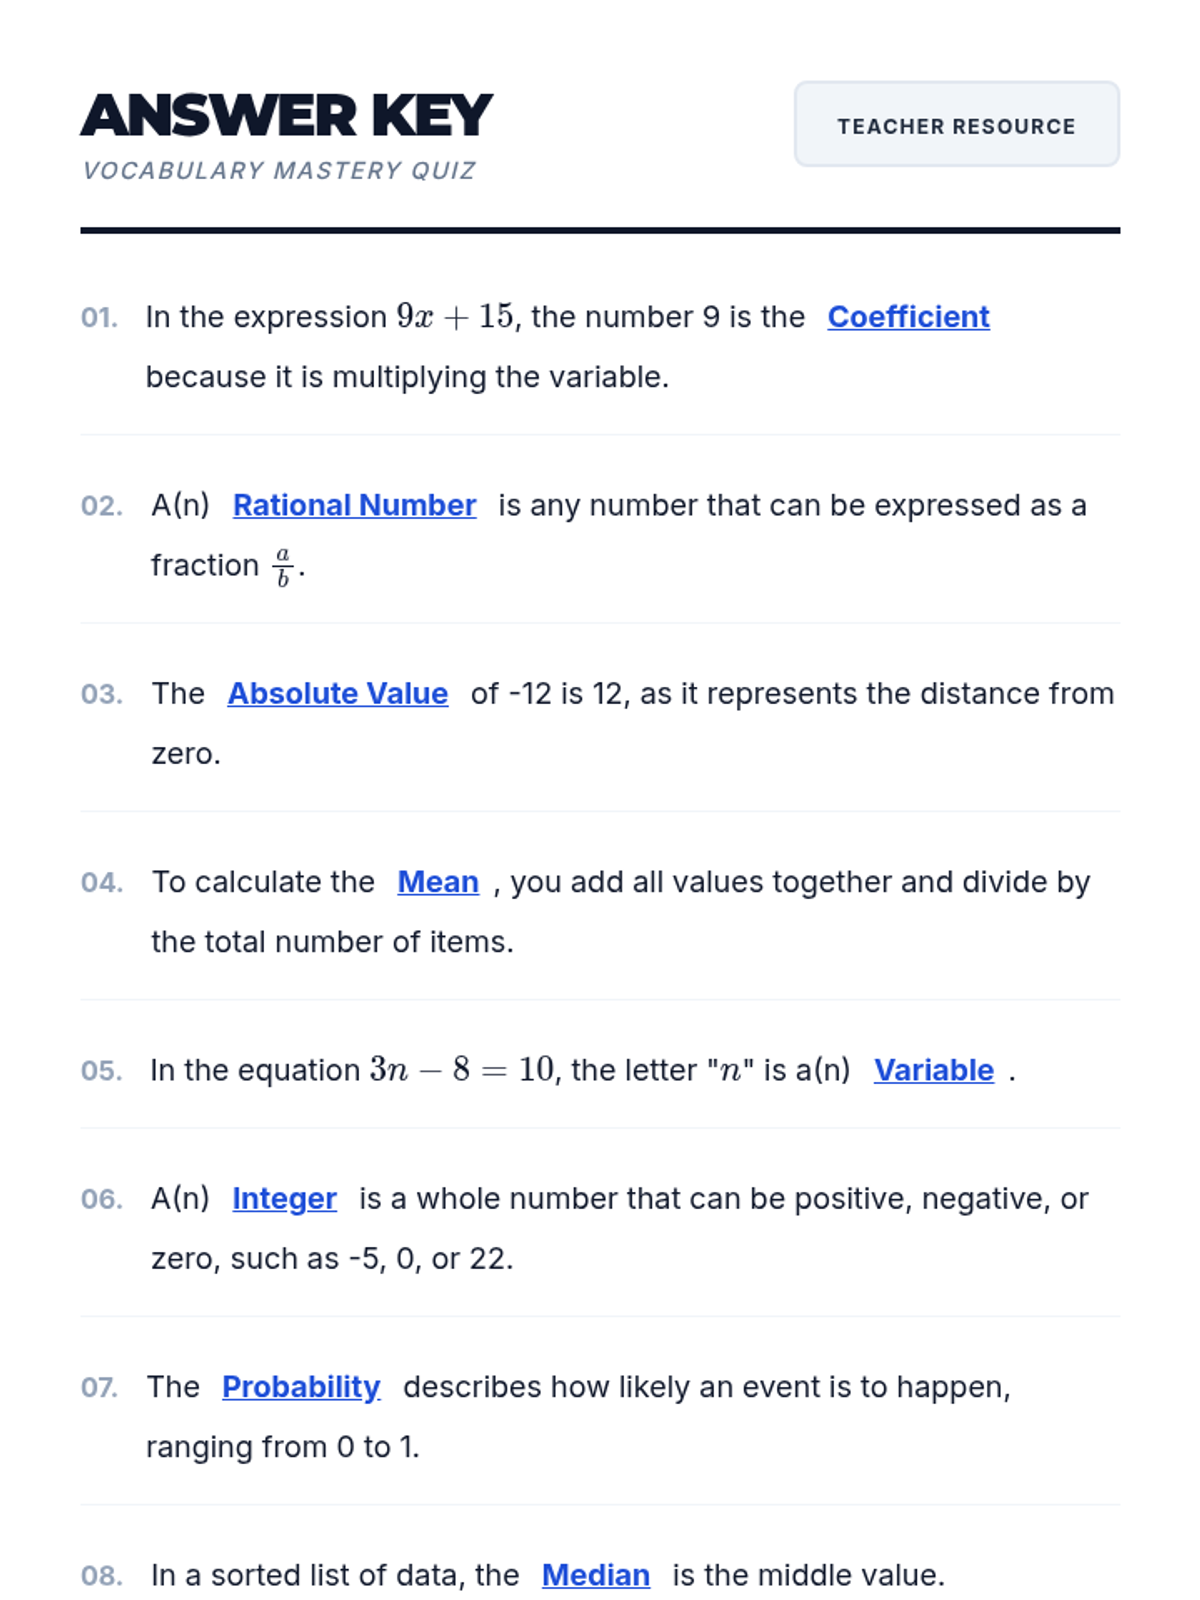
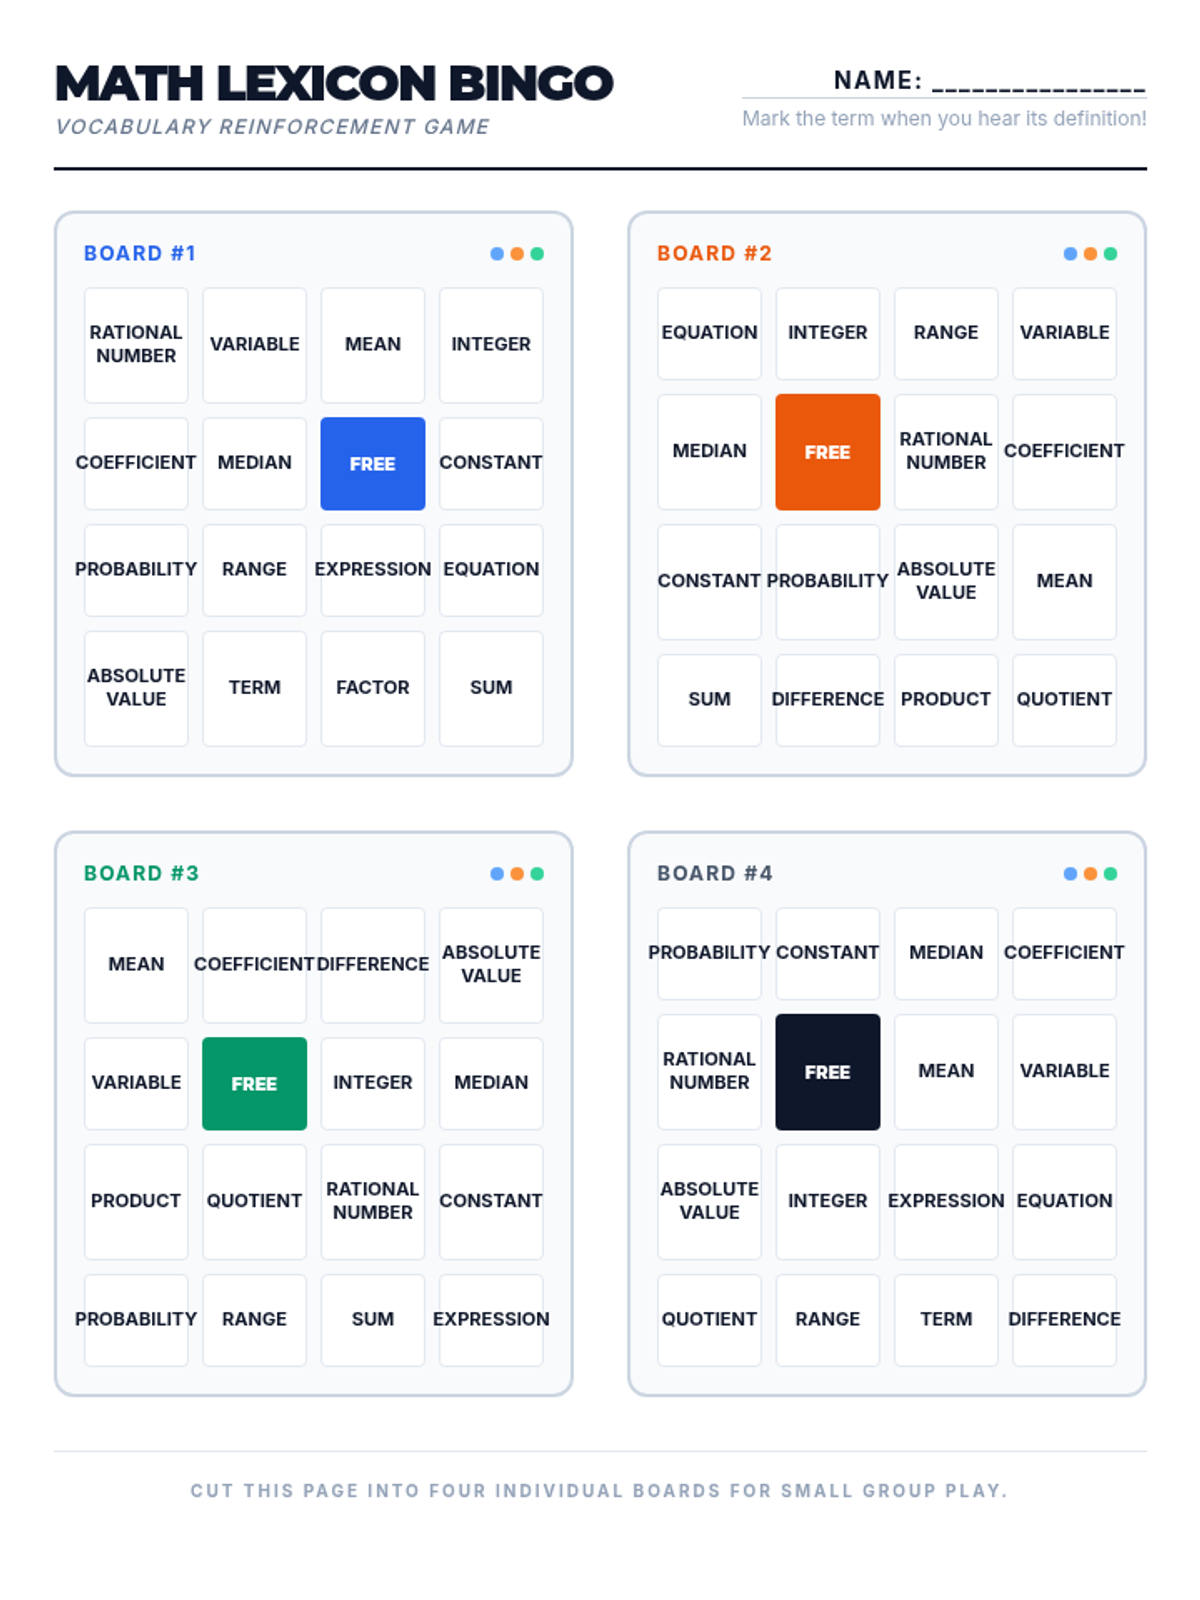
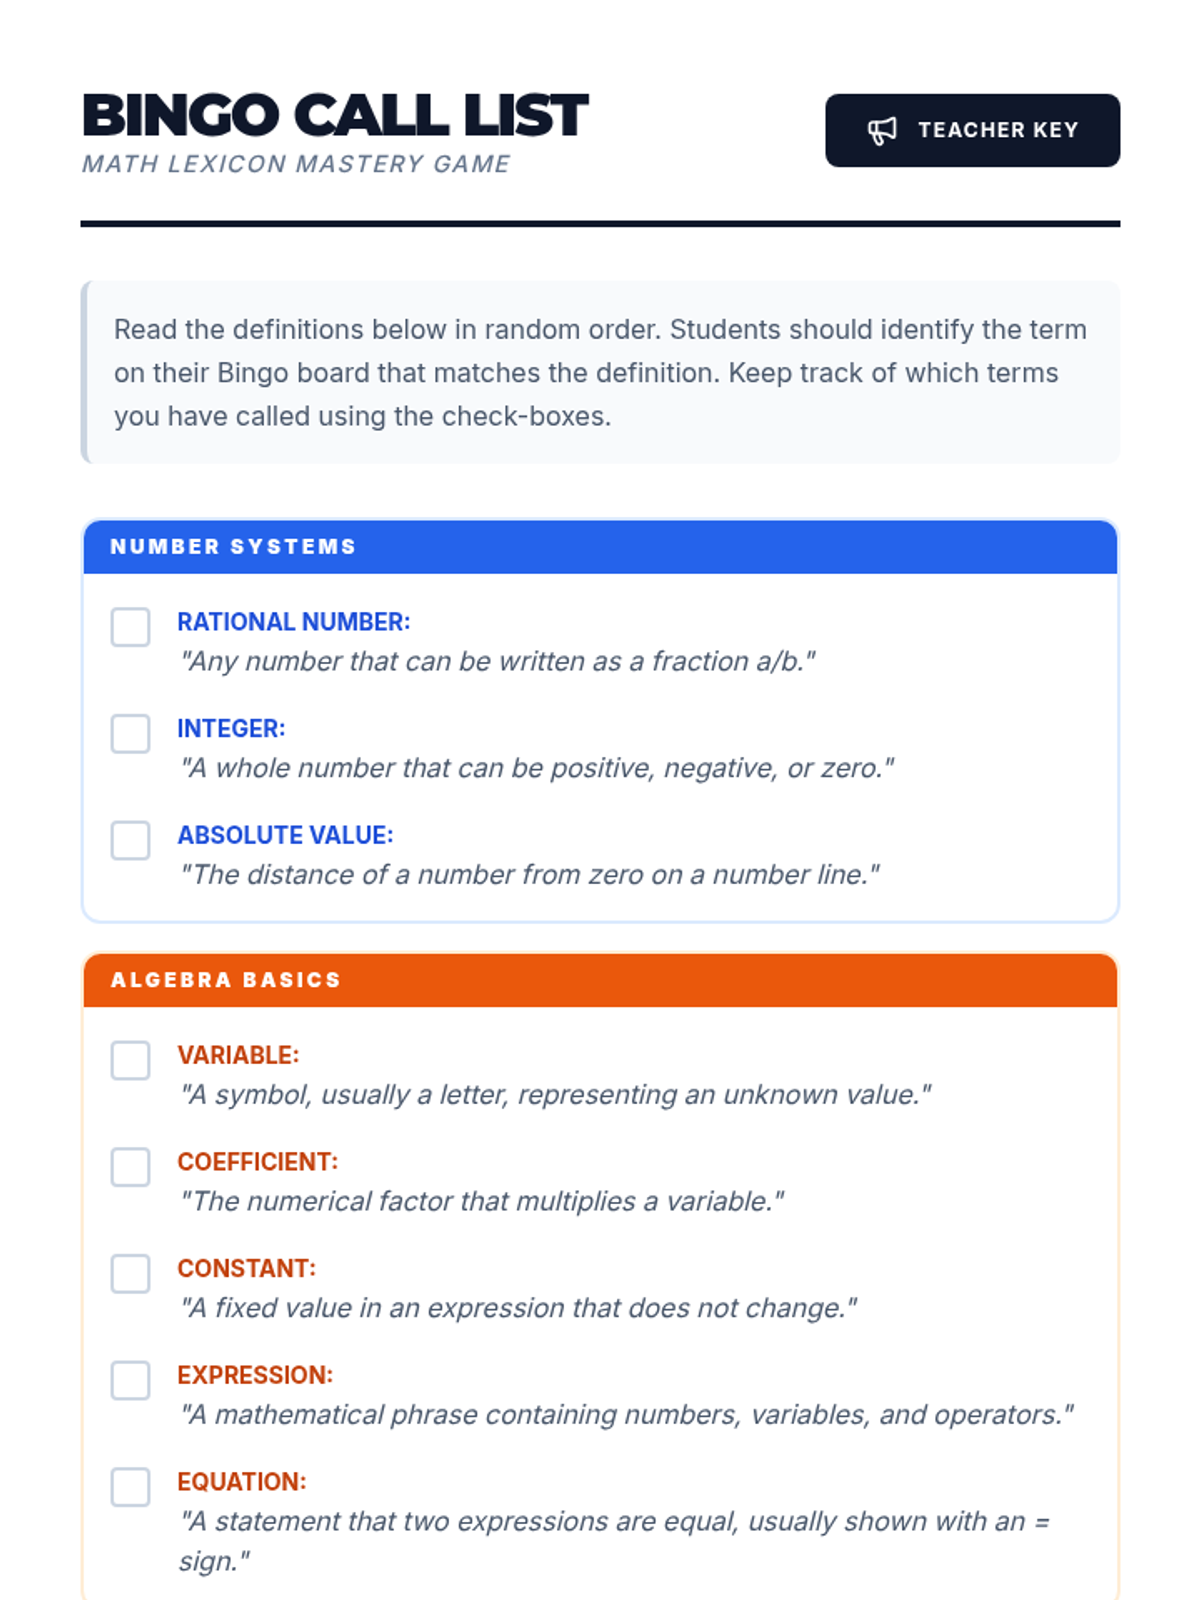
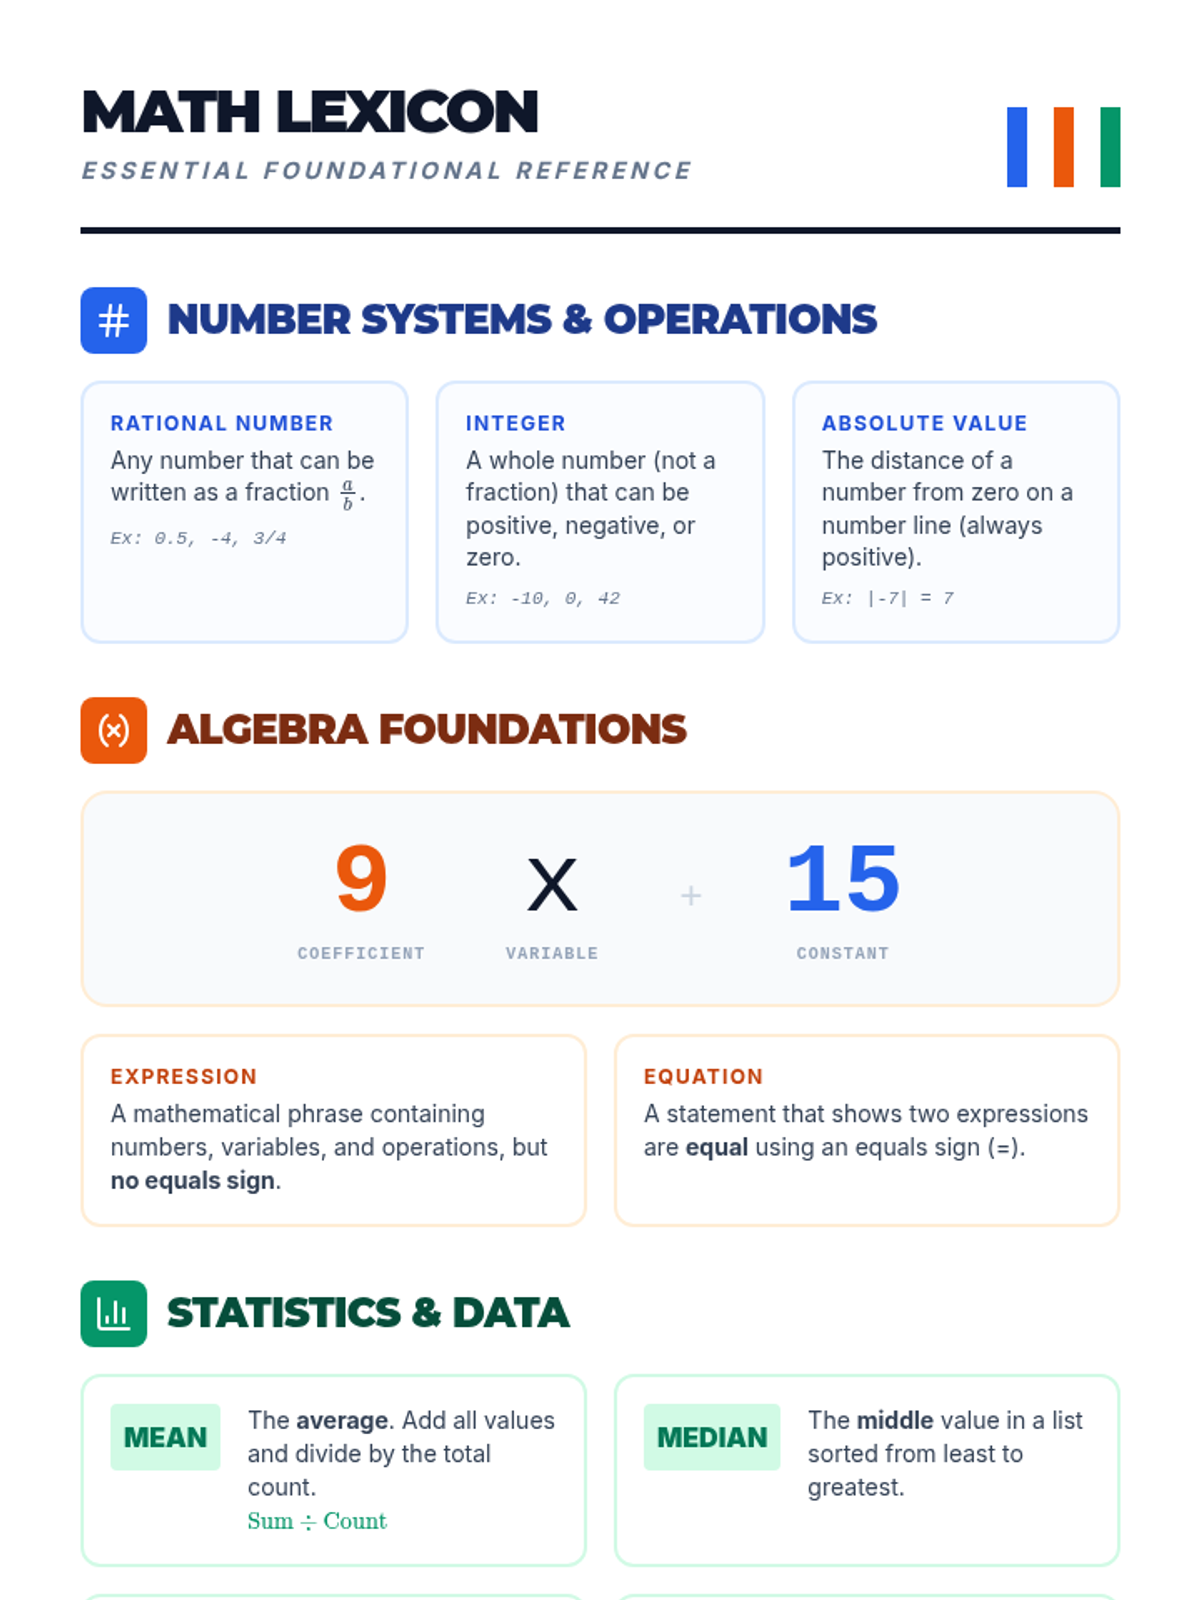
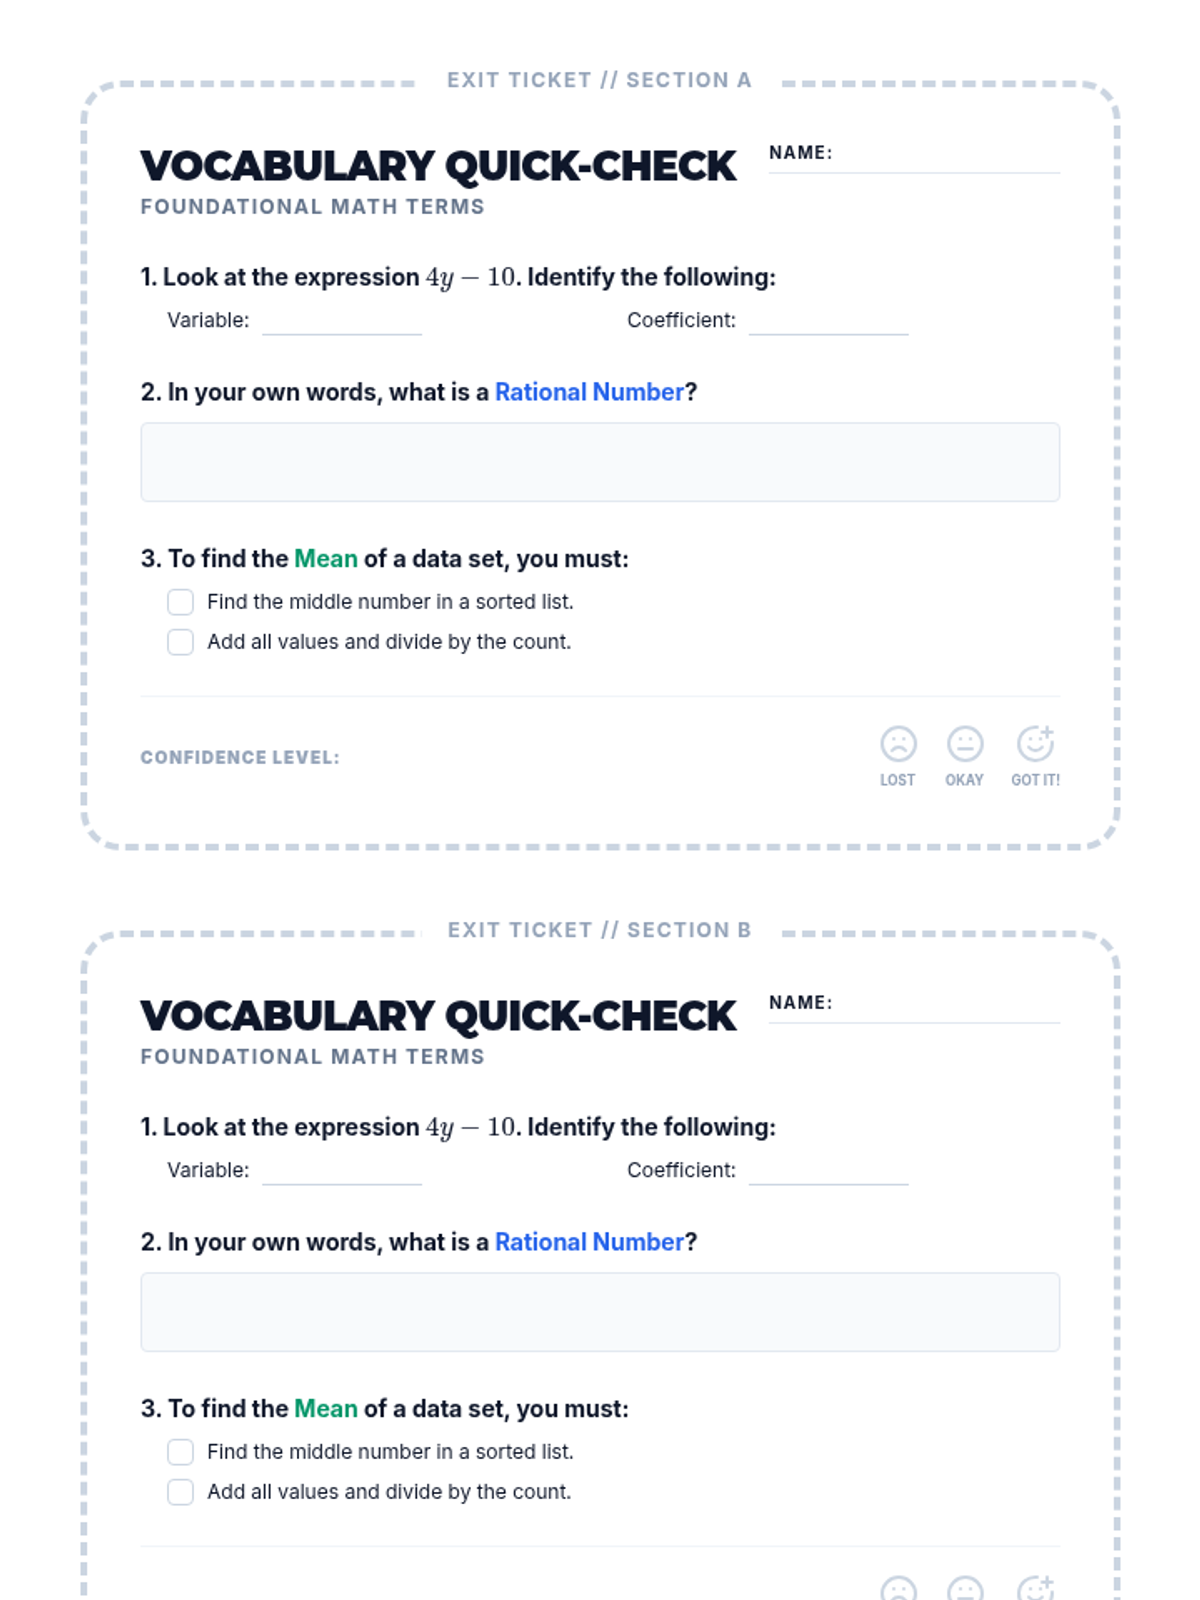
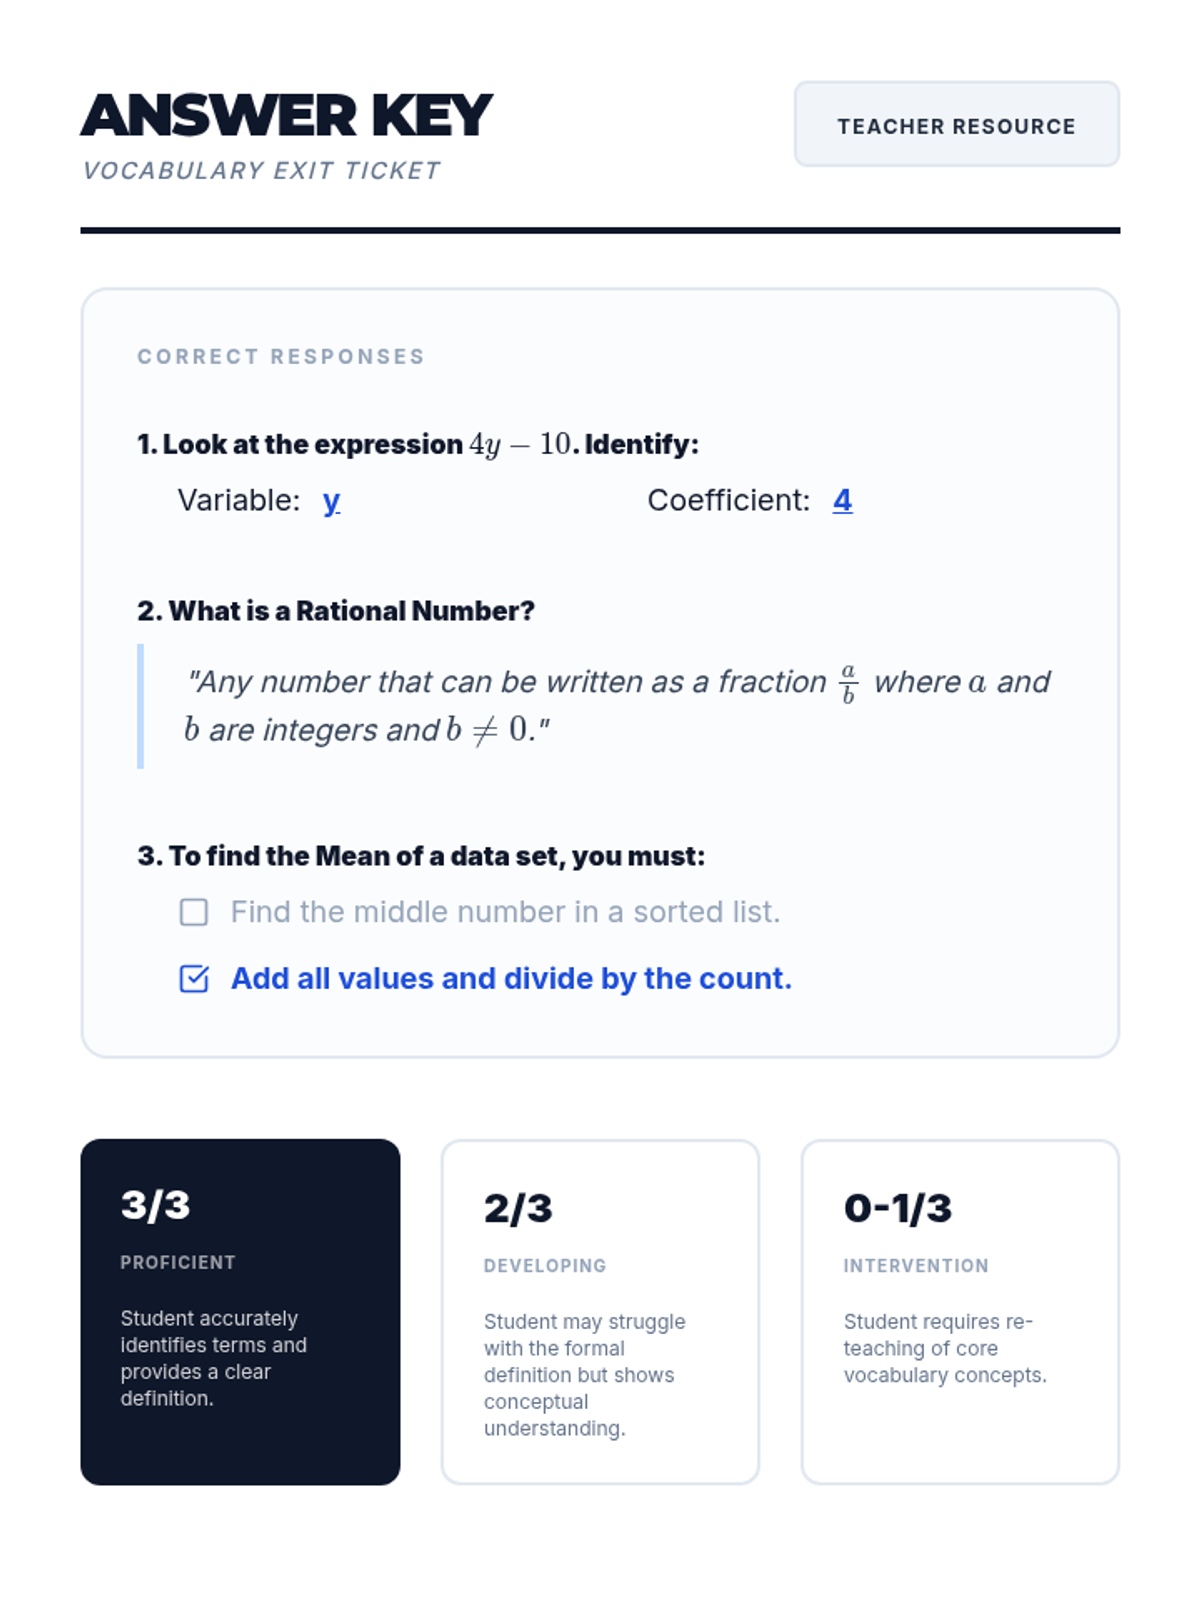
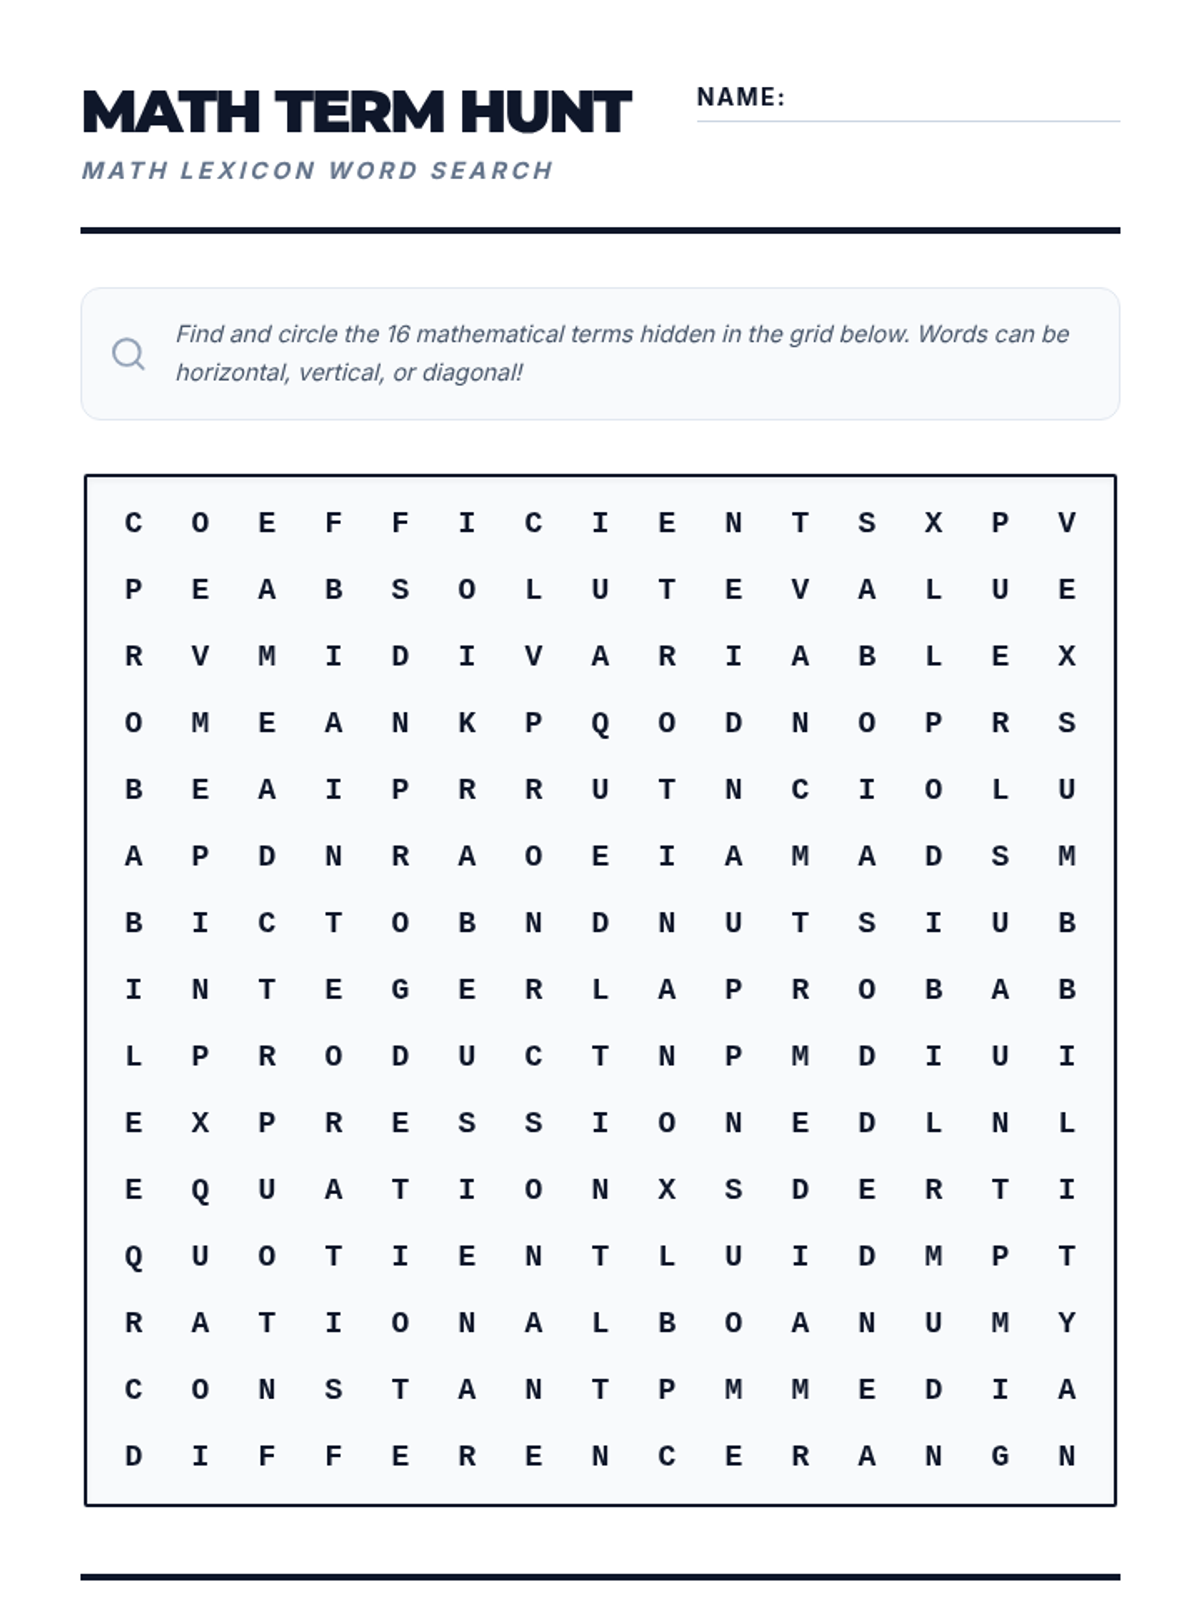
A comprehensive collection of mathematical vocabulary resources covering number systems, algebraic expressions, and statistical analysis. This unit focuses on building precise mathematical language for foundational concepts.
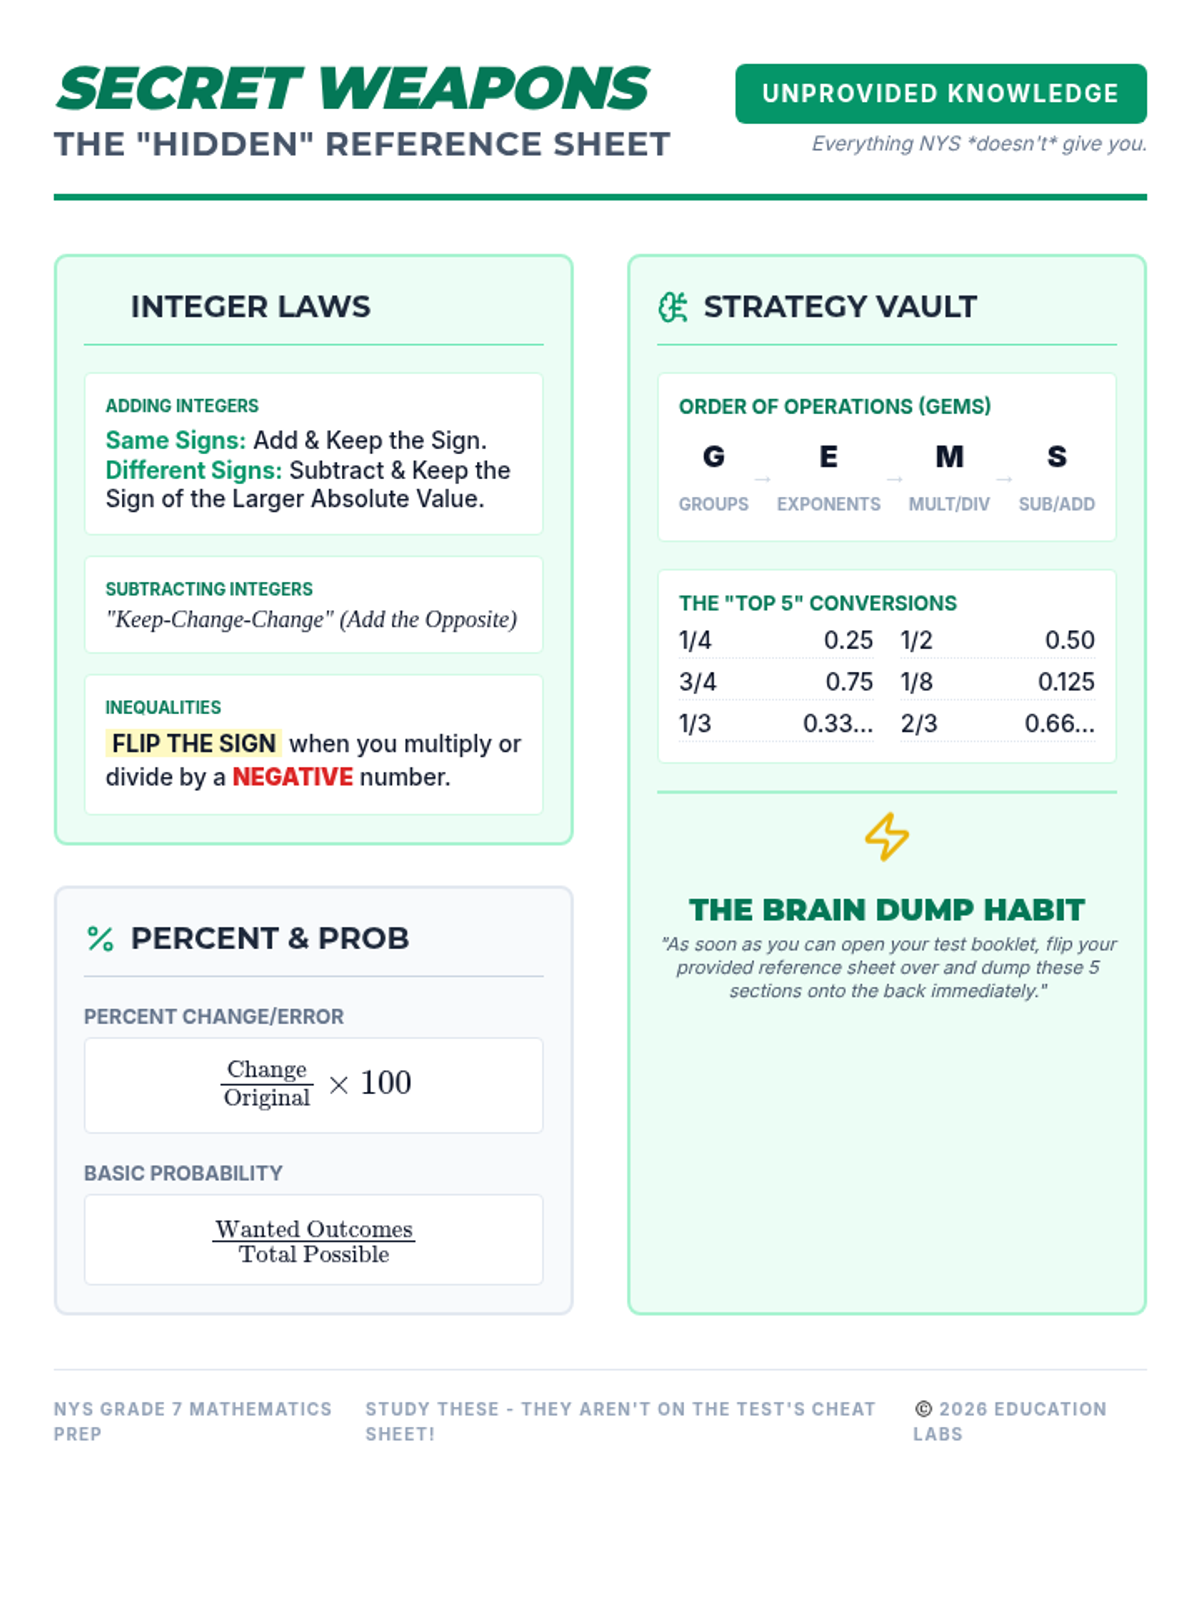
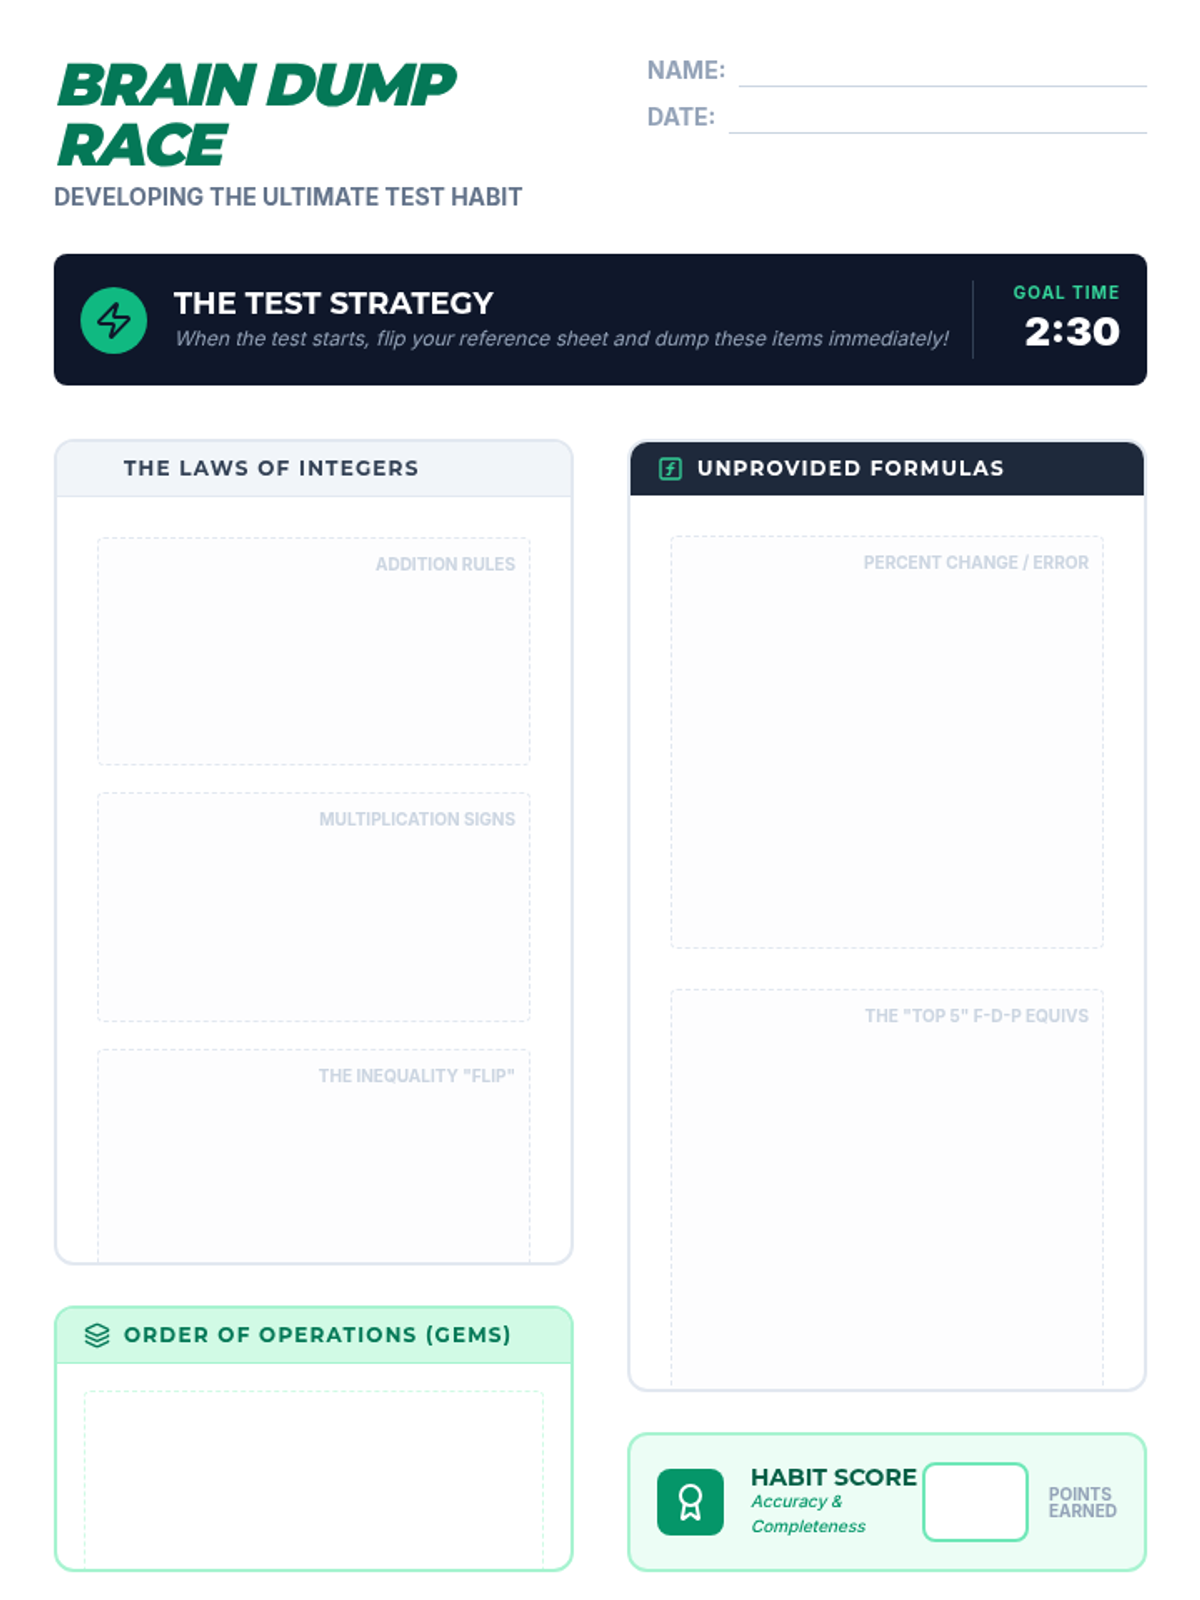
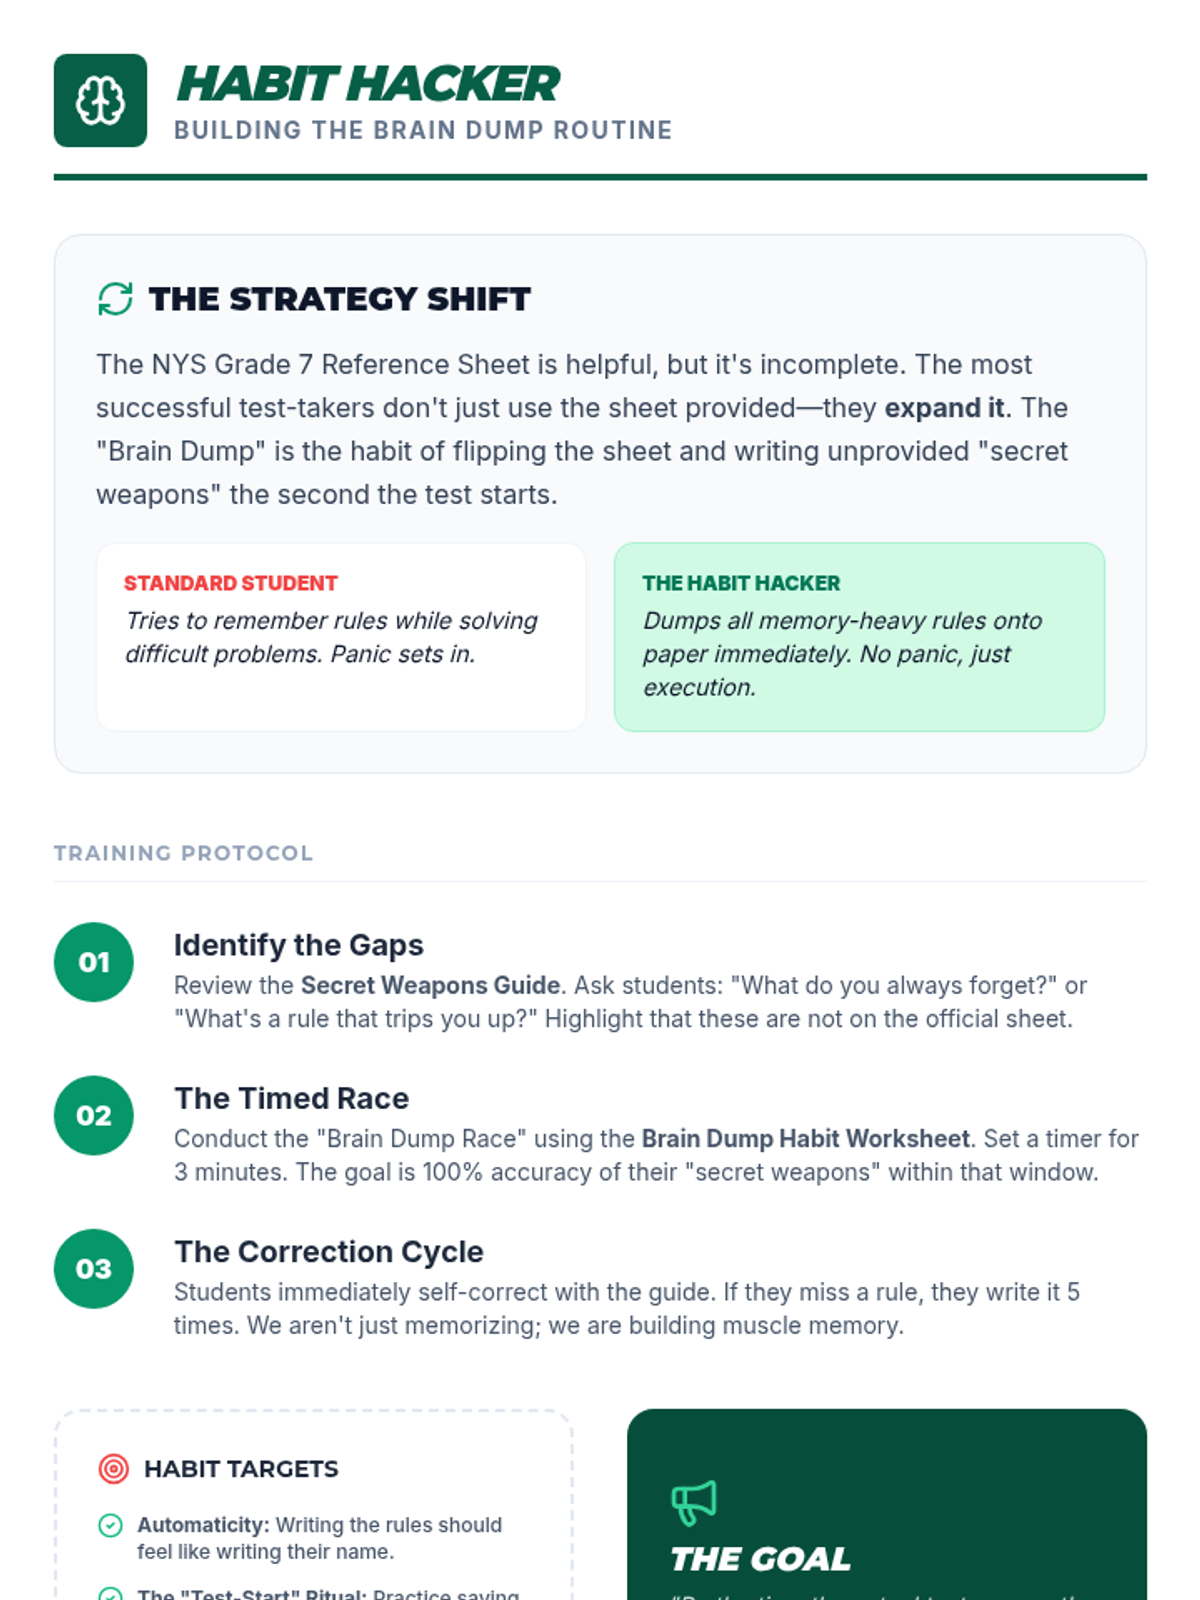
A series of focused prep sessions designed to equip 7th-grade students with the tools and strategies needed for the New York State Math Assessment. This sequence emphasizes reference sheet familiarity, test-taking endurance, and conceptual review.
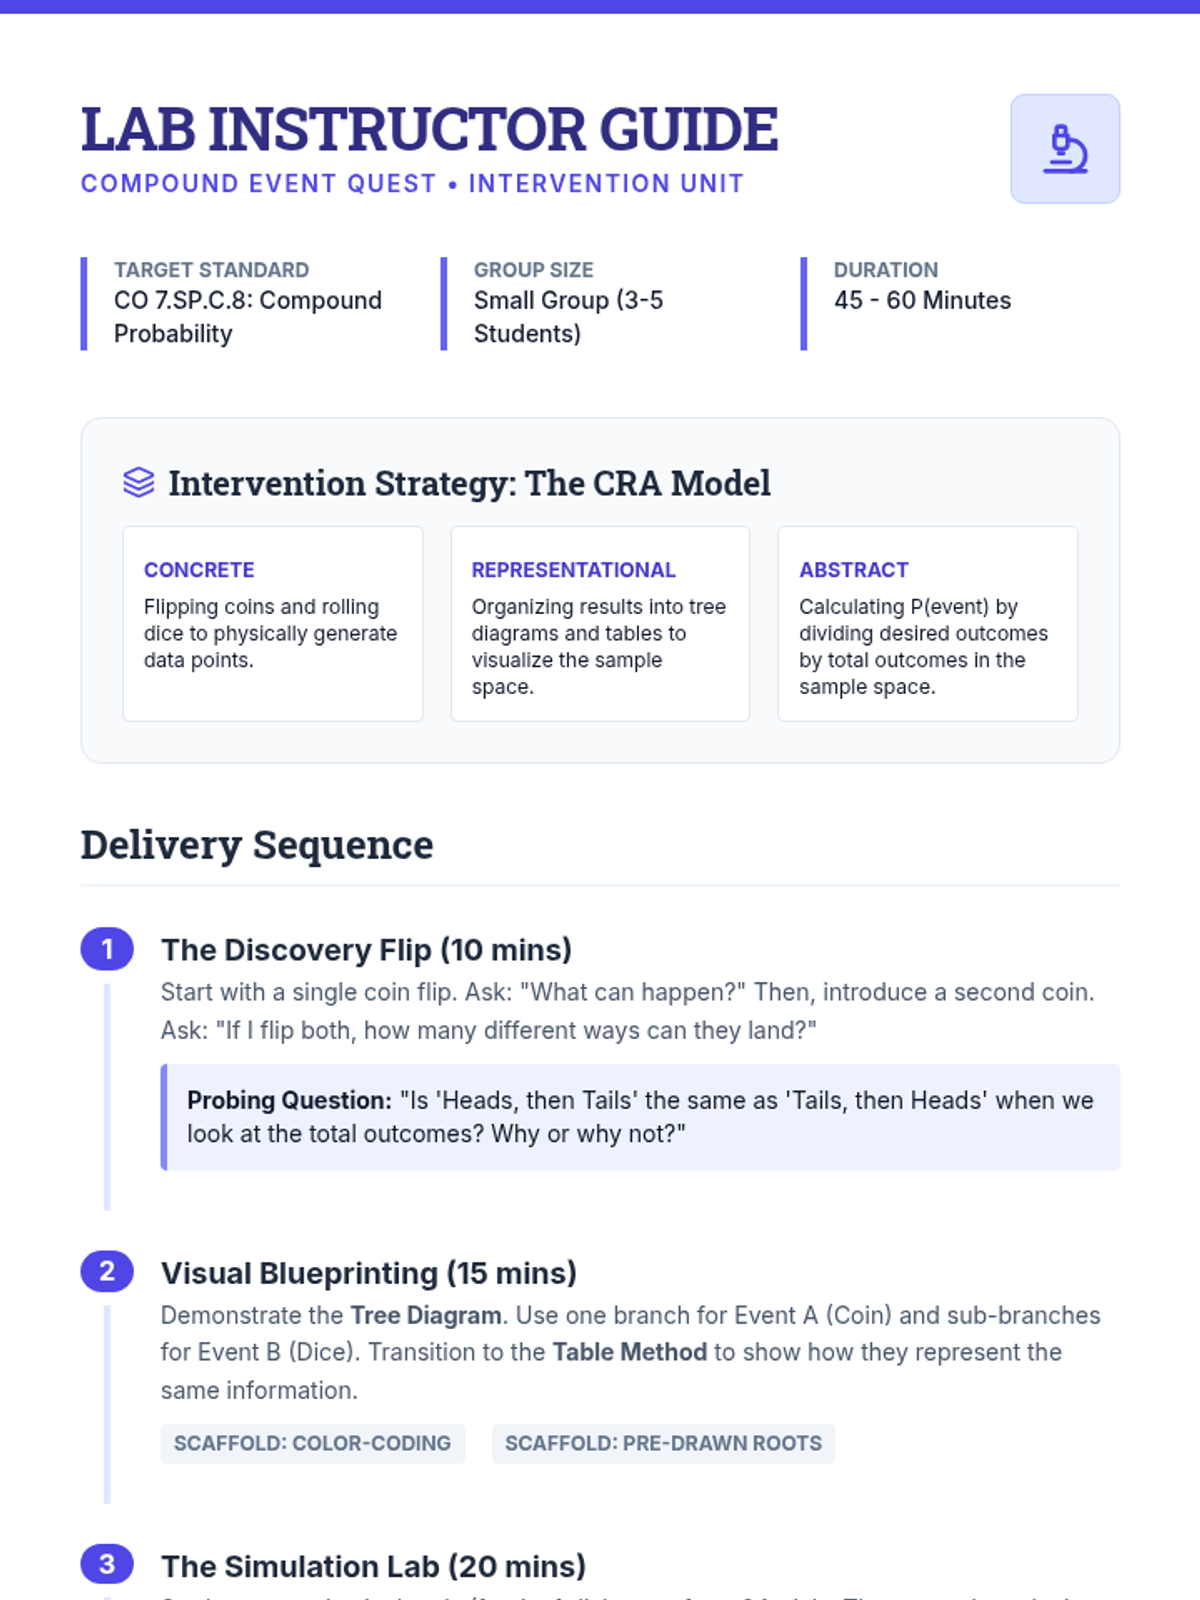
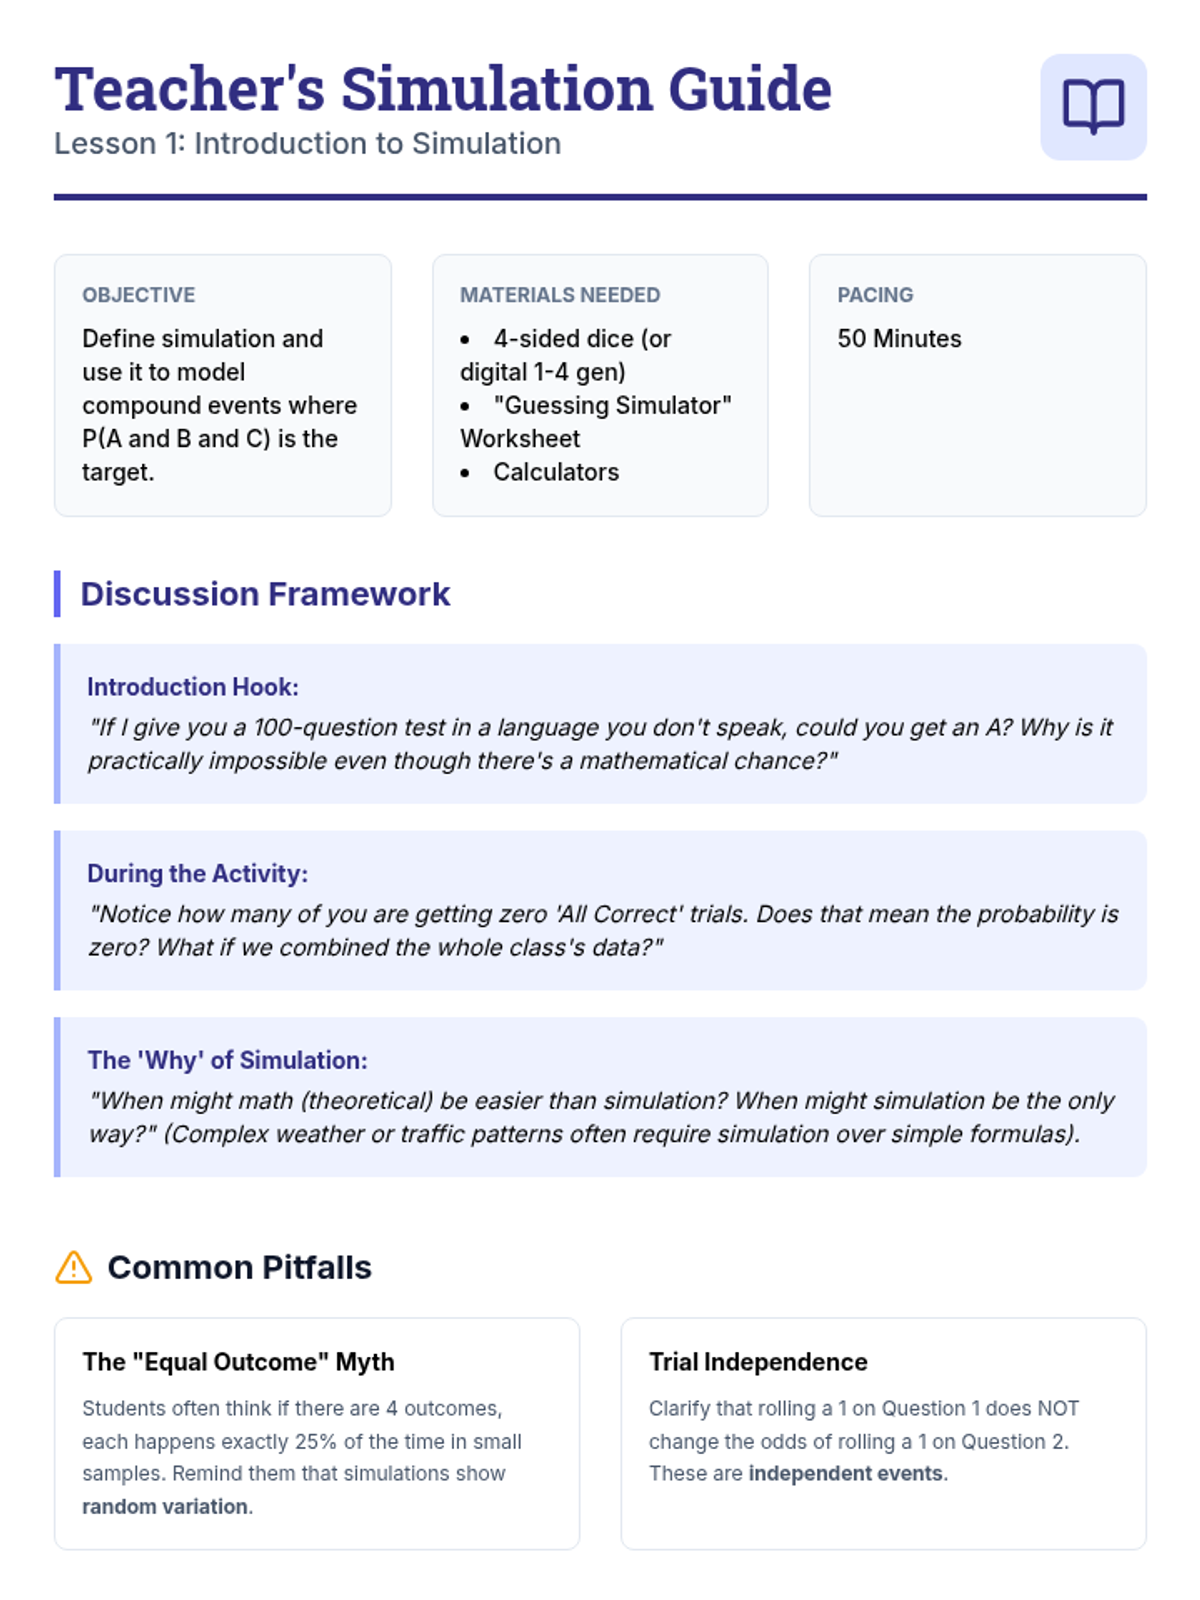
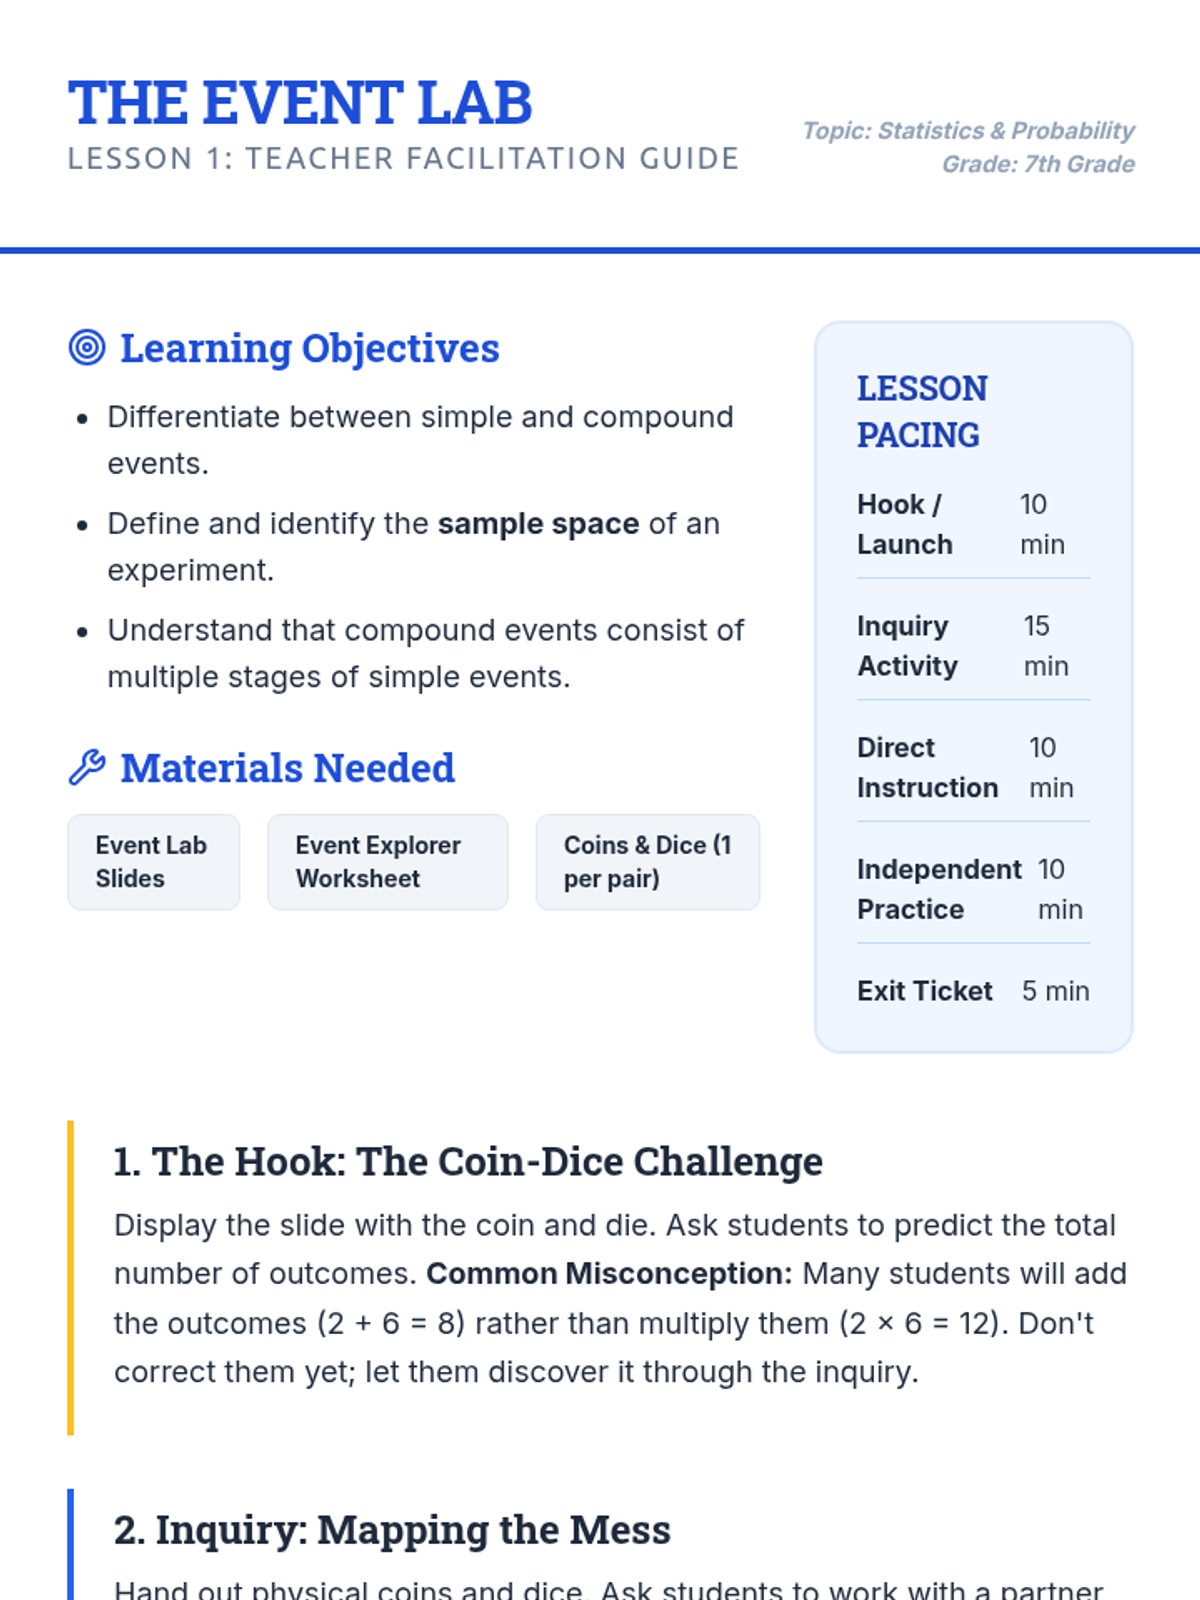
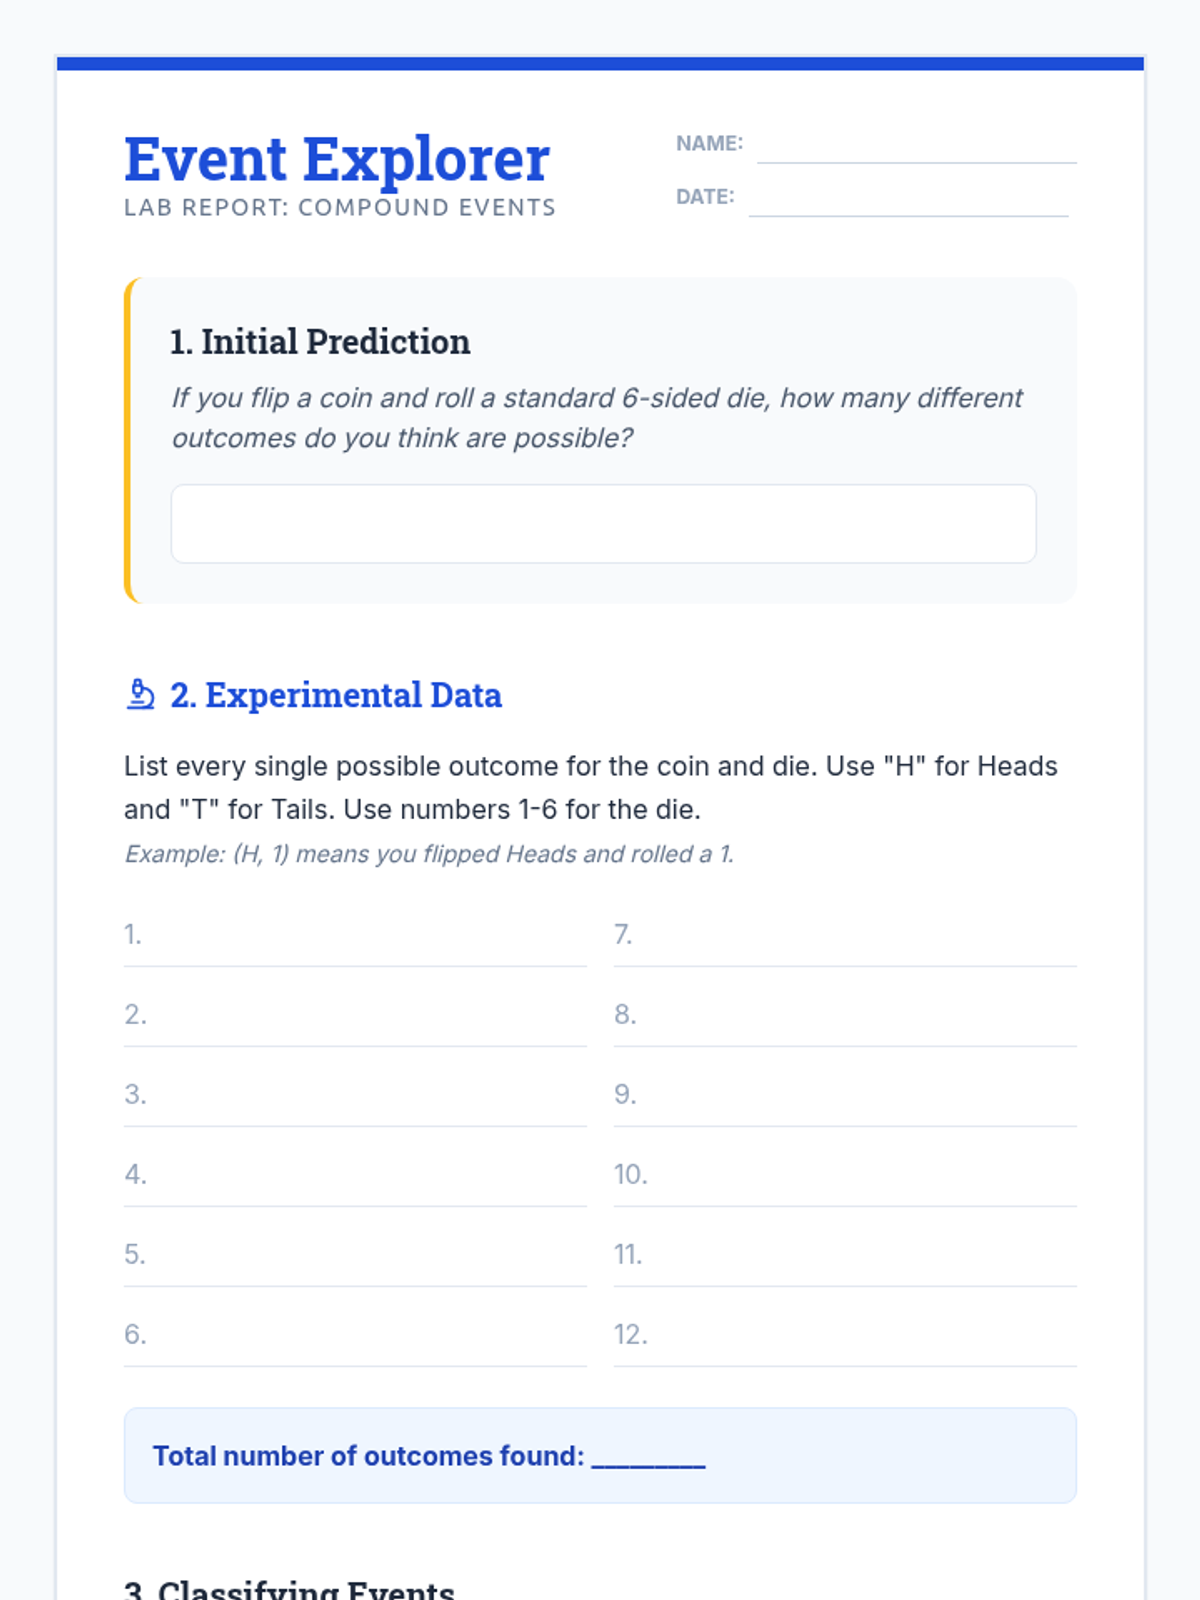
A targeted intervention sequence focused on compound probability, designed for small groups to master sample space construction and simulations.
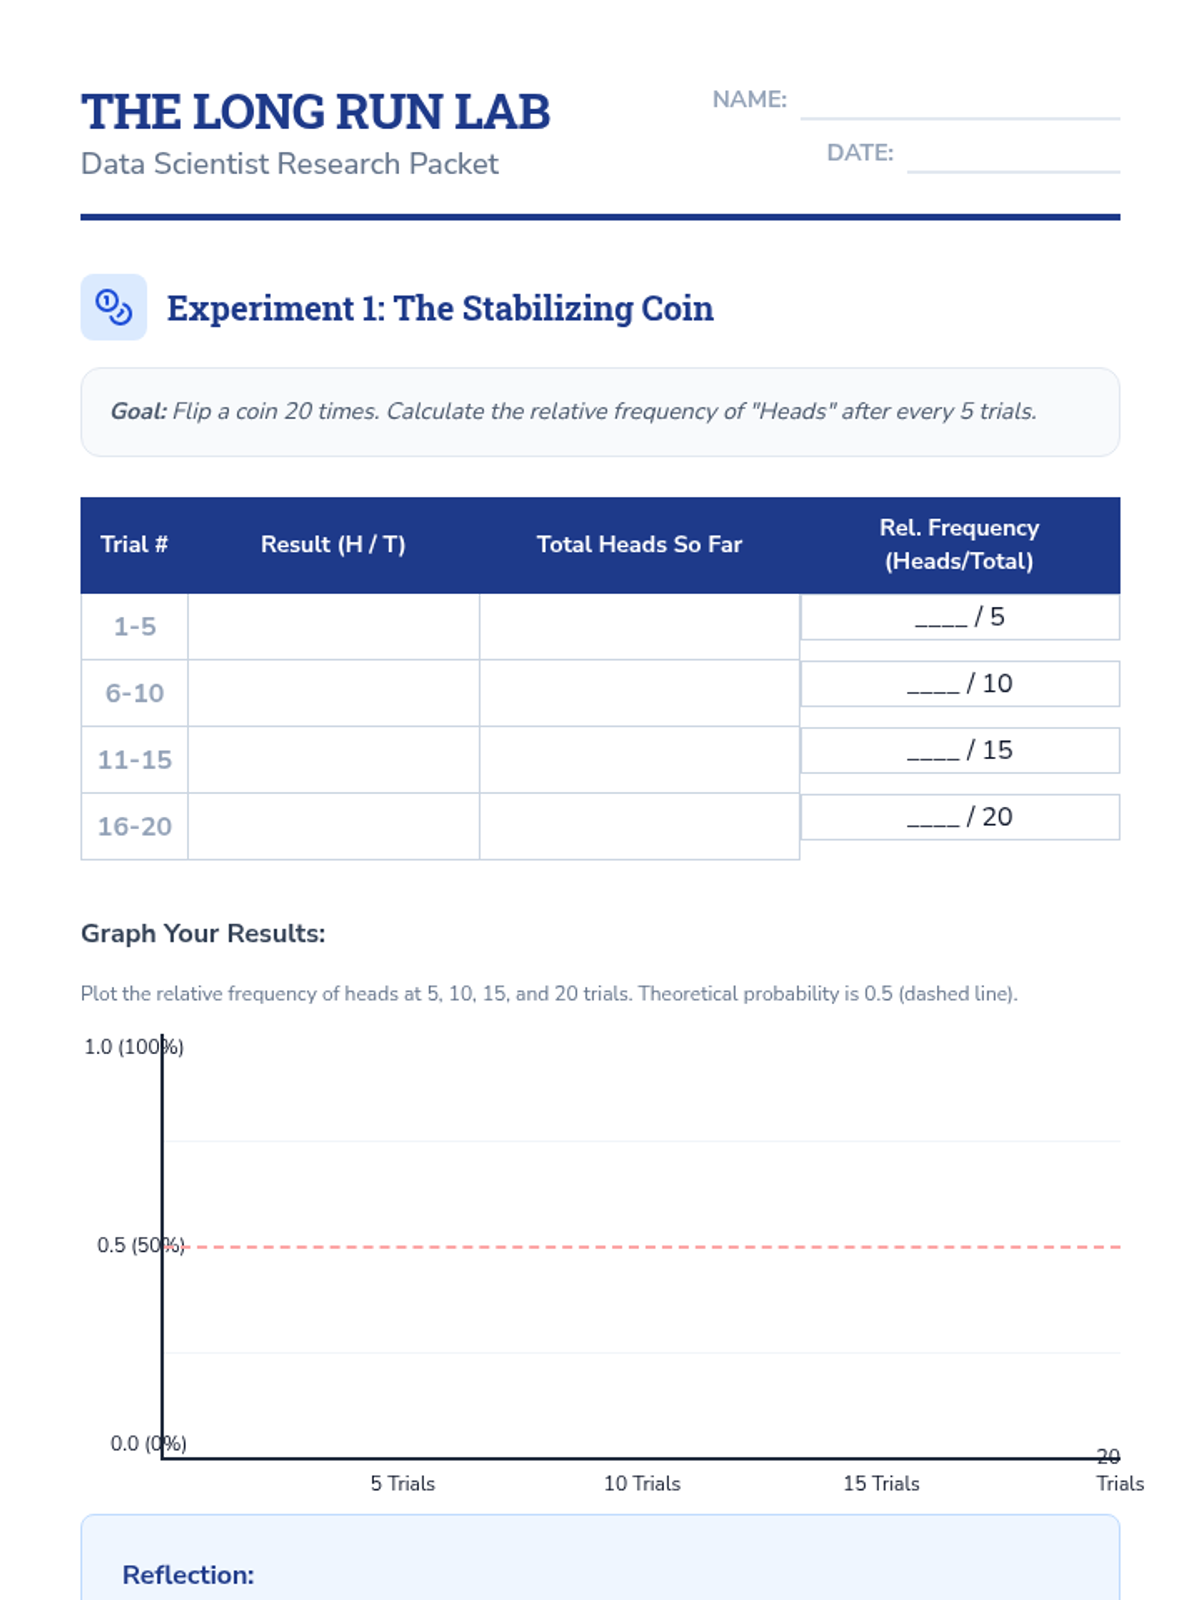
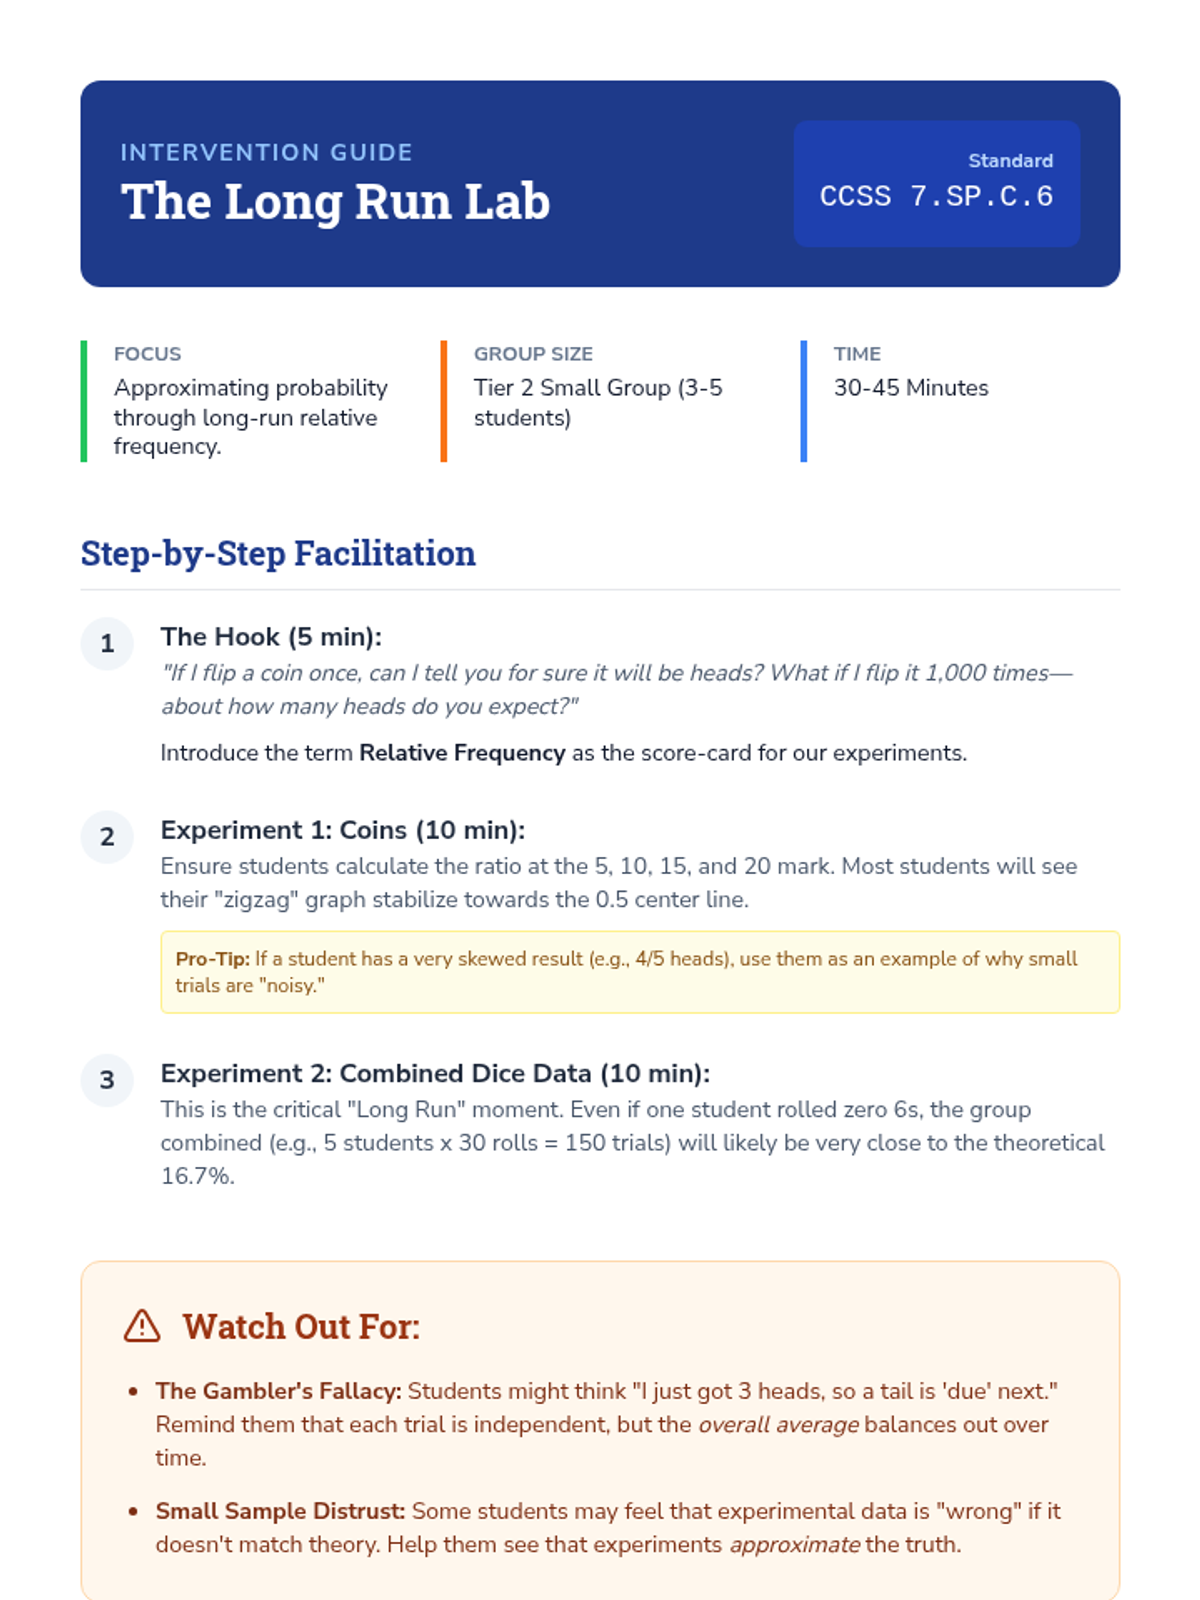
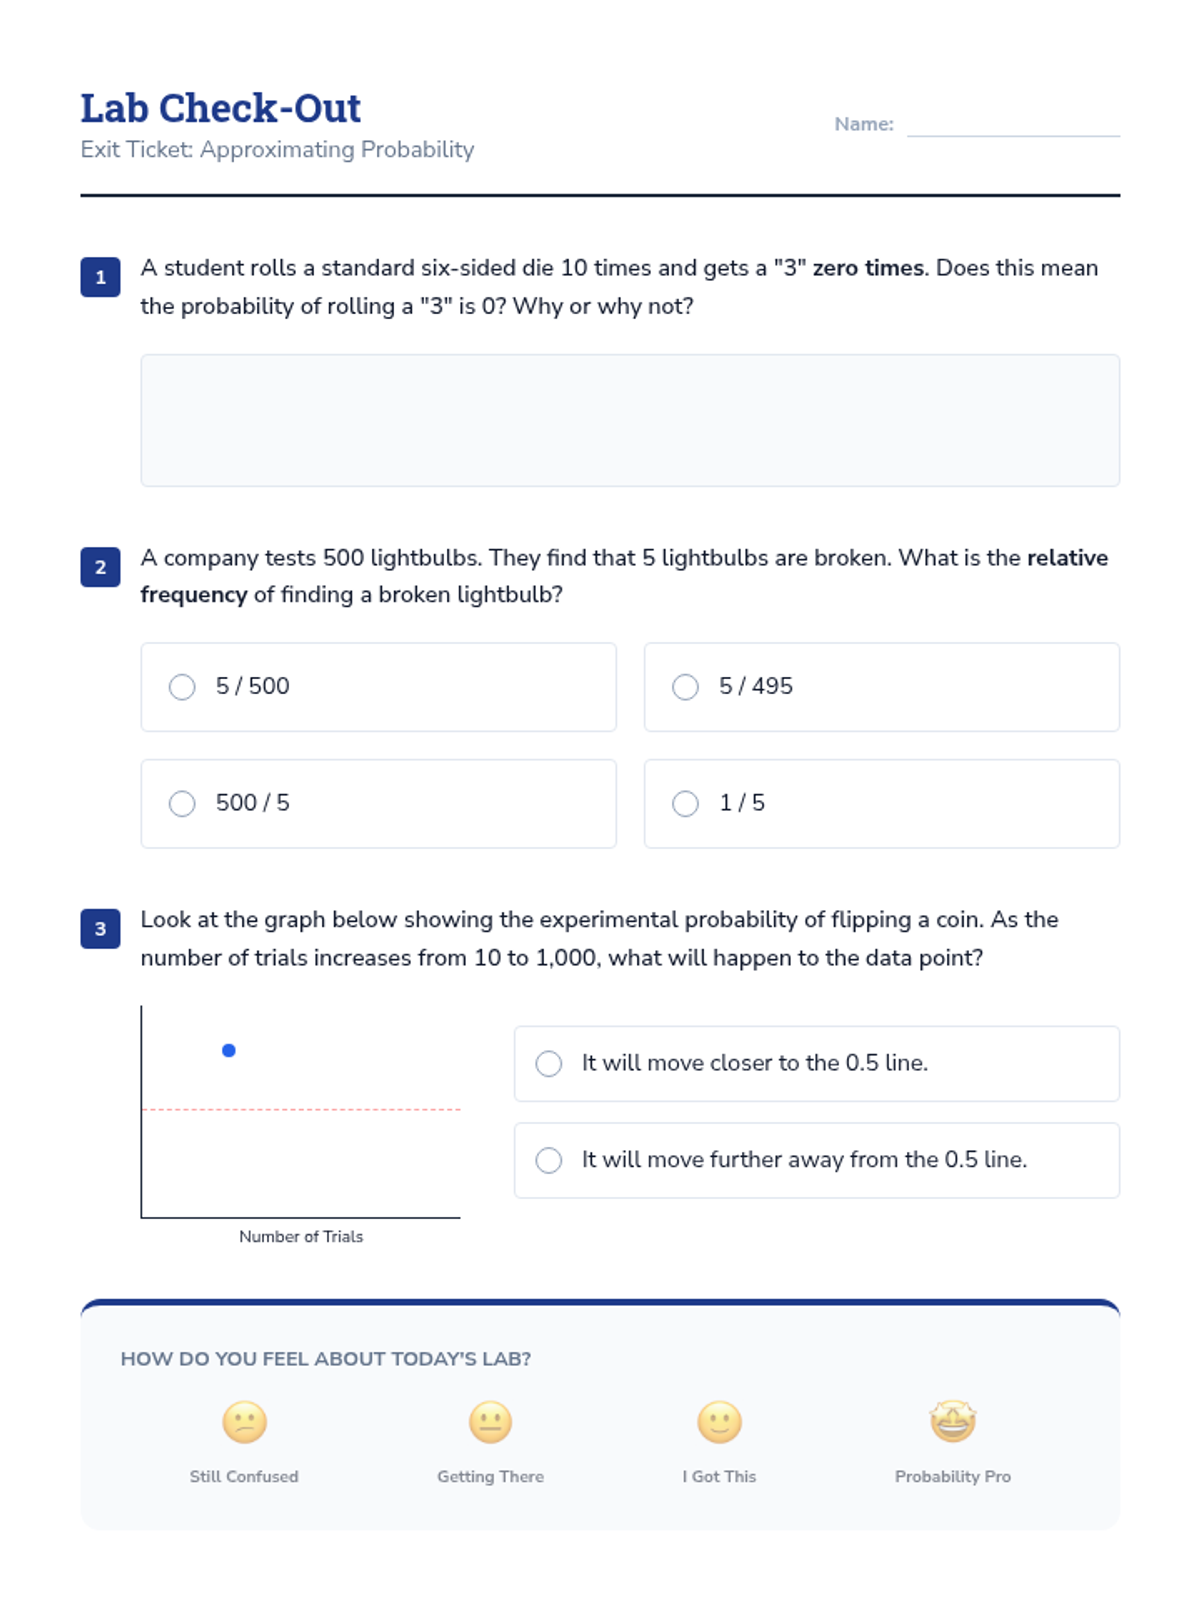
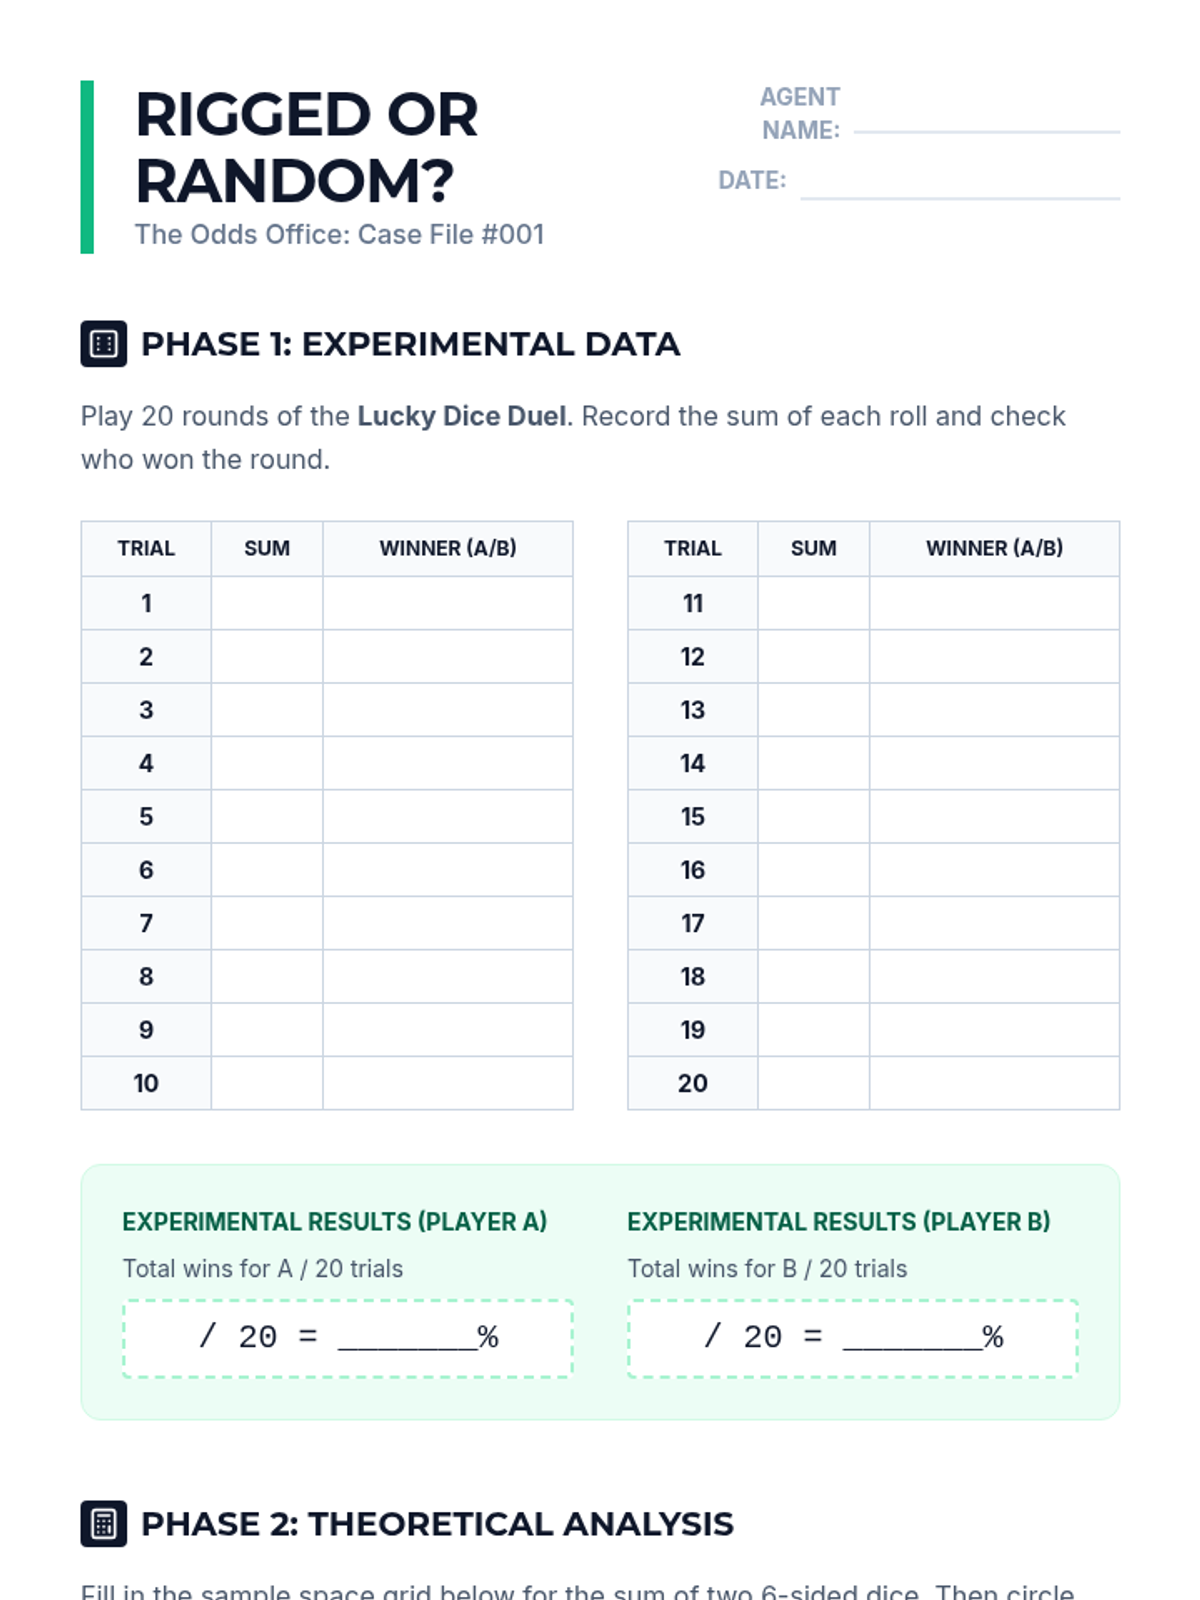
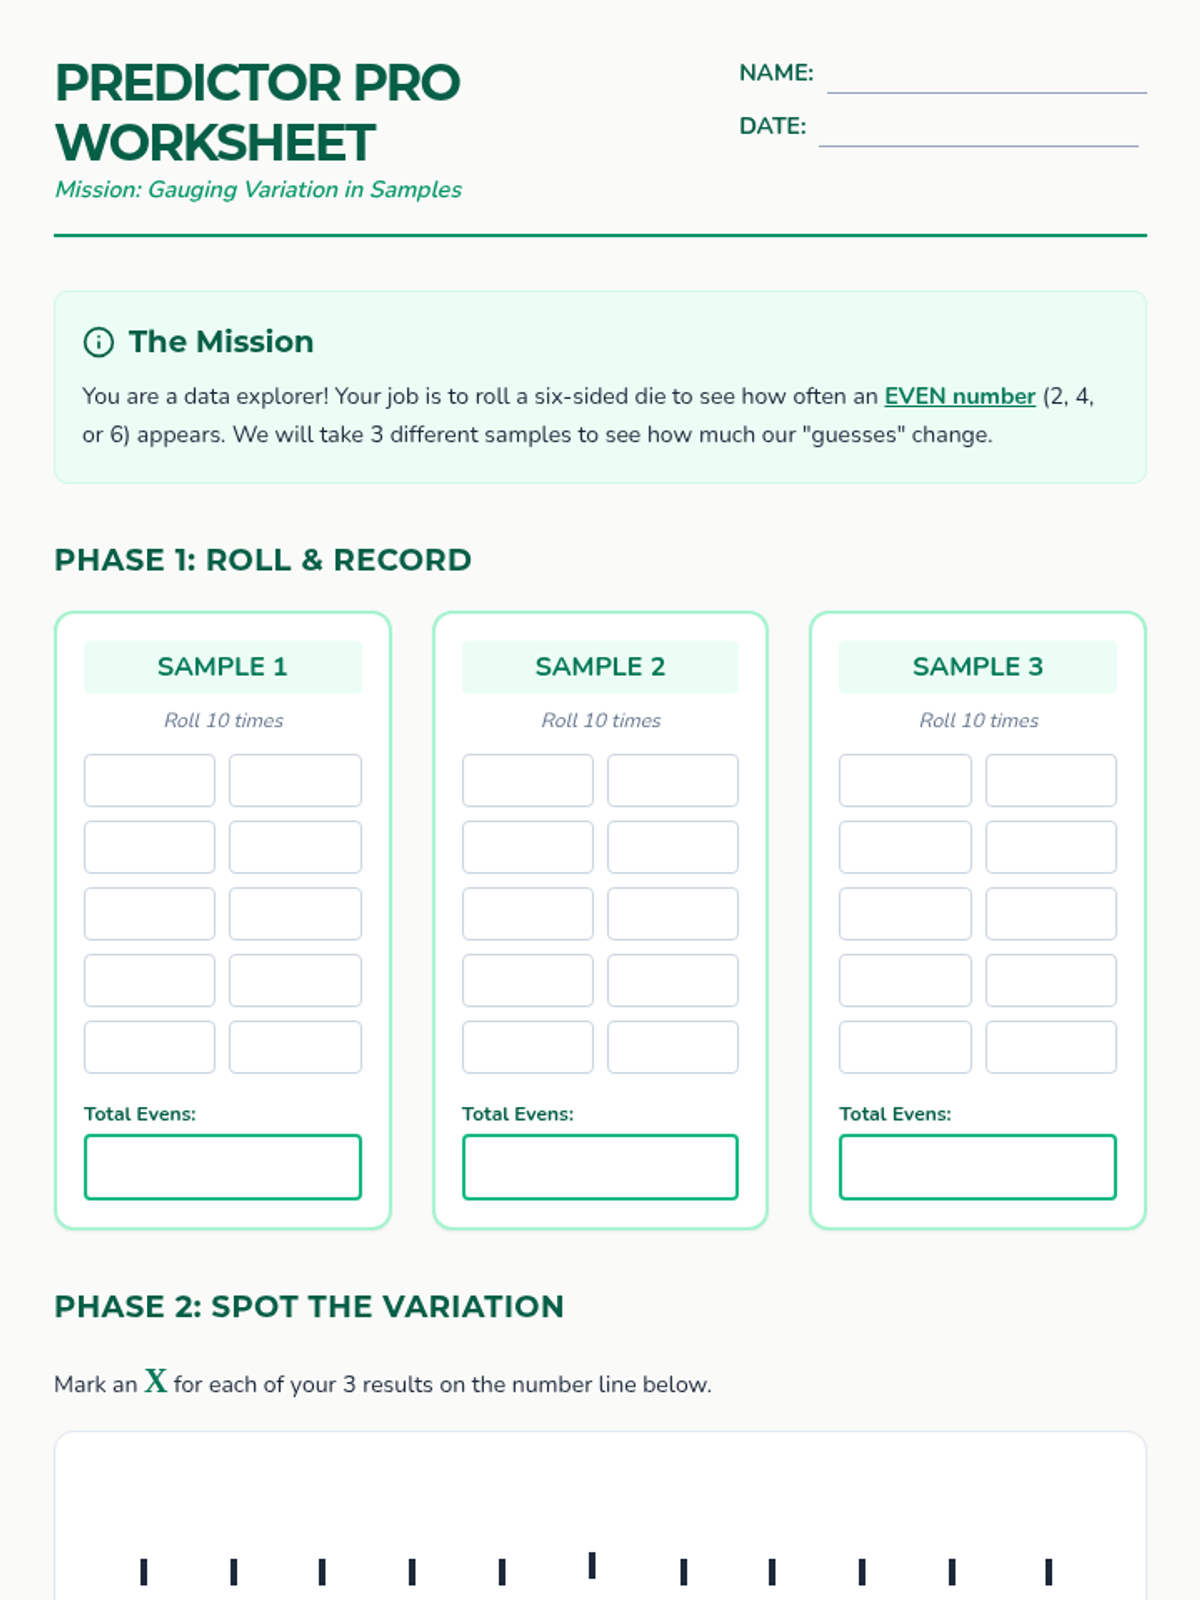
A targeted intervention sequence focused on understanding probability through experimental data, recording frequencies, and observing how relative frequency stabilizes over many trials.
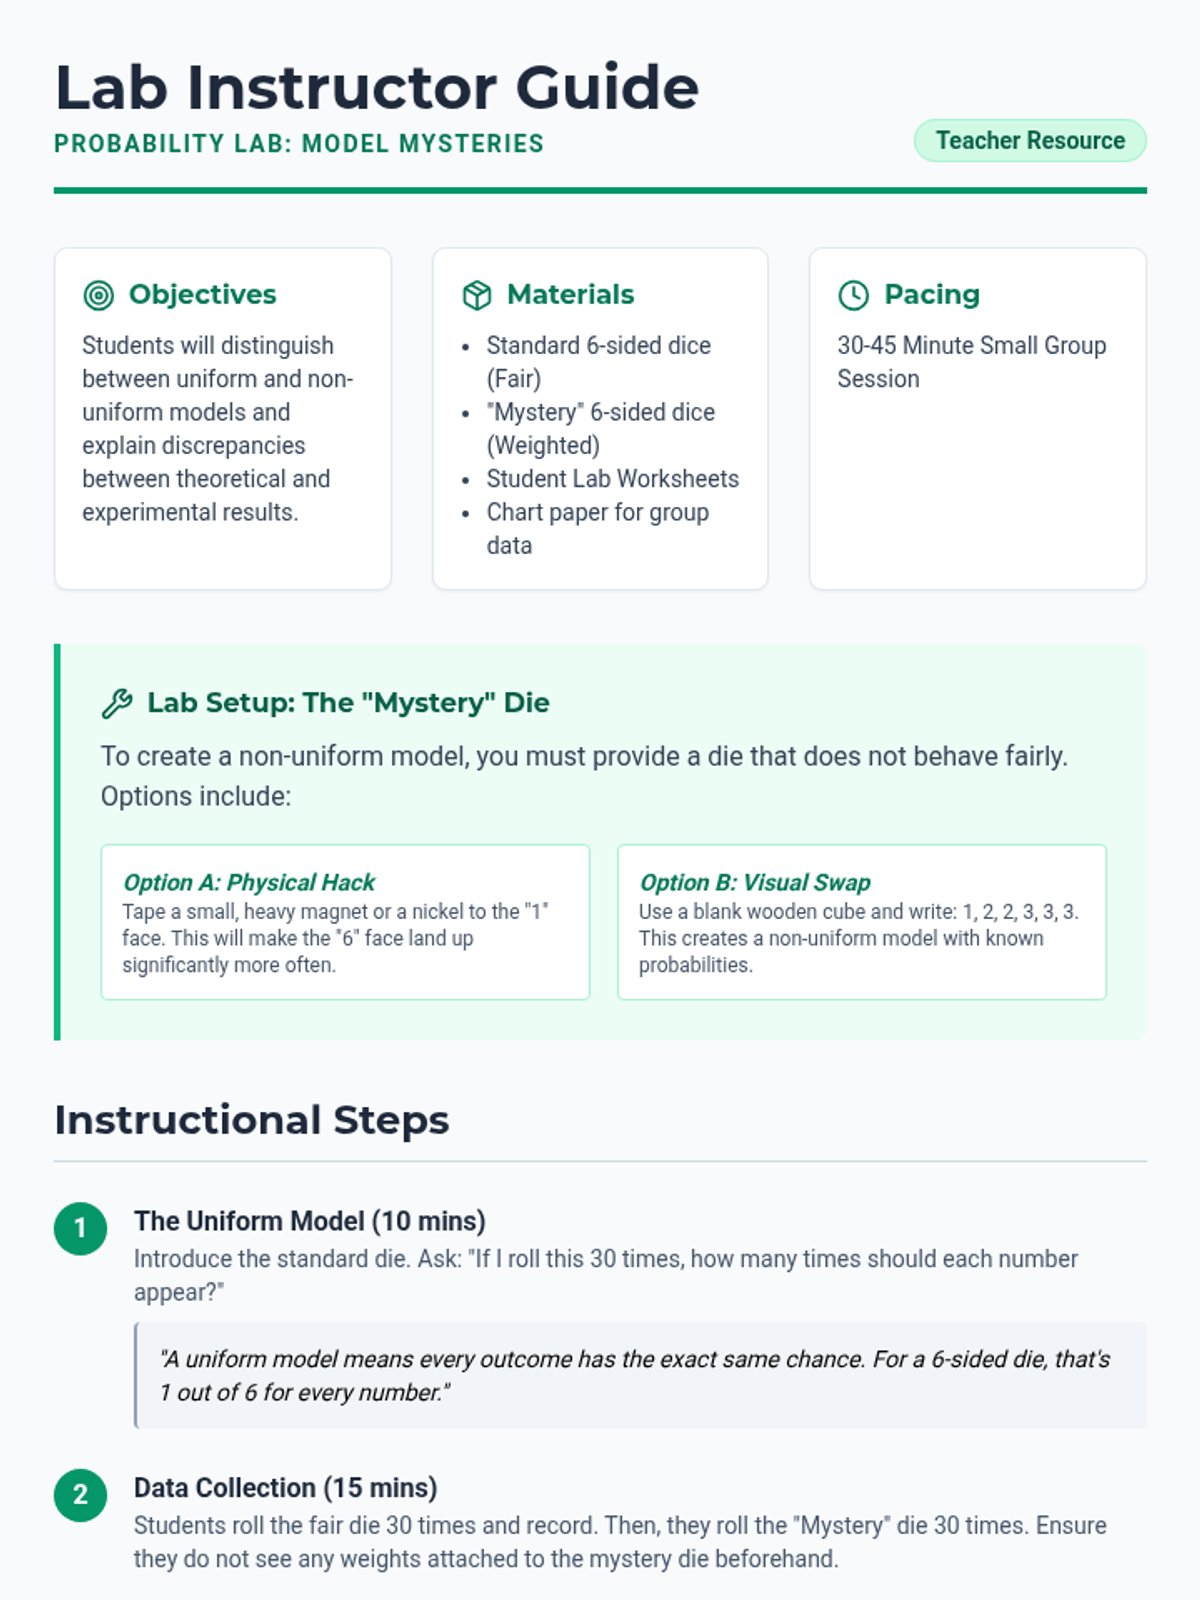
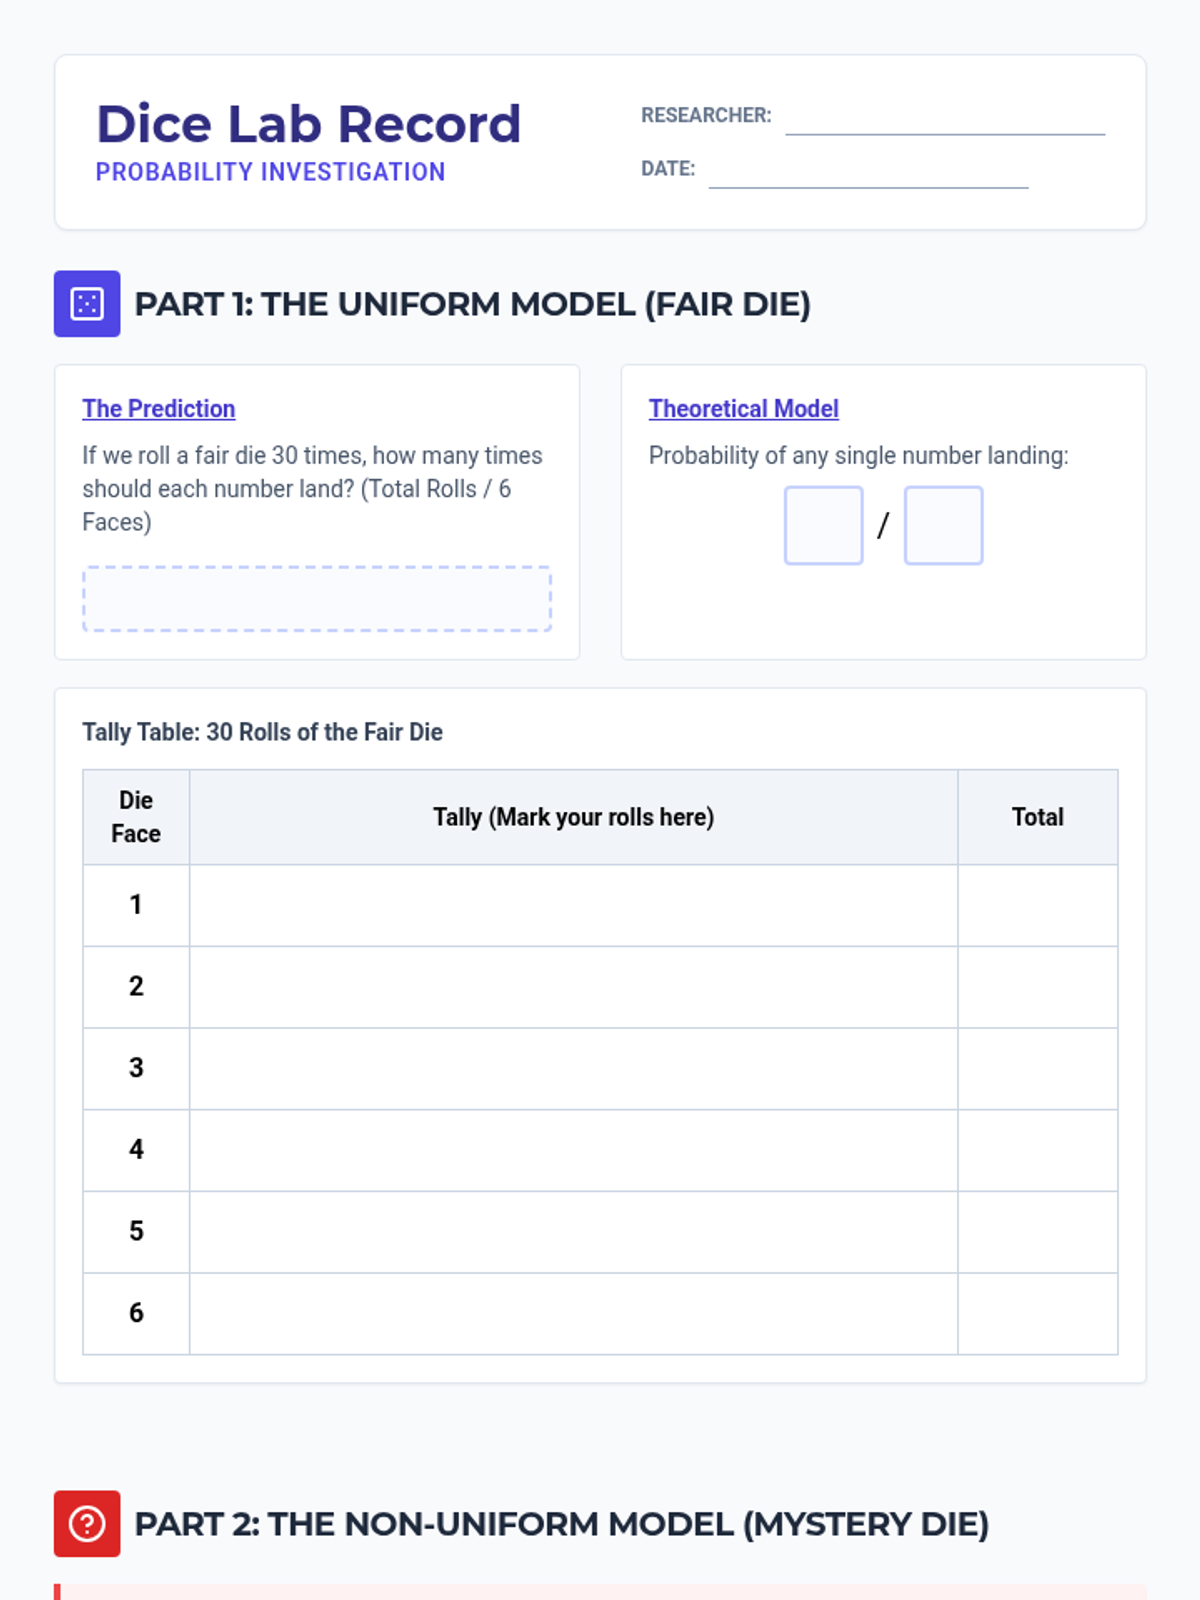
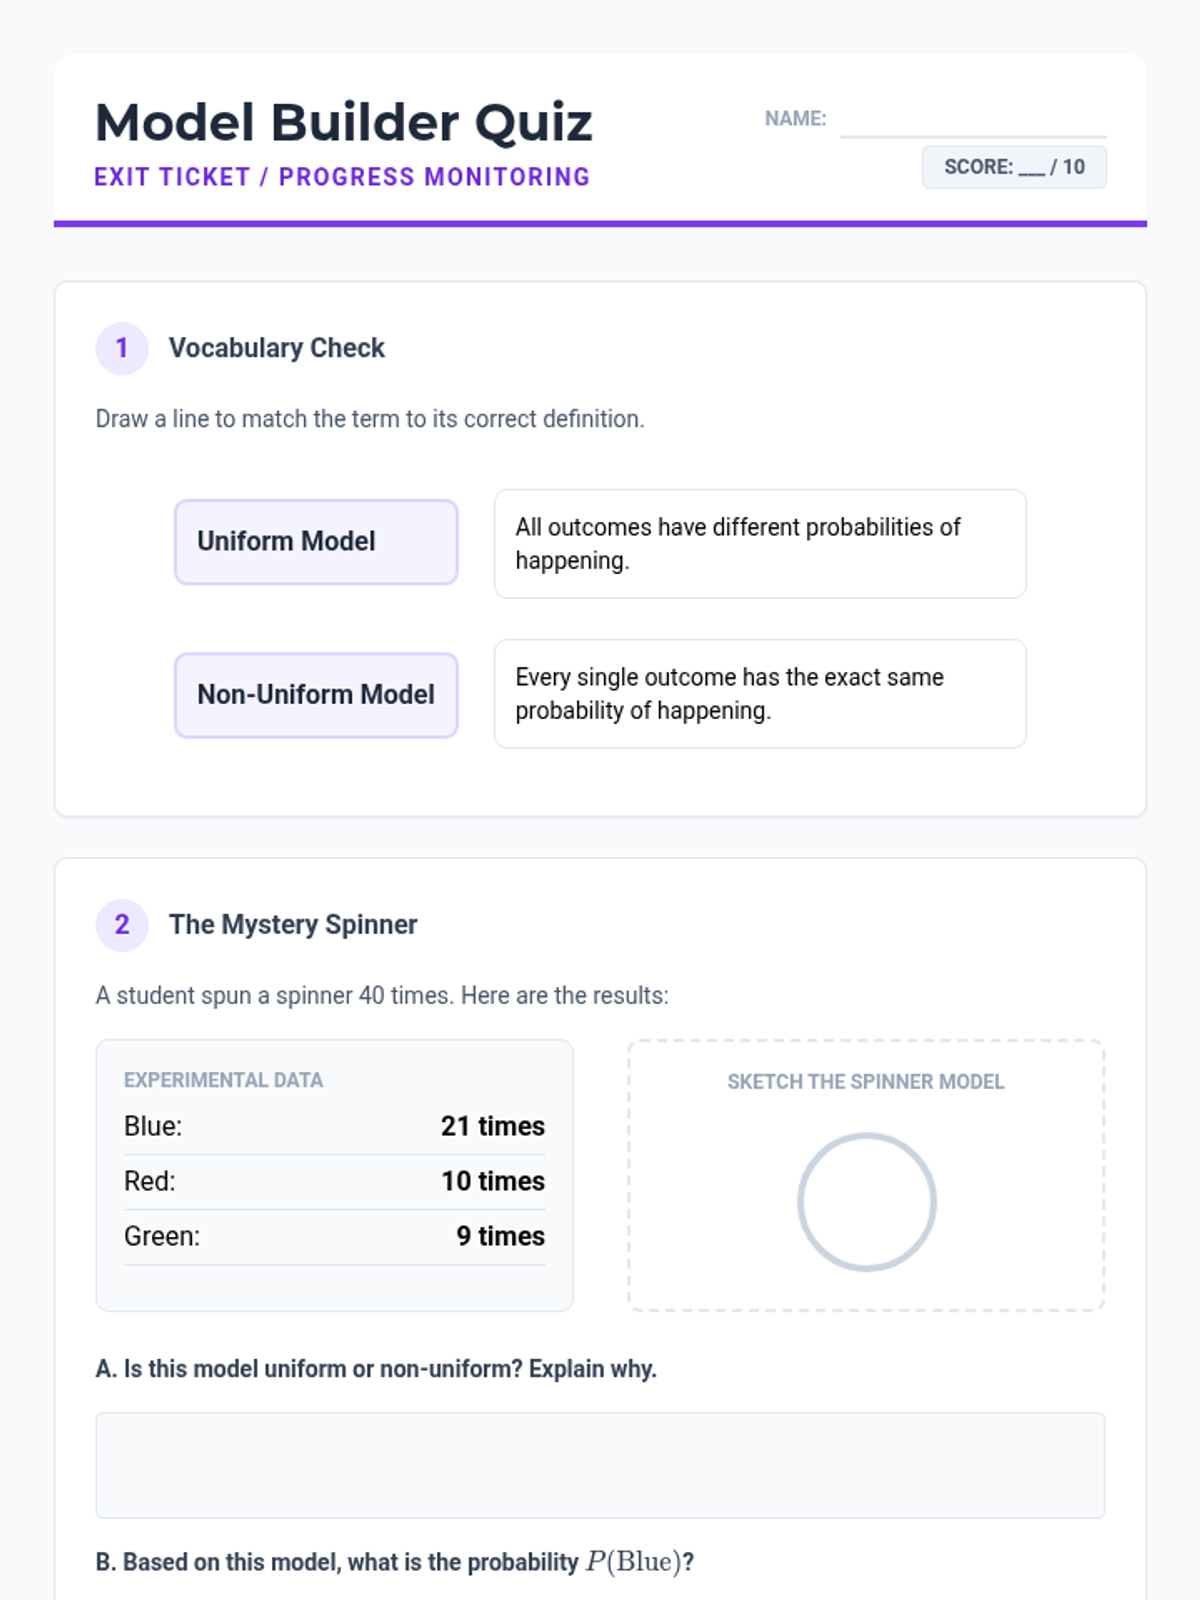
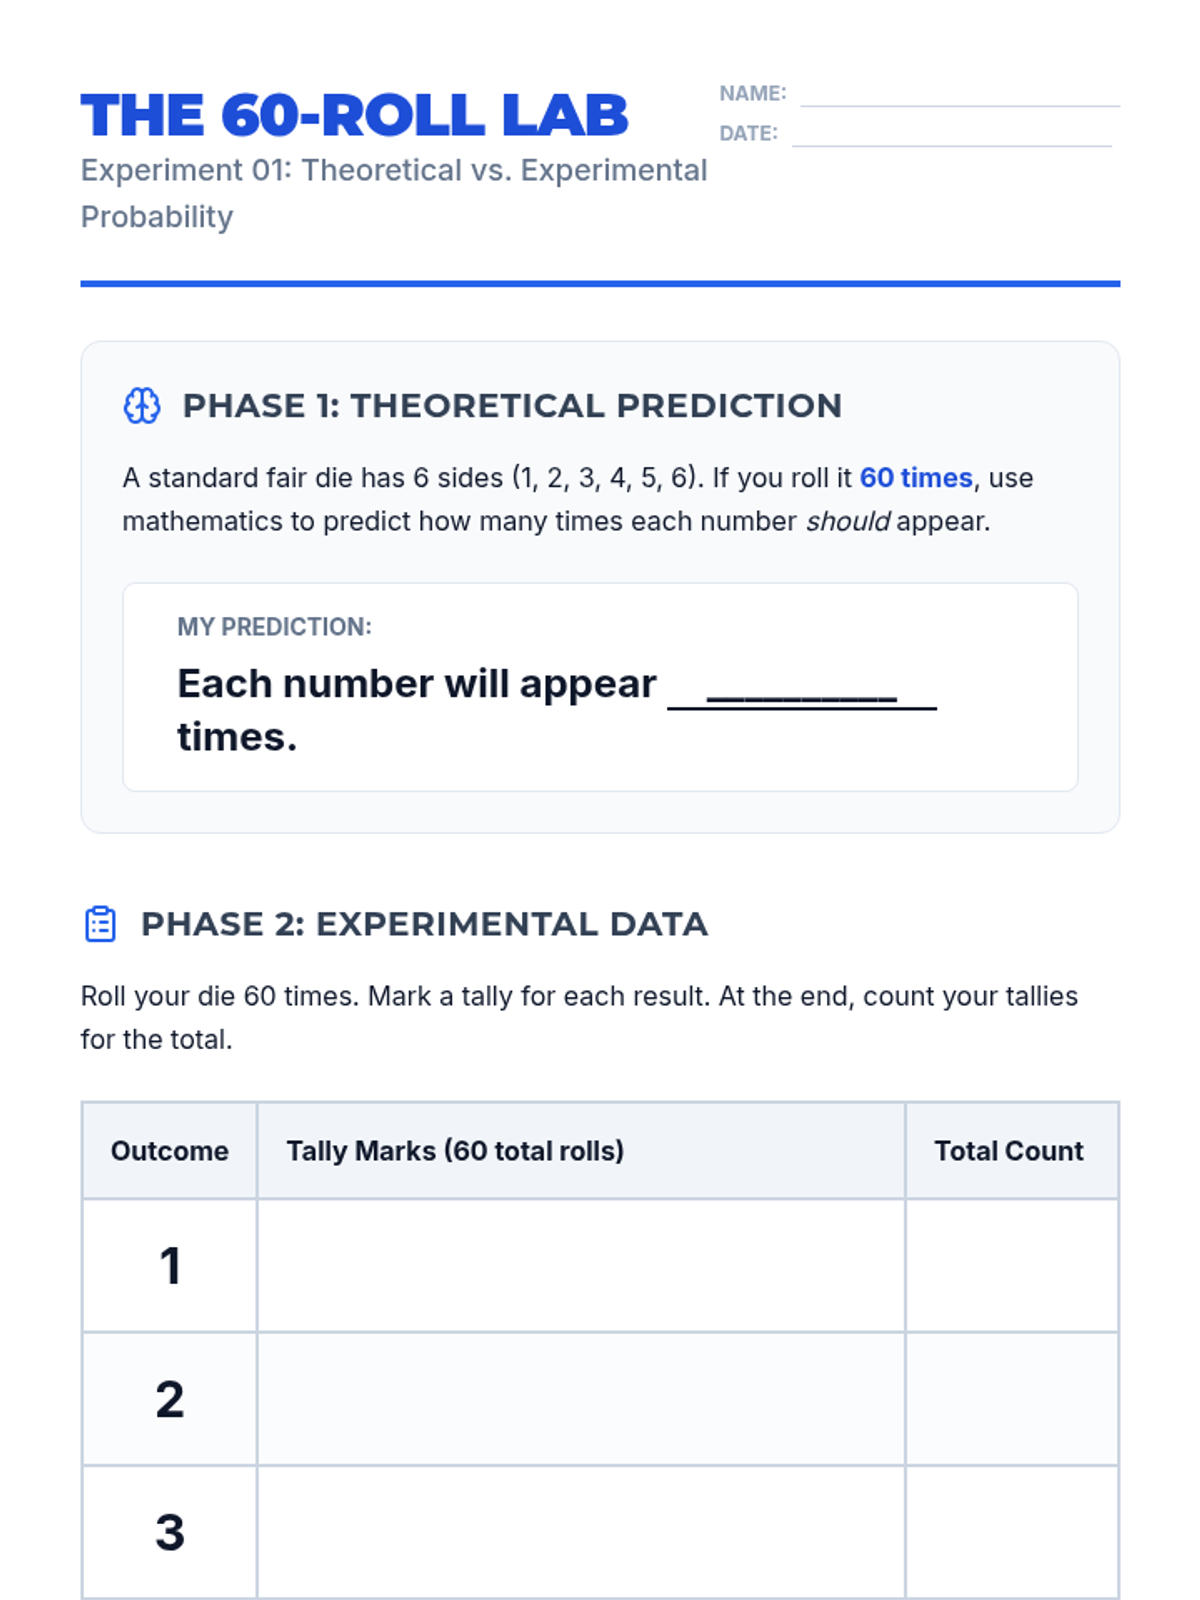
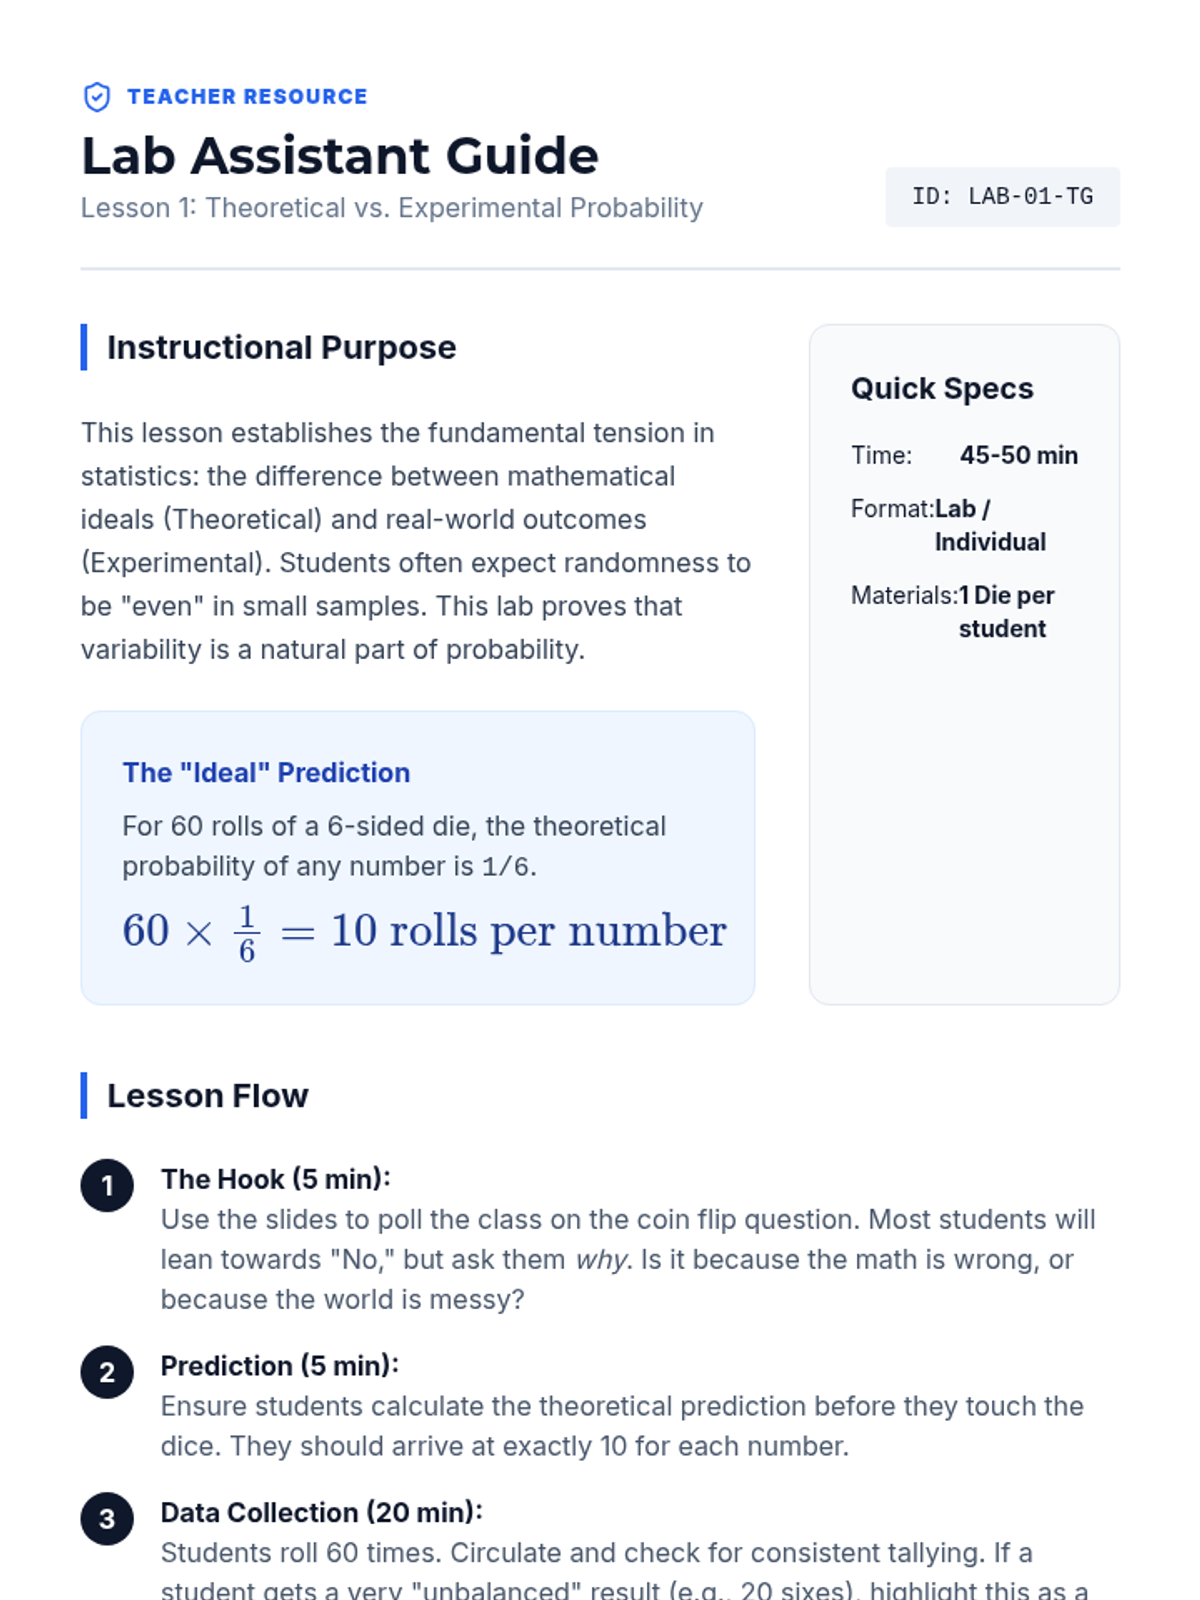
A Tier 2 intervention sequence focused on uniform and non-uniform probability models. Students use fair and weighted dice to compare theoretical models with experimental data, developing a deep understanding of why discrepancies occur.
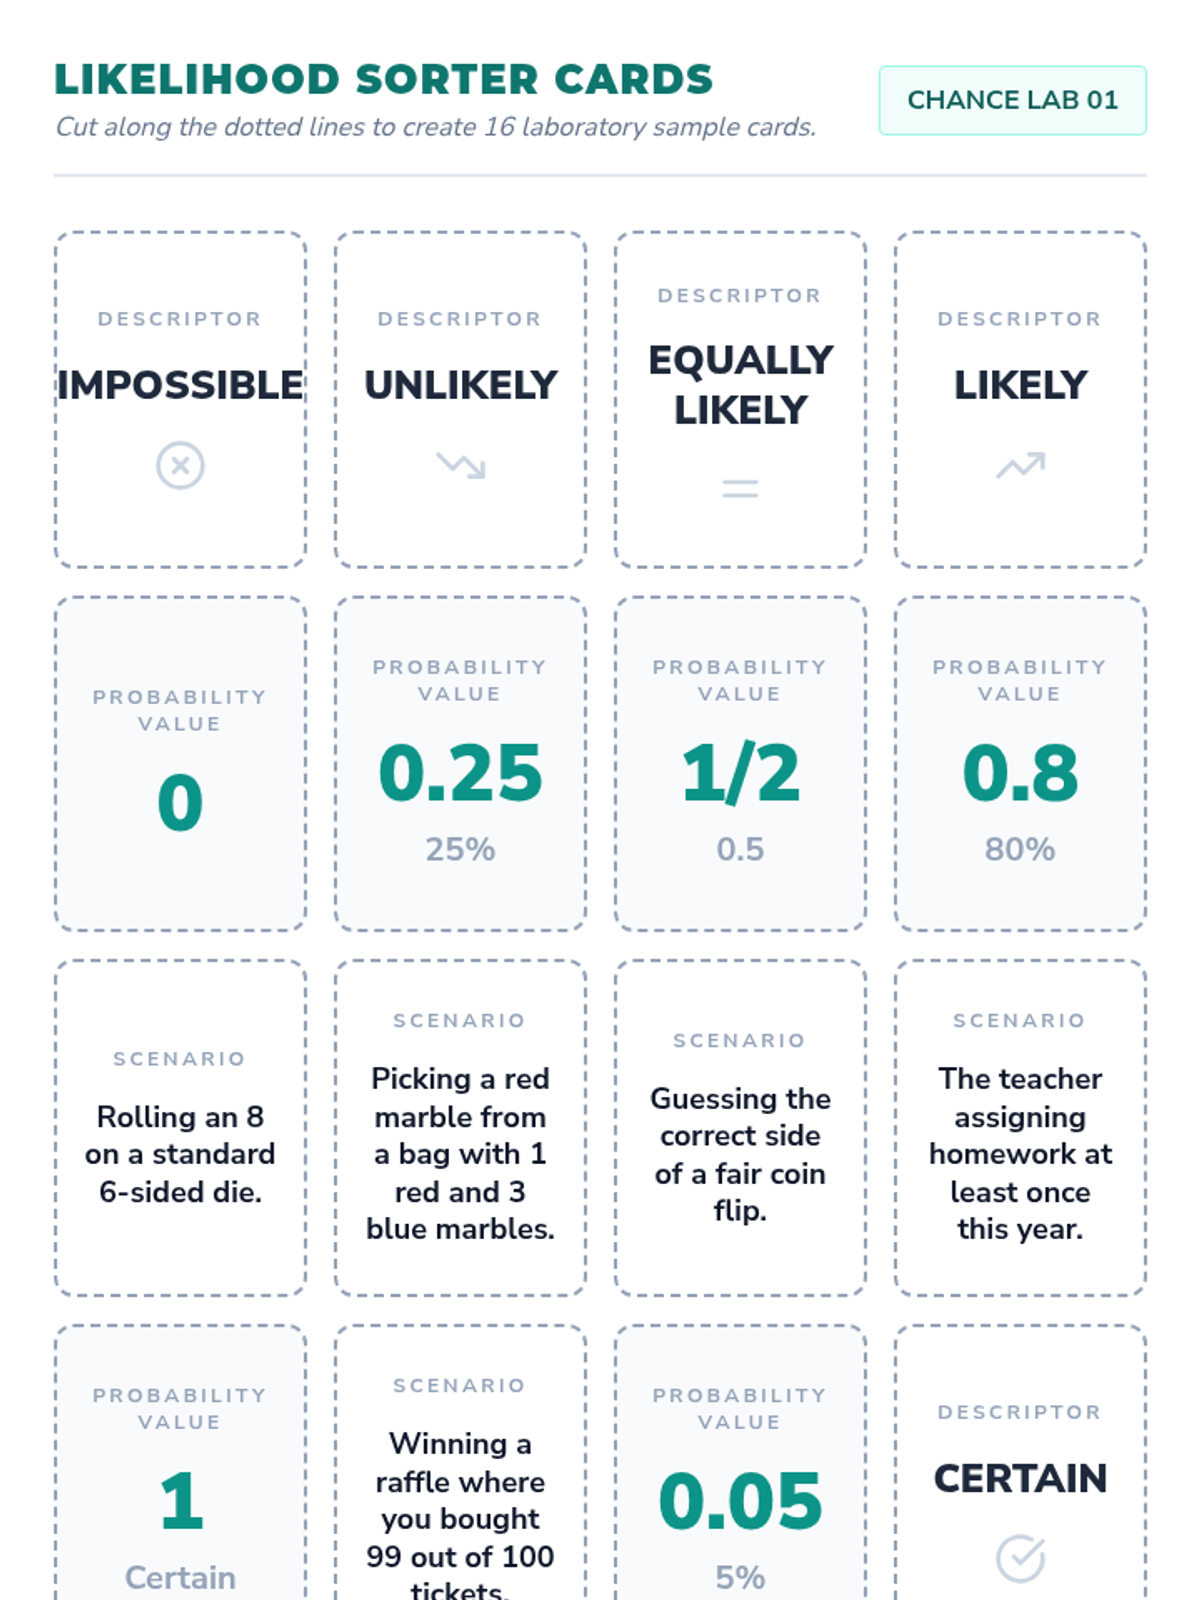
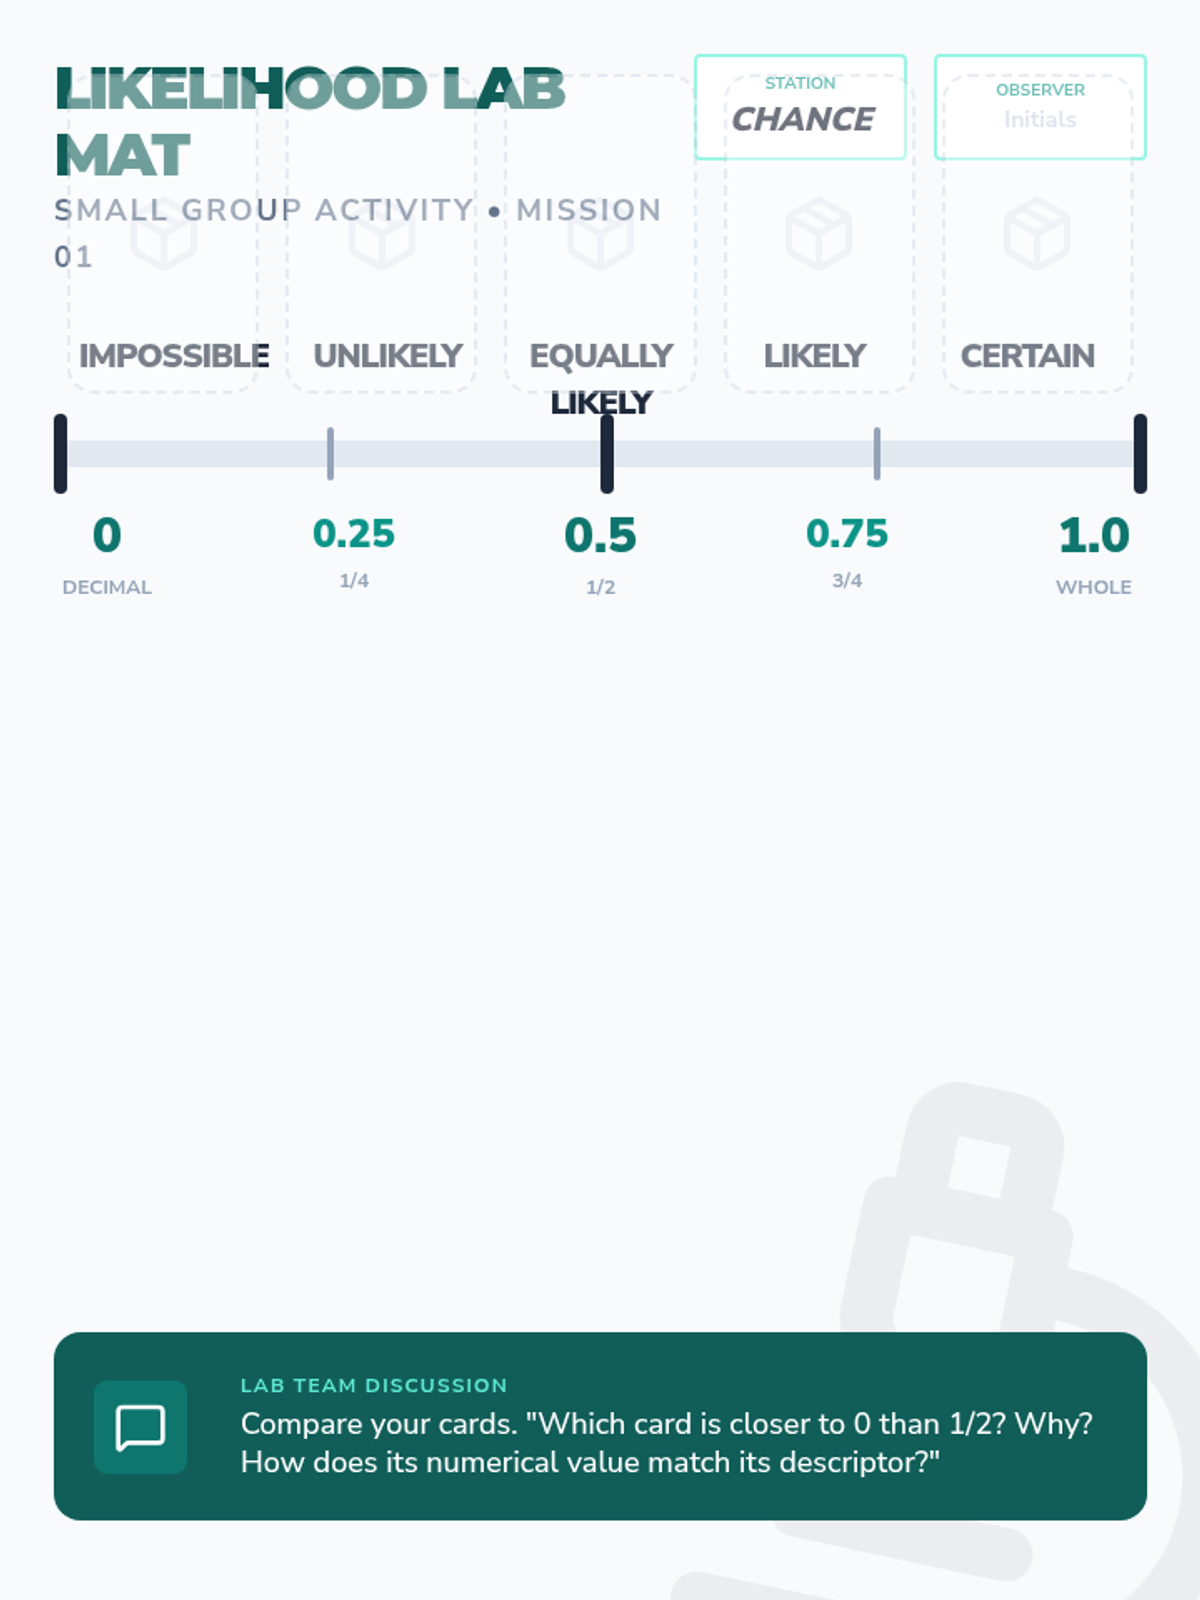
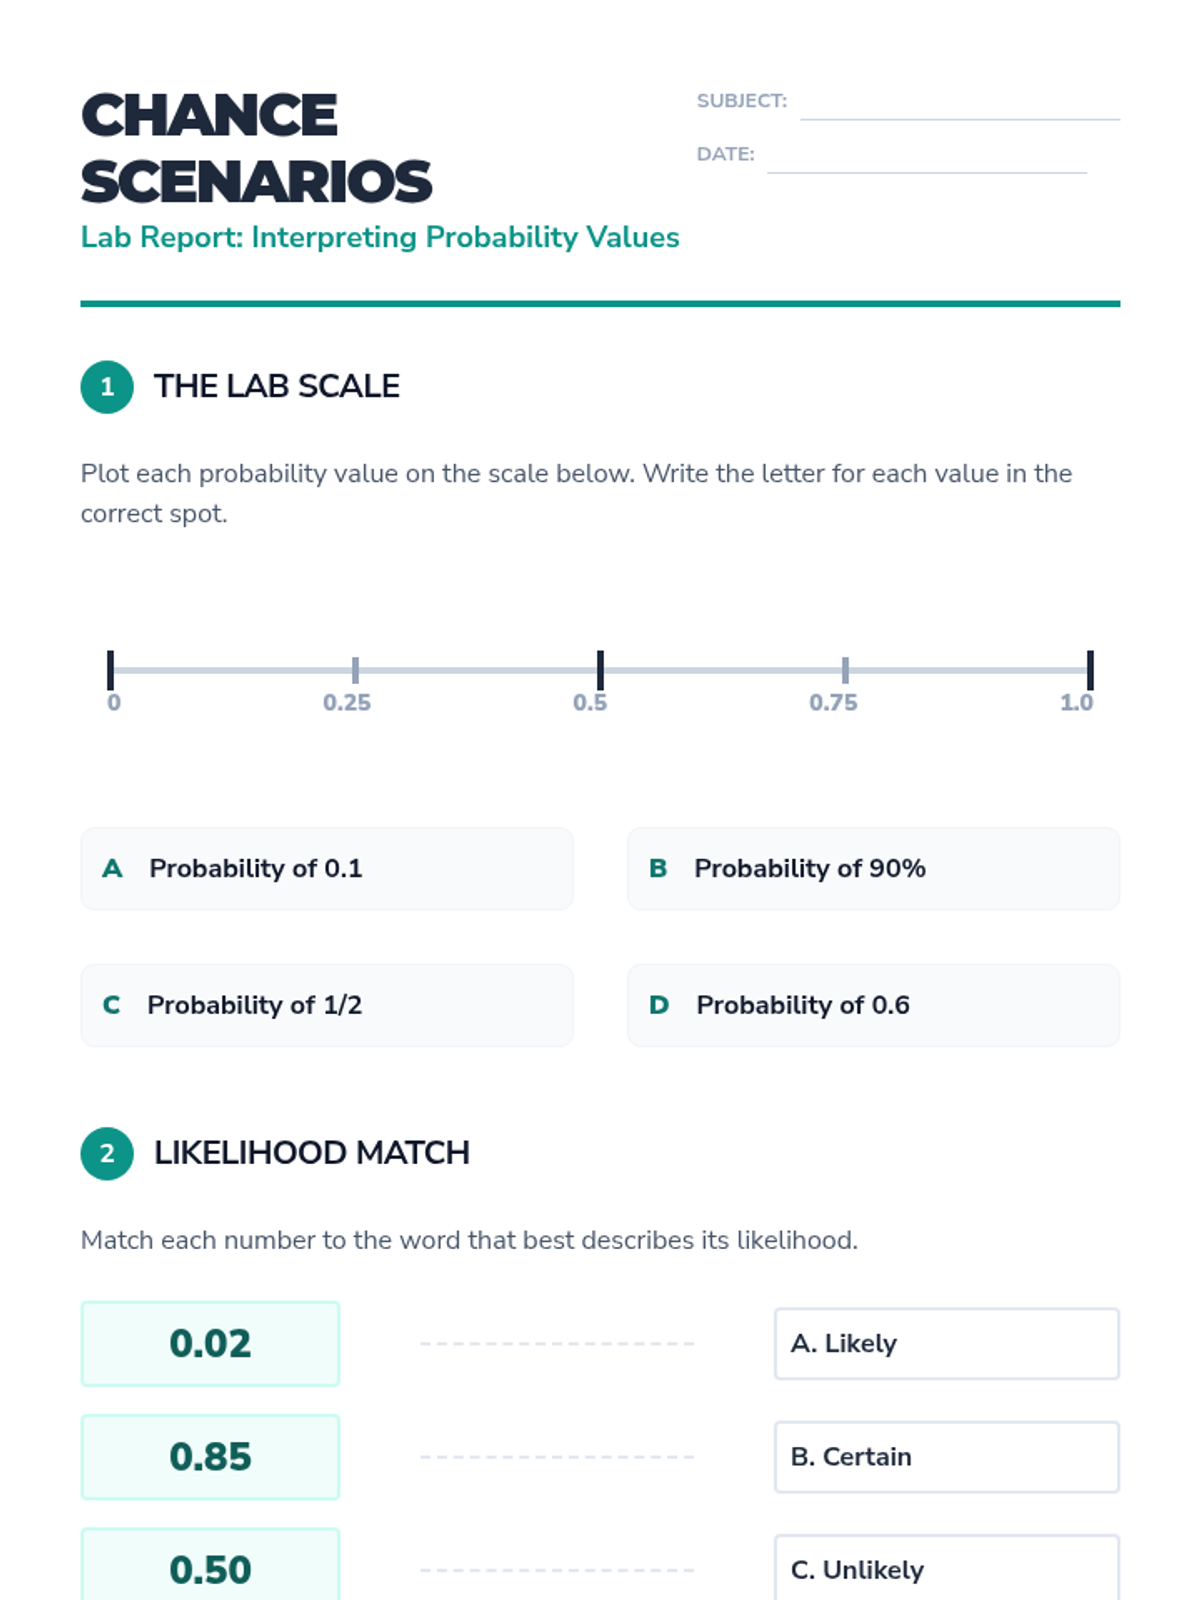
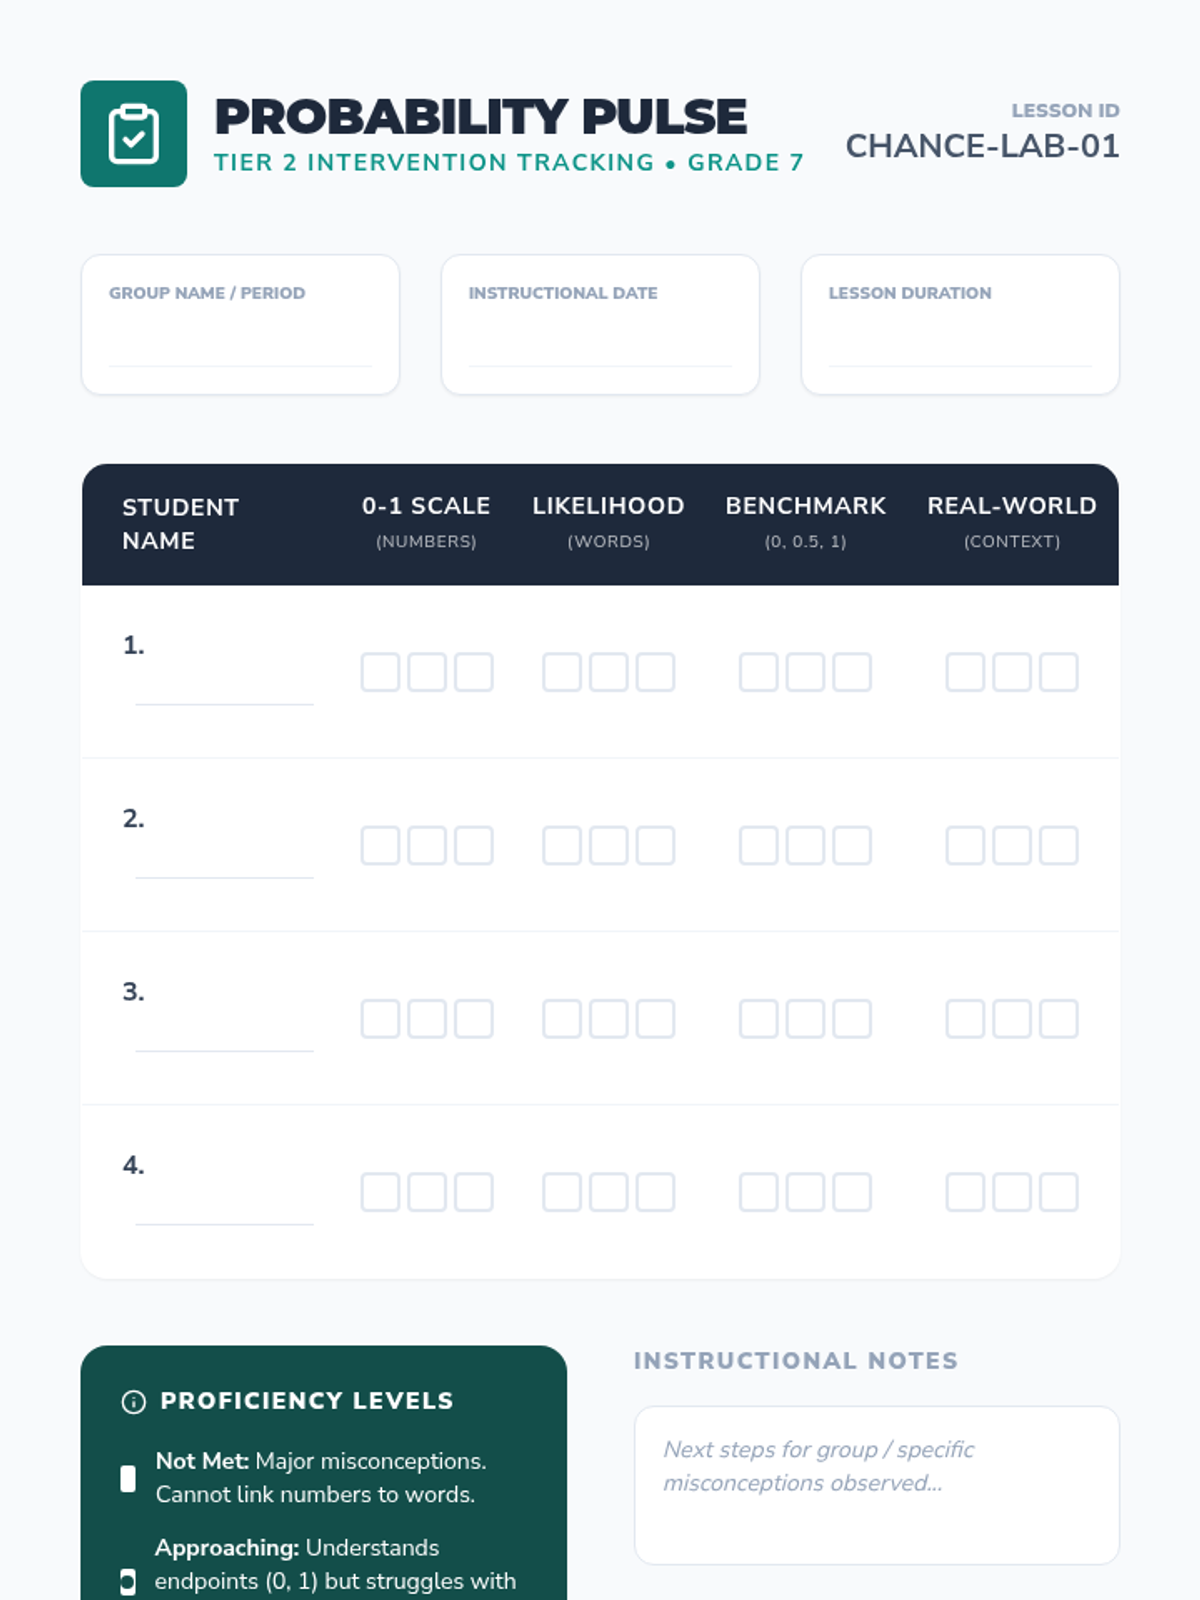
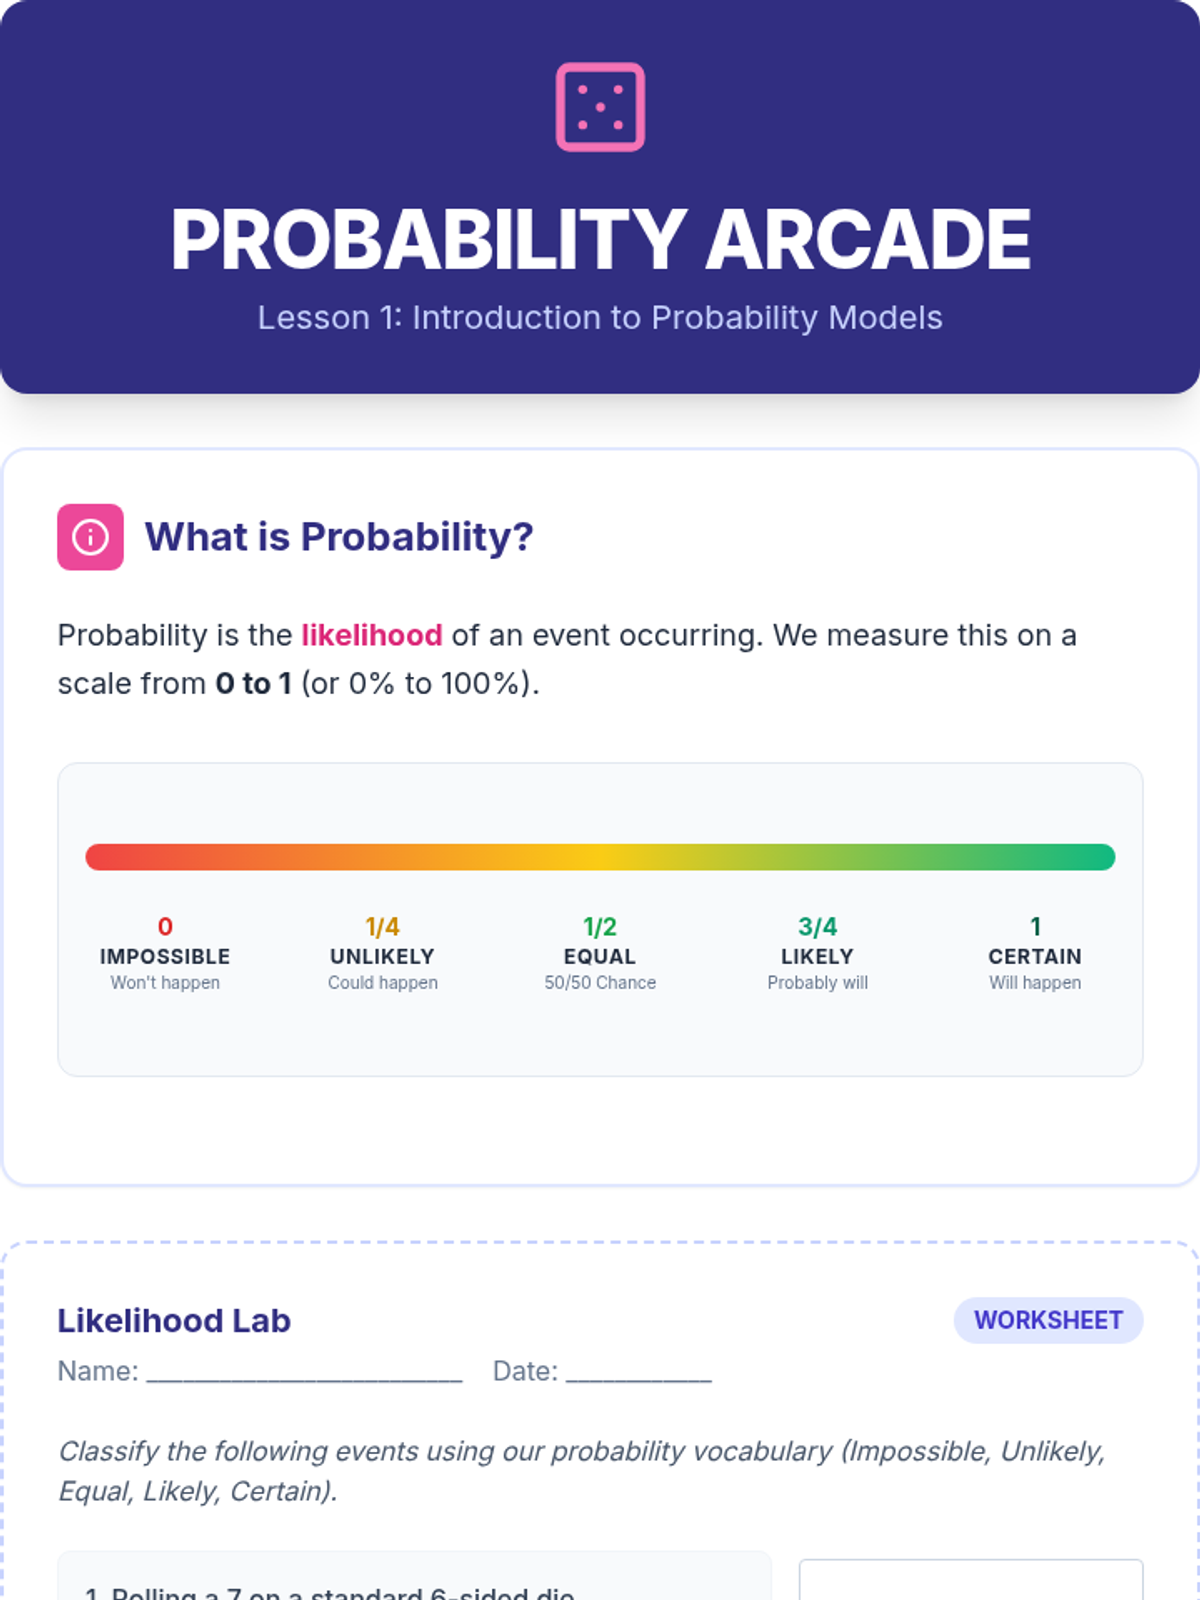
A Tier 2 intervention sequence focused on foundational probability concepts for 7th grade, specifically interpreting the 0-1 scale and real-world likelihood.
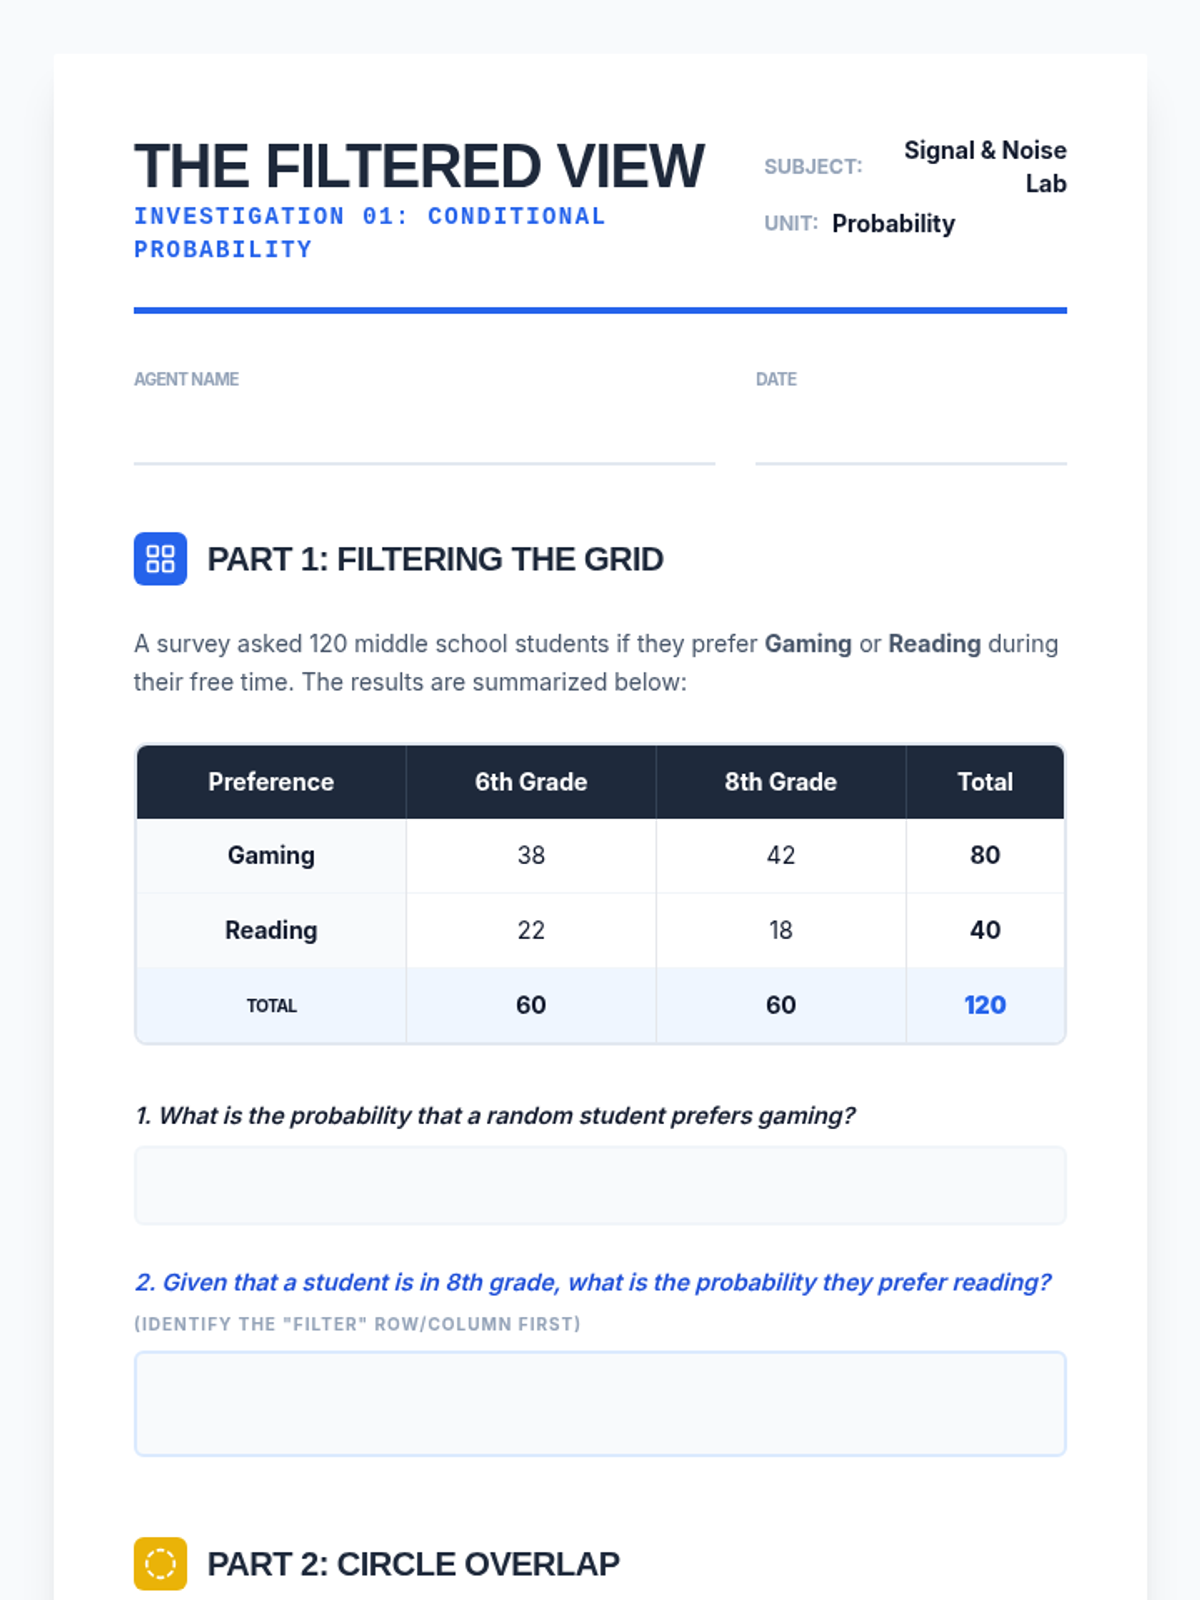
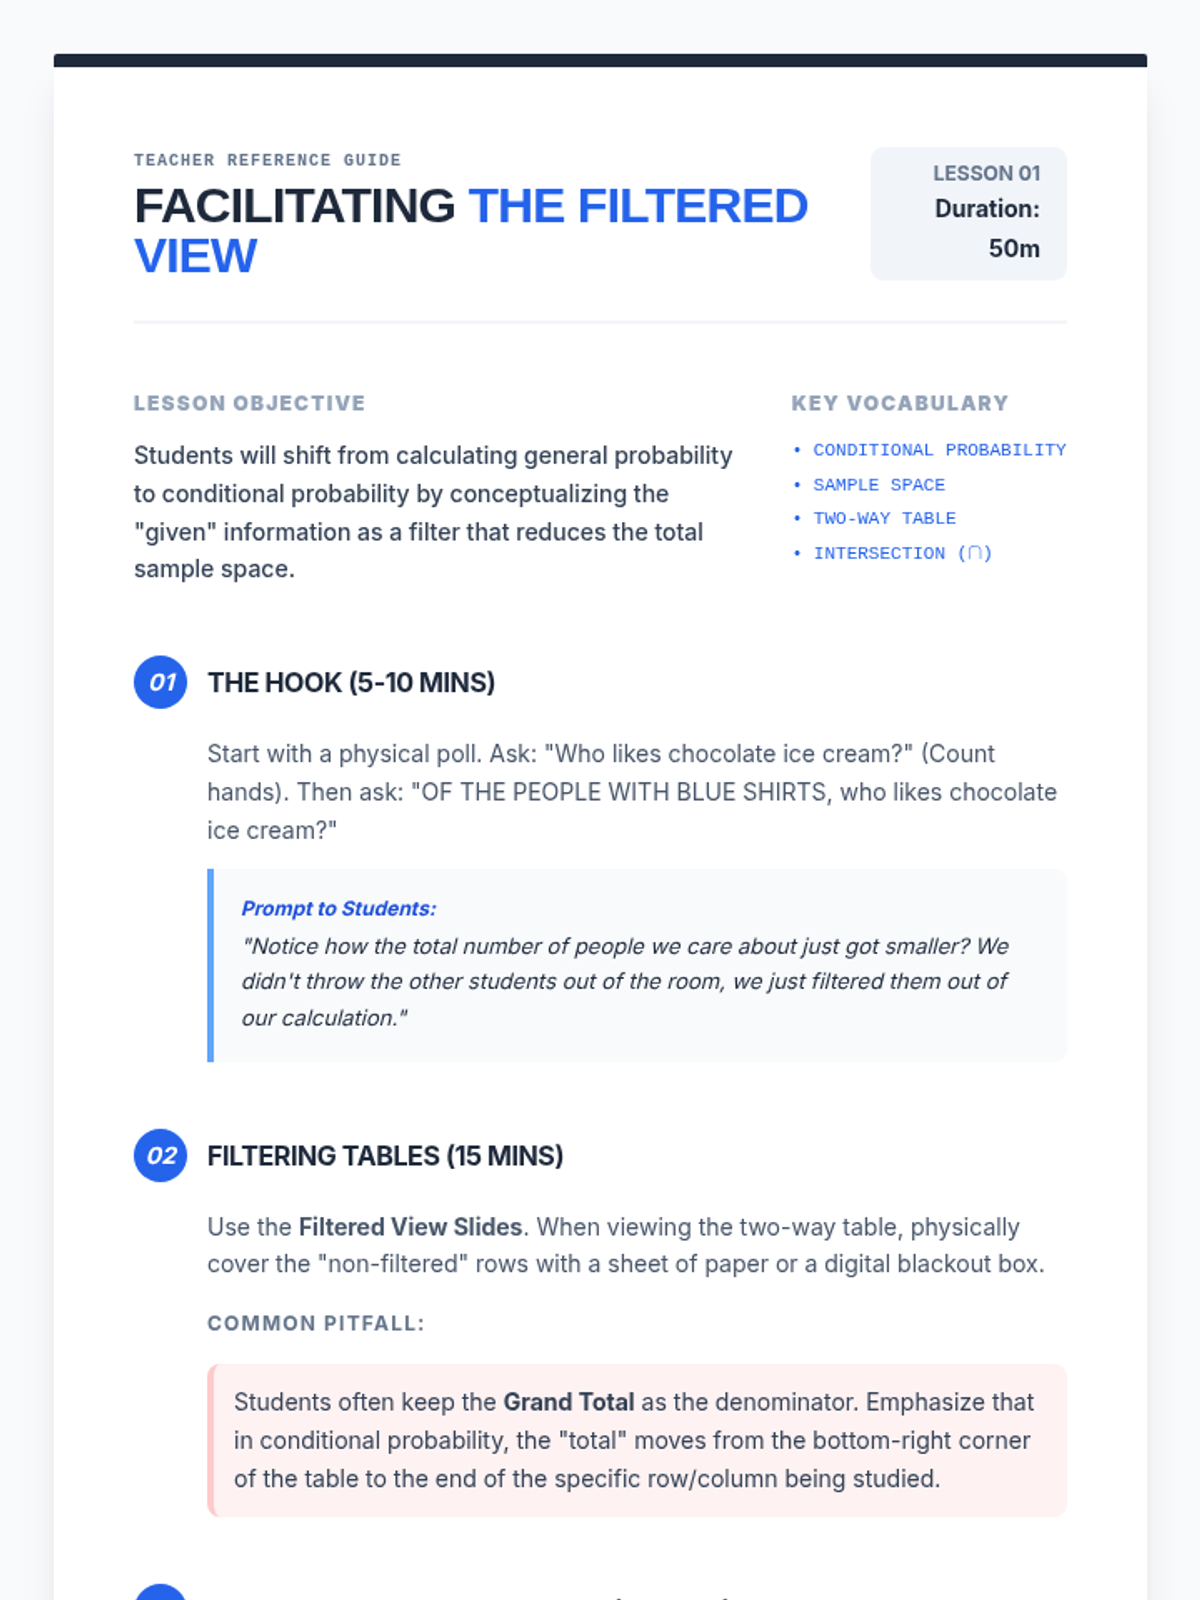
This sequence explores conditional probability and the reliability of tests using frequency trees and area models. Students investigate 'false positives' and 'false negatives' in real-world contexts like medical testing and spam filters, ultimately debating the ethical implications of screening policies.
A 5-lesson sequence for 7th graders exploring the relationship between theoretical probability and experimental results, culminating in Bayesian-style predictive updates and simulations. Students move from simple dice rolls to complex forecasting scenarios.
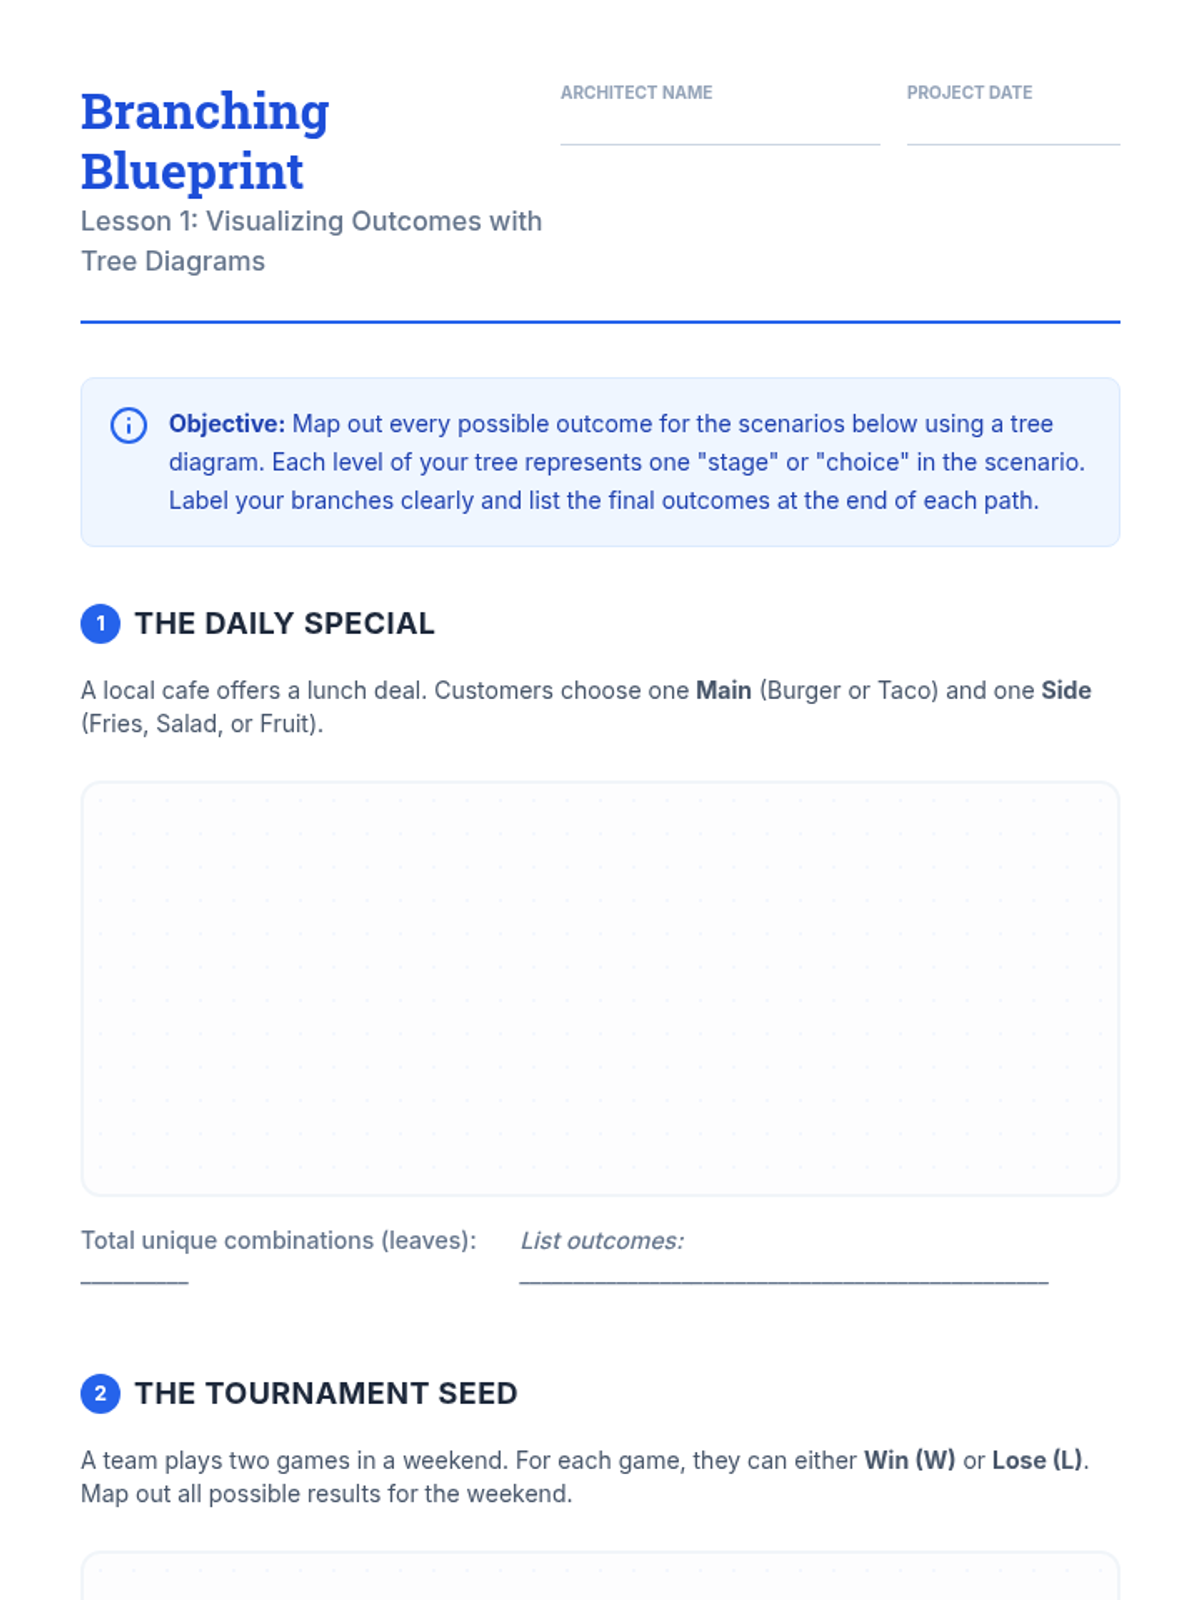
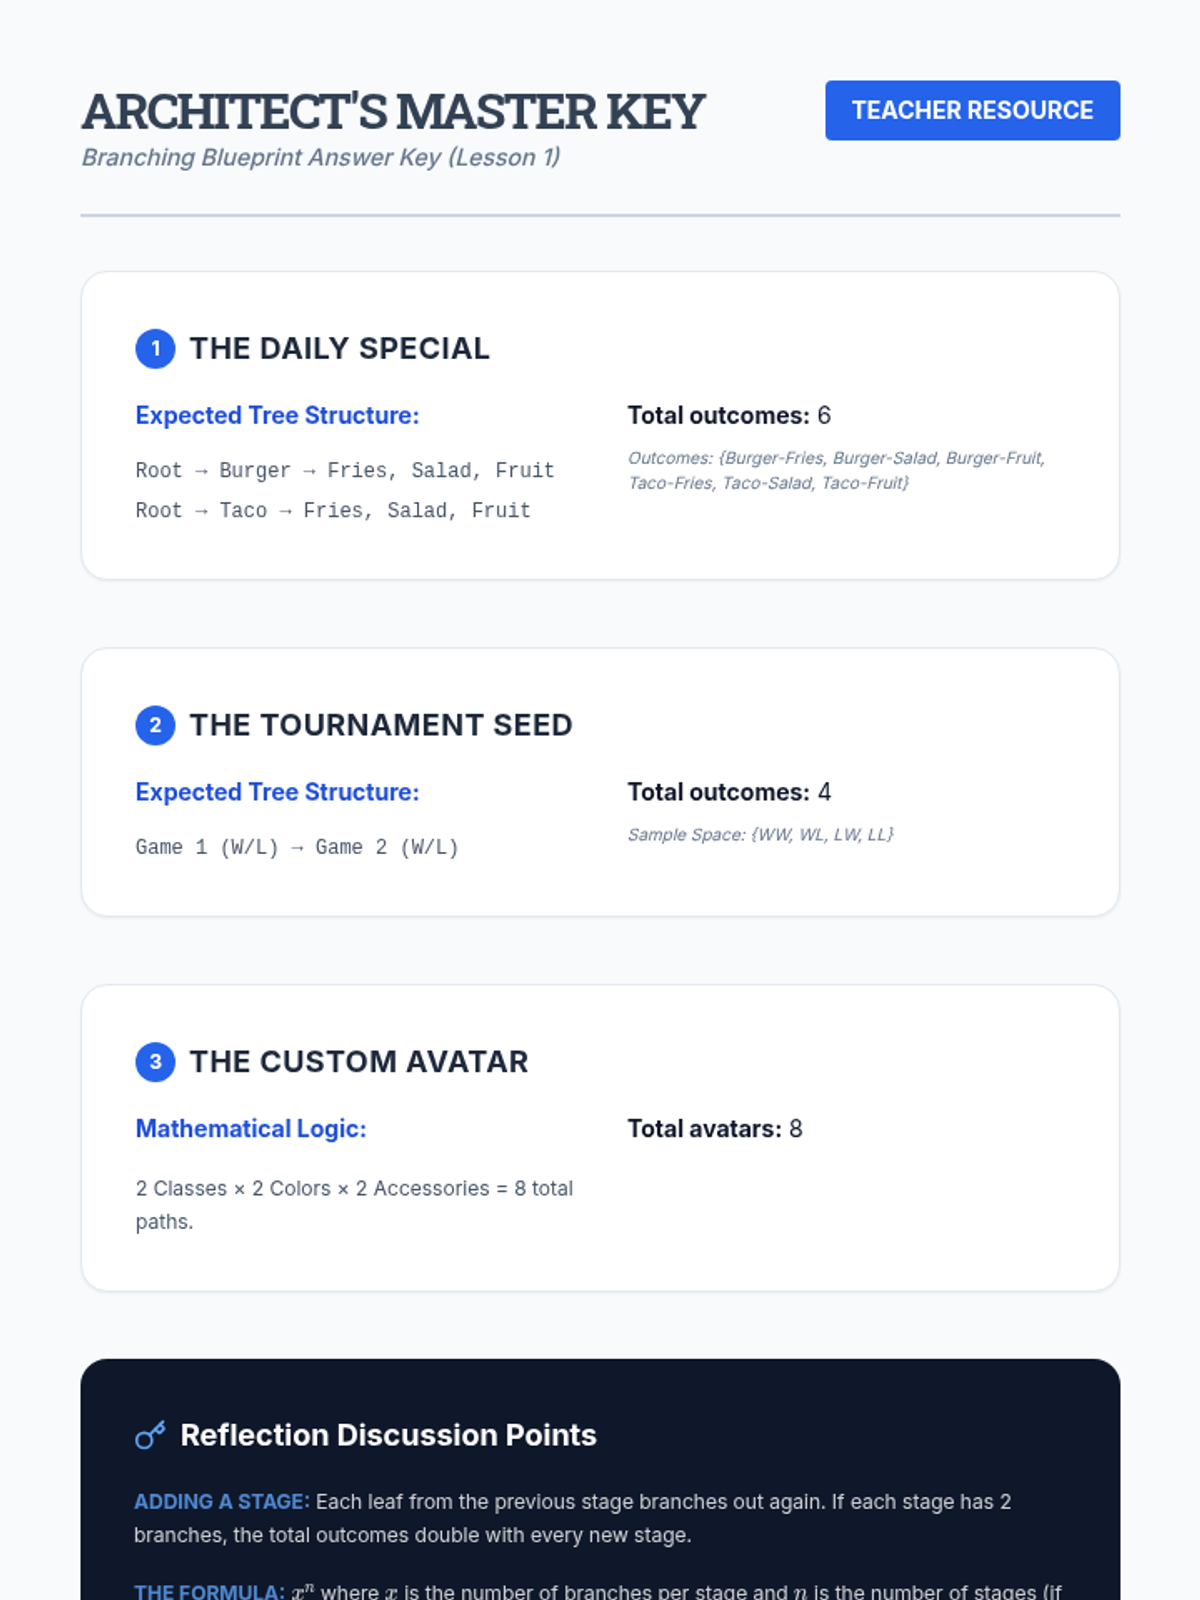
This sequence guides students through the visualization and calculation of compound probabilities using tree diagrams. Students progress from basic branching to analyzing complex real-world decisions involving dependent and independent events.
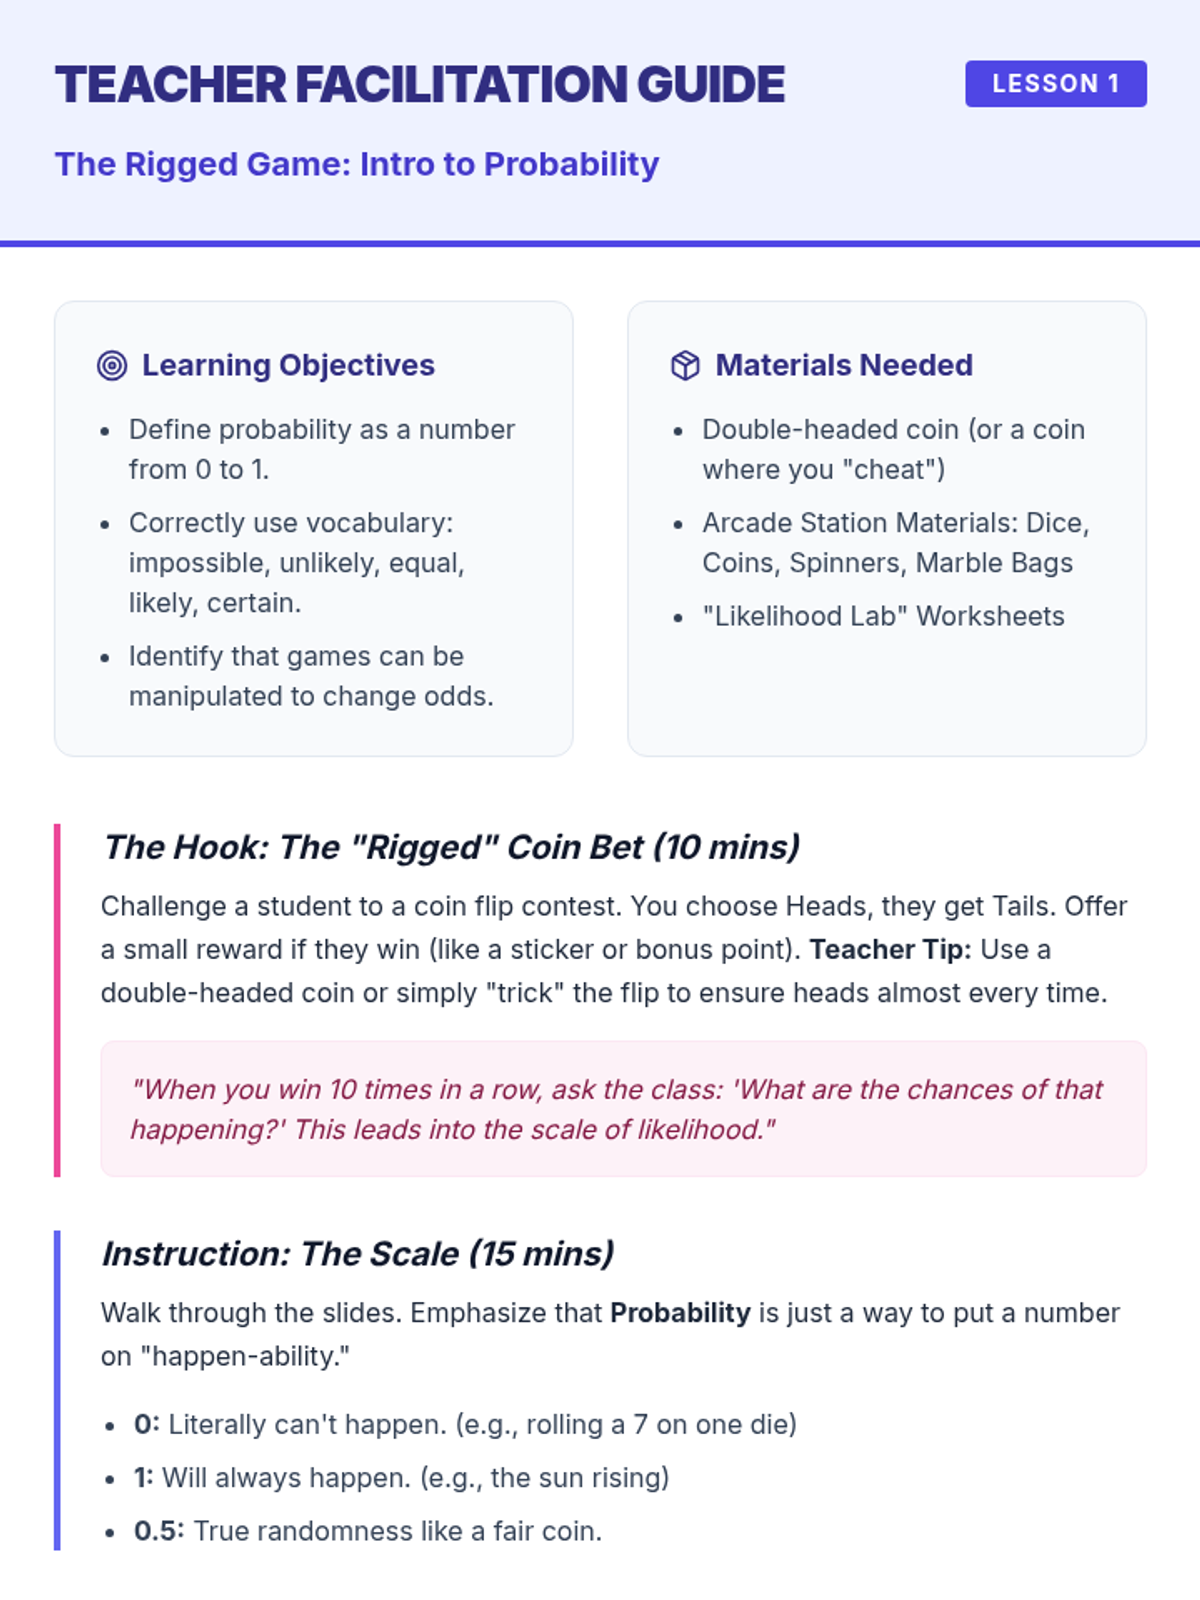
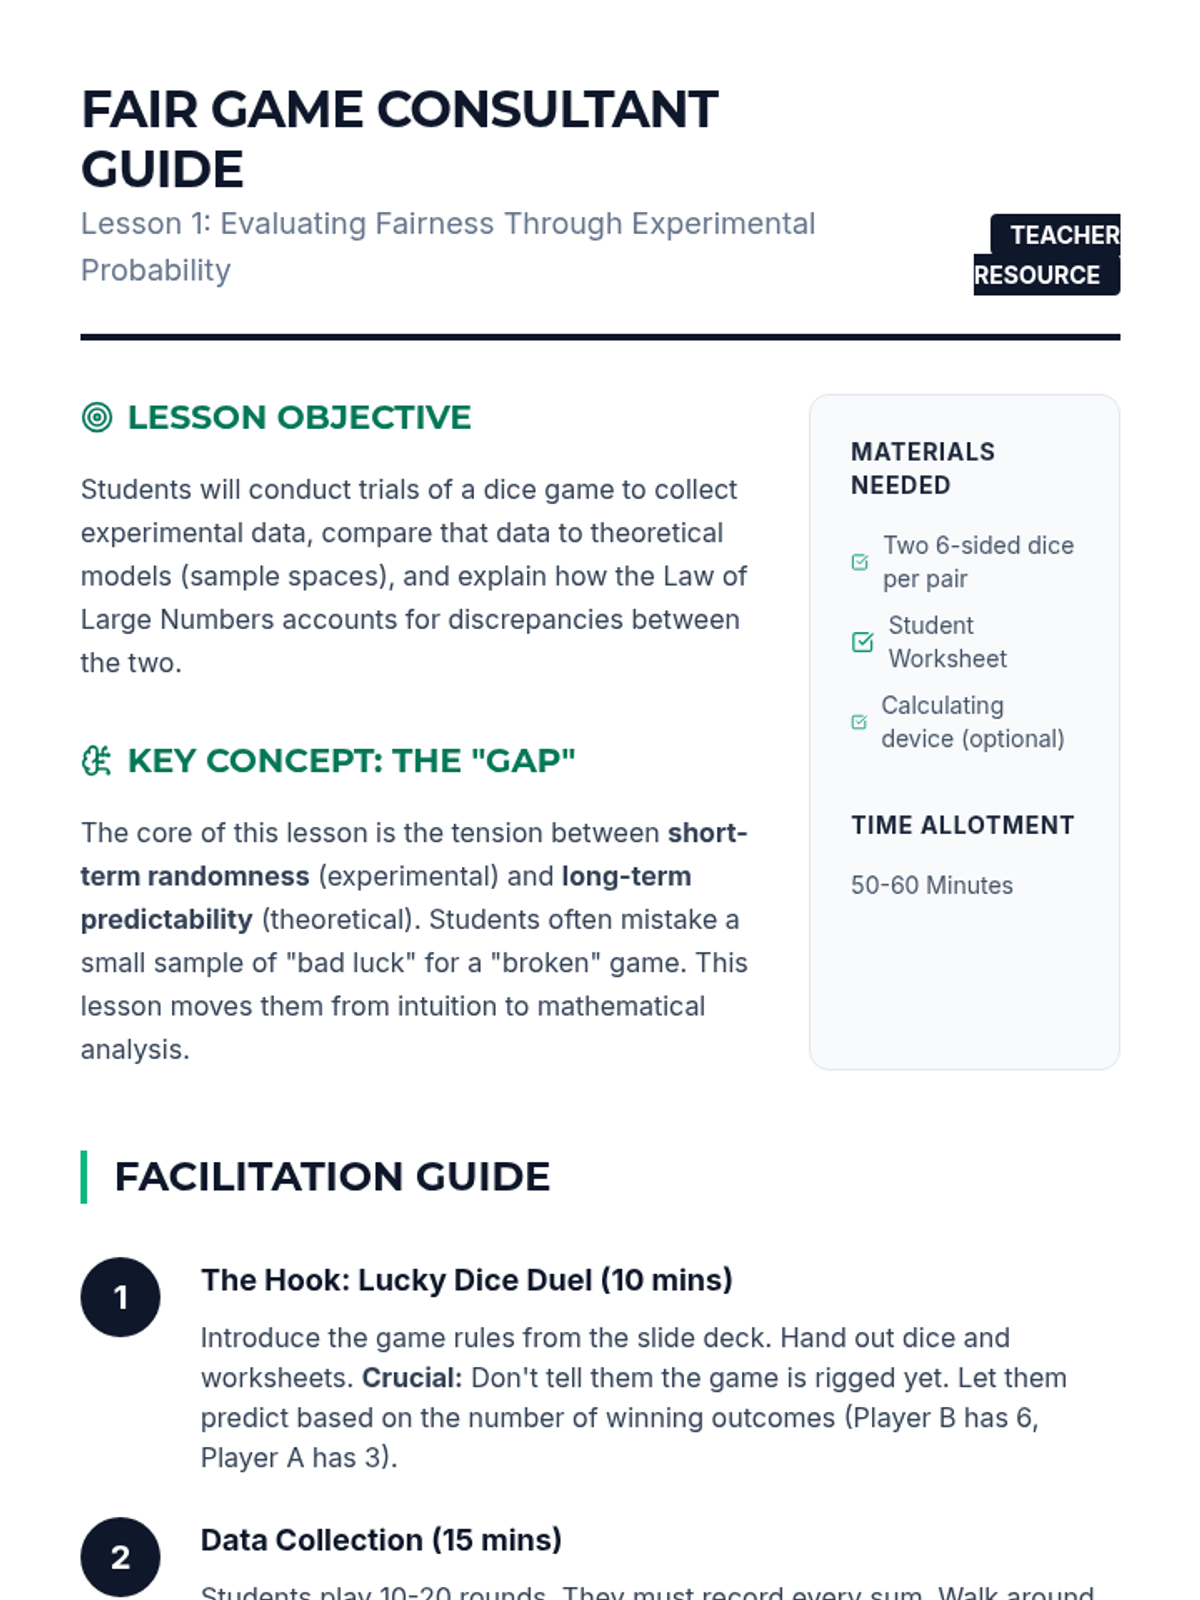
A comprehensive 7th-grade unit exploring probability through game design, where students move from understanding basic likelihood to analyzing mathematical fairness and building their own chance-based simulations.
This mastery-based sequence focuses on the algebraic side of probability, specifically utilizing the multiplication rule for complex problems. Students progress from visual models to abstract formulas, covering independent and dependent events, 'at least one' scenarios using complements, and mixed strategy application.
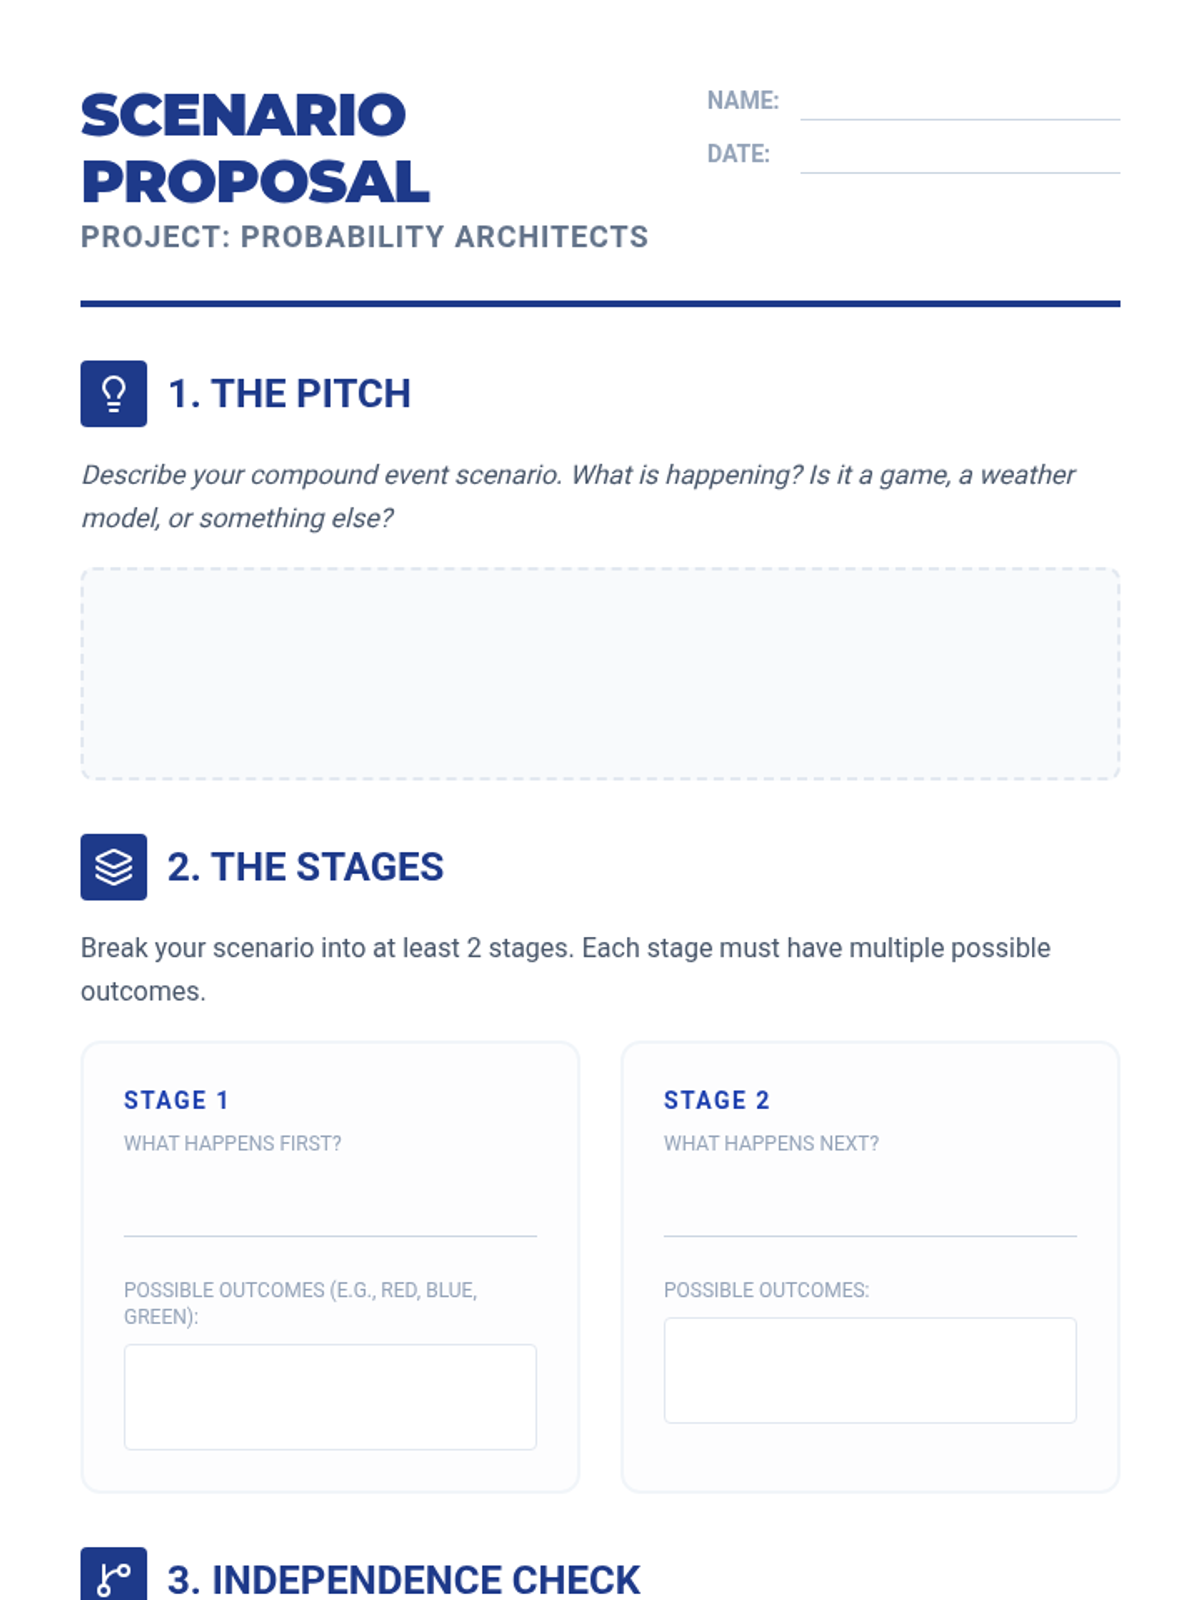
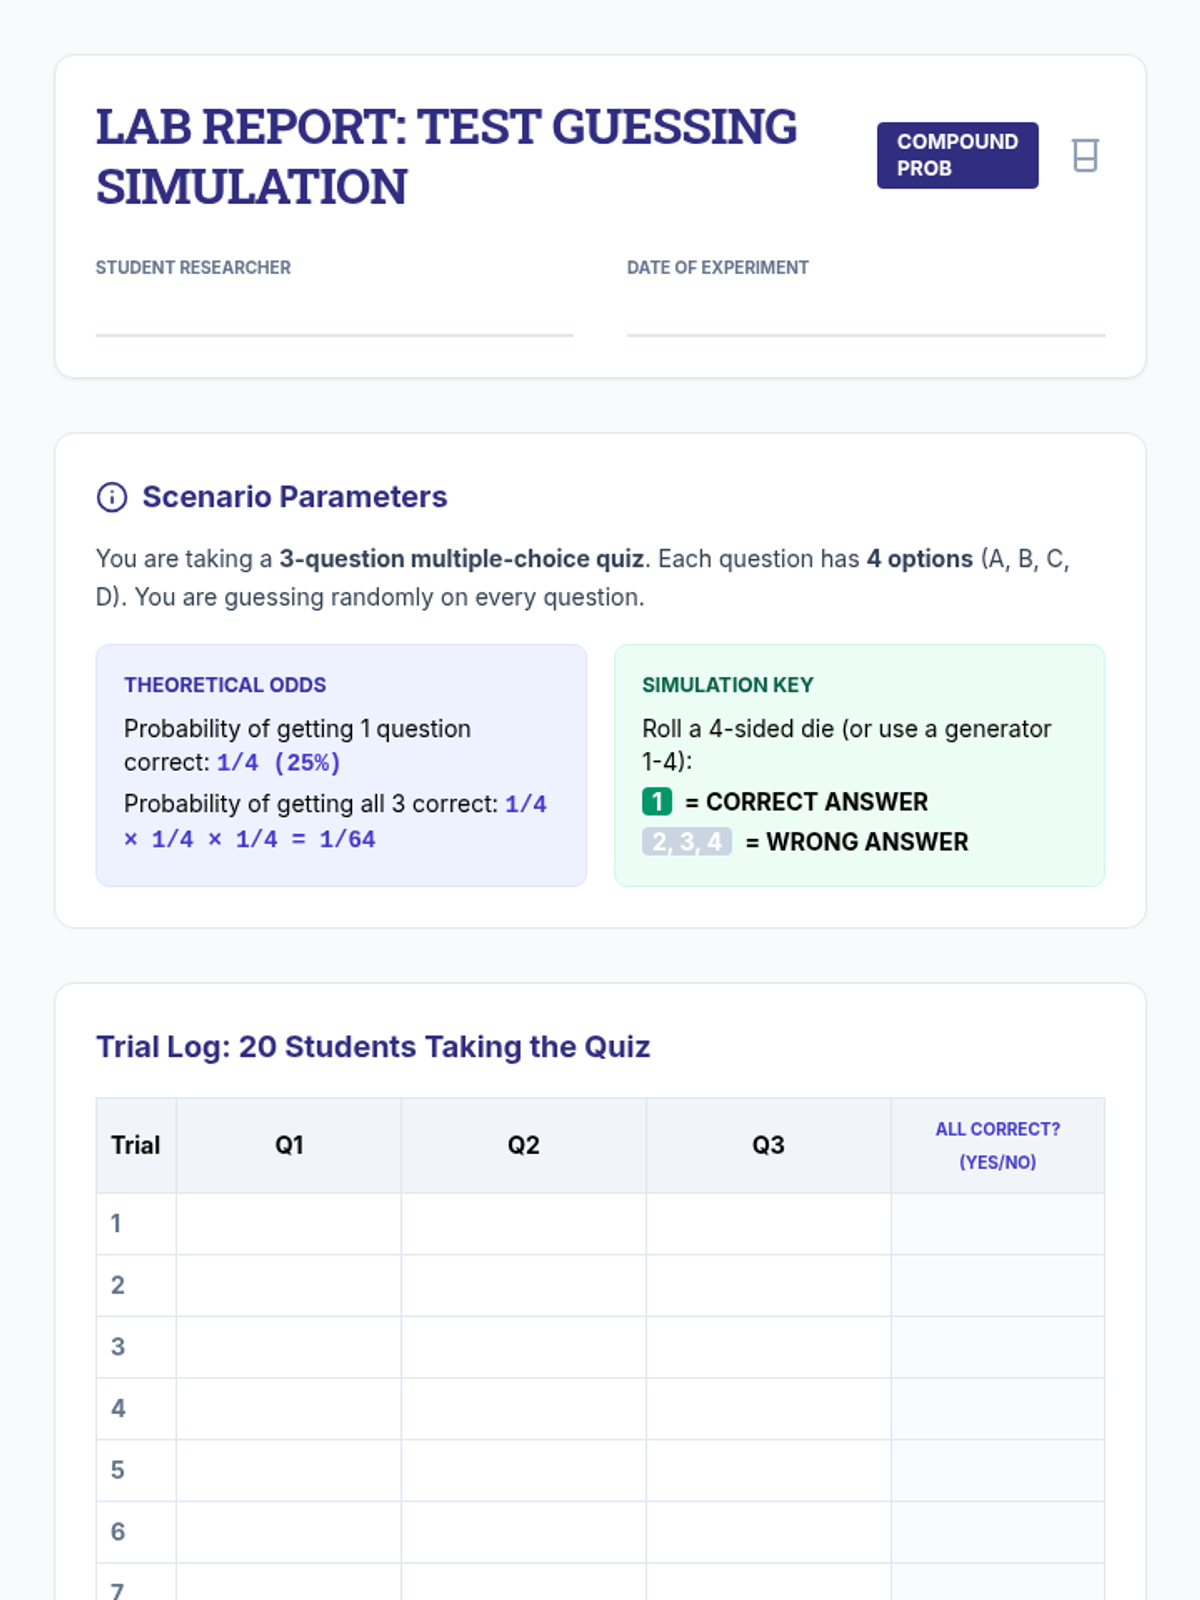
Students act as game designers to create, calculate, and simulate compound probability models. They move from brainstorming scenarios to analyzing experimental data, culminating in a gallery walk showcase.
This 7th-grade sequence explores compound probability and simulations, connecting mathematical models to genetics, sports, and weather forecasting. Students move from basic simulations to designing their own complex models for real-world scenarios.
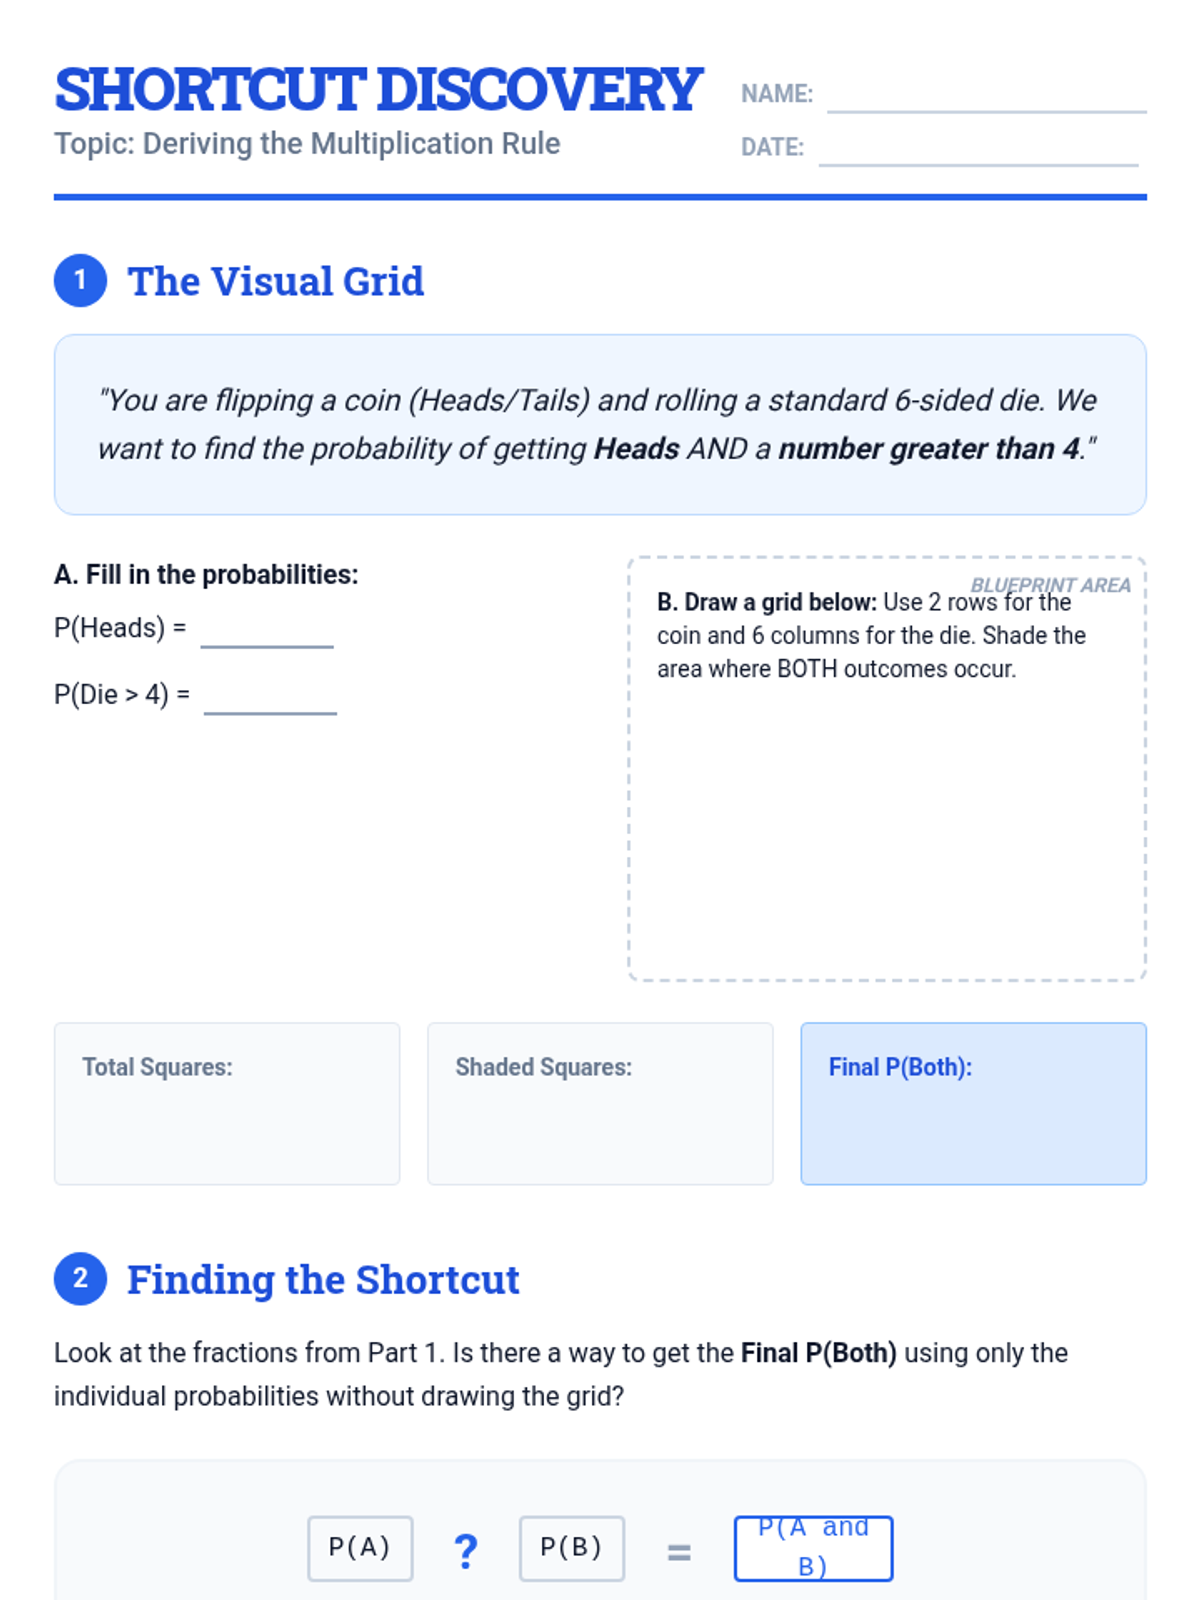
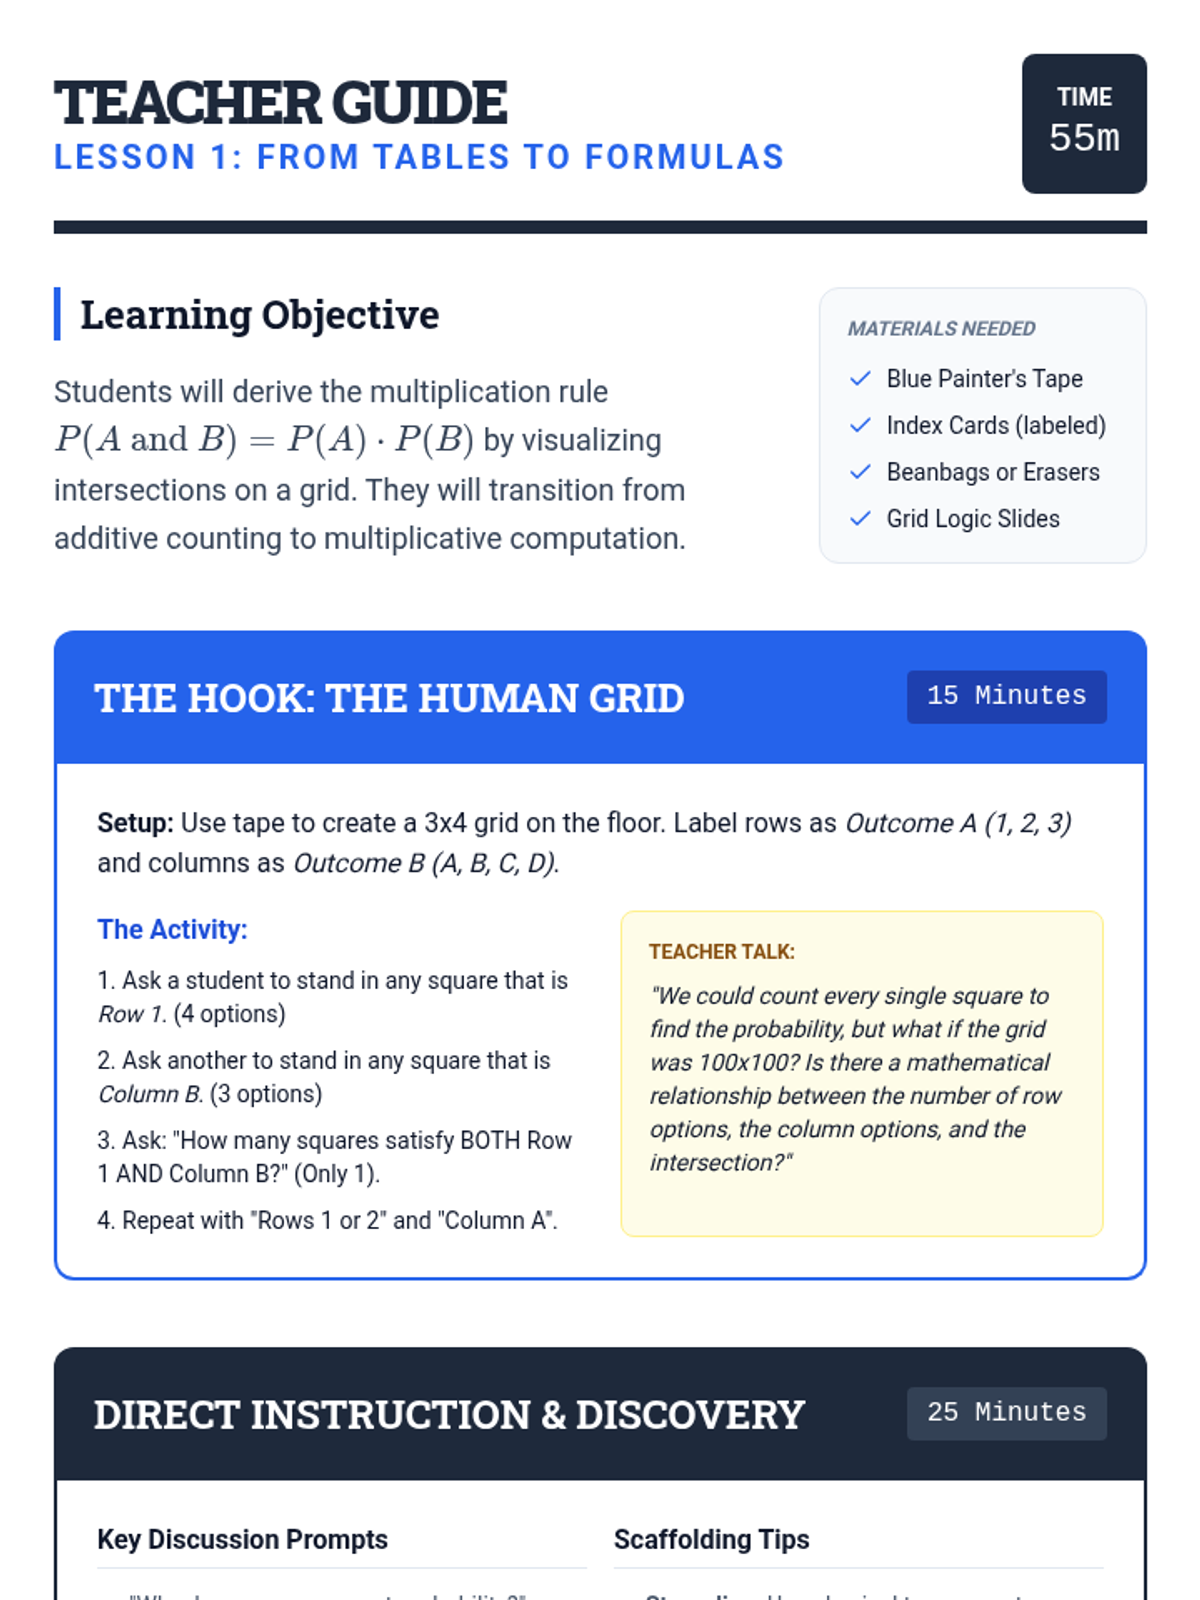
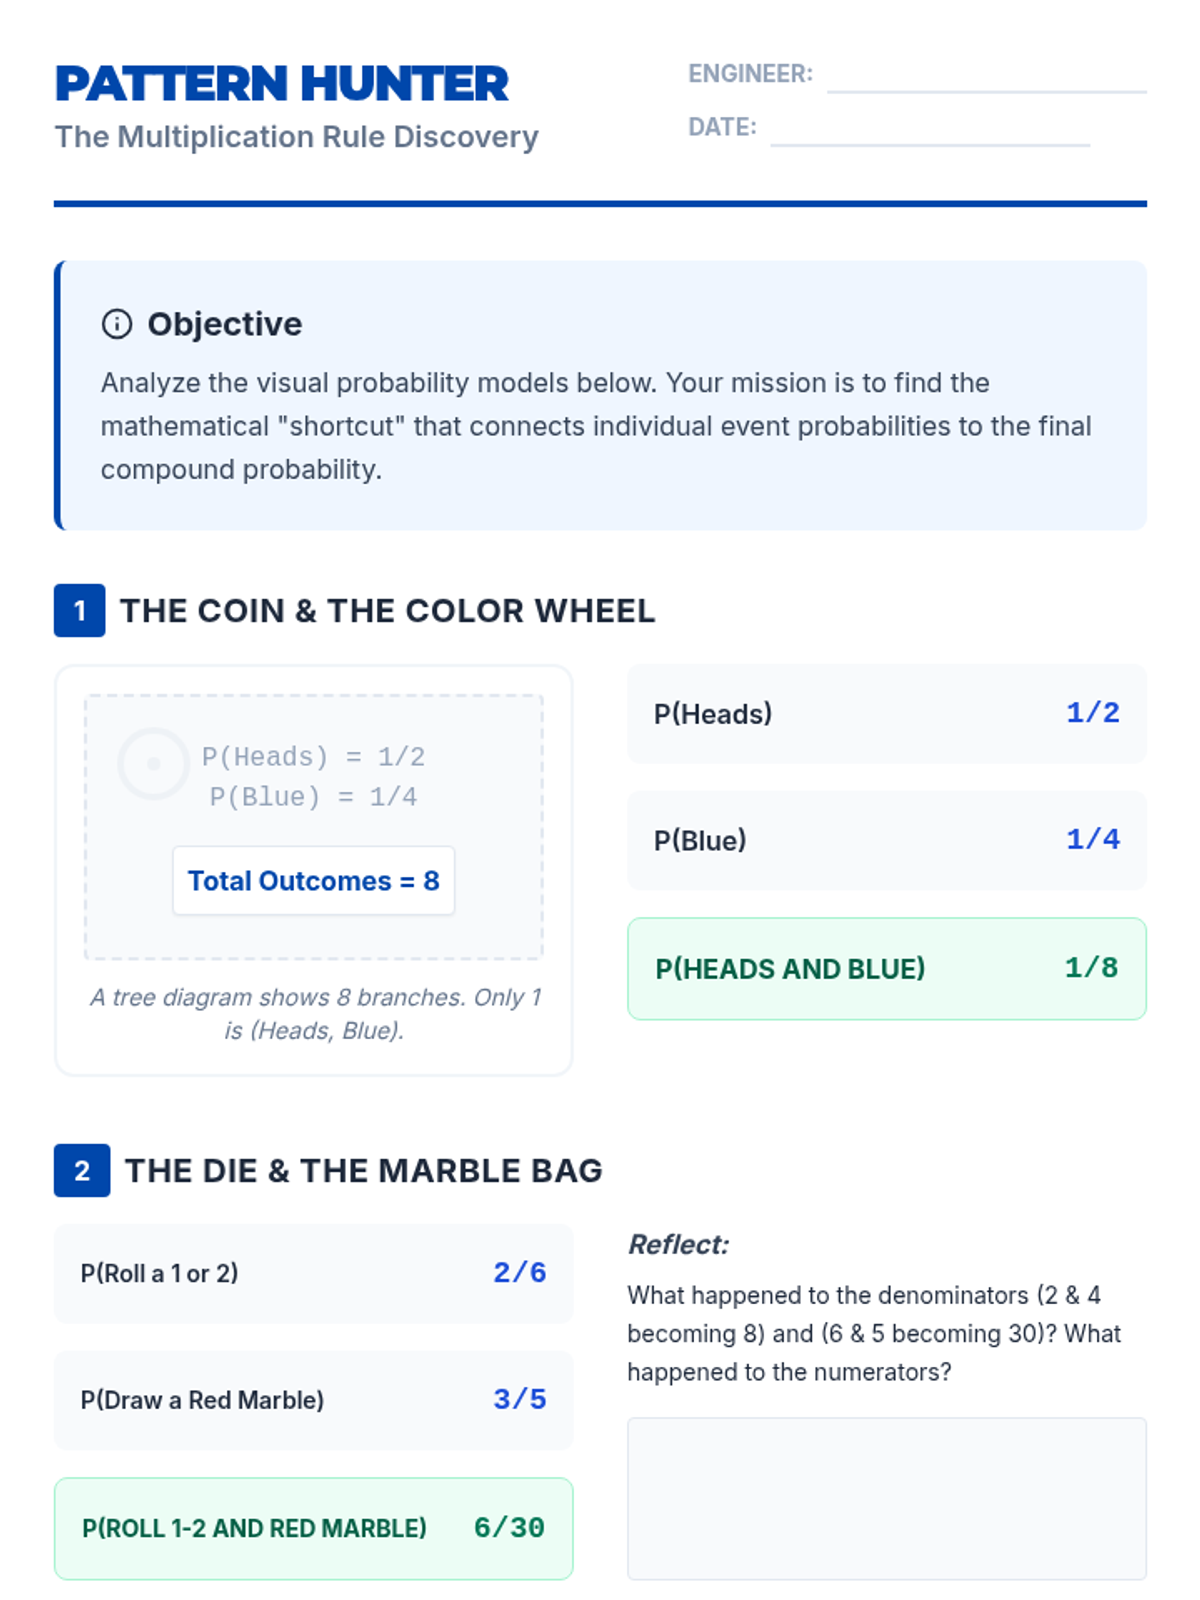
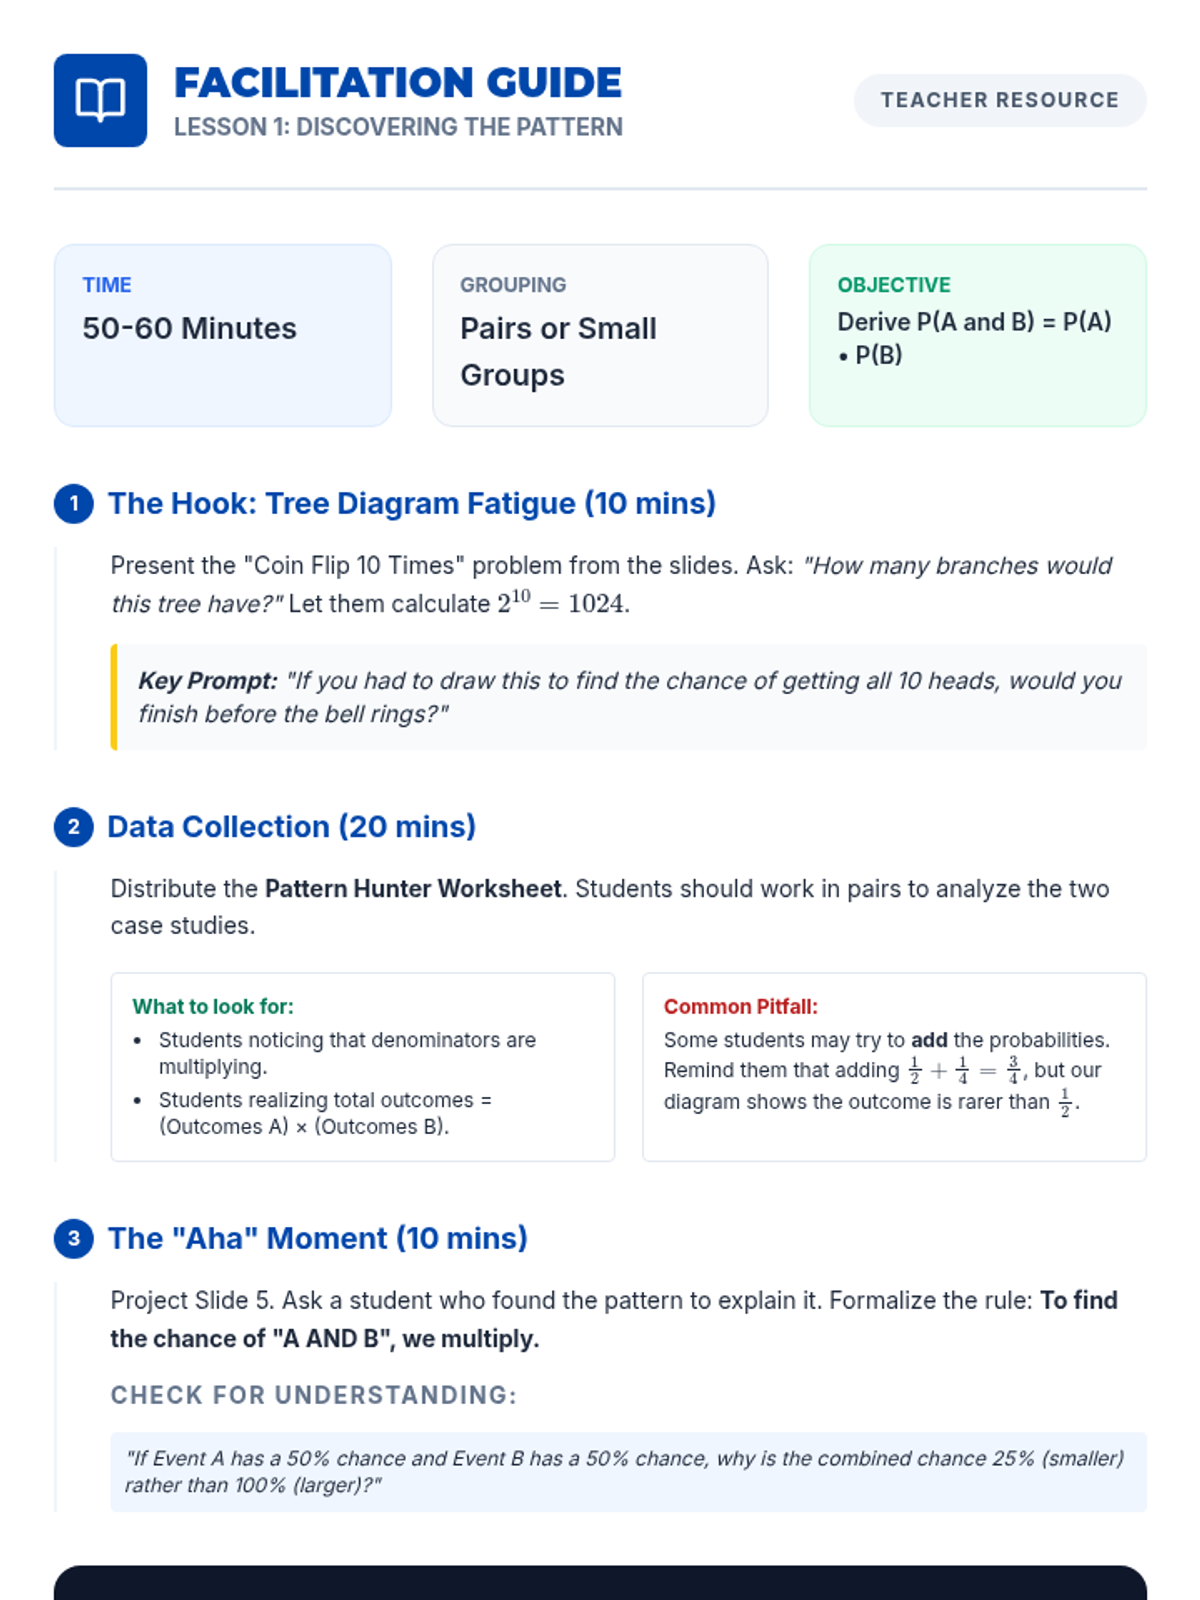
This sequence guides 7th-grade students from visual probability models (tree diagrams, area models) to the abstract Multiplication Rule for independent and dependent events. Students will discover the rule through inquiry, apply it to increasingly complex multi-stage scenarios, and master the distinction between replacement and non-replacement contexts.
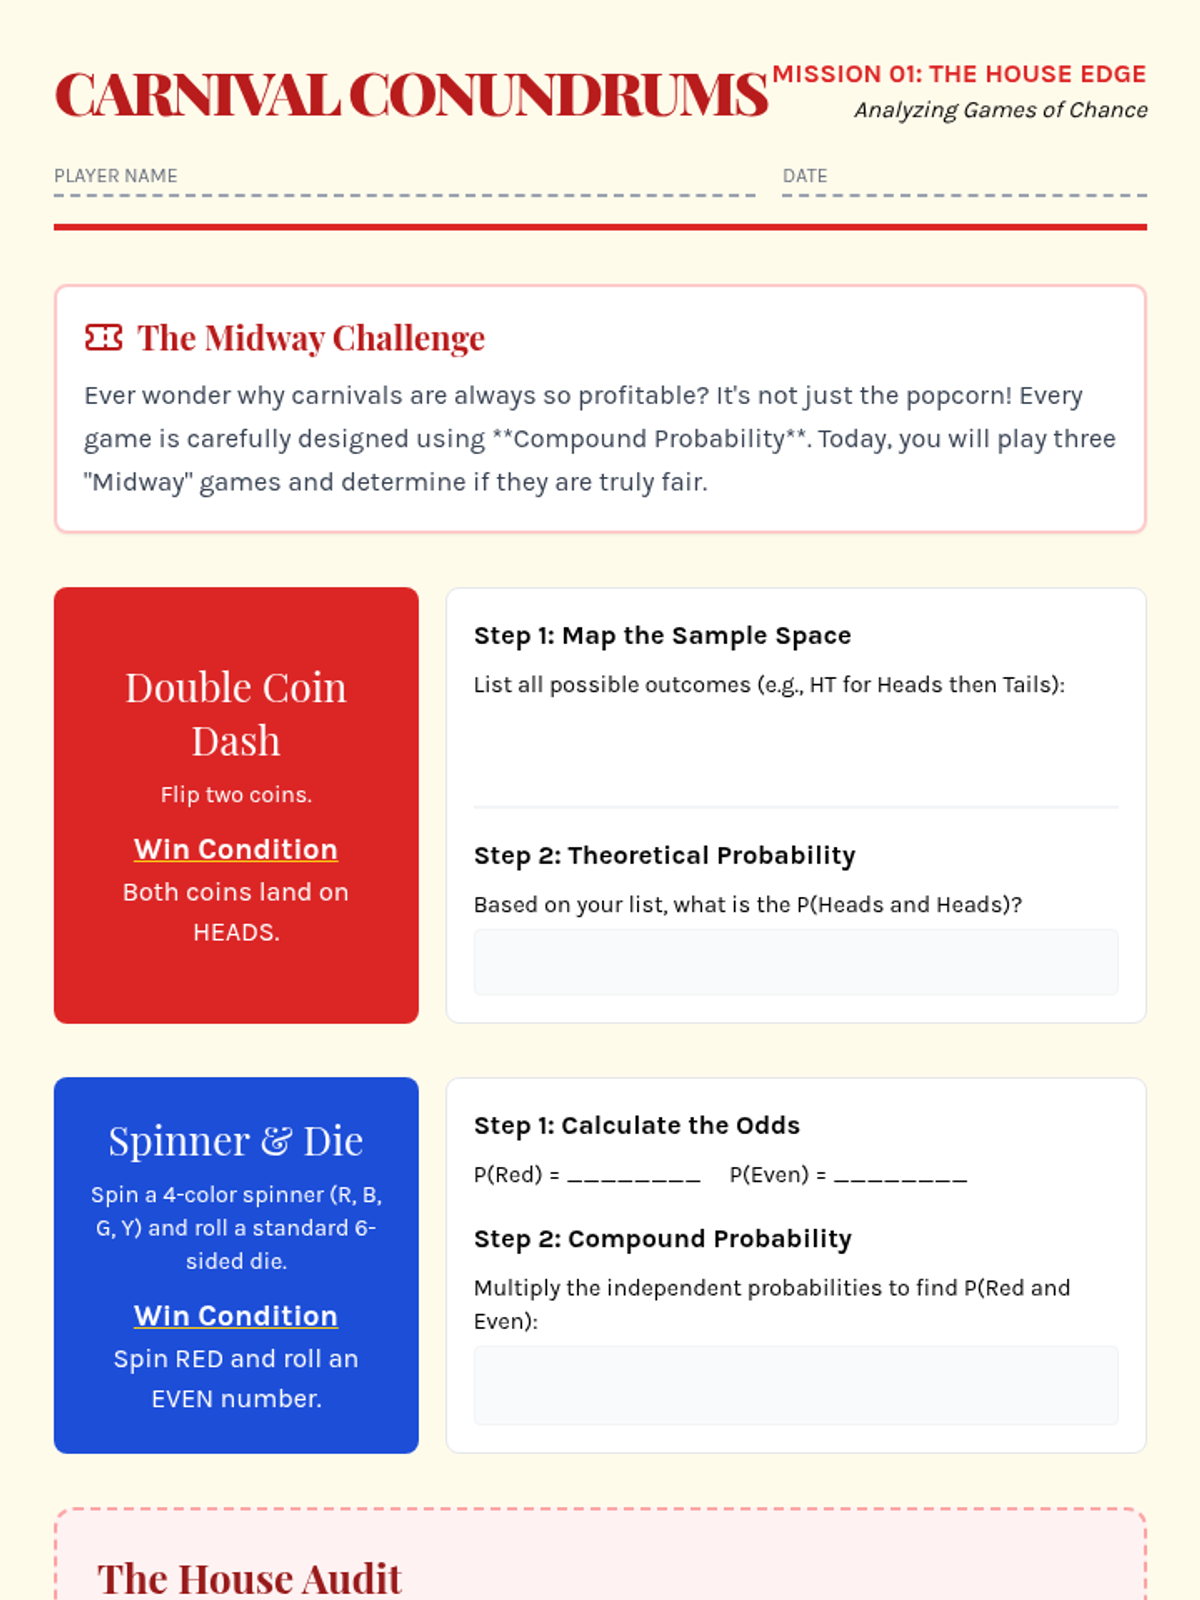
A project-based unit where 7th-grade students analyze, design, and audit games of chance using compound probability. Students move from playing carnival games to calculating theoretical win rates and testing them against experimental data.
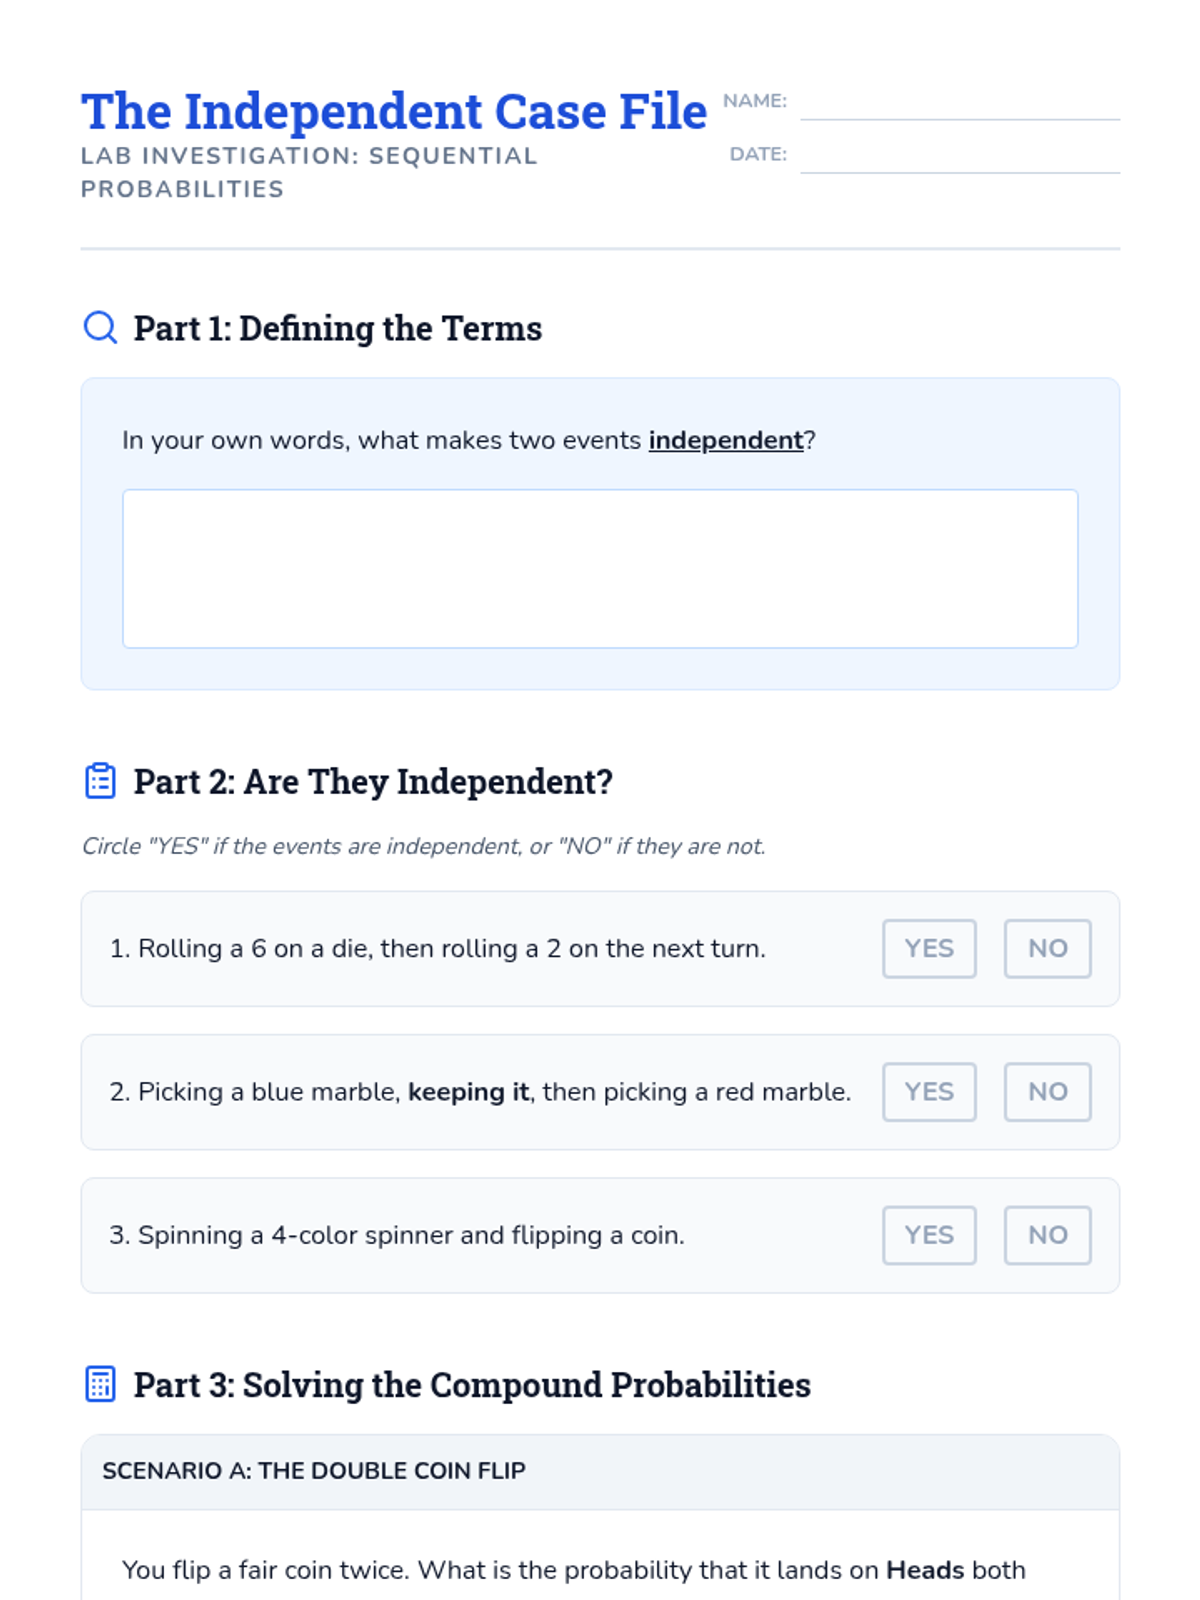
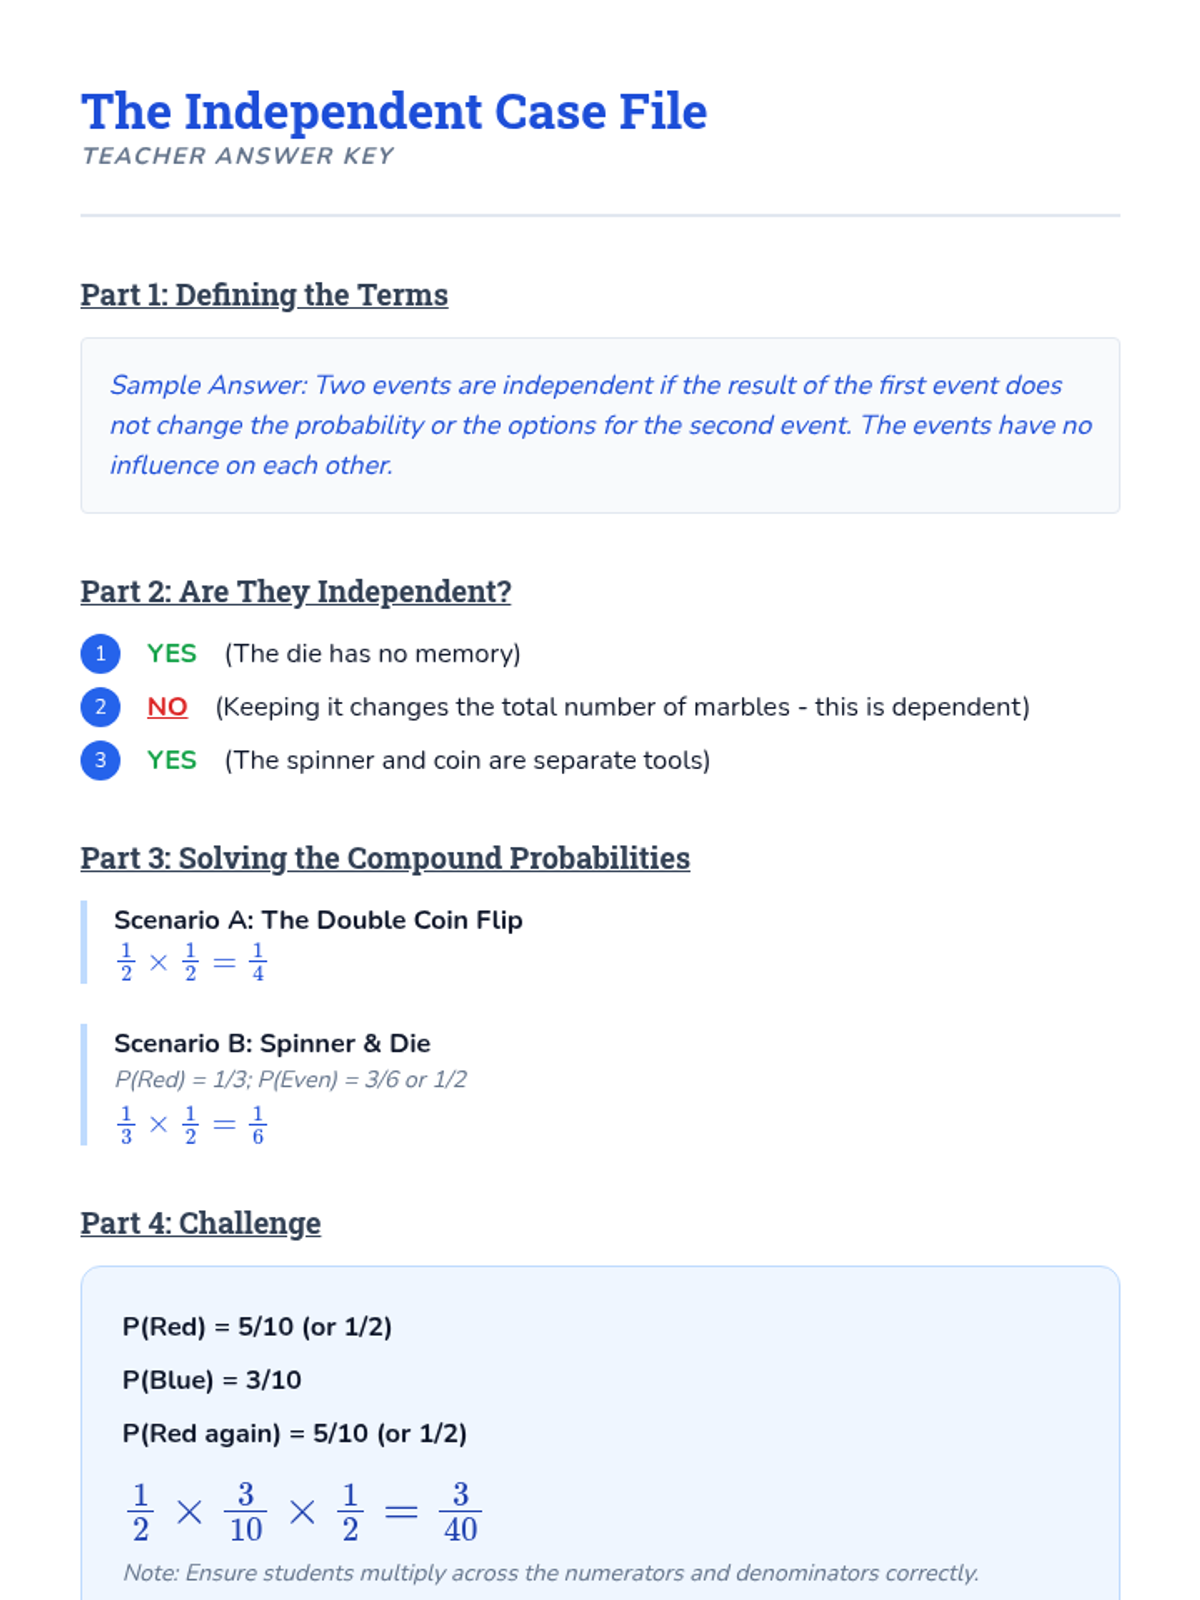
This sequence explores the differences between independent and dependent events through hands-on simulations, comparative analysis, and multi-step calculations. Students learn to adjust sample spaces and numerators based on whether items are replaced, building a strong foundation for compound probability.
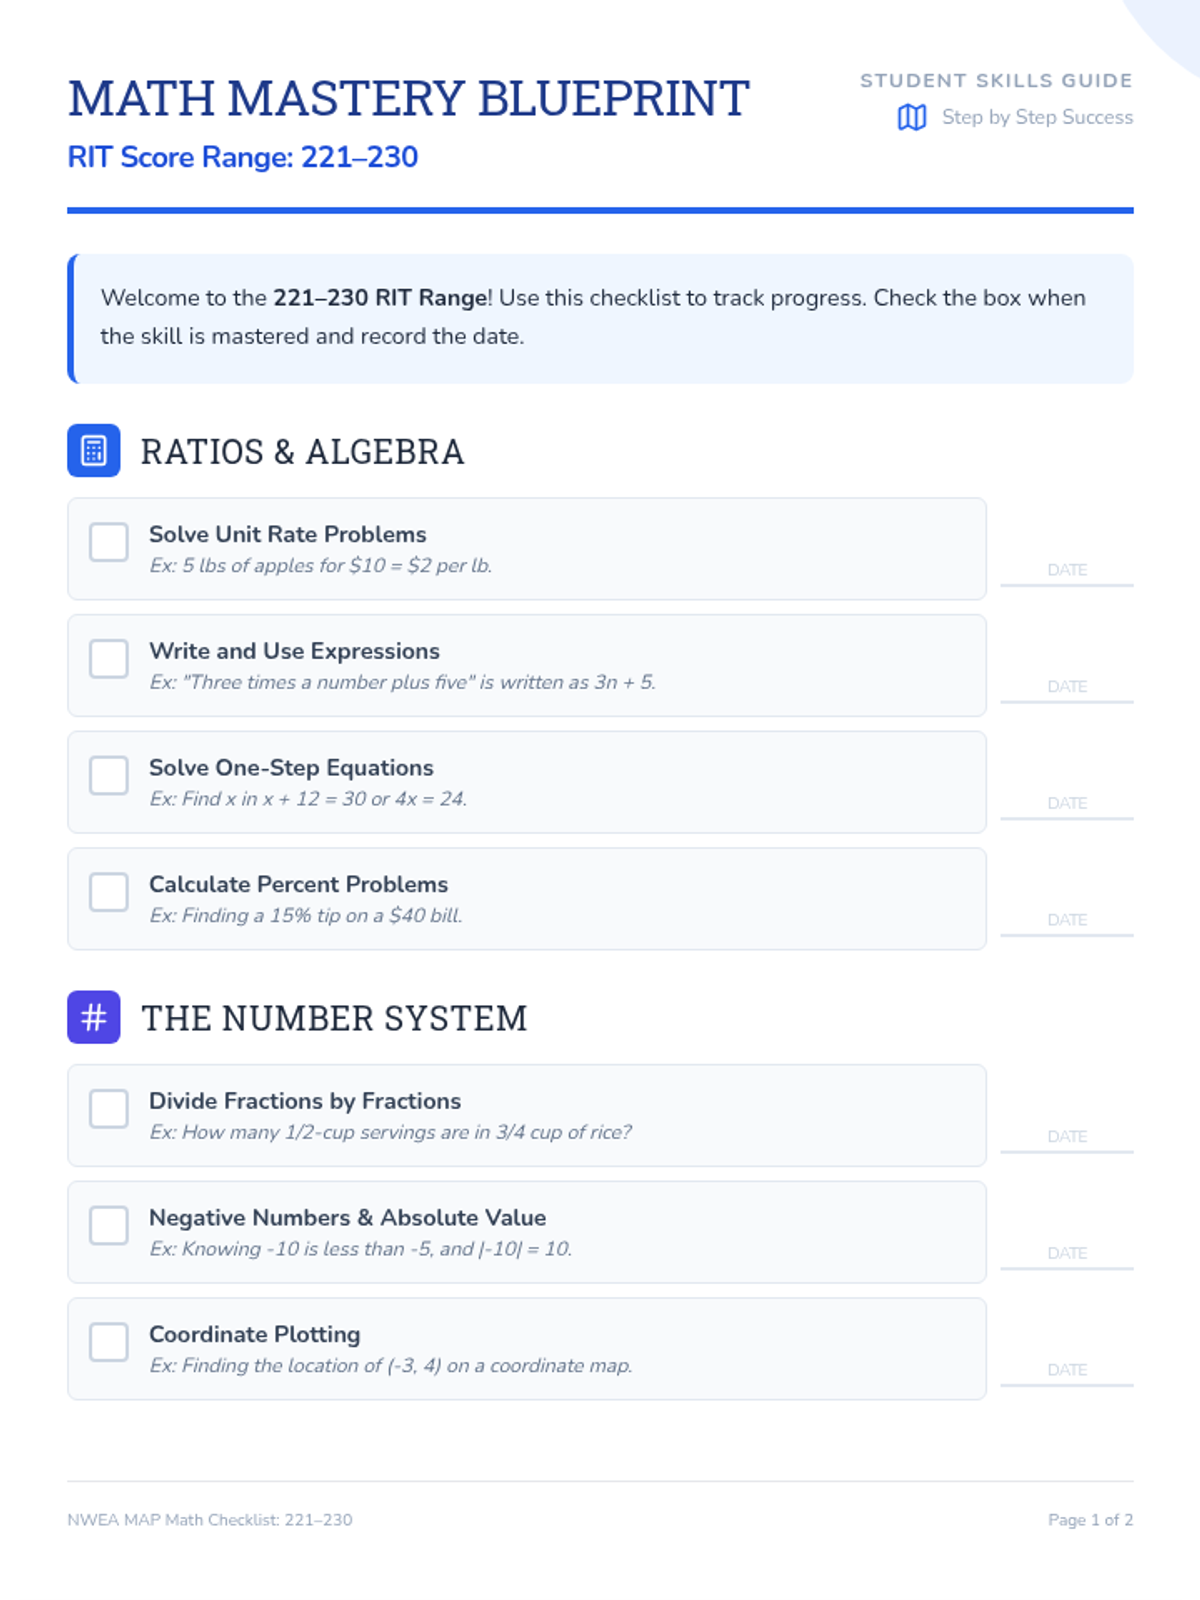
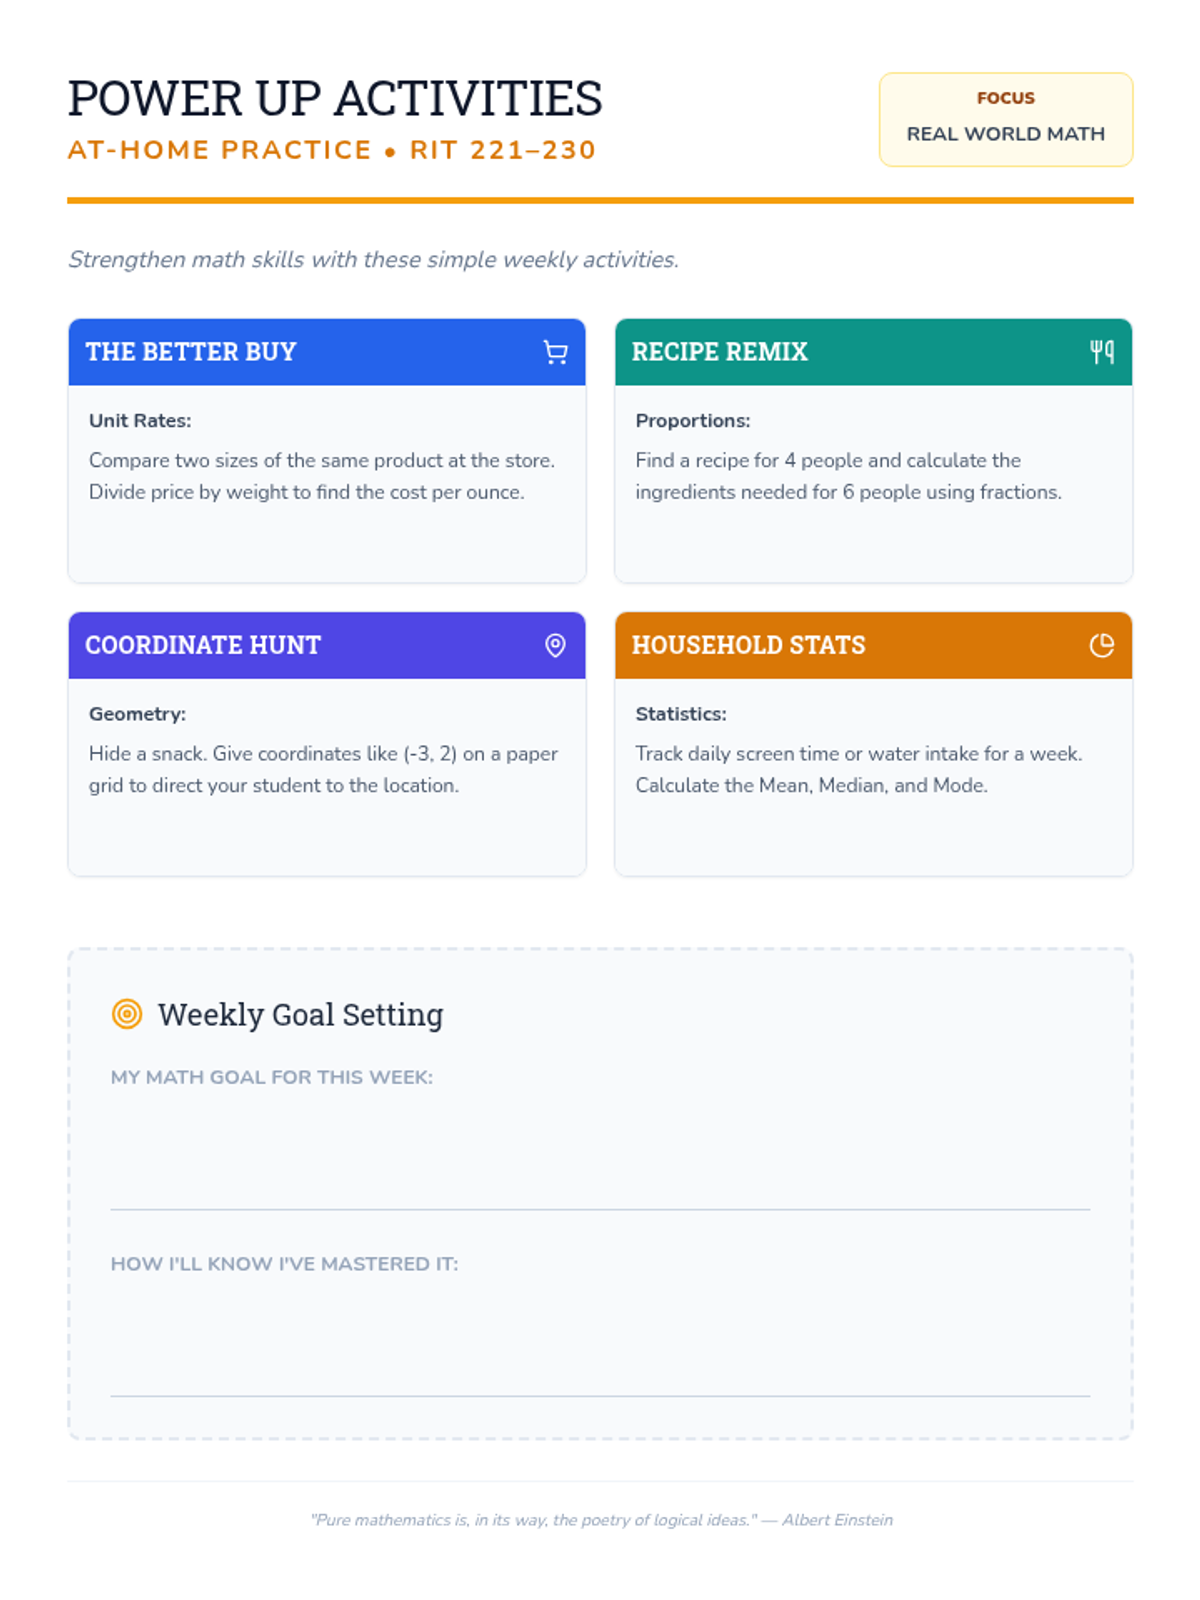
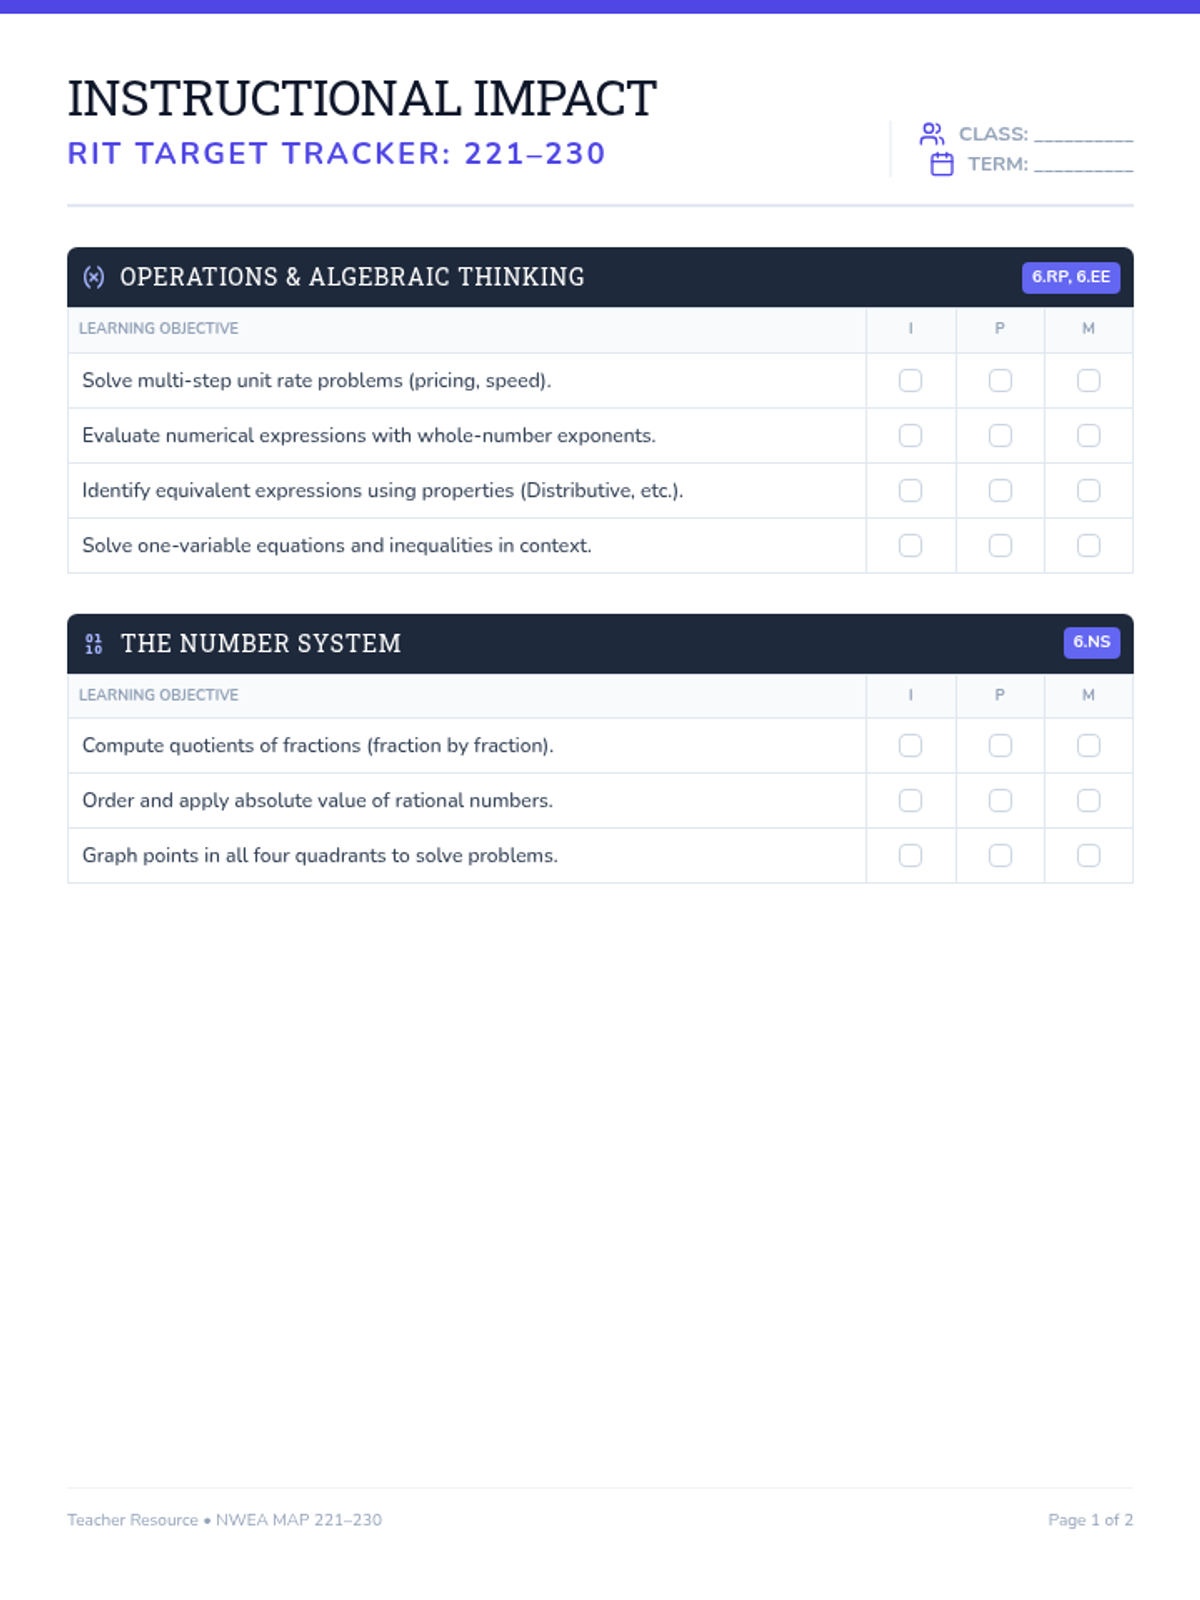
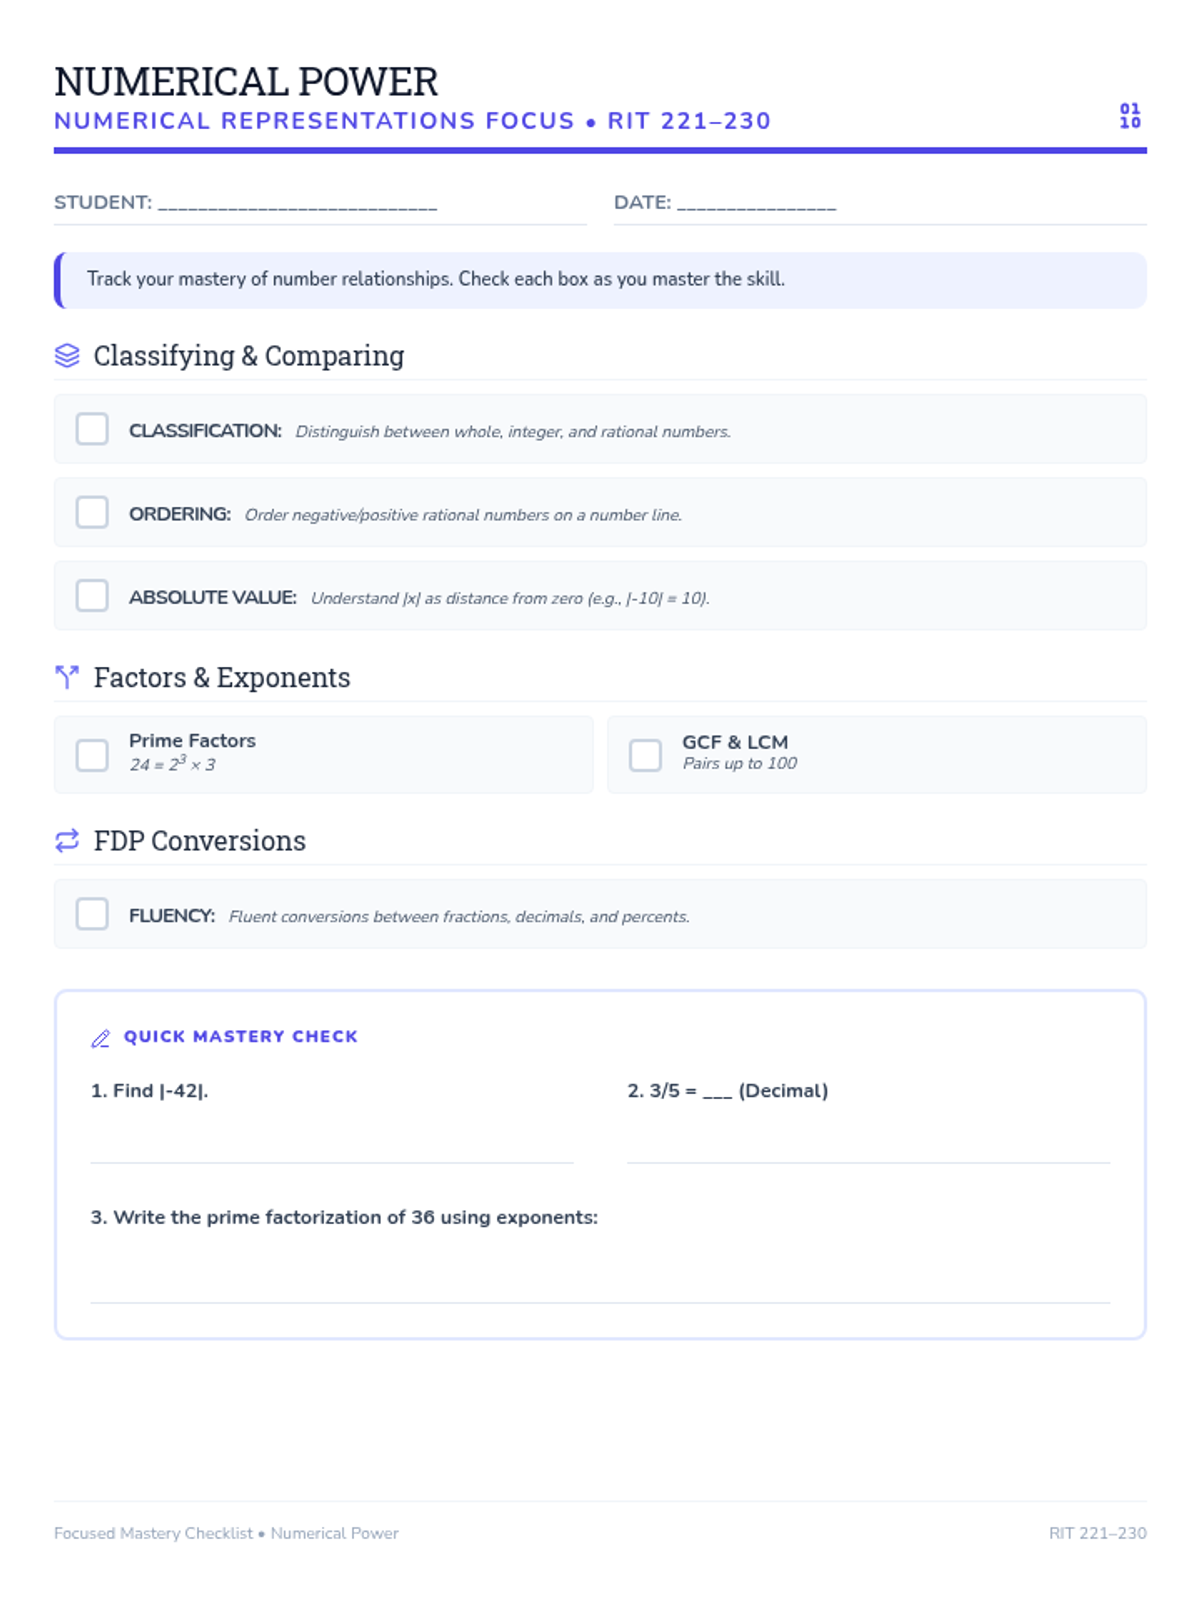
A comprehensive collection of RIT-aligned math mastery resources for student and teacher tracking across key mathematical development ranges.
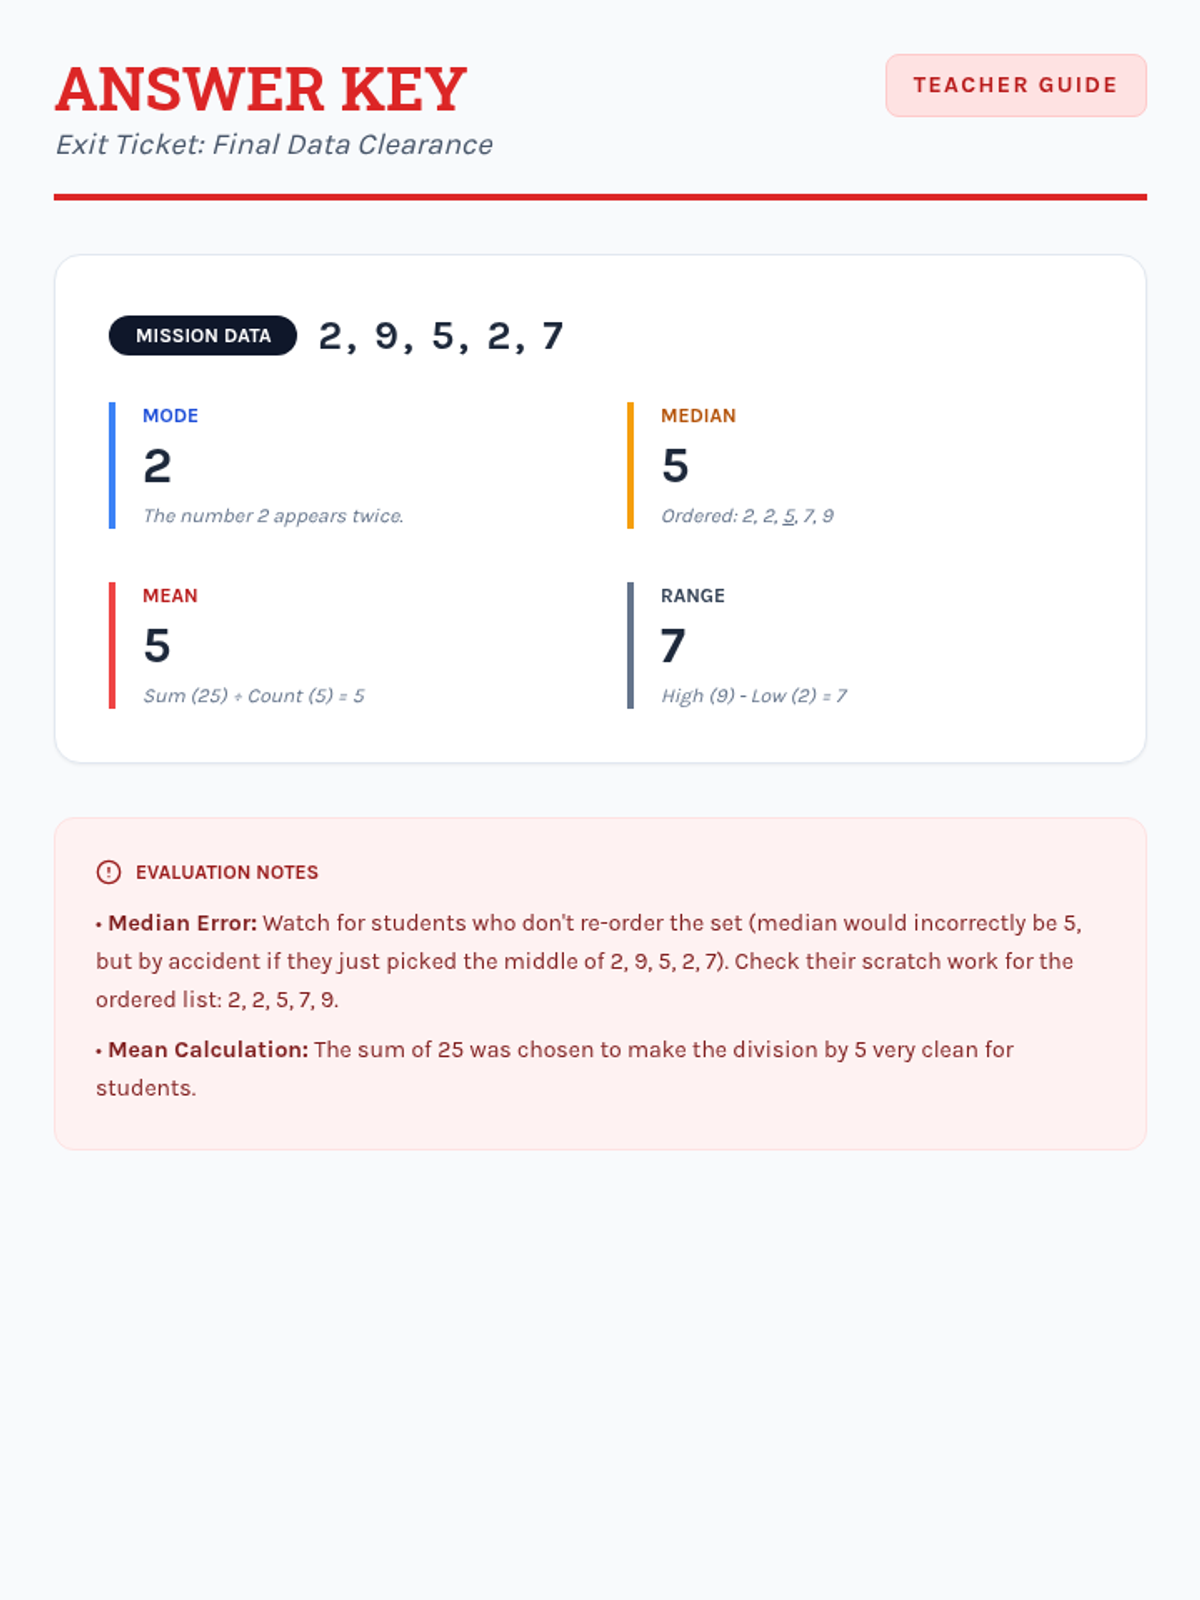
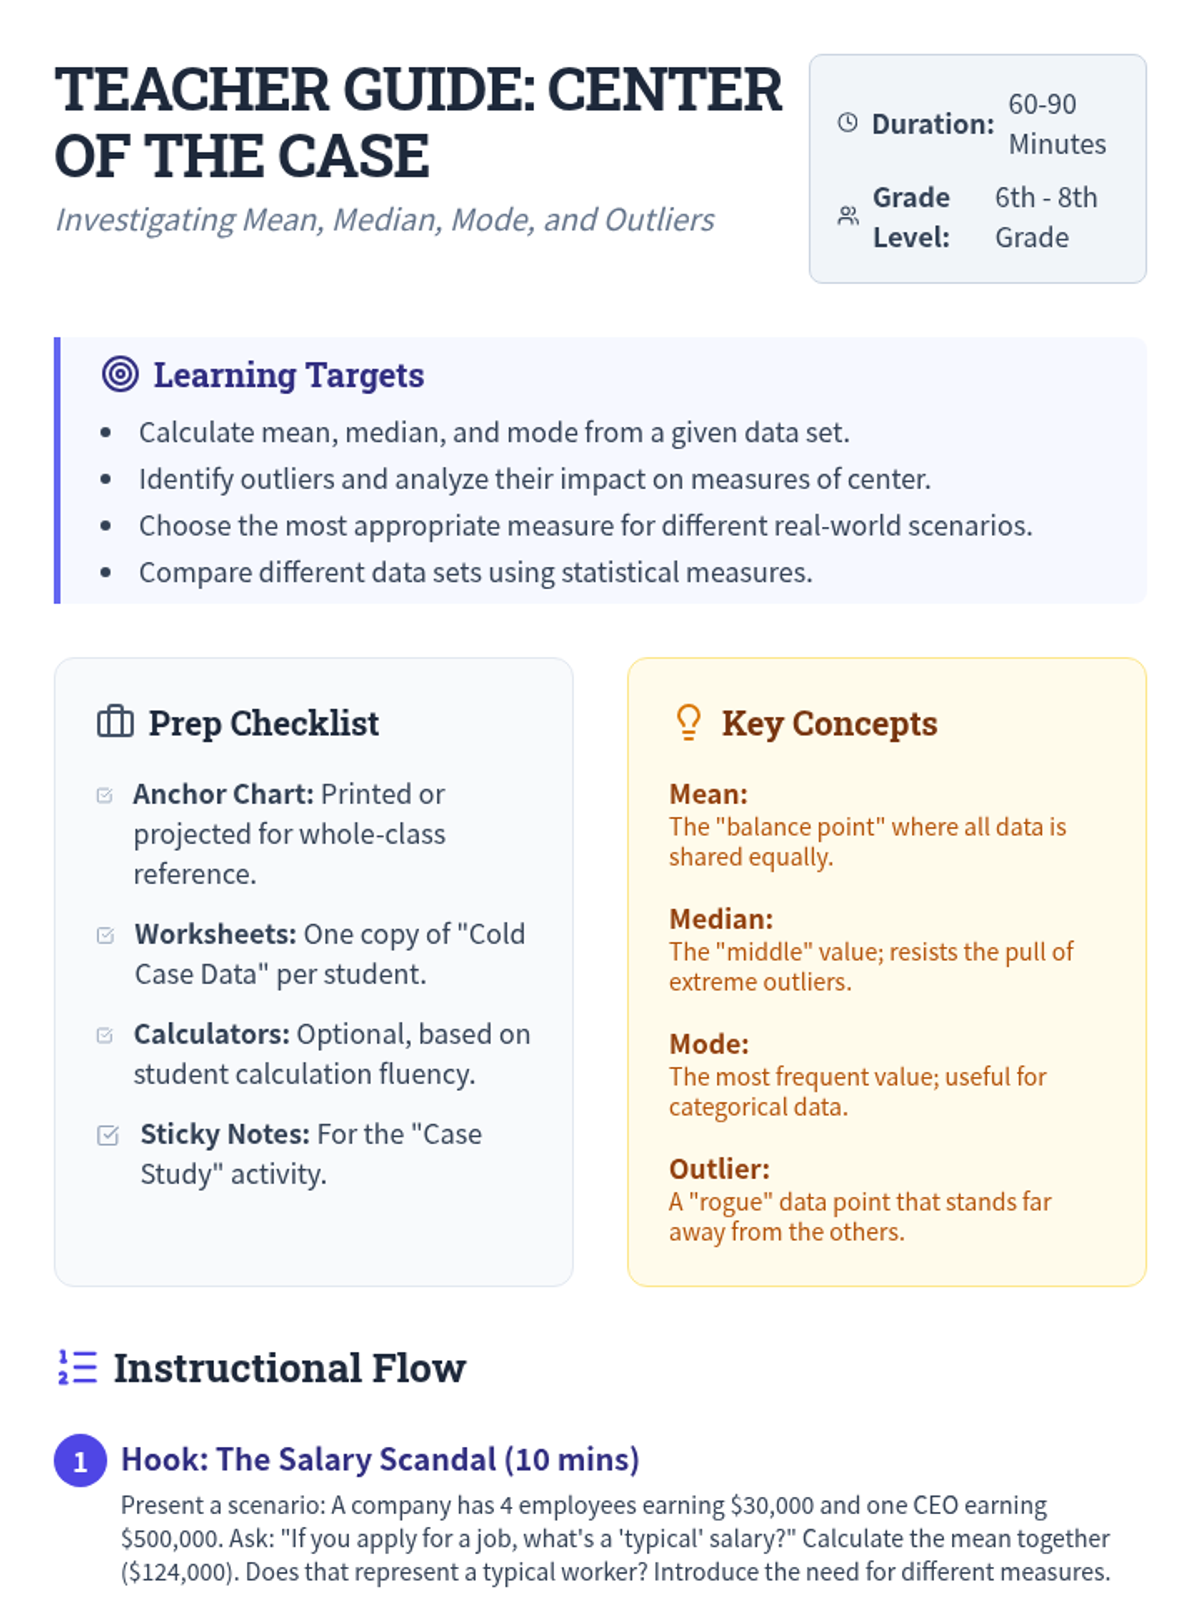
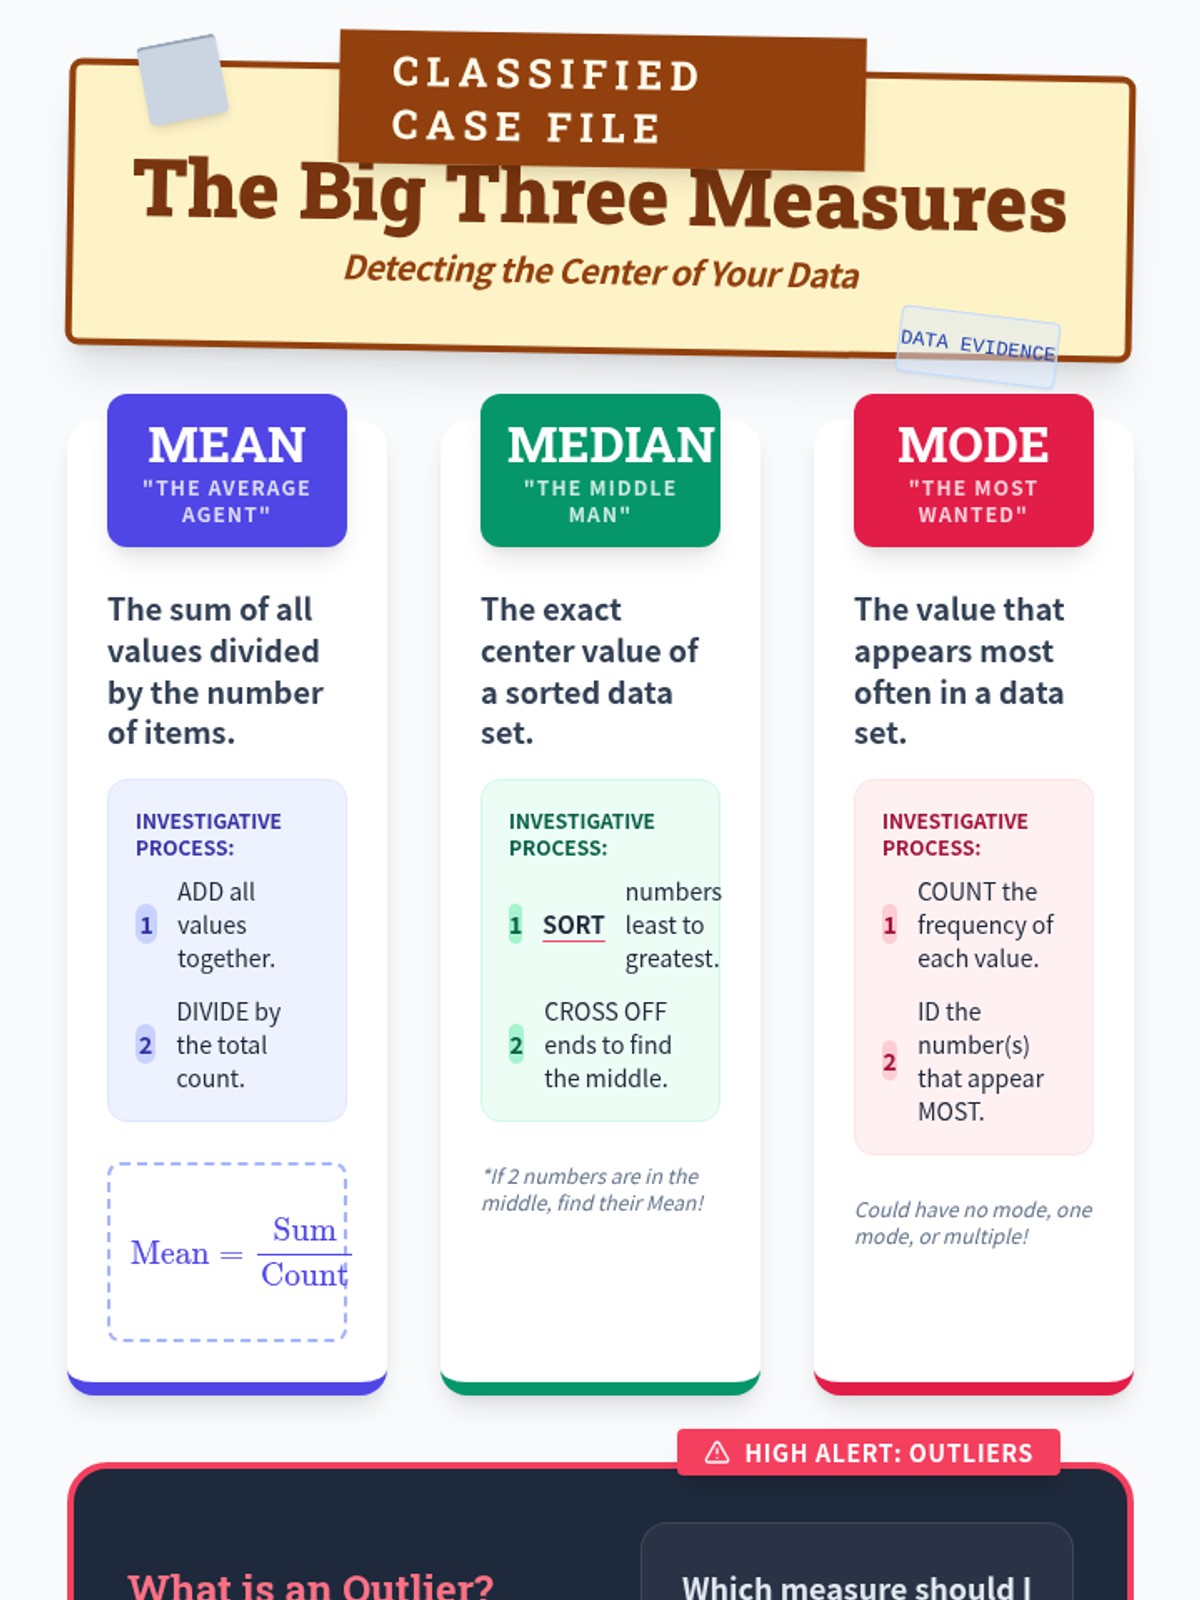
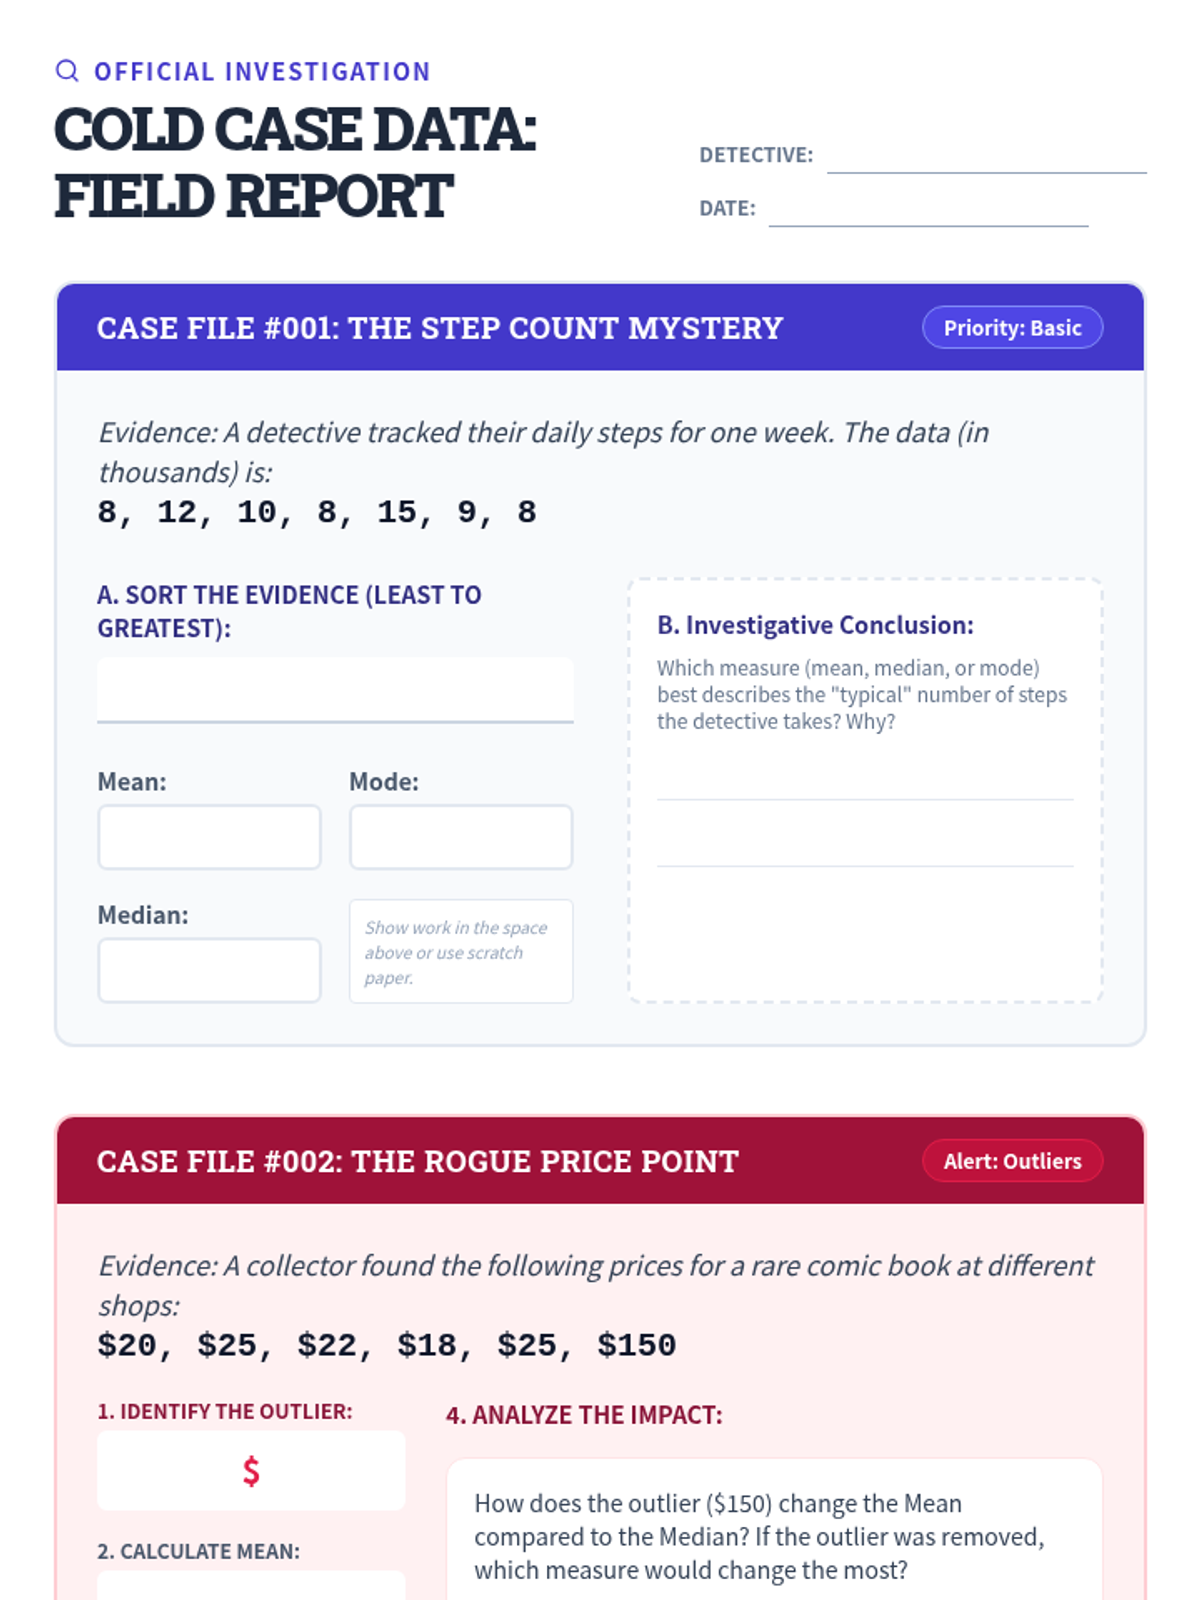
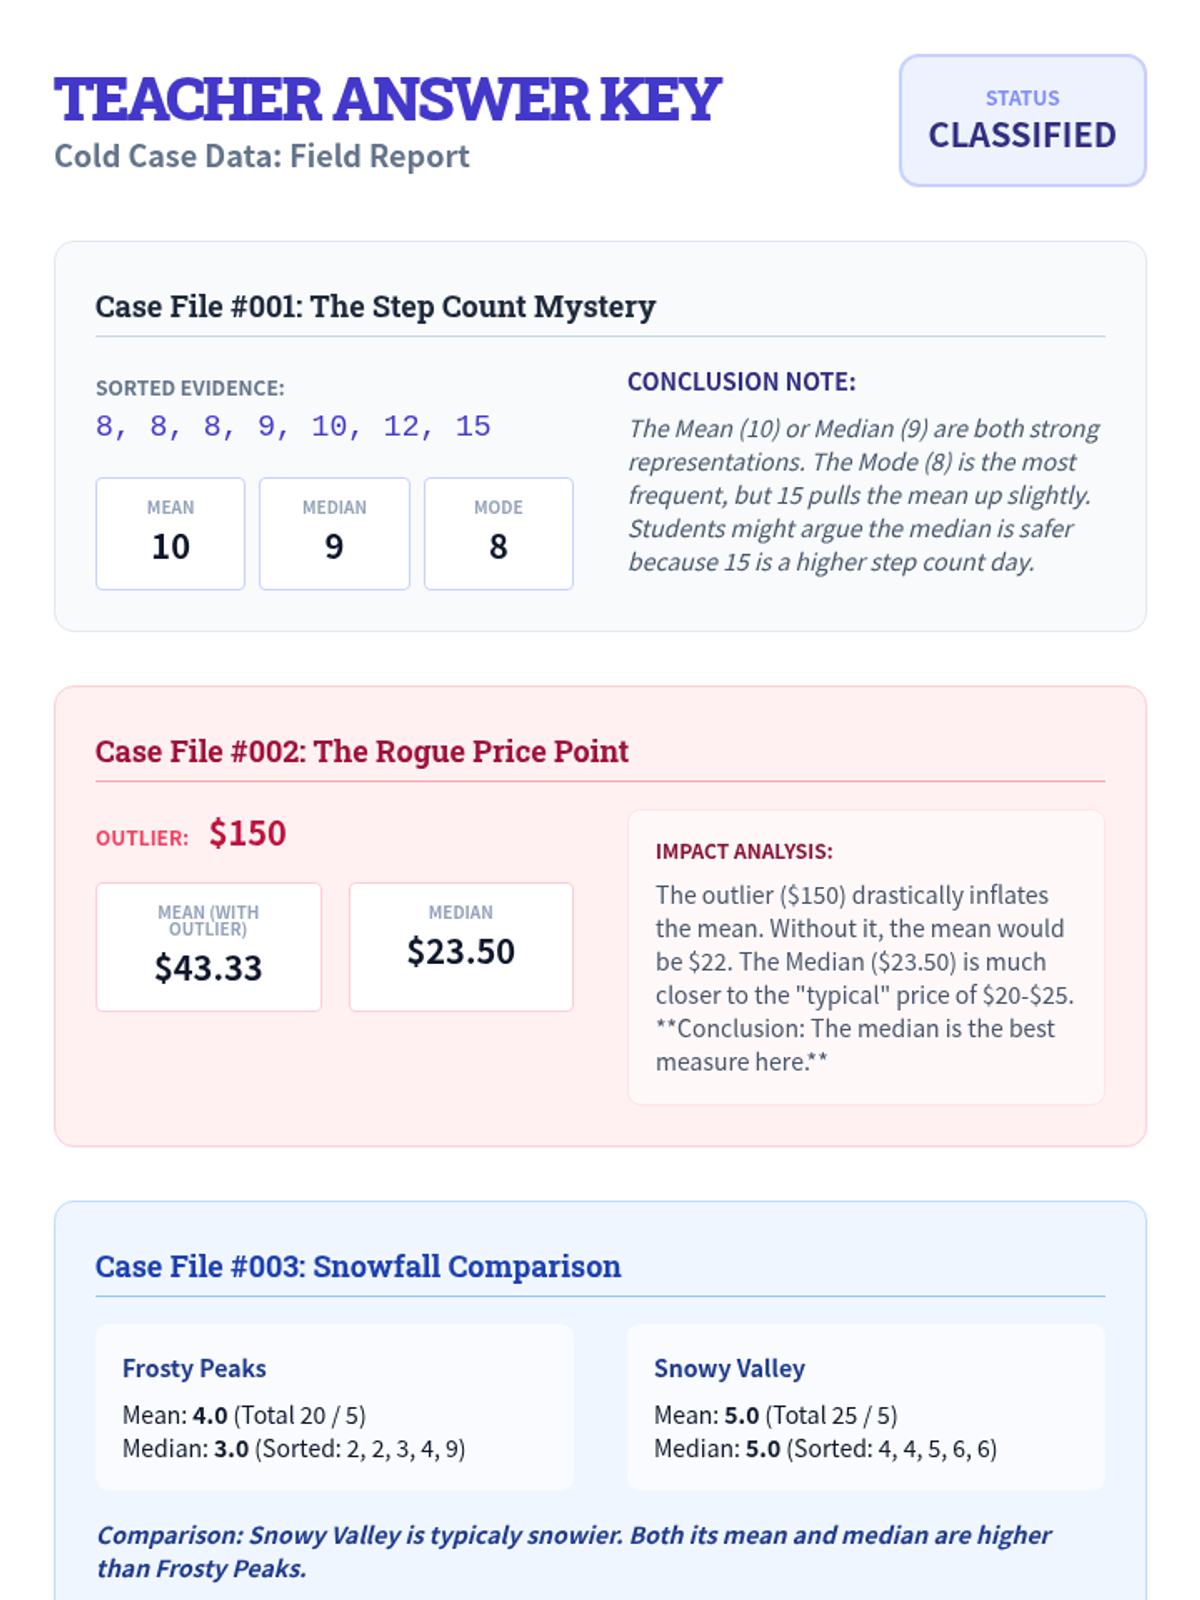
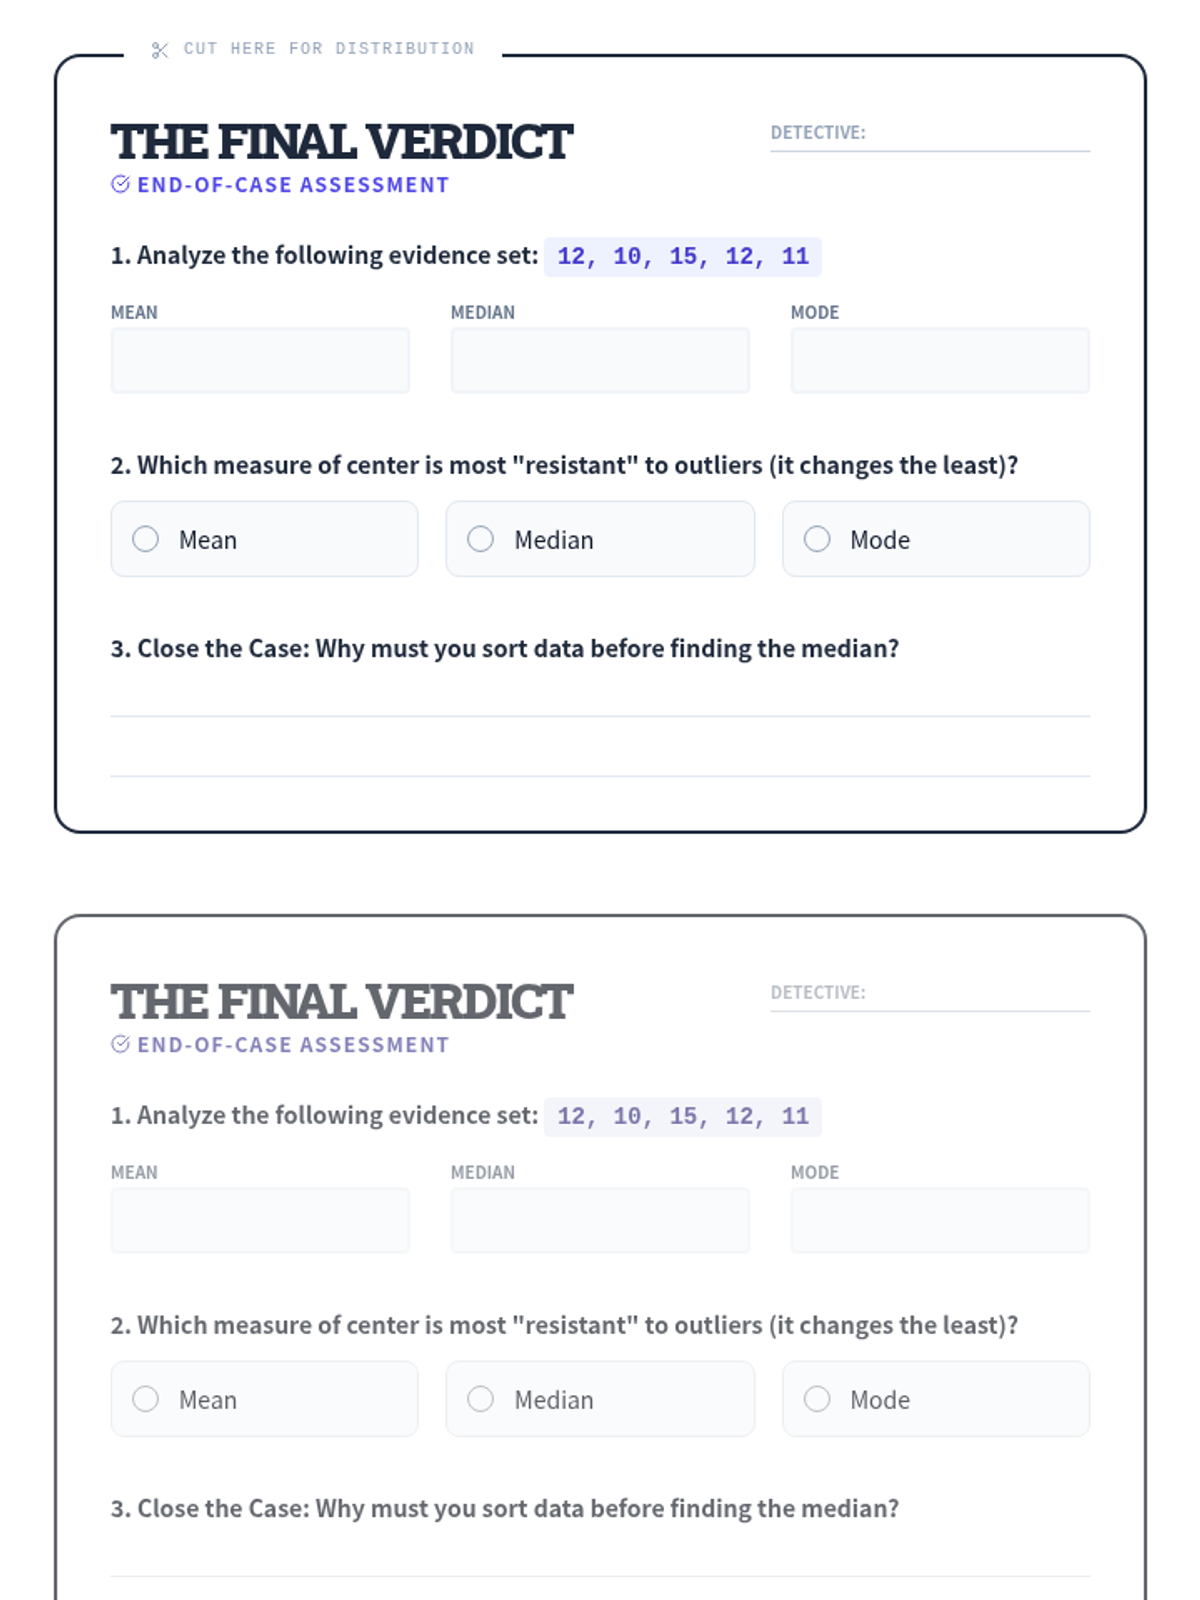
A comprehensive progression through descriptive statistics, from foundational calculations to high-school level analytical applications, including outlier effects and algebraic problem-solving.
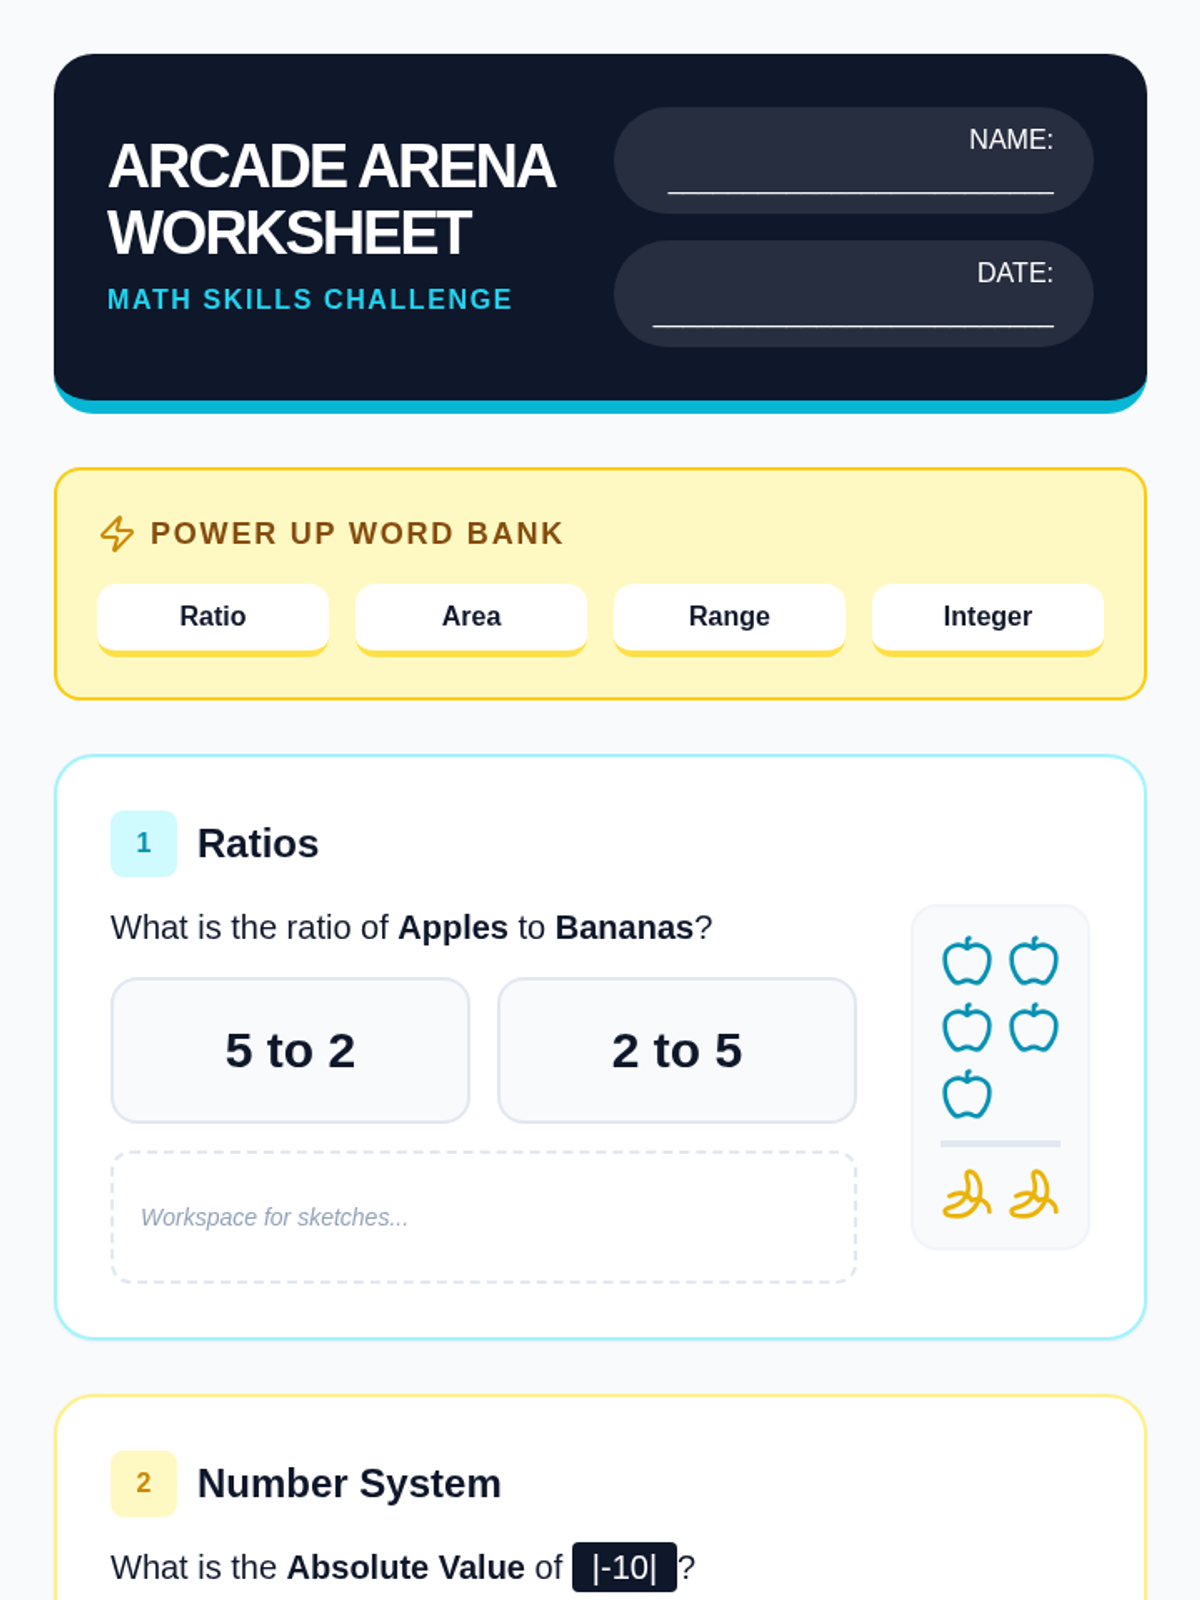
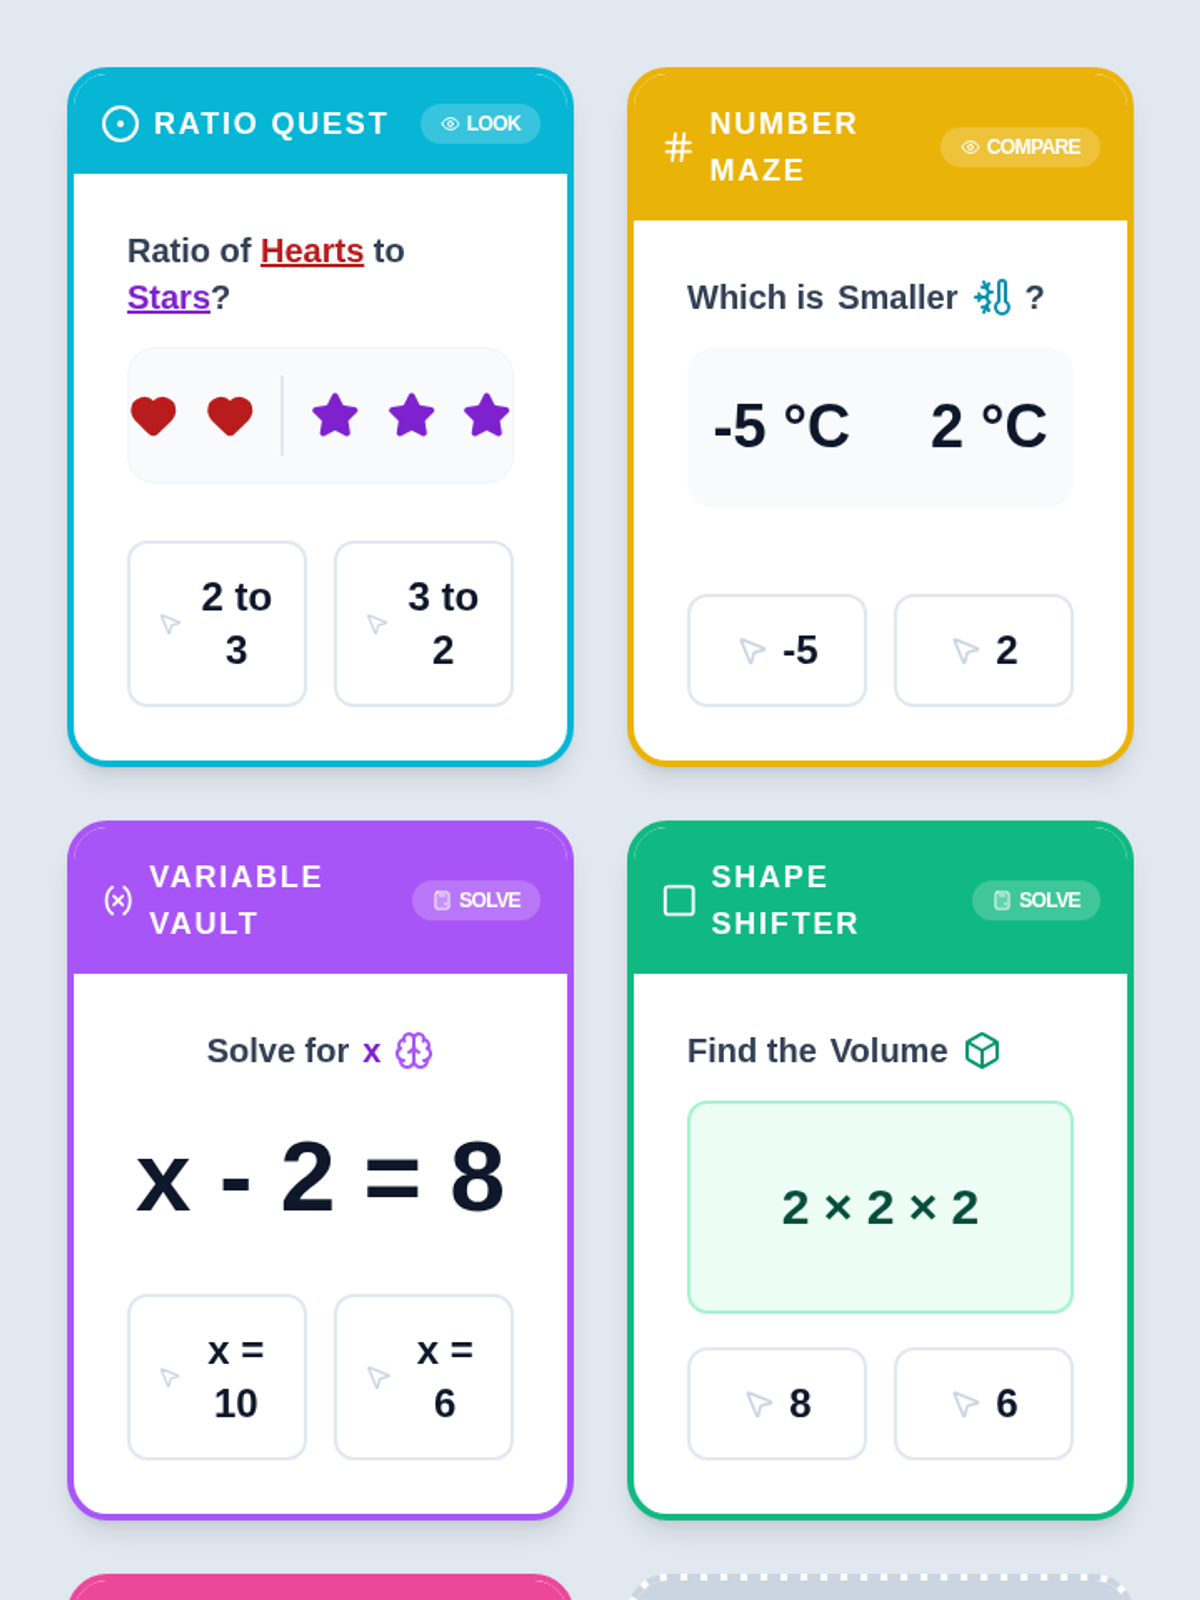
A comprehensive math review sequence designed for students with IEPs, featuring simplified numbers, visual aids, and a gamified arcade theme. Covers Ratios, The Number System, Expressions, Geometry, and Statistics through interactive slides and printable activities.
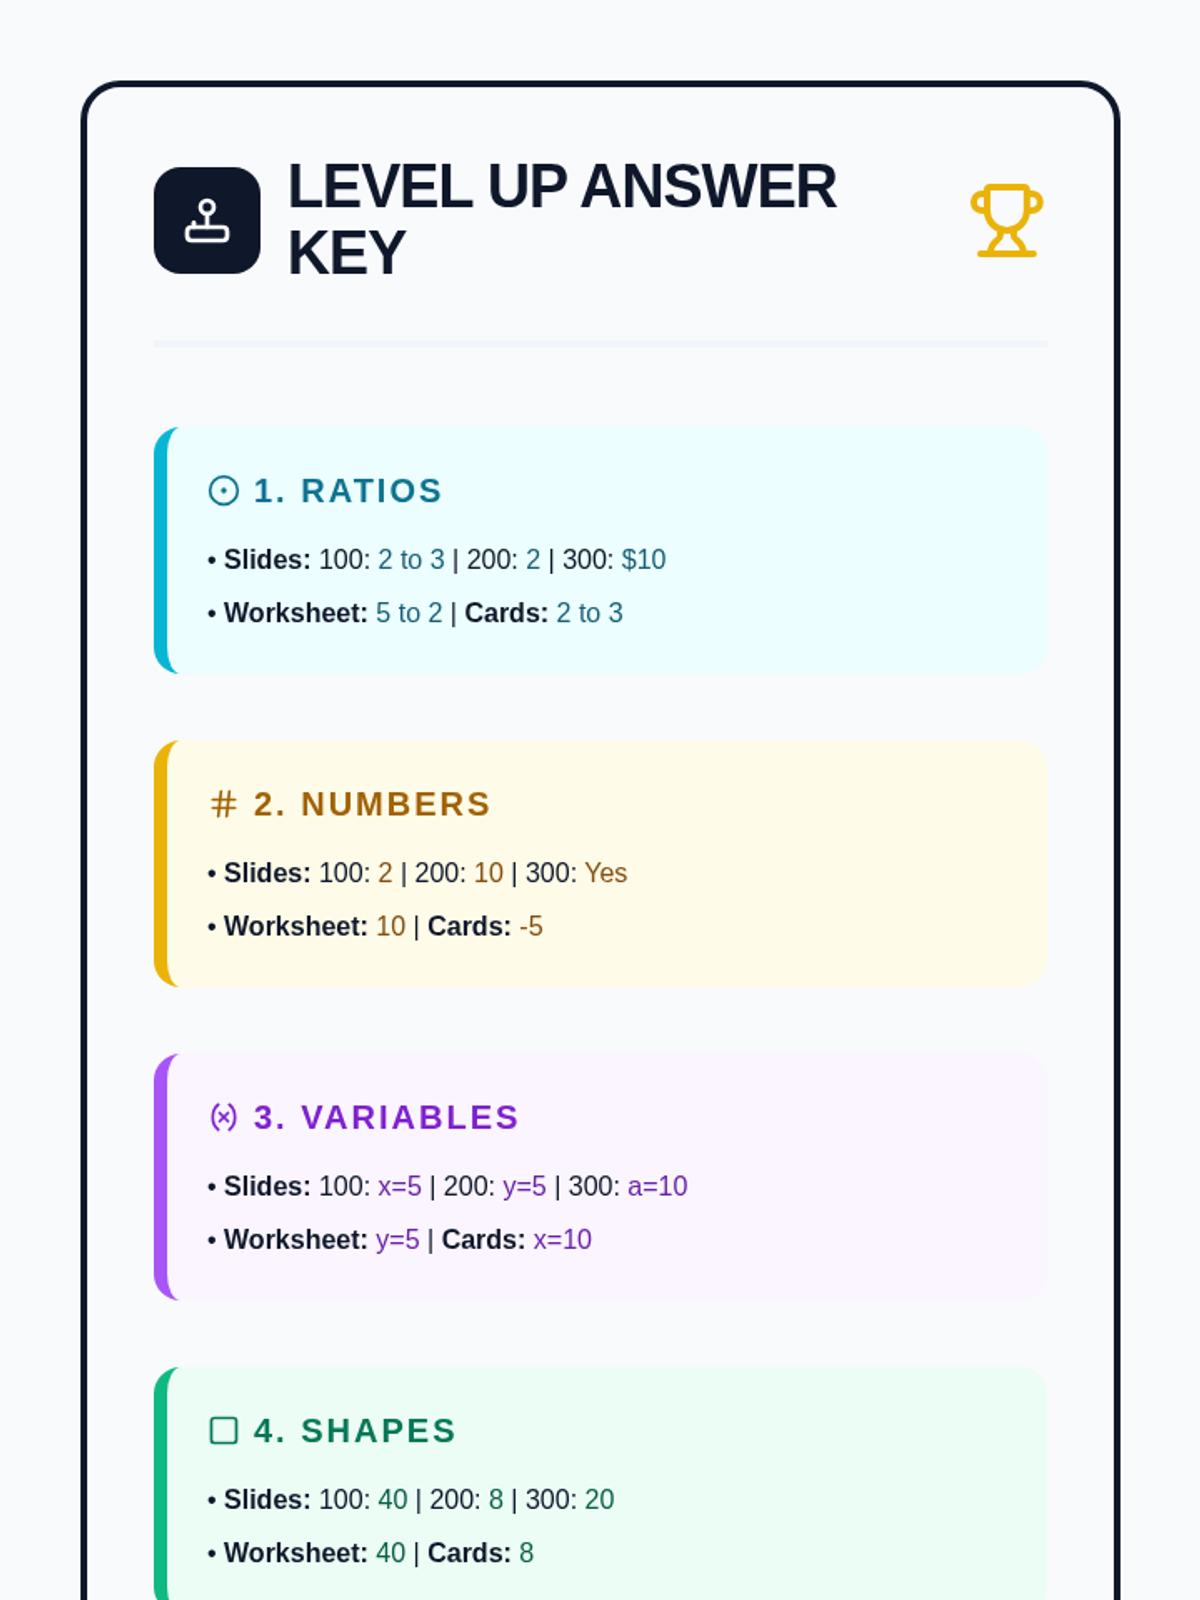
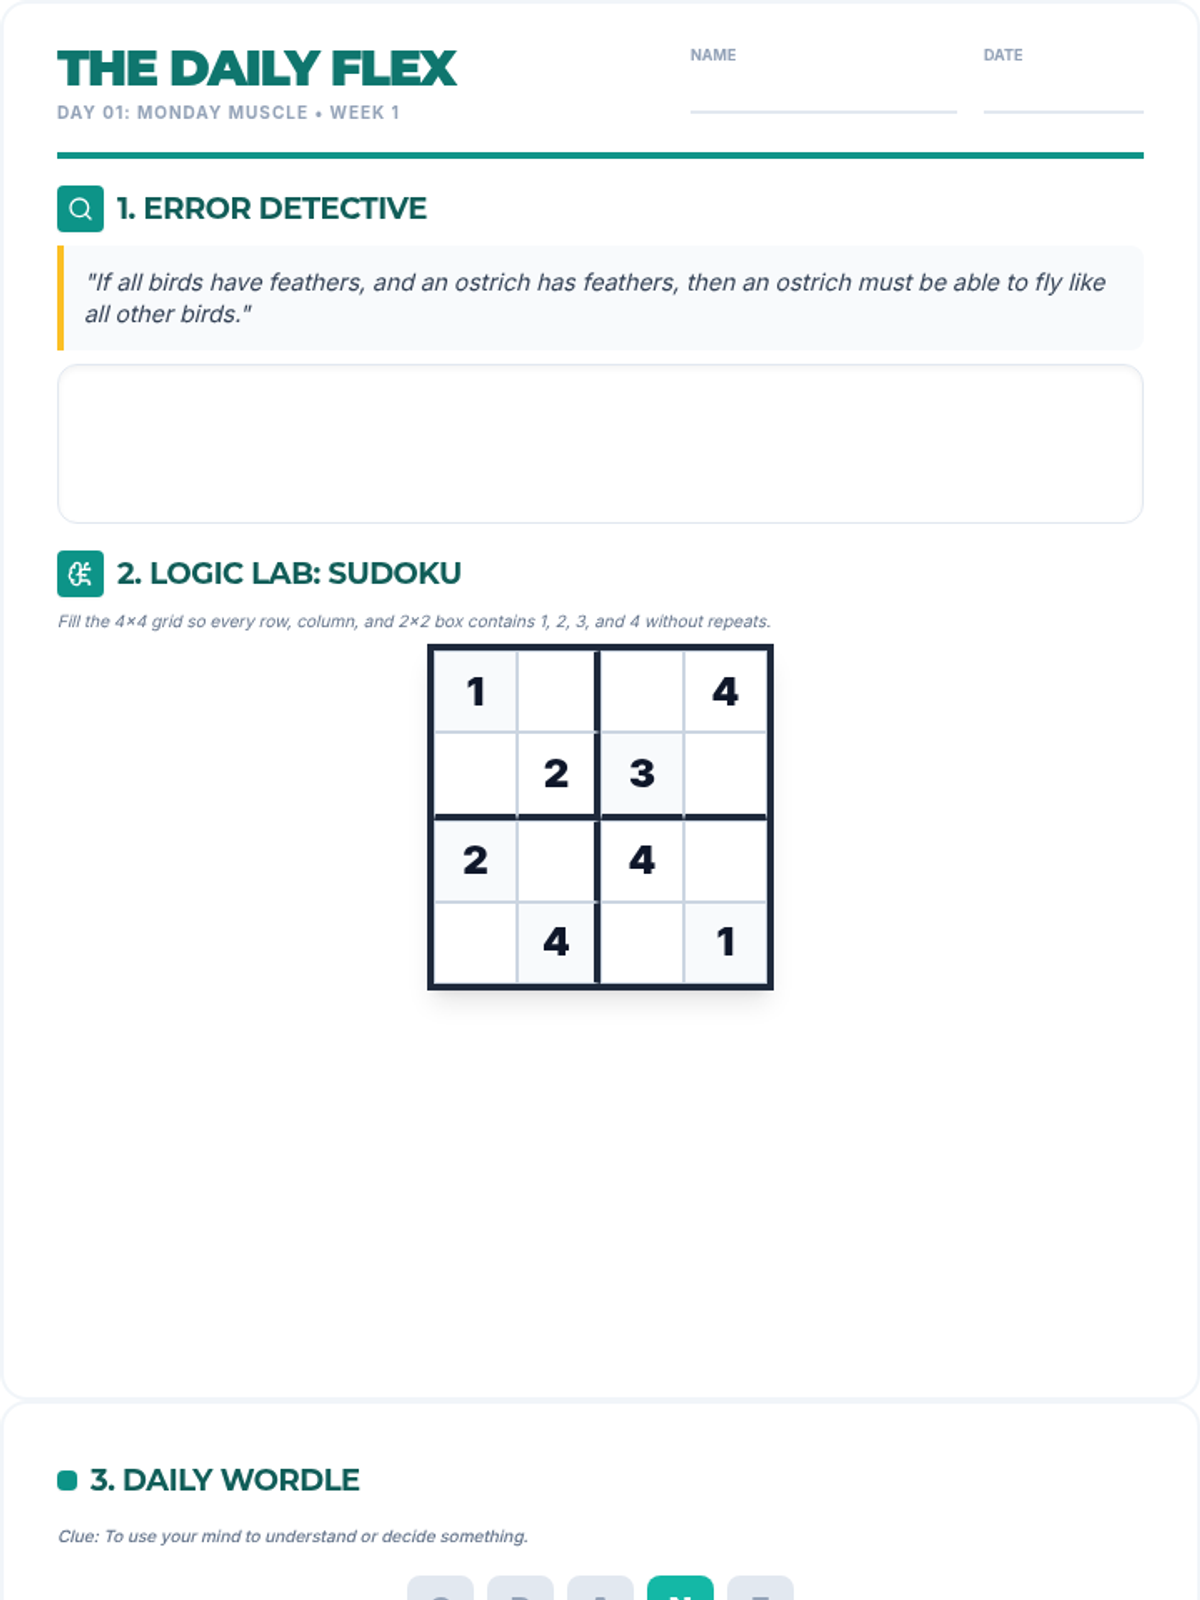
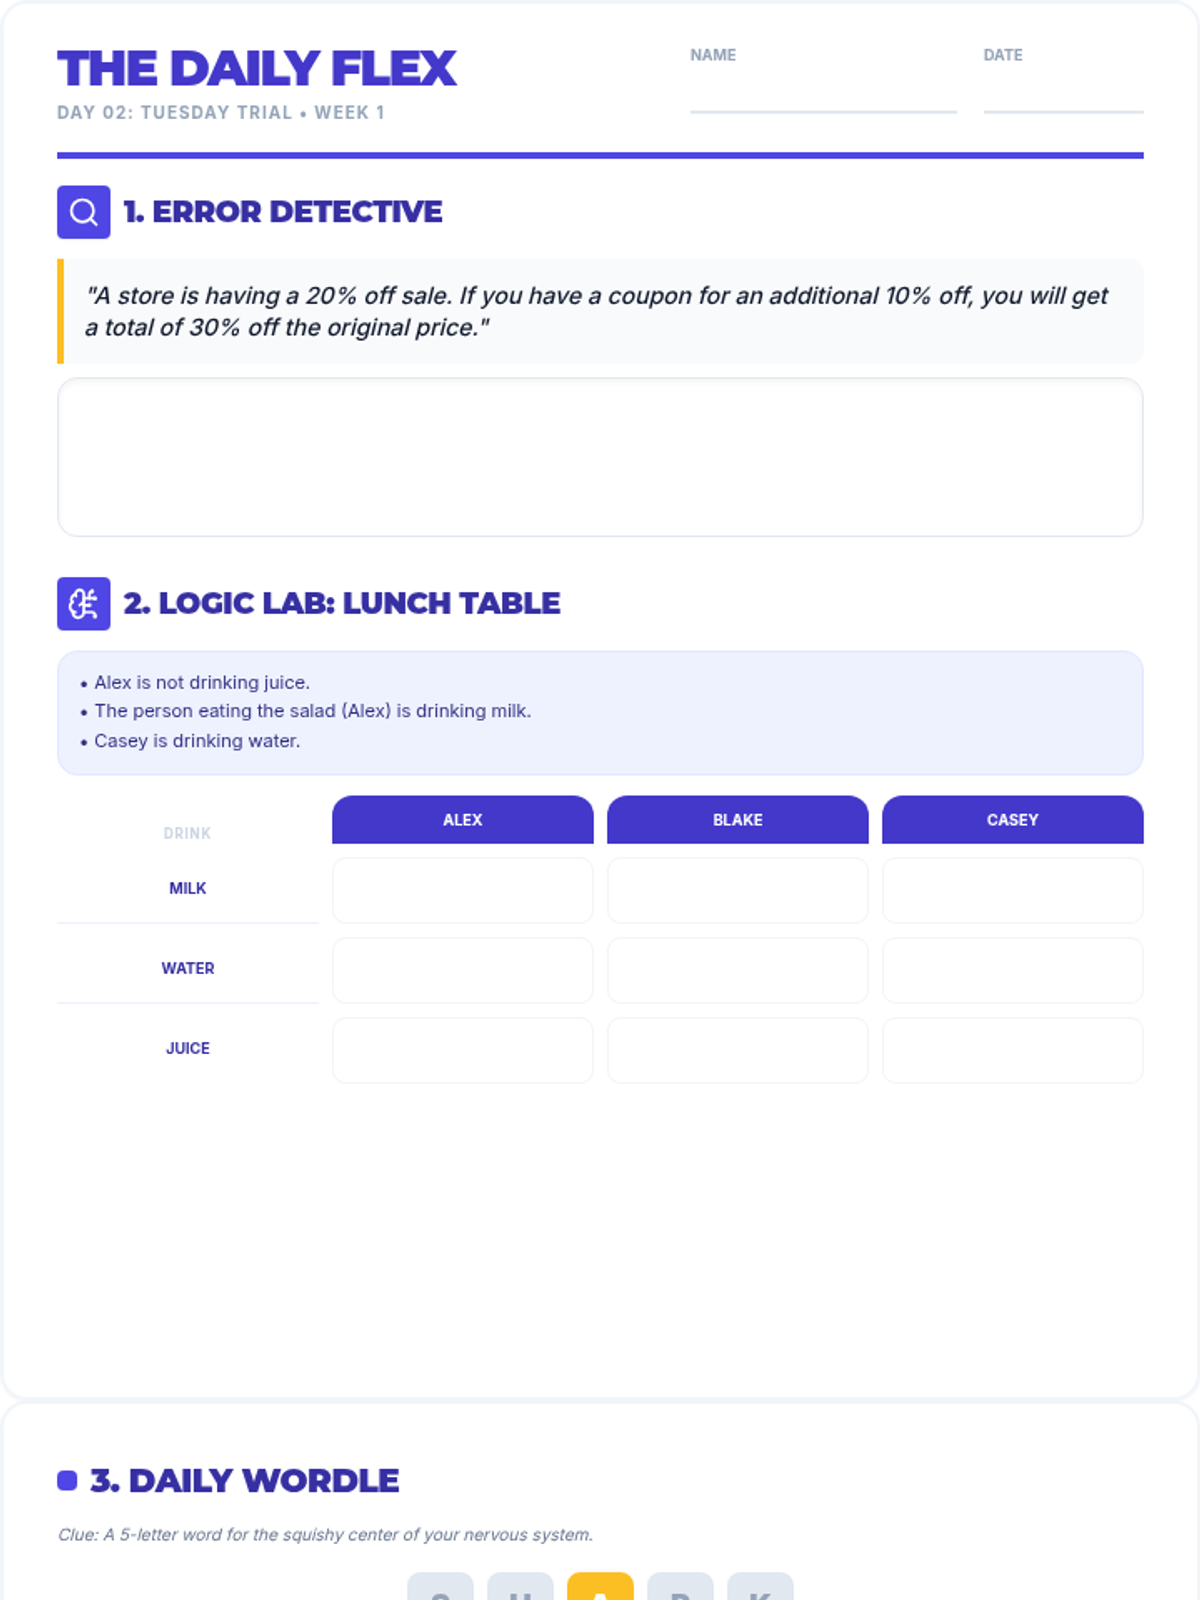
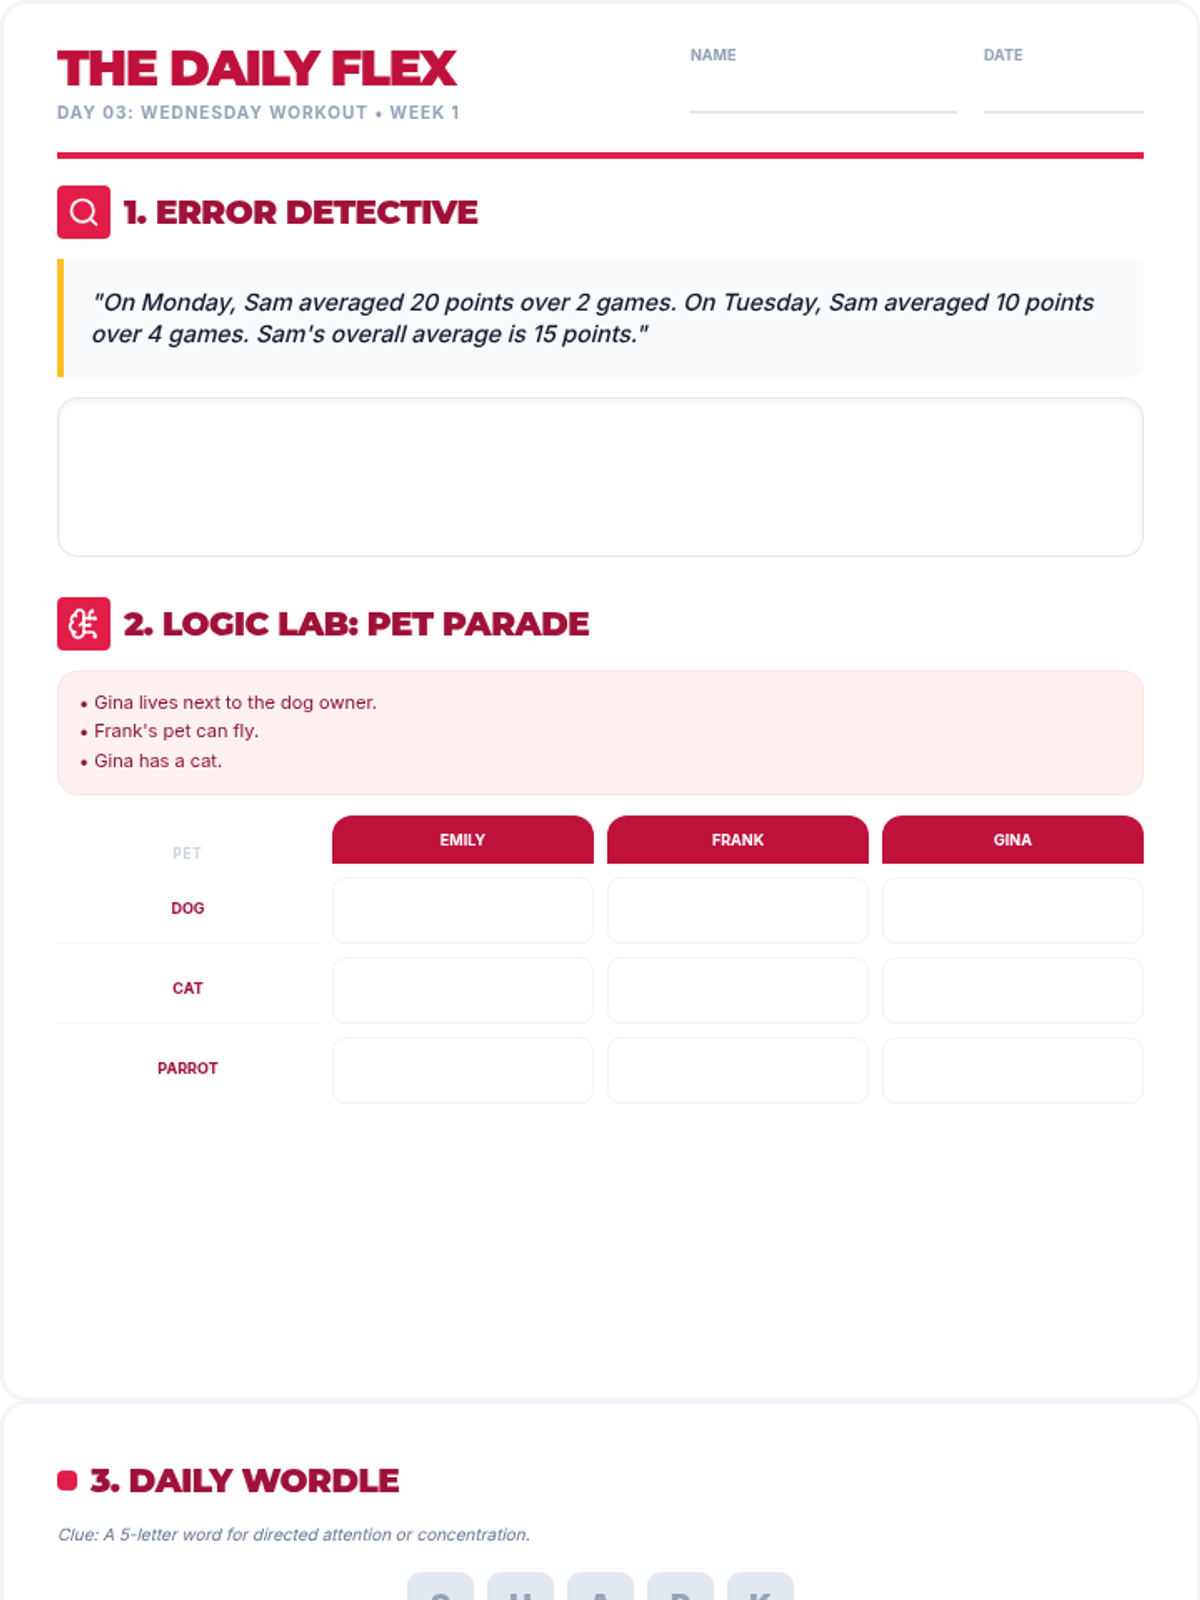
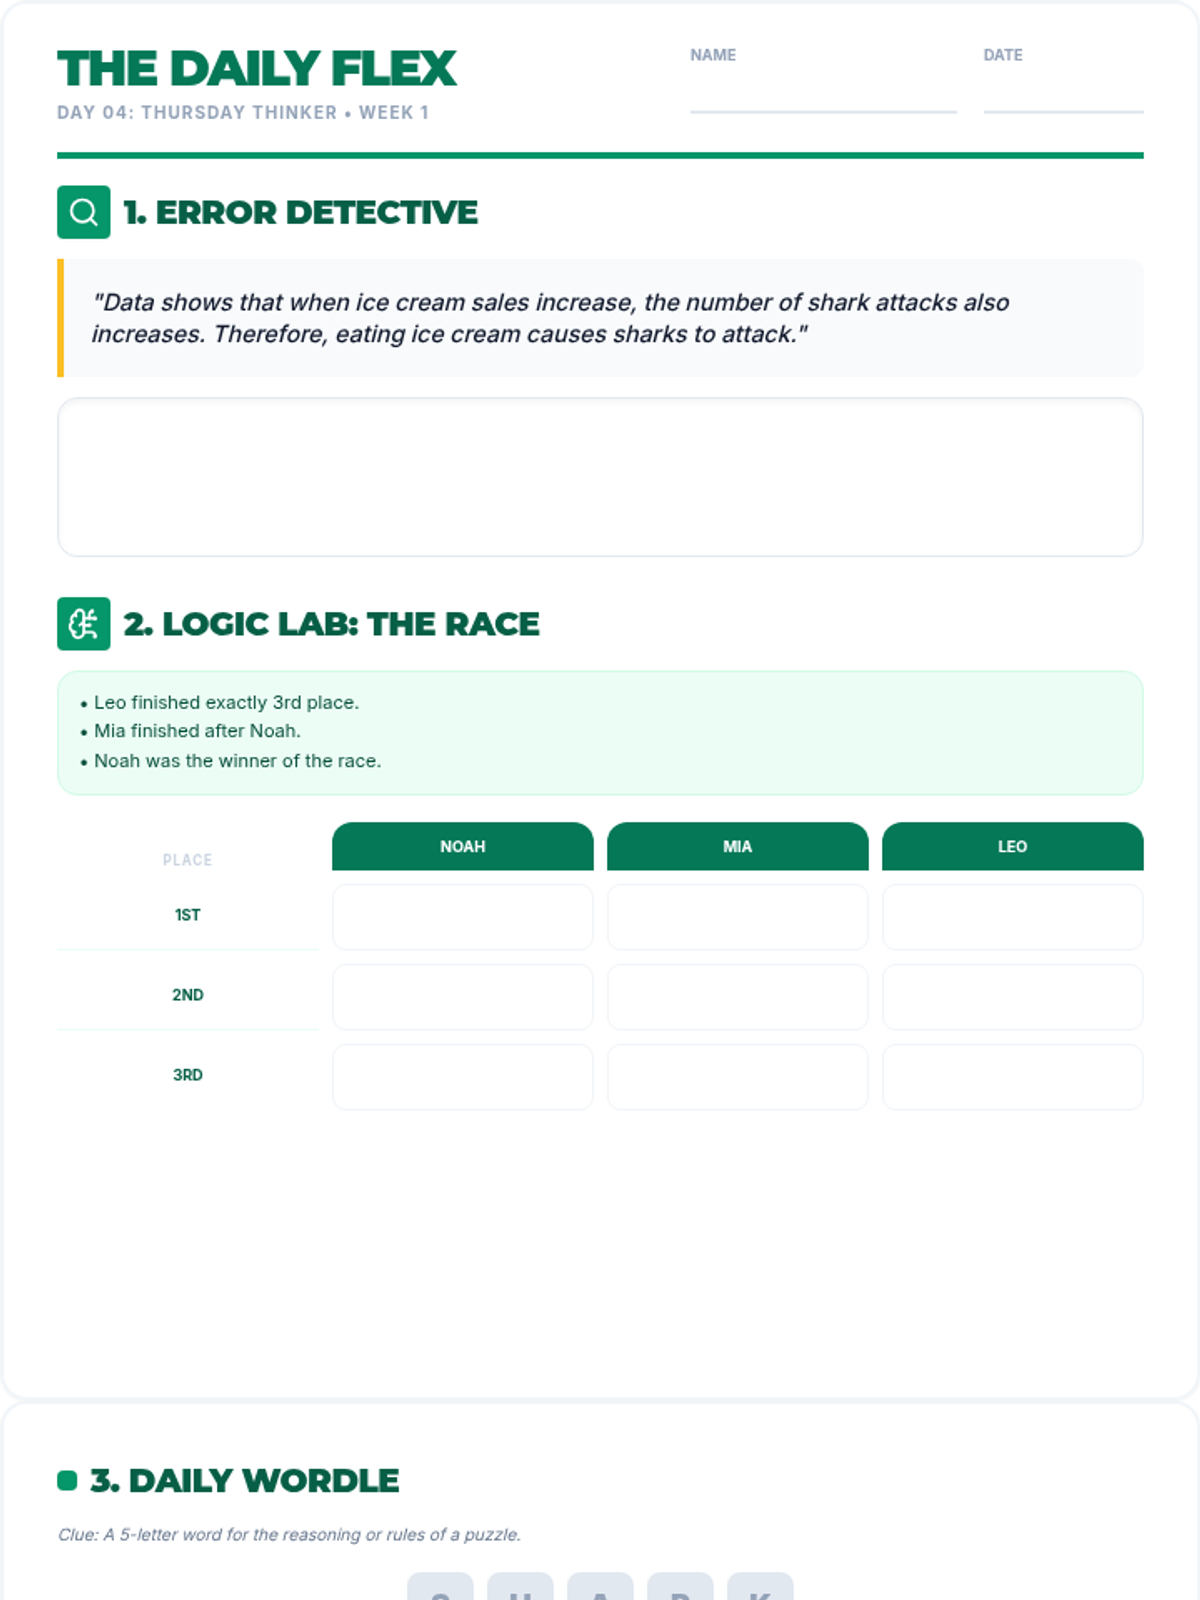
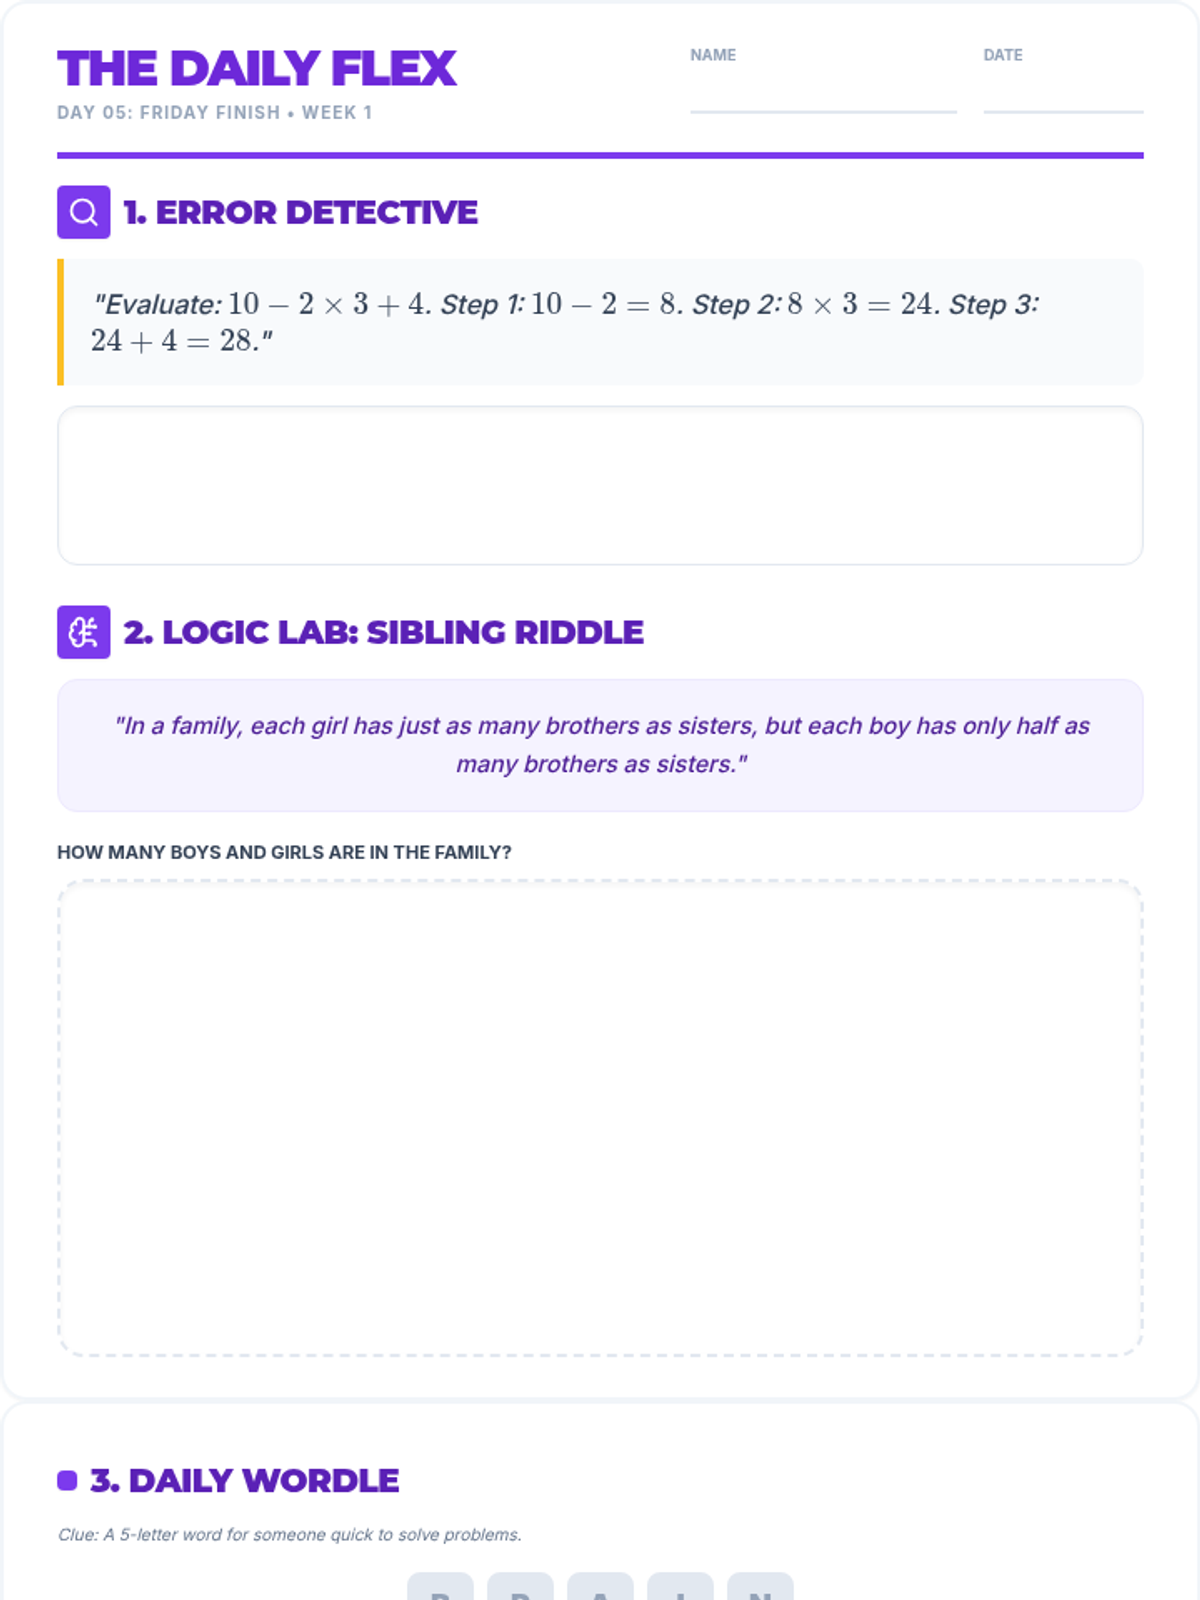
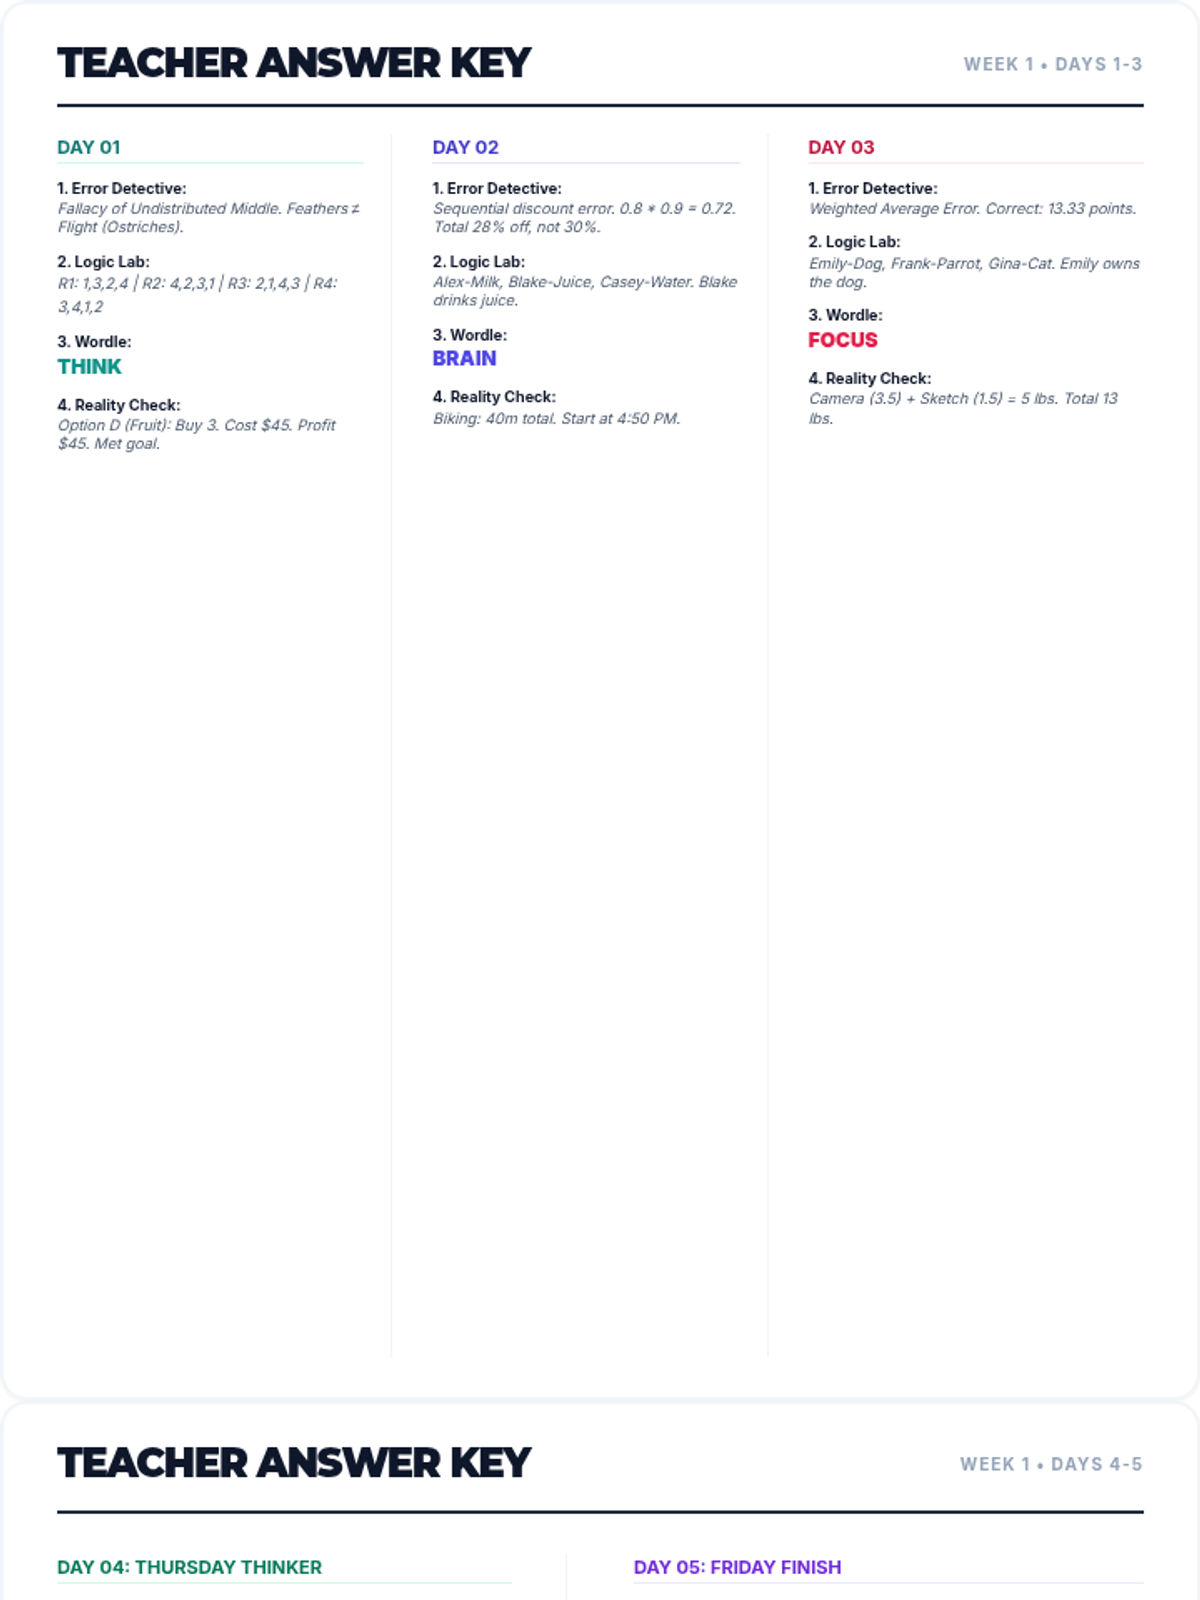
A 5-day series of morning work activities for 7th graders designed to sharpen critical thinking through error analysis, logic puzzles, open-ended problems, and real-world tasks.
A unit focused on statistics and data analysis, teaching students how to interpret, compare, and draw conclusions from various data sets.
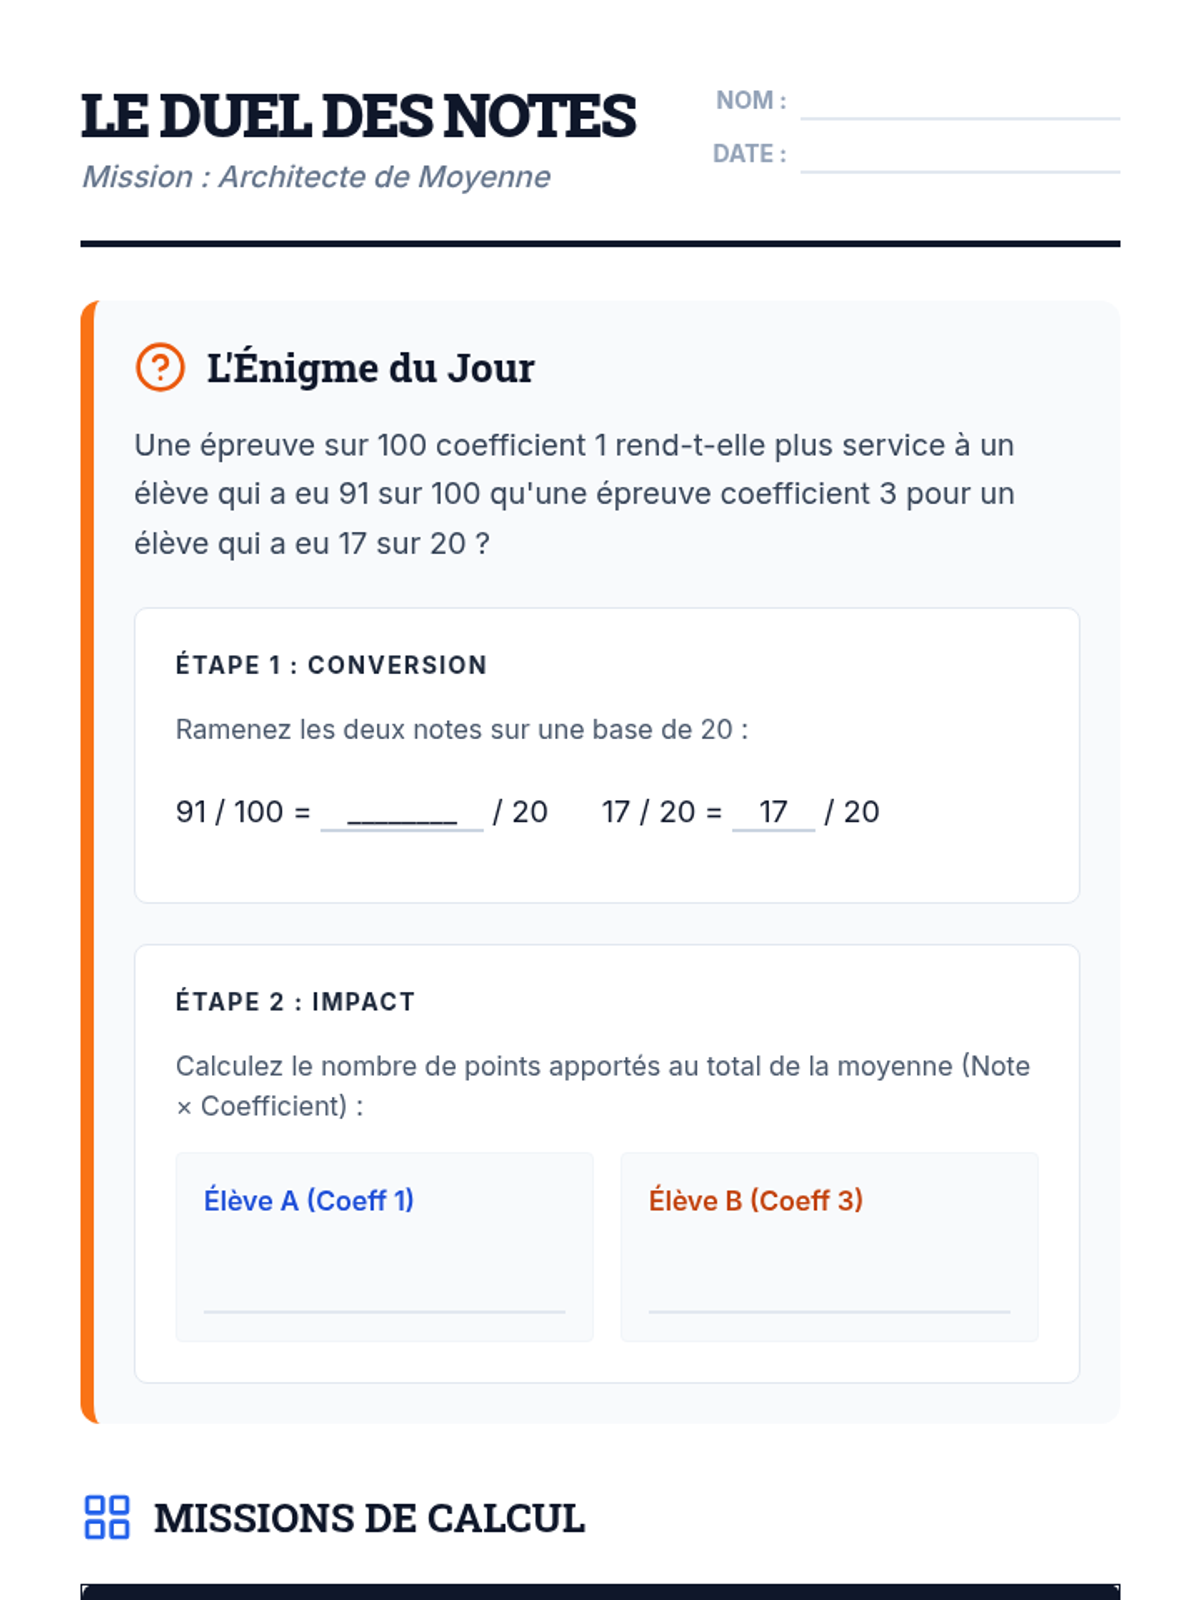
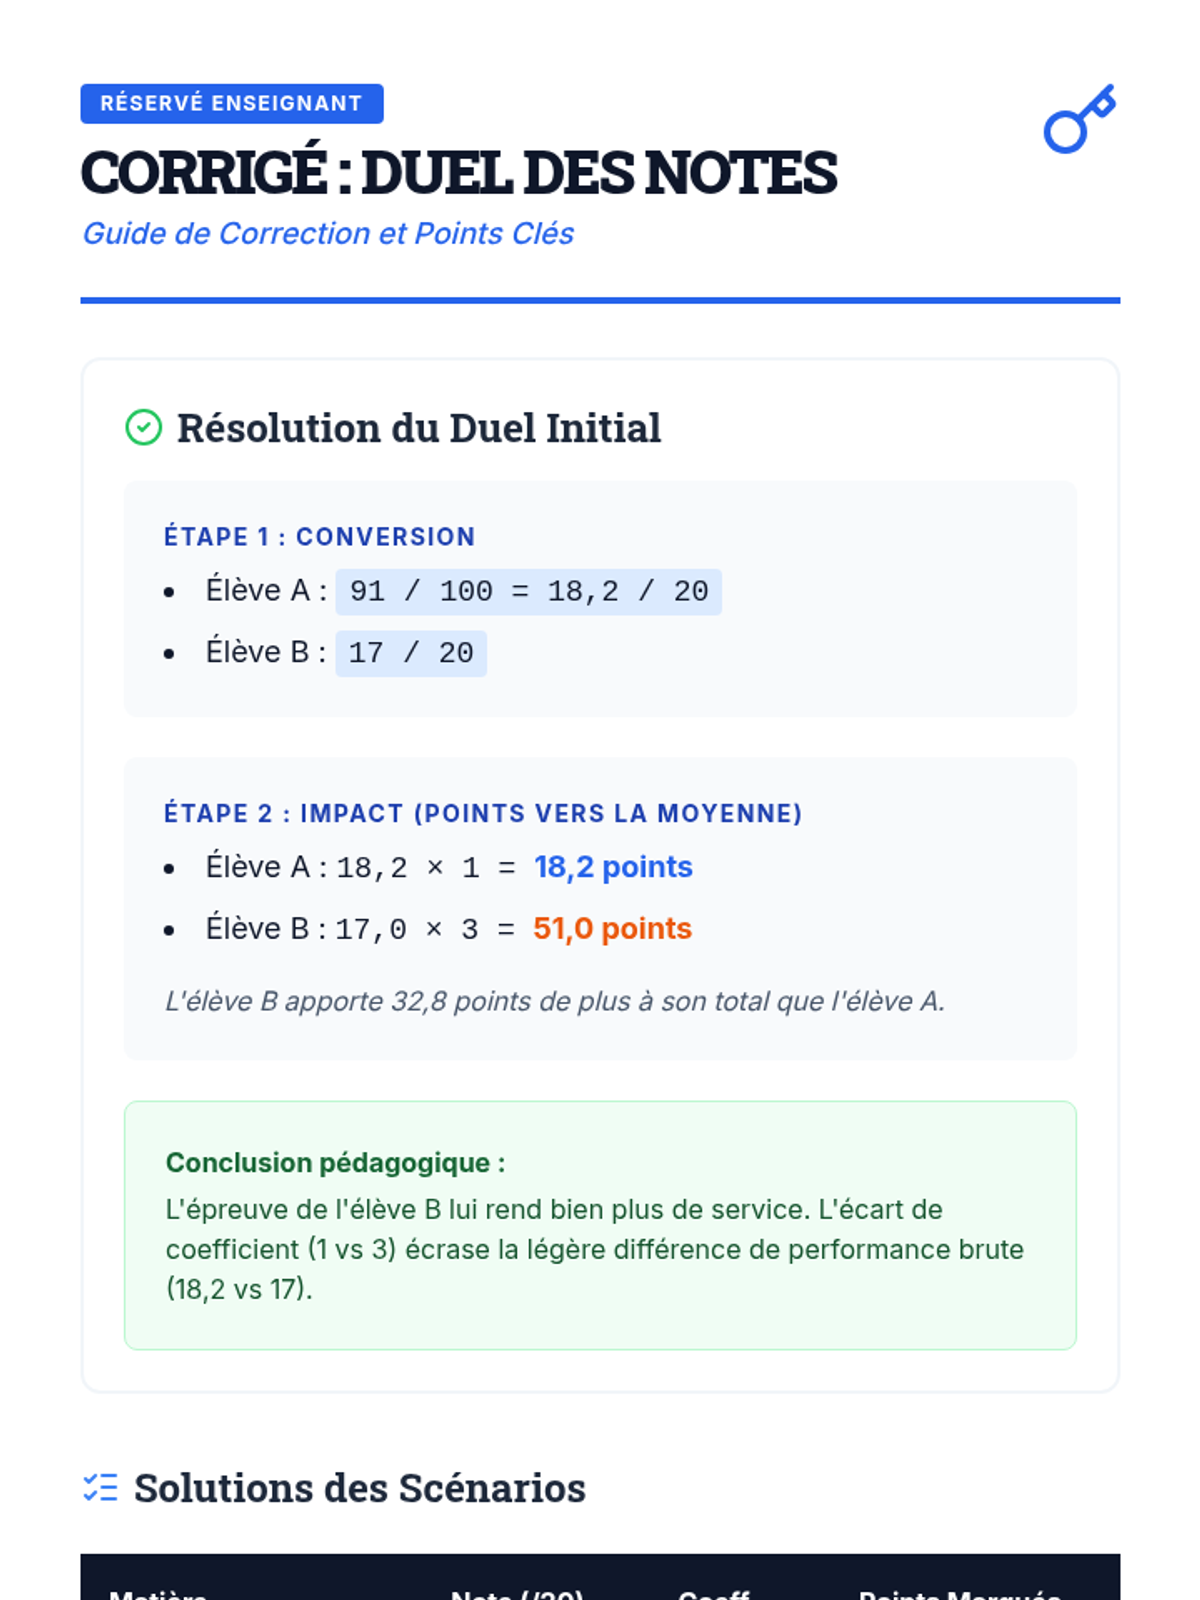
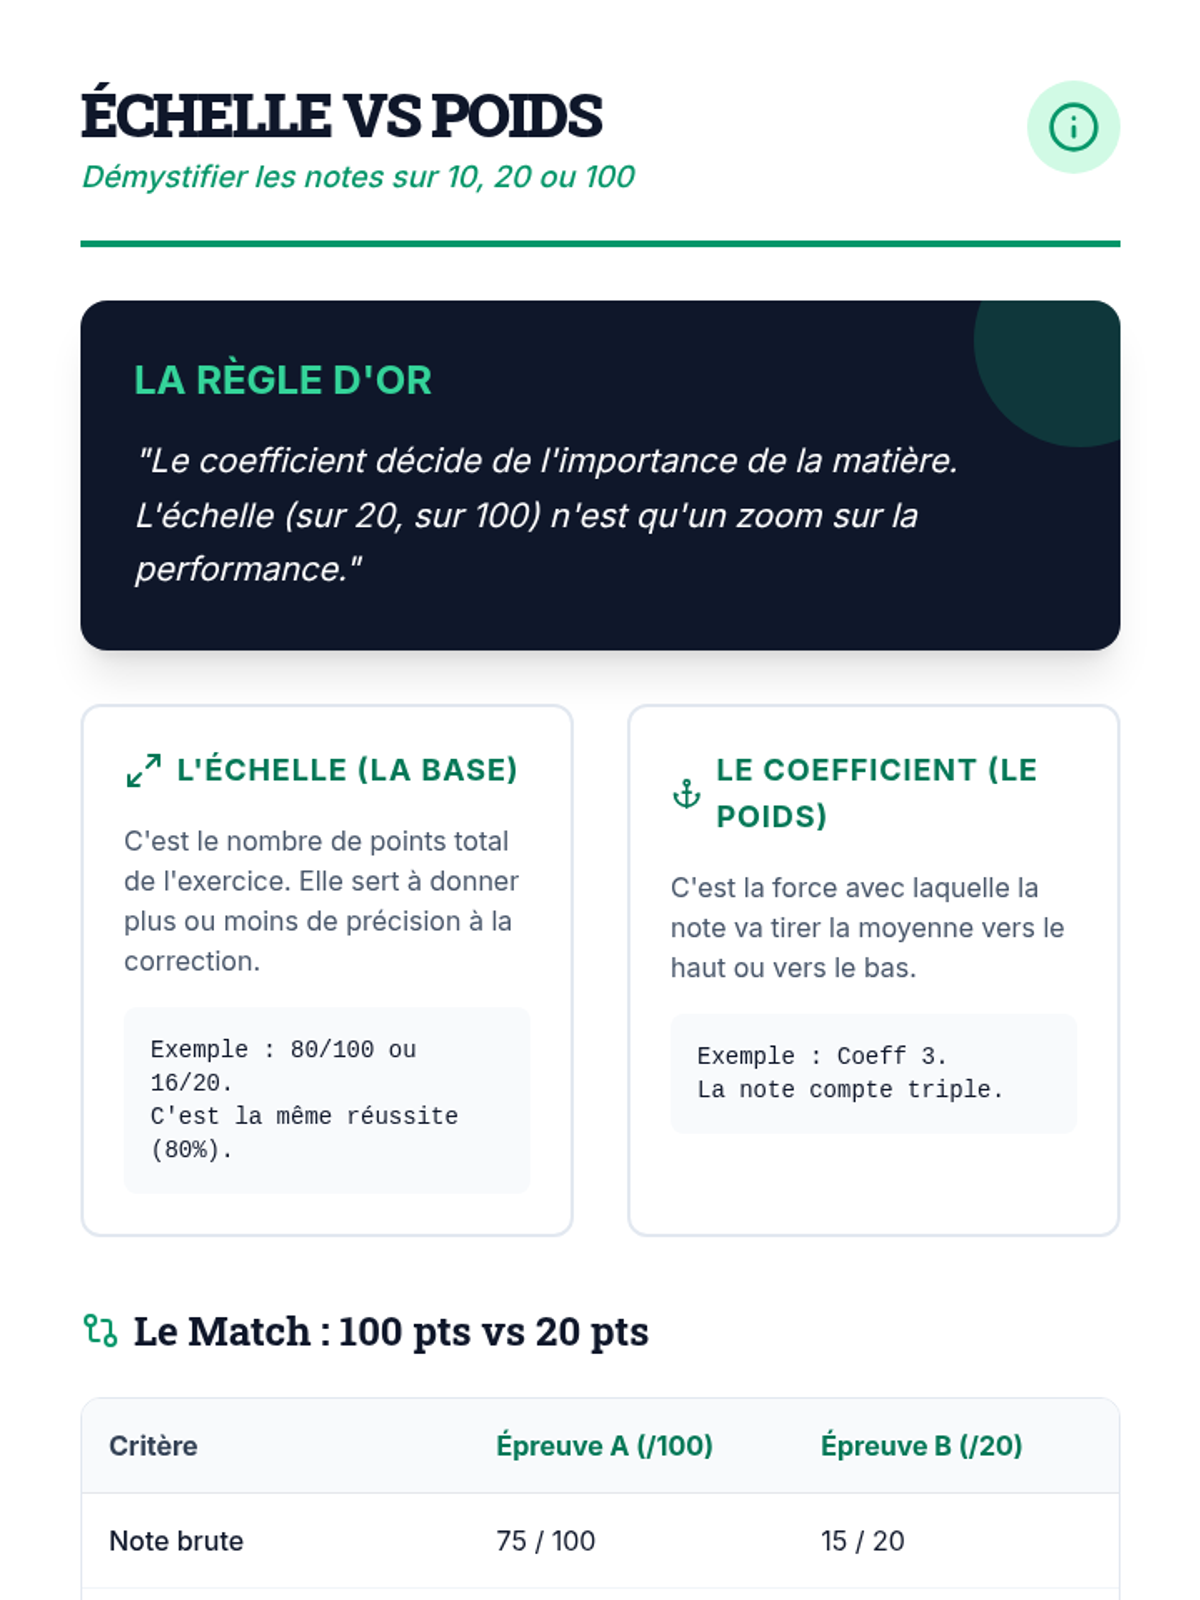
Une exploration mathématique de l'impact des coefficients sur les moyennes, utilisant des cas pratiques concrets pour comprendre la pondération et les moyennes pondérées.
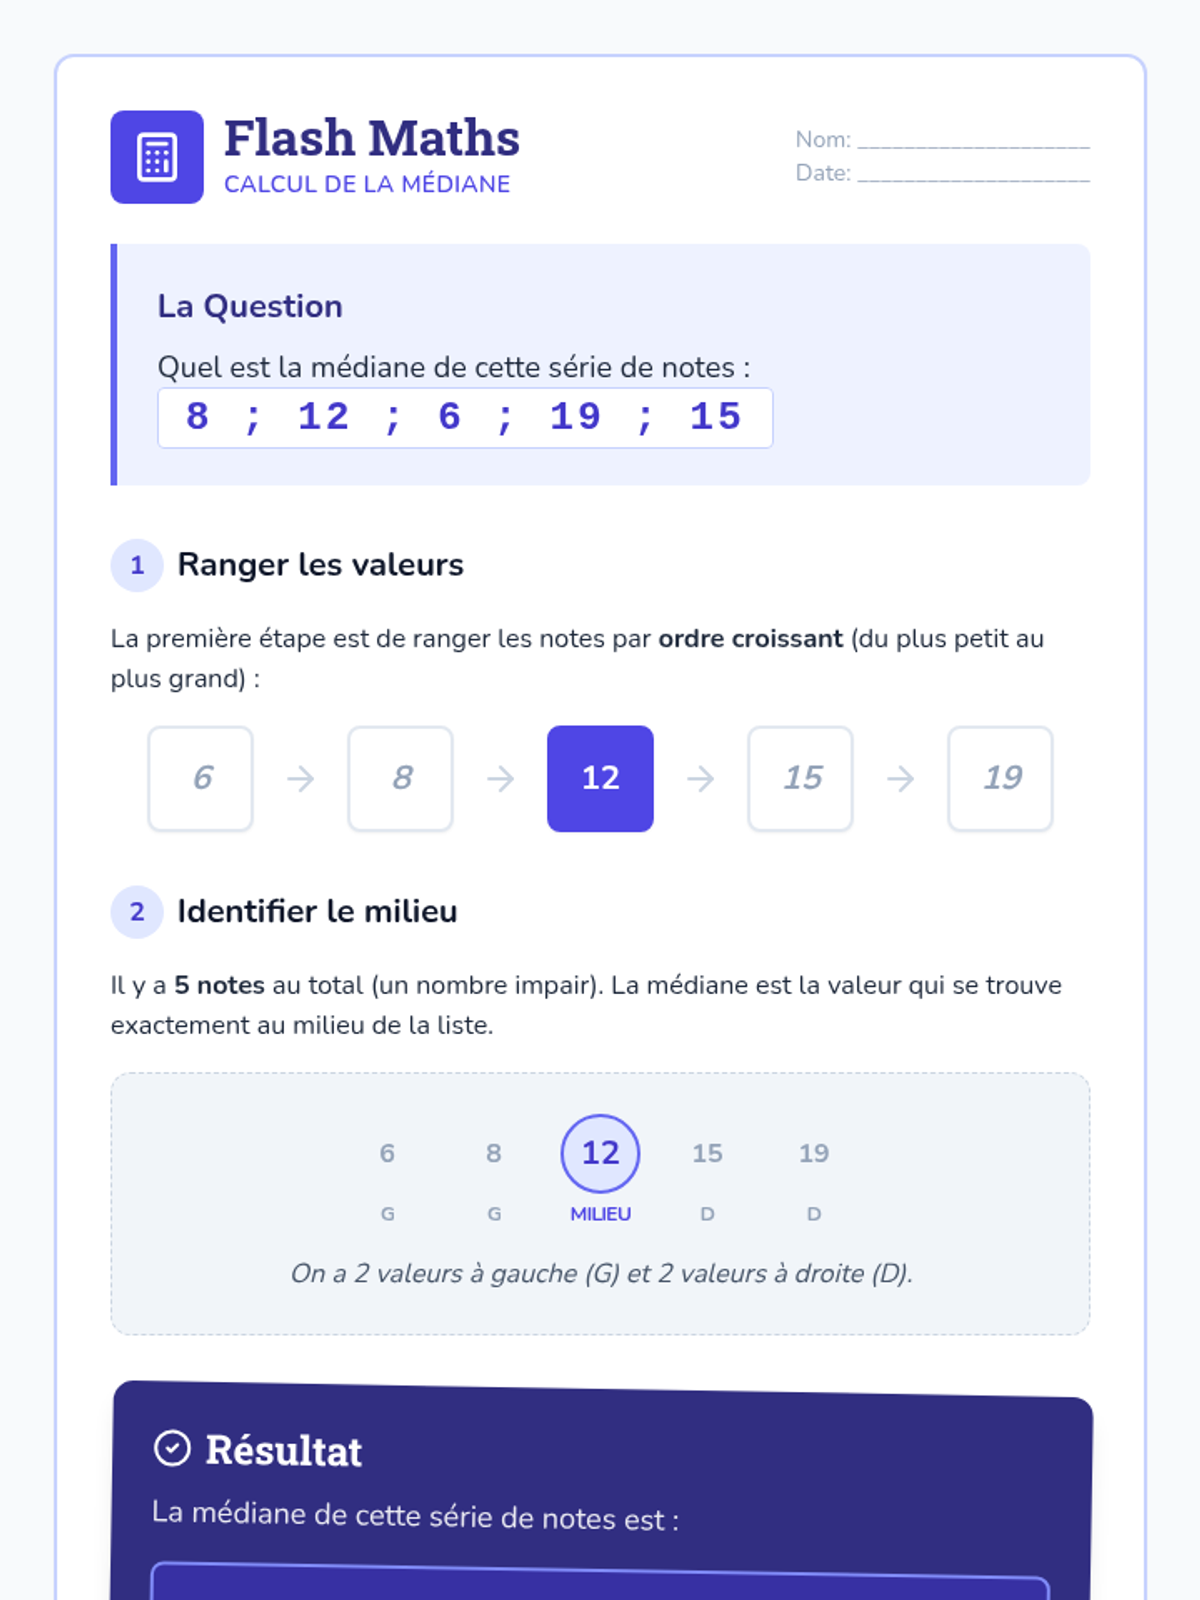
Une série de ressources éducatives couvrant divers concepts mathématiques essentiels comme les statistiques et la trigonométrie.
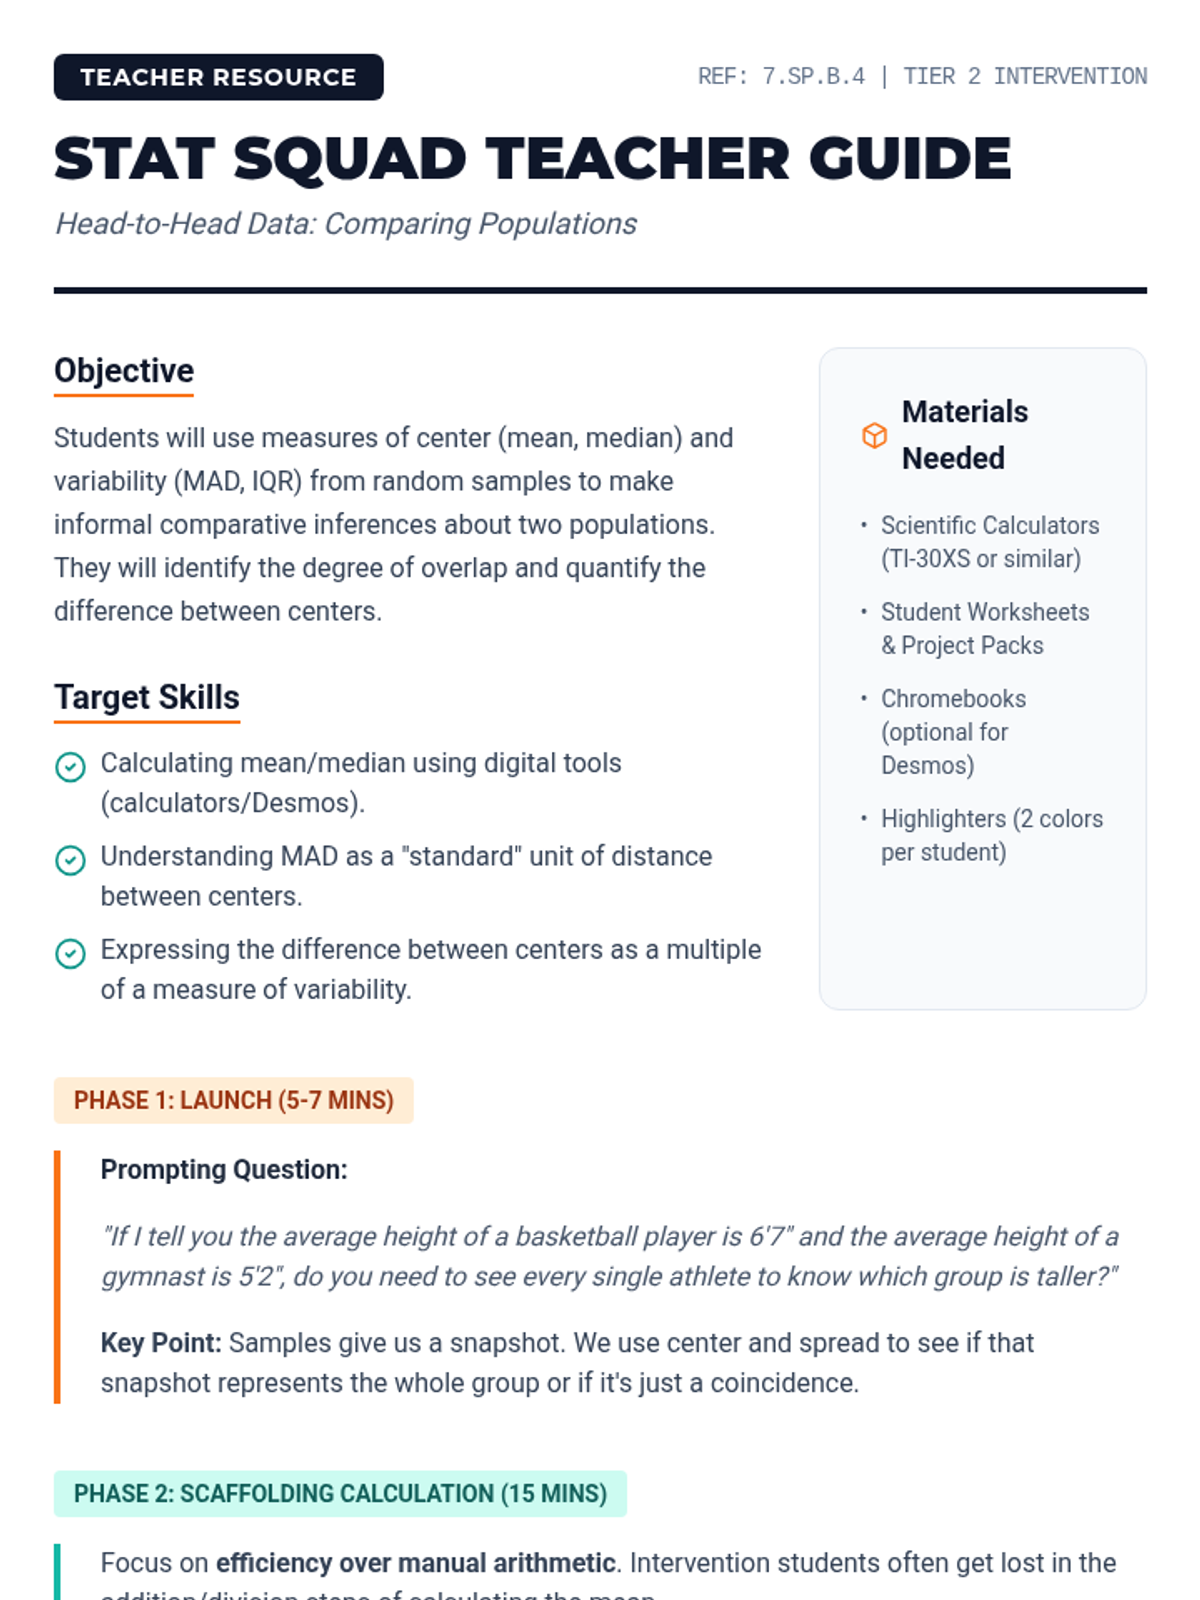
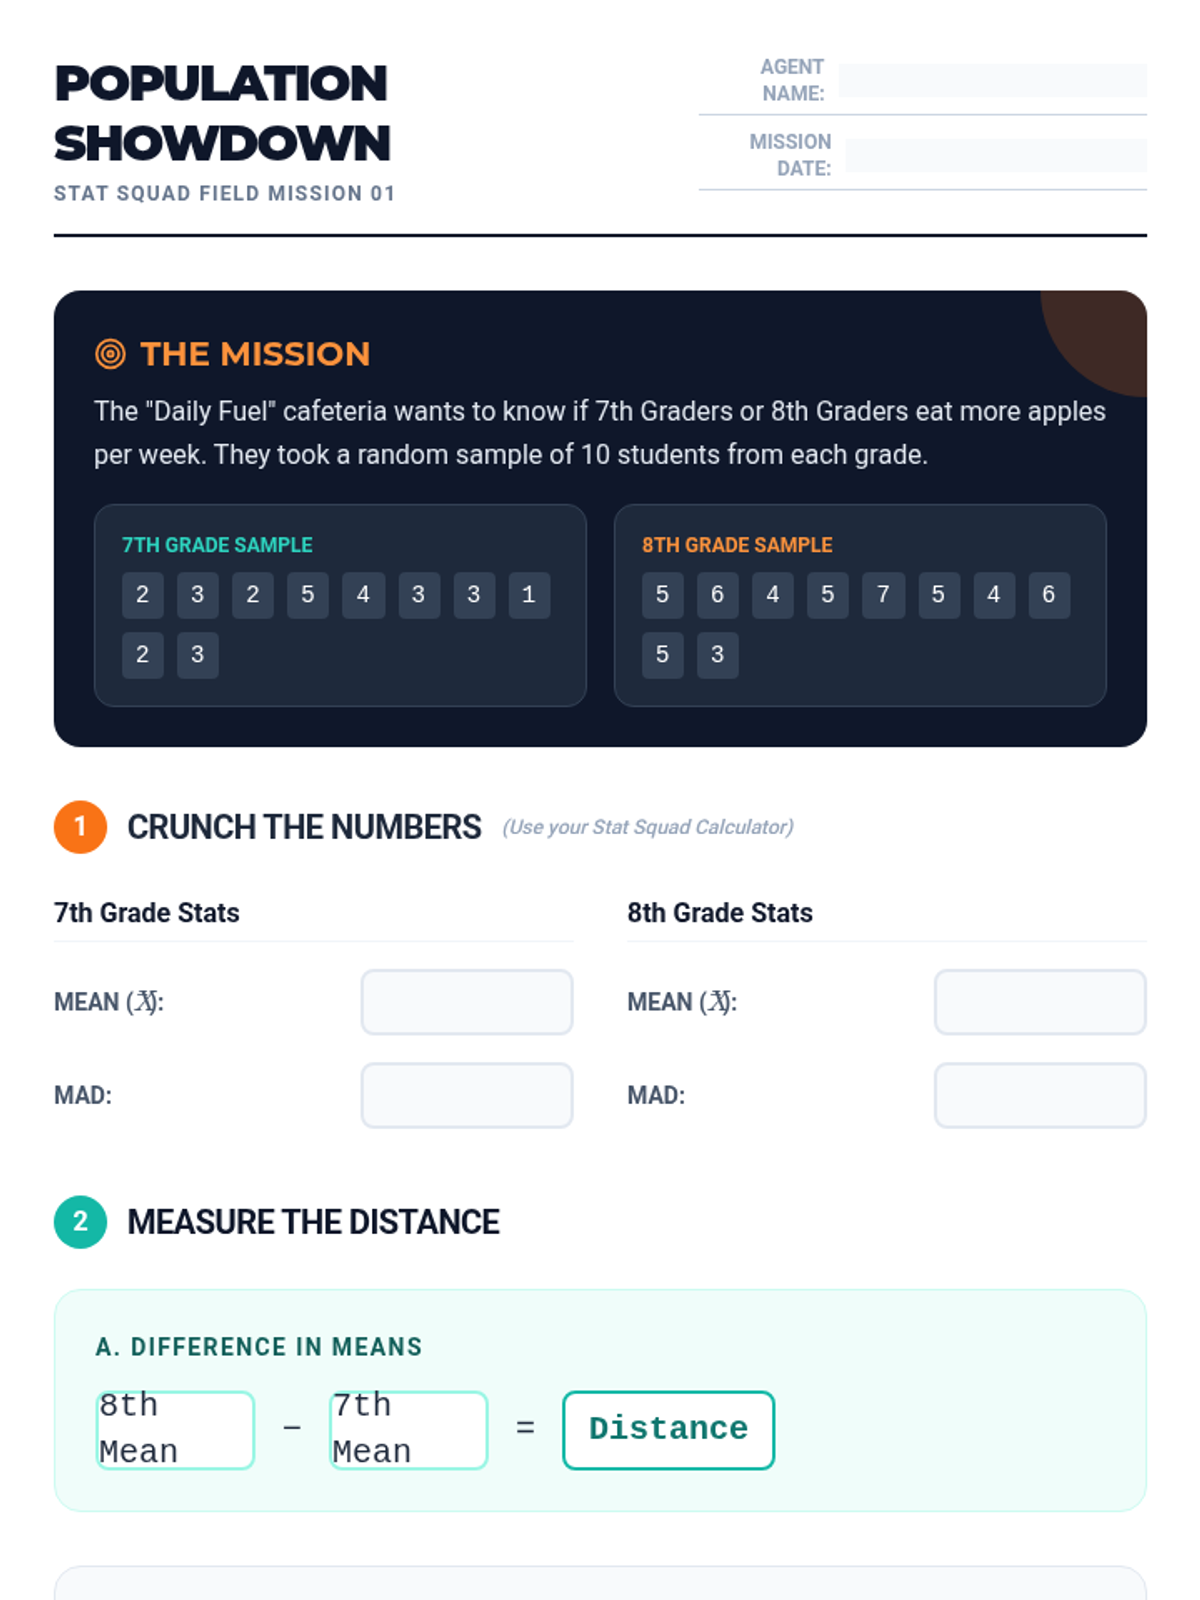
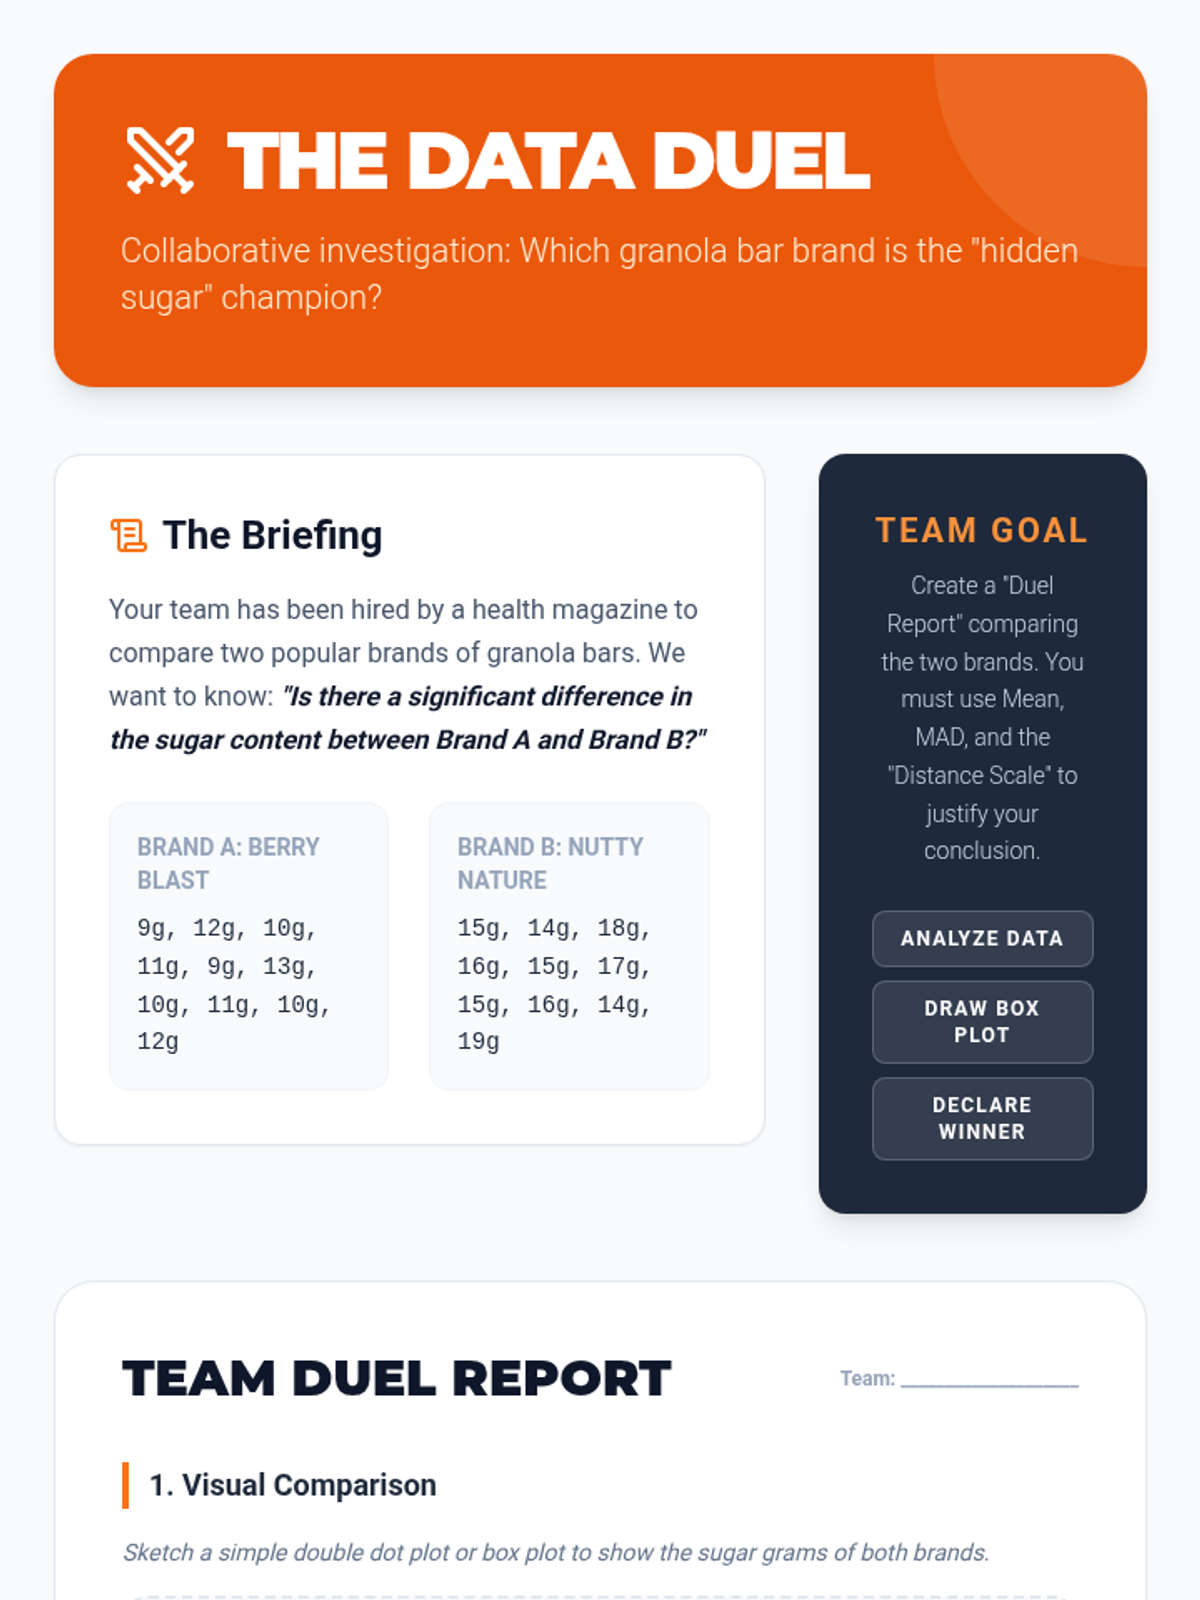
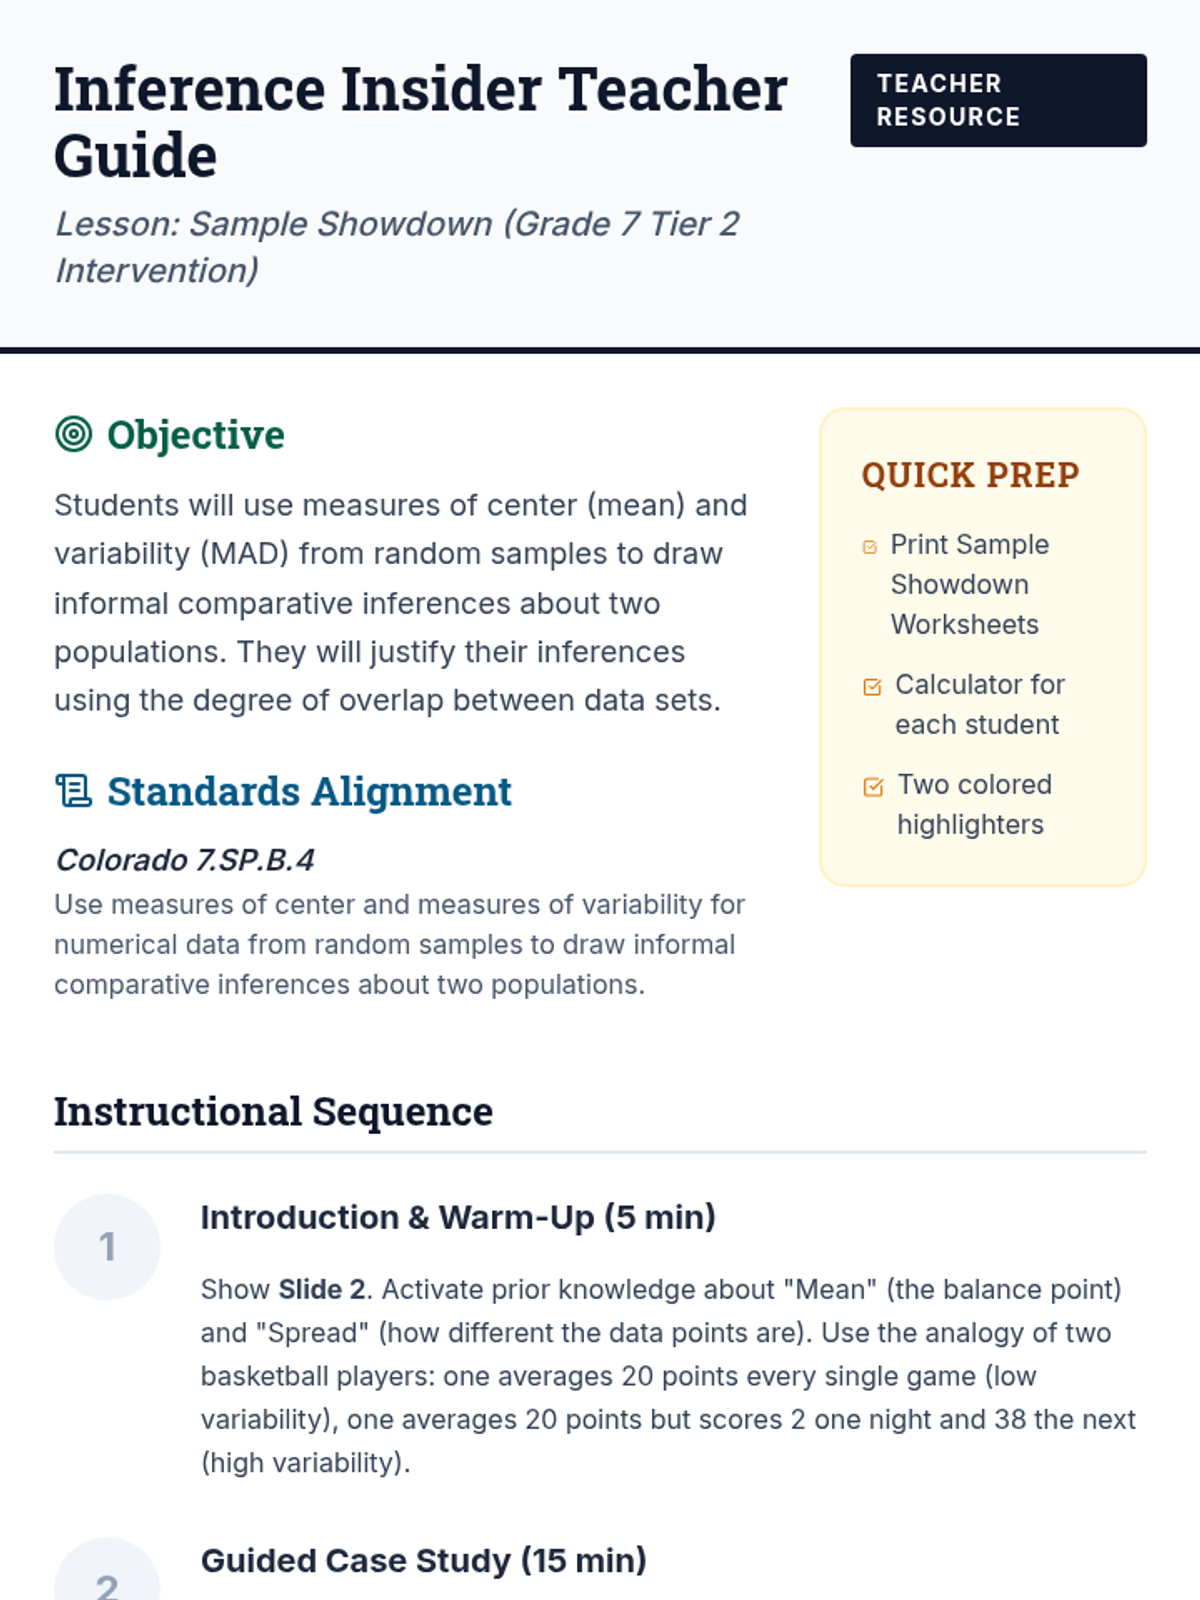
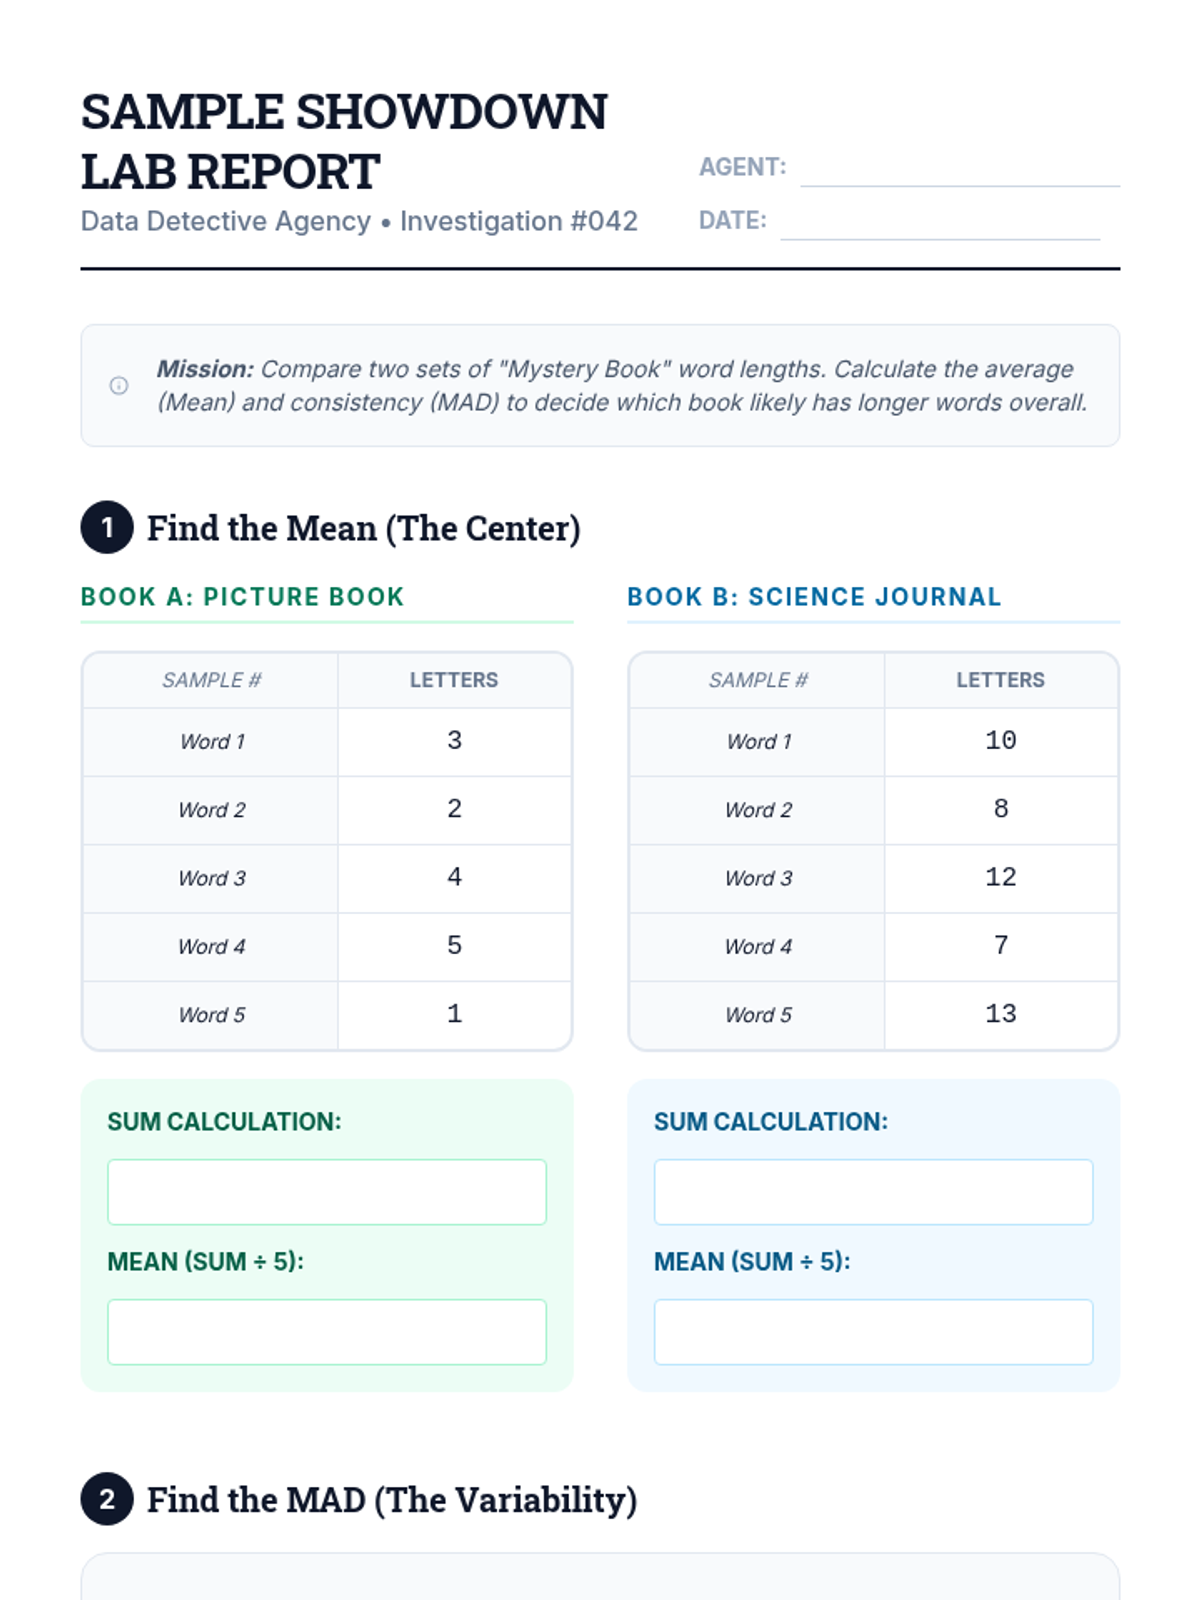
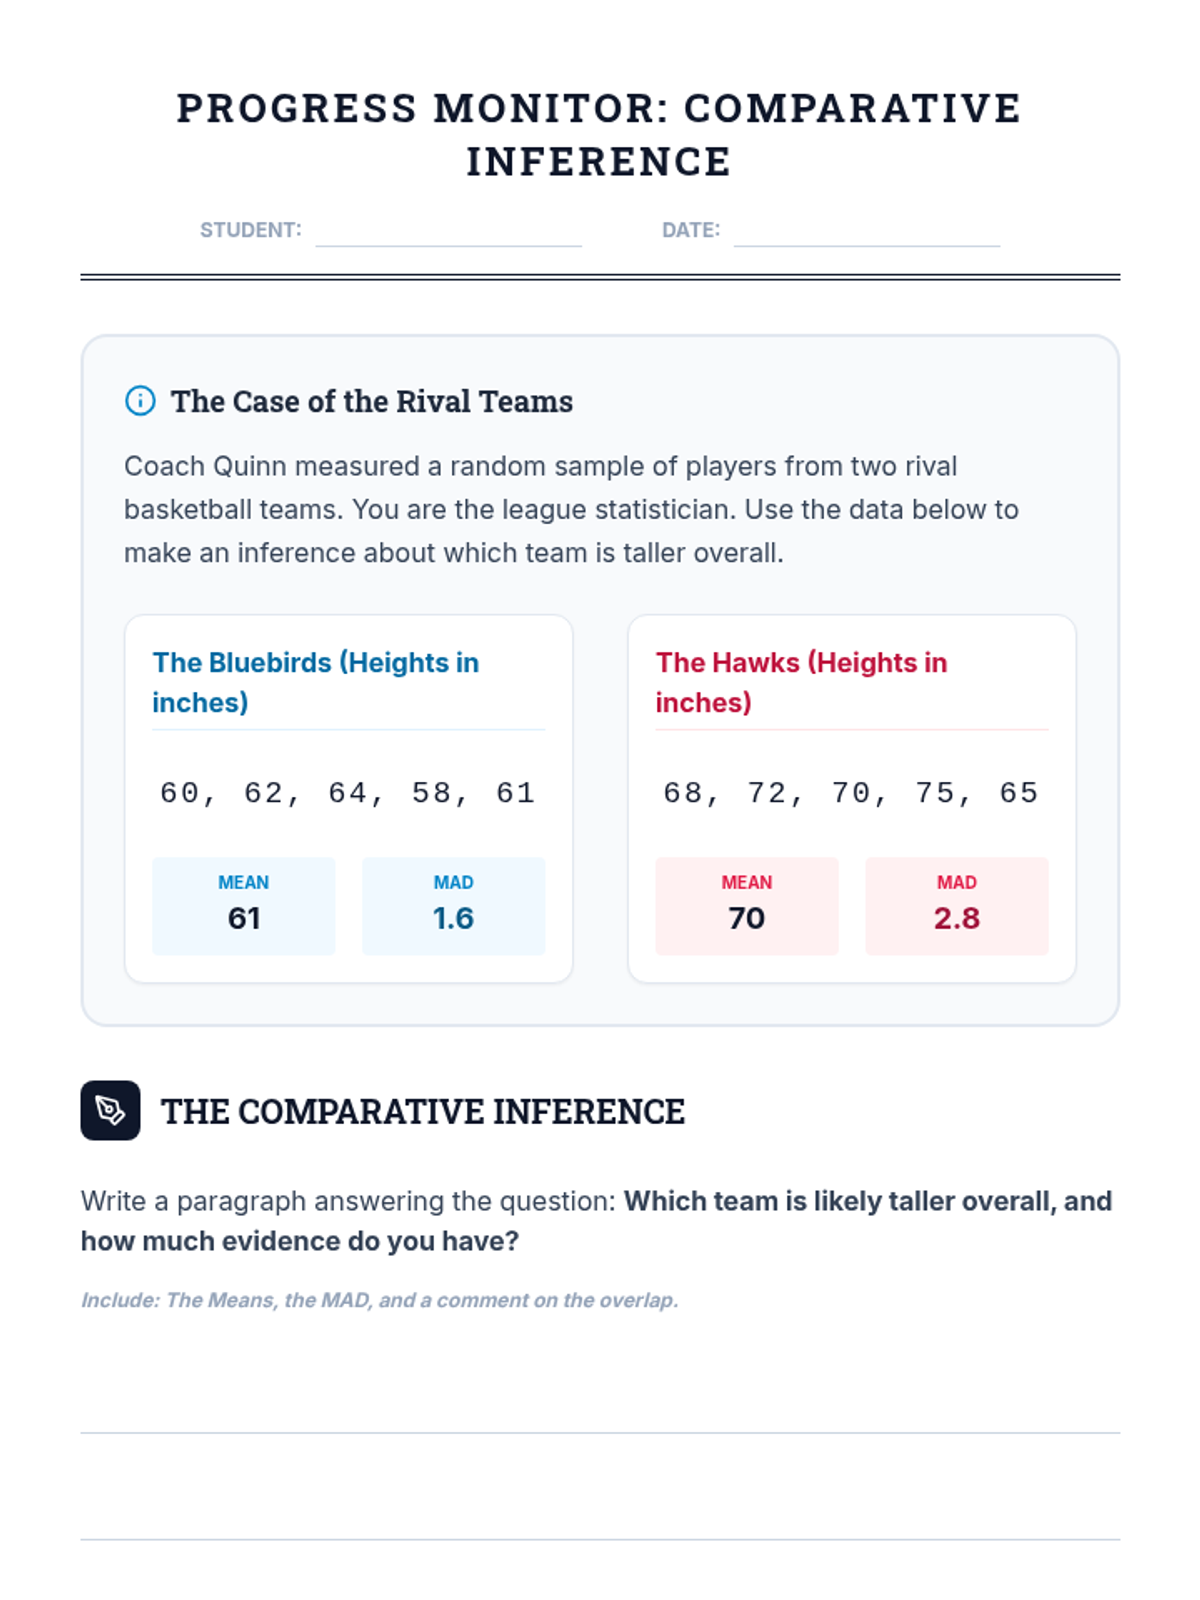
A targeted intervention sequence focused on helping students use measures of center and variability to compare two different populations from sample data. Students engage in scaffolded calculations and collaborative projects to build statistical reasoning.
A specialized intervention sequence focused on data analysis and informal inferences, helping students bridge the gap between calculating statistics and interpreting their real-world meaning through comparative analysis.
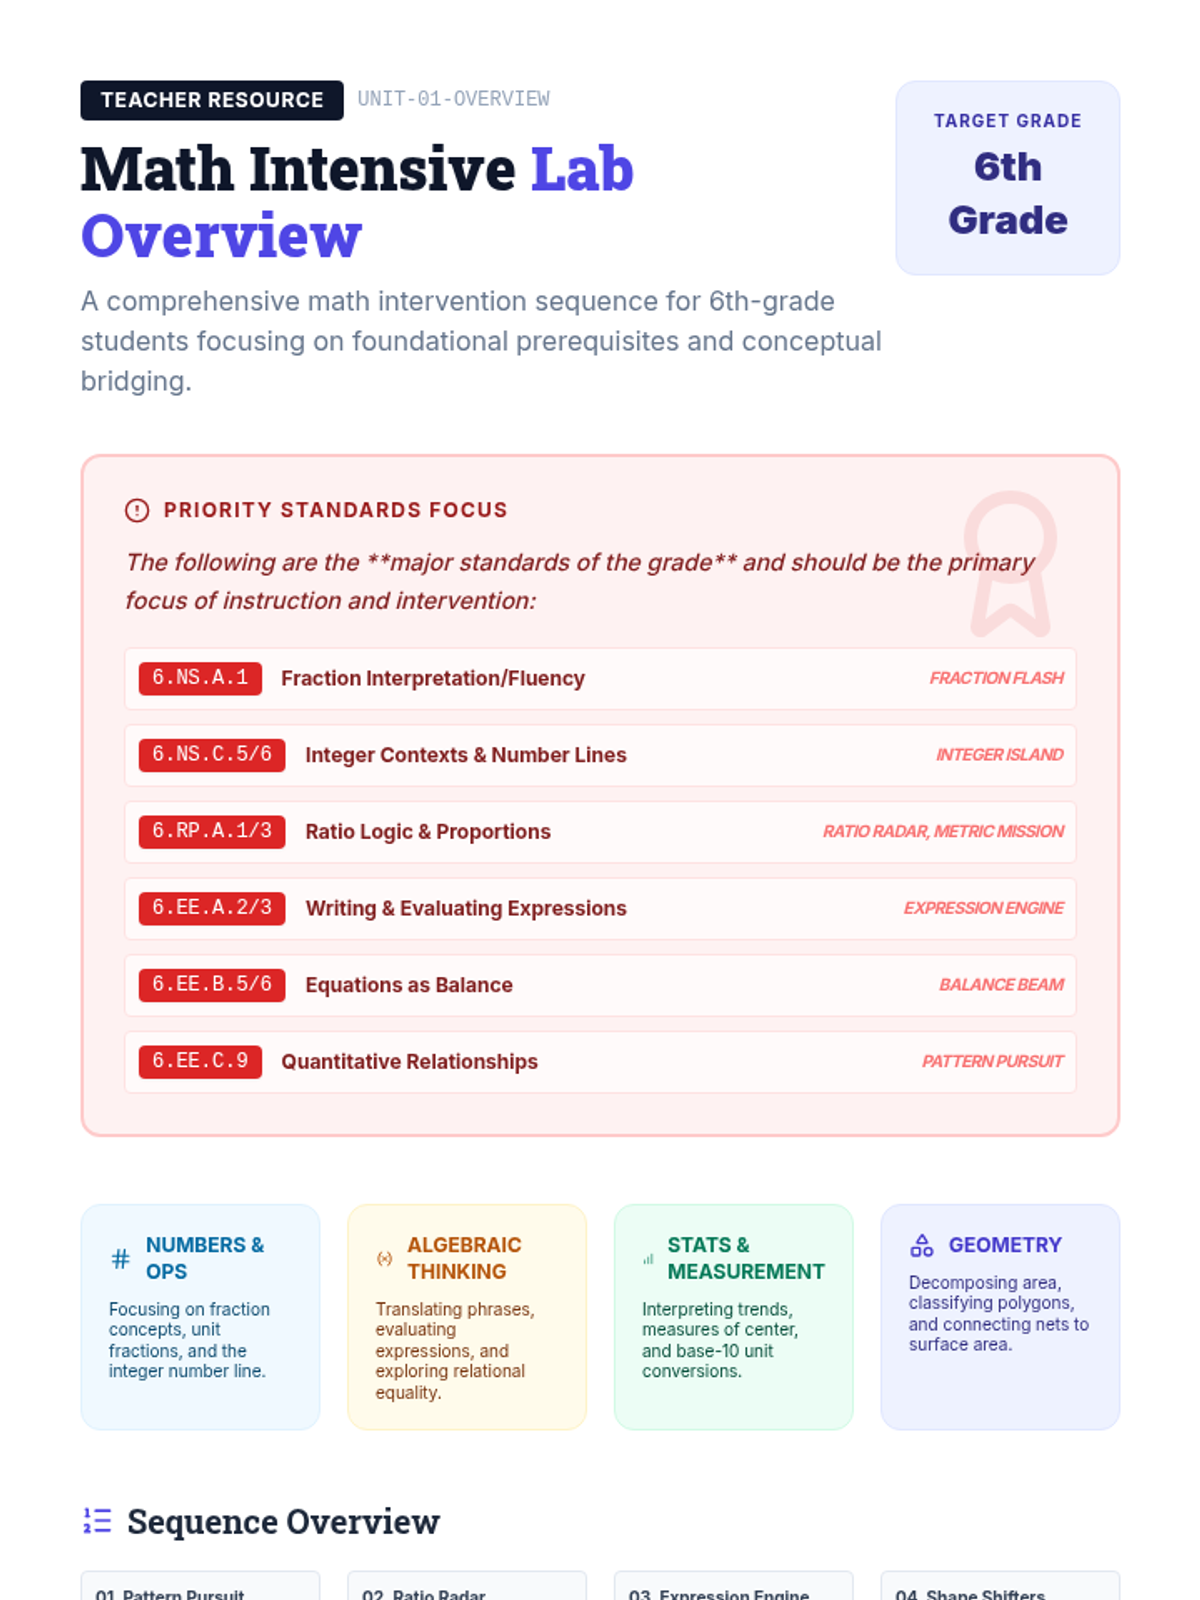
A comprehensive math intervention sequence for 6th-grade students, focusing on four key domains: Numbers & Operations, Algebraic Thinking, Measurement & Data, and Geometry. This sequence uses high-leverage strategies from the All Learners Network (ALN) and aligns with i-Ready prerequisite modules to bridge conceptual gaps.
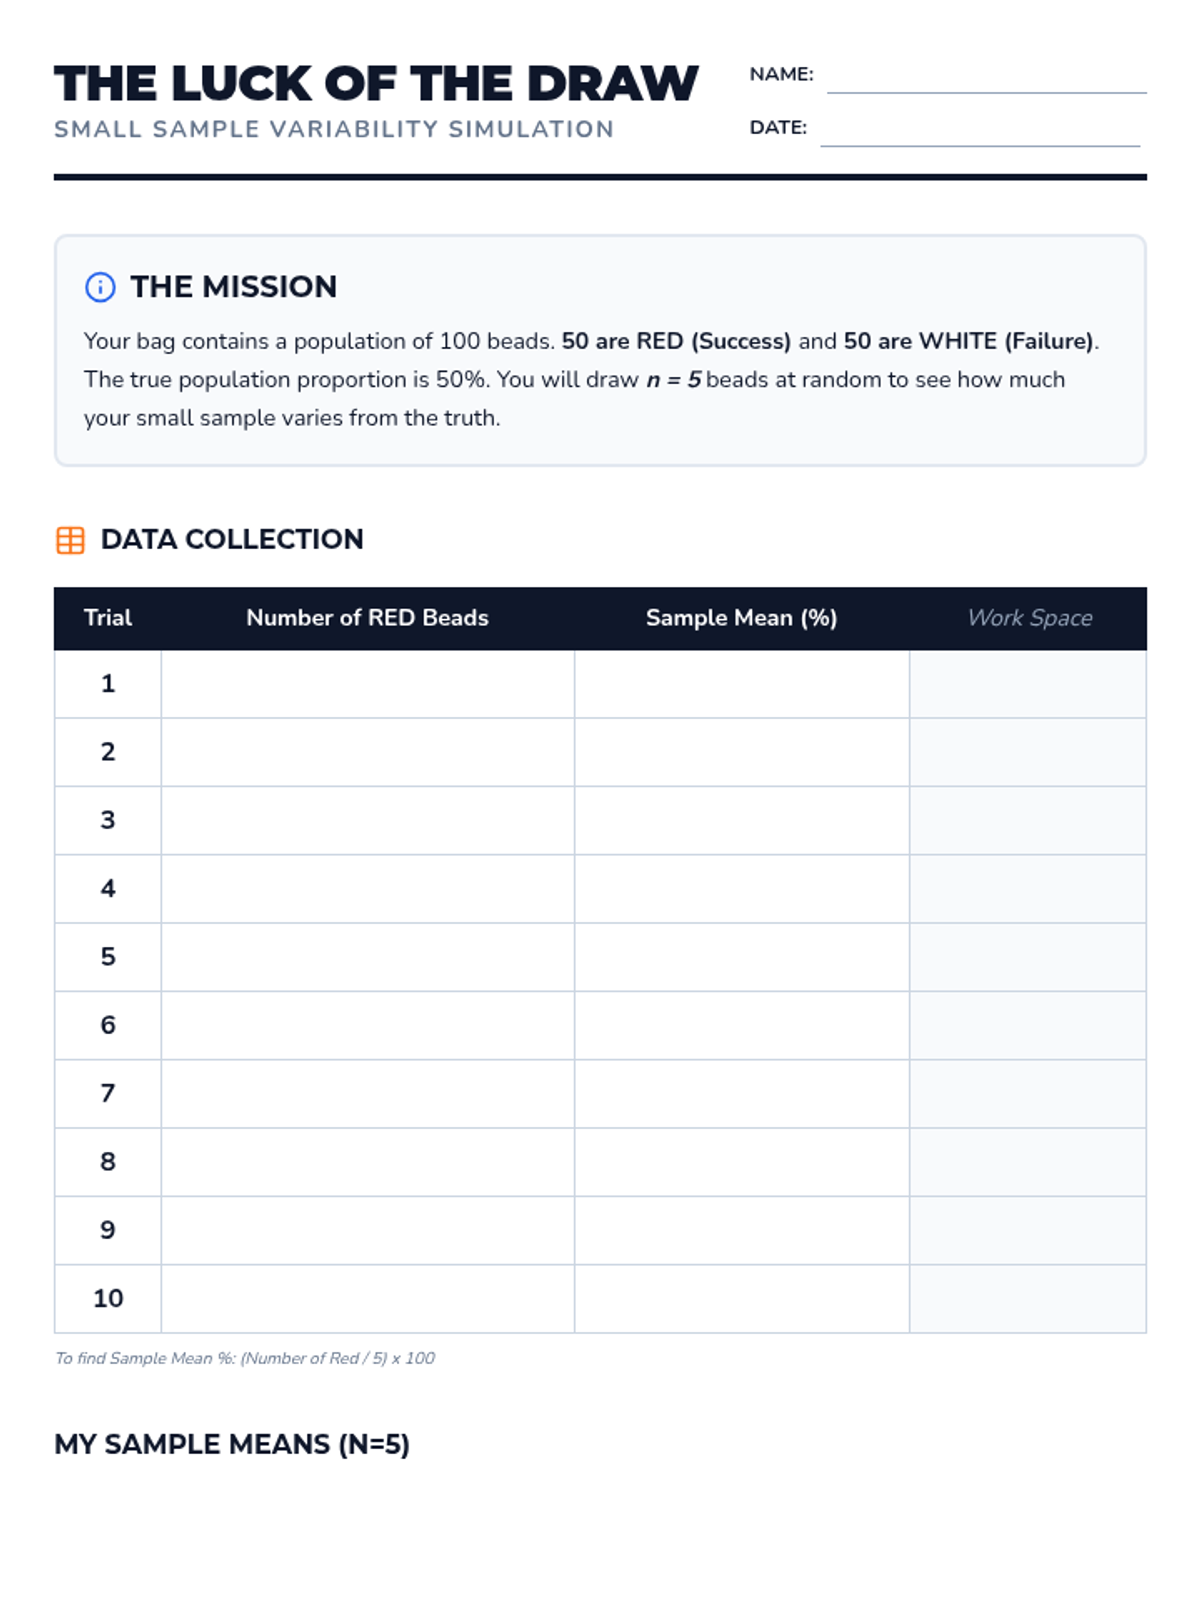
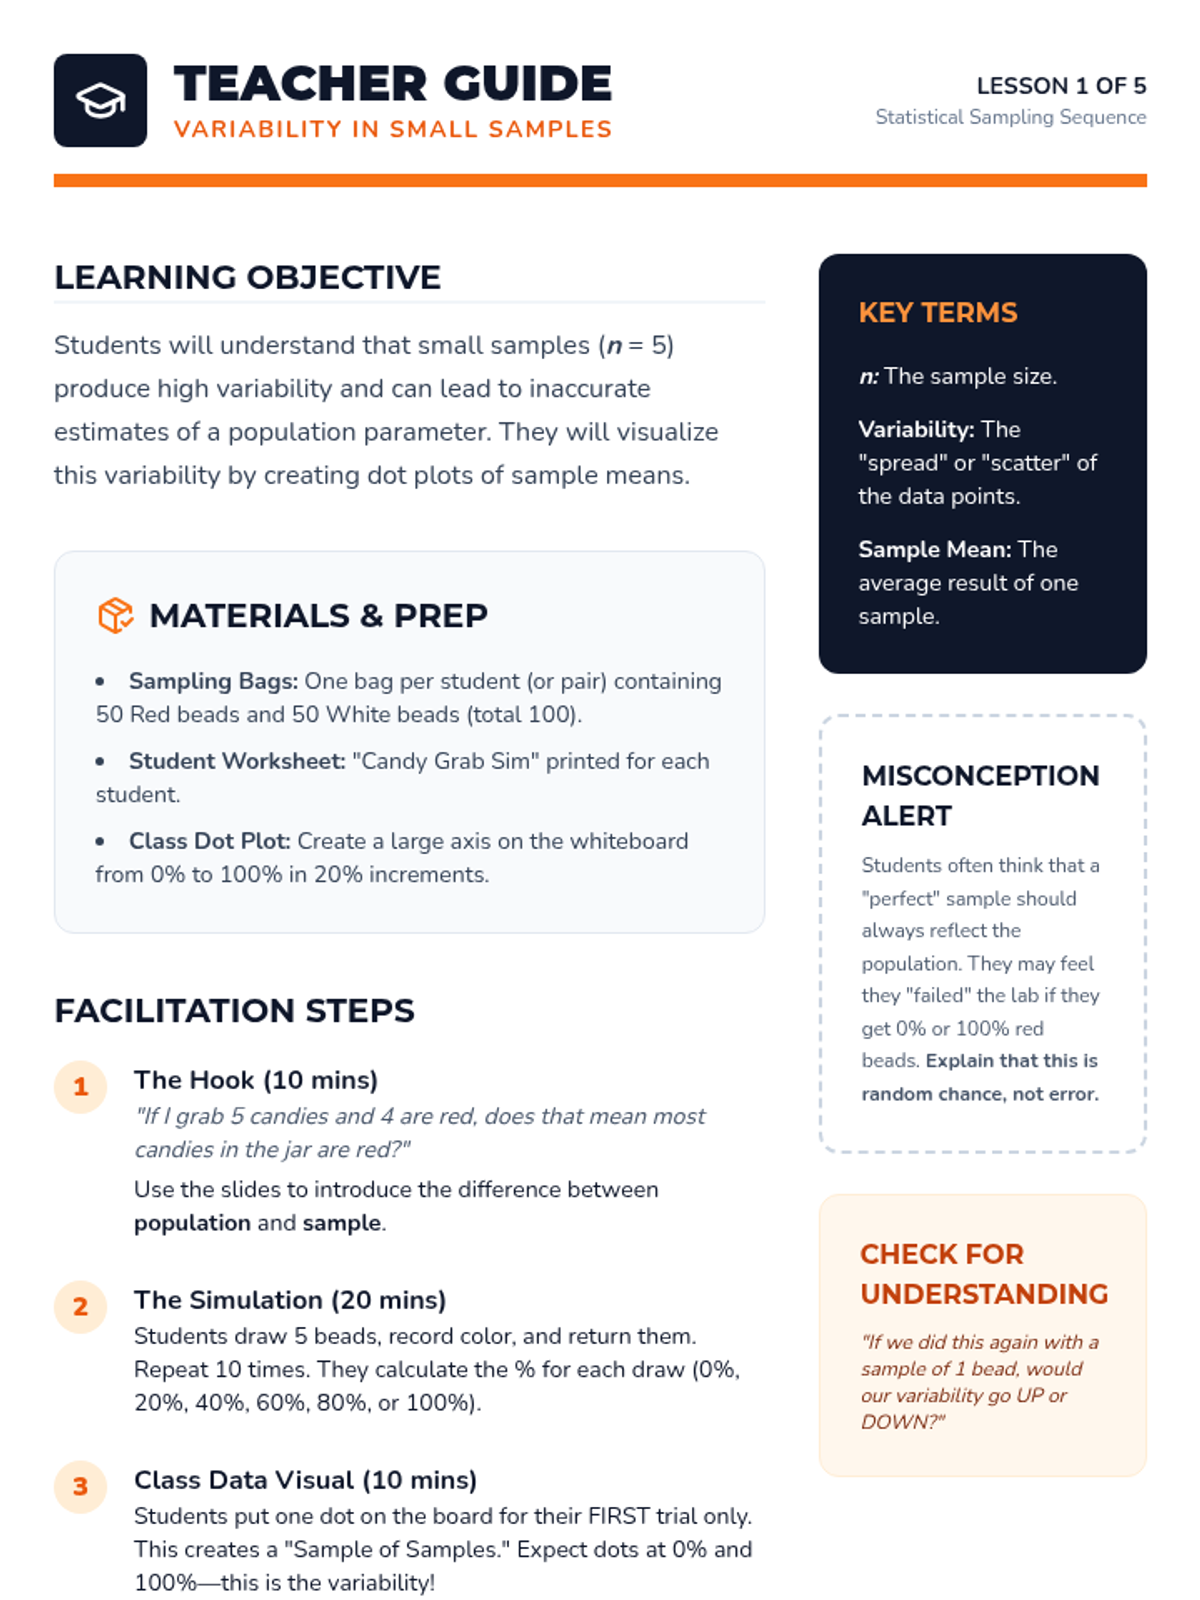
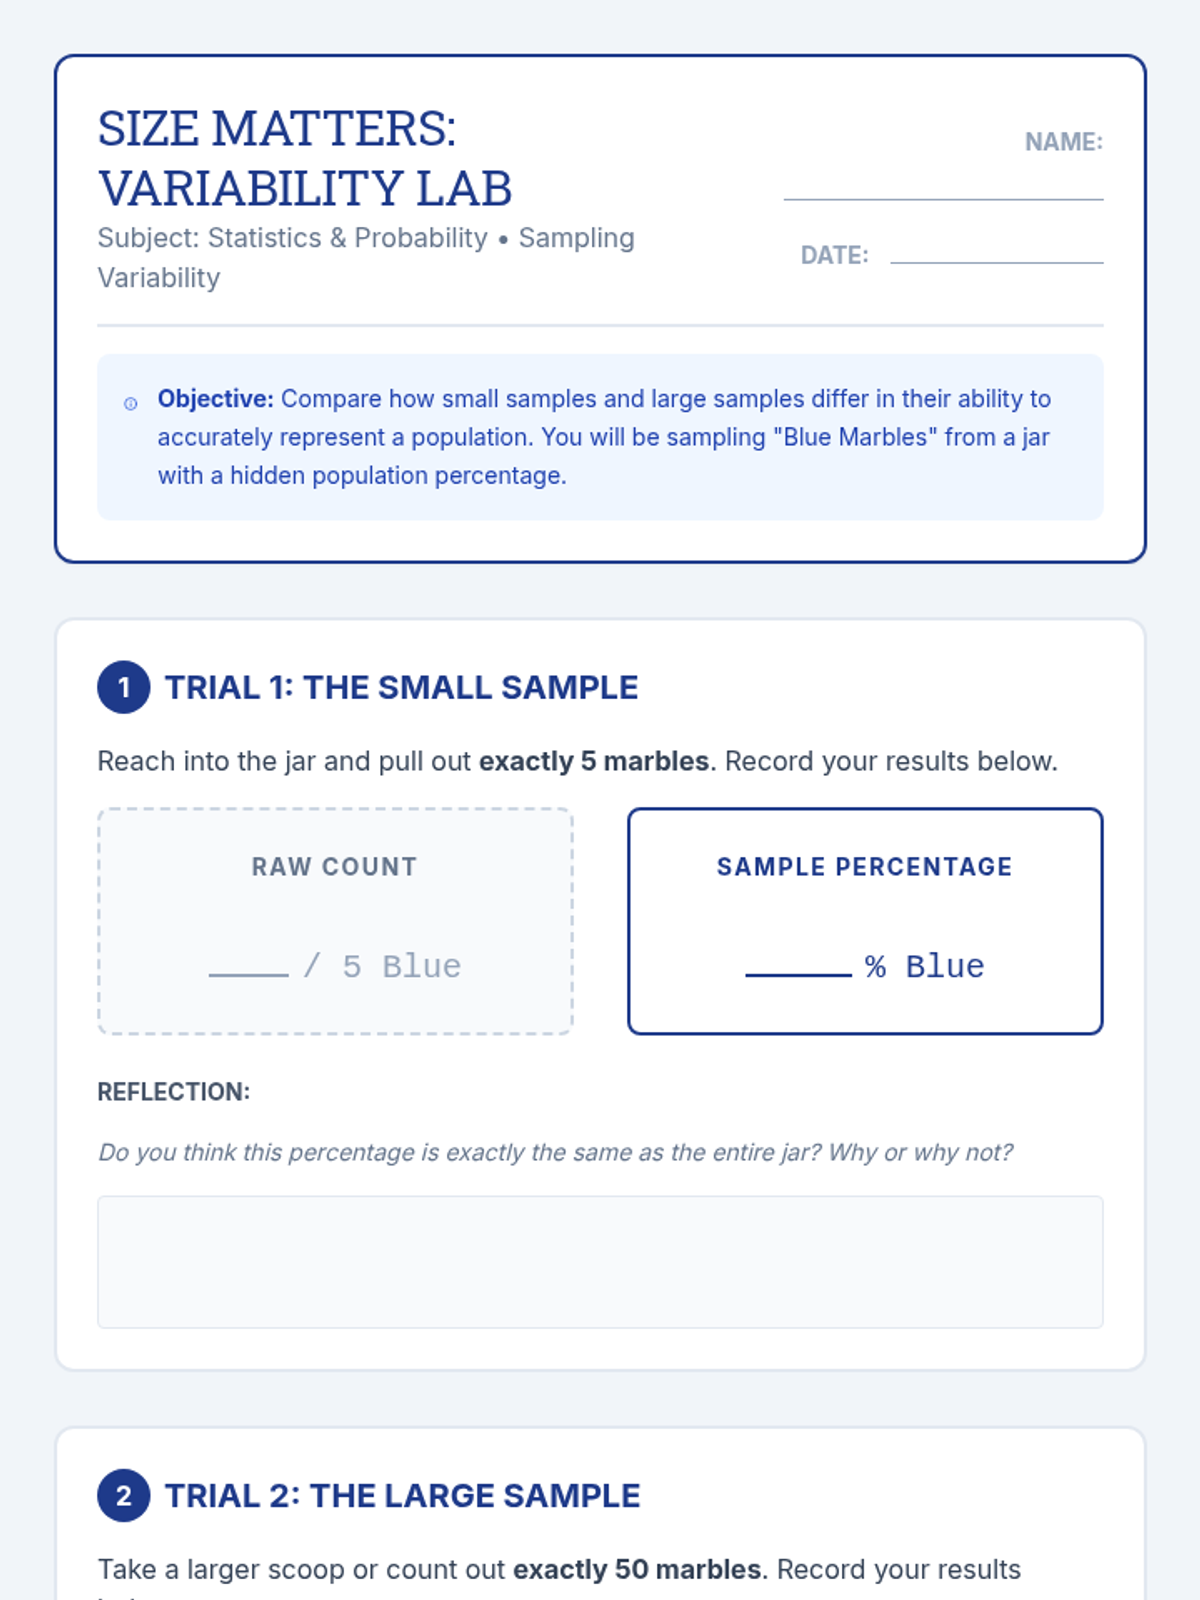
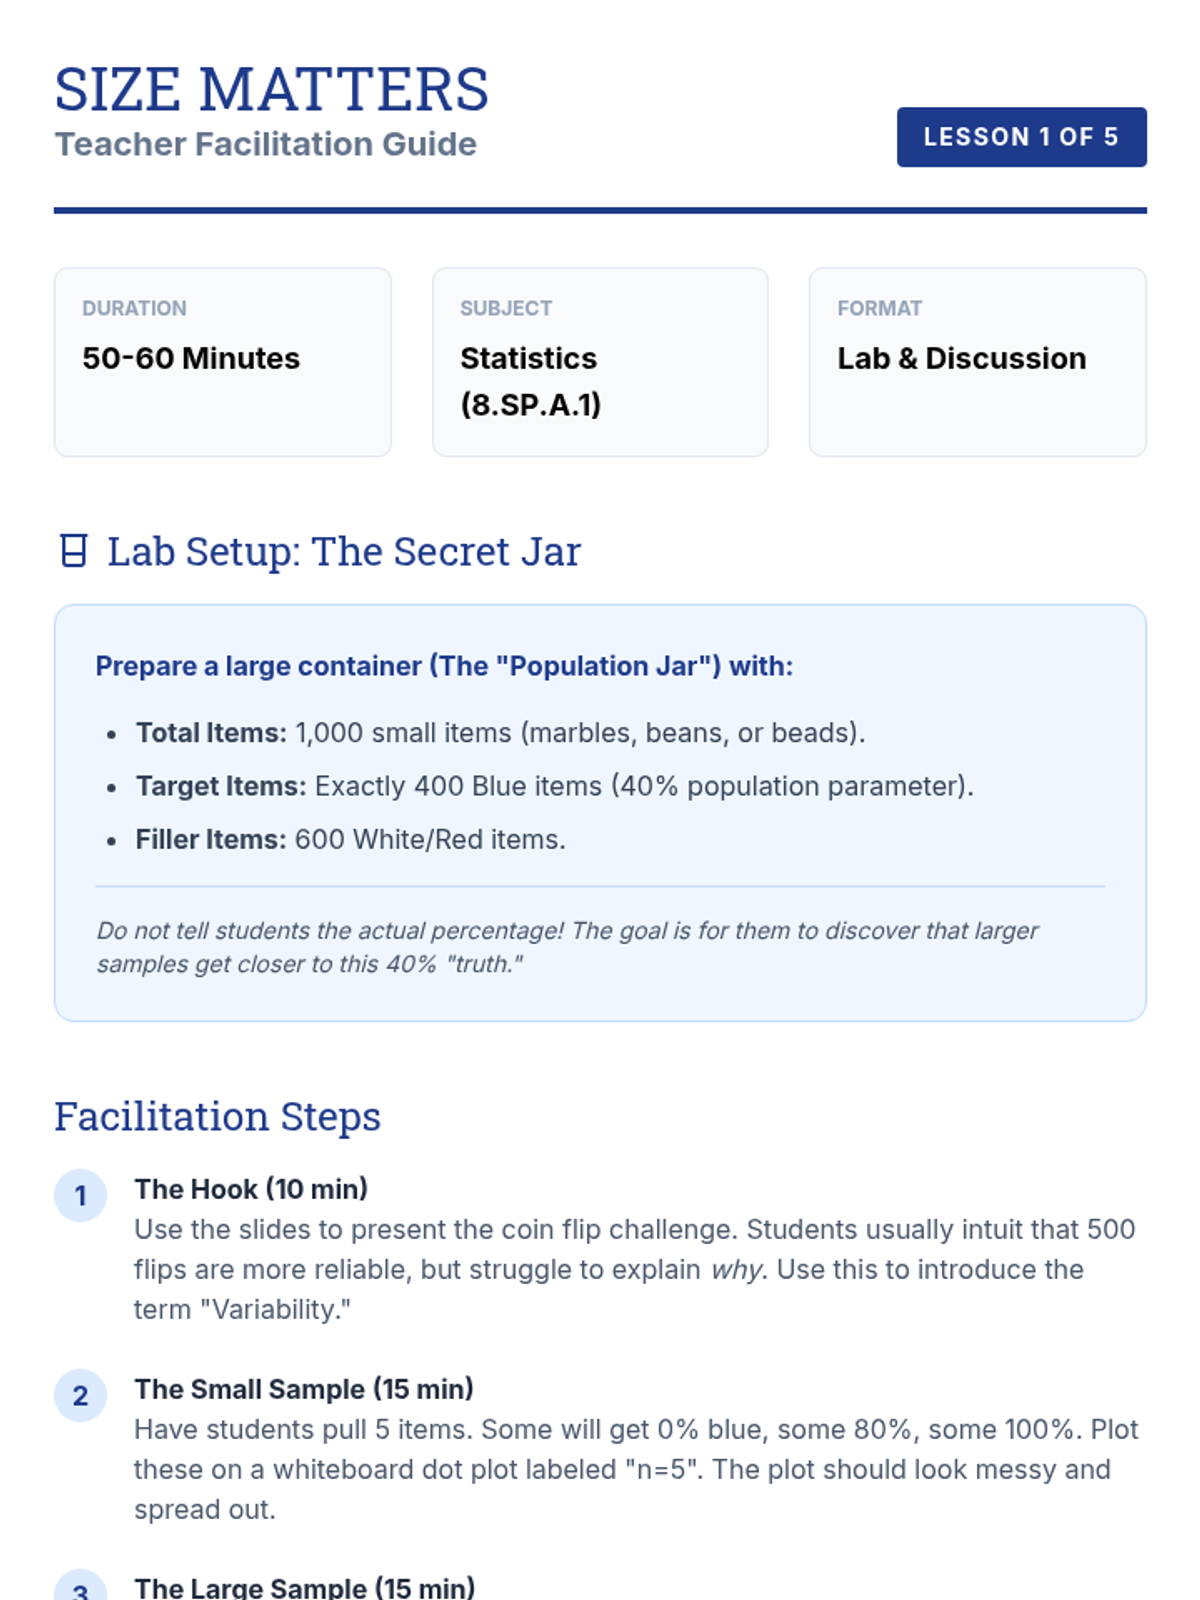
This 5-lesson sequence explores how sample size influences variability and the reliability of statistical inferences. Students participate in simulations to discover the law of large numbers, use Mean Absolute Deviation to quantify spread, and evaluate the validity of real-world sampling methods.
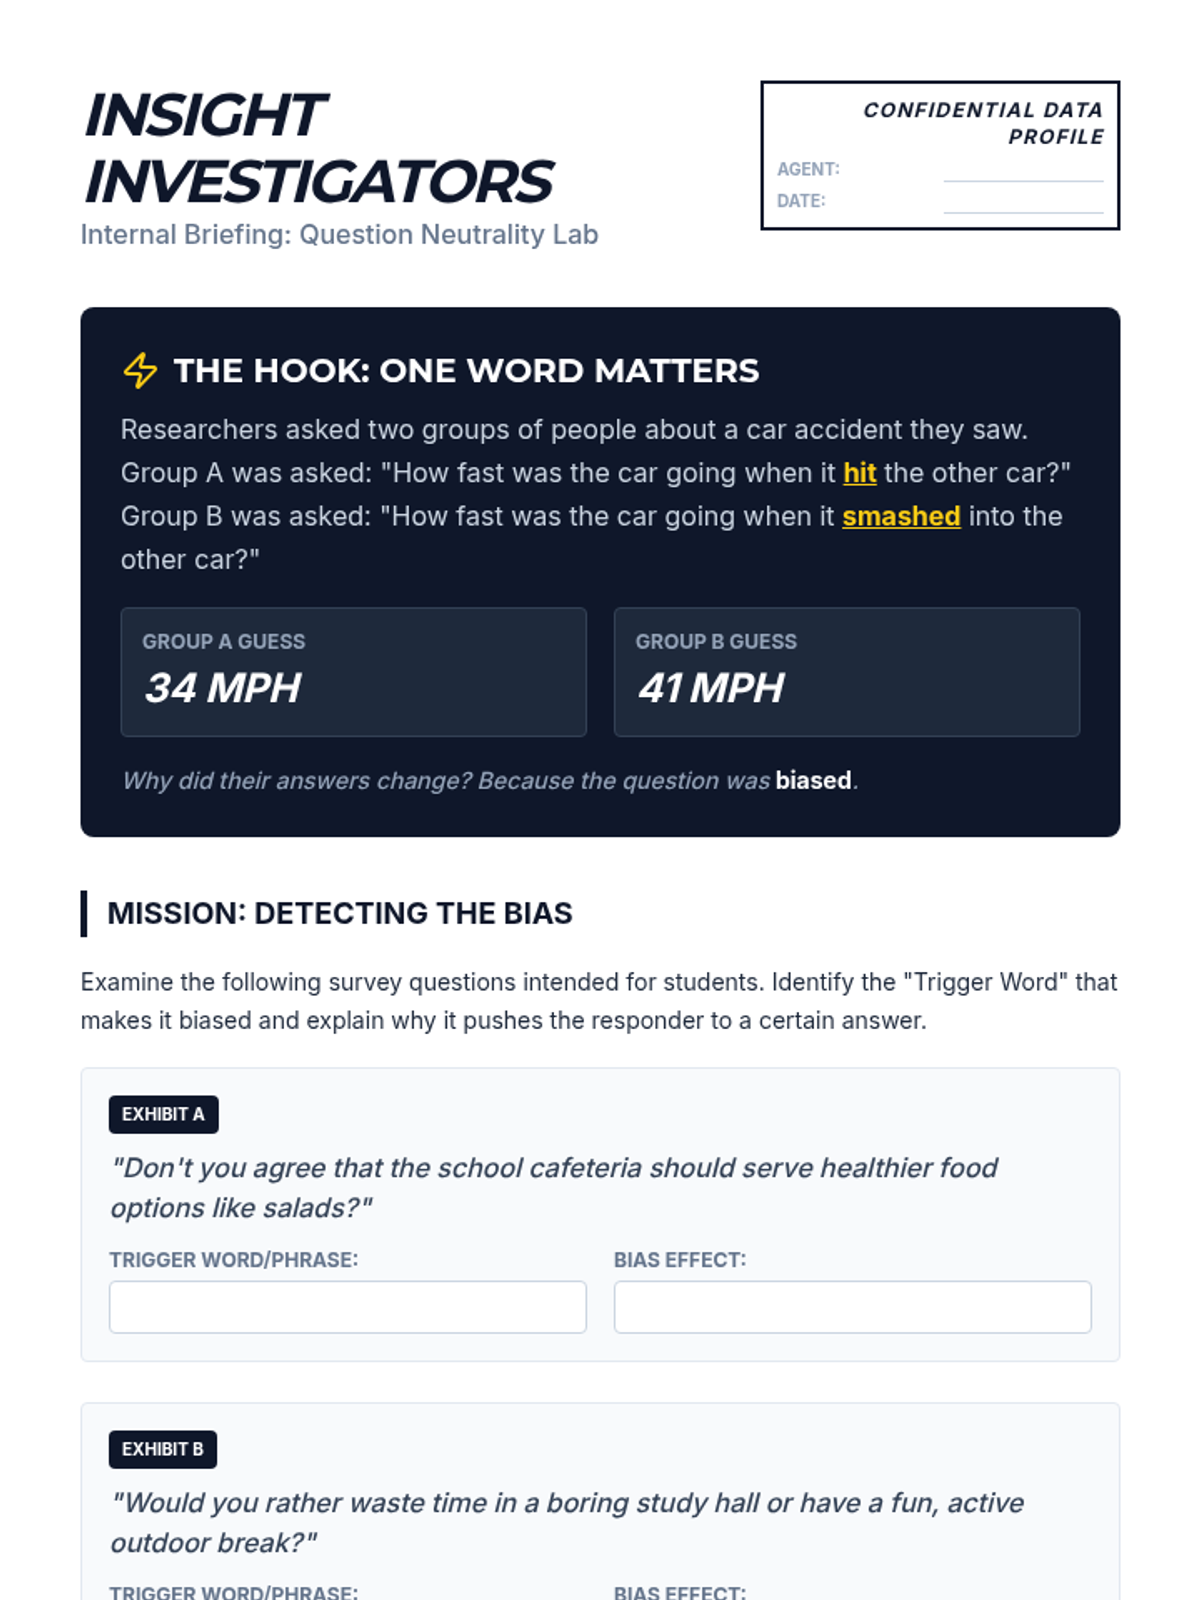
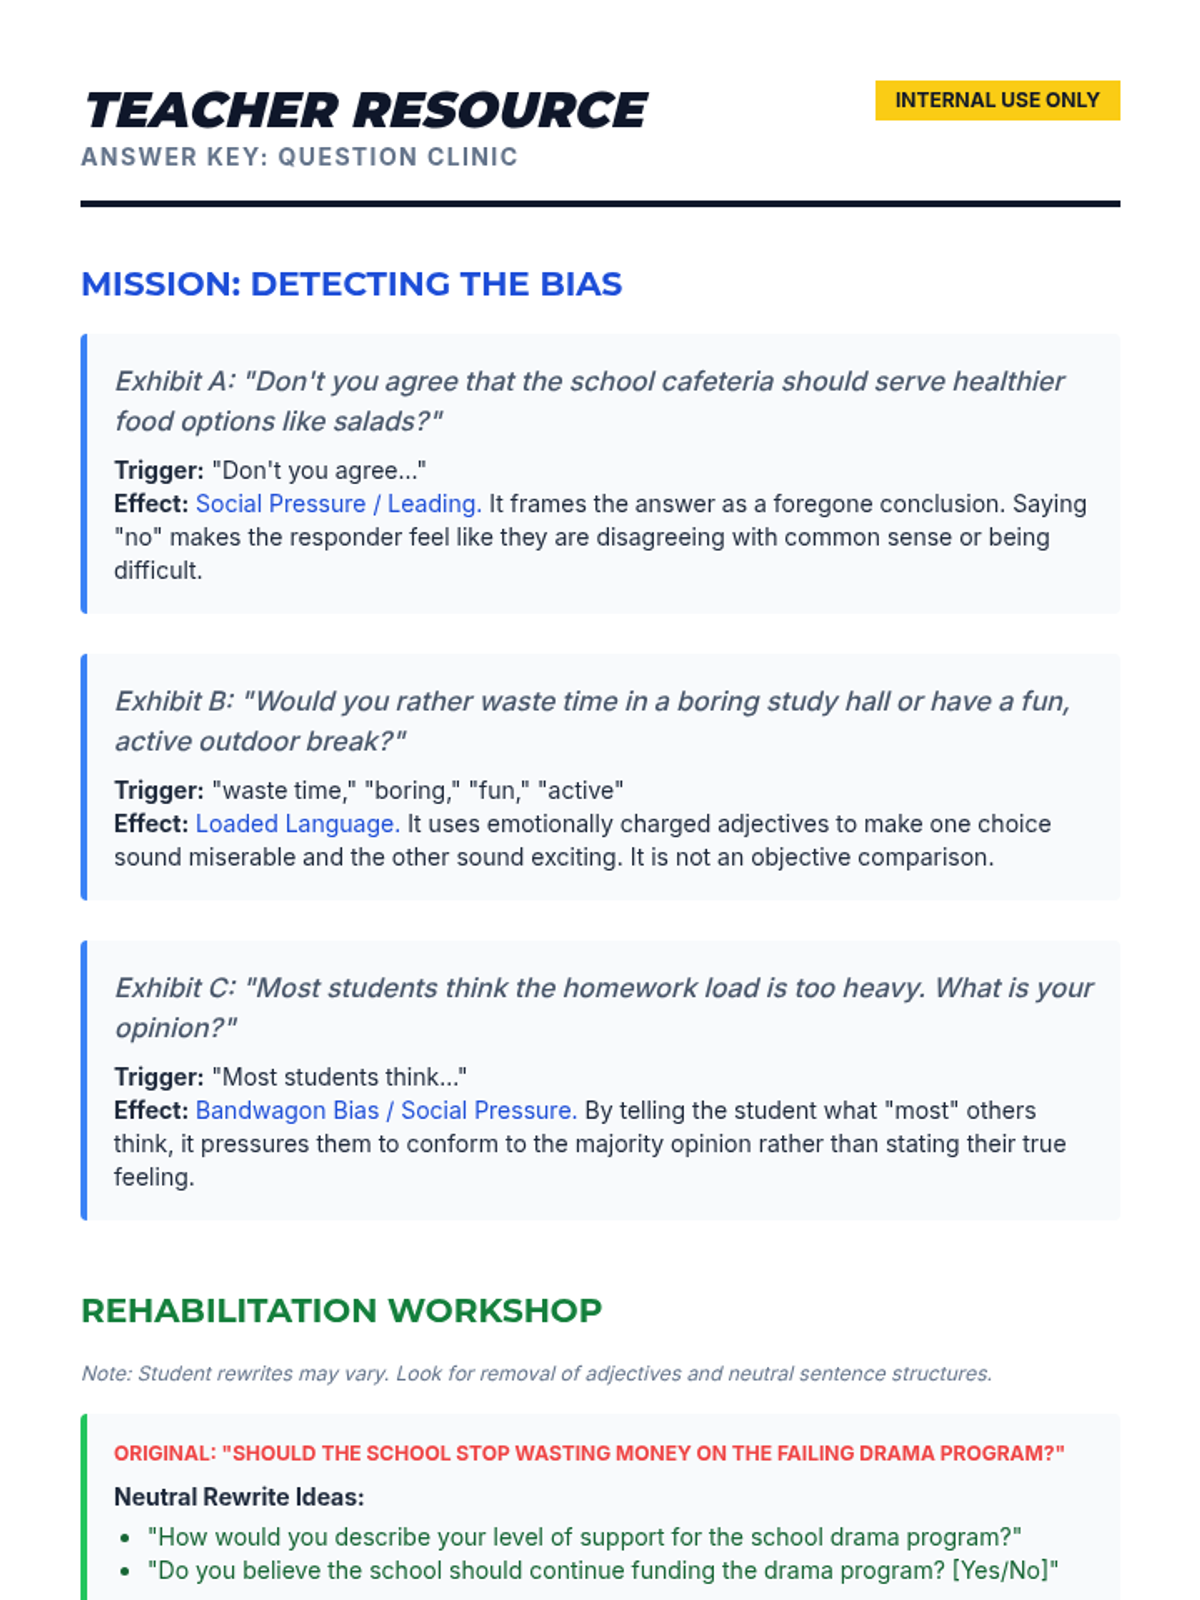
A project-based unit where 7th-grade students act as data consultants to solve school-wide problems. They learn to identify bias, design sampling plans, collect data, and present data-backed recommendations to administration.
An inquiry-based exploration of sampling, outliers, and data reliability for 7th-grade students. Students investigate how sample size and variability impact the conclusions we draw about populations.
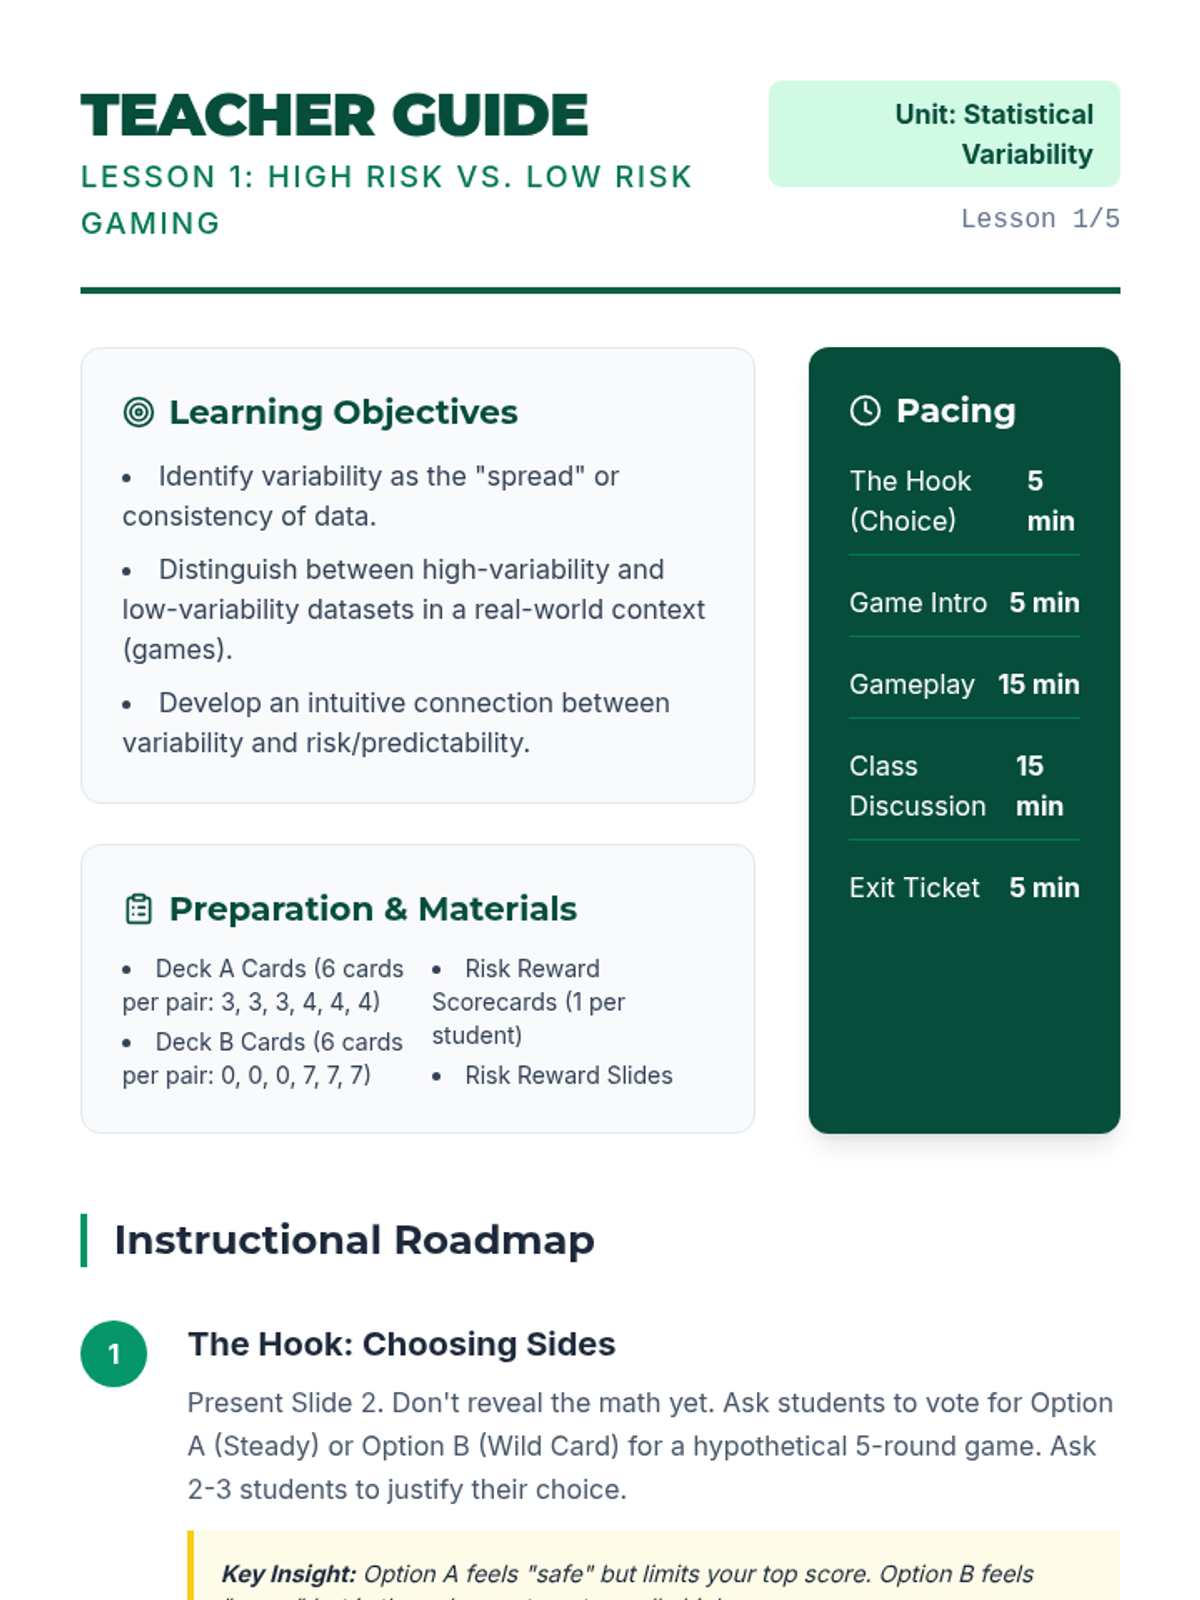
A 5-lesson sequence for 7th-grade students exploring statistical variability through gamification and simulations. Students progress from intuitive risk assessment to quantifying variability using range and Mean Absolute Deviation (MAD).
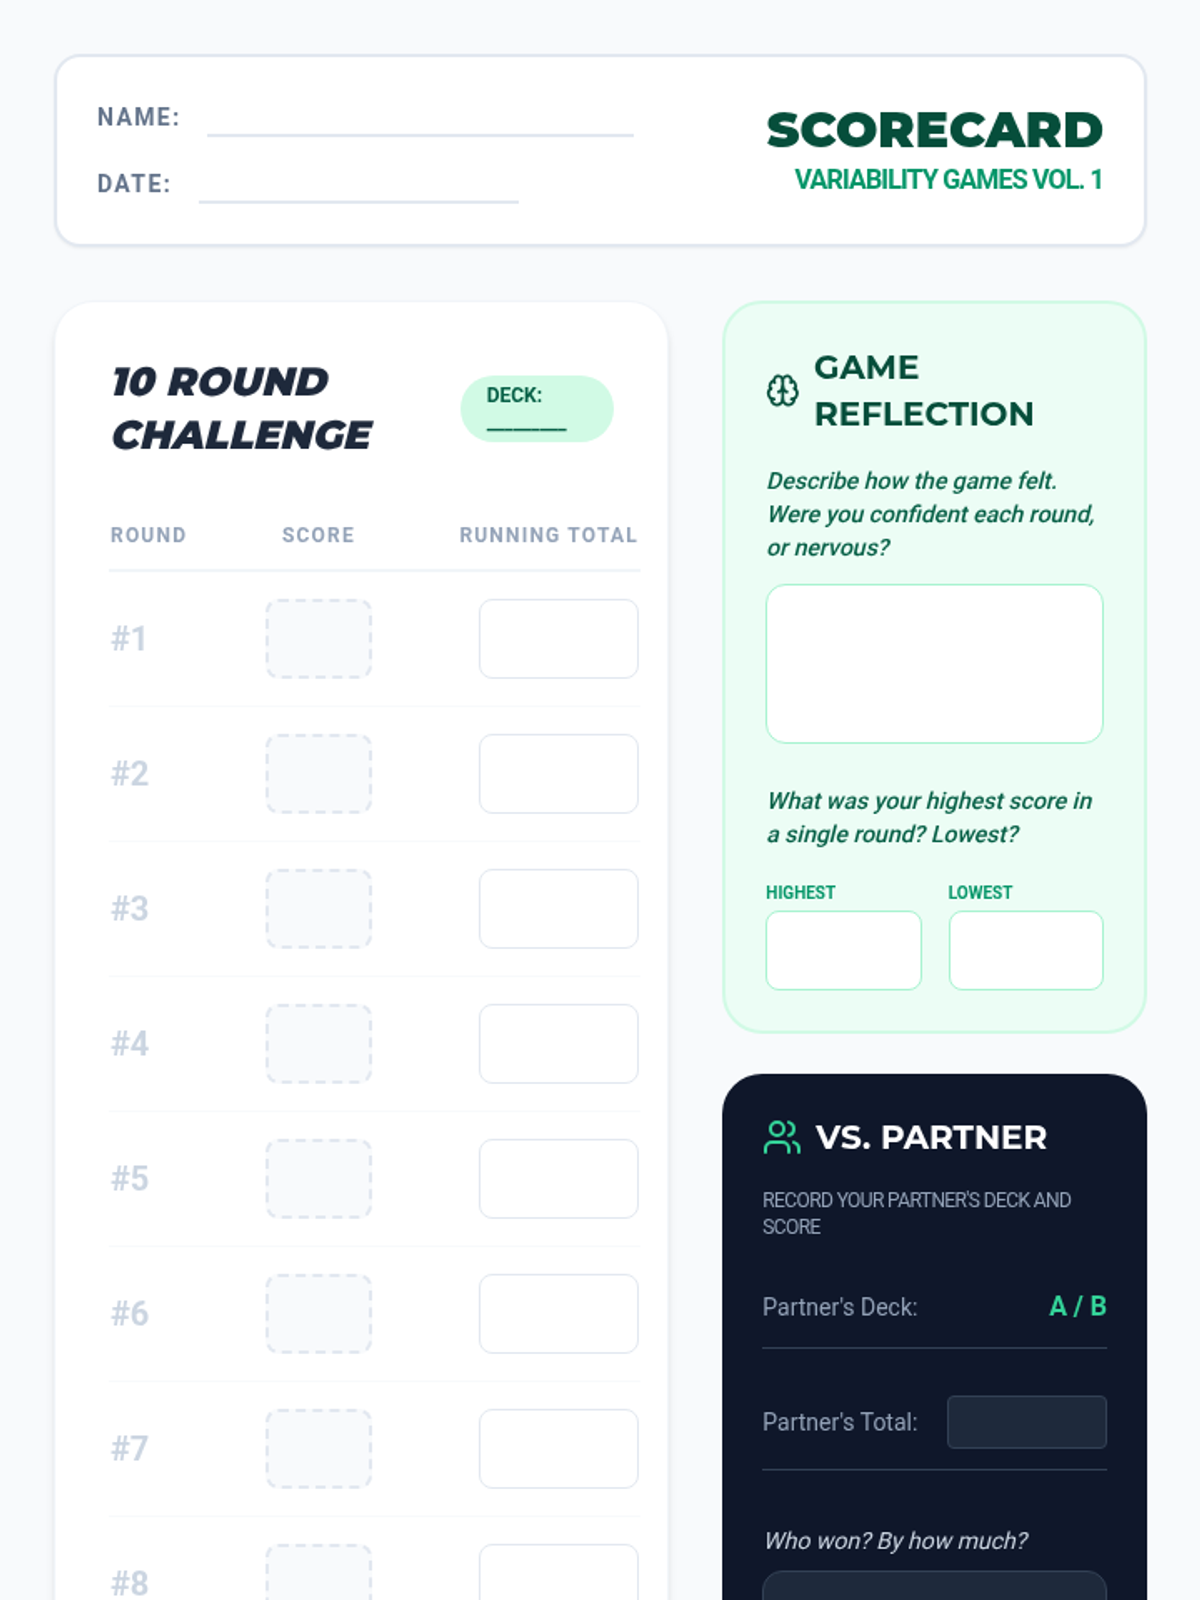
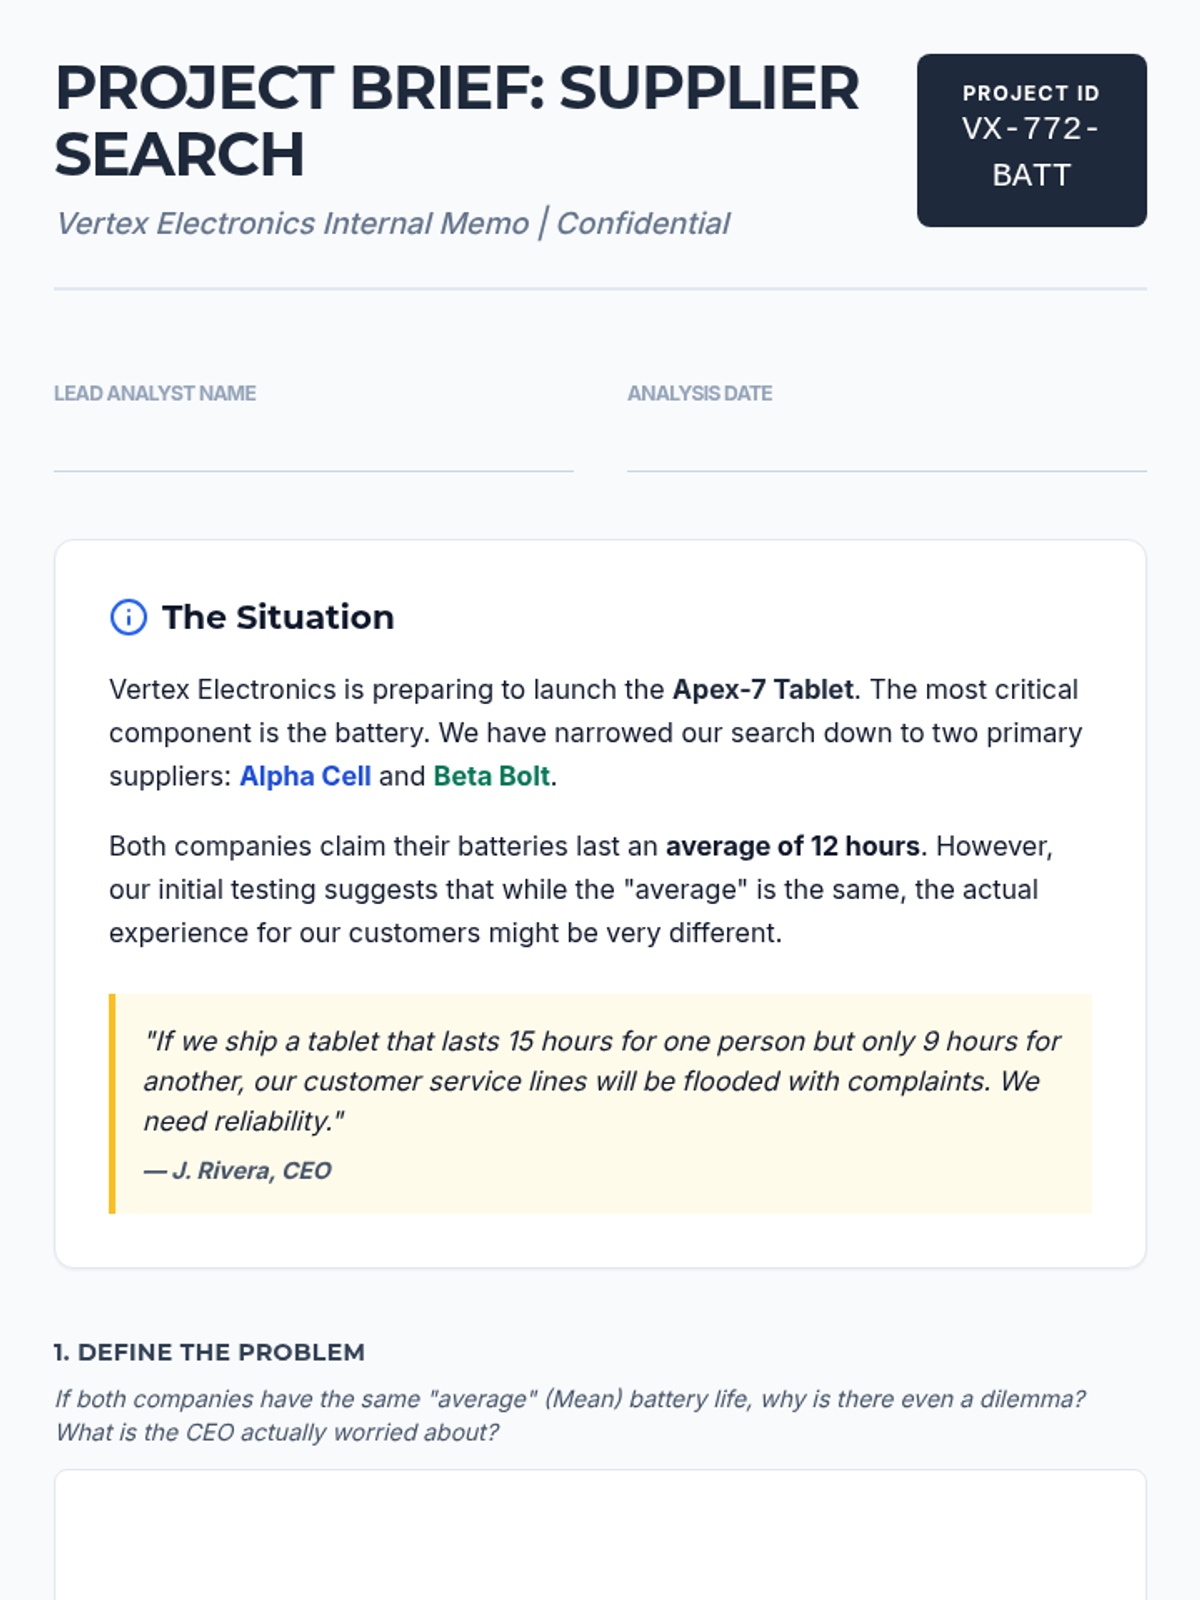
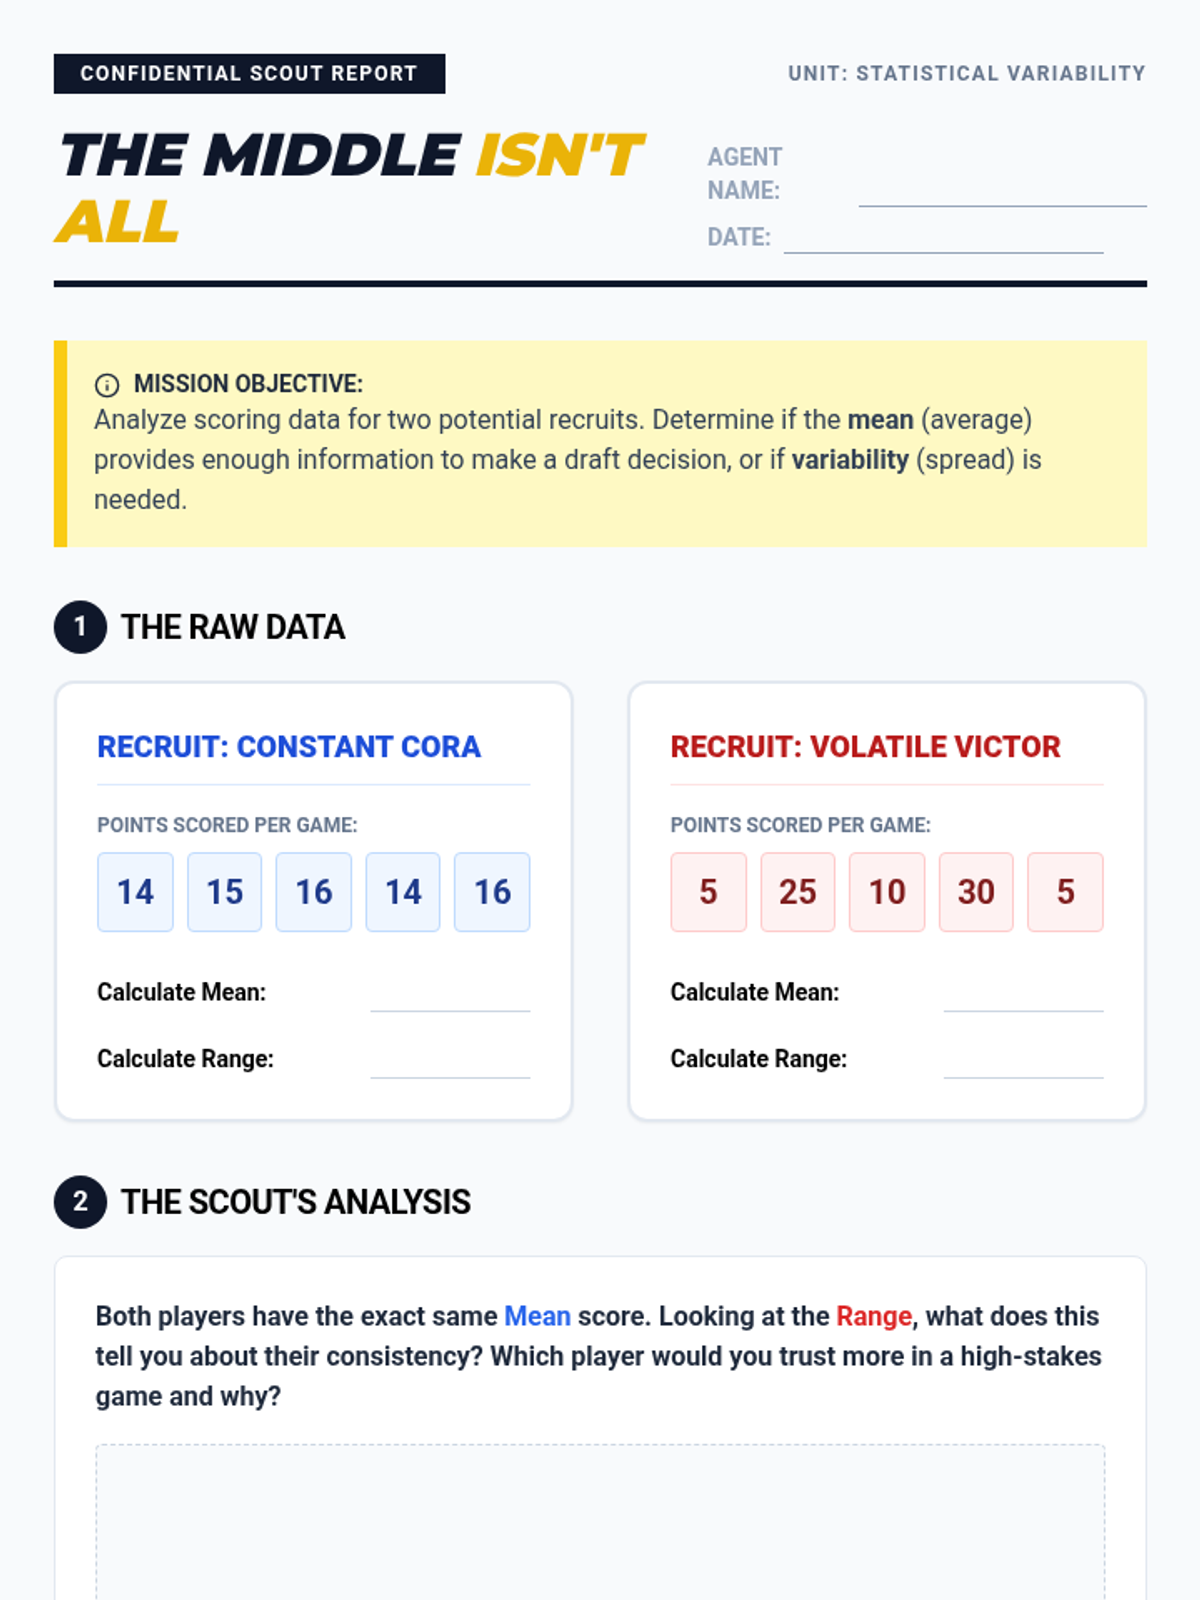
Students act as data analysts for a tech company to decide between two suppliers. They learn that averages don't tell the whole story, using Mean Absolute Deviation (MAD) and Interquartile Range (IQR) to assess risk and consistency in real-world decision making.
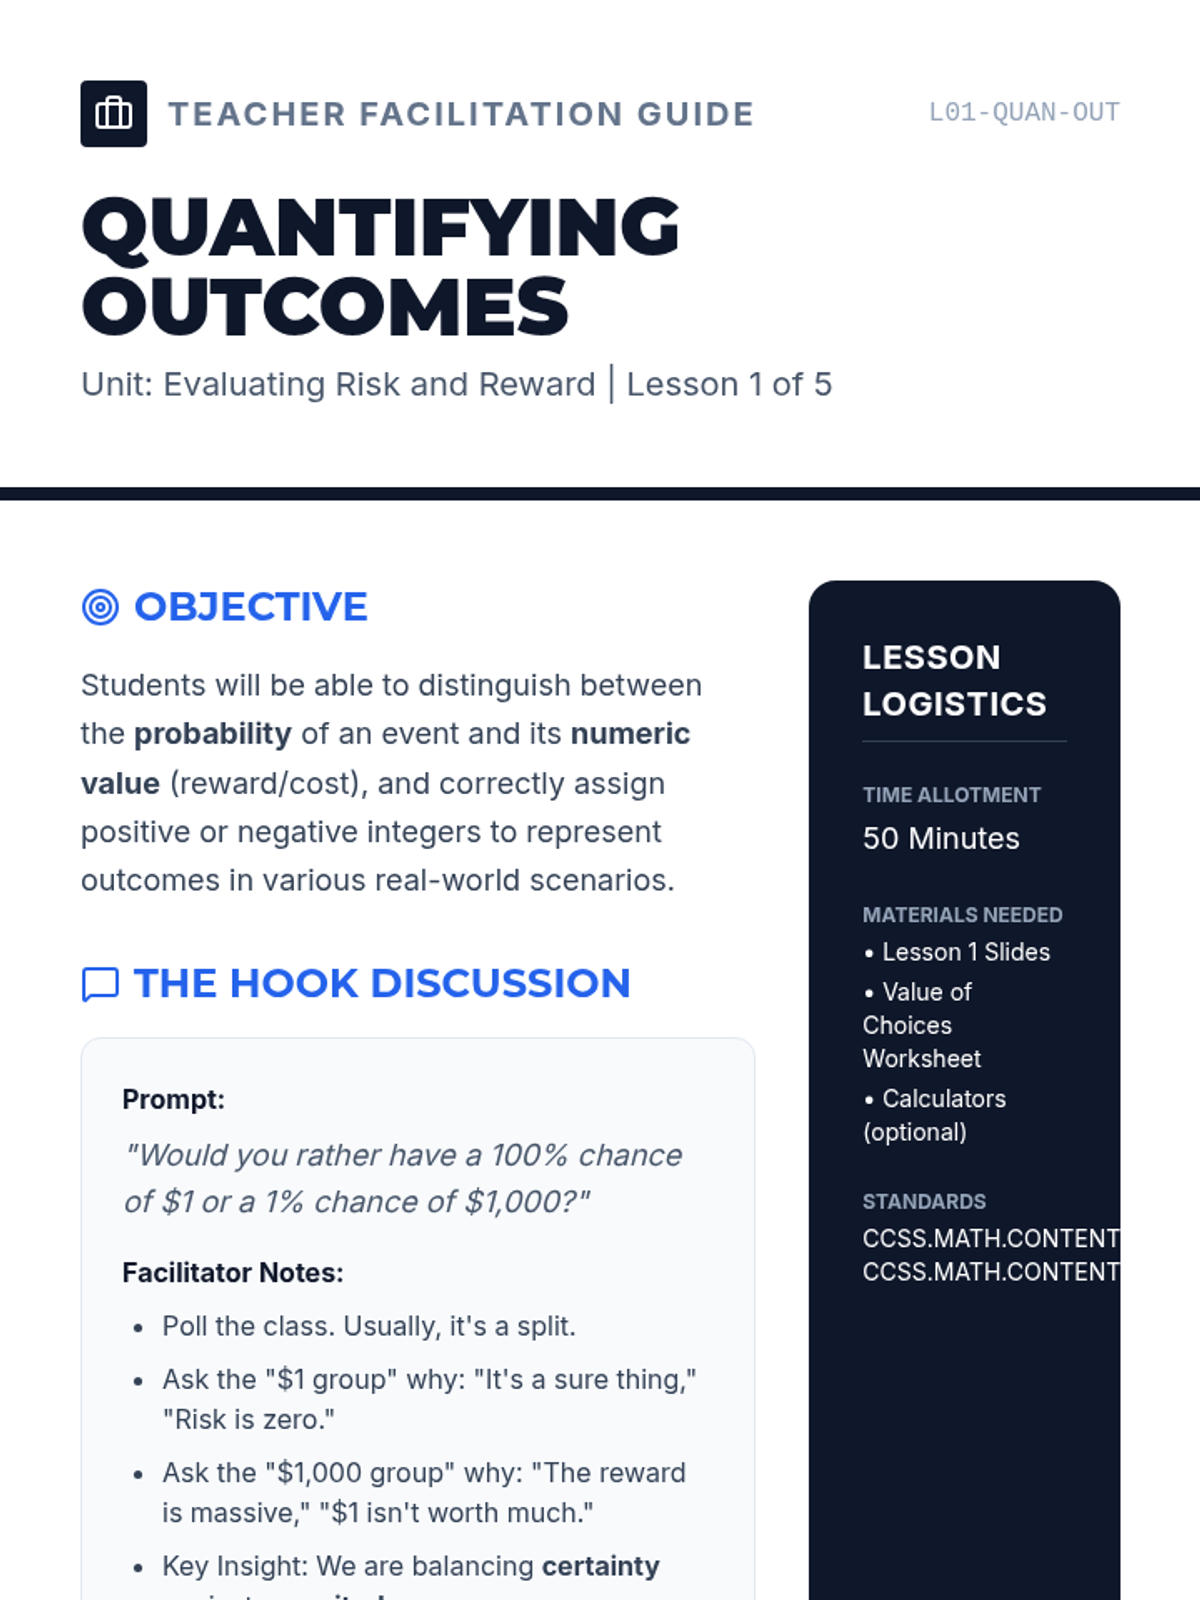
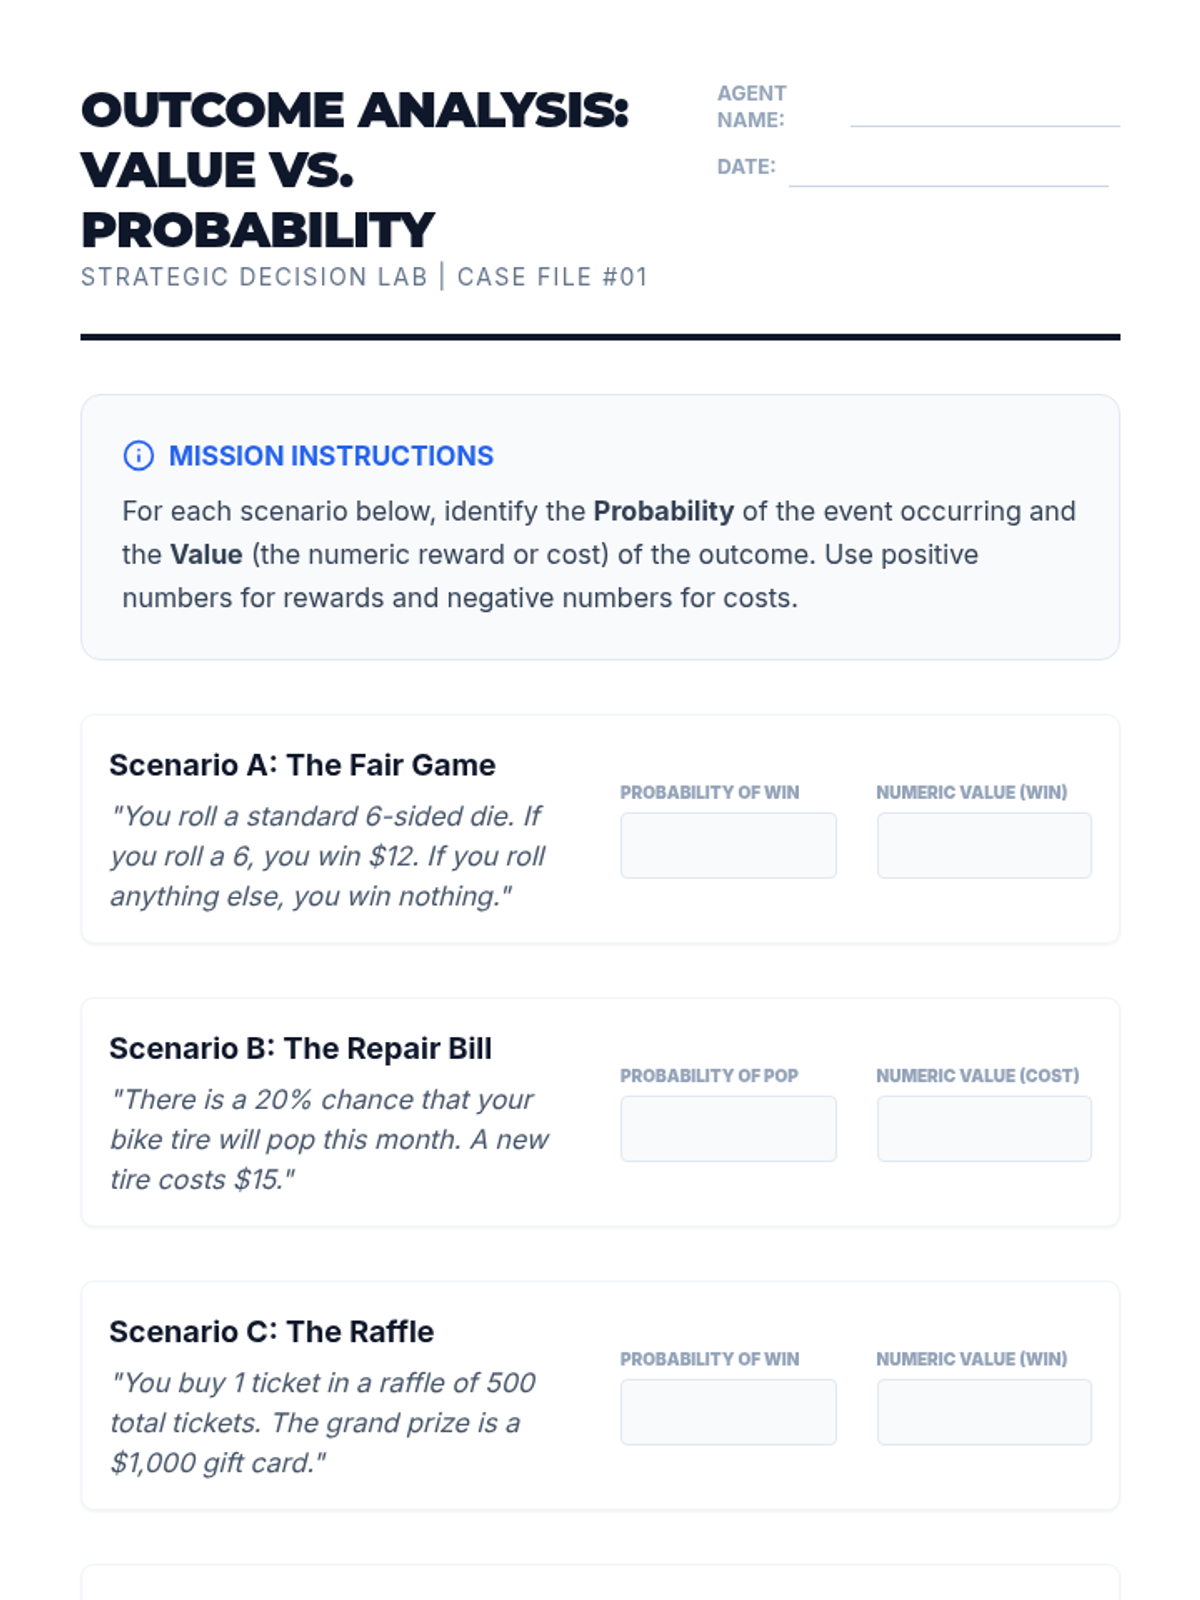
In this sequence, students explore how mathematical probability guides rational decision-making in uncertain situations. Learners progress from simple compound events to constructing decision trees and calculating expected values to evaluate the fairness and potential payoff of various choices.
A comprehensive sequence on statistical variability focusing on Mean Absolute Deviation (MAD). Students progress from conceptual understanding of spread to algorithmic calculation and comparative analysis of data distributions.
A 5-lesson sequence for 6th-grade students focused on using measures of variability (Range, IQR, MAD) to compare populations and make evidence-based arguments. Students transition from calculation to analysis using real-world case studies in sports, meteorology, and consumer products.
This sequence explores statistical variability through the lens of robust measures like IQR and box plots. Students move from basic understanding of spread to complex comparative analysis, focusing on how variability impacts the reliability of data-driven conclusions.
A 7th-grade math sequence focusing on probability-based decision making and expected value. Students explore risk, reward, and long-term outcomes in insurance, business, and finance.
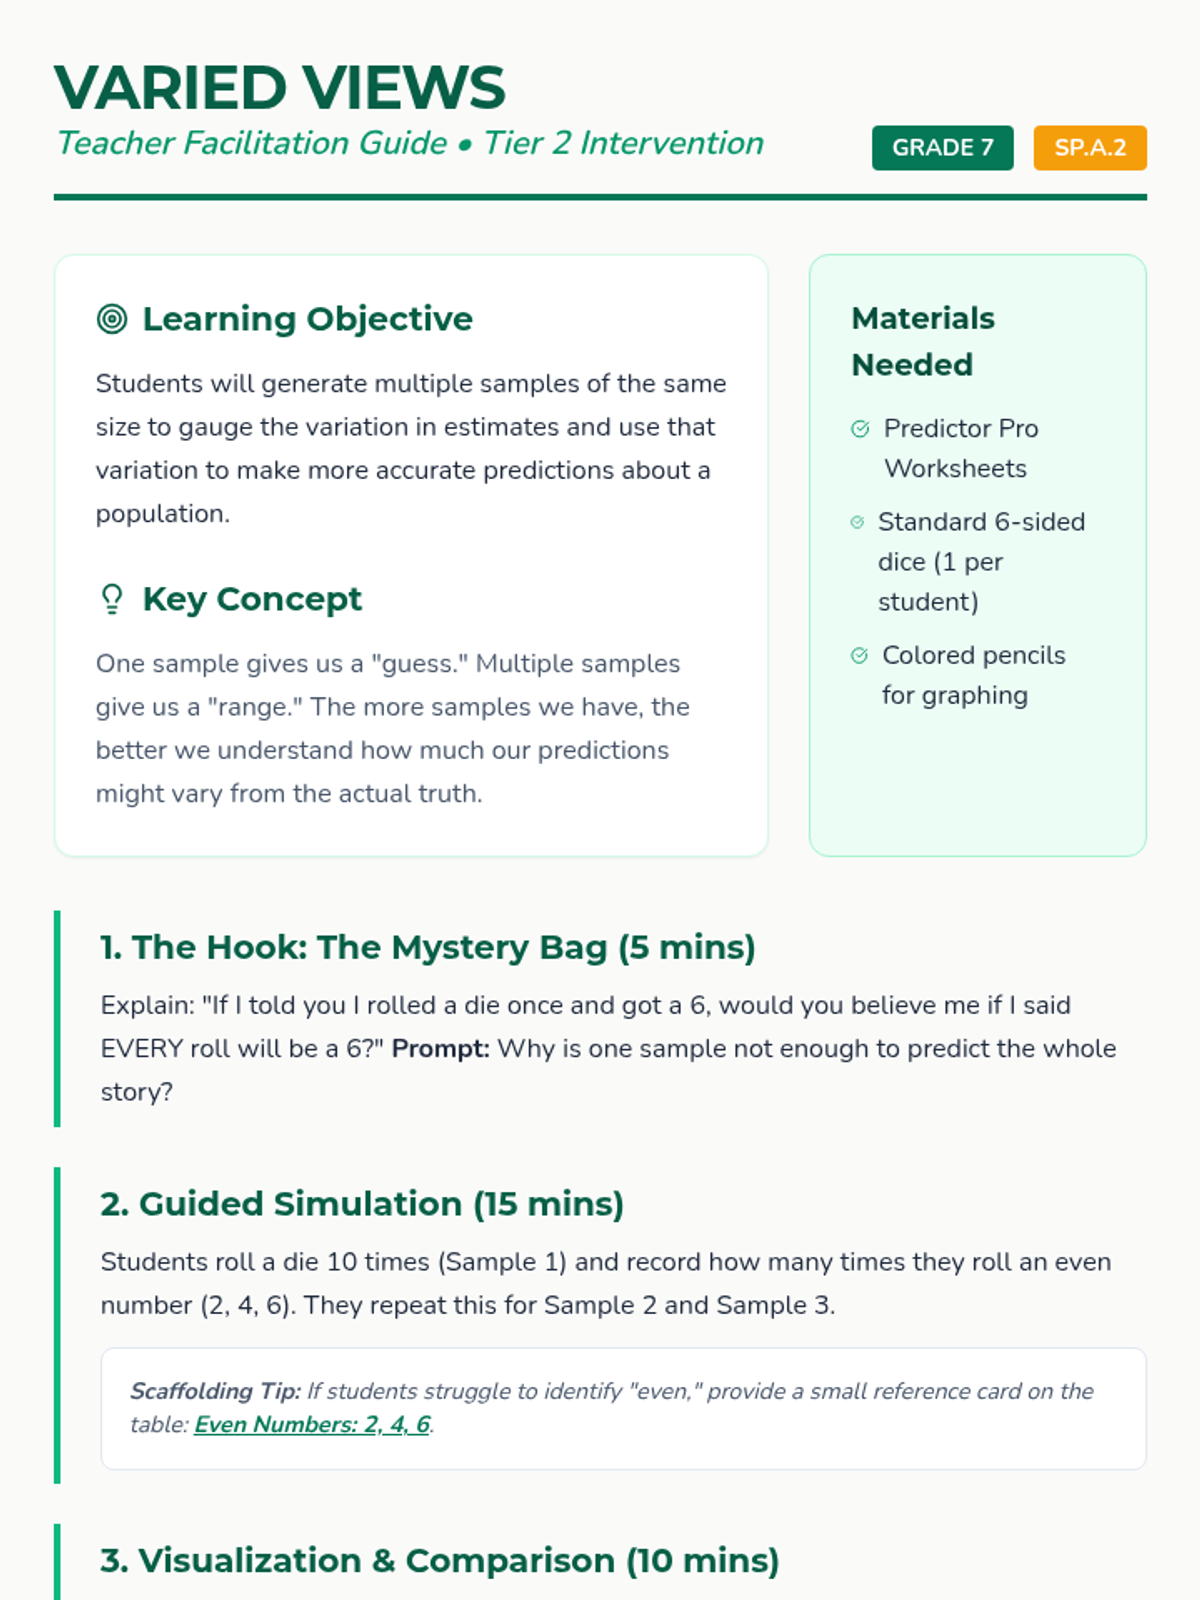
A specialized intervention sequence focused on understanding how multiple samples provide a clearer picture of a population and how variability affects predictions. Students engage in hands-on simulations and visual data analysis to master seventh-grade sampling standards.
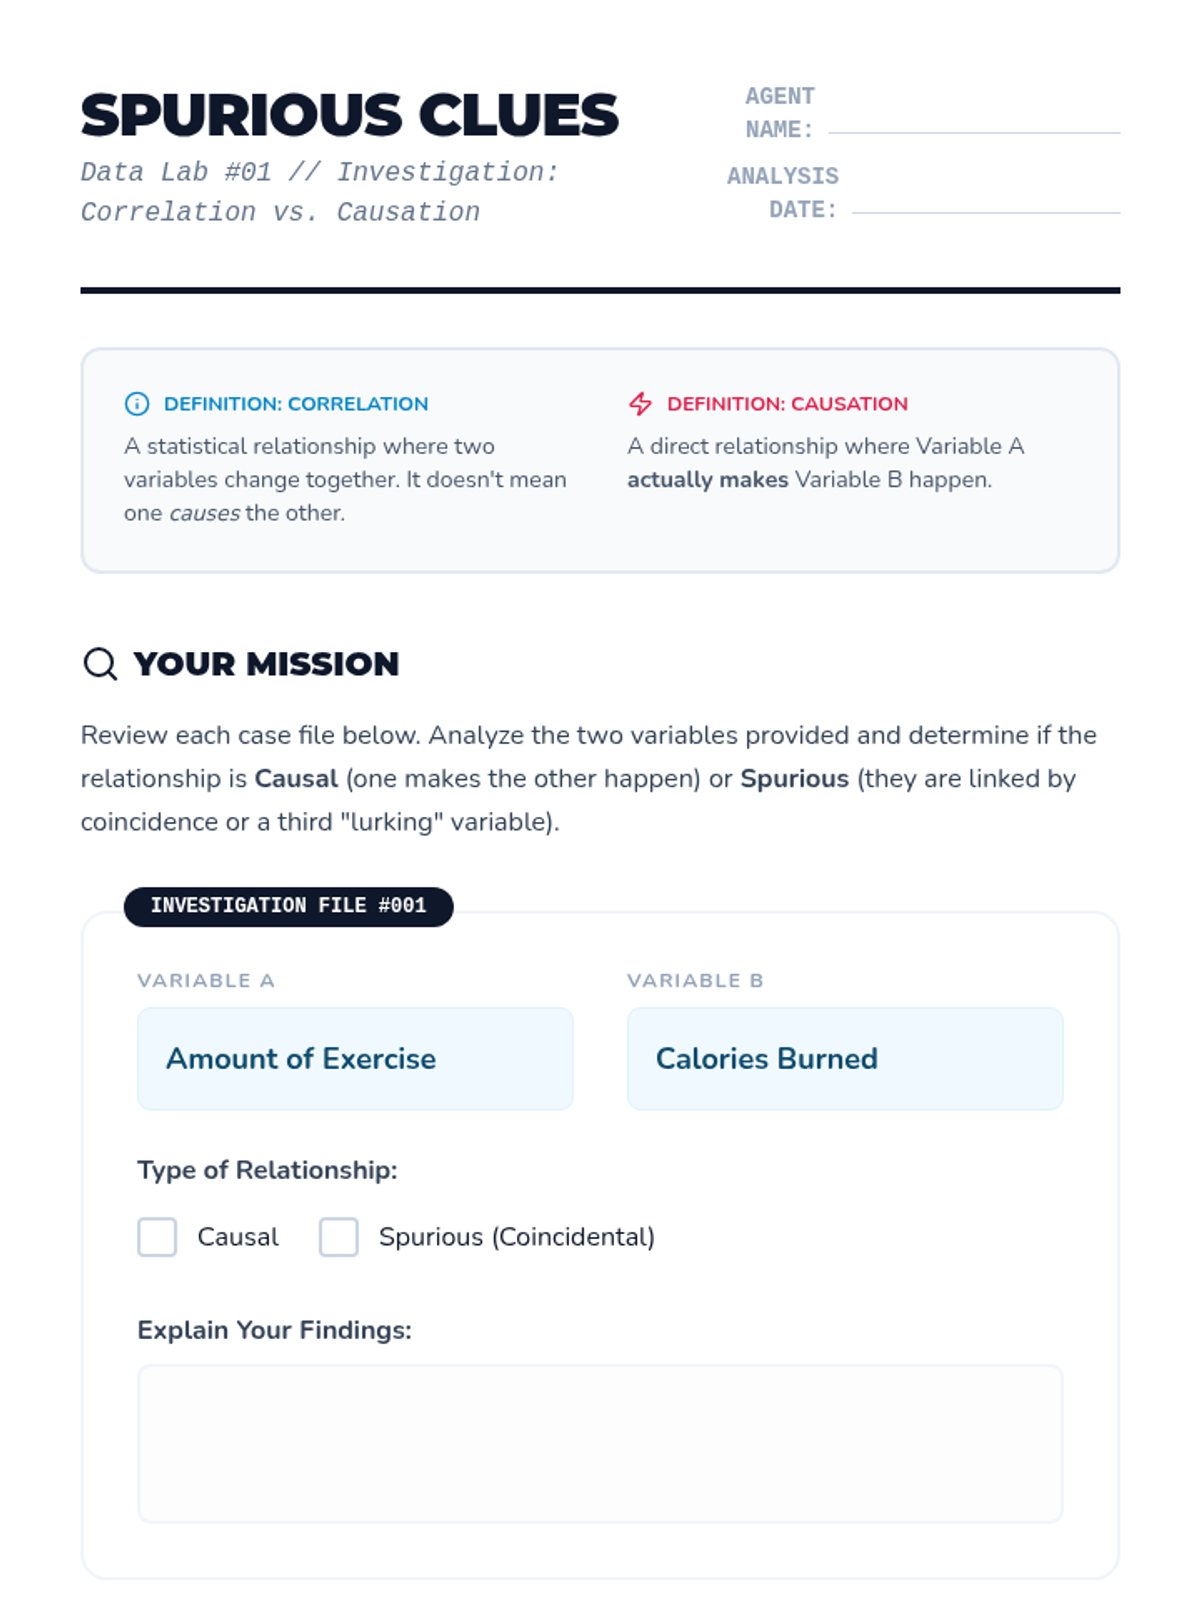
Students move from describing data to interpreting and modeling it. They explore correlation vs. causation, trend lines, predictive modeling, and the ethics of data bias using real-world datasets and case studies.
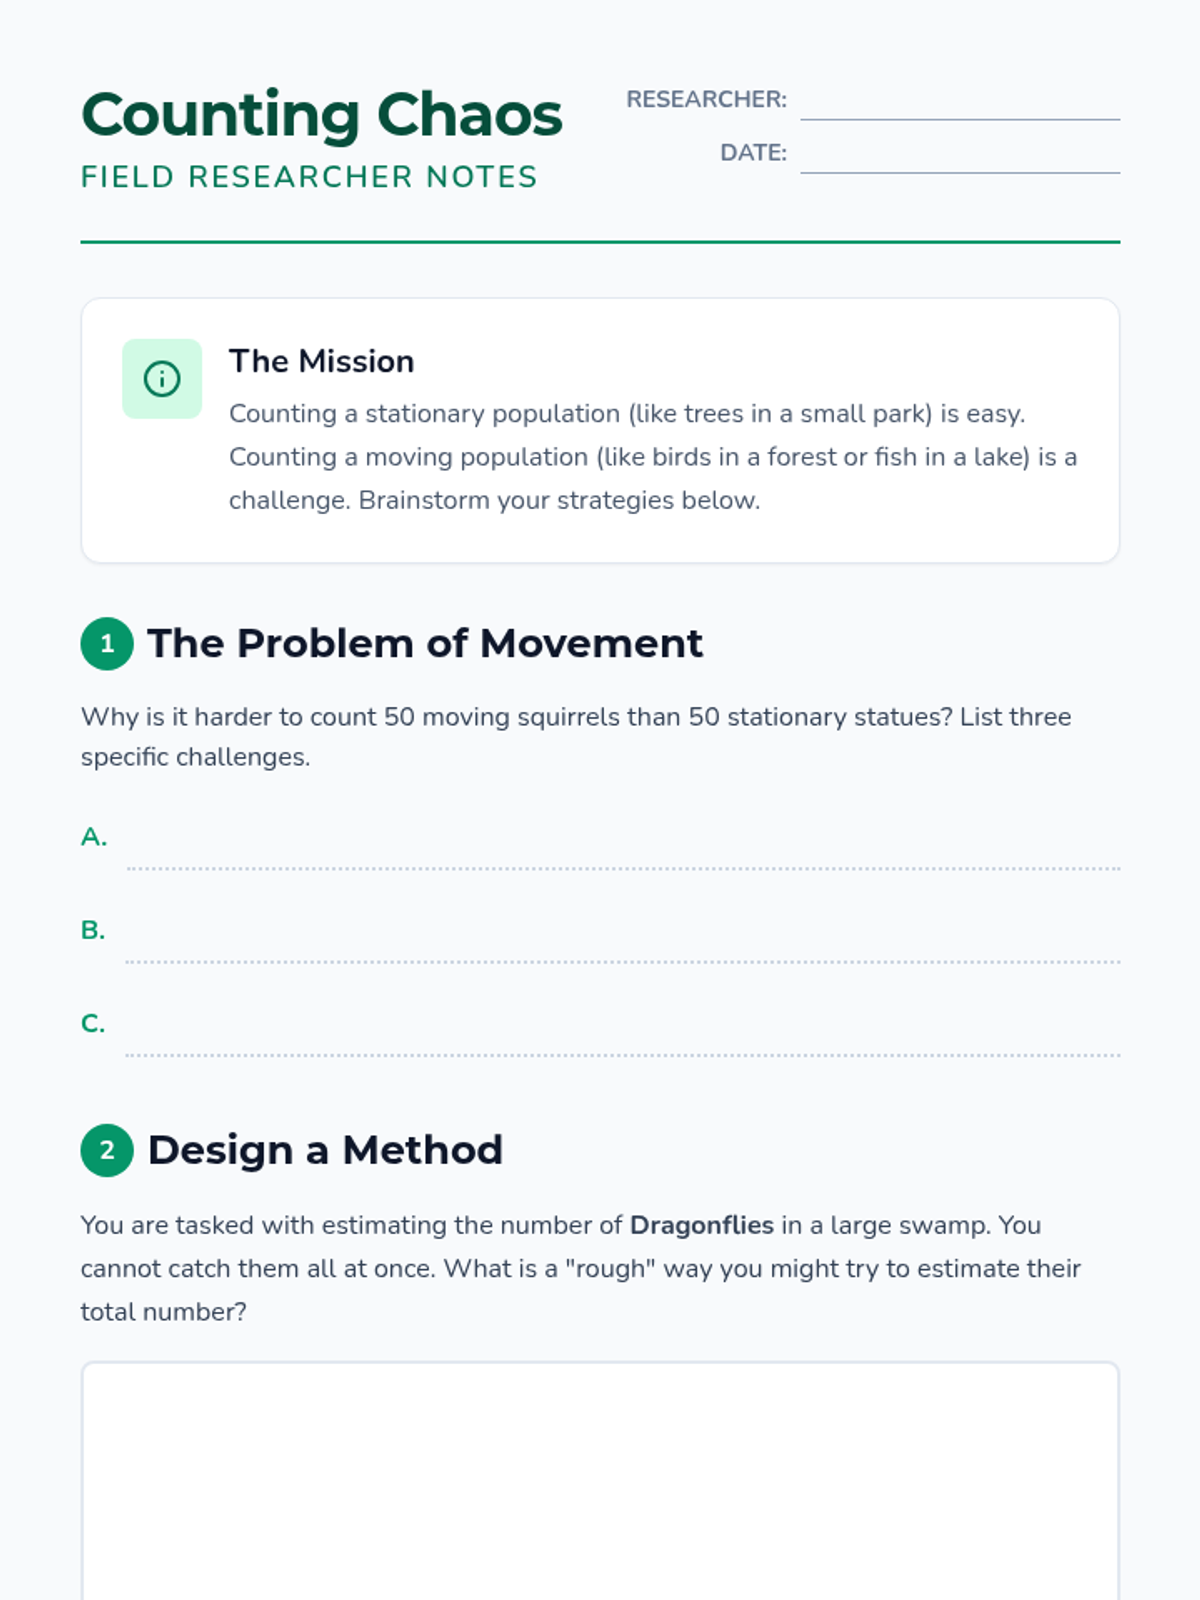
A game-based sequence where students use the Capture-Recapture method to estimate population sizes, progressing from physical simulations to proportional reasoning and real-world ecological analysis.
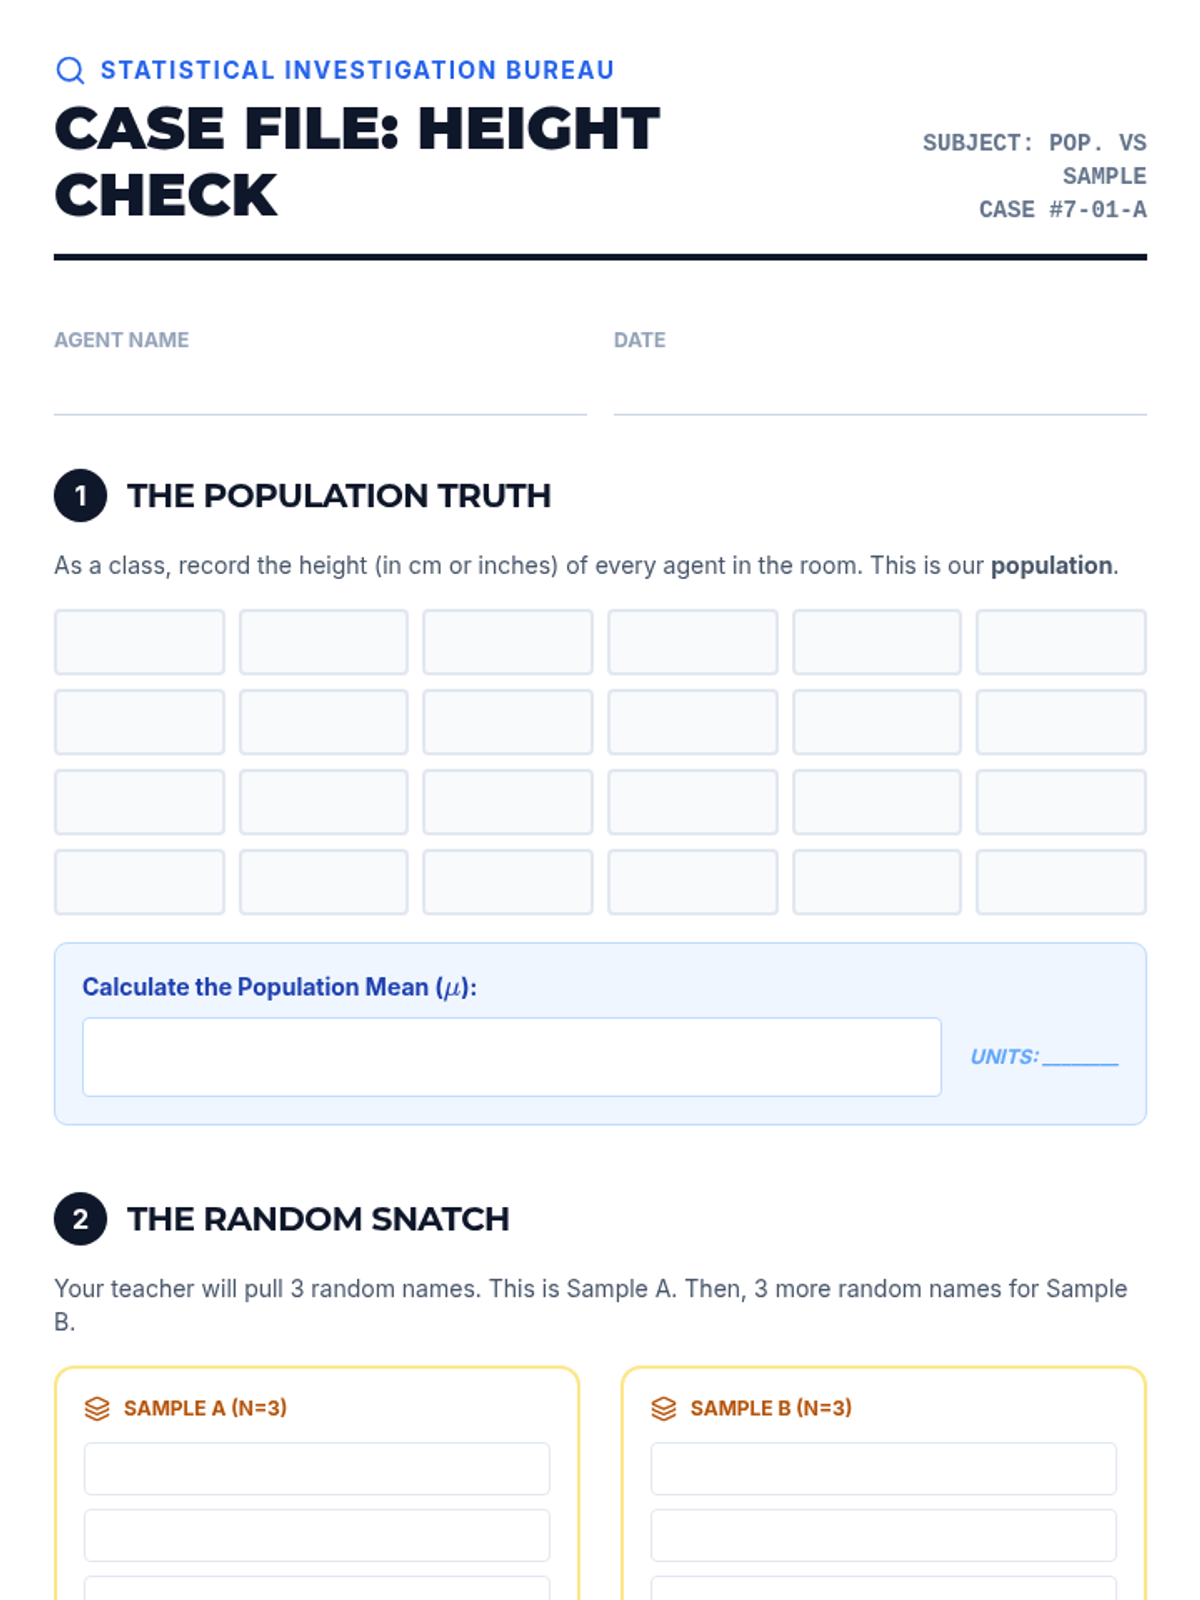
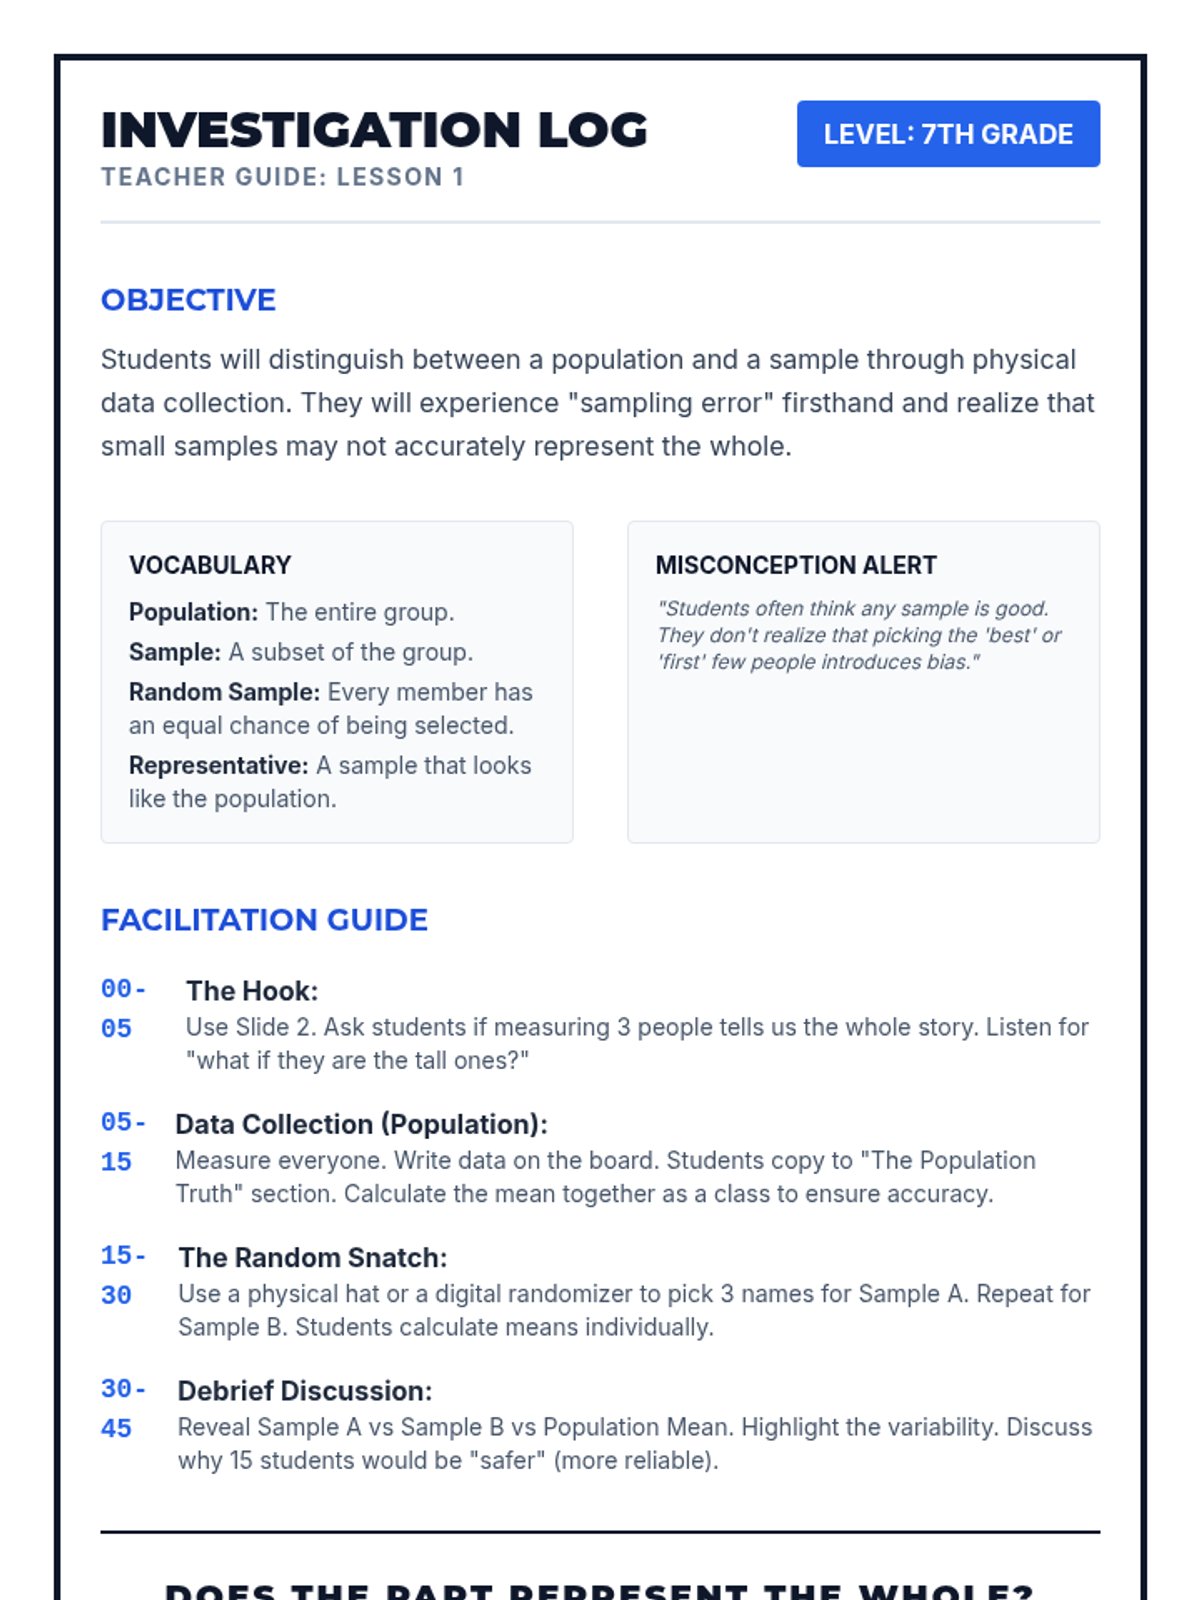
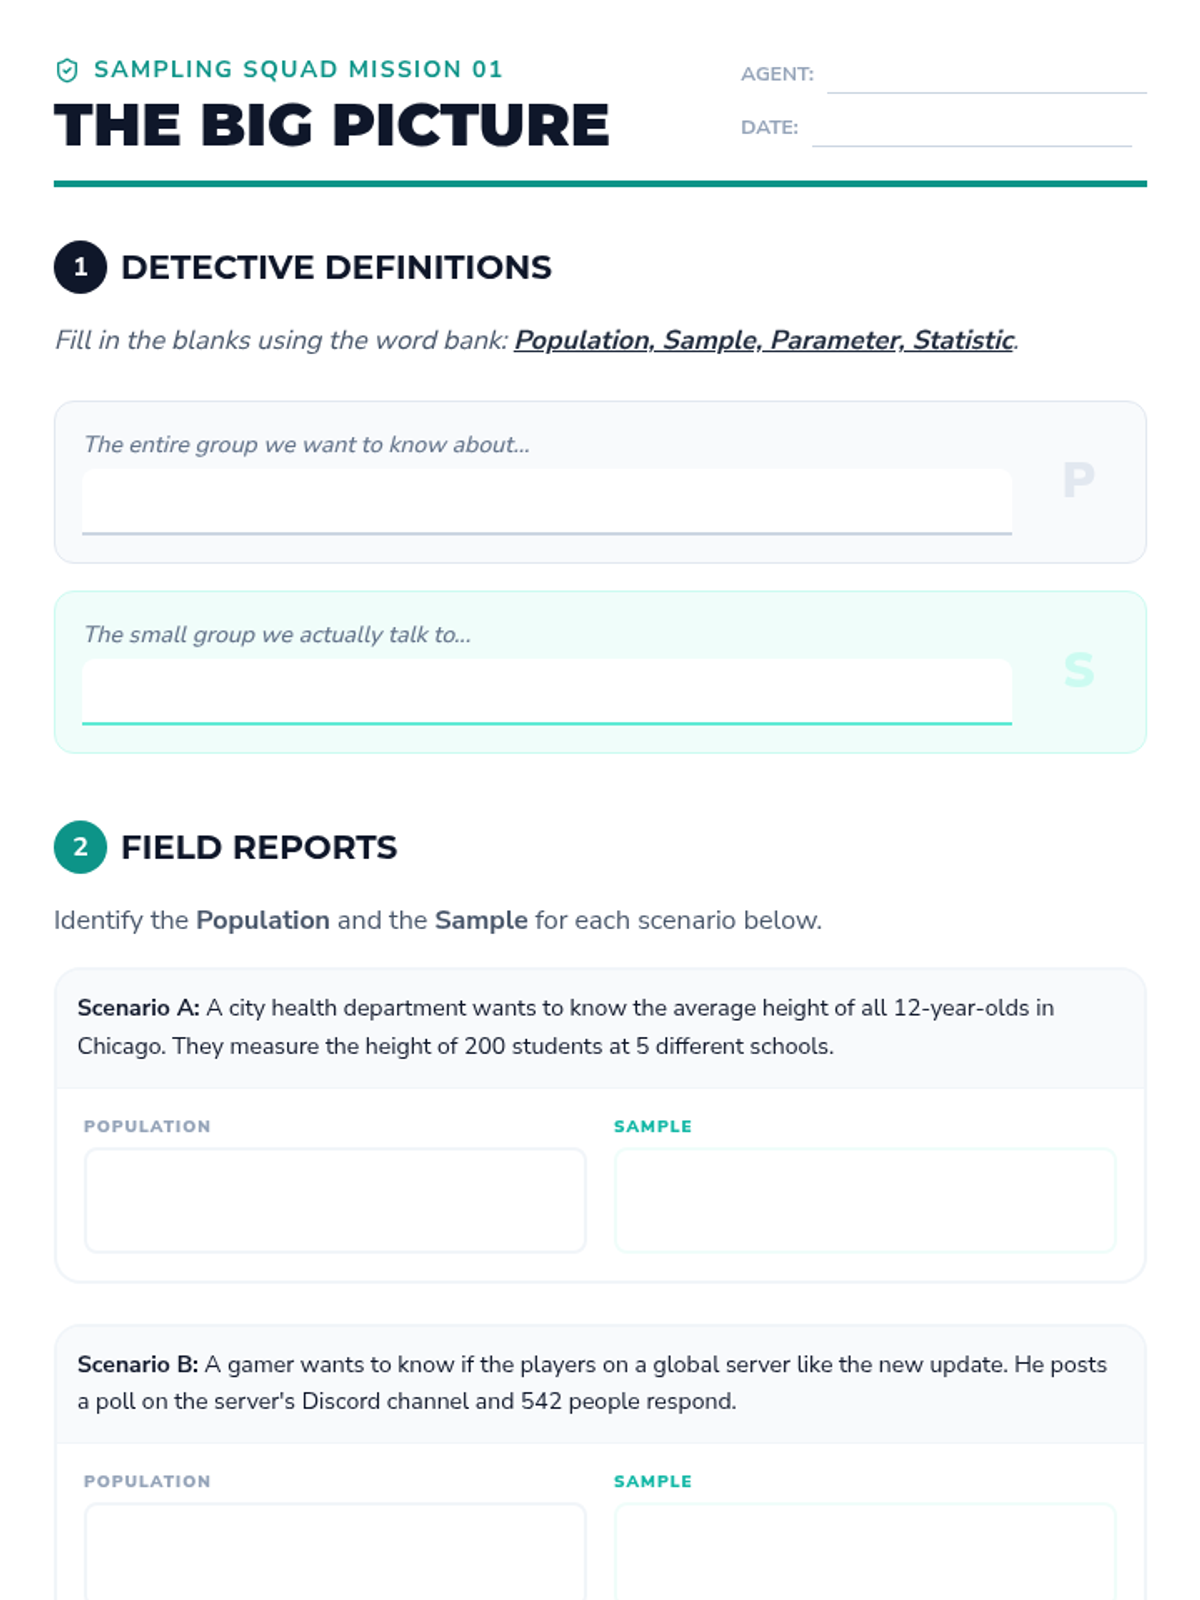
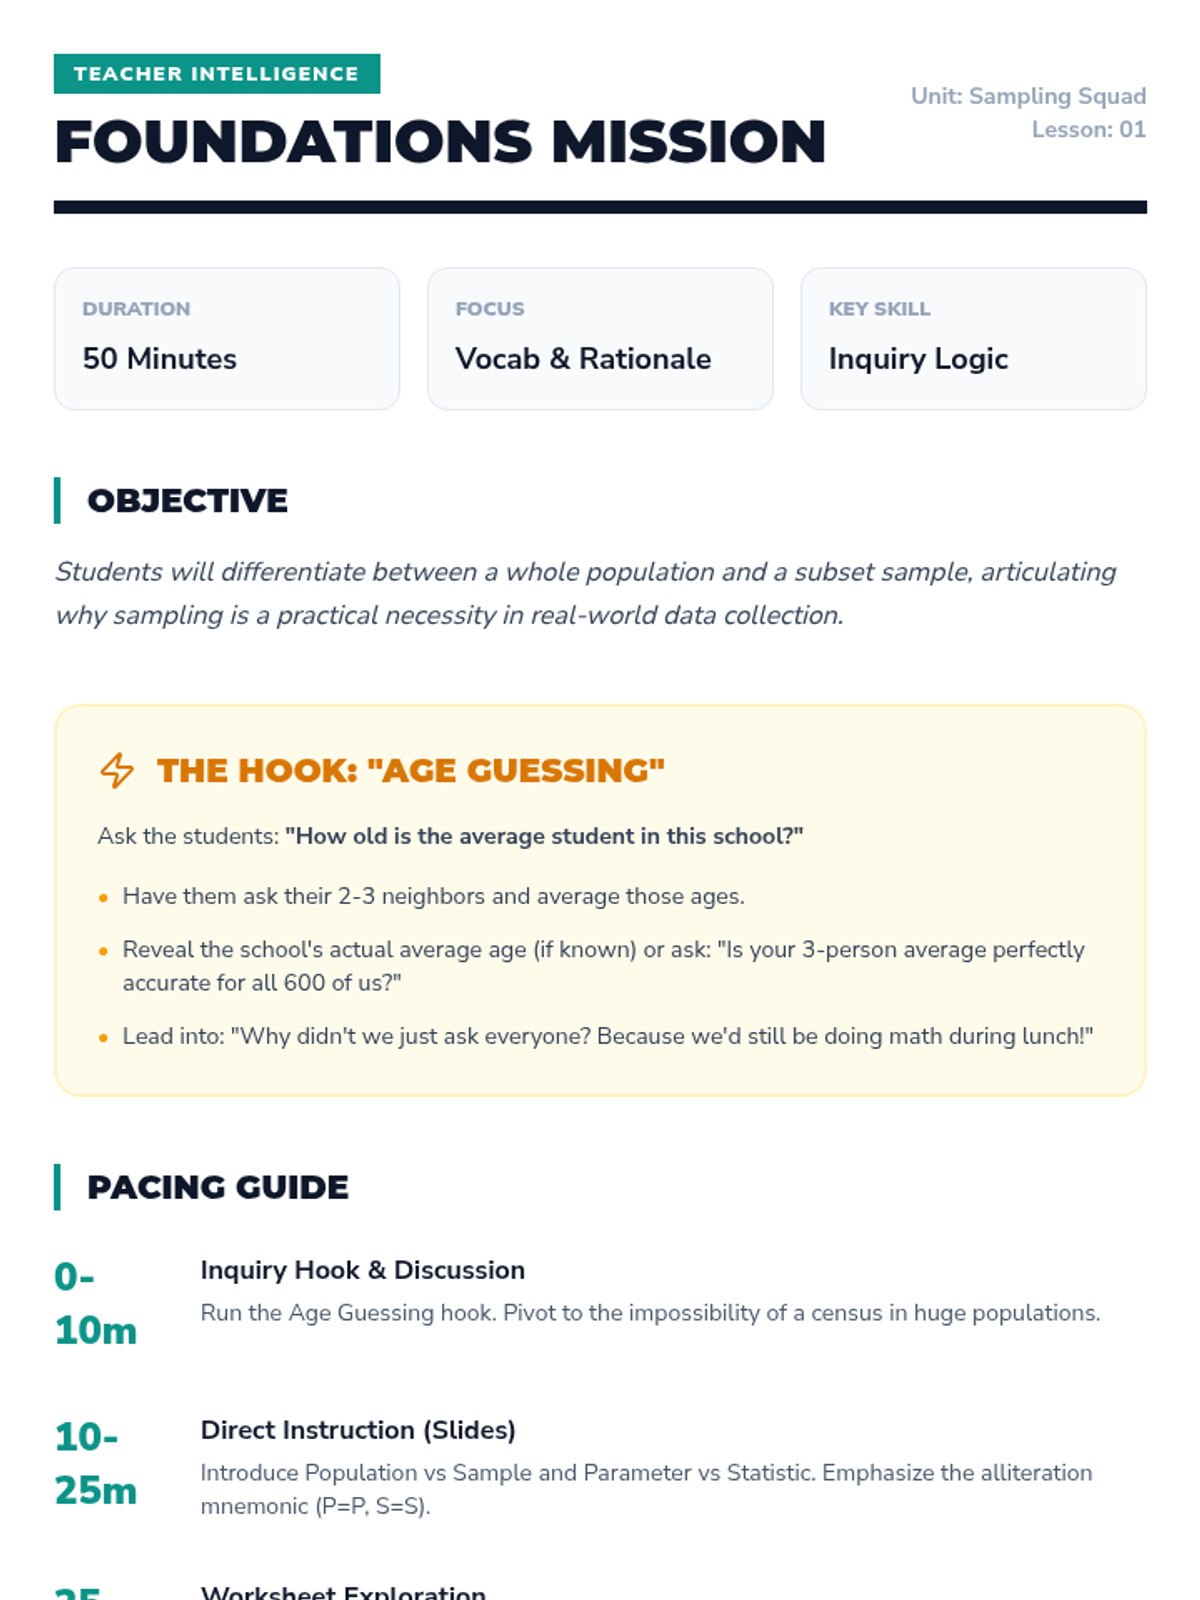
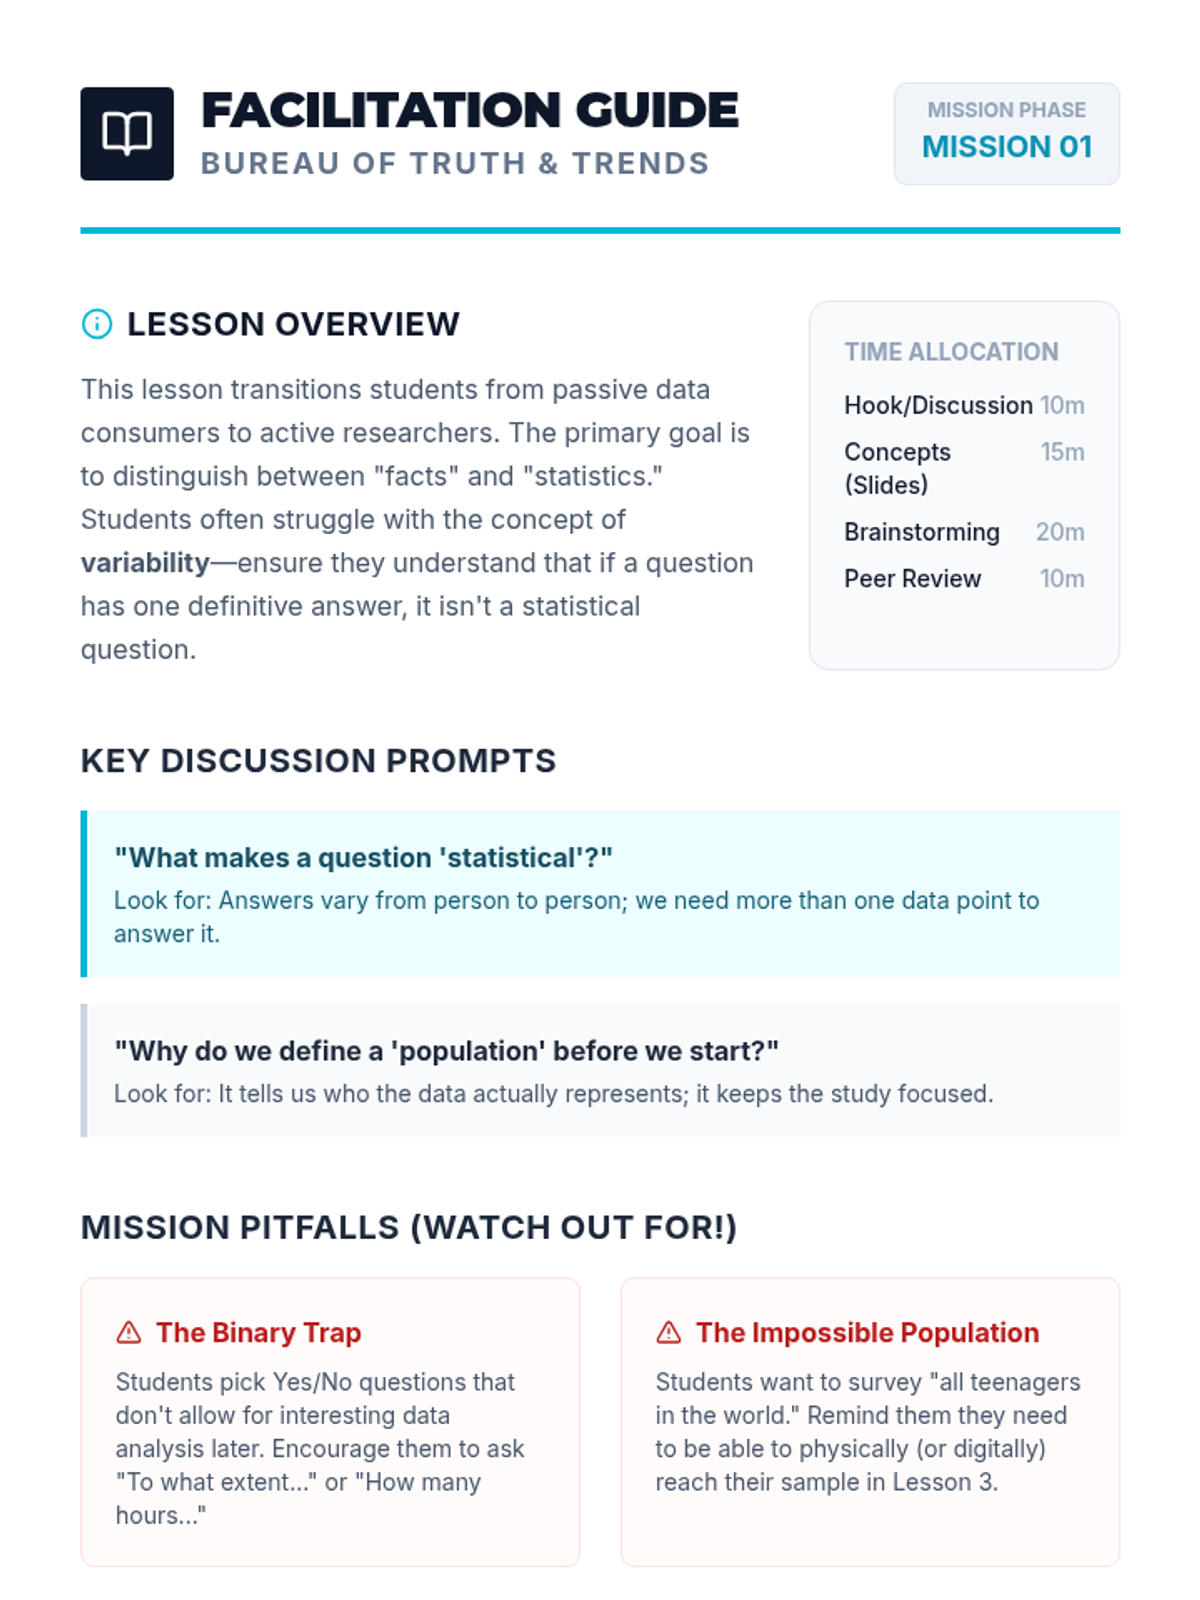
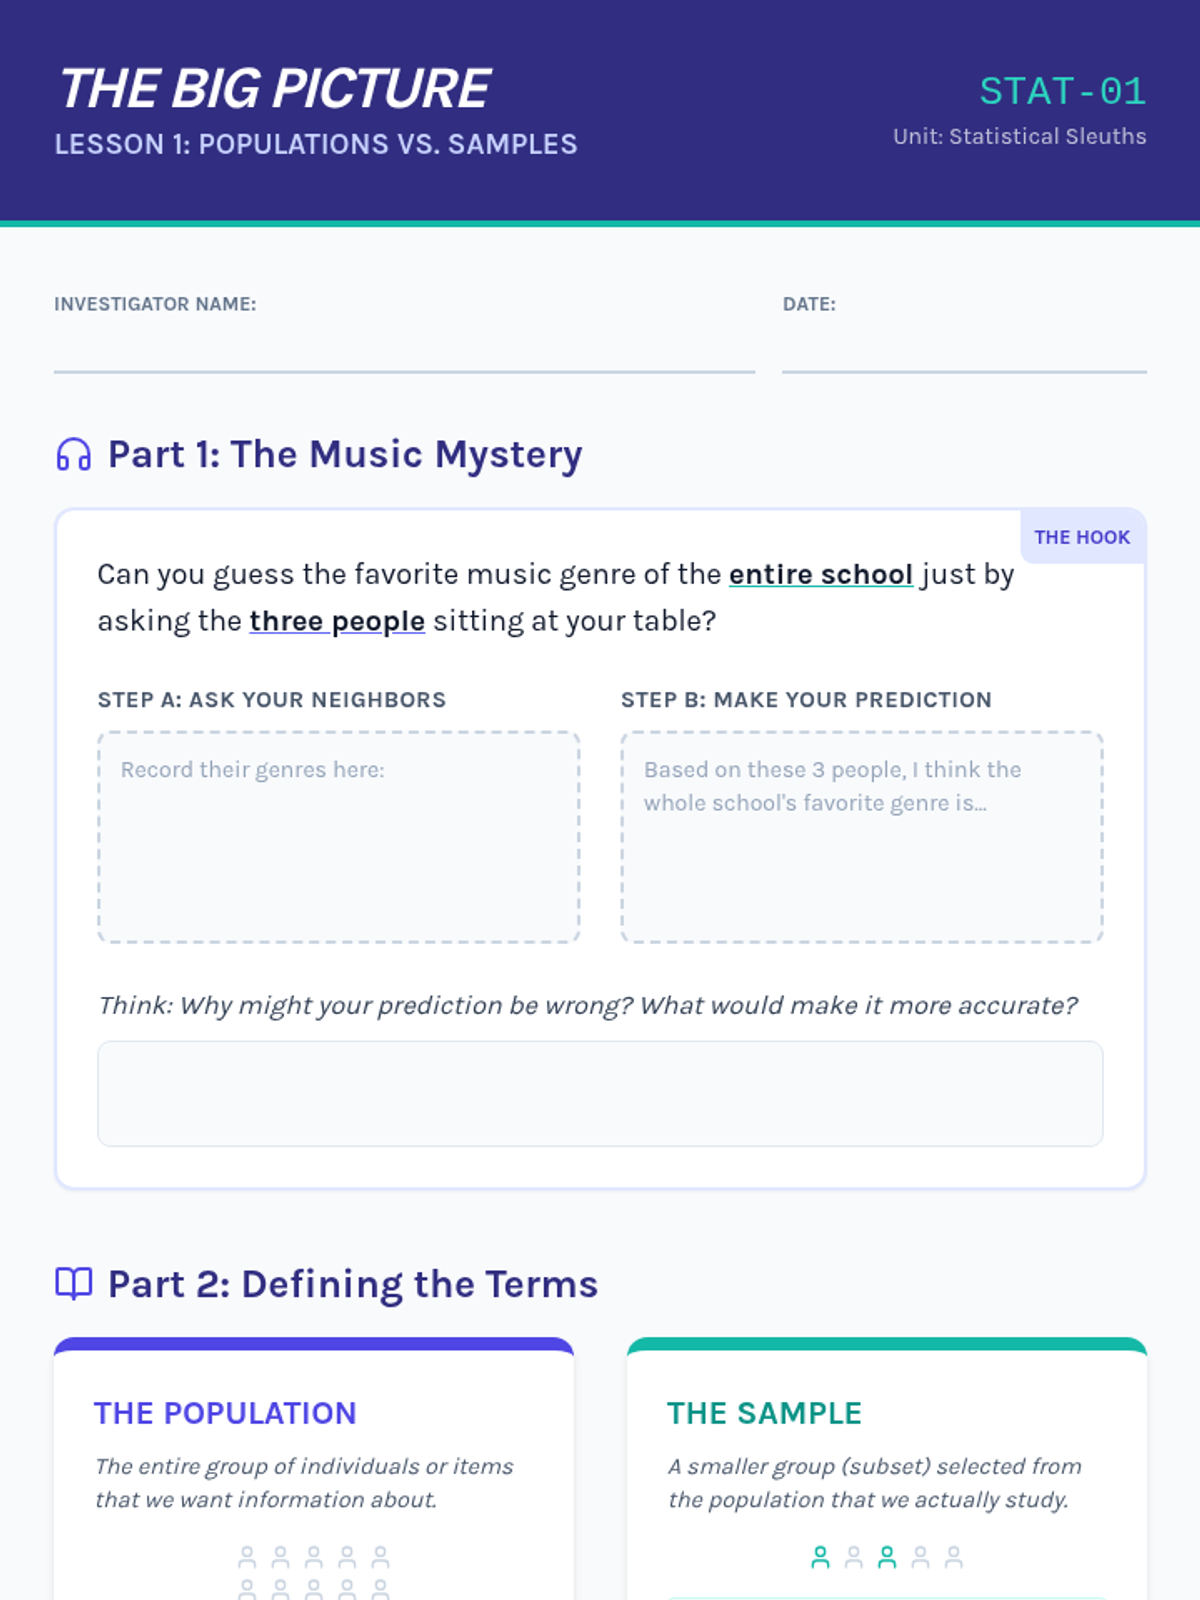
A comprehensive 7th-grade unit on statistical sampling, moving from conceptual definitions to hands-on simulations of bias, the mechanics of random selection, and making valid inferences about populations.
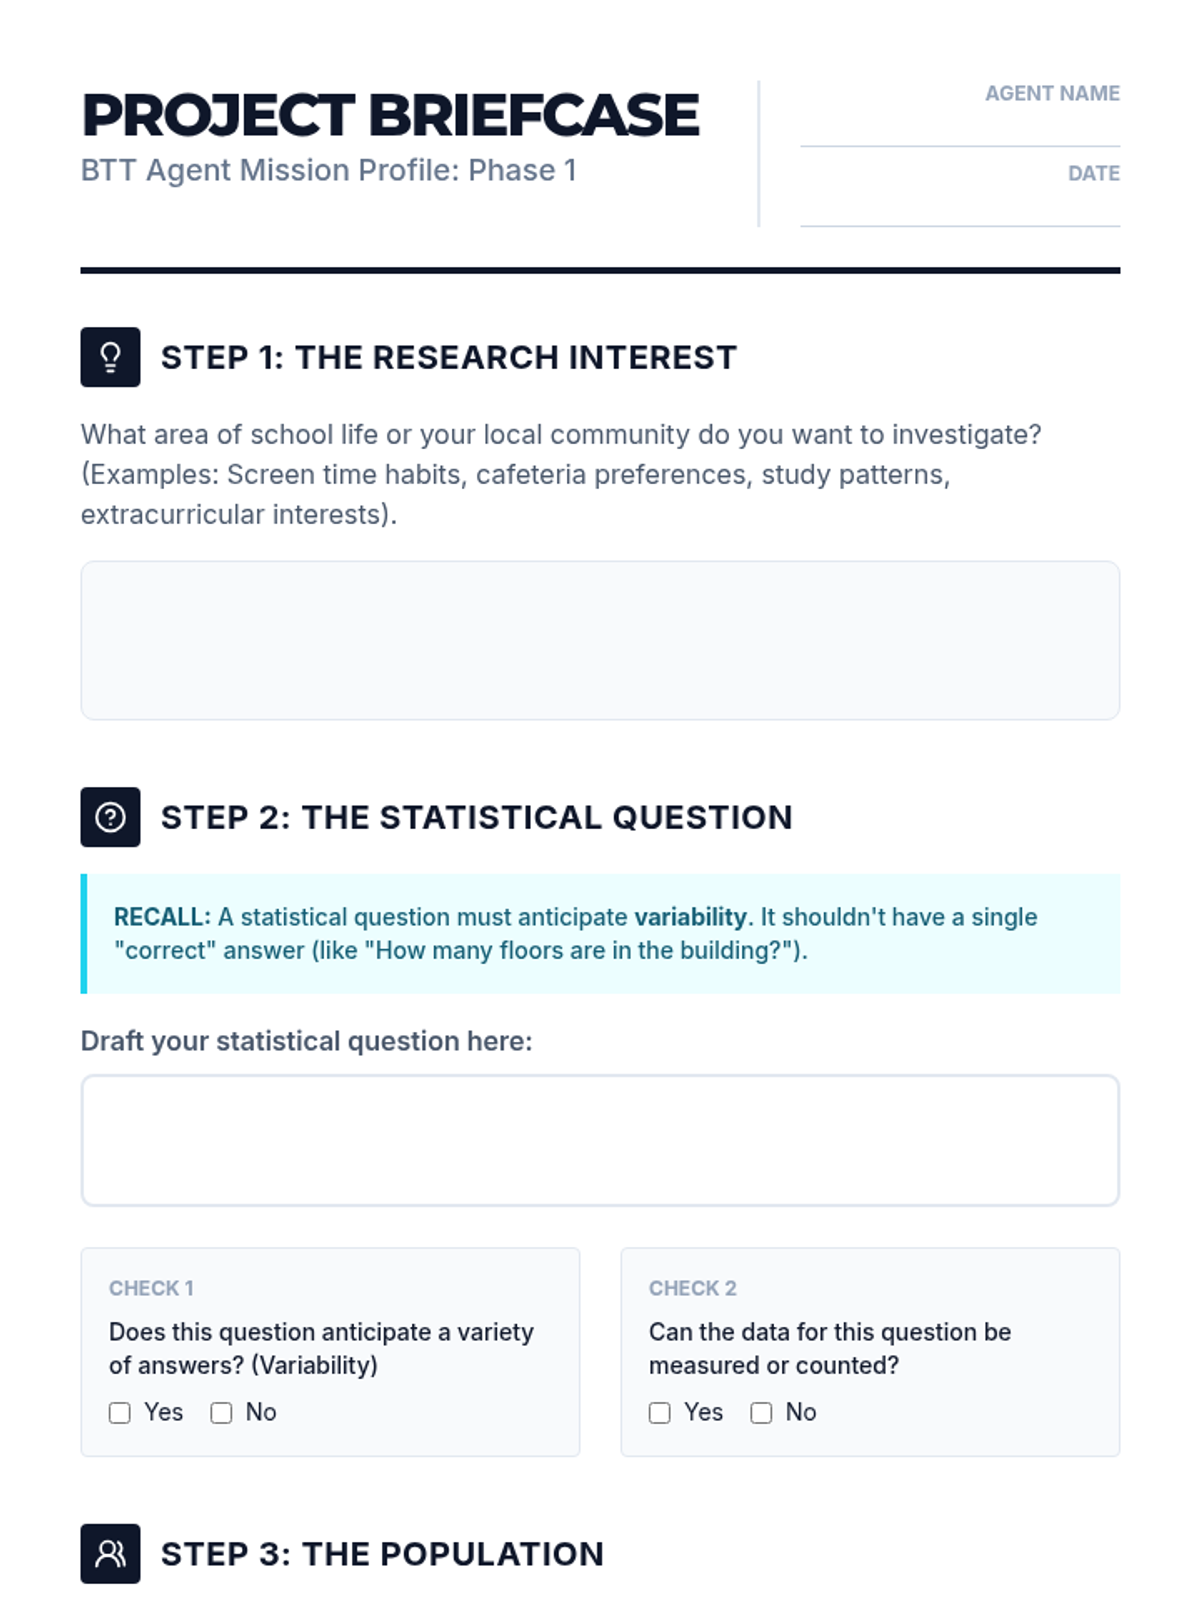
A project-based unit where students act as lead researchers, designing and executing a statistical study from question formulation to final validity reporting. Students learn to navigate population definitions, sampling methods, and question bias to ensure their data accurately reflects reality.
This inquiry-based sequence focuses on the relationship between sample size and the reliability of inferences. Students use technology and simulations to visualize how large samples stabilize around population parameters, introducing the Law of Large Numbers and Margin of Error concepts.
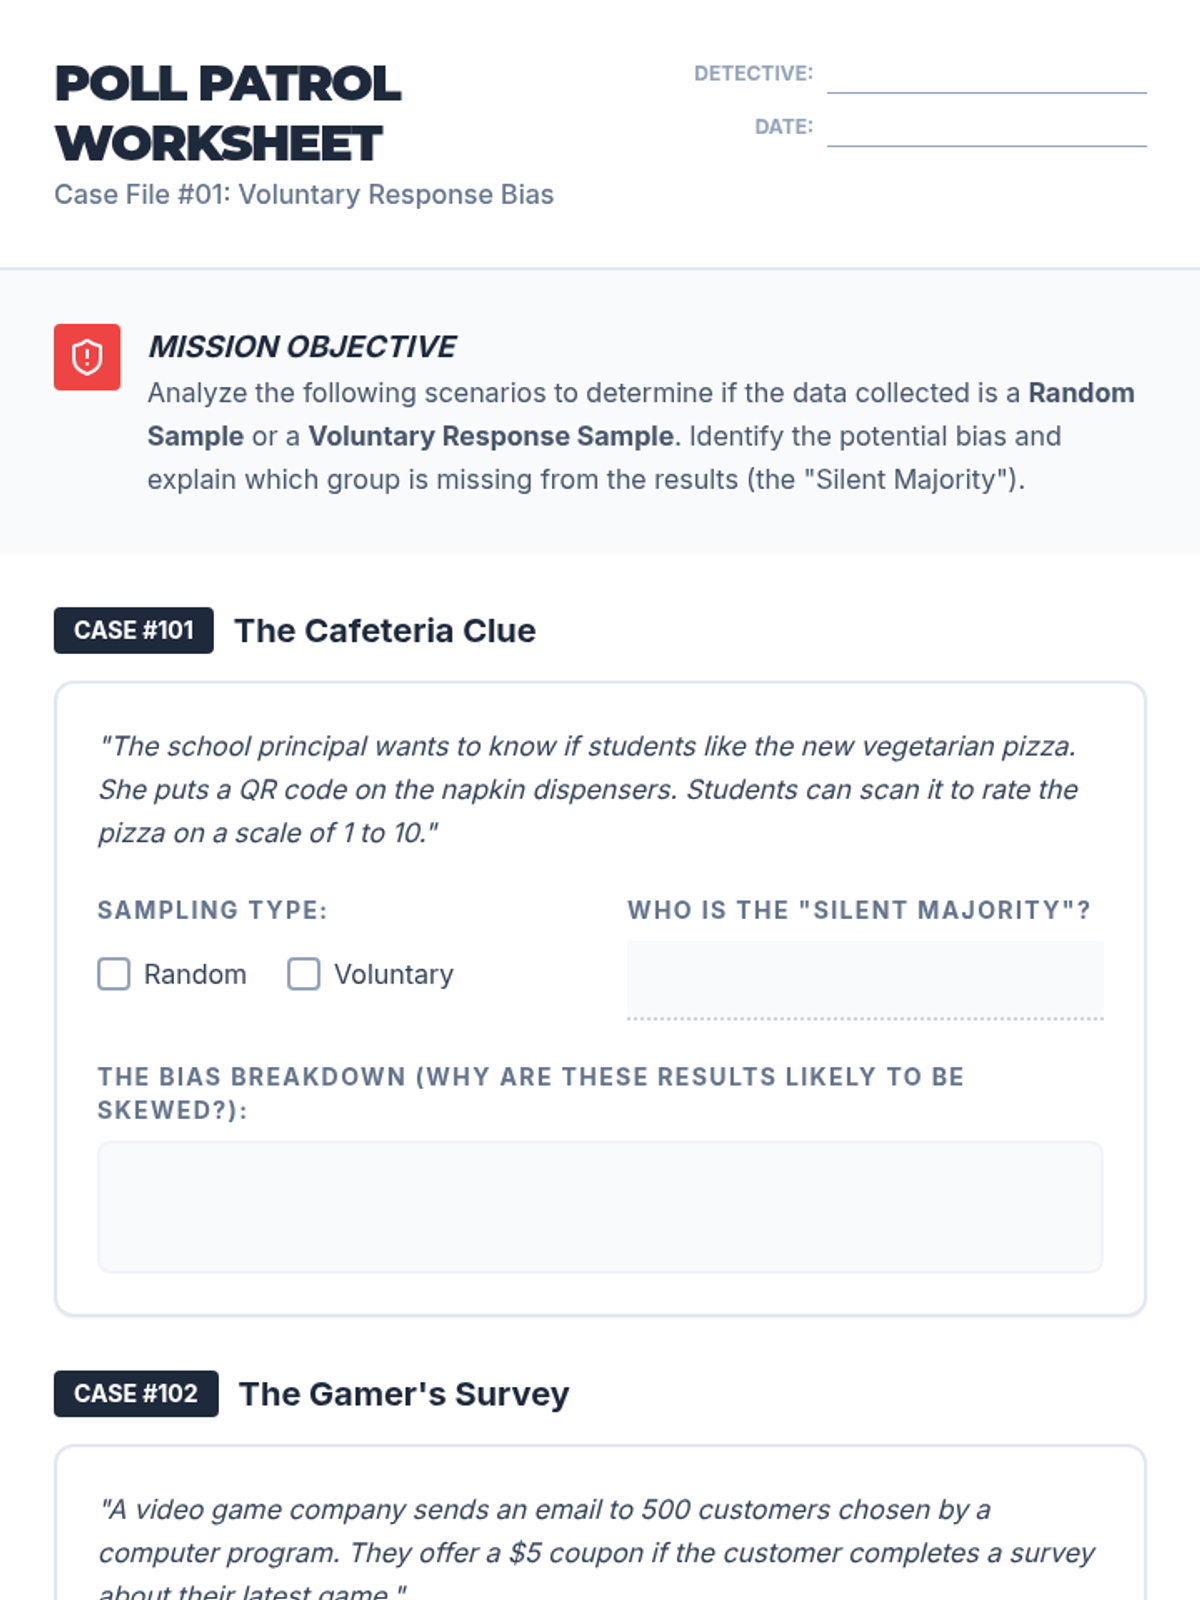
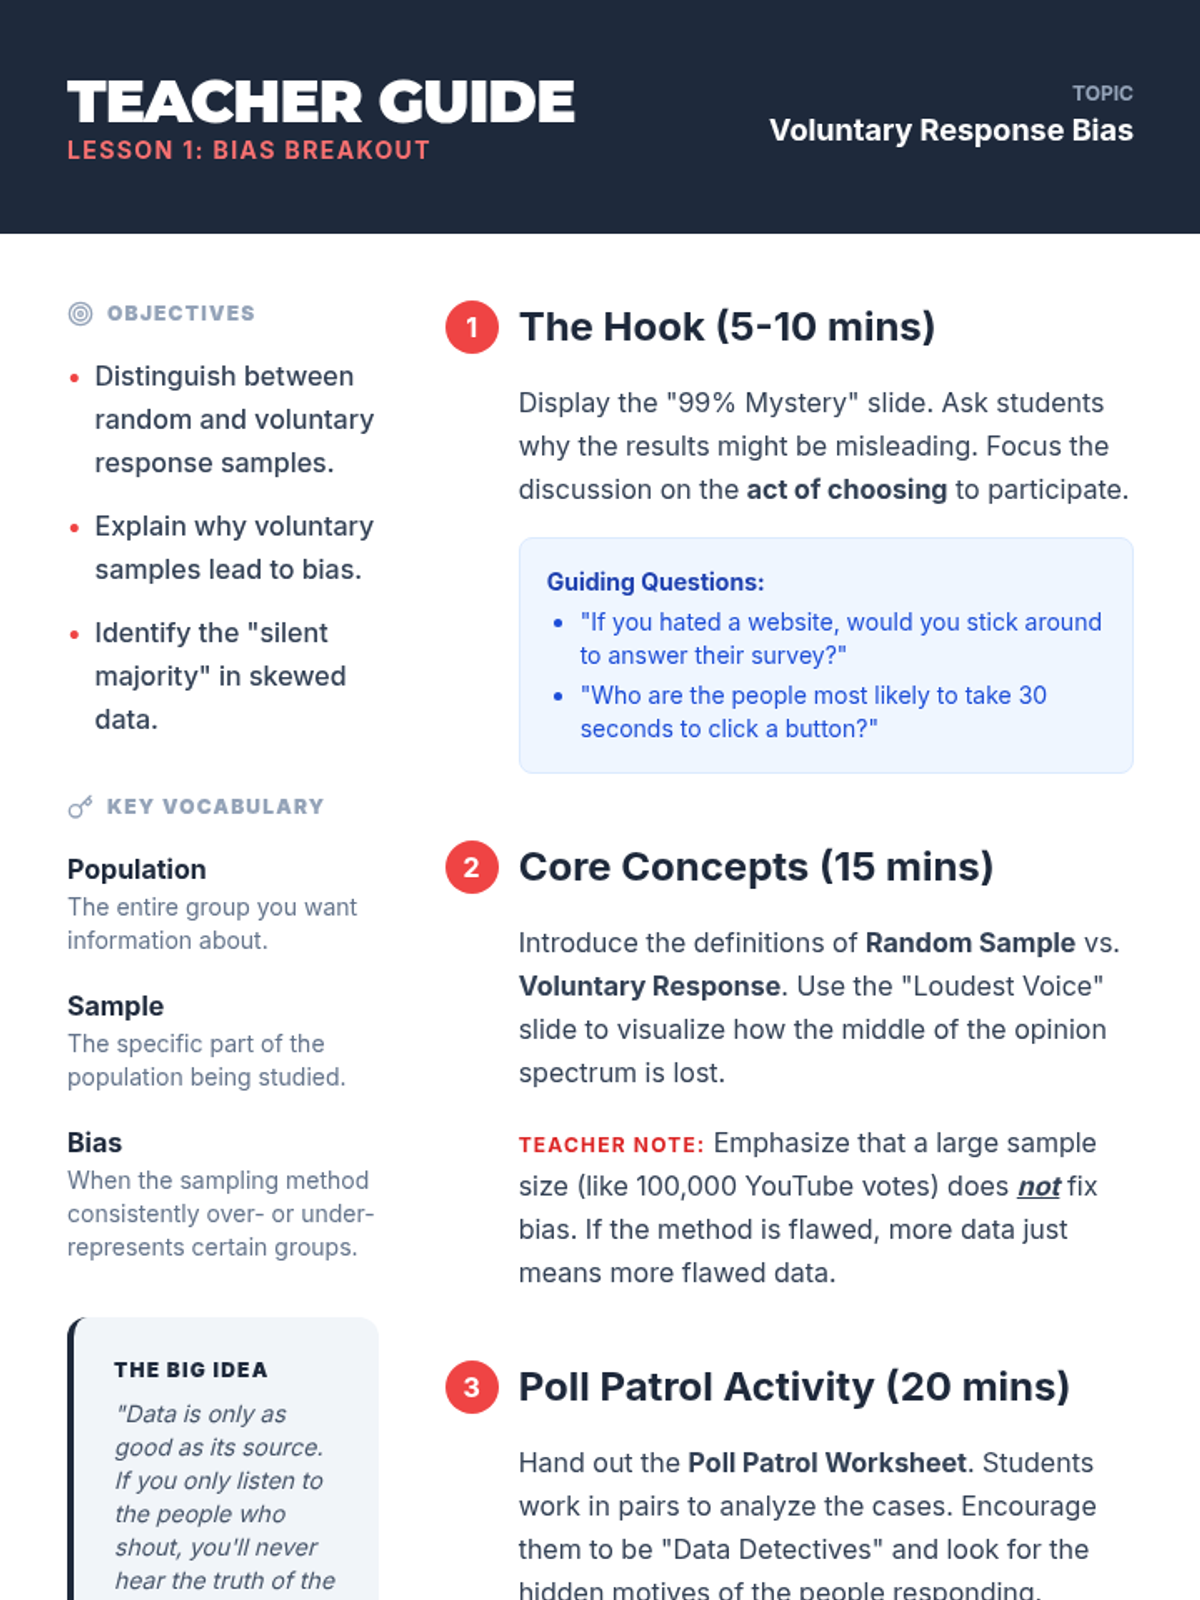
This sequence explores the critical world of statistical sampling, teaching students to identify bias, understand the importance of randomness, and evaluate the validity of data-driven claims in media and history.
An interdisciplinary unit for 7th and 8th graders that transforms students into 'Data Detectives'. They learn to collect, analyze, and visualize real-world data to uncover trends and communicate findings effectively.
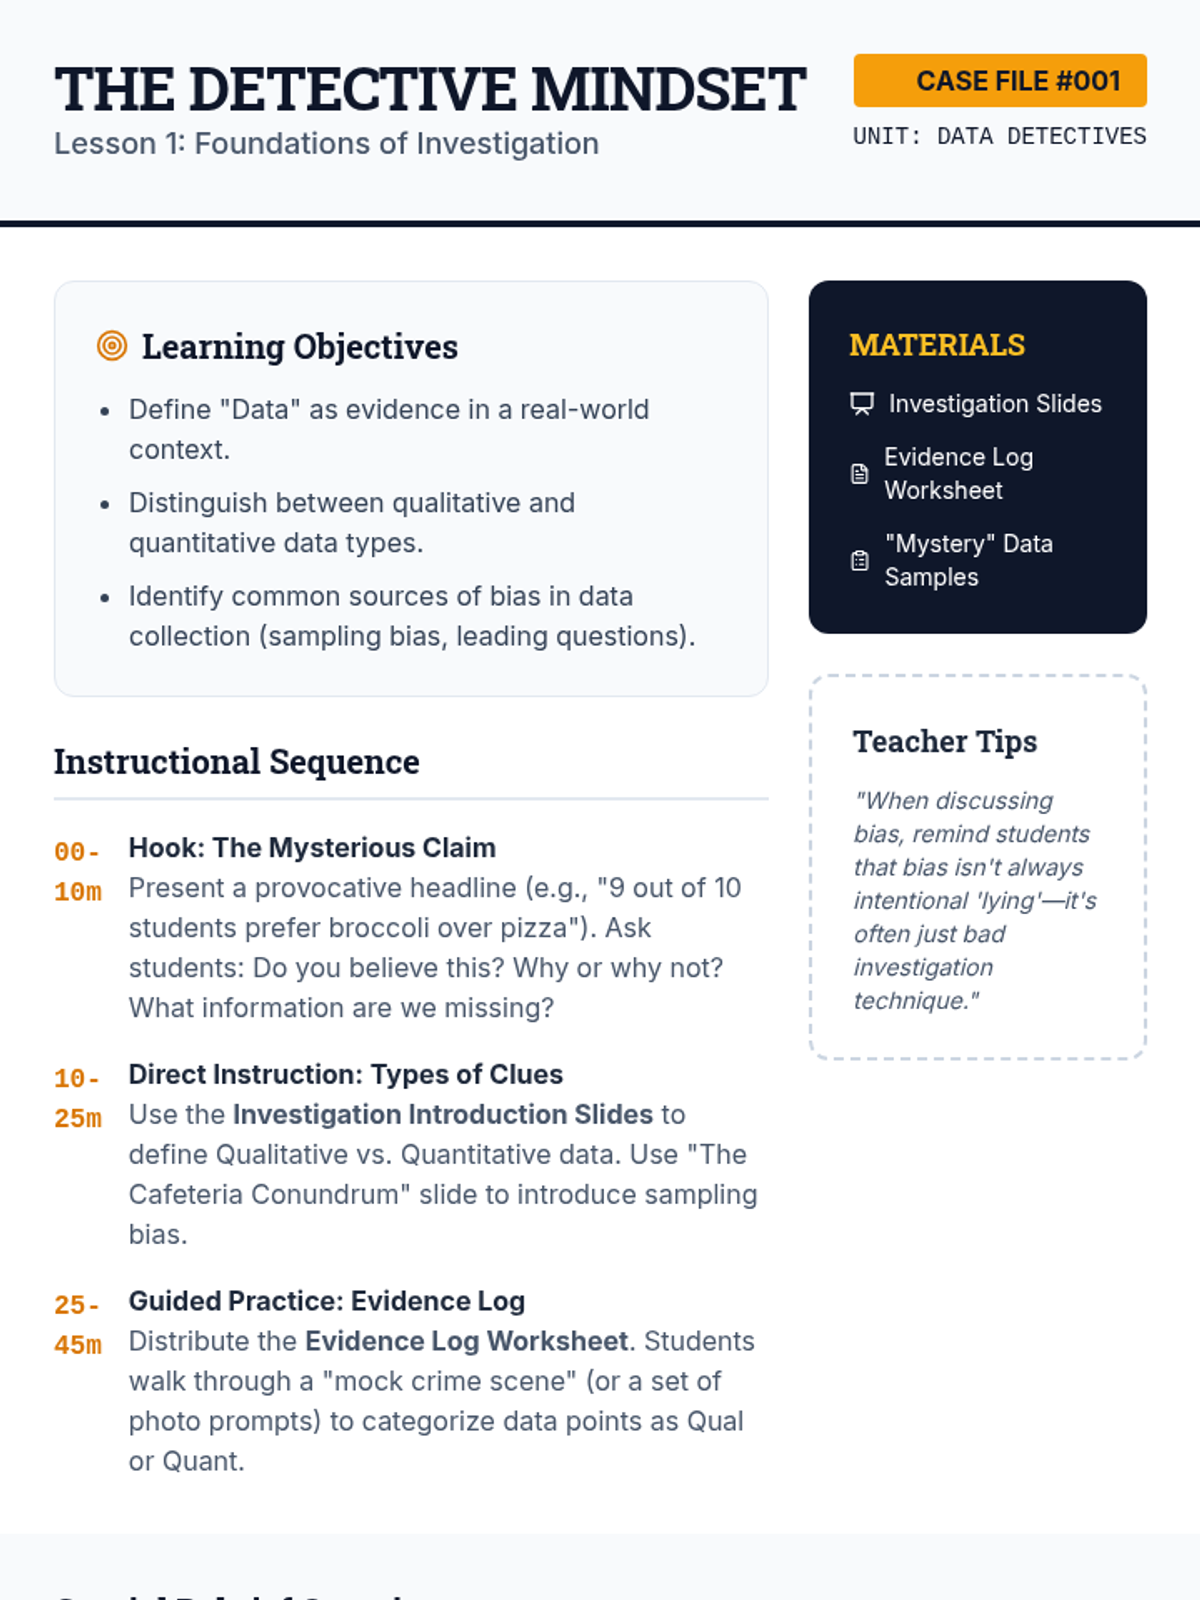
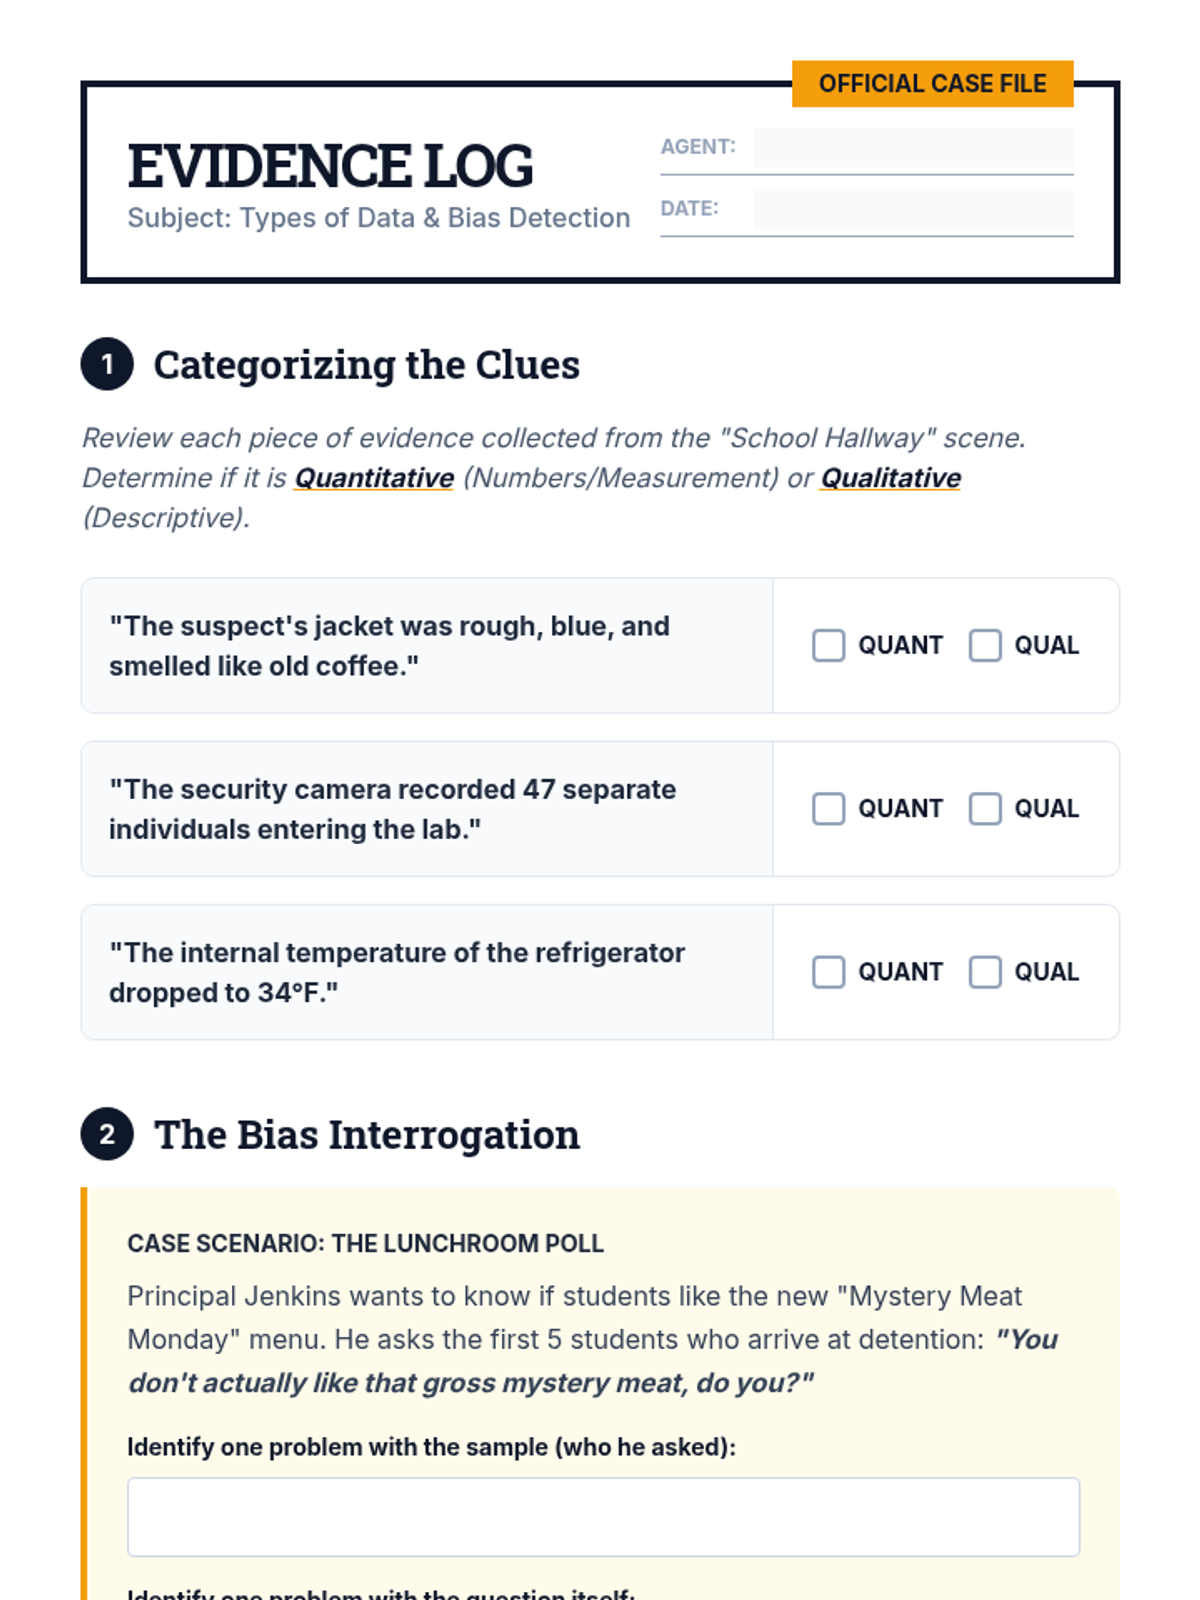
A 7th-grade math sequence focused on statistical sampling, bias, and data literacy. Using a 'Data Detective' theme, students analyze real-world and historical examples of sampling failures, misleading visualizations, and the difference between correlation and causation.
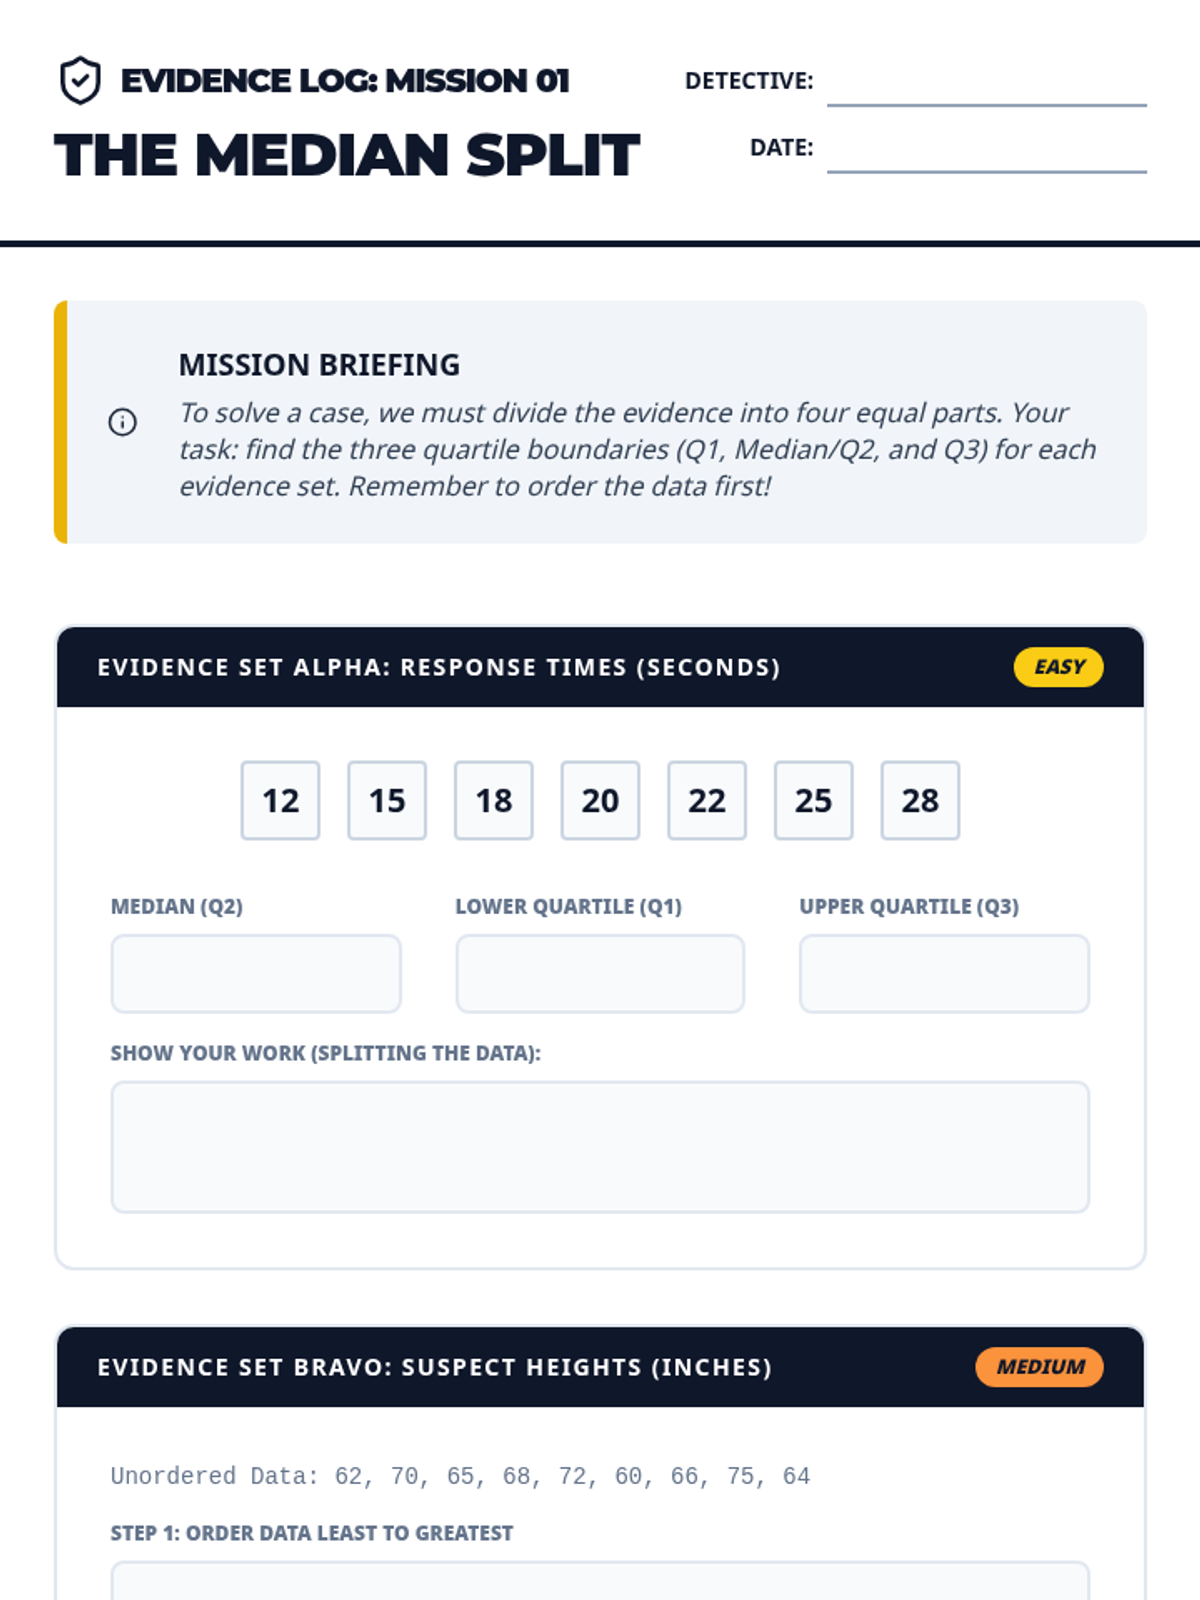
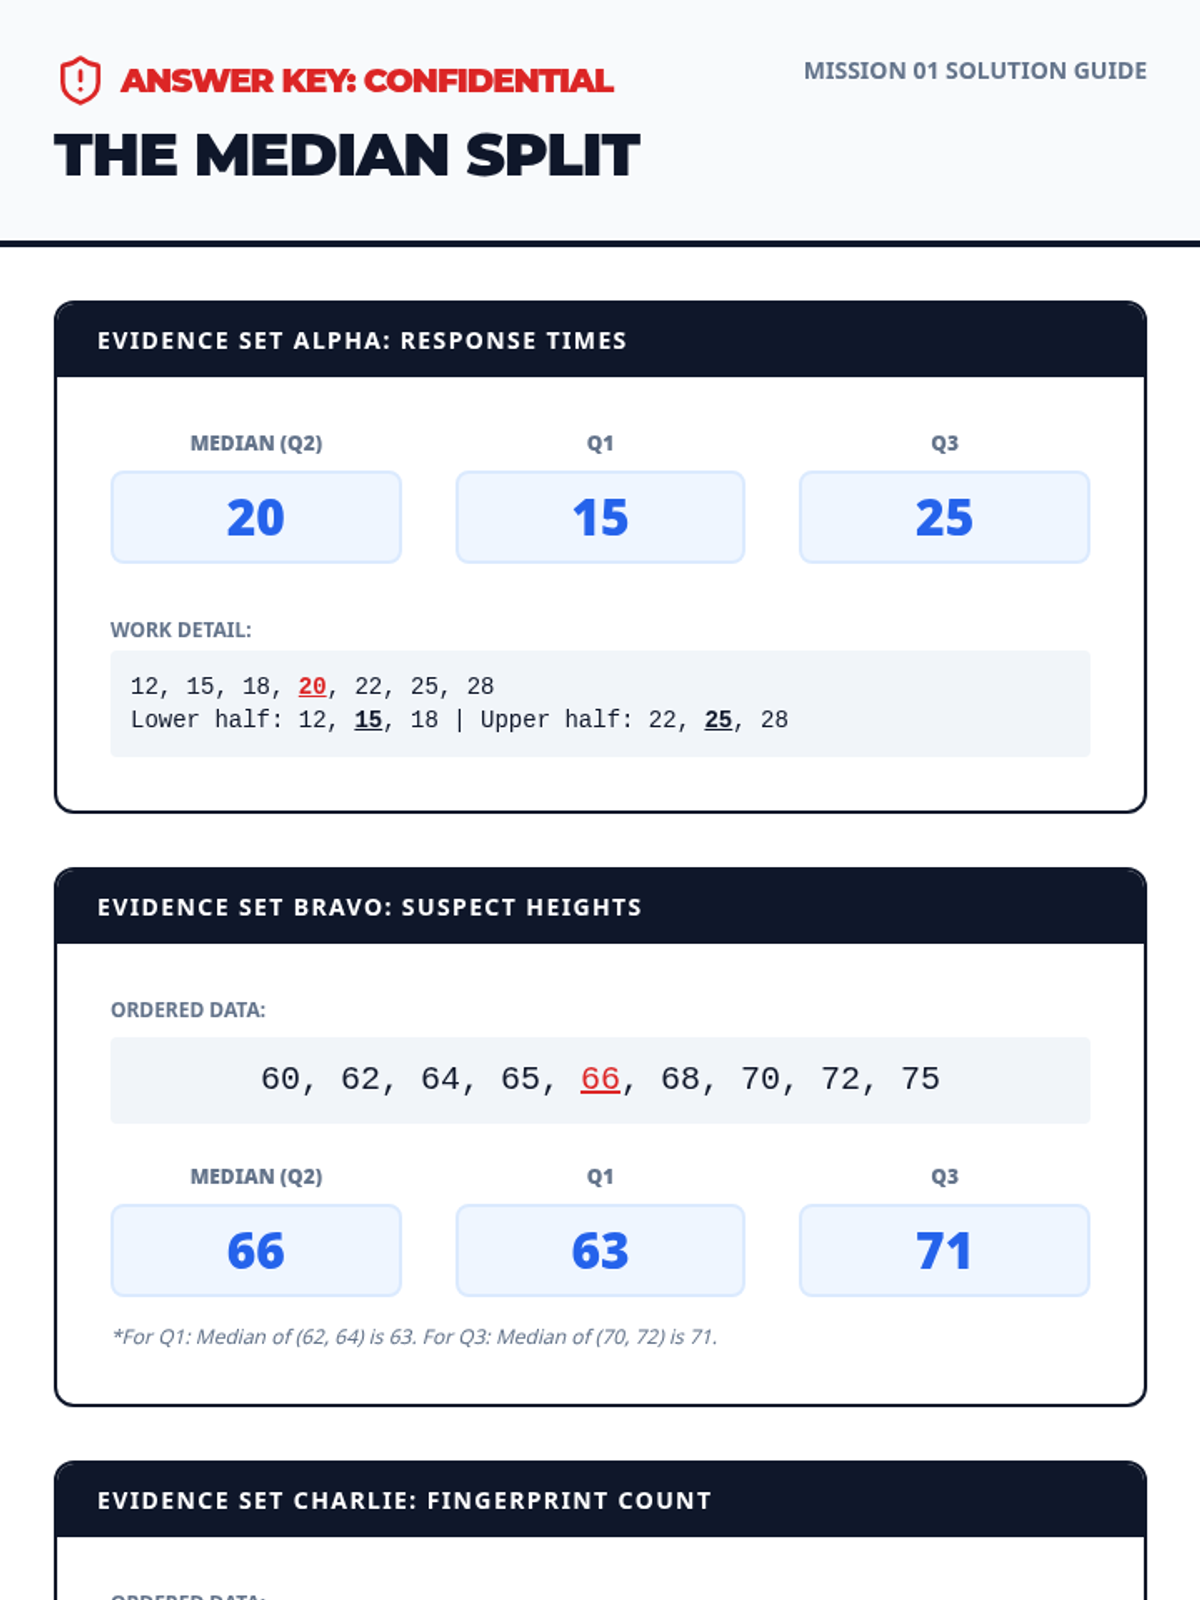
A comprehensive 7th-grade unit on statistical variability, focusing on quartiles, interquartile range (IQR), and the construction and interpretation of box plots using a detective-themed 'Data Detectives' aesthetic.
A comprehensive unit for 7th graders on compound event probability, moving from visual mapping (tree diagrams, tables) to theoretical calculations and strategy selection.
A comprehensive 7-week NYS Math Assessment preparation sequence for 8th grade, covering major clusters including algebra, functions, geometry, and statistics.
Mastering data visualization and interpretation through scatter plots and trend analysis.
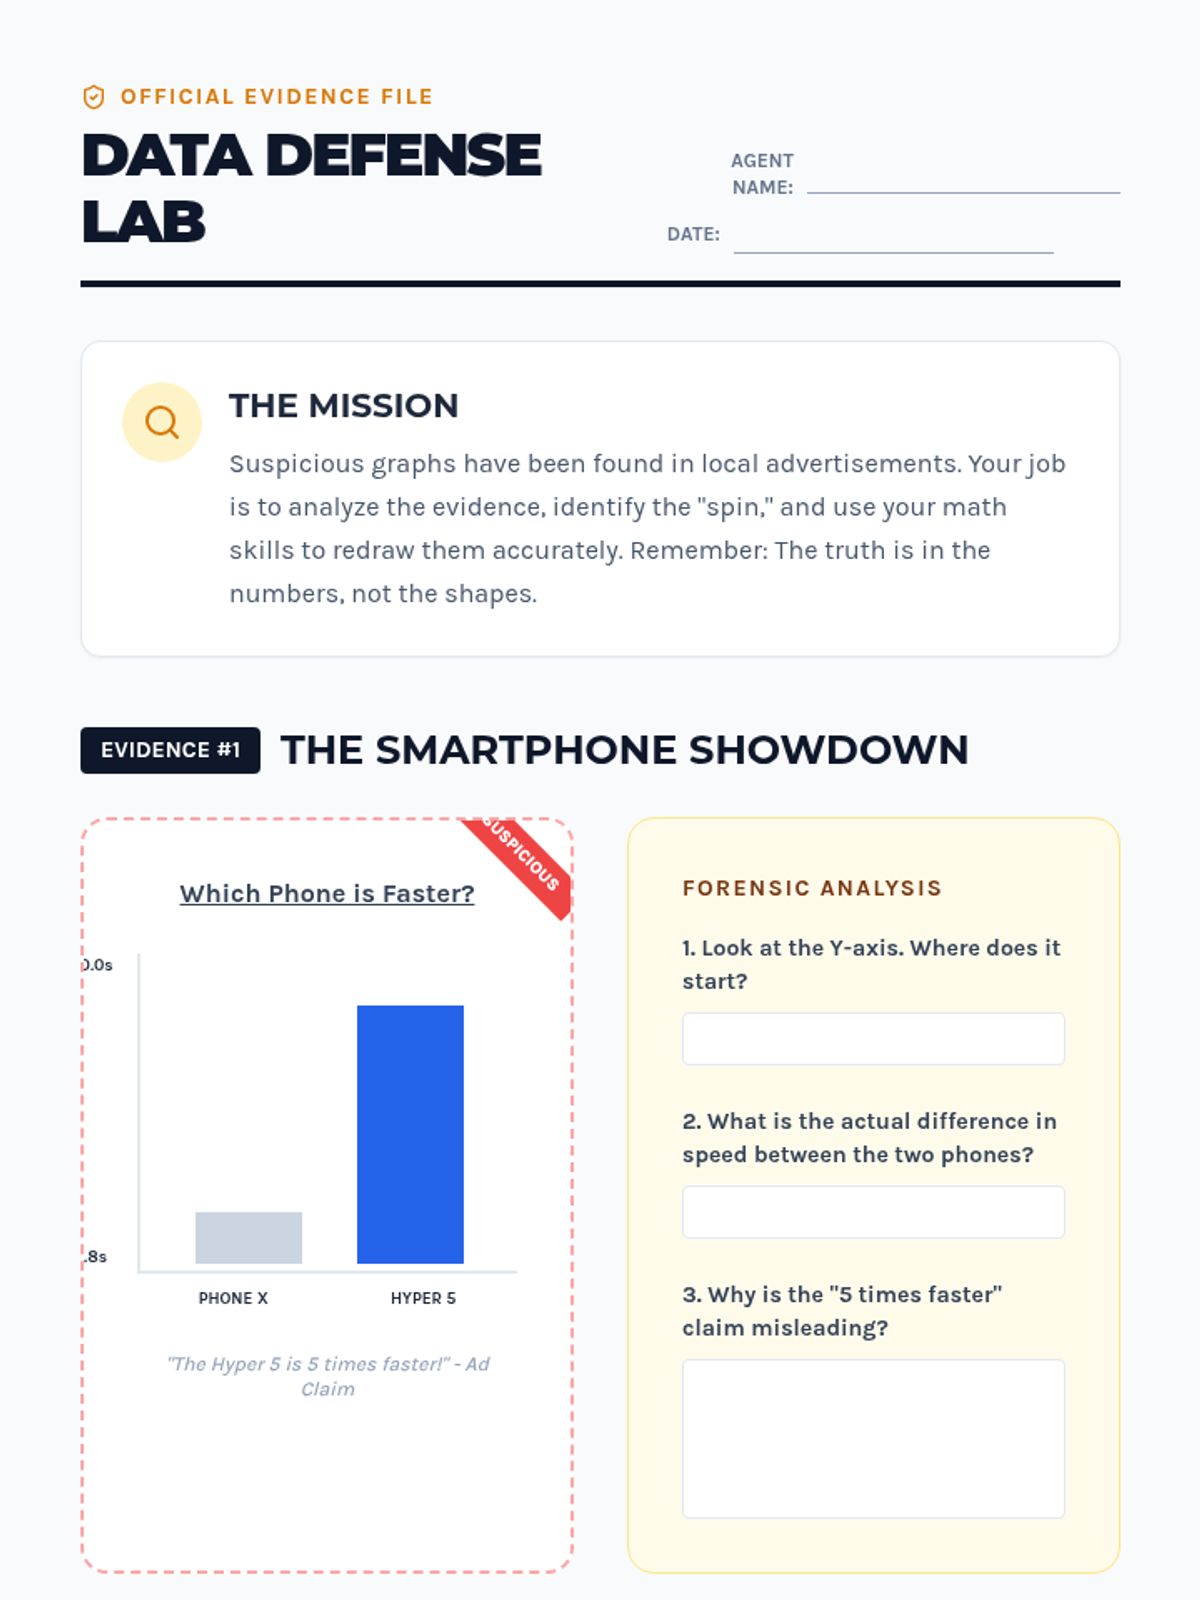
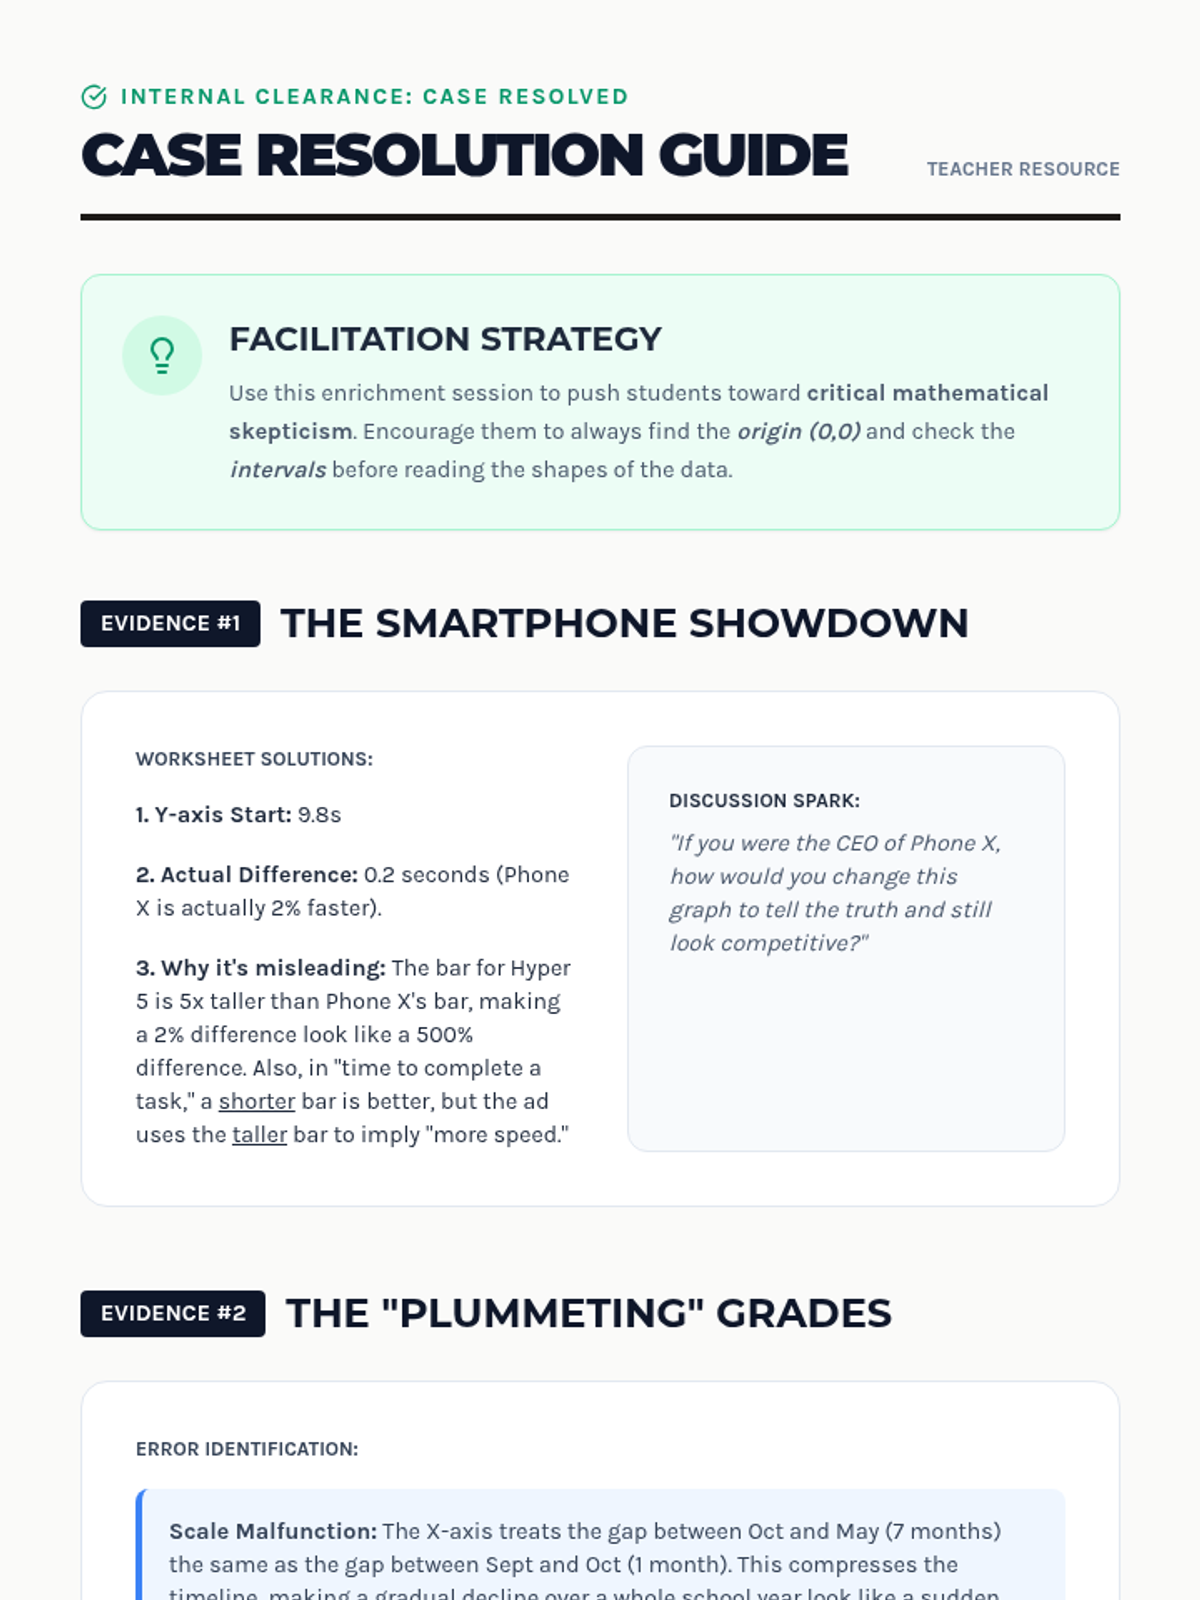
A deep dive into data literacy, focusing on how data can be manipulated and how to interpret it with a critical, mathematical eye. Students move beyond simple reading to evaluation and analysis.
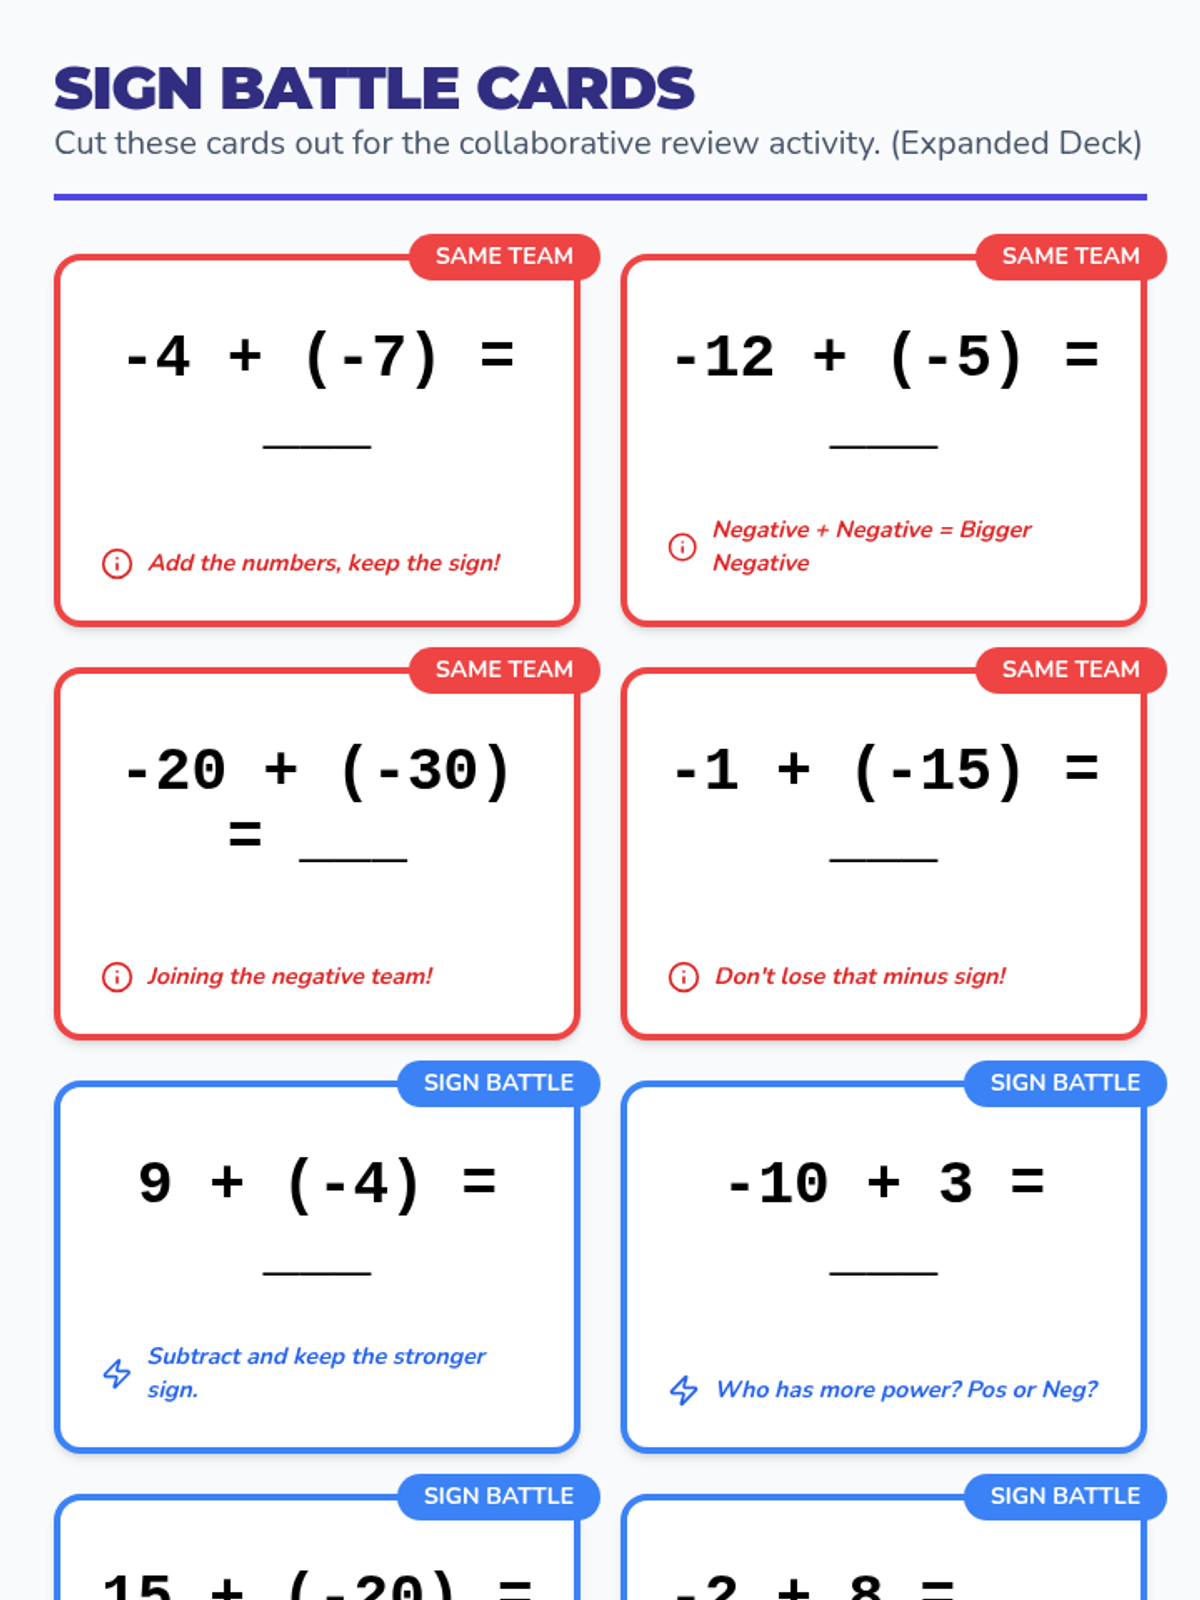
A comprehensive unit on adding and subtracting integers for grades 5-7, focusing on visual supports, mnemonic rules, and scaffolded practice for students with diverse learning needs.
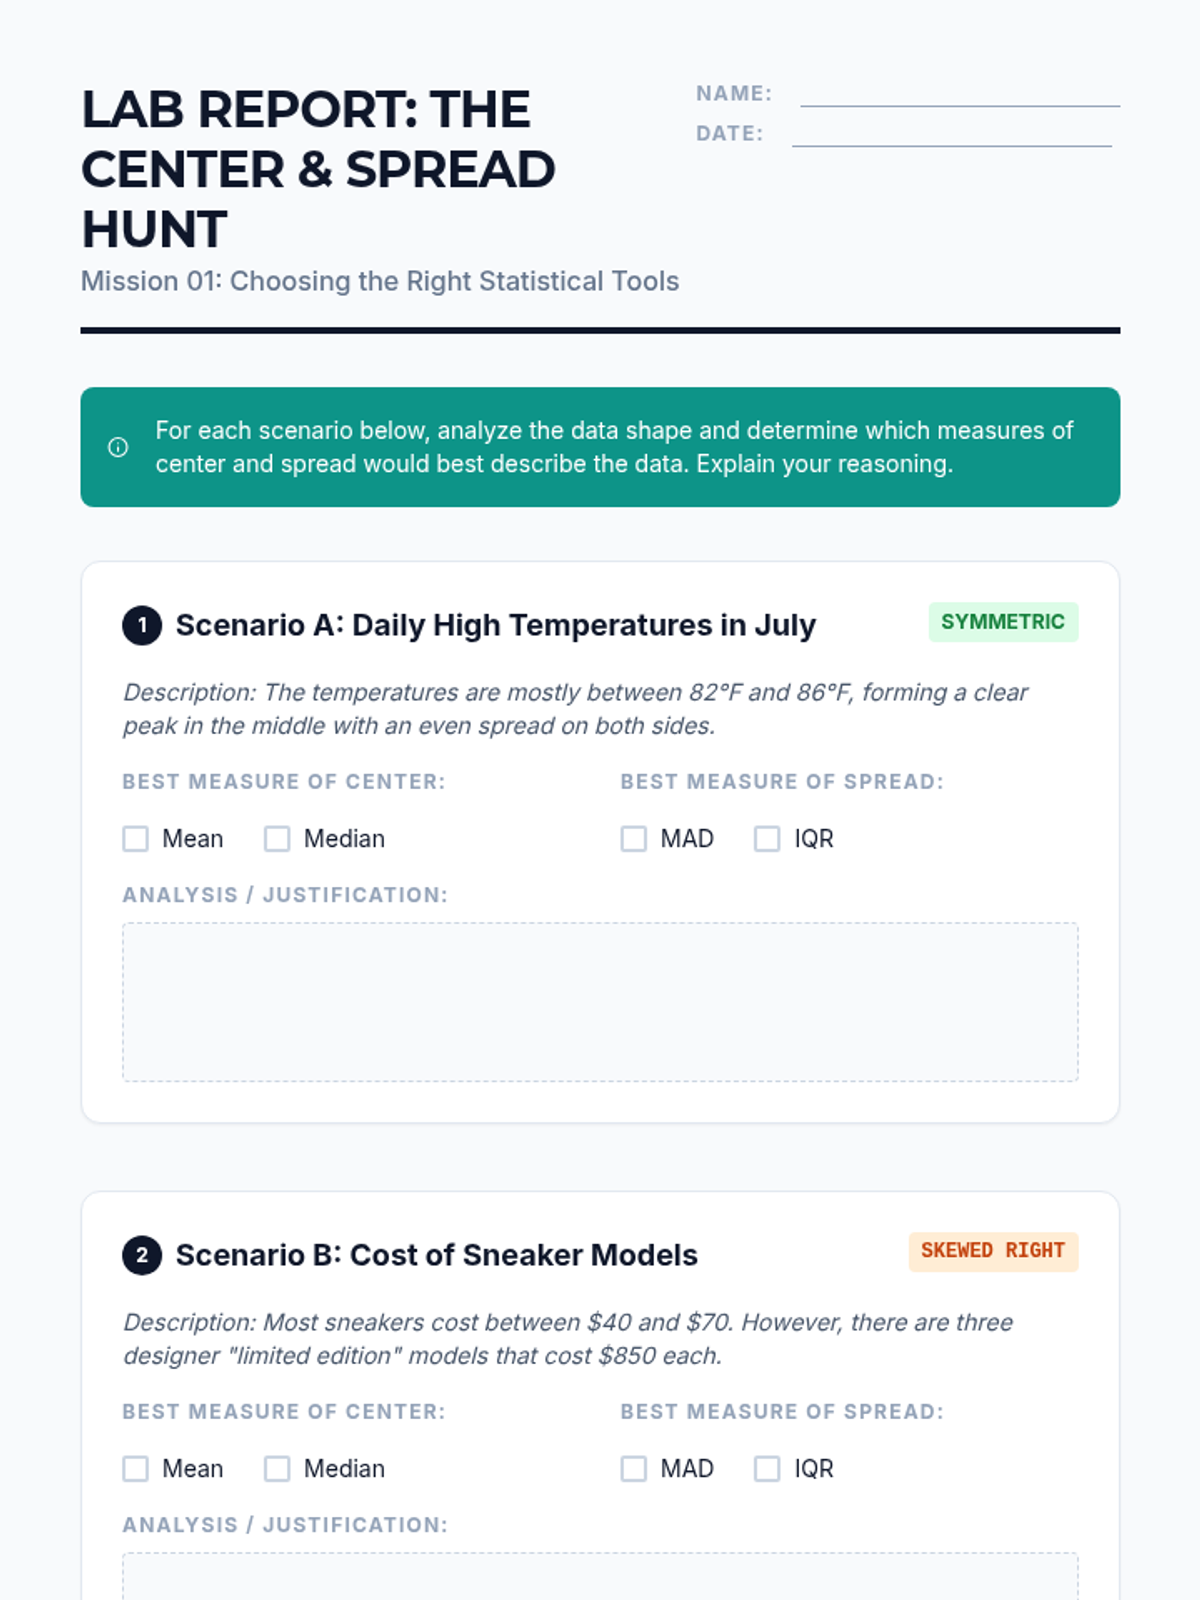
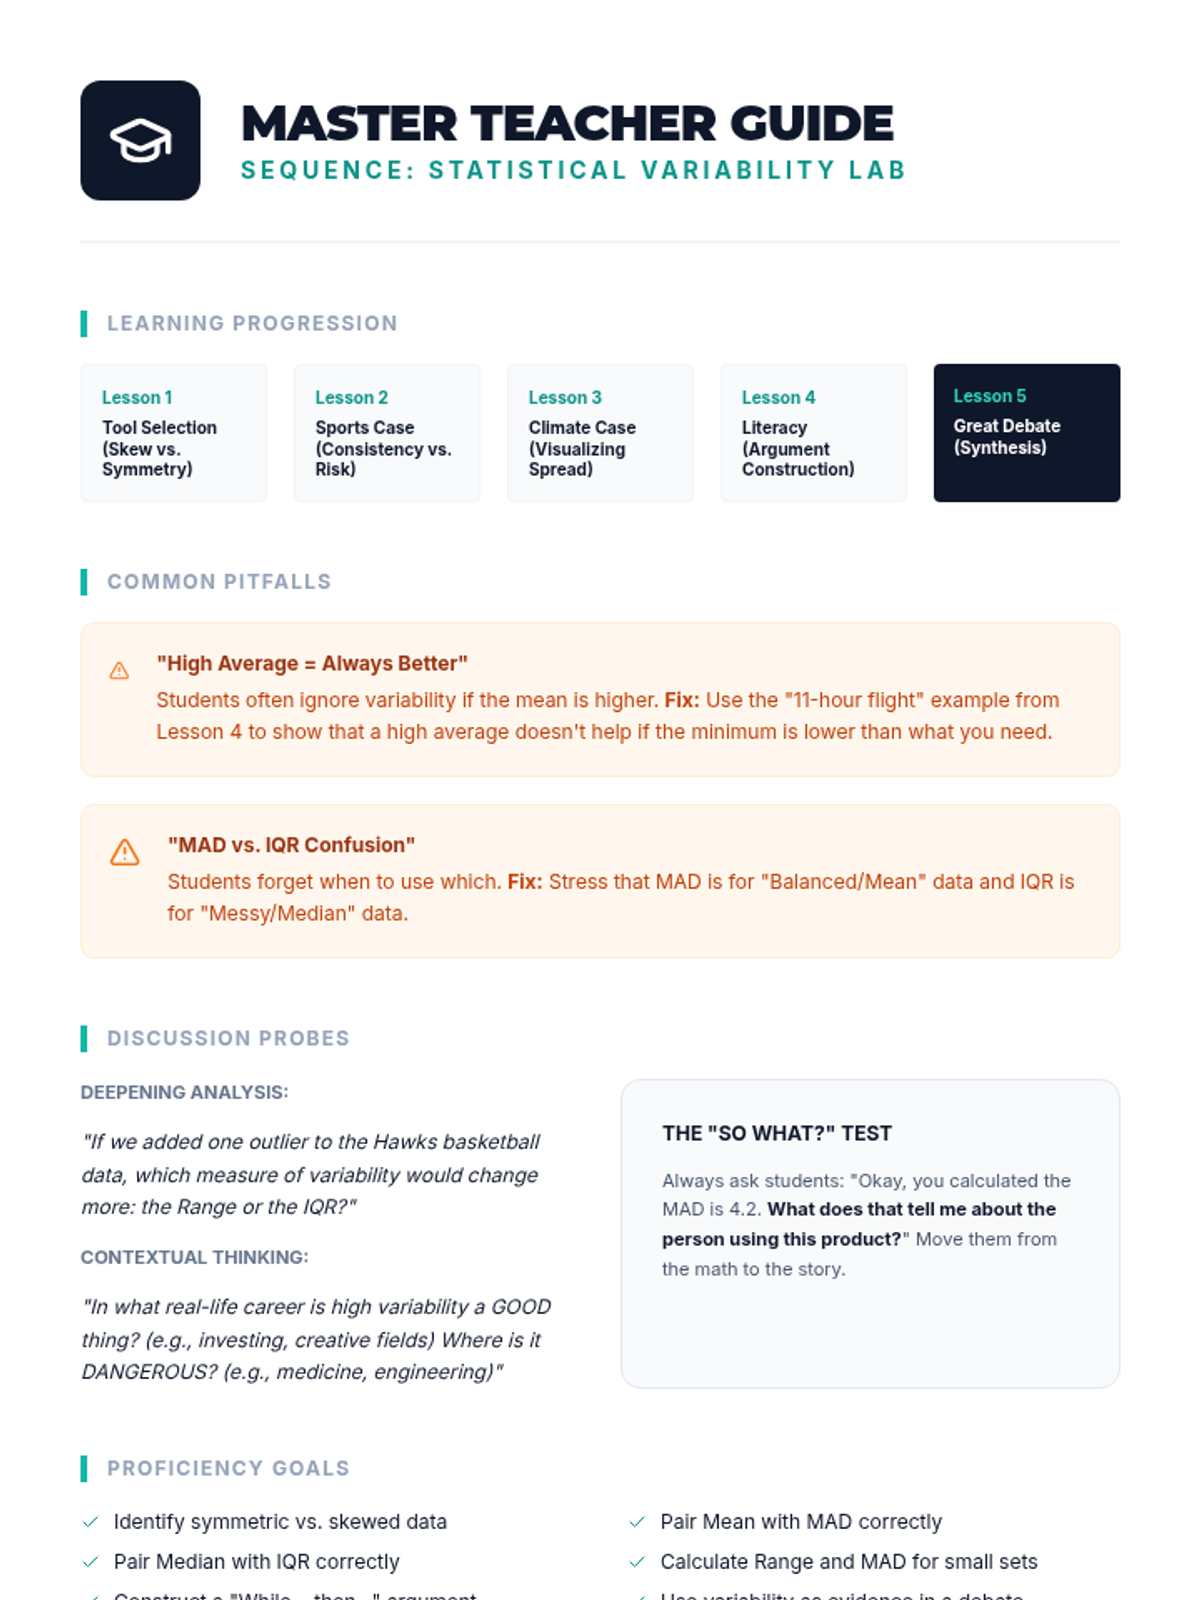
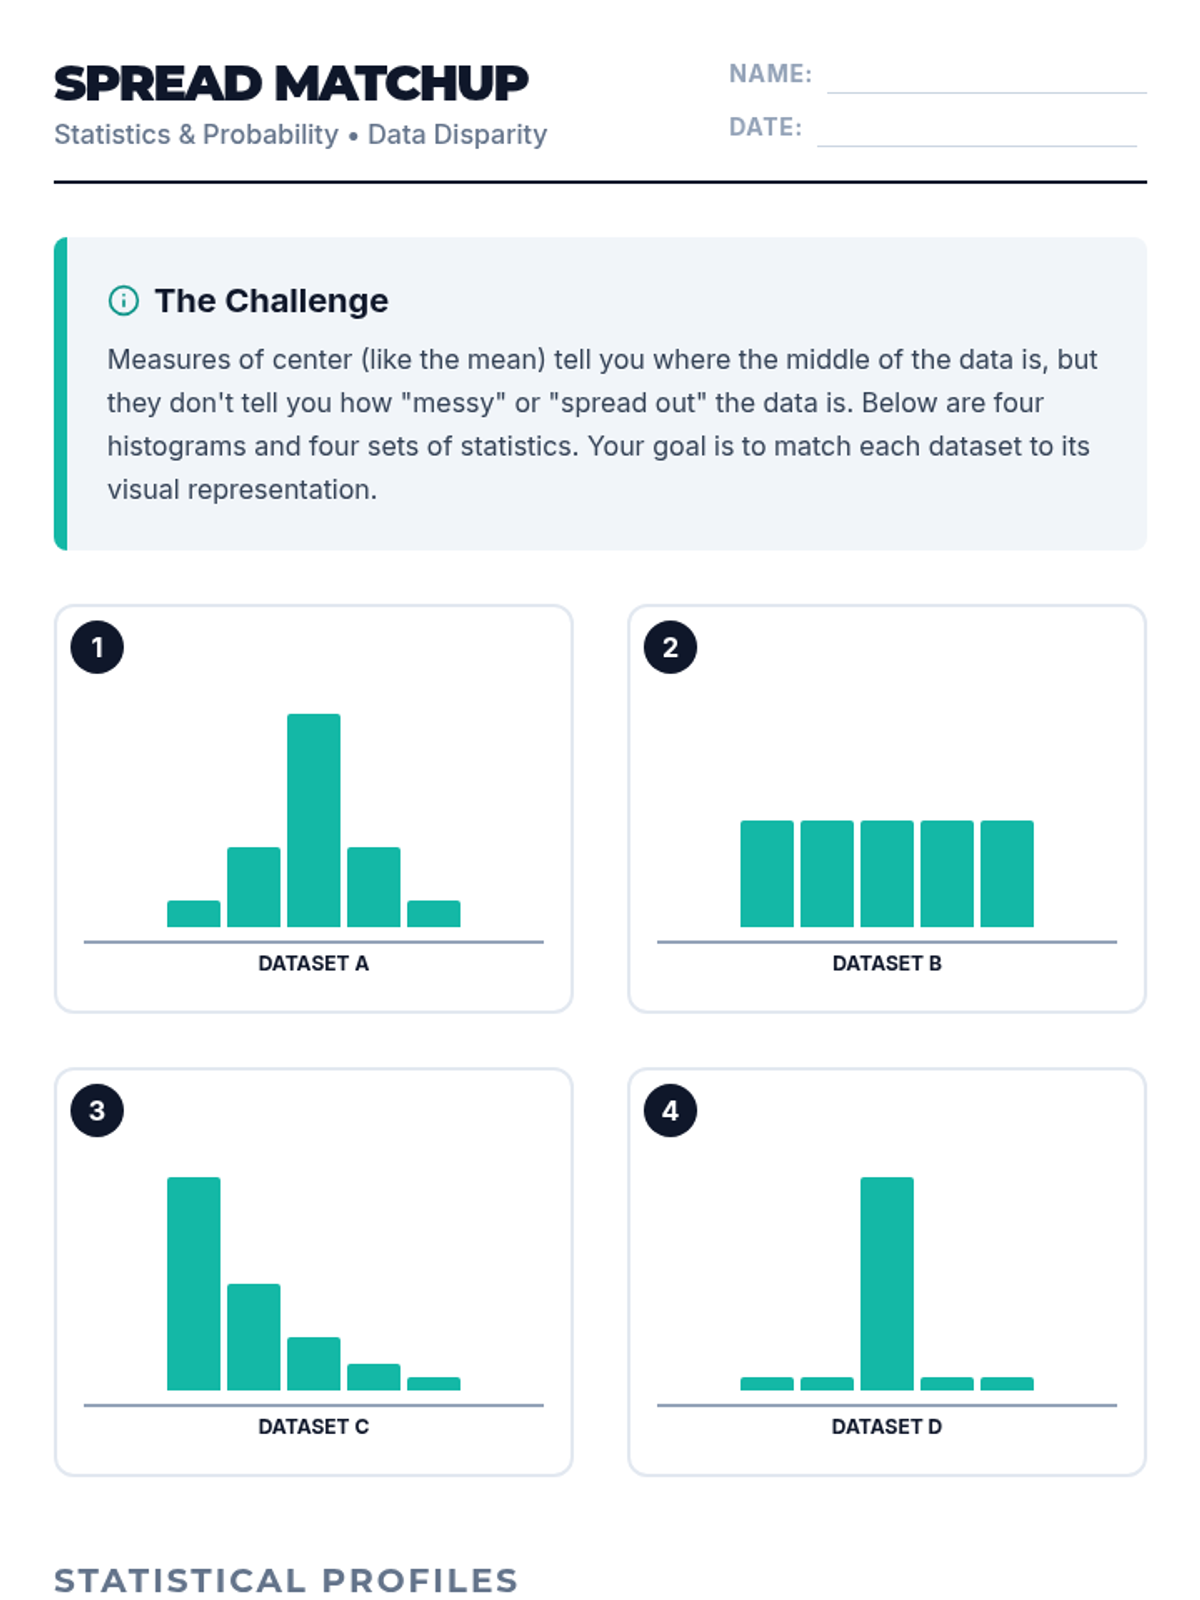
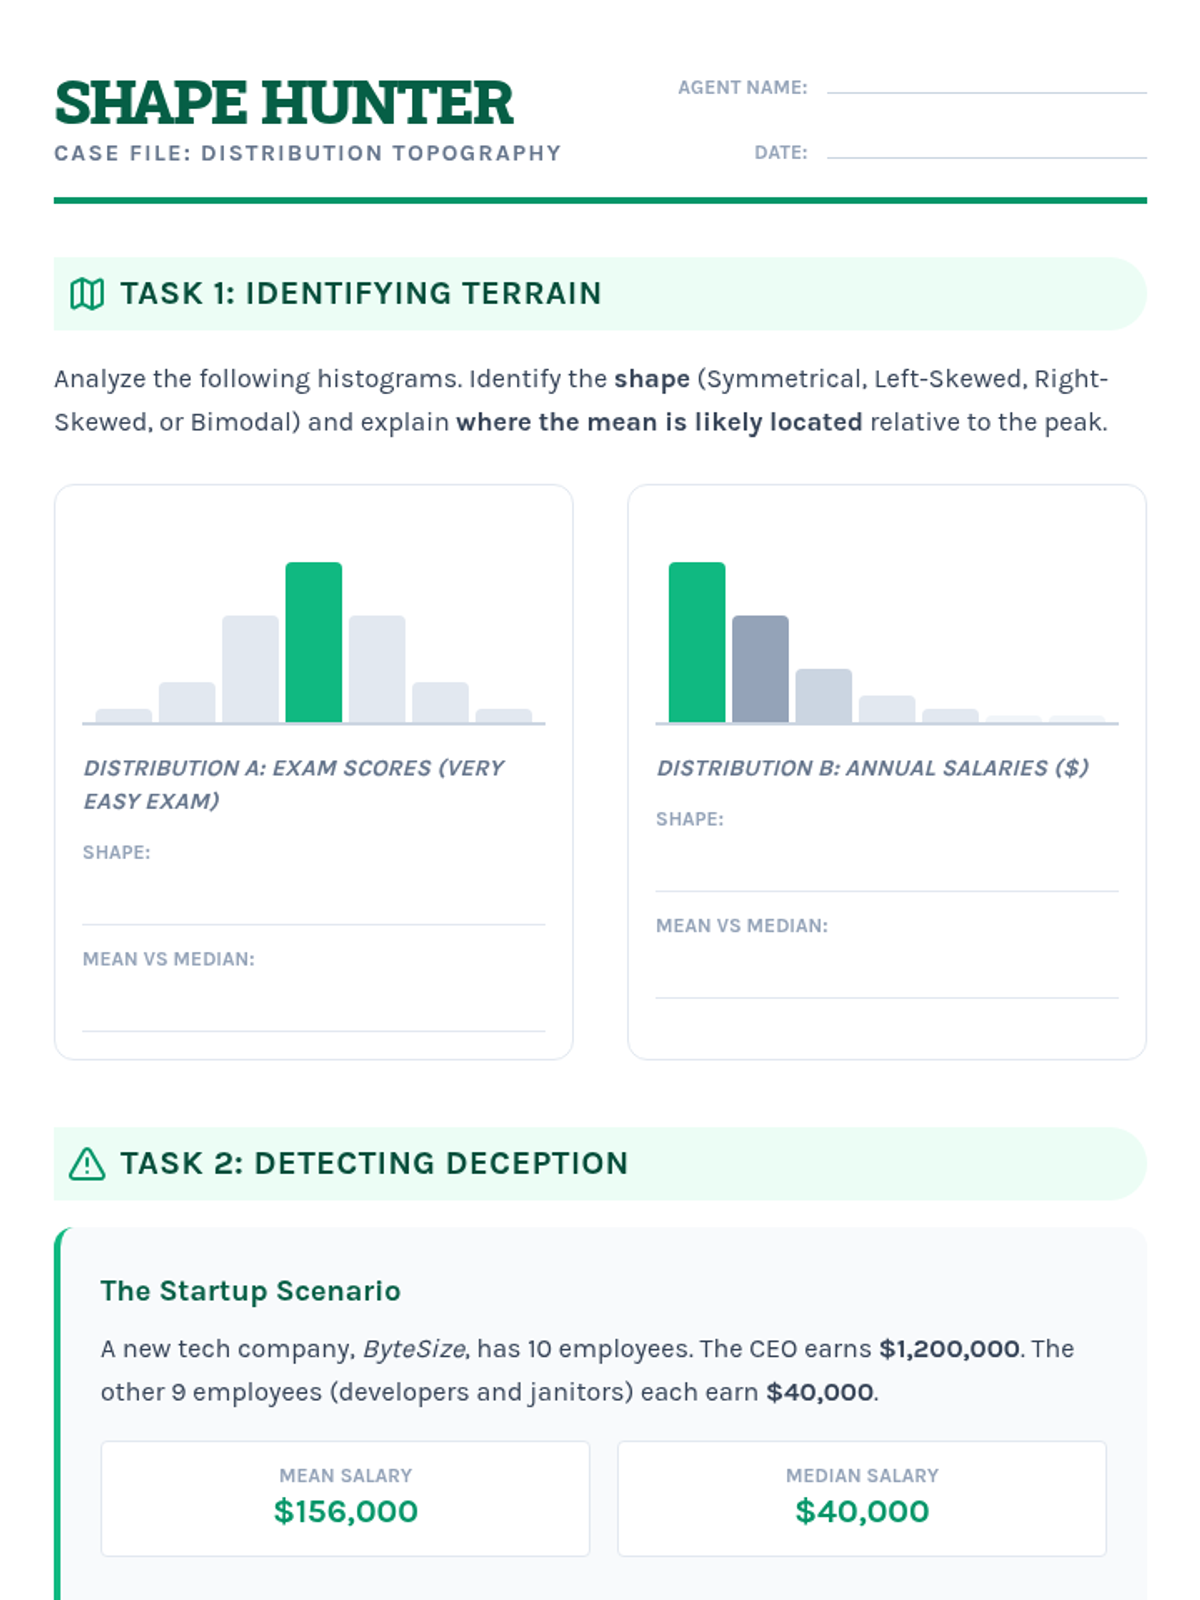
An inquiry-based exploration of statistical variability, focusing on how data spread reveals truths about inequality, climate instability, and diversity that averages often hide. Students transition from visual distribution analysis to quantifying disparity using IQR and MAD, culminating in an independent investigation.