Data representation, distributions, and statistical variability using sampling and inference techniques. Integrates probability models, compound events, bivariate patterns, and linear models to guide data-driven decision making.
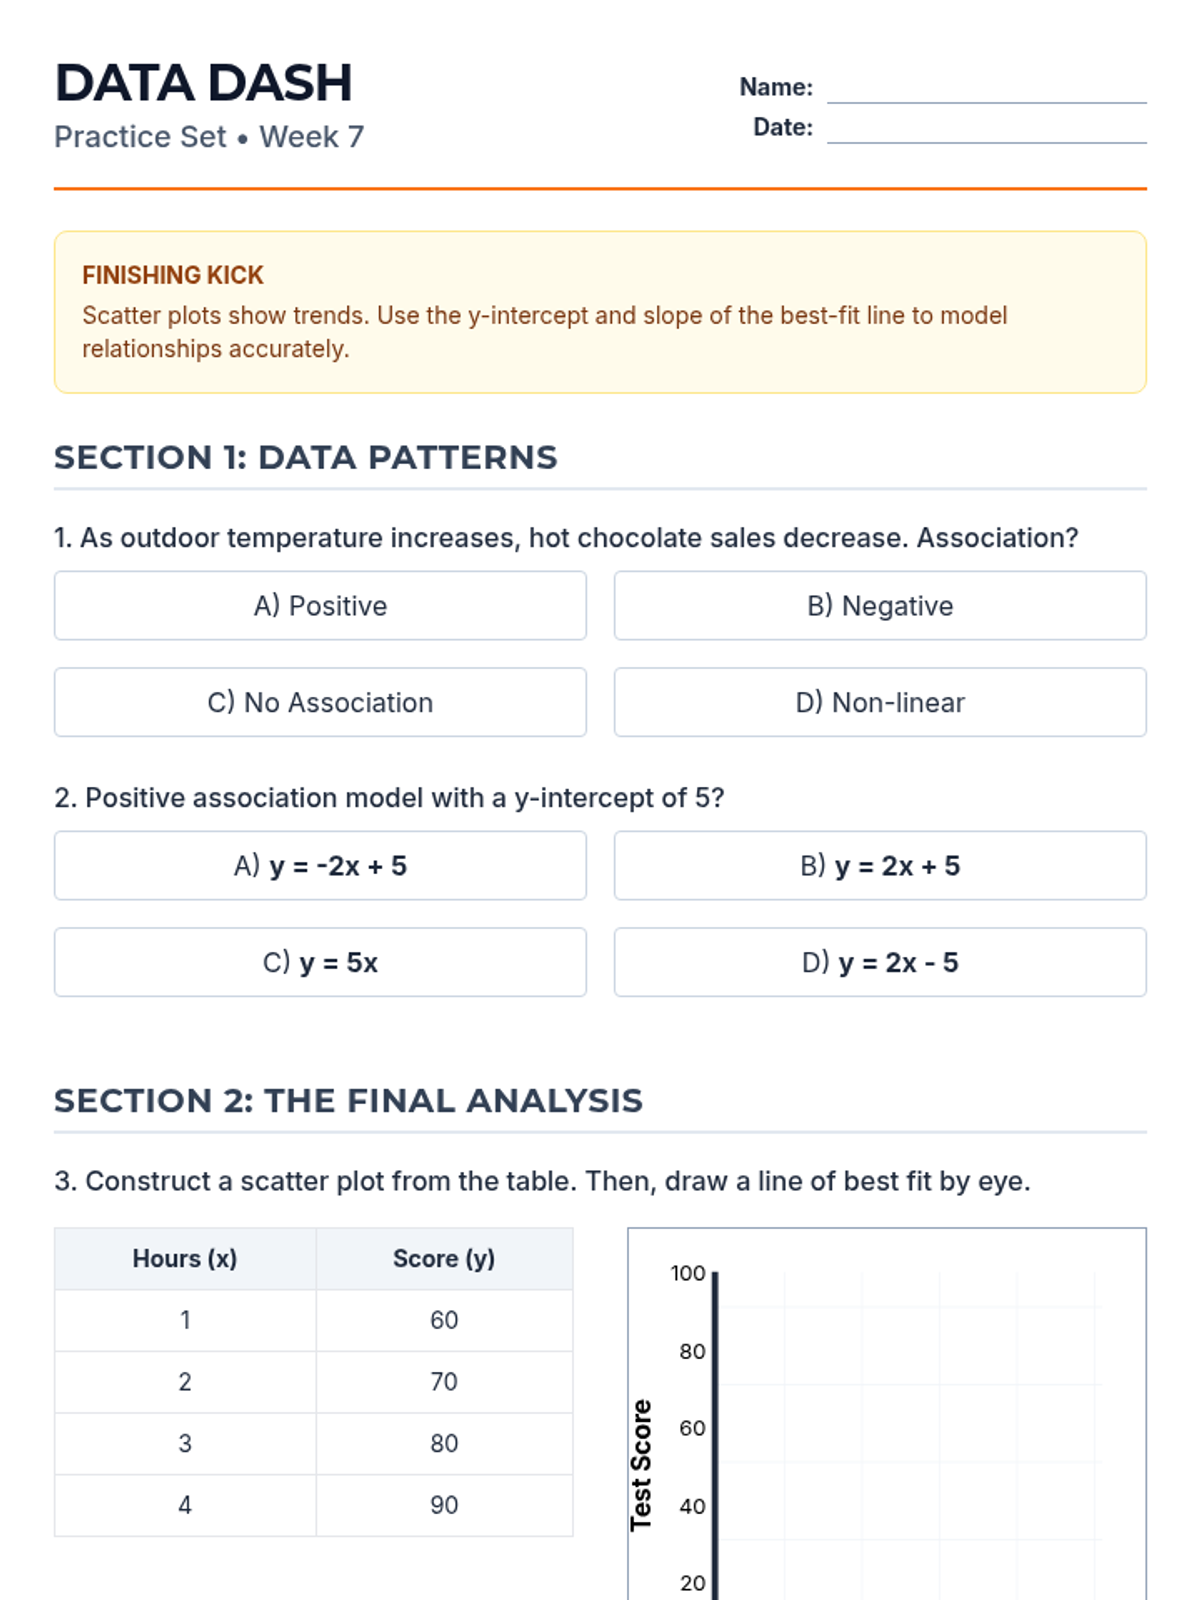
Revised 2-page practice set for Week 7. Fixed scatter plot grid Y-axis labels and tick alignment. Darkened handwriting guides and corrected table variable text for better PDF rendering.
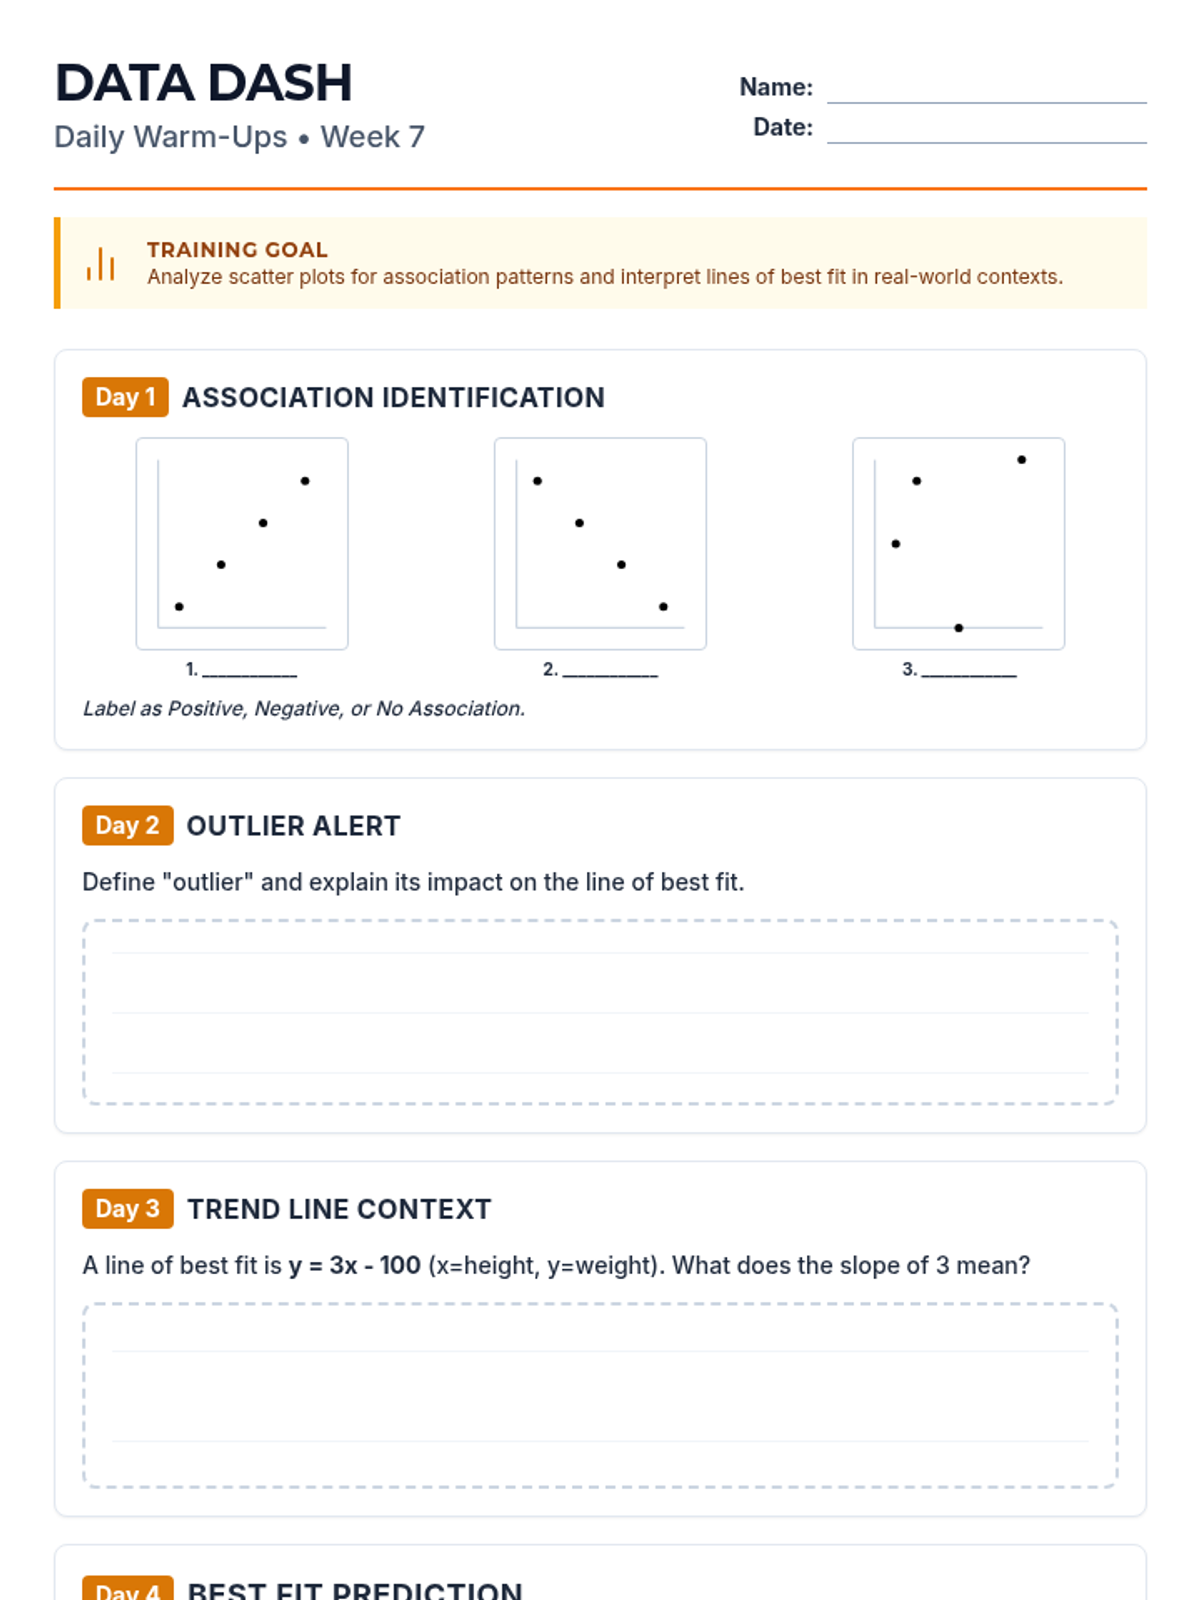
Polished 2-page Warm-Up for Week 7. Replaced MathJax in body text with standard bold for better PDF compatibility, consolidated layout to fit on two pages, and added guided handwriting lines.
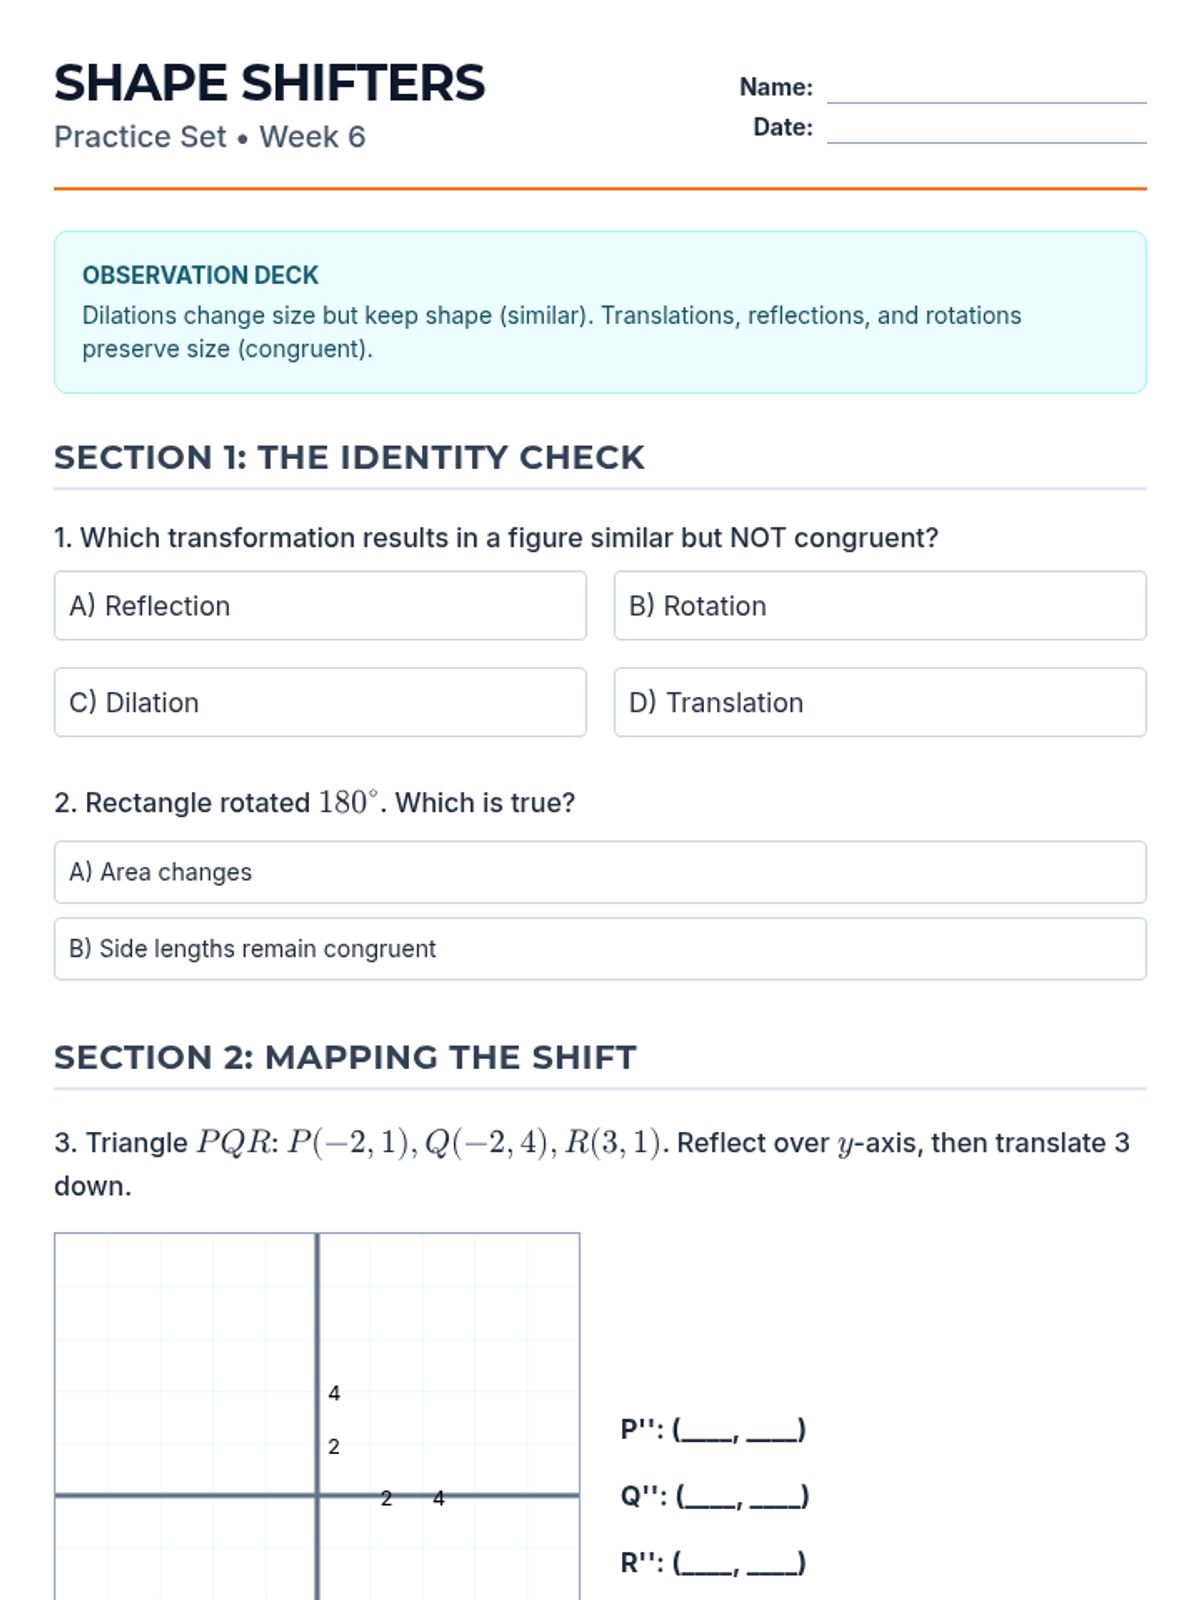
Revised 2-page practice set for Week 6. Added grid and numerical labels to coordinate planes, consolidated layout to avoid orphaned headers, and improved shape comparison workspace.
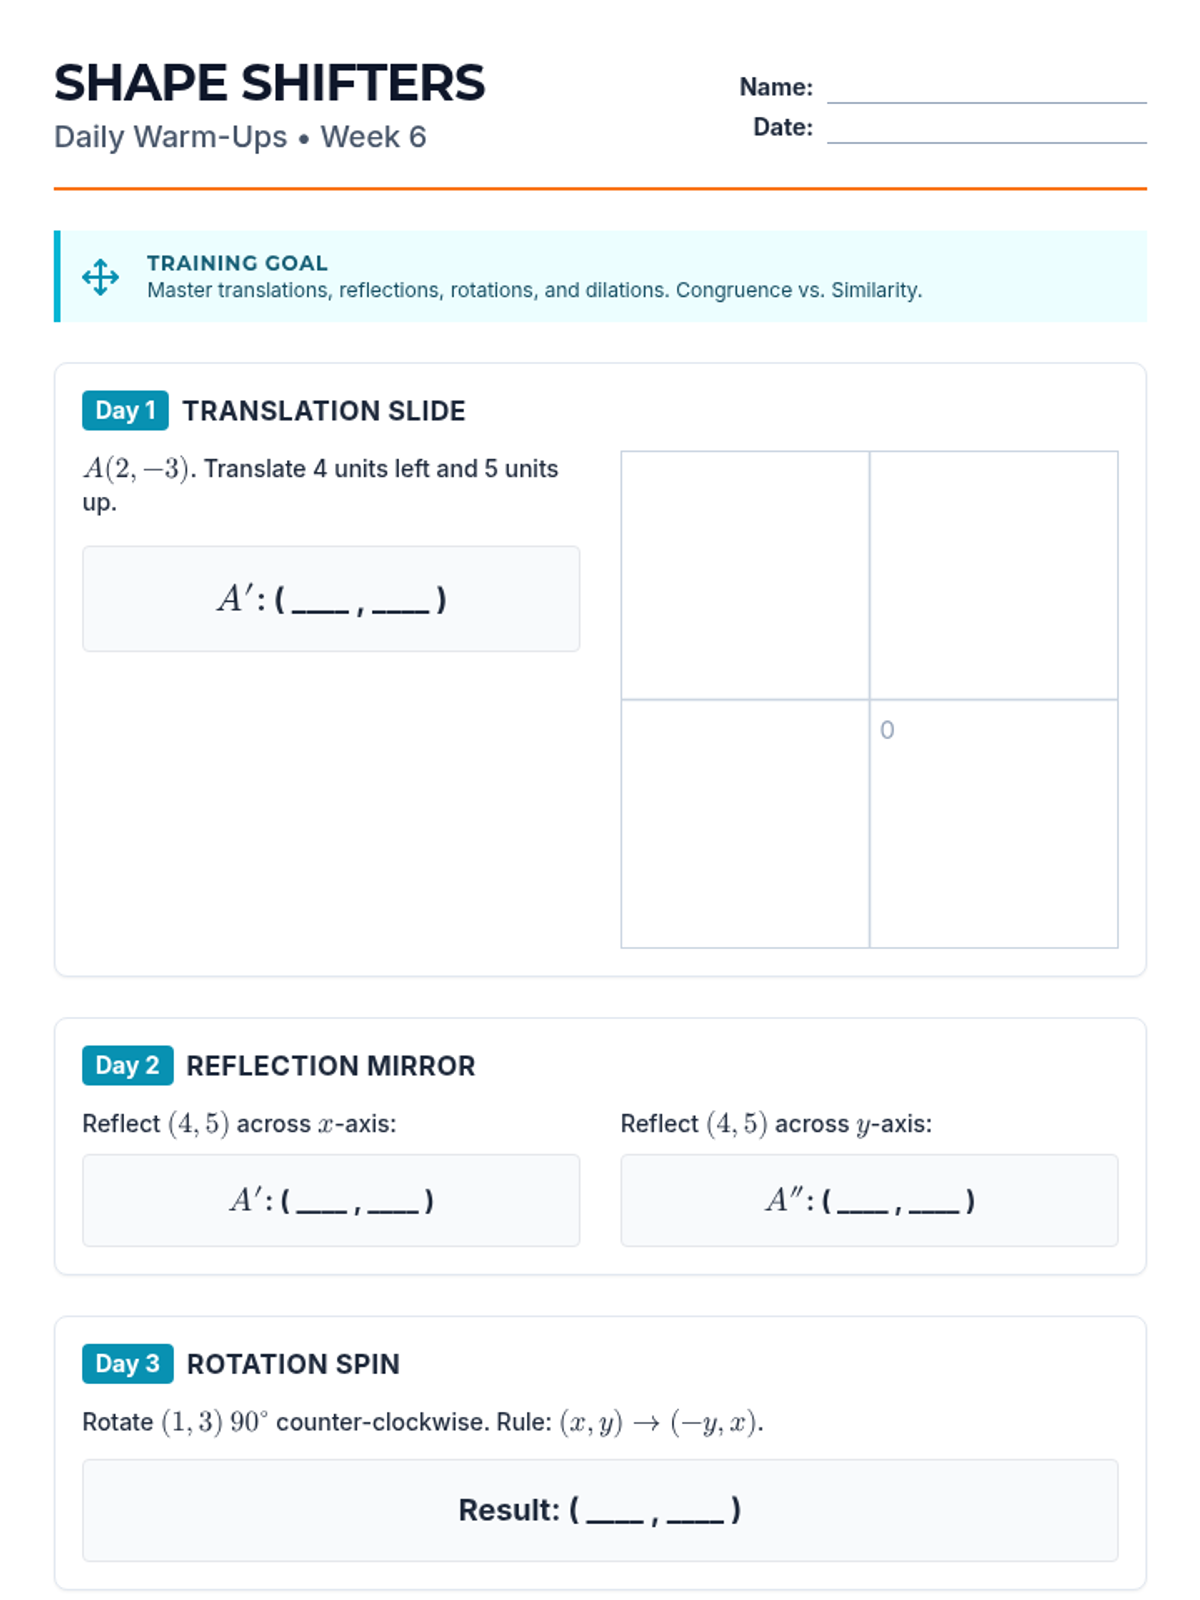
Revised 2-page Warm-Up for Week 6. Fixed overlapping coordinate plane, removed raw markdown asterisks, and consolidated all 5 days onto two pages.
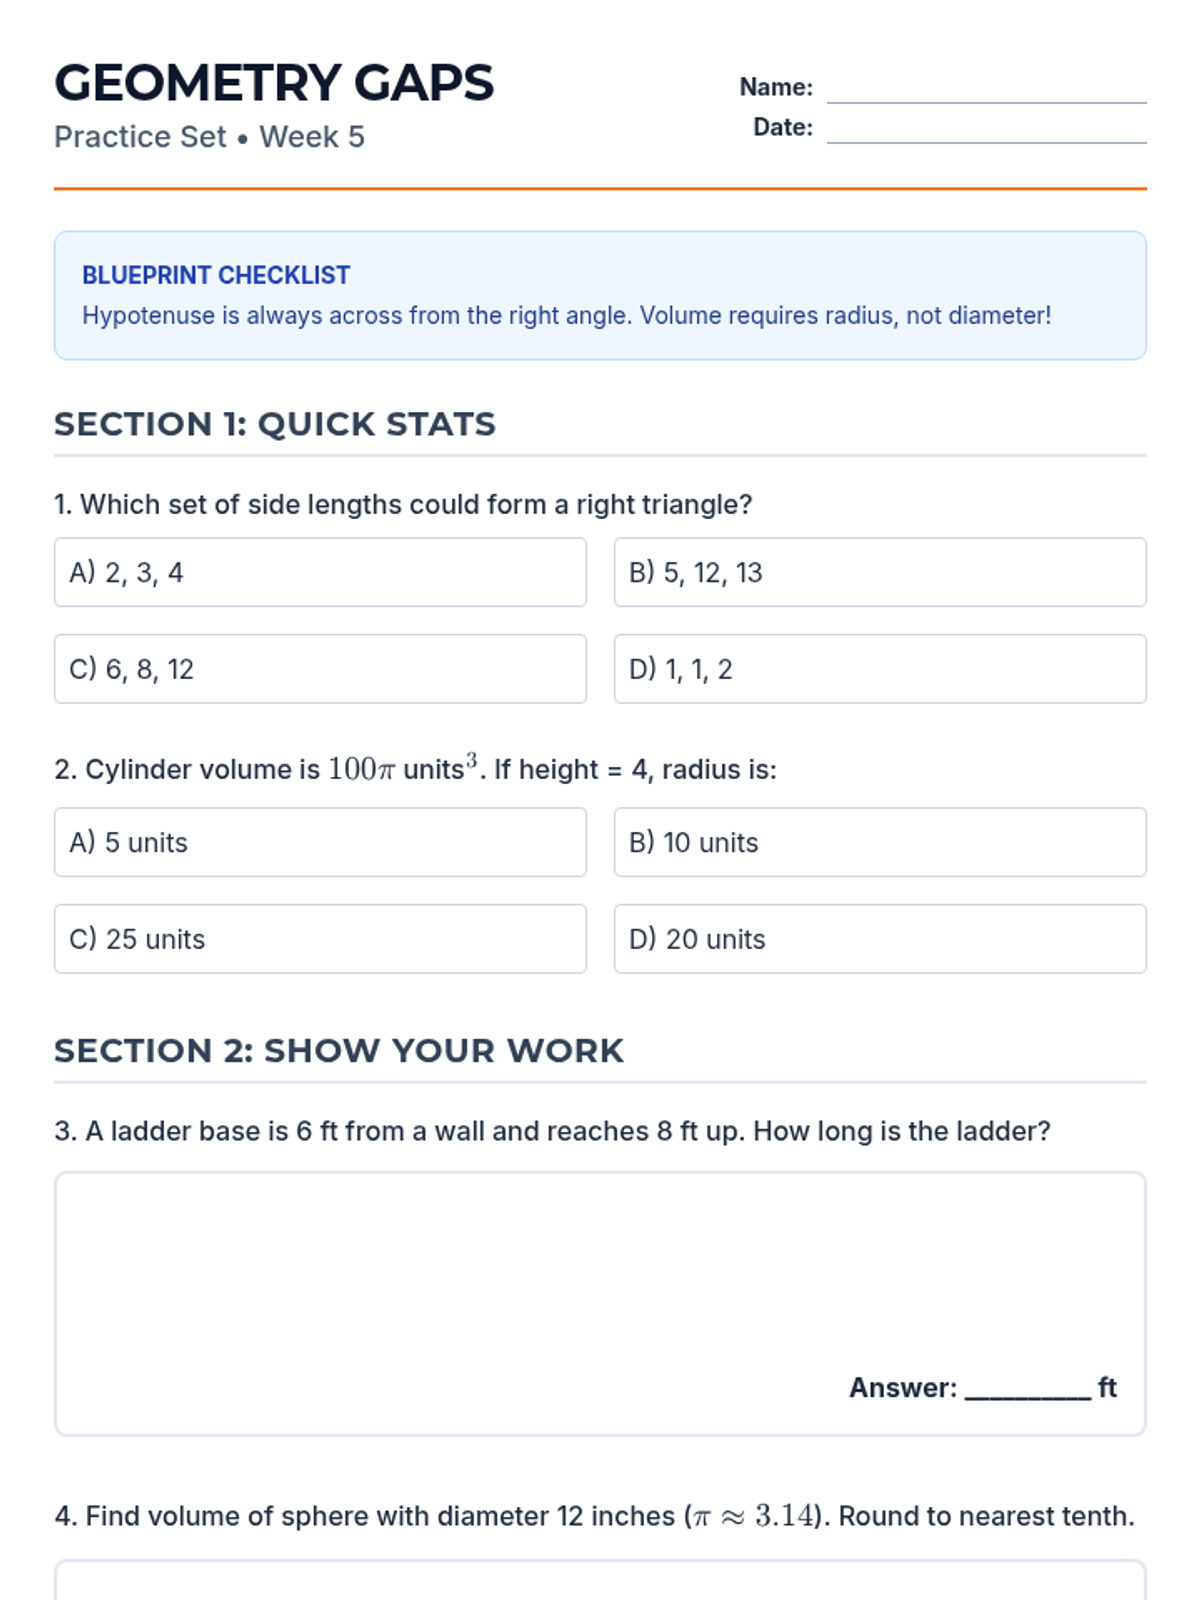
Revised 2-page practice set for Week 5. Corrected LaTeX rendering for exponents, improved shape comparison workspace, and consolidated Section 2 layout.
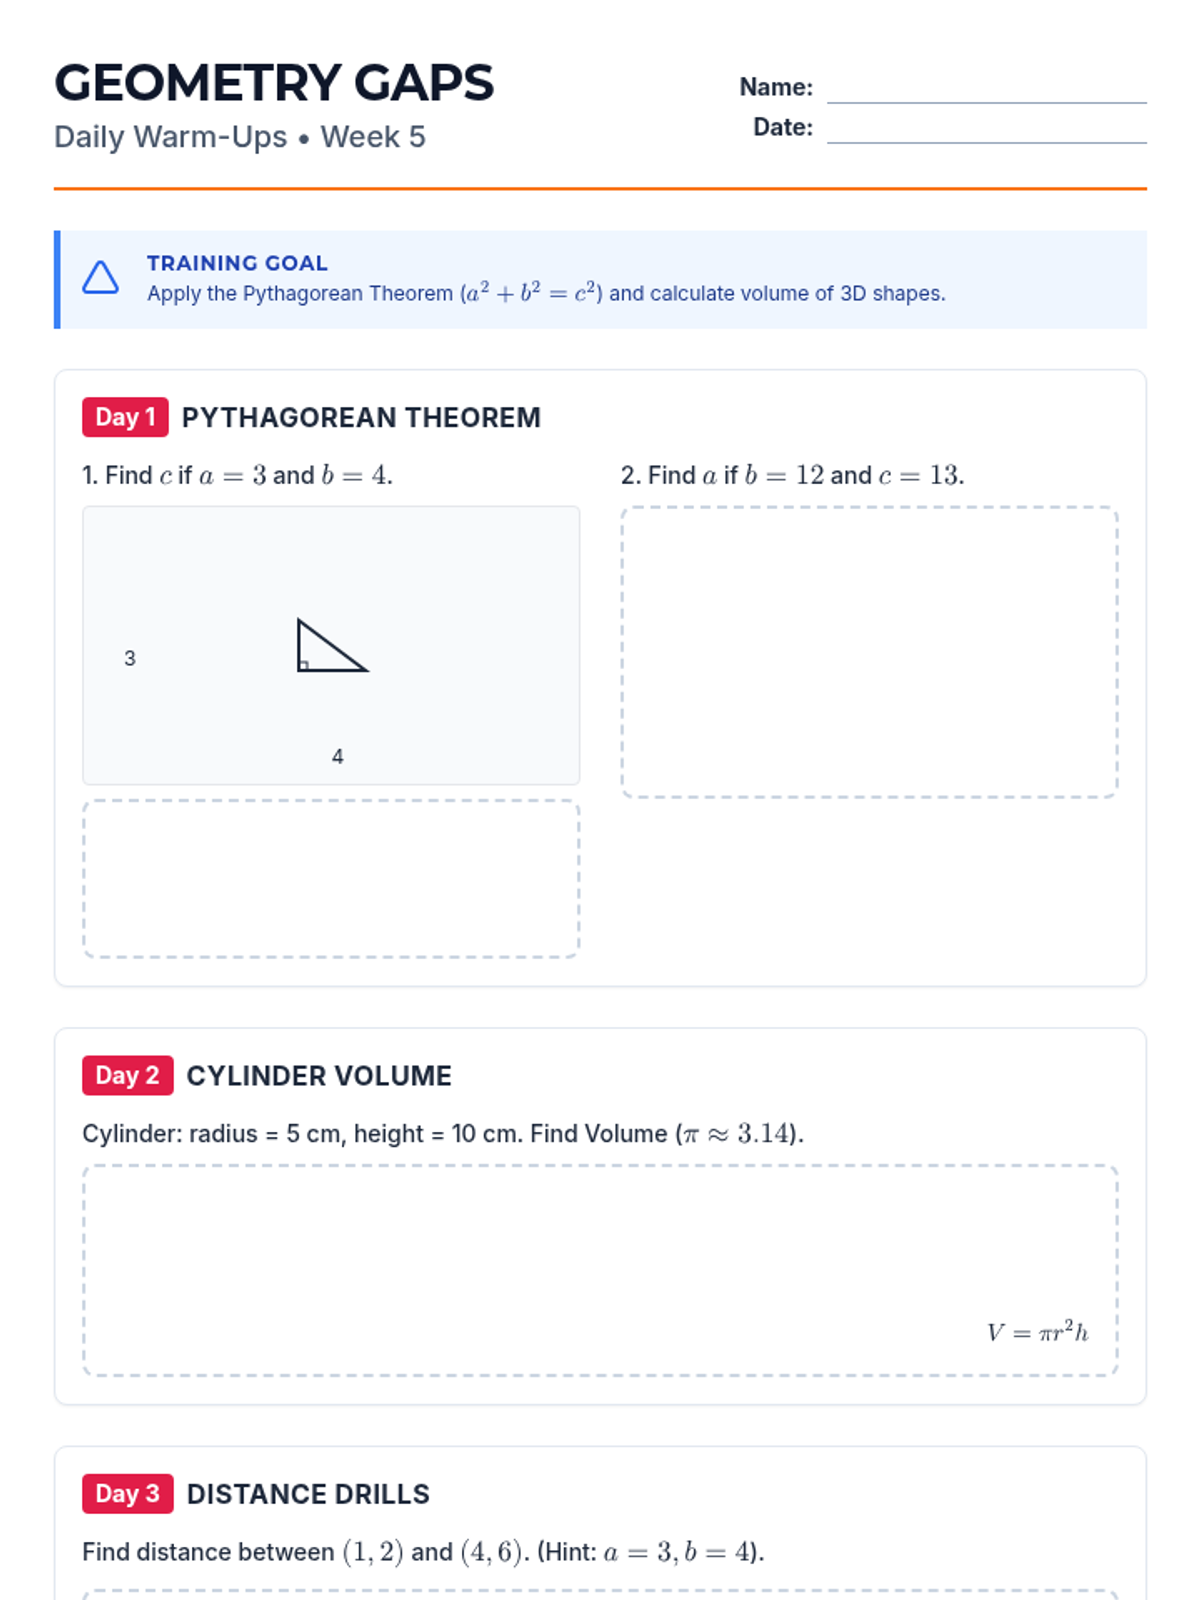
Revised 2-page Warm-Up for Week 5. Fixed LaTeX rendering issues, consolidated layout to fit all days efficiently, and standardized work area heights.
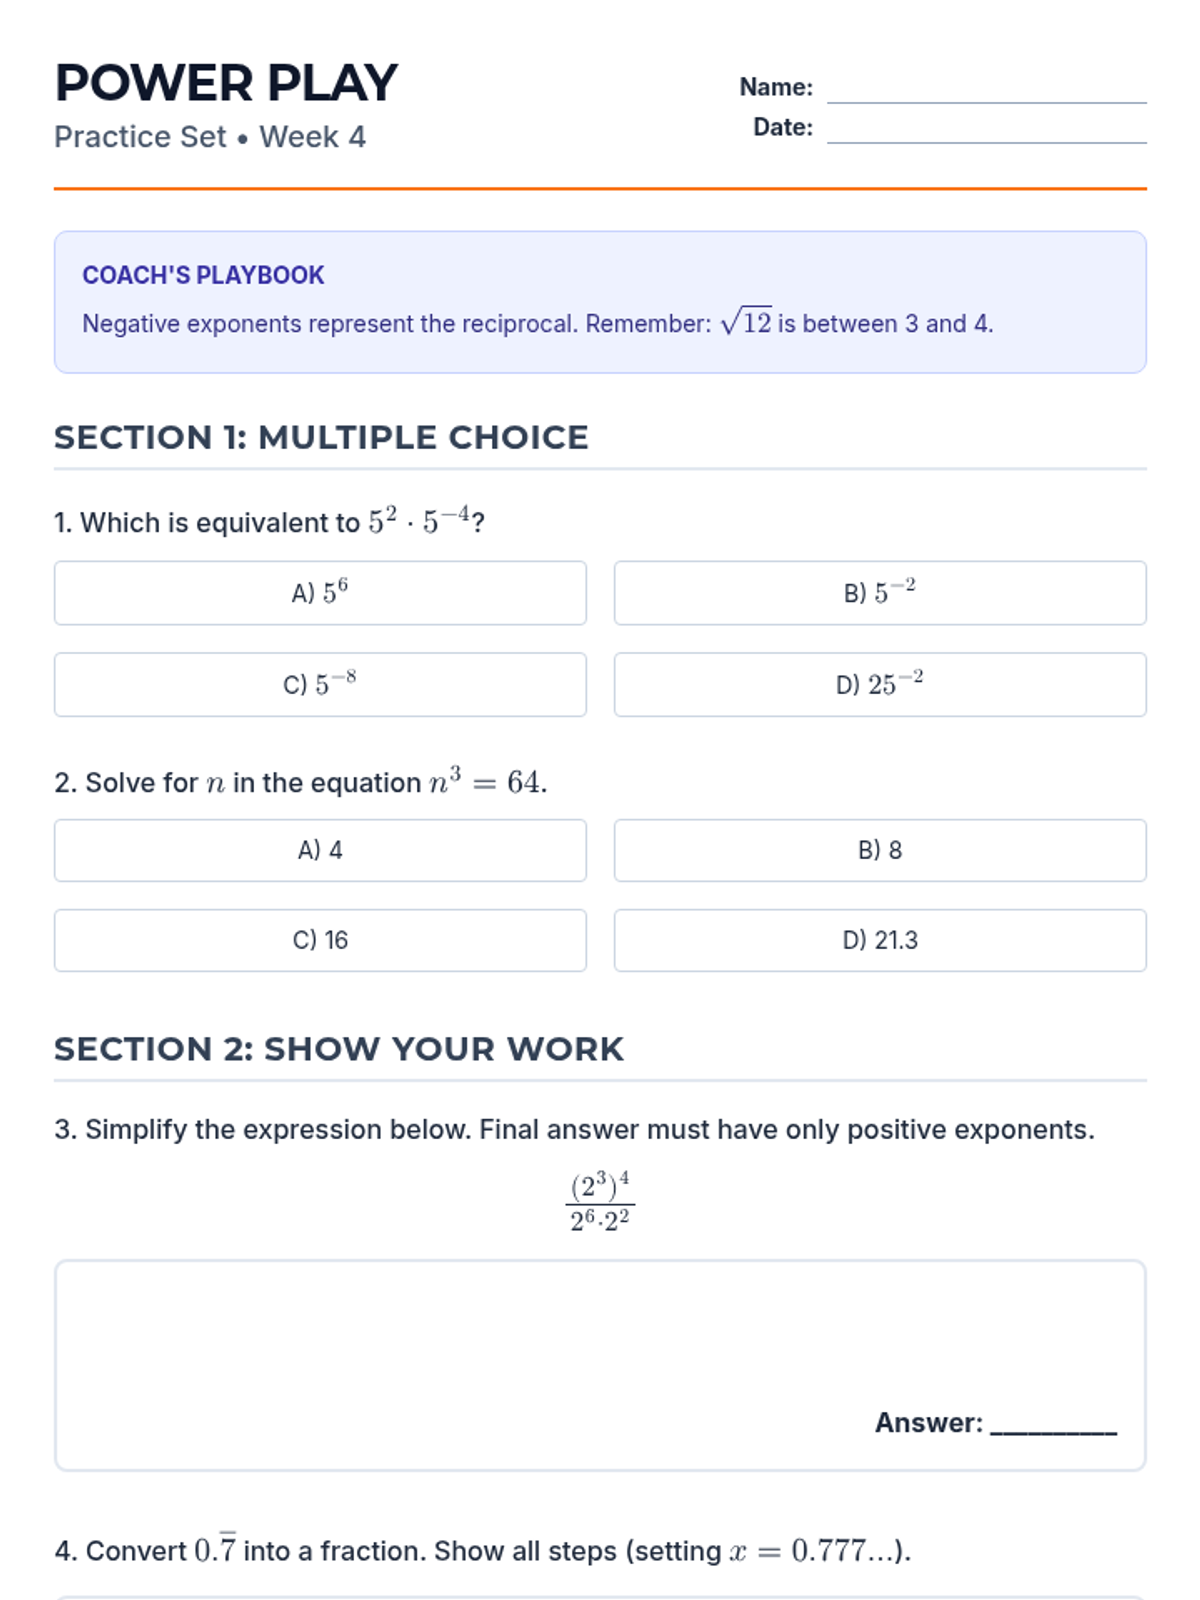
Optimized 2-page practice set for Week 4. Standardized work area heights to fit all content on two pages and improved SVG number line scale and labels.
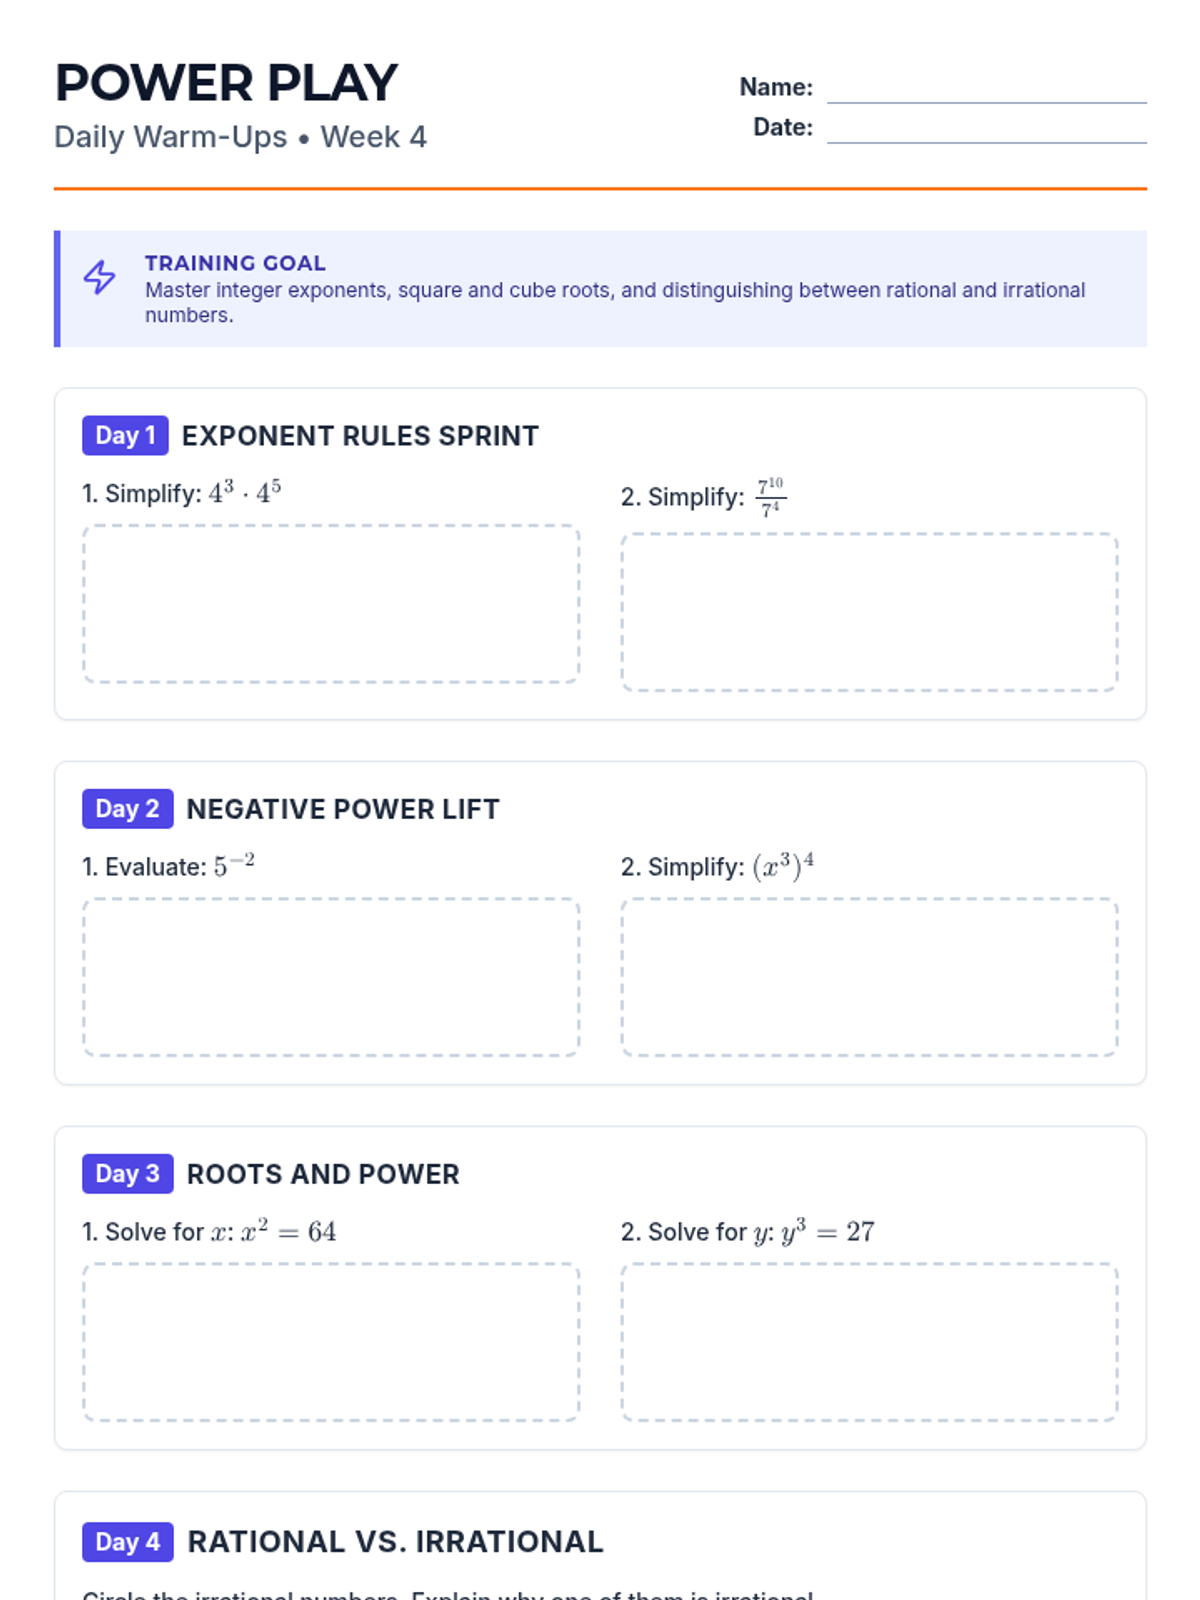
Revised 2-page Warm-Up for Week 4. Replaced scientific notation with square/cube roots and repeating decimal conversions. Improved pagination and font consistency.
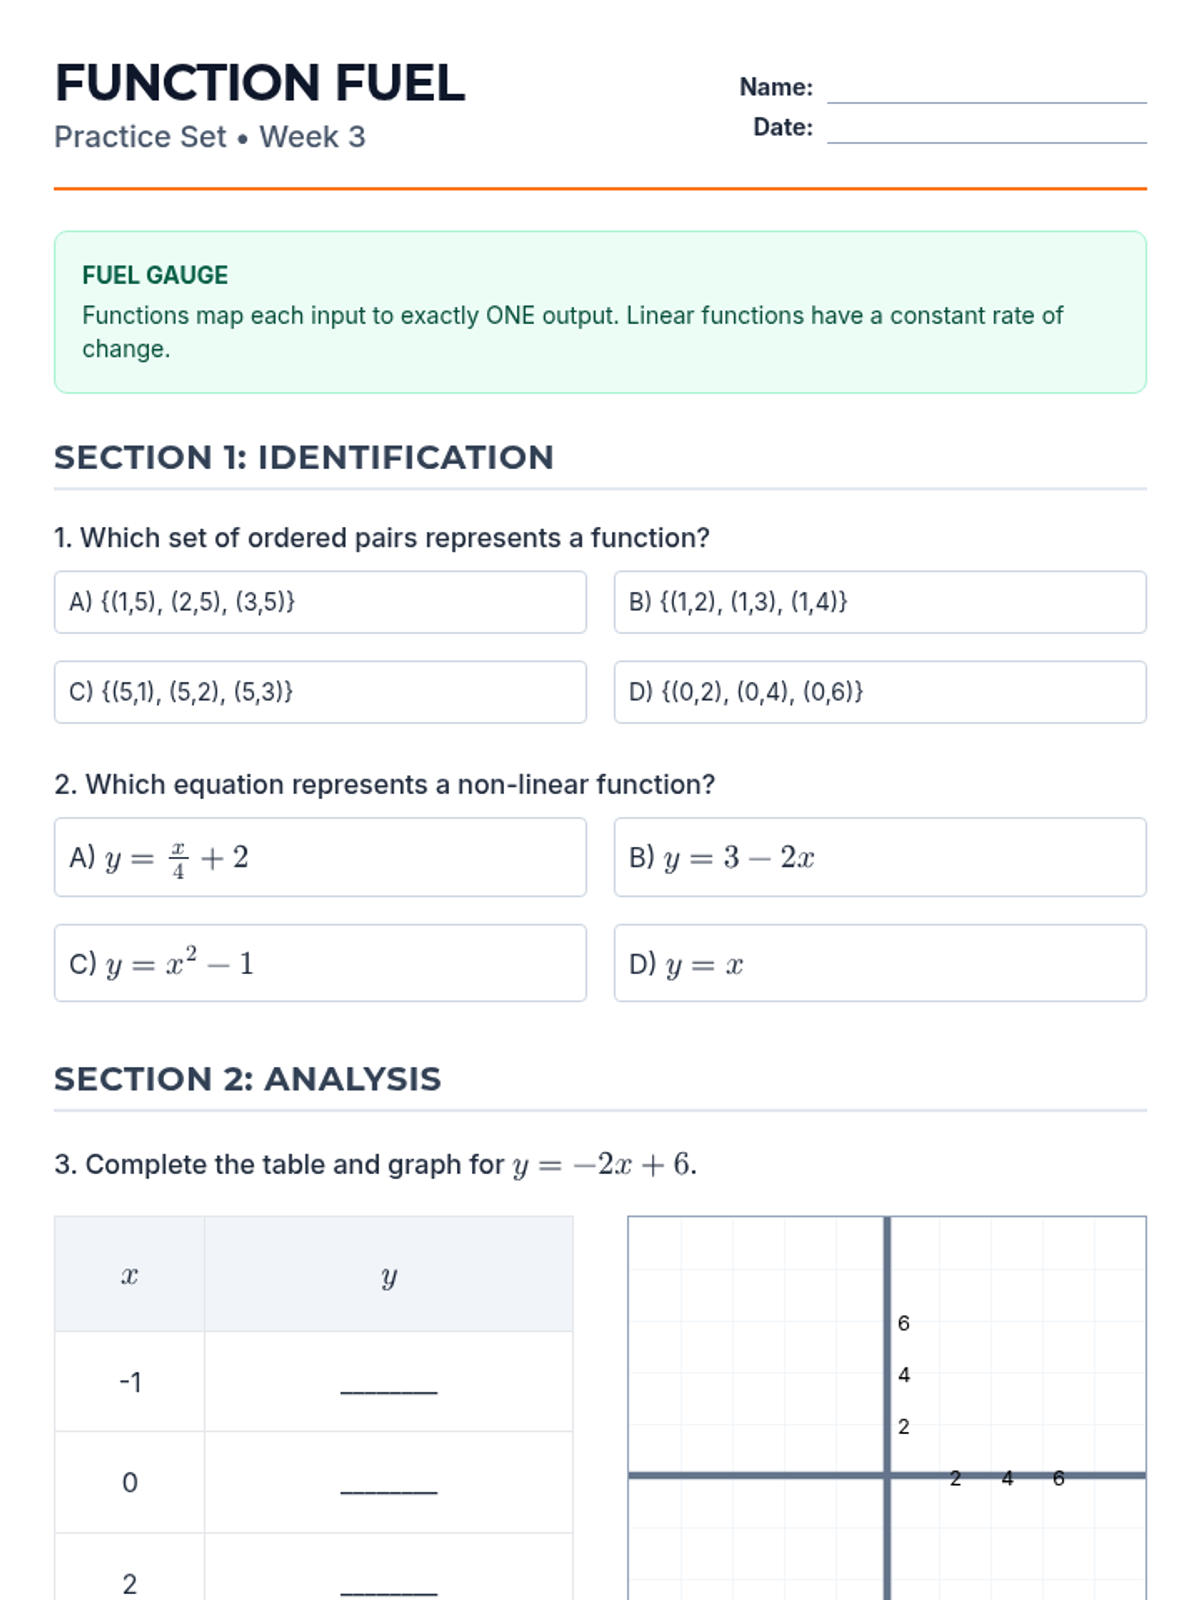
Revised 2-page practice set for Week 3. Improved coordinate plane with numerical labels, corrected font sizes, and consolidated layout.
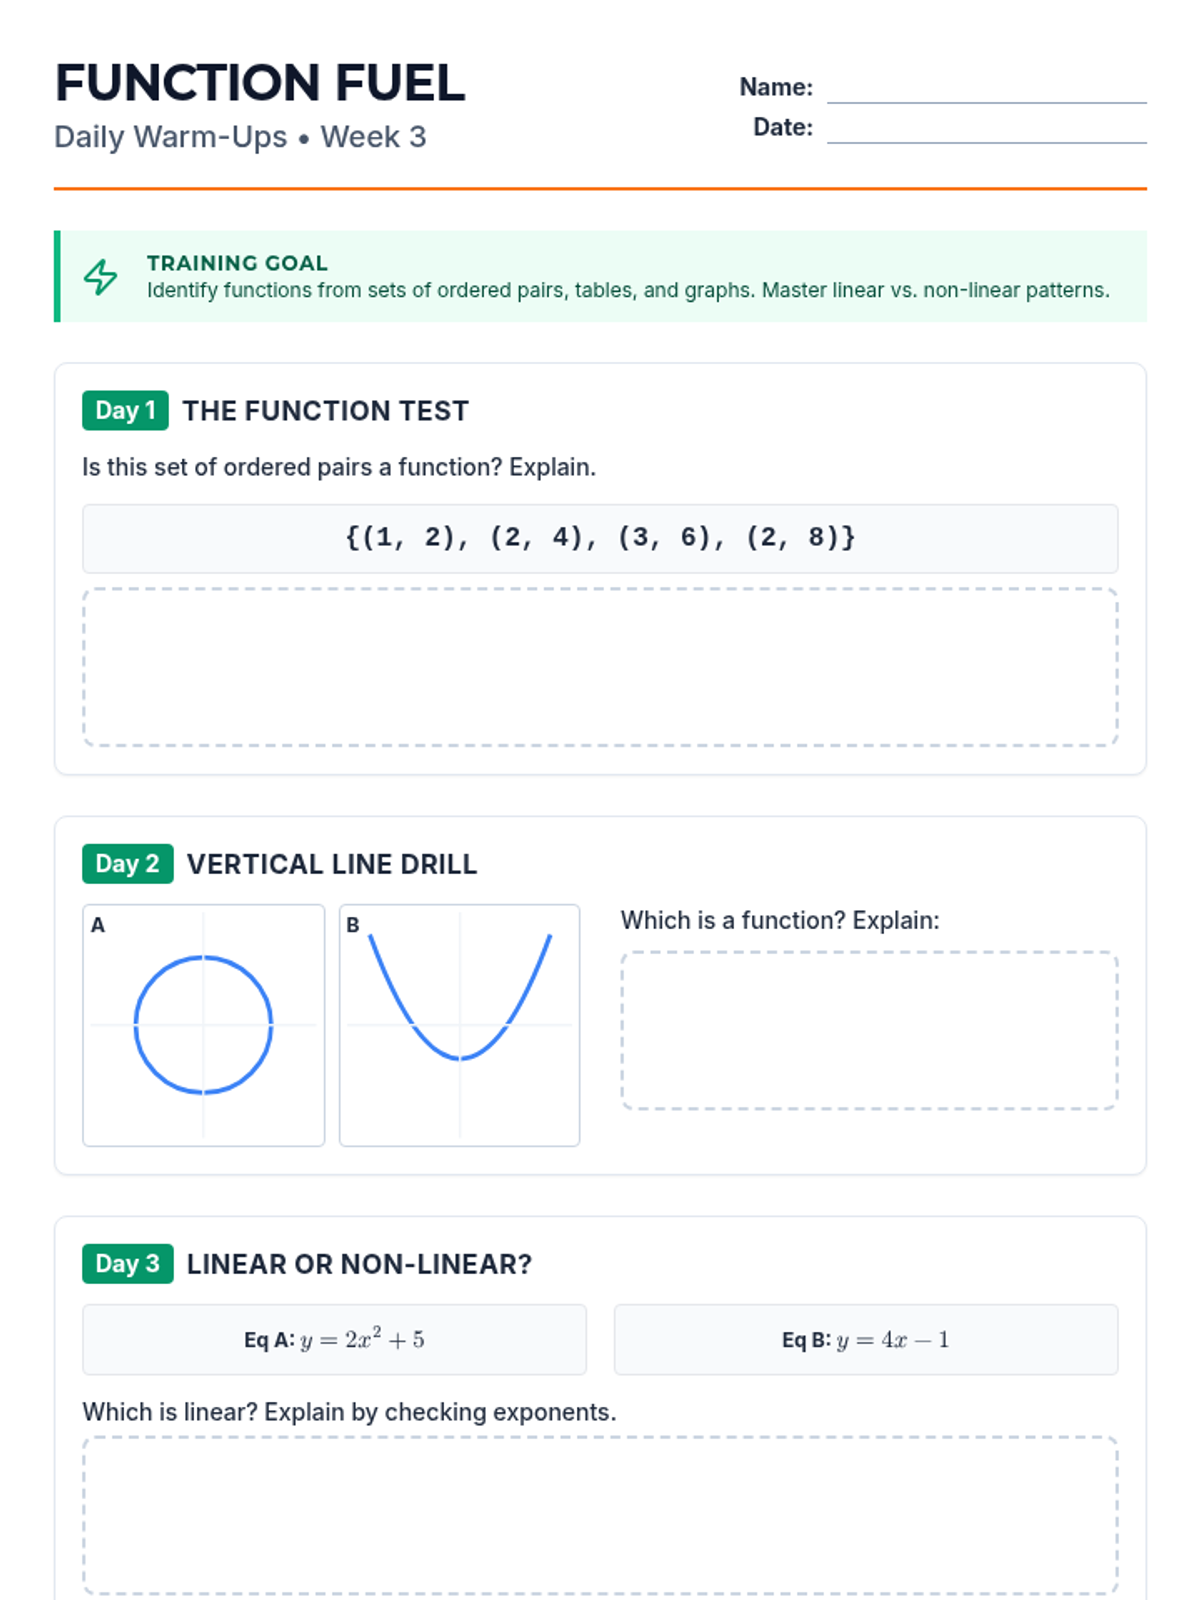
Revised 2-page Warm-Up for Week 3. Consolidated layout, fixed overlapping Day 2 elements, and improved work area contrast for better printing.
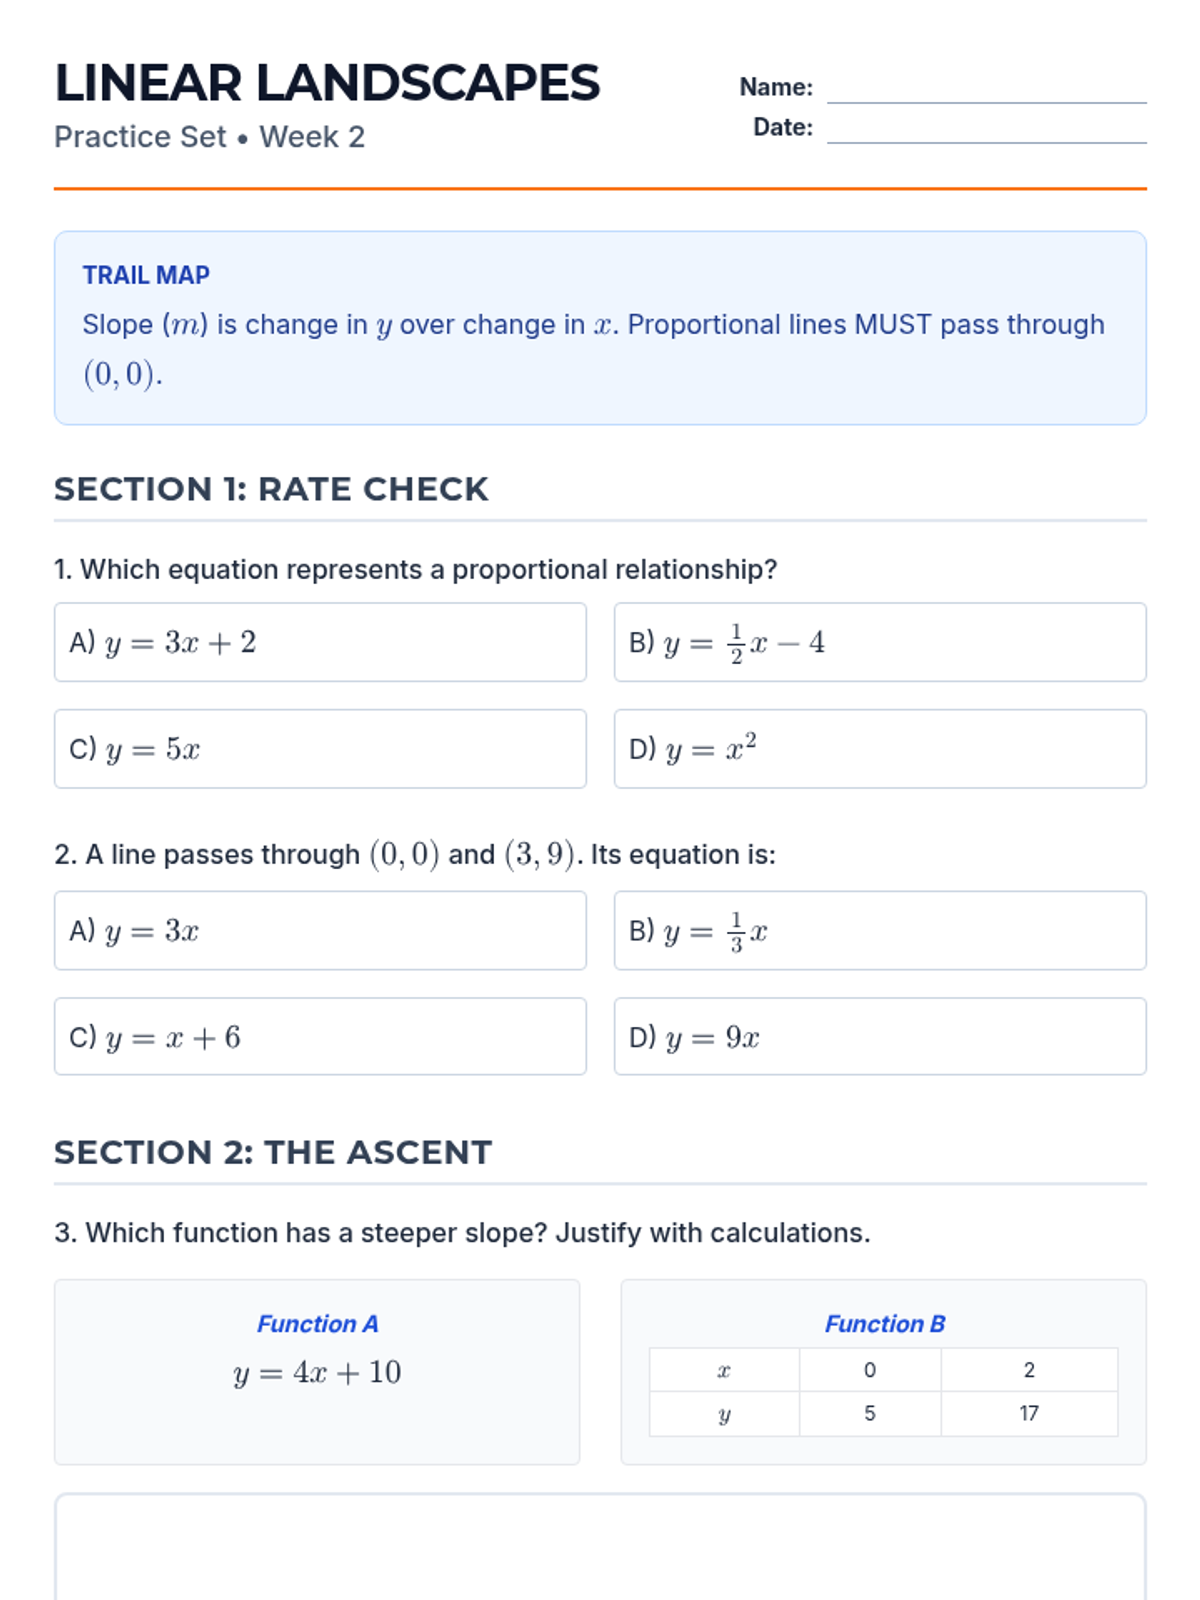
Revised 2-page practice set for Week 2. Fixed pagination, added numerical scale to coordinate plane, and improved the layout of word problems.
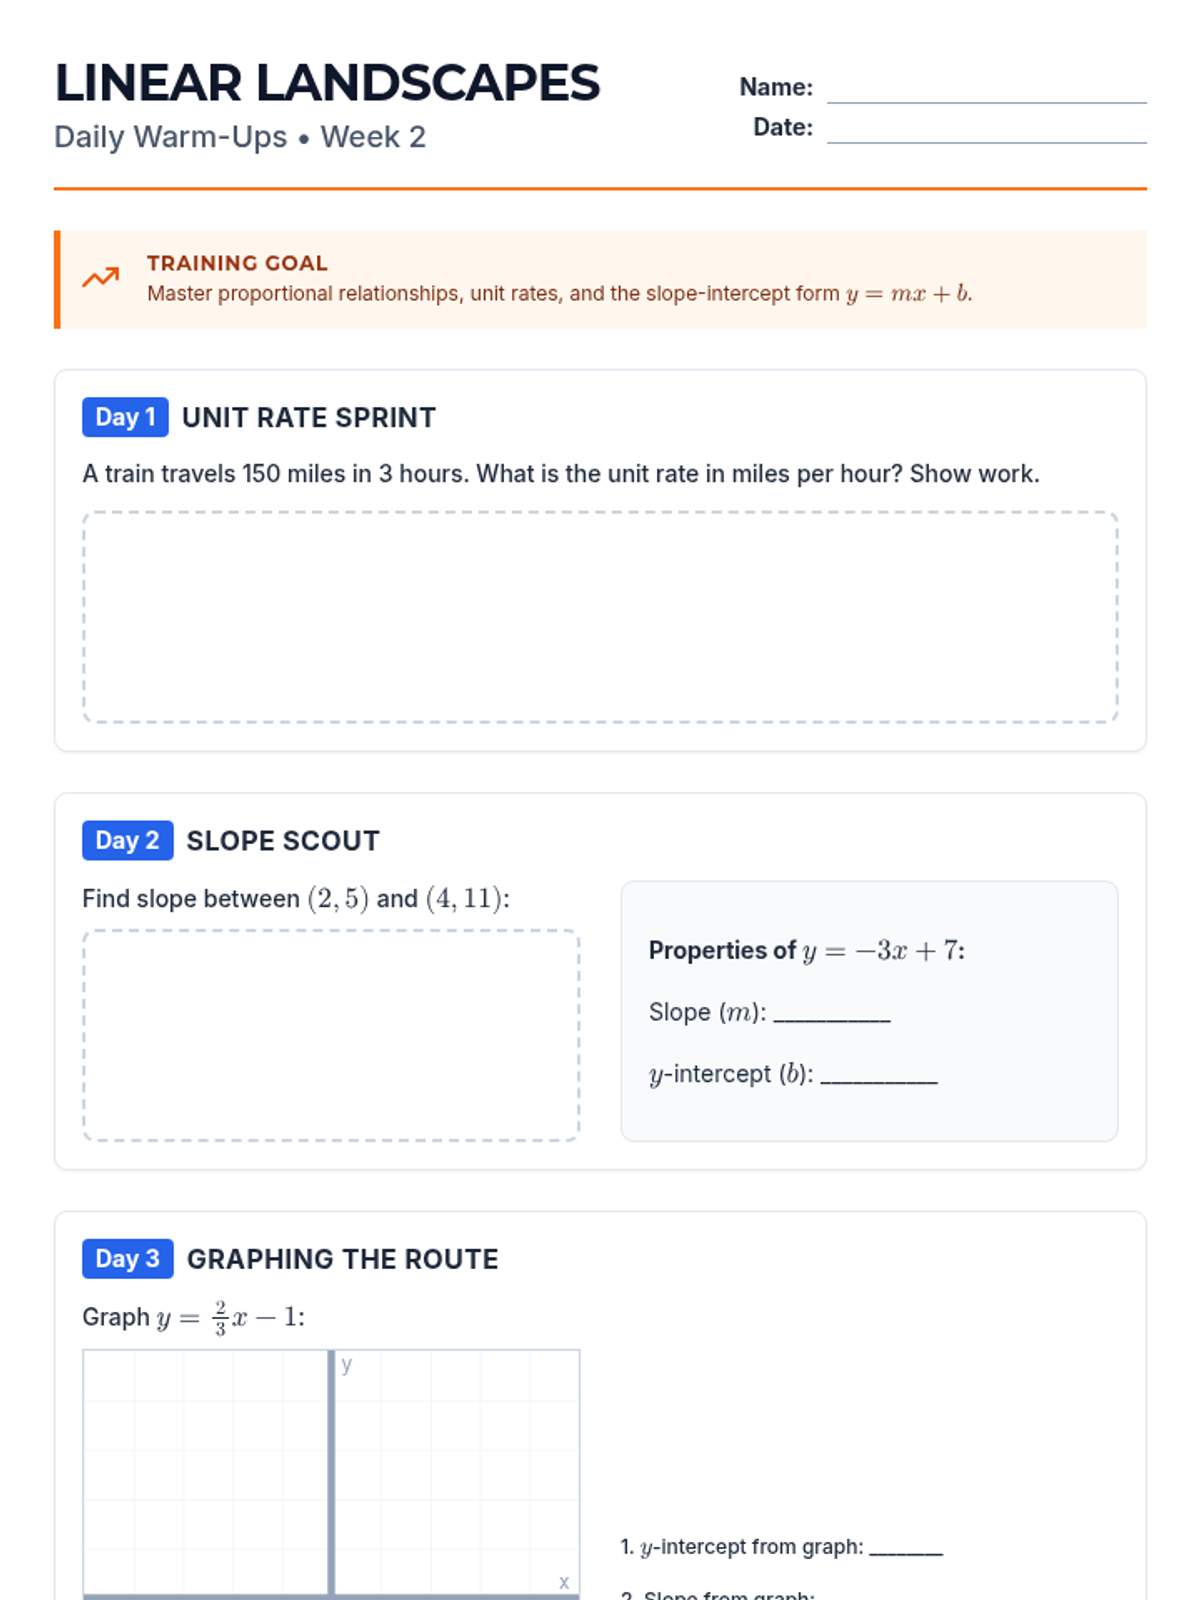
Revised 2-page Warm-Up for Week 2. Fixed pagination, added scale to coordinate plane, and improved the response area for slope identification.
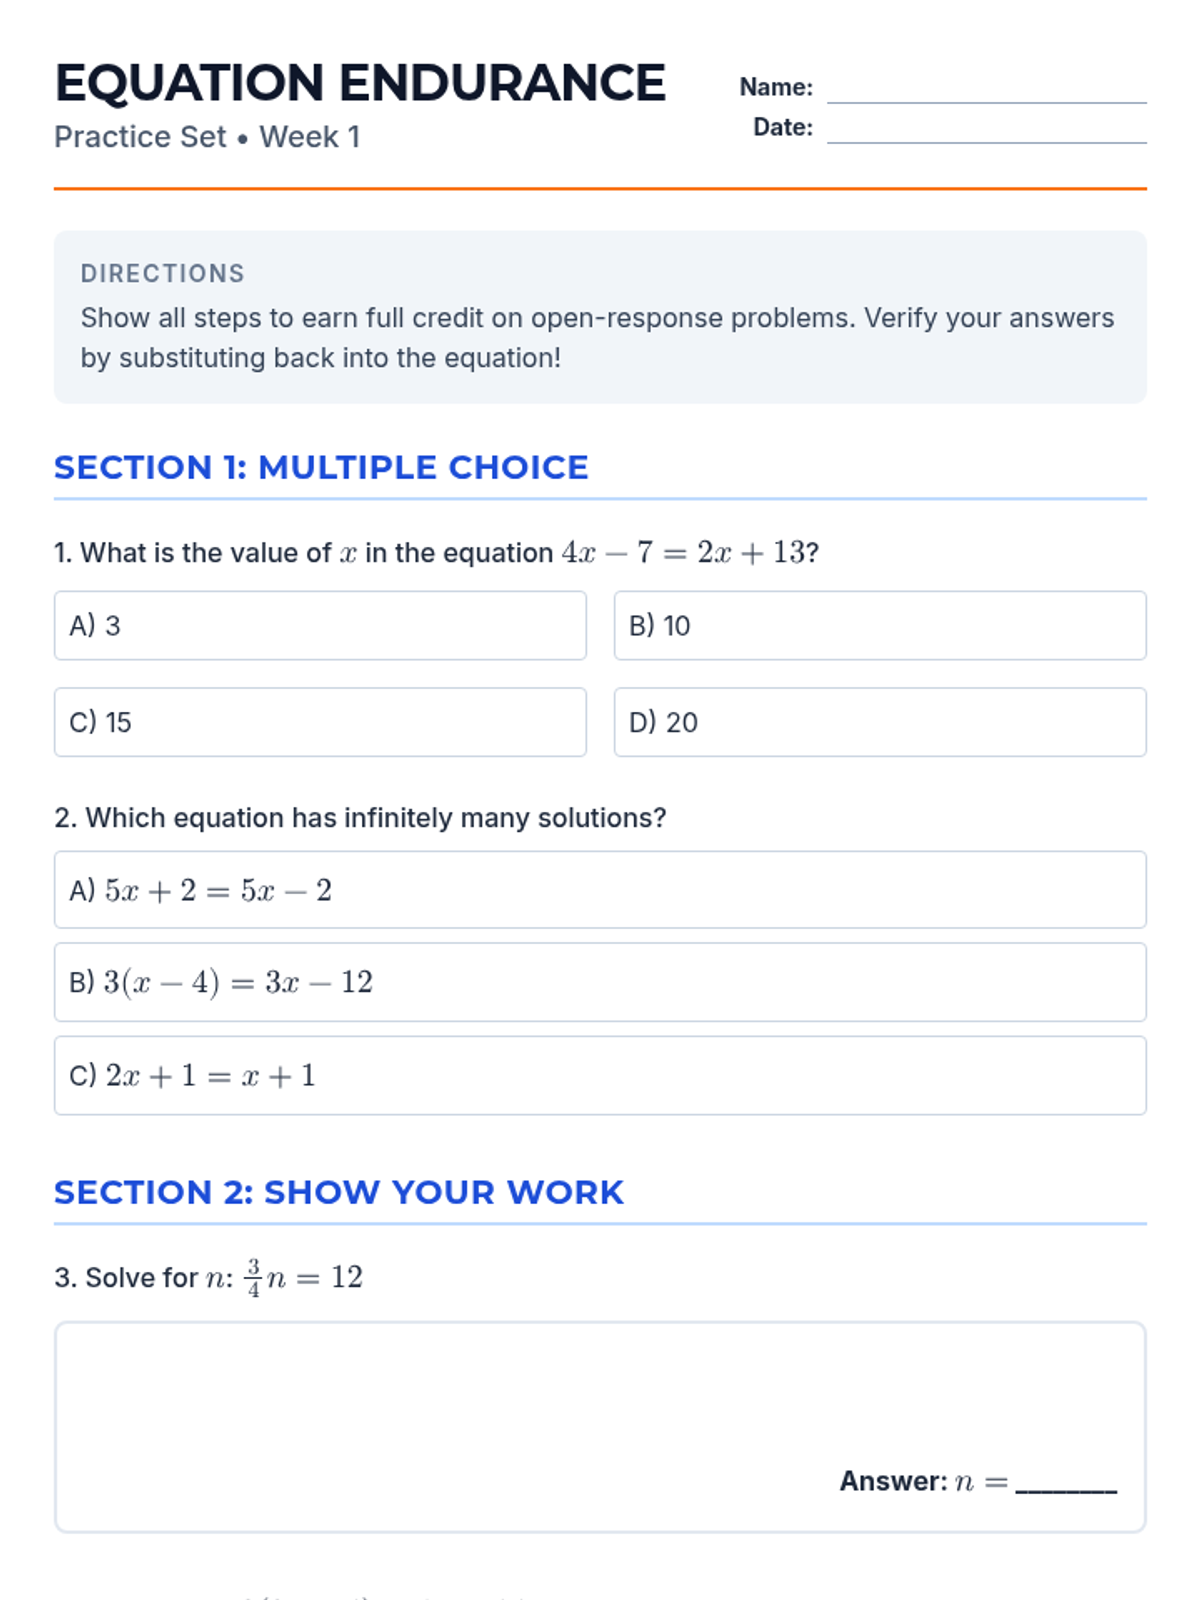
Revised 2-page practice set for Week 1. Consolidated layout to avoid orphaned headers and added specific answer lines.
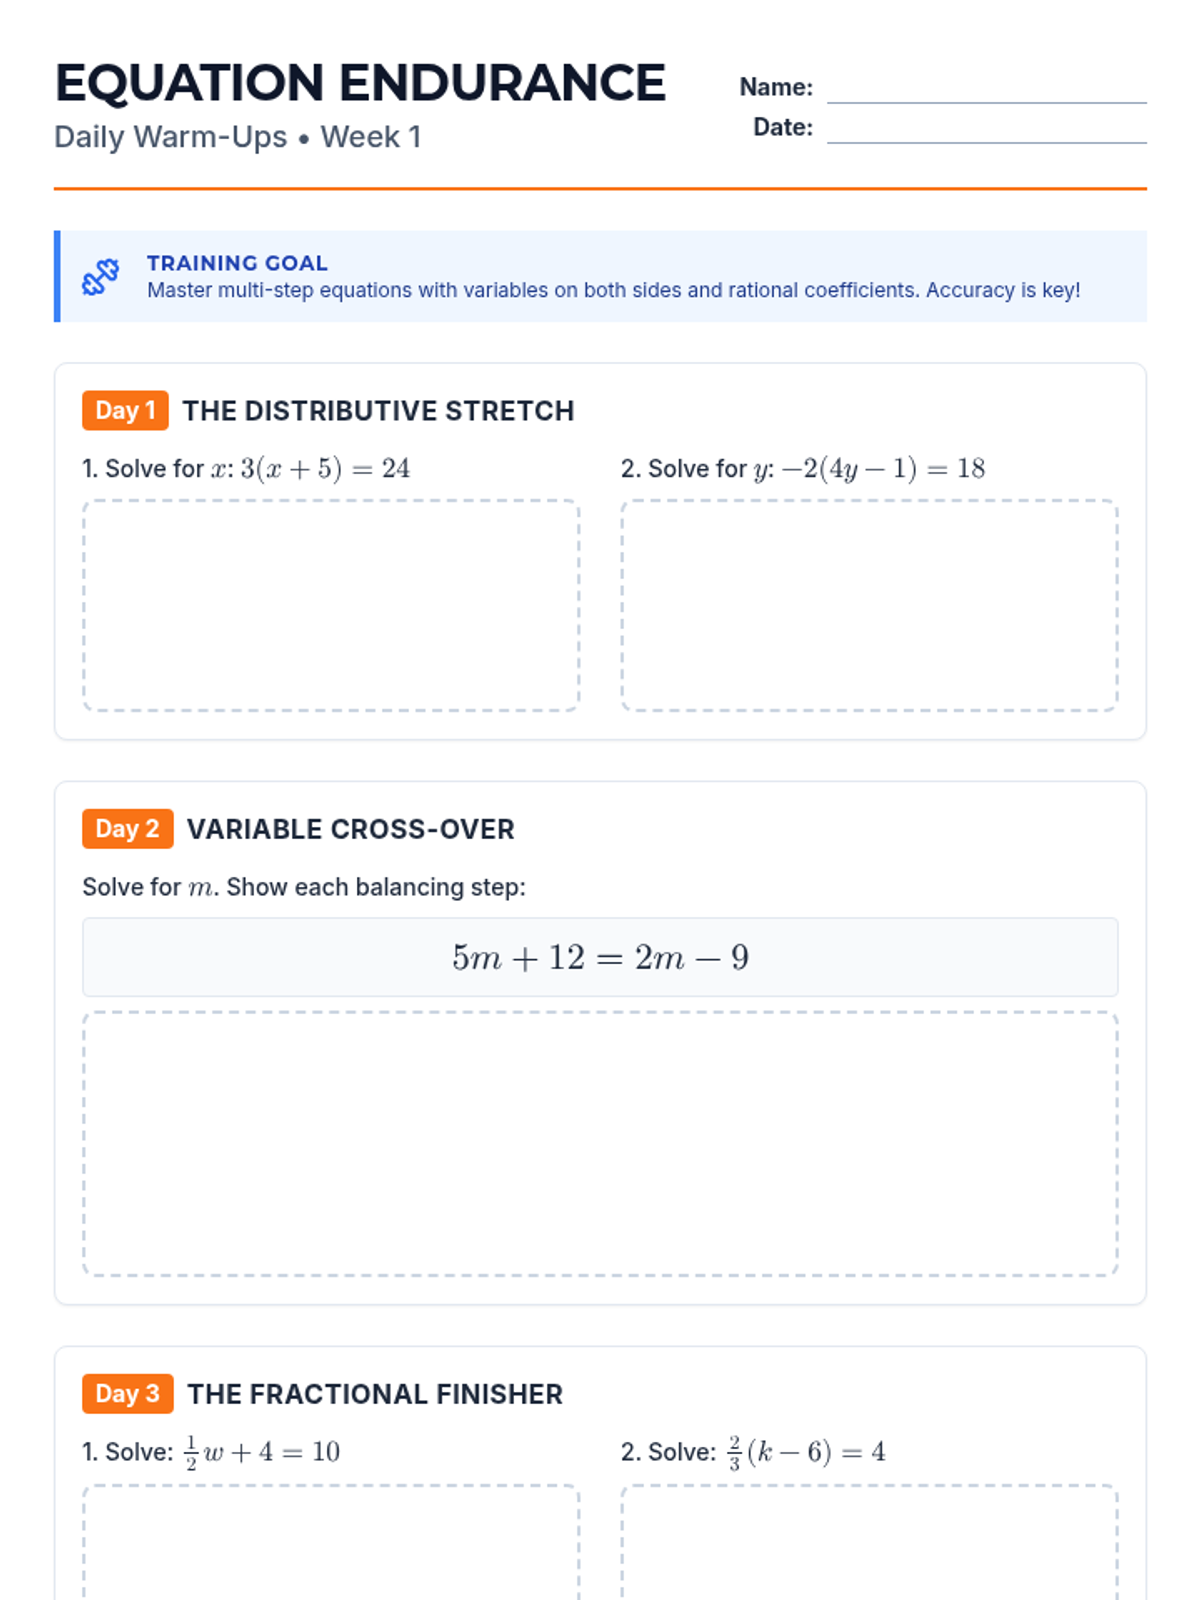
Condensed and polished 2-page Warm-Up for Week 1. Fixed pagination issues and improved work area contrast for printing.
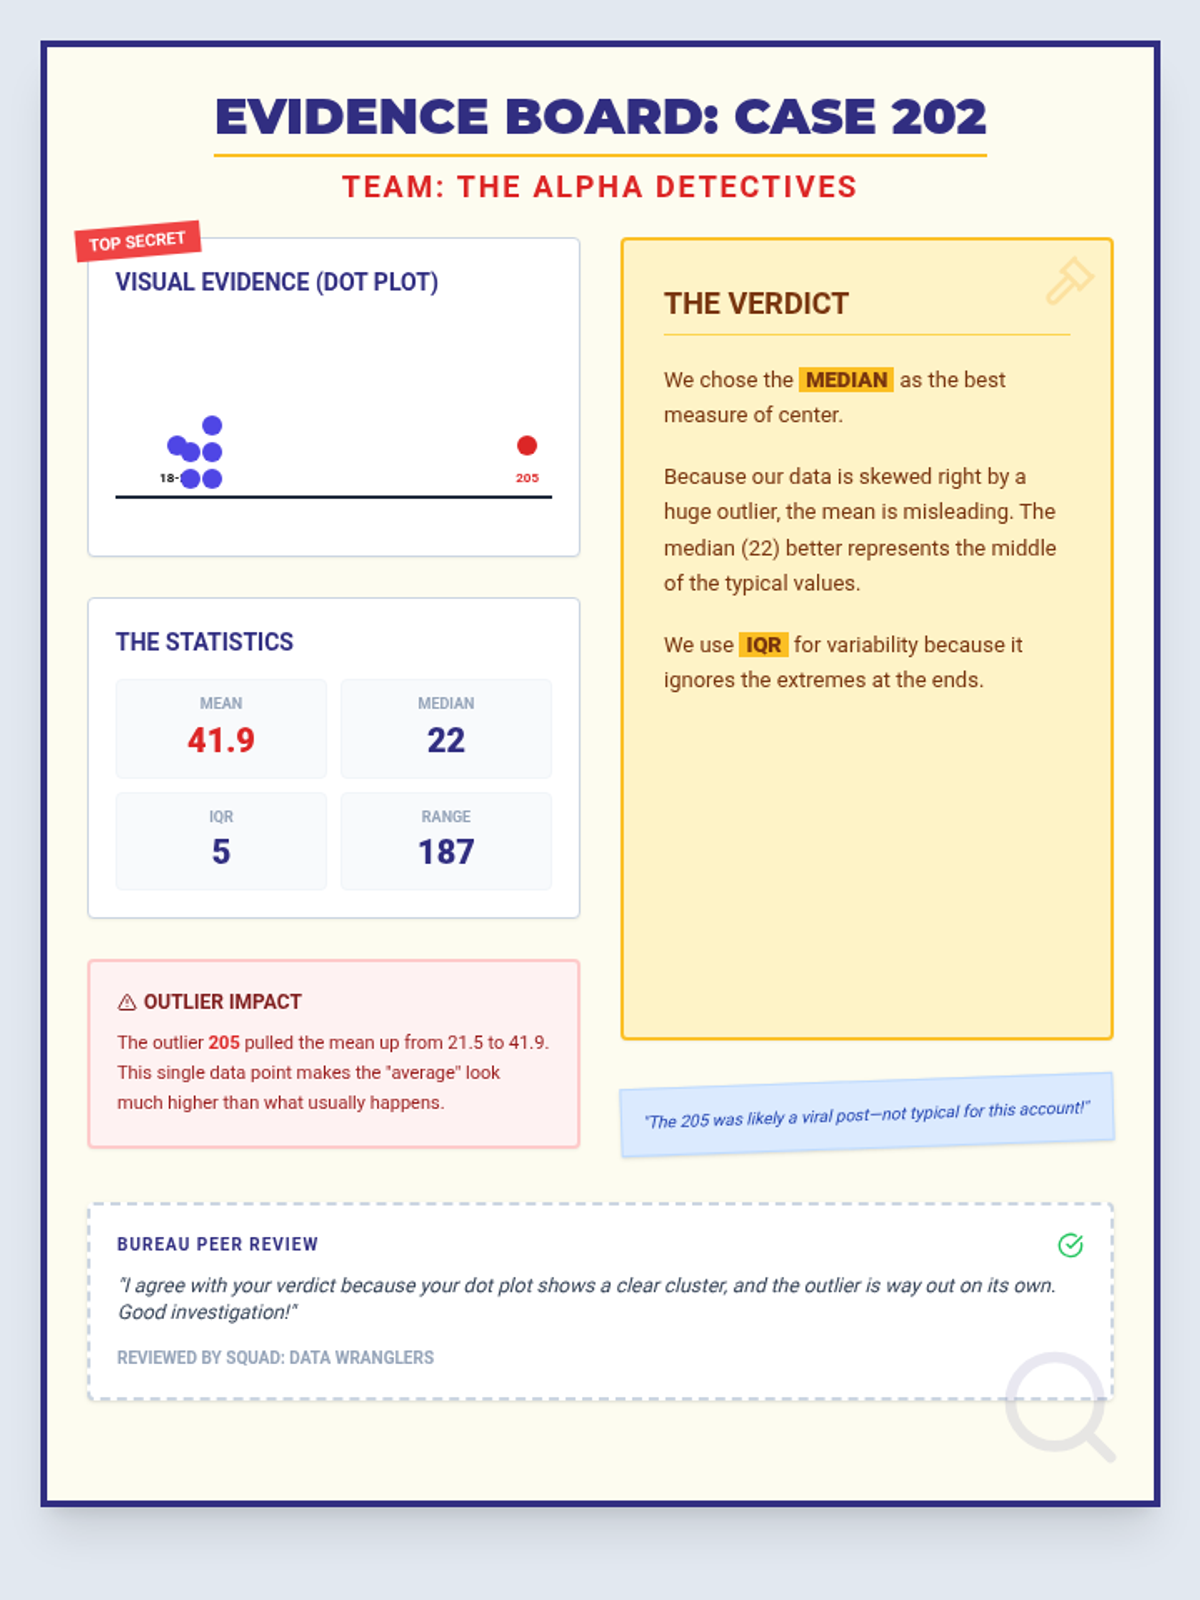
A visual example and mockup of a completed 'Evidence Board' poster for Case 202, demonstrating how students should present their visual plot, statistics, verdict, and outlier analysis. Revised for single-page layout.
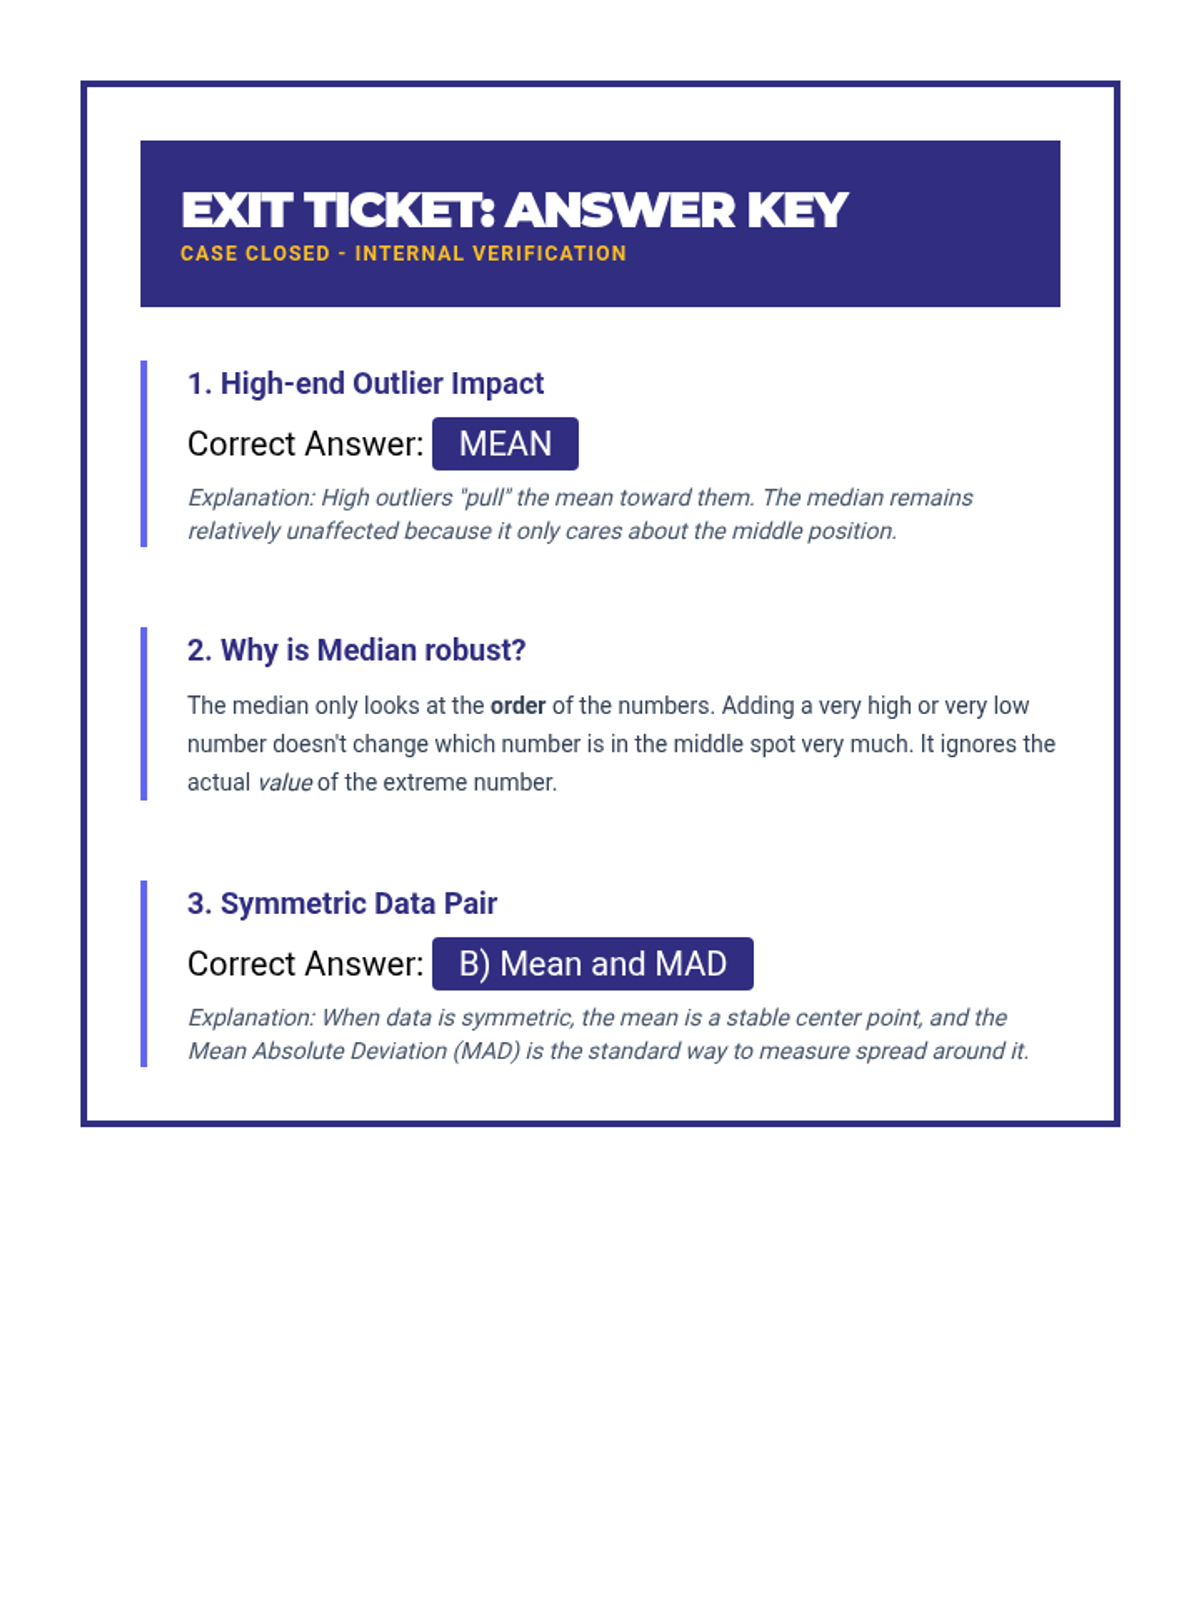
An answer key for the Distribution Debrief Exit Ticket, providing correct answers and brief pedagogical explanations.
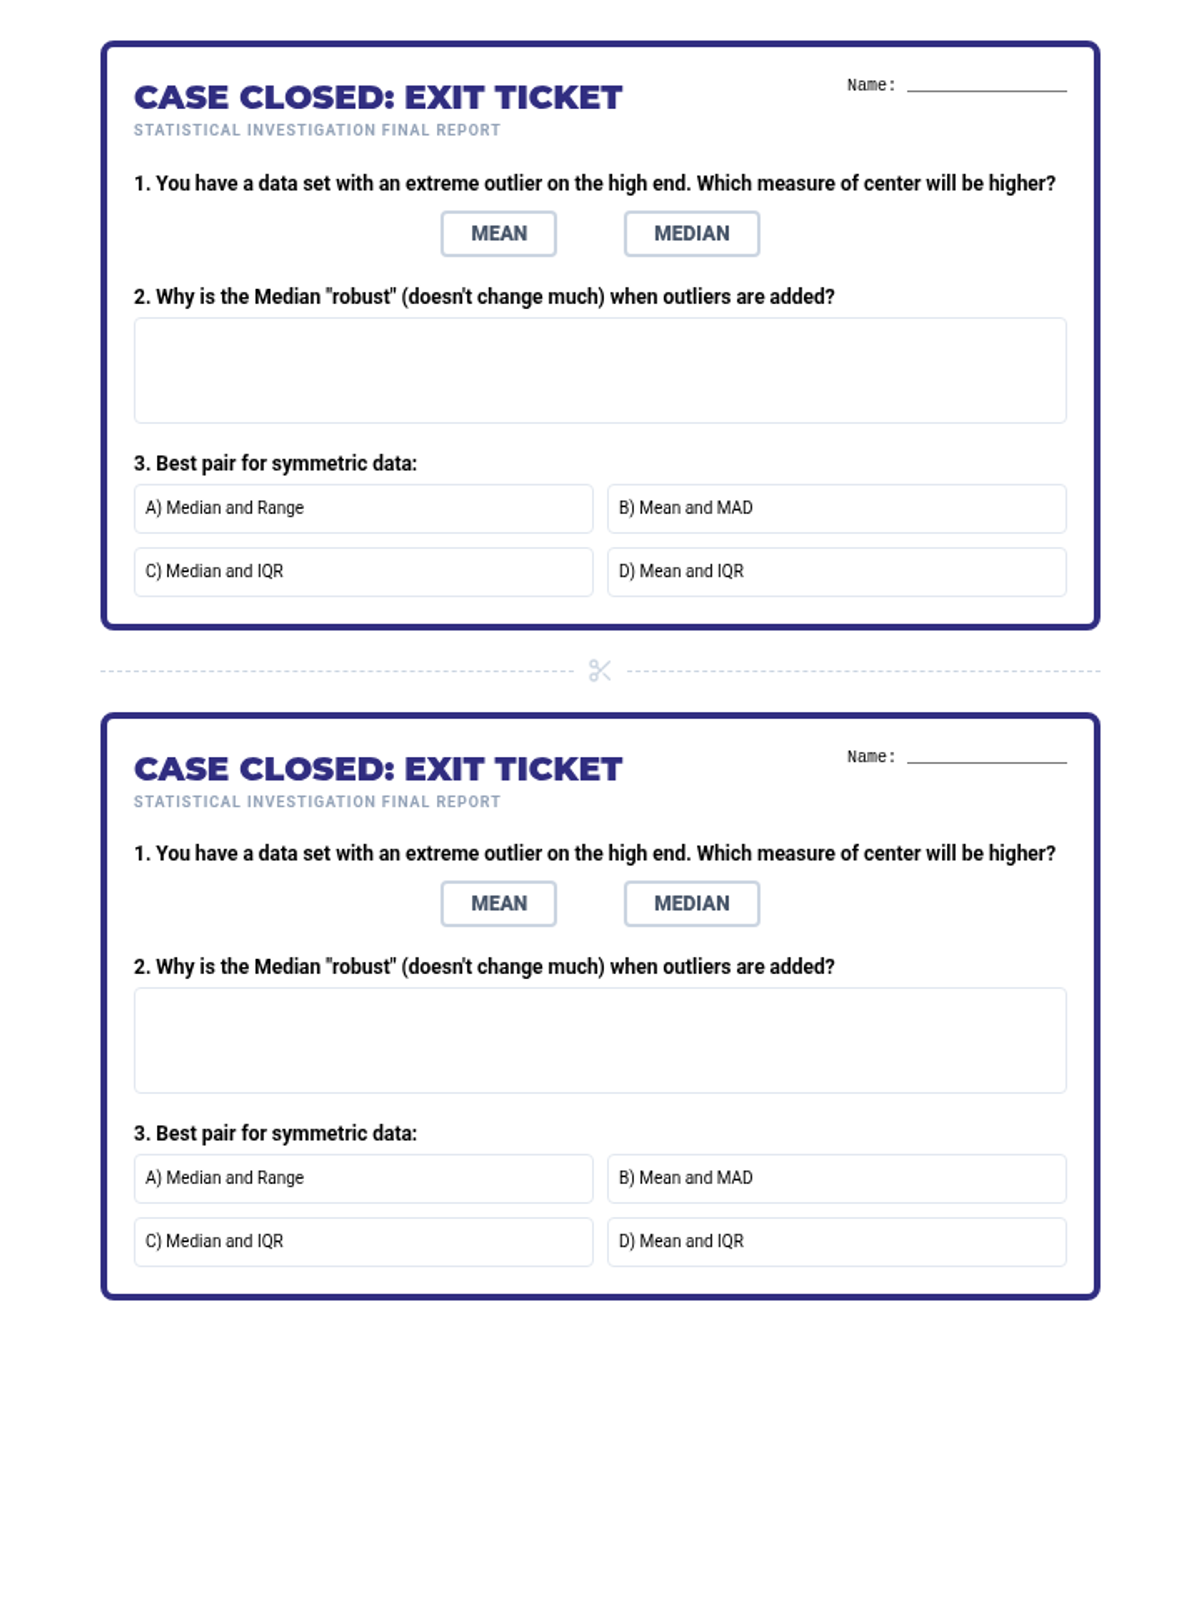
A brief end-of-lesson assessment checking student understanding of how outliers affect mean vs median and when to use specific statistical measures. Two tickets per page for efficient printing. Revised for layout and uniform answer choices.
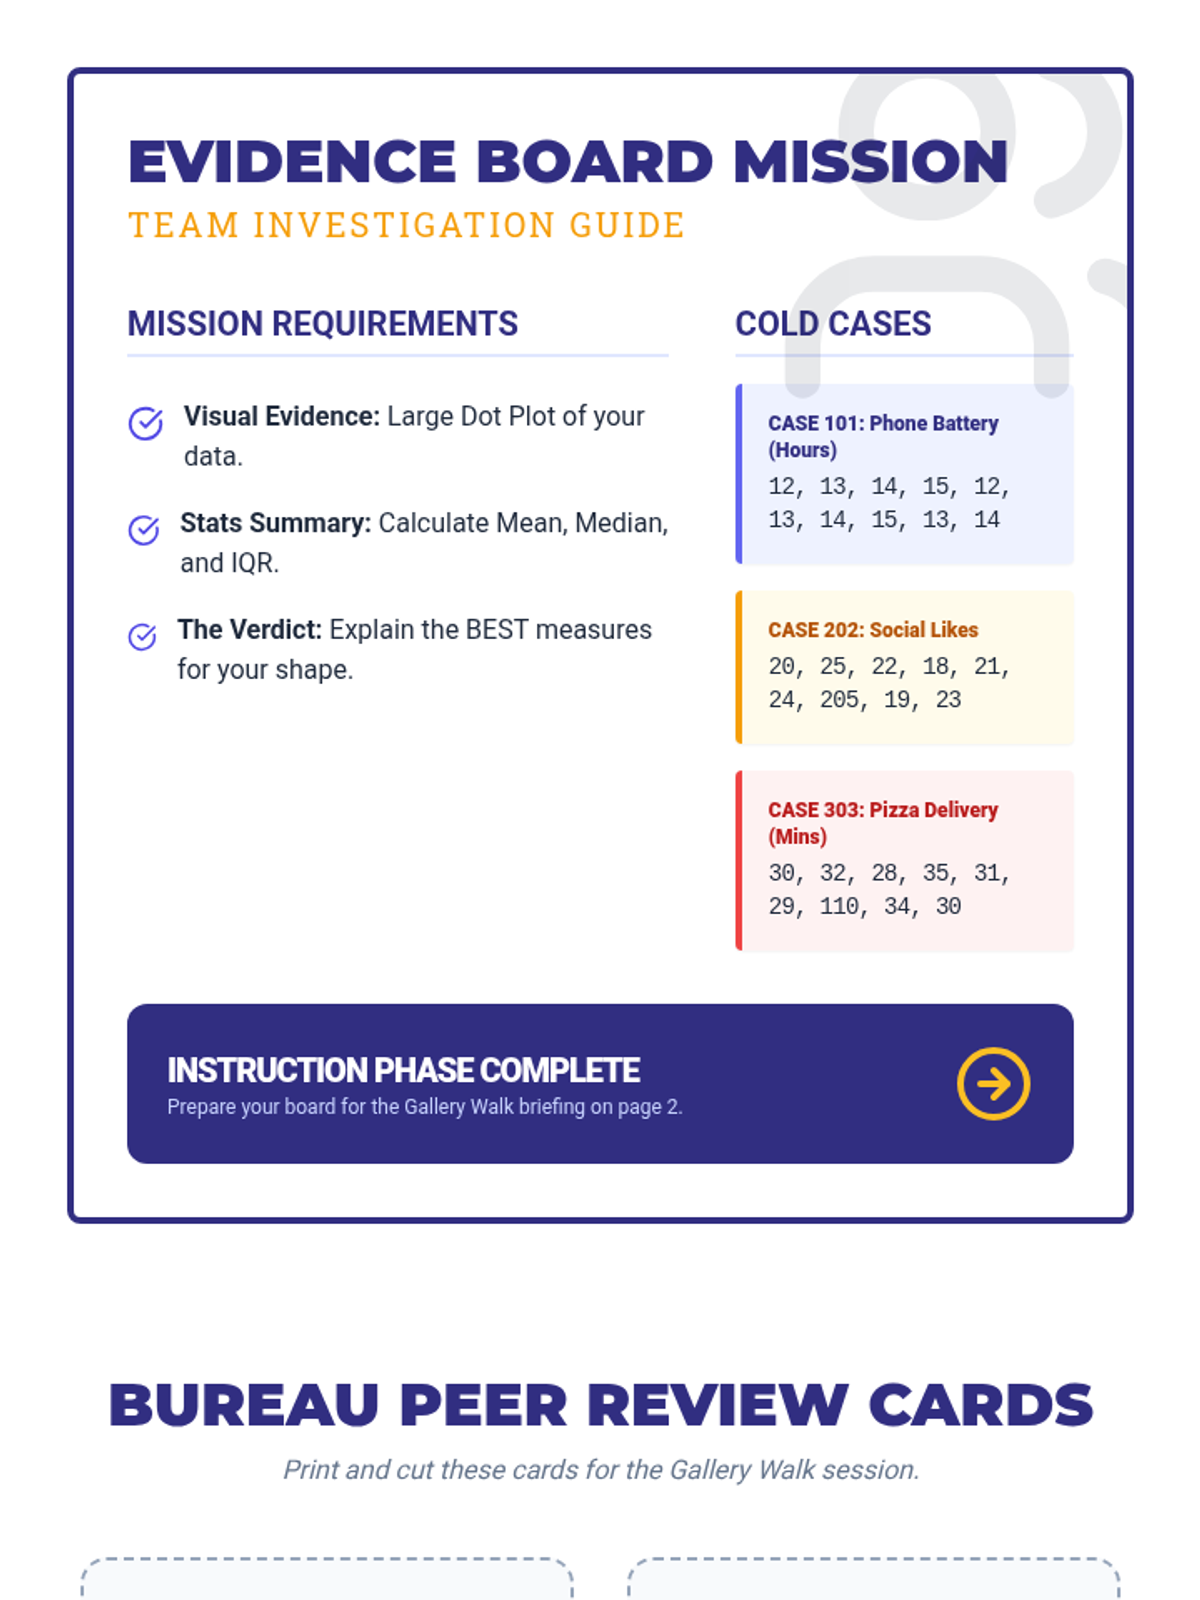
A guide for the collaborative poster activity featuring specific case studies for students to analyze and 'peer review' cards for a gallery walk. Revised with larger peer review cards and better layout.
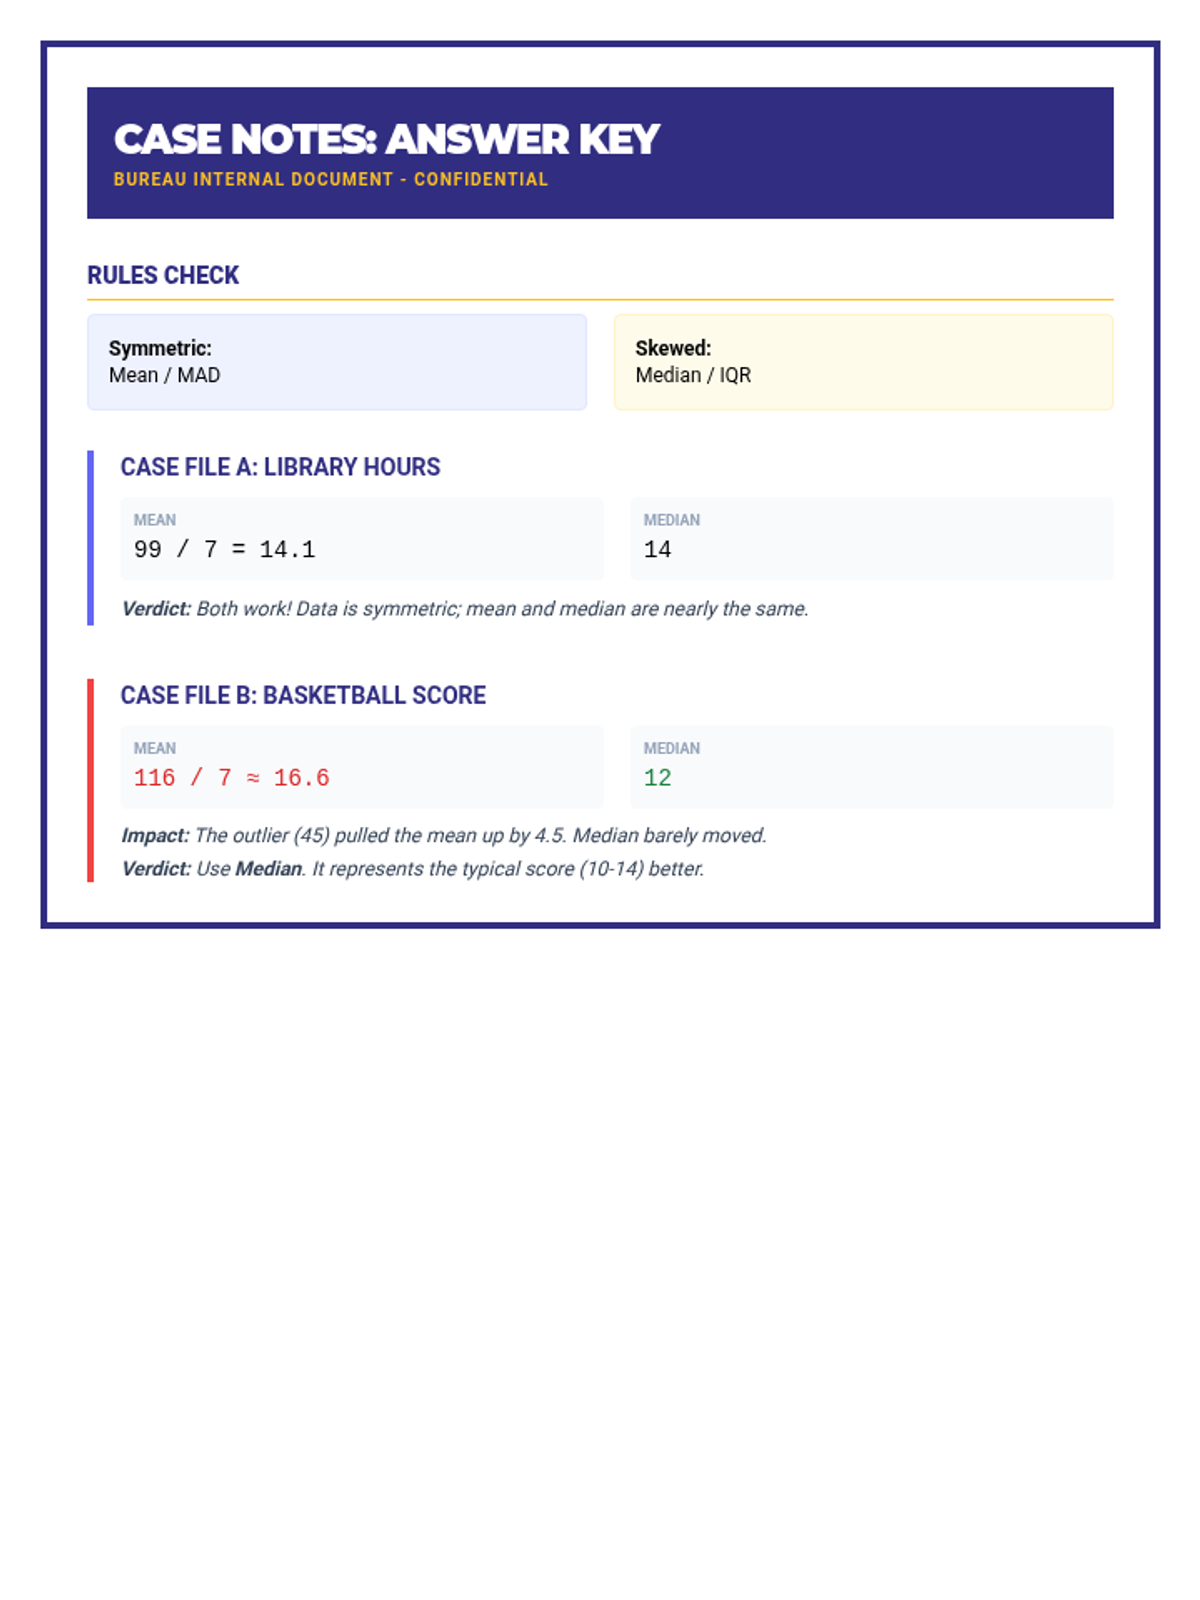
An answer key for the Case Notes handout, providing calculations for mean and median and clear explanations of why certain measures are preferred in symmetric vs skewed data. Revised for layout and clarity.
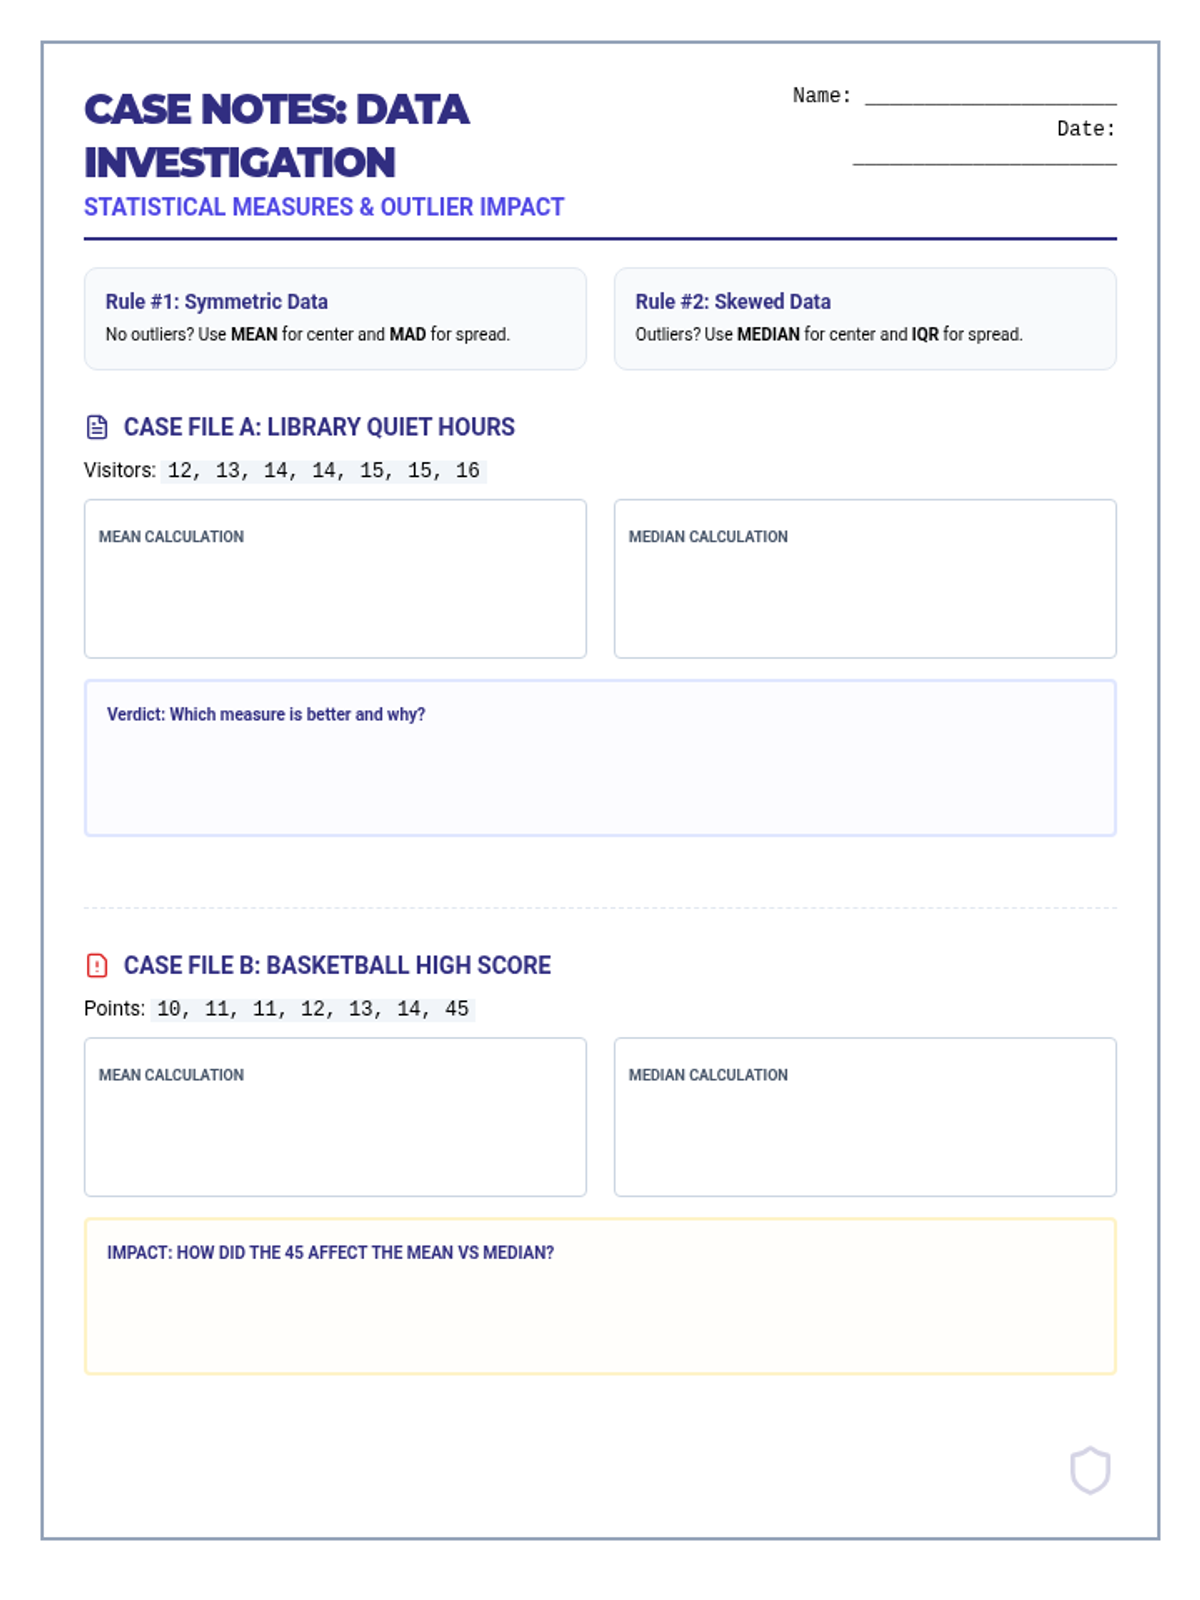
A student practice worksheet with two real-world scenarios comparing symmetric data to data with an outlier, requiring students to calculate measures and justify their selection. Layout optimized for 8.5x11 printing. Revised for single-page fit.
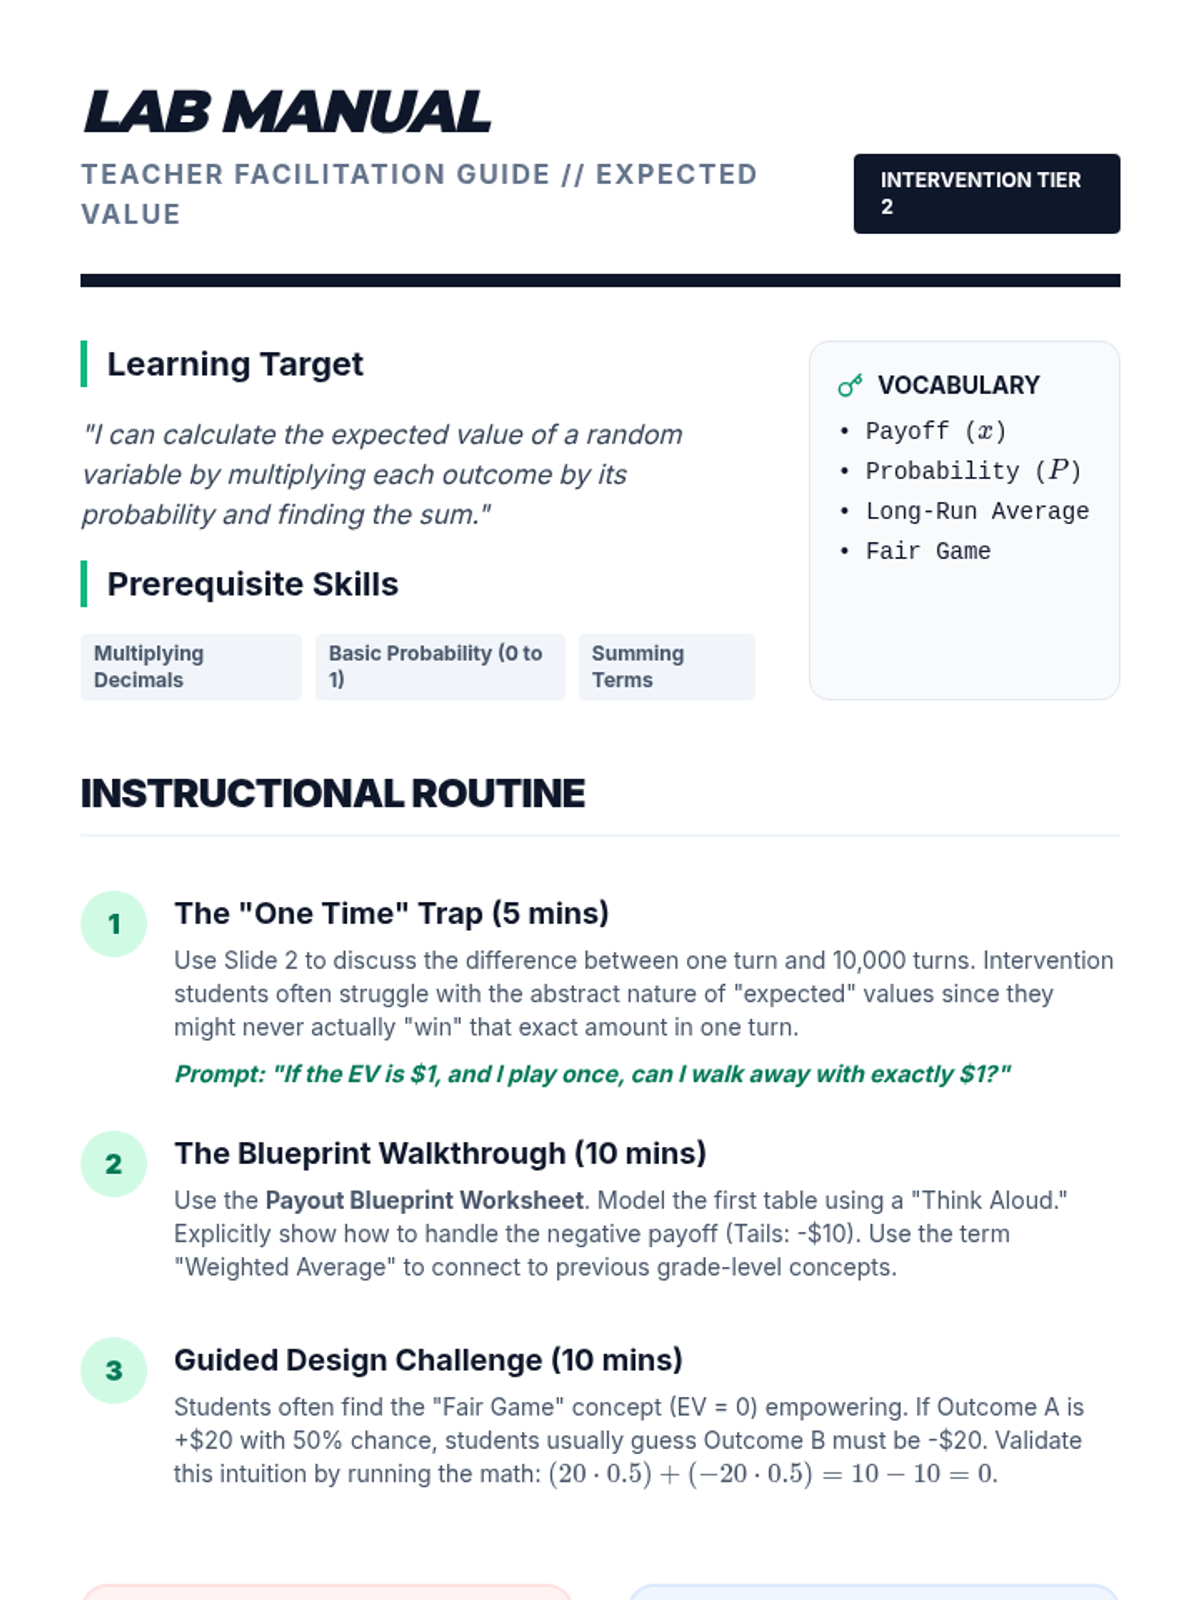
A comprehensive teacher guide for facilitating a Tier 2 intervention lesson on expected value. It includes a scripted instructional routine, common misconceptions, and differentiation strategies to support struggling learners.
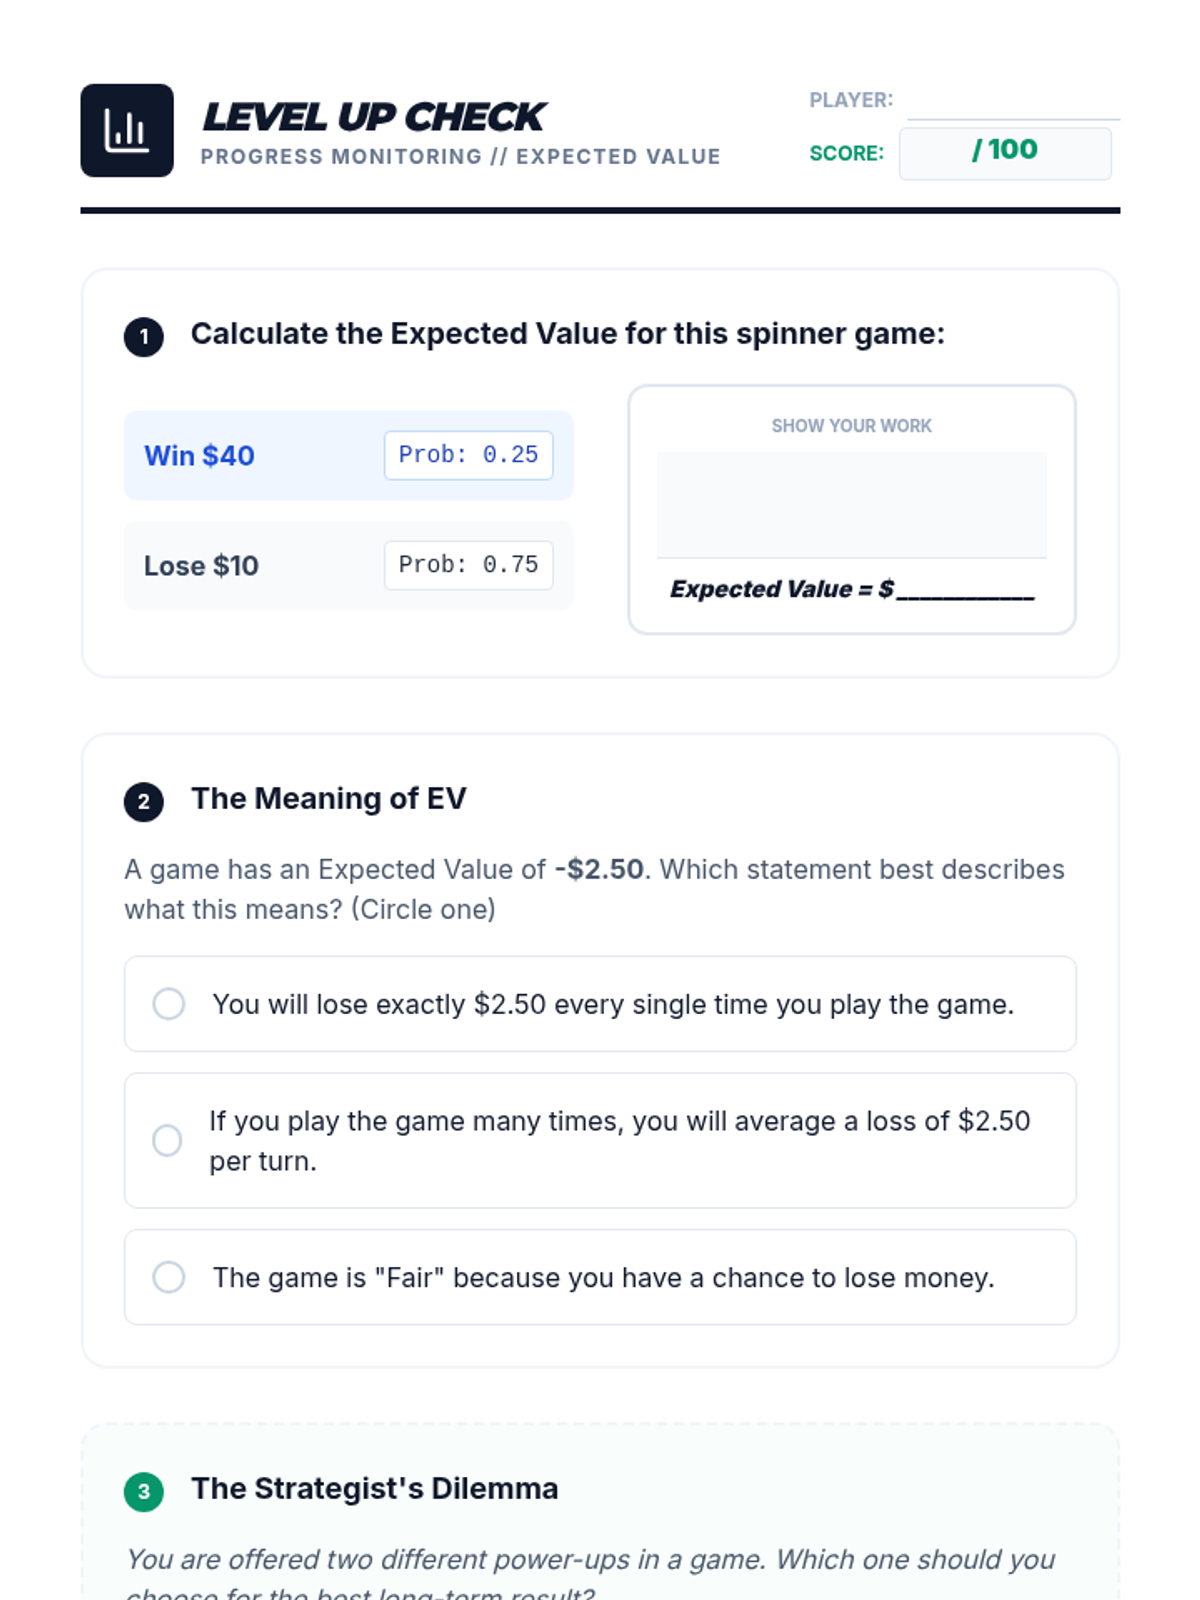
A concise progress monitoring tool designed as an 'exit ticket' to assess student understanding of expected value calculations and conceptual meaning.
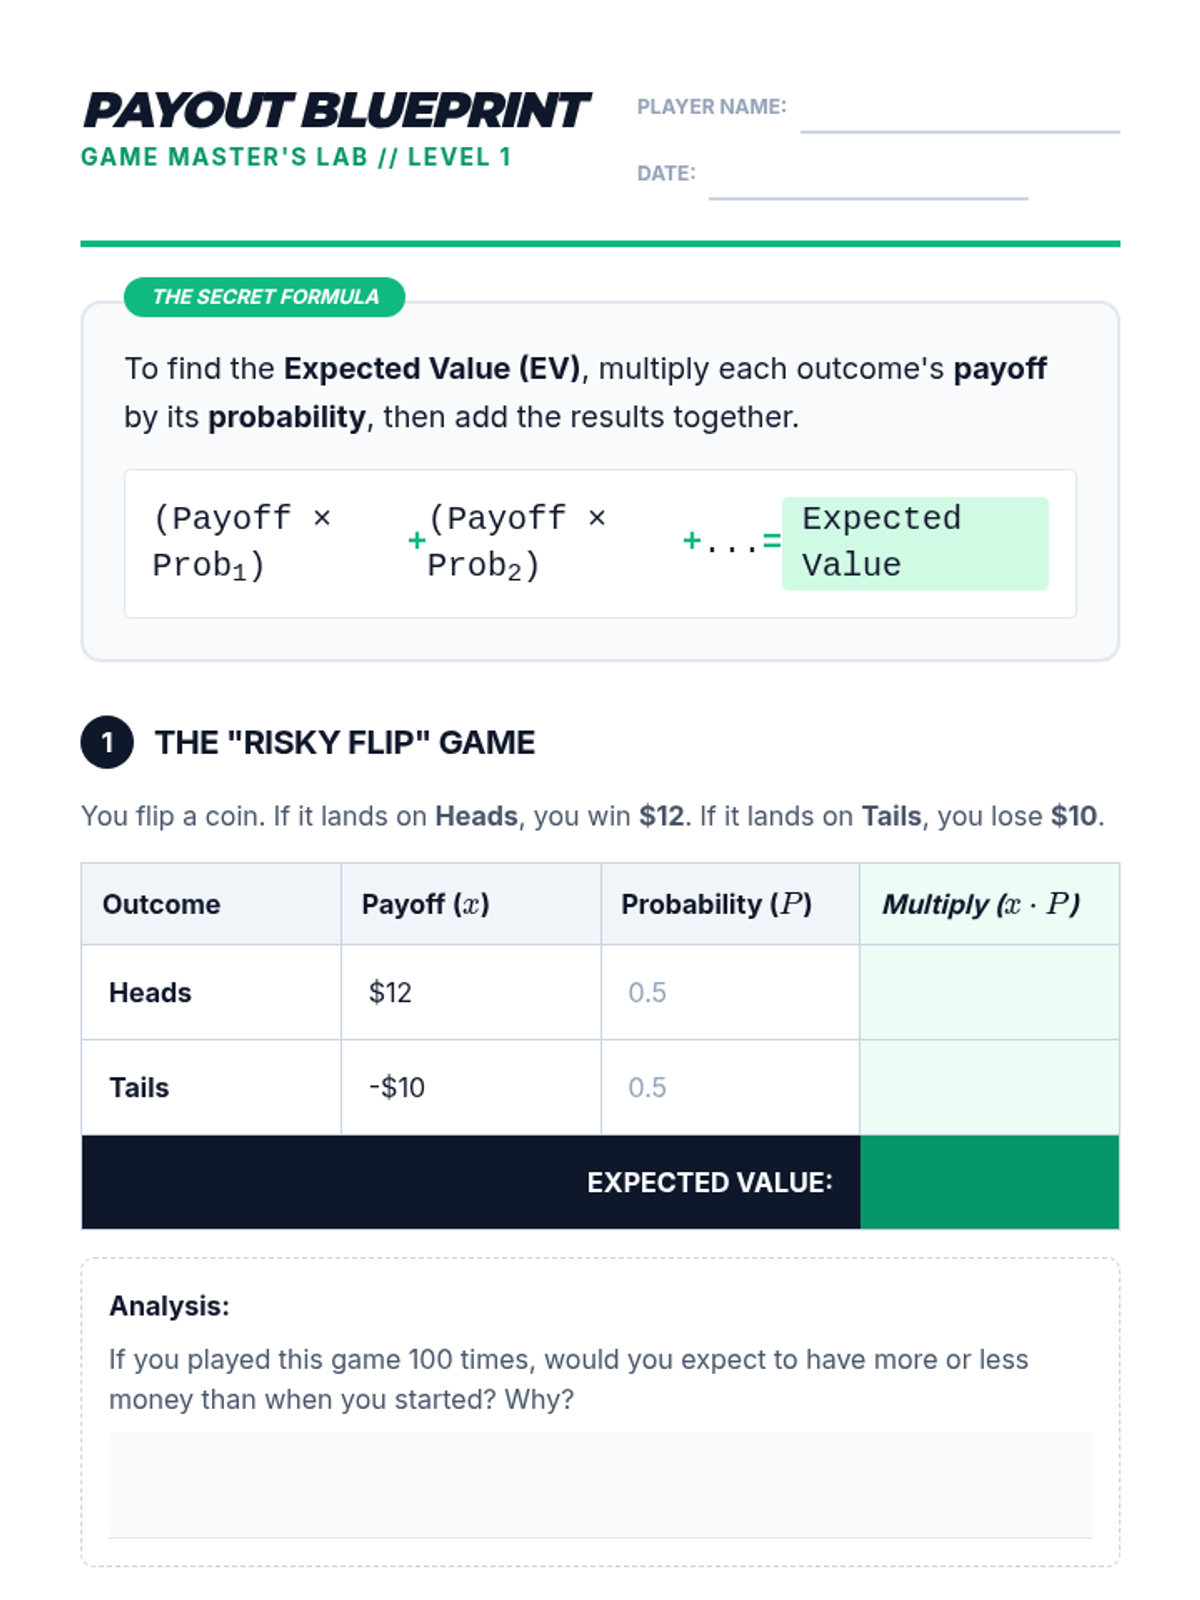
A scaffolded worksheet that guides students through calculating expected value step-by-step using game outcome tables. It includes a progression from basic coin flips to multi-outcome games and a 'fair game' design challenge.
A visual presentation for a small group intervention lesson on expected value, using a game design theme to make the concept of 'long-run average' concrete and engaging.
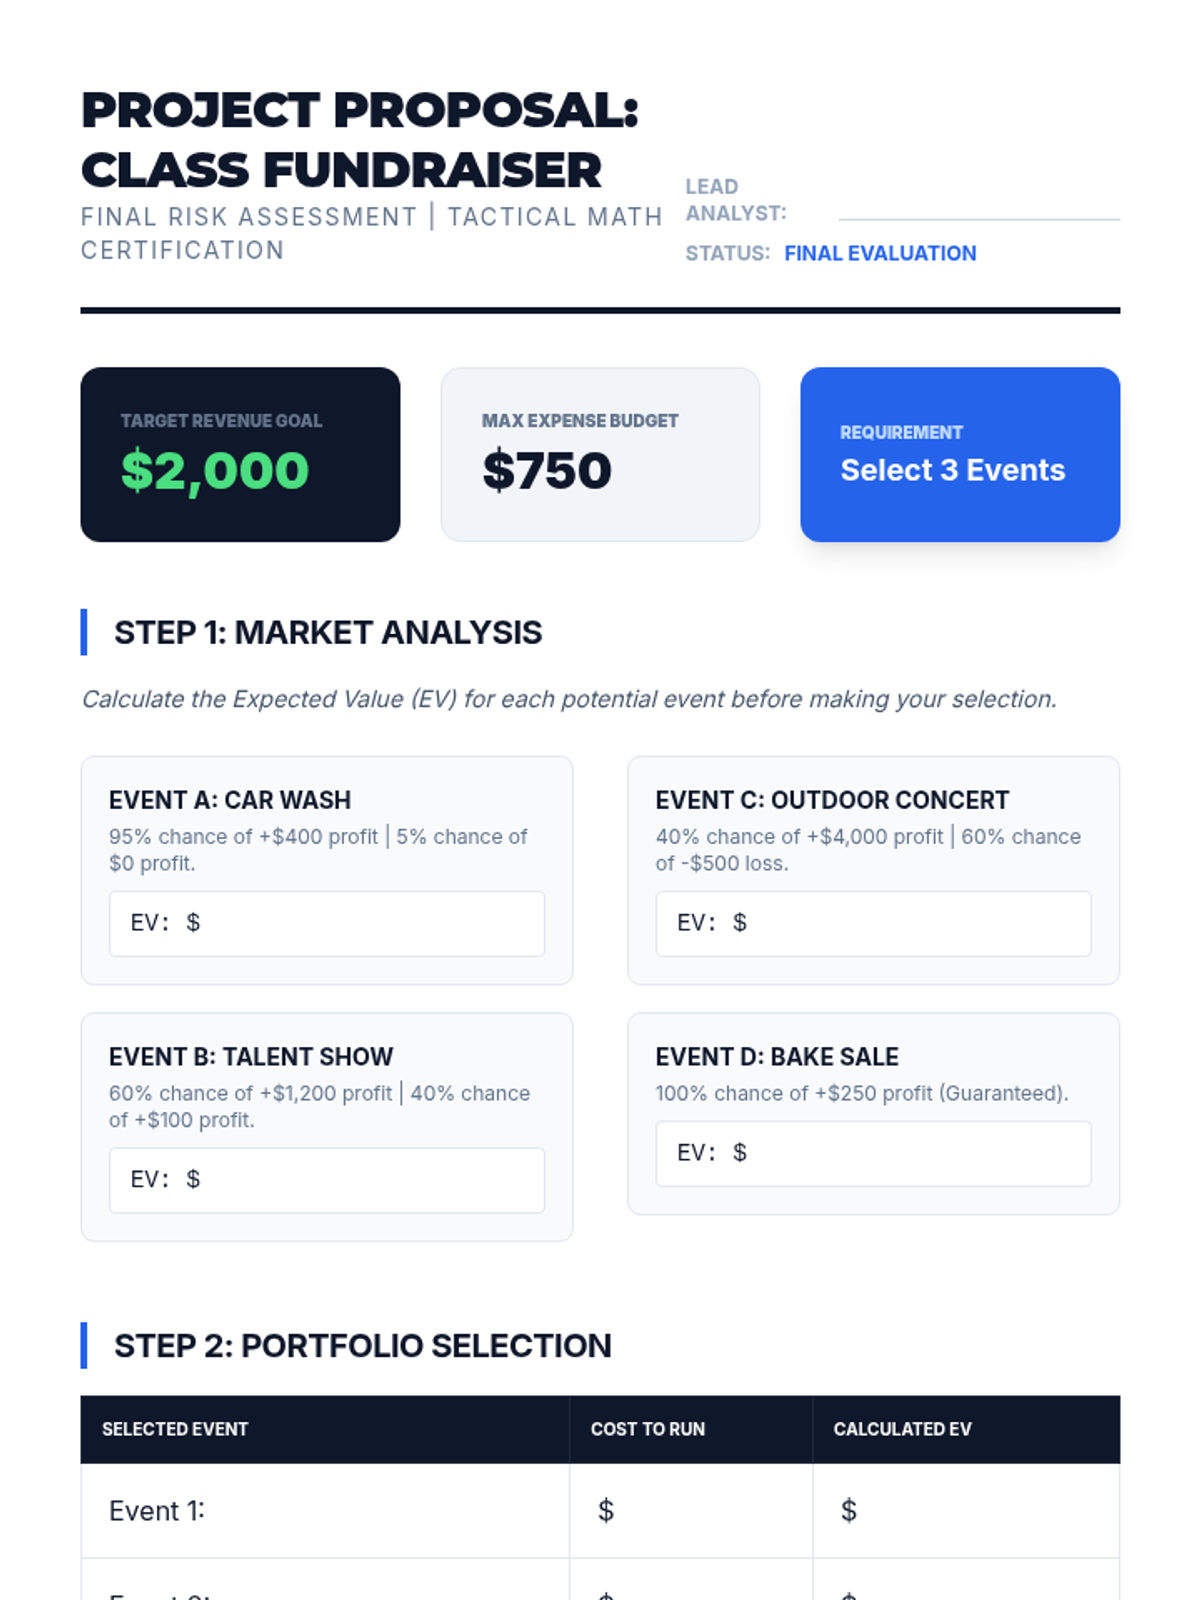
Final assessment worksheet where students evaluate fundraiser options and build a portfolio to maximize expected profit within a budget.
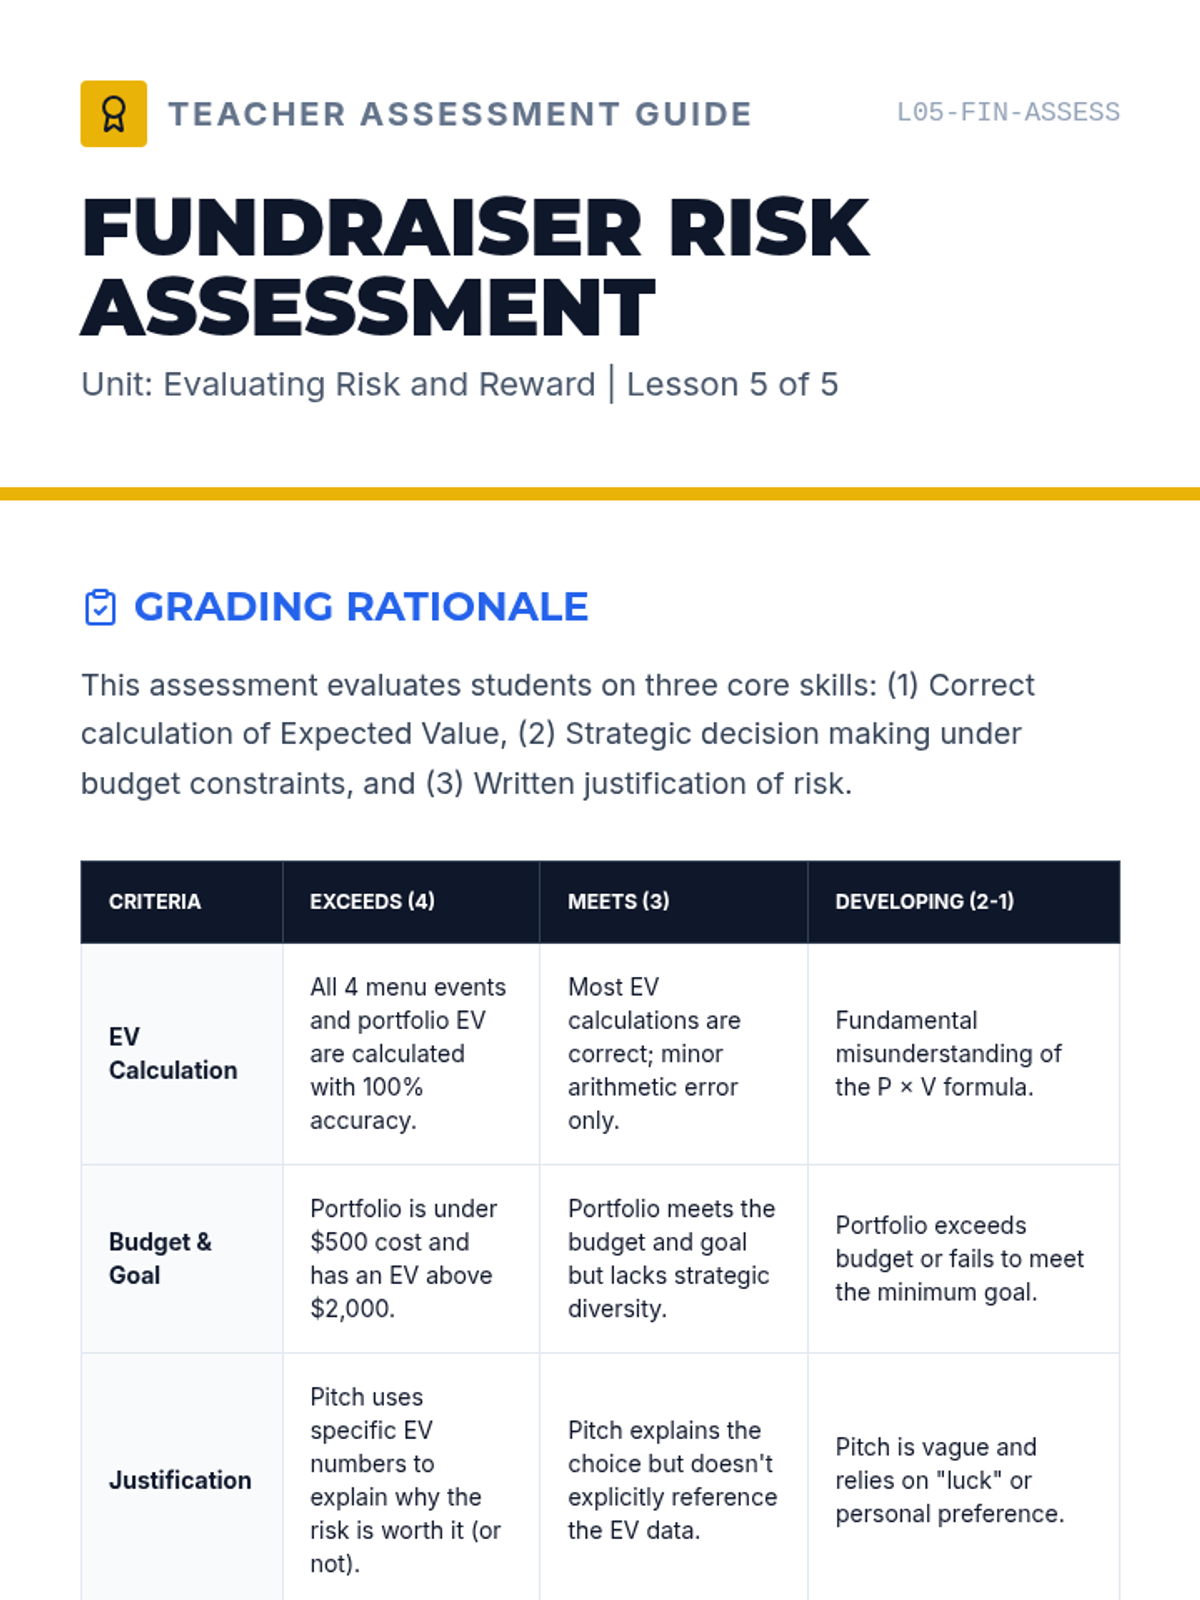
Teacher facilitation guide for Lesson 5, providing instructional steps for comparing business scenarios using expected value.
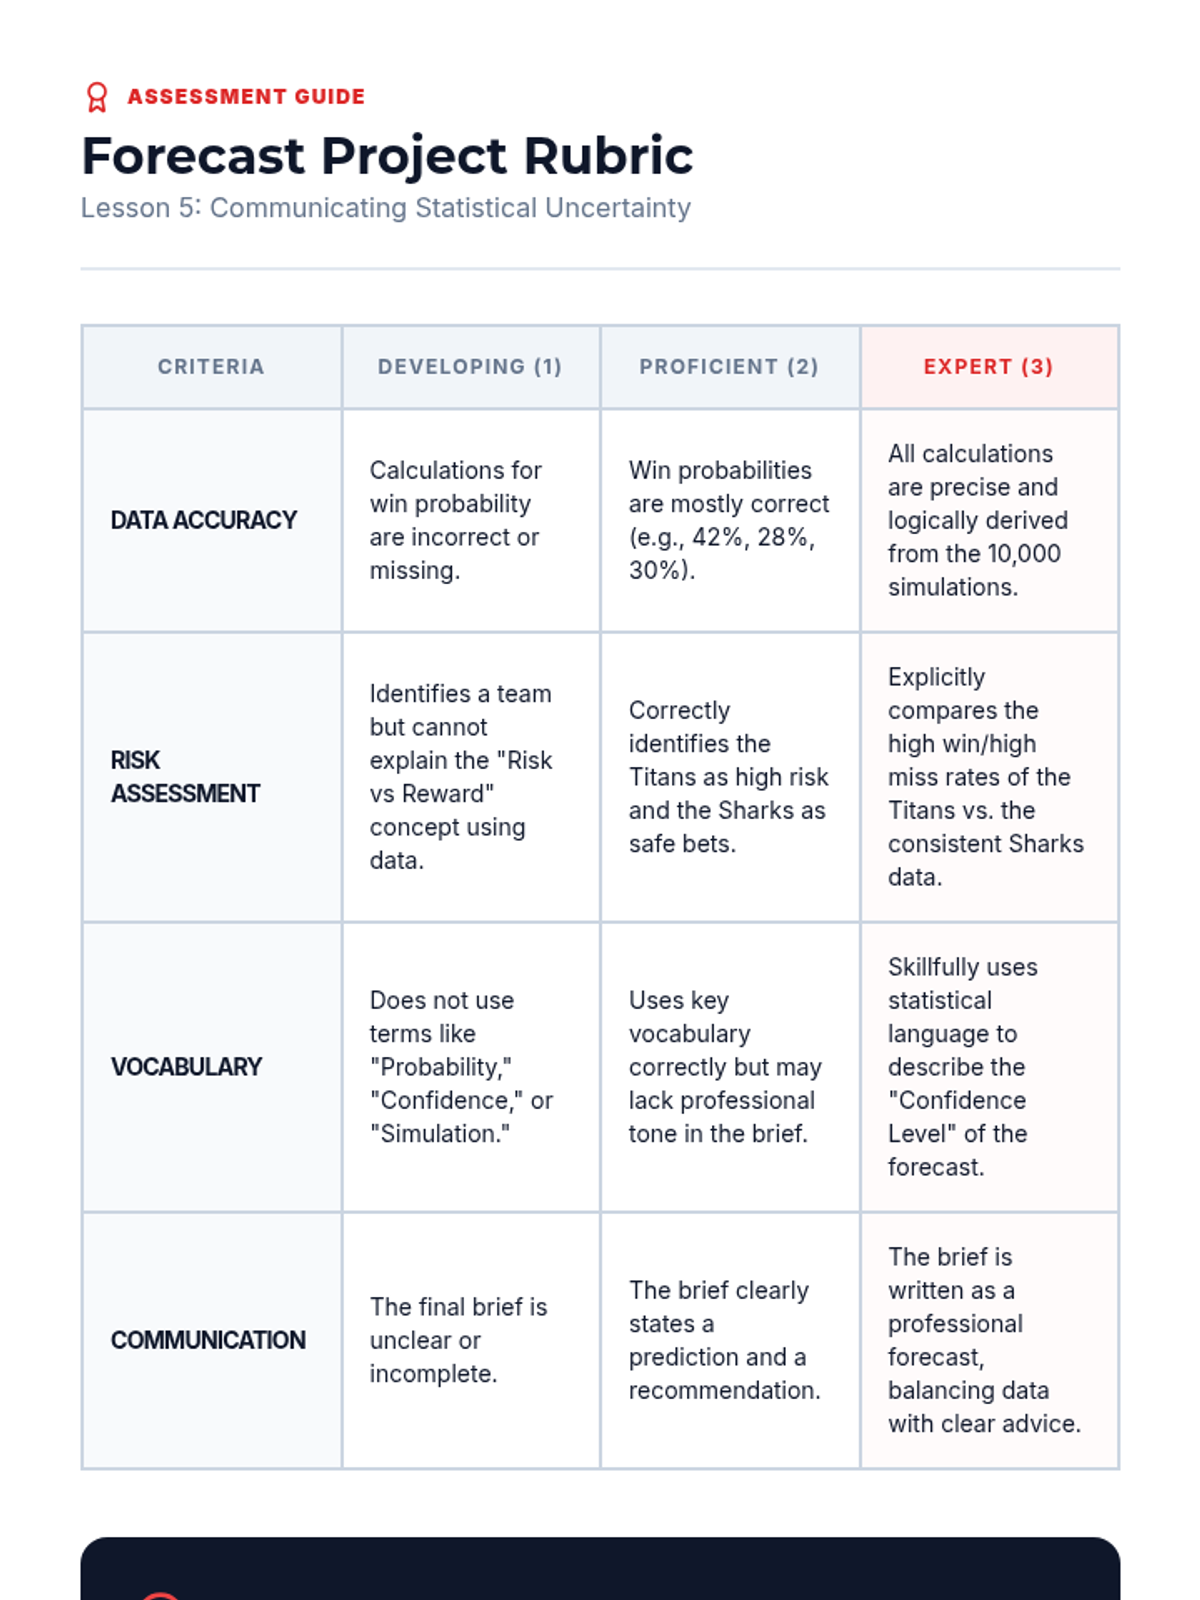
A grading rubric for the Season Forecast project, focusing on data accuracy, risk assessment, statistical vocabulary, and professional communication of uncertainty.
Final slide deck for the sequence, presenting the fundraiser portfolio challenge and evaluation criteria.
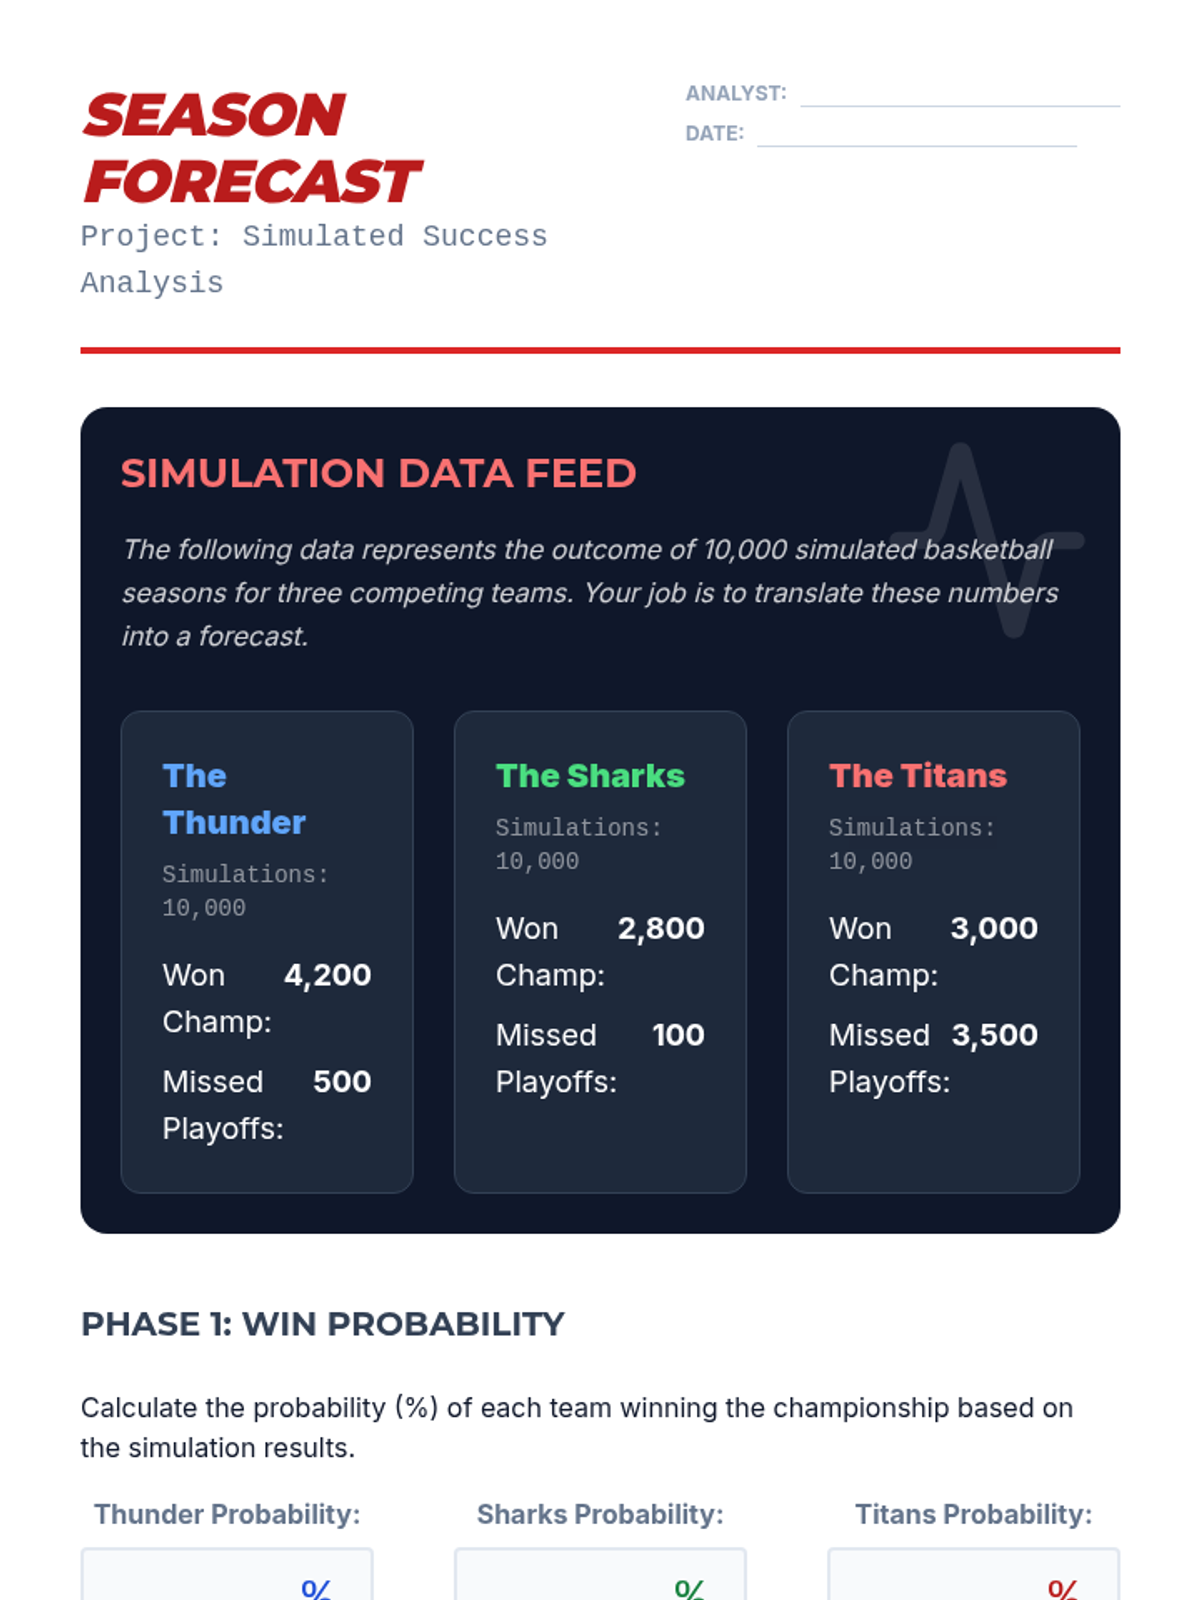
A student project for Lesson 5 where they analyze data from 10,000 simulated sports seasons. They calculate probabilities, identify risk vs. reward, and write a professional forecast summary.
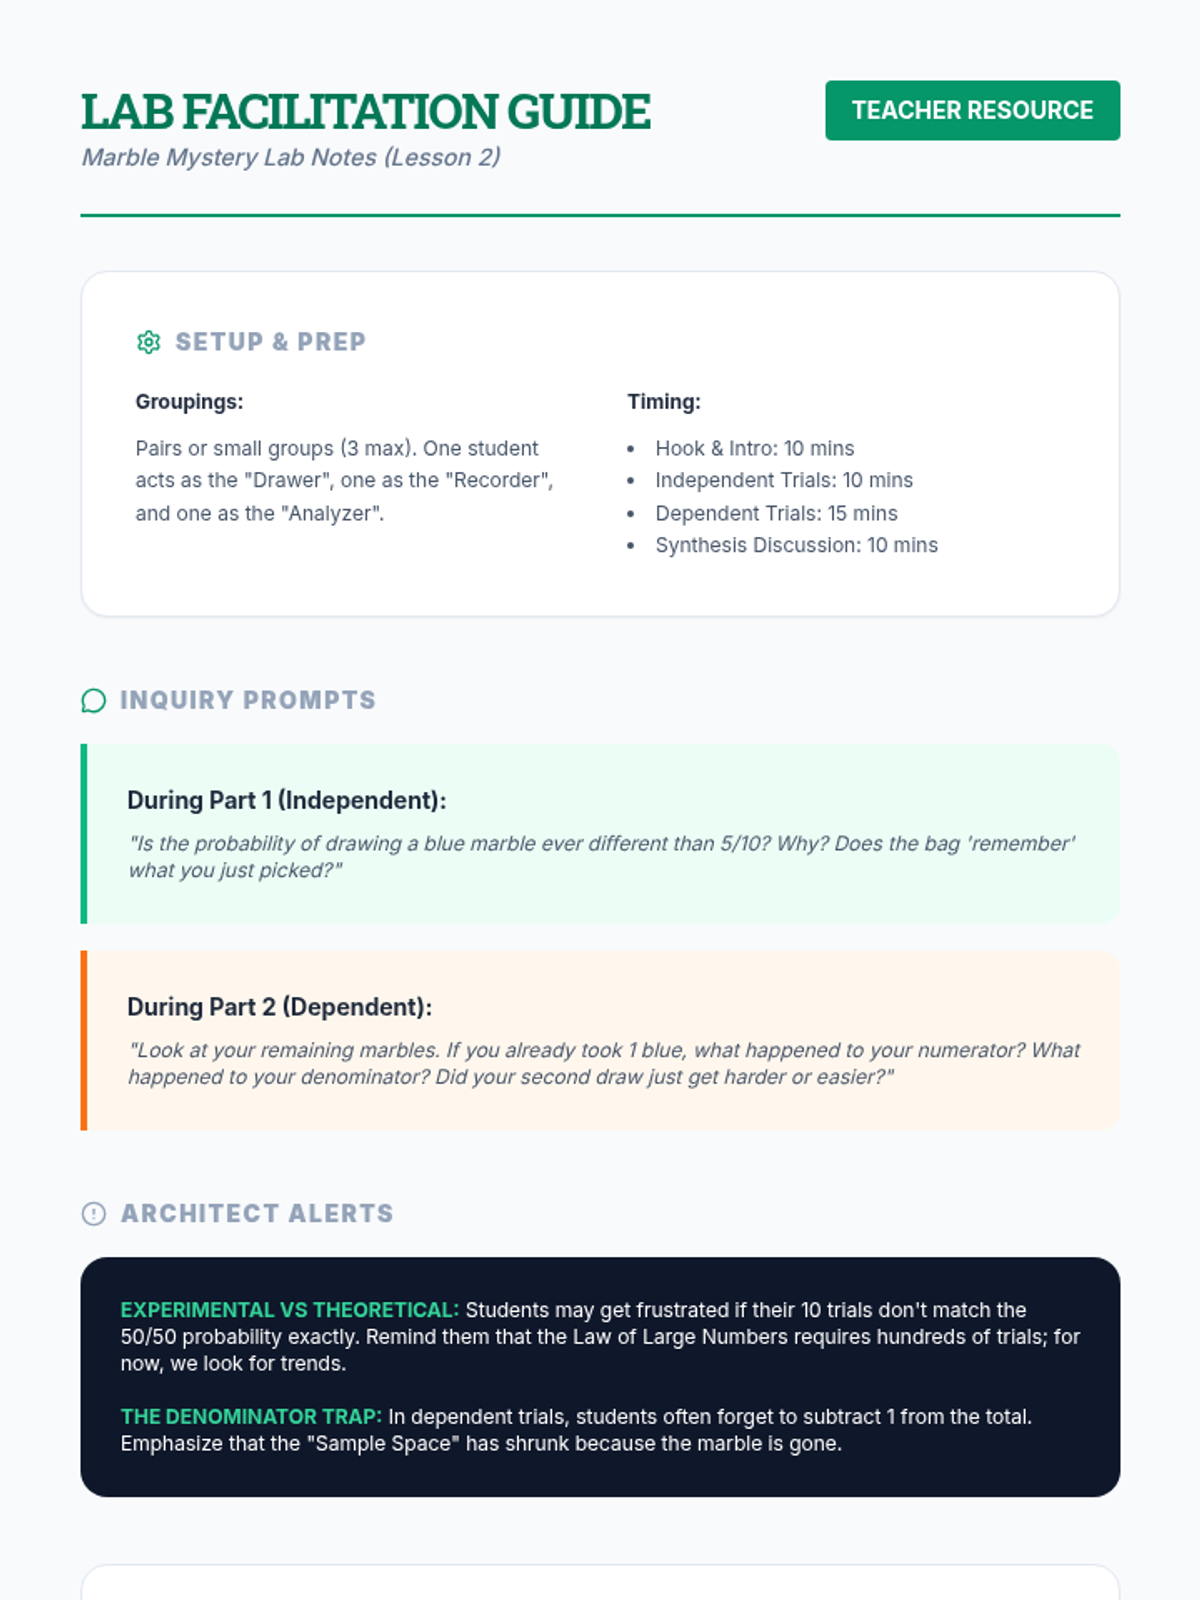
Facilitation guide for the Lesson 2 marble experiment, including setup instructions, inquiry-based discussion prompts, and expected experimental outcomes.
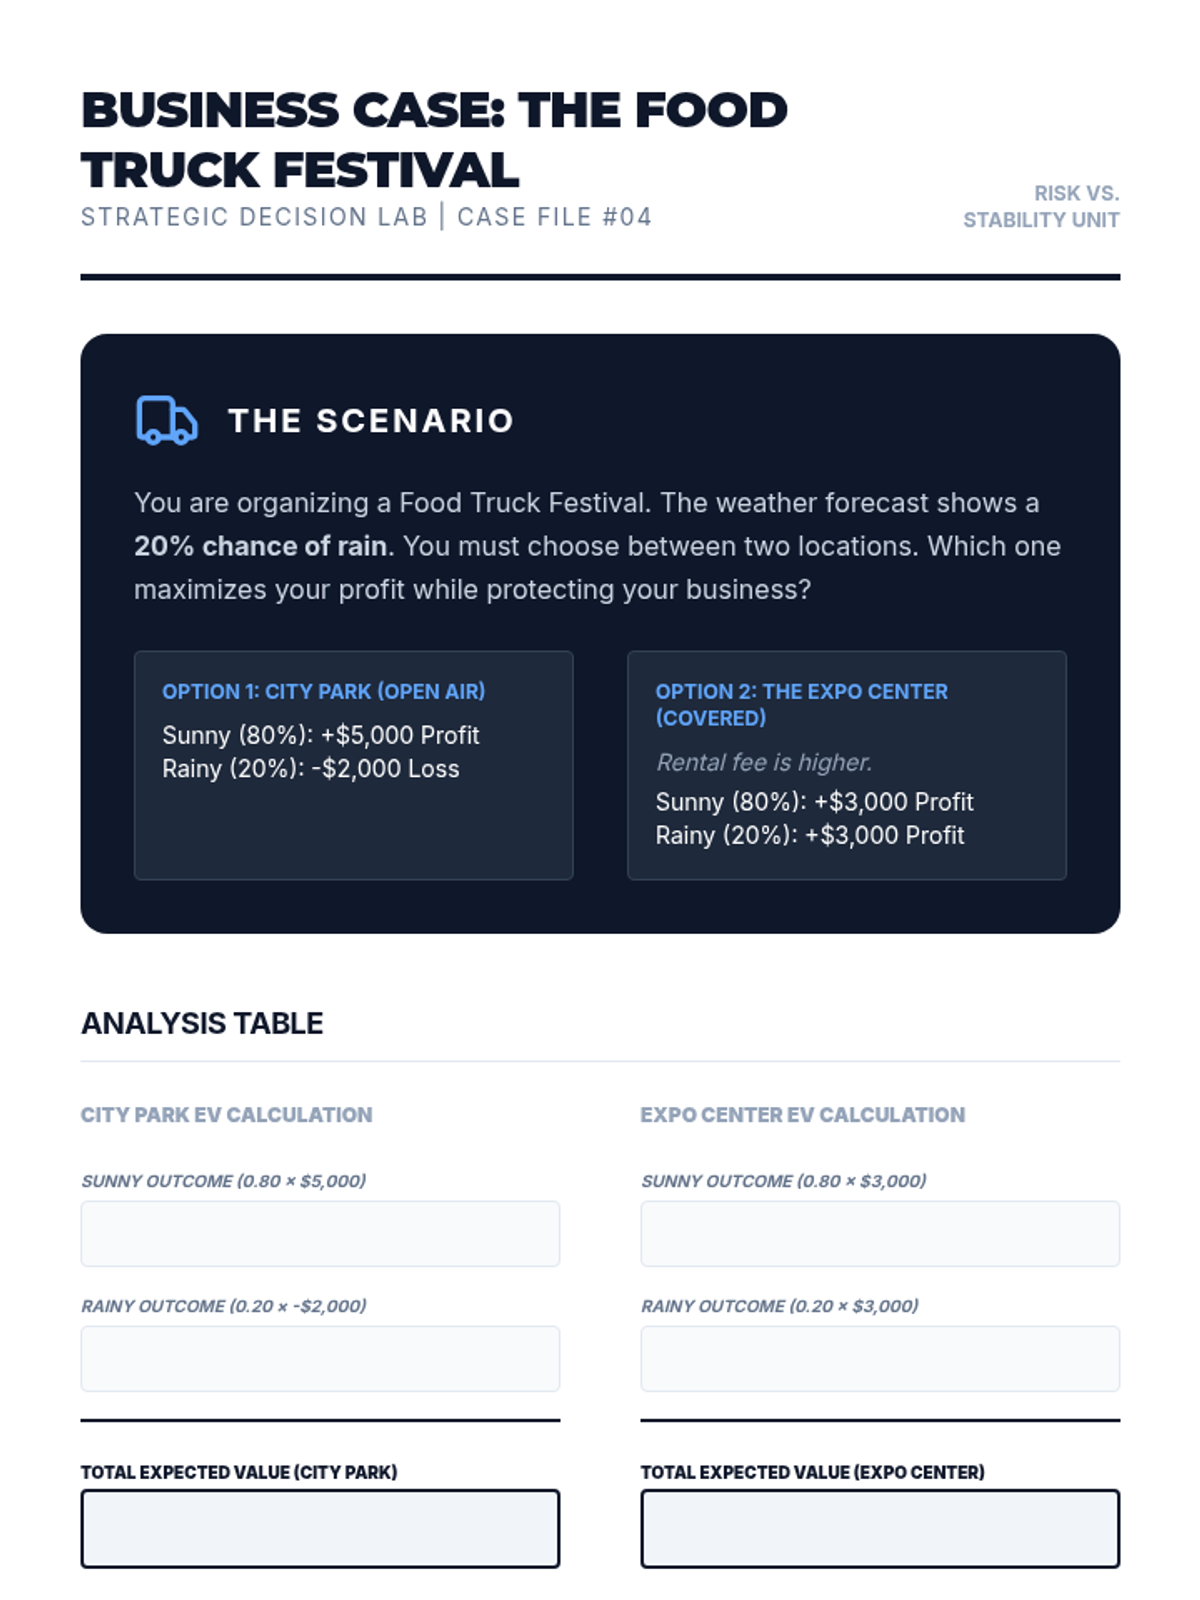
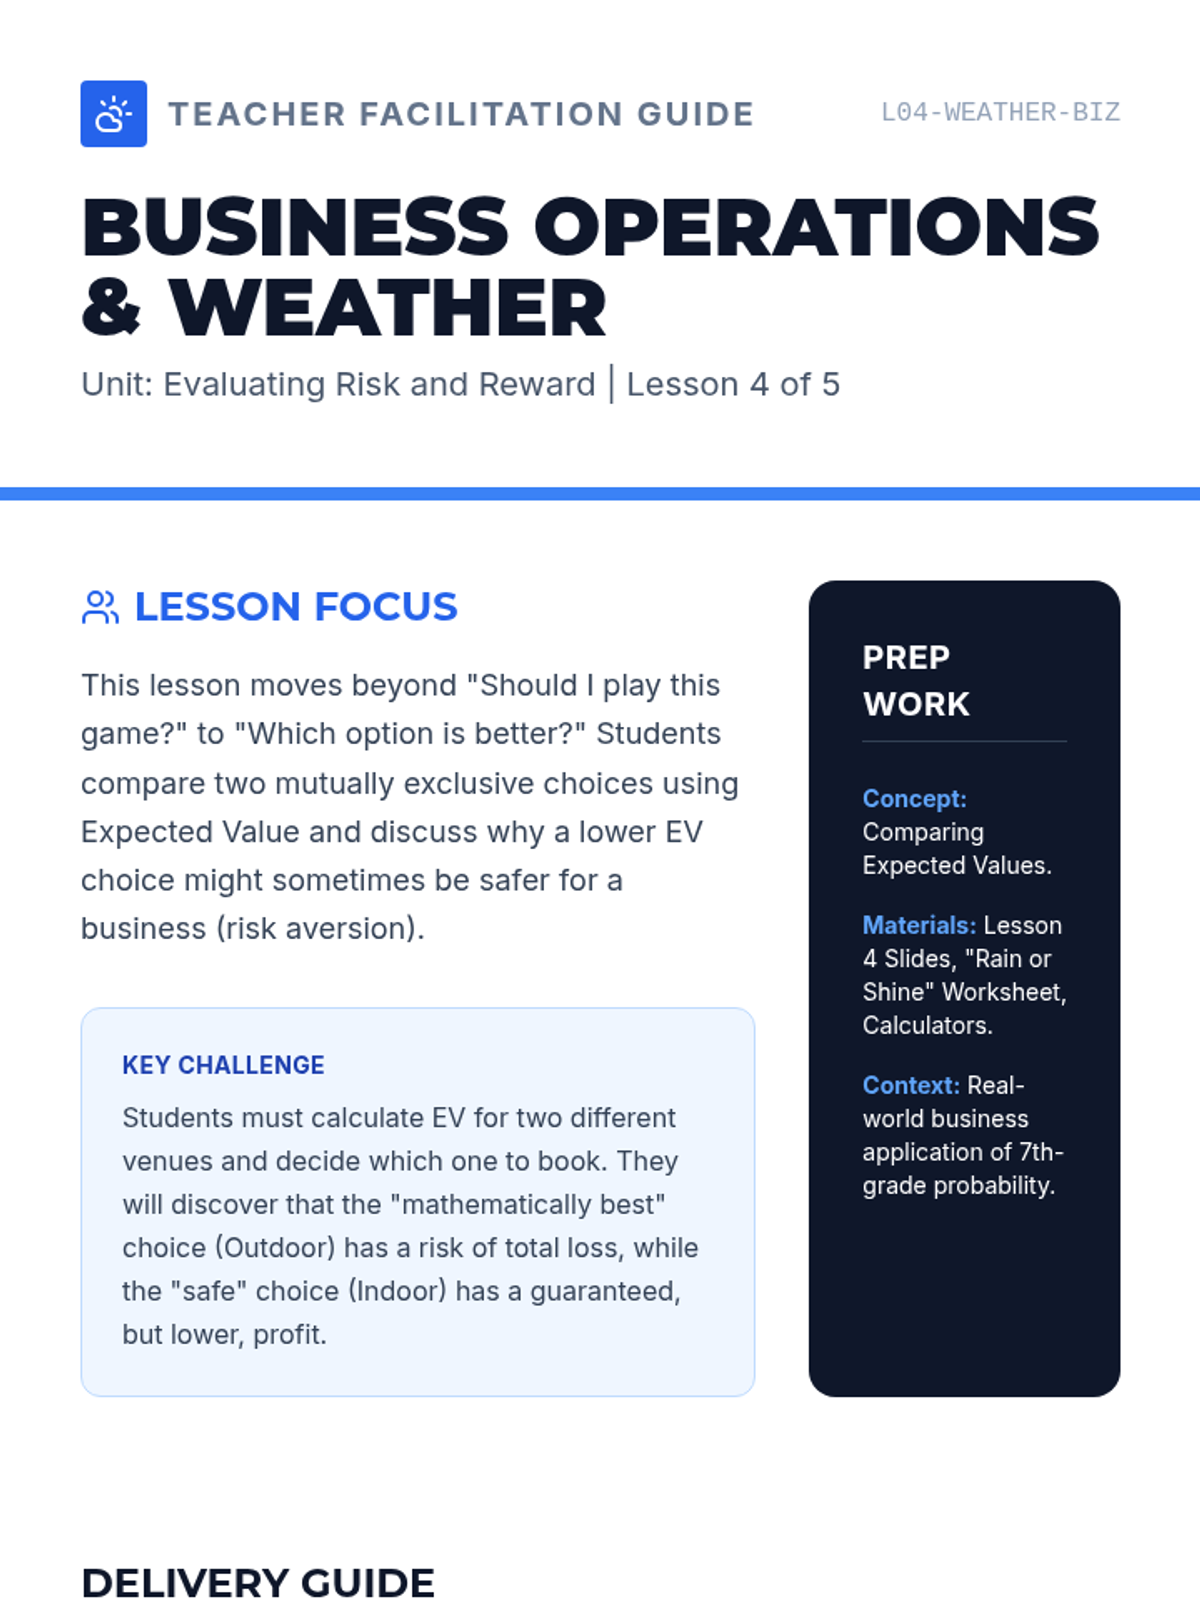
Student worksheet for Lesson 4, comparing two business locations based on weather forecasts and expected profit.
Introductory slides for Lesson 5 on simulations and forecasting. Explains the concept of thousands of trials and how they lead to confidence levels in predictions.
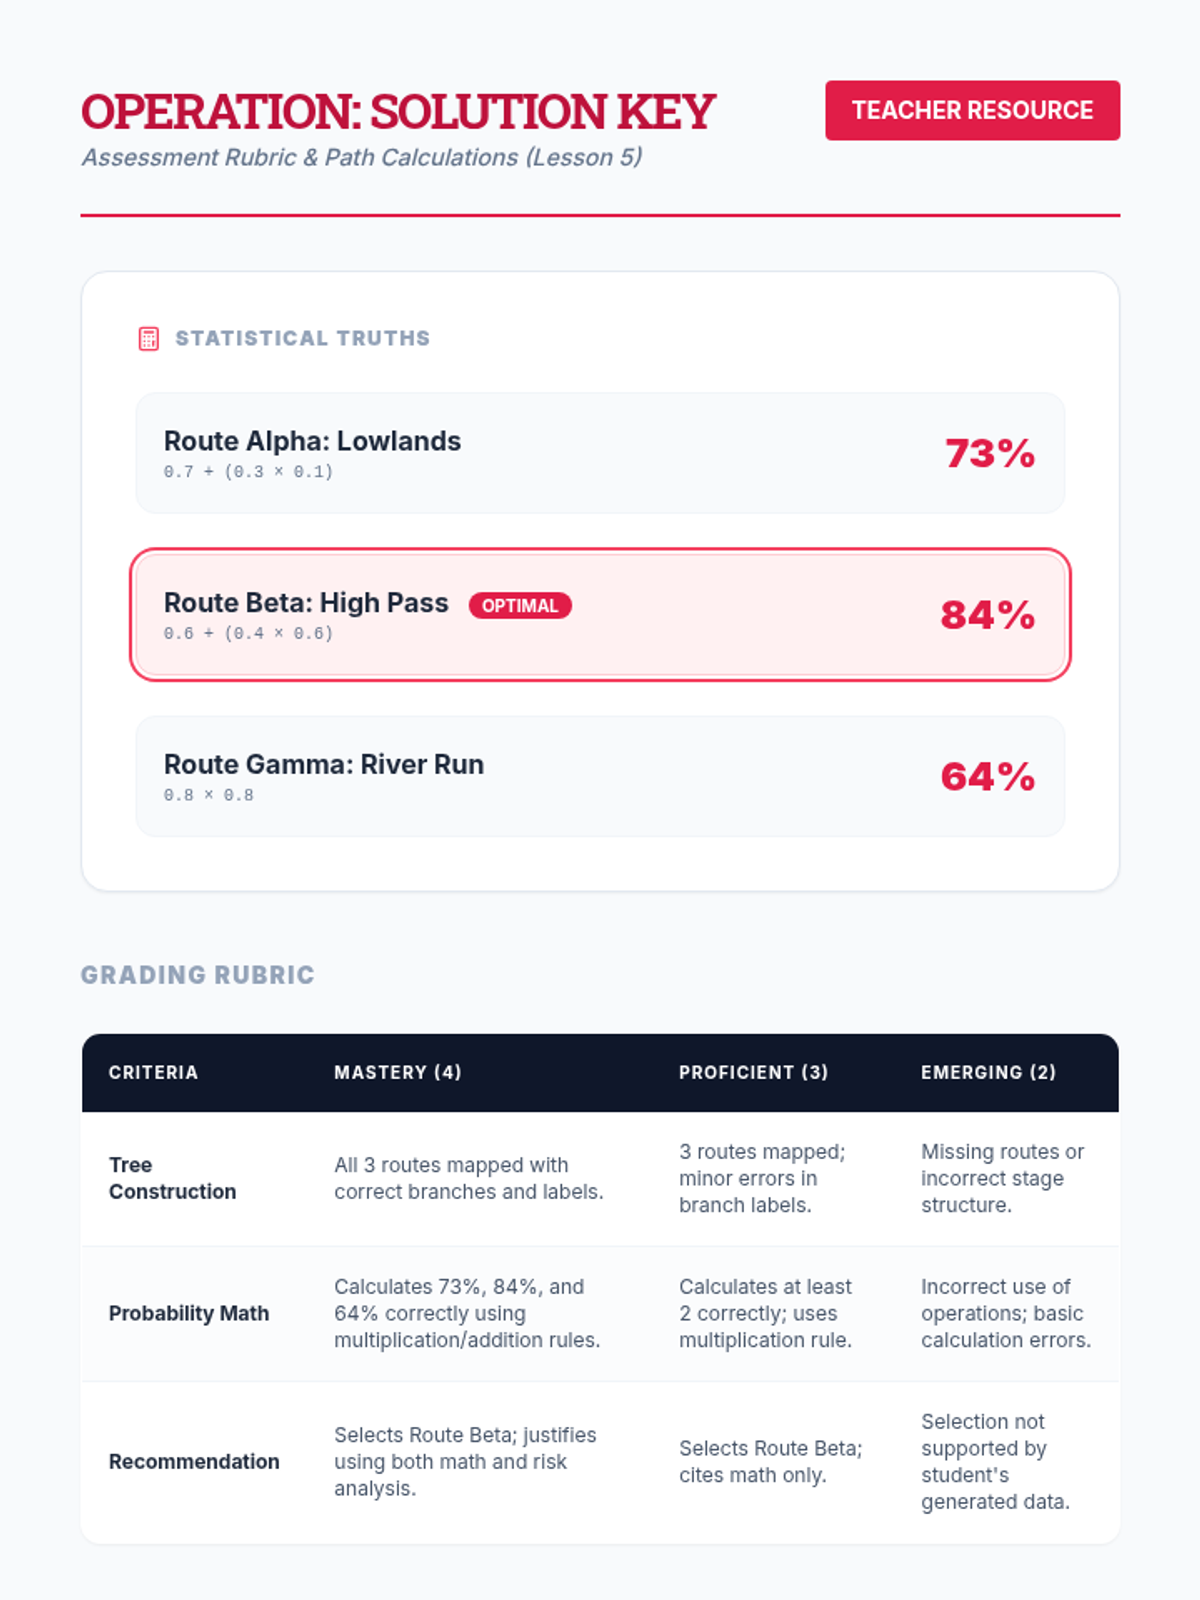
Answer key and grading rubric for the Lesson 5 assessment, including detailed success probability calculations for all three disaster relief routes.
Teacher facilitation guide for Lesson 4, providing instructional steps for comparing business scenarios using expected value.
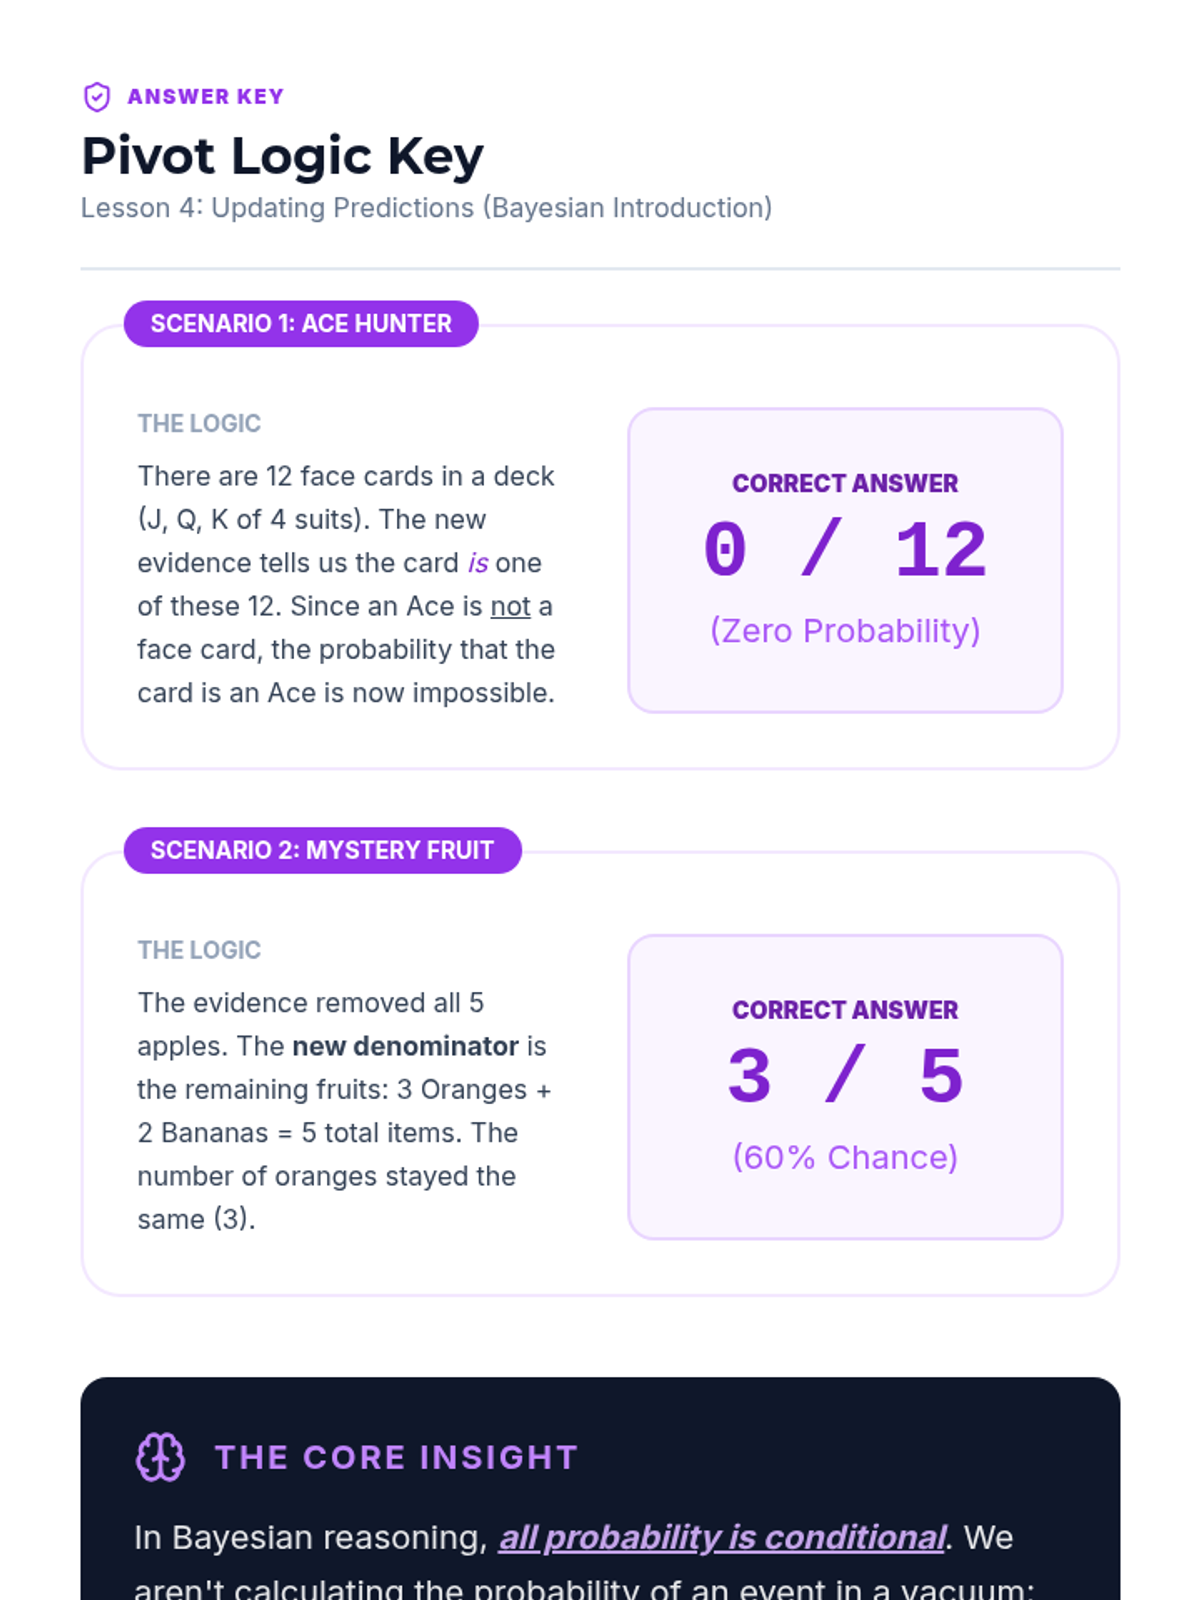
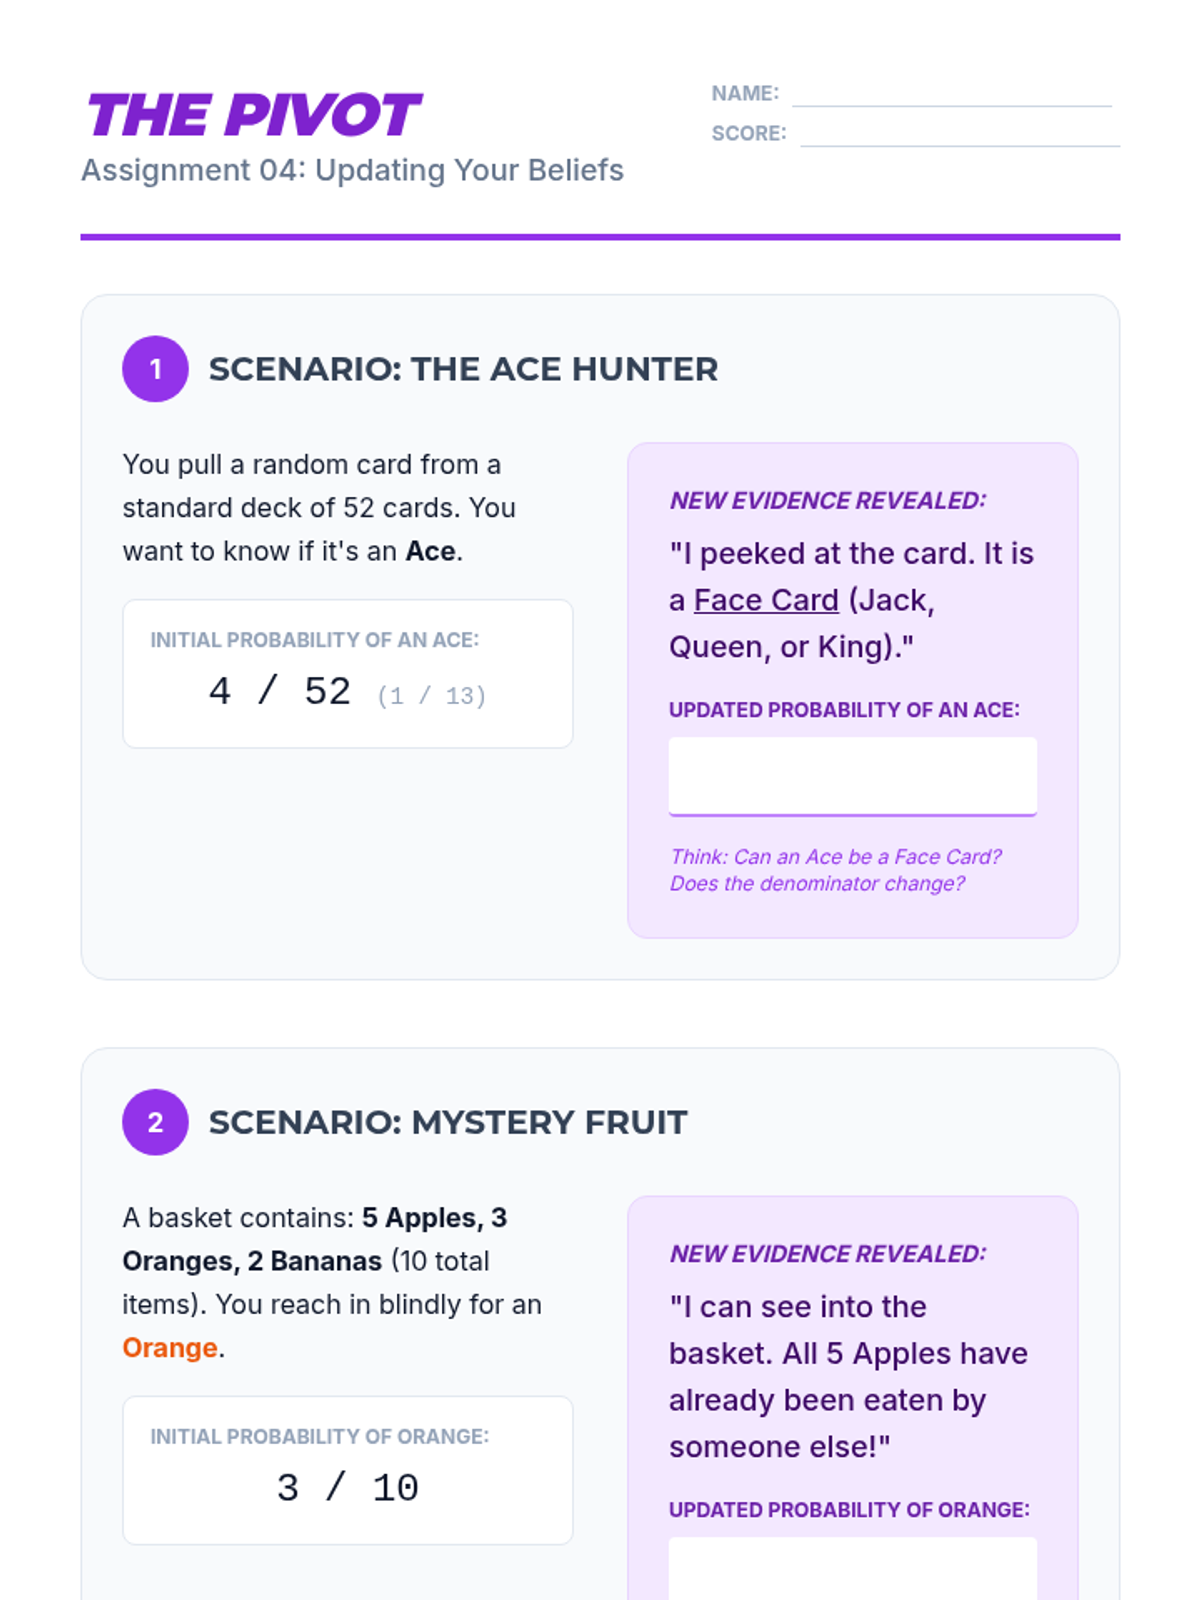
Teacher answer key for the Prediction Pivot worksheet. Provides logical breakdowns for why probability updates when denominators change or evidence rules out outcomes.
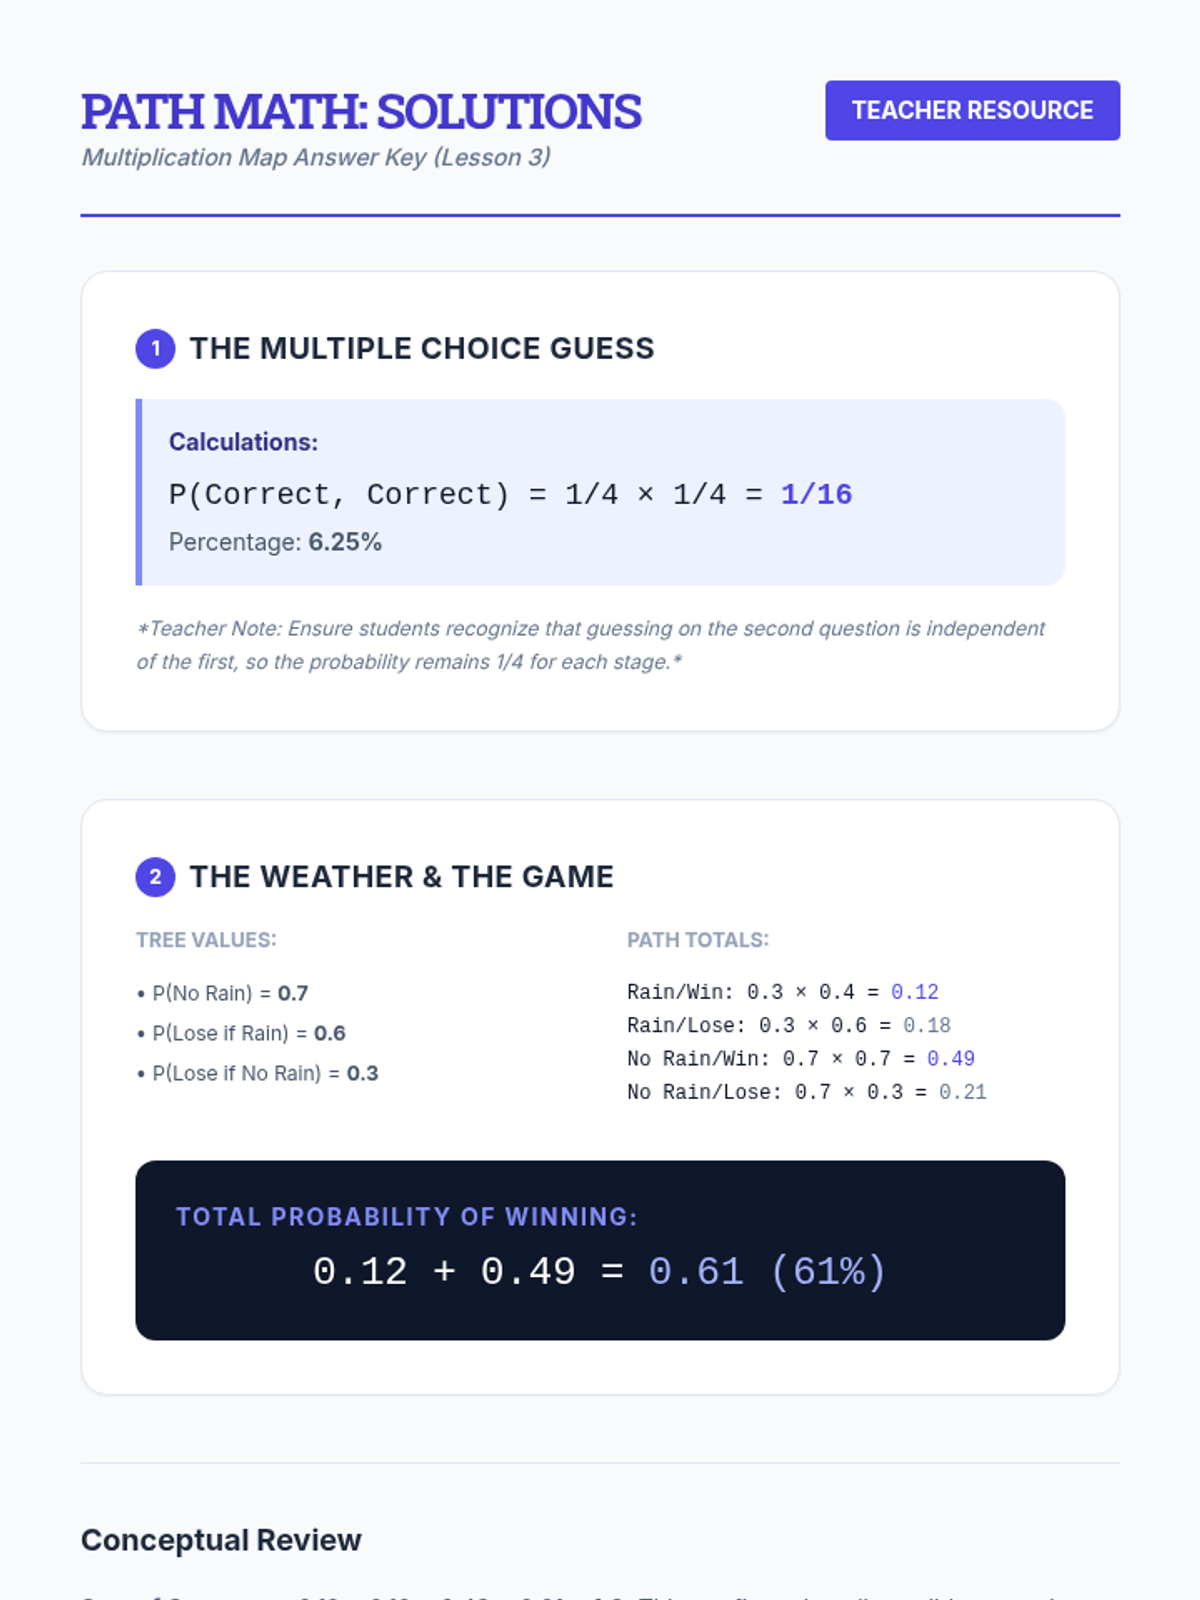
Answer key for the Lesson 3 worksheet, providing the correct path calculations and totals for the quiz and weather scenarios.
Introductory slide deck for Lesson 4, introducing expected value in business scenarios and comparing multiple choices.
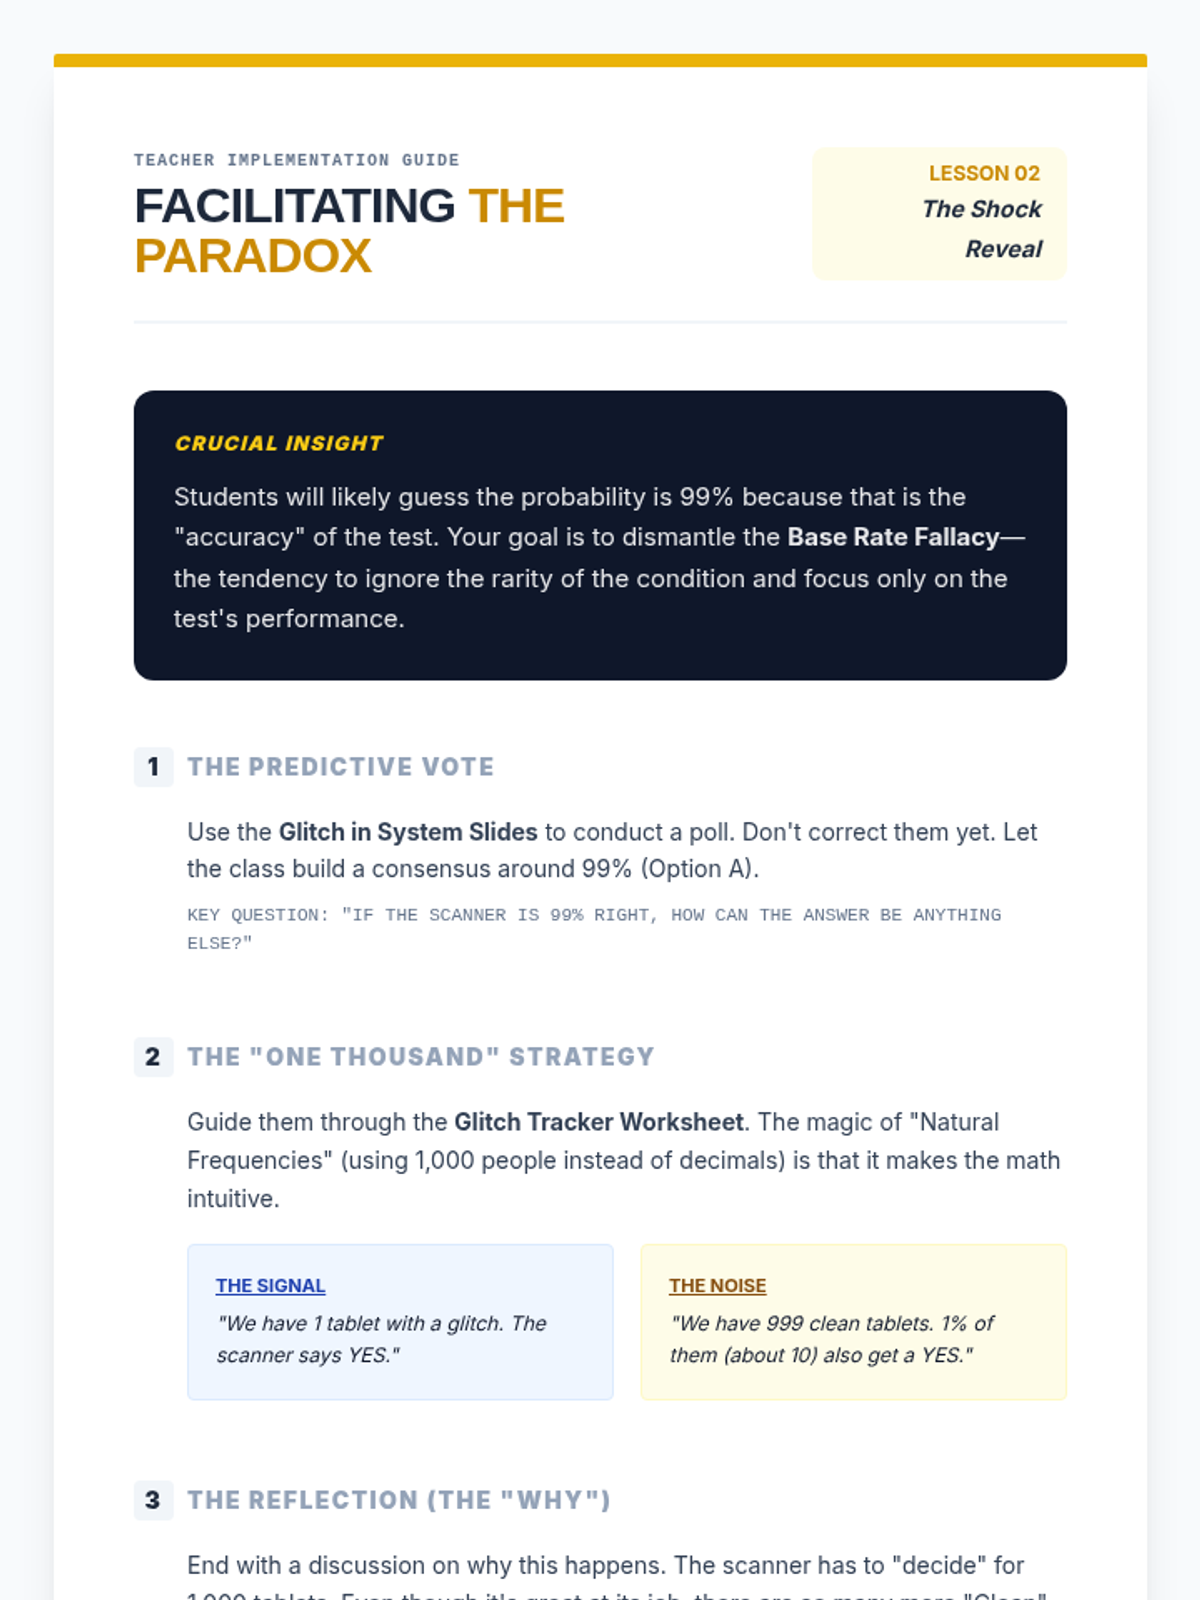
Teacher guide for Lesson 2, providing instructional scripts and pedagogical insights into the False Positive Paradox and the Base Rate Fallacy. Includes strategies for guiding students through the 'Shock Reveal' simulation.
A student worksheet introducing conditional probability updates. Students work through scenarios where they must calculate initial probability and then adjust their calculation based on new, limiting evidence.
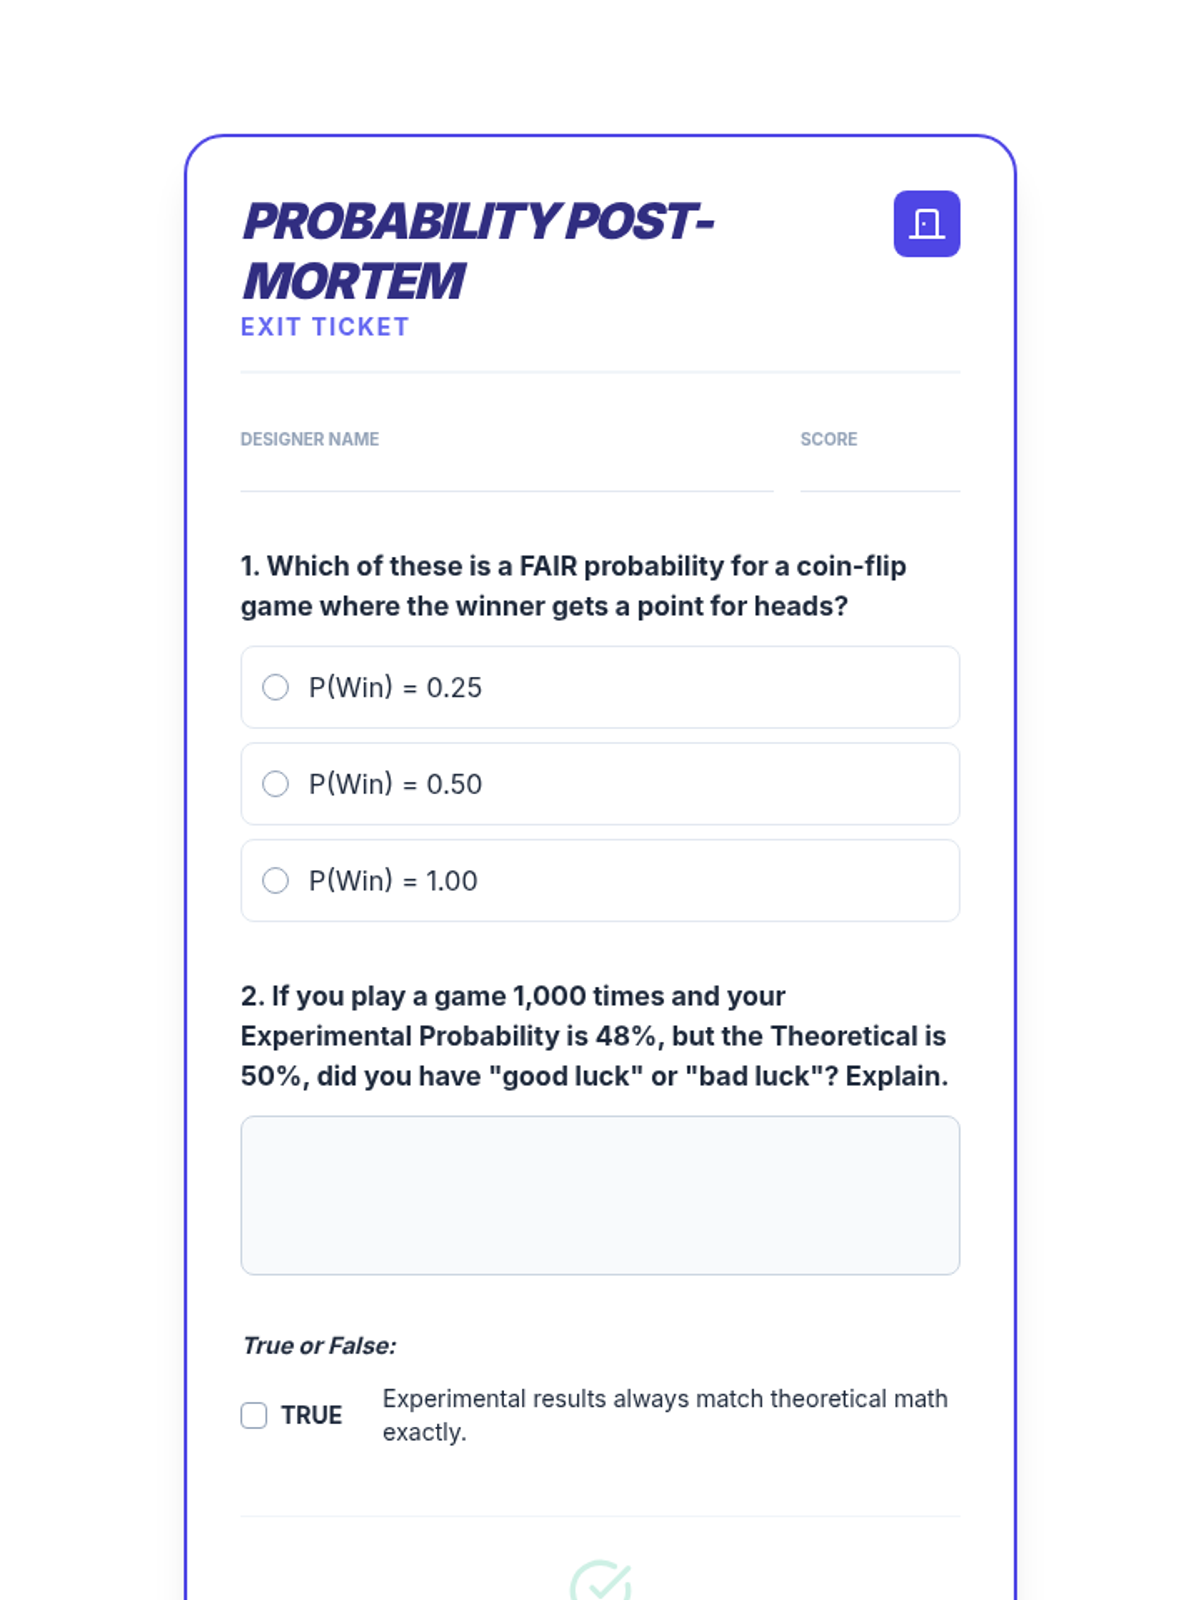
Final exit ticket for the sequence, assessing students' ability to define fairness and compare theoretical versus experimental results.
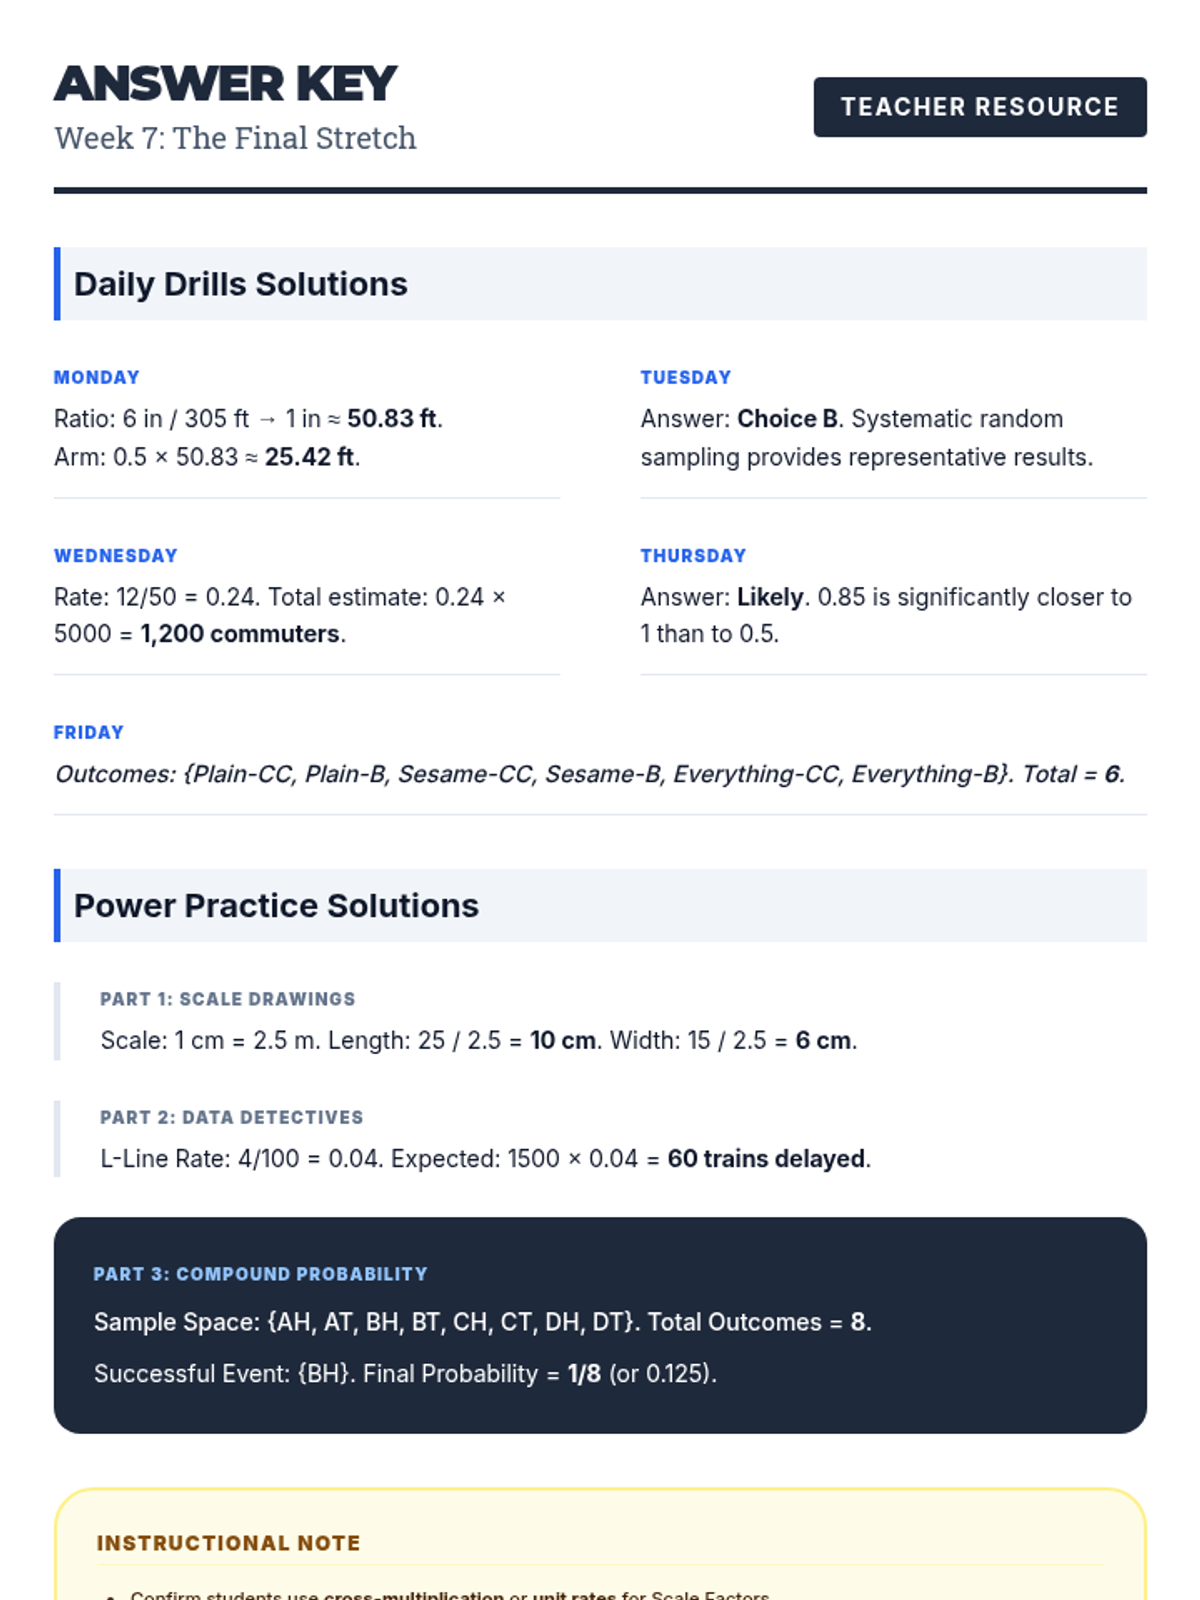
Teacher's answer key for Week 7 (Final Stretch) Daily Drills and Power Practice worksheets.
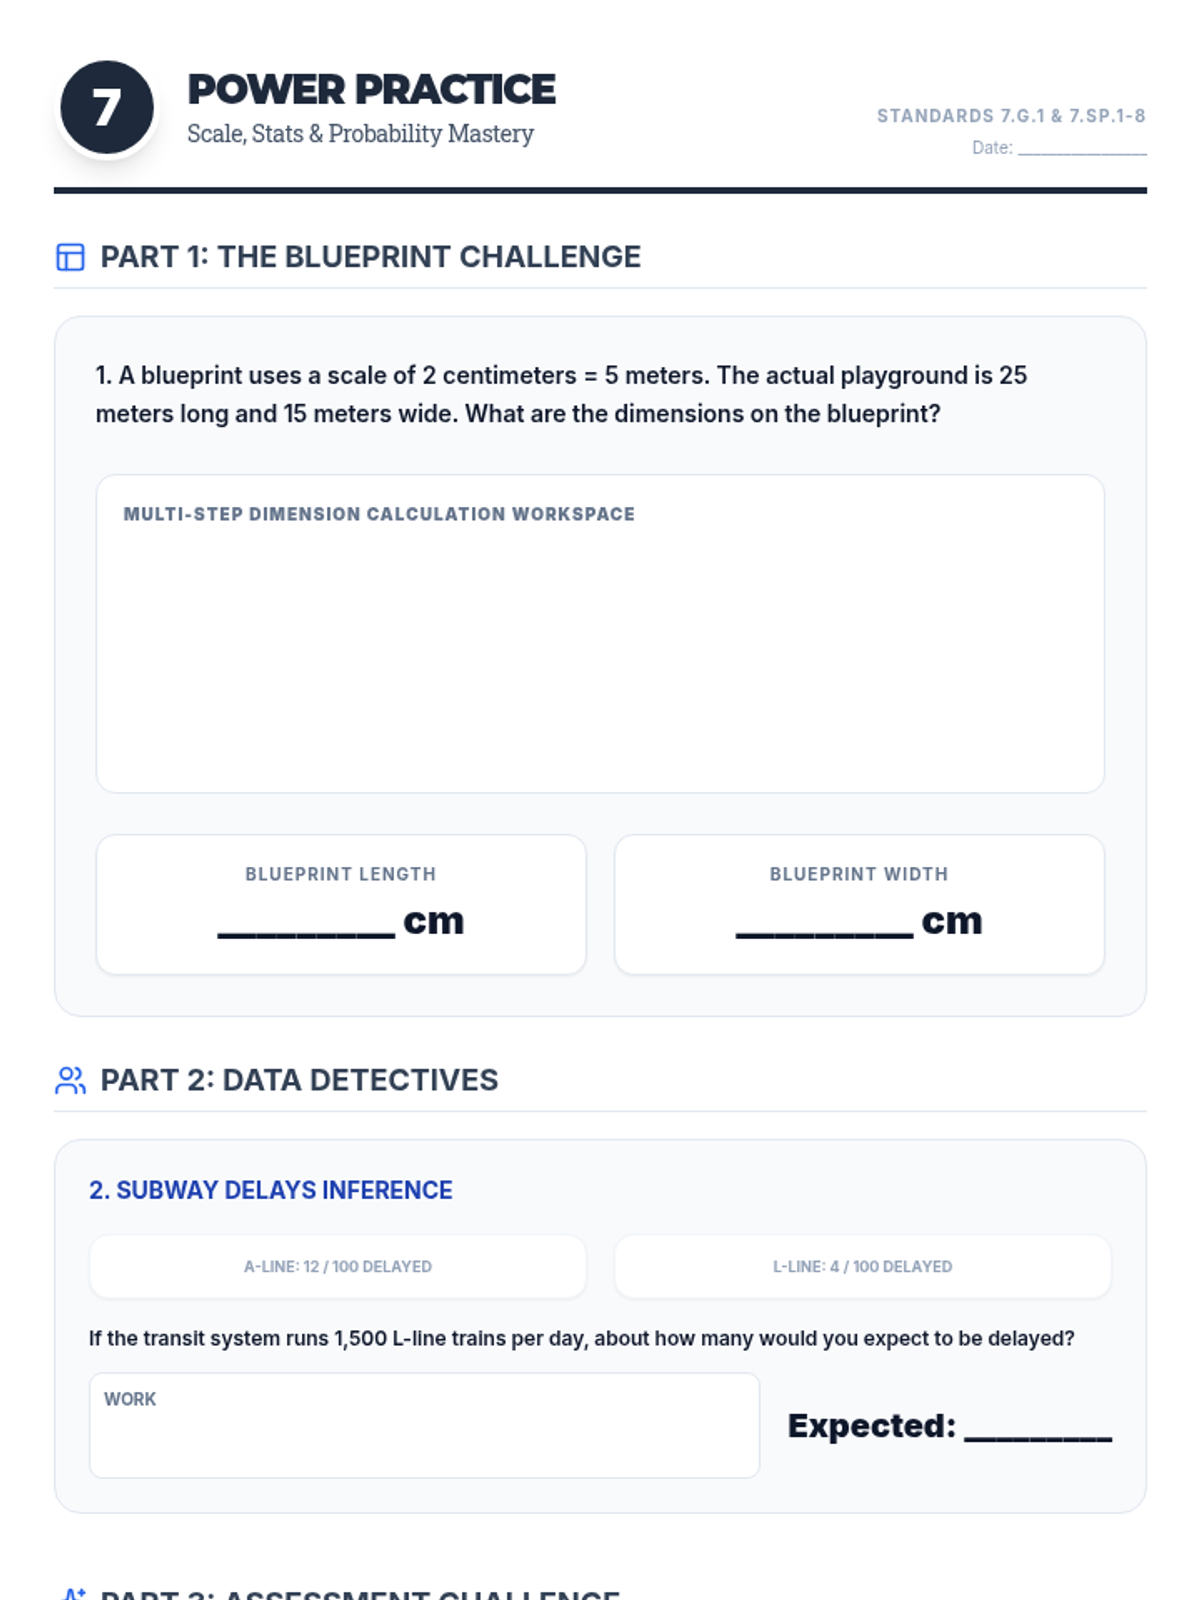
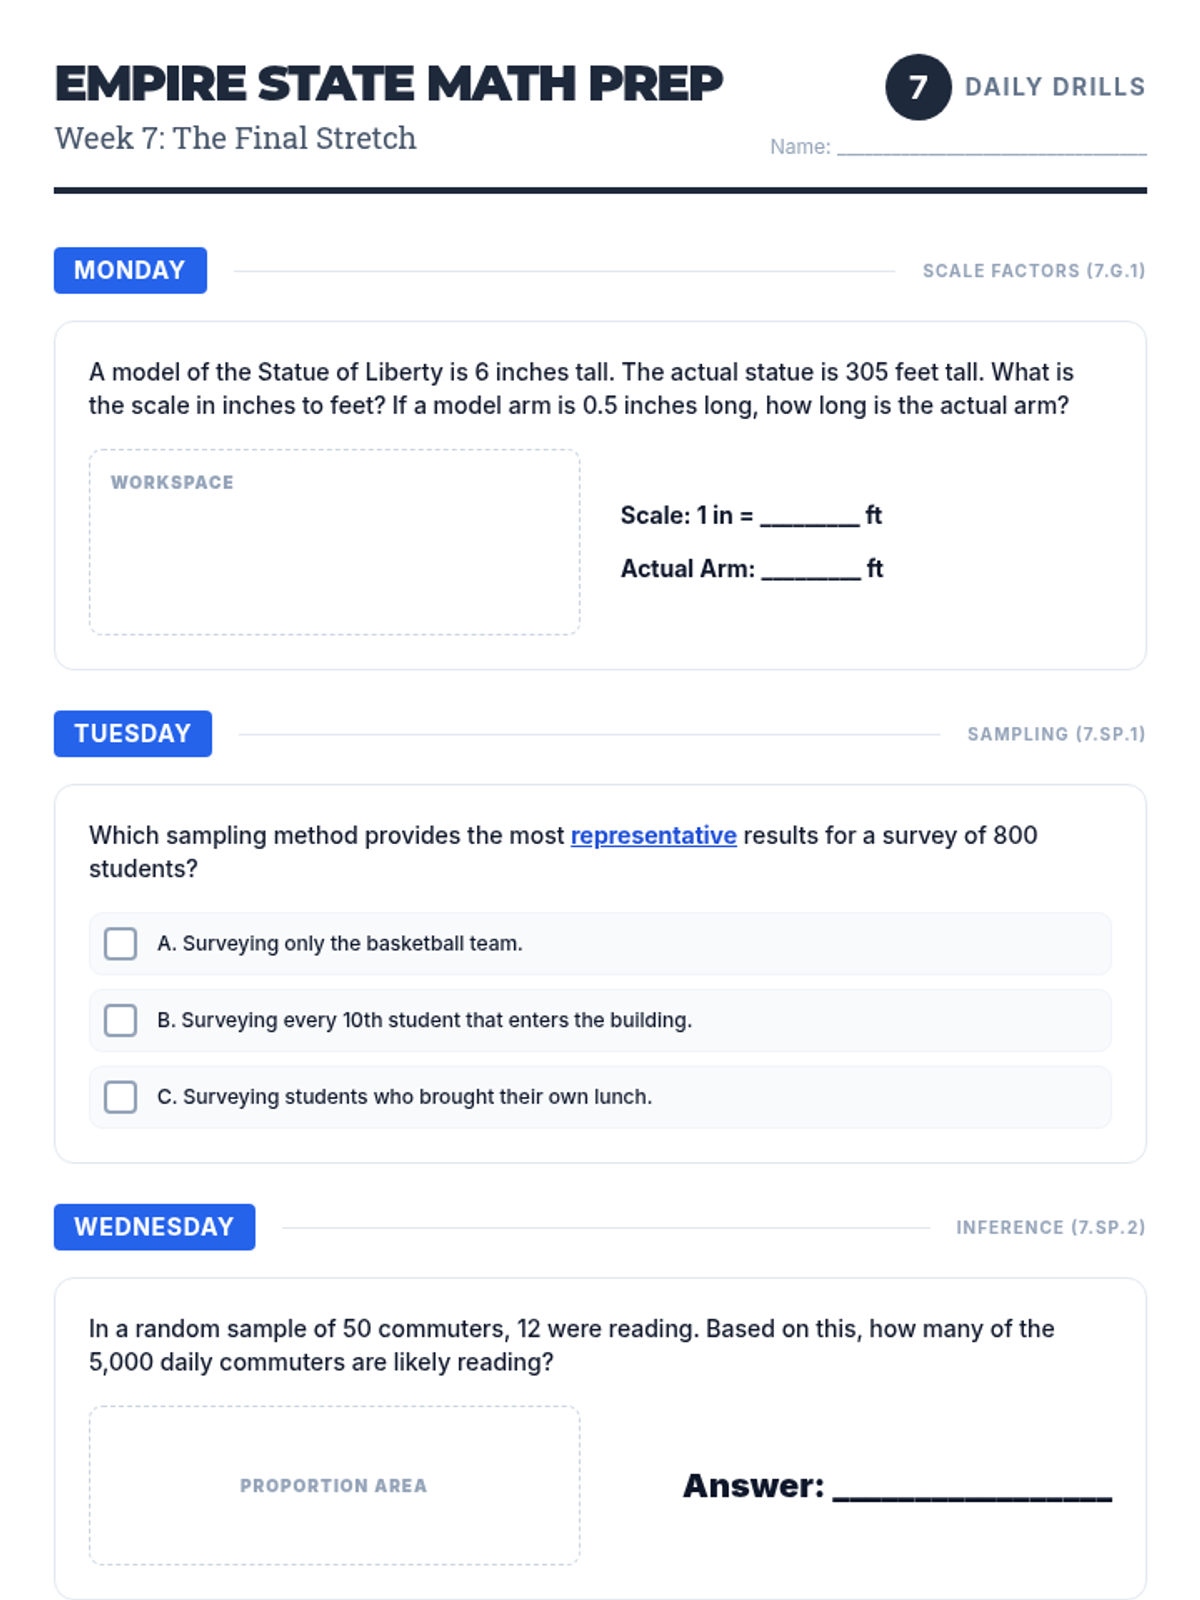
A comprehensive practice set for Week 7 (Final Stretch), covering scale drawings, comparative statistics, and compound probability.
A 5-day warm-up worksheet for Week 7, covering scale factors, statistics sampling, inference, and probability basics.
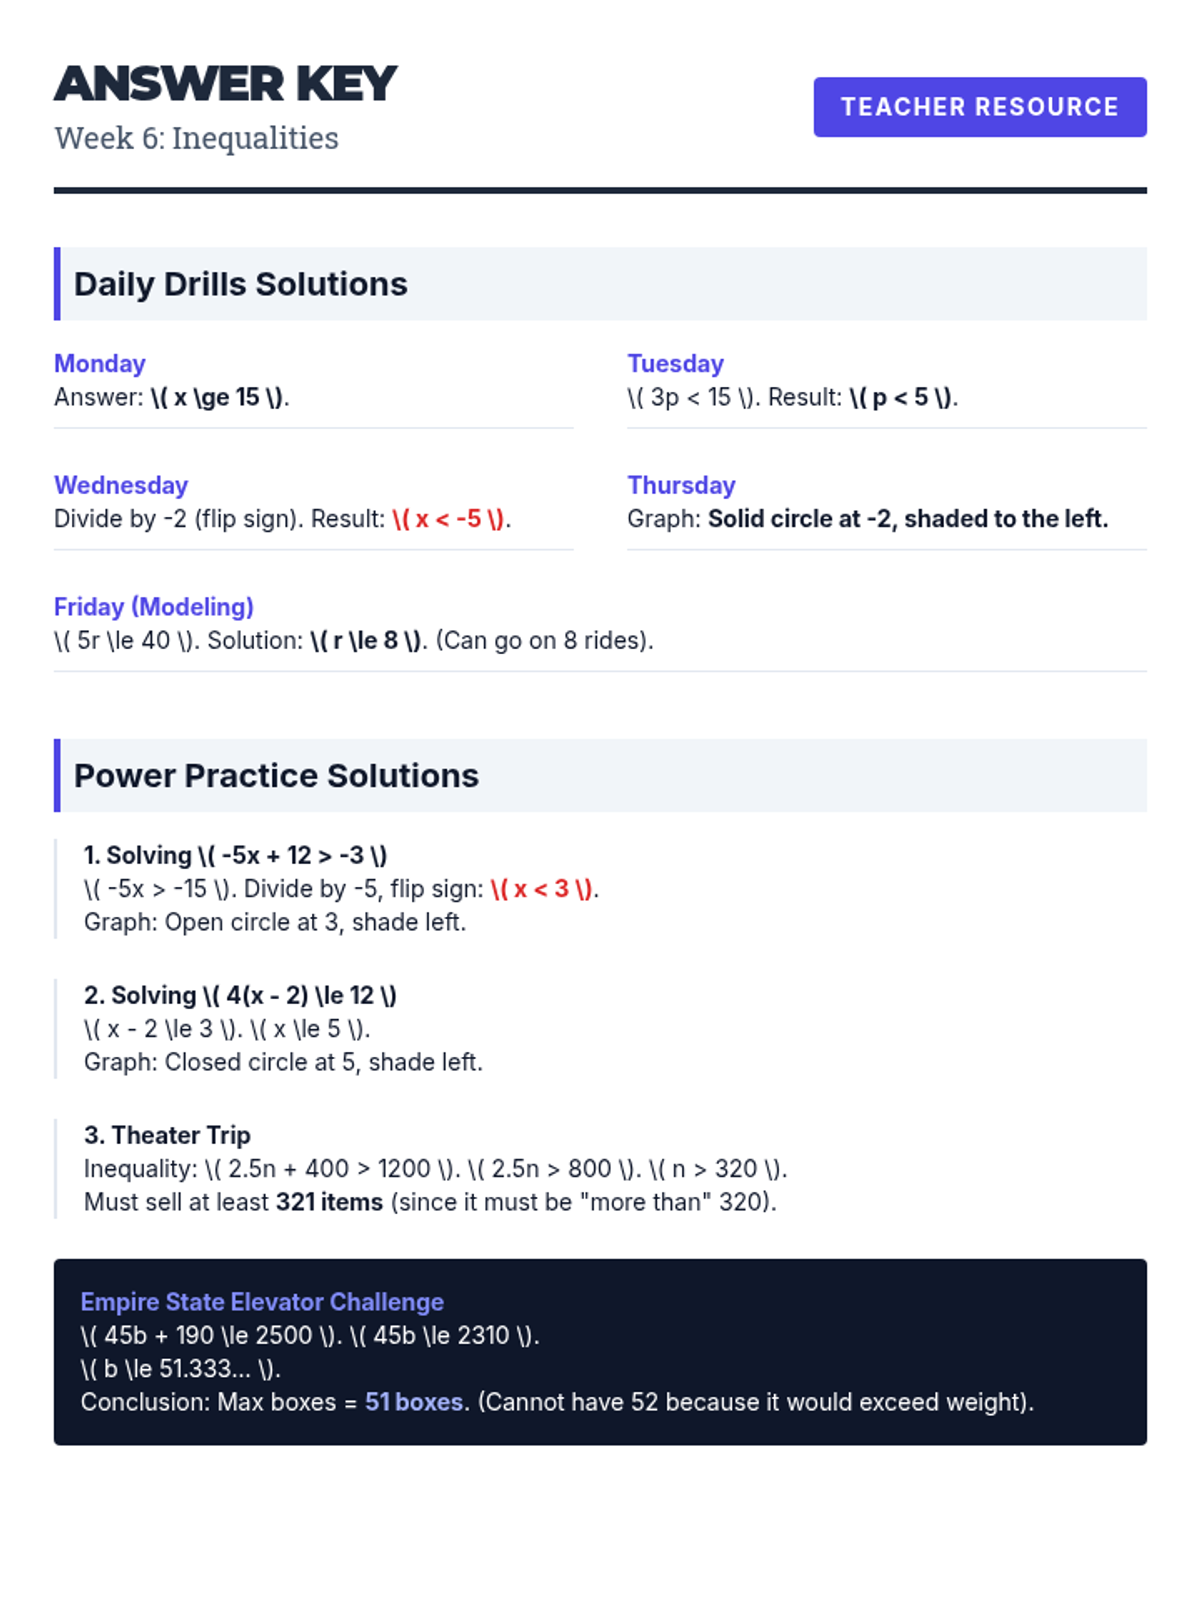
Teacher's answer key for Week 6 (Inequalities) Daily Drills and Power Practice worksheets.
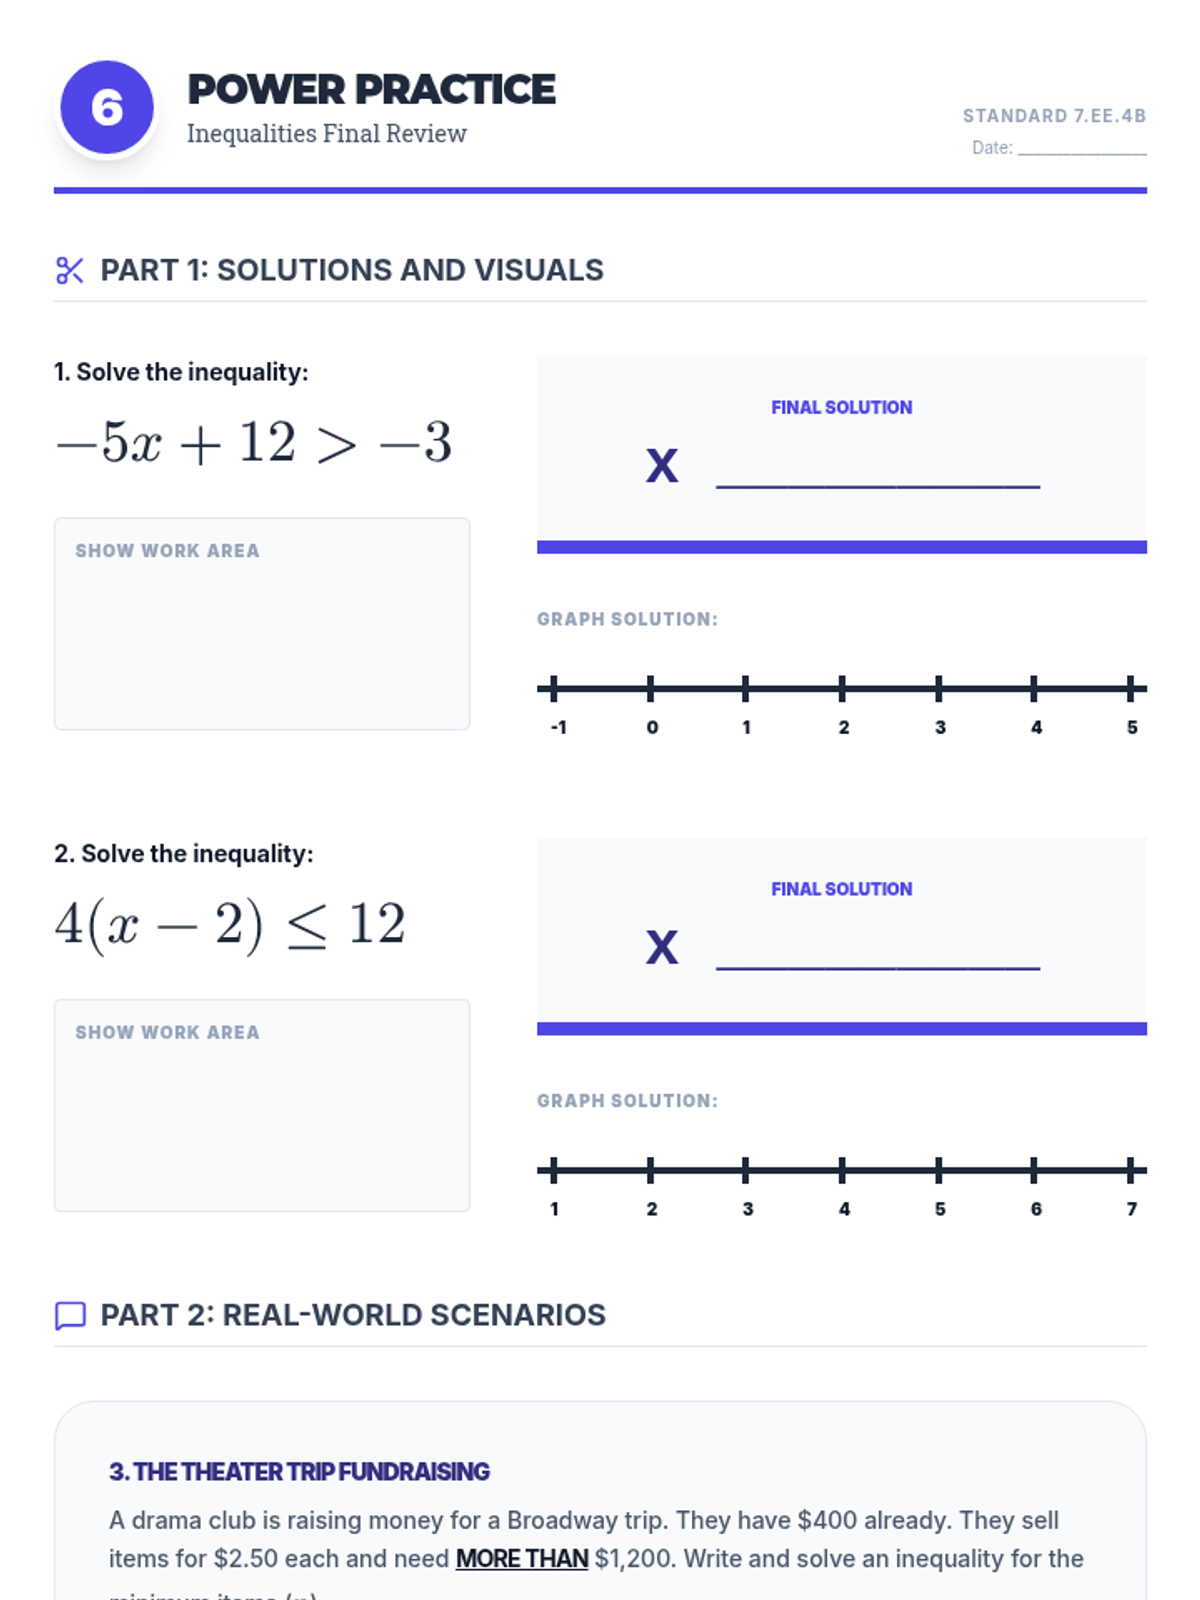
A final comprehensive practice set for Week 6 (Inequalities), including multi-step solving, graphing on number lines, and real-world New York-themed modeling.
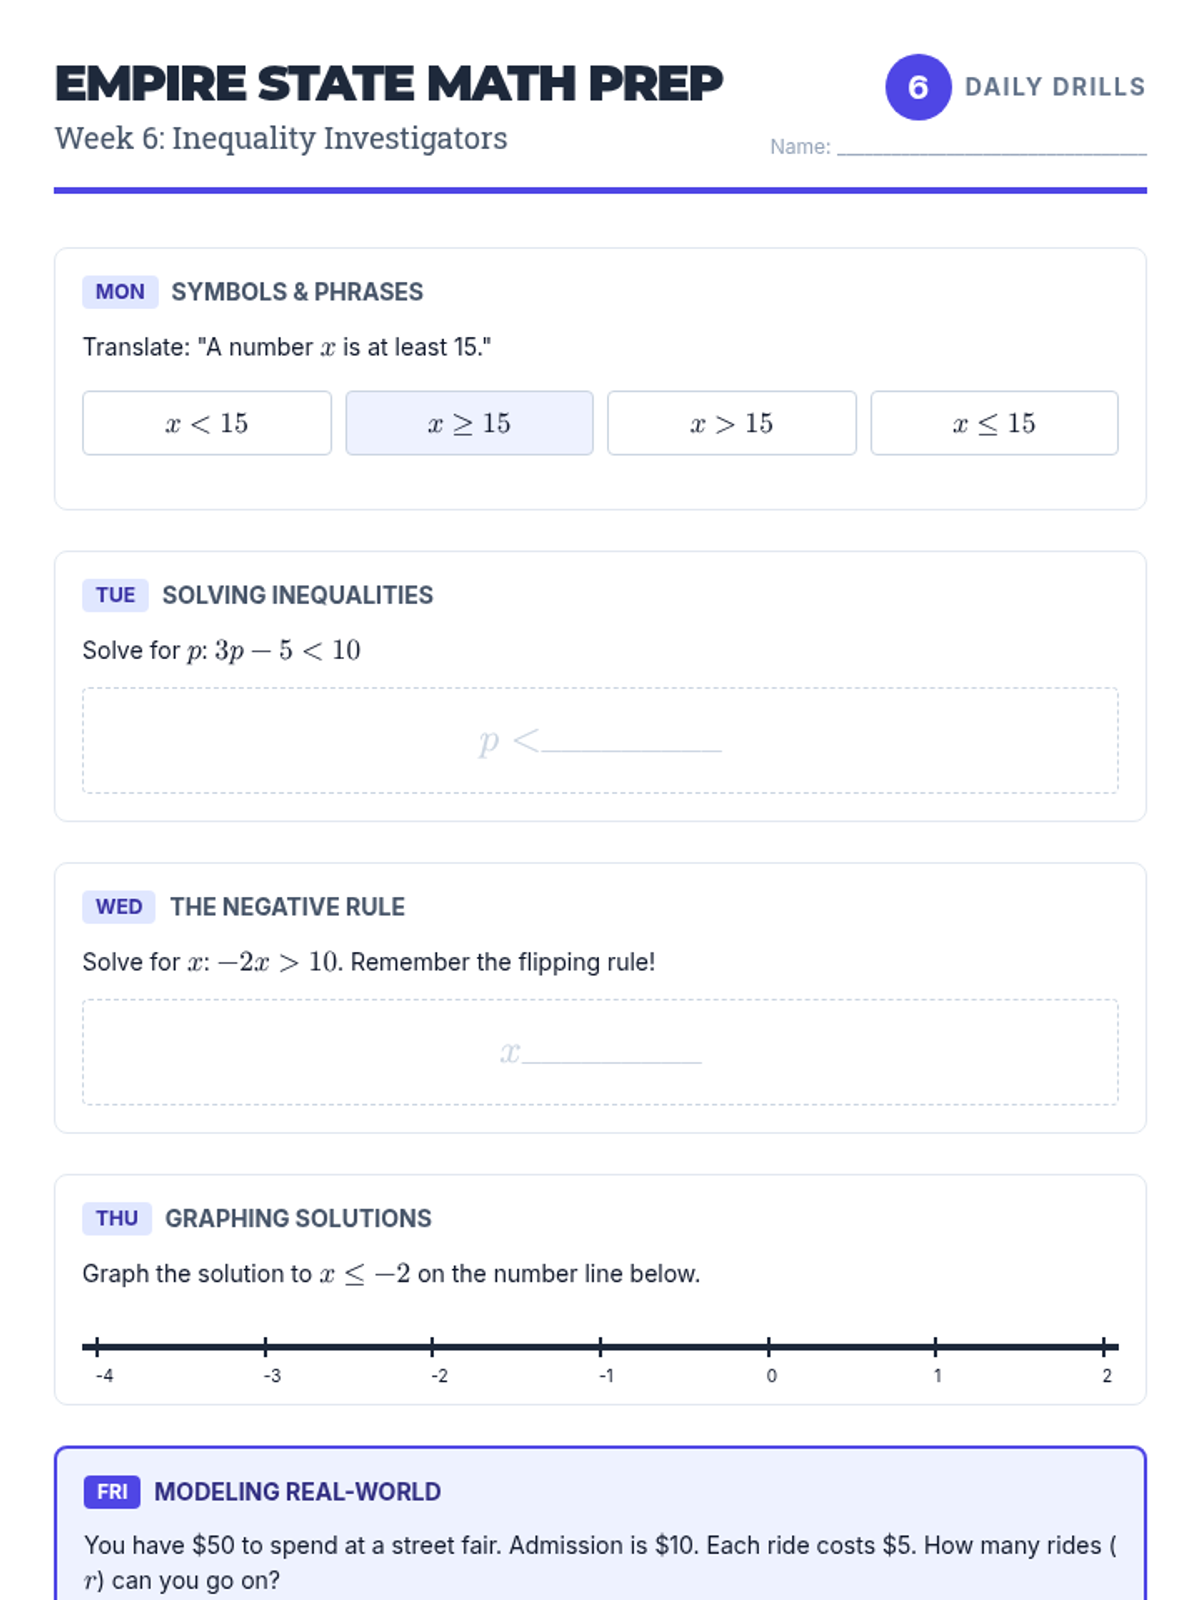
A 5-day warm-up worksheet for Week 6, focusing on translating, solving, and graphing inequalities, with attention to the negative flipping rule.
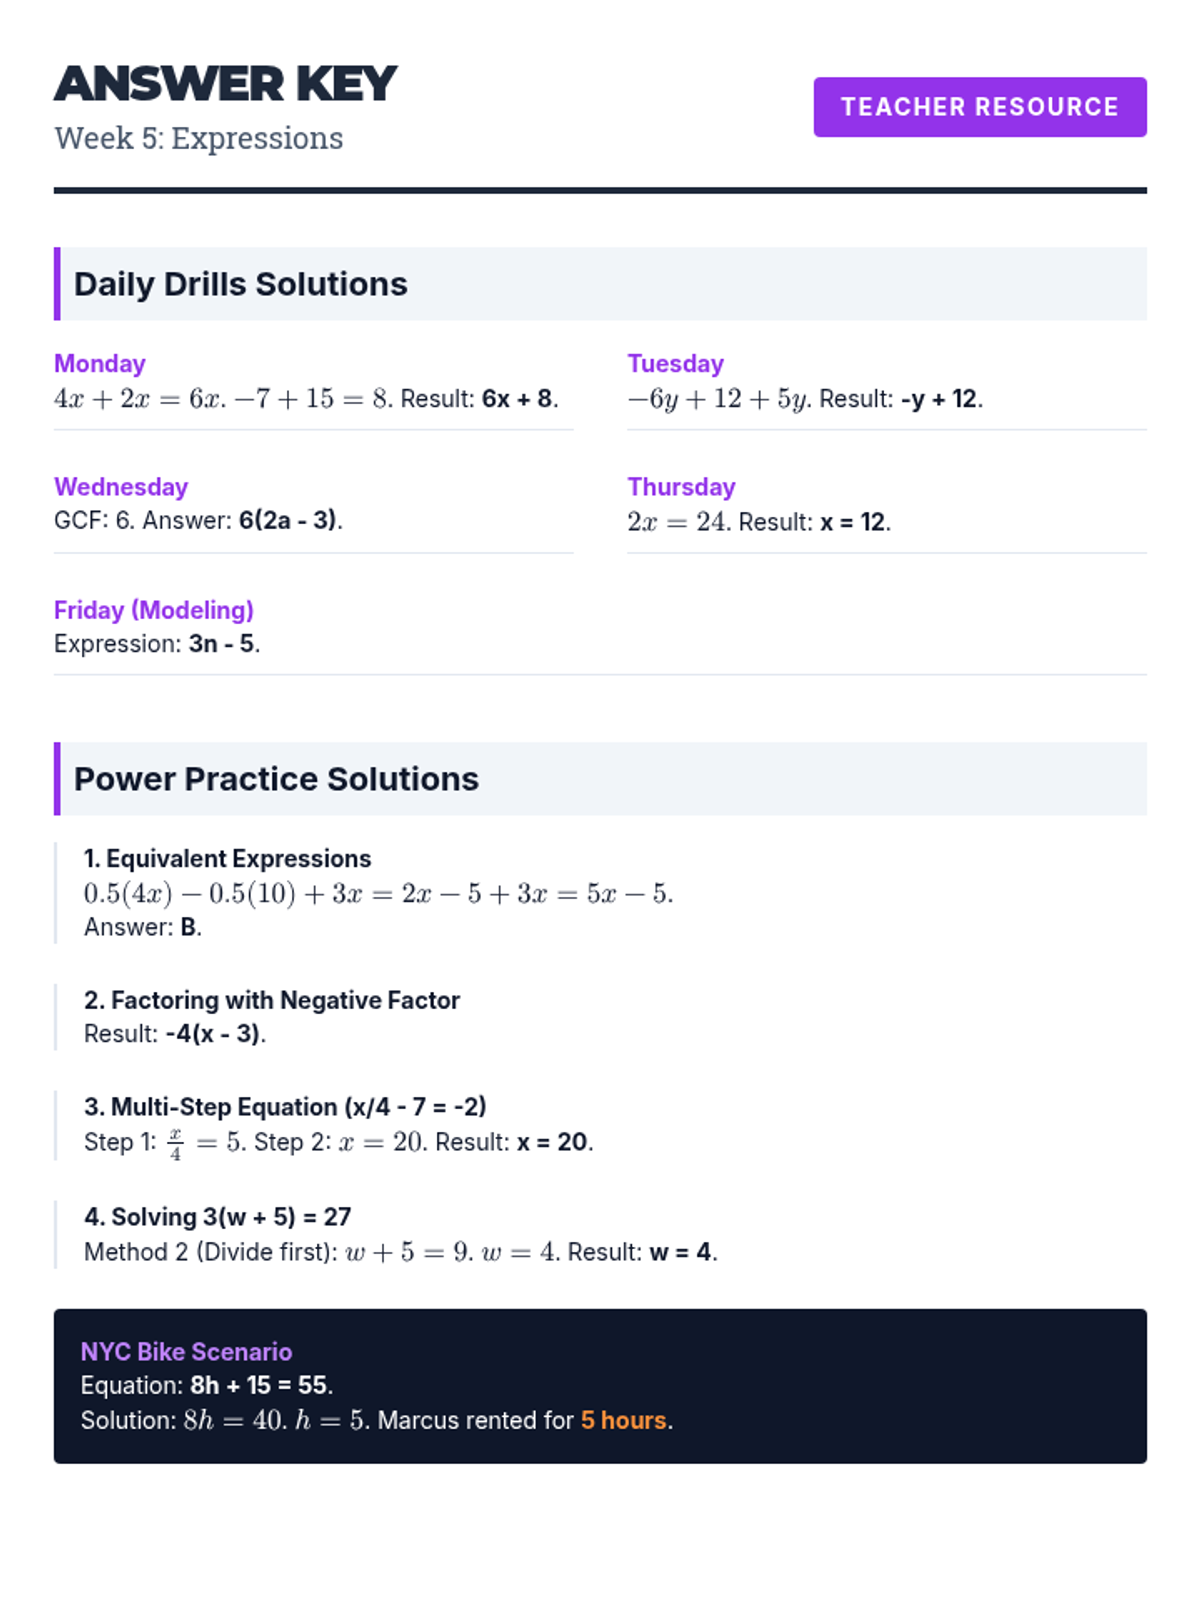
Teacher's answer key for Week 5 (Expressions) Daily Drills and Power Practice worksheets.
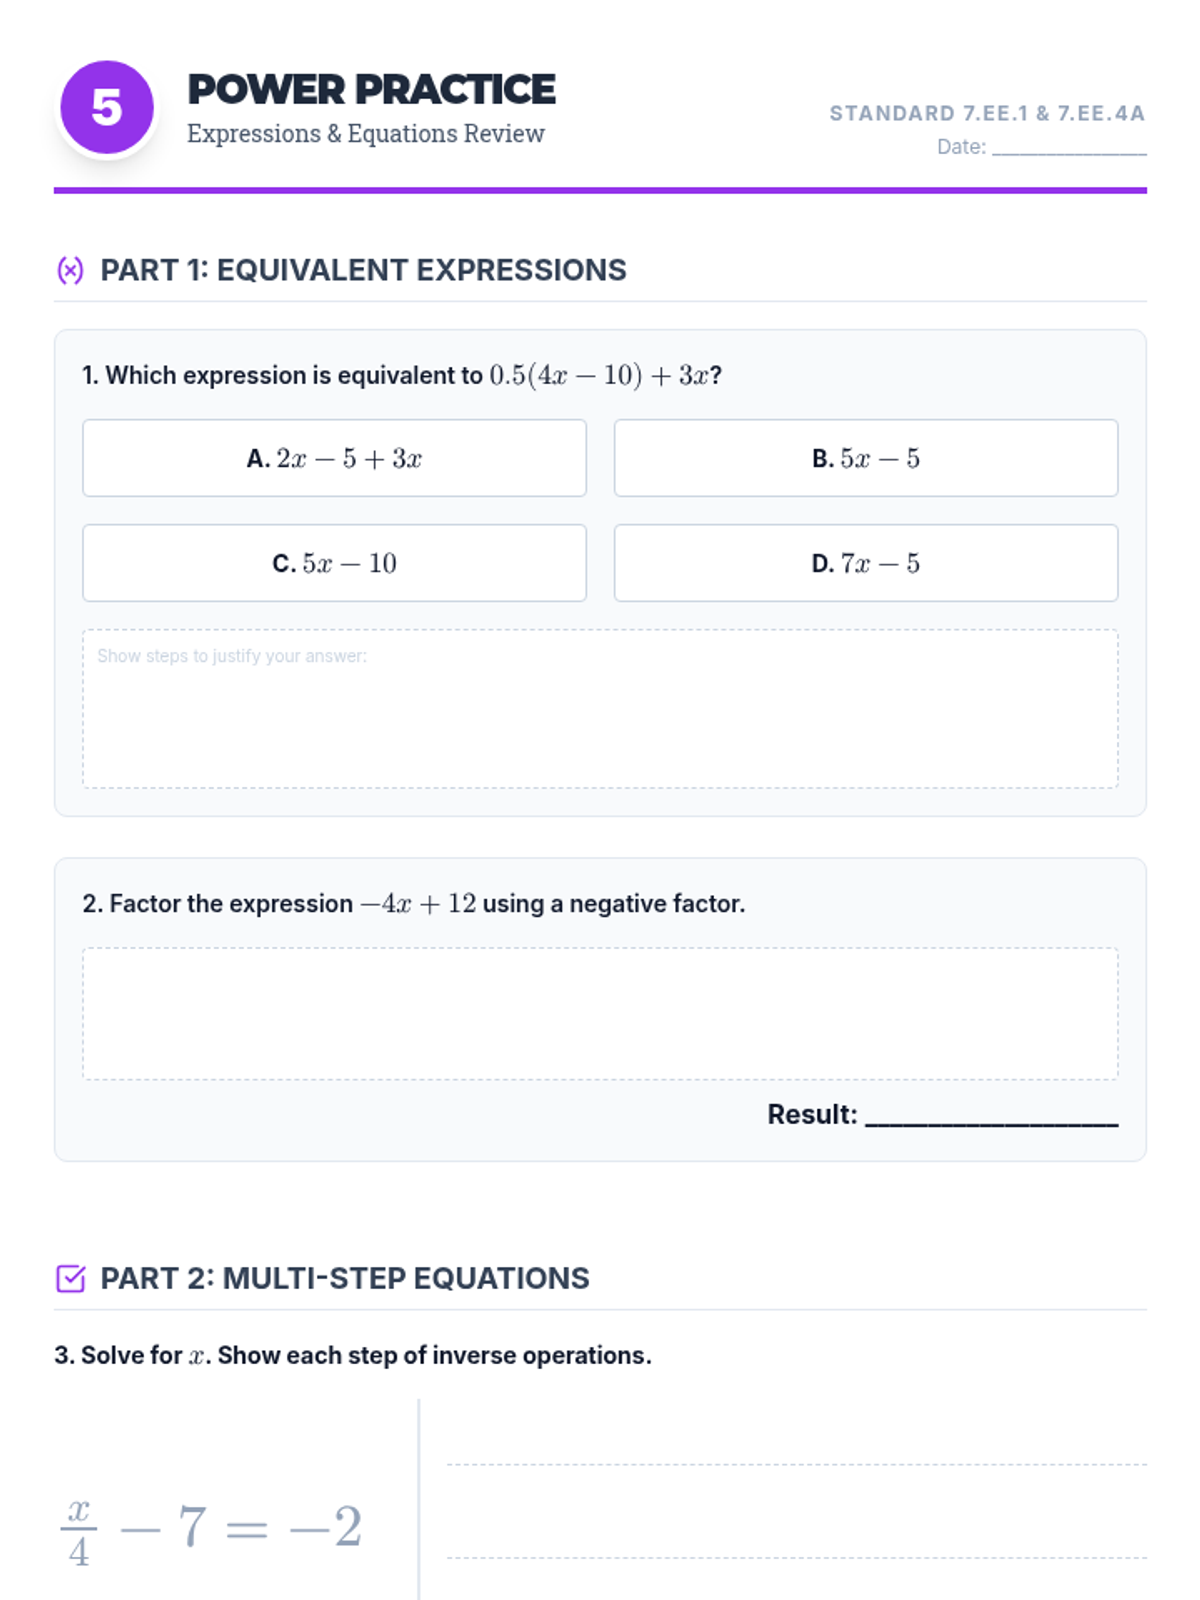
A comprehensive practice set for Week 5 (Expressions), including equivalent expressions, factoring, and solving multi-step equations in context.
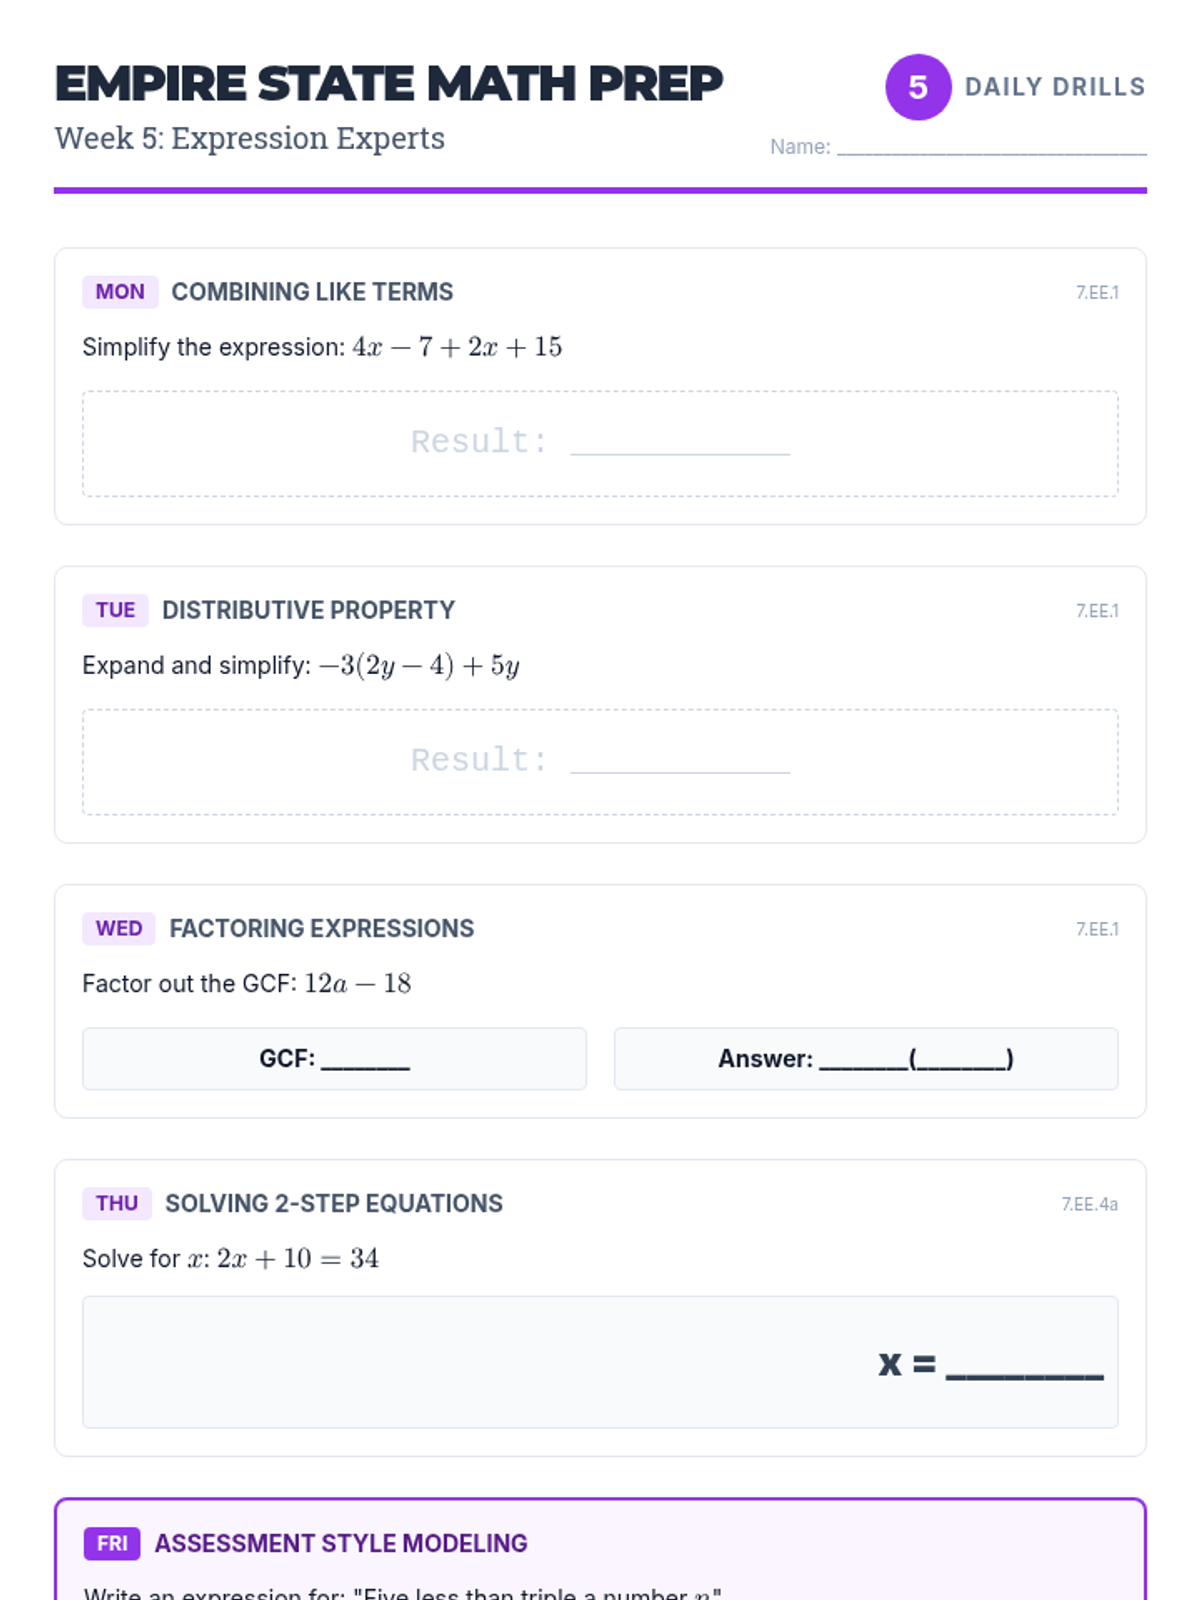
A 5-day warm-up worksheet for Week 5, focusing on simplifying, factoring, expanding expressions, and solving 2-step equations.
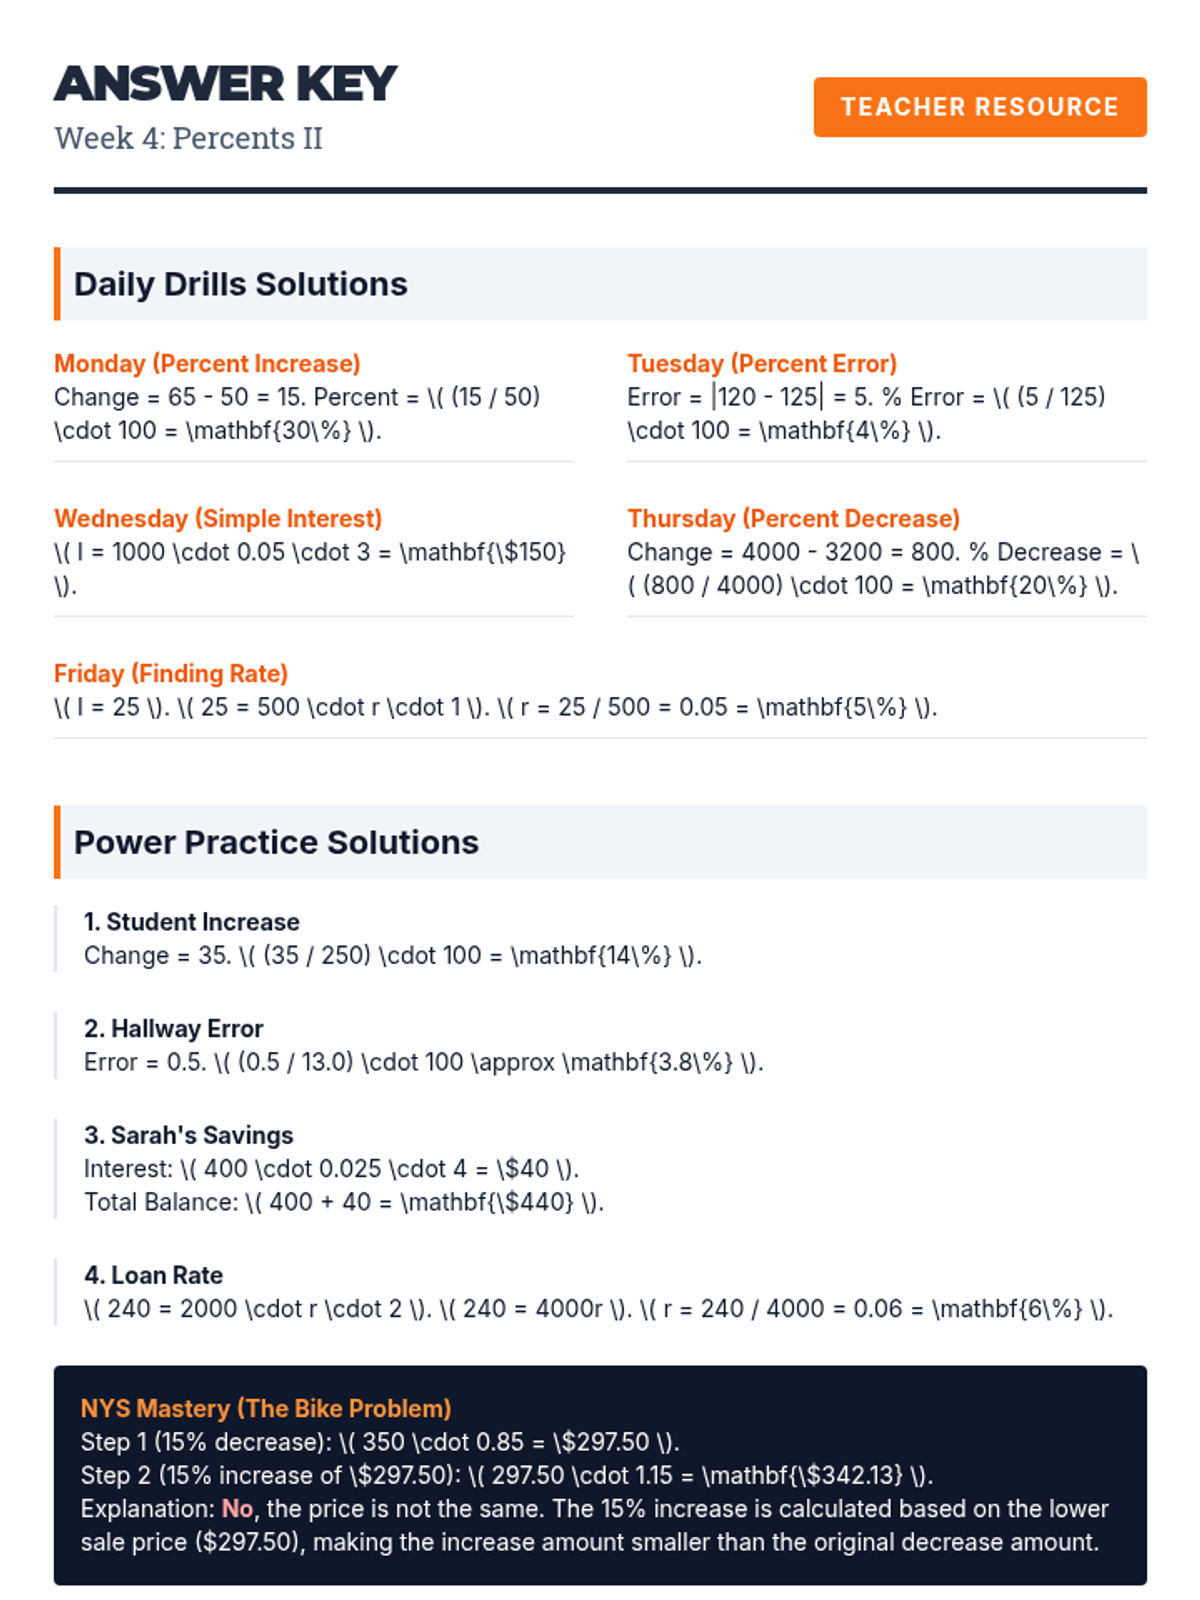
Teacher's answer key for Week 4 (Percents II) Daily Drills and Power Practice worksheets.
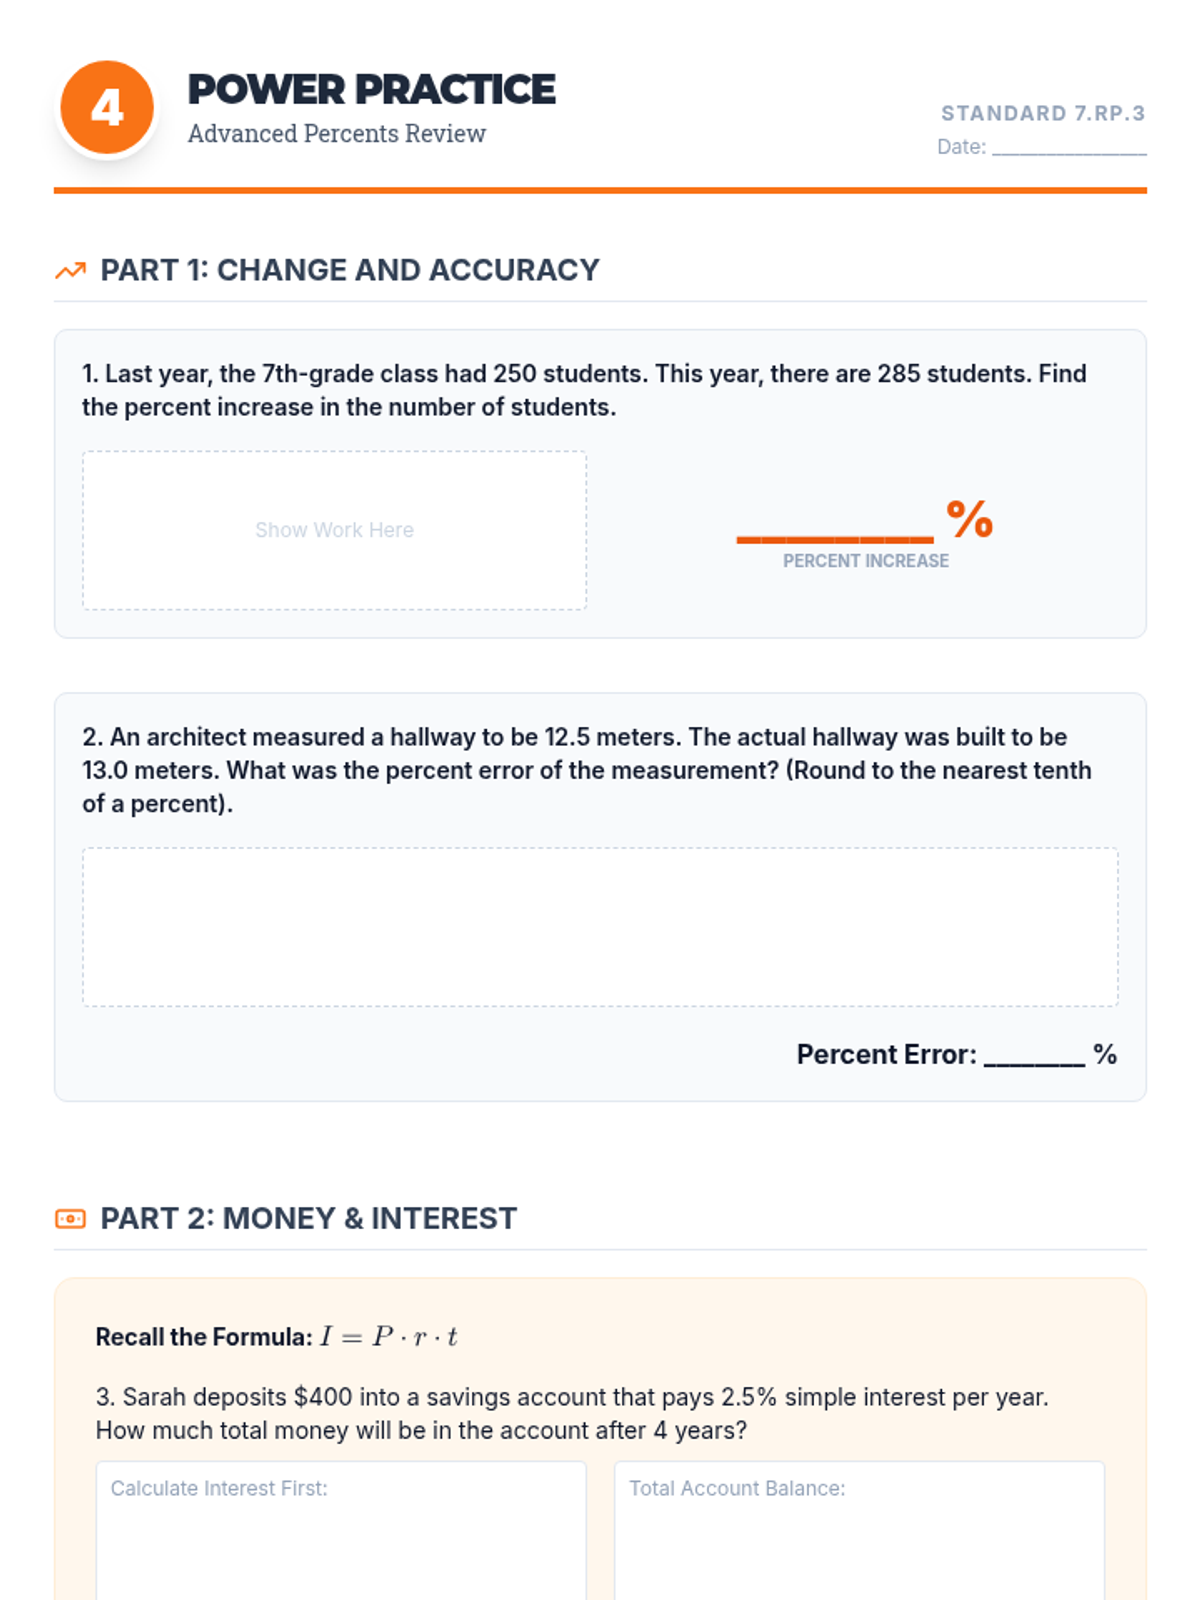
A comprehensive practice set for Week 4 (Percents II), covering percent increase/decrease, percent error, and multi-step simple interest problems.
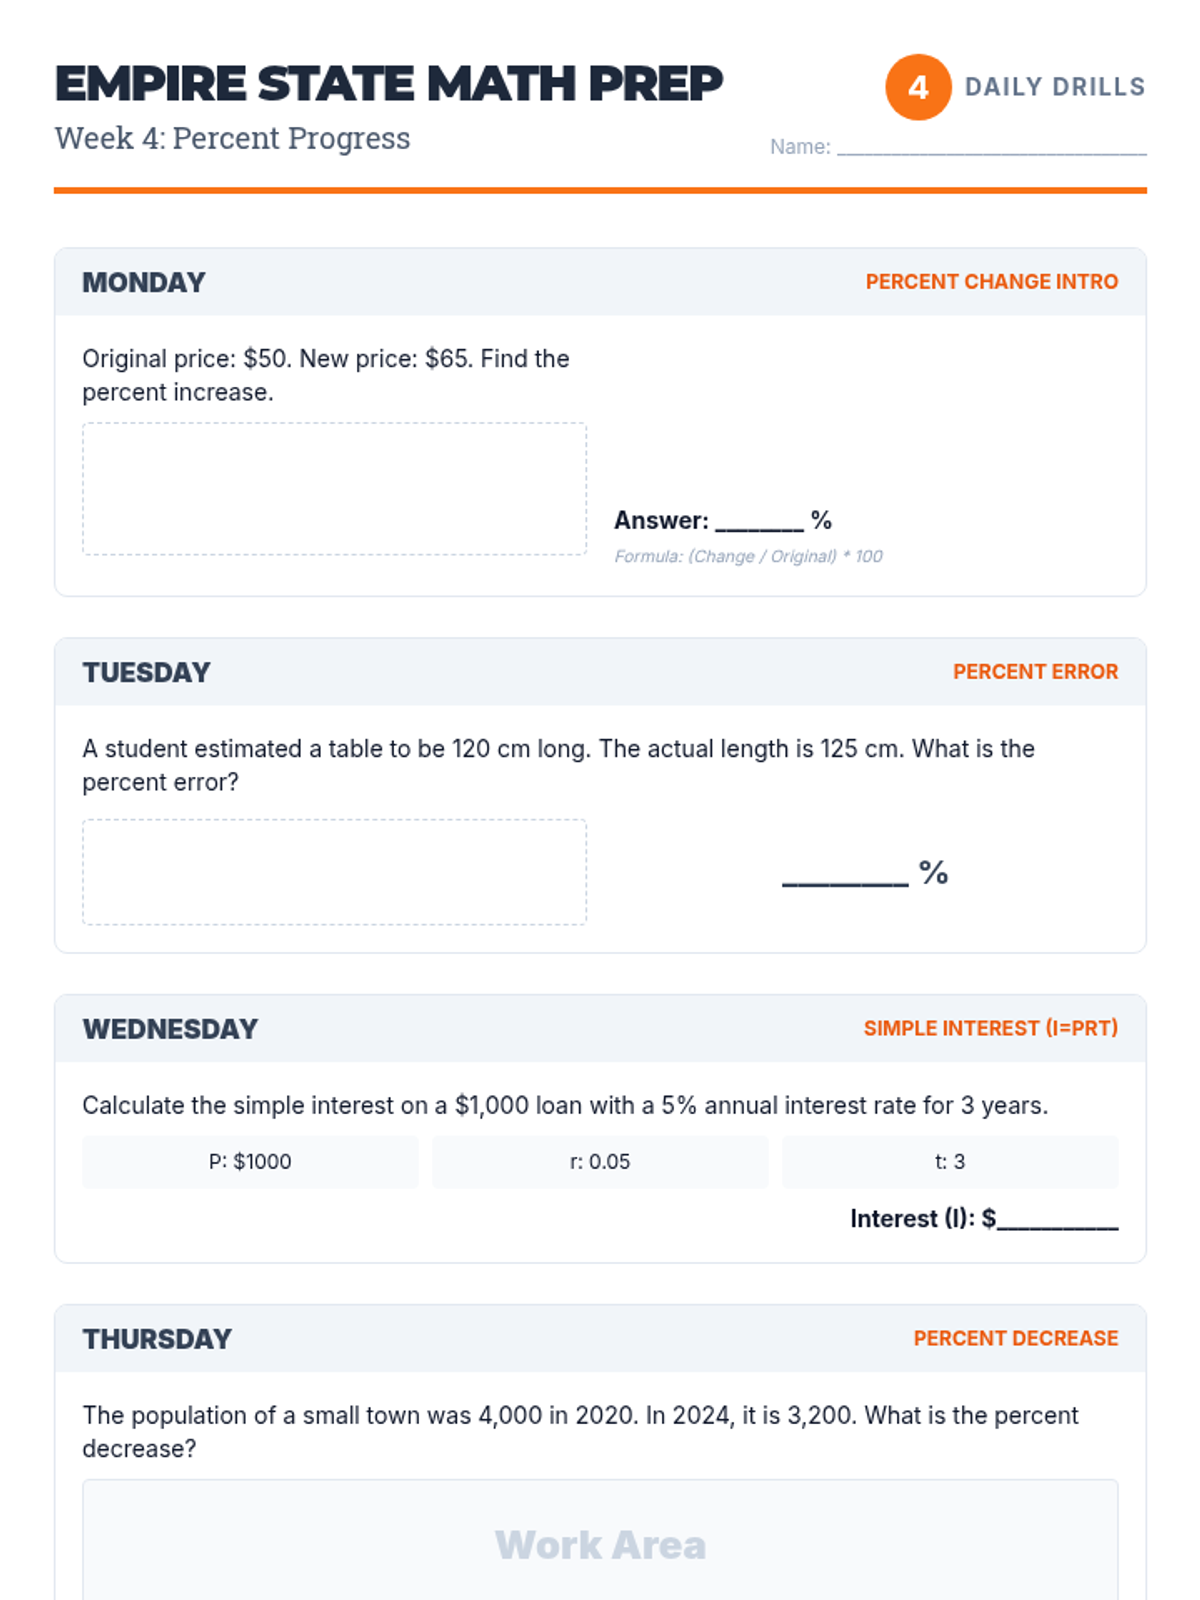
A 5-day warm-up worksheet for Week 4, focusing on percent change, percent error, and simple interest (I=PRT).
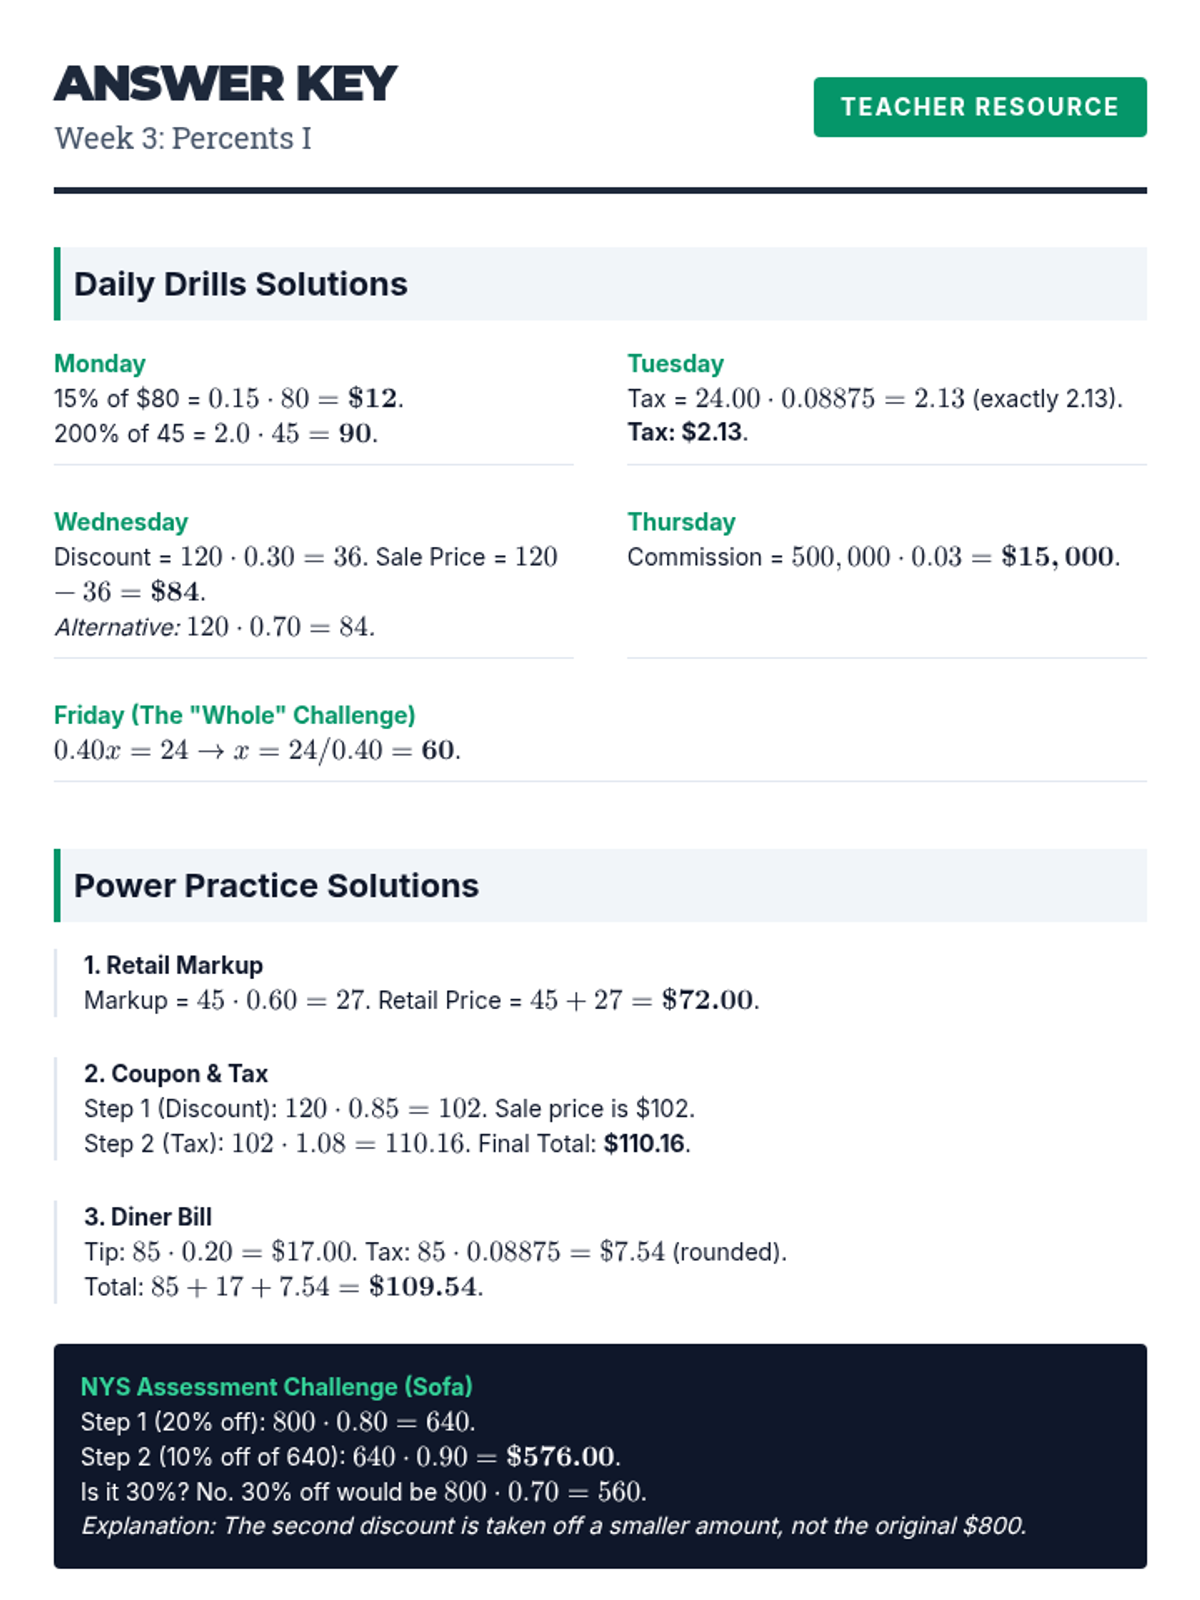
Teacher's answer key for Week 3 (Percents I) Daily Drills and Power Practice worksheets.
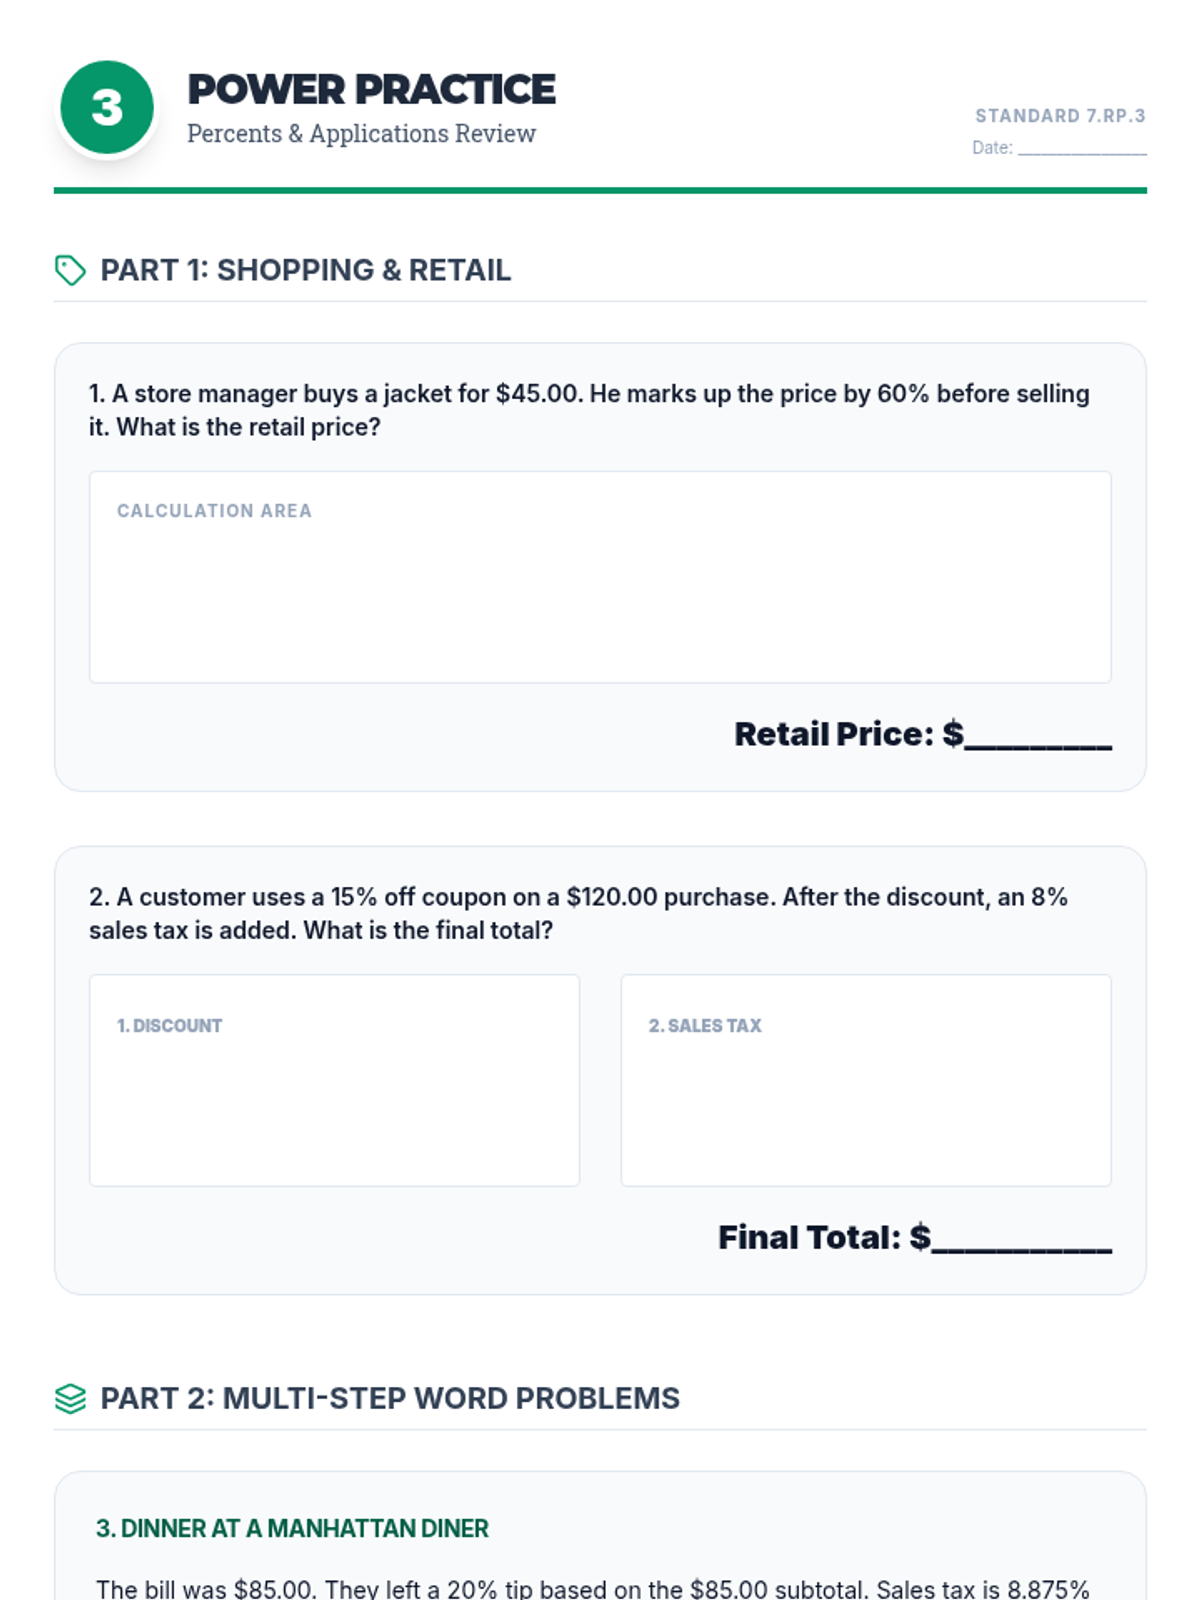
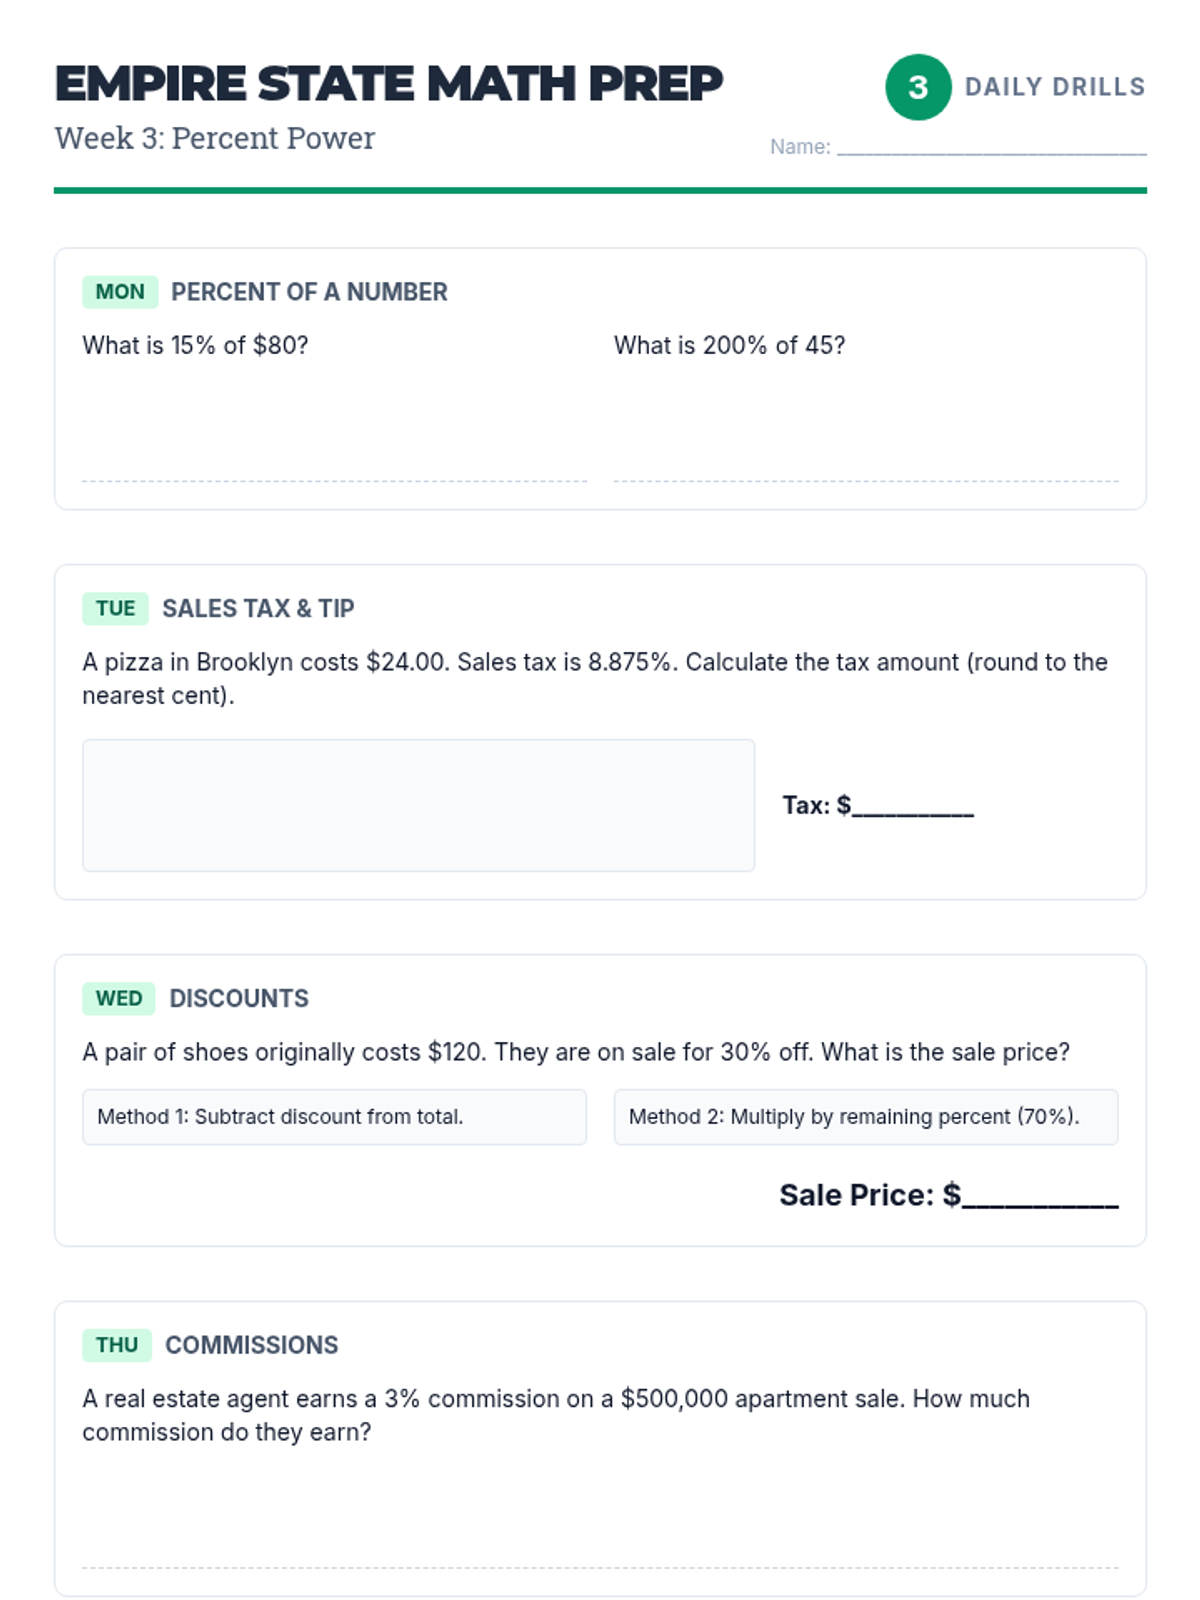
A comprehensive practice set for Week 3 (Percents), featuring markups, multiple discounts, tax, and tip problems in a retail context.
A 5-day warm-up worksheet for Week 3, focusing on basic percents, tax, tip, discounts, and commissions.
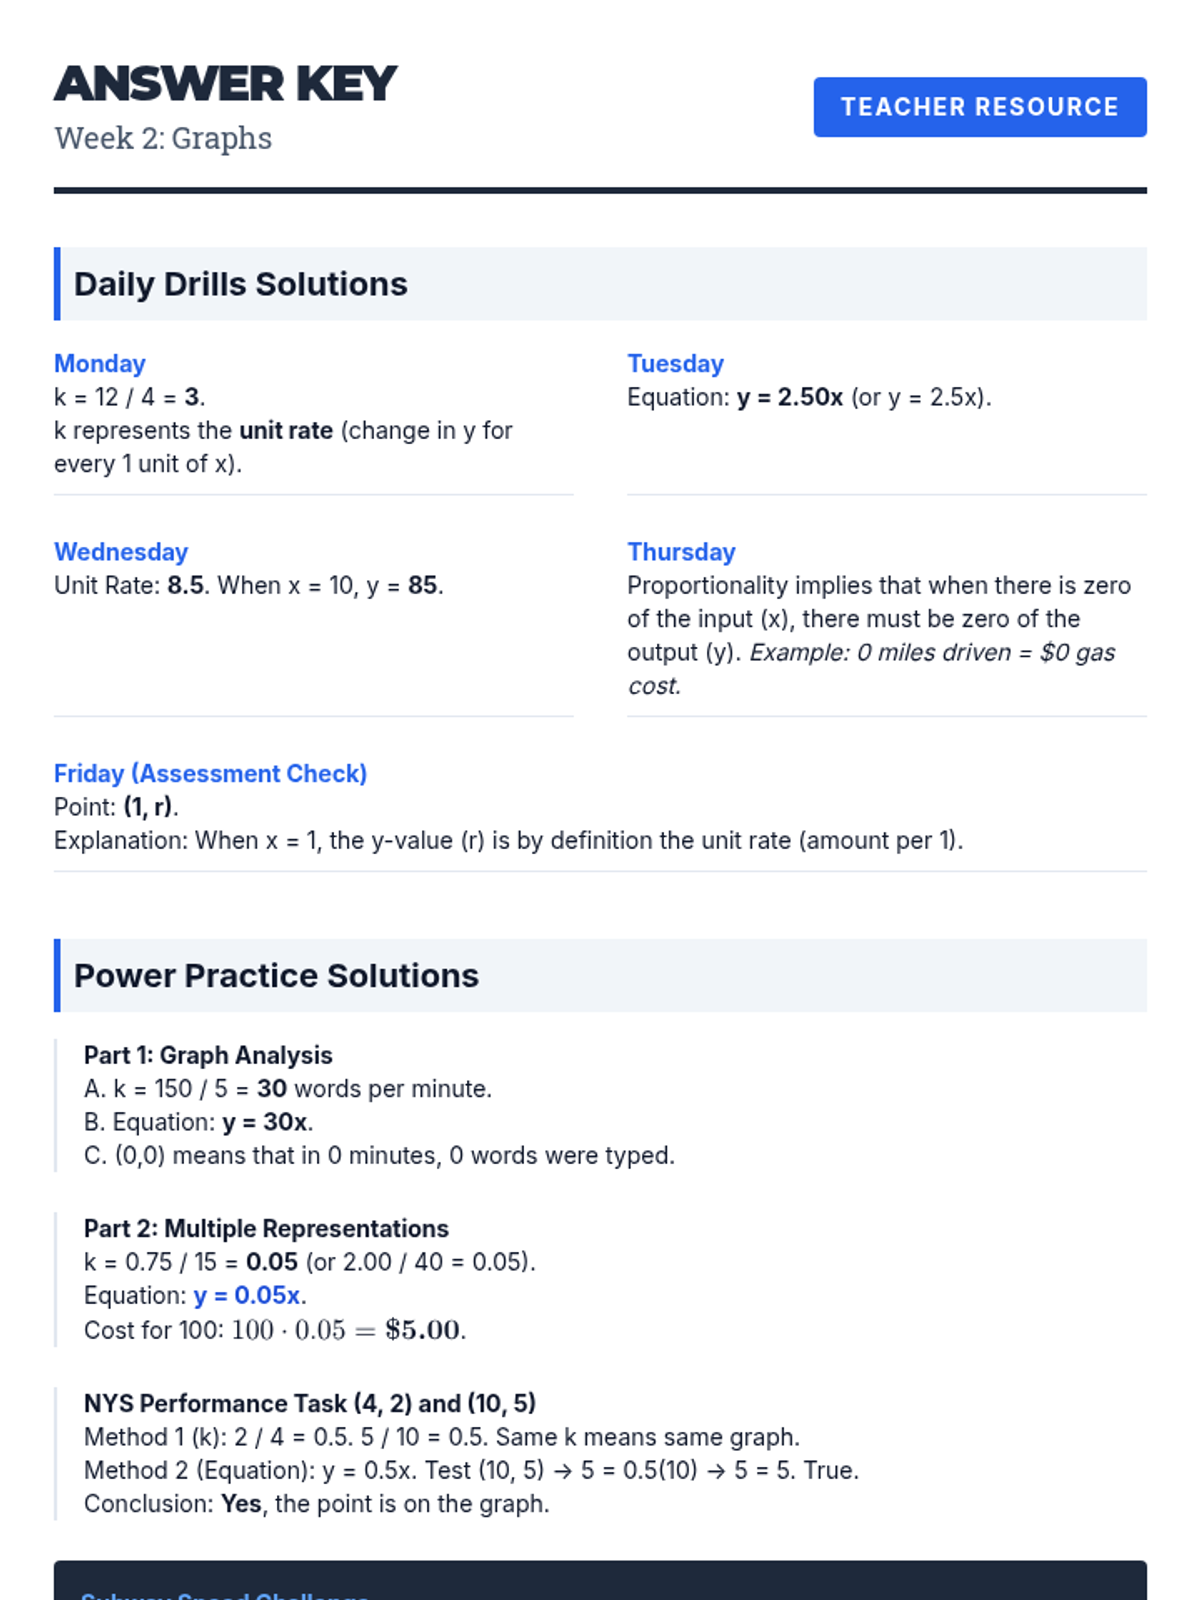
Teacher's answer key for Week 2 (Graphs) Daily Drills and Power Practice worksheets.
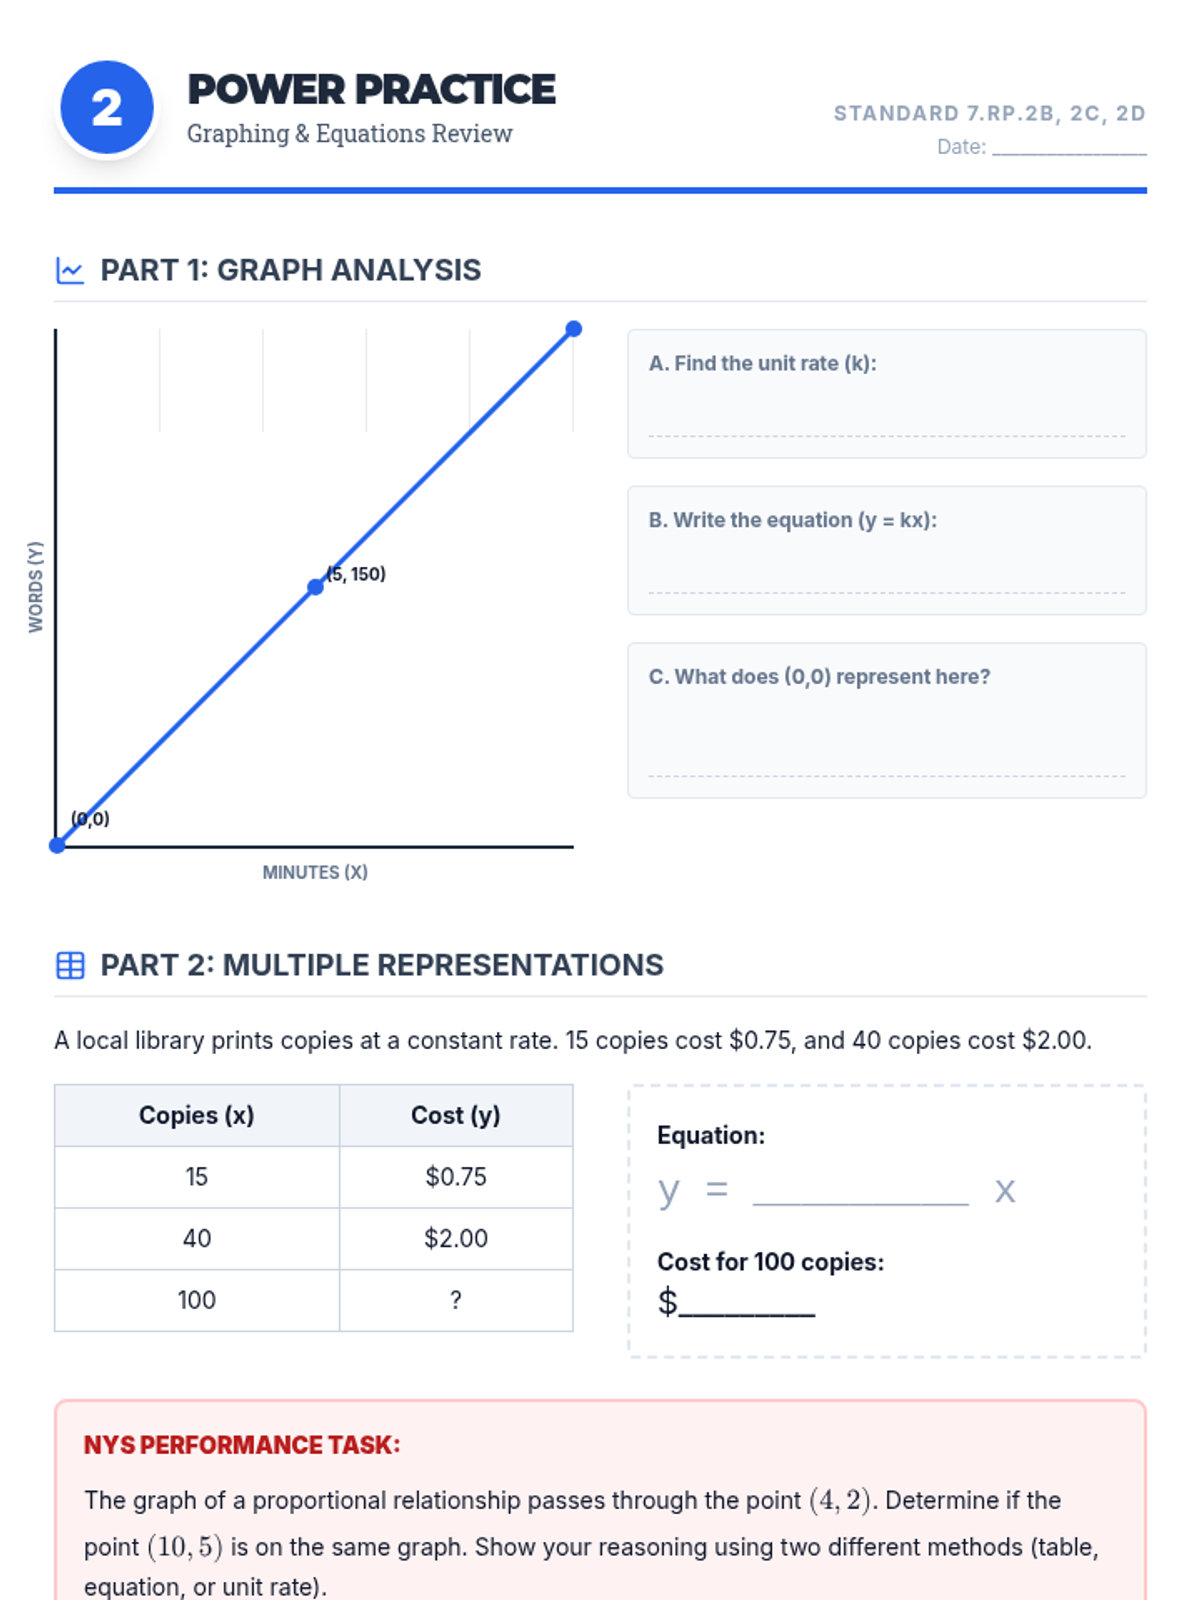
A comprehensive practice set for Week 2 (Graphs), featuring graph interpretation, equations, and comparing multiple representations.
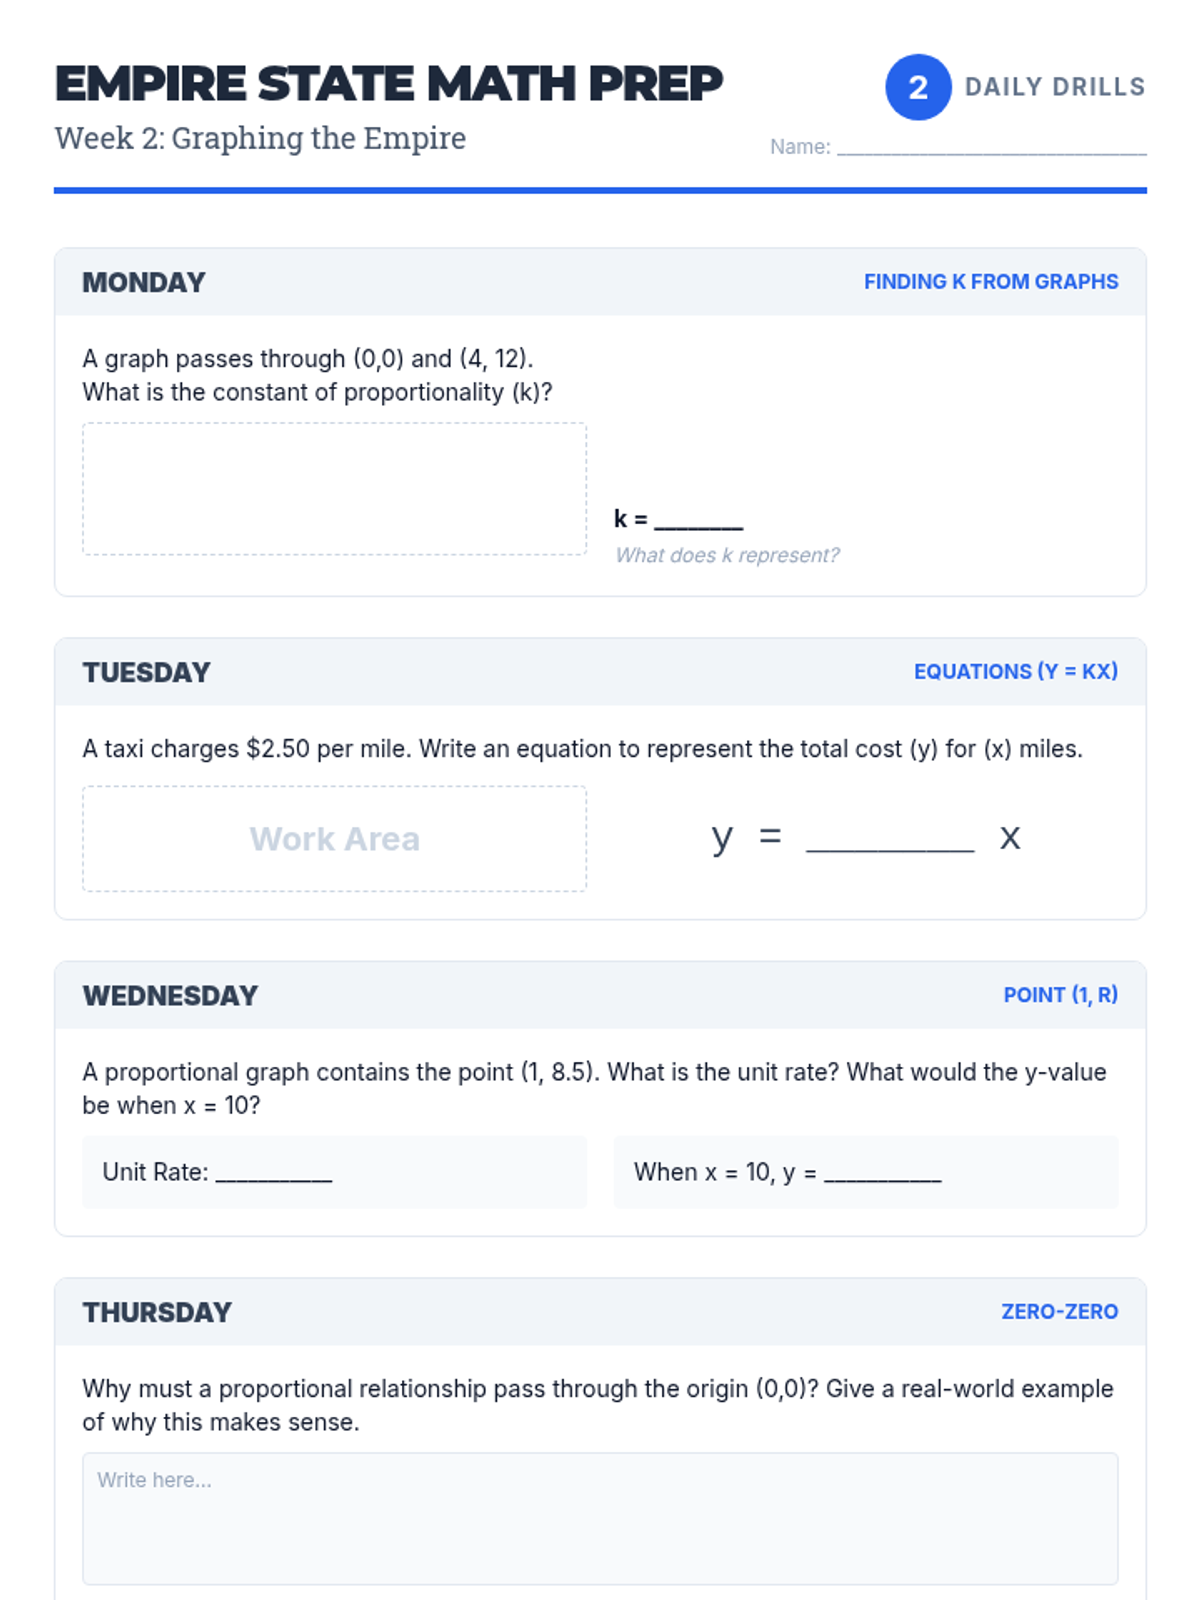
A 5-day warm-up worksheet for Week 2, focusing on graphing proportional relationships, finding k, and interpreting key points like (0,0) and (1,r).
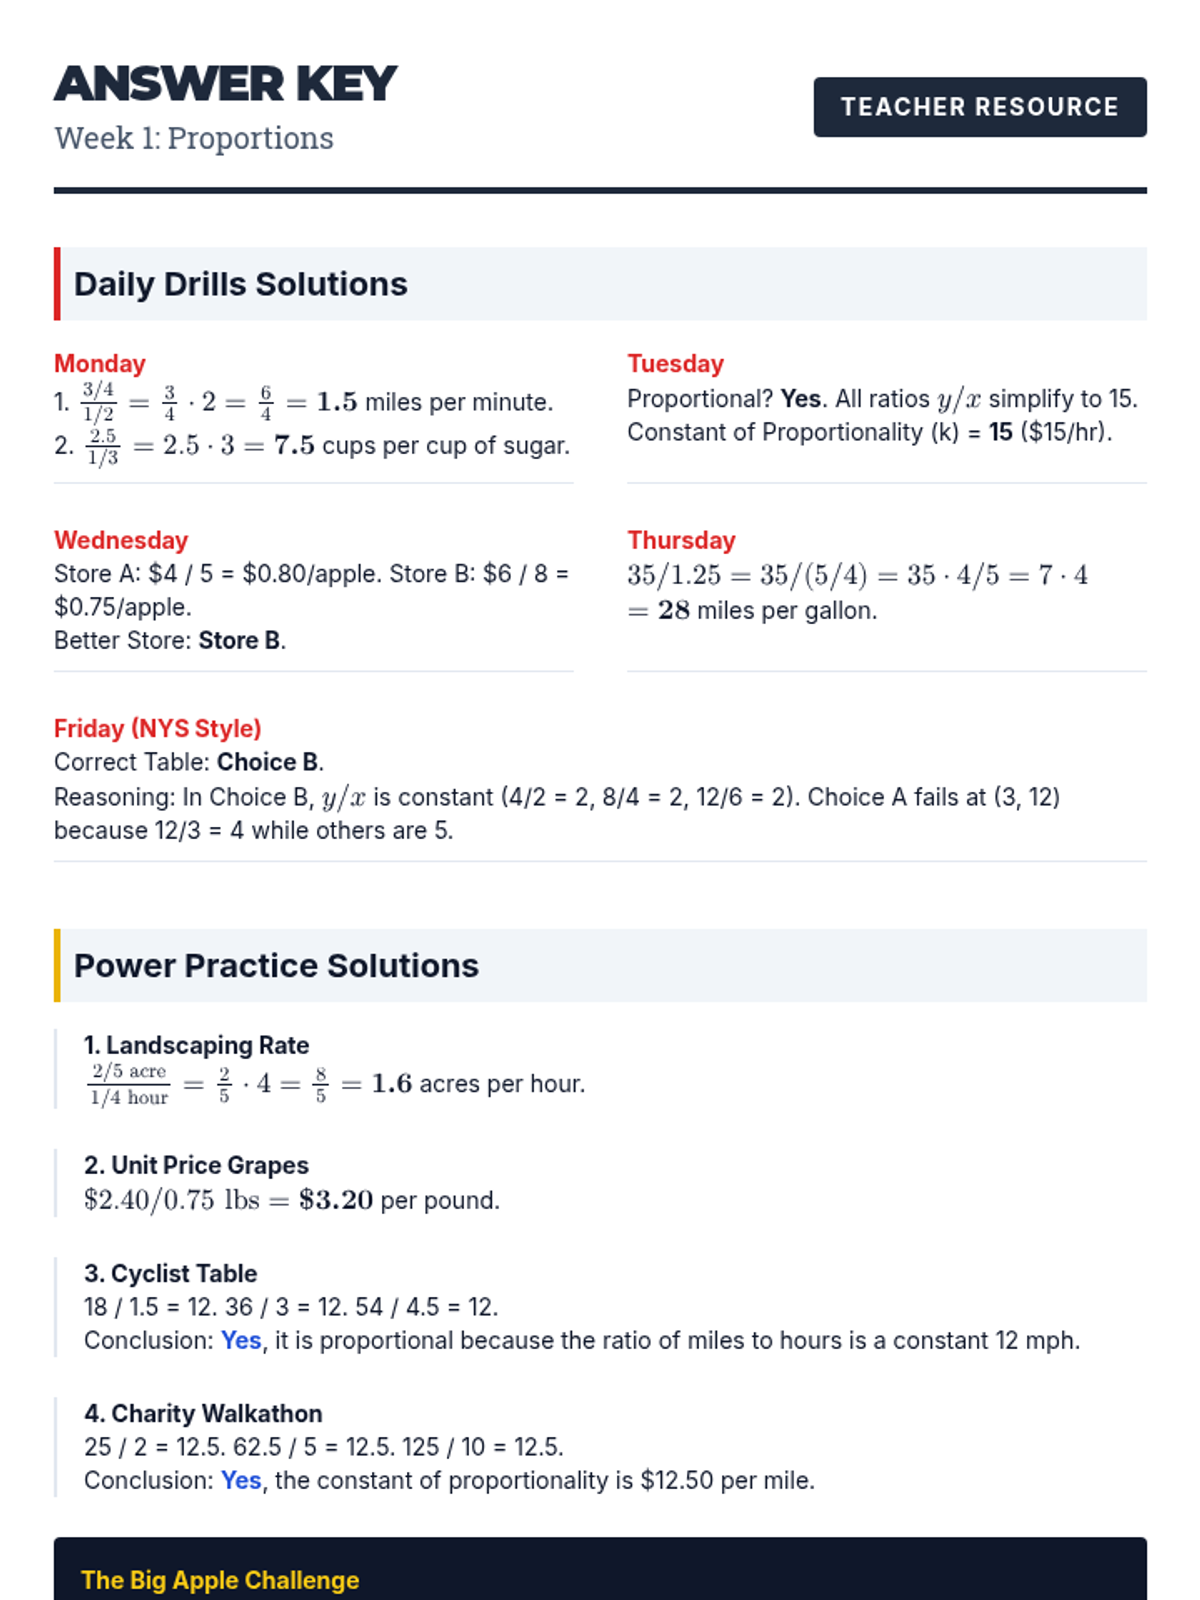
Teacher's answer key for Week 1 (Proportions) Daily Drills and Power Practice worksheets.
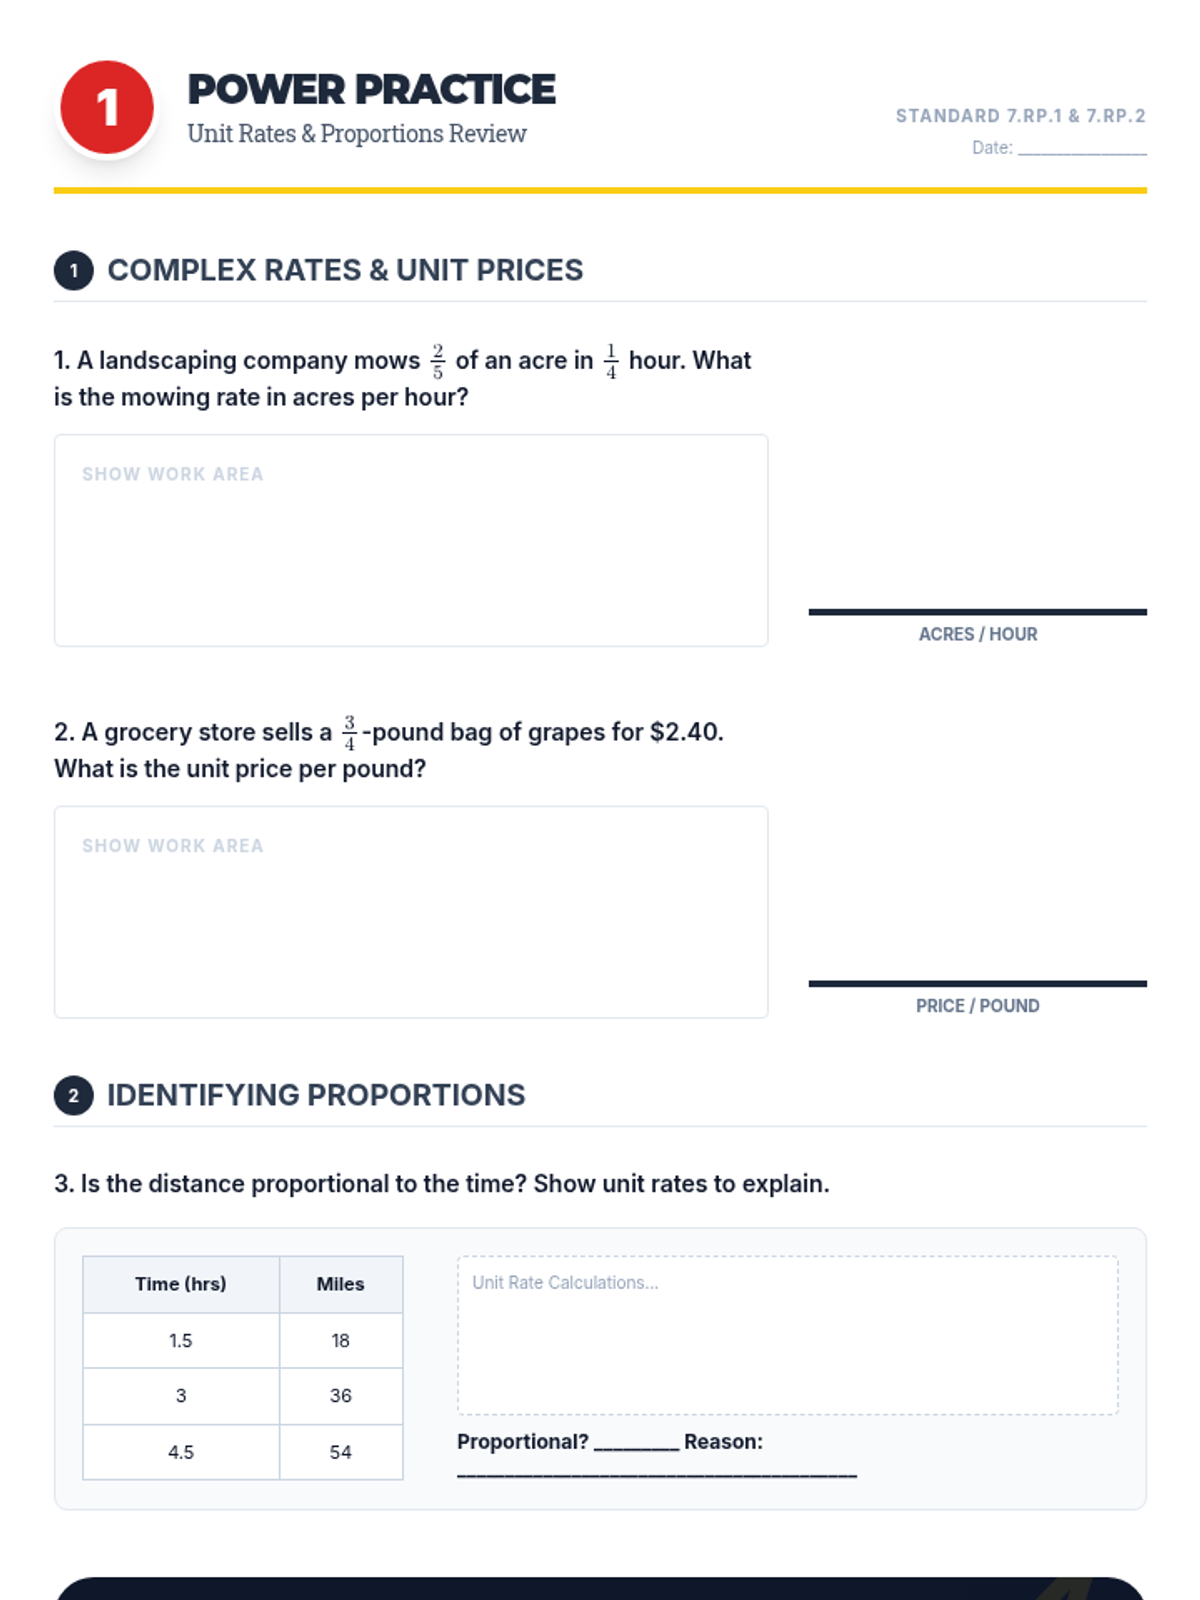
A comprehensive practice set for Week 1 (Proportions), featuring multi-step problems, complex fractions, and real-world New York context.
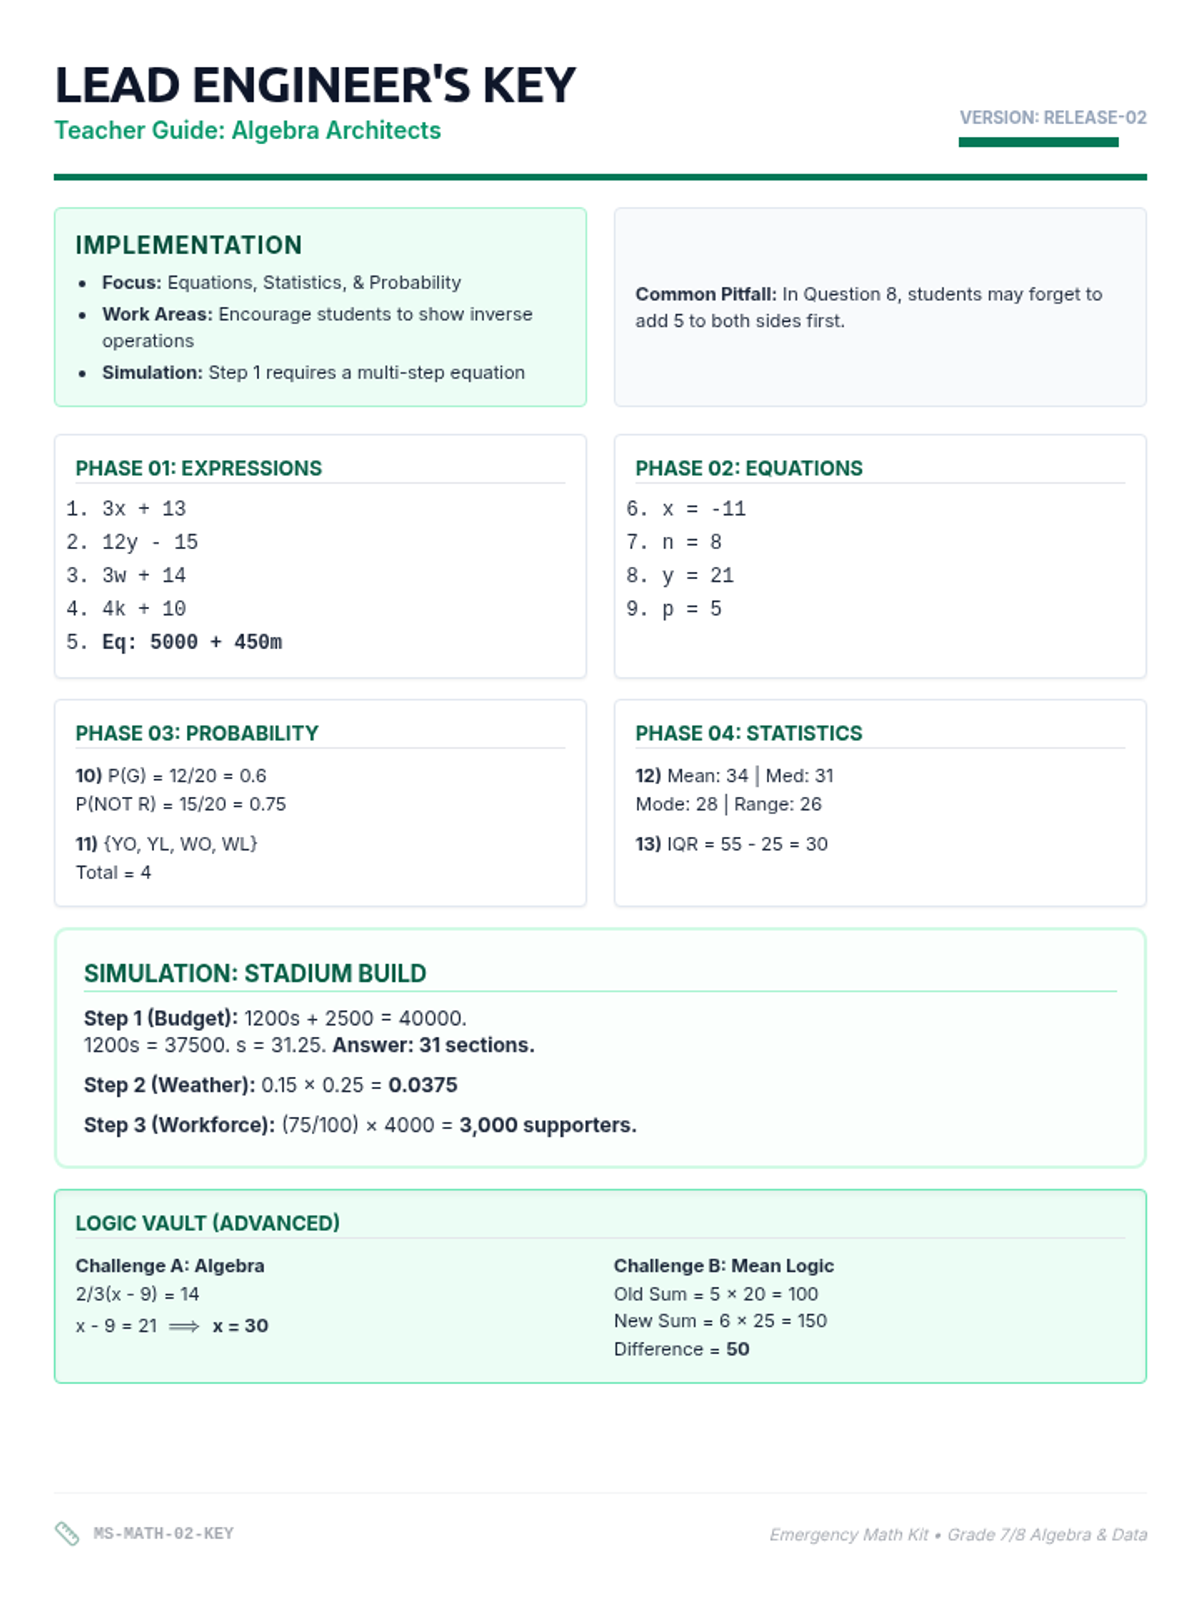
A detailed answer key and pedagogical guide for the Algebra Architects packet. Provides solutions for all phases, the simulation task, and the Logic Vault extensions.
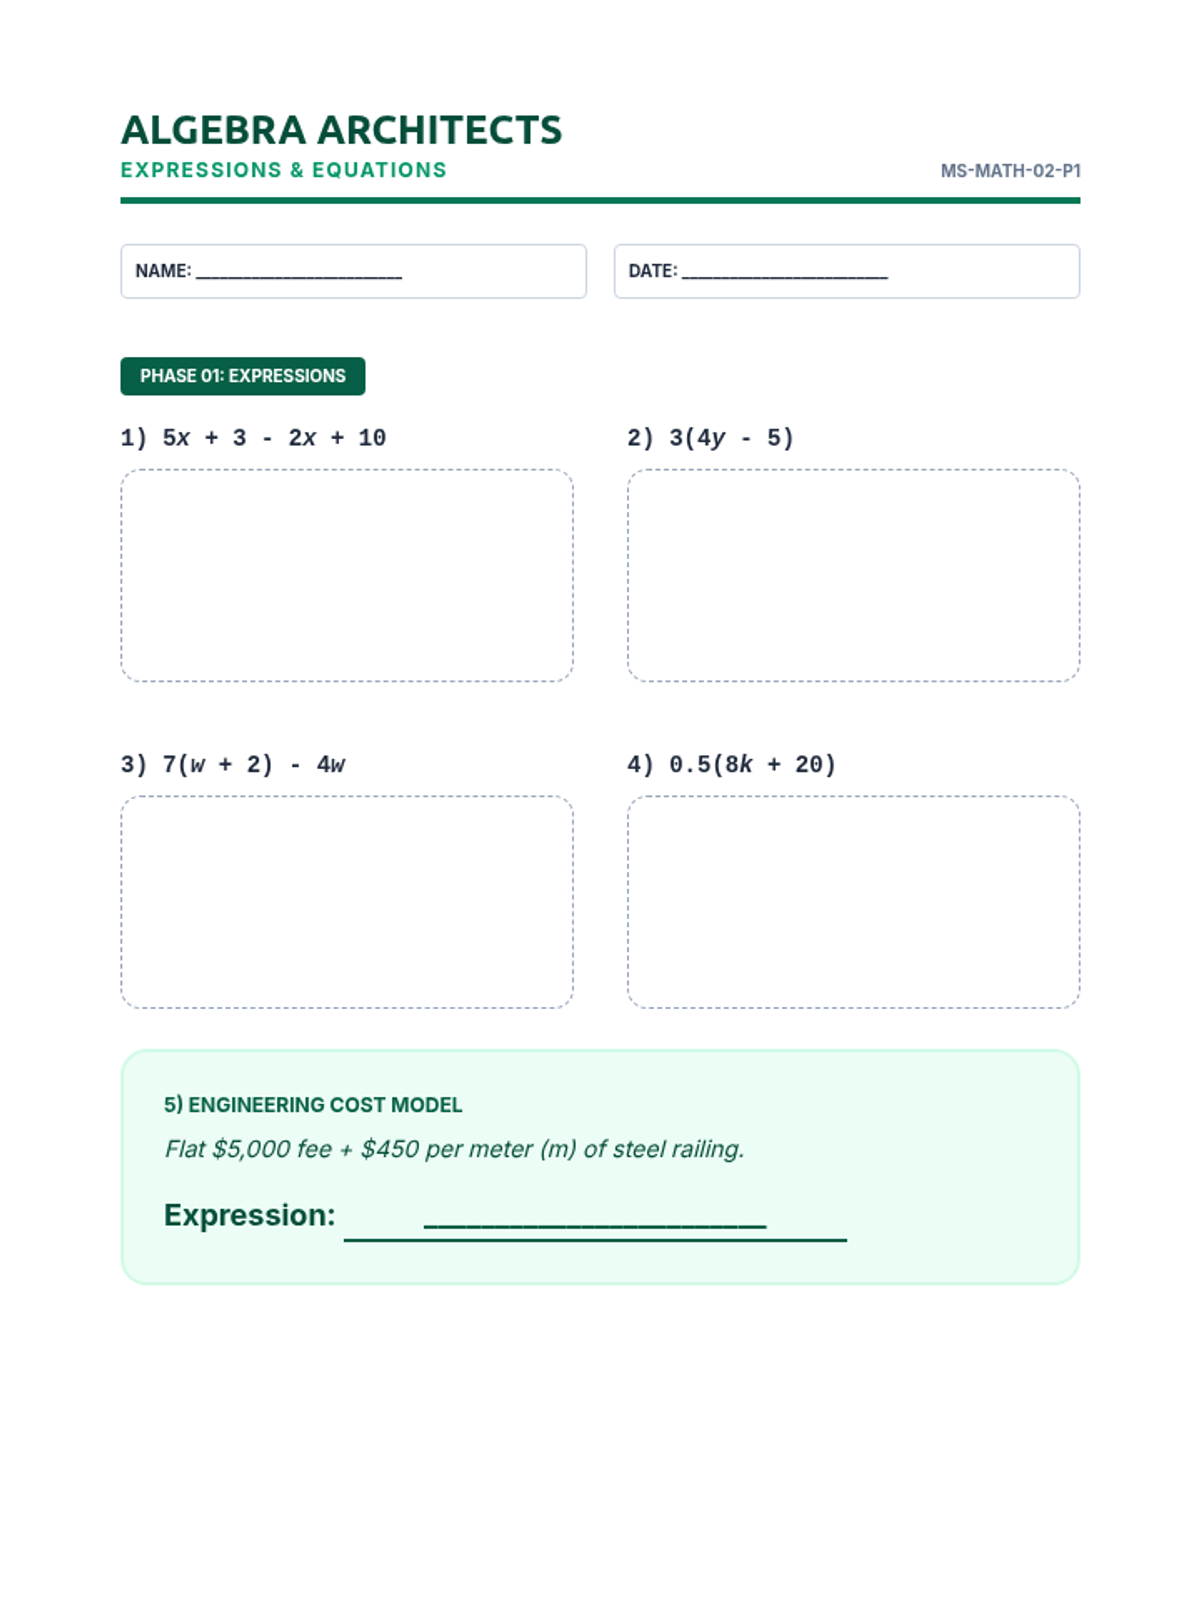
A 4-page student packet for a 90-minute substitute block covering linear expressions, equations, probability, and statistics. Includes application tasks and an "Engineering Vault" for fast finishers.
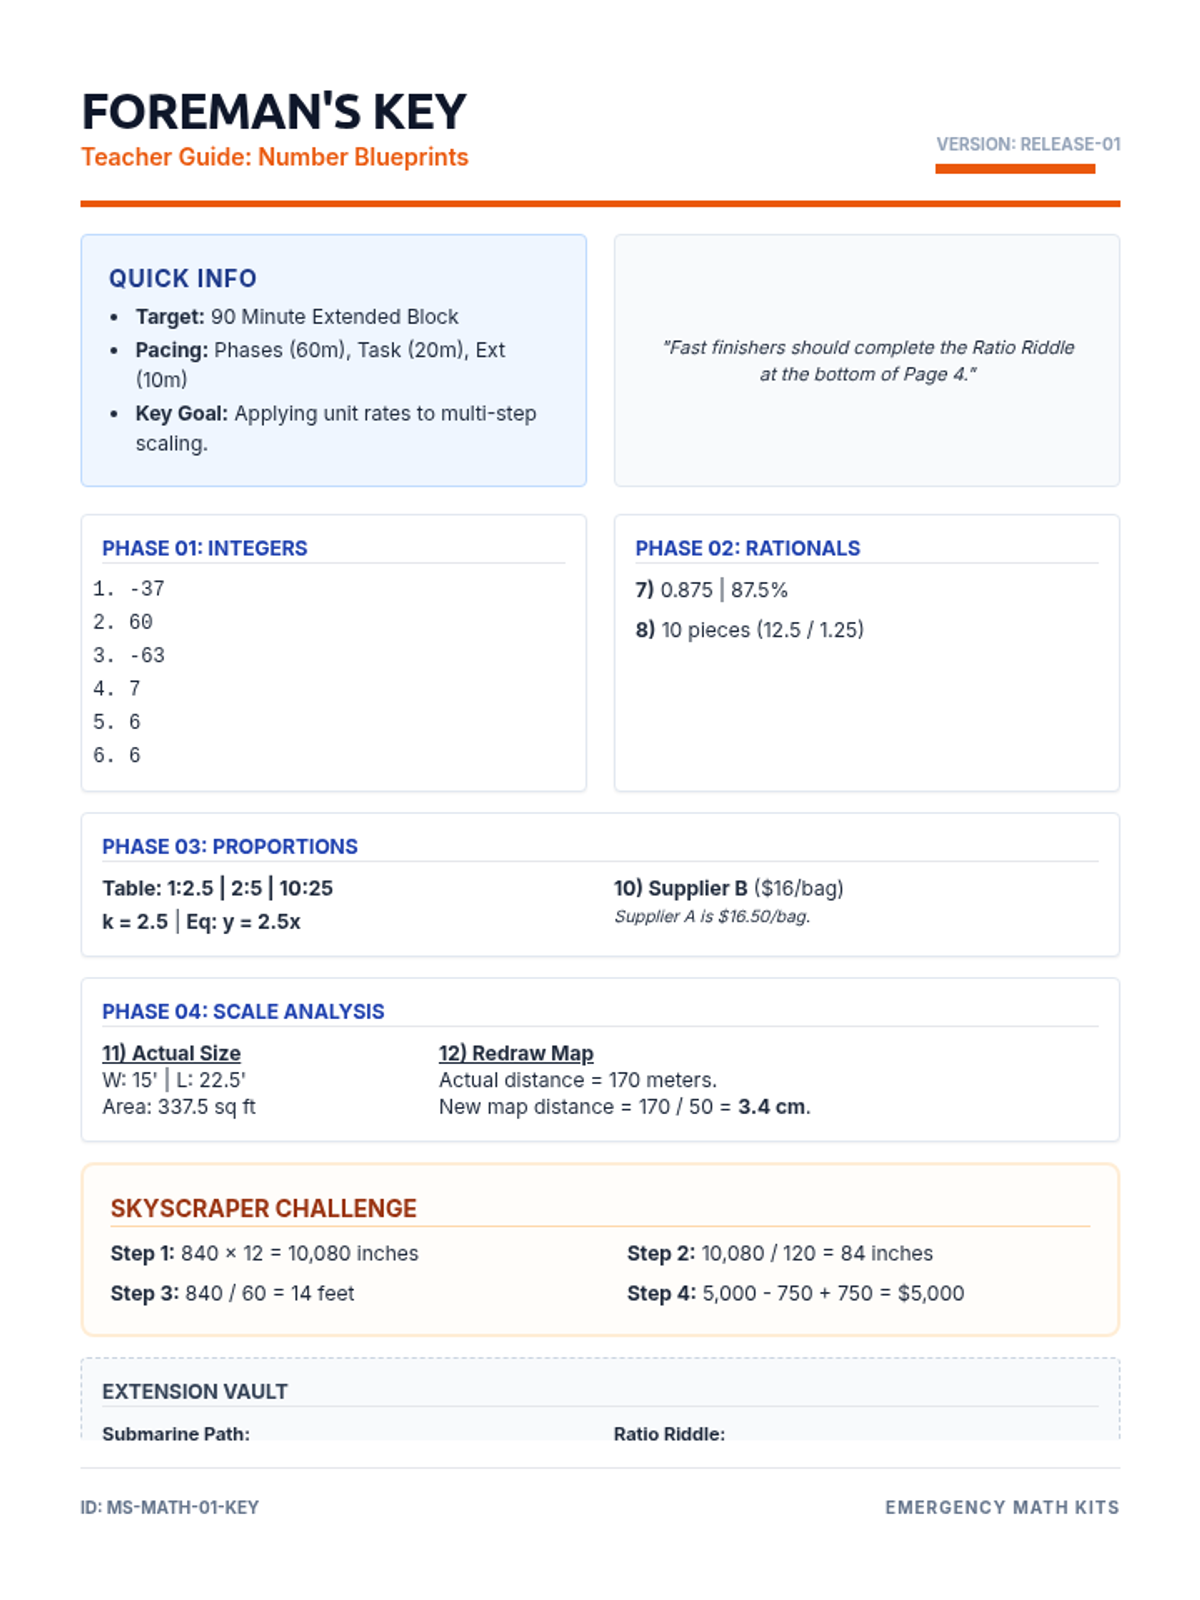
A concise answer key and instructional guide for the Number Blueprints packet. Includes step-by-step solutions and time management tips for the substitute teacher.
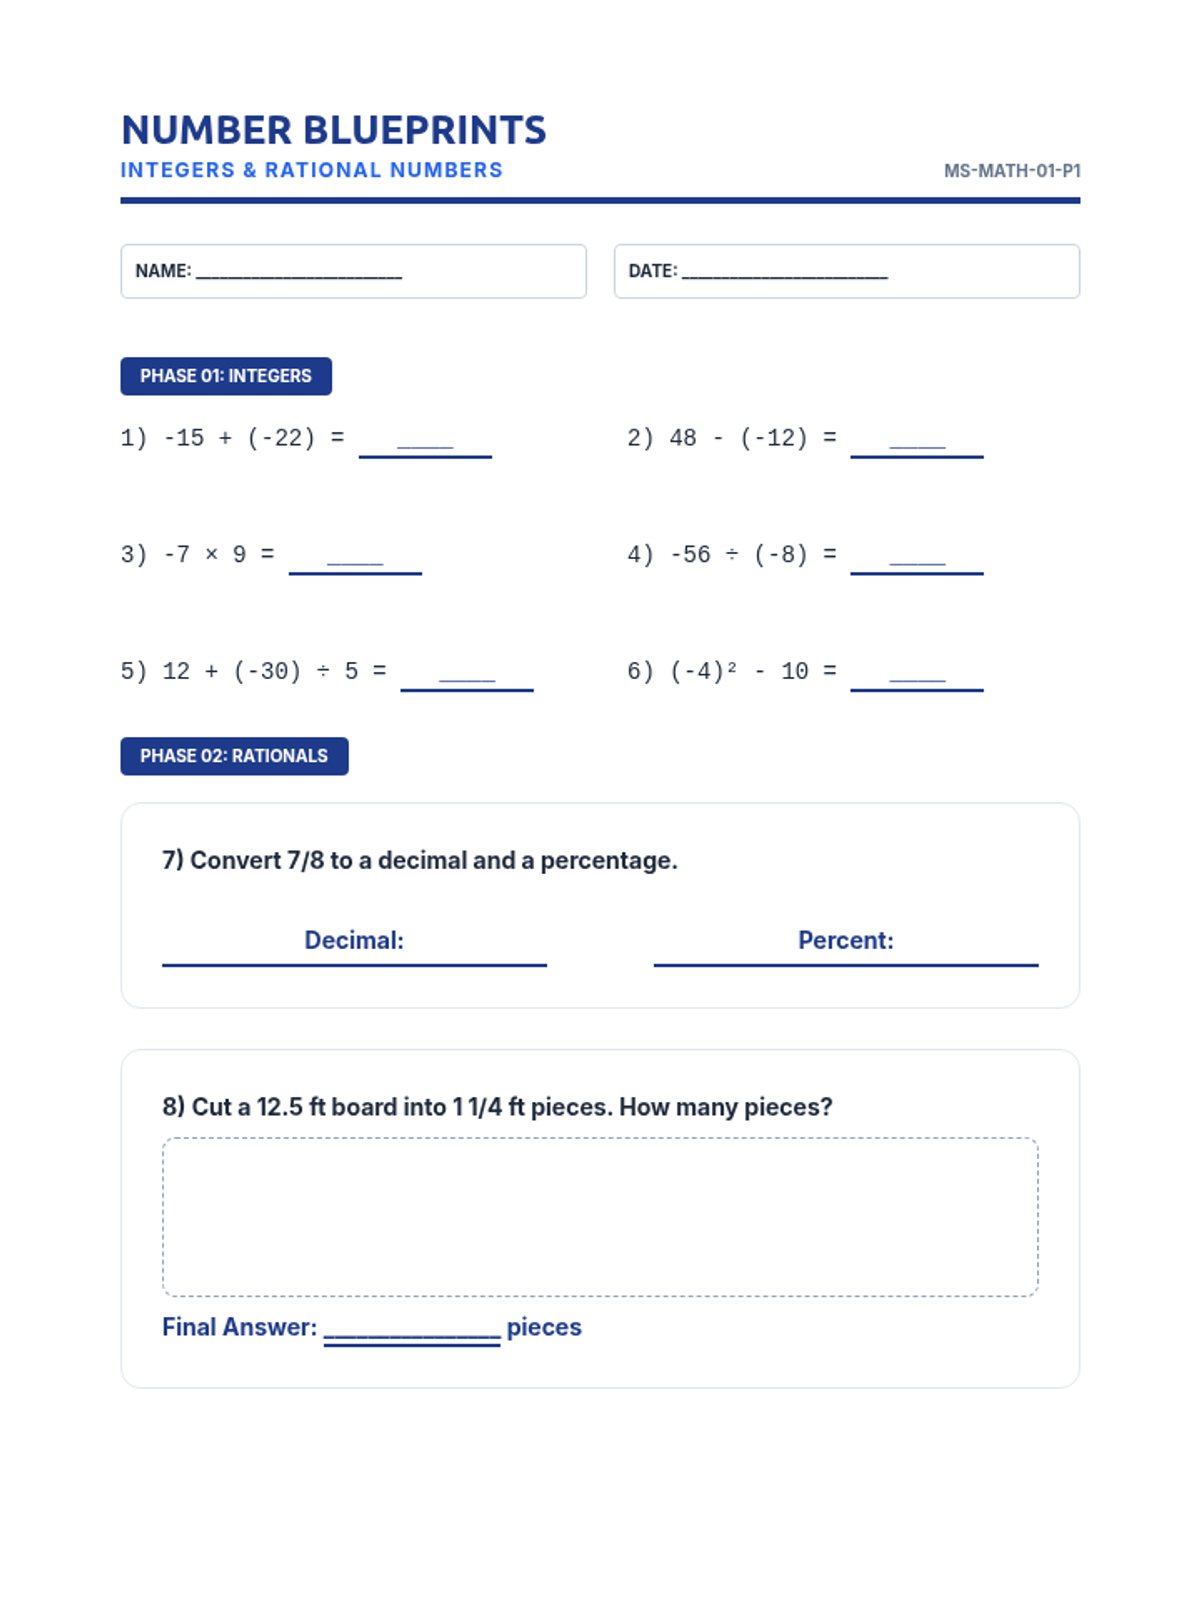
A 4-page student packet for a 90-minute substitute block covering integers, rational numbers, proportions, and scale factor. Designed with an architecture/blueprint theme, it includes guided phases, a performance task, and an extension vault.
Visual presentation for the lesson including outlier identification, impact on mean vs median, and selection criteria for symmetric vs skewed data.
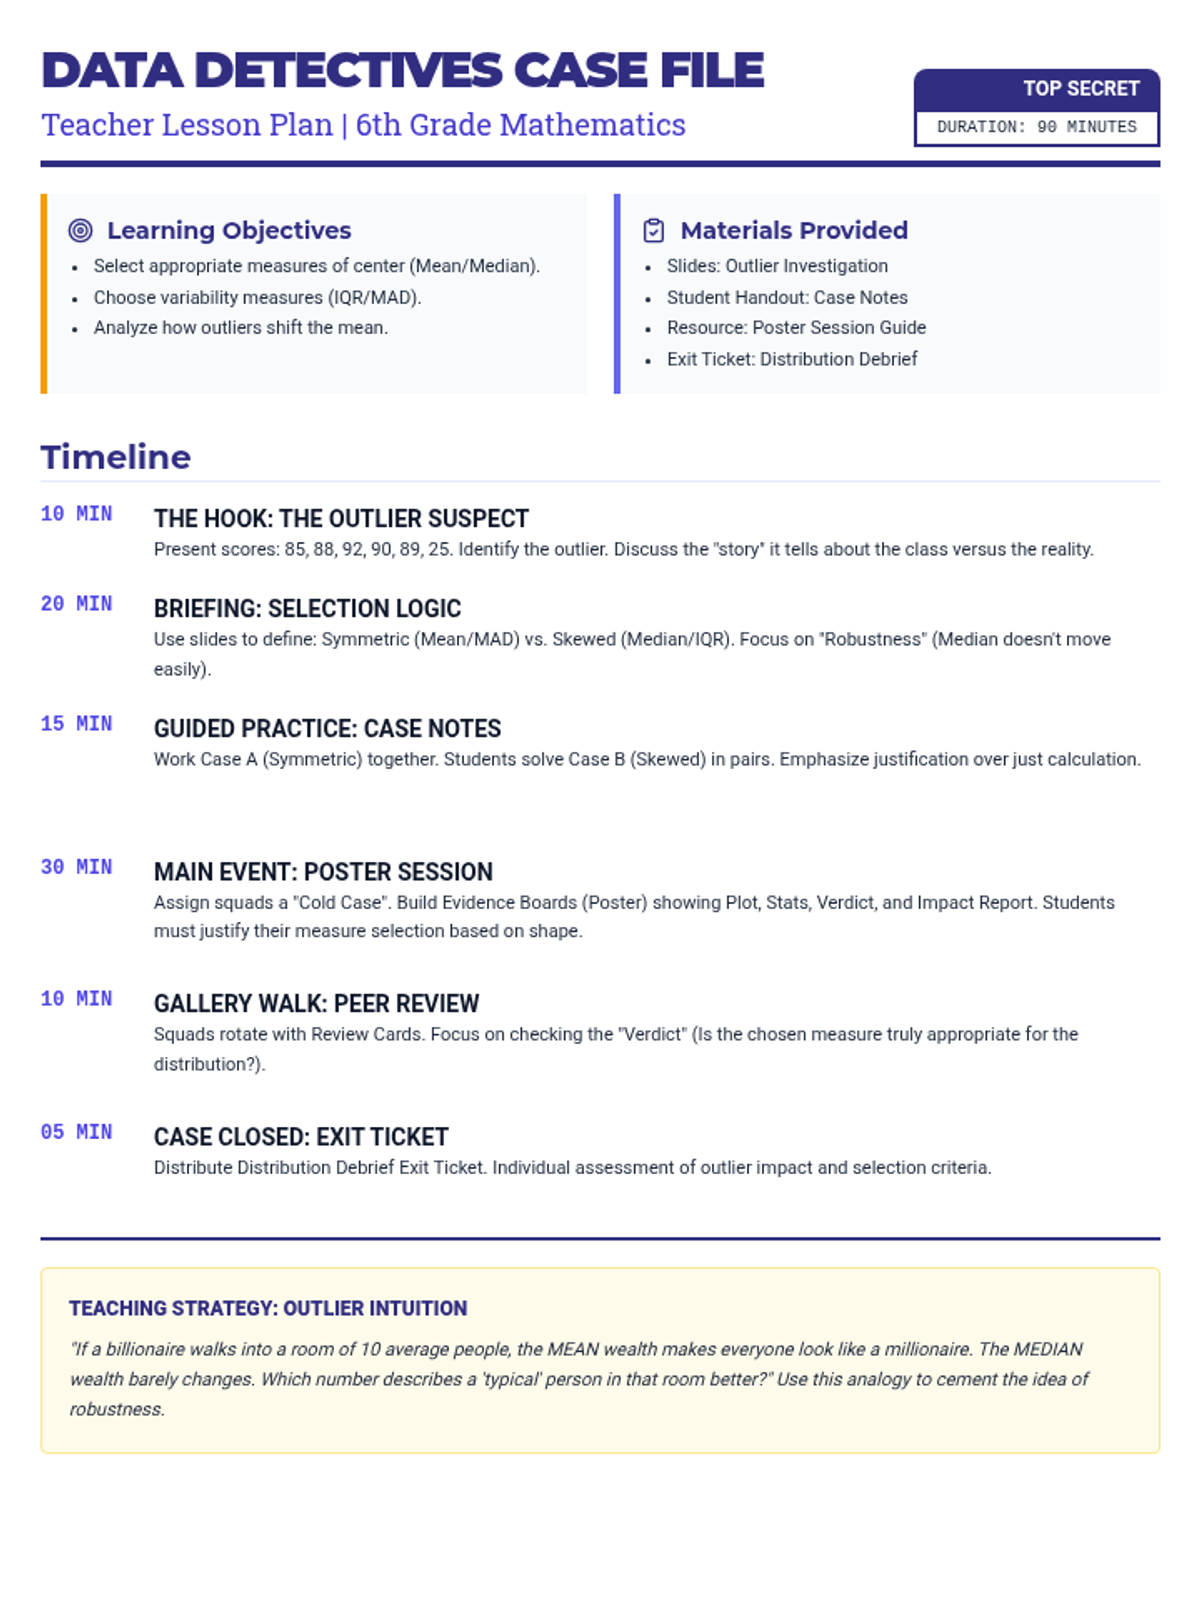
A detailed 90-minute teacher guide for a 6th grade math lesson on statistical measures and outliers, featuring a 'Data Detective' theme with a clear timeline, learning objectives, and teaching tips. Revised for better page breaks.
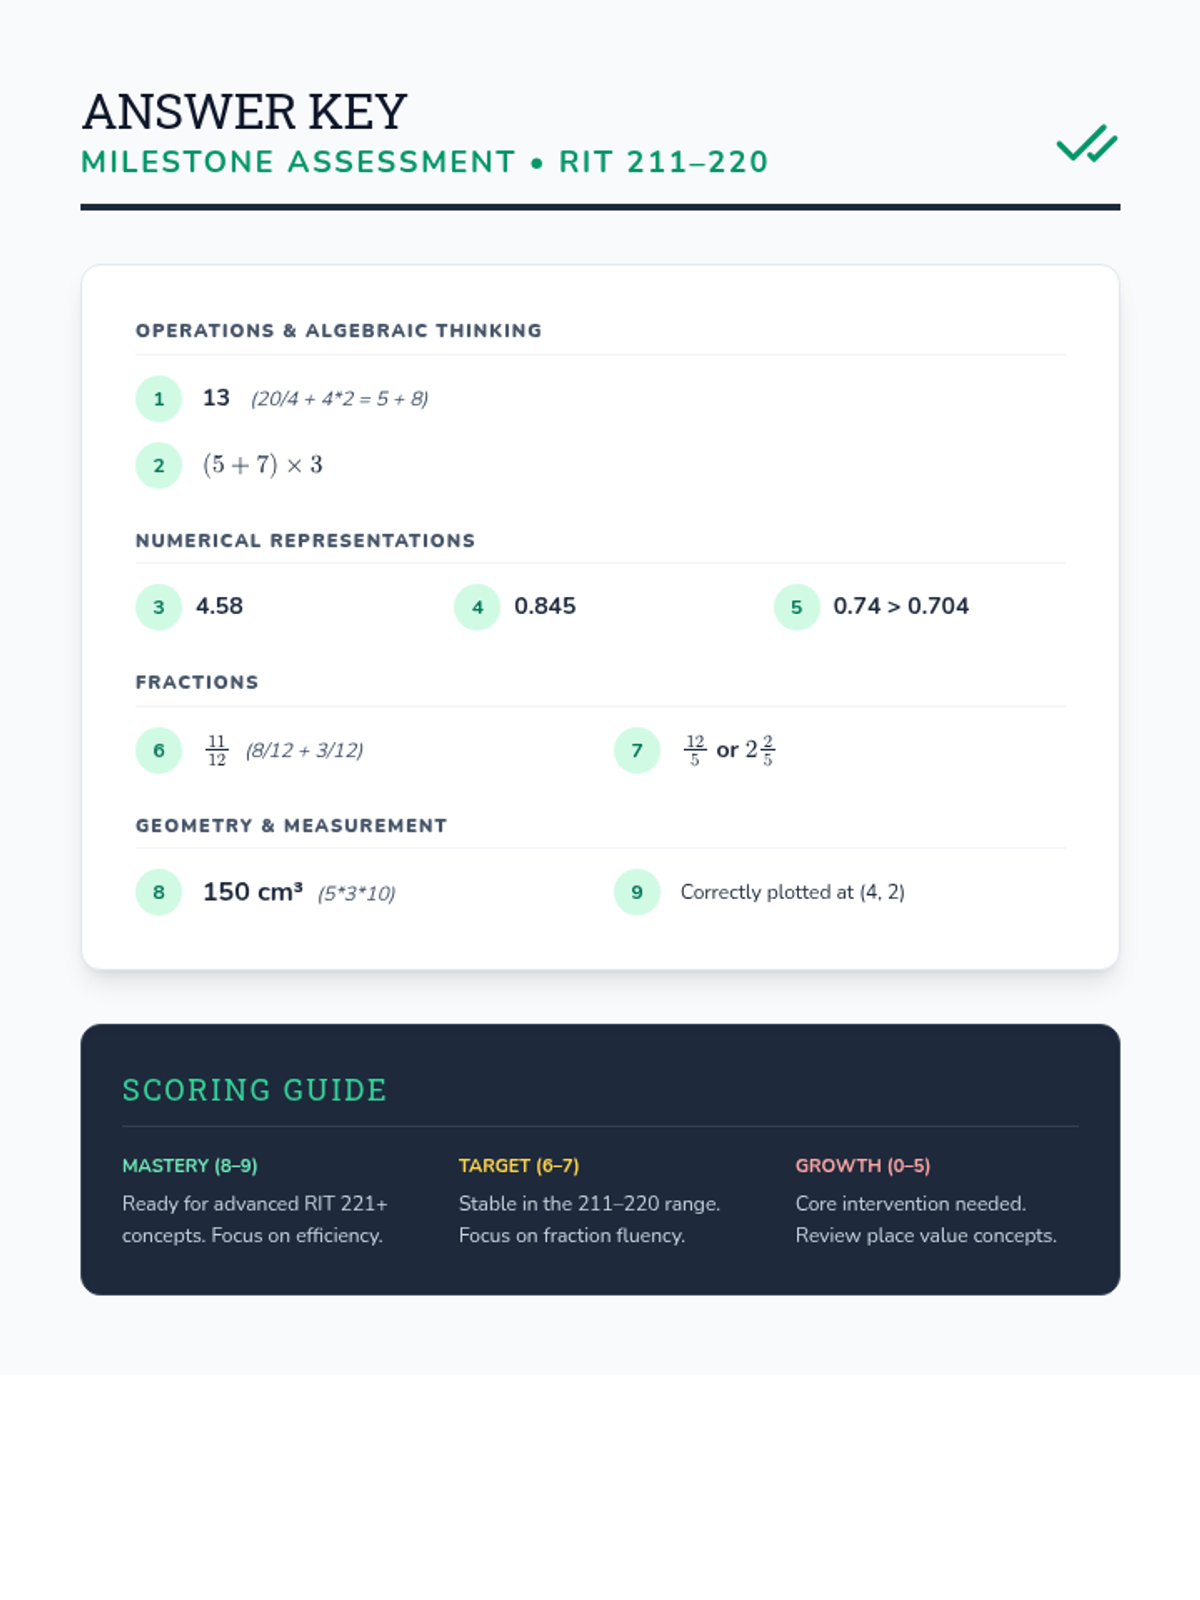
Teacher answer key for the RIT 211-220 Milestone Assessment, including step-by-step work and a scoring guidance chart. Revised for page-break consistency and clarity.
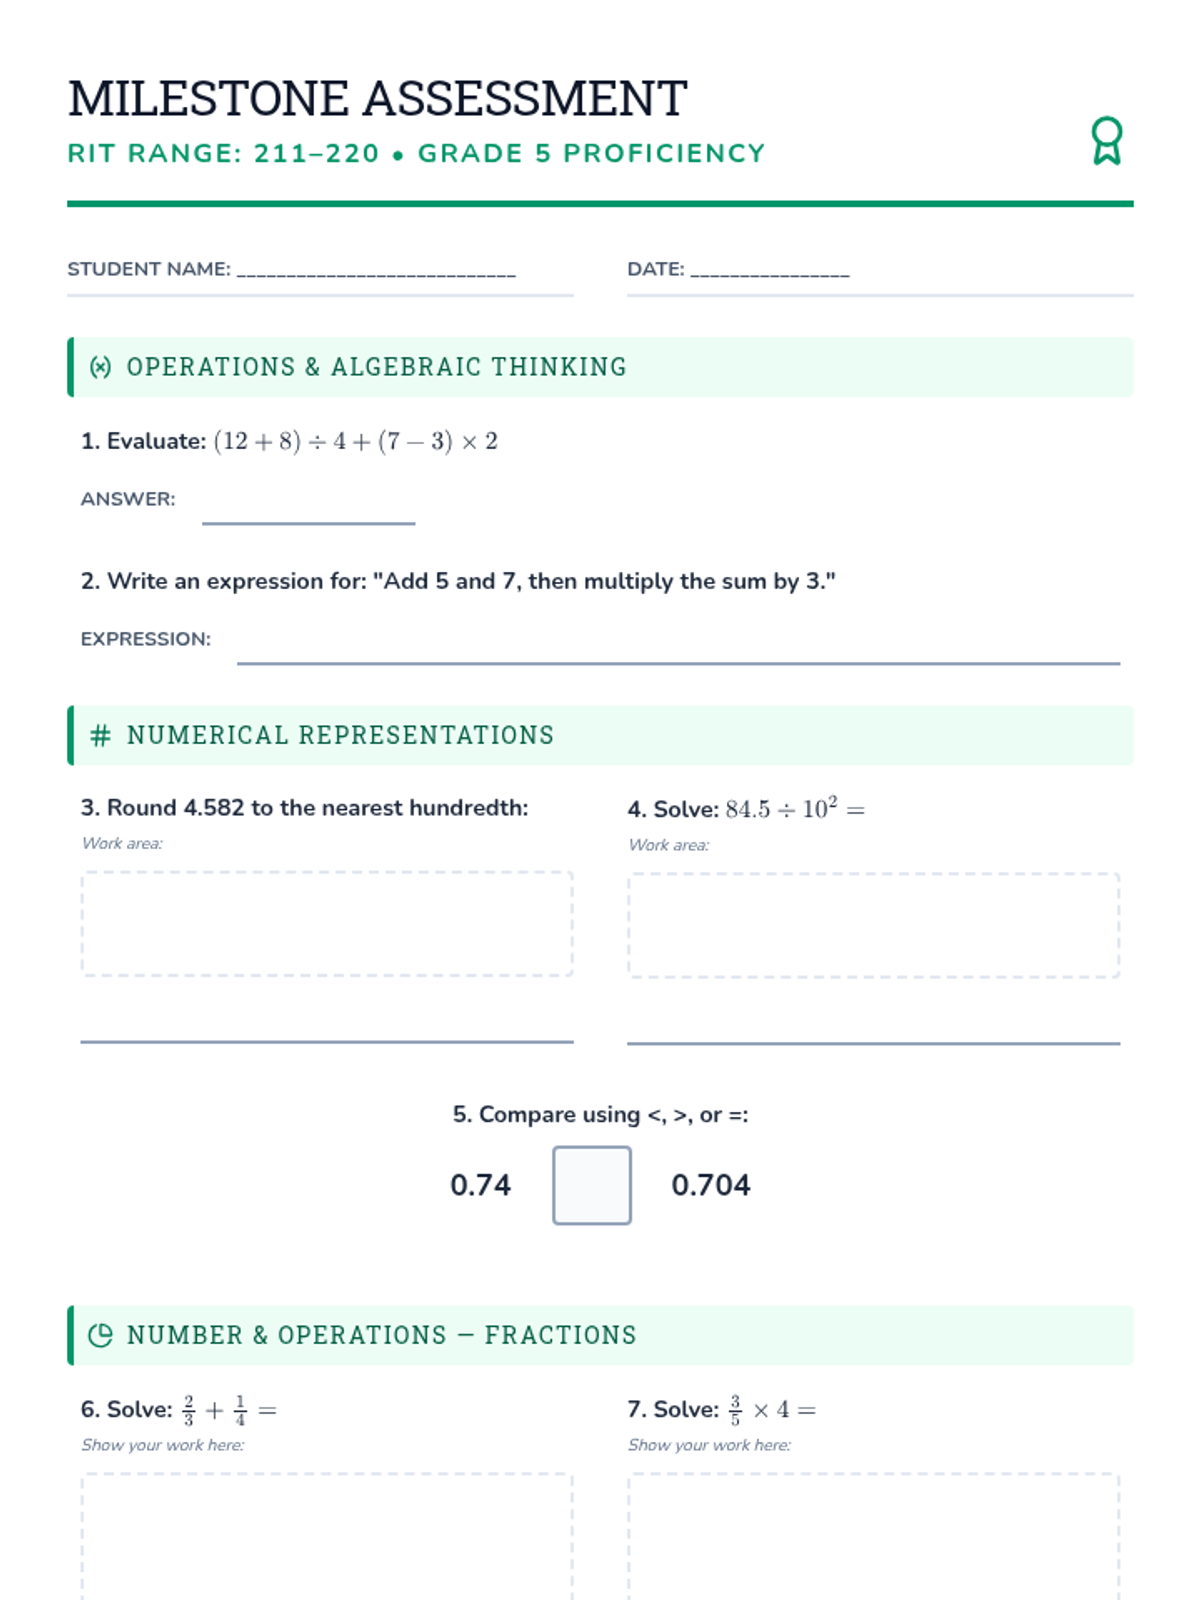
A comprehensive multi-domain assessment worksheet for students in the NWEA MAP RIT range 211-220. Covers Operations, Numerical Representations, Fractions, and Geometry. Revised for layout efficiency and better work space.
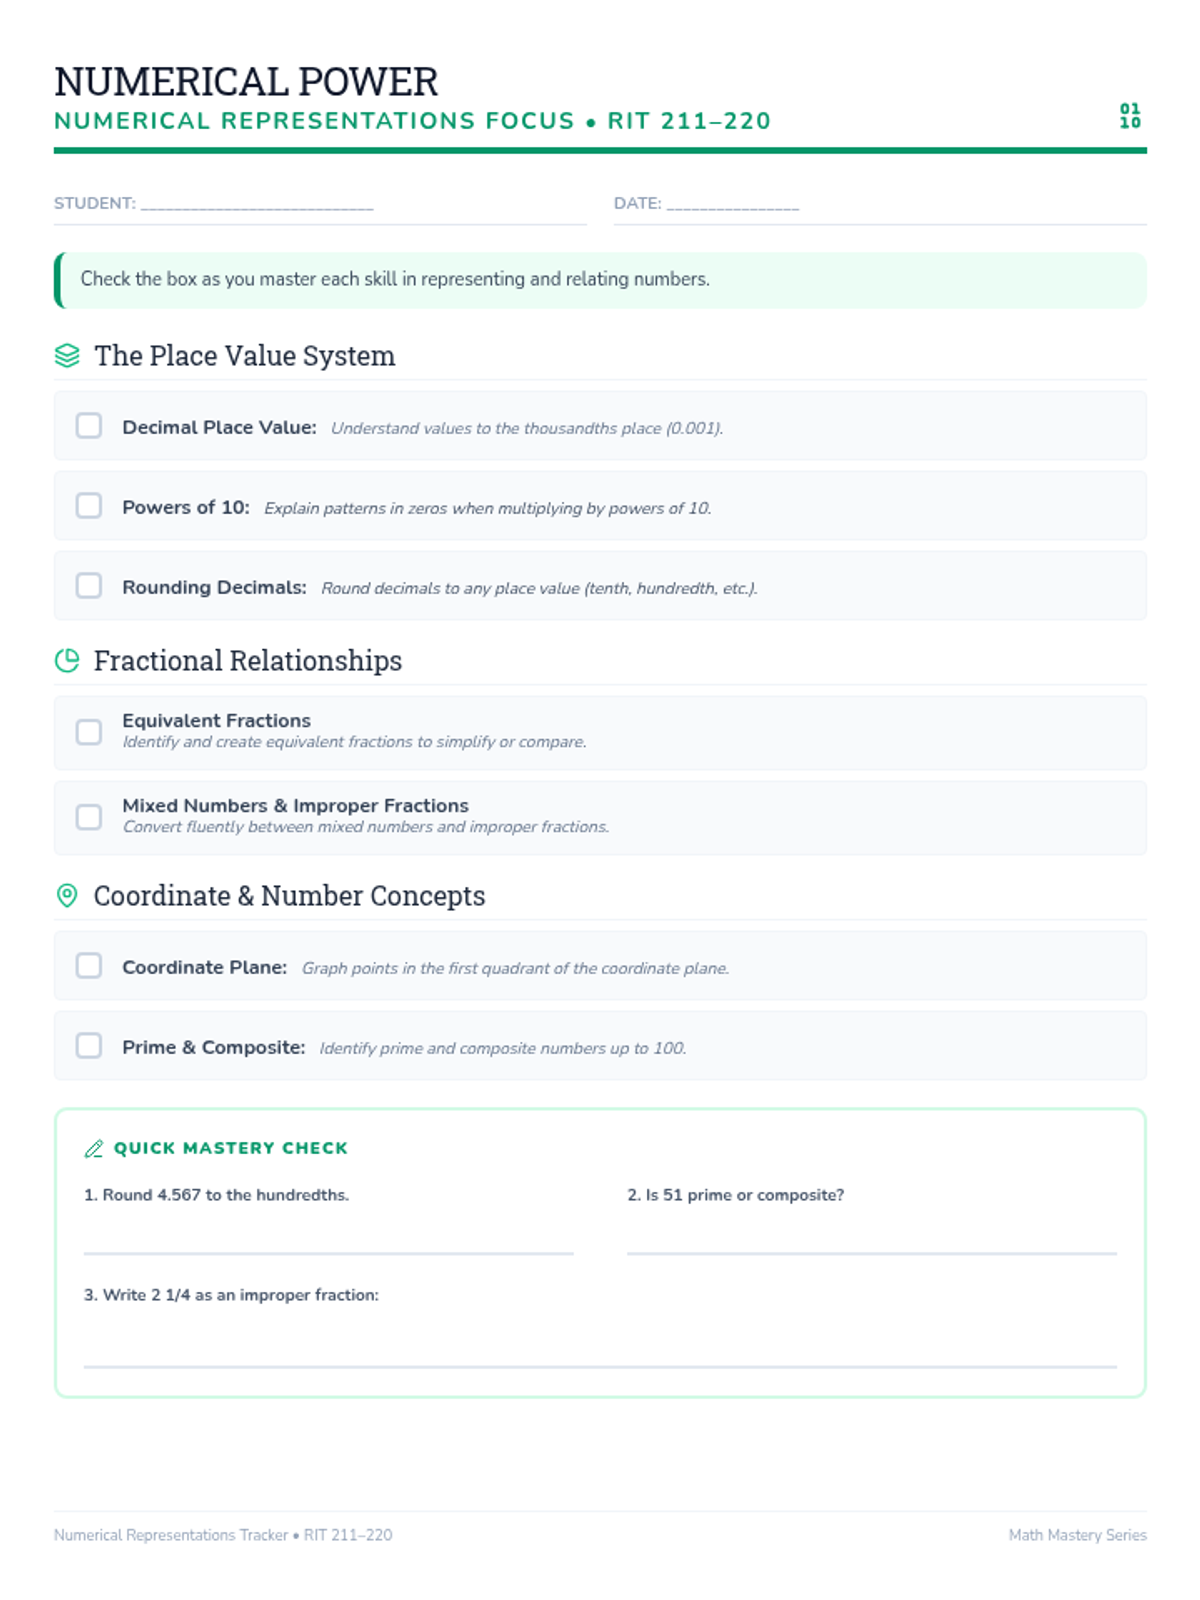
A focused 1-page checklist specifically targeting the Numerical Representations and Relationships domain for the 211-220 RIT range. Includes skills for decimal place value, powers of 10, rounding, and fractional conversions. Revised to improve tag structure and content completeness.
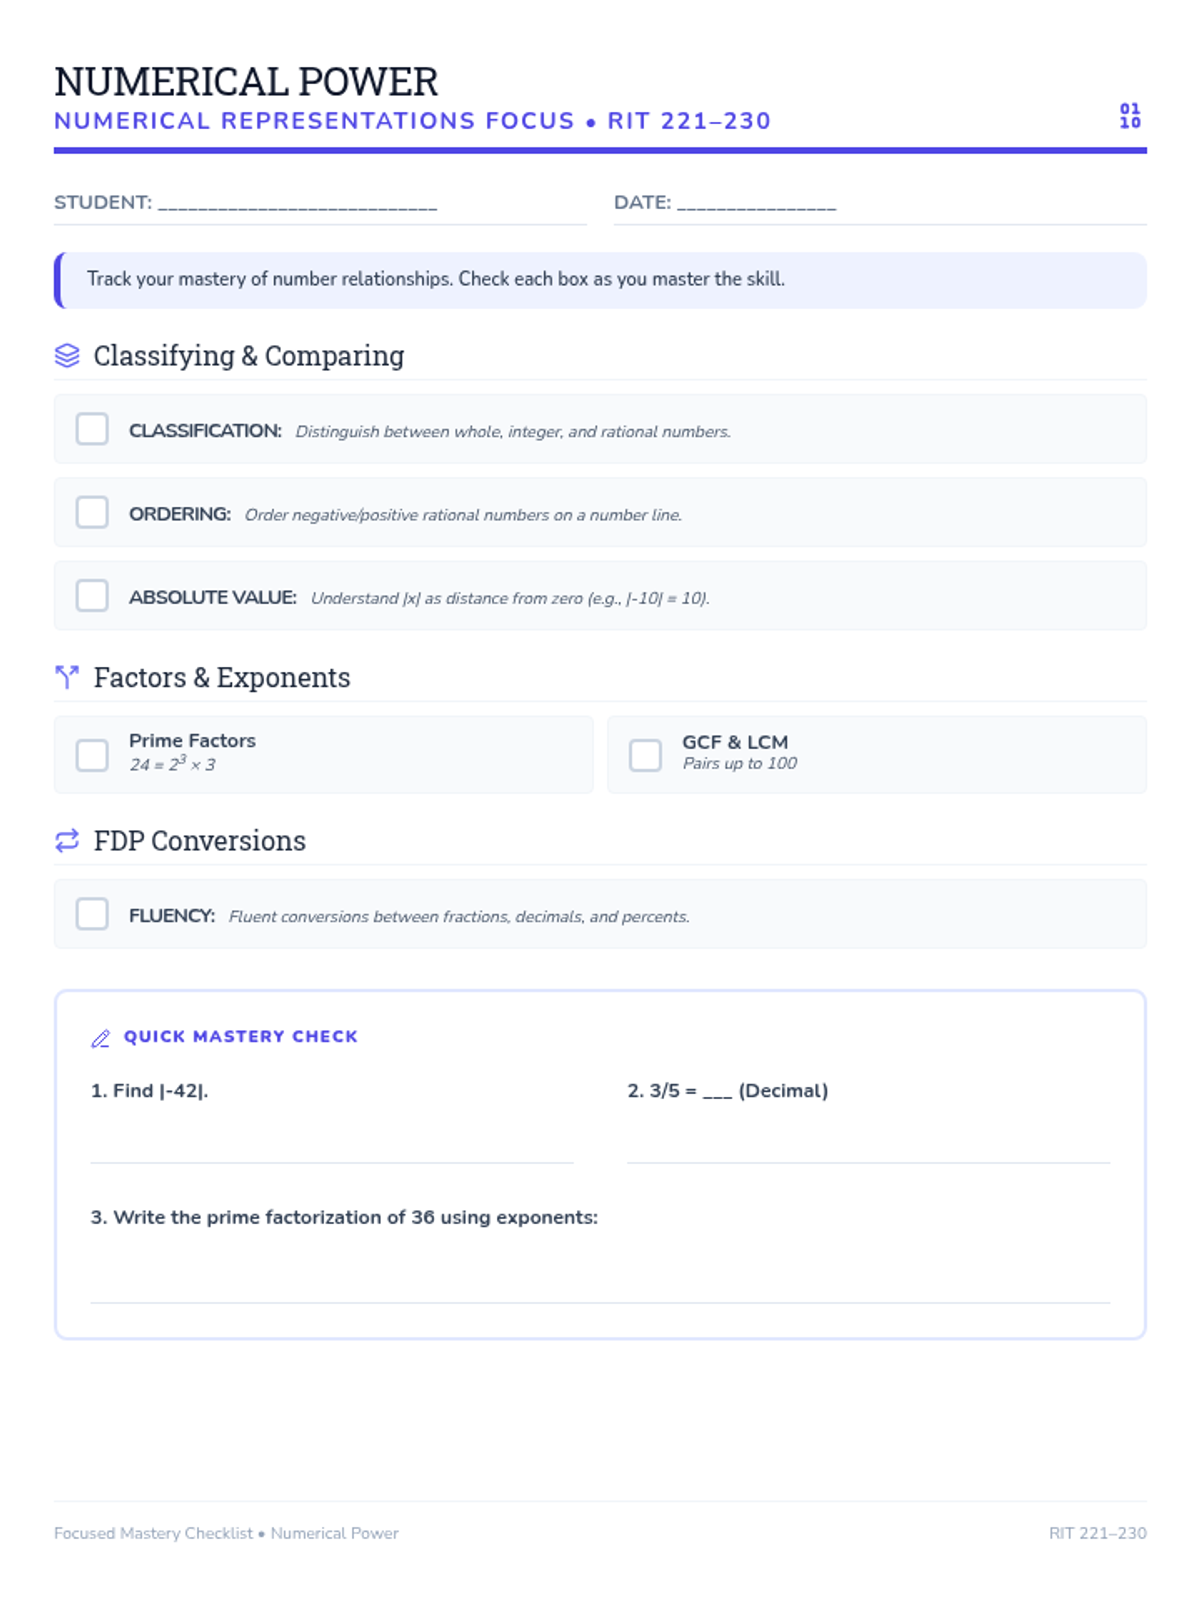
A focused 1-page checklist specifically targeting the Numerical Representations and Relationships domain for the 221-230 RIT range. Includes skills for classification, factors, and conversions. Revised to ensure single-page fit and improved writing area.
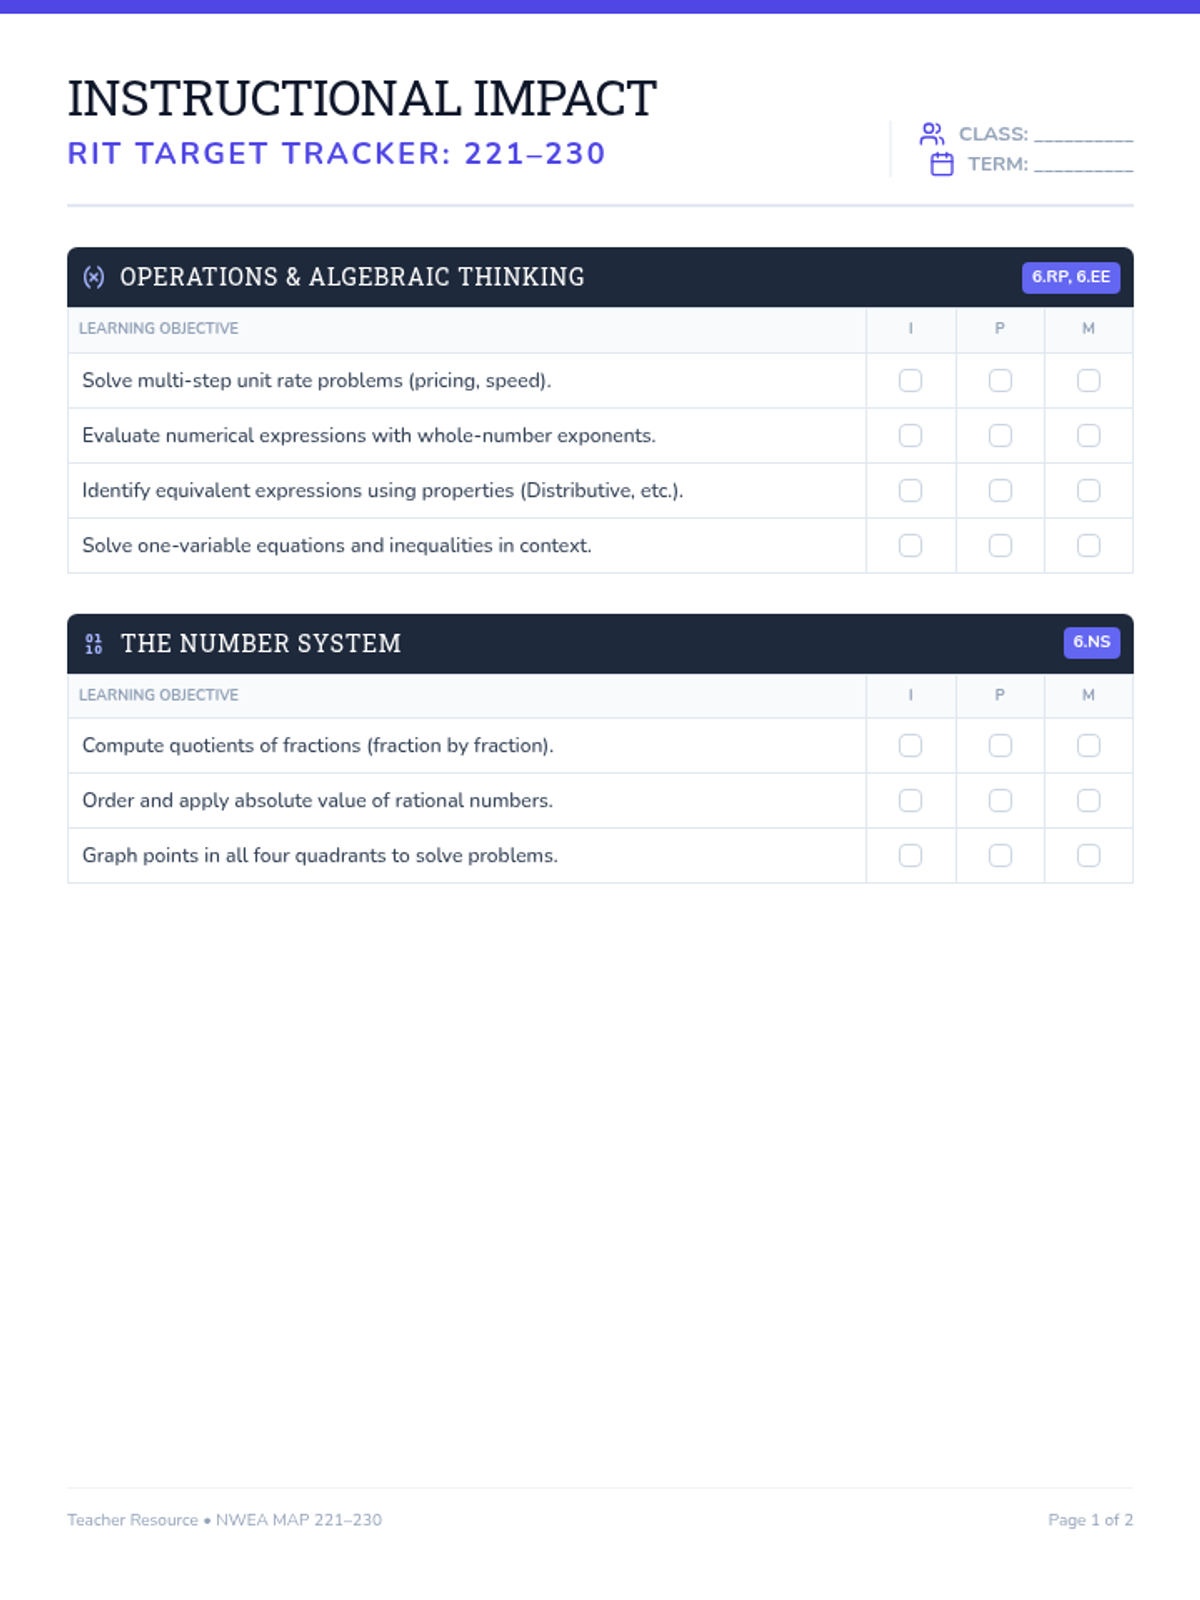
A professional 2-page teacher-facing checklist for tracking instructional progress in the NWEA MAP 221-230 RIT range. Includes CCSS alignments, learning objectives across all domains, and a dedicated space for small group intervention planning. Revised for better page layout and writing space.
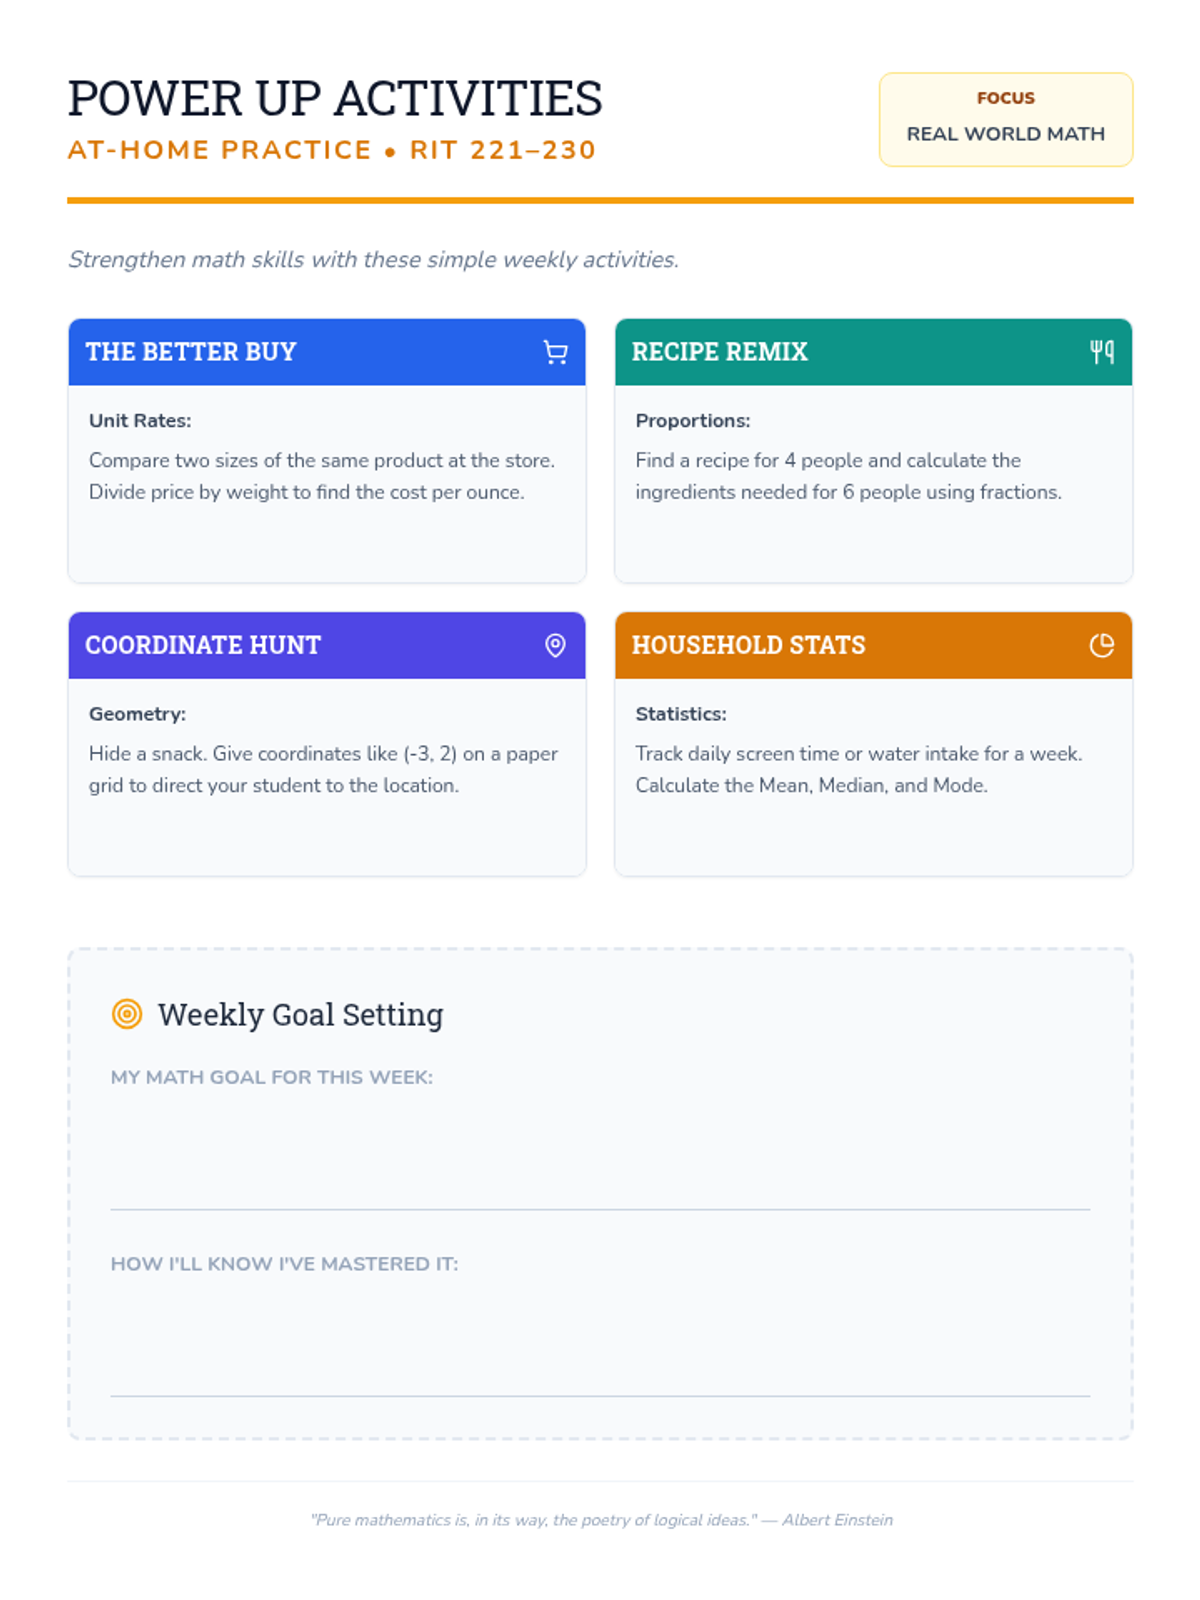
A set of four practical, engaging at-home activities designed for parents and students to practice specific RIT 221-230 math skills together. Revised to fit on a single page with larger writing areas.
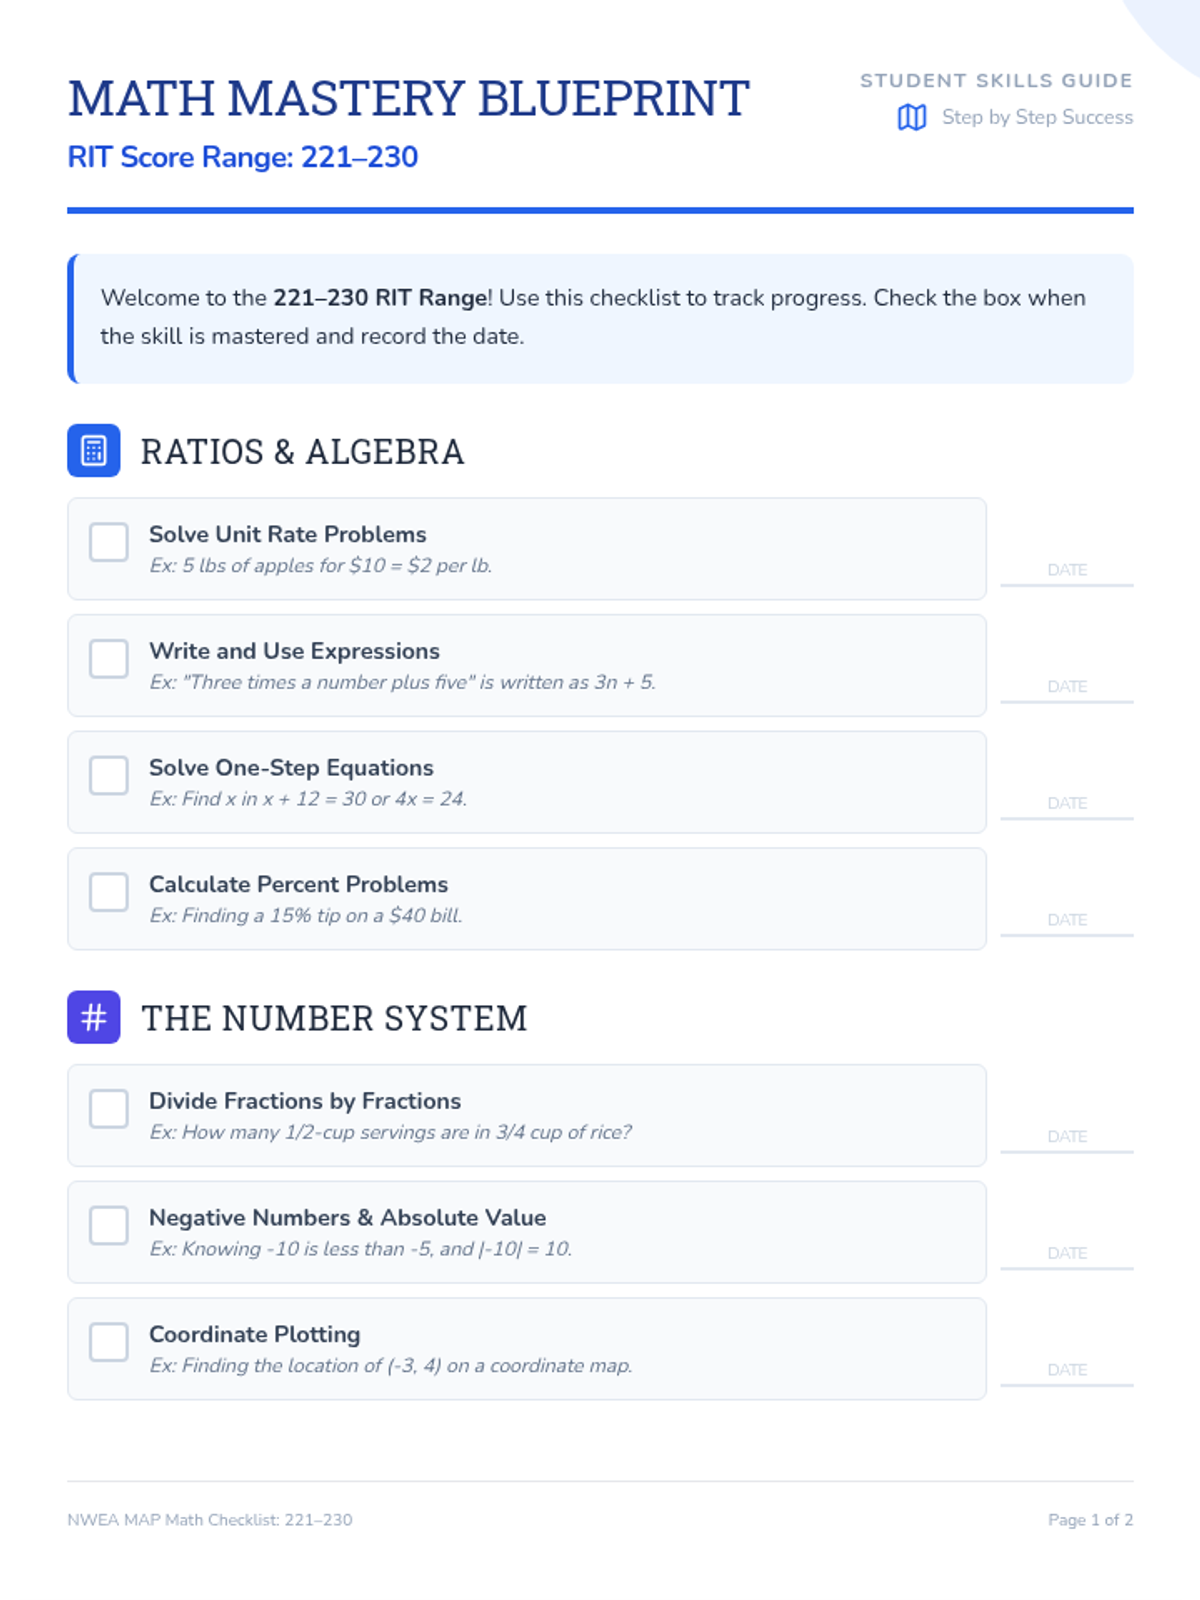
A parent-friendly 2-page checklist and guide covering all mathematical domains for the NWEA MAP RIT range 221-230, including real-world examples and home practice tips. Revised for better page layout and math rendering.
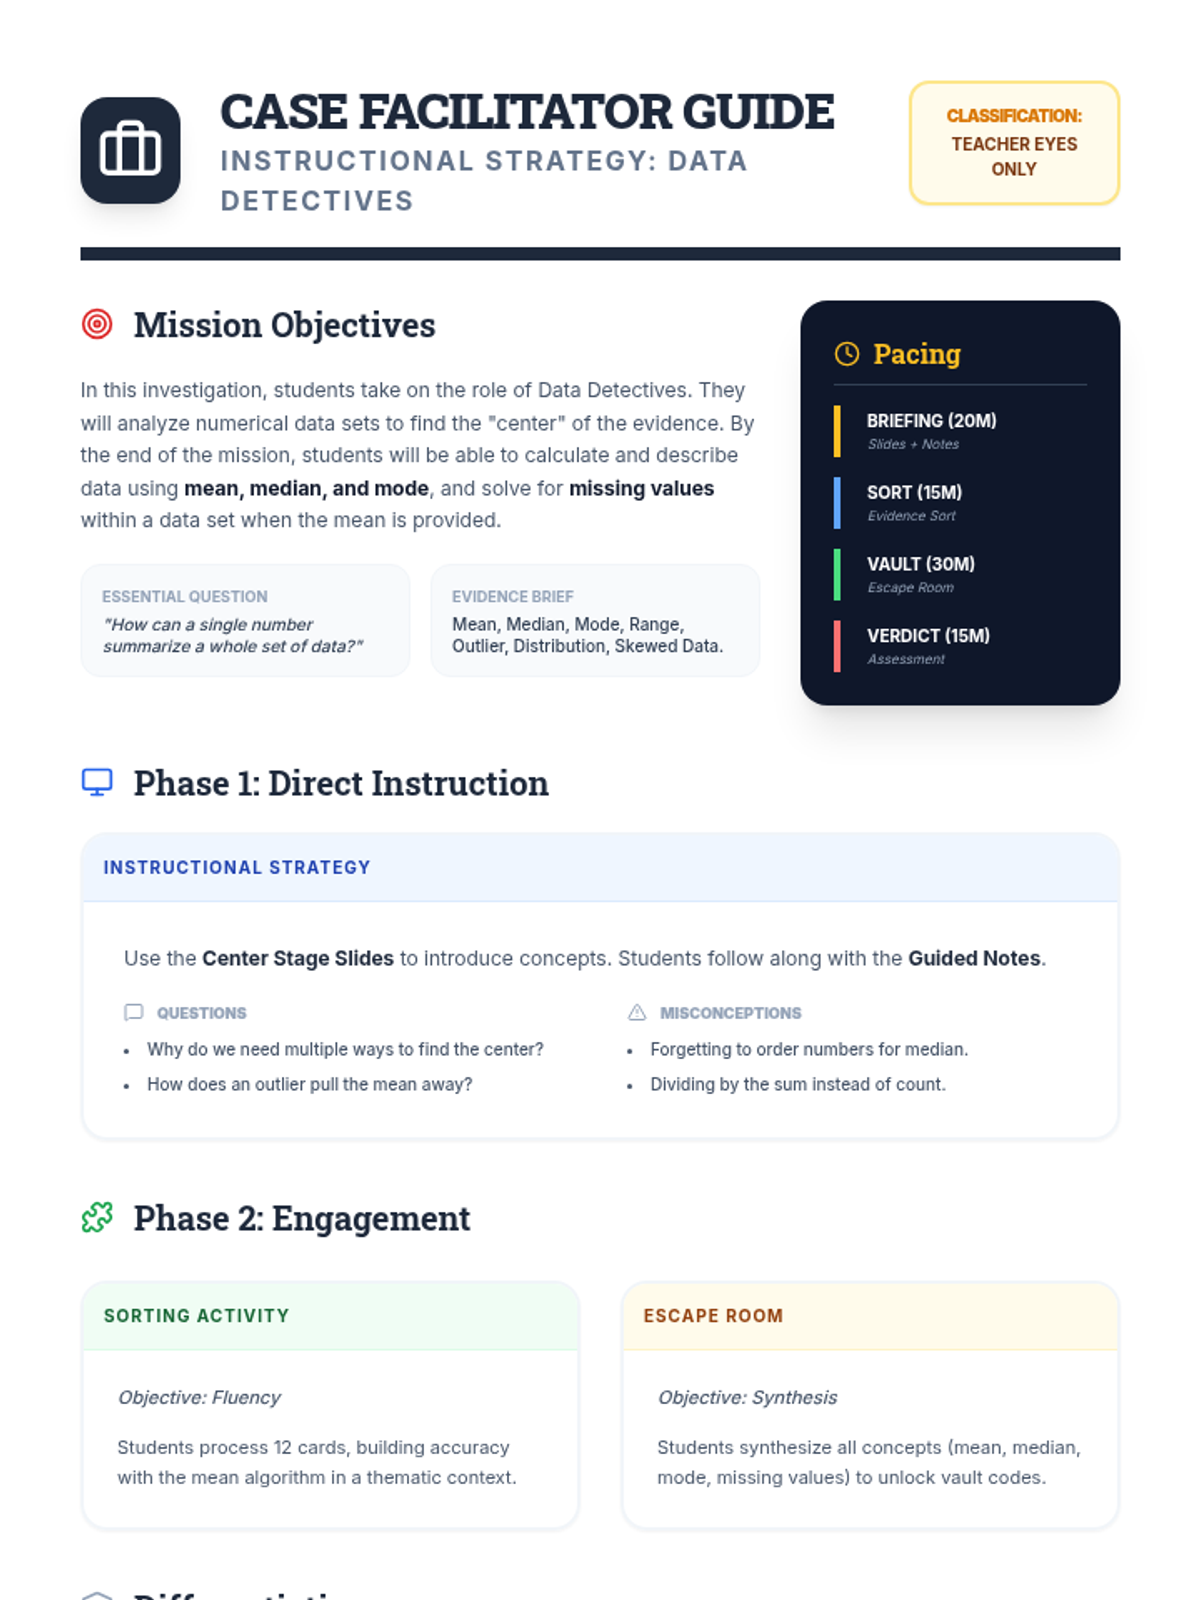
A comprehensive teacher guide for the "Data Detectives" lesson. Includes lesson objectives, a detailed pacing guide, instructional strategies for slides and activities, common misconceptions, and differentiation tips for supporting and challenging students. Revised to fix layout, spacing, and page break issues.
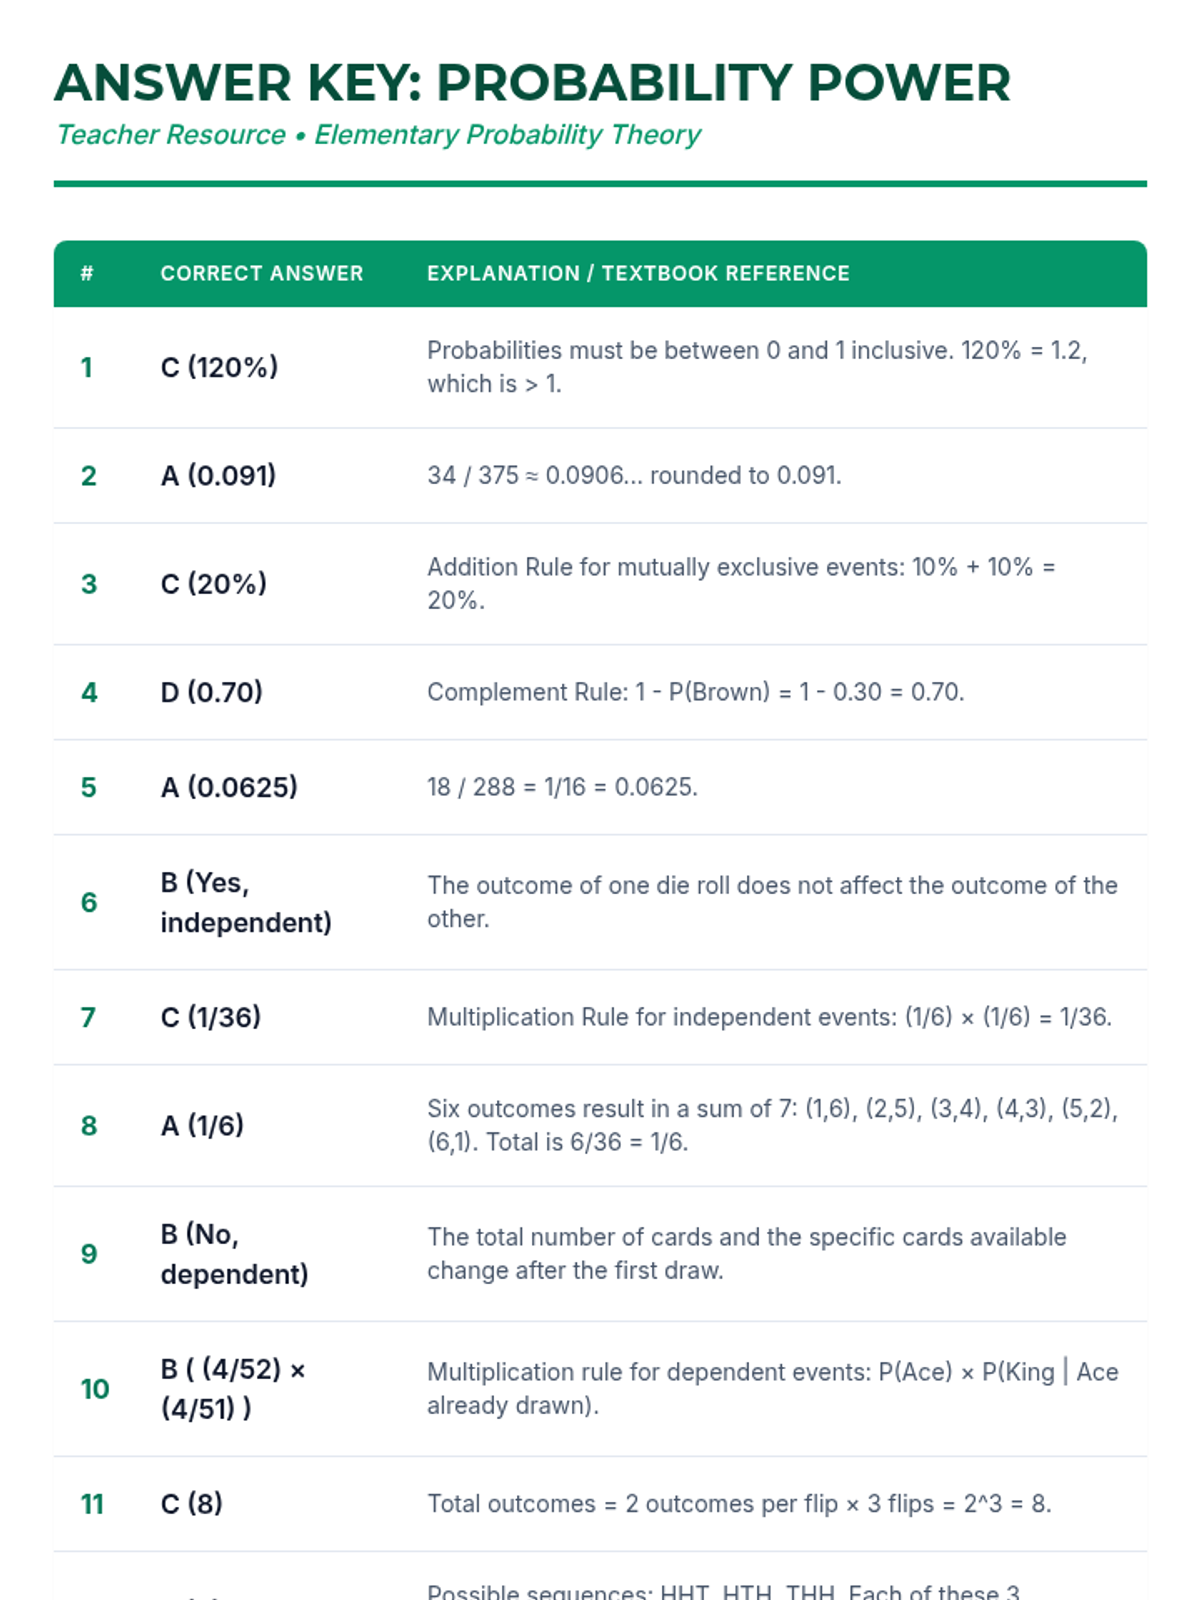
An answer key for the Probability Power Quiz, including detailed explanations and mathematical justifications for each of the 15 questions.
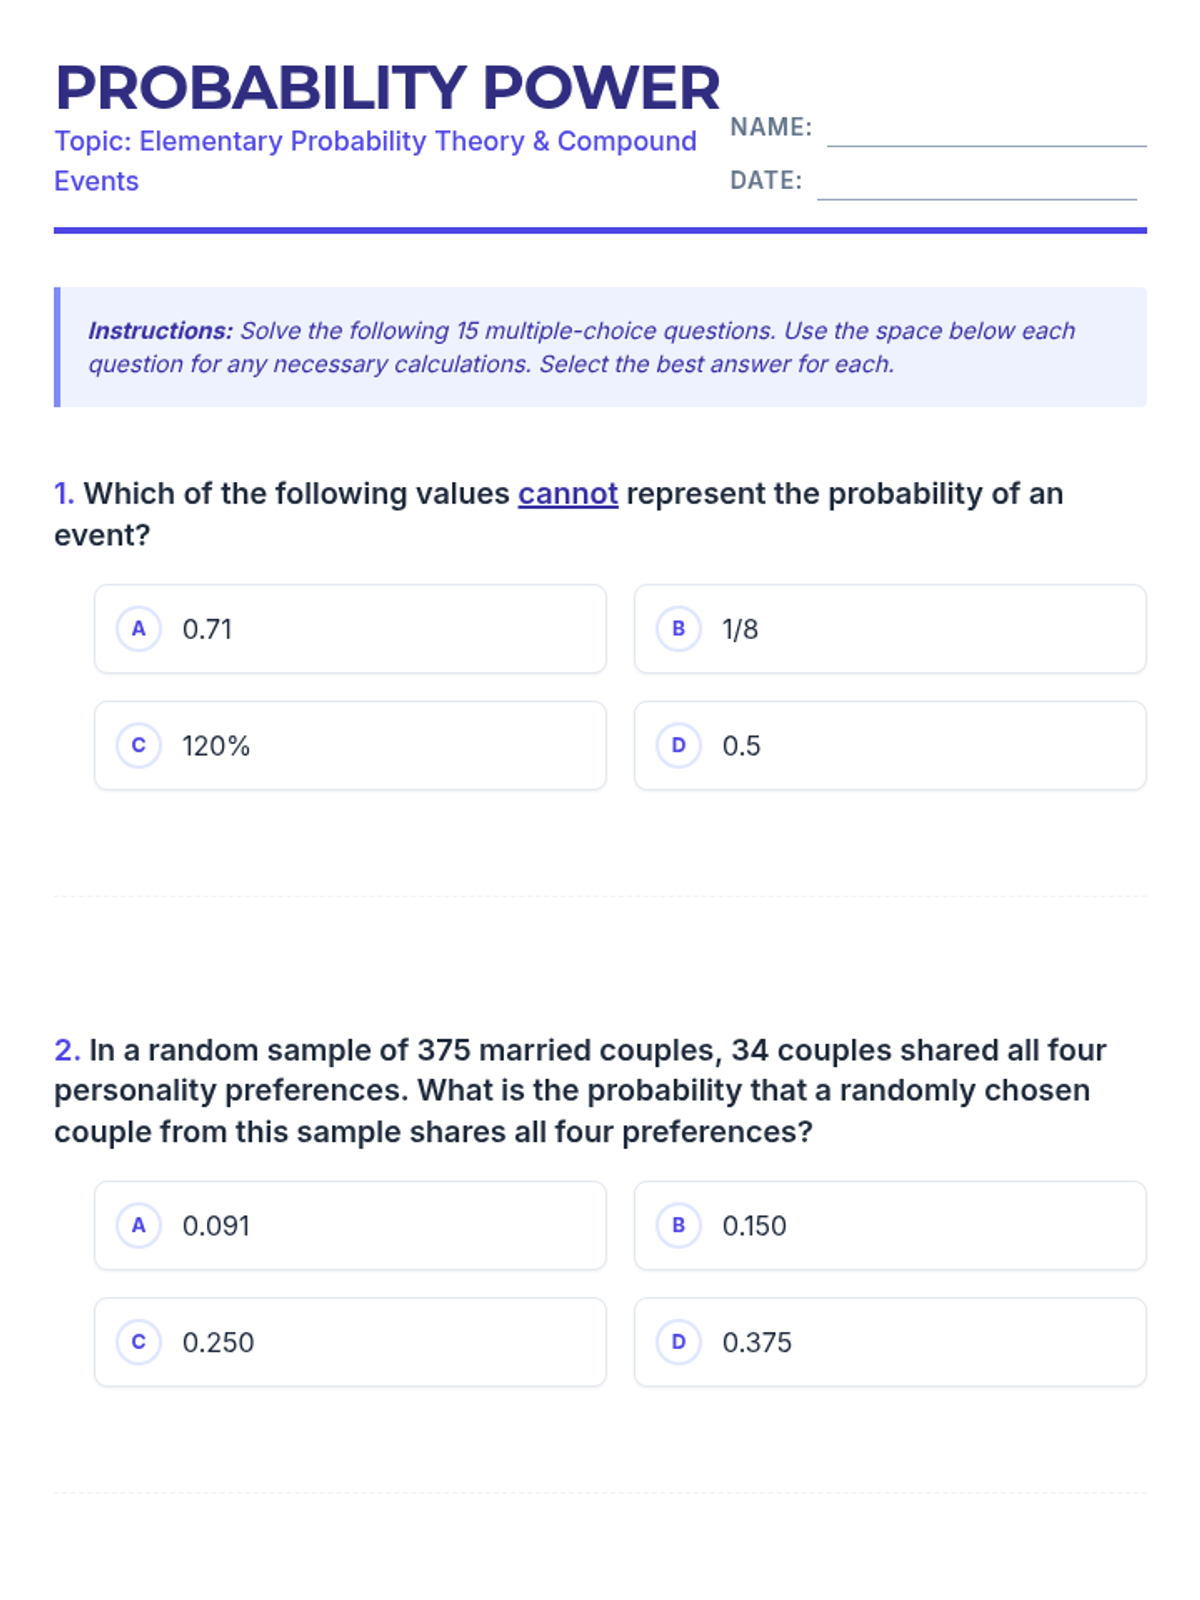
A 15-question multiple-choice worksheet on elementary probability theory. It covers concepts like valid probability ranges, compound events, and tree diagrams based on textbook problems. Includes designated scratch work areas.
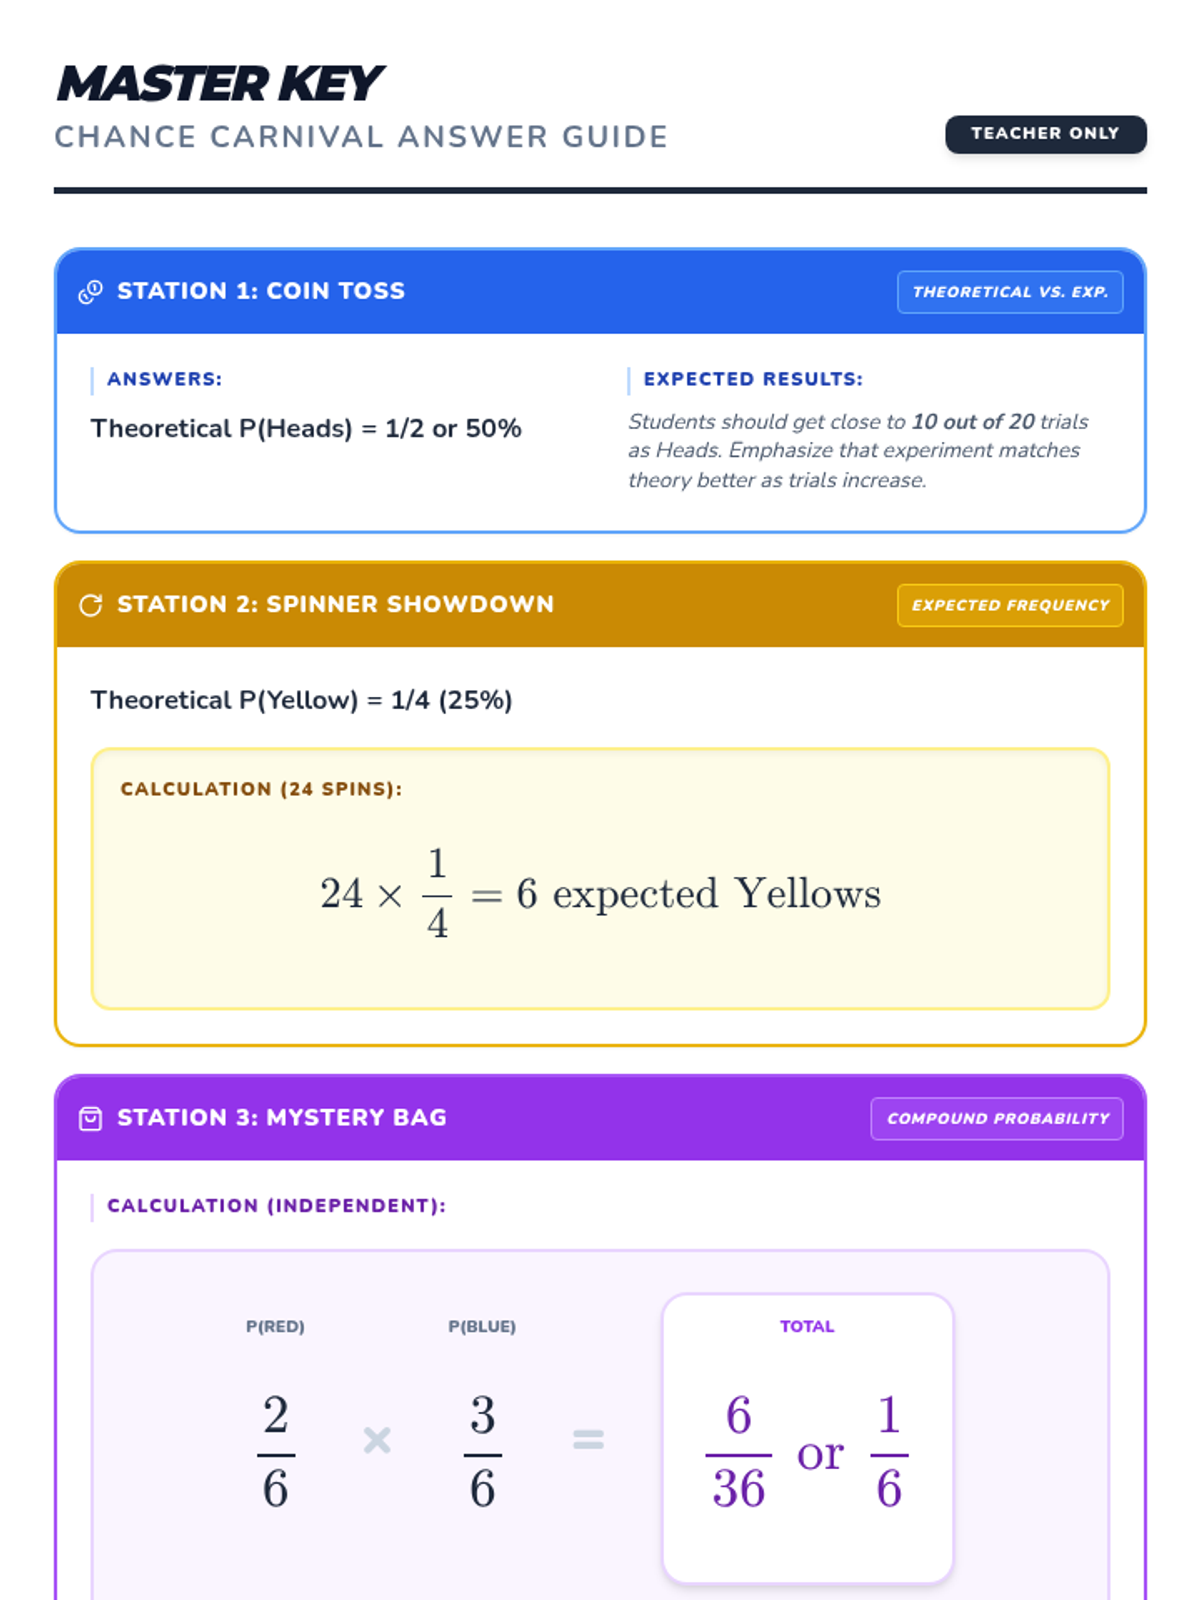
The answer key for the Chance Carnival lab, updated to reflect the change from marbles to colored blocks for Station 3. It provides theoretical probabilities, expected frequencies, and sample space breakdowns for teacher use.
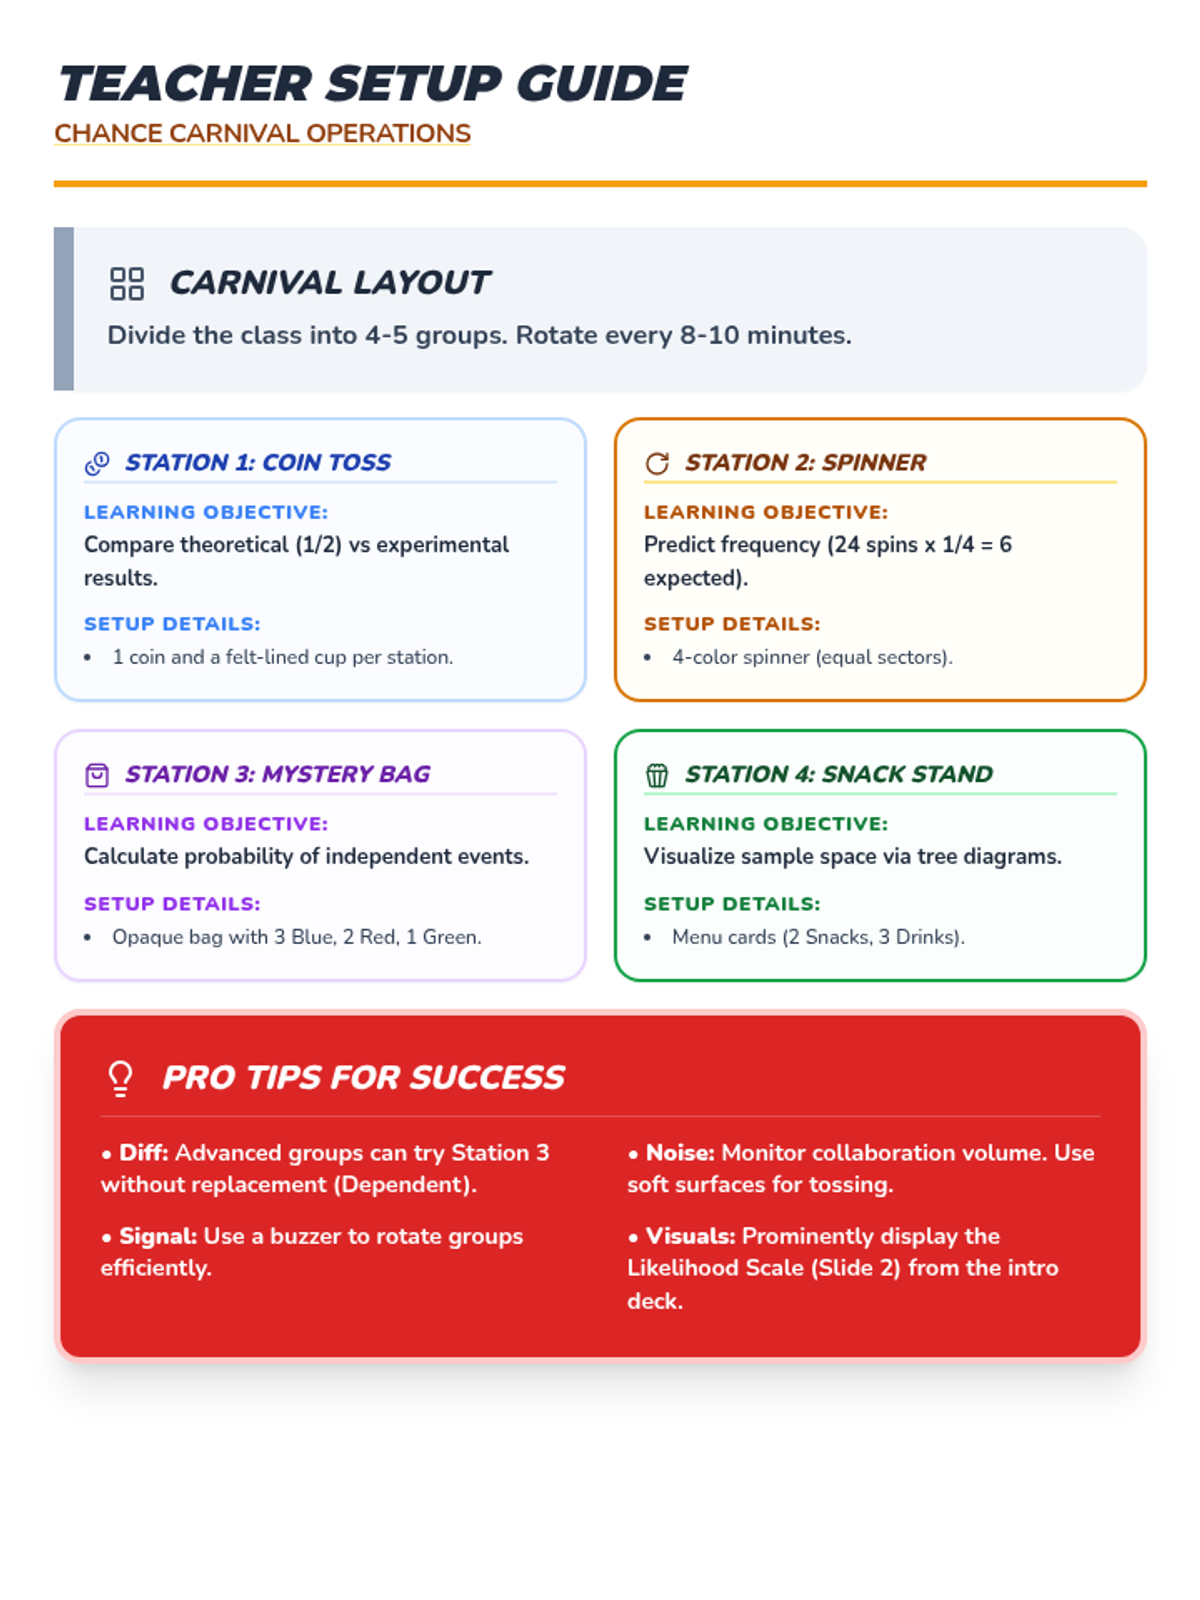
A comprehensive teacher resource providing instructions for setup, learning objectives, and facilitation tips for the probability rotation stations. Updated to reflect the change from marbles to colored blocks for Station 3.
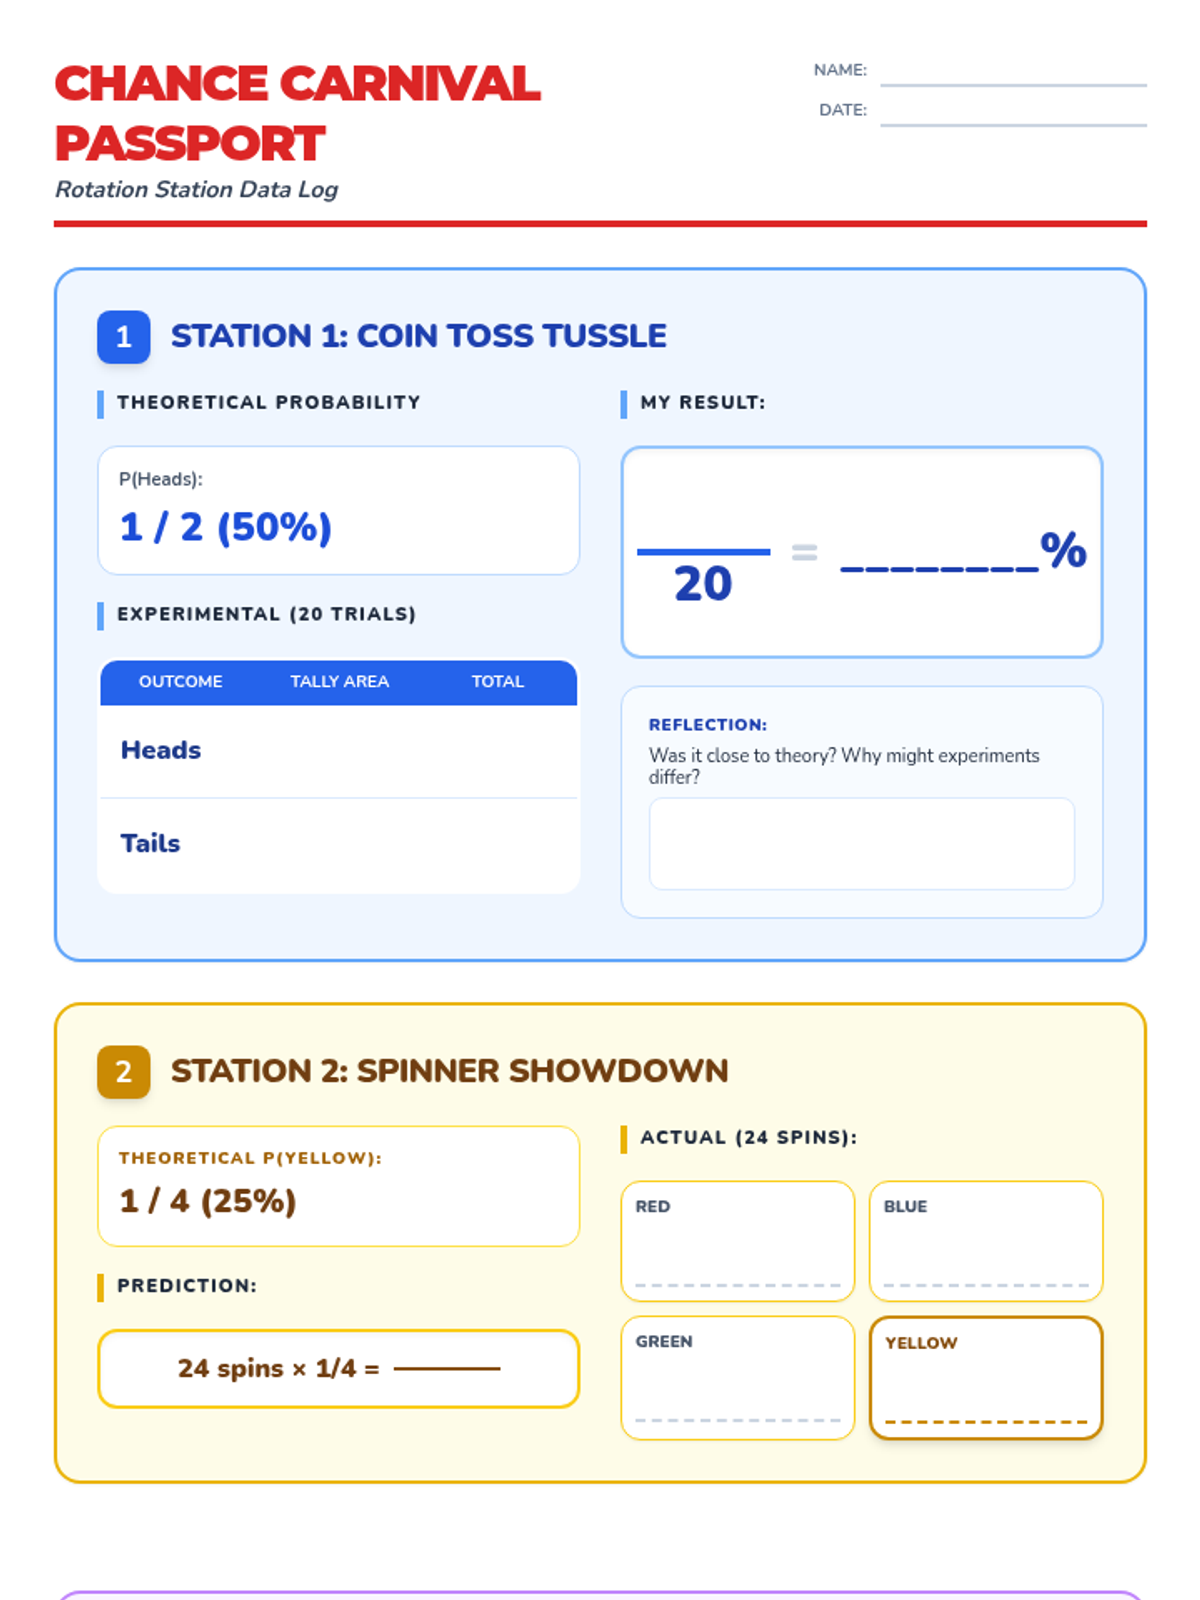
An updated student 'Passport' document where Station 2's tally area has been repurposed as a larger reflection space. Station 4 remains a challenge with no spoilers on outcomes, and Station 3 uses colored blocks with a visual guide. Refined layouts ensure maximum workspace and legibility for all probability rotations.
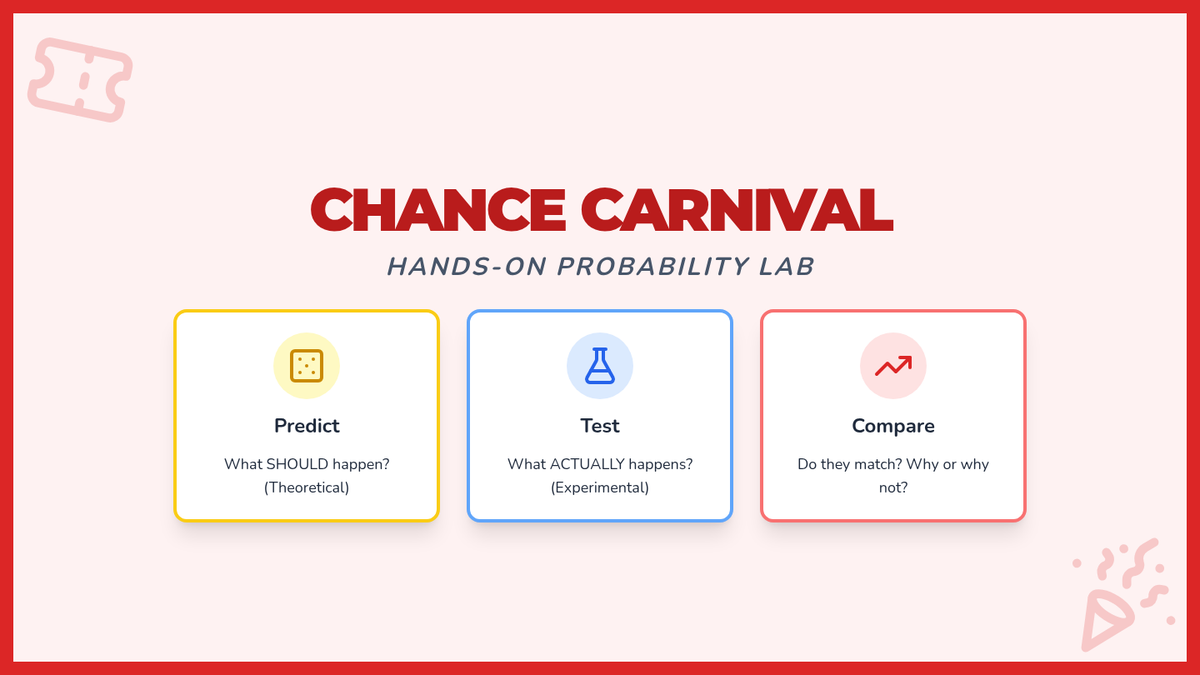
An engaging slide deck to introduce the Chance Carnival hands-on probability stations. Updated to reflect the change from marbles to blocks for Station 3 and the increased complexity of the Station 4 Mega Combo Tree. Includes clear visual aids for likelihood and station rules. Updated Slide 4 to remove outcome counts to match the student worksheet.
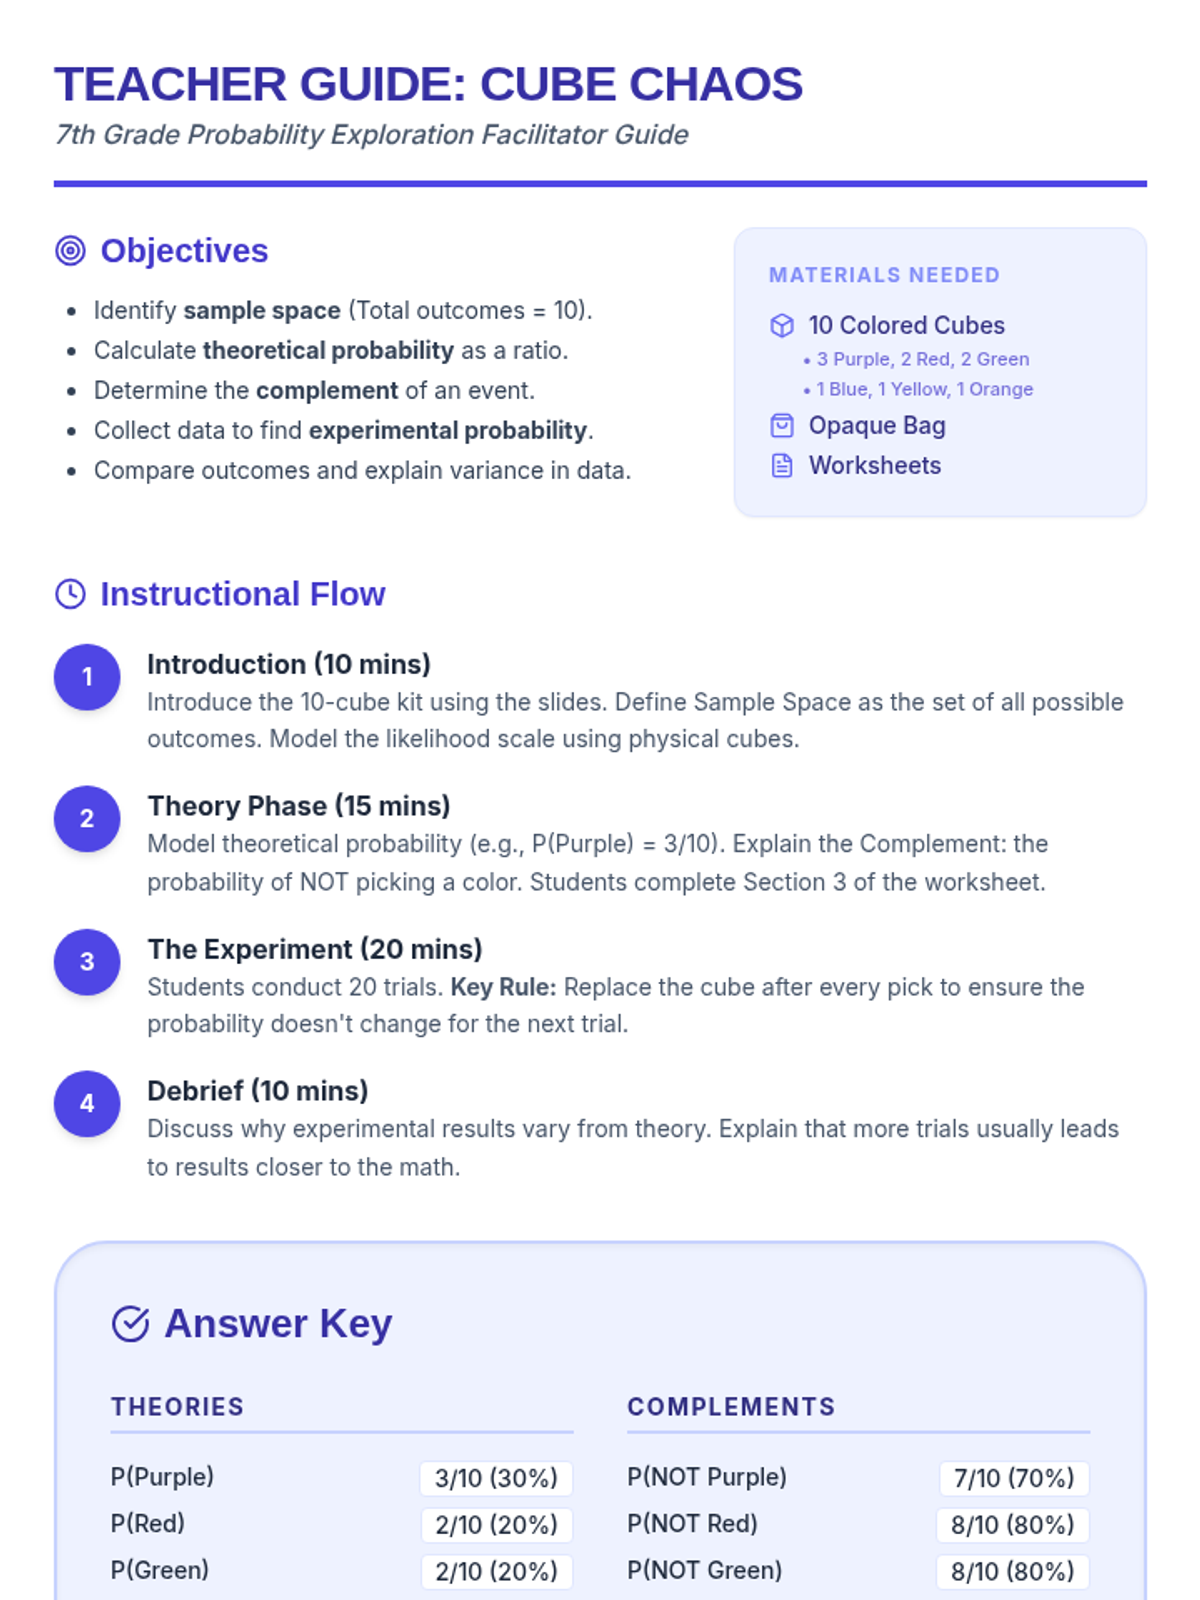
A comprehensive teacher guide for the Cube Chaos lesson with refined pacing, instructional notes, and a complete answer key for theoretical probabilities and complements of all 6 colors.
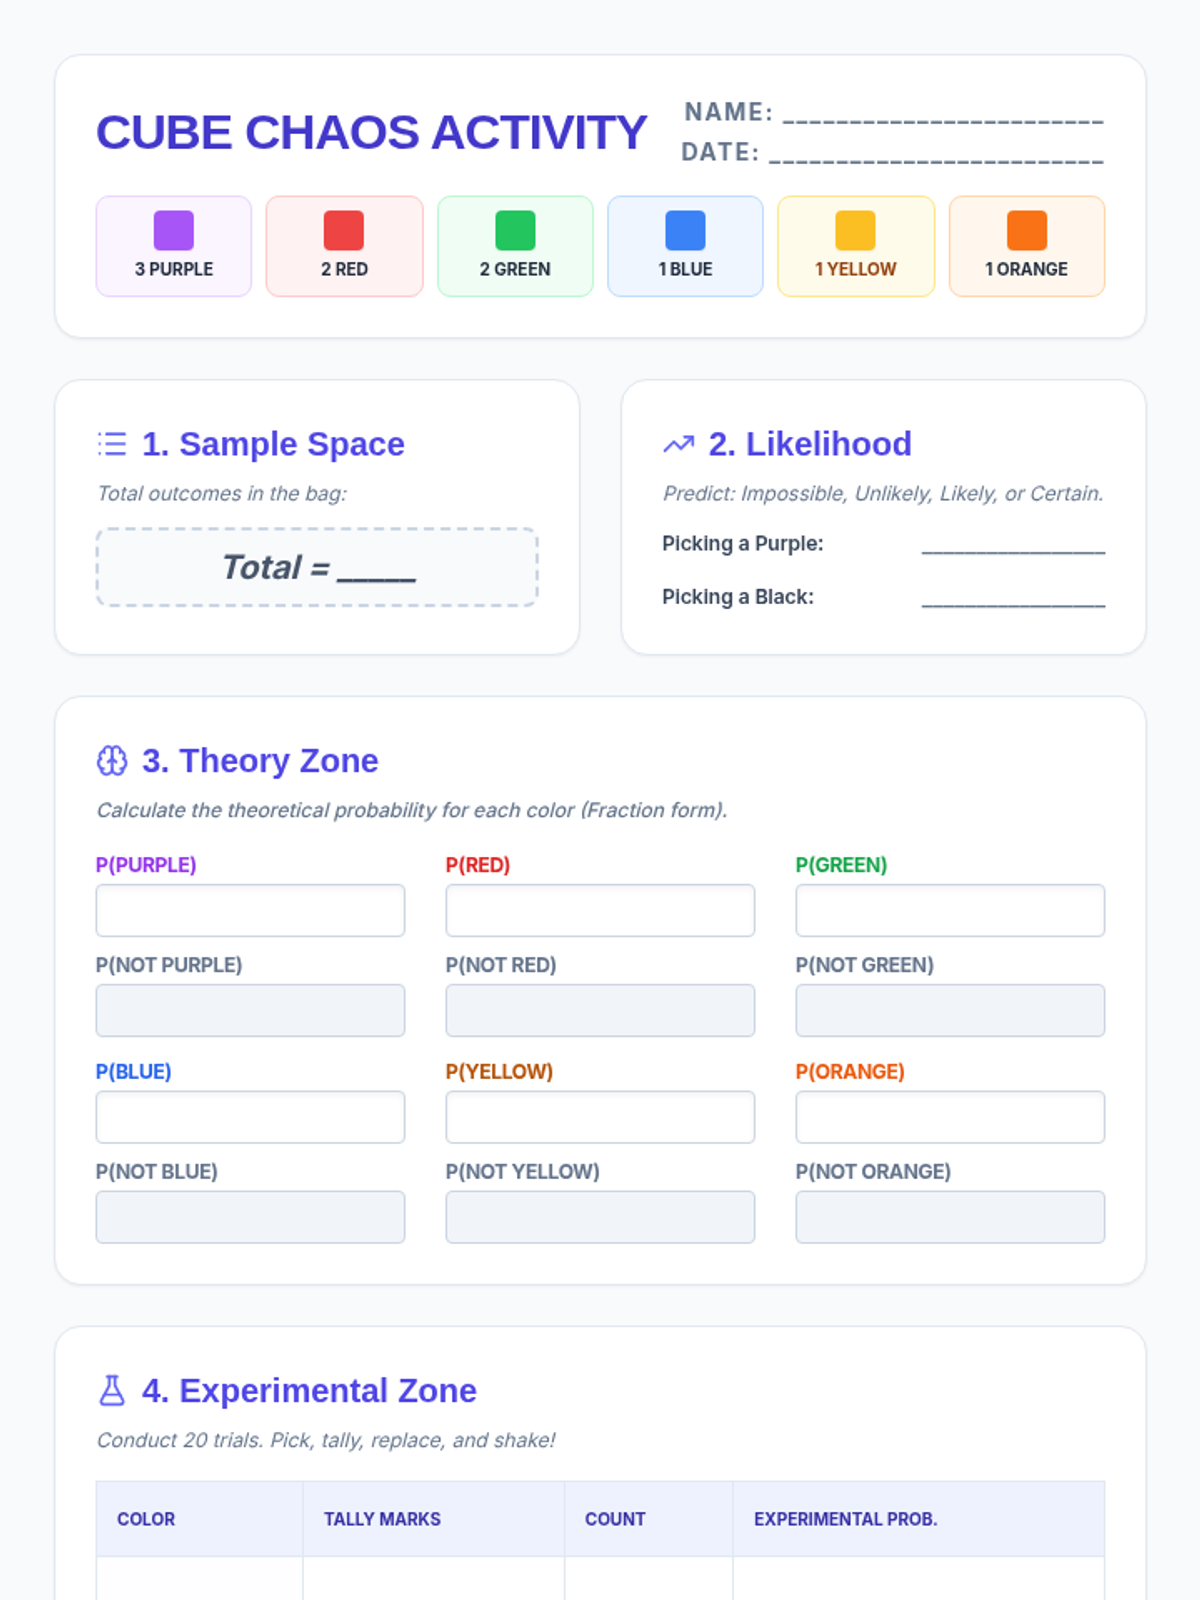
A two-page student activity worksheet for recording sample space, calculating theoretical probability and complements for all 6 colors, and conducting 20 trials with expanded writing space and improved contrast.
A colorful and engaging 12-slide presentation introducing 7th-grade probability concepts (sample space, likelihood, theoretical, complement, and experimental) using a set of 10 colored cubes. Each concept includes a dedicated practice slide.
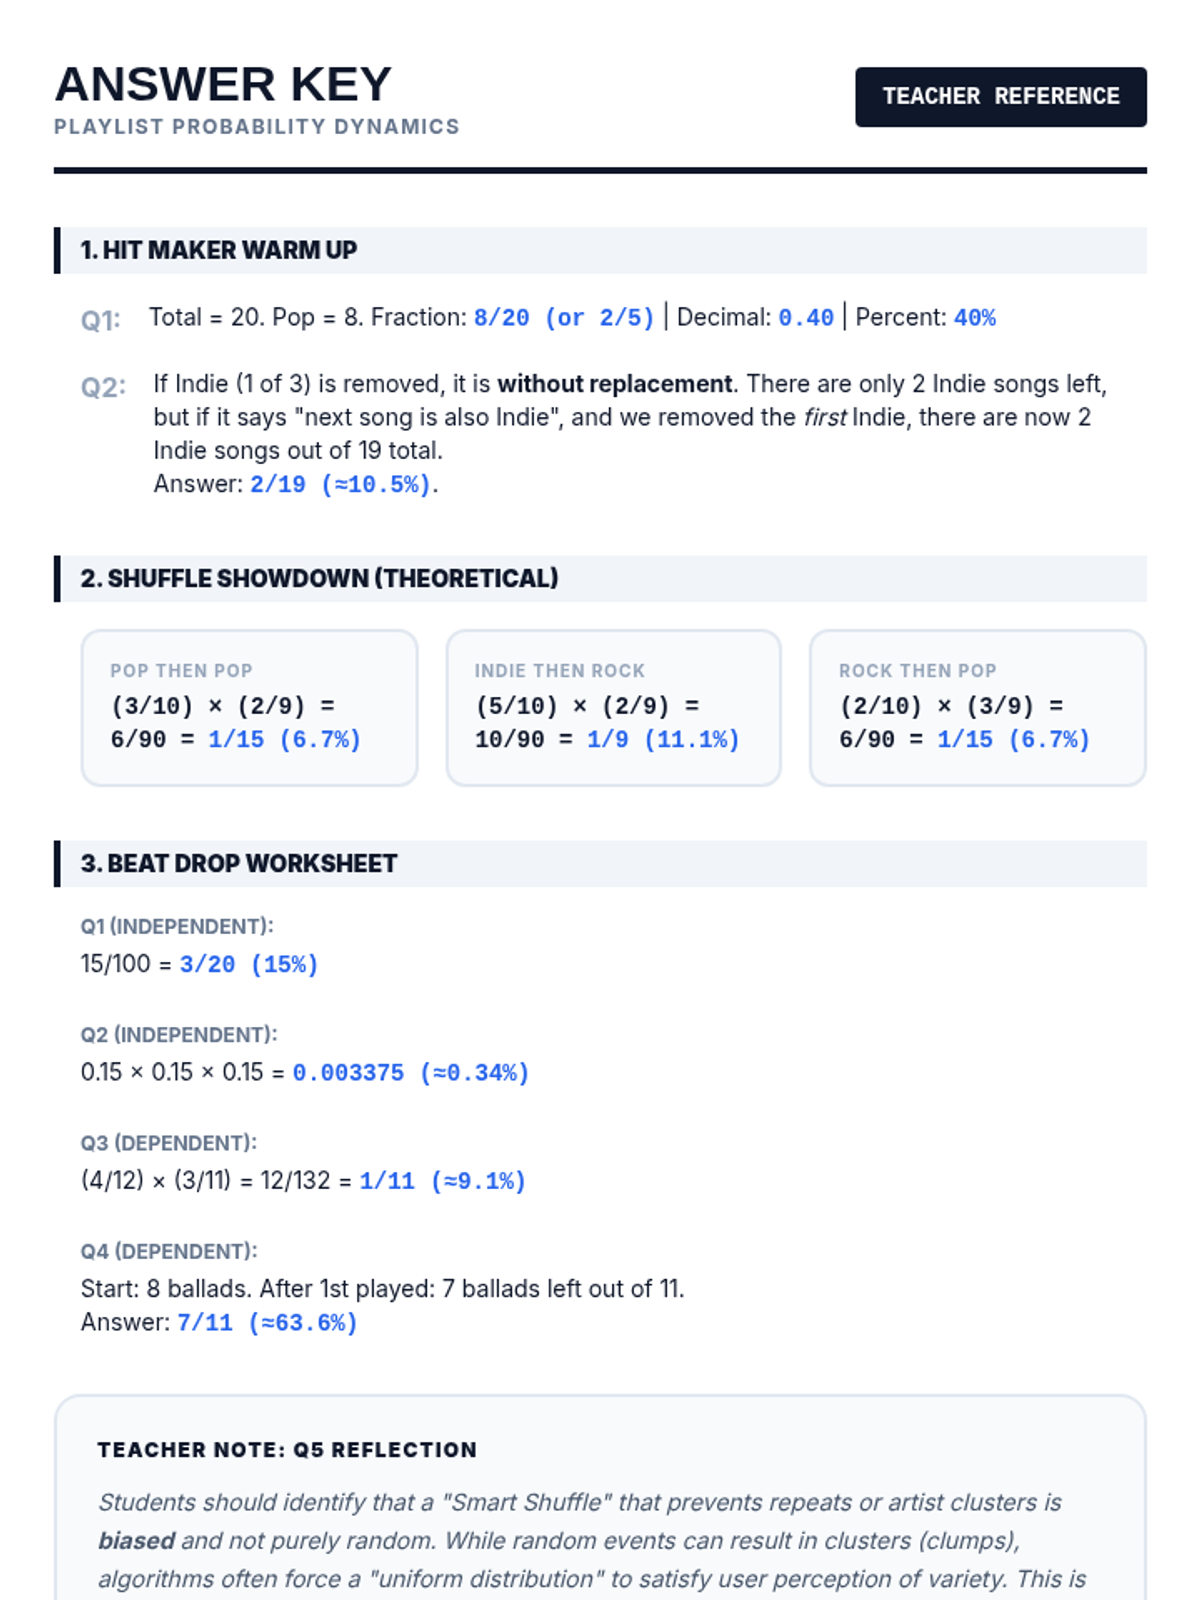
A consolidated answer key for the Playlist Probability Dynamics lesson. Updated with improved header tracking and consolidated layout.
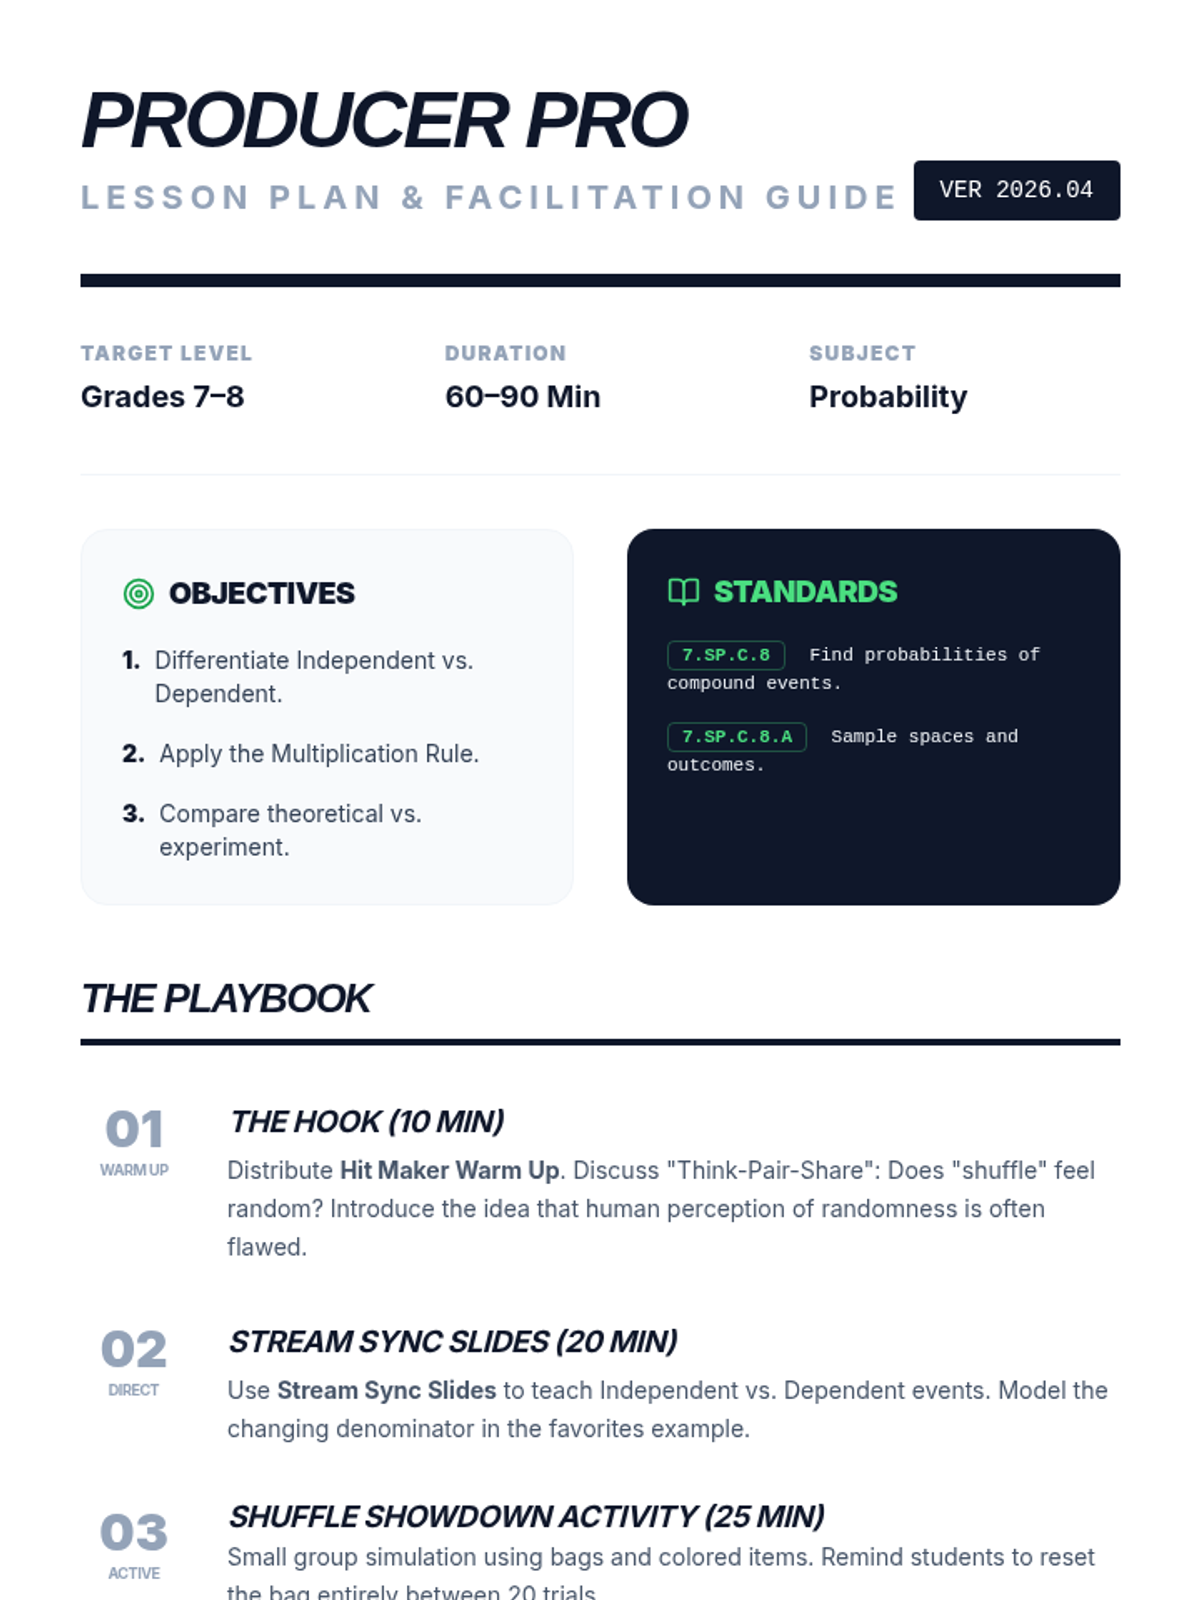
A detailed teacher's guide for the Playlist Probability Dynamics lesson. Updated with improved color contrast for standards and a stable layout for differentiation strategies.
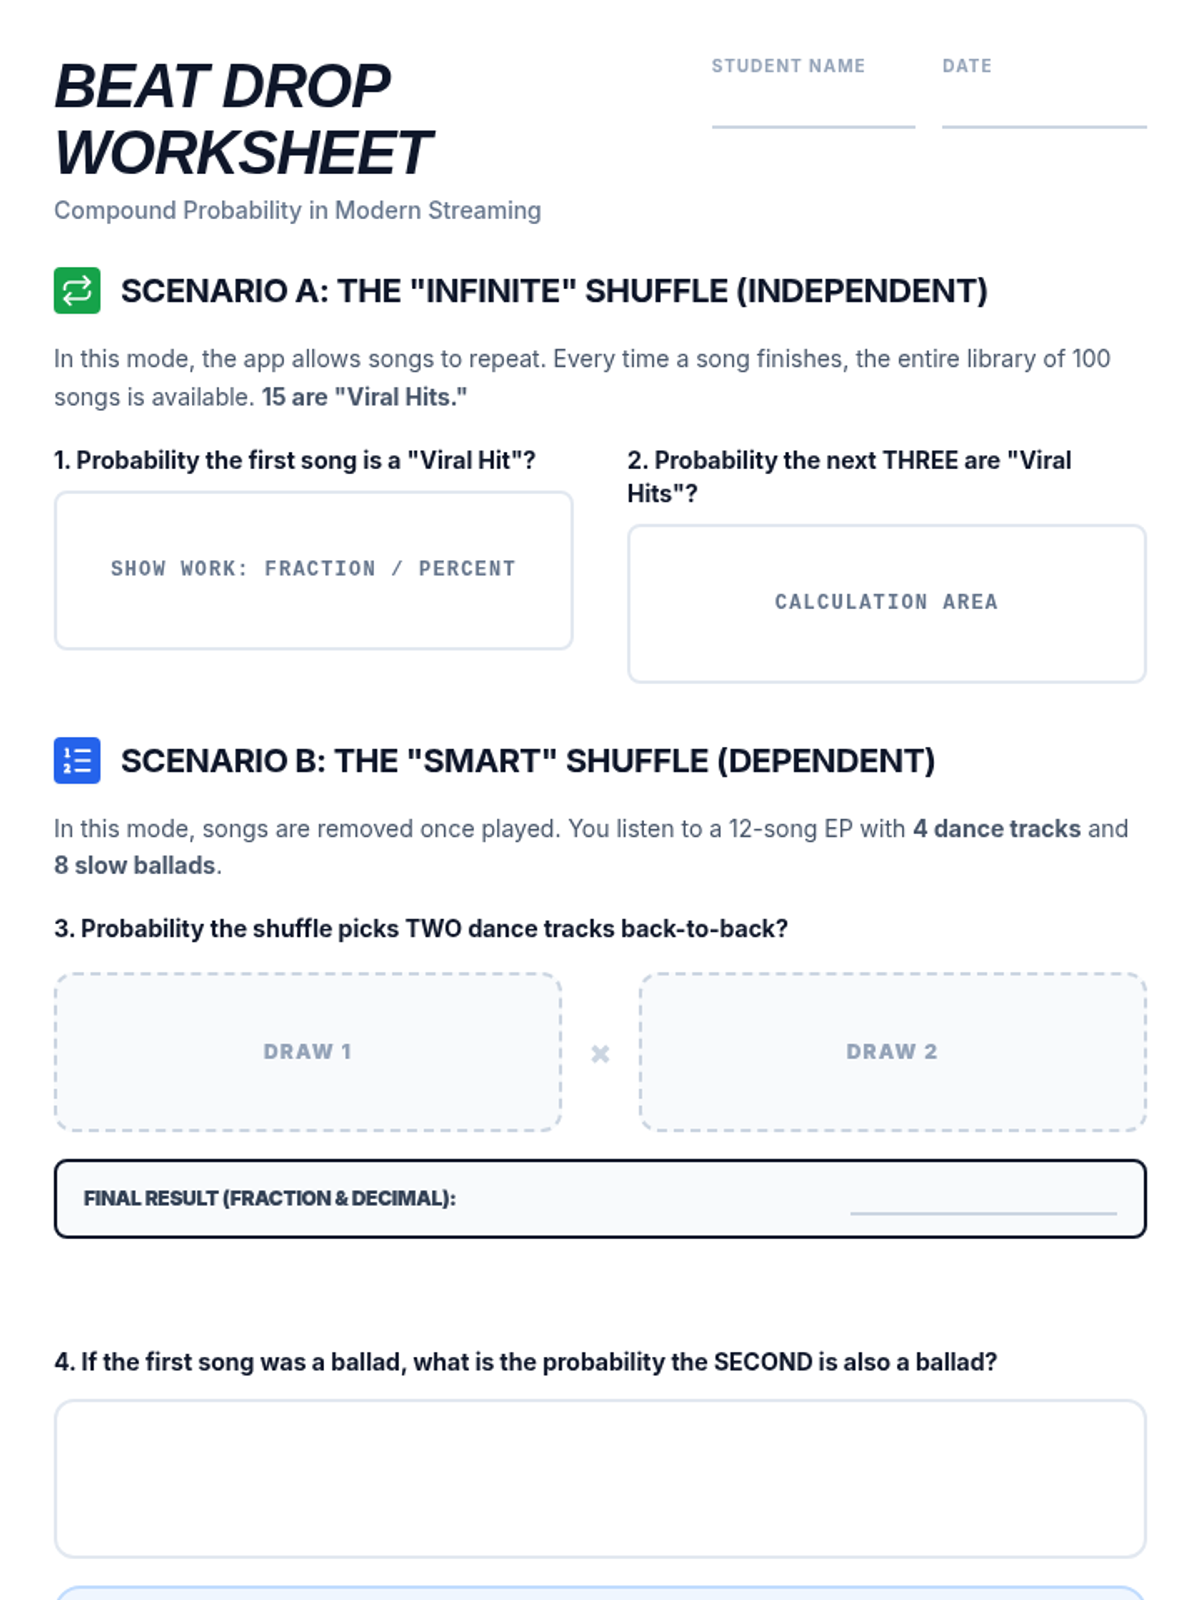
A comprehensive practice worksheet featuring word problems about independent and dependent compound probability. Updated for better page flow and student work area legibility.
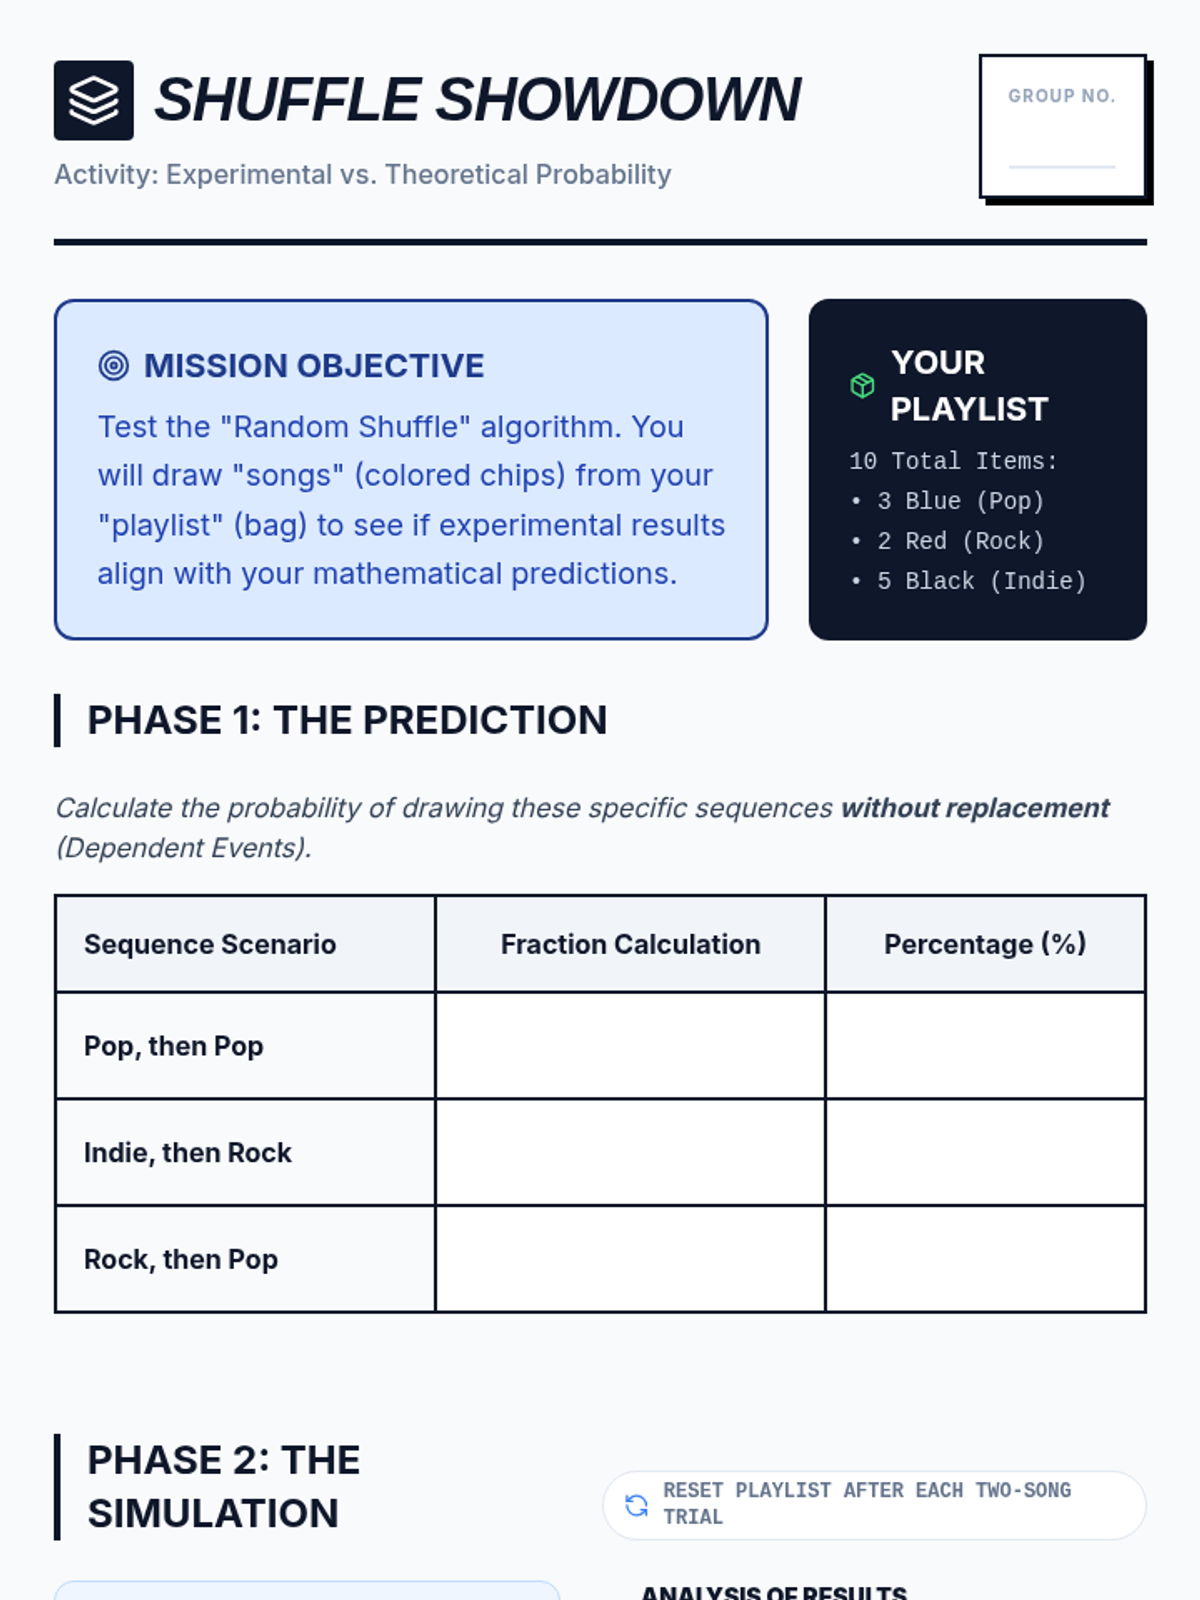
A hands-on activity sheet for students to conduct a shuffle simulation. Updated with clarified simulation rules, improved layout on page 2, and print-friendly input areas.
A high-energy, dark-themed slide deck that introduces compound probability concepts through the lens of music streaming algorithms. Updated with corrected math formulas and improved visual contrast.
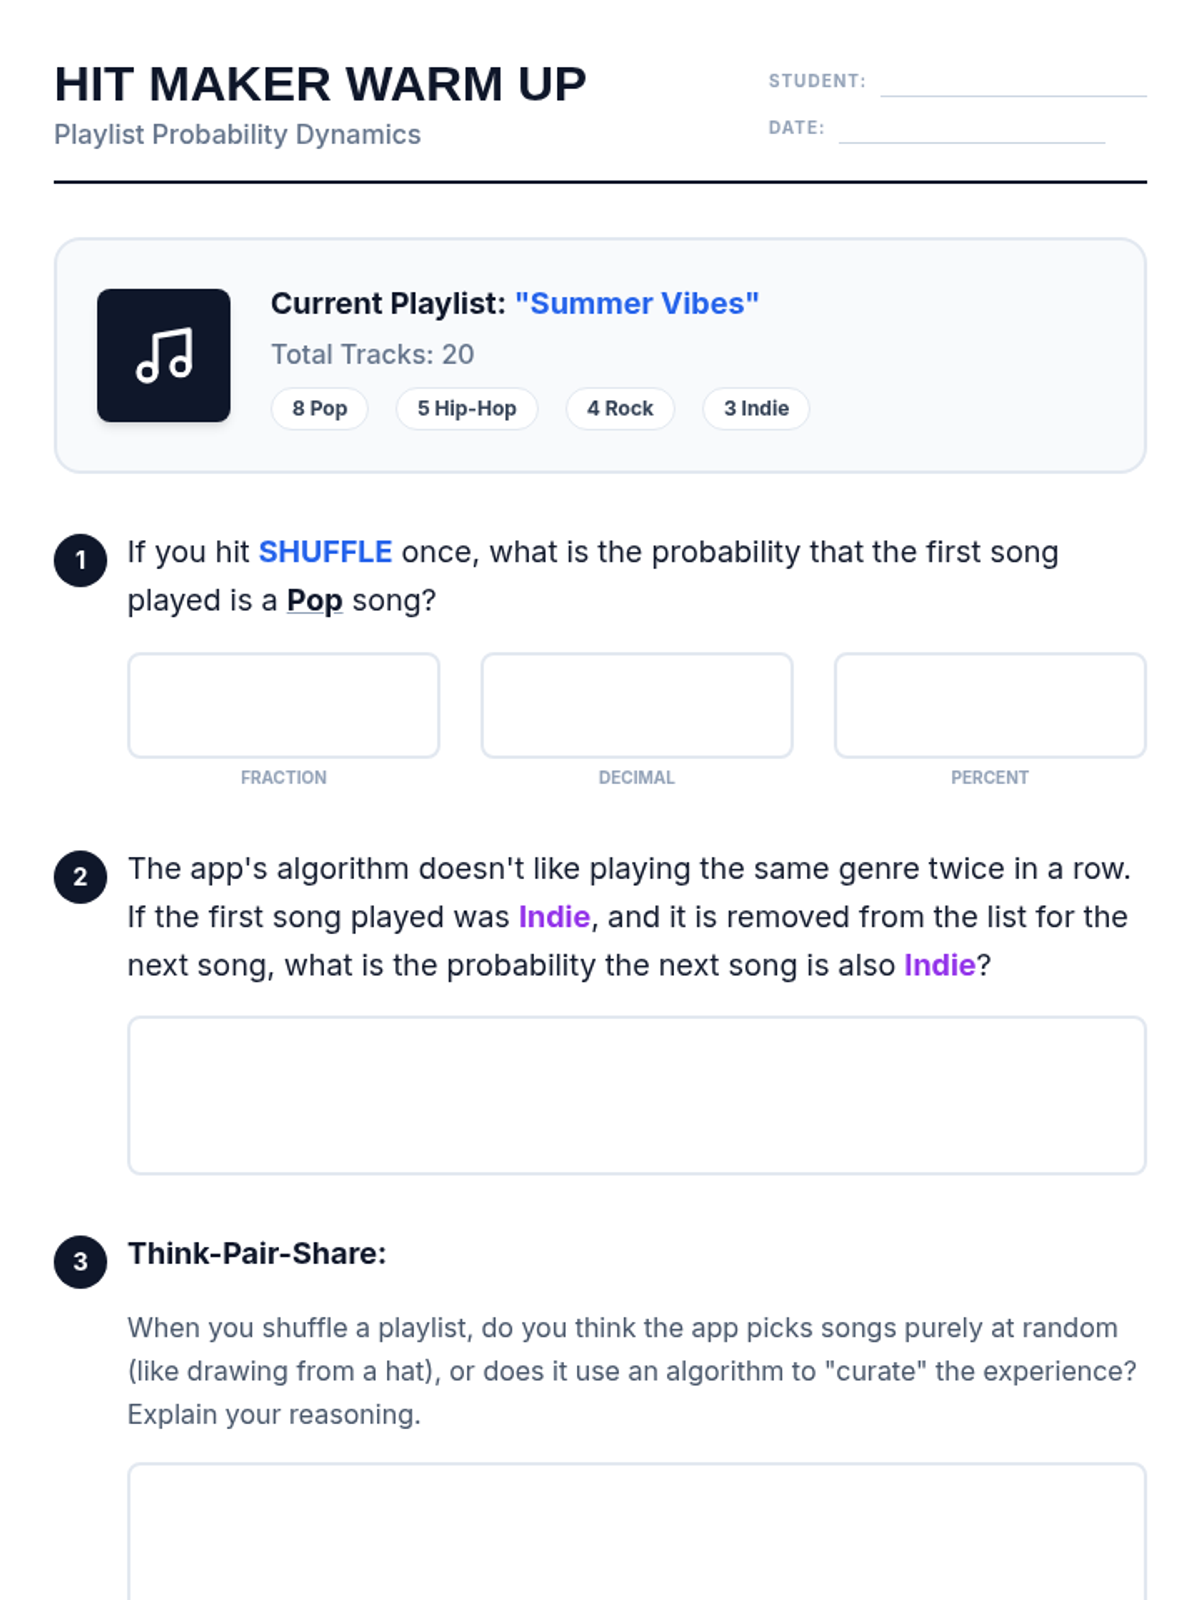
A streaming-themed warm-up worksheet for students to calculate basic probabilities using a fictional playlist and reflect on shuffle algorithms. Updated for better print contrast and layout.
A 6-slide presentation for a Pre-Algebra Chapter 9 midterm review, covering probability types, counting principles, permutations/combinations, and event independence.
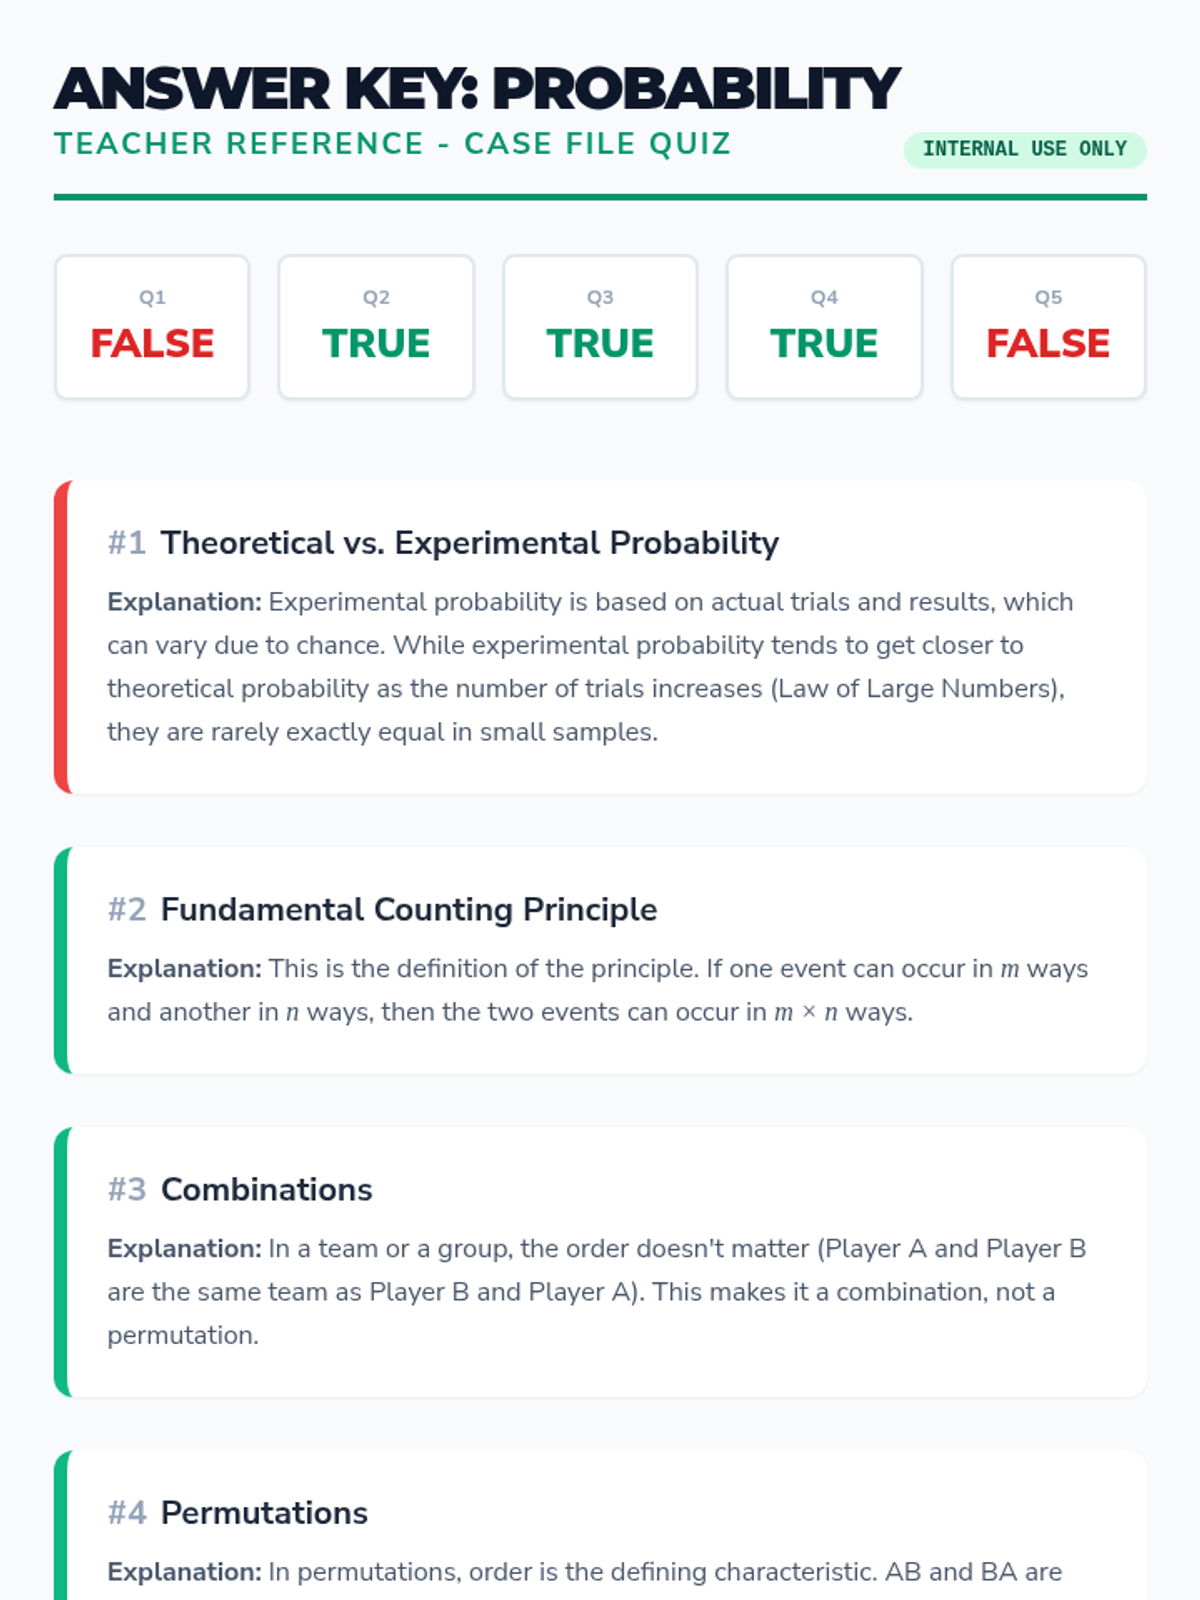
A teacher-facing answer key for the Probability Case File Quiz, providing correct answers and detailed conceptual explanations for each statement.
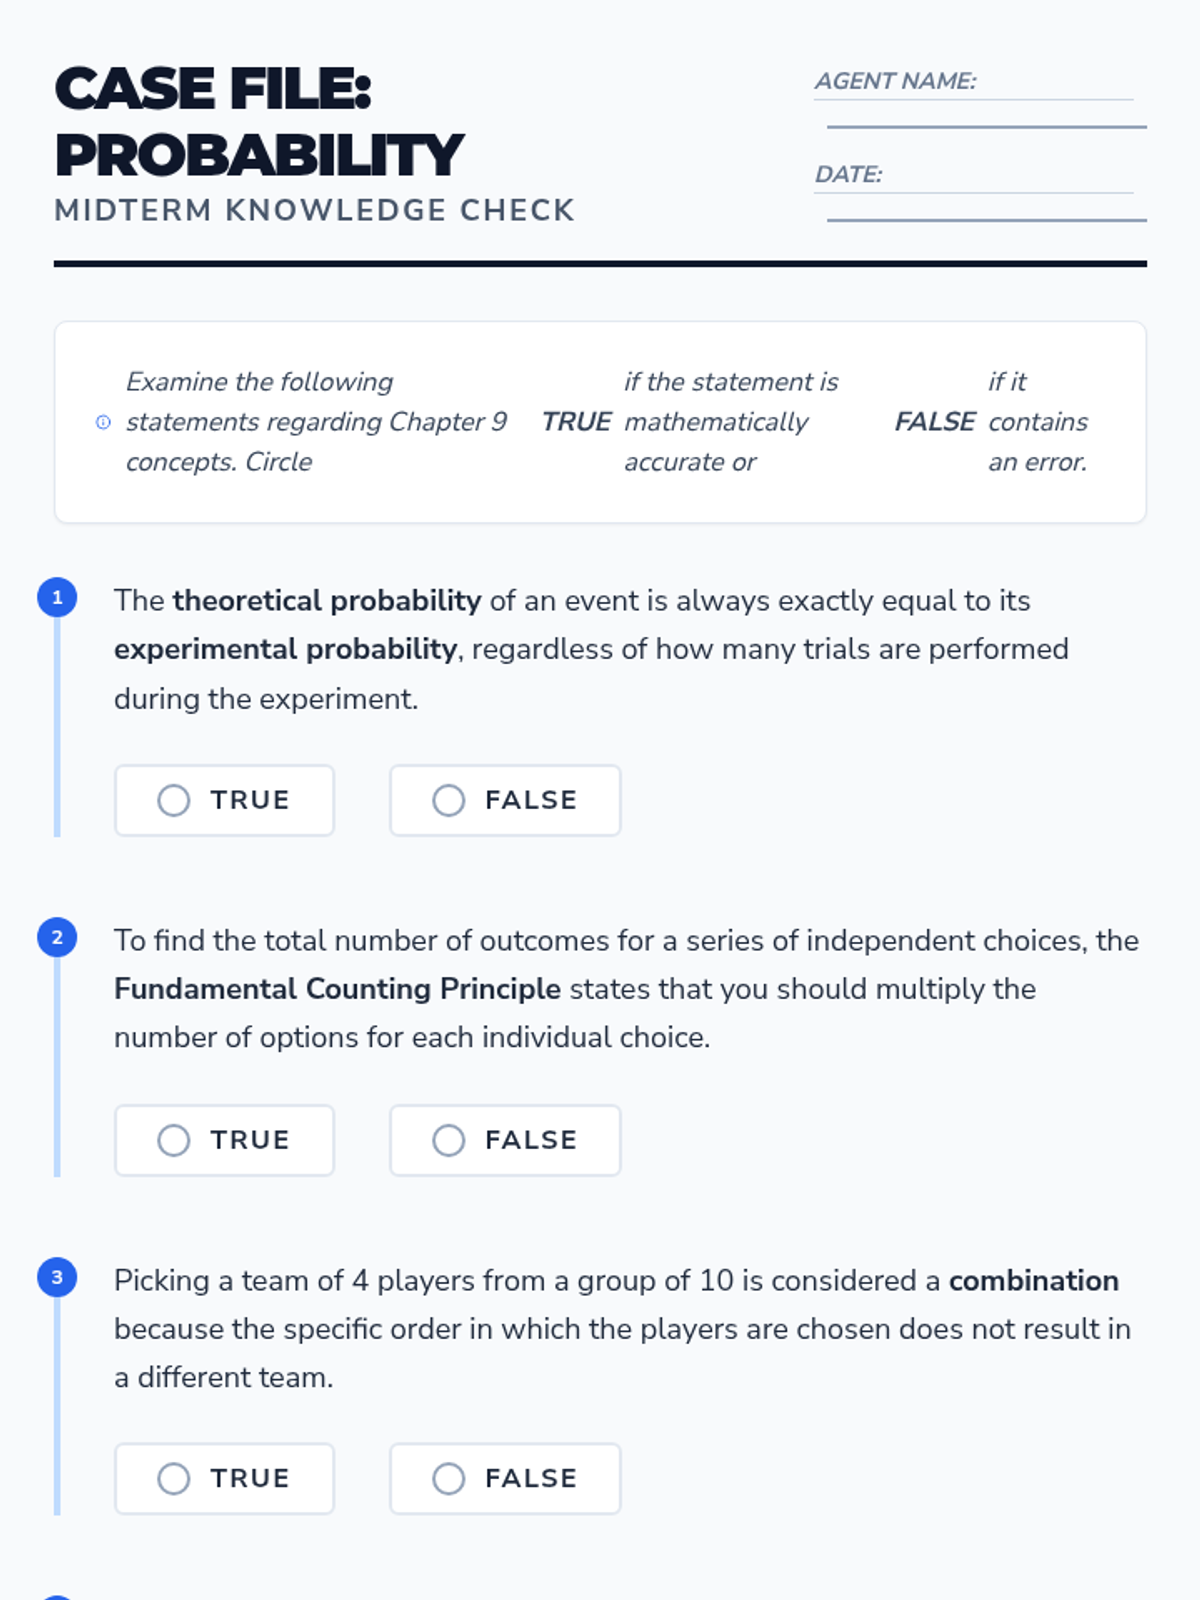
A student-facing quiz containing 5 true/false questions covering theoretical/experimental probability, counting principles, permutations, combinations, and dependent events.
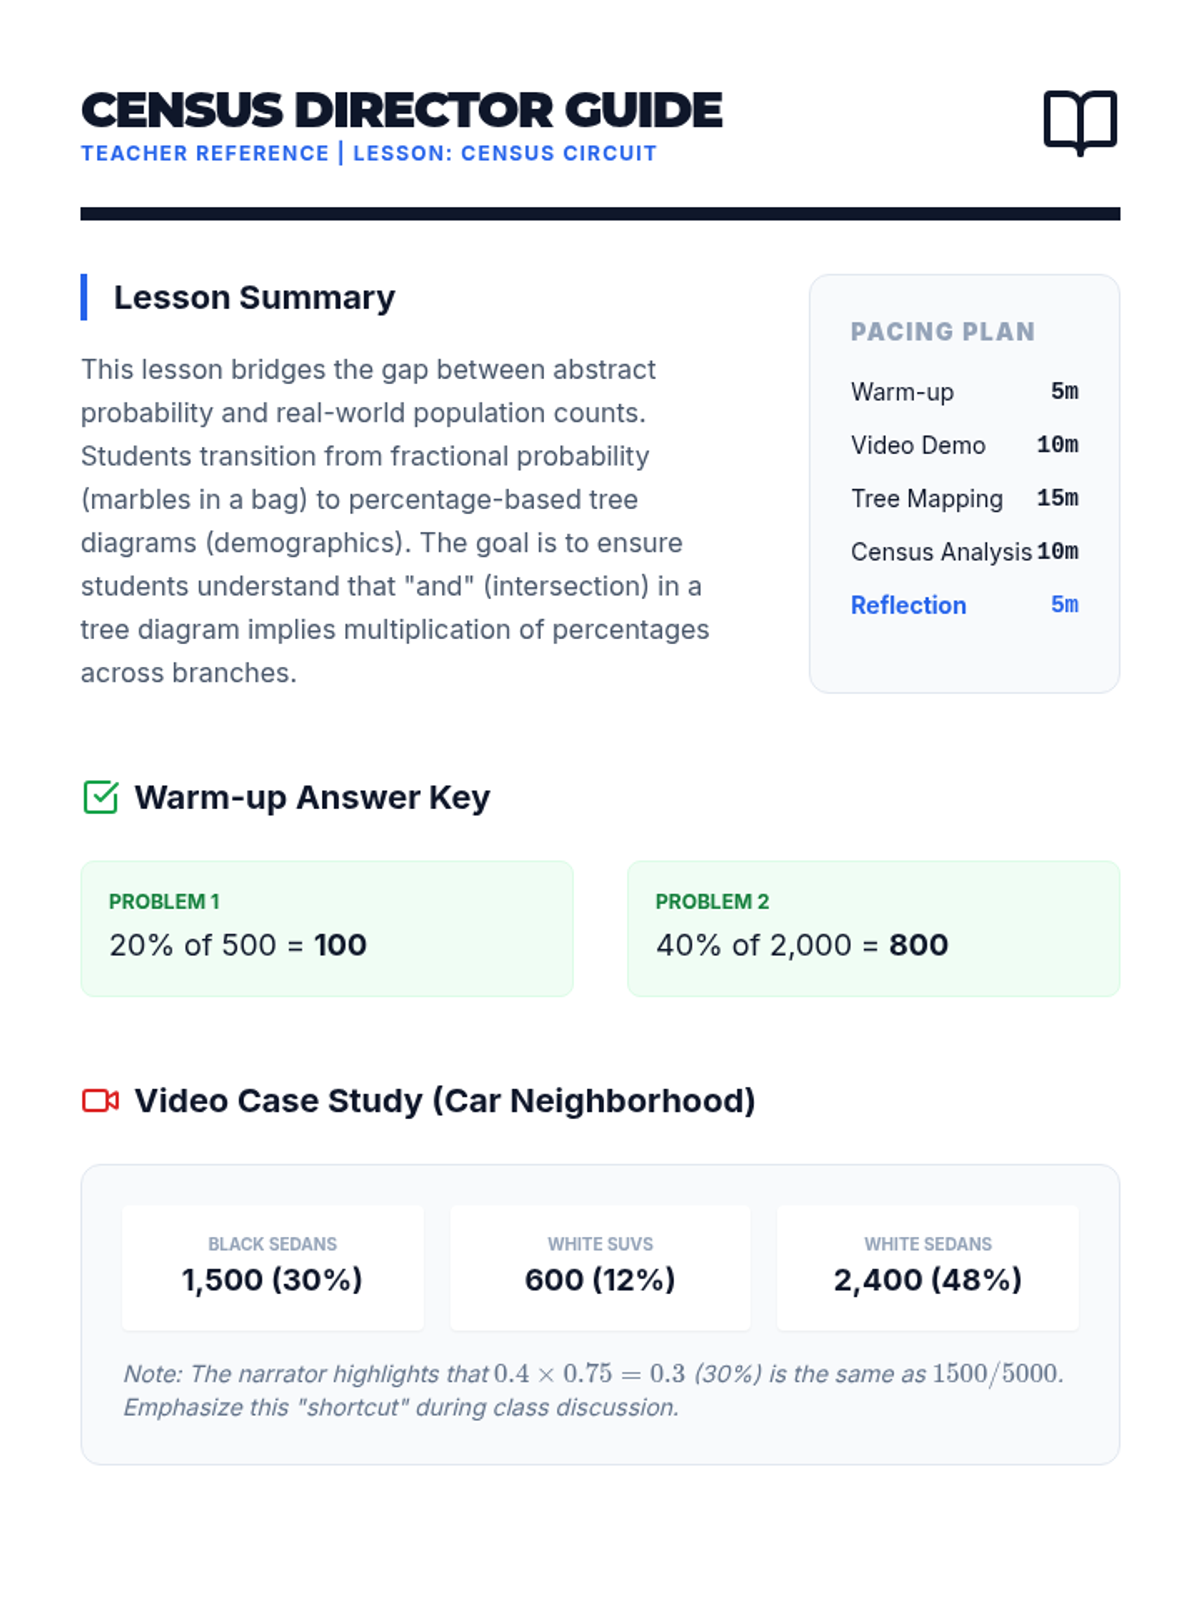
A professional teacher-facing guide including a pacing guide, answer keys for the warm-up and video problems, and a comprehensive master solution for the Willow Creek Census activity.
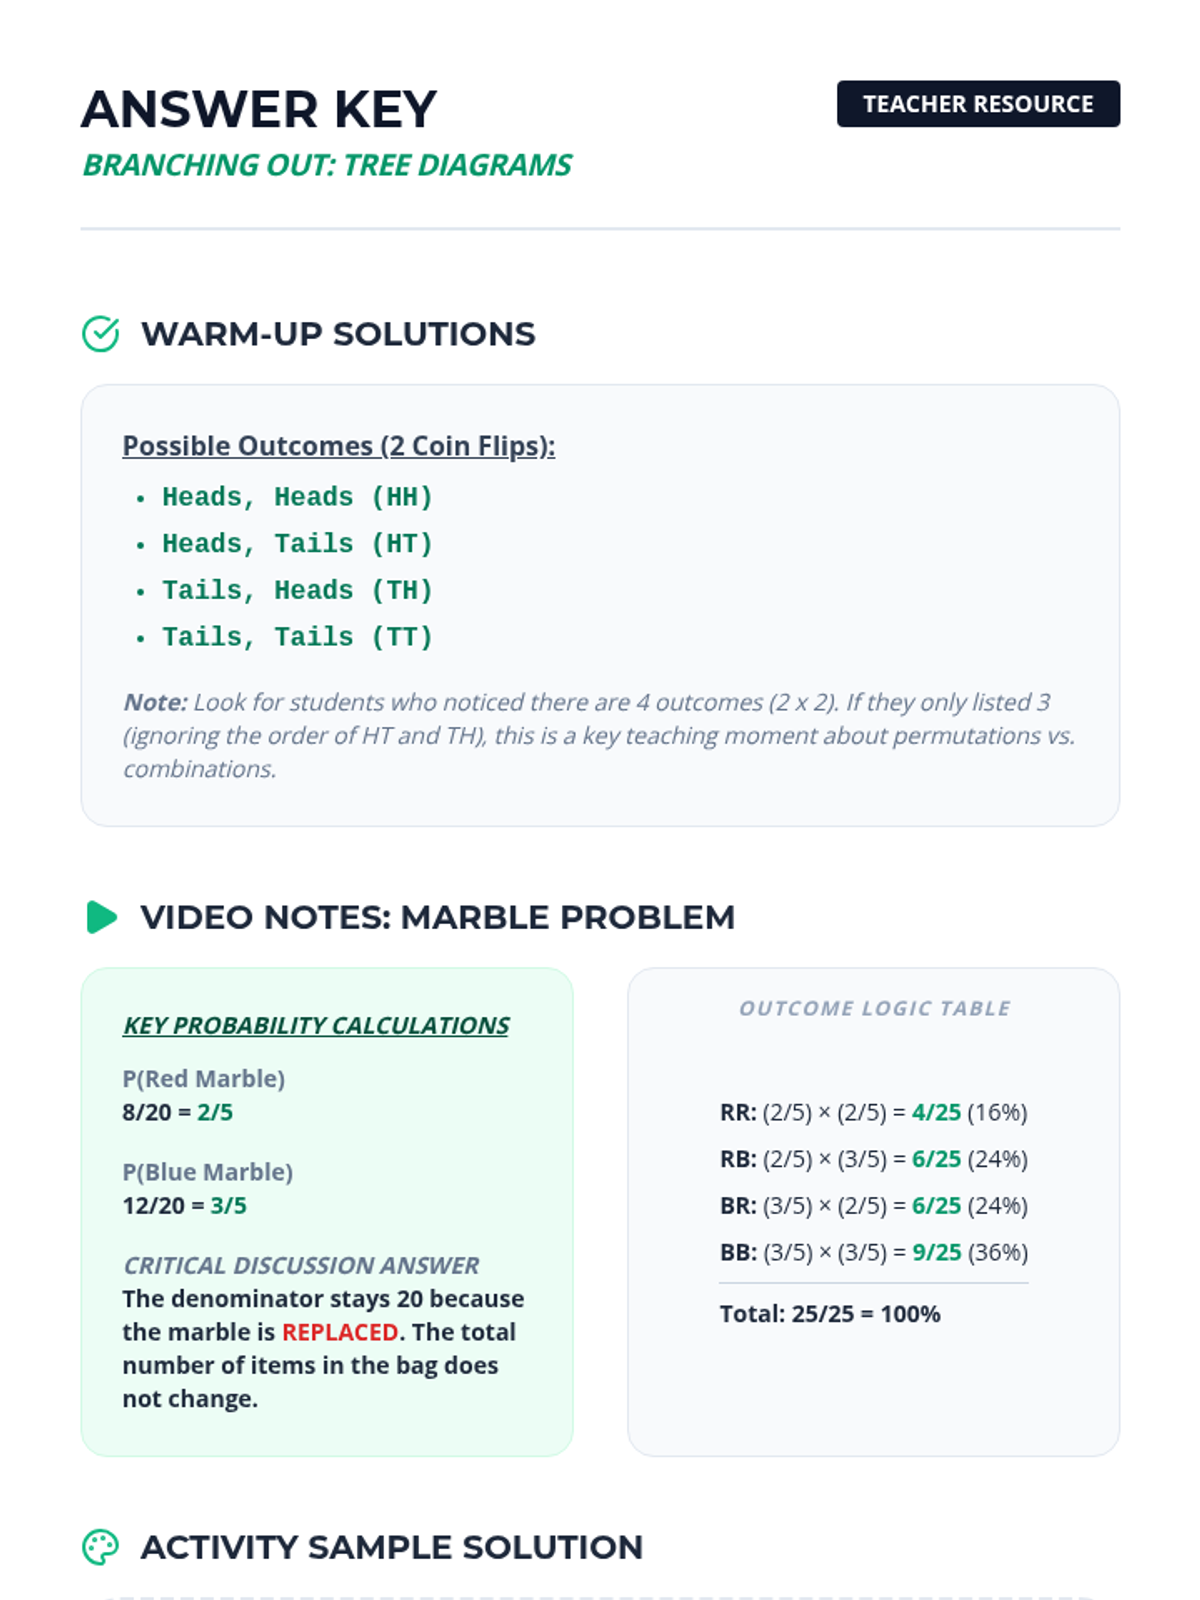
A detailed answer key for the 'Branching Out' worksheet. It provides solutions for the coin-flip warm-up, step-by-step calculations for the video's marble problem, and a complete sample scenario for the creative student activity.