Comparisons of quantities using unit rates and proportional reasoning. Connects tables, graphs, and equations to represent constant rates of change.
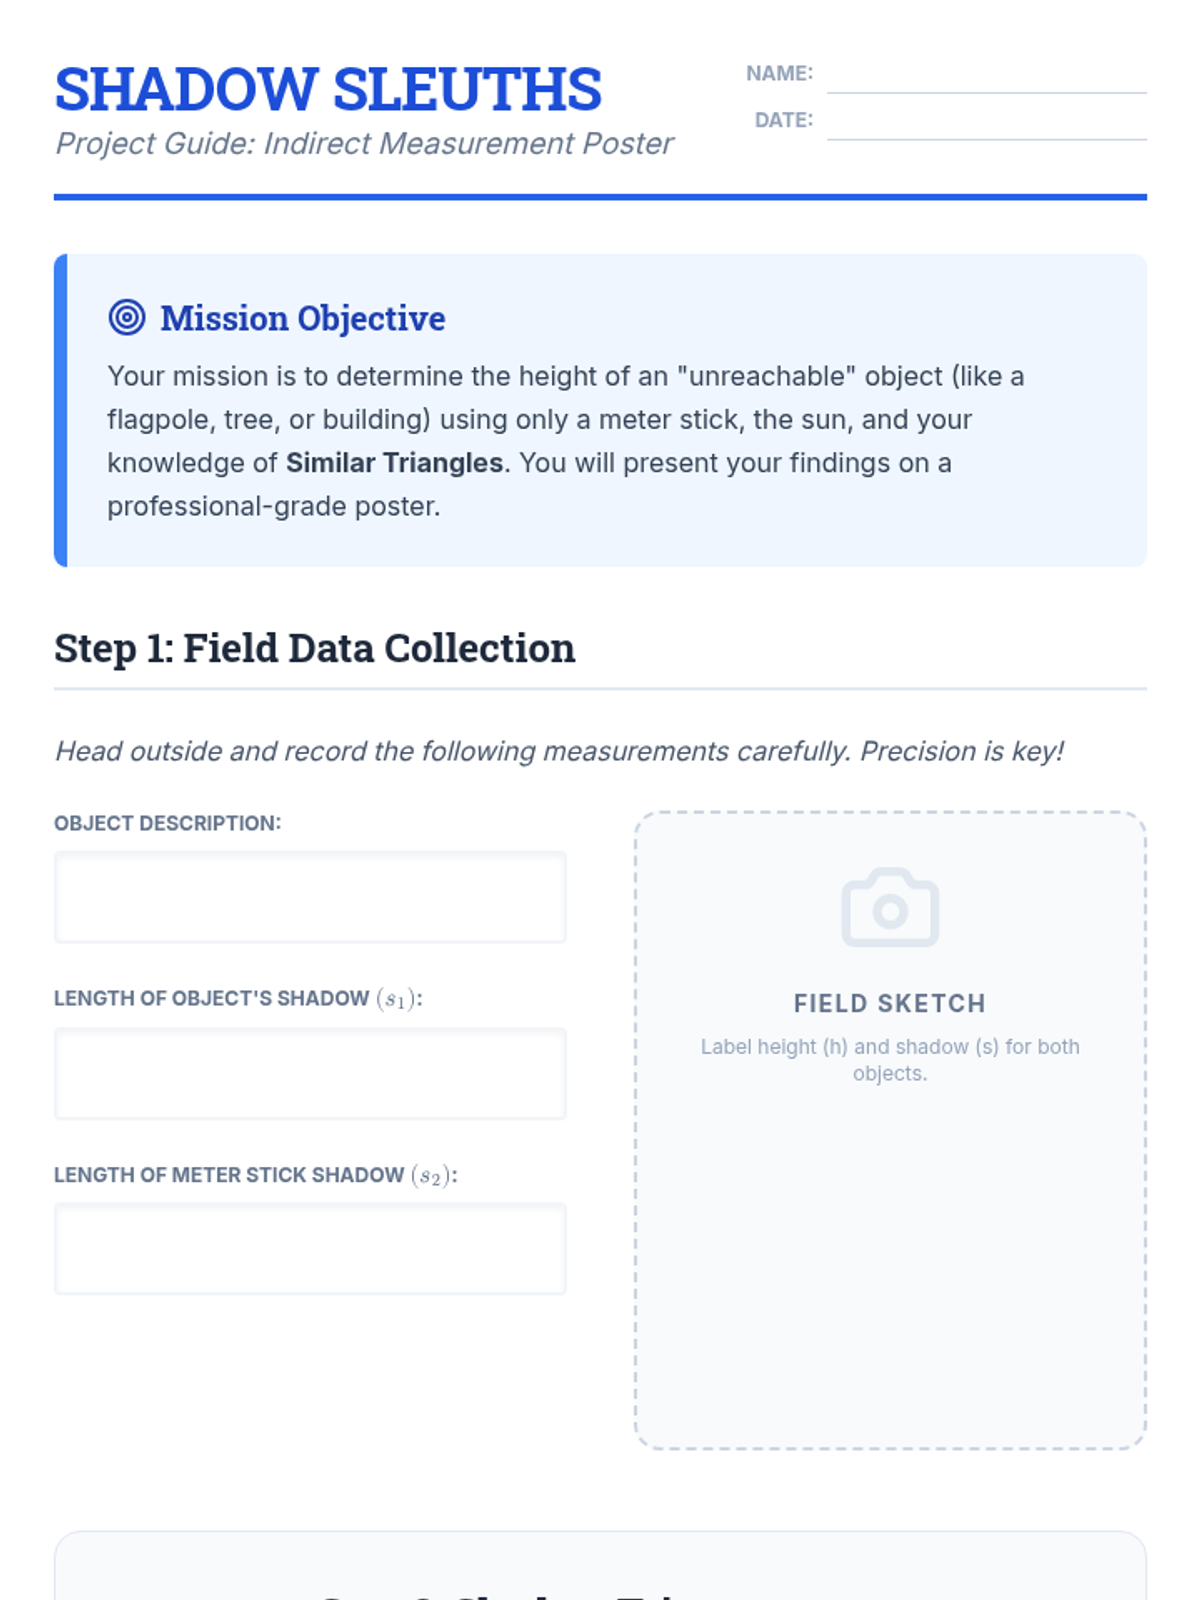
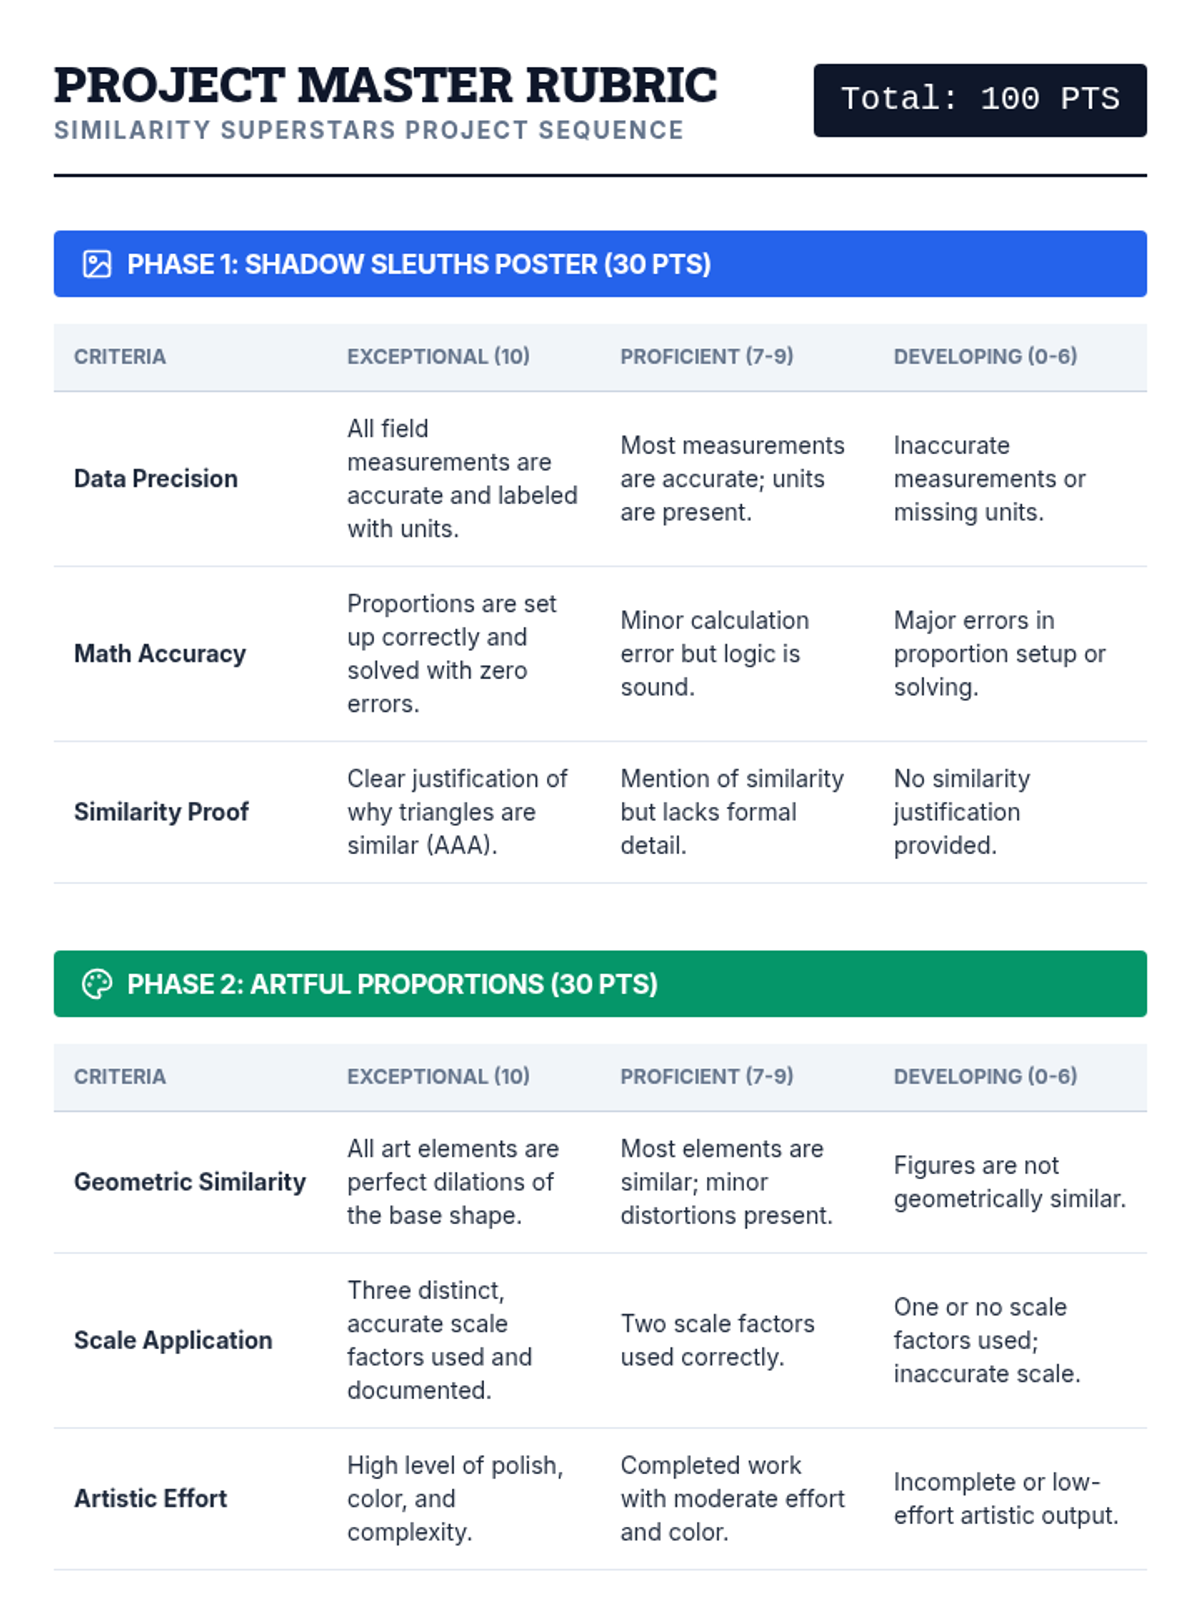
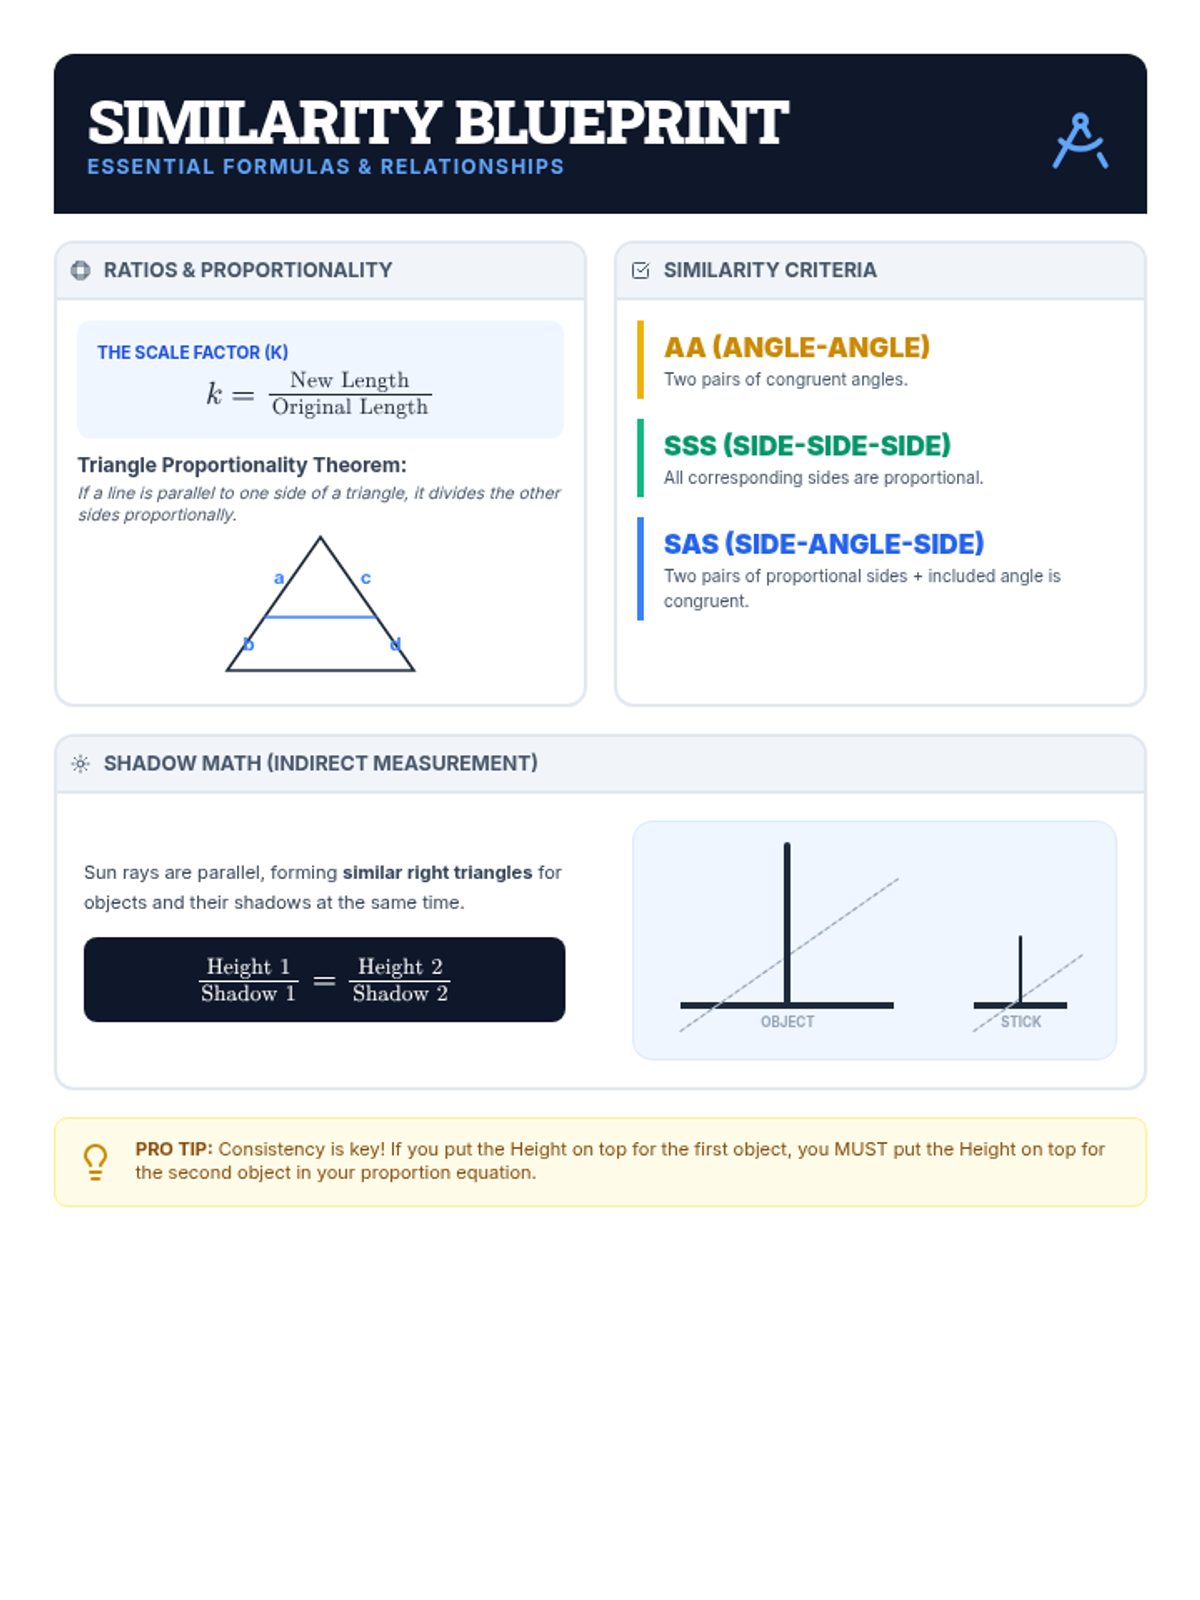
Students explore geometric similarity through art and tessellations, applying ratios and proportional parts to create scaled masterpieces.
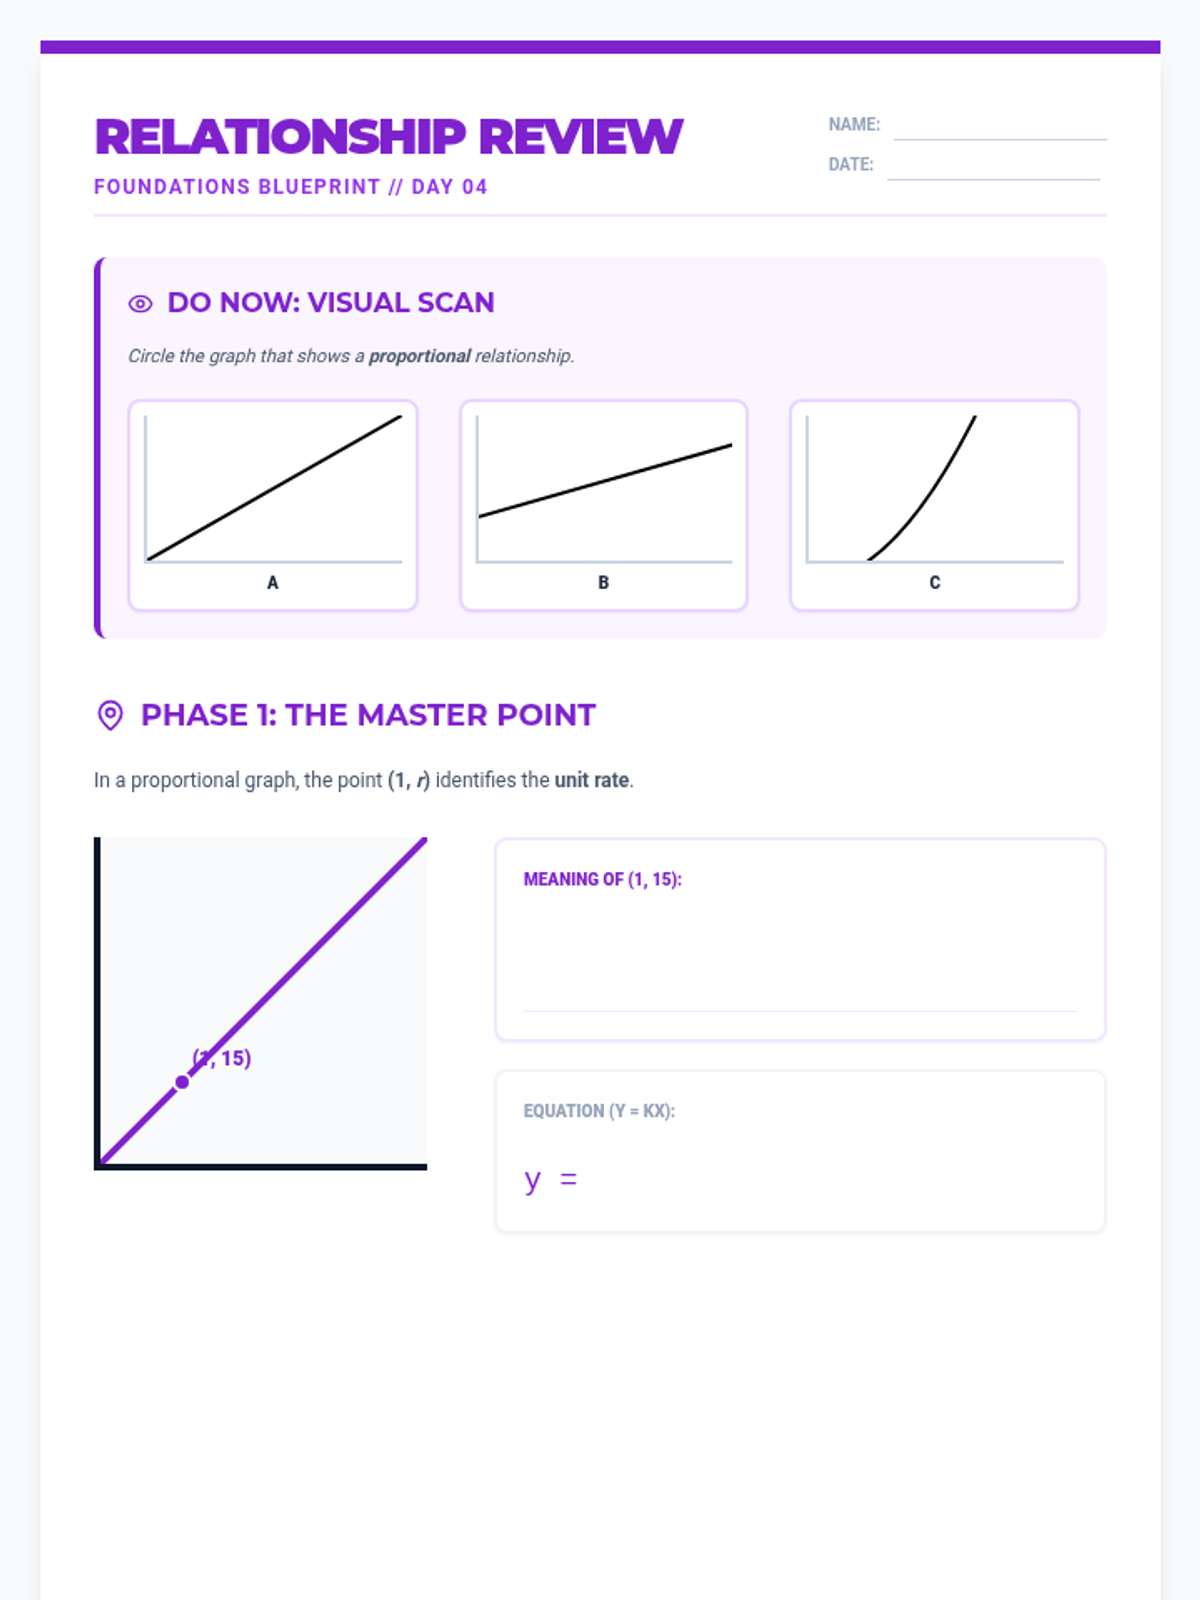
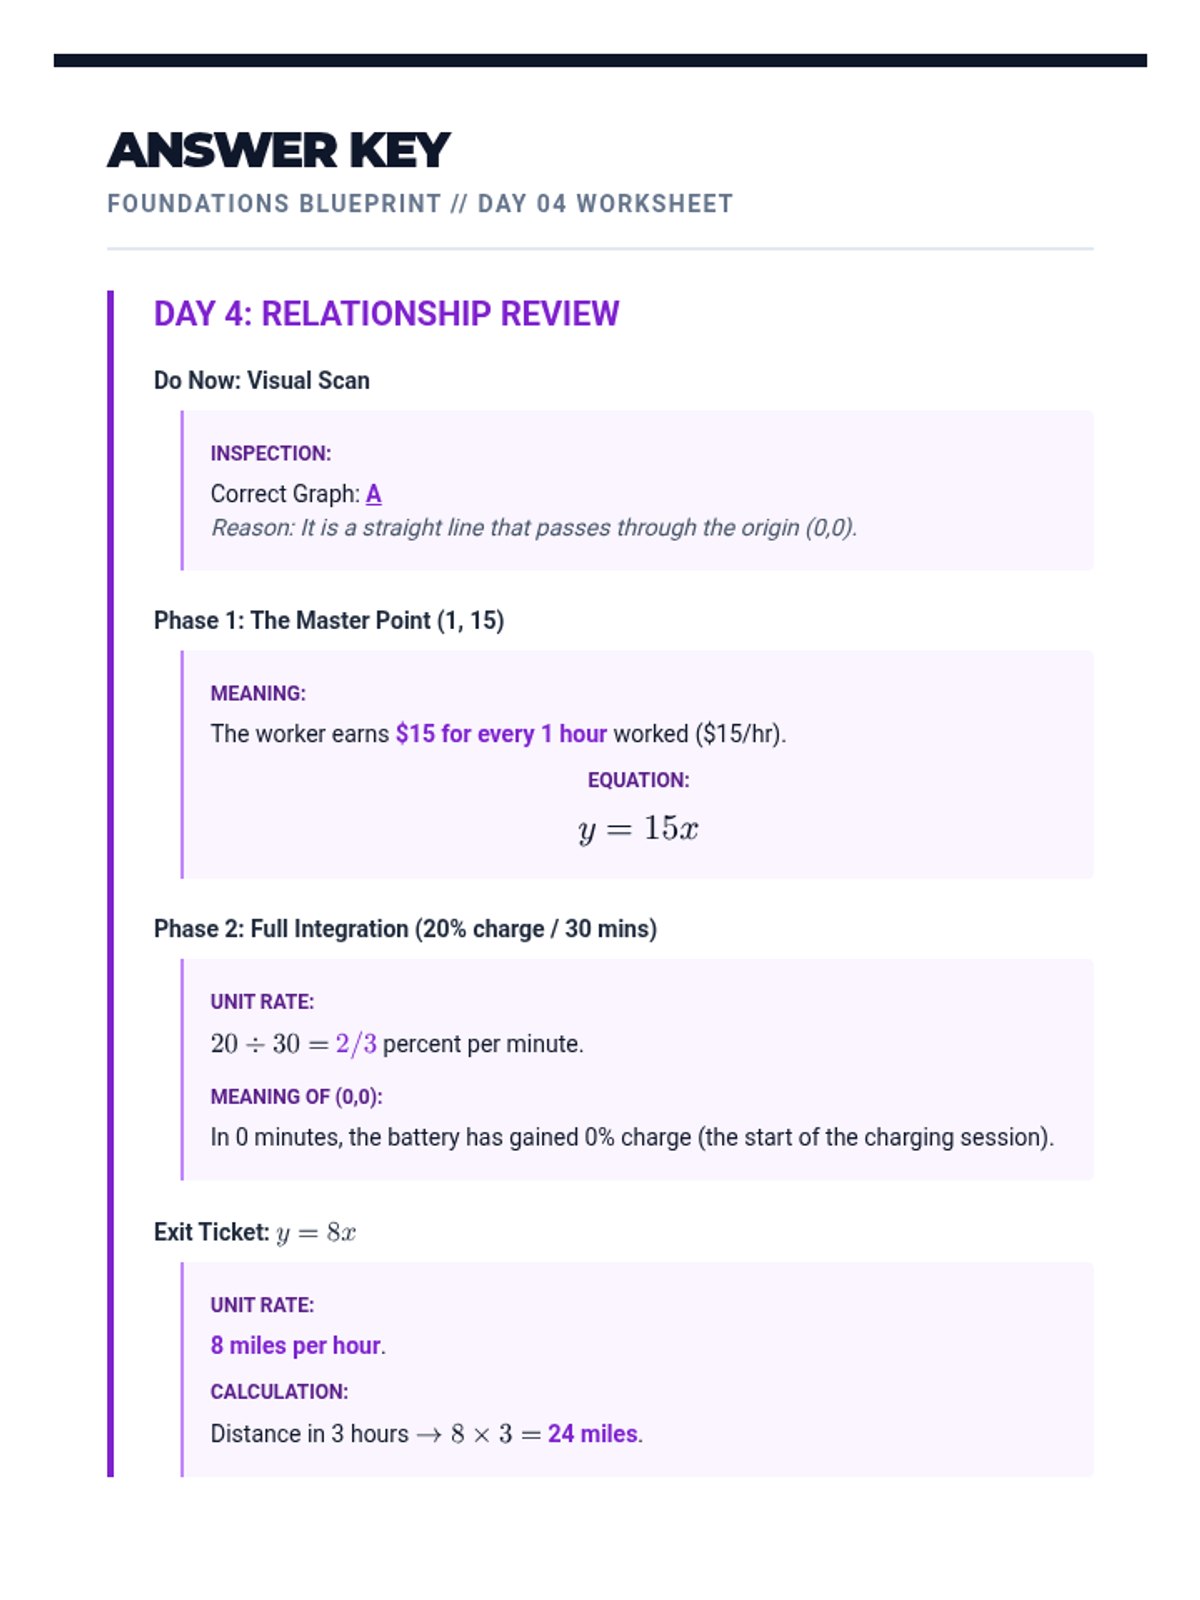
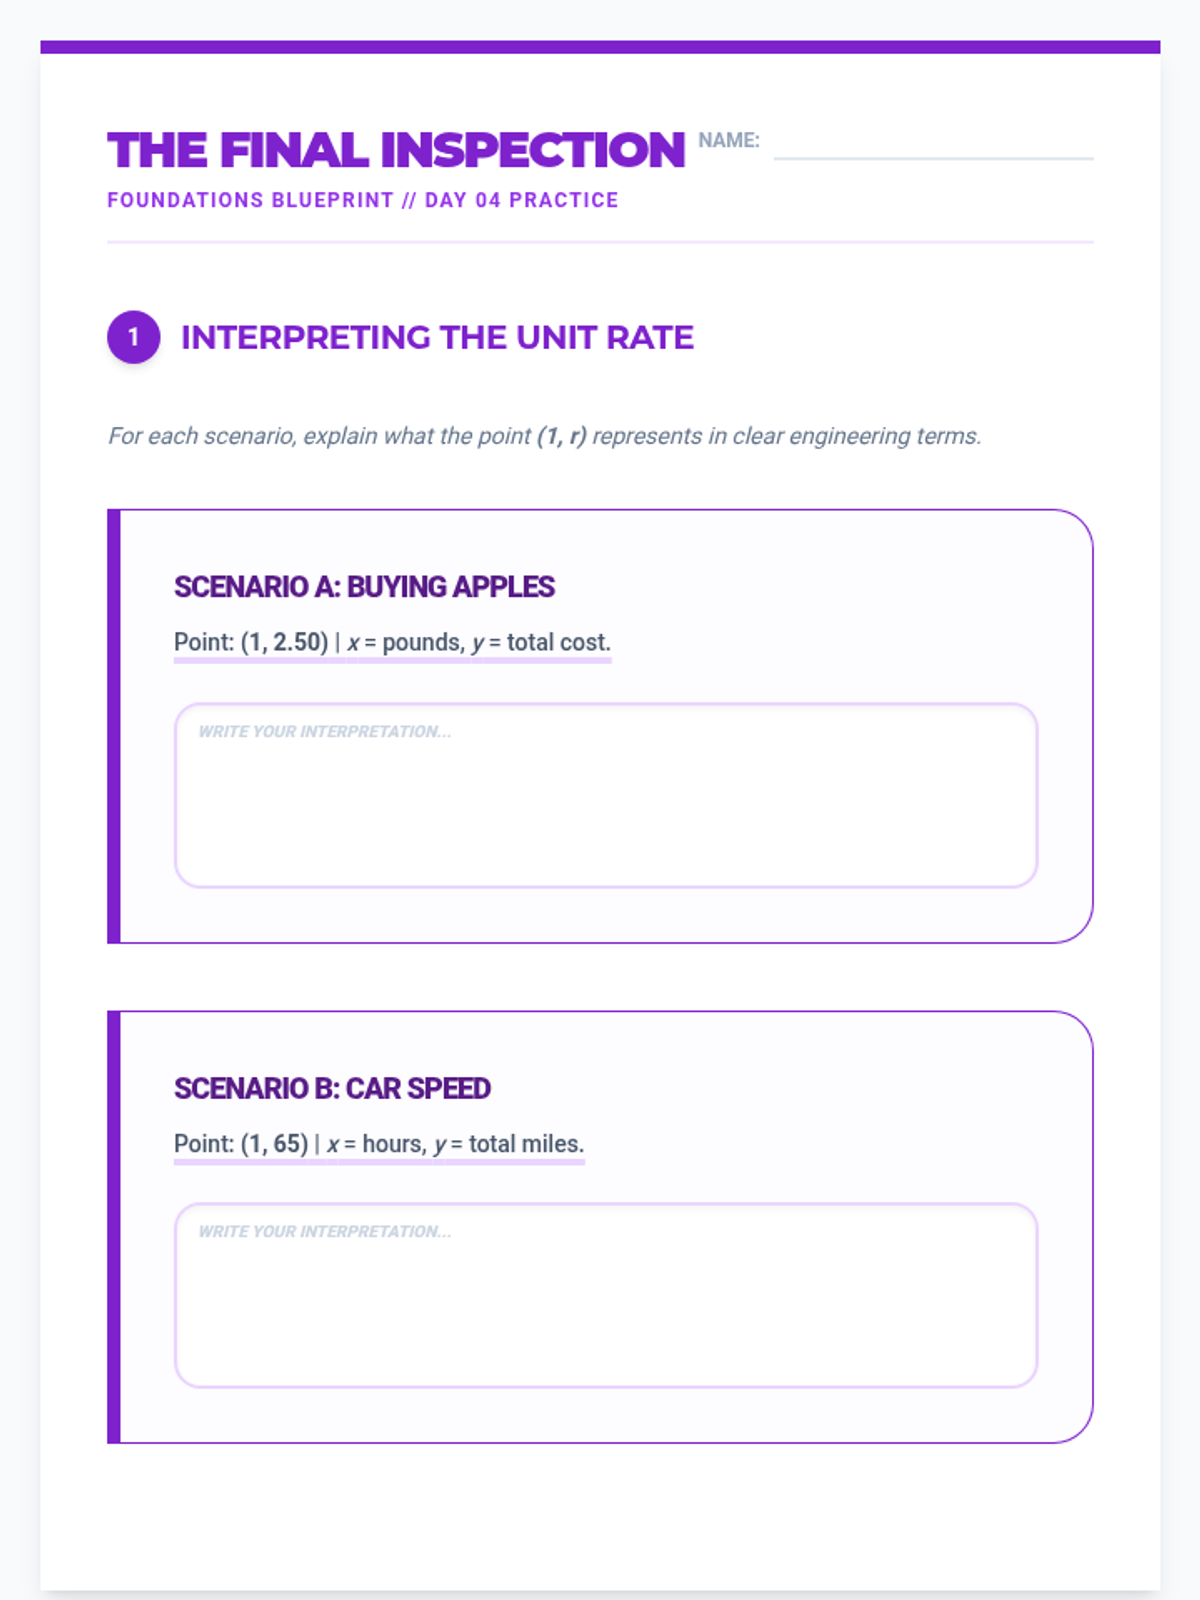
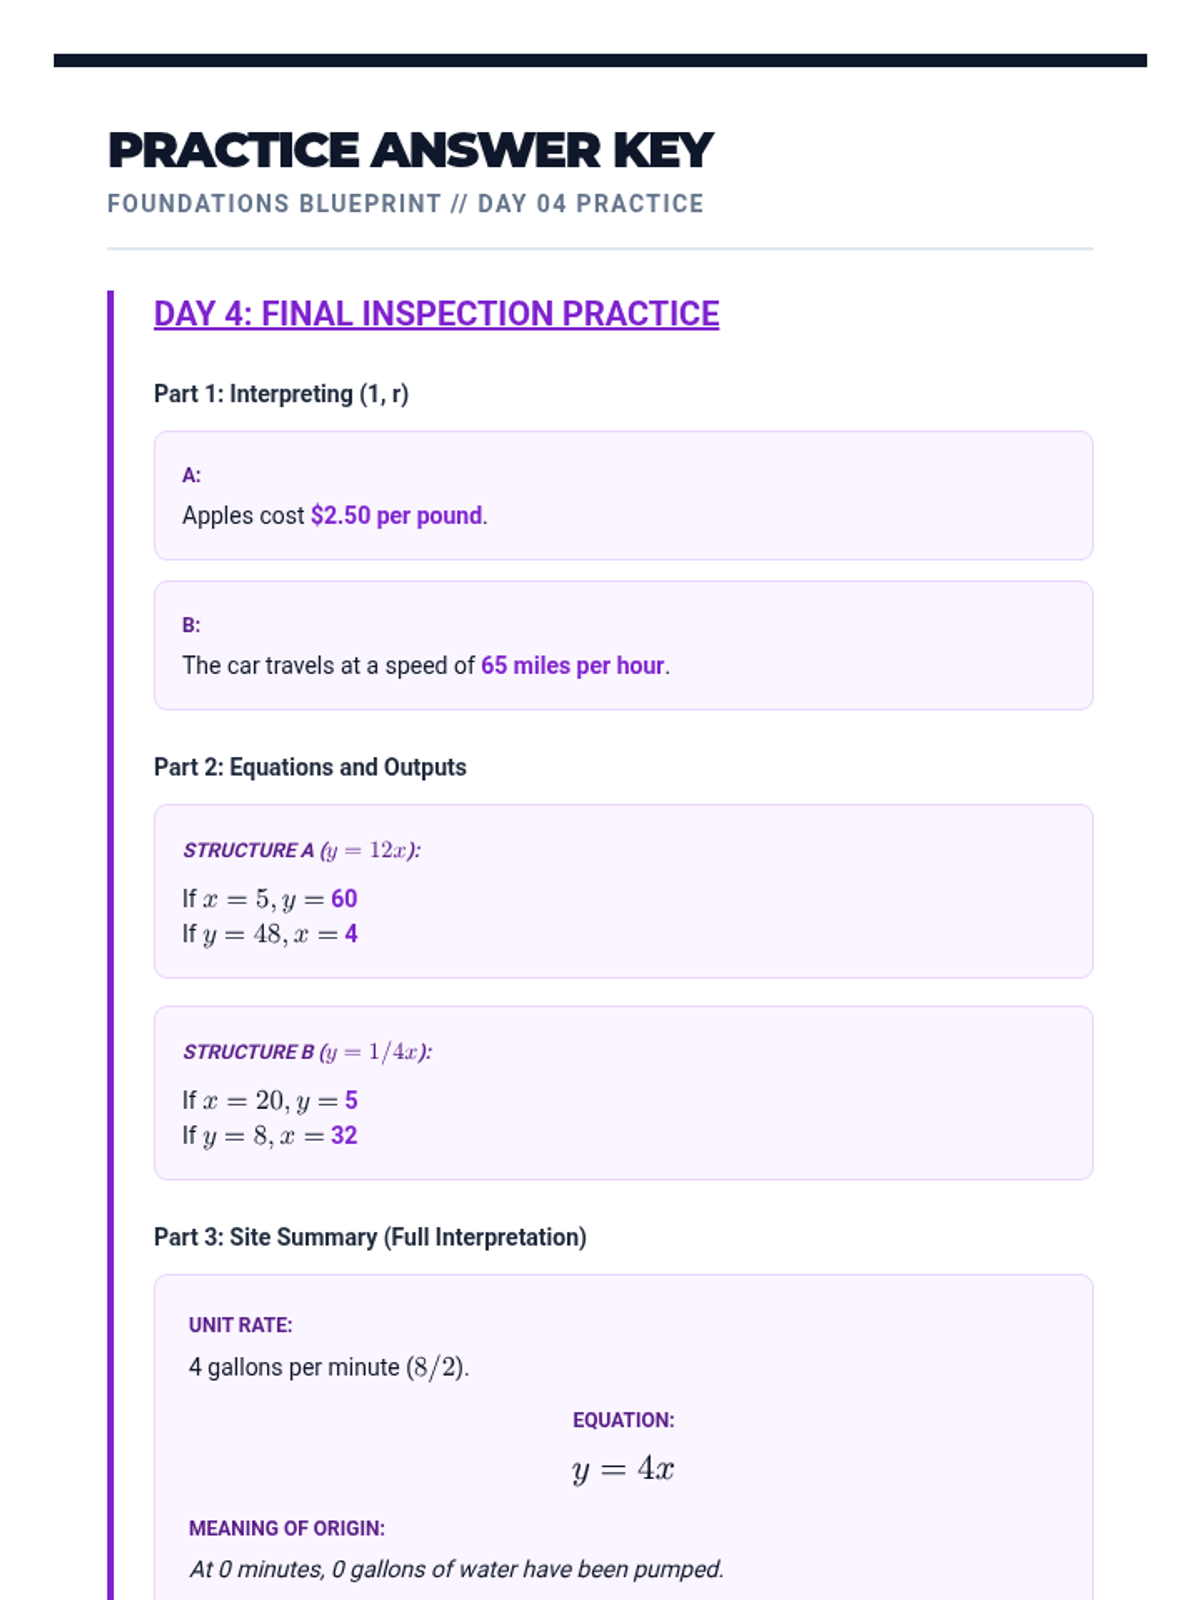
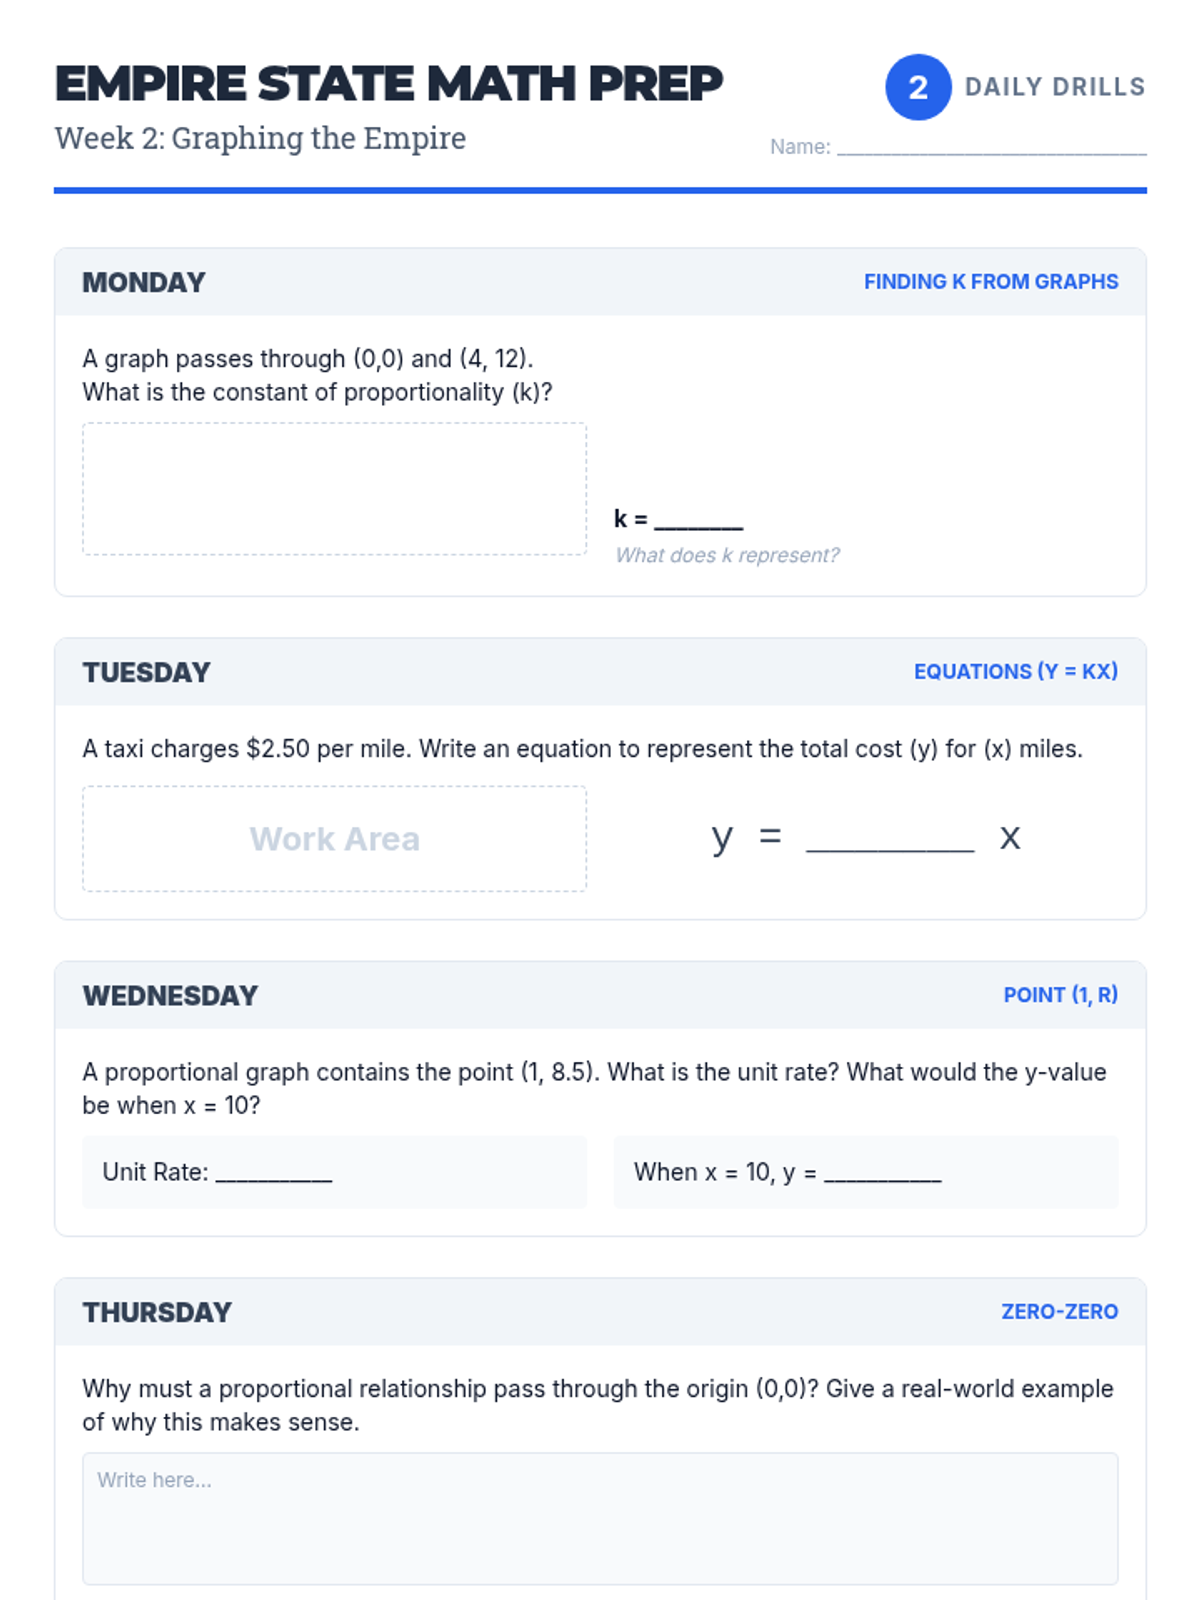
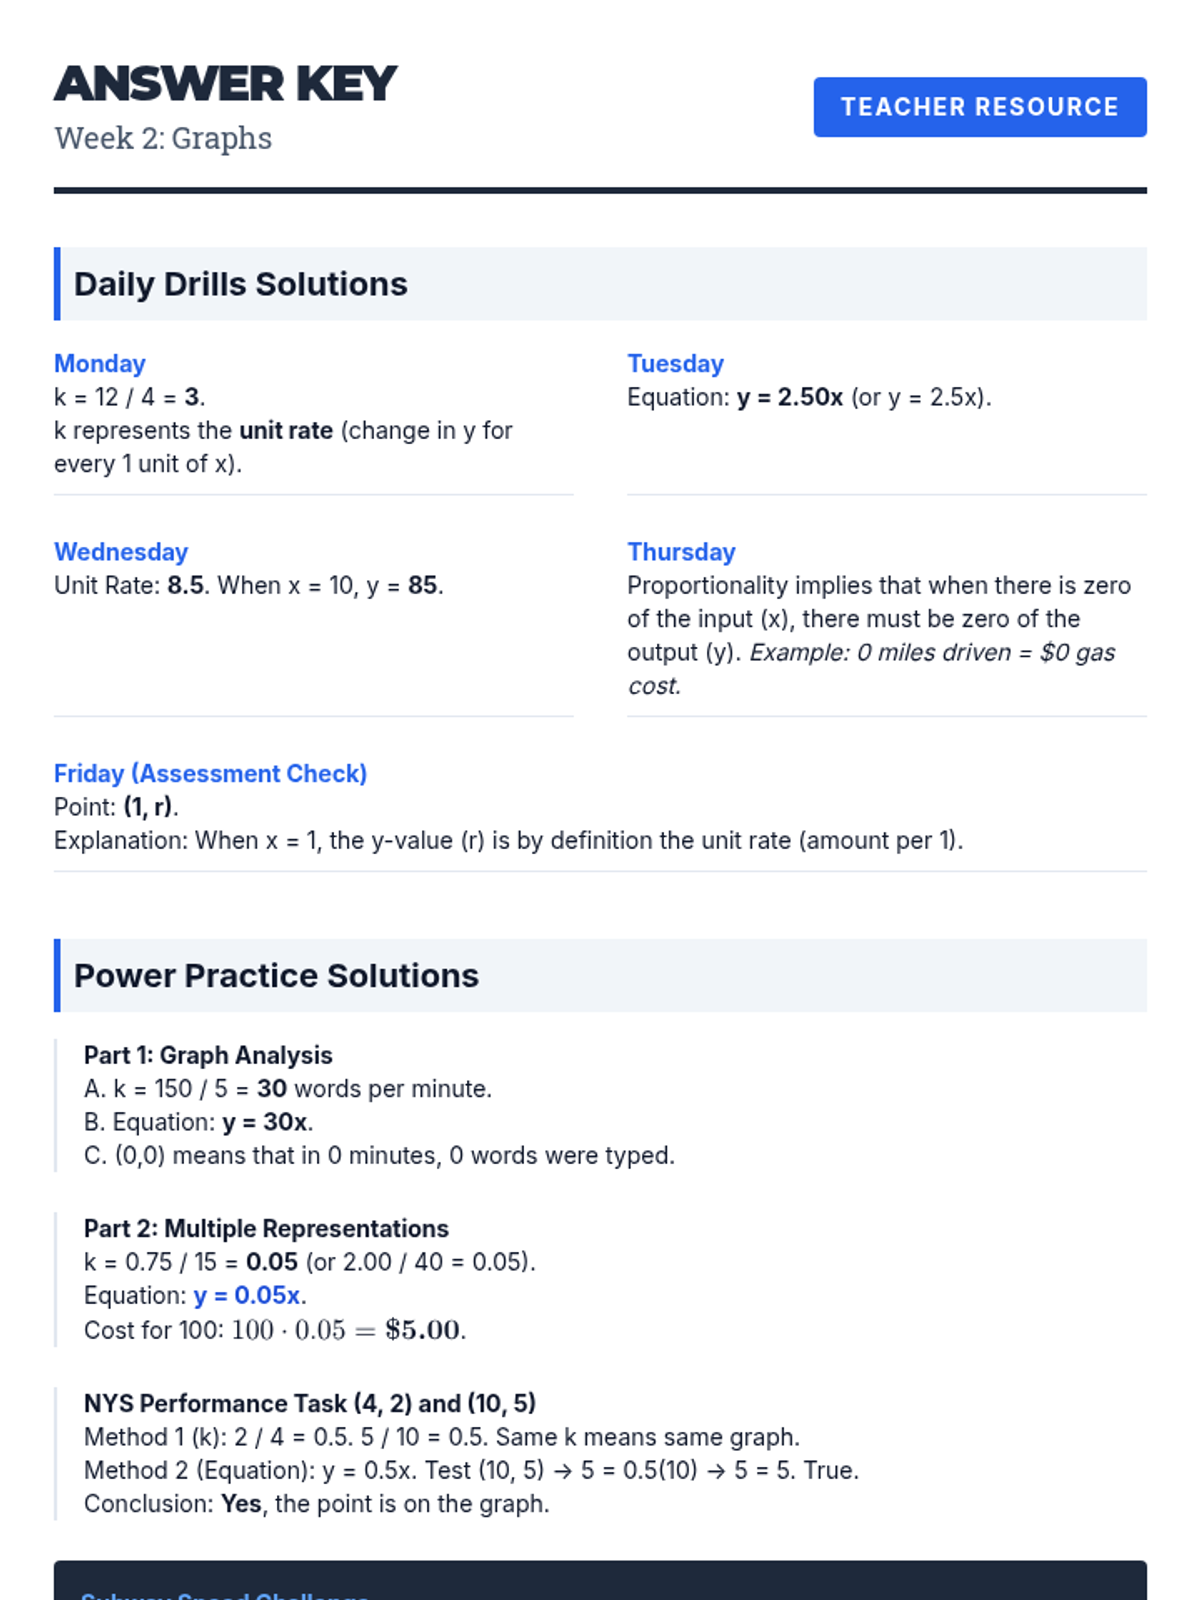
In-depth look at interpreting points on a proportional graph, specifically the unit rate (1, r) and the origin (0, 0).
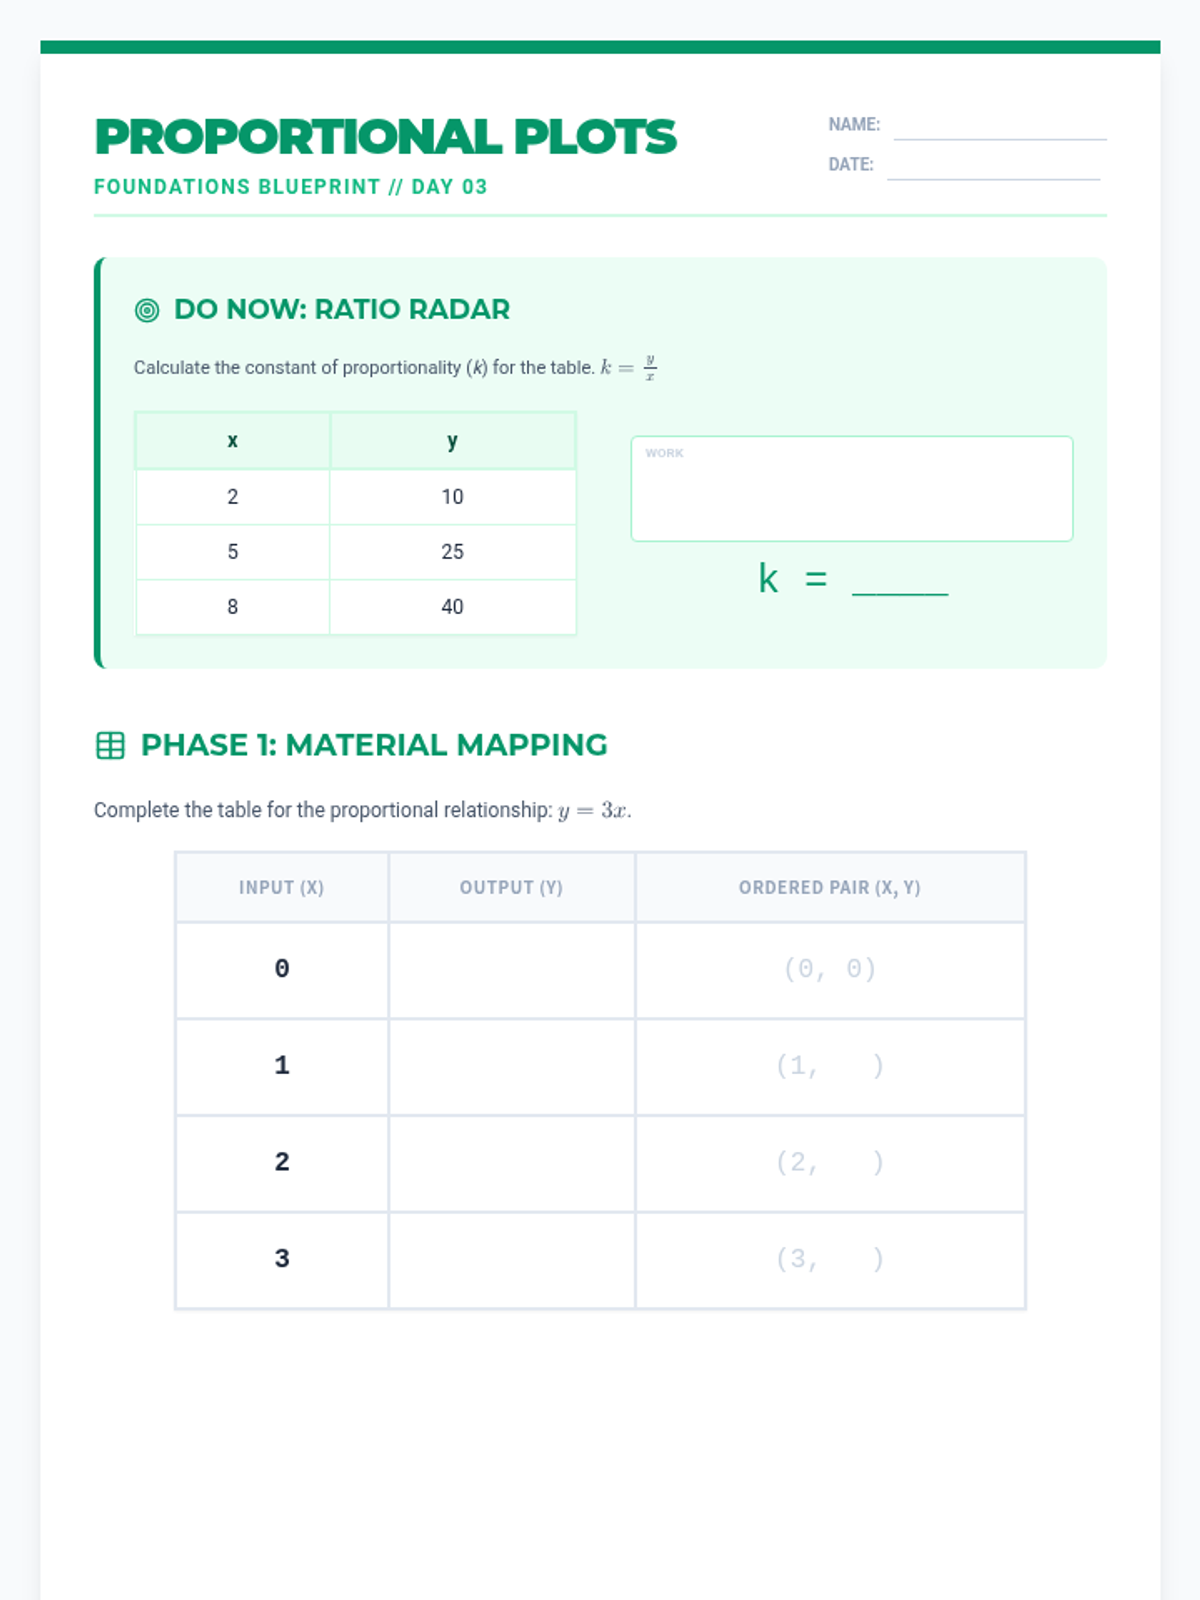
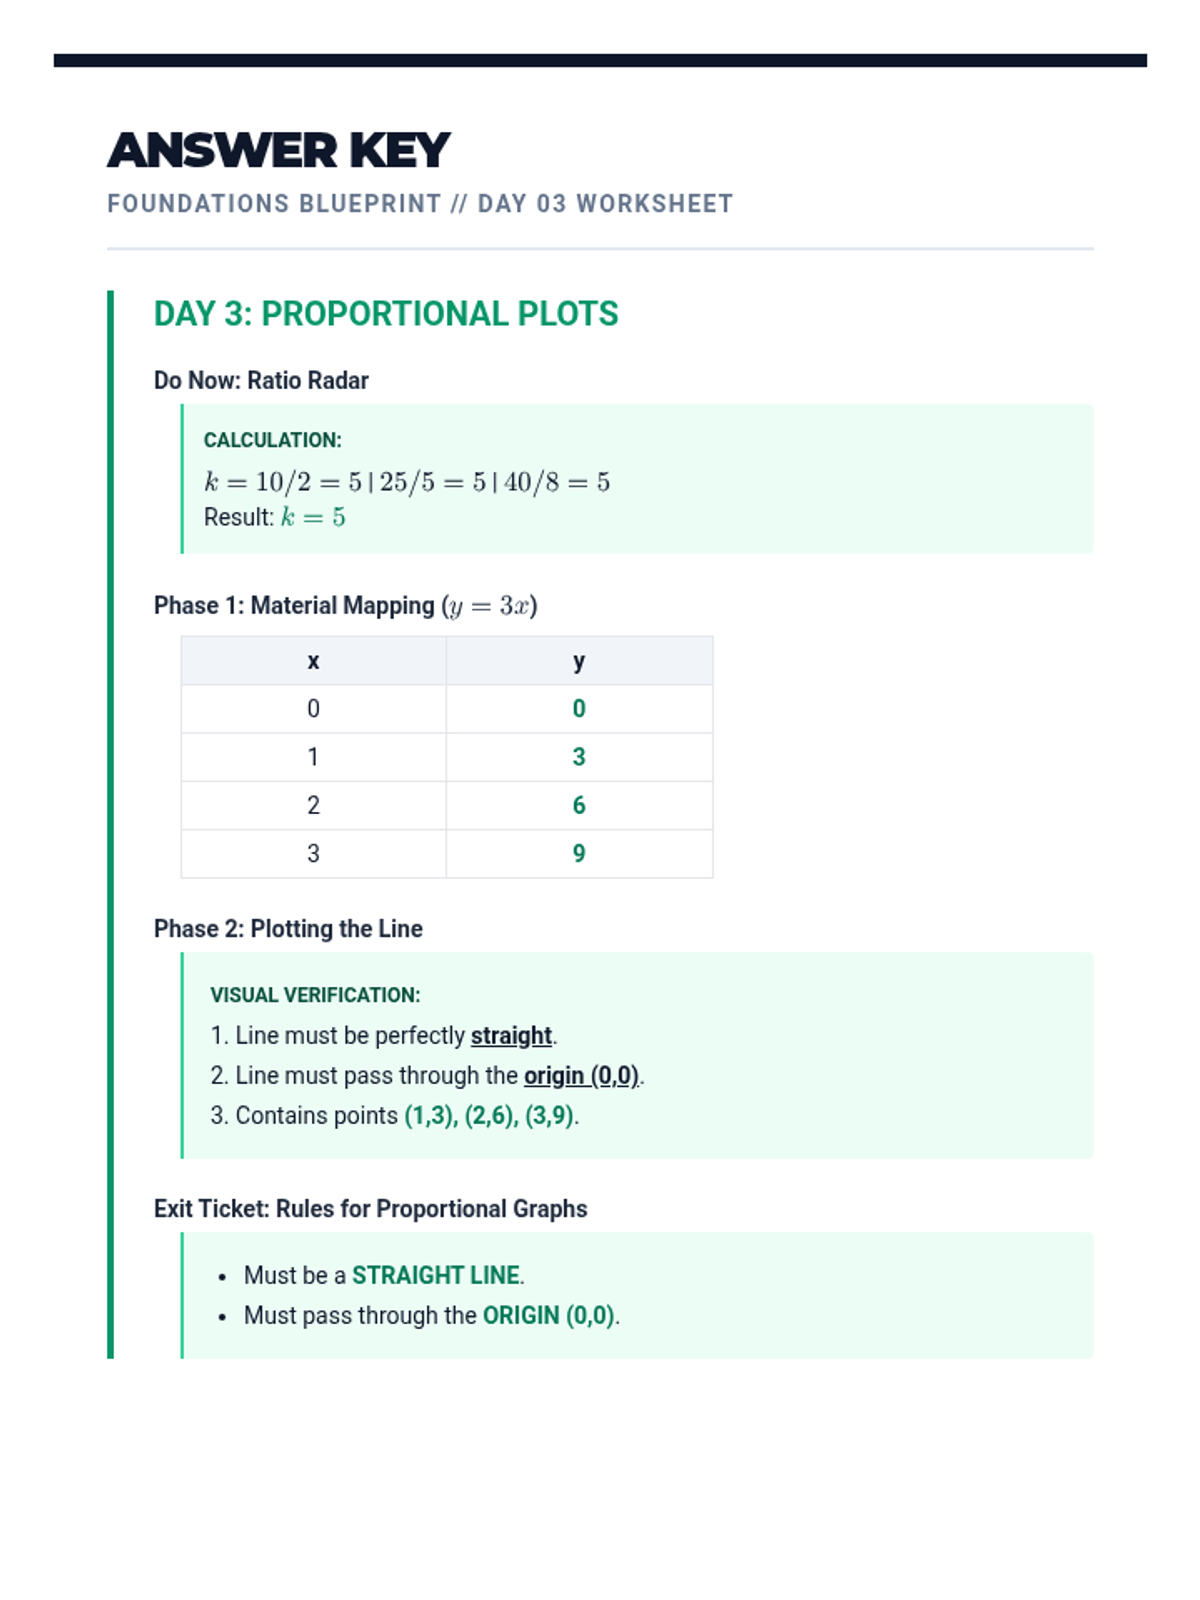
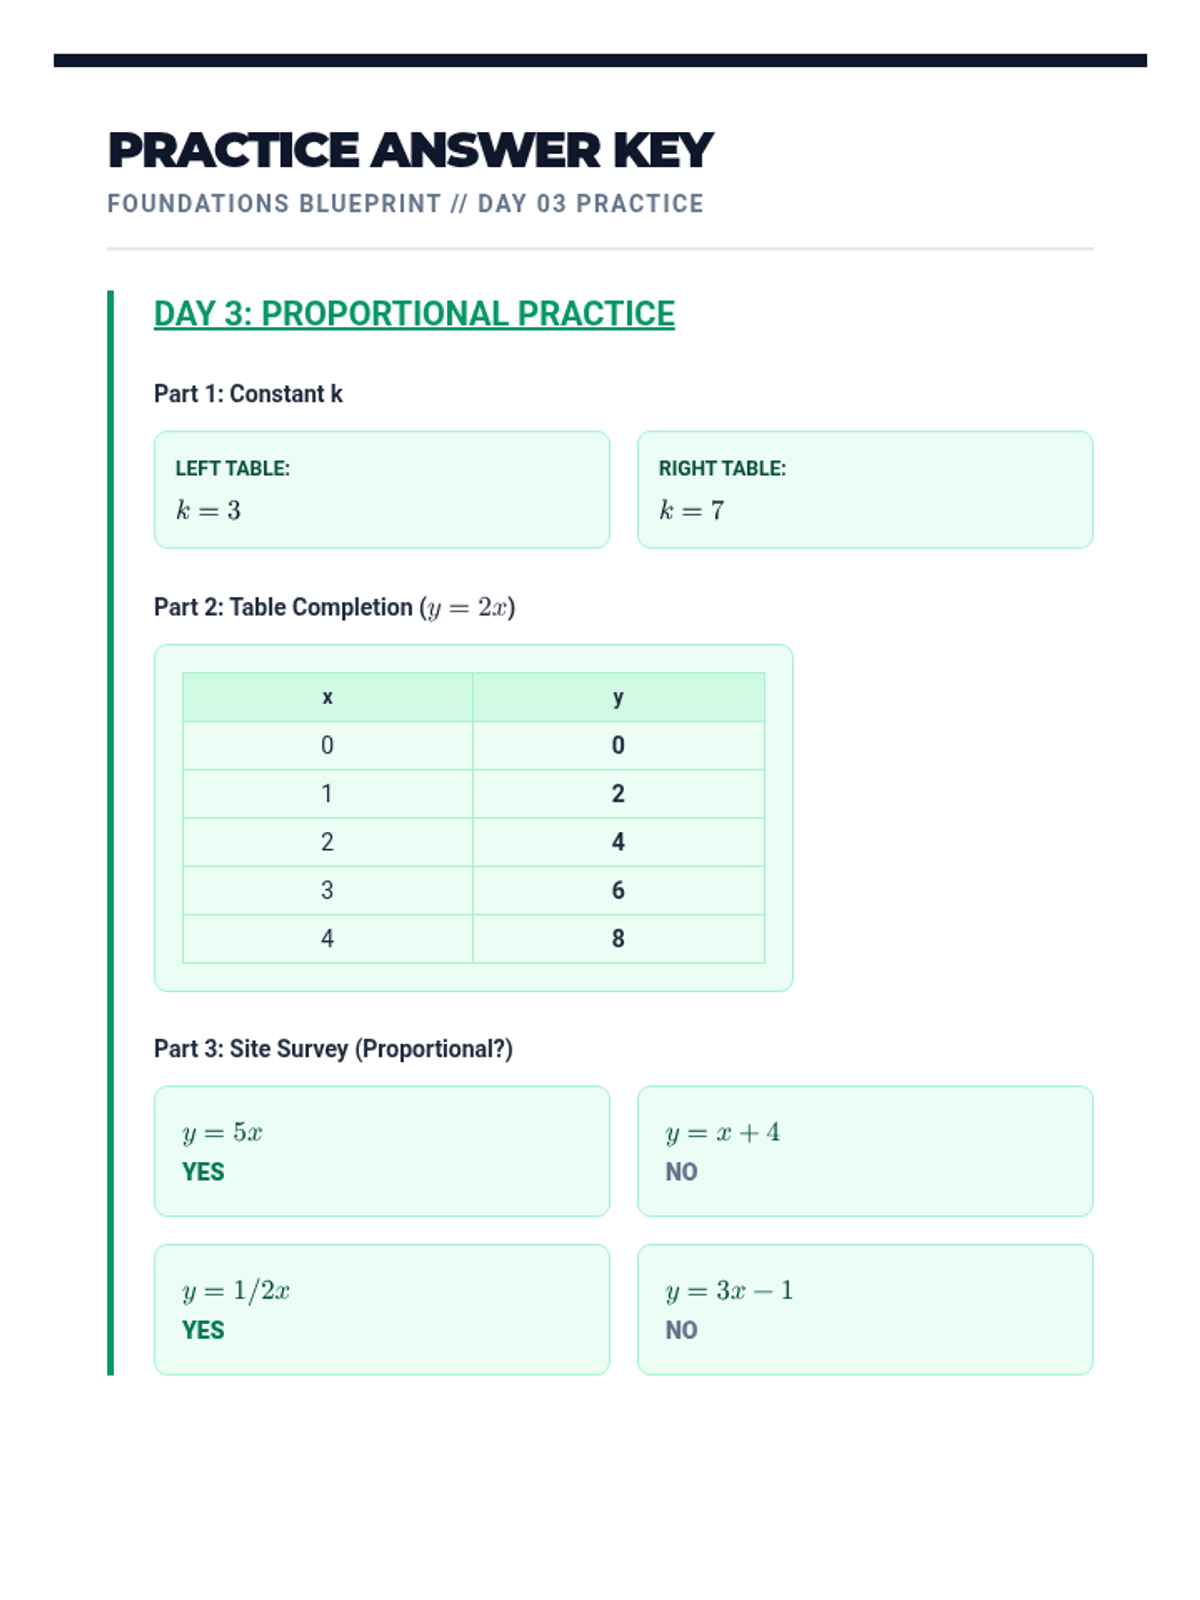
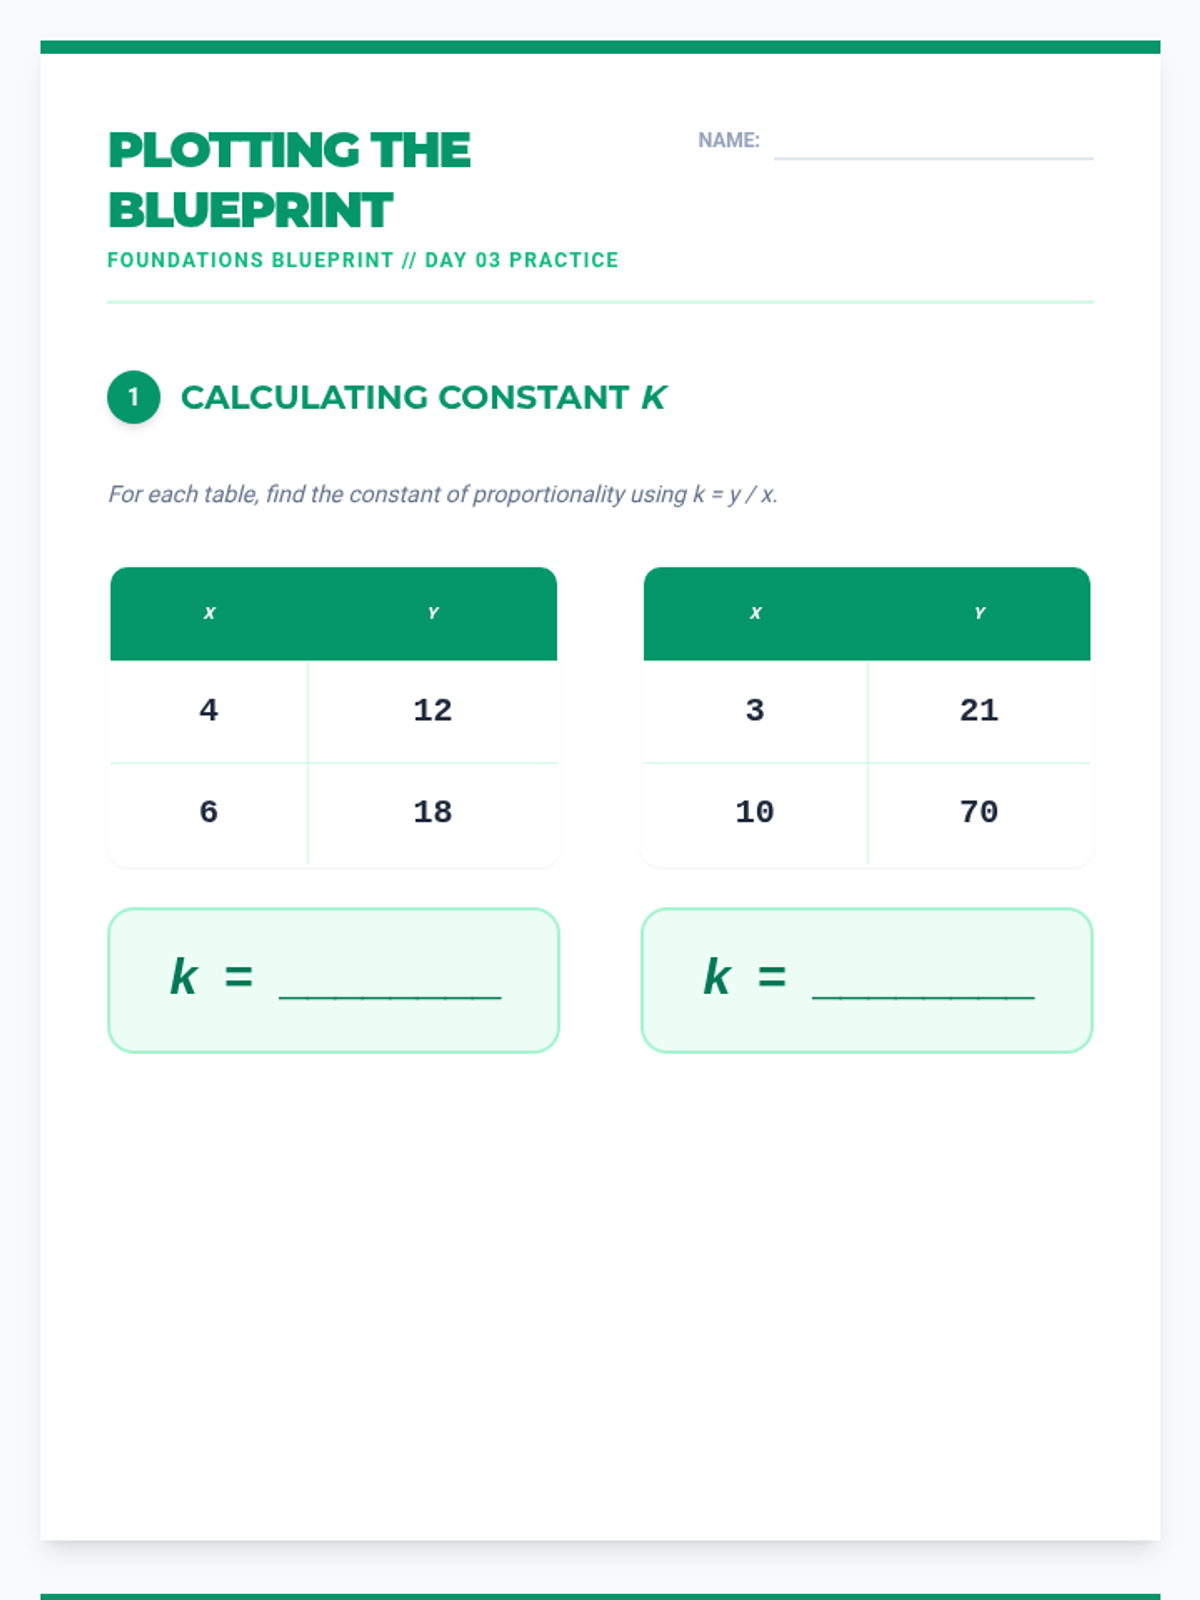
Students identify the constant of proportionality from tables and translate proportional relationships onto coordinate planes.
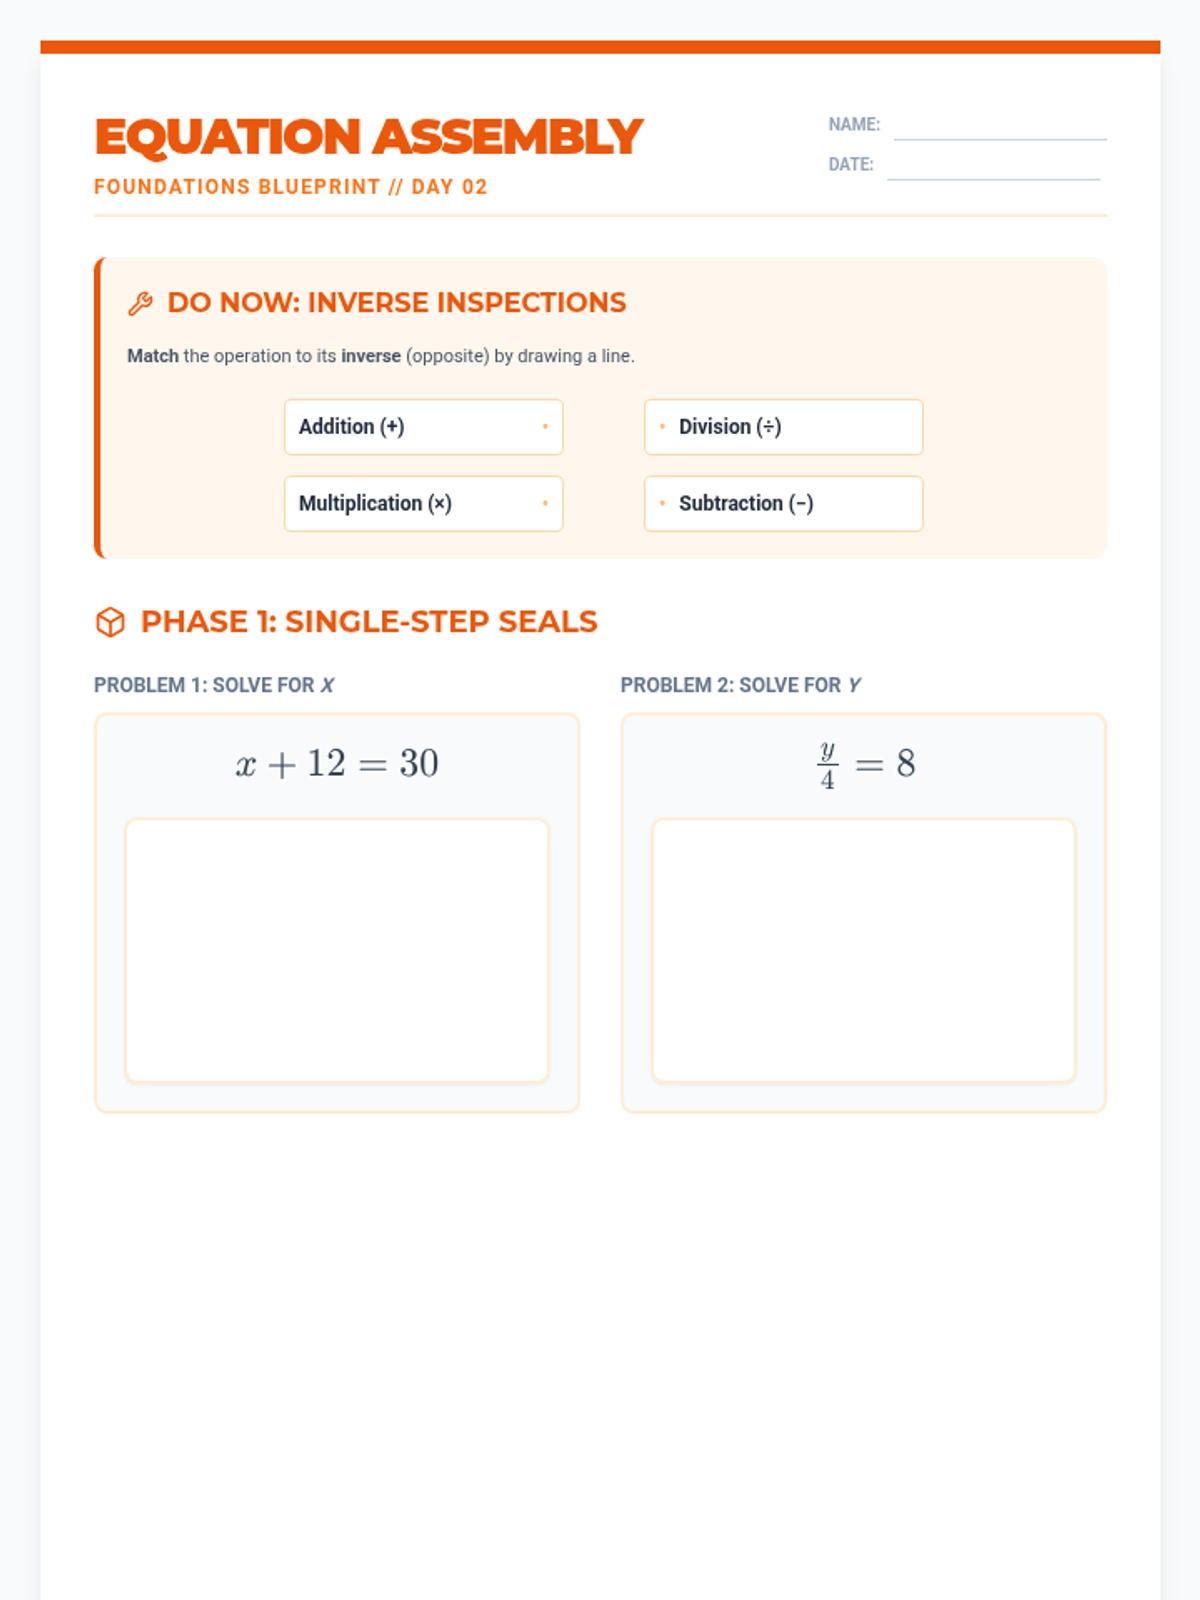
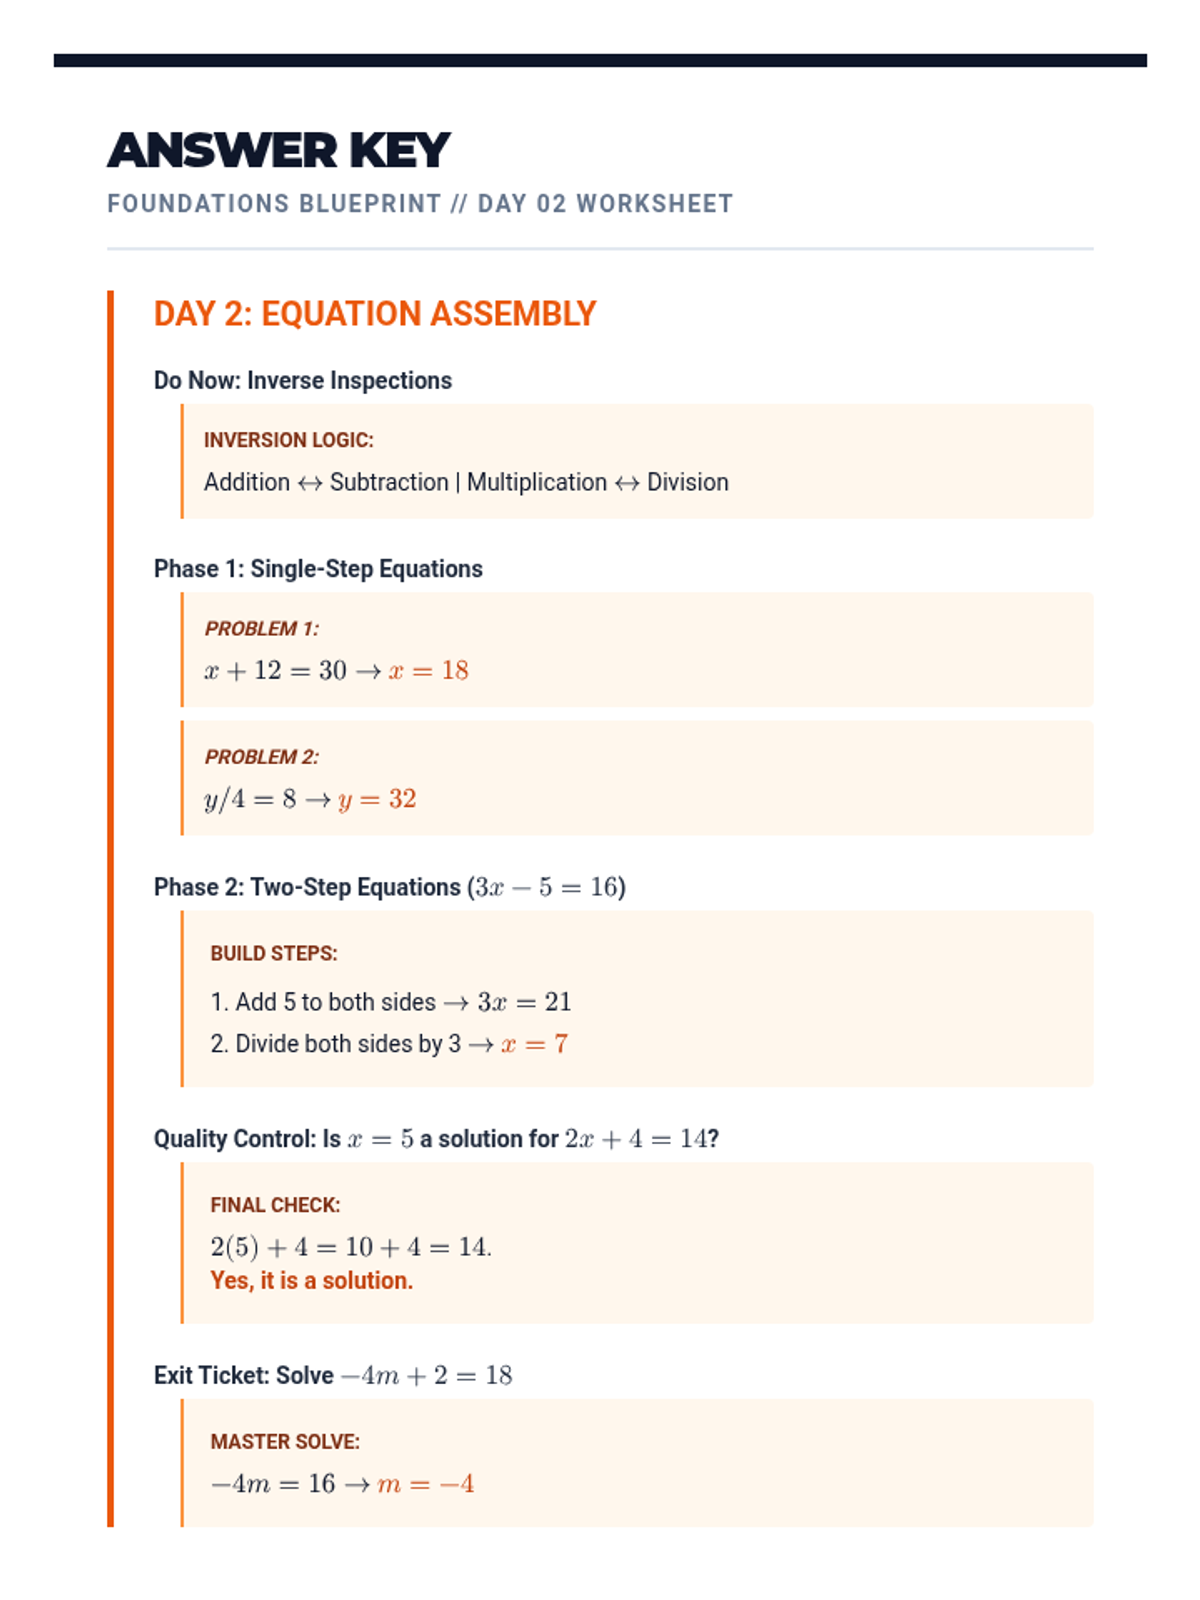
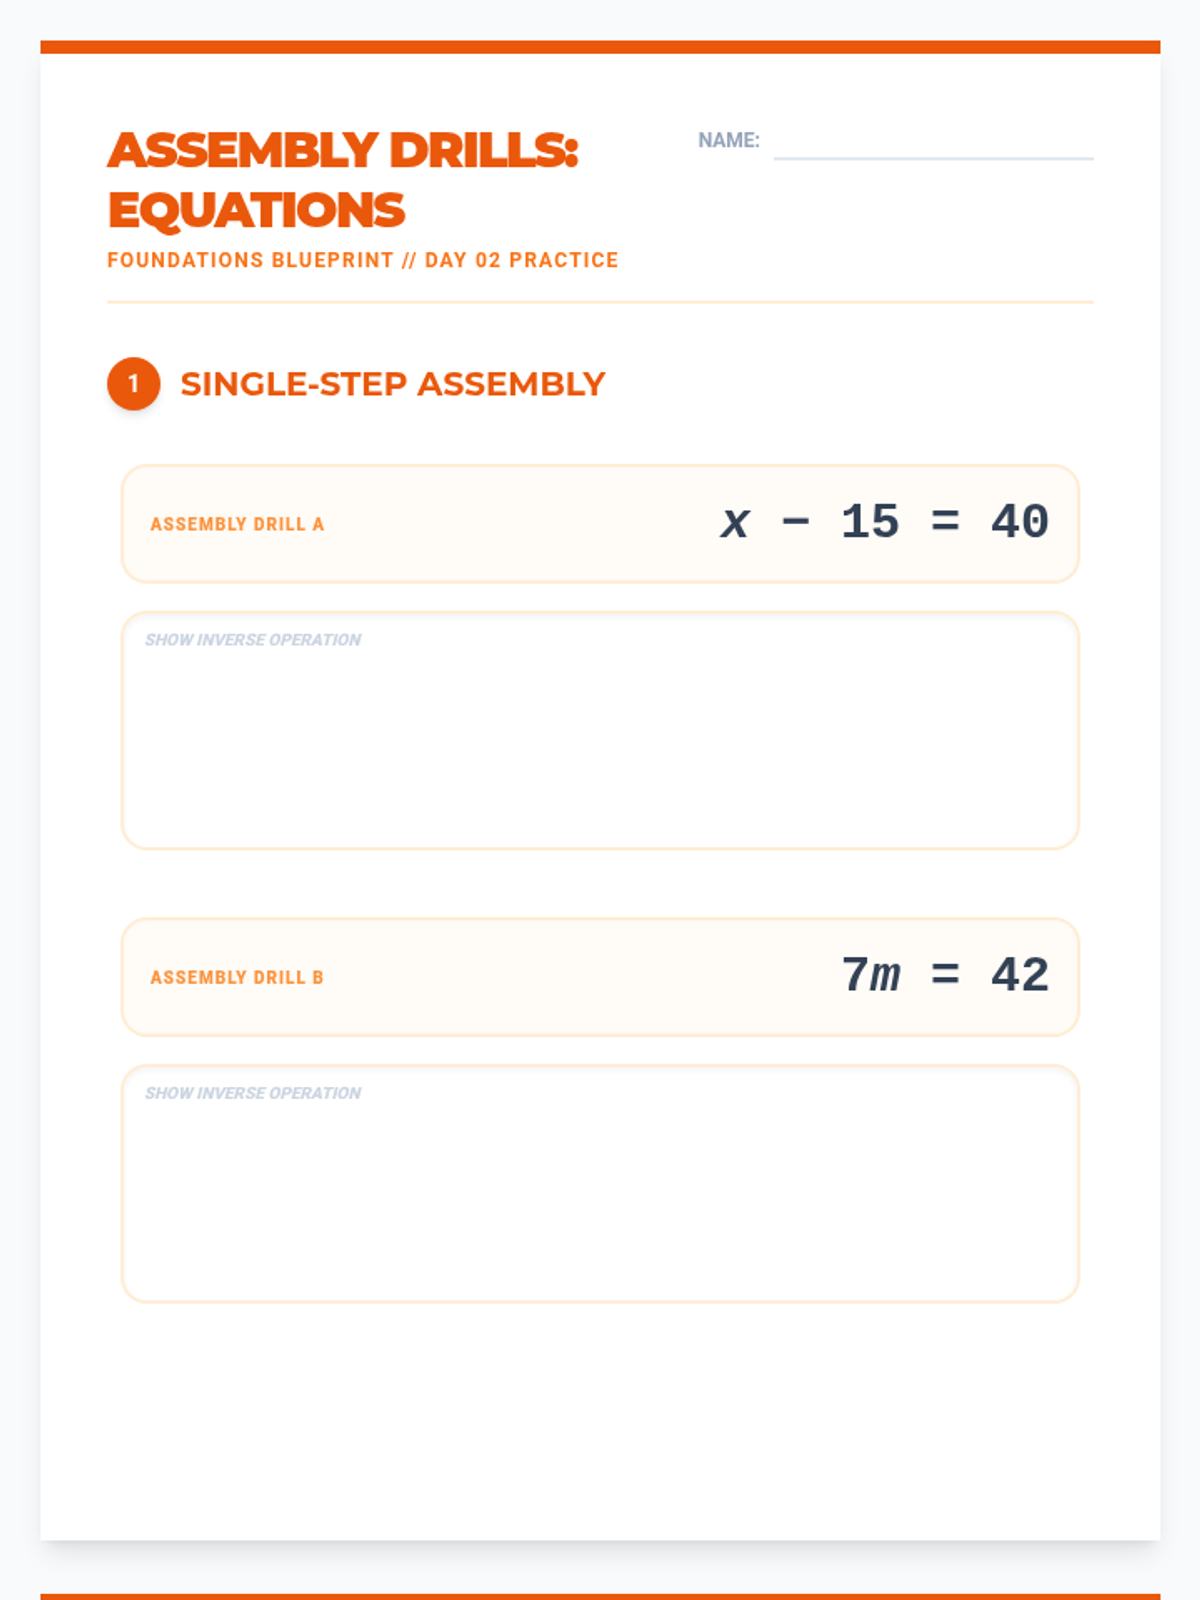
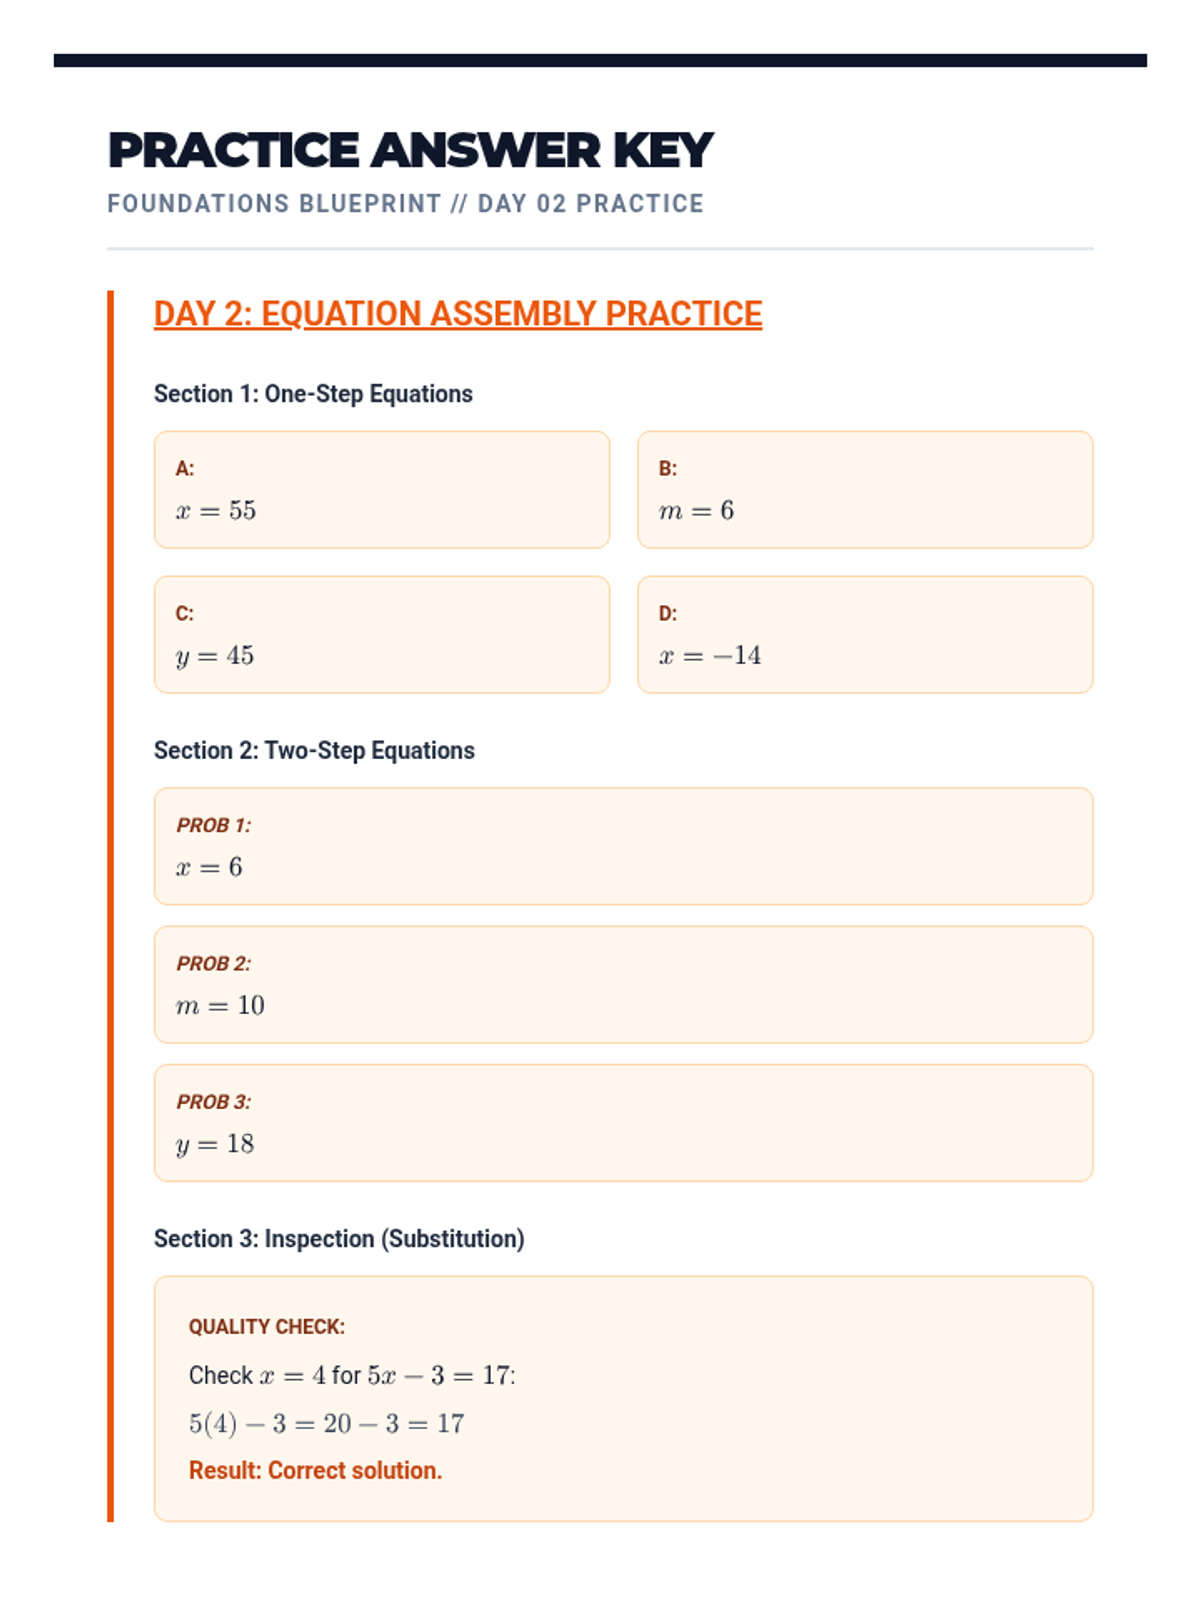
Covers solving one-step and two-step equations using inverse operations and verifying solutions through substitution.
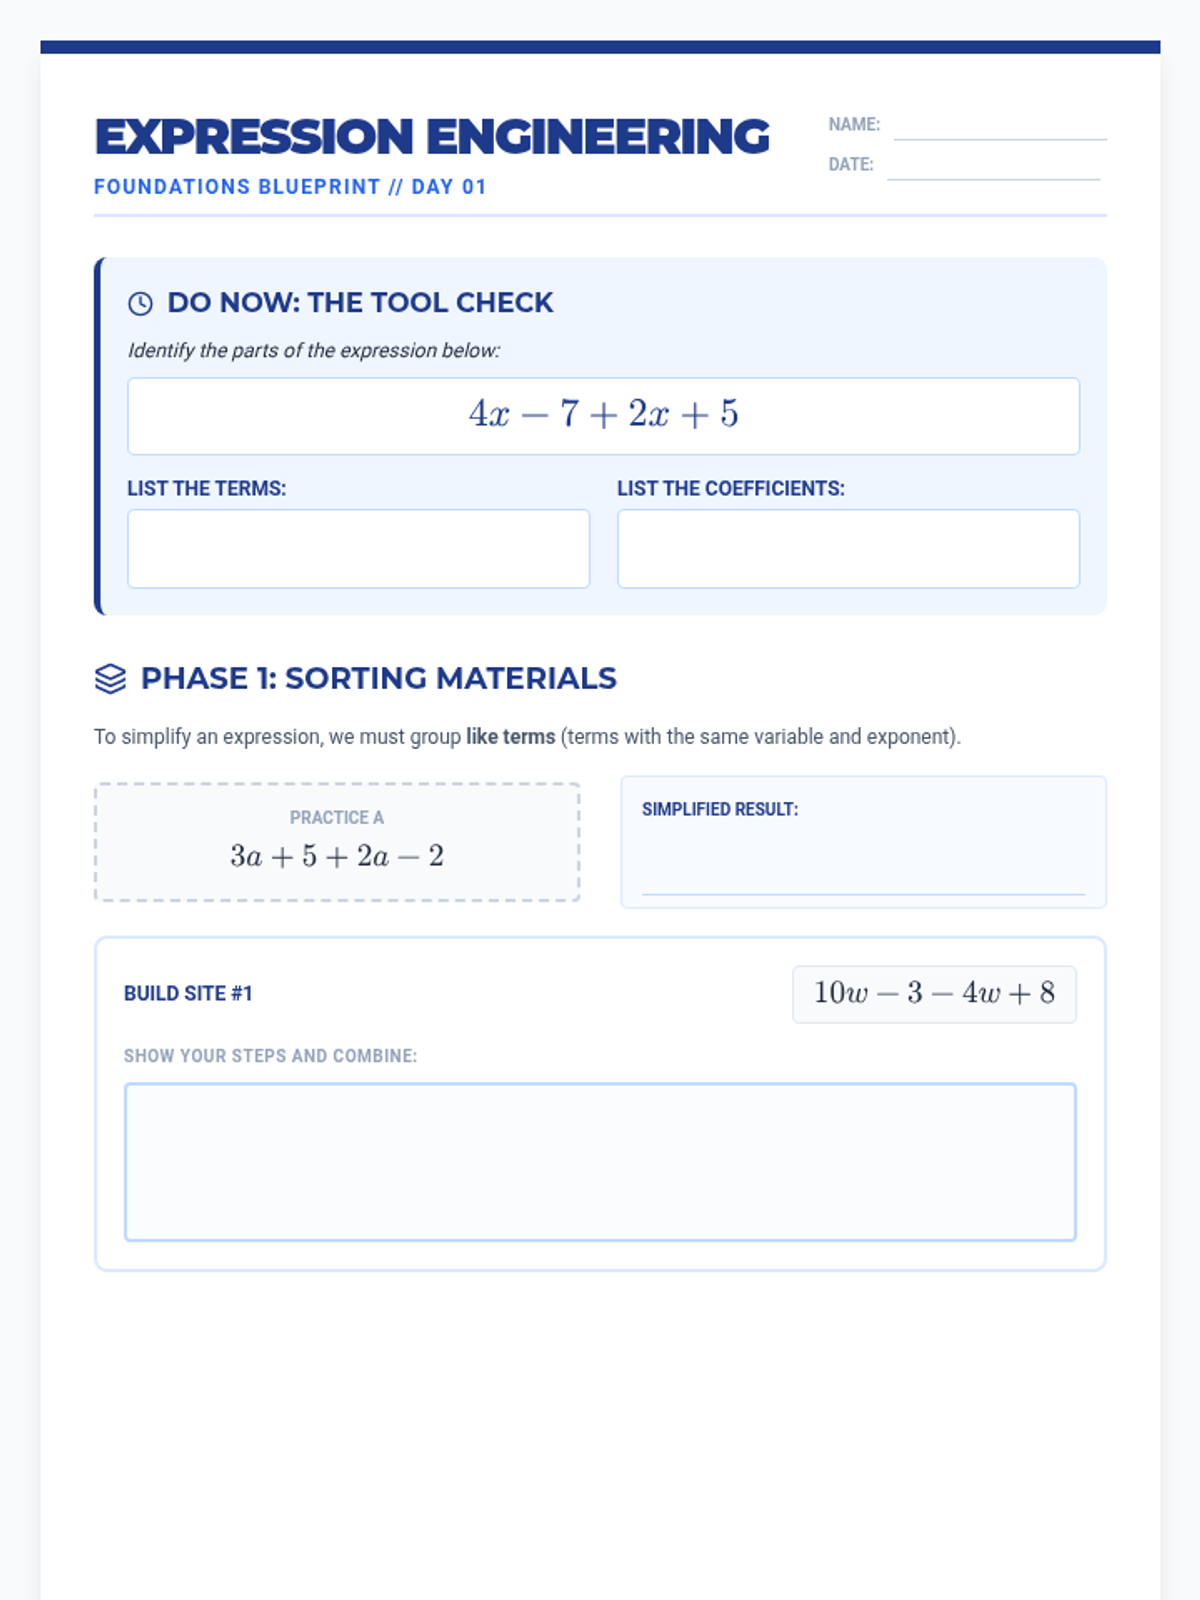
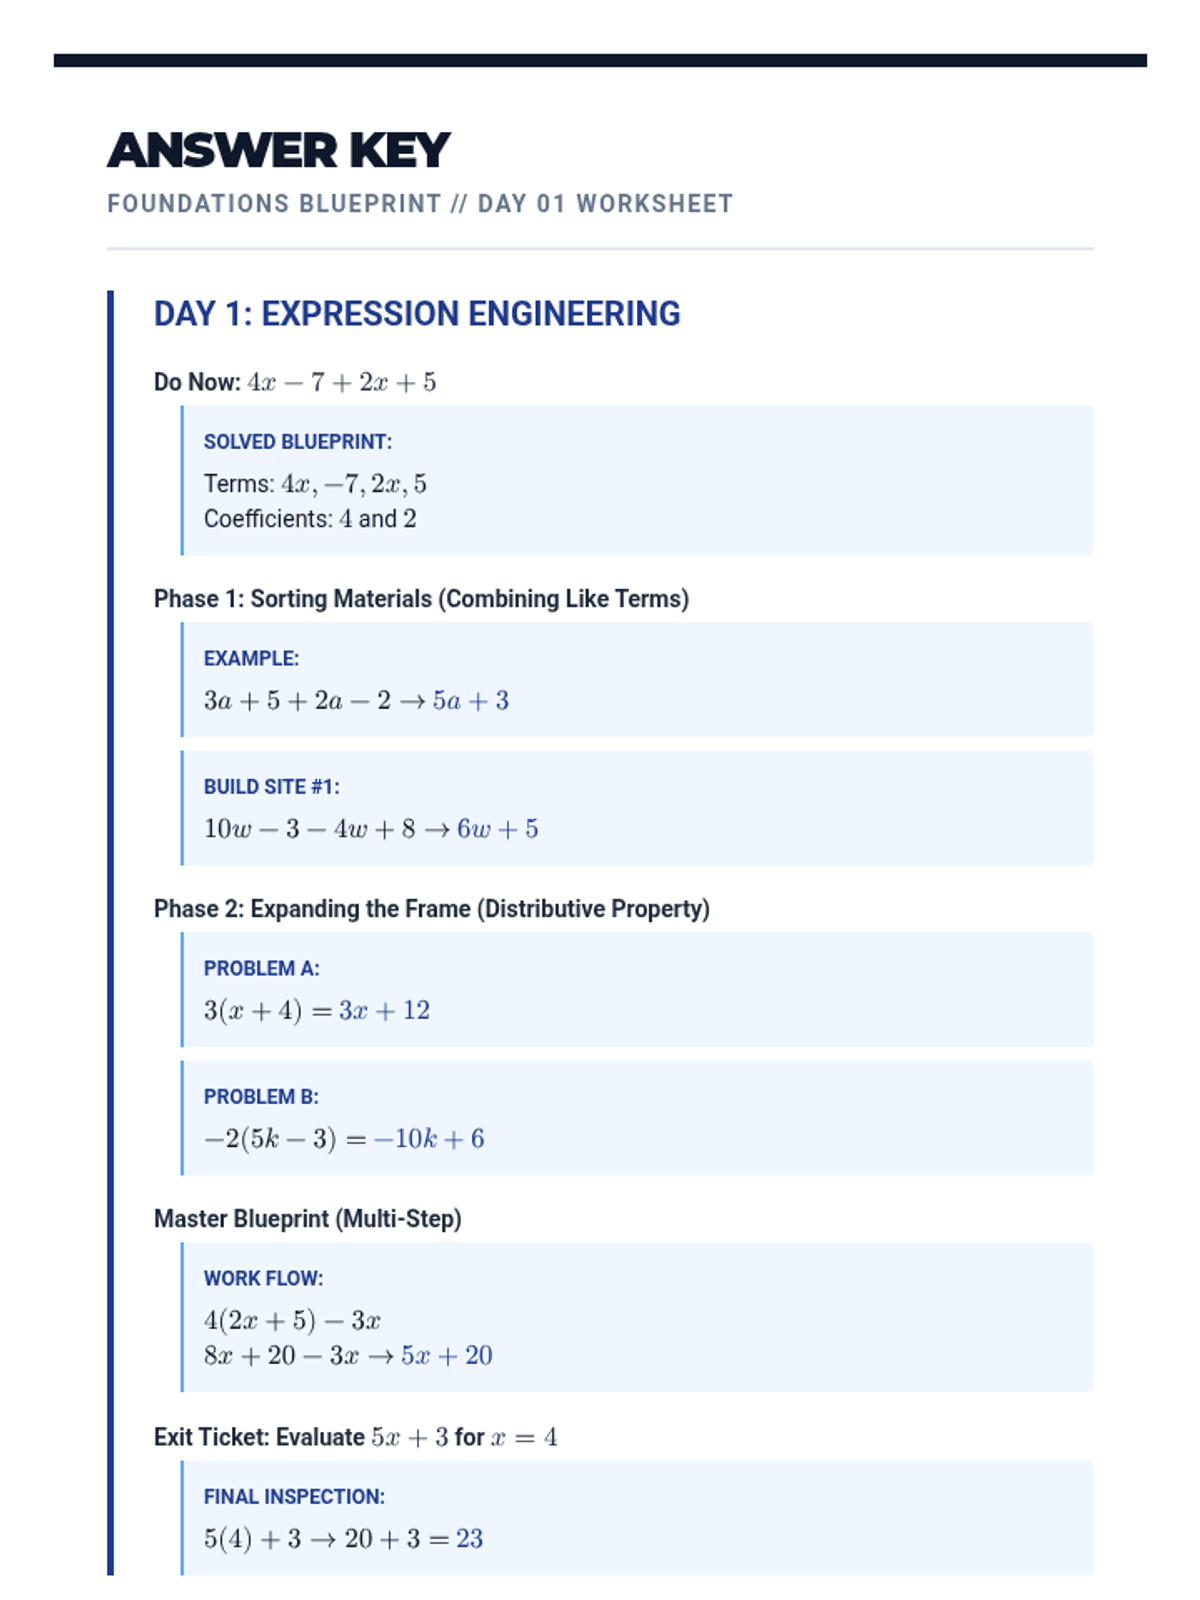
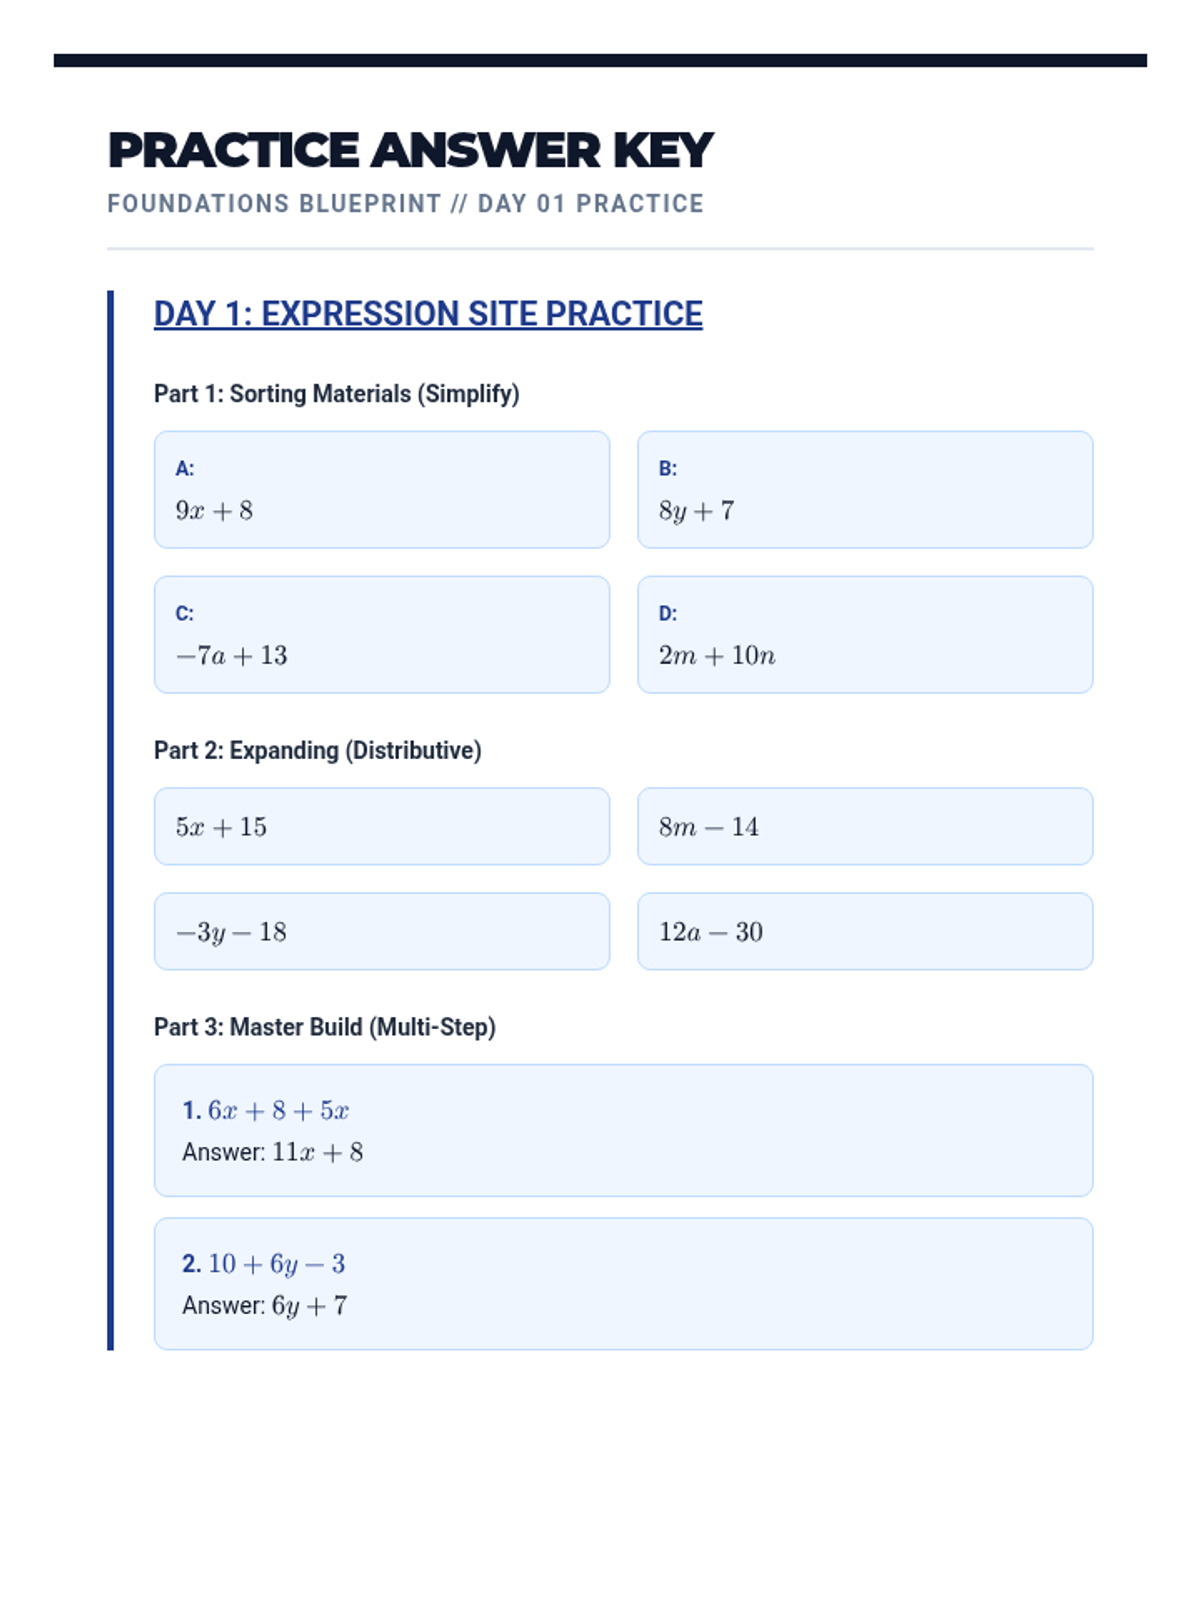
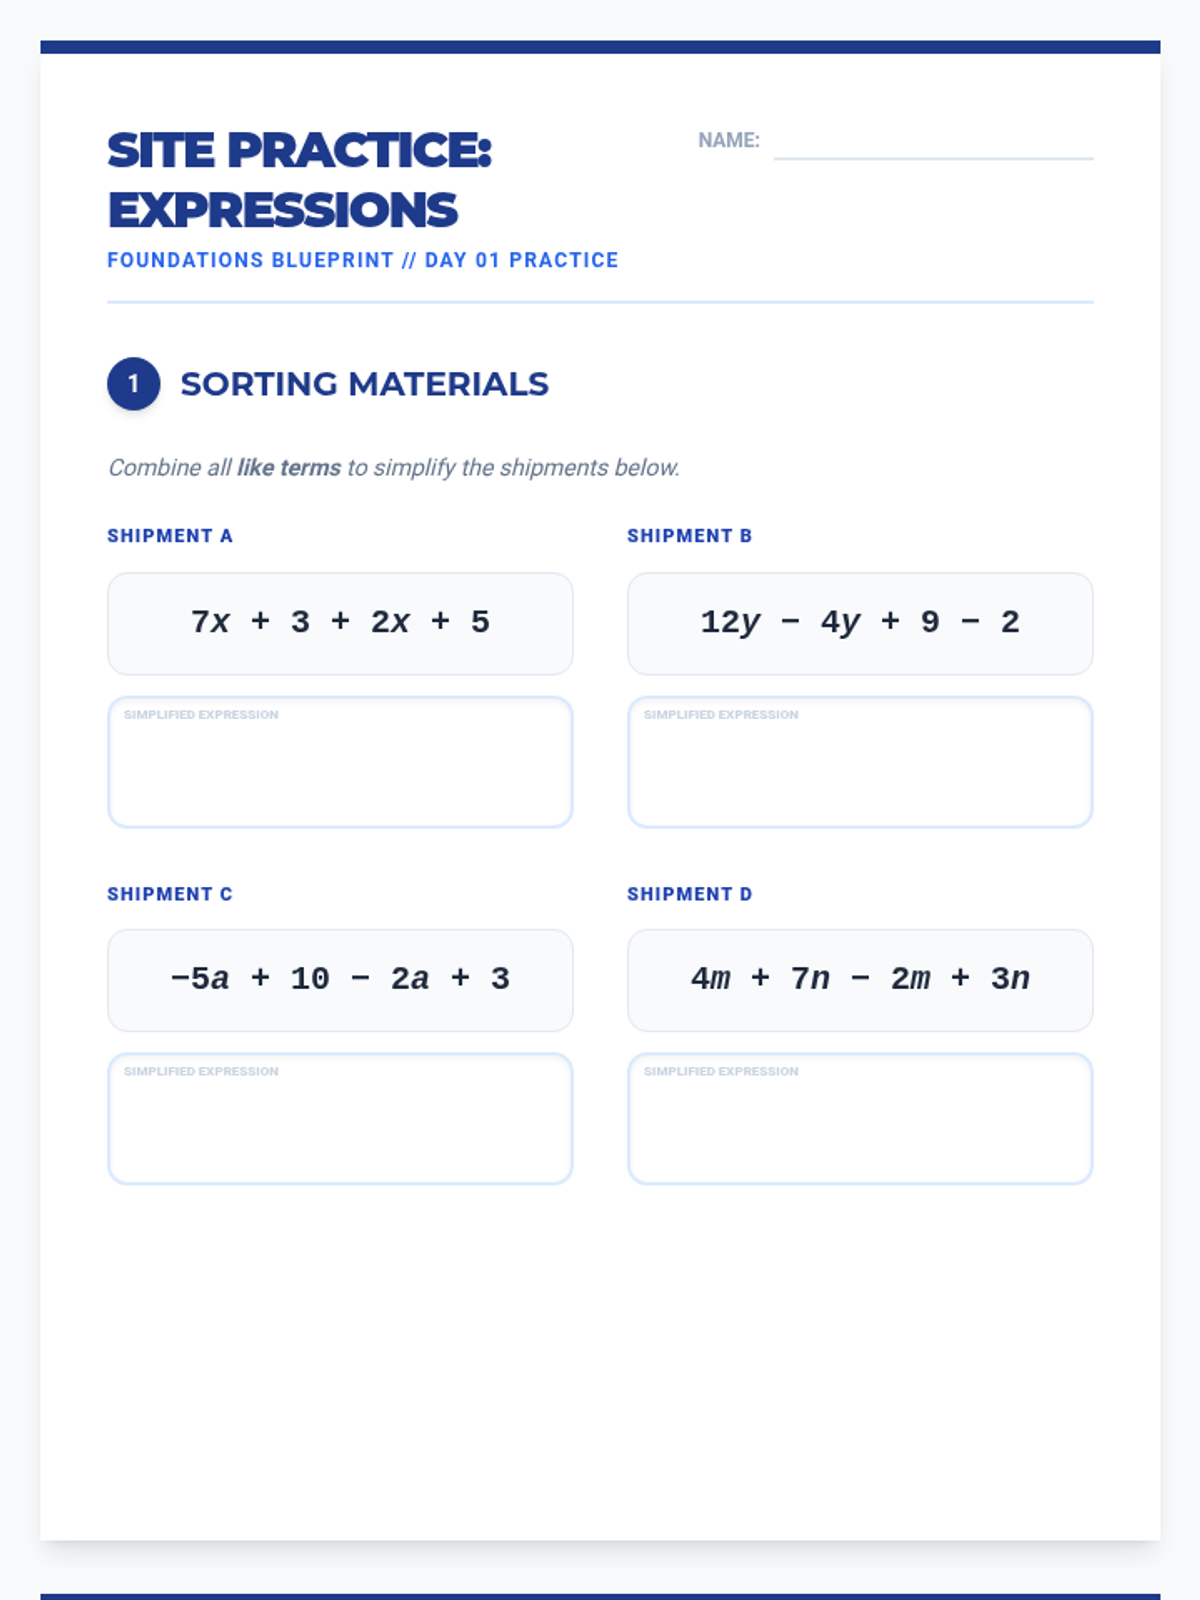
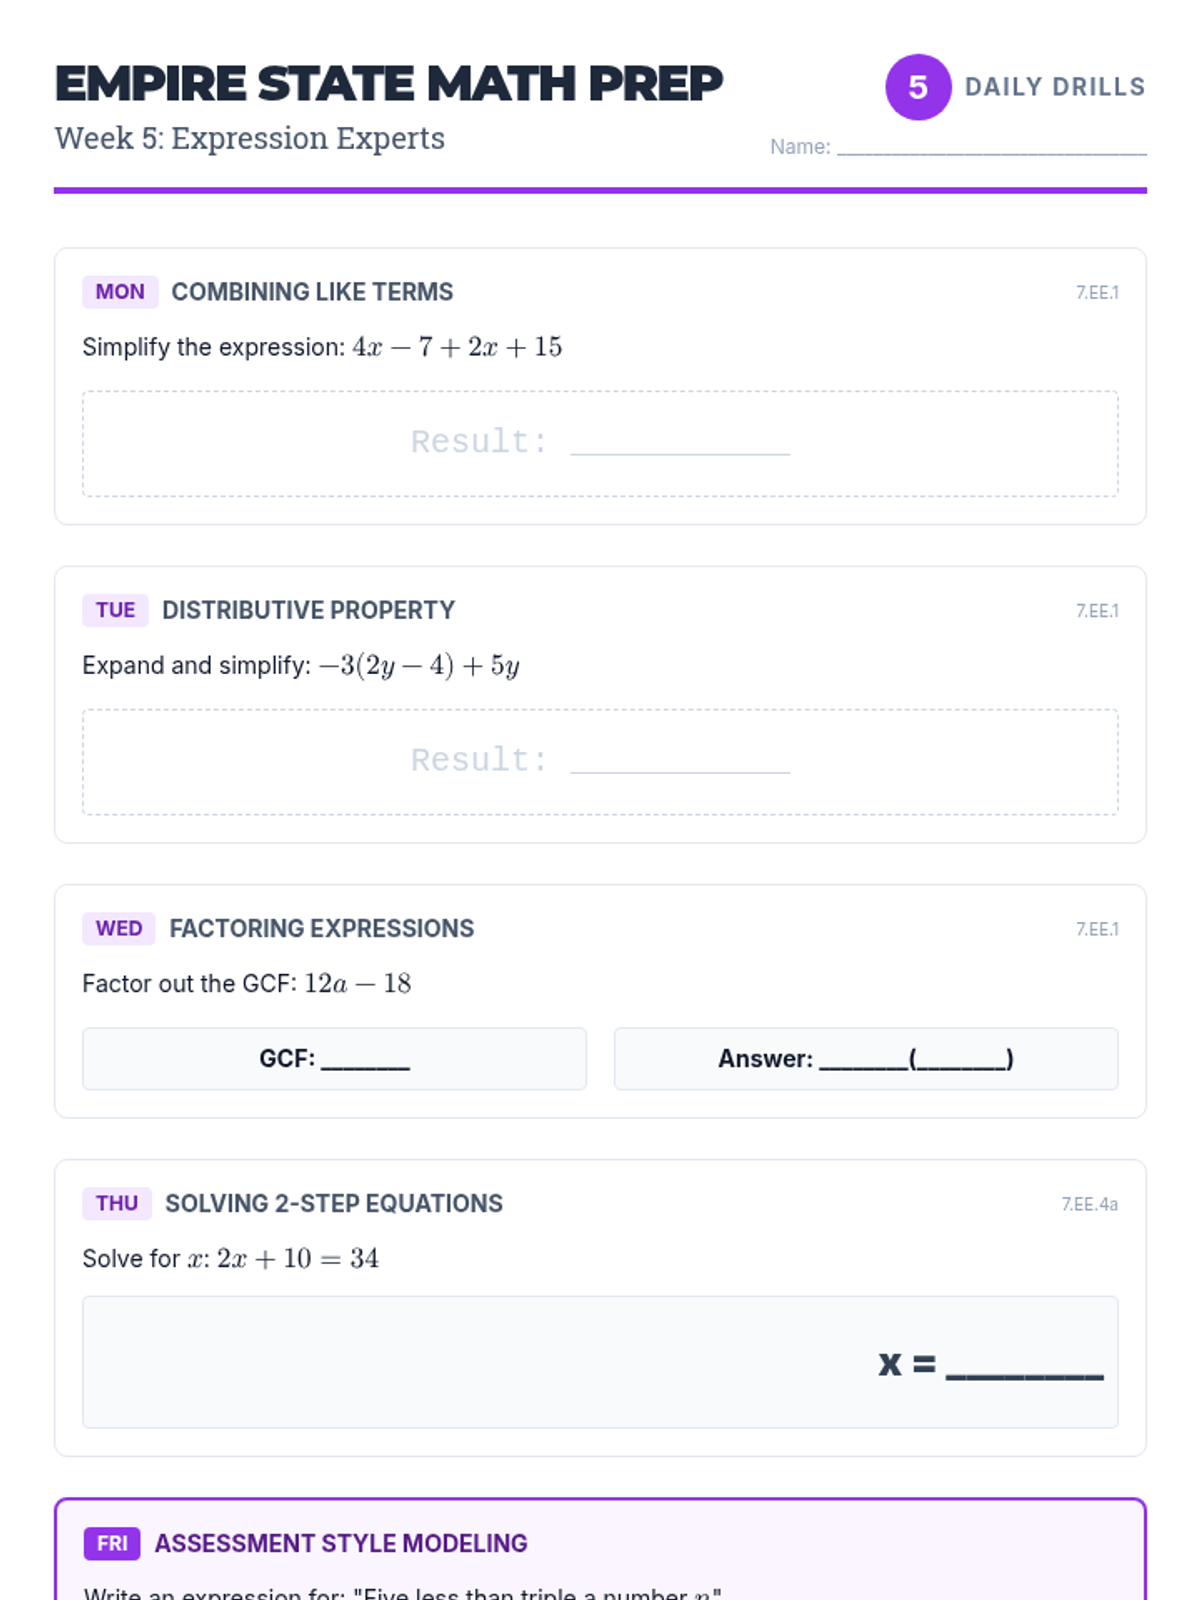
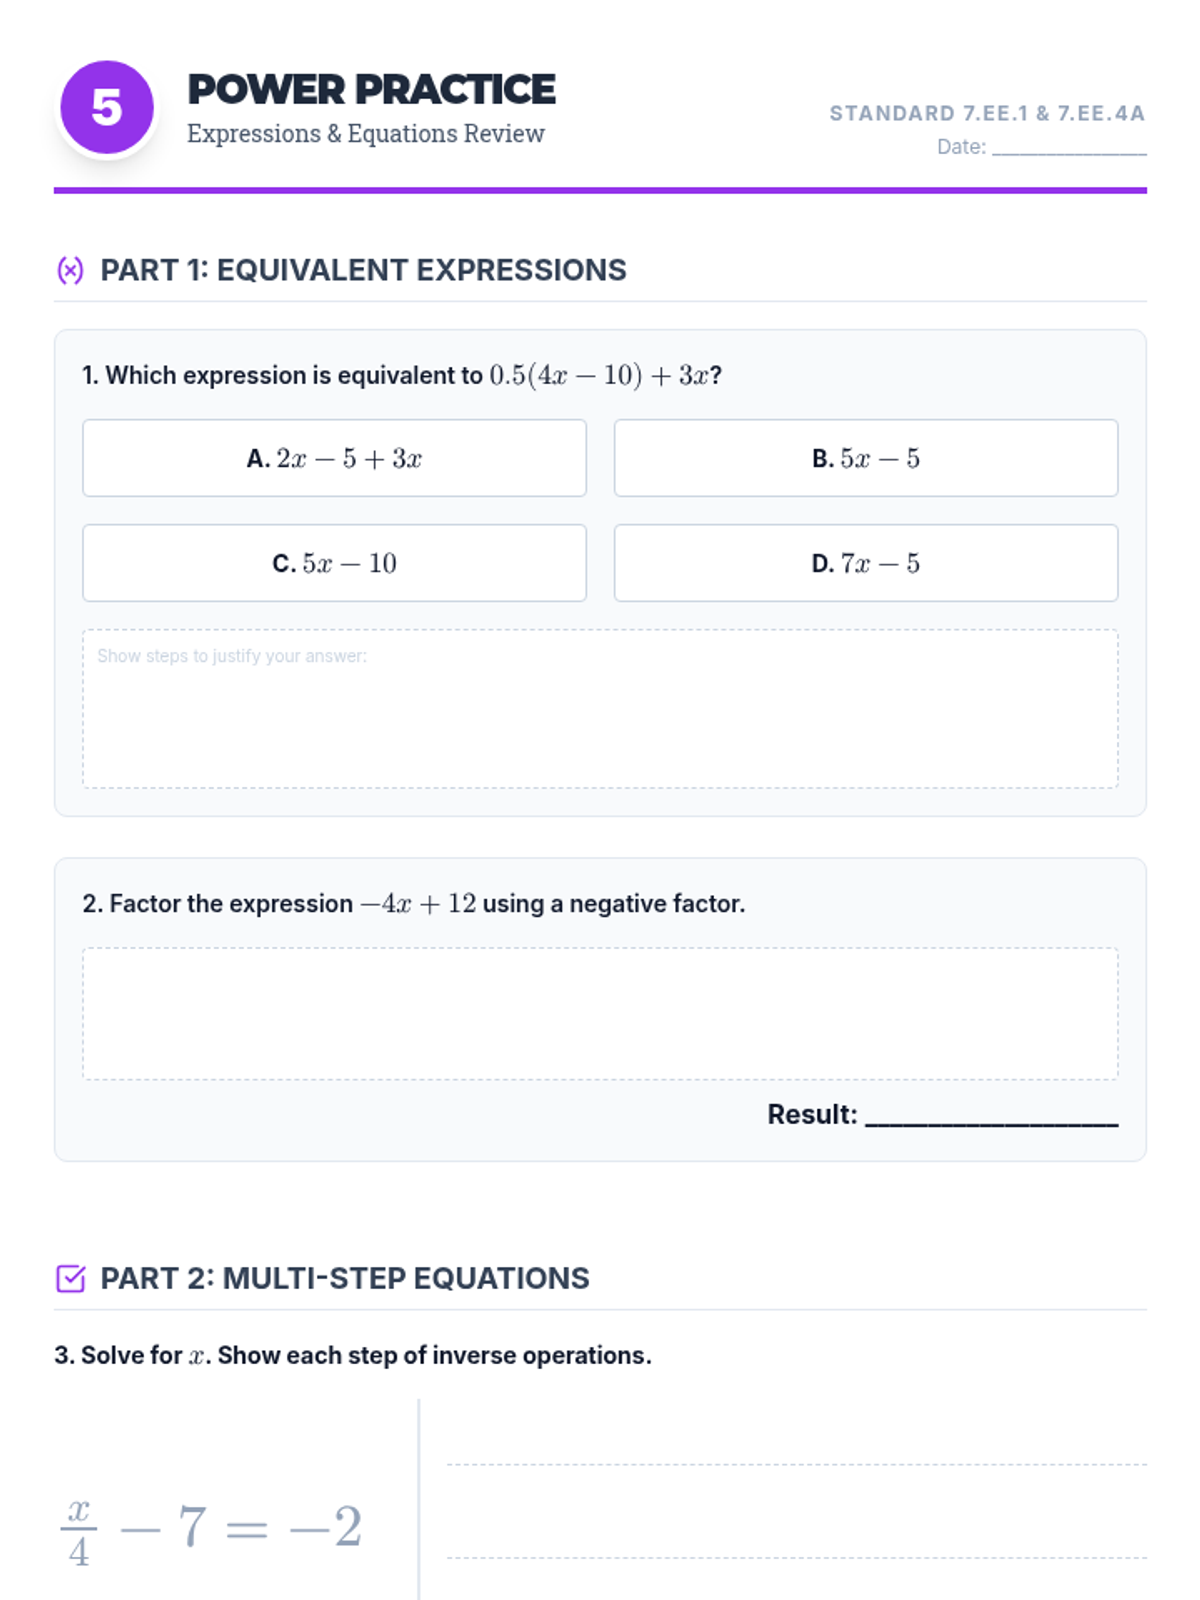
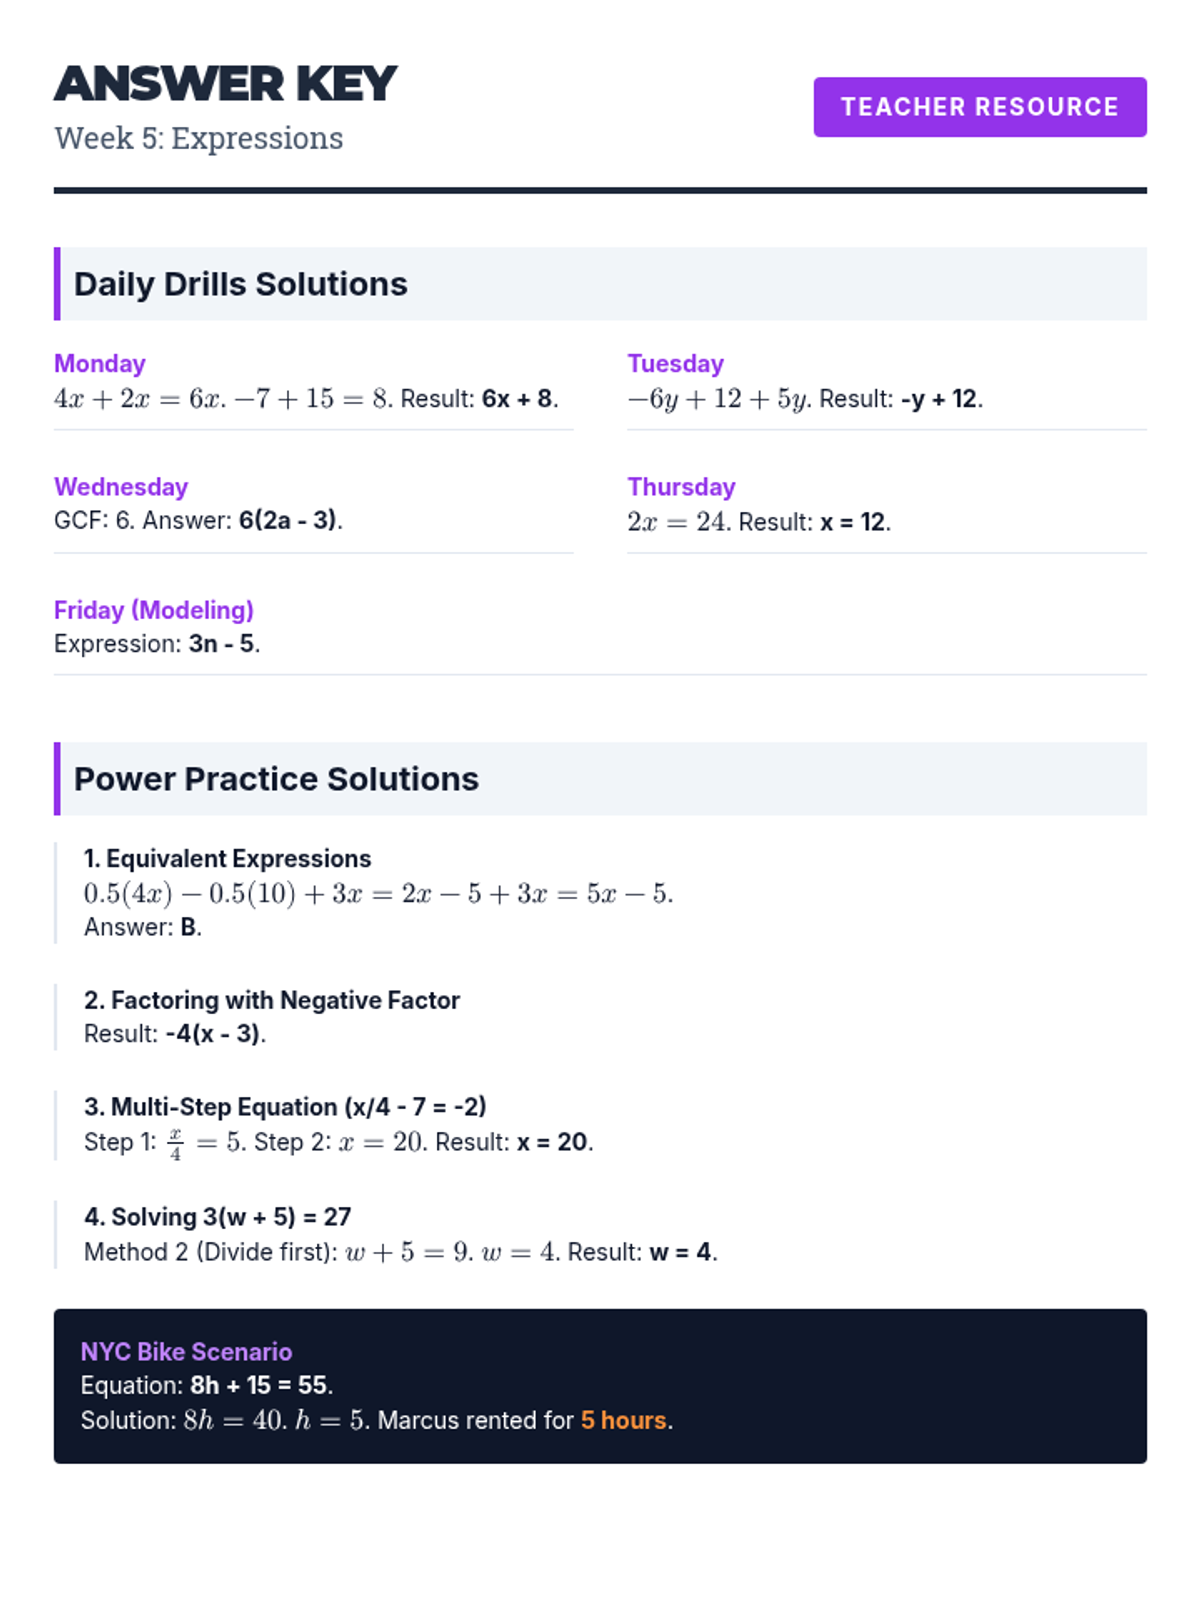
Focuses on identifying terms, combining like terms, and applying the distributive property to simplify algebraic expressions.
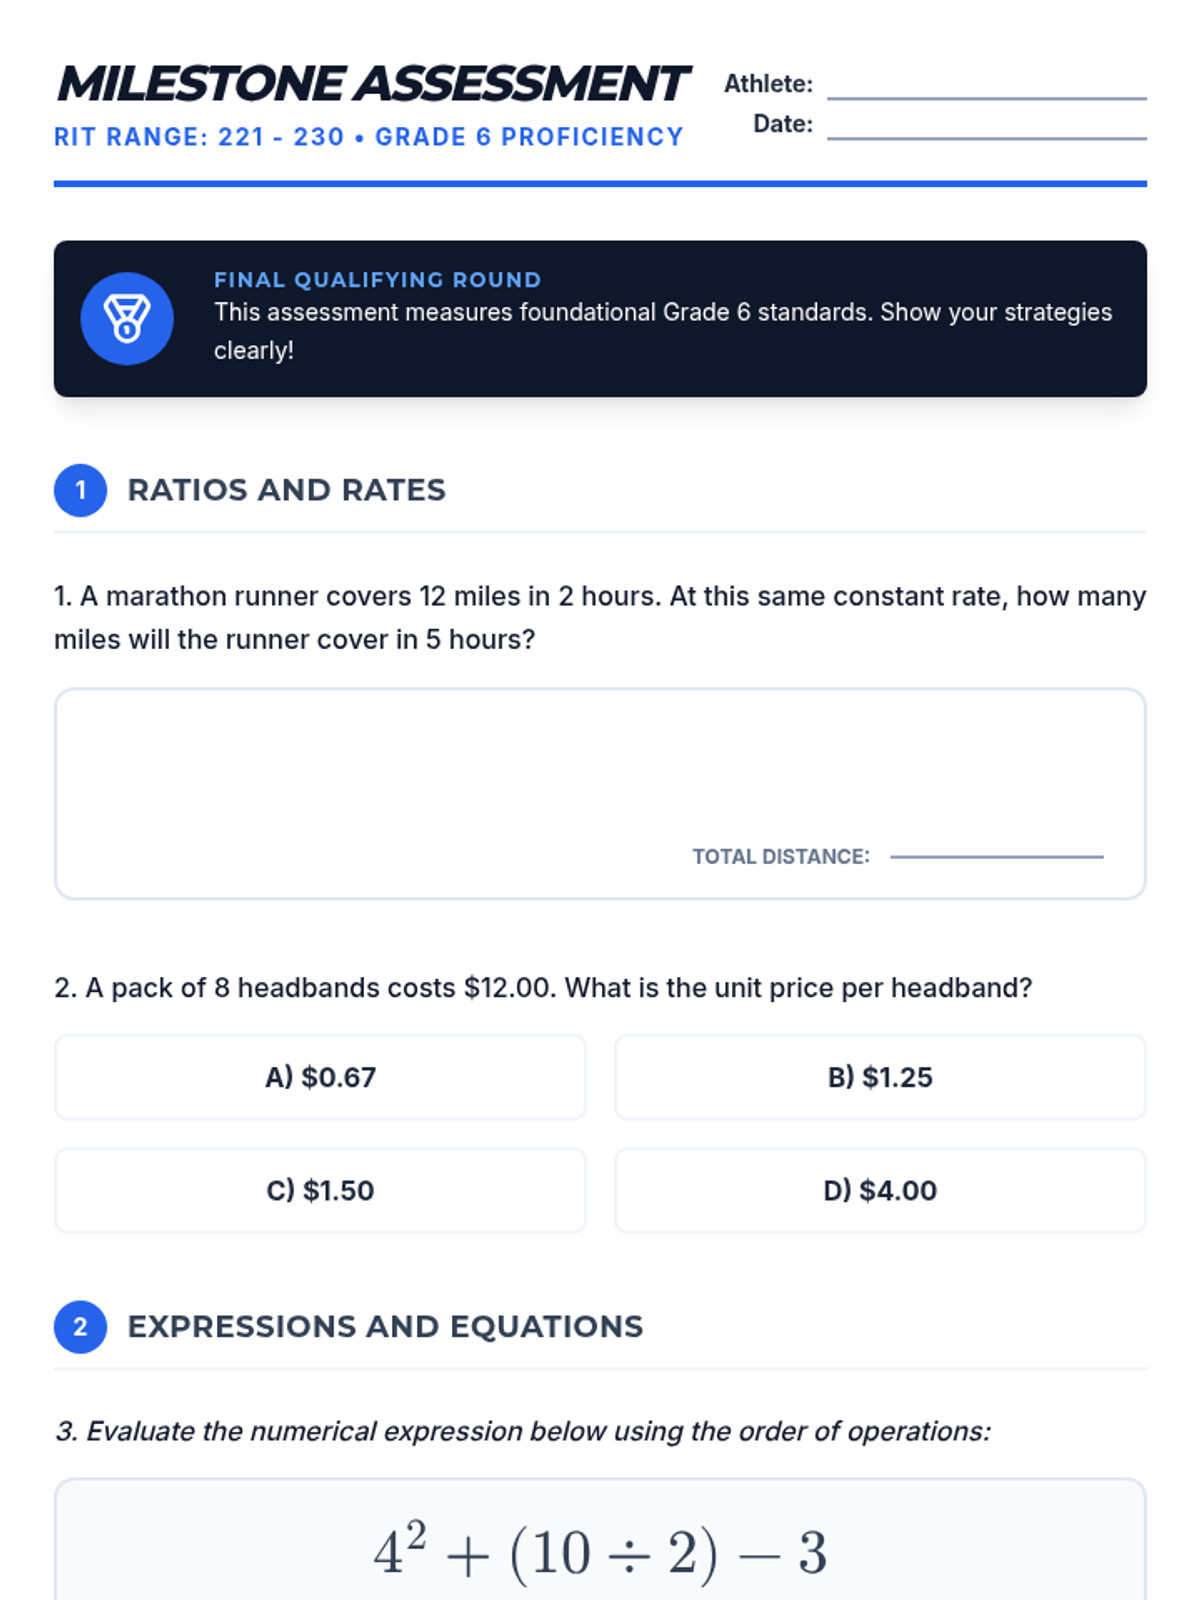
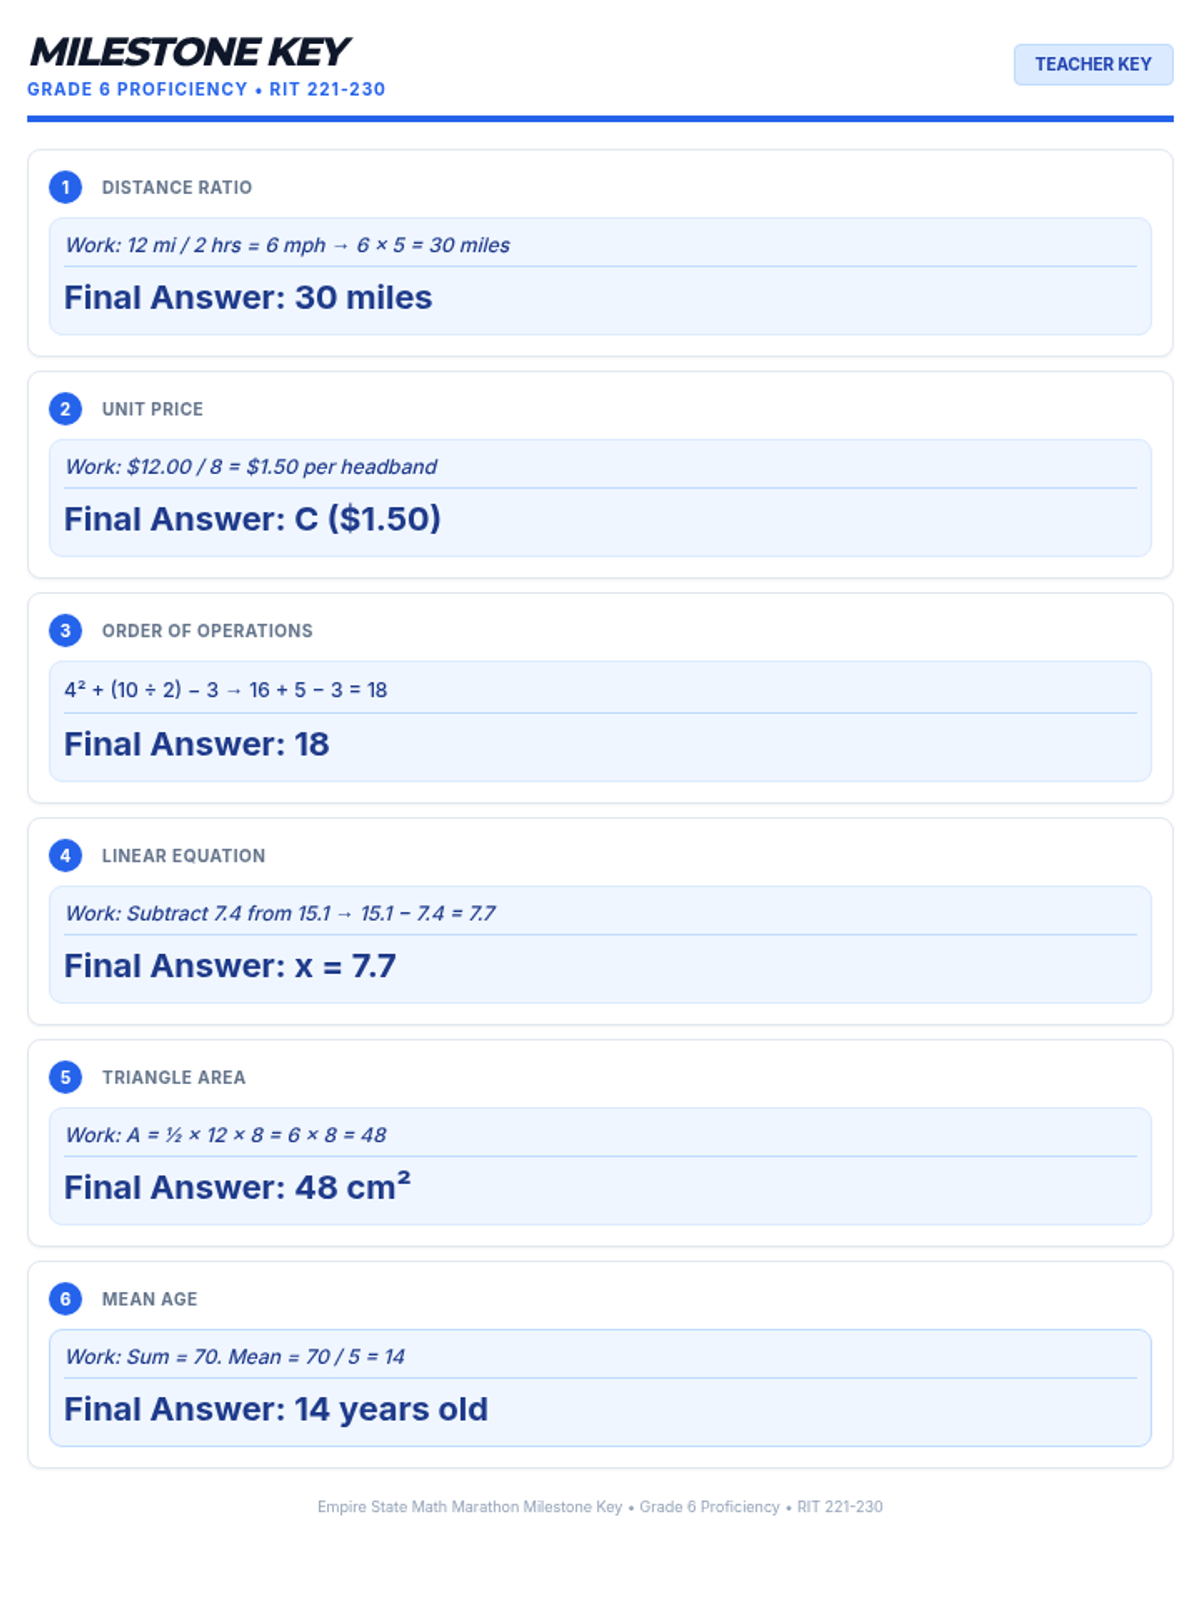
A cumulative milestone assessment designed for students at Grade 6 proficiency (RIT 221-230). This assessment checks foundational understanding of ratios, expressions, and geometry needed for 8th-grade success.
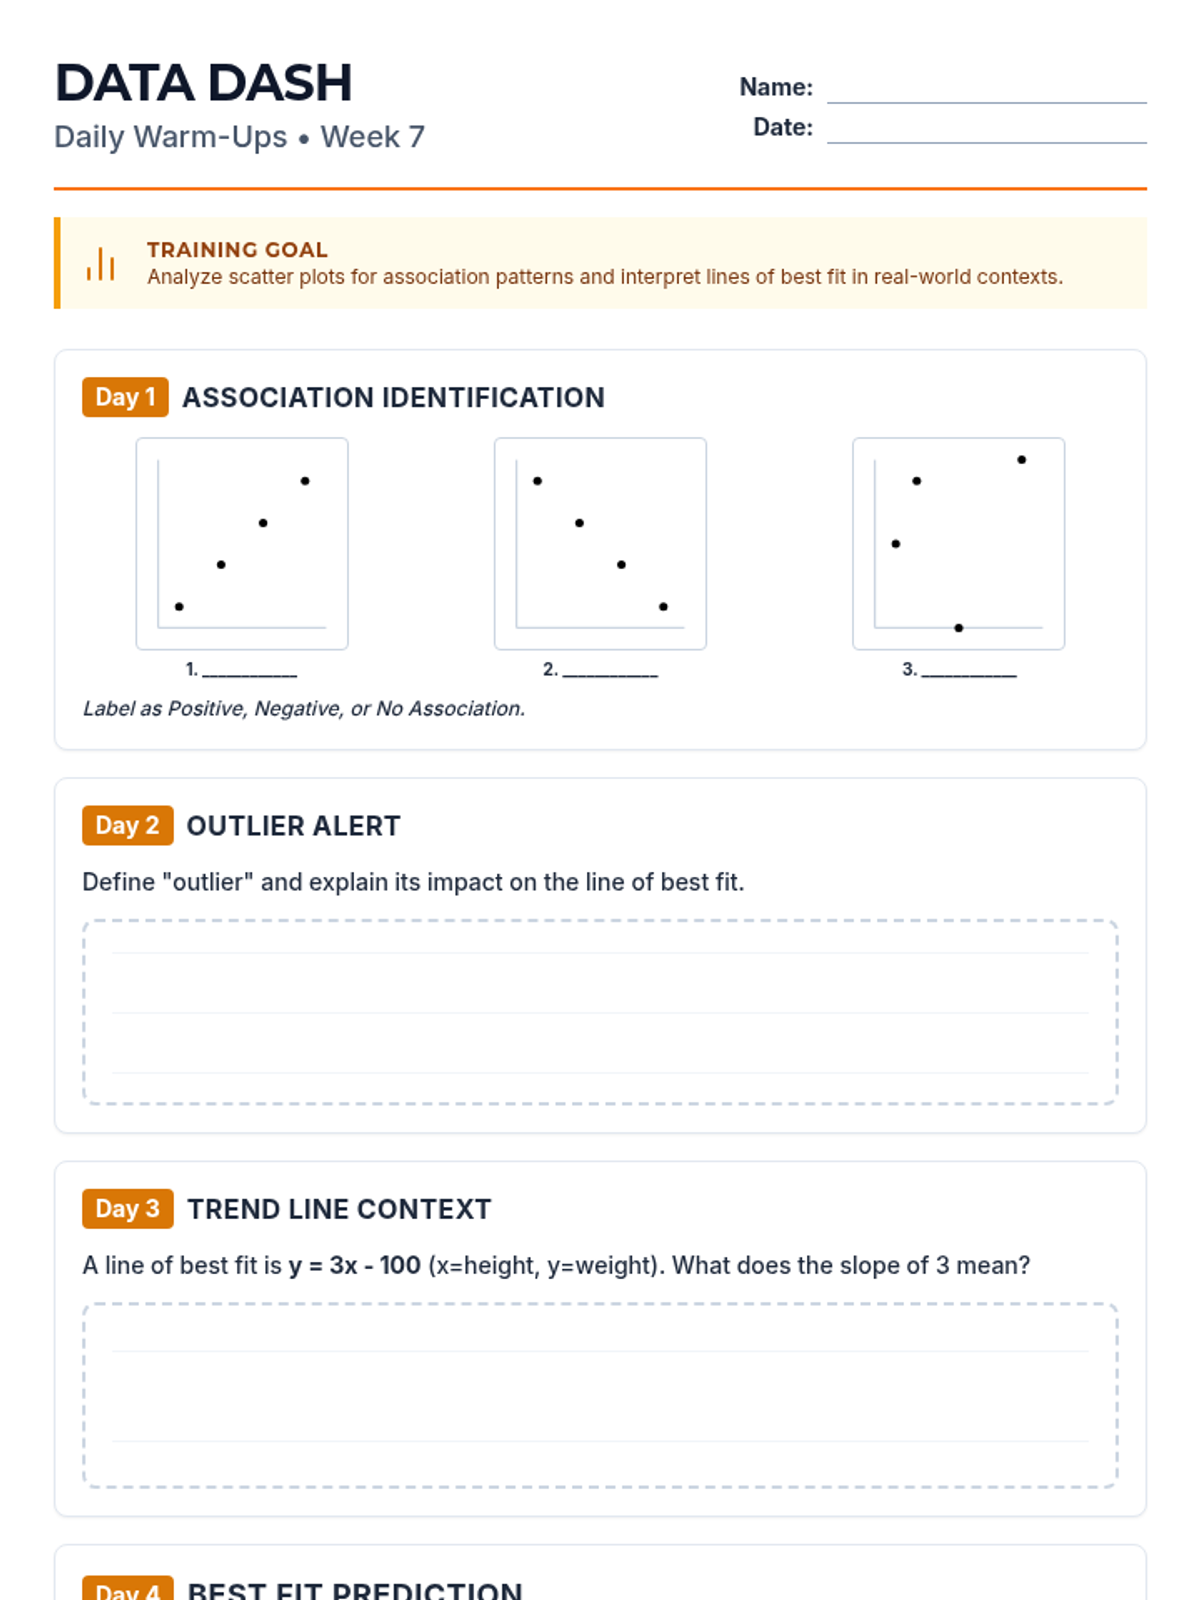
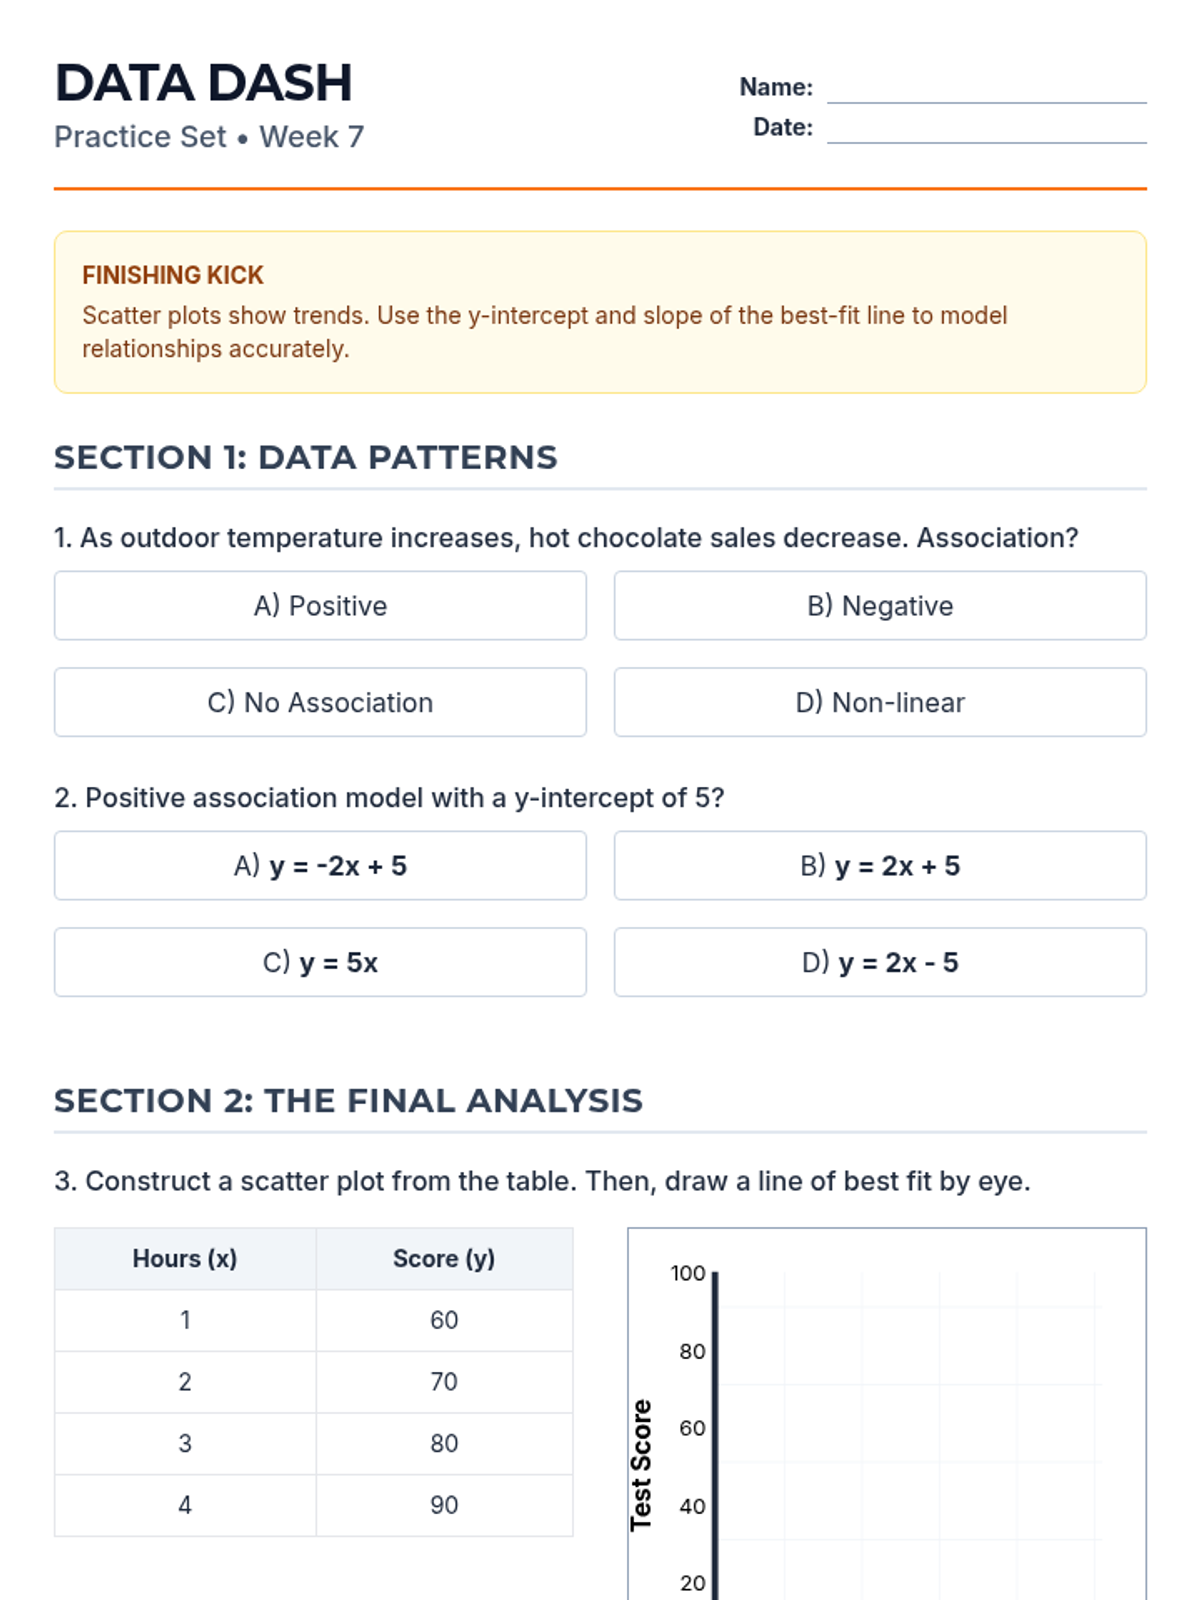
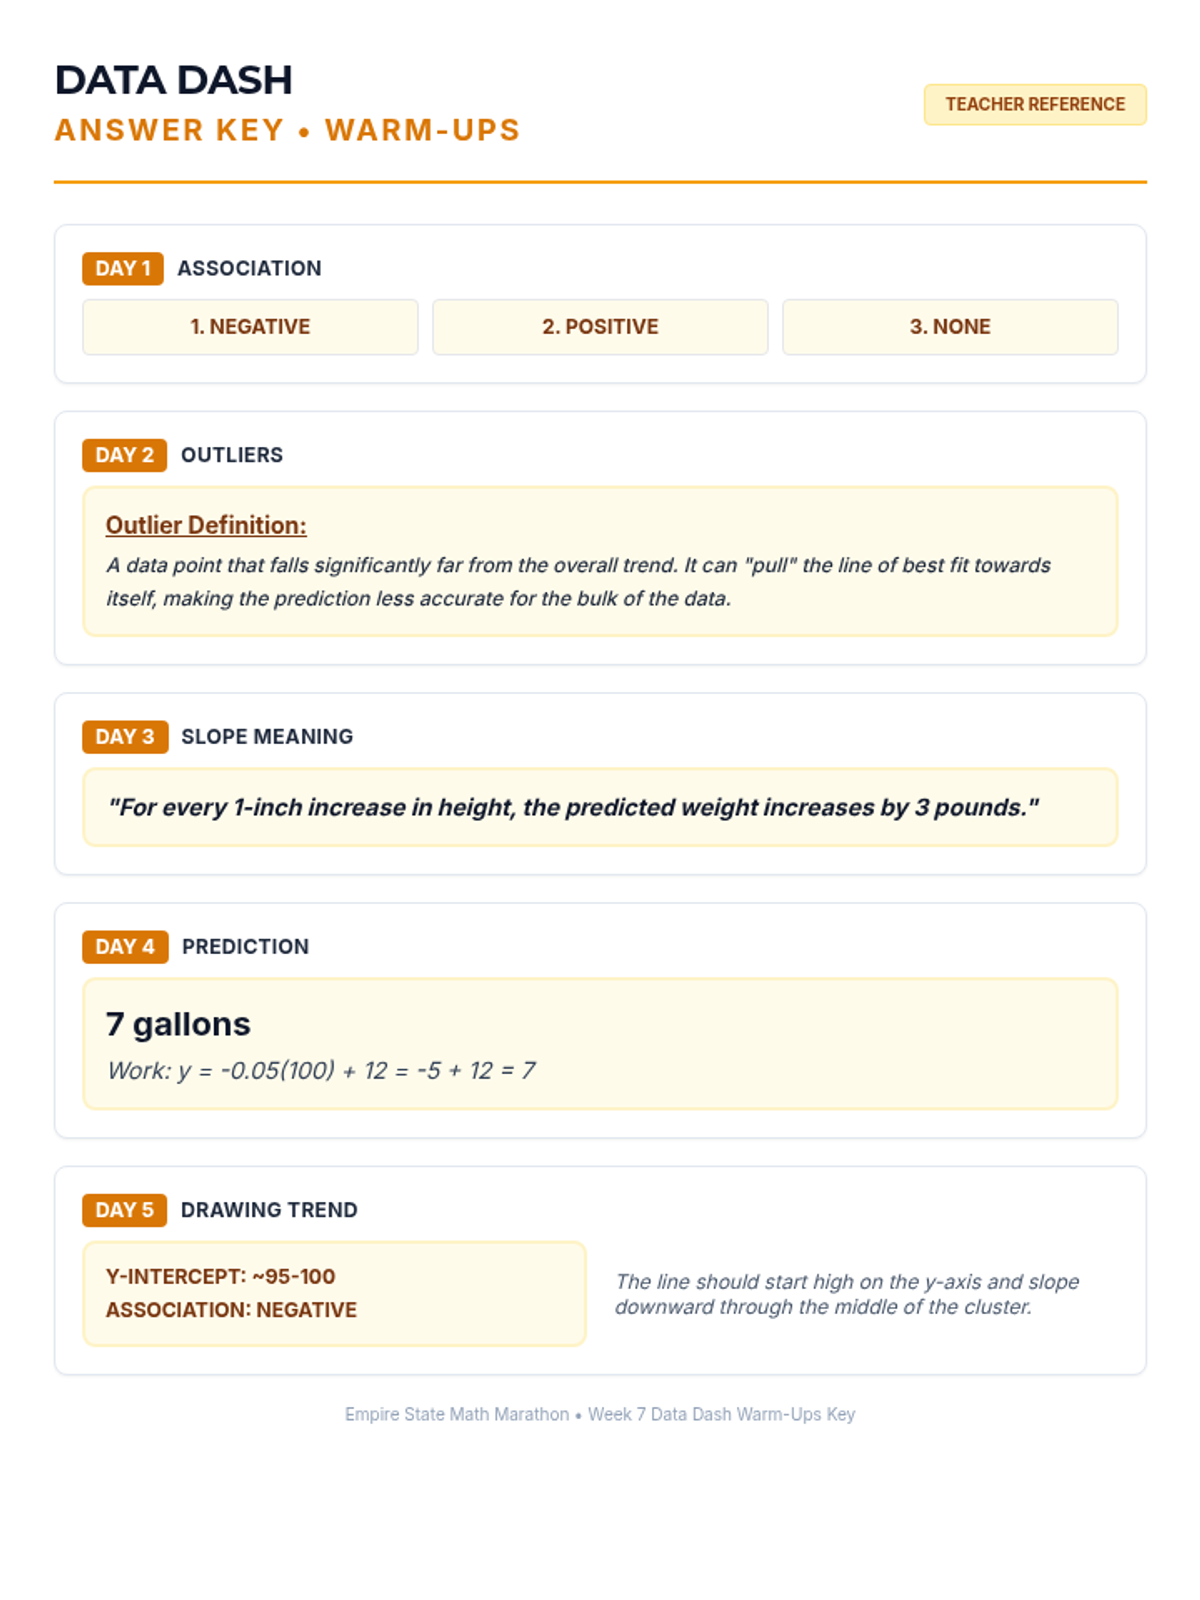
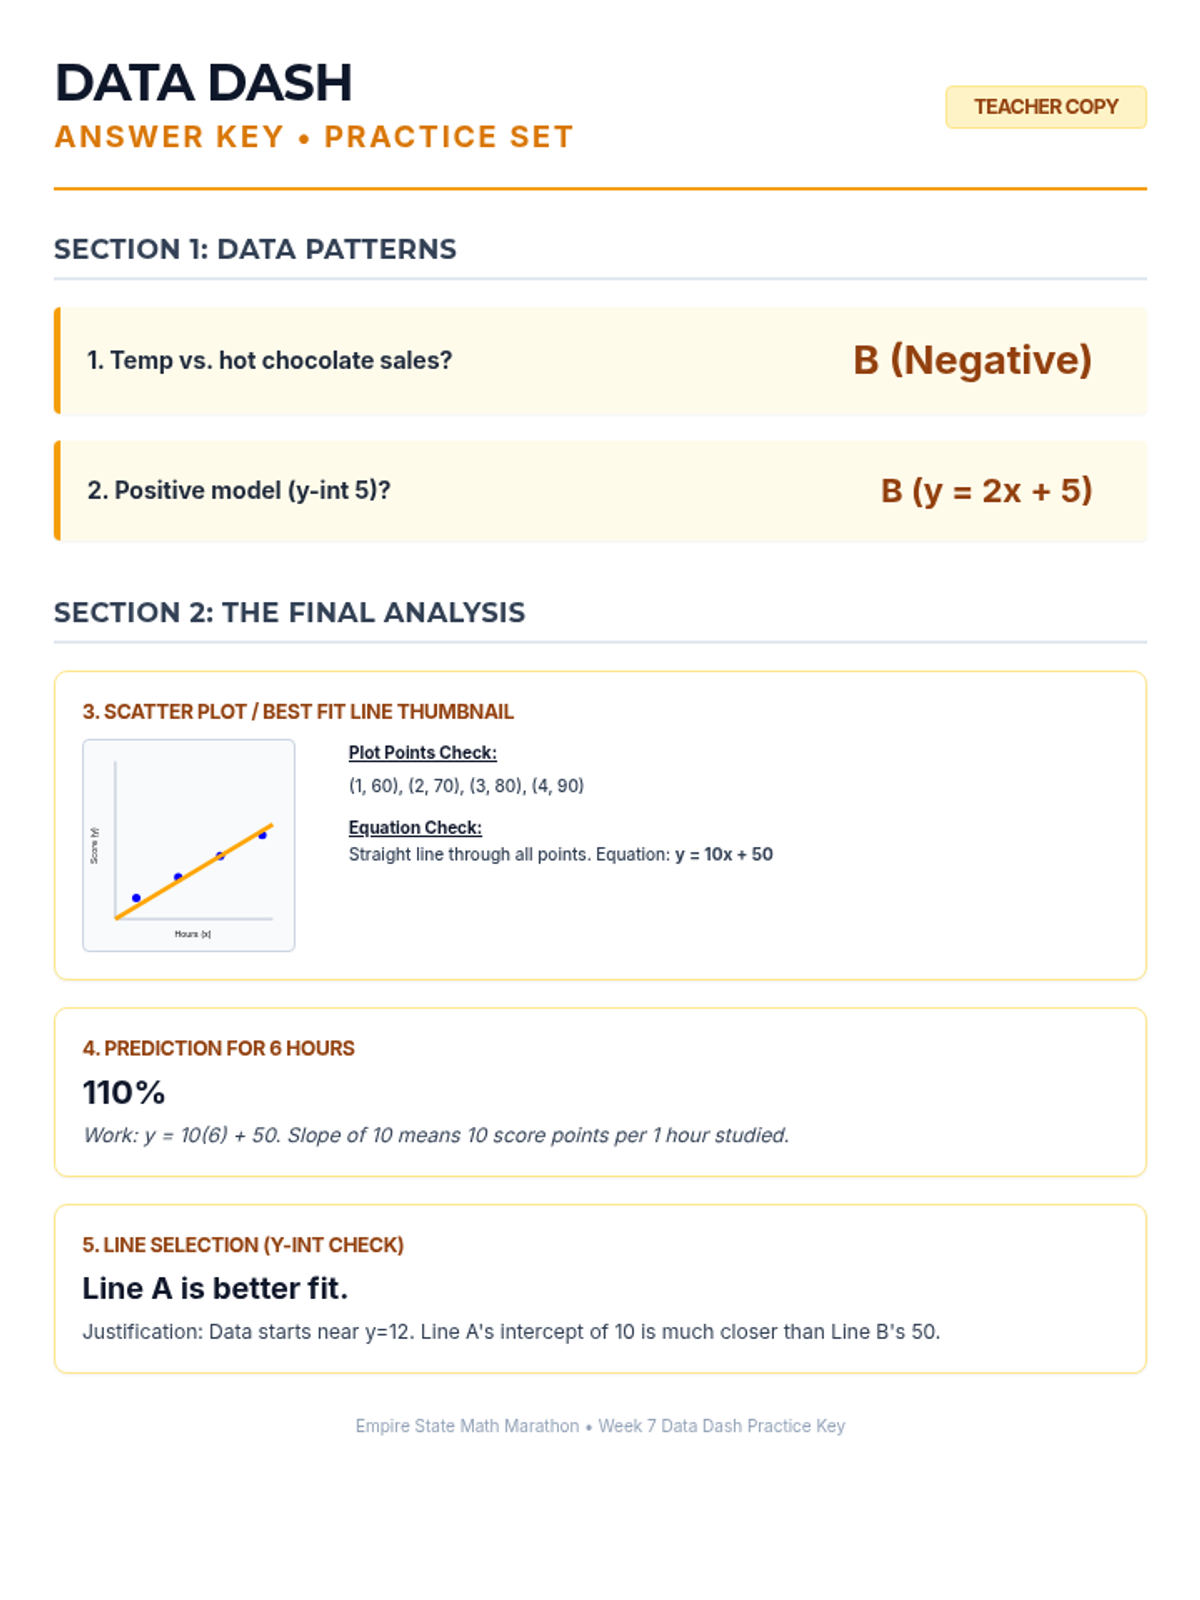
Week 7 analyzes bivariate data through scatter plots, interpreting lines of best fit, and using linear models to make predictions.
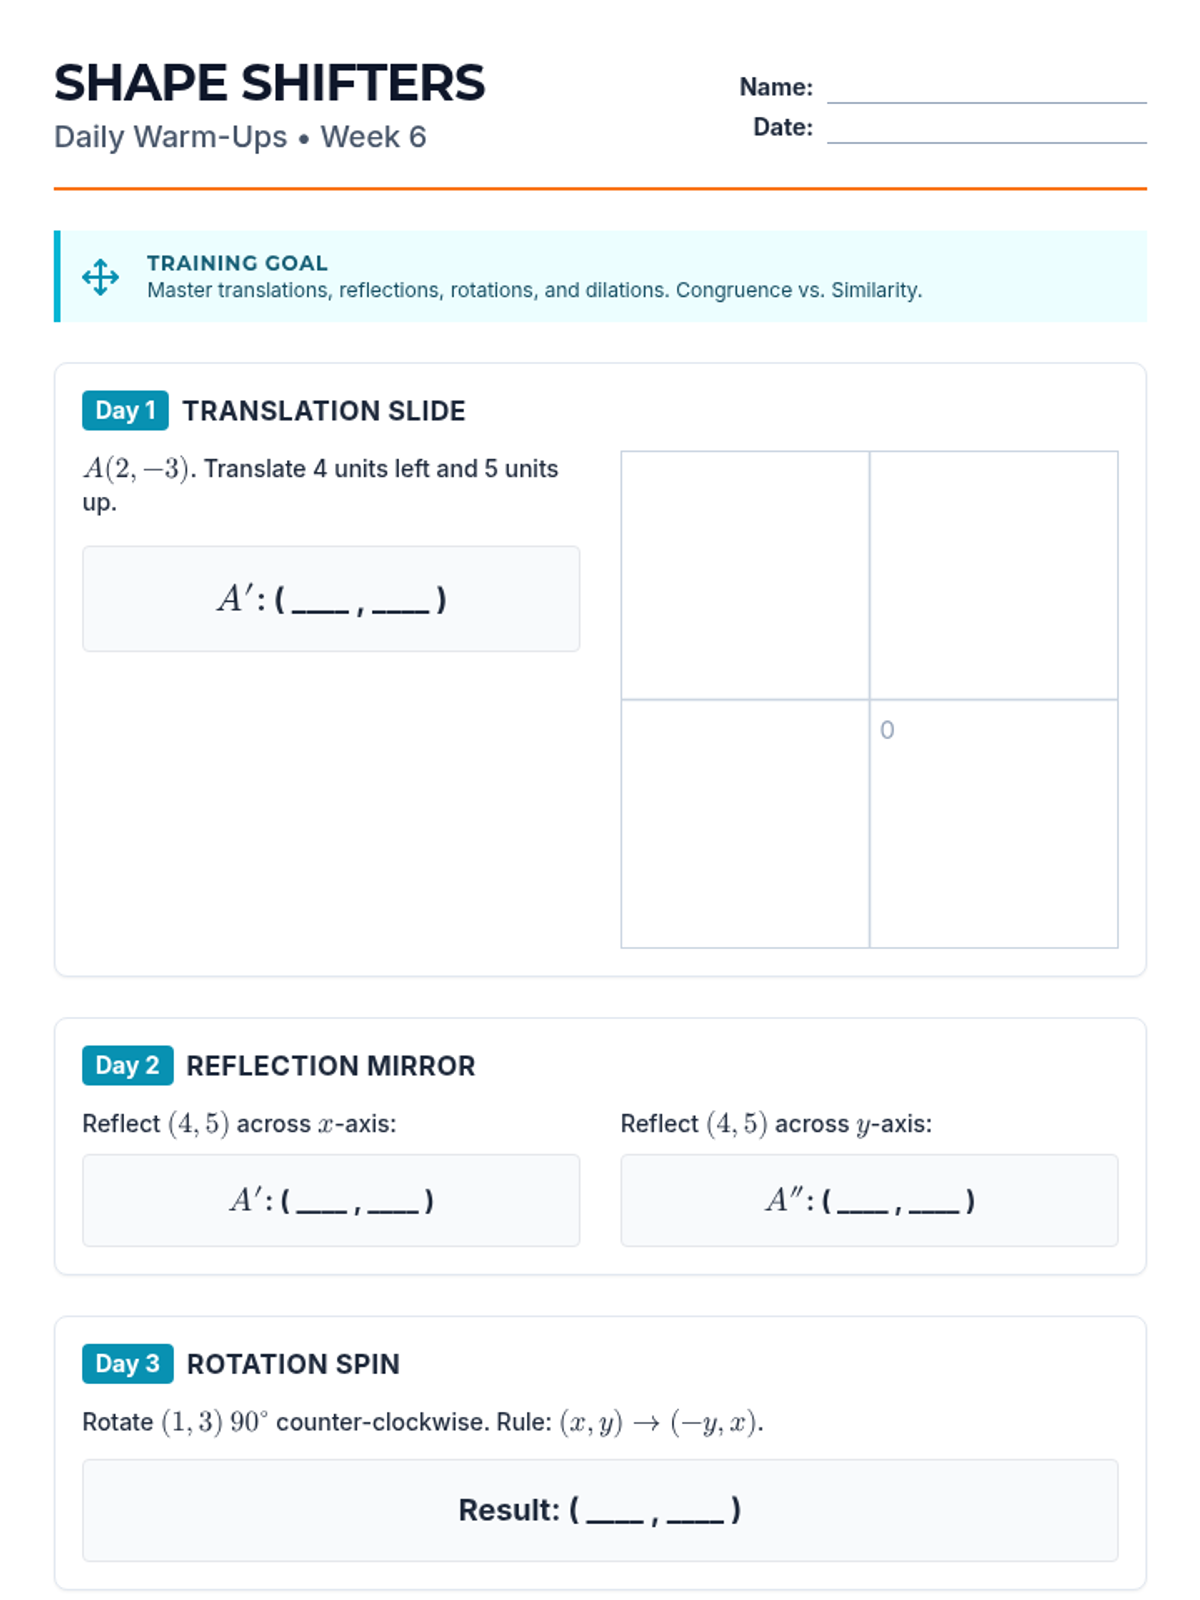
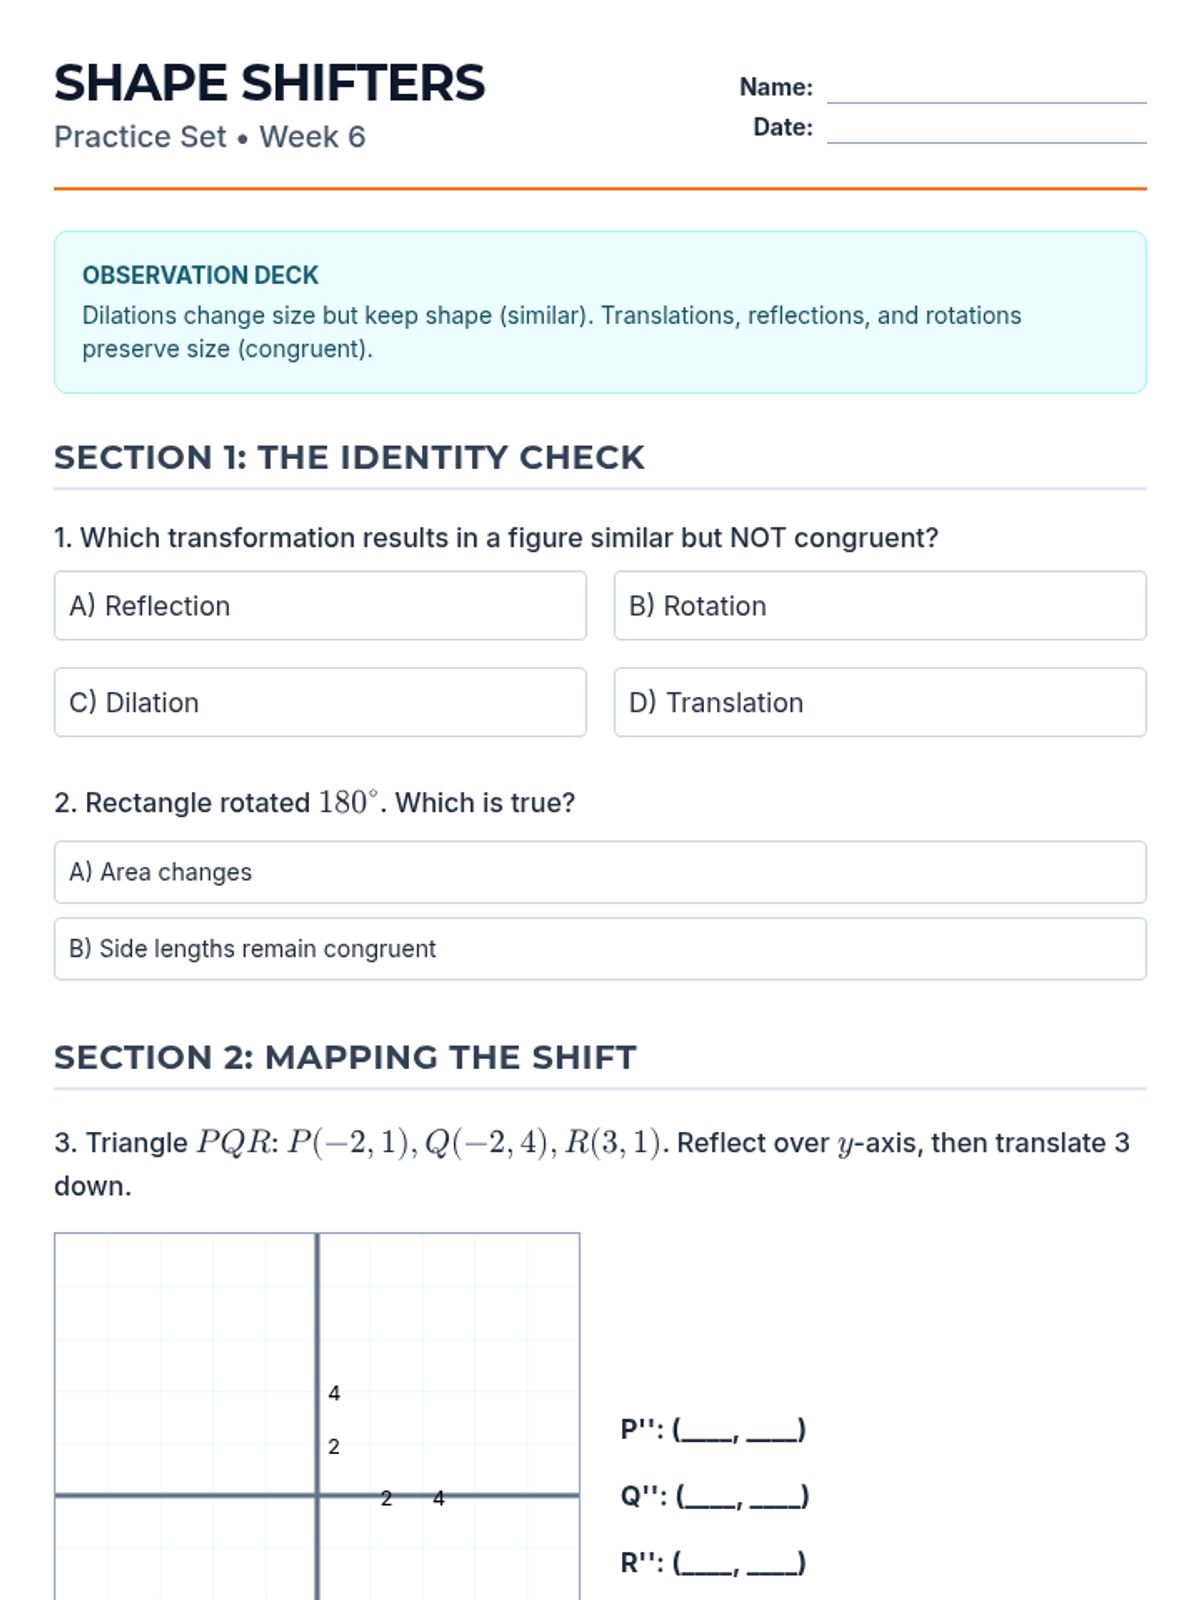
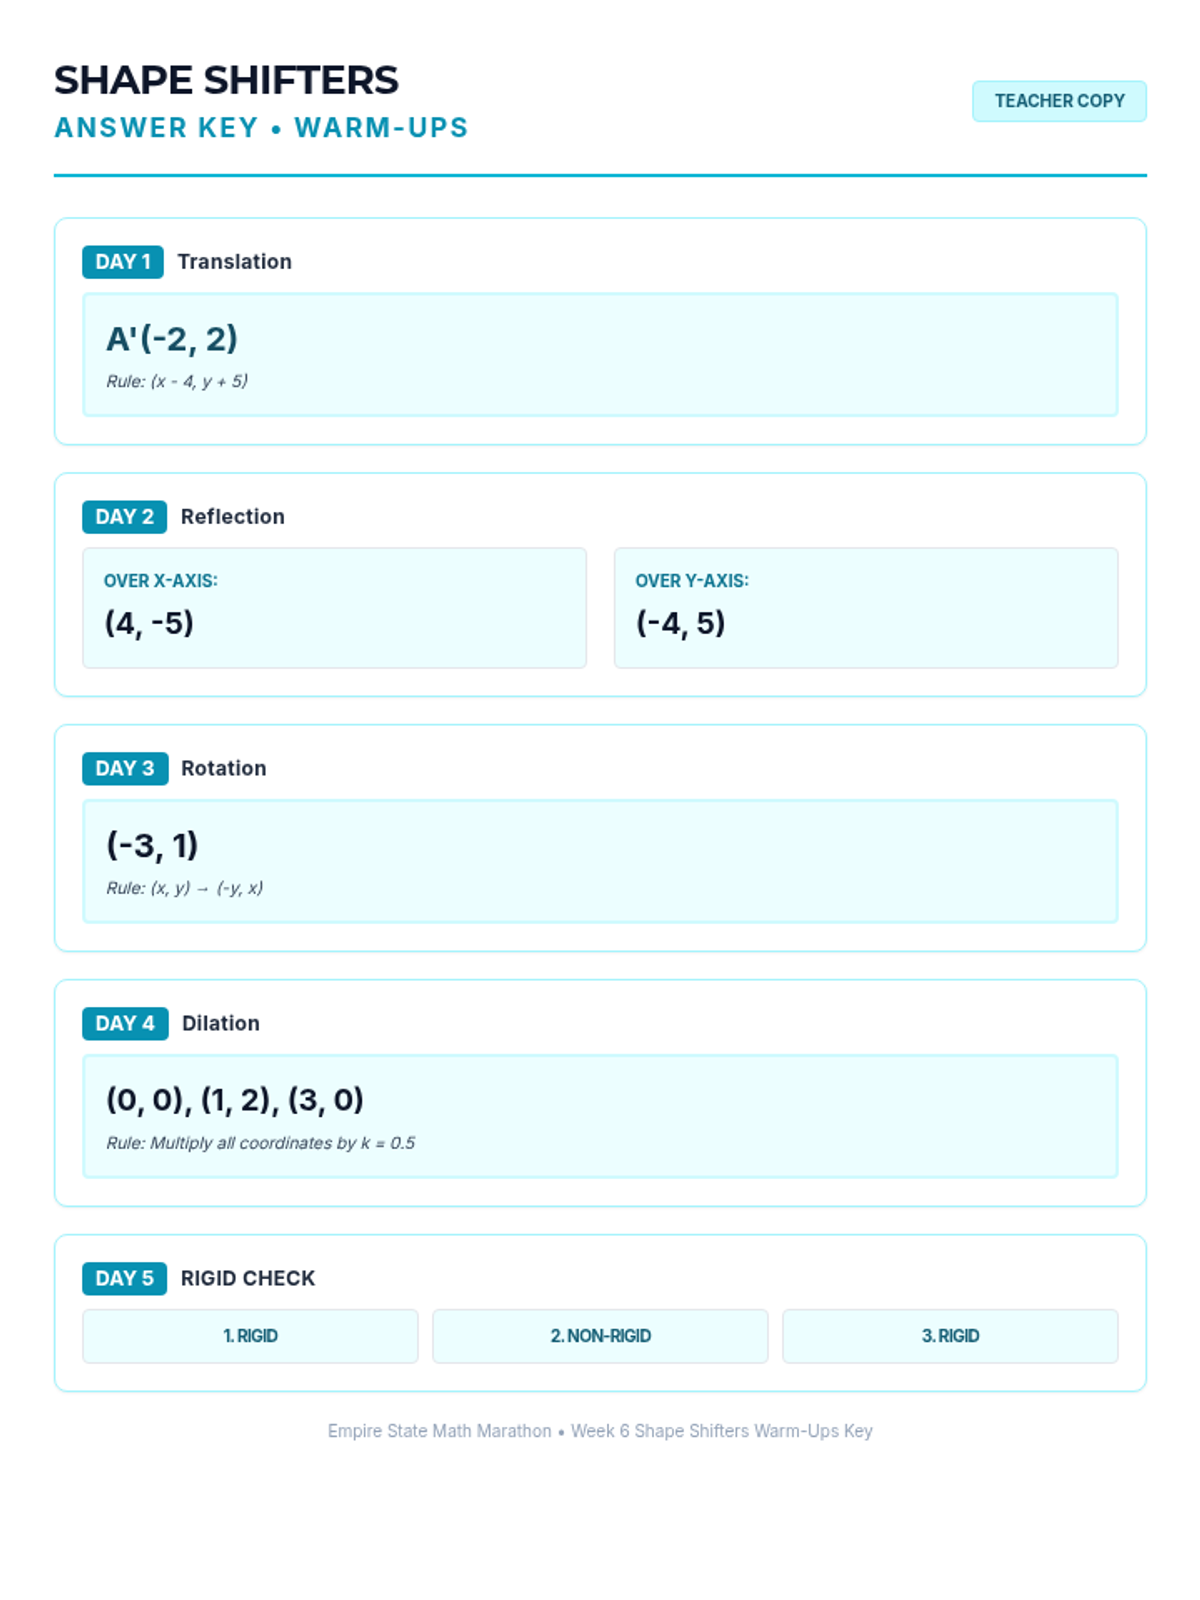
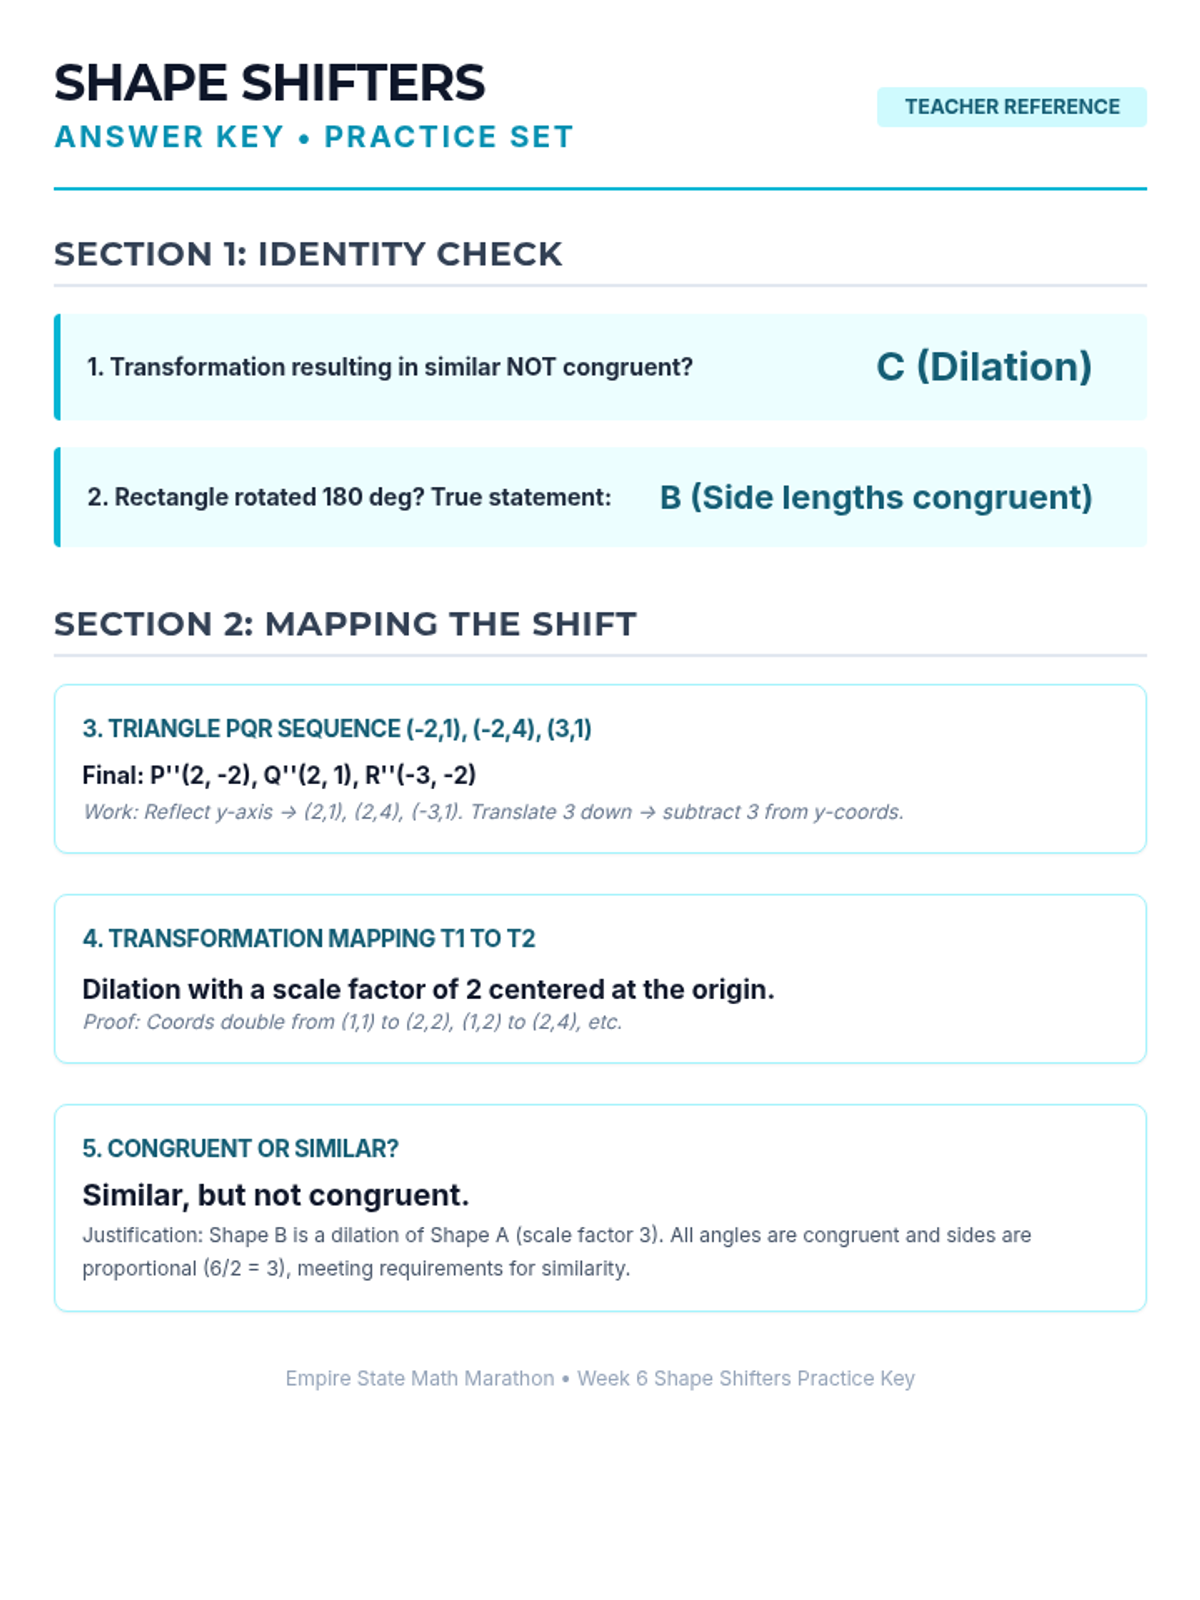
Week 6 focuses on rigid transformations (translations, reflections, rotations) and similarity transformations (dilations).
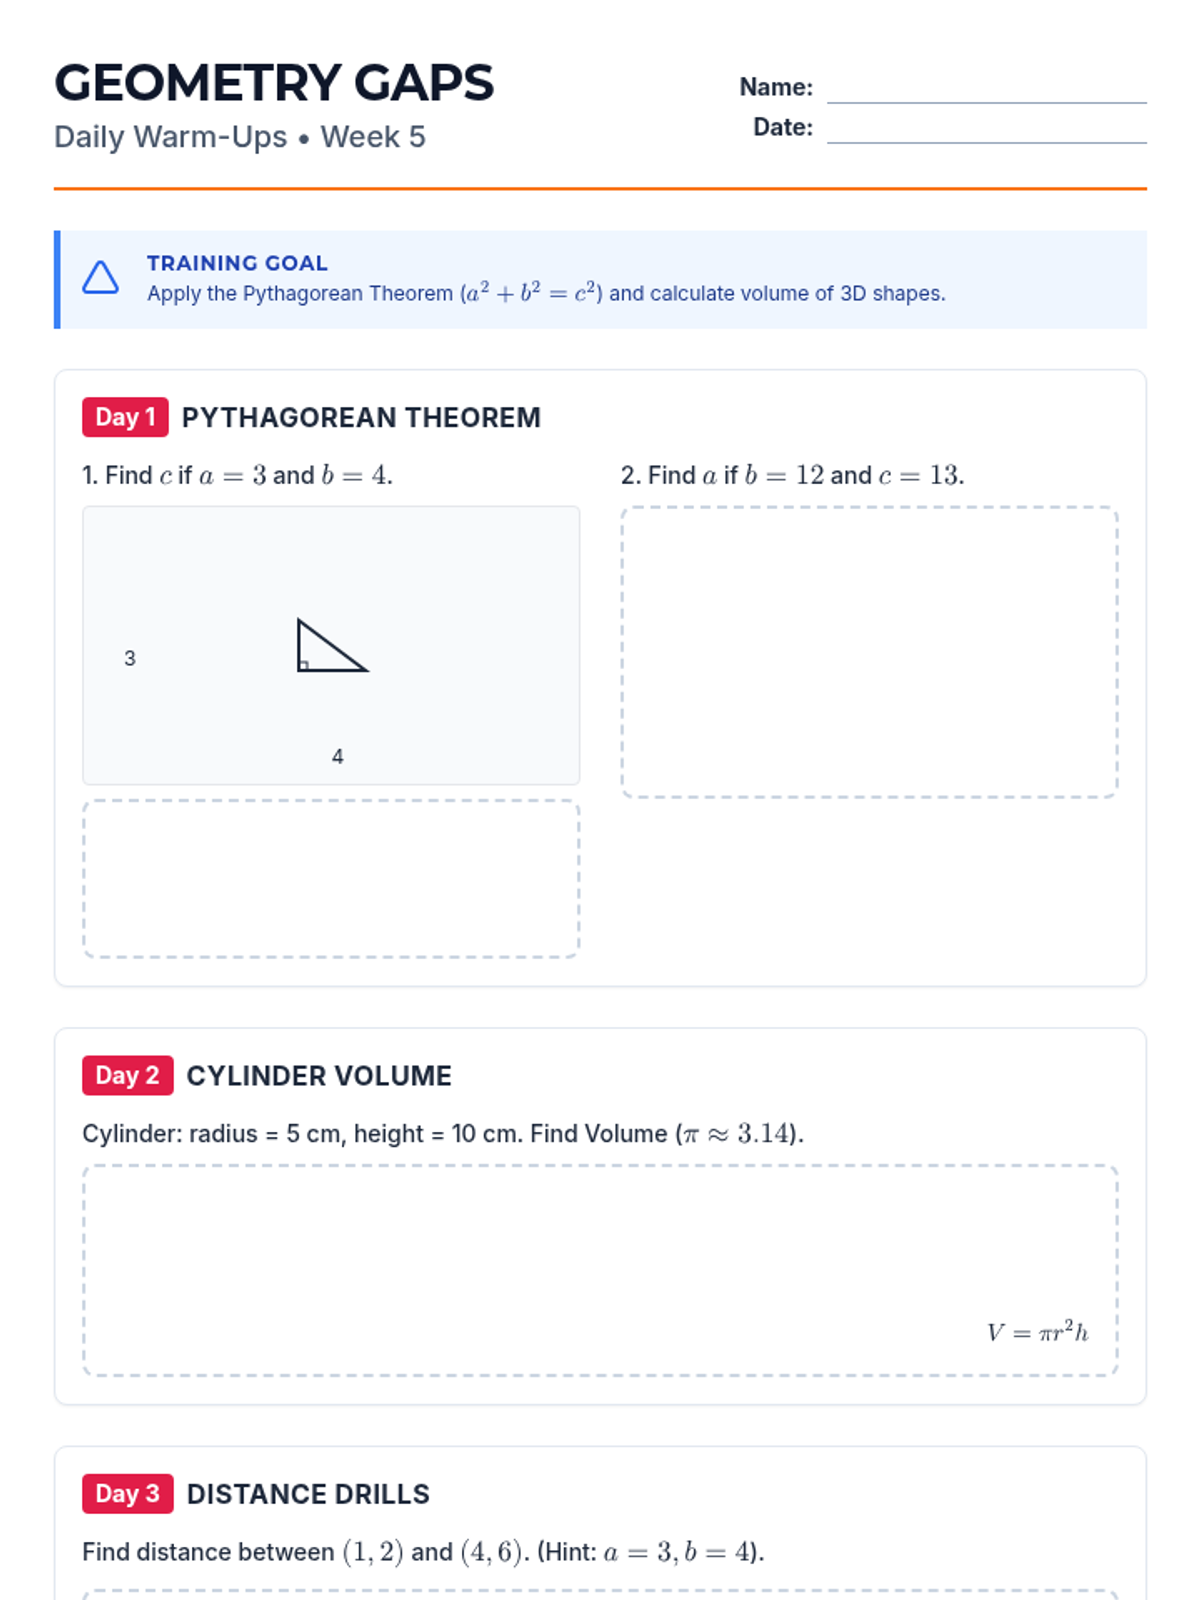
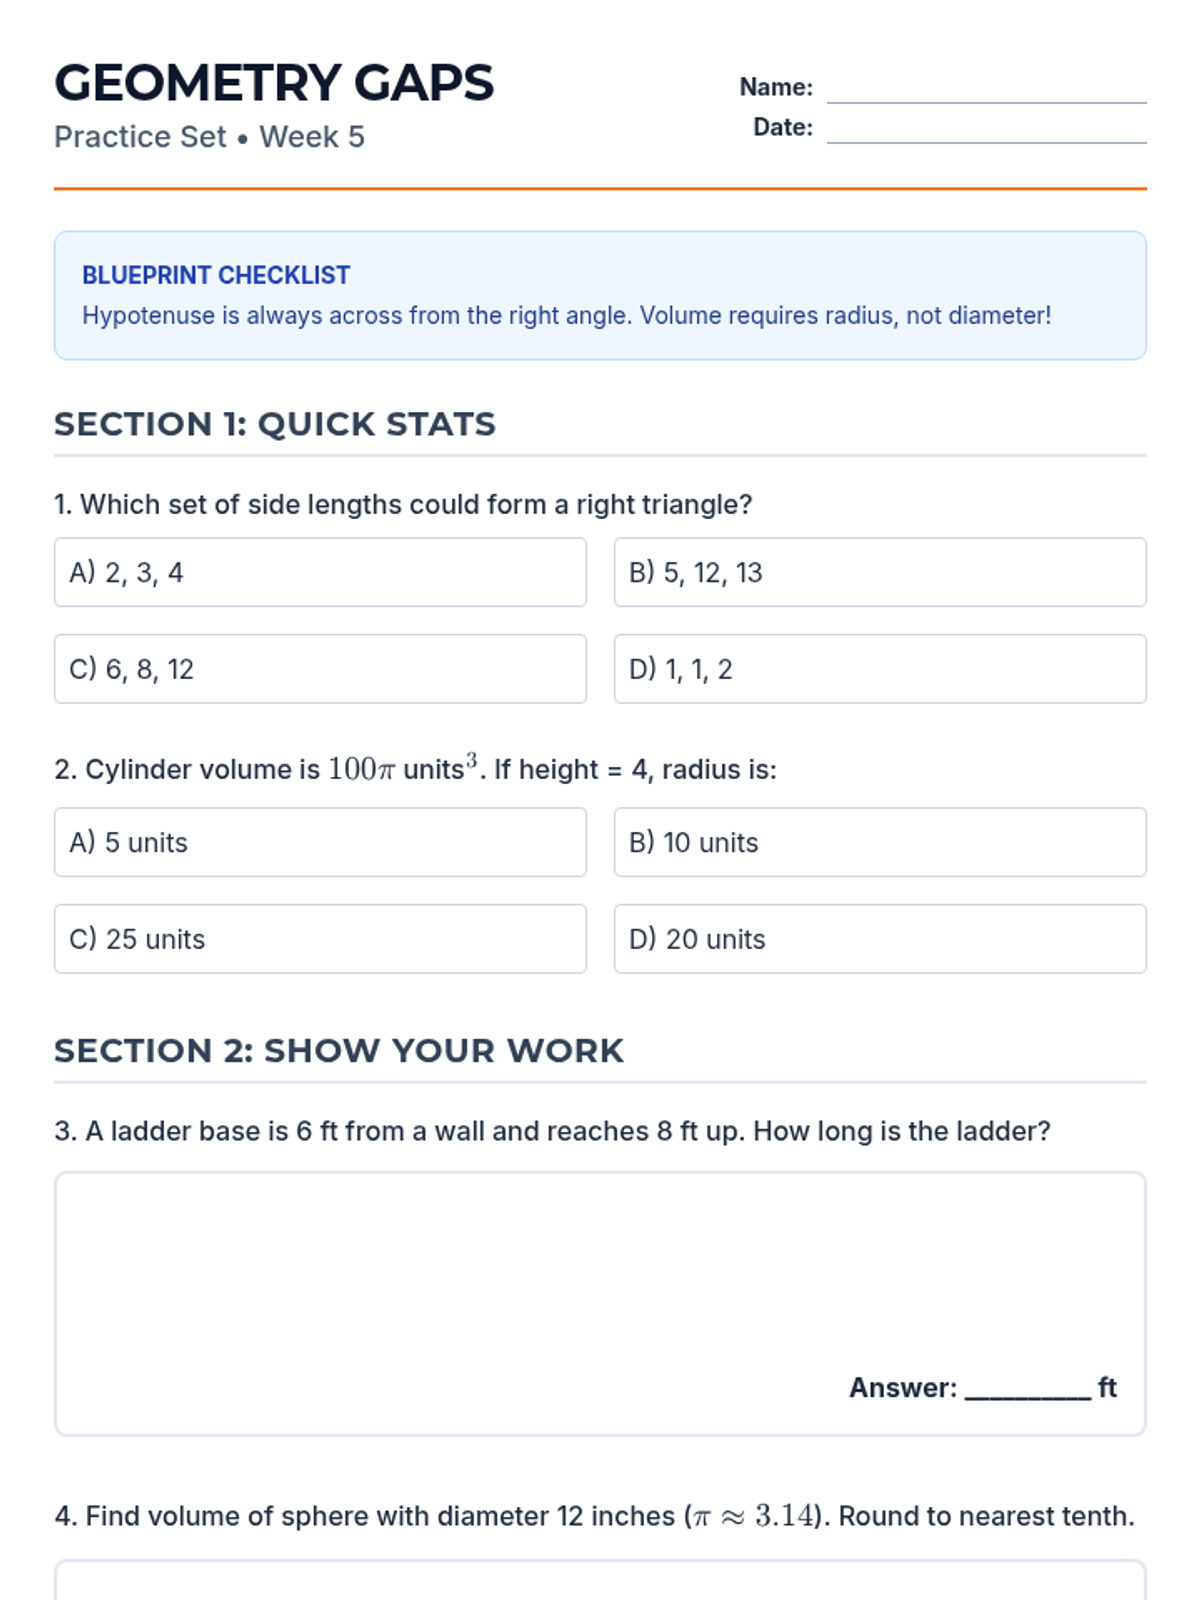
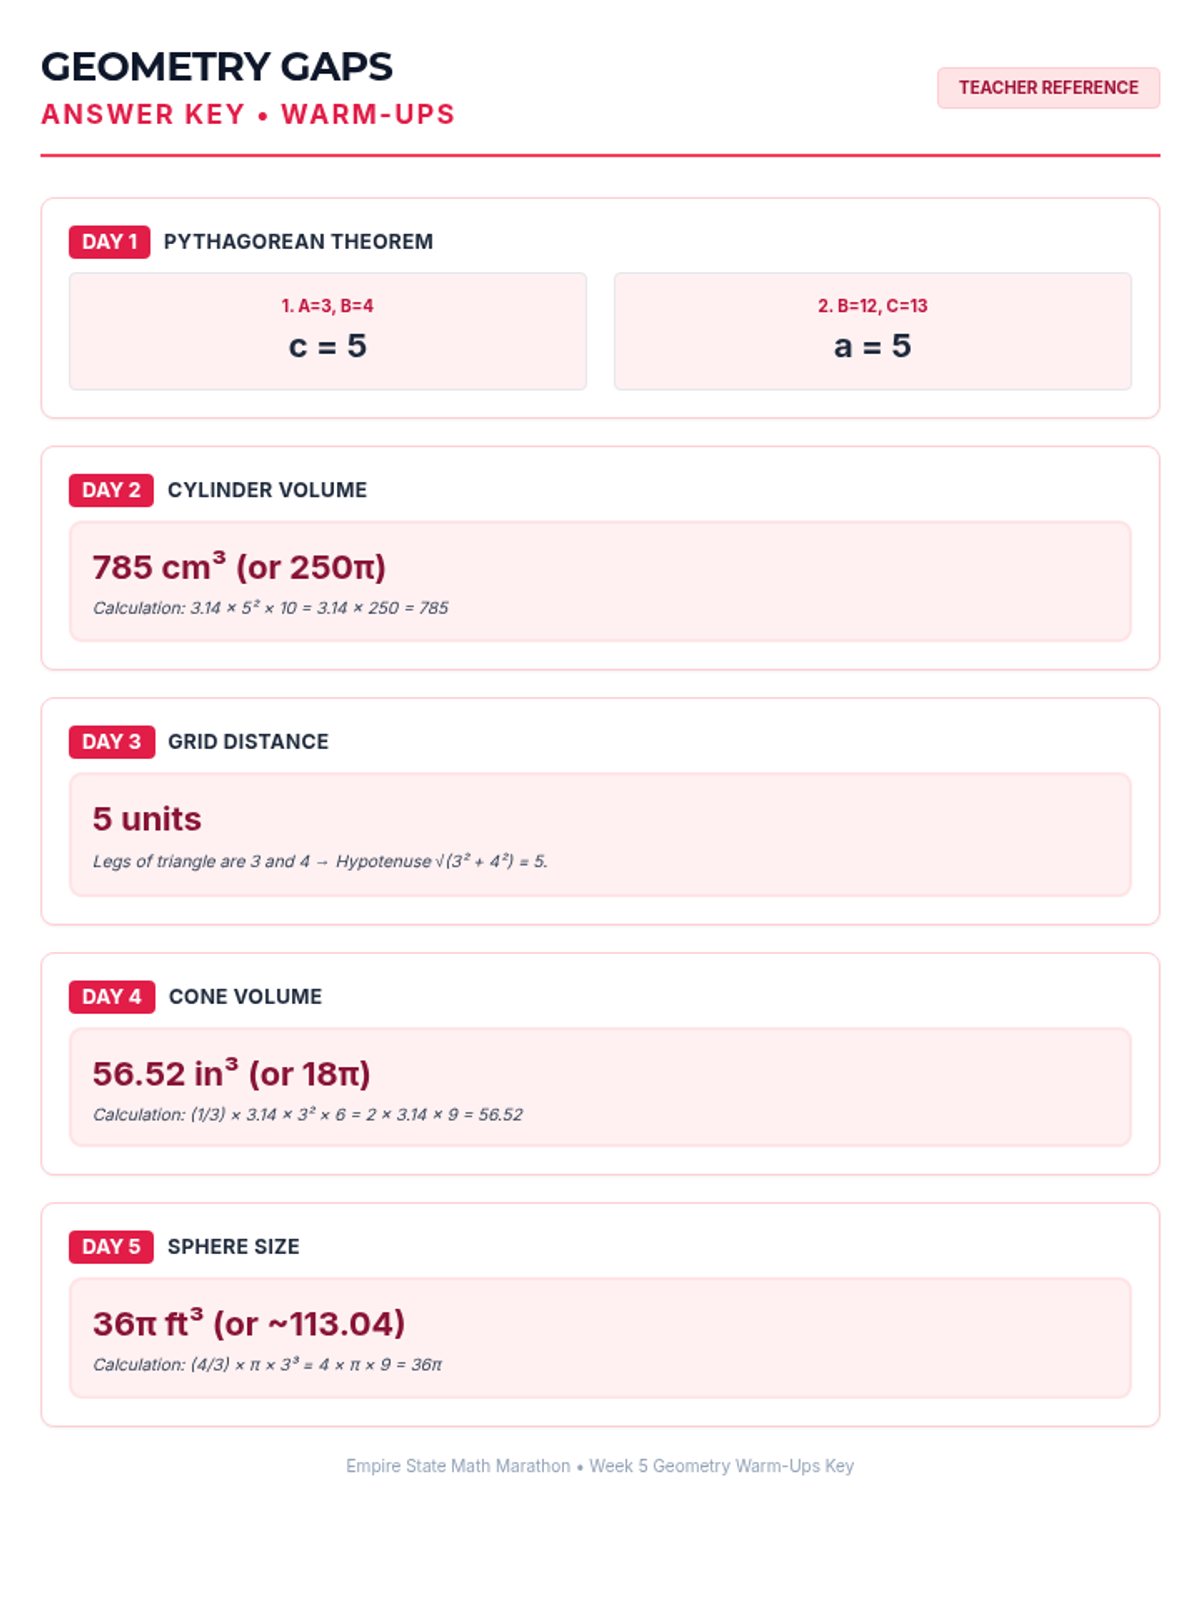
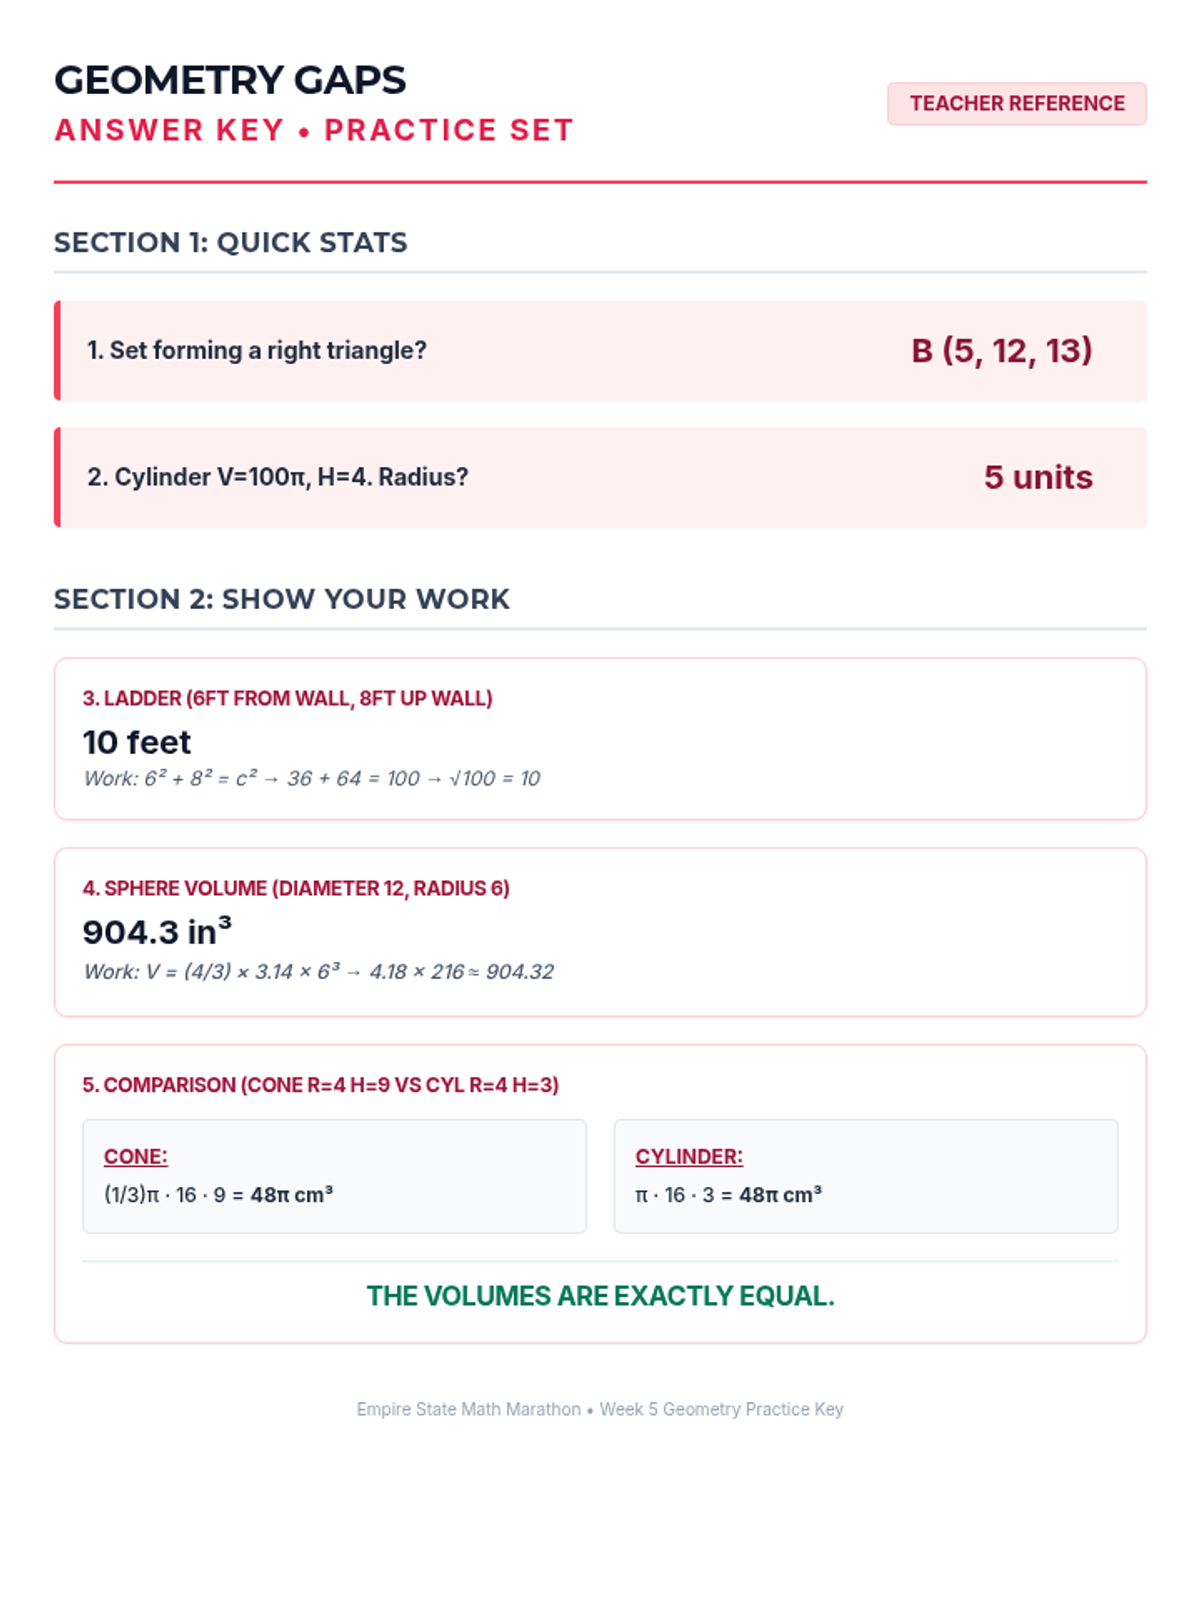
Week 5 reviews the Pythagorean Theorem and volume formulas for cylinders, cones, and spheres.
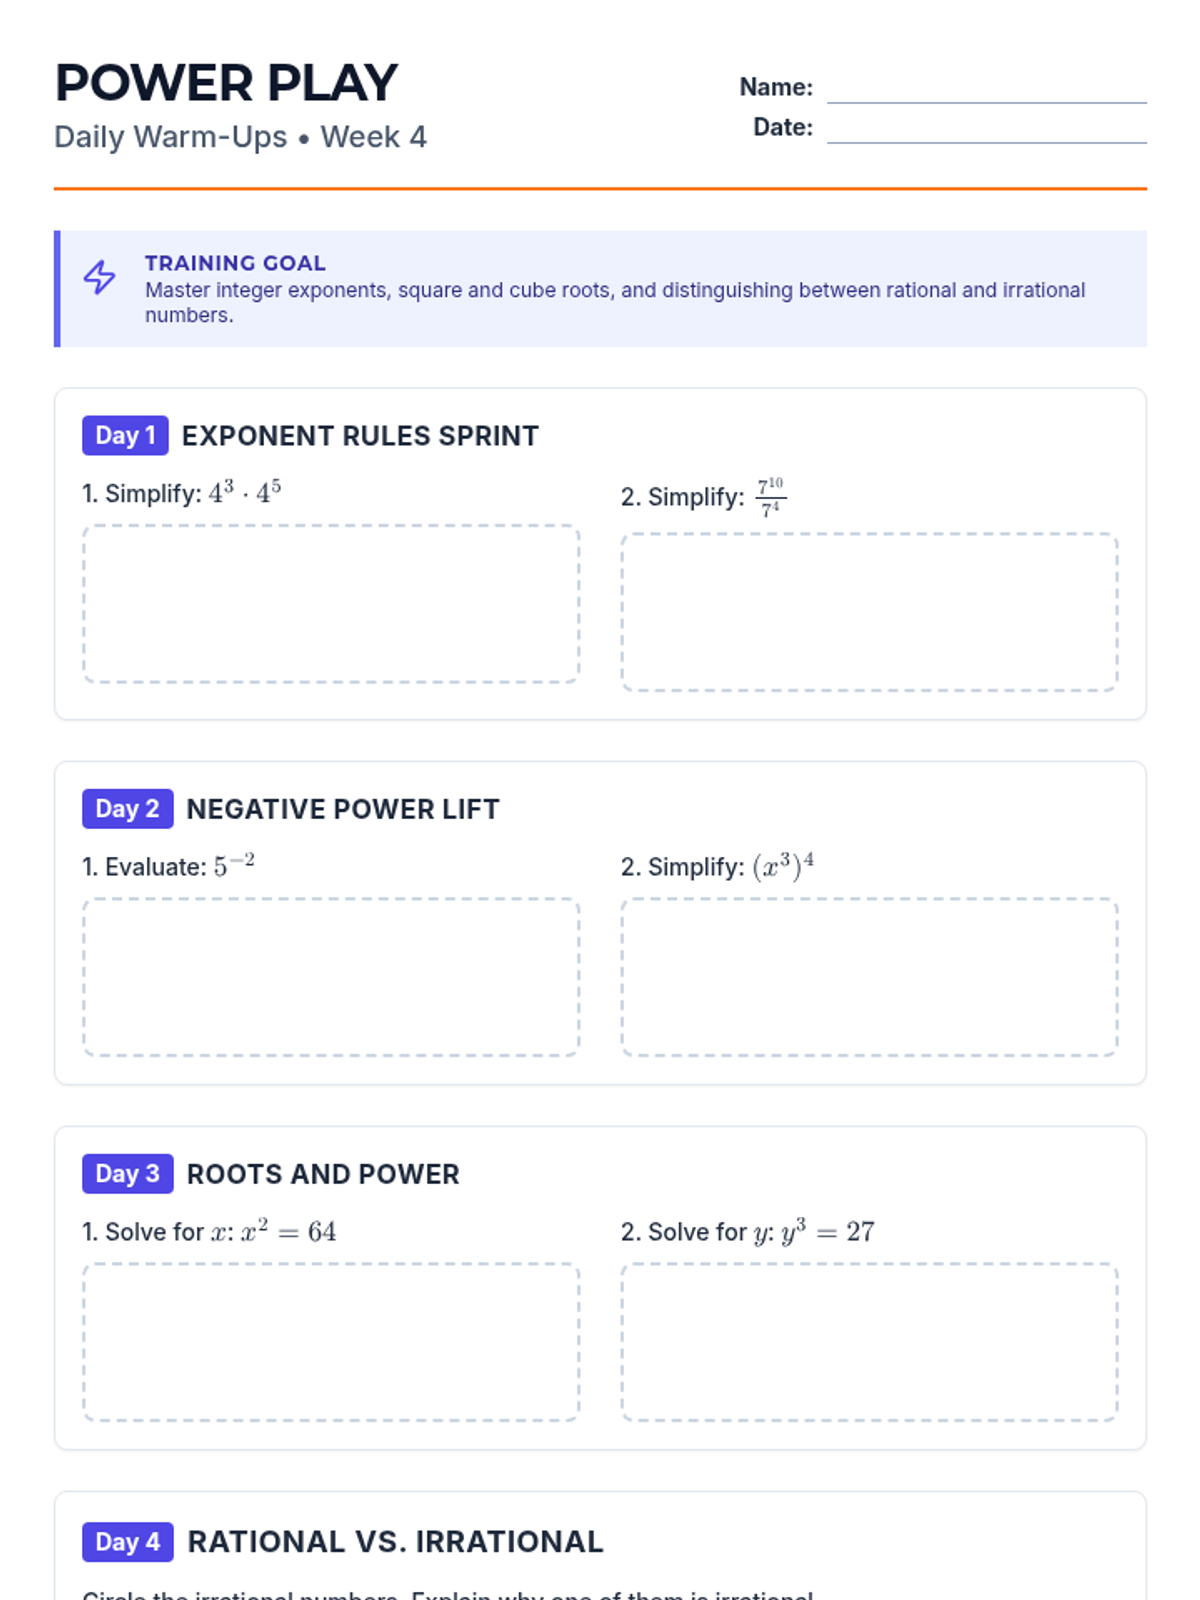
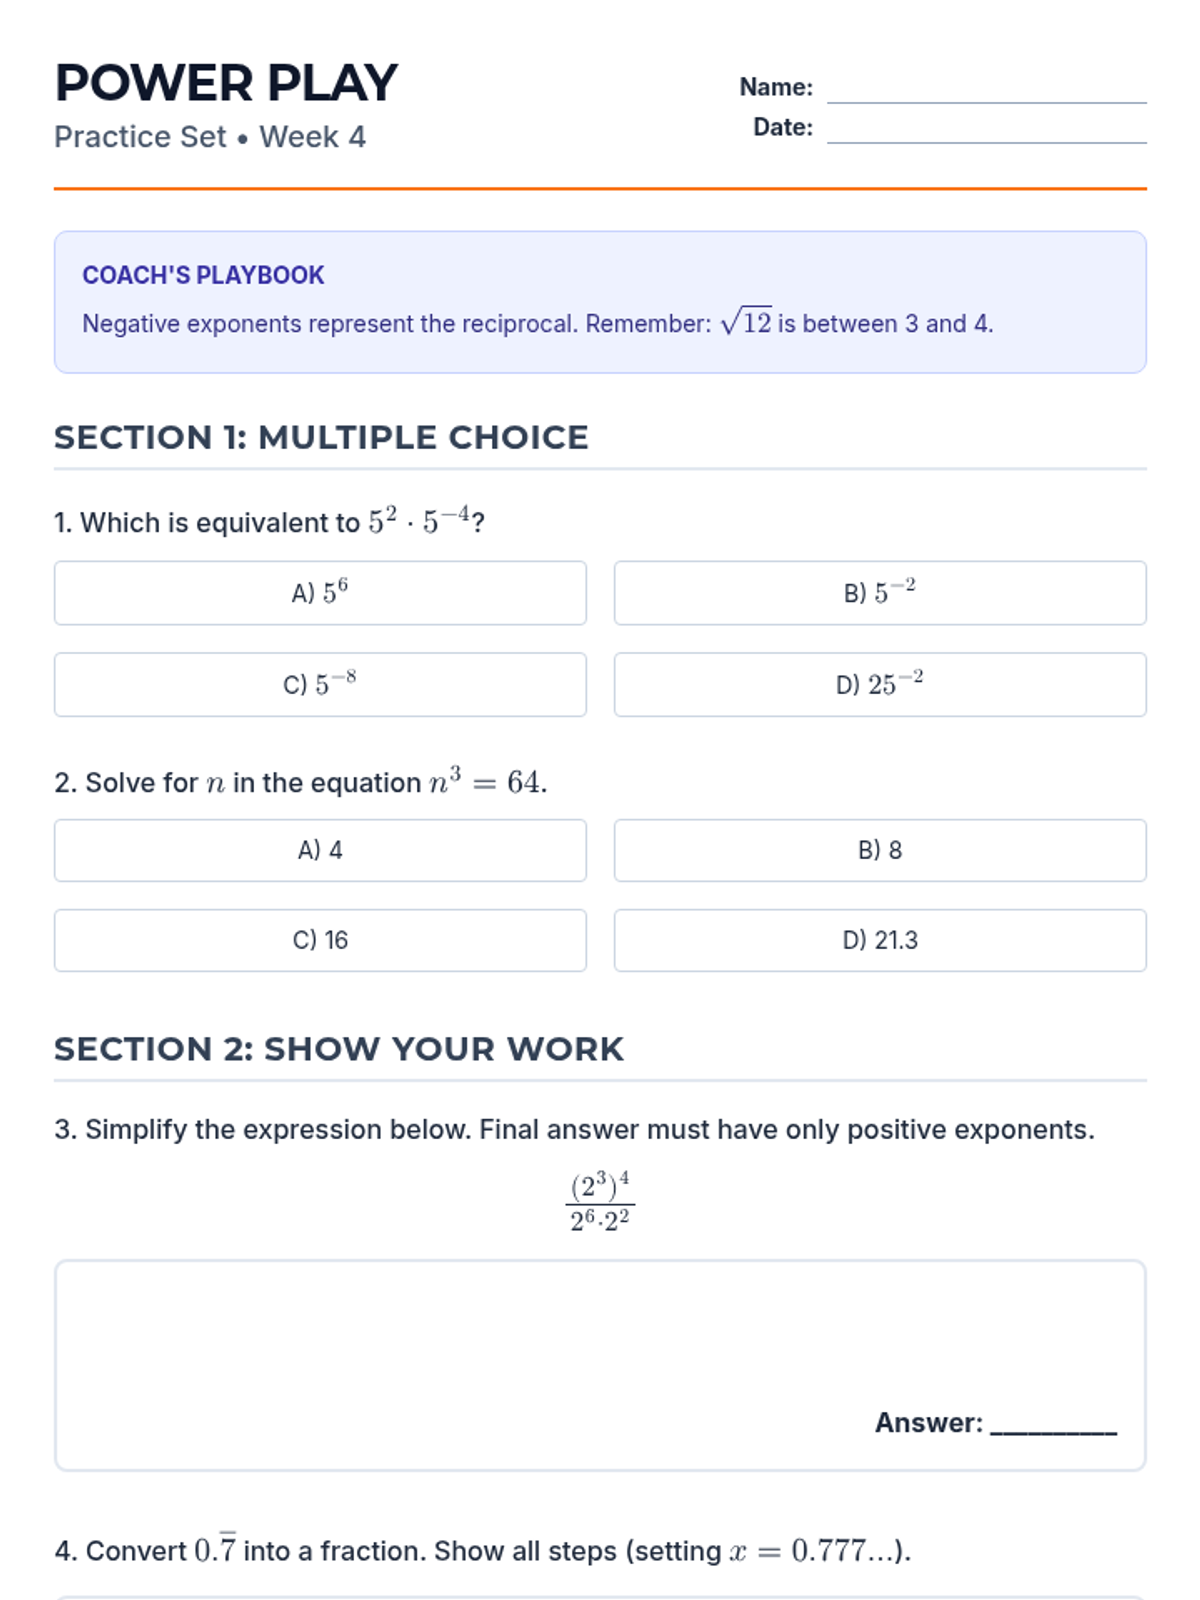
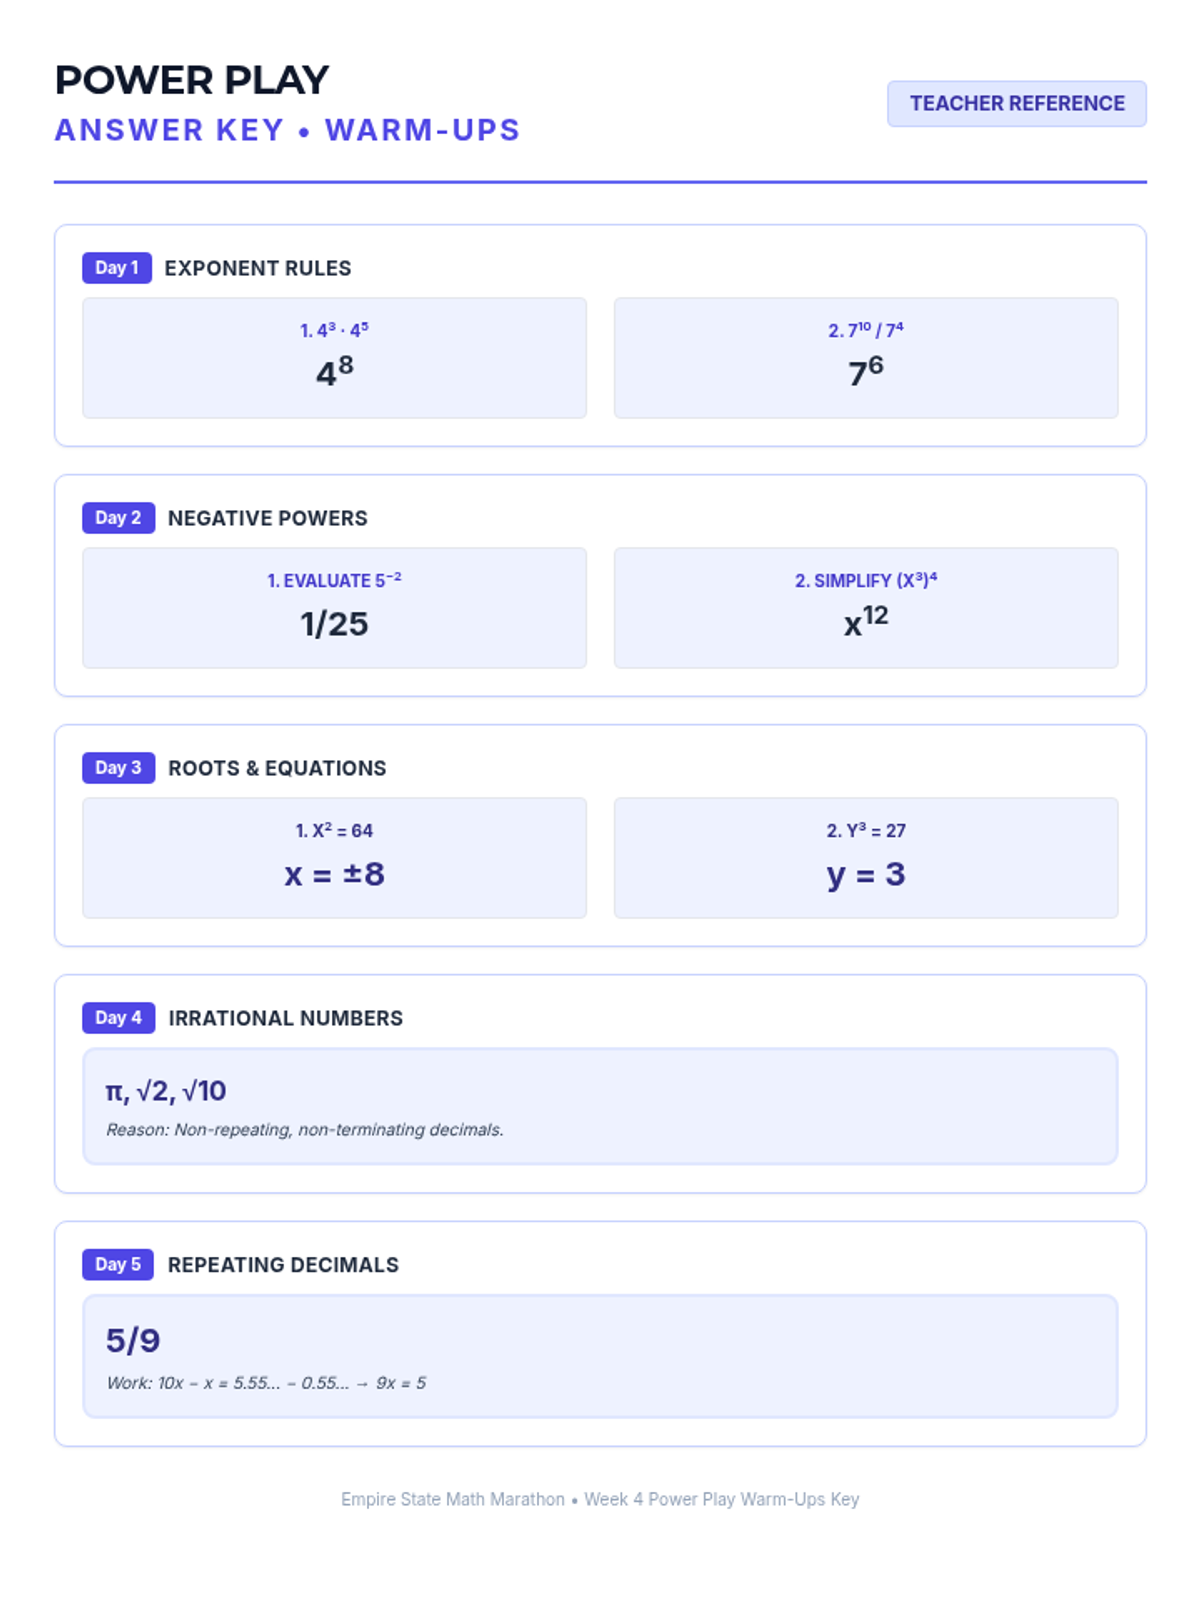
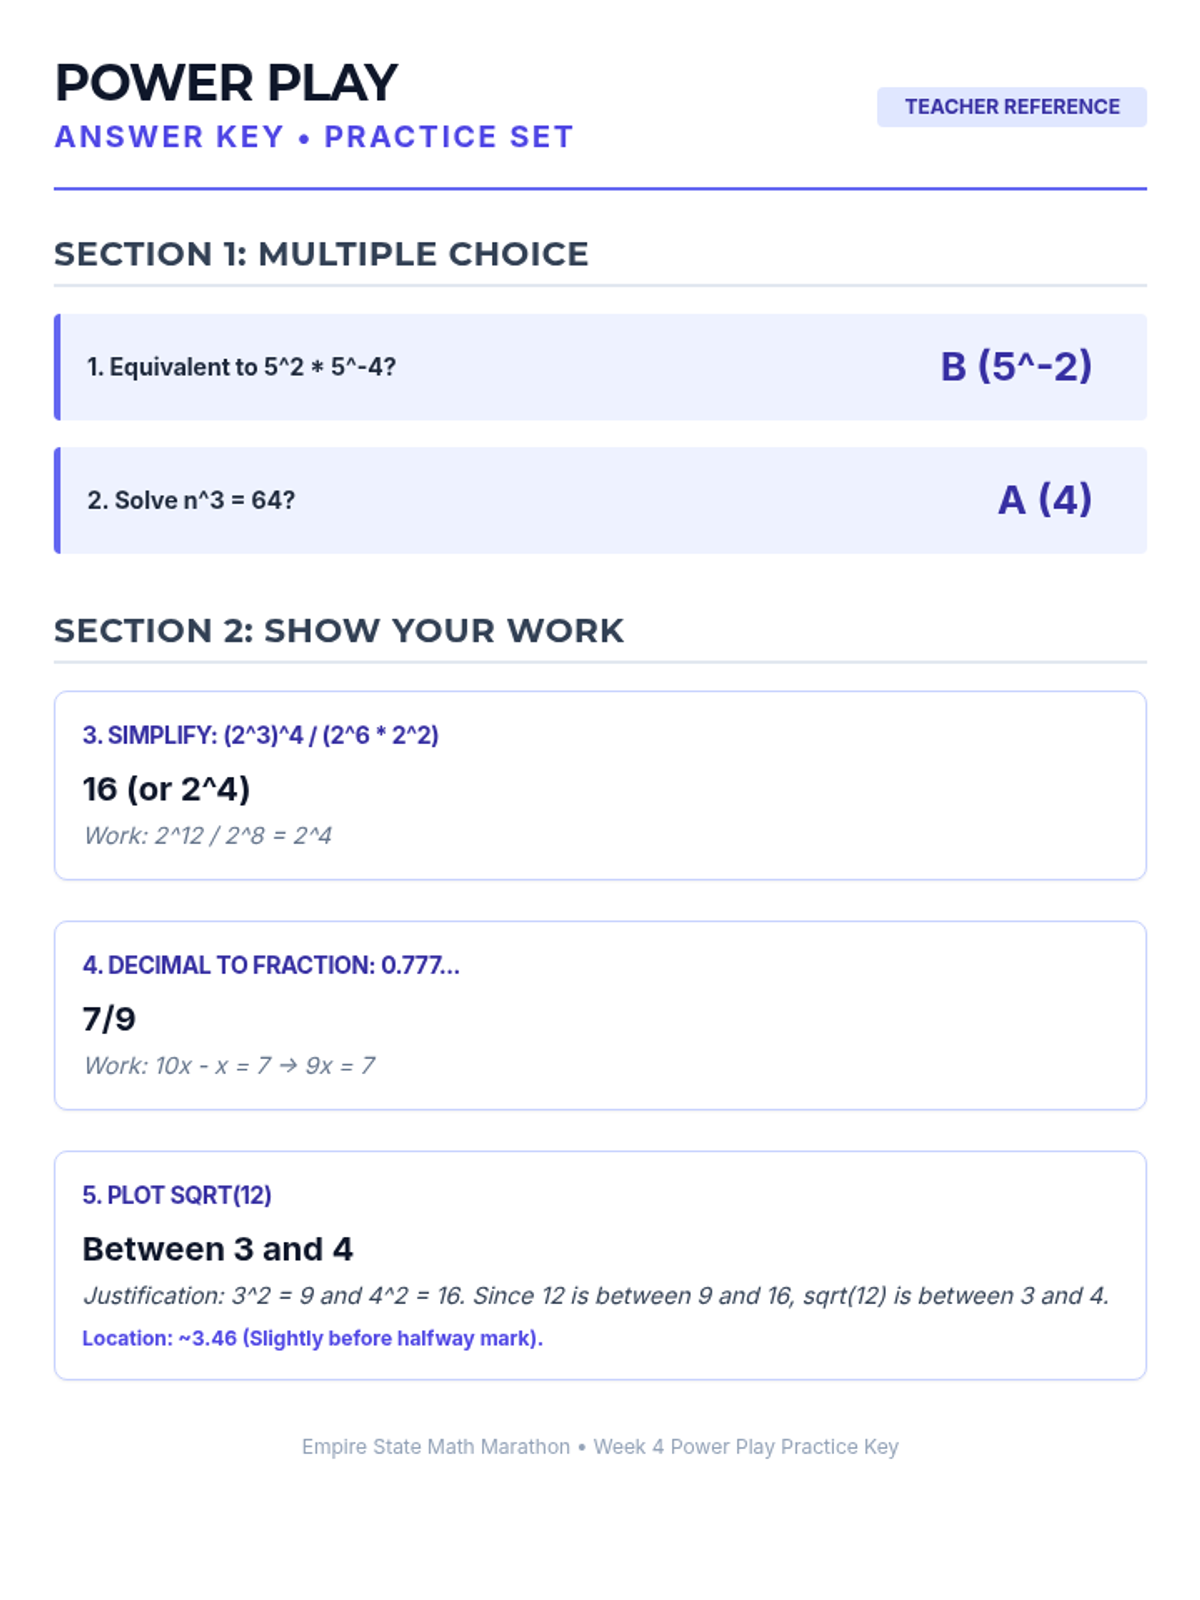
Week 4 explores integer exponent rules, perfect squares and cubes, and distinguishing between rational and irrational numbers.
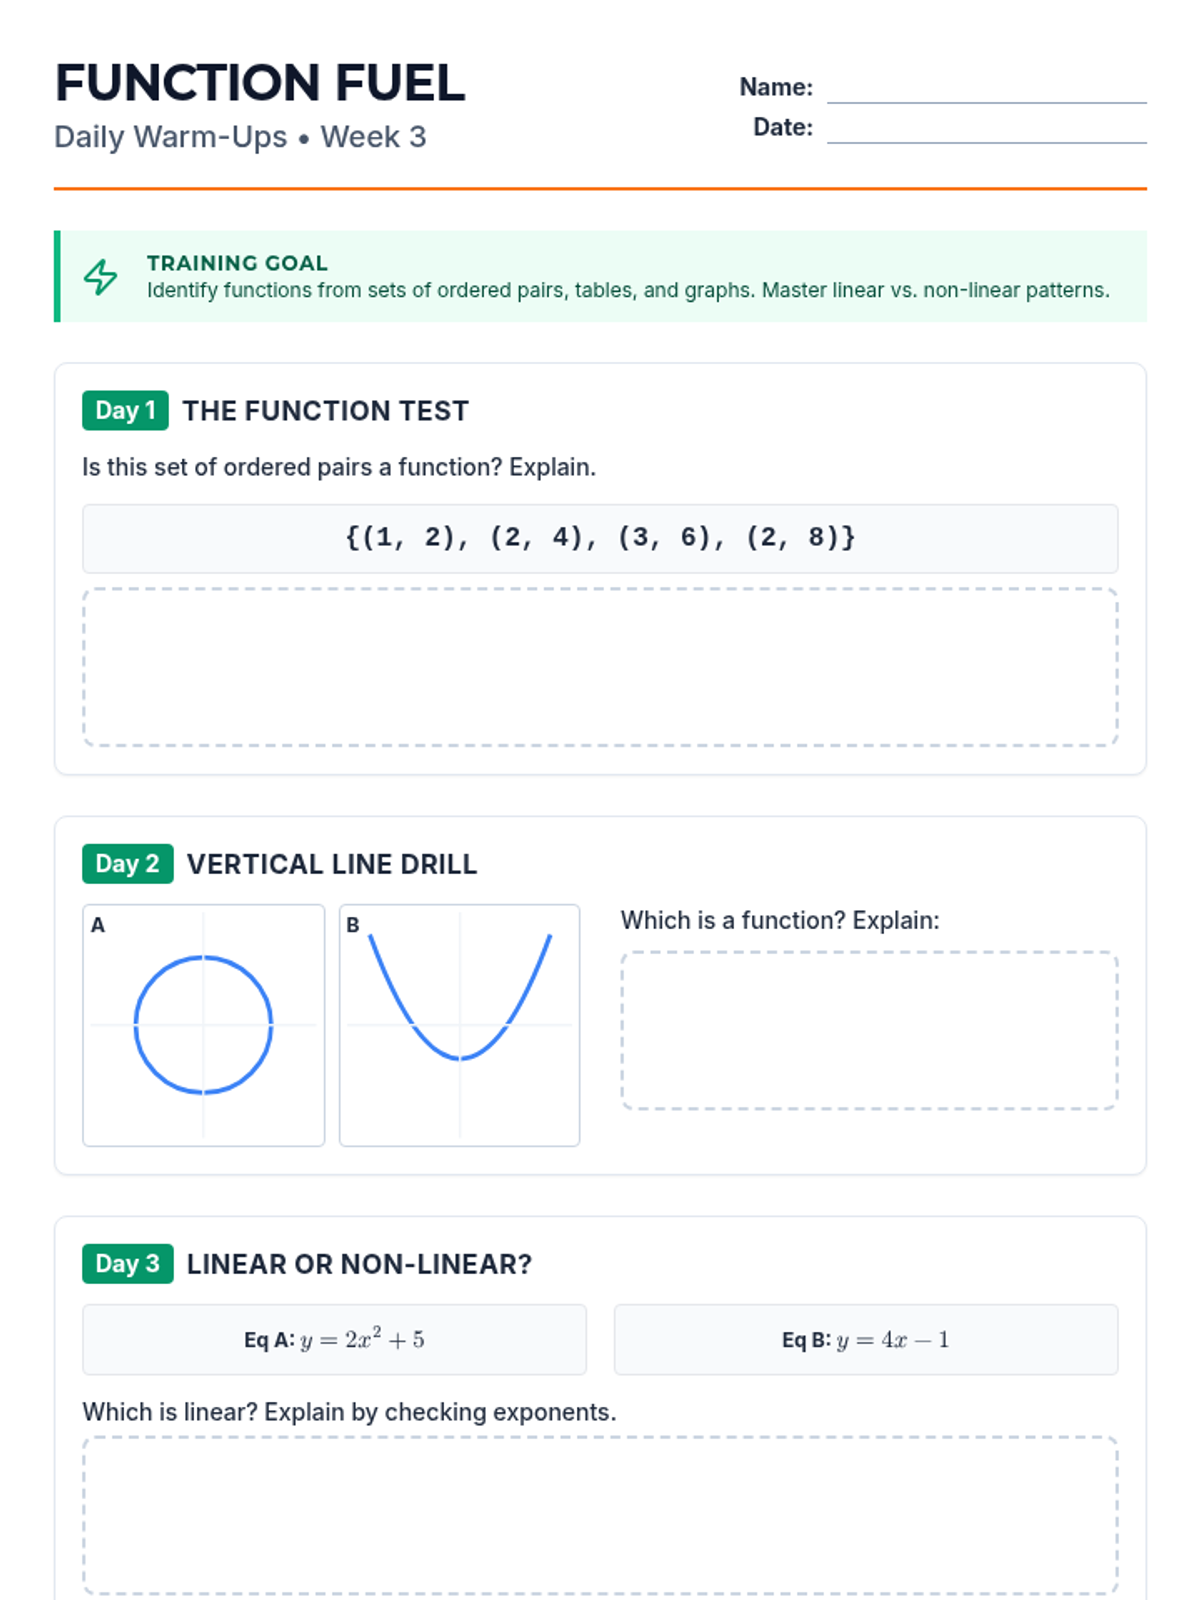
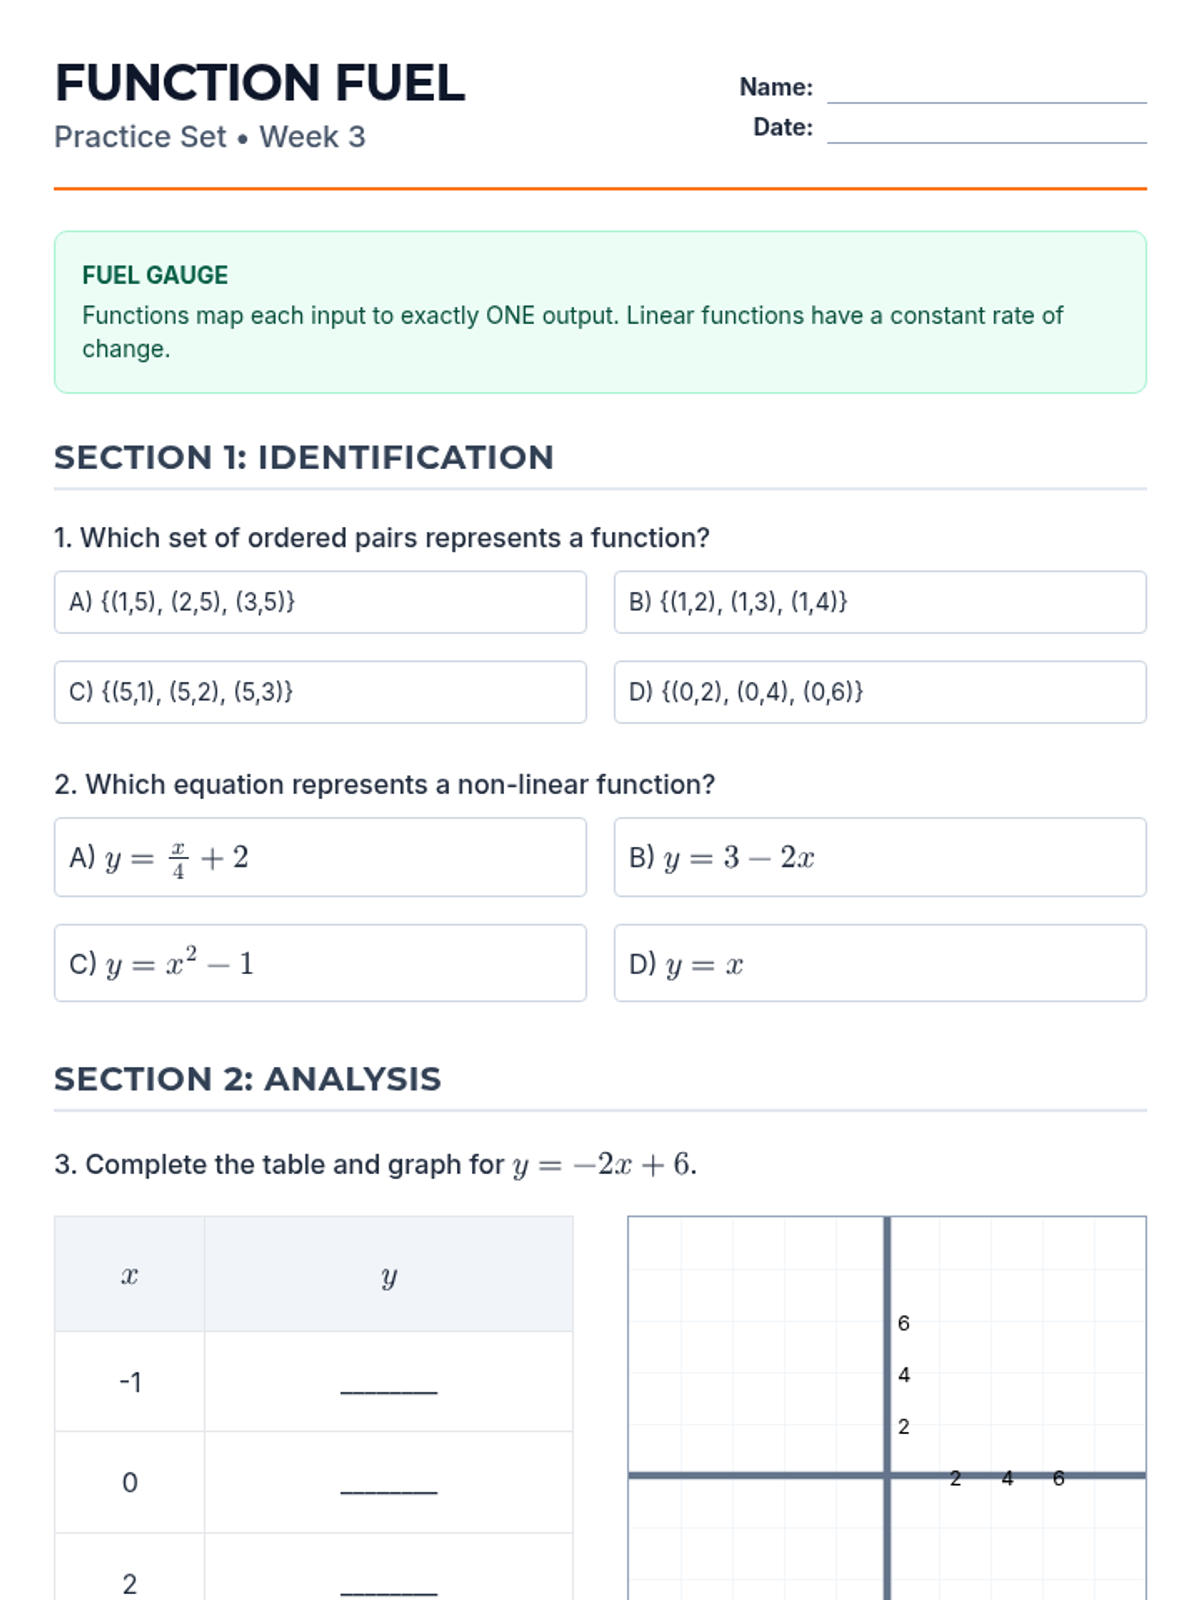
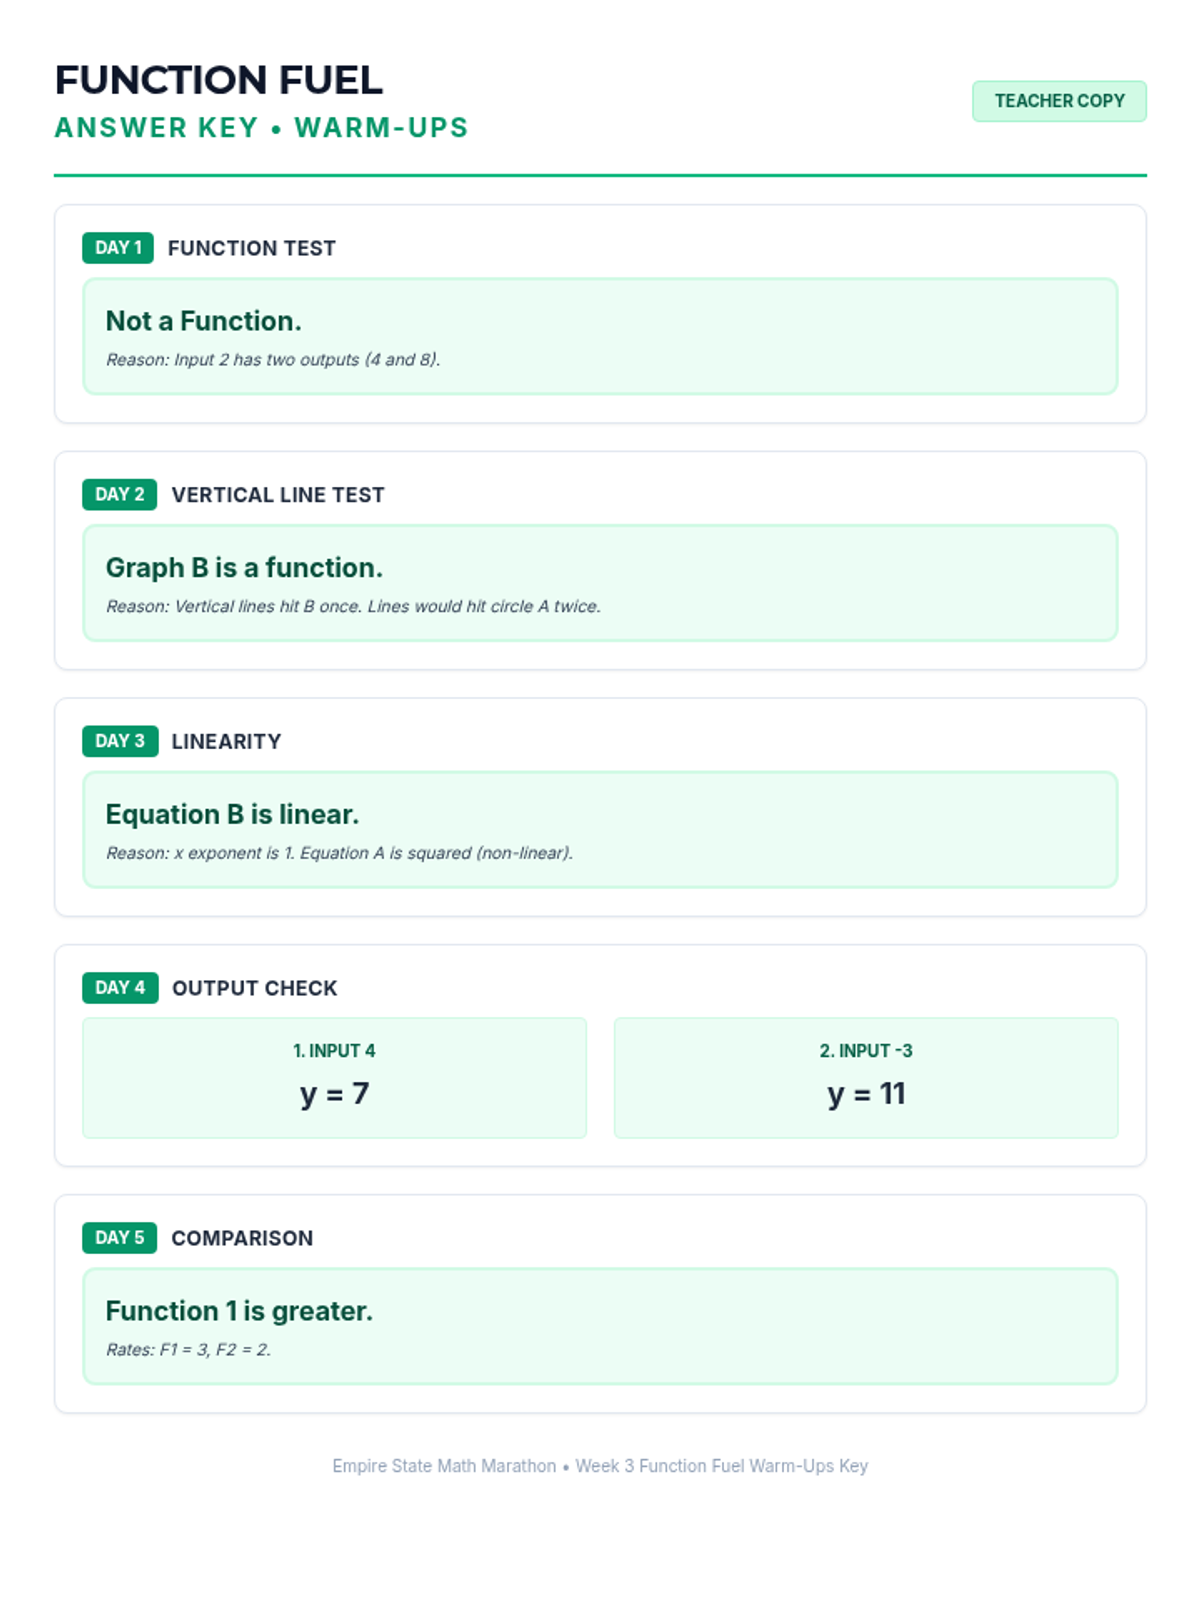
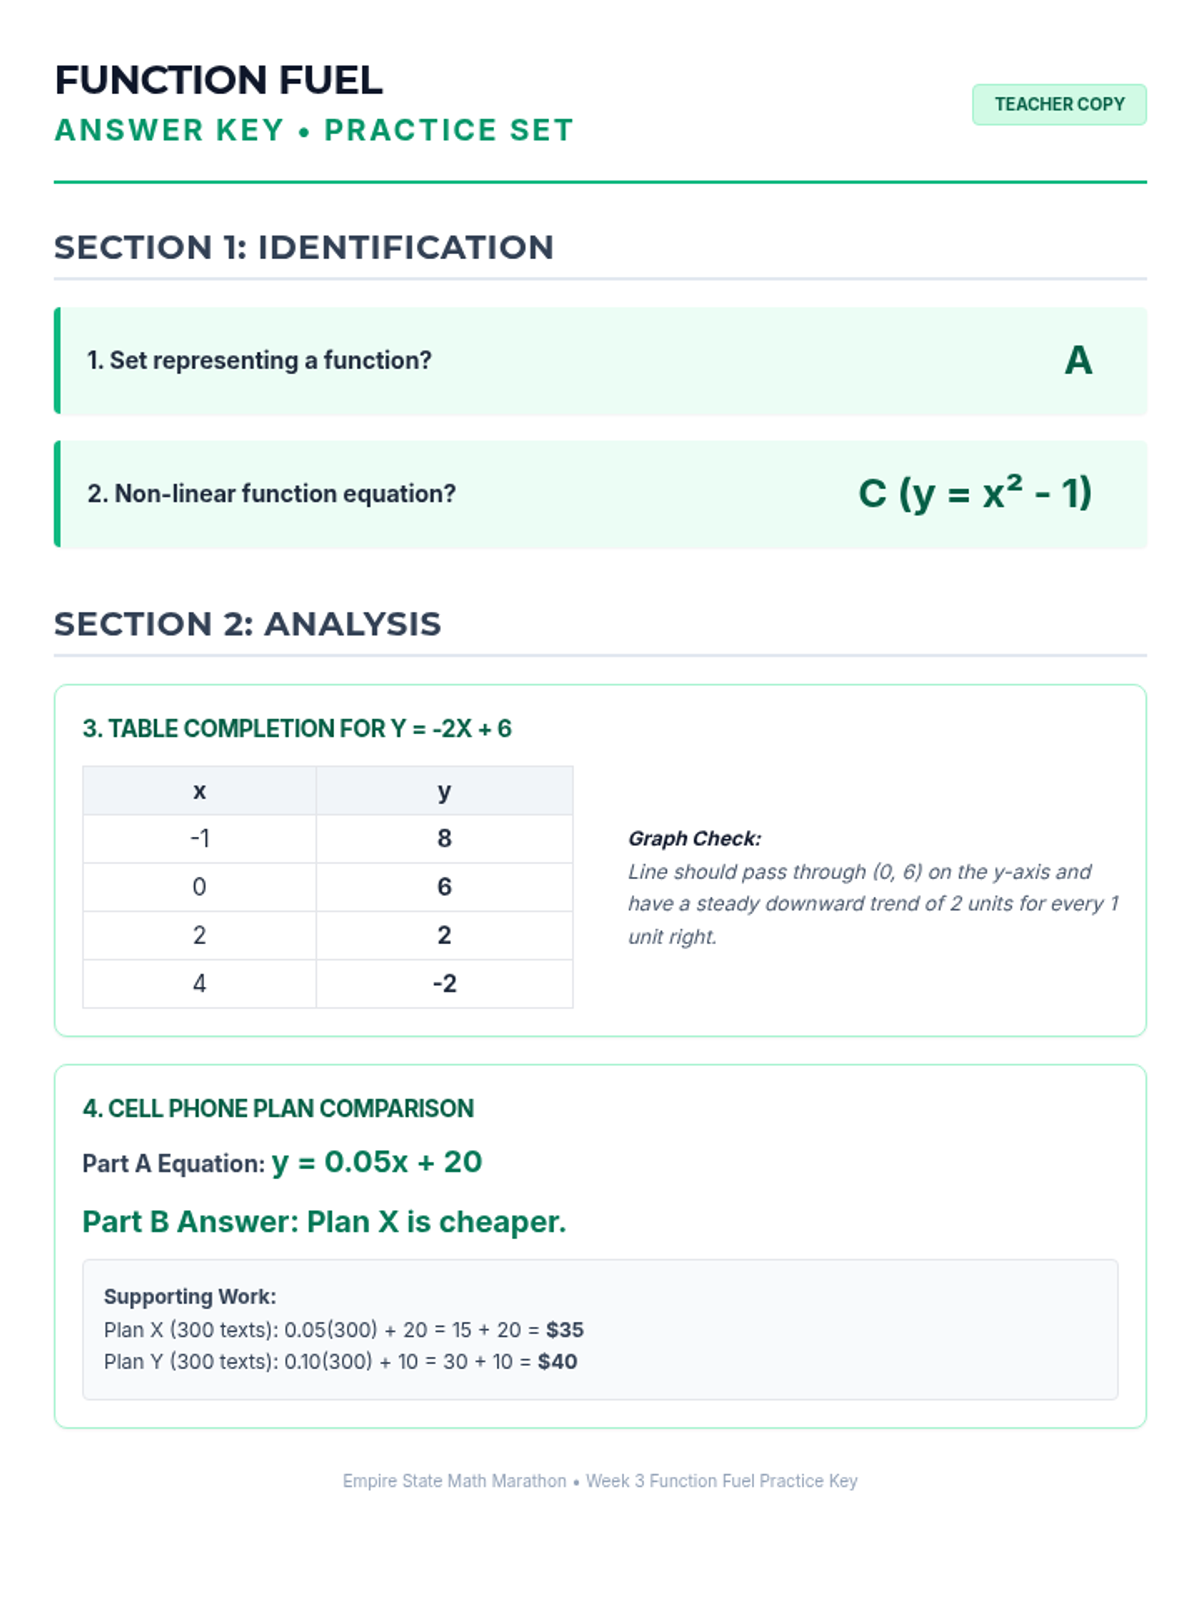
Week 3 defines, evaluates, and compares functions represented in different ways (tables, graphs, equations).
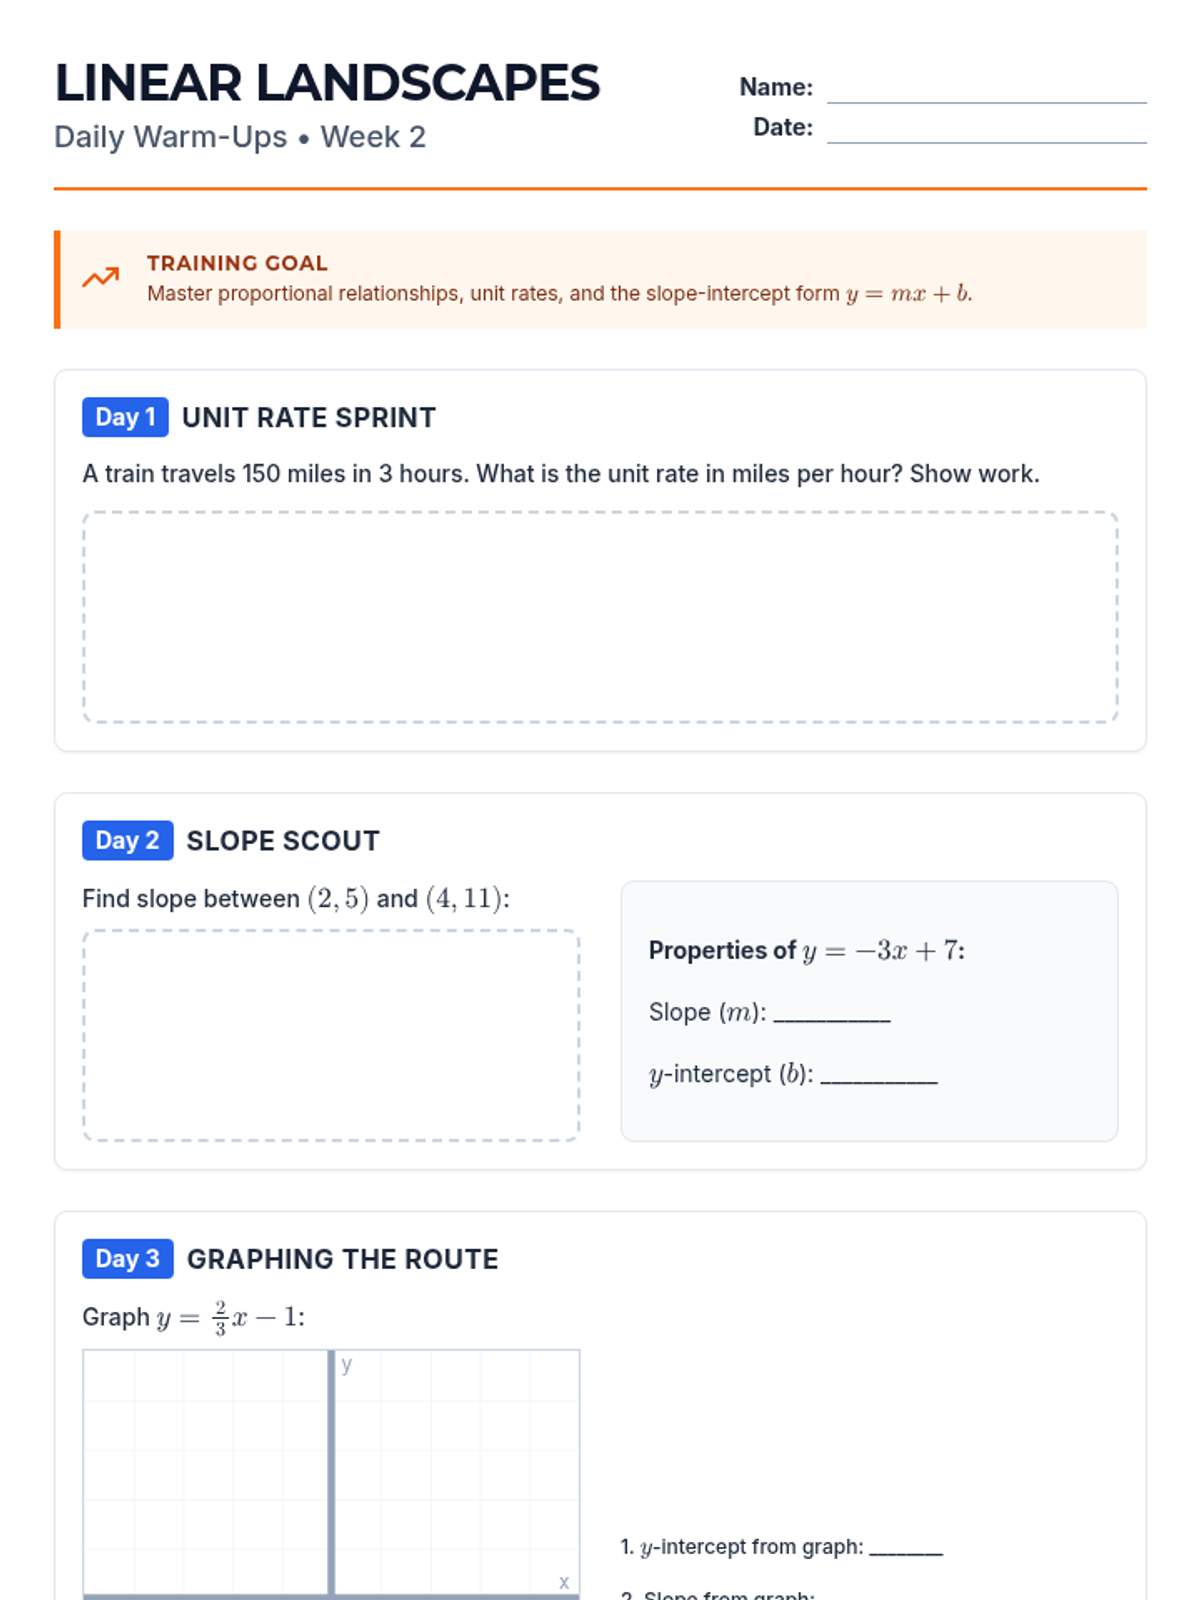
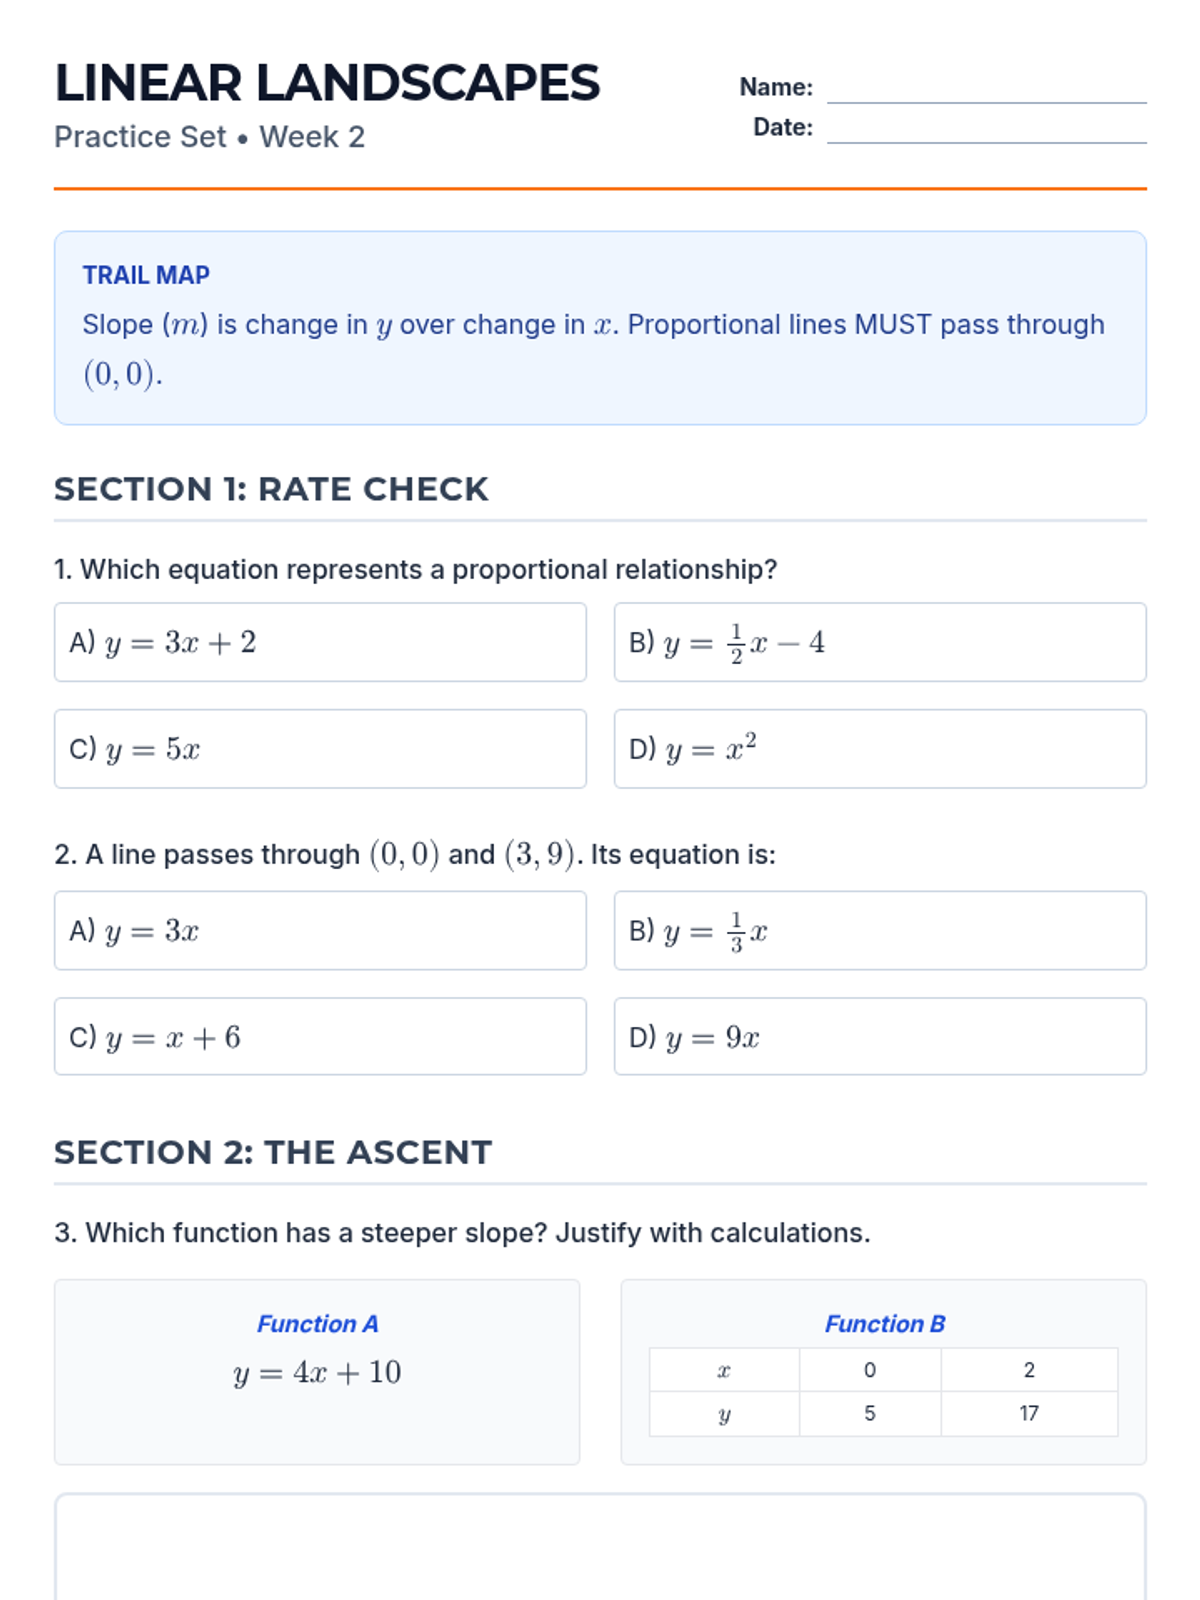
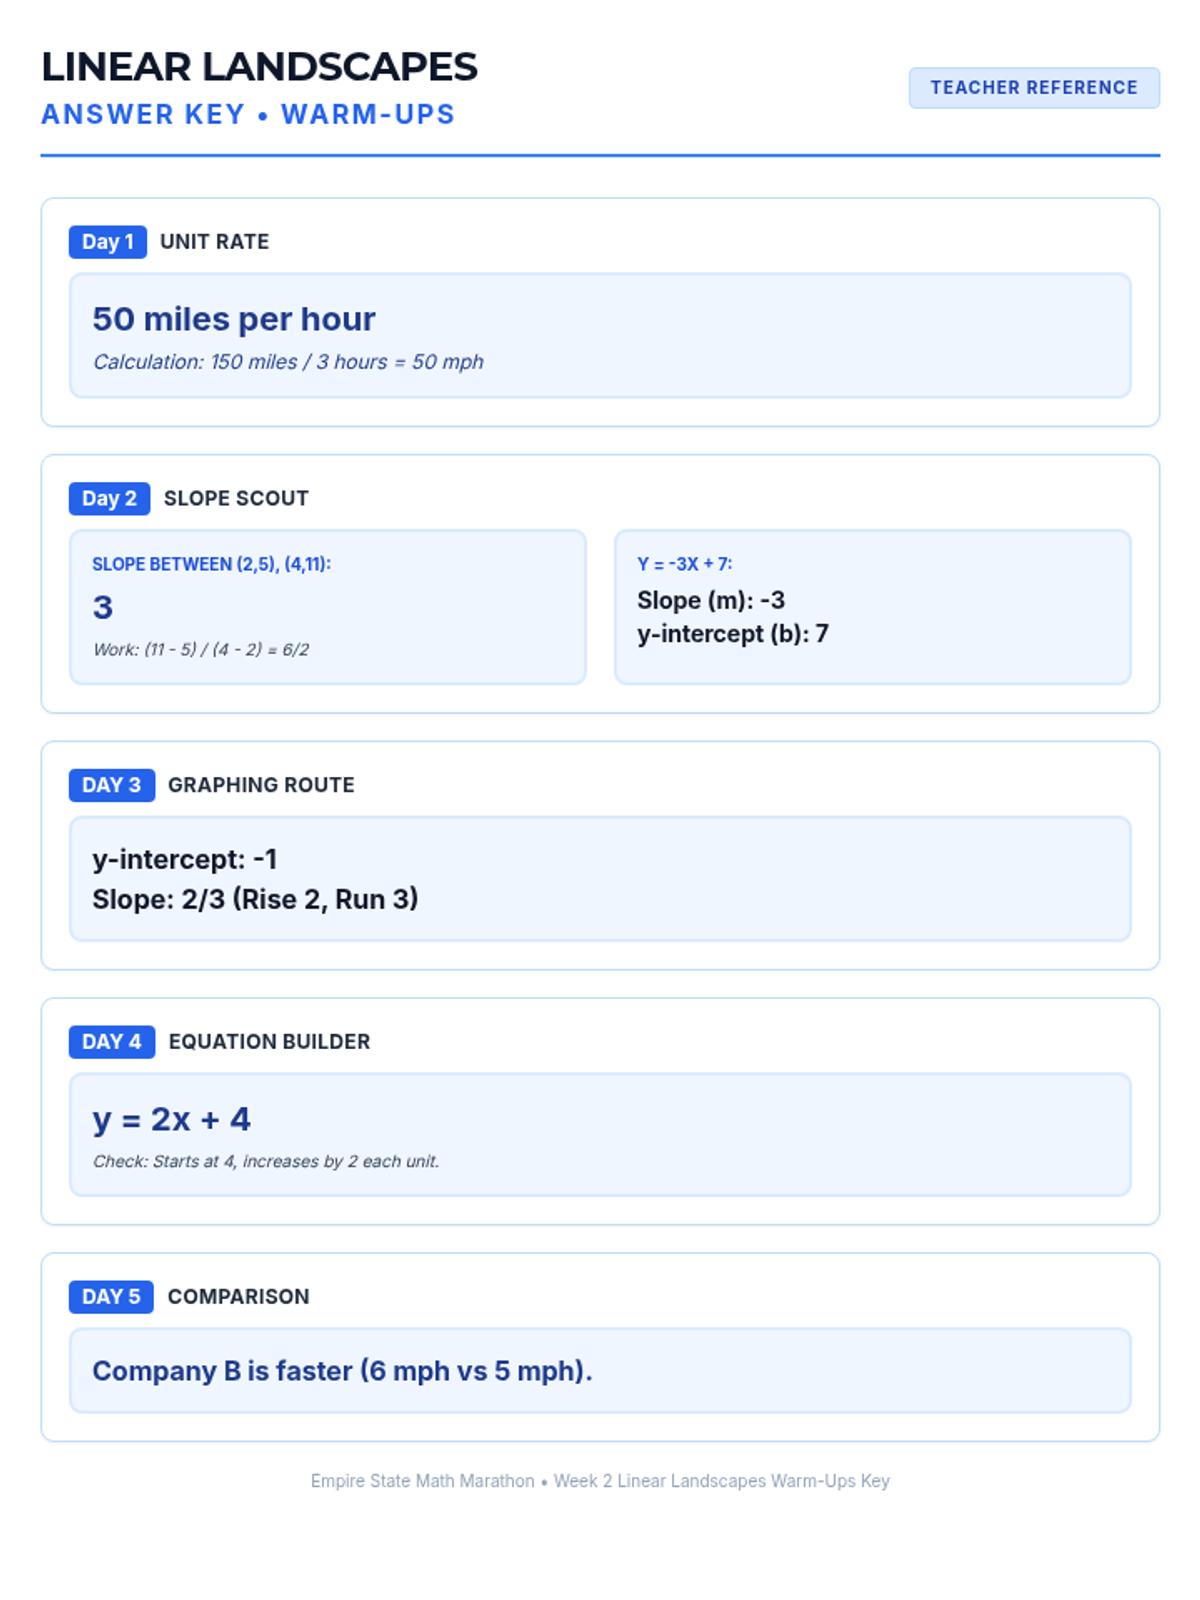
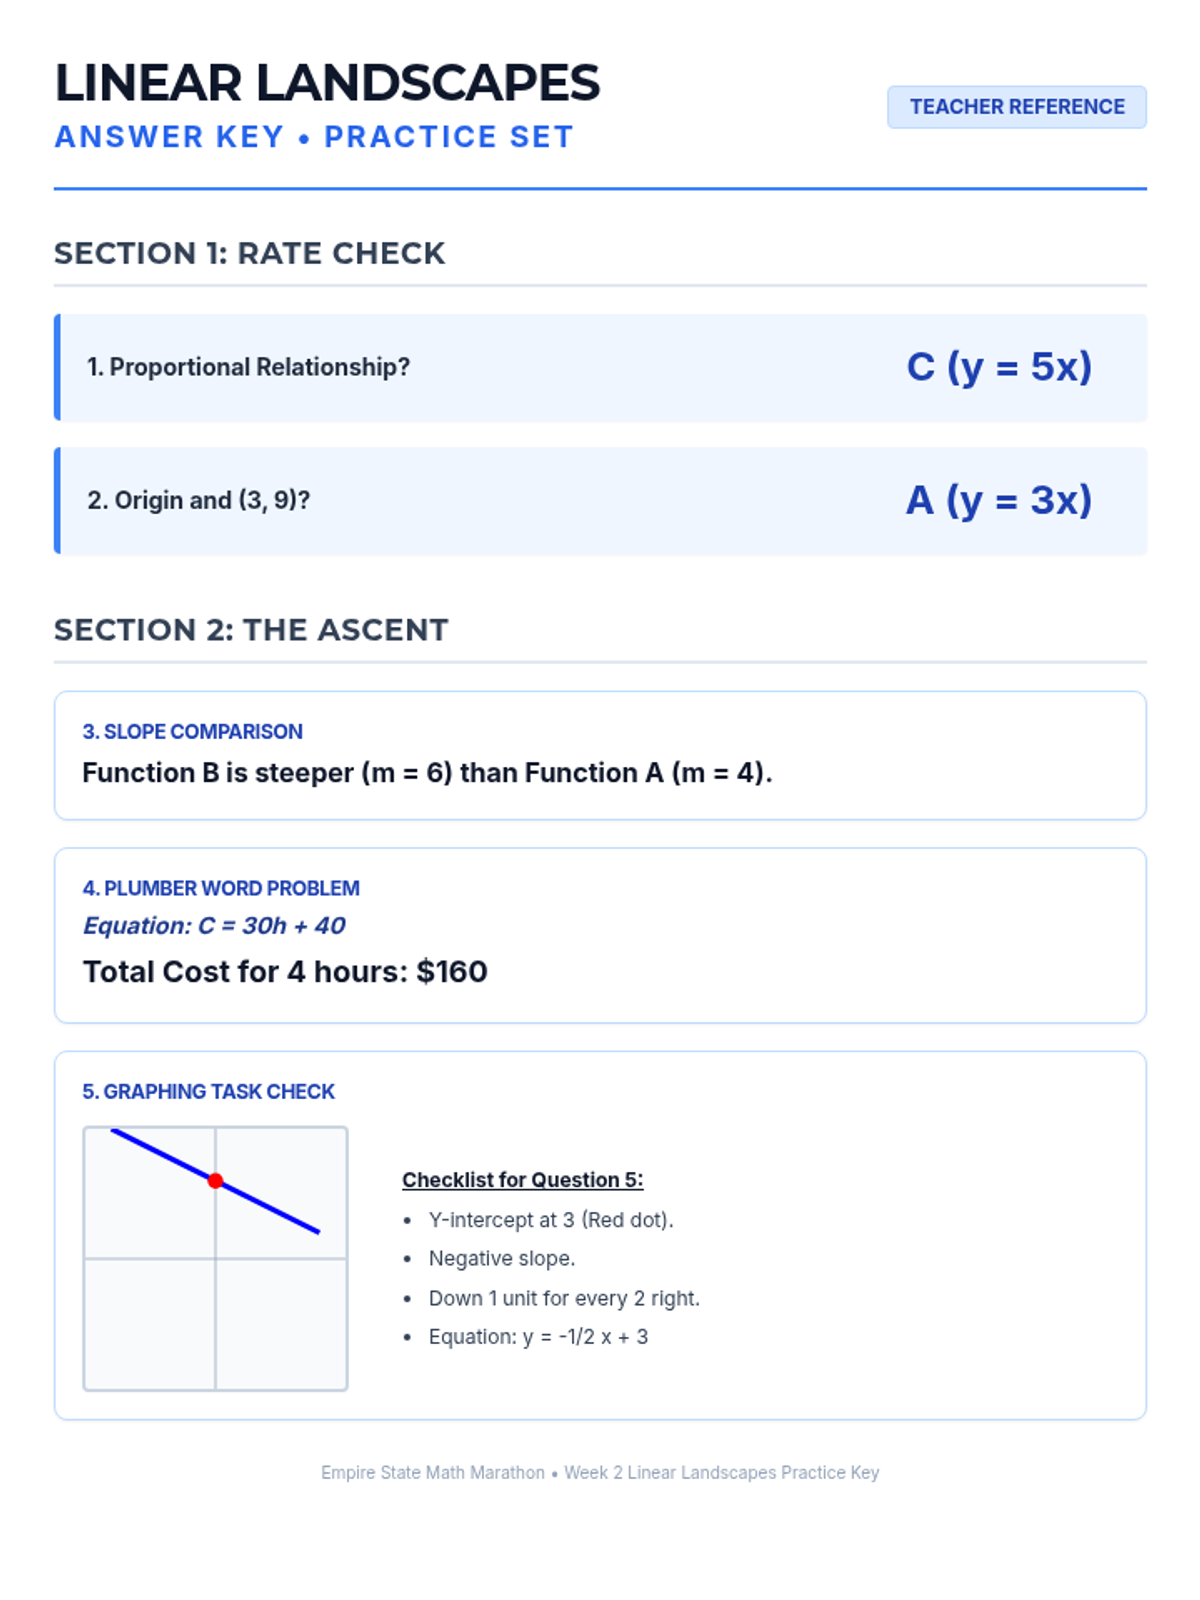
Week 2 covers proportional relationships, unit rates, and the slope-intercept form of linear equations.
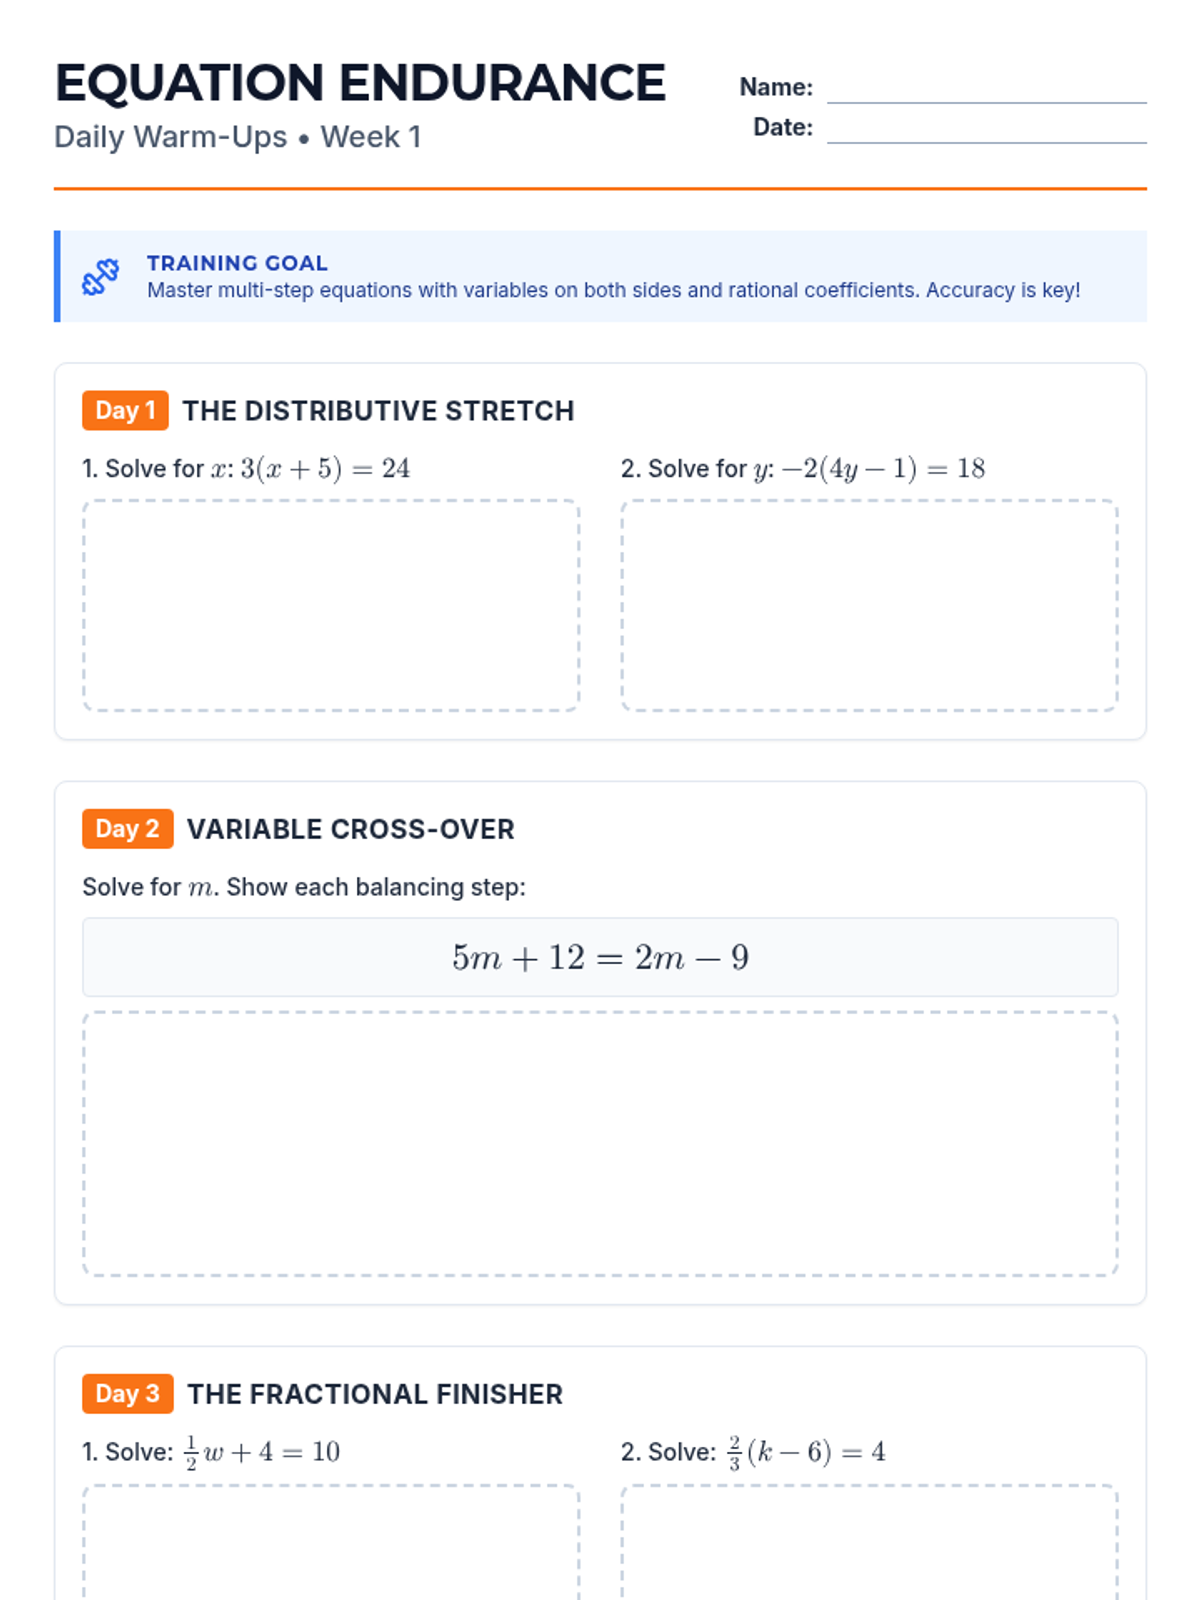
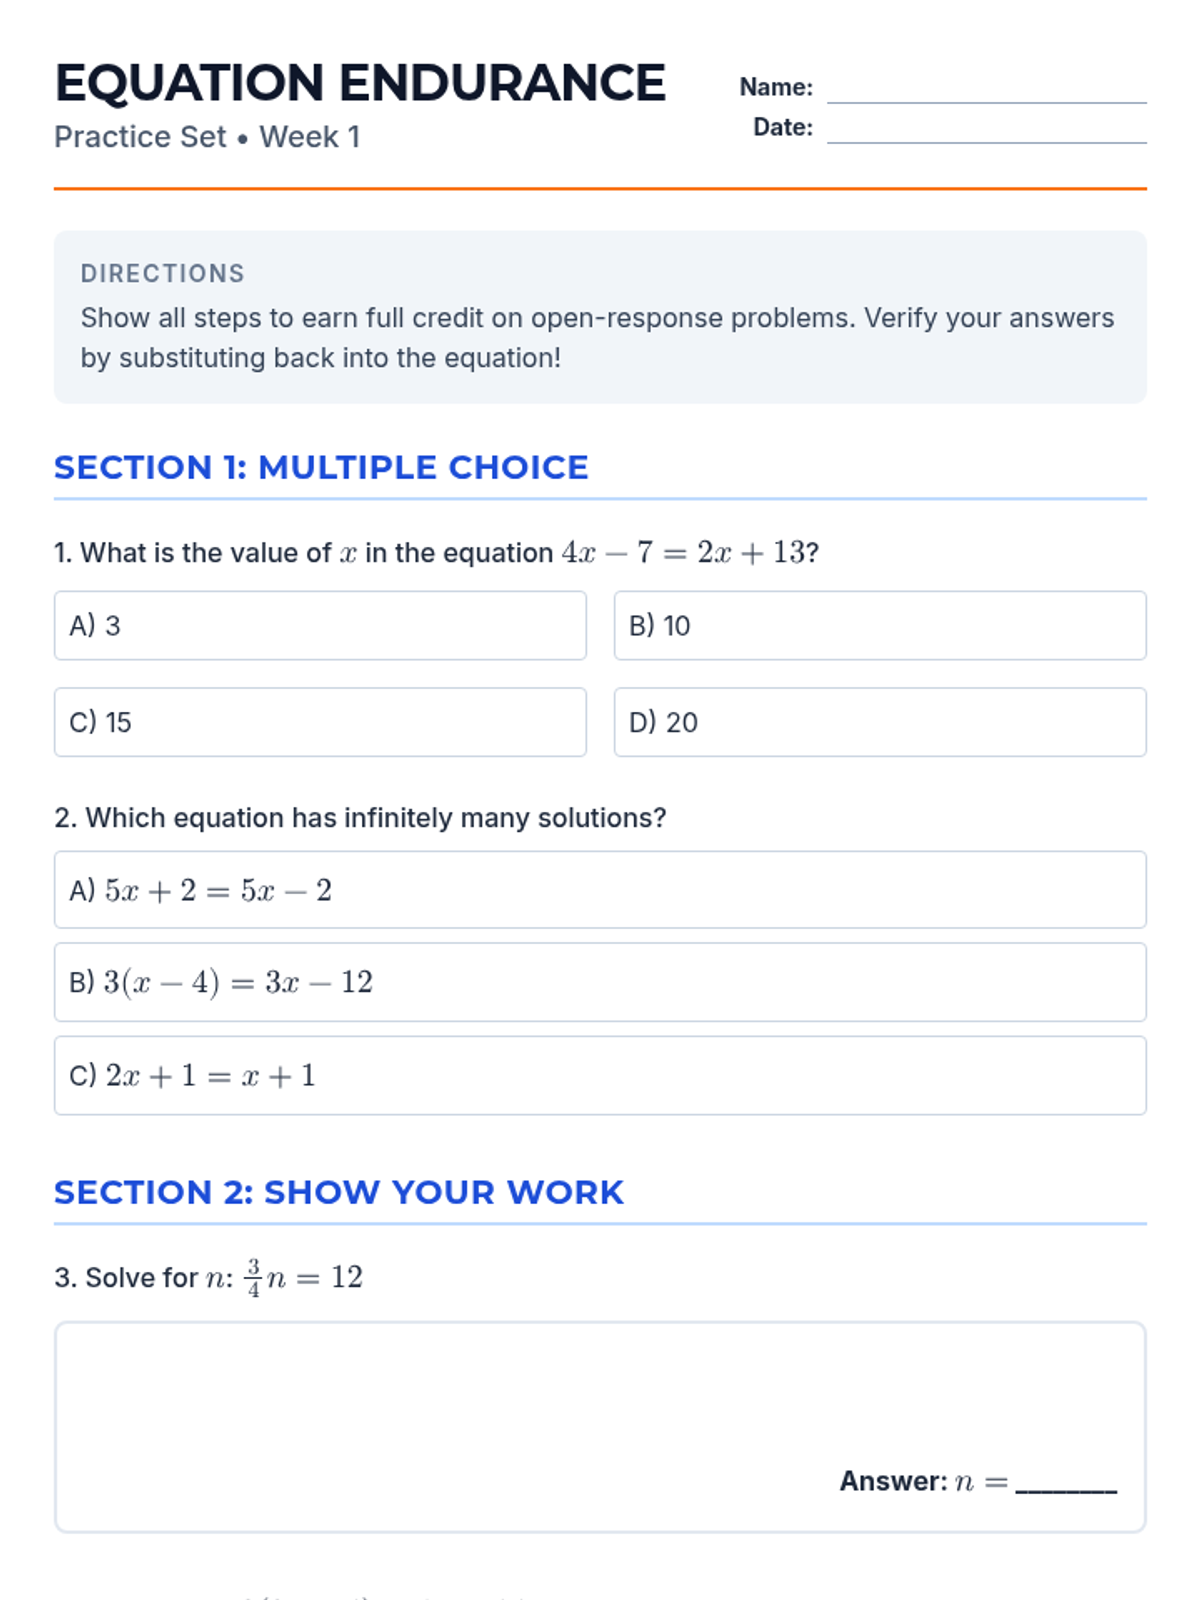
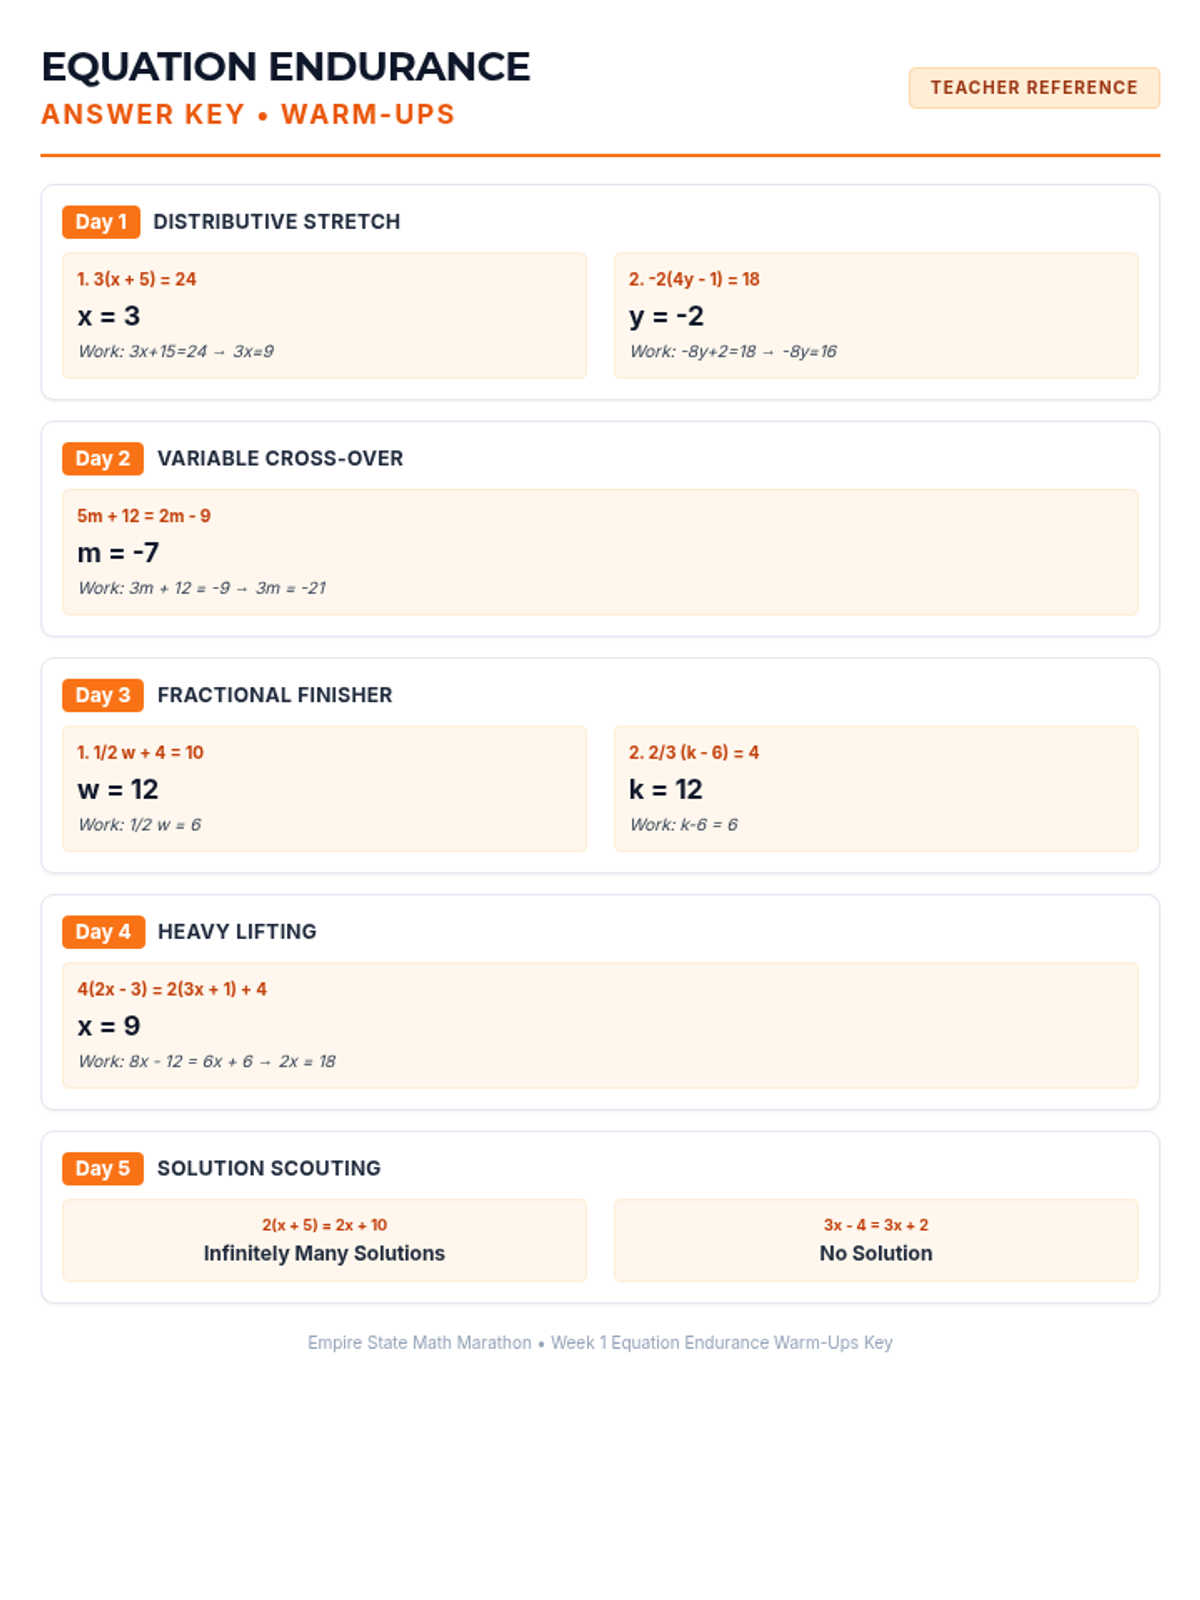
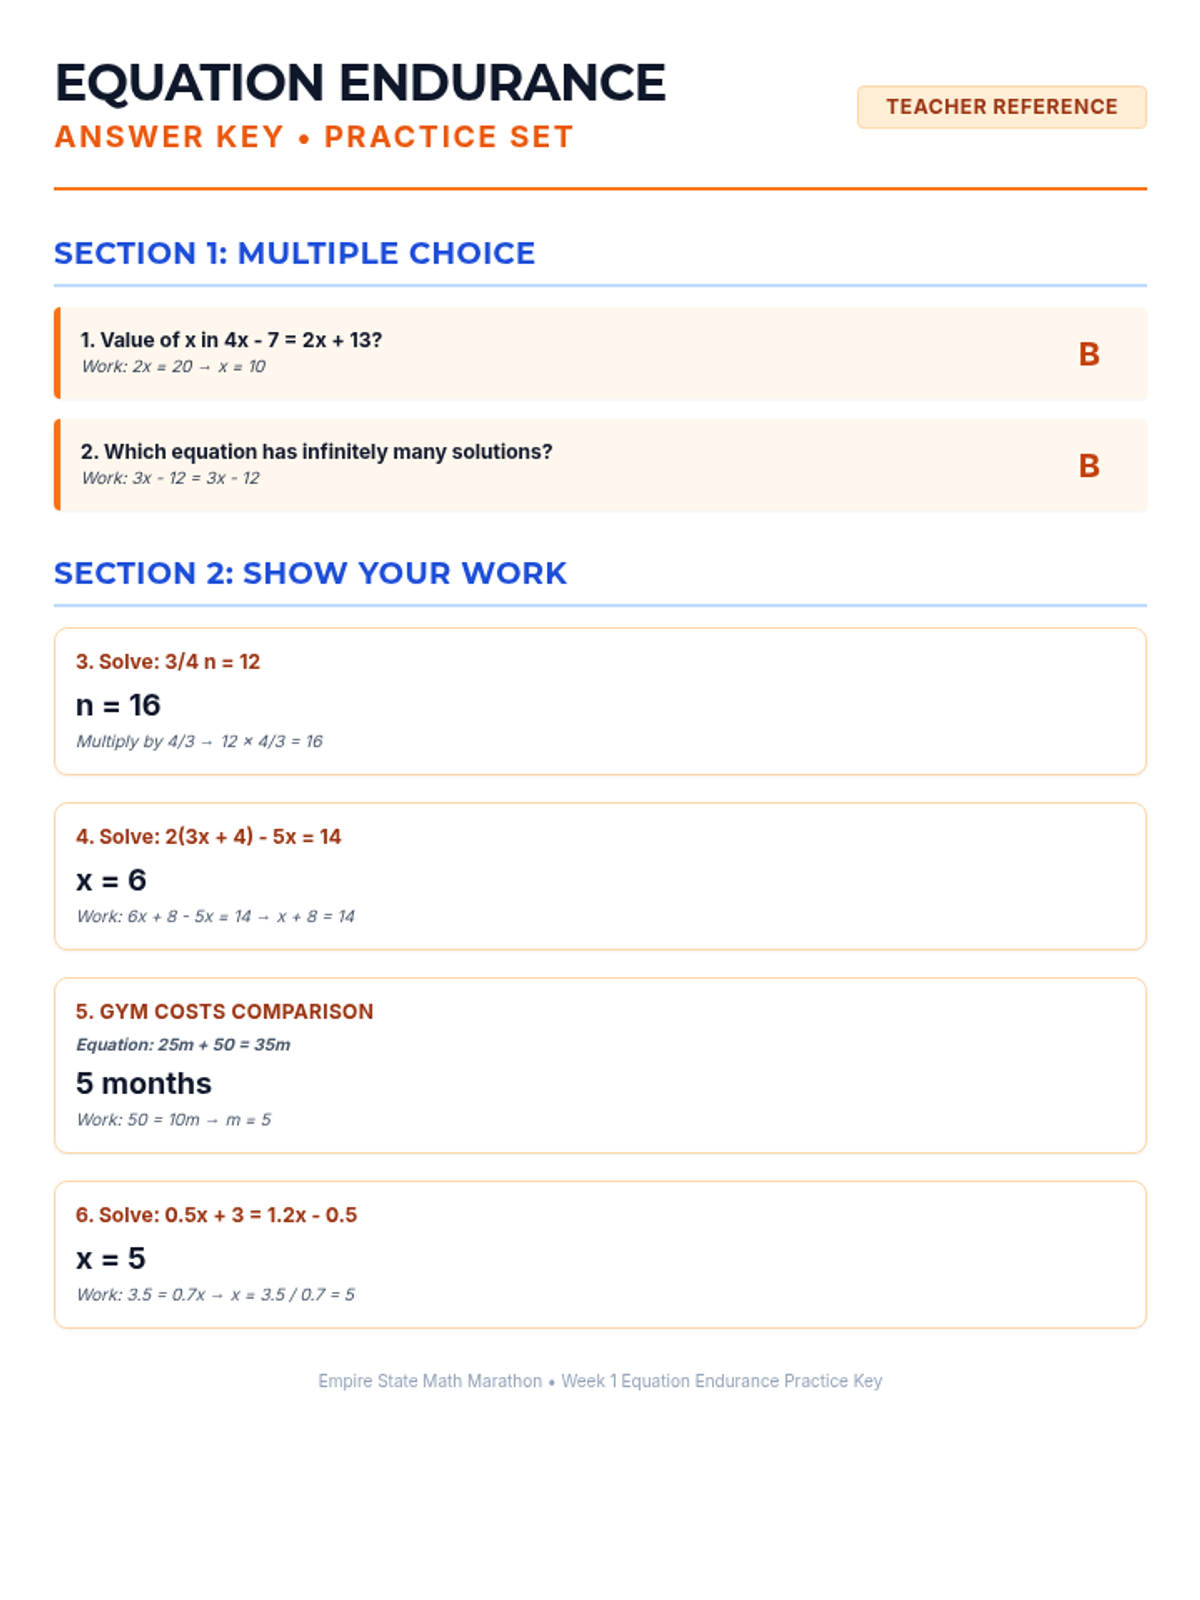
Week 1 focuses on solving multi-step equations, including those with variables on both sides, rational coefficients, and checking solutions.
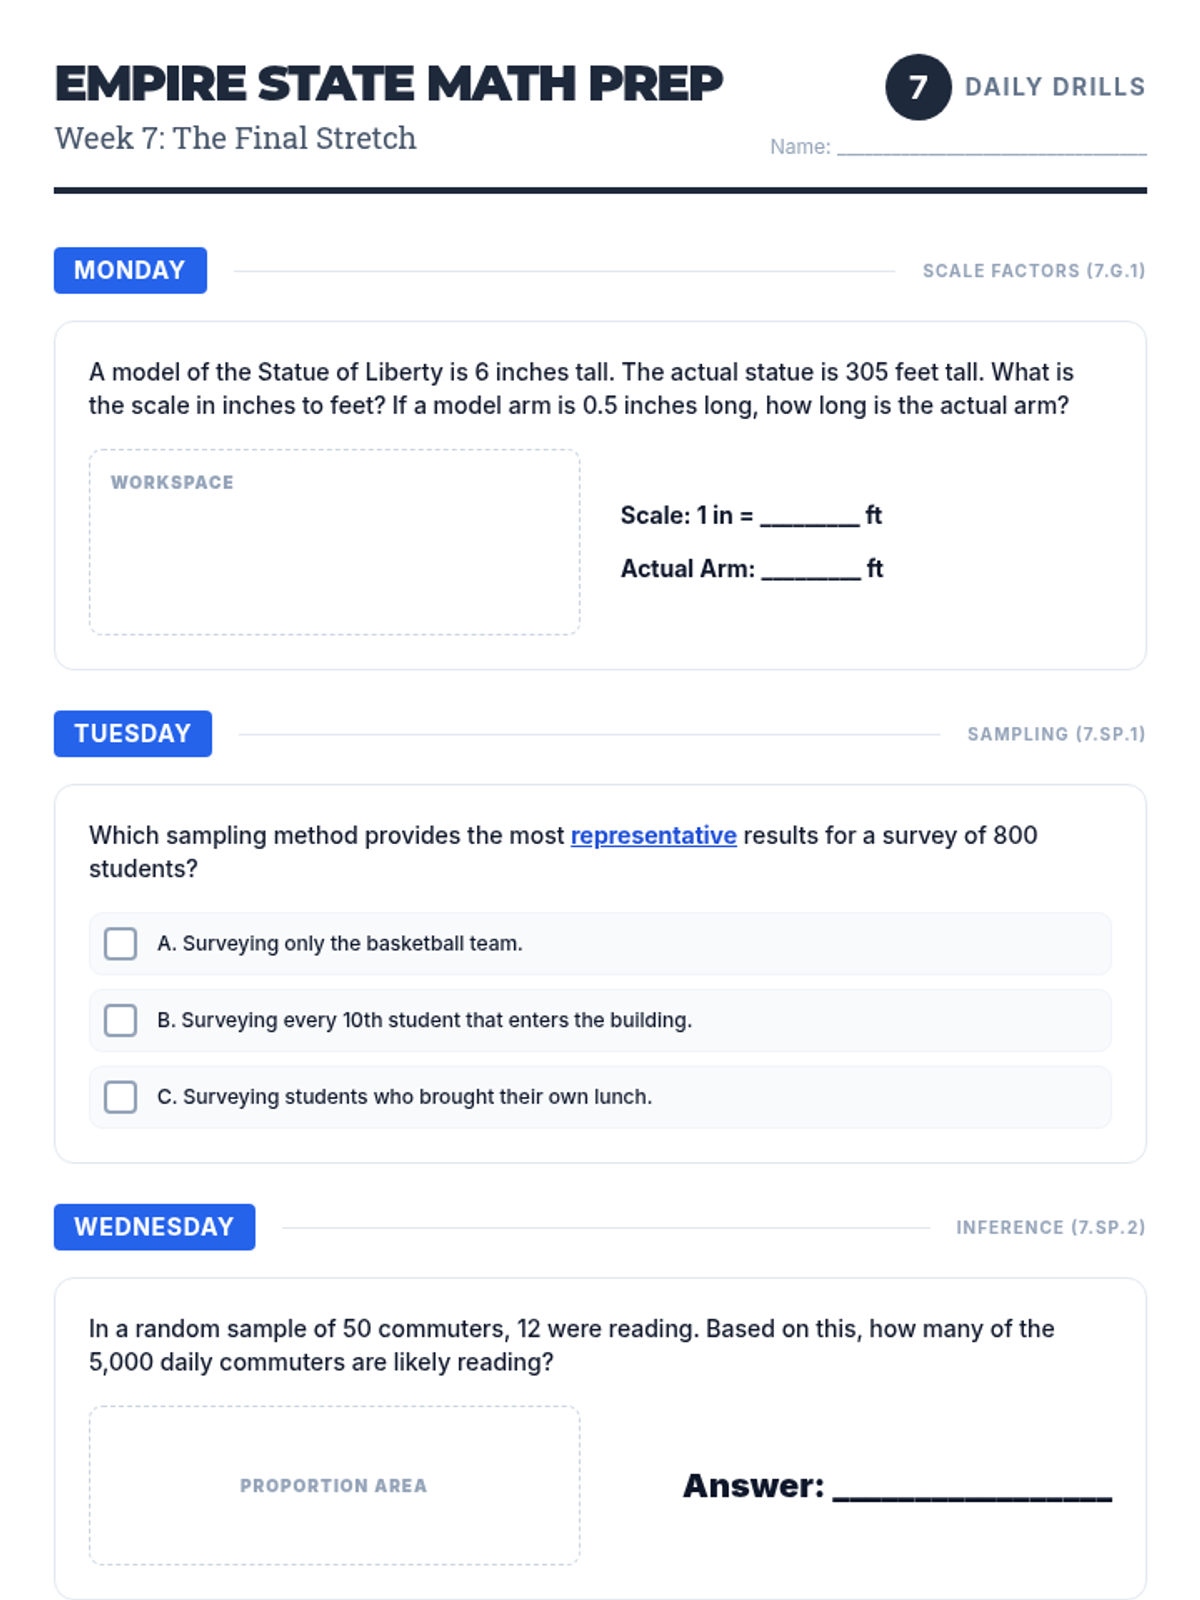
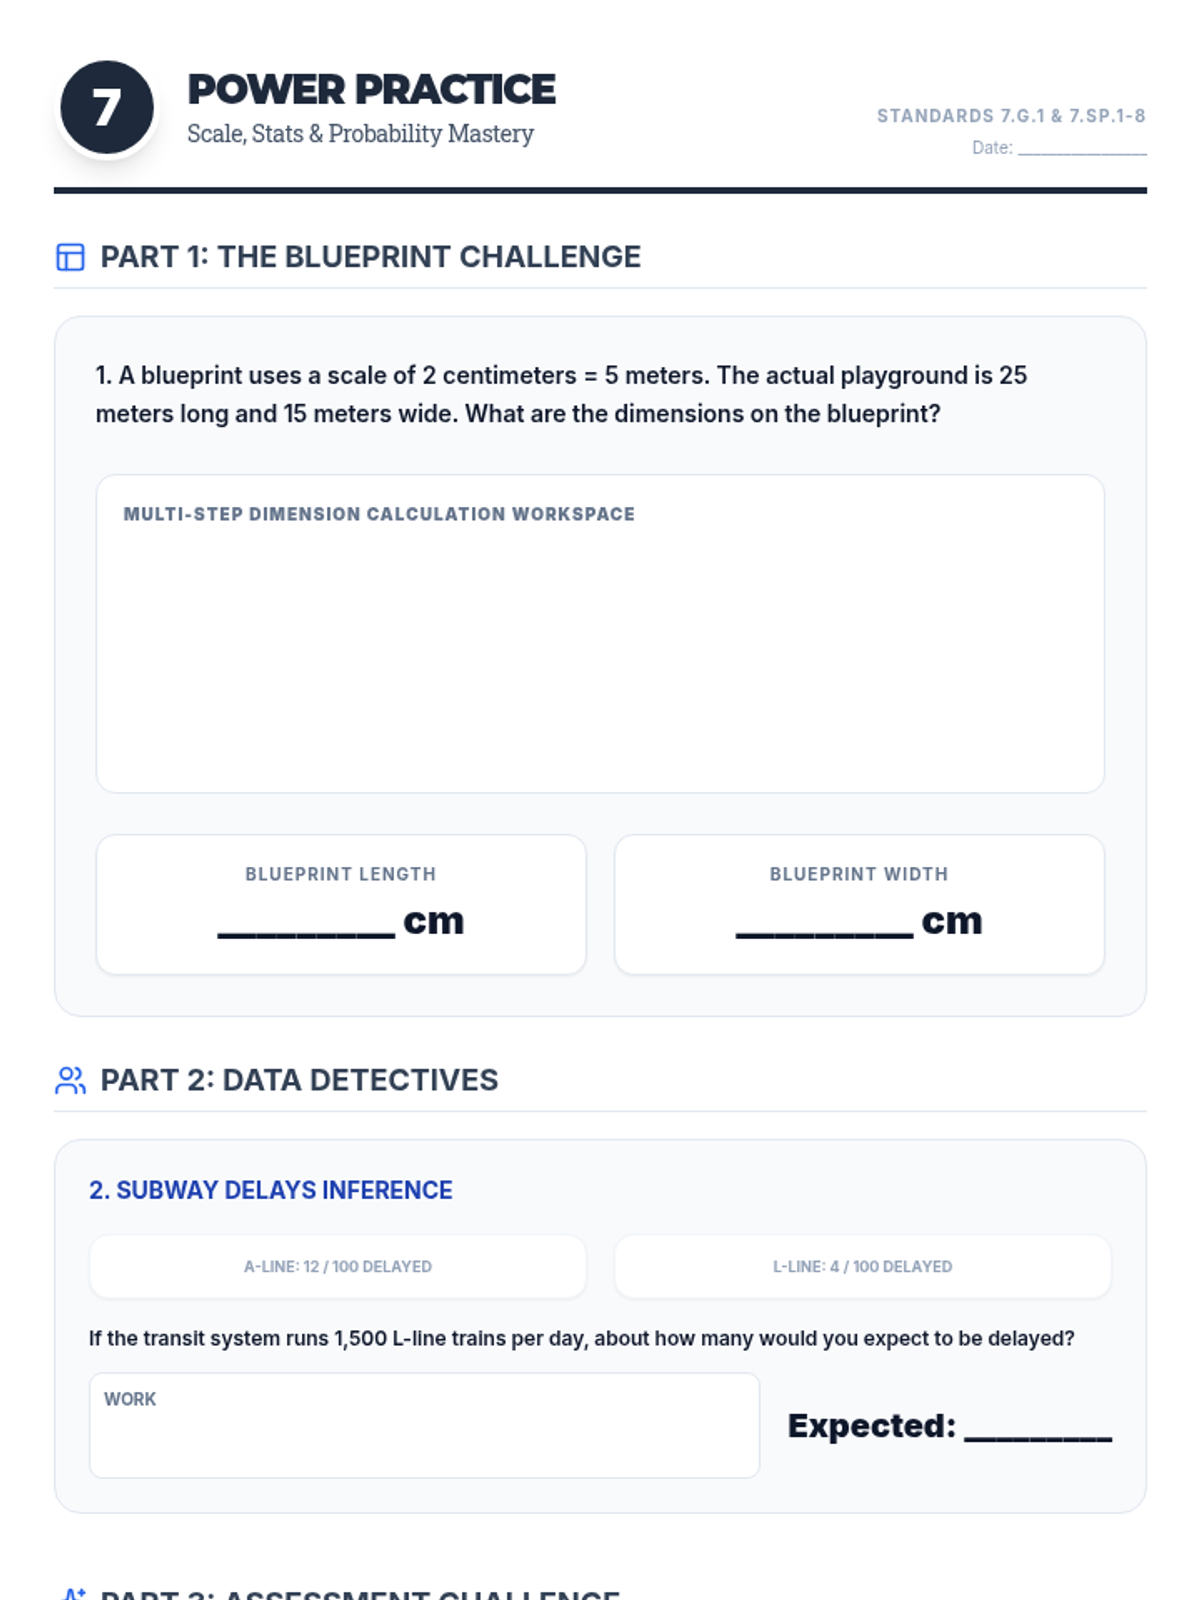
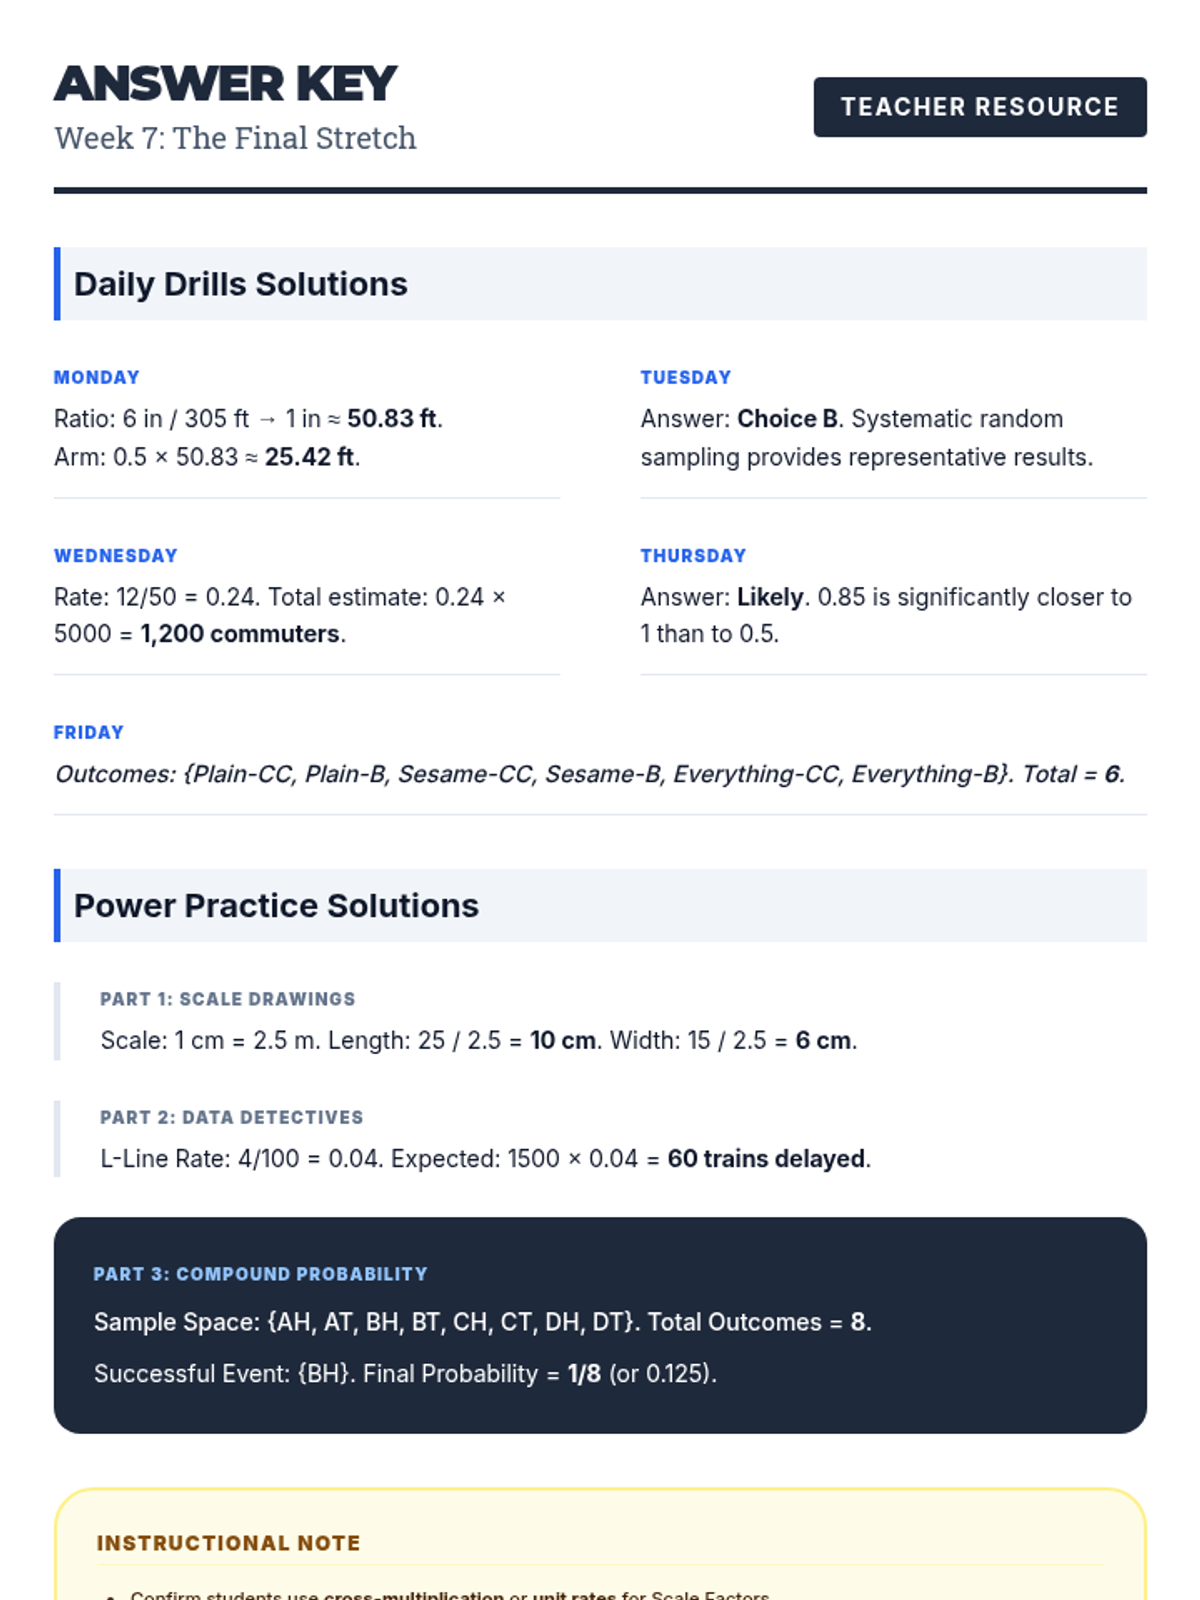
Reviewing scale drawings, statistics, and probability to round out the comprehensive NYS Assessment preparation.
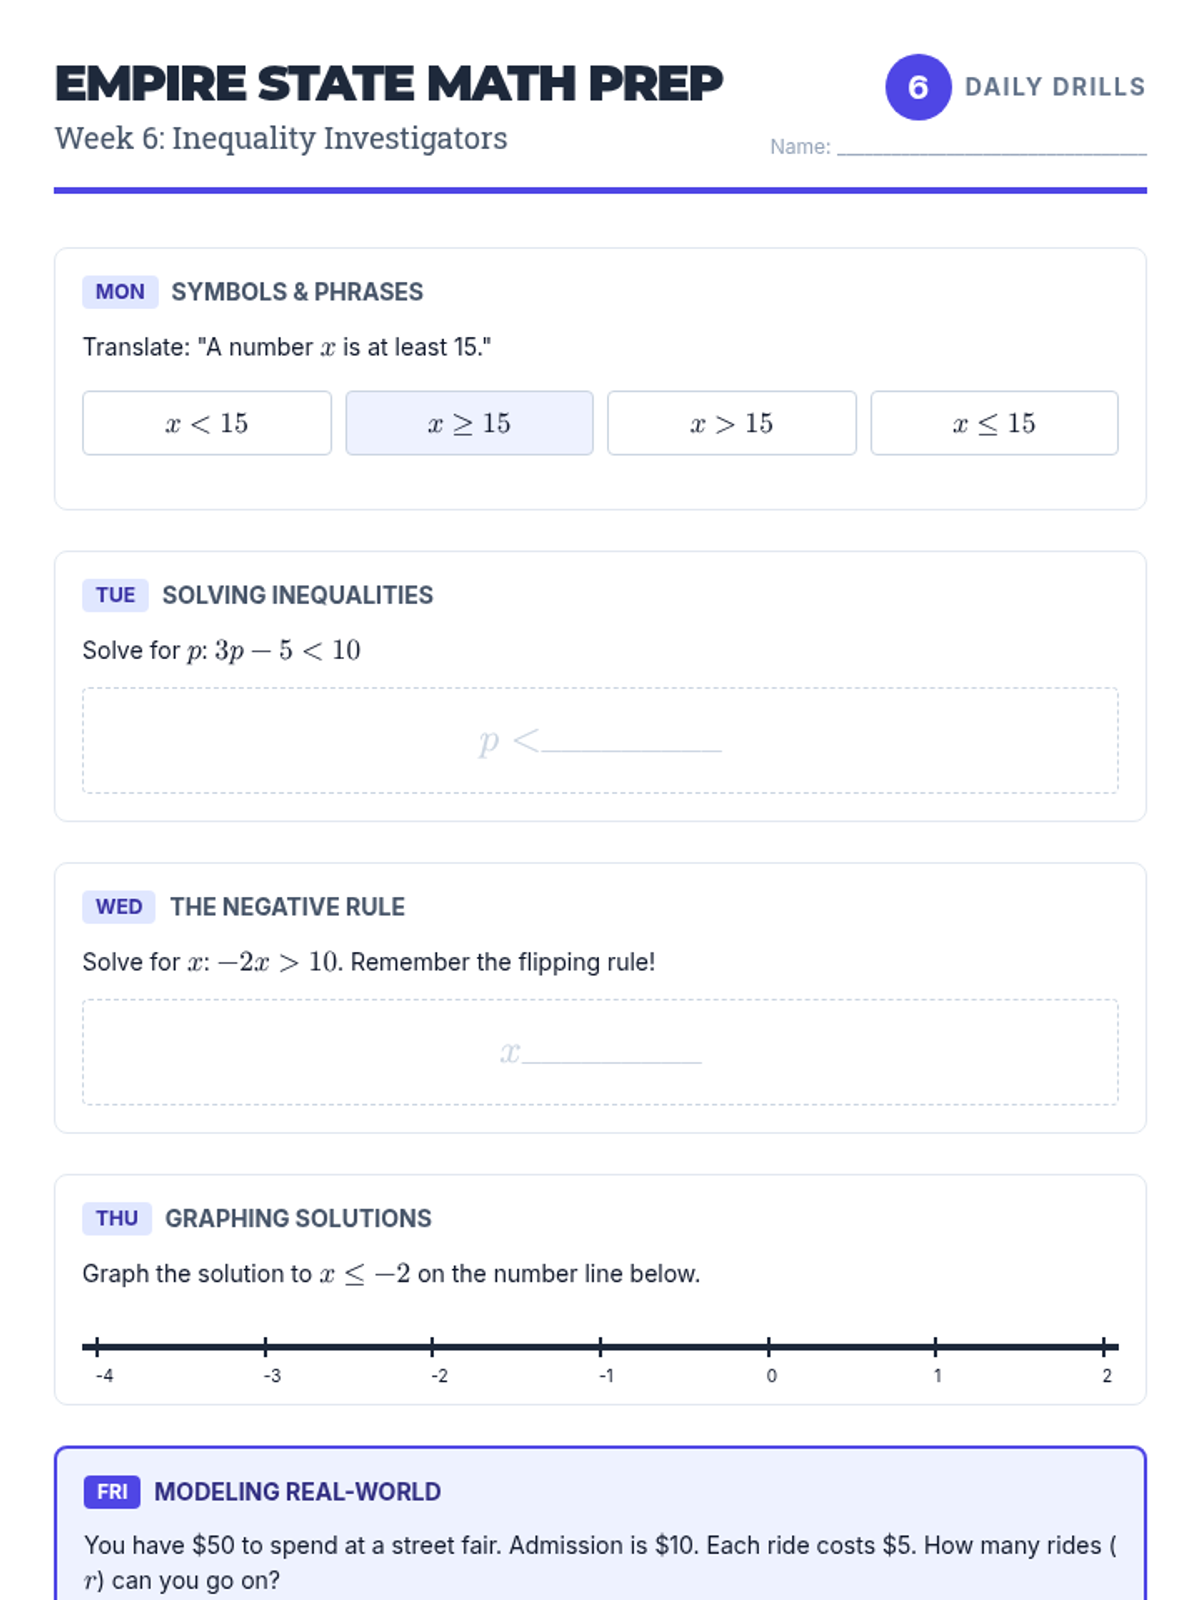
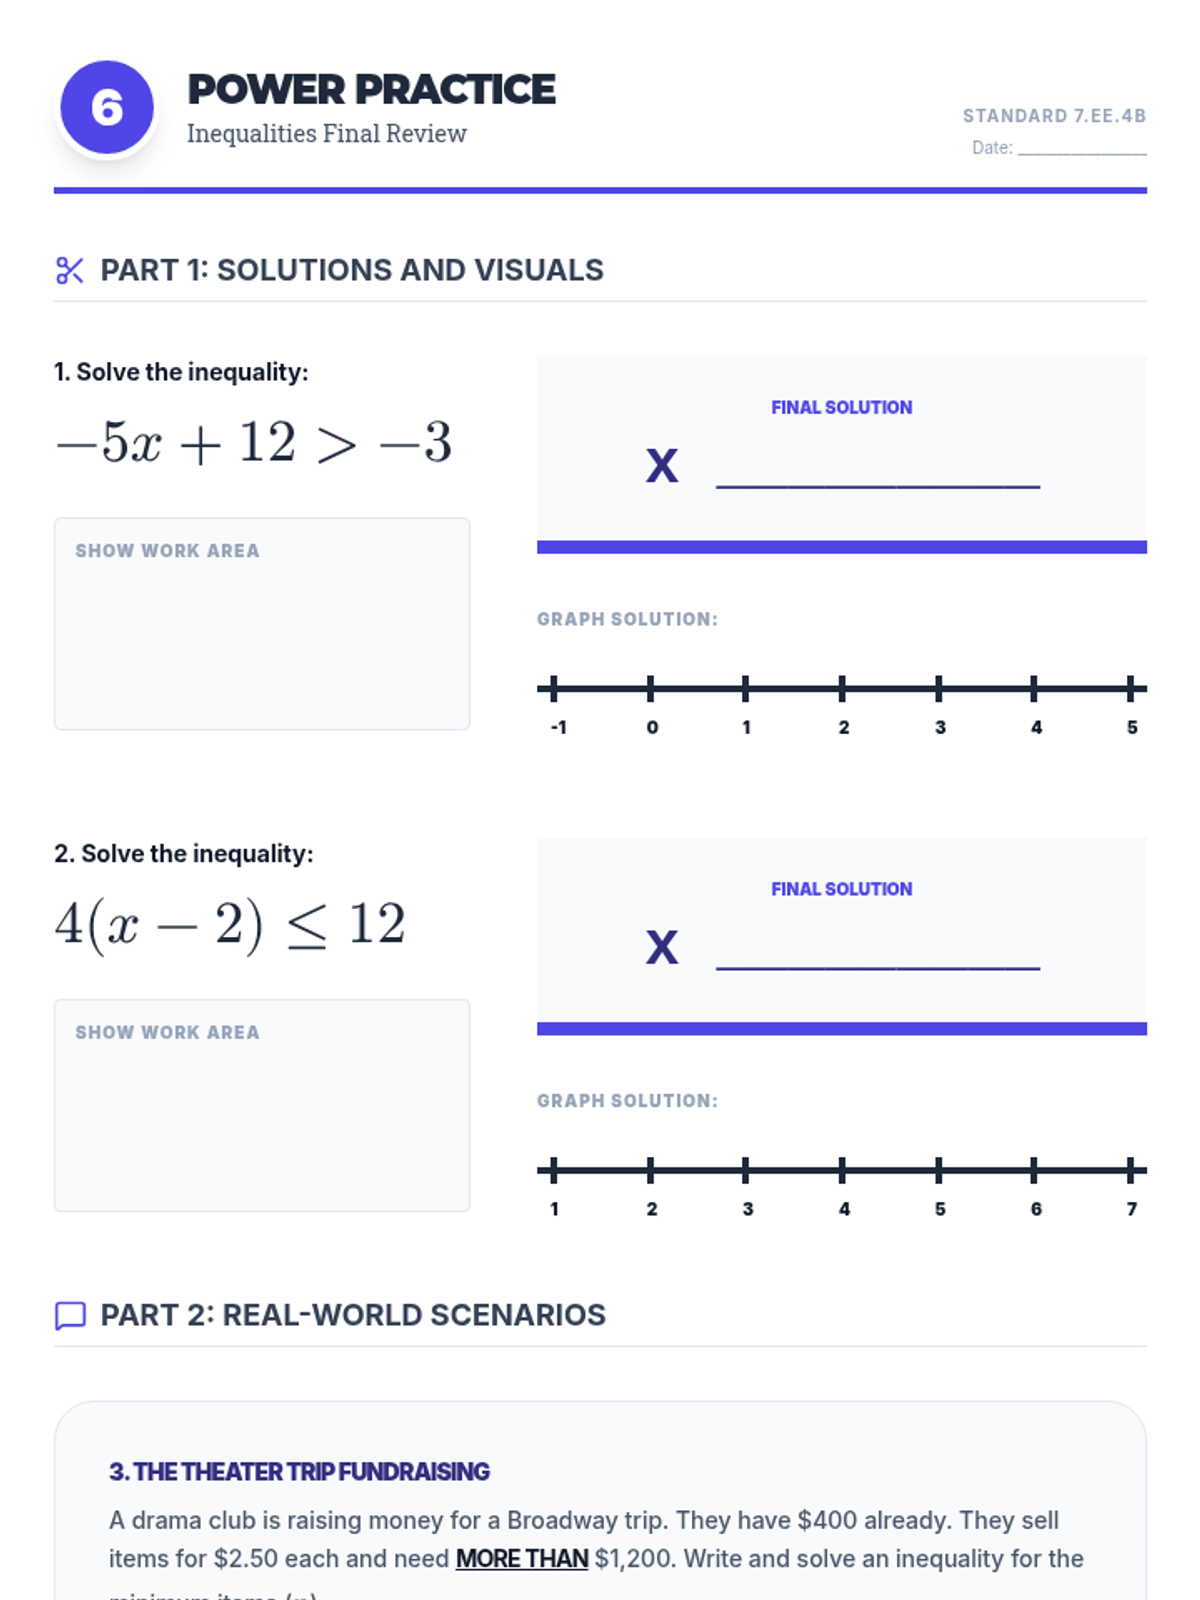
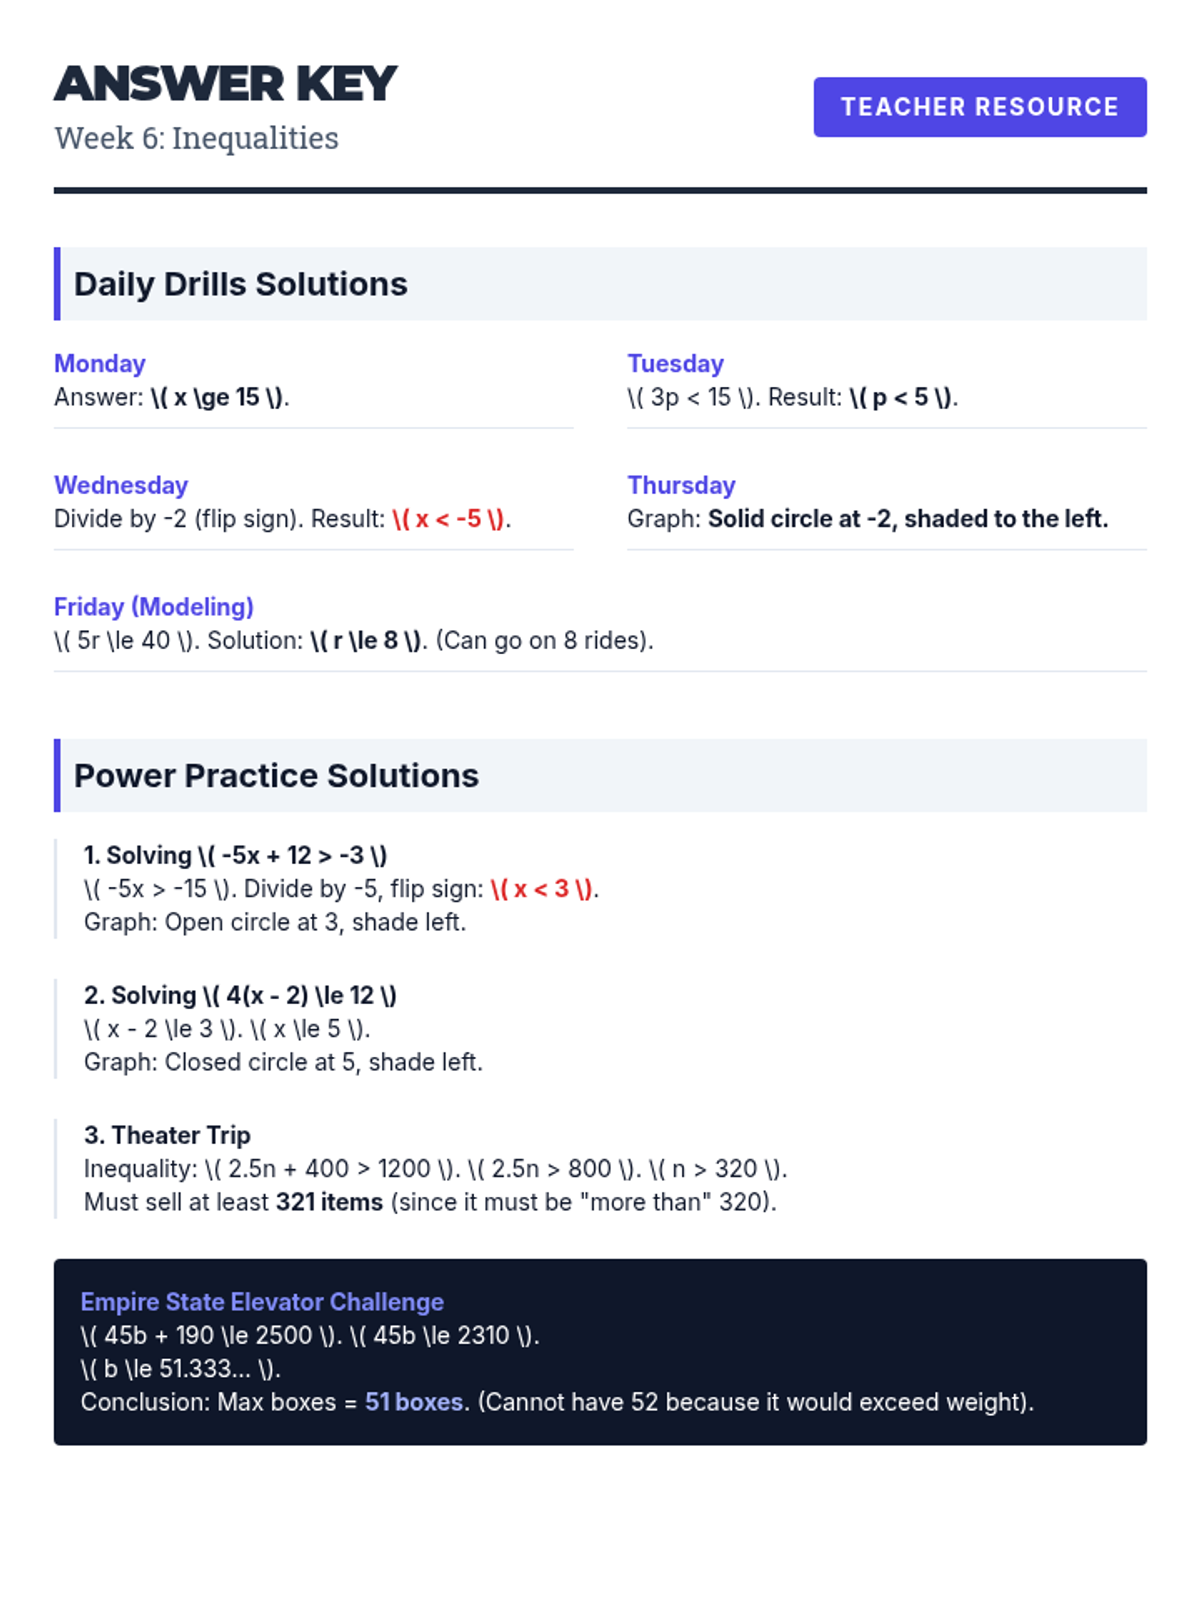
Solving and graphing linear inequalities and applying them to real-world NYS assessment scenarios.
Simplifying linear expressions and solving multi-step equations using properties of operations.
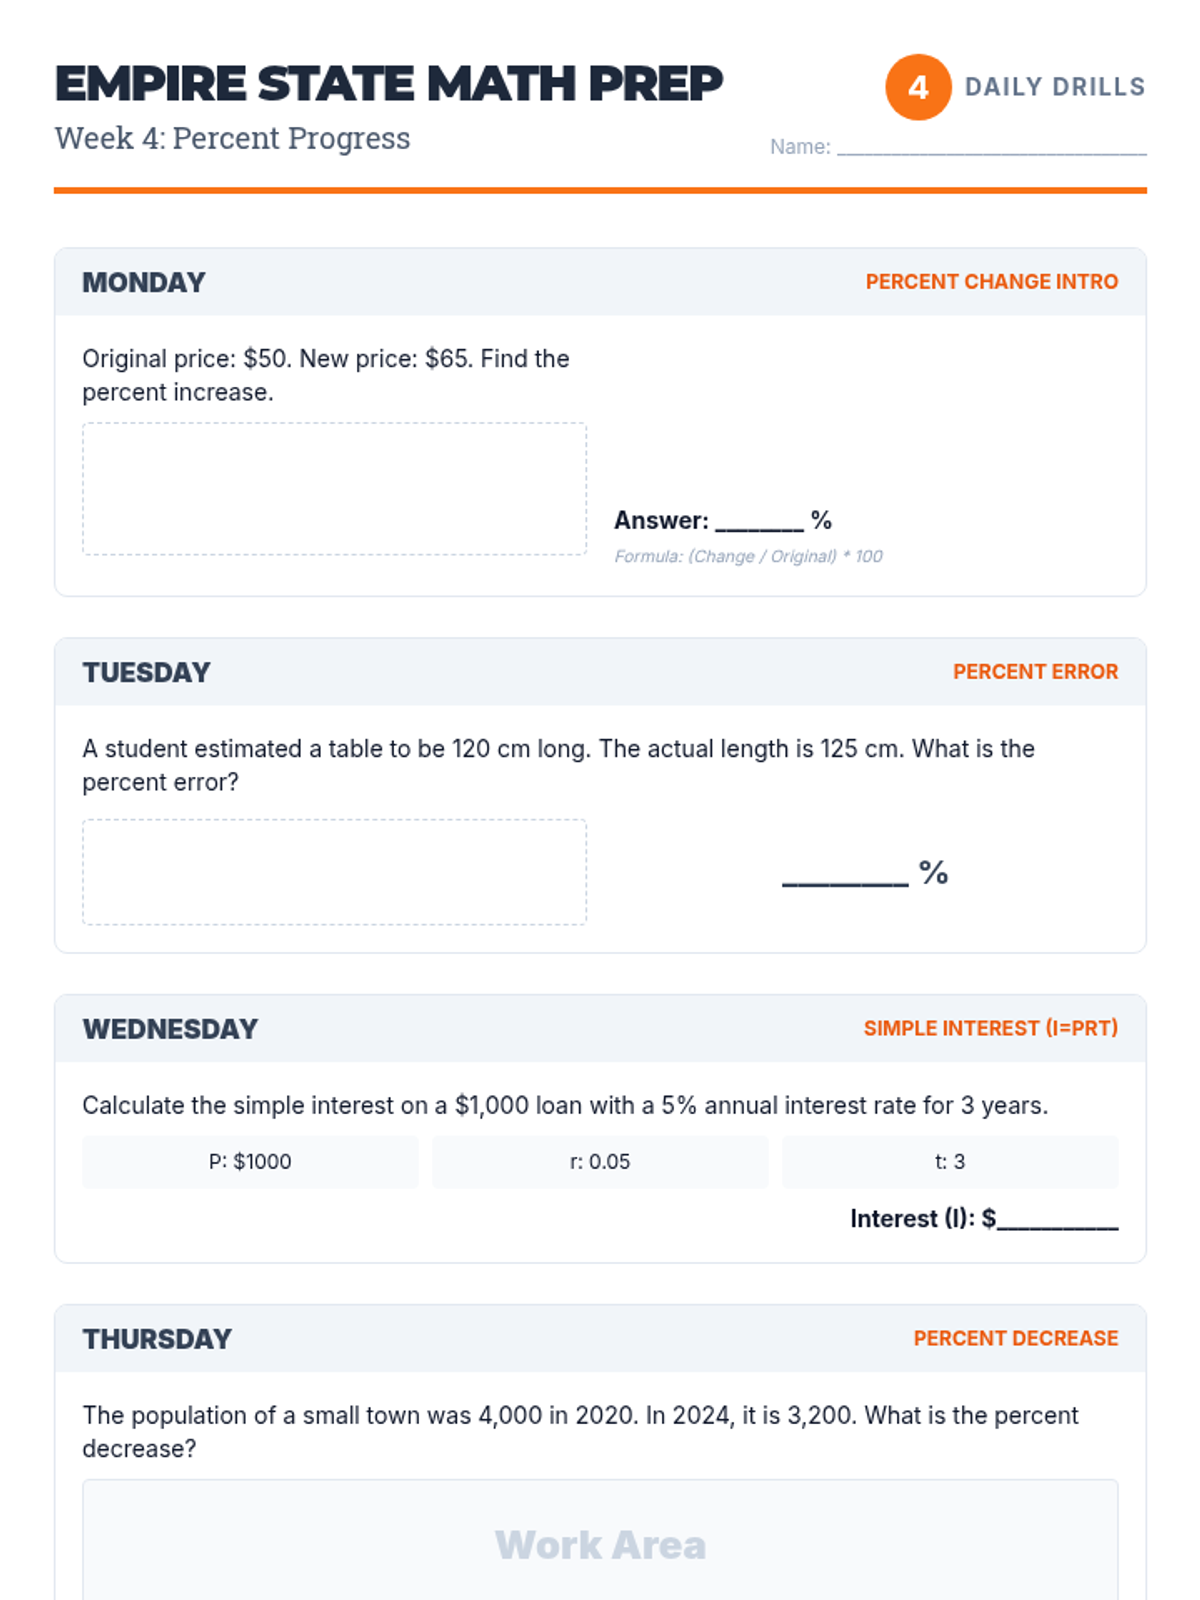
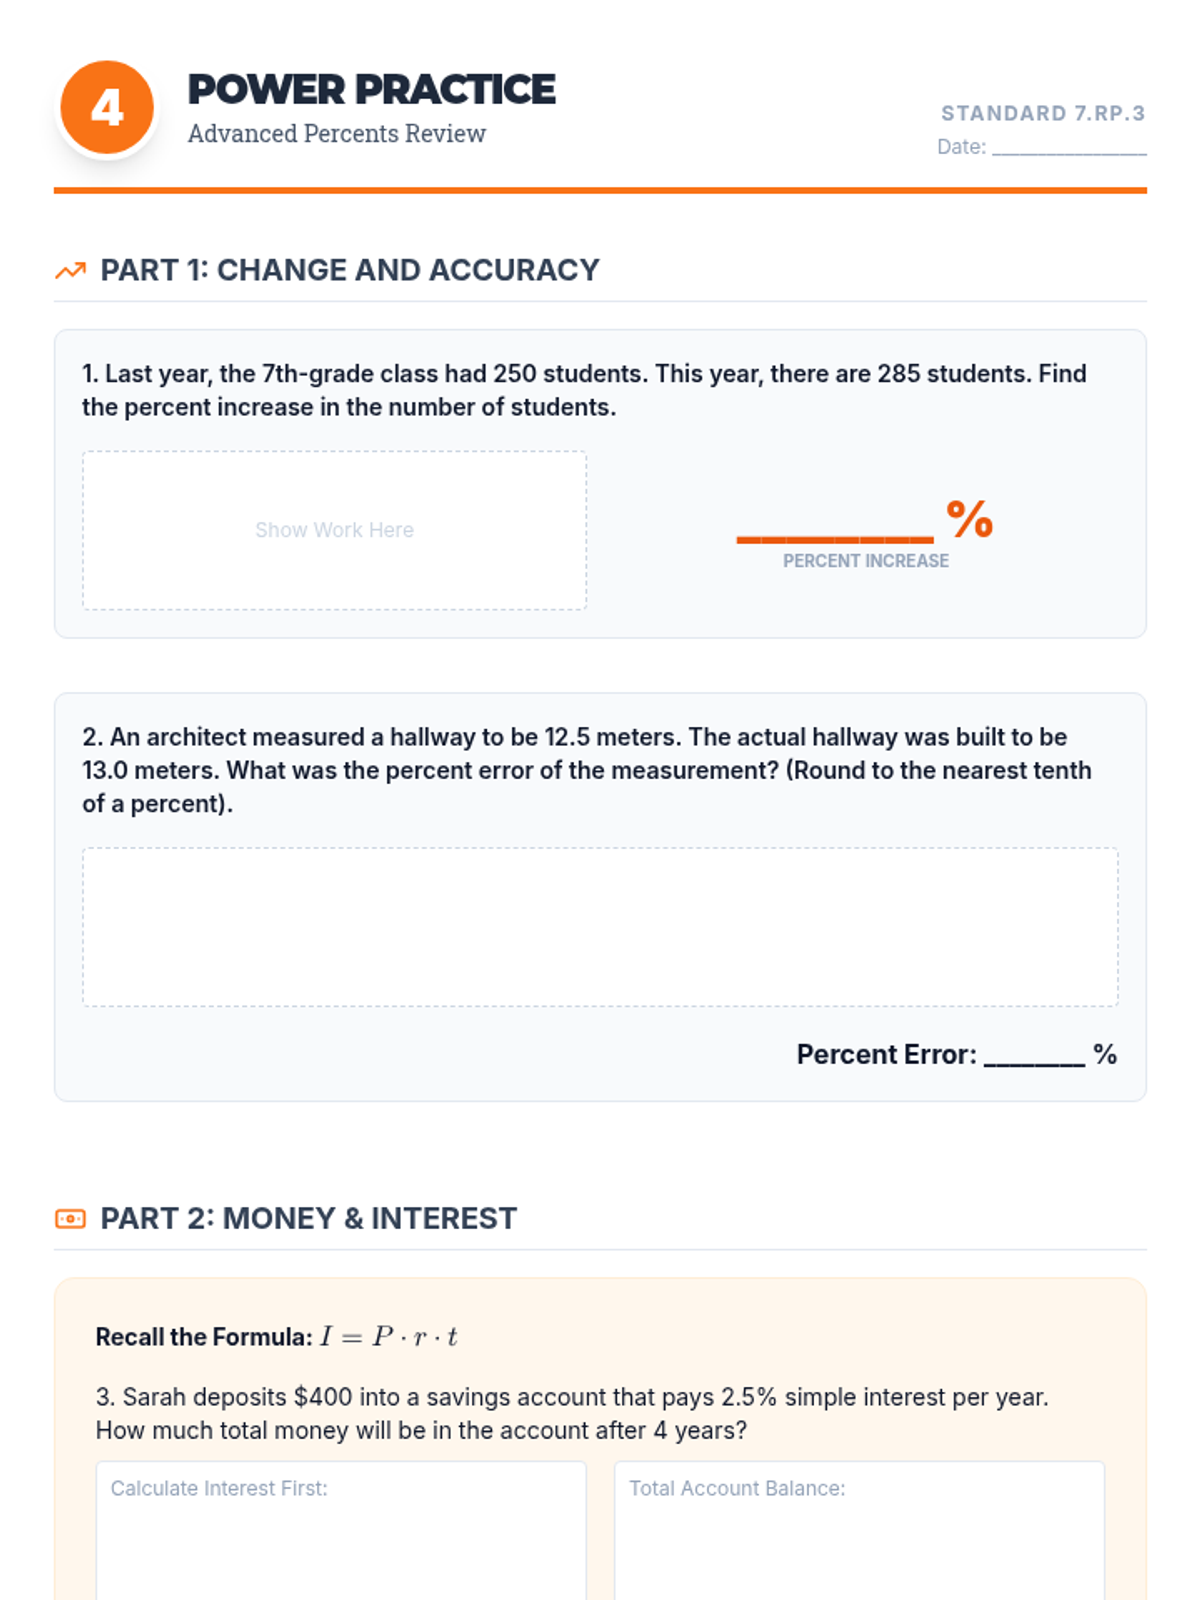
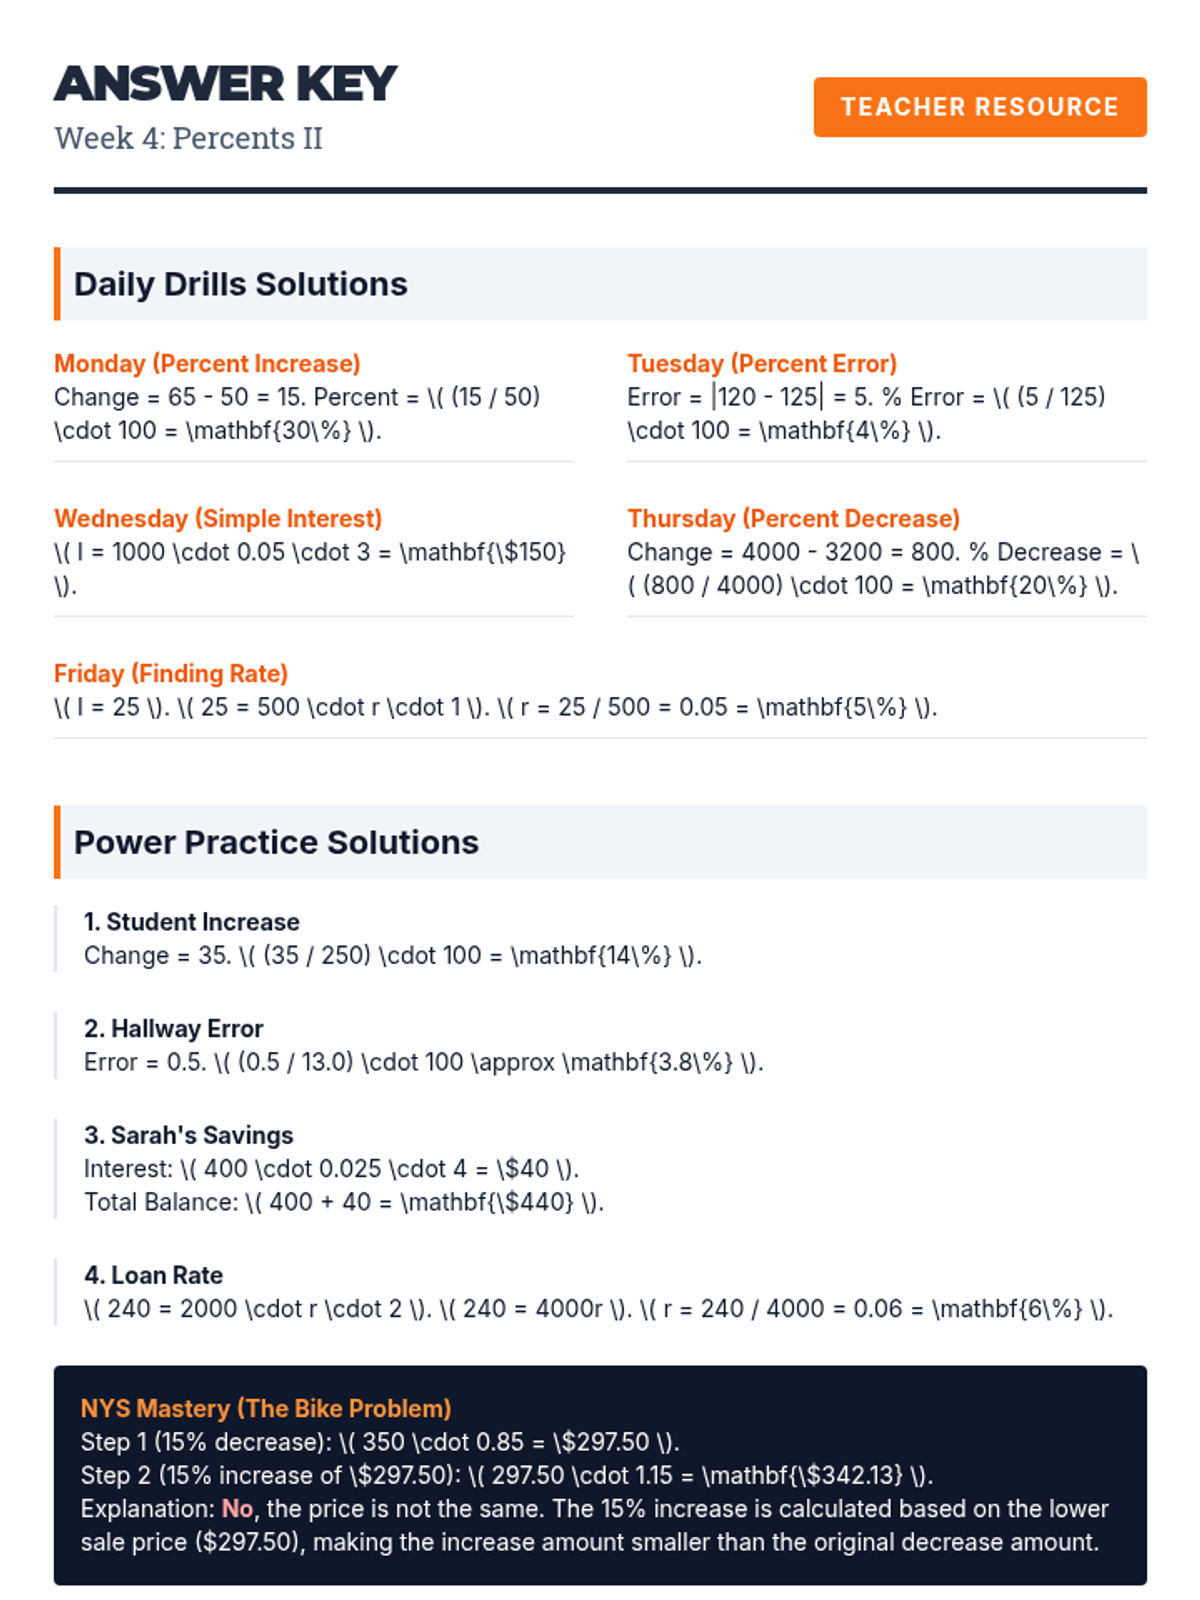
Advanced percent problems including simple interest, percent change (increase/decrease), and percent error.
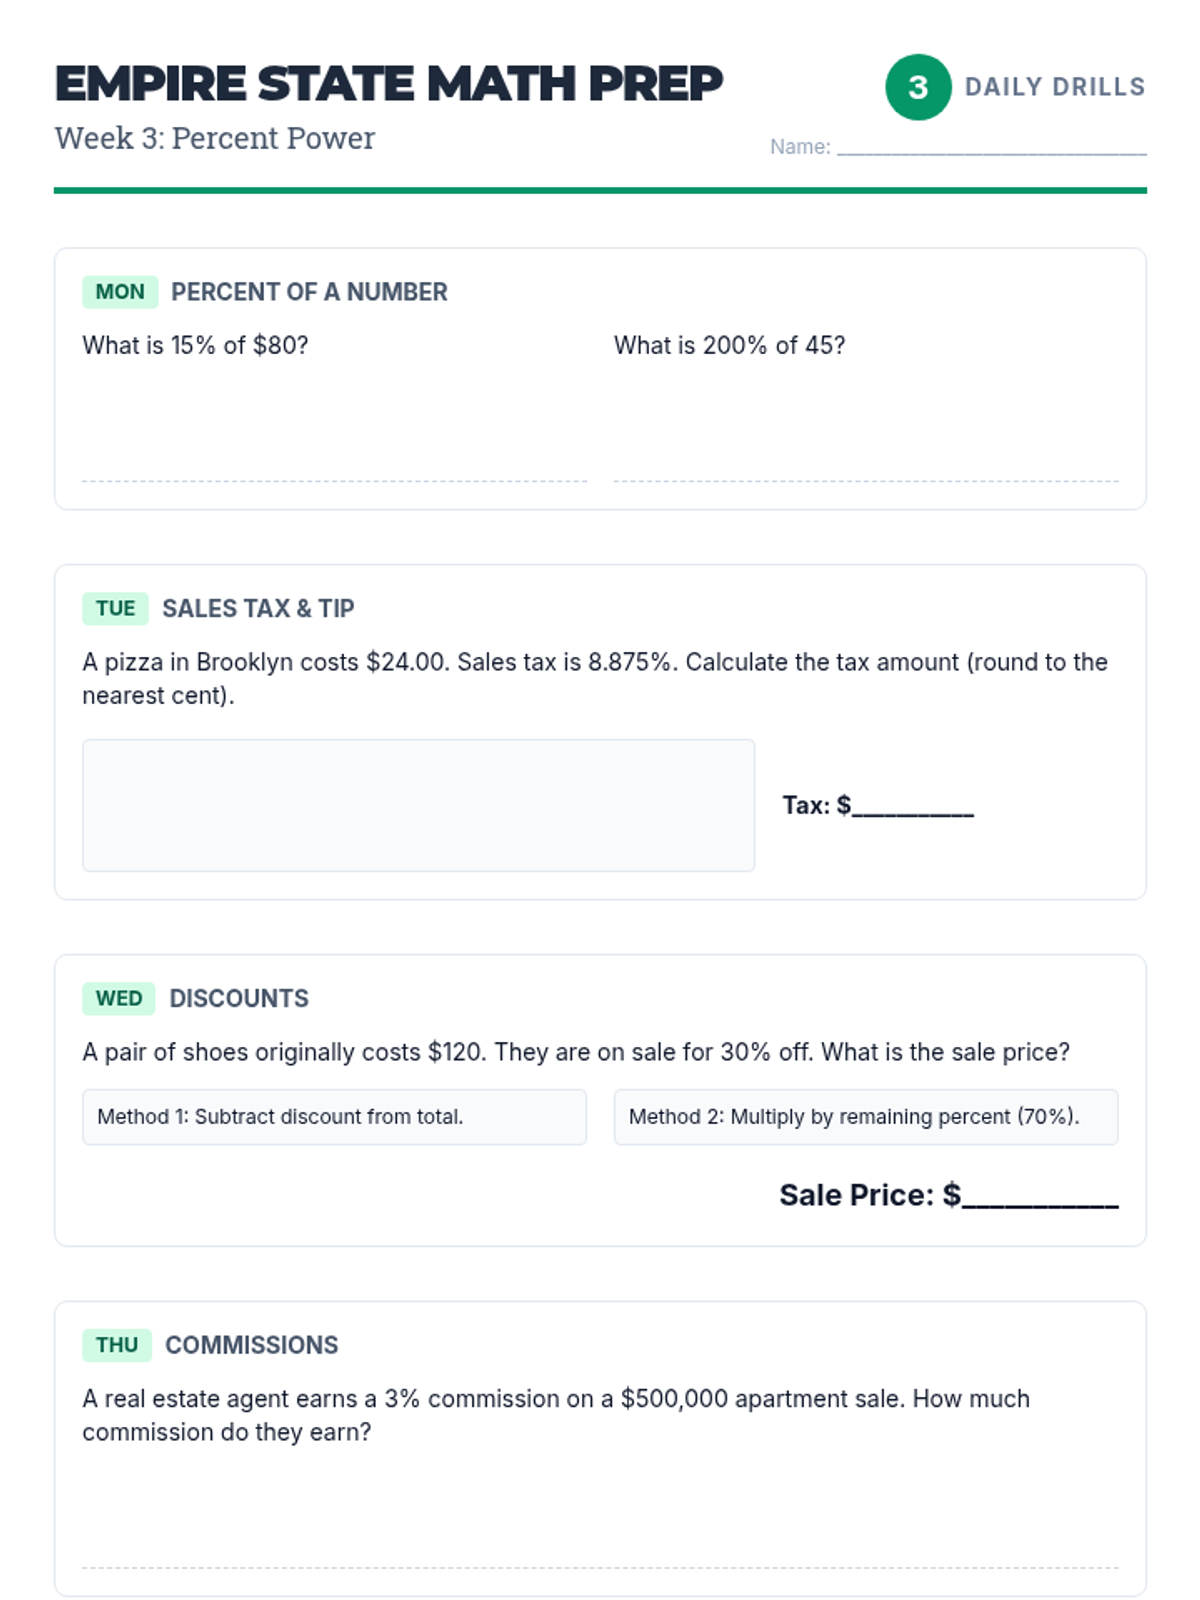
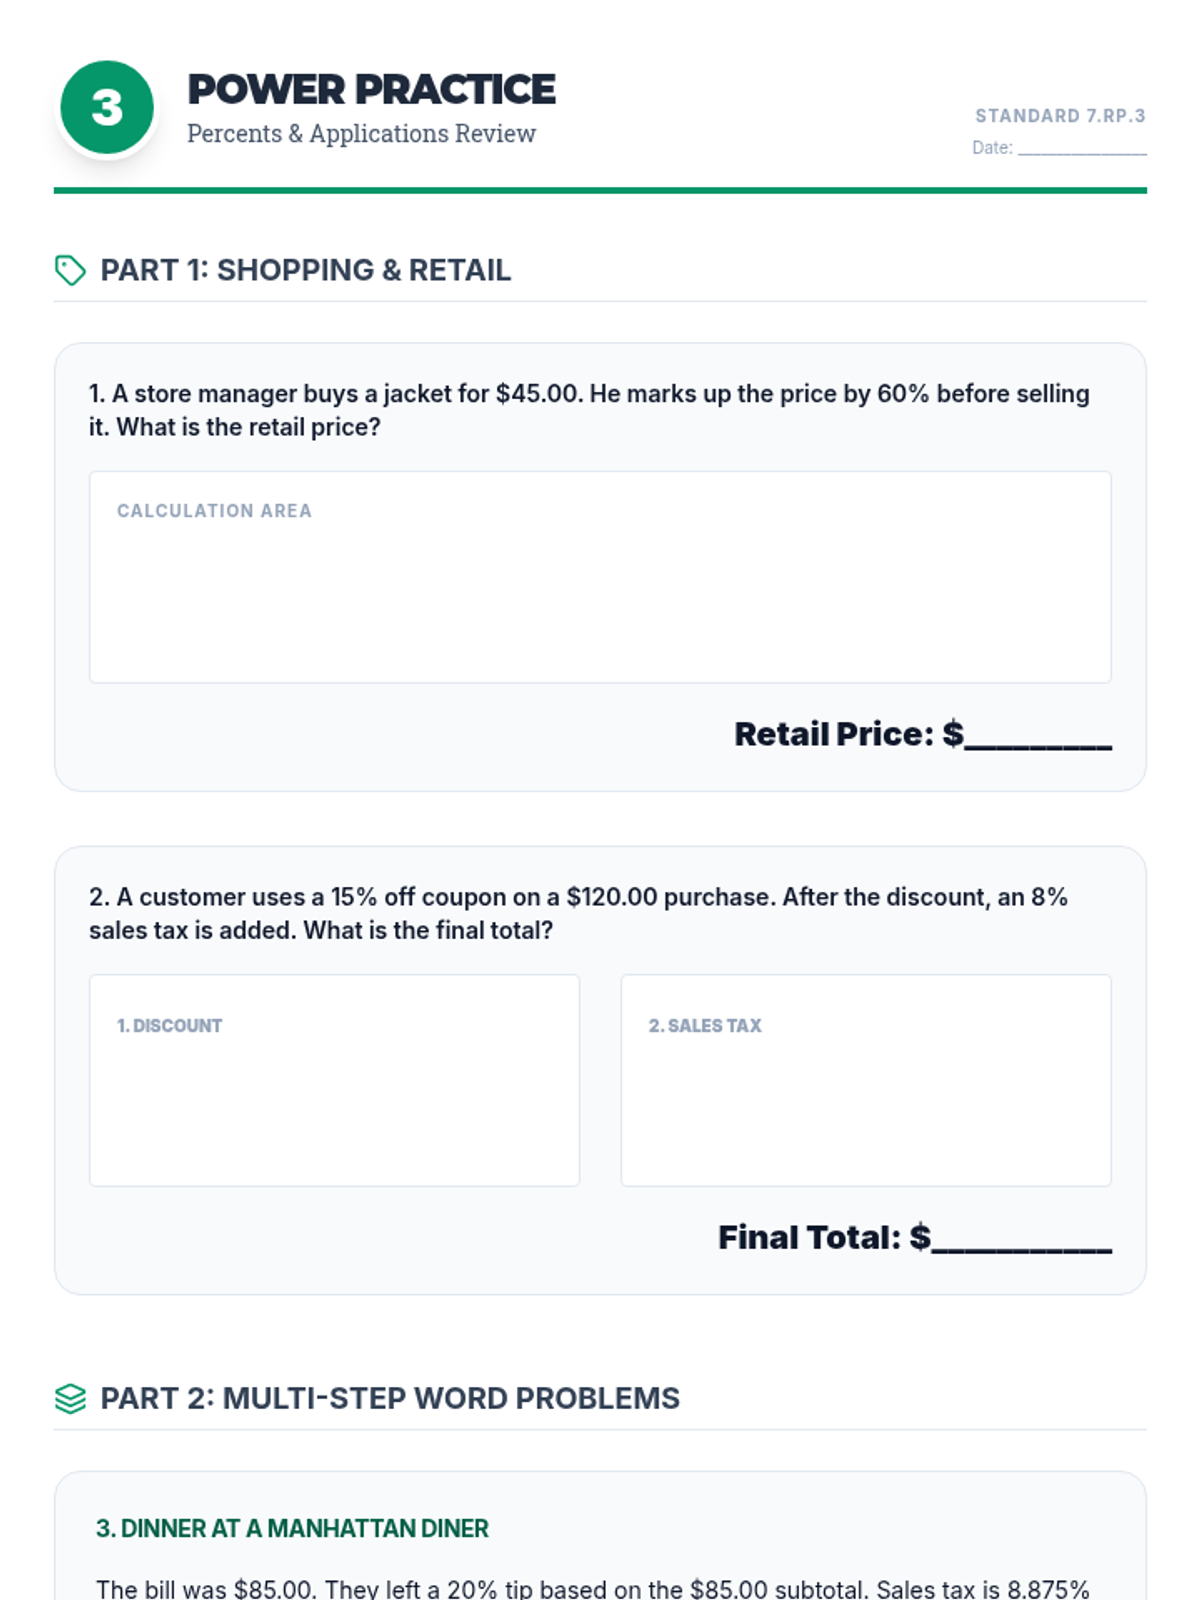
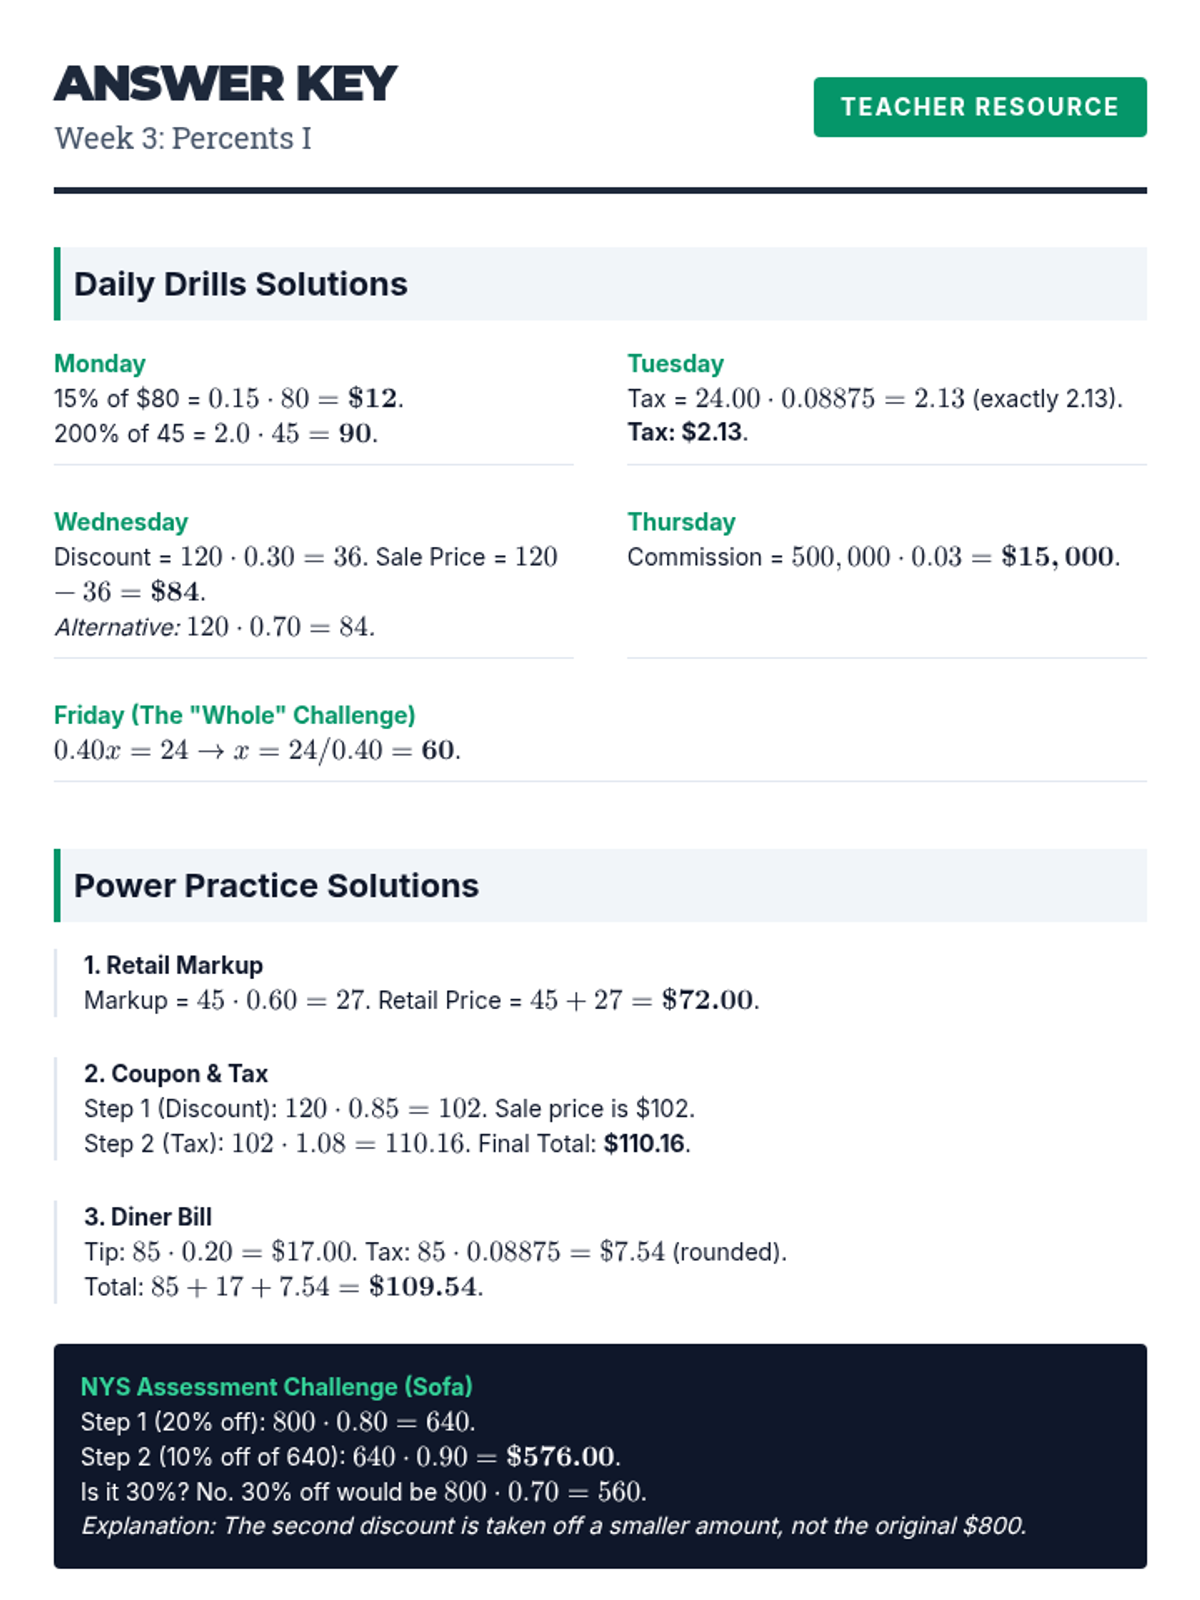
Practical applications of percents, including calculating tax, tip, commissions, discounts, and markups.
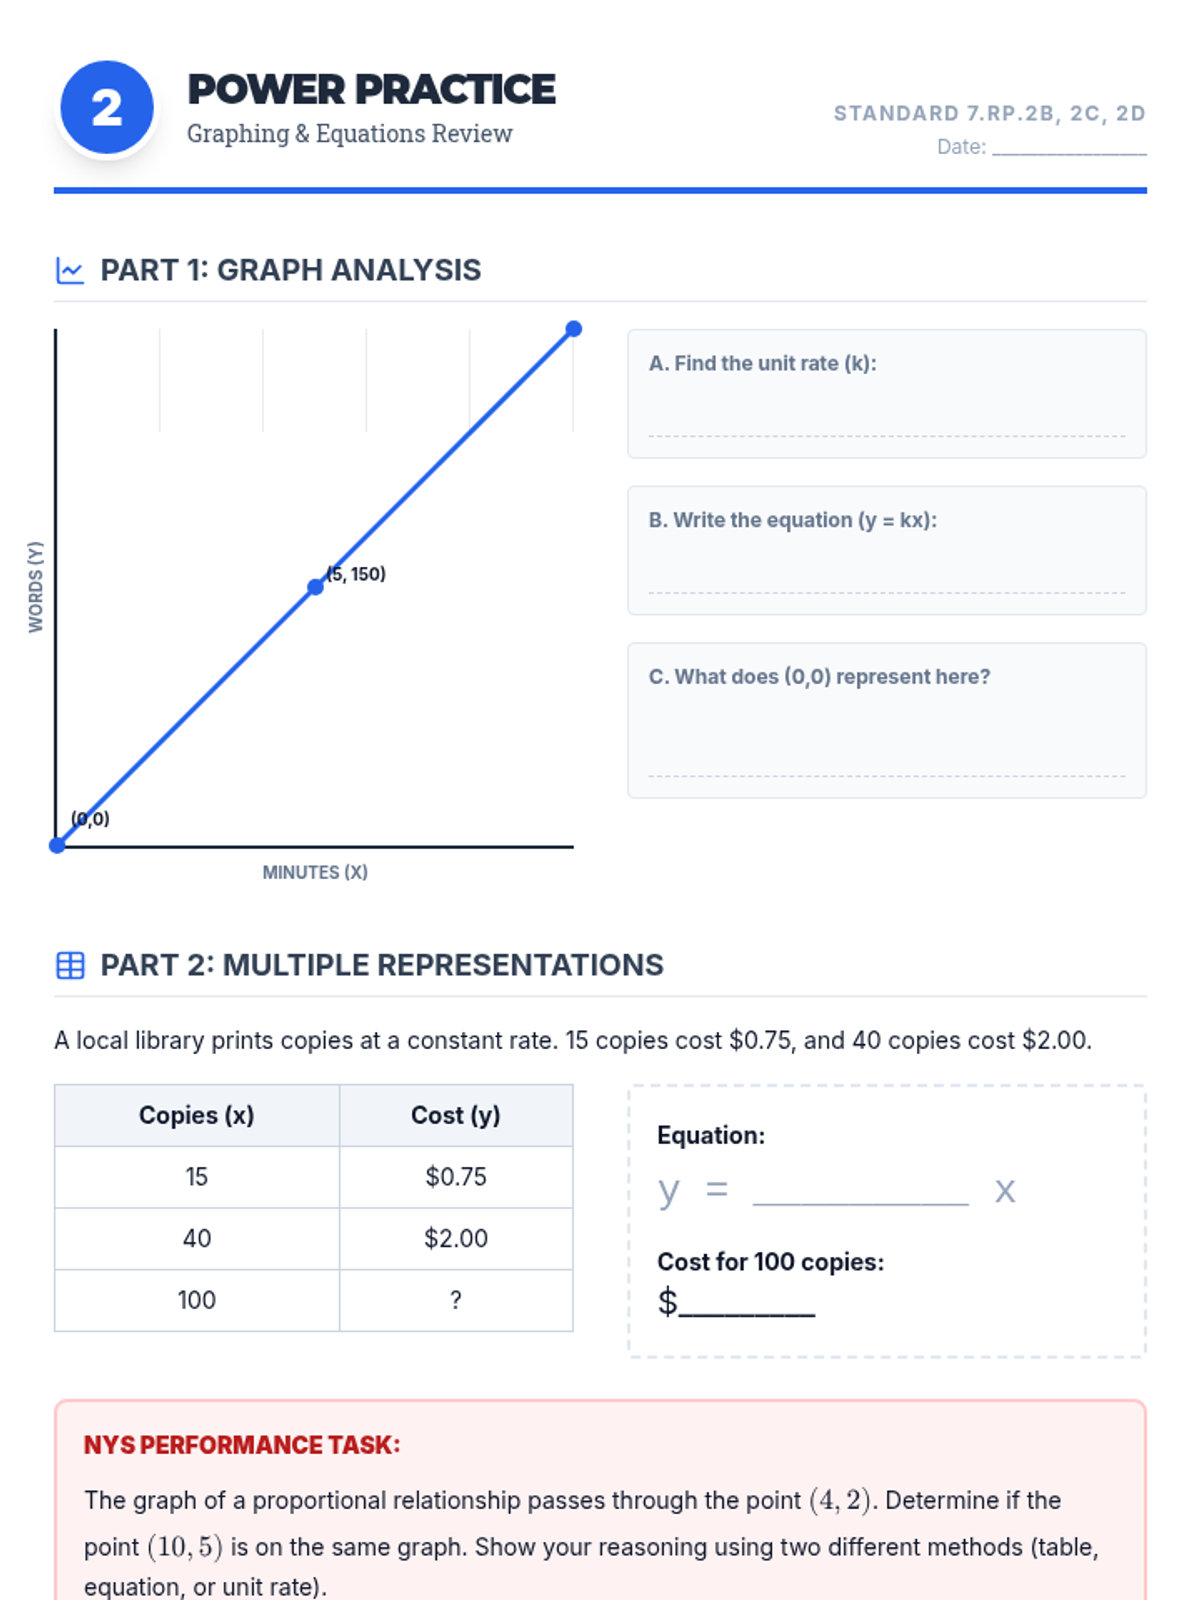
Analyzing graphs of proportional relationships, finding the constant of proportionality, and writing equations in the form y = kx.
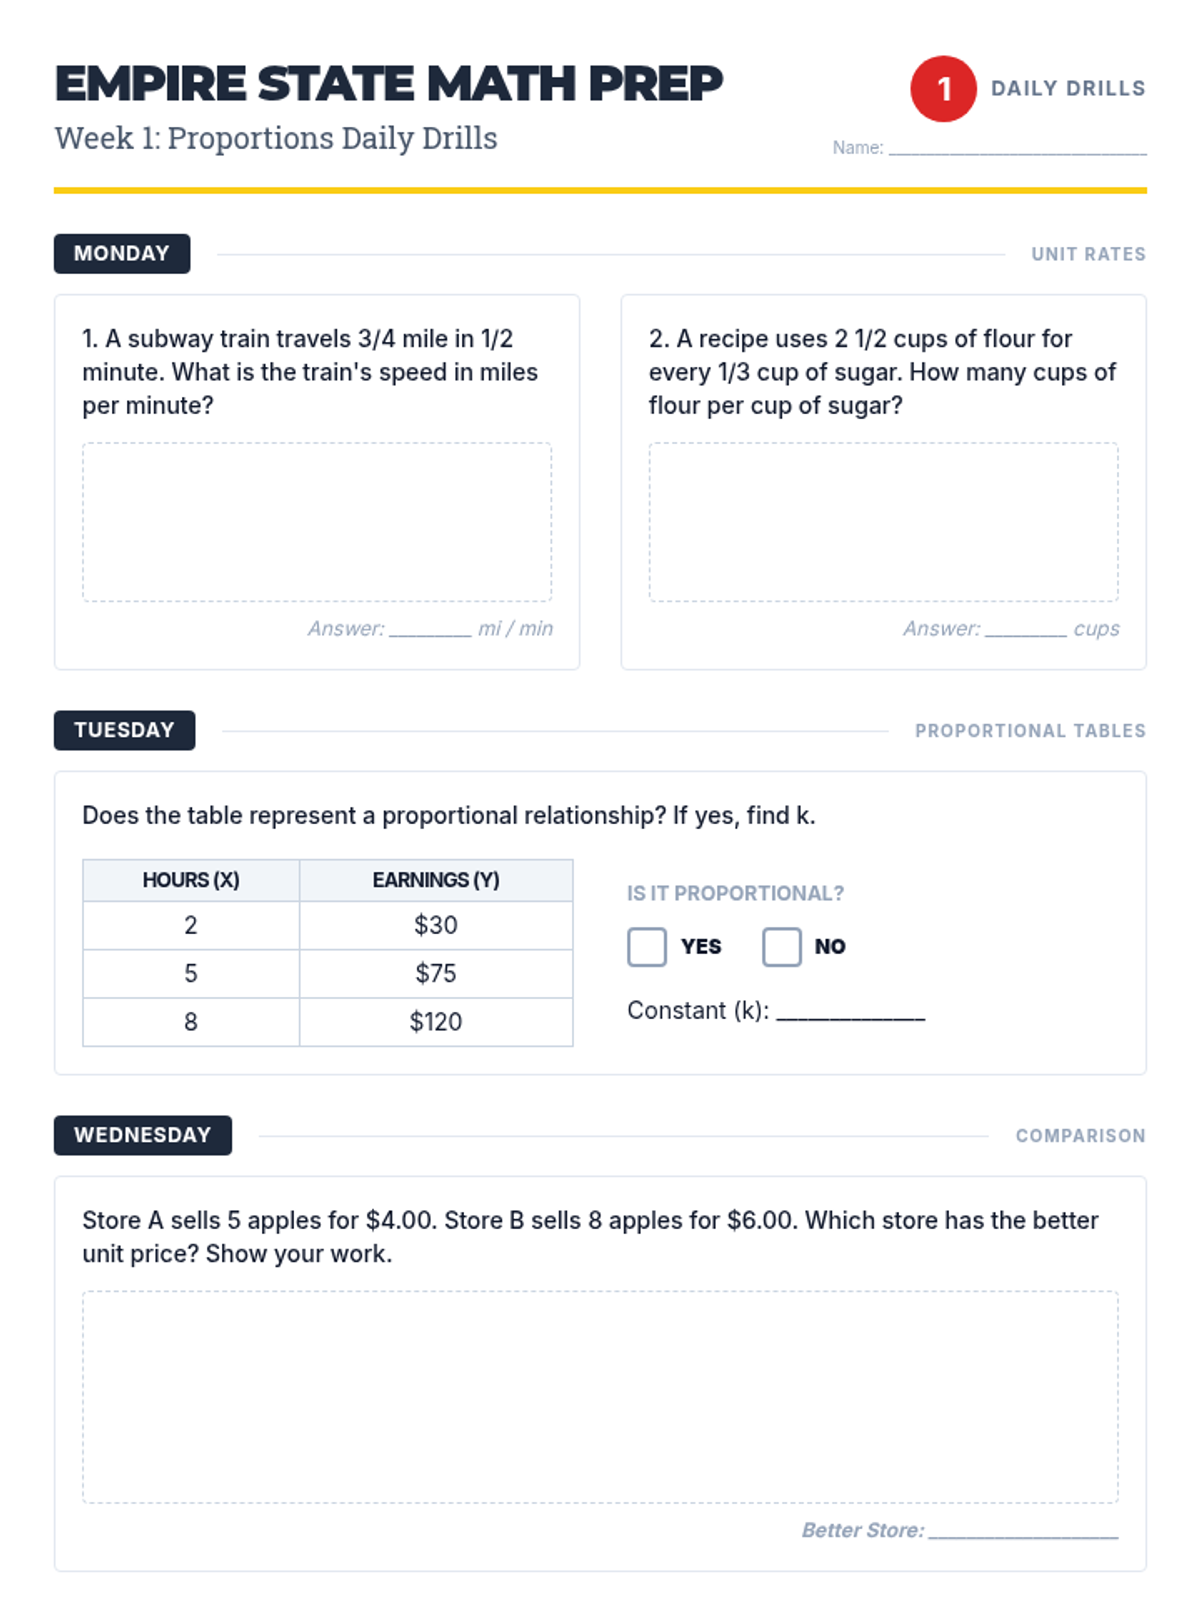
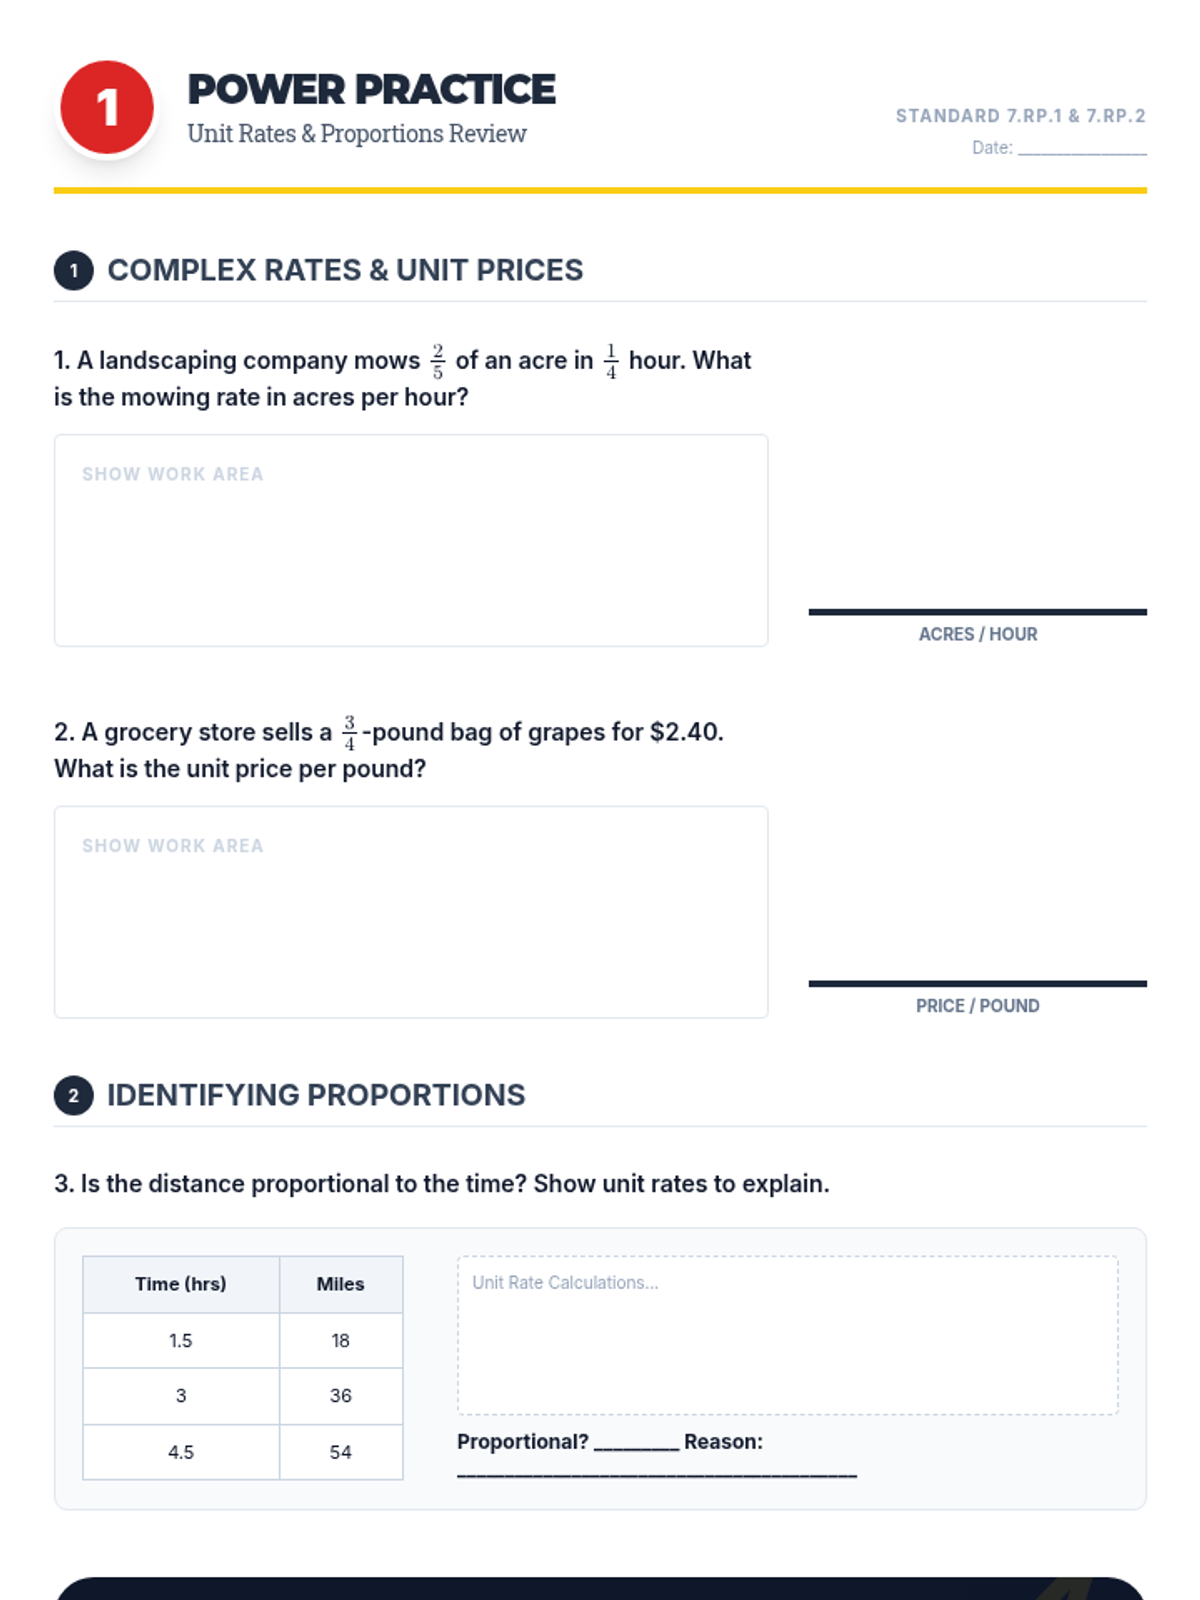
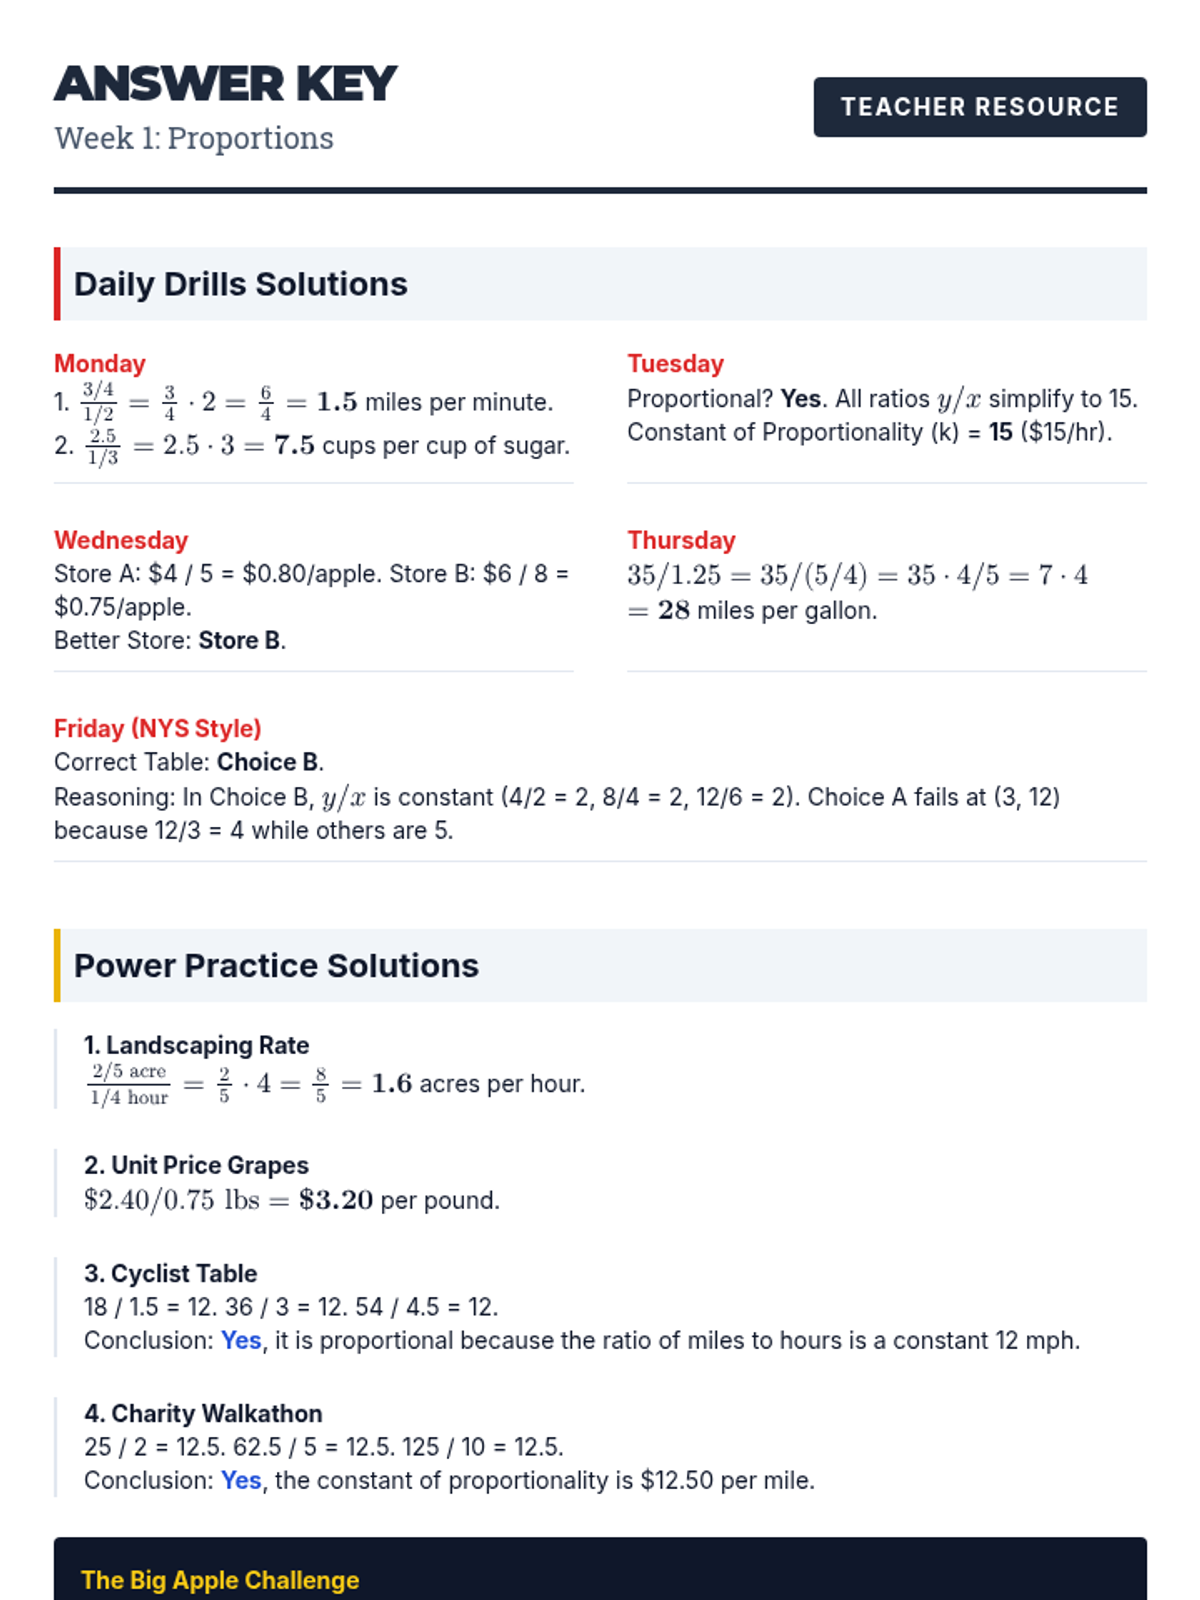
Review of ratios, unit rates with fractions, and identifying proportional relationships in tables and context.
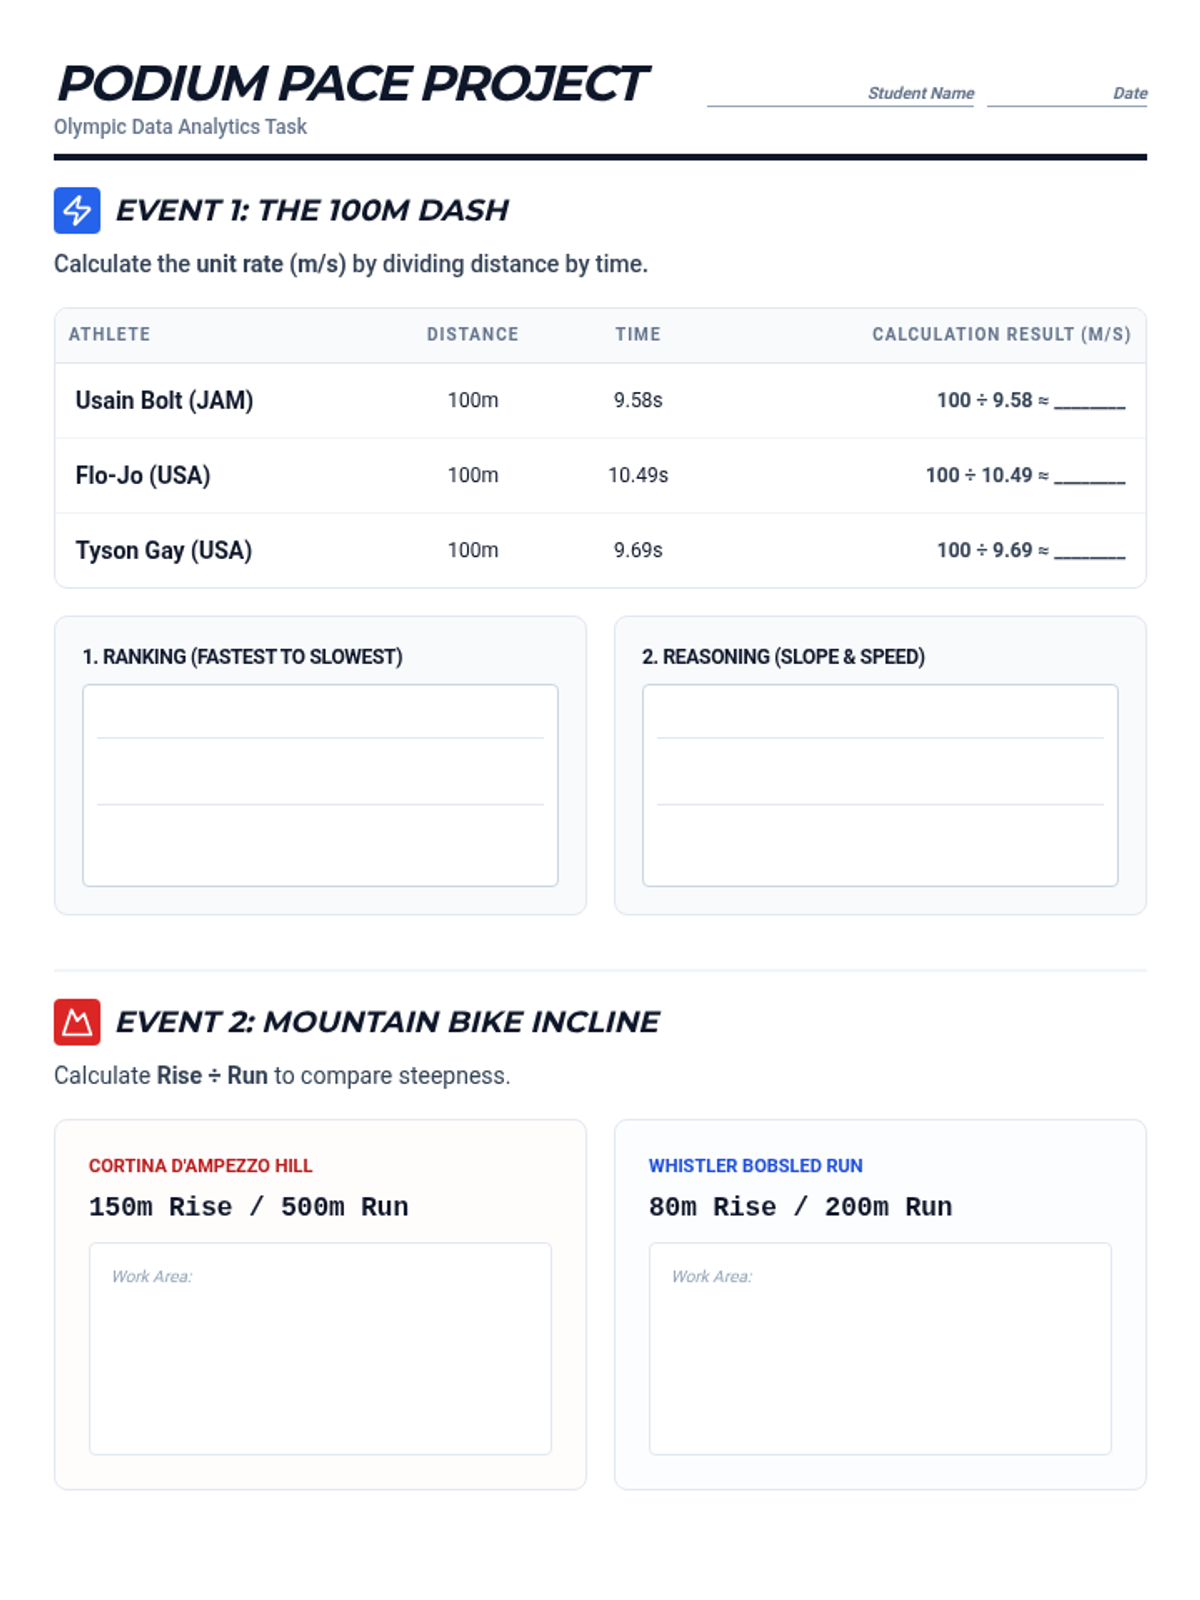
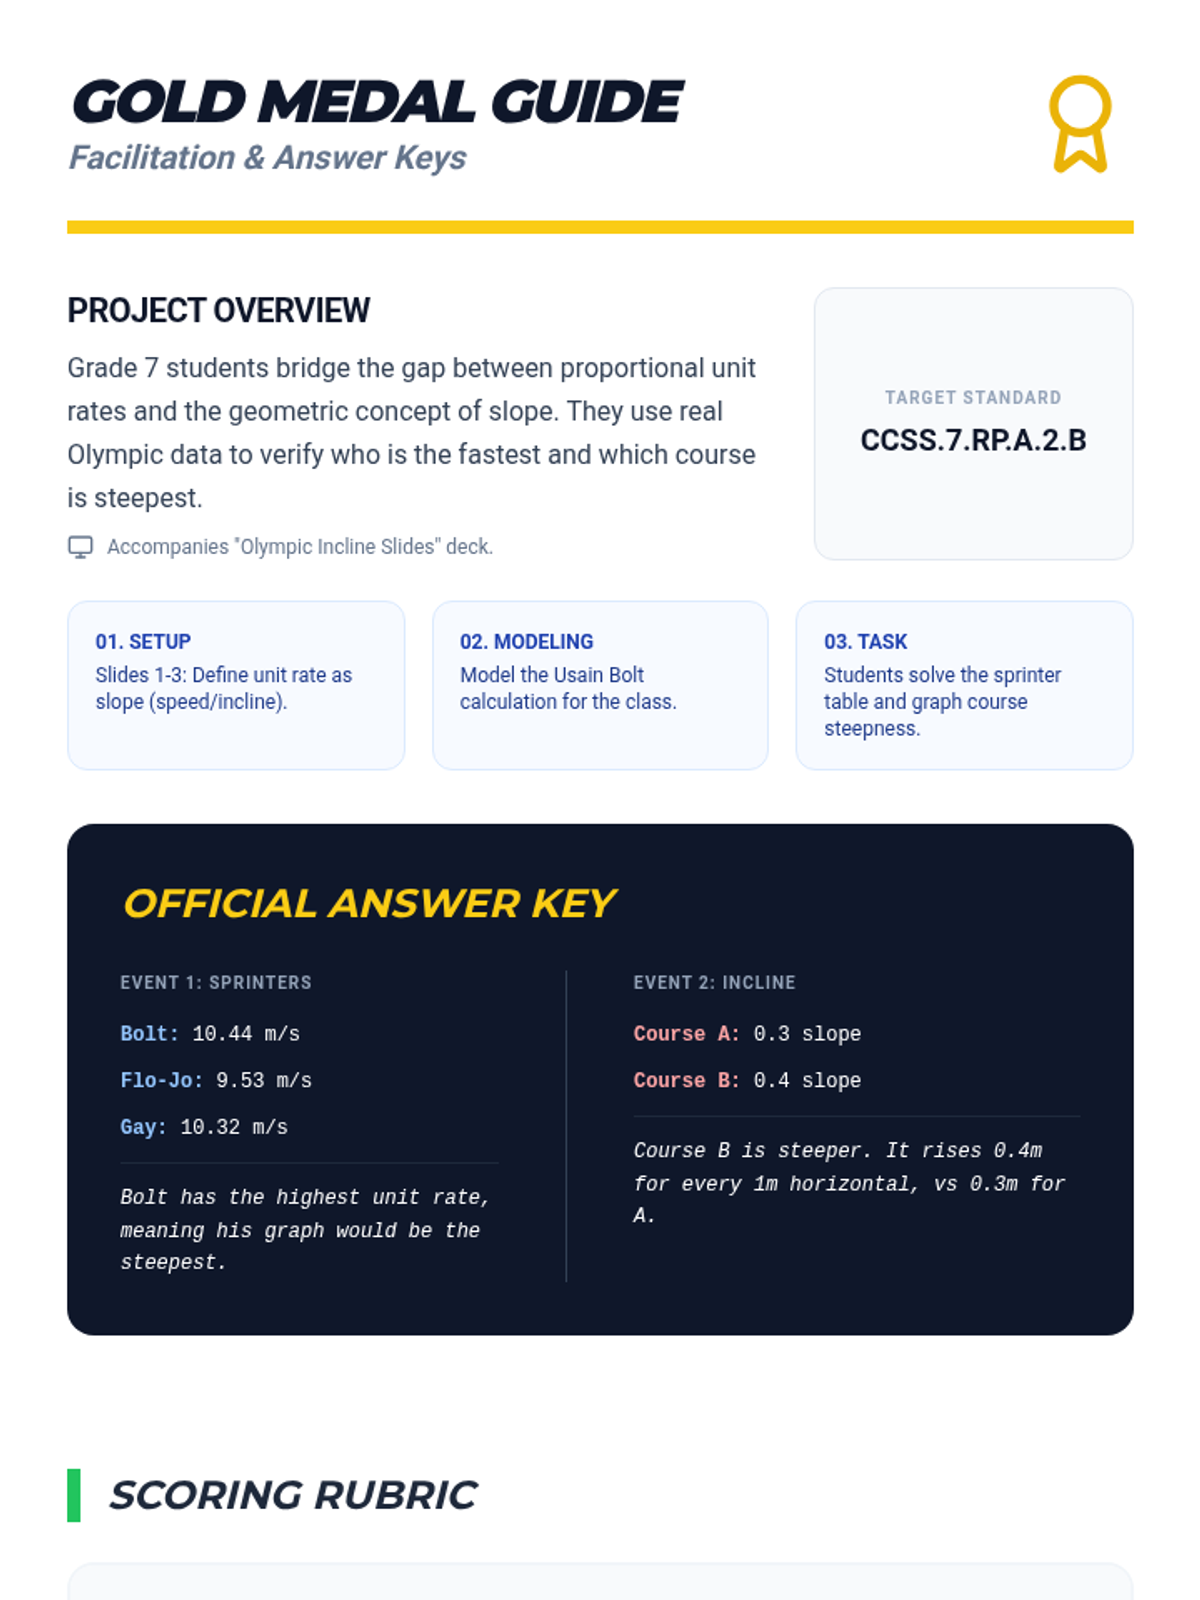
A math project where students analyze Olympic athlete performance and track difficulty using unit rates and slope concepts to determine who is the fastest and which courses are the steepest.