A 7th-grade geometry lesson focusing on the distinction between surface area and volume through hands-on construction of triangular prisms and video-based conceptual learning.
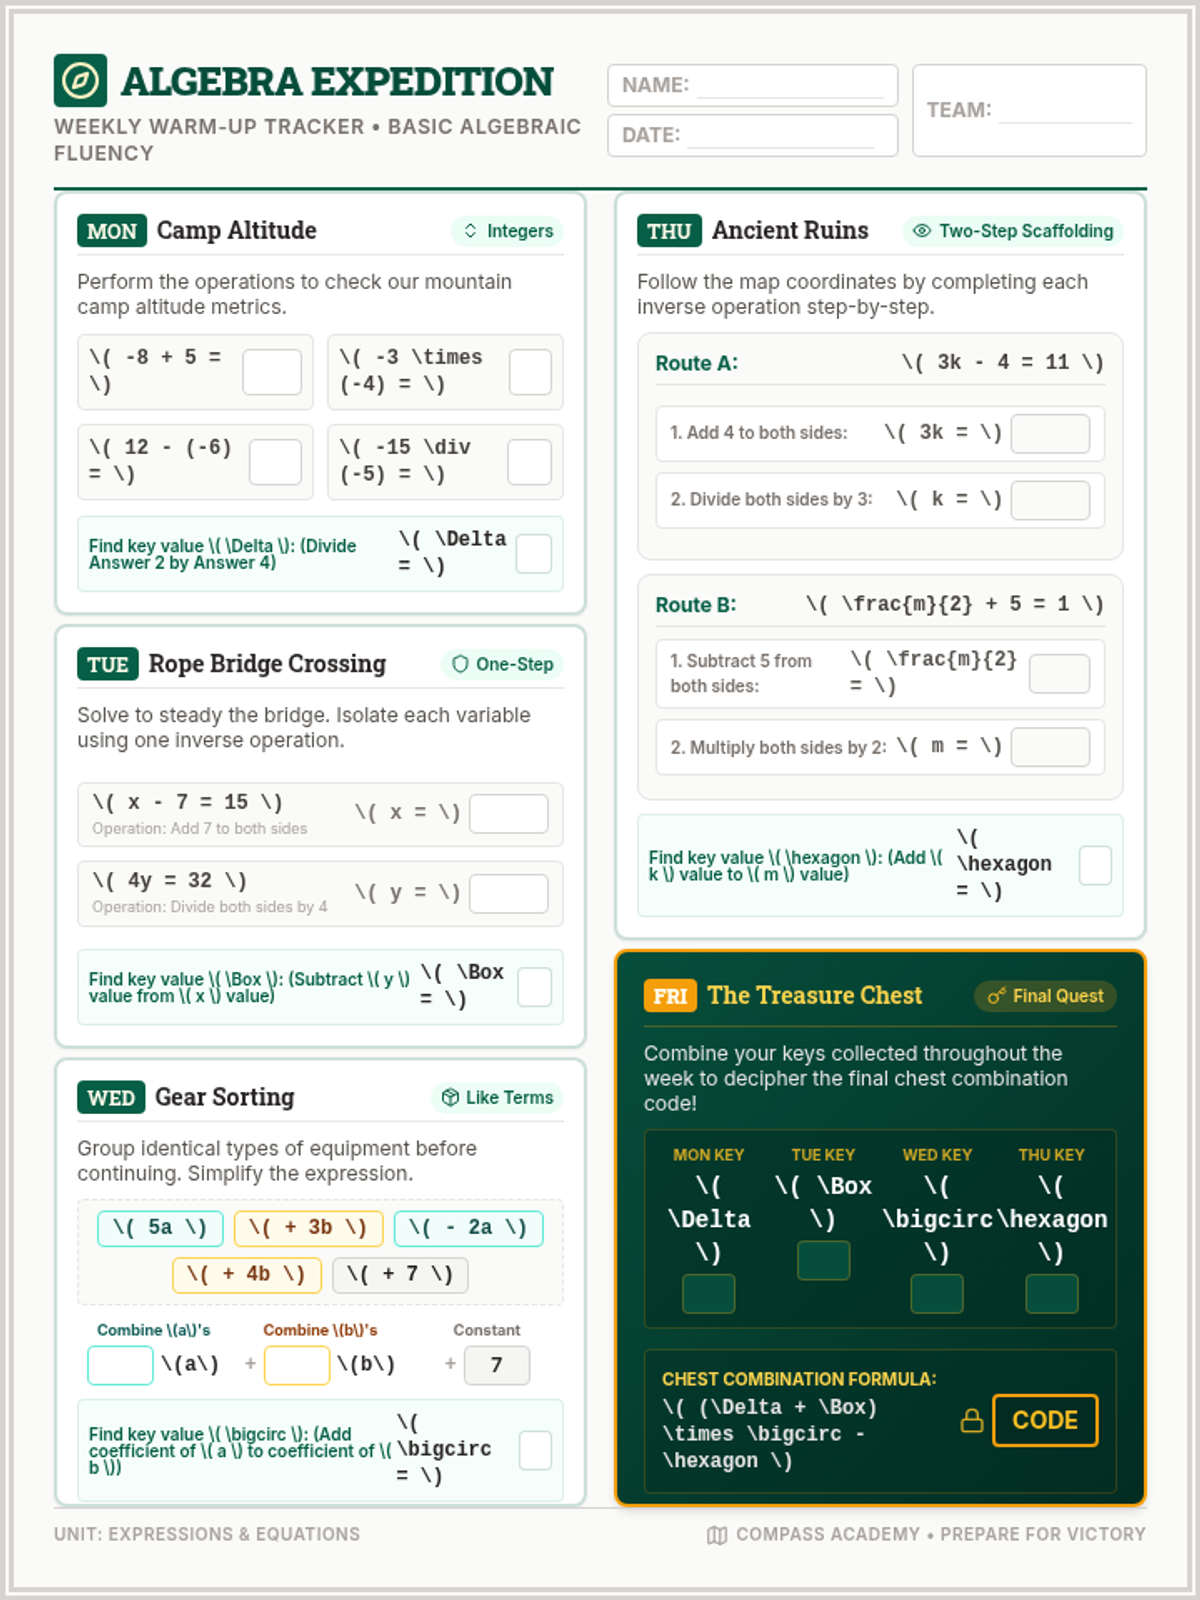
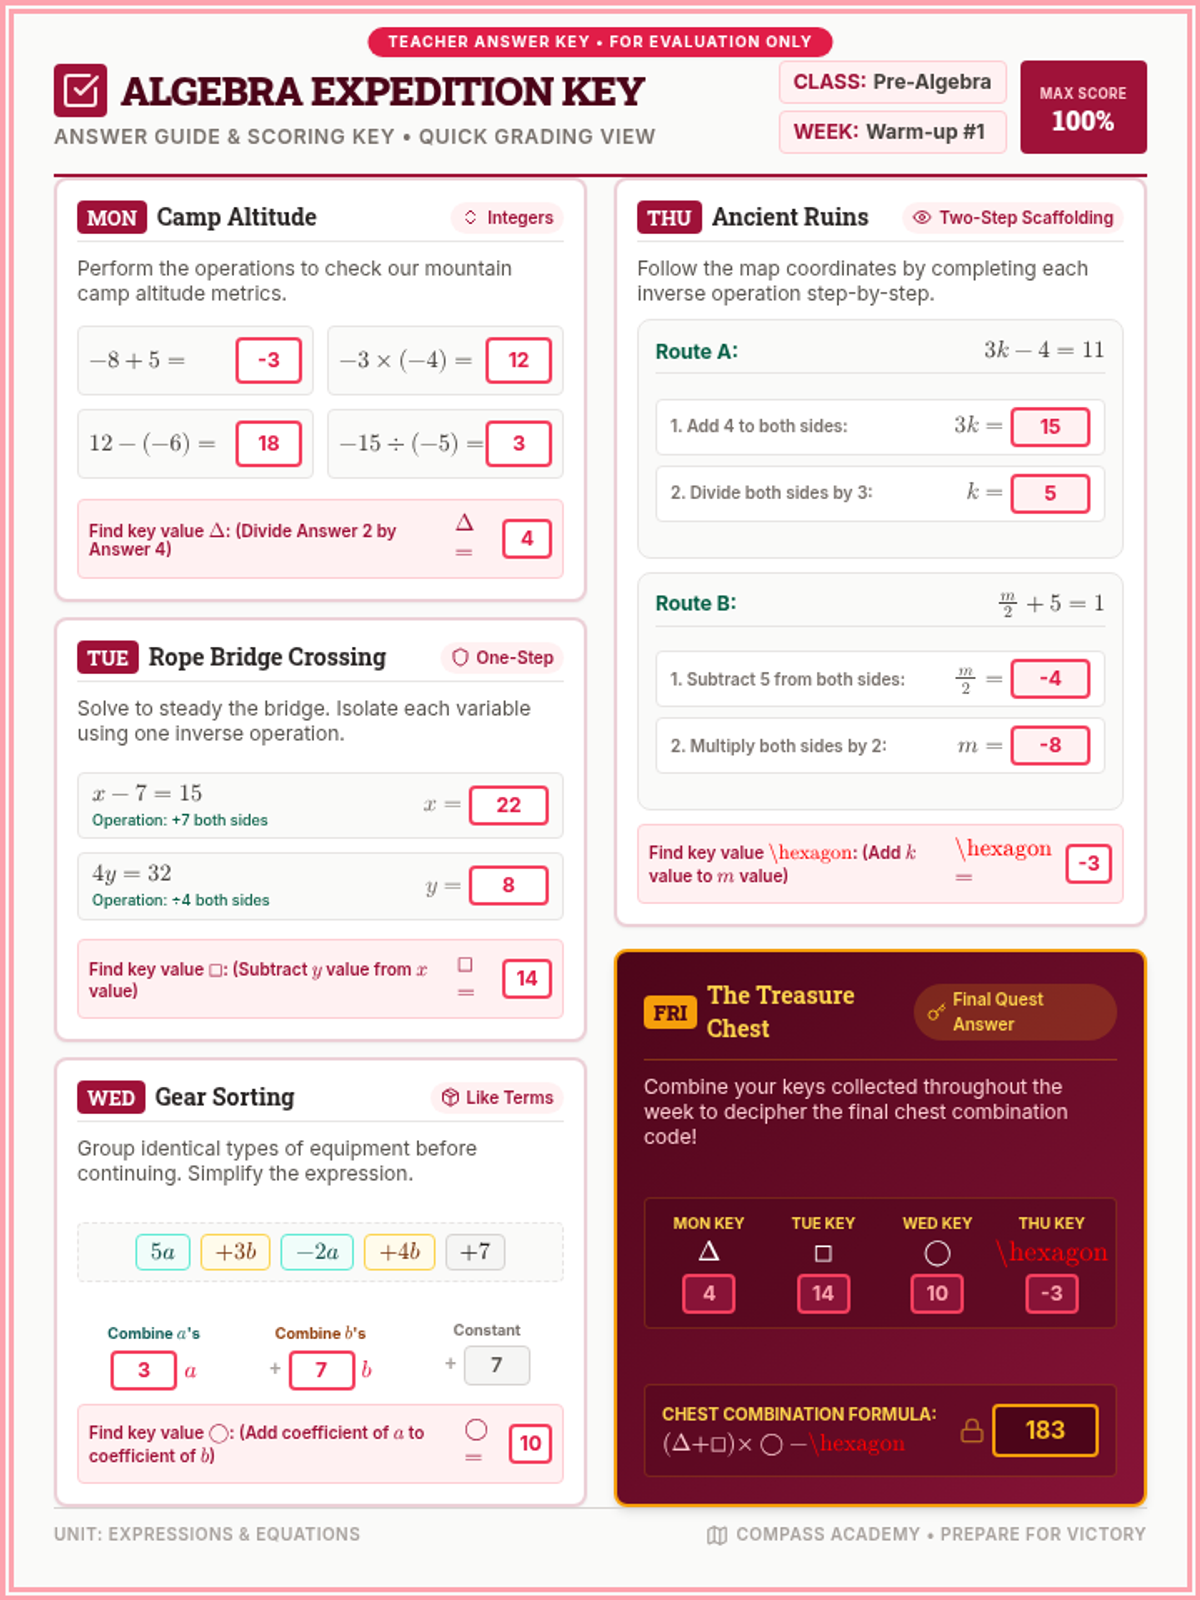
A collection of daily warm-up activities designed to build algebraic fluency. Over five days, students tackle integer operations, one-step equations, combining like terms, and scaffolded two-step equations to prepare for algebraic mastery.
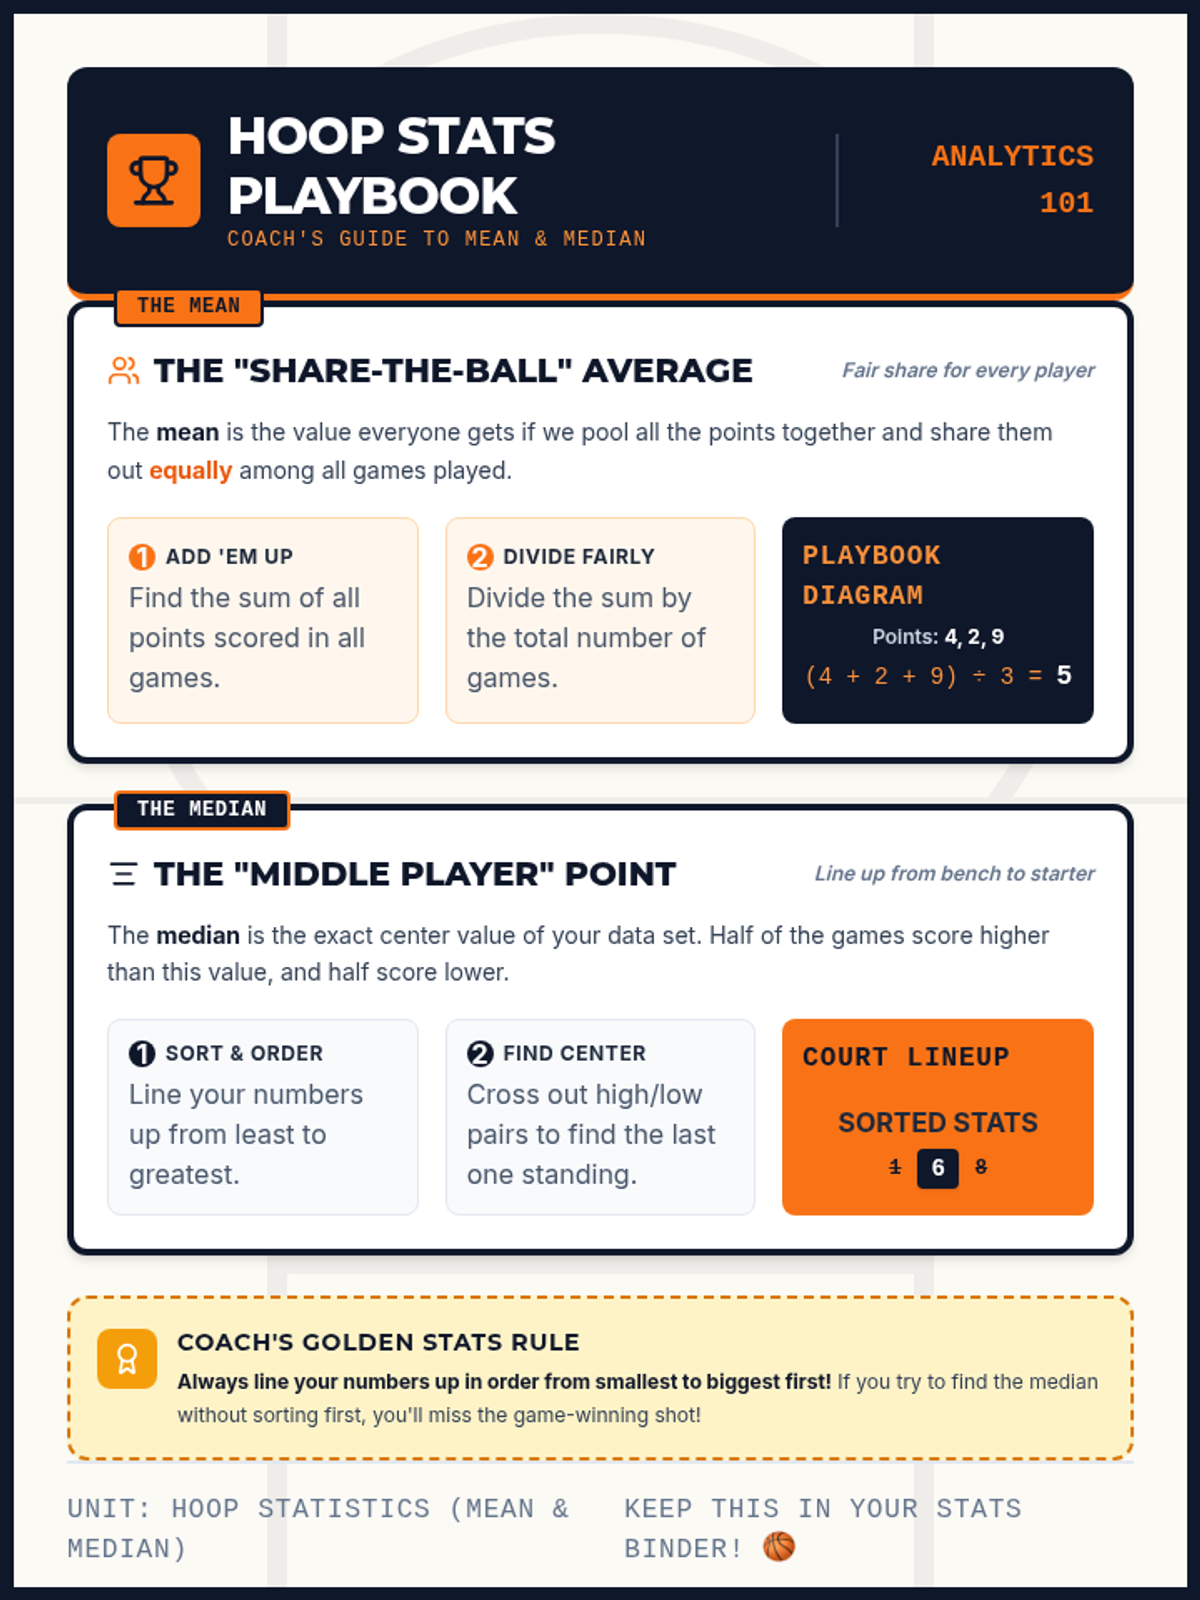
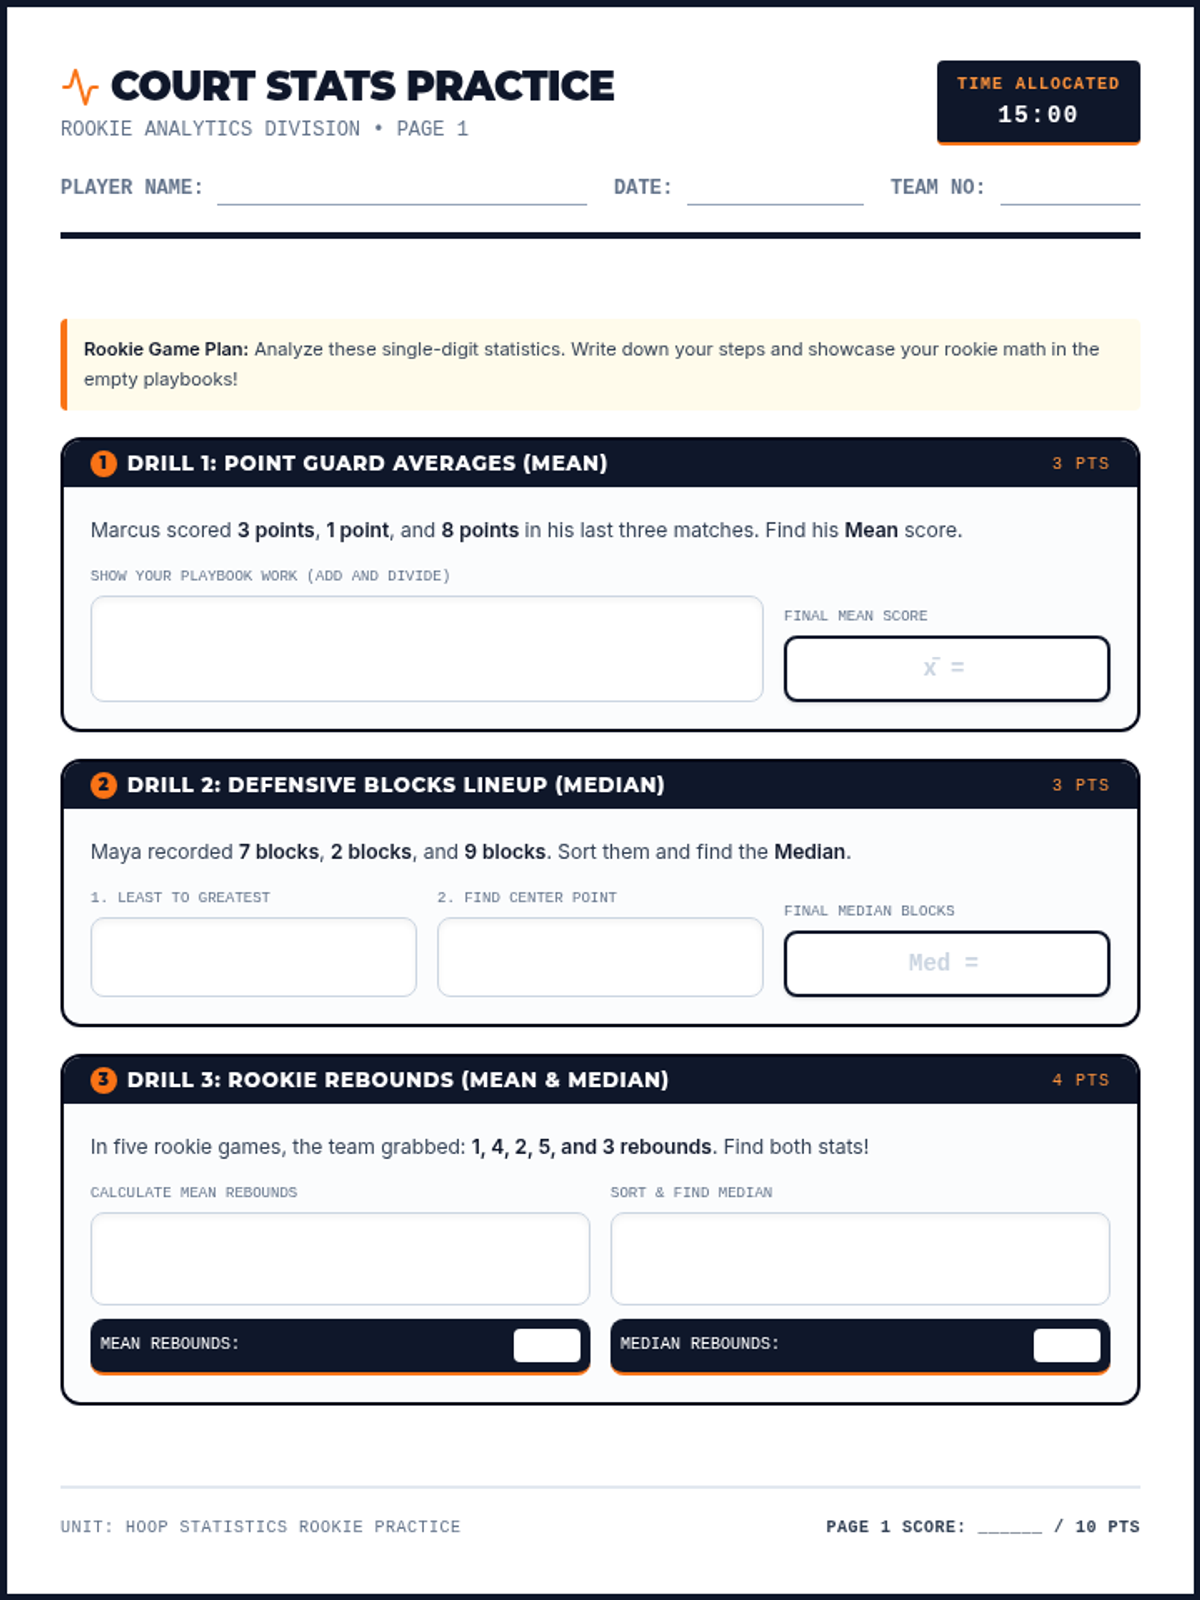
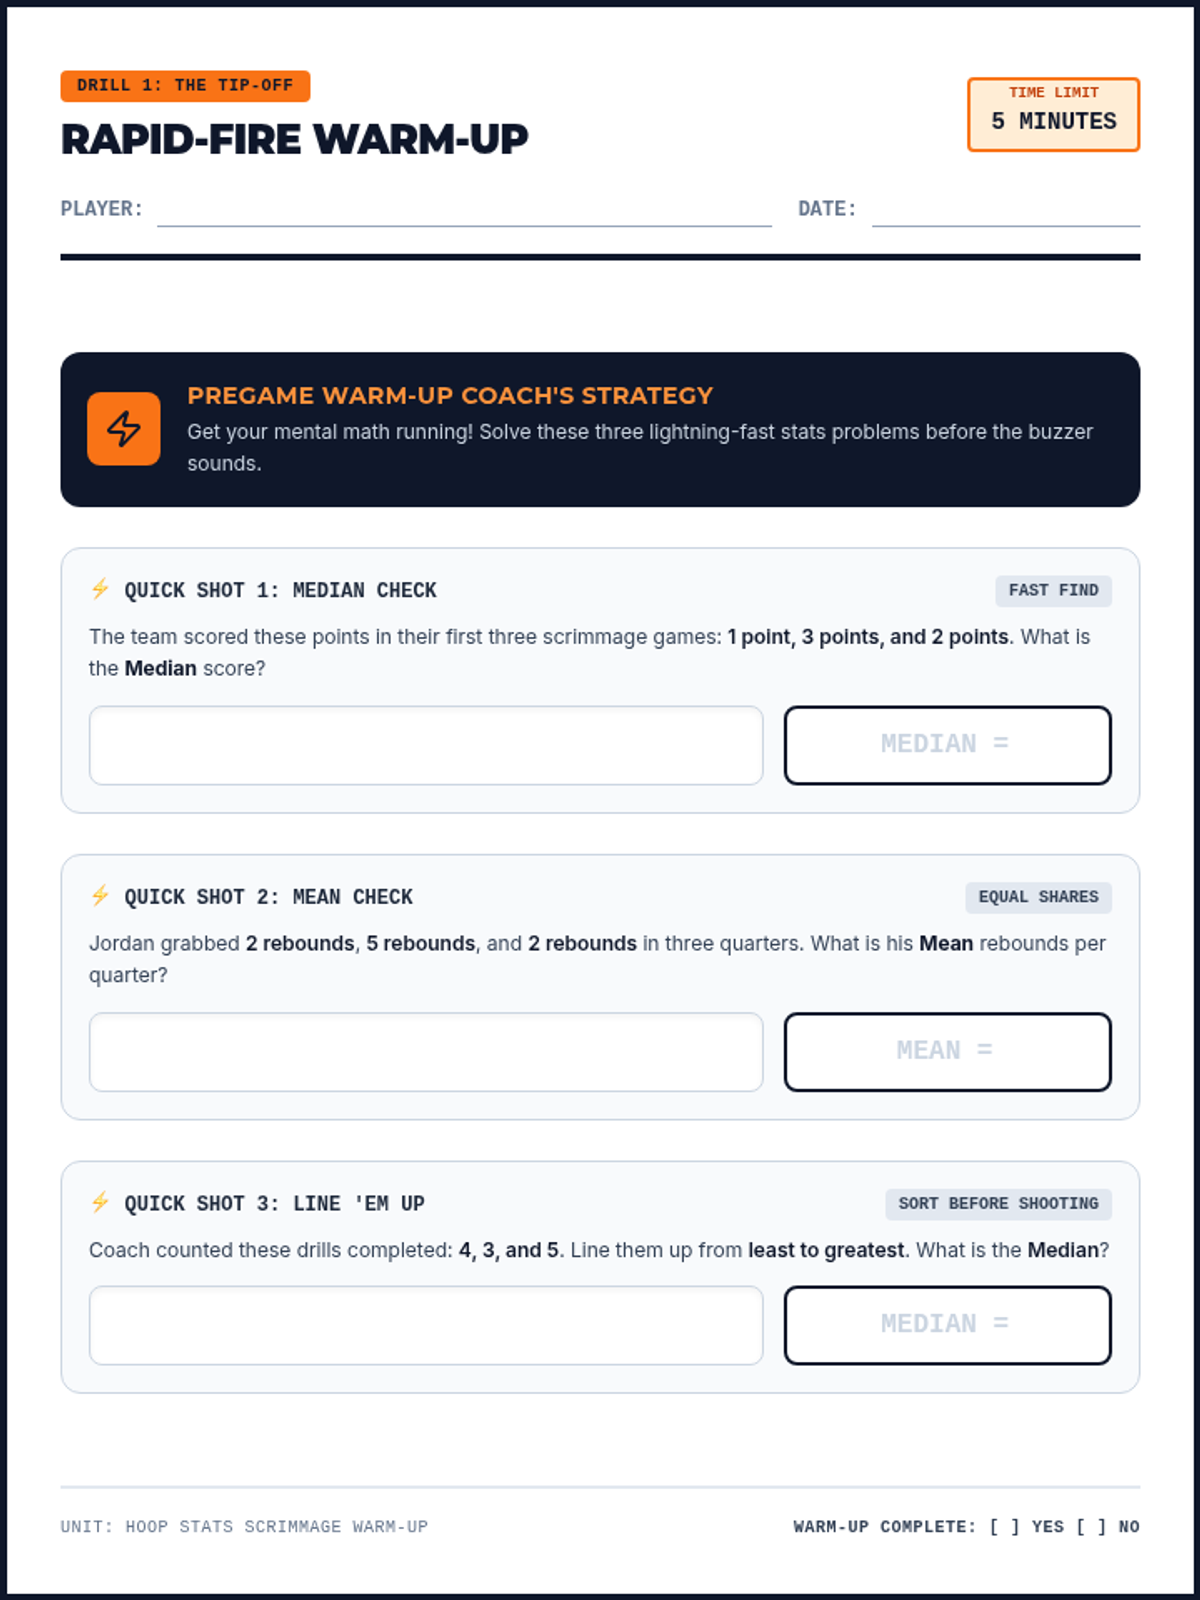
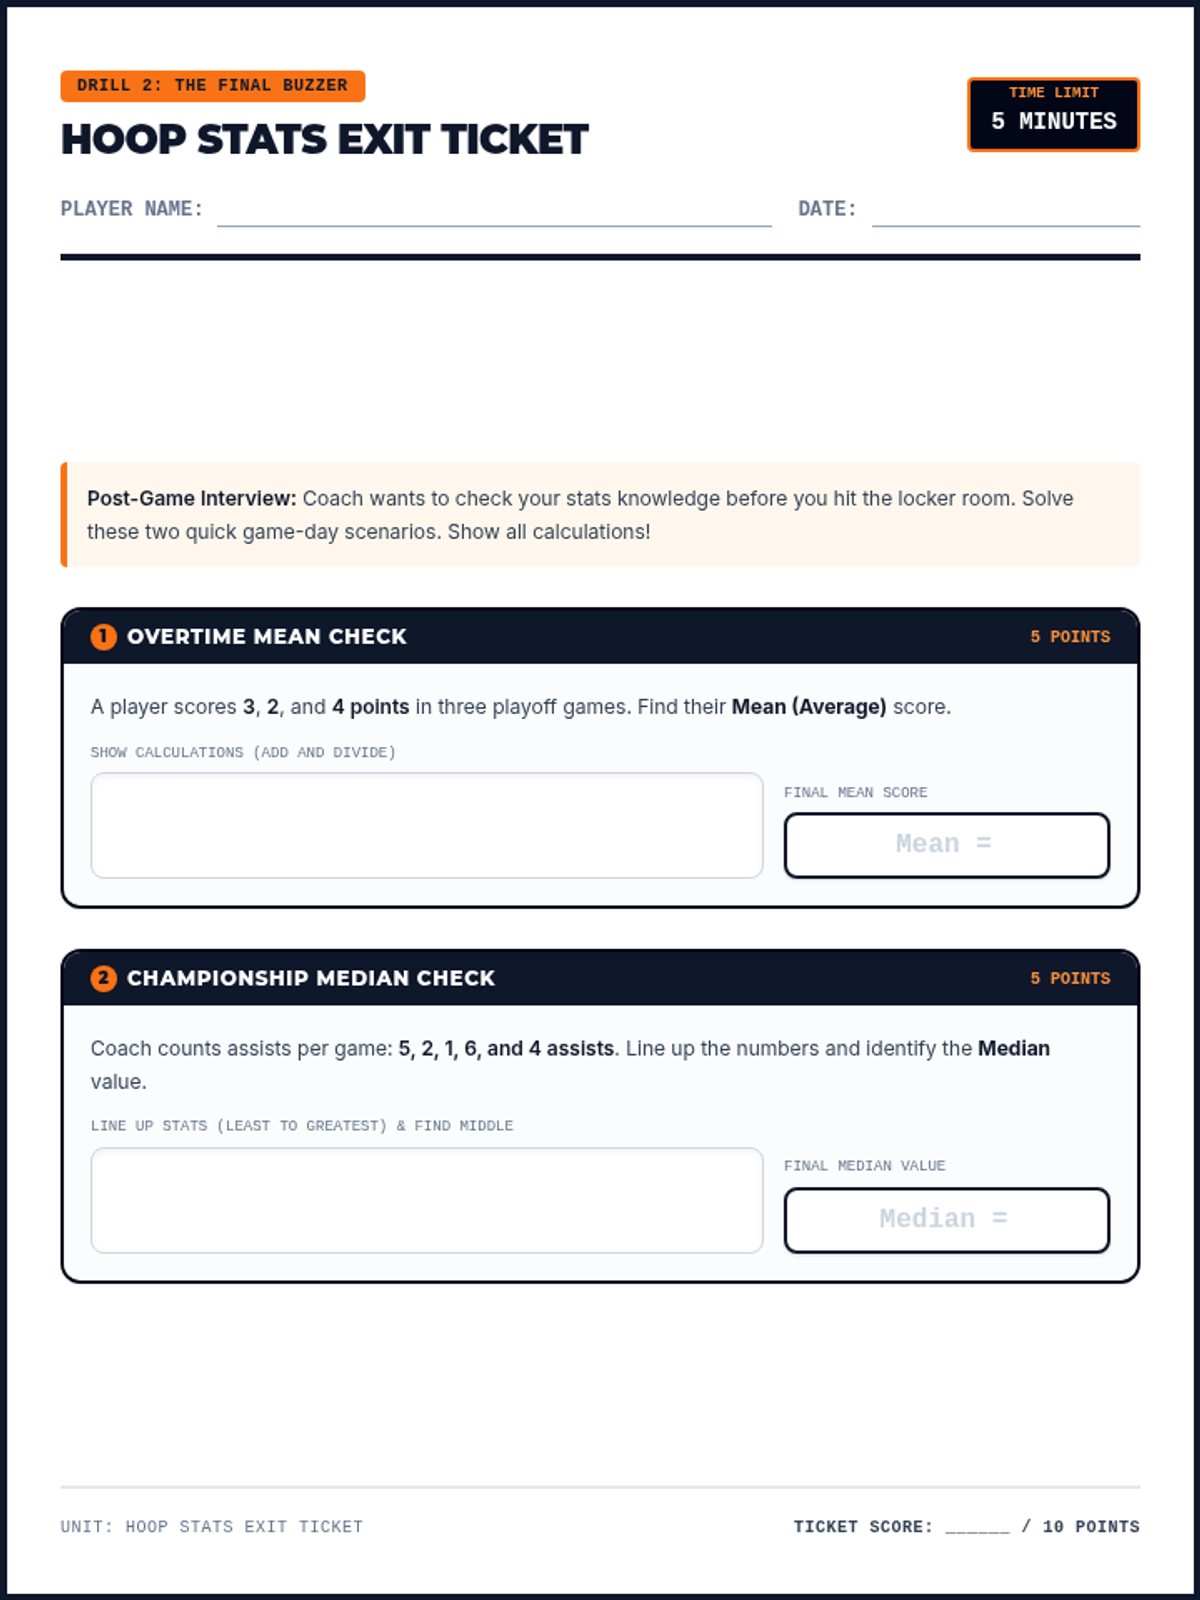
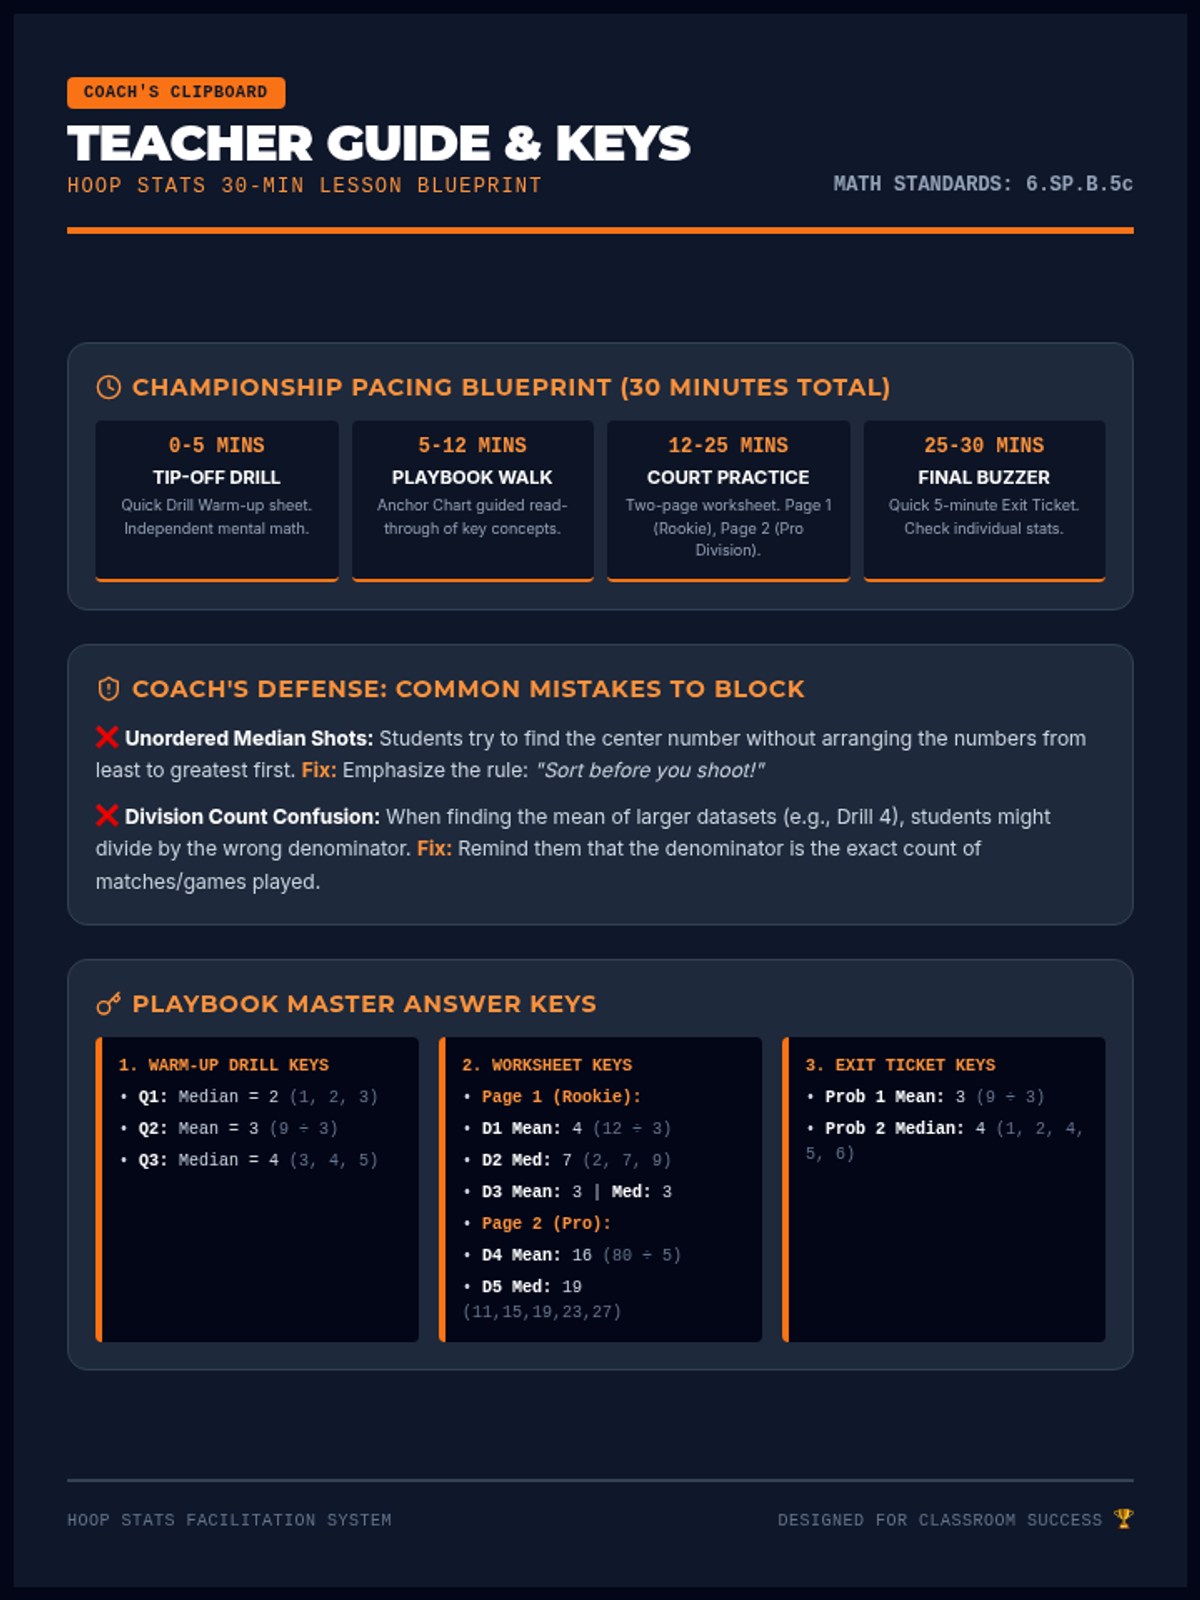
A 30-minute basketball-themed lesson focusing on Mean and Median with simplified data sets for accessible, friendly calculations. Includes an anchor chart, practice worksheet, rapid-fire warm-up drill, exit ticket, and a comprehensive teacher guide.
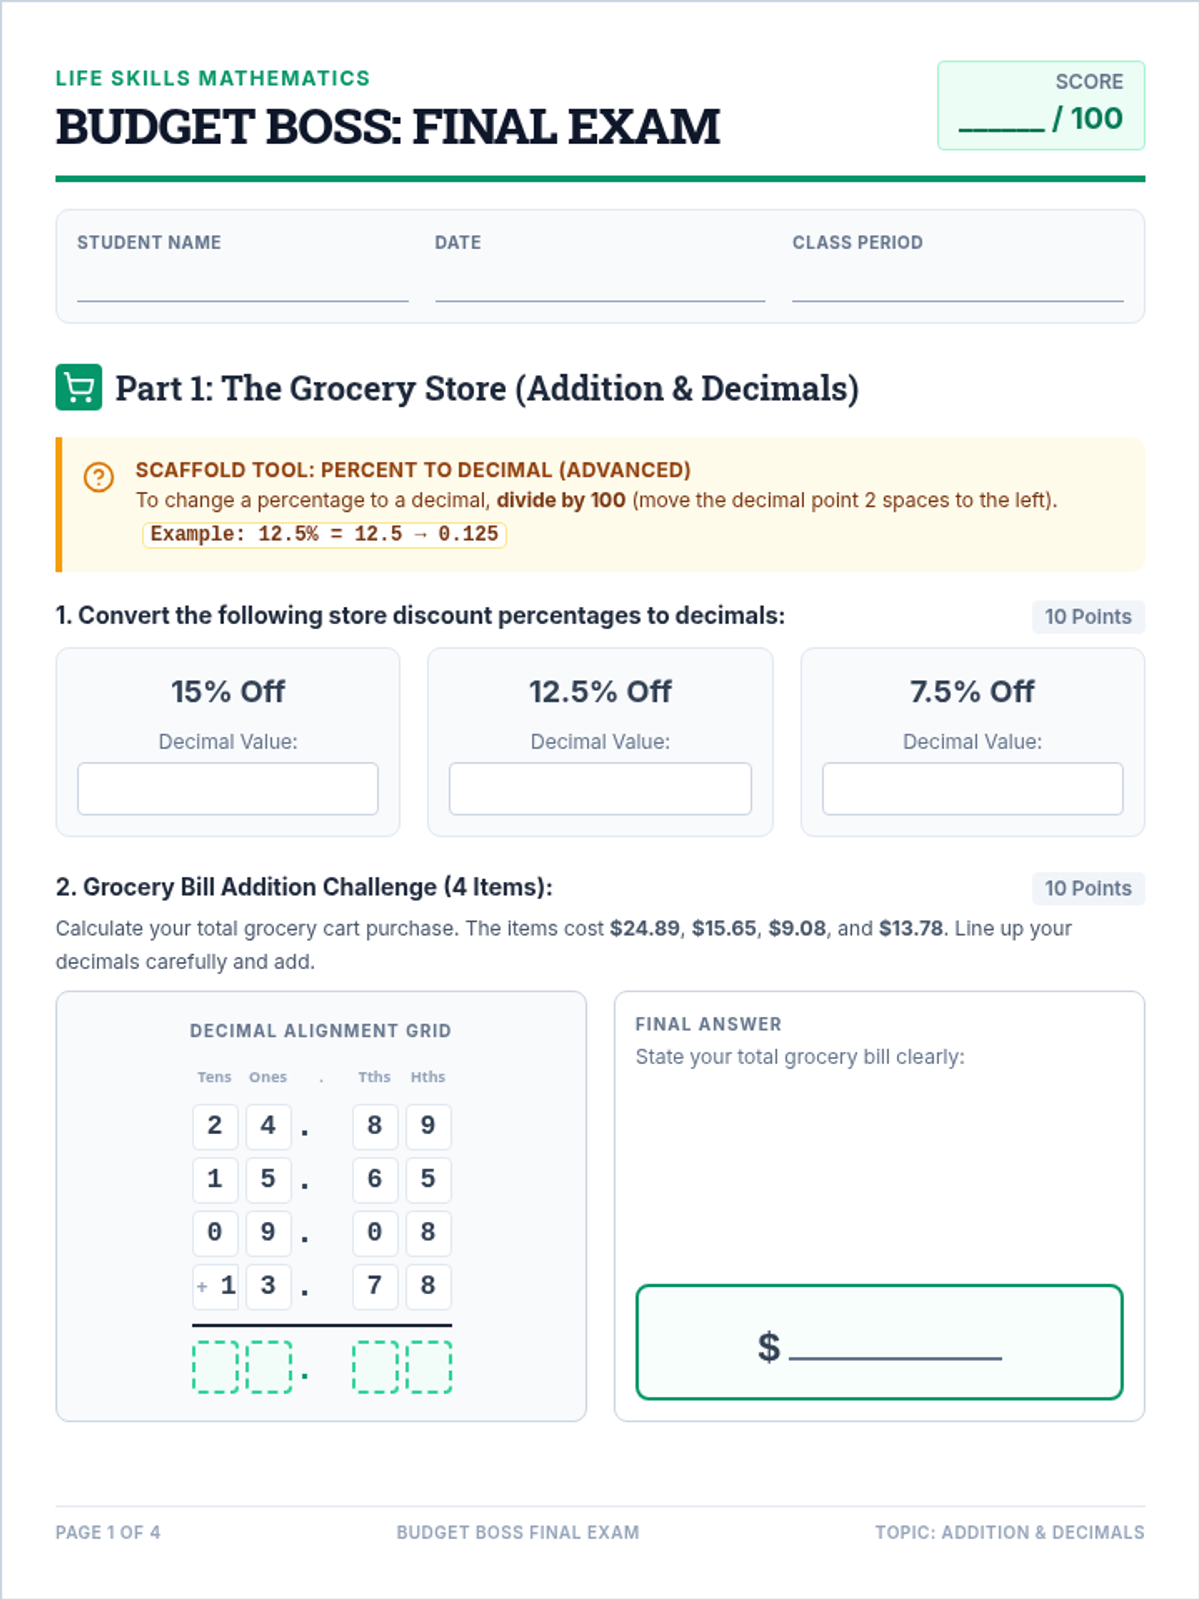
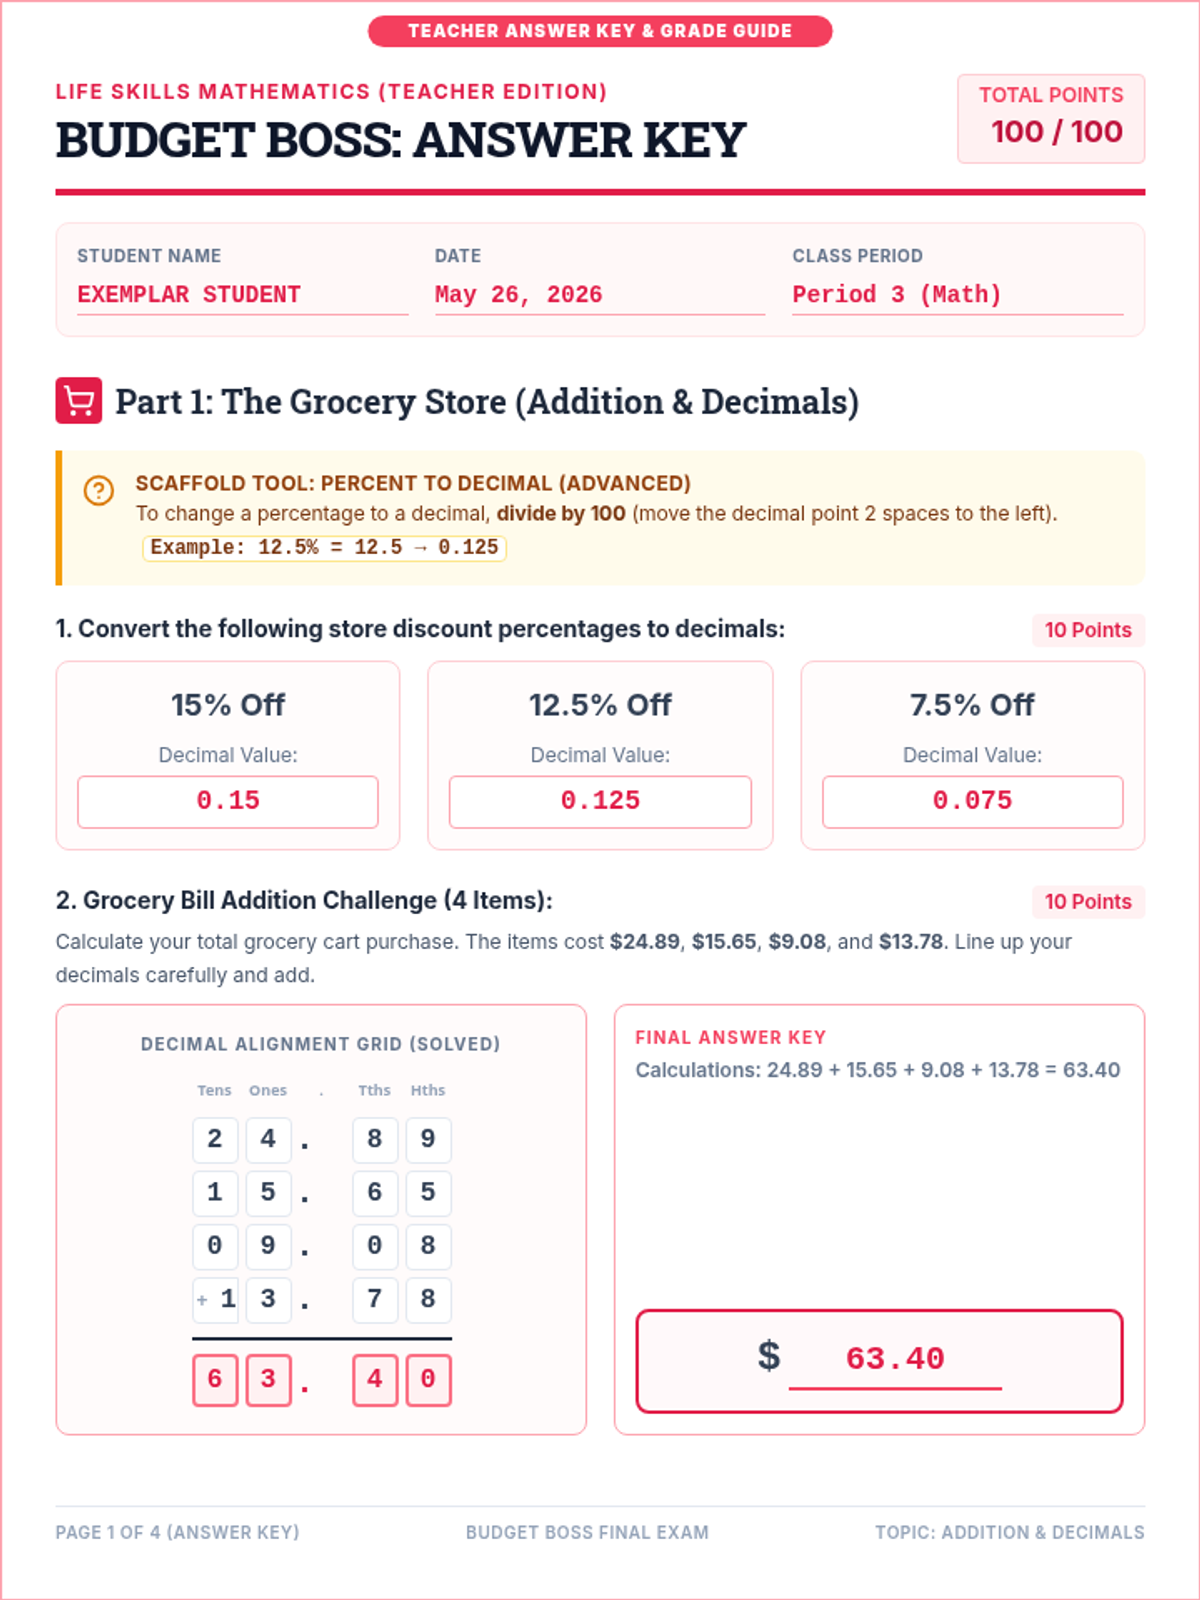
A comprehensive, real-world math exam and answer key assessing student mastery of addition, division, percentage-to-decimal conversions, and multi-step word problems through grocery shopping, vocational wages, and budgeting scenarios.
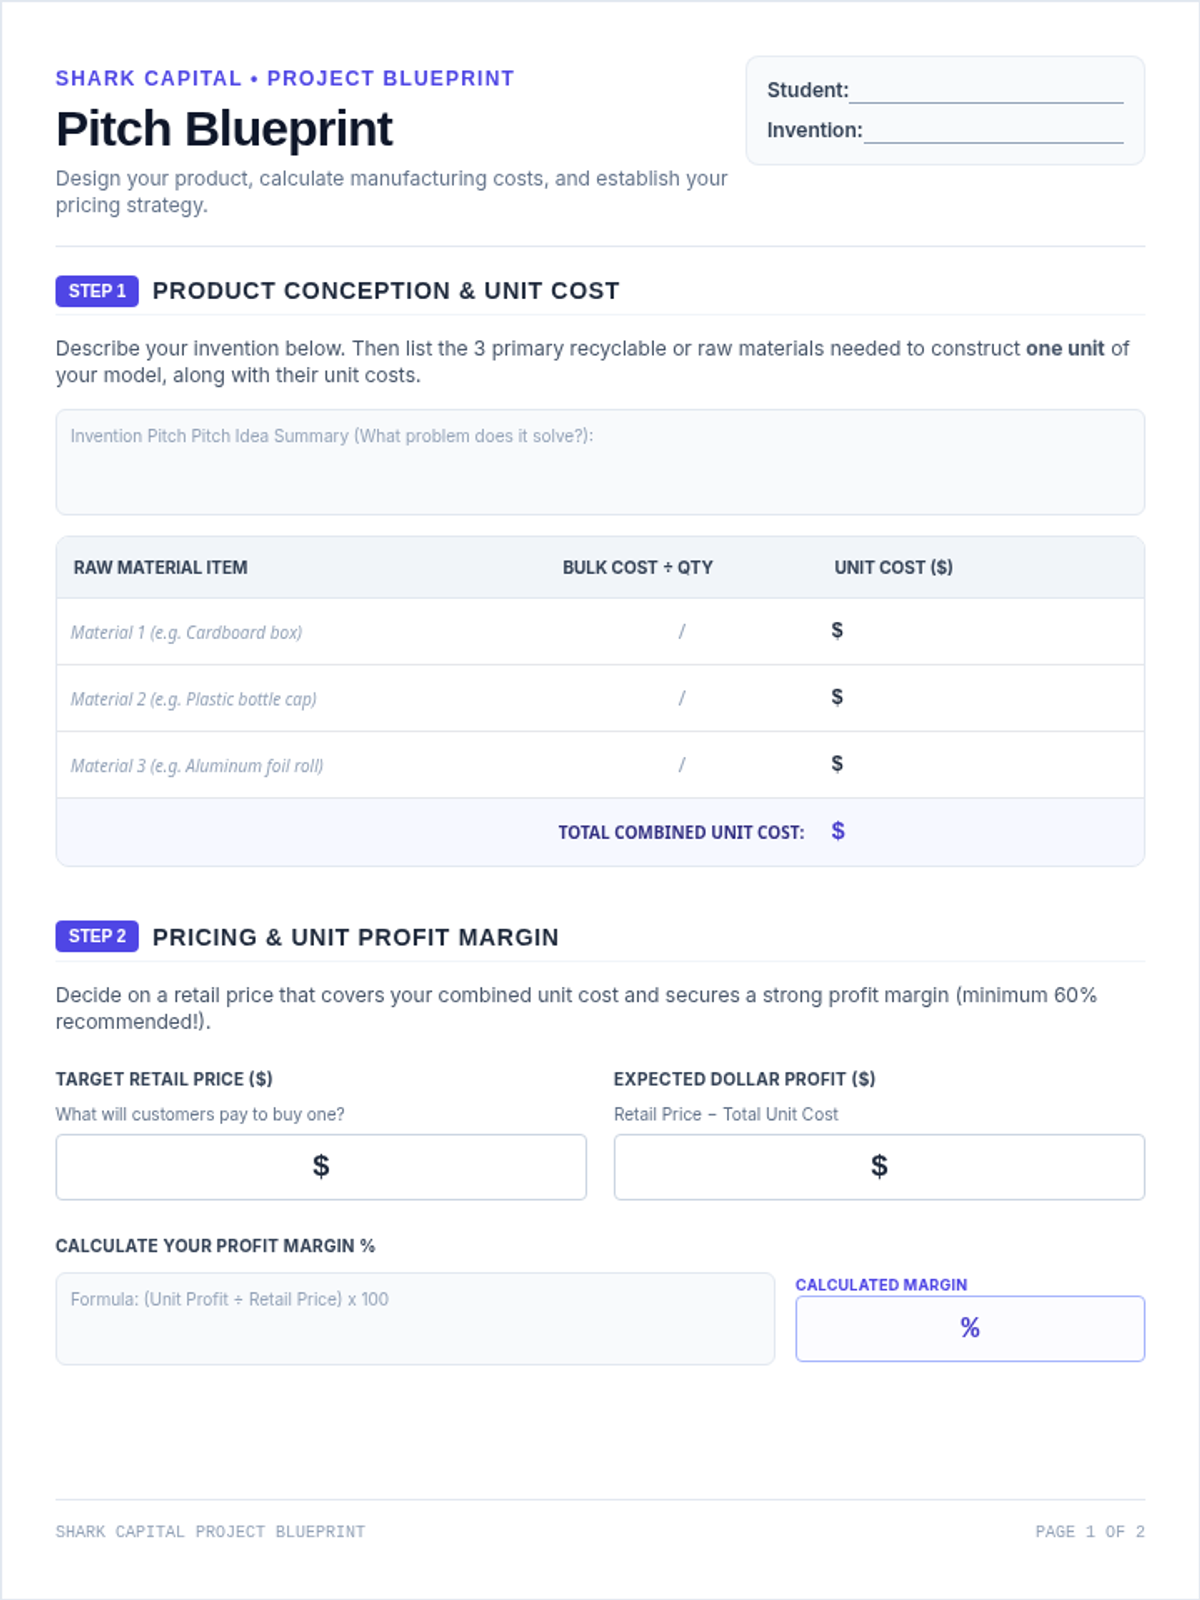
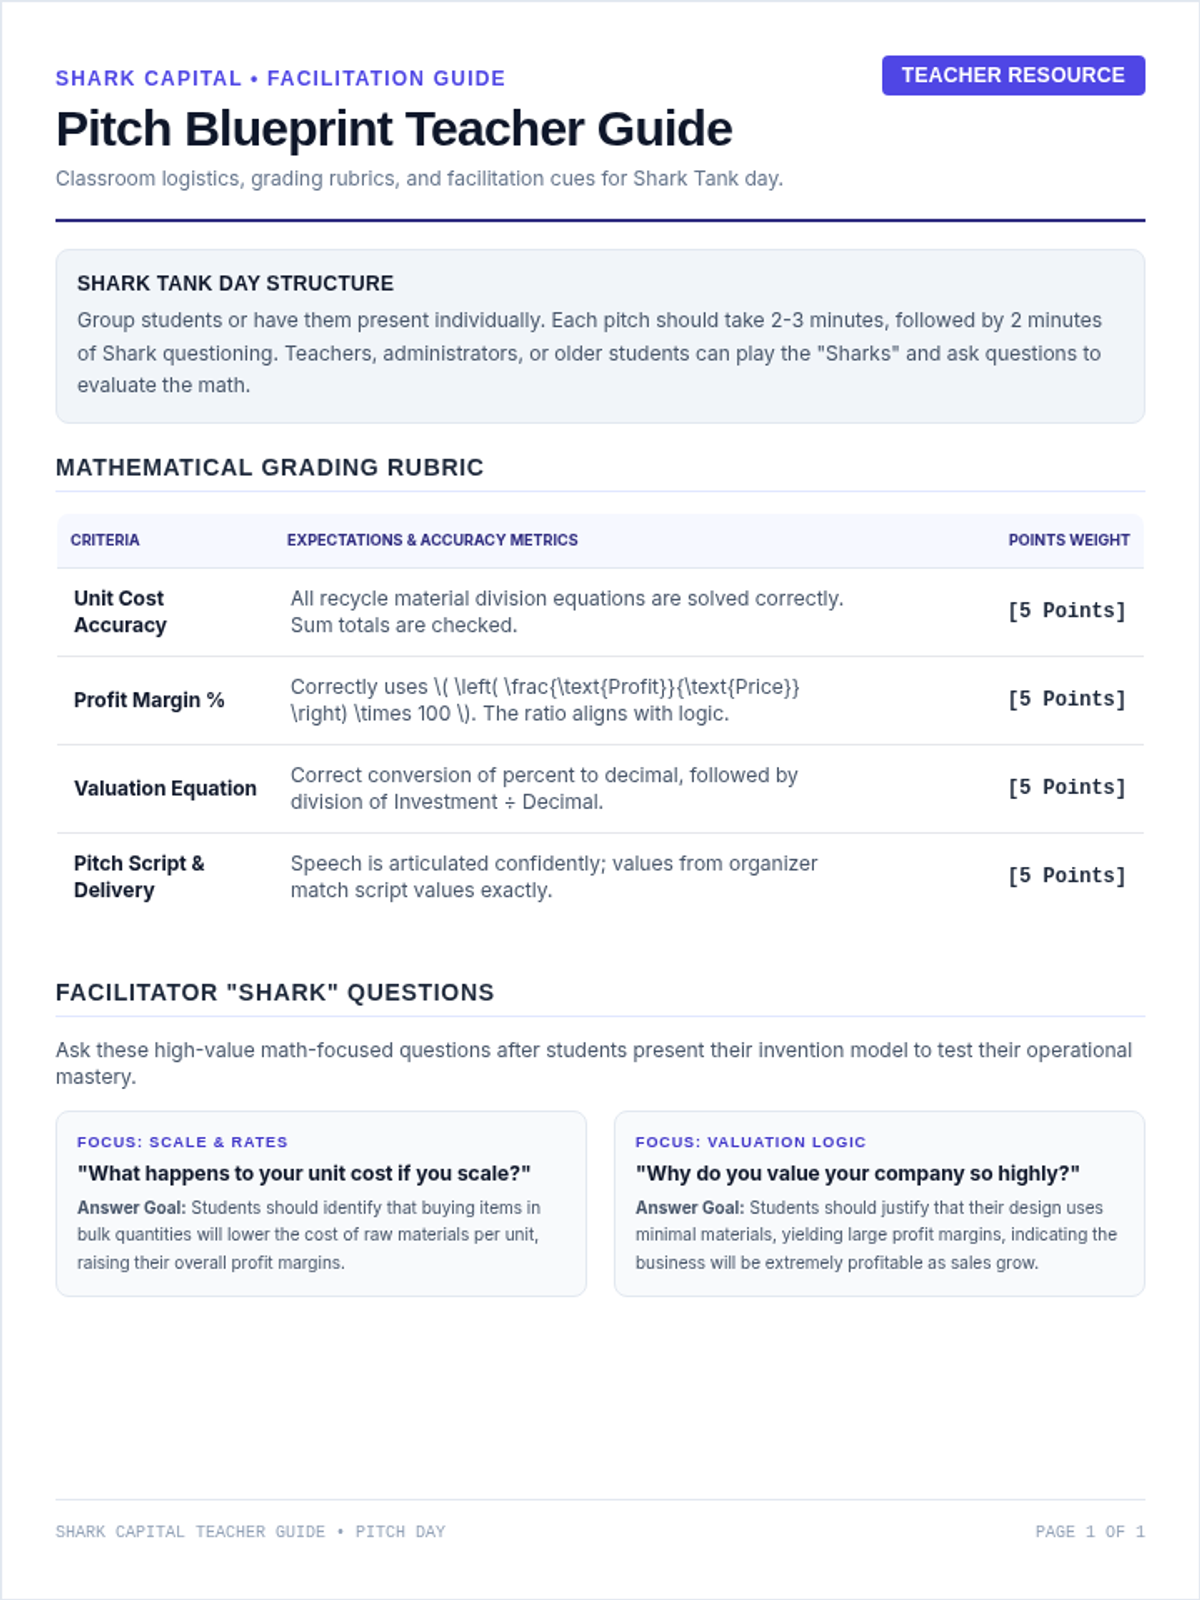
Students apply their mathematical knowledge to their own inventions. They calculate their product costs, set their retail price, determine their company valuation, and write the math portion of their pitch speech.
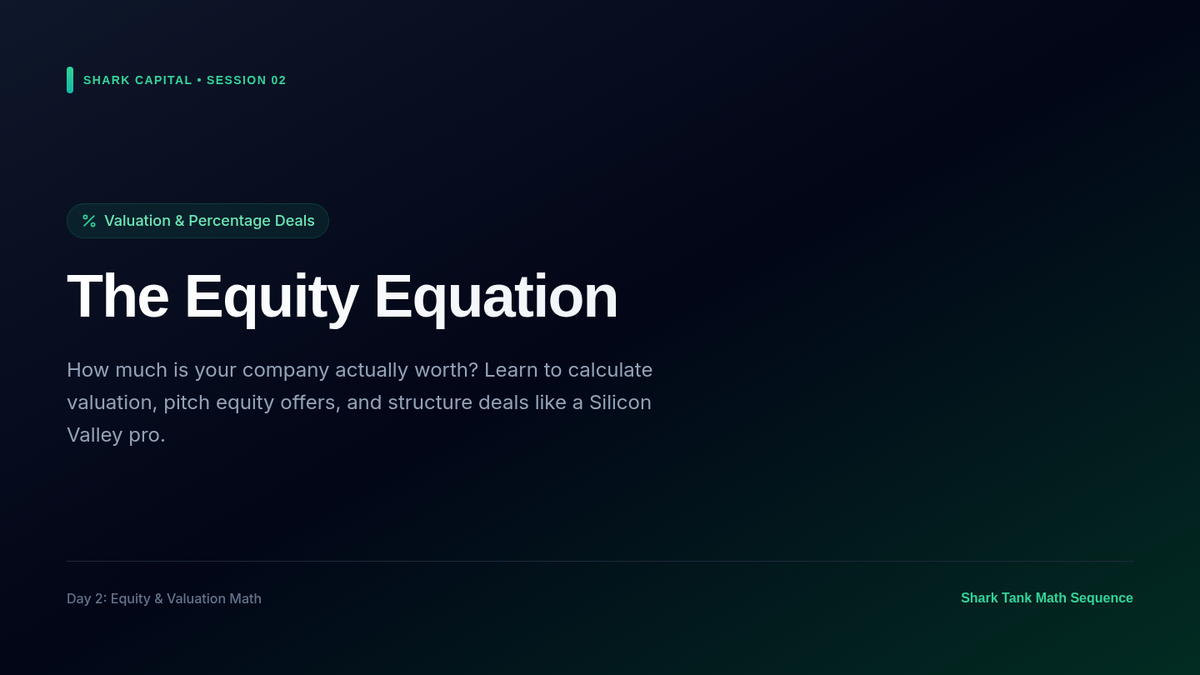
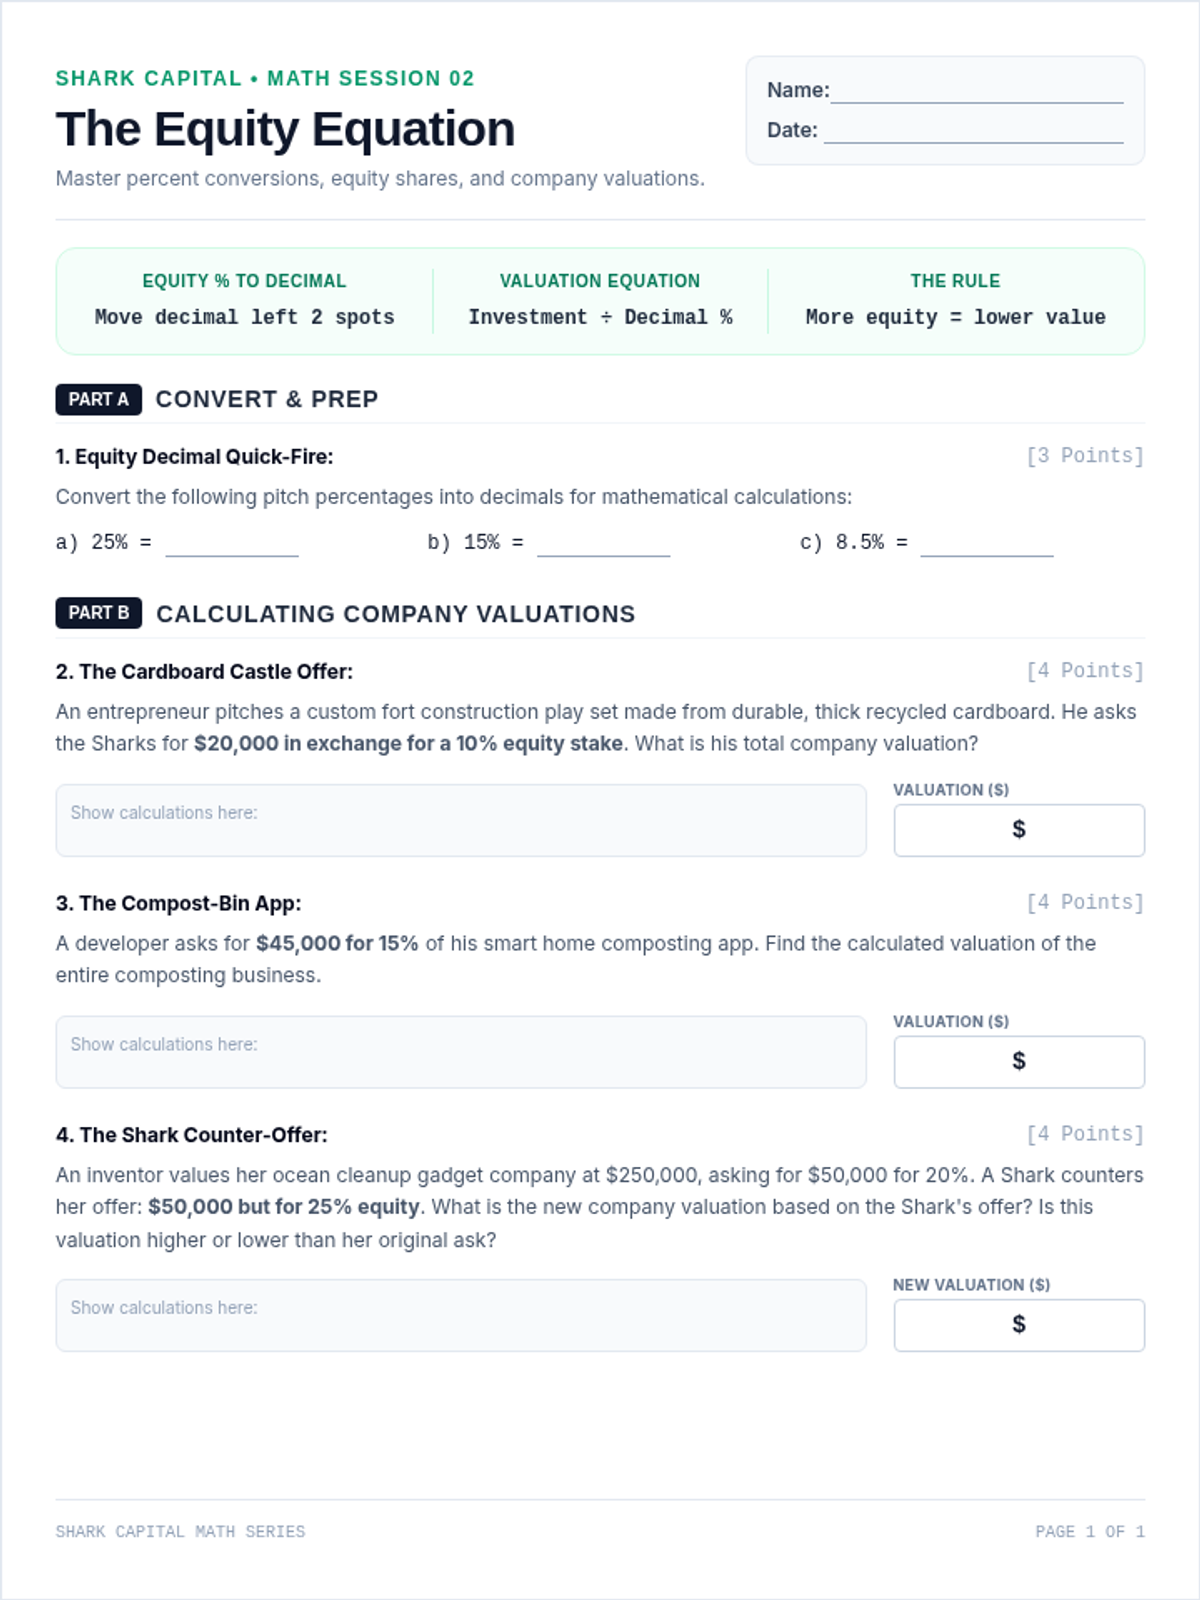
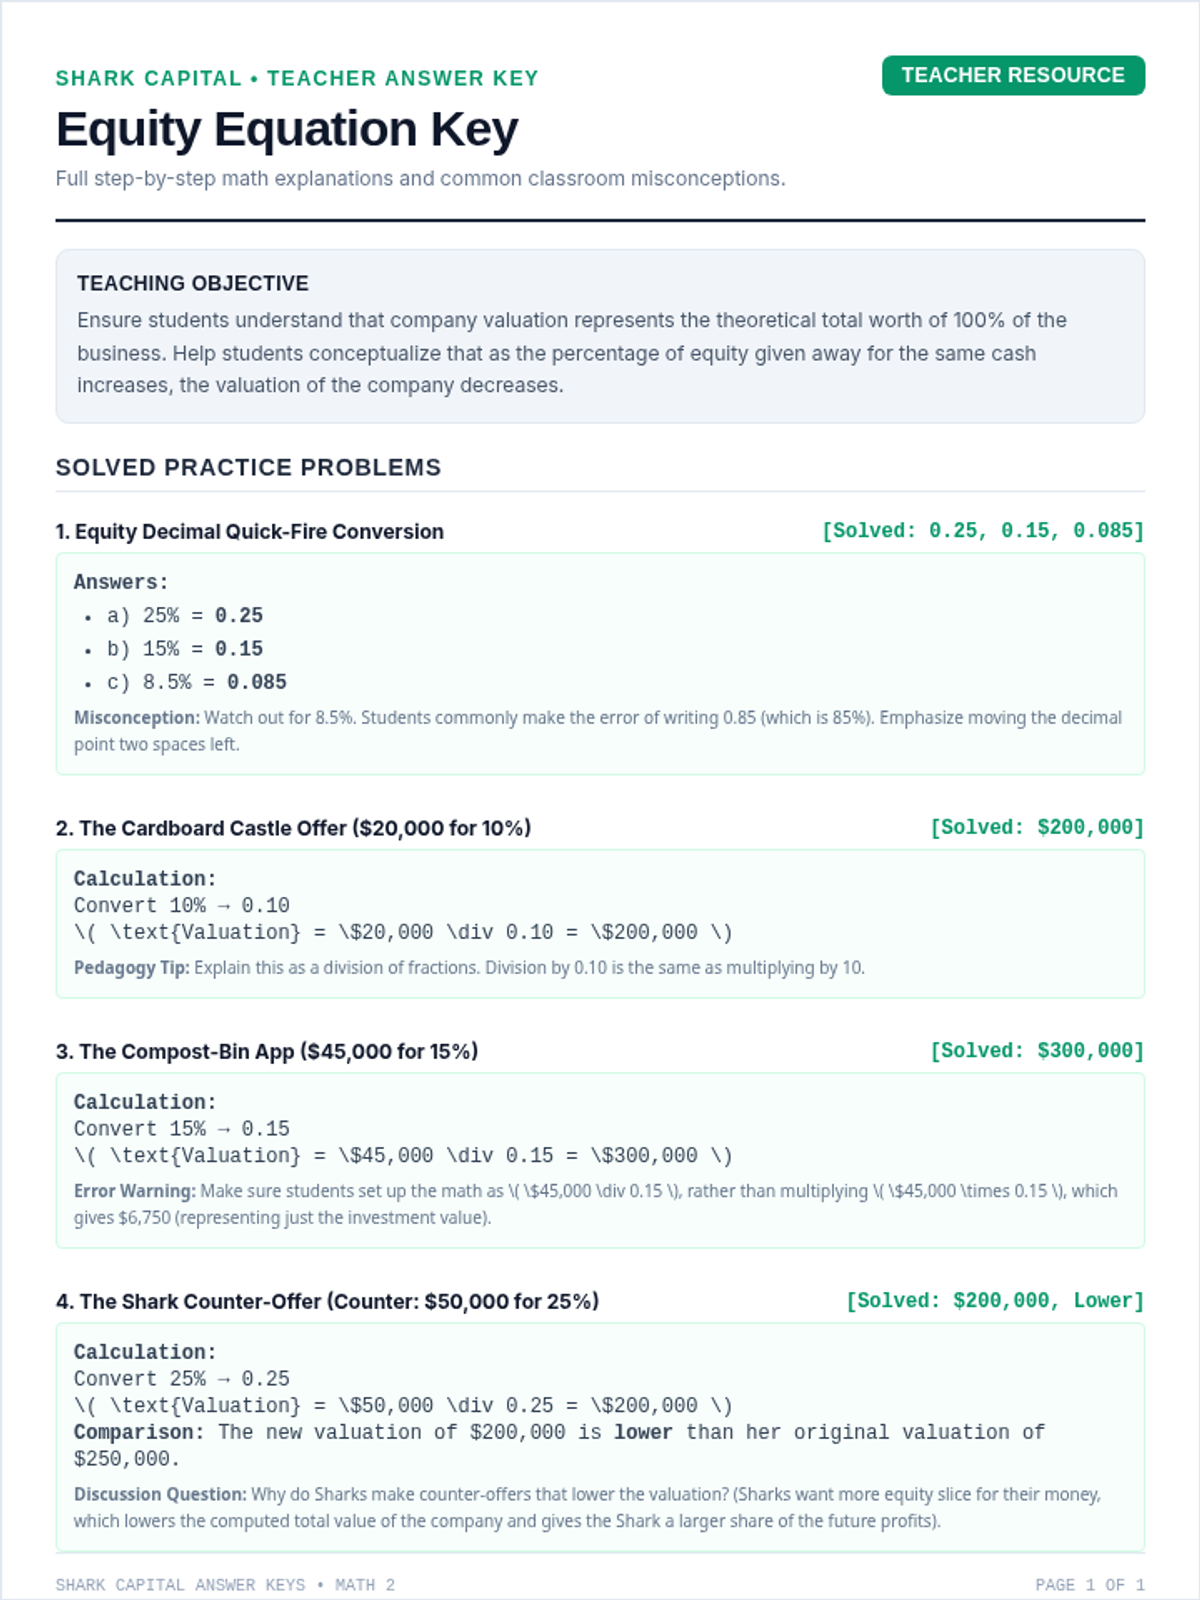
Students tackle company valuations, percentage offers, and equity calculations. They learn the math behind asking for investment and determining what percentage of their company to sell.
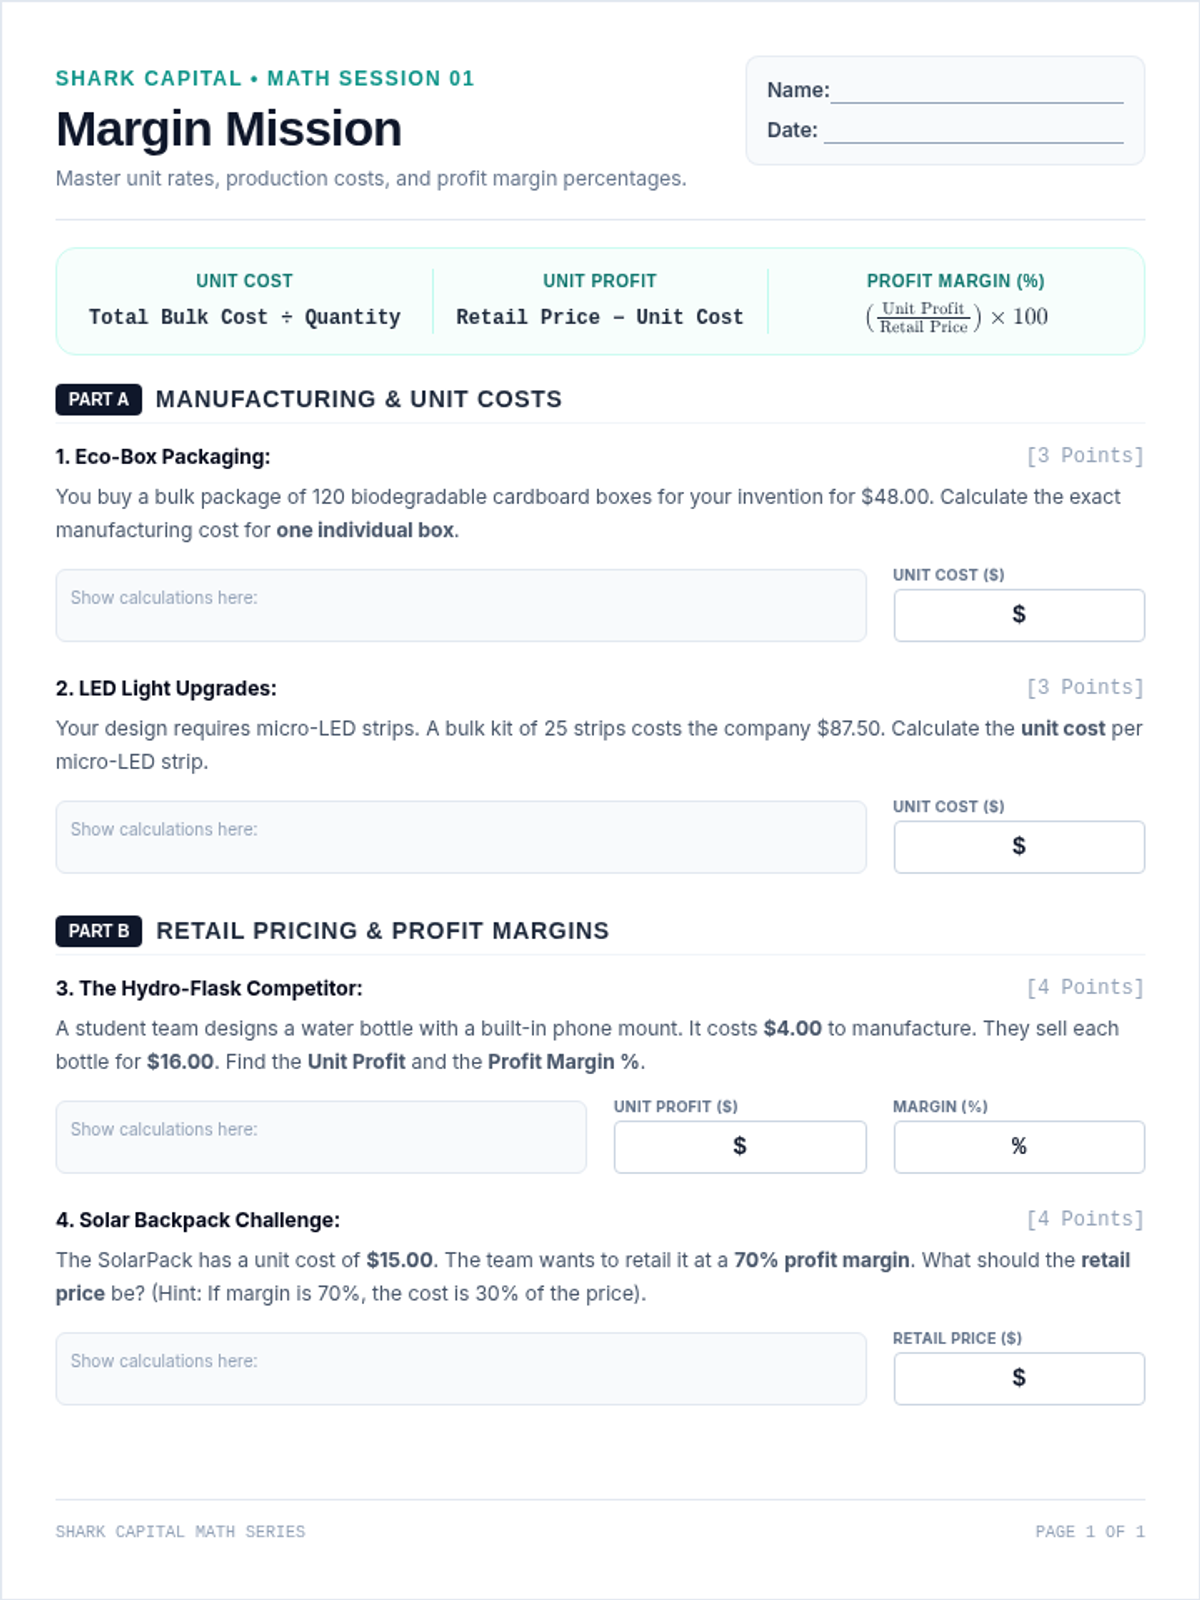
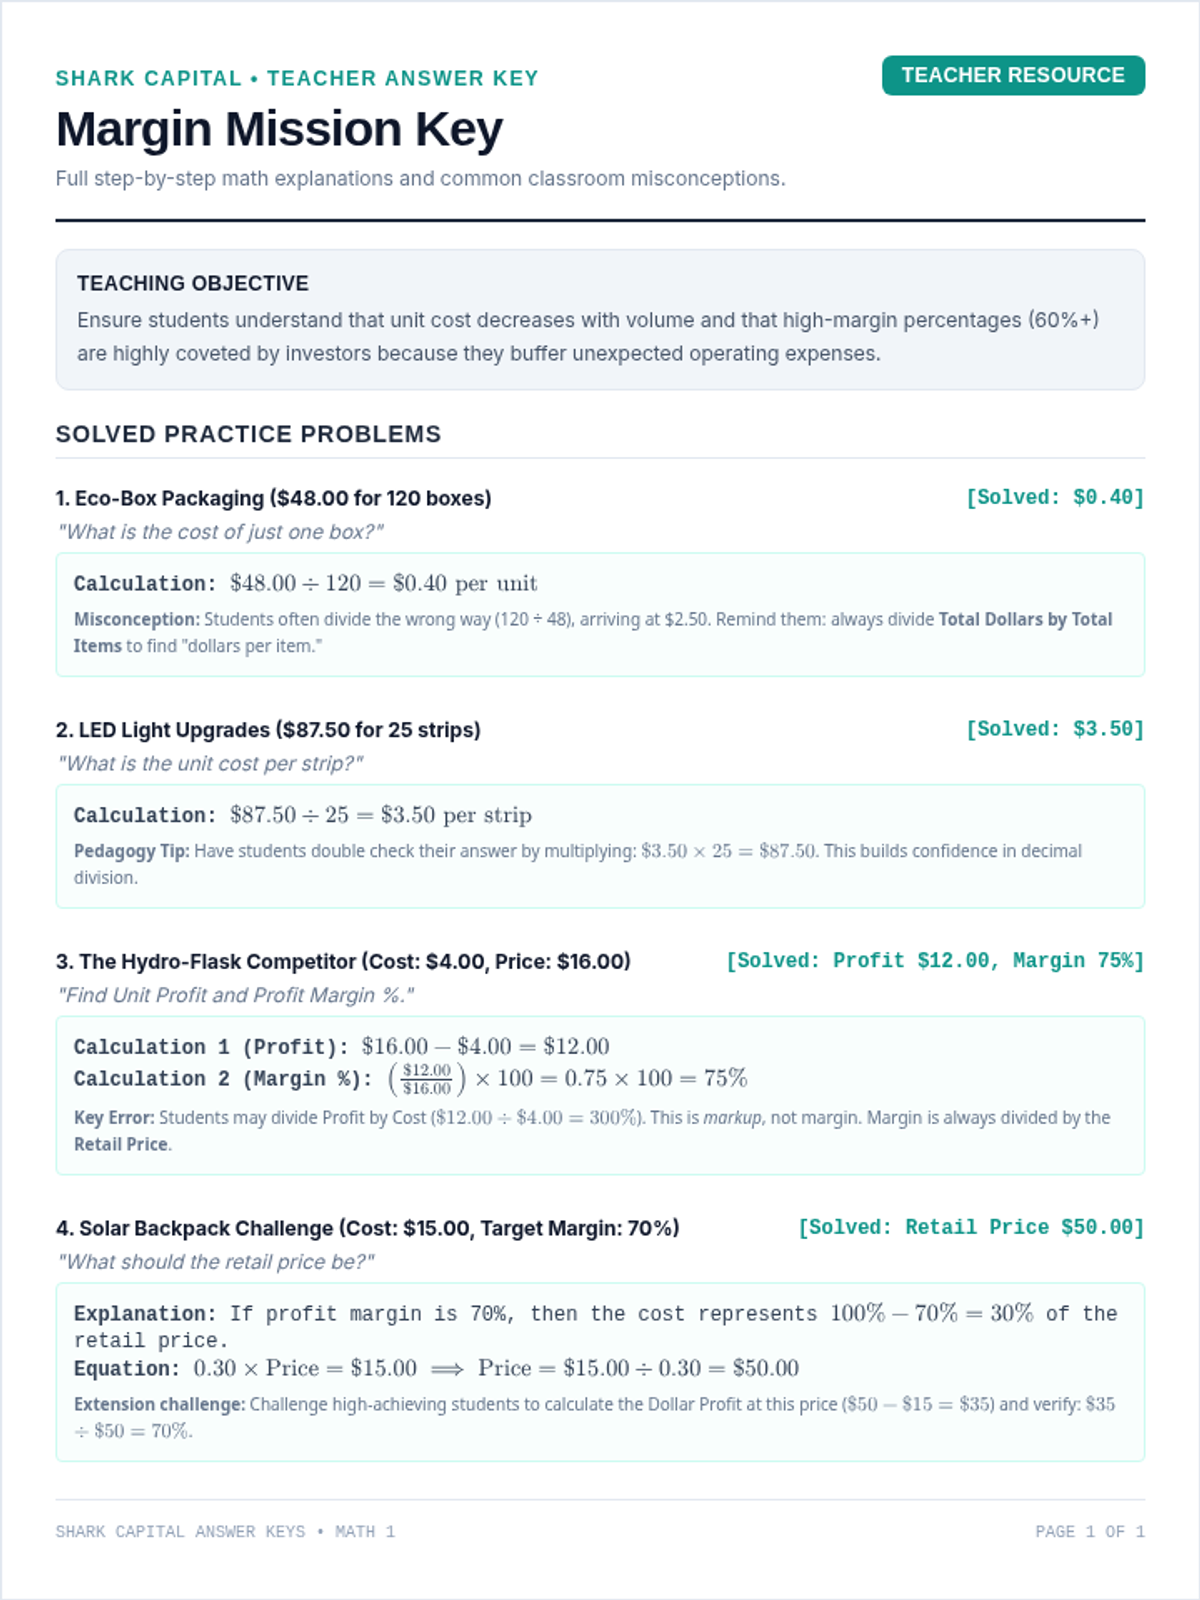
Students master unit rates, production costs, retail pricing, and profit margin percentages. They learn how to analyze whether an invention is financially viable on a unit level.
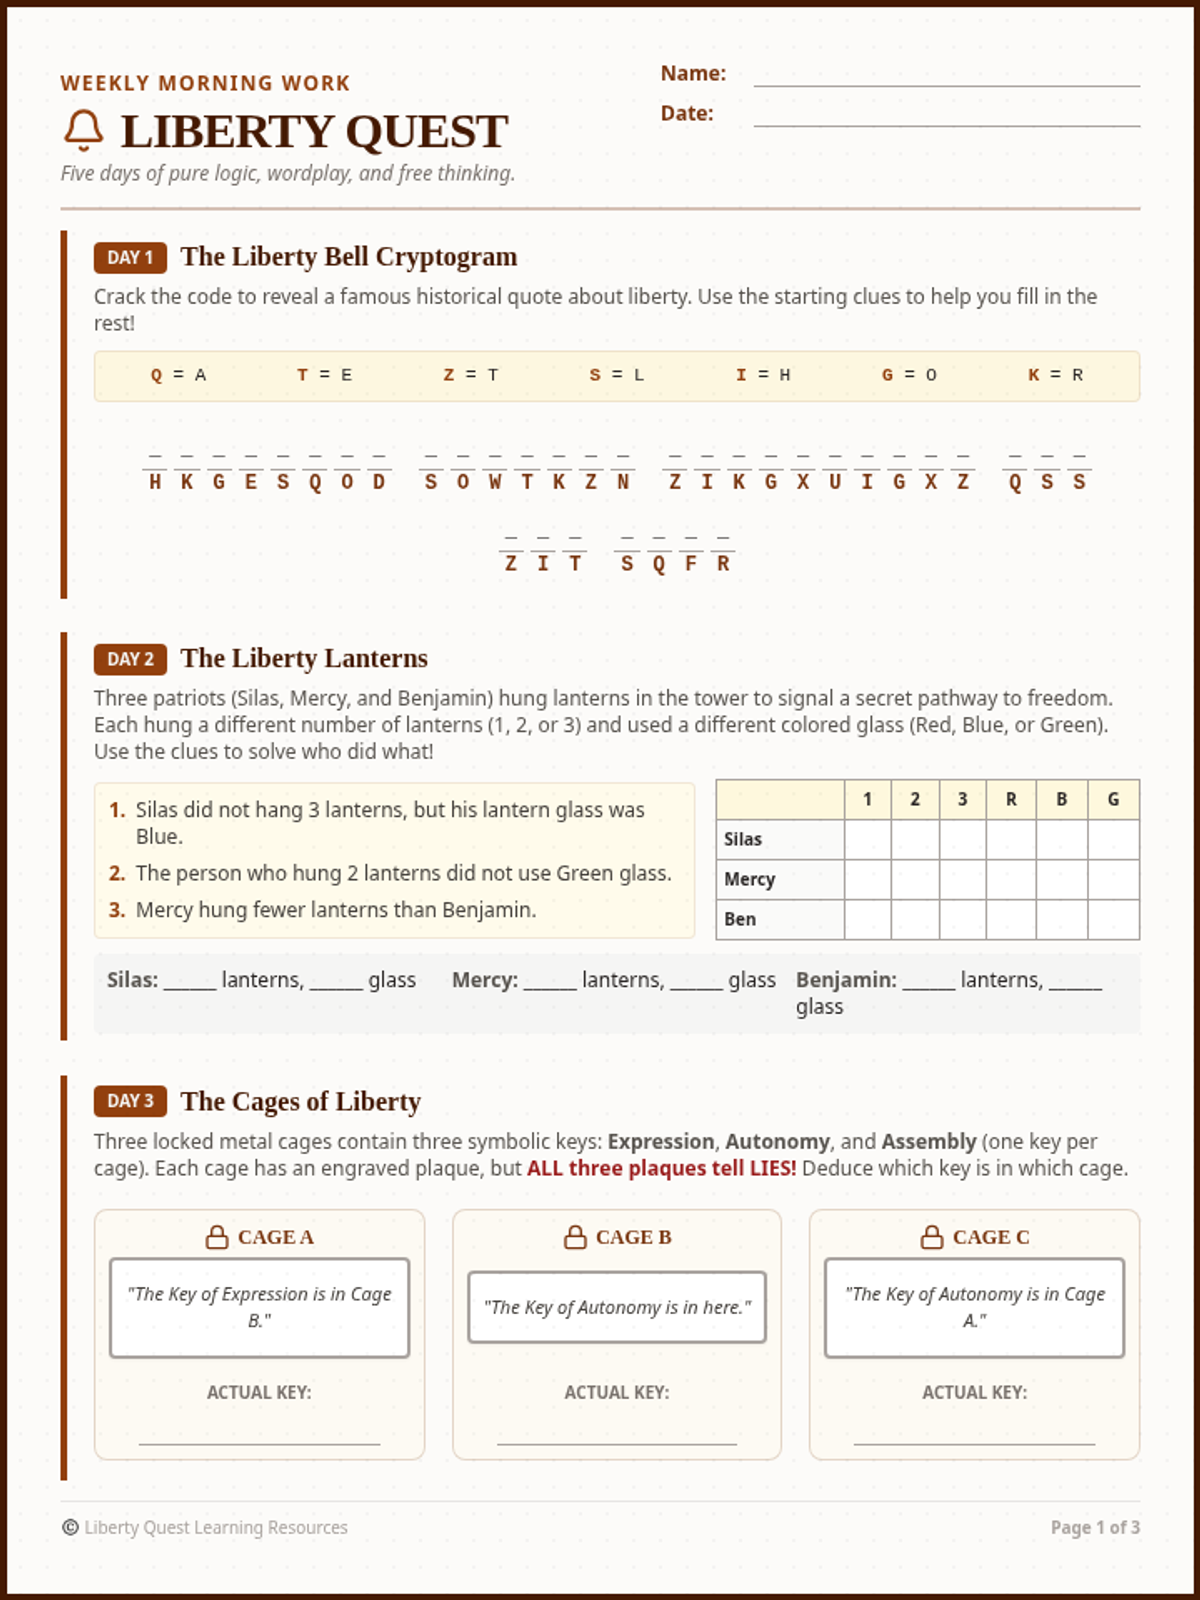
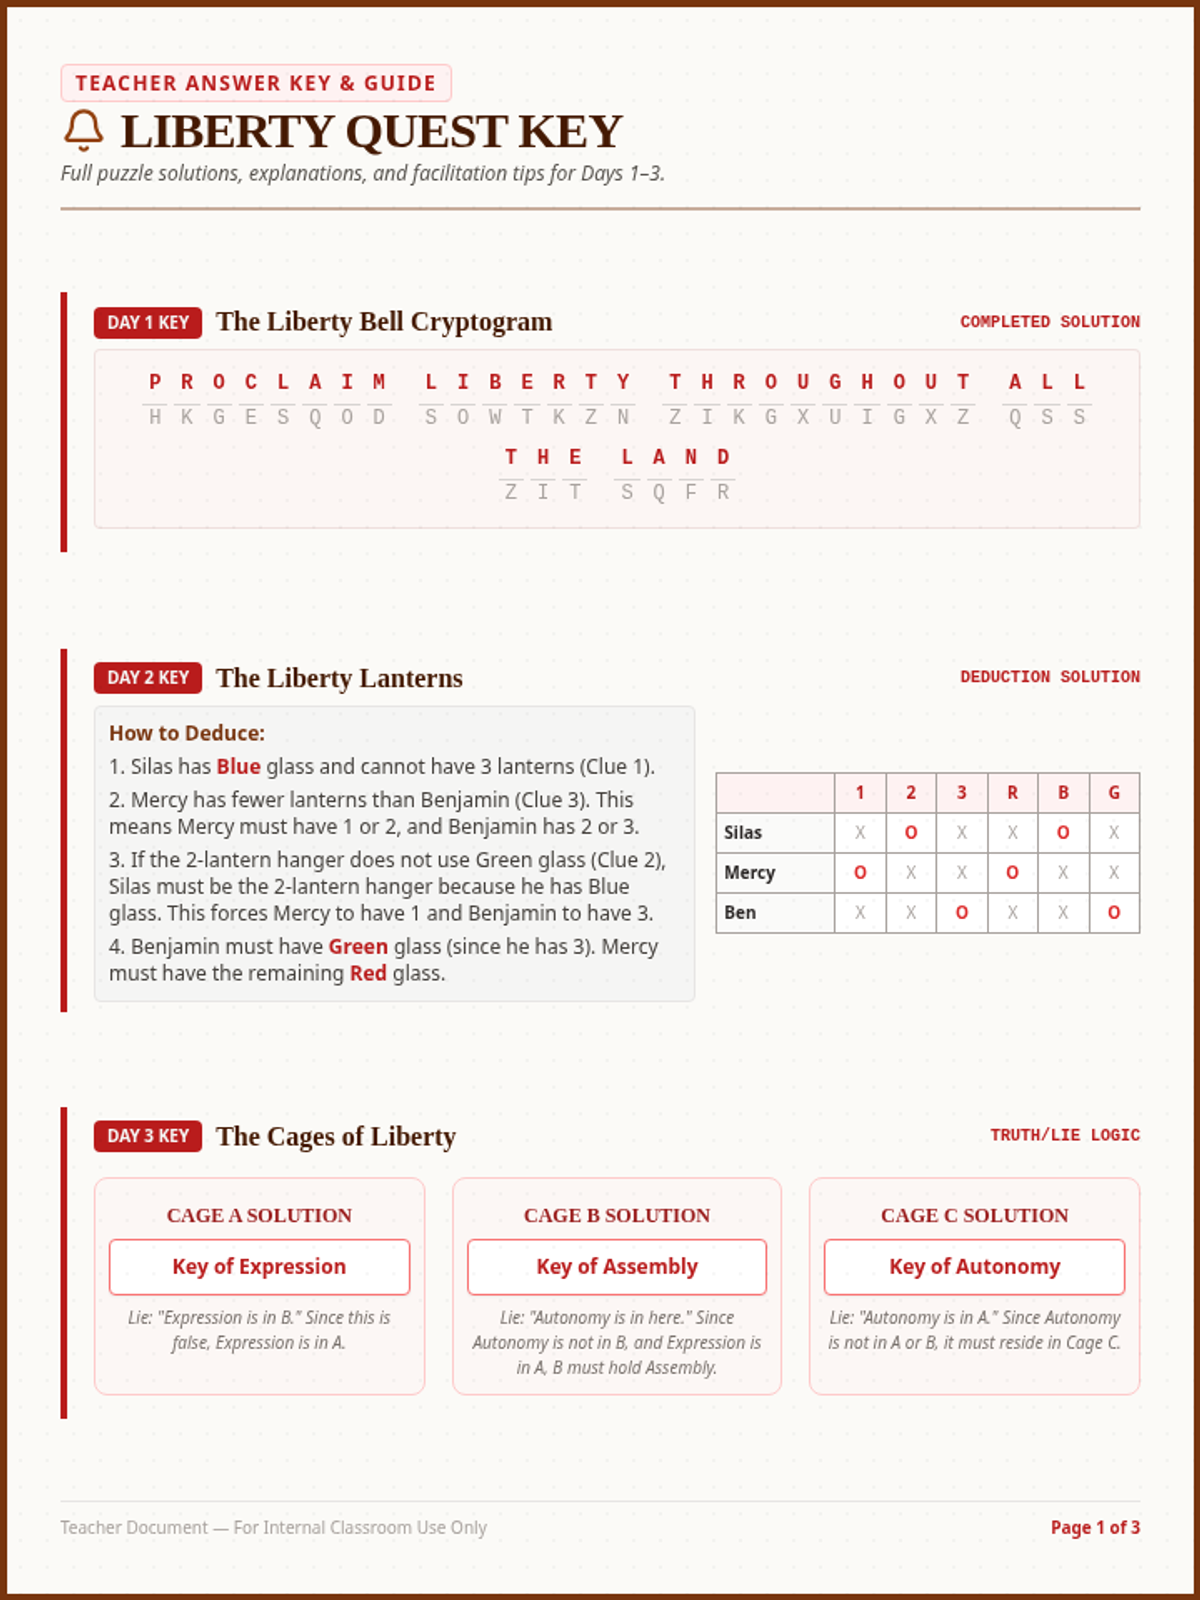
A 5-day daily warm-up packet based on logic puzzles and wordplay themed around liberty and freedom. Focuses on critical thinking and non-numerical deduction.
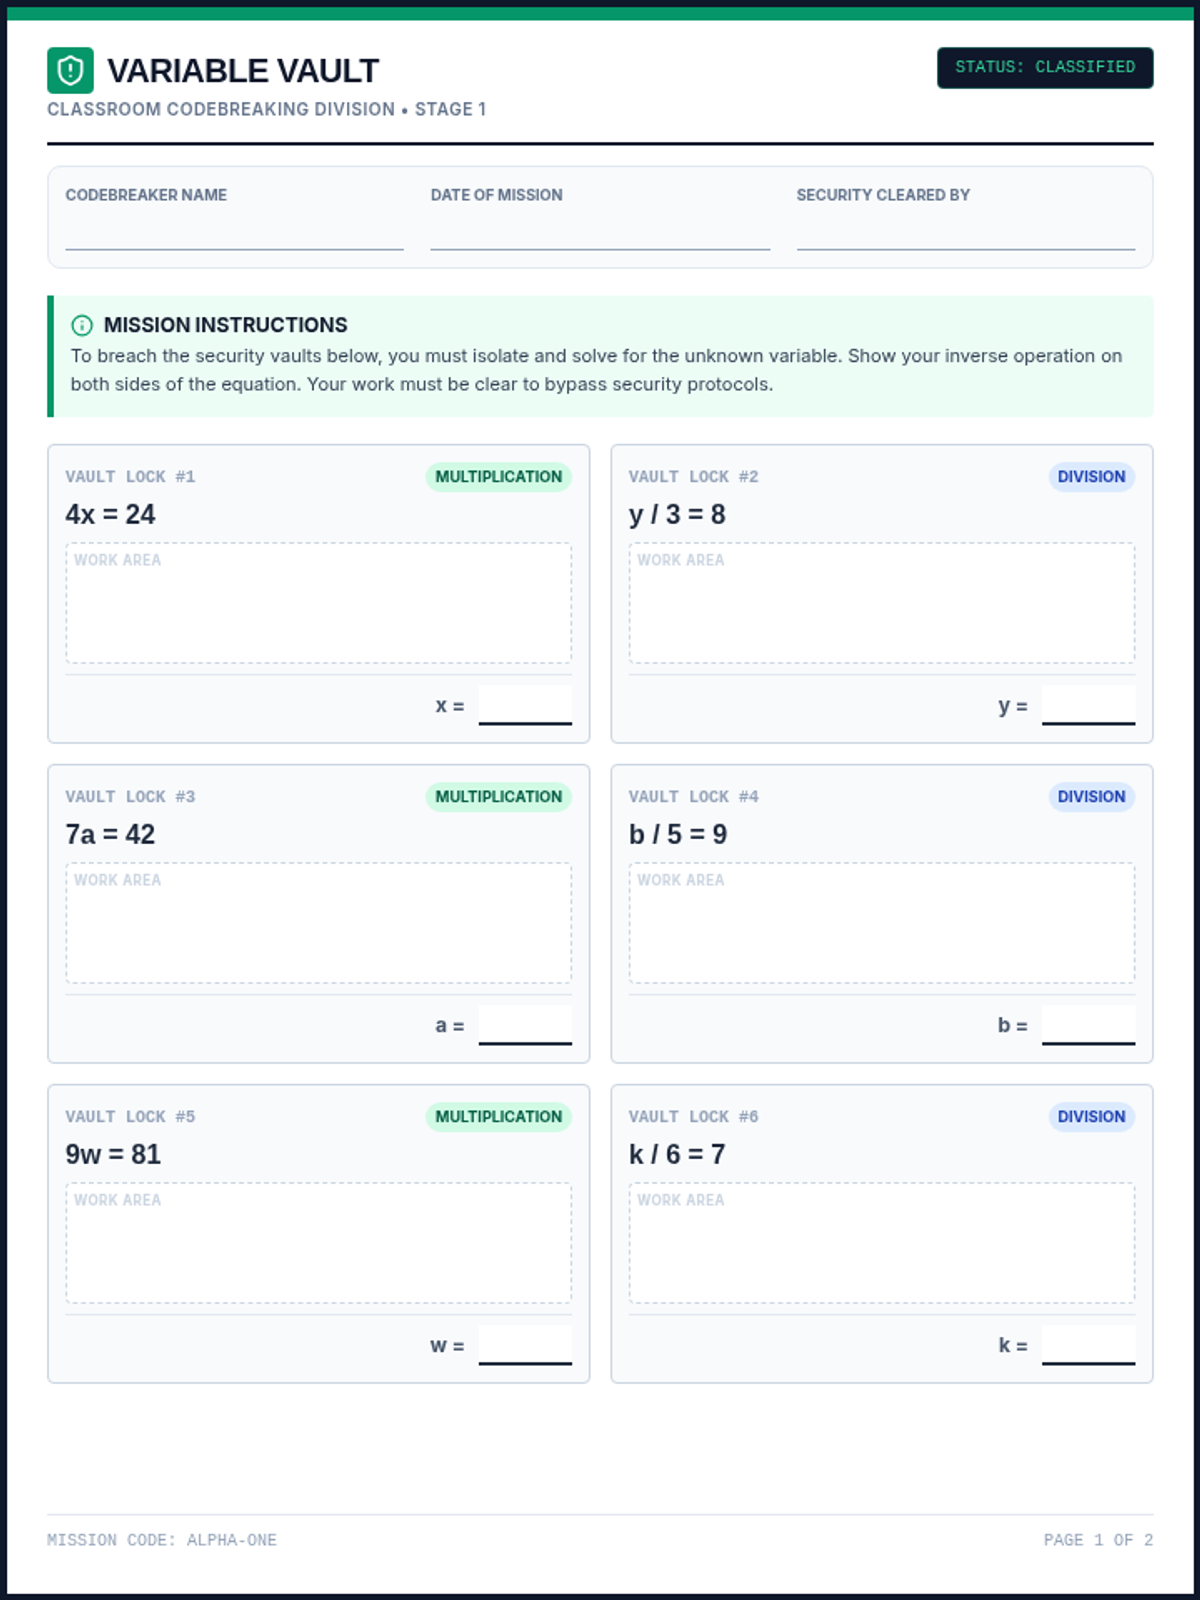
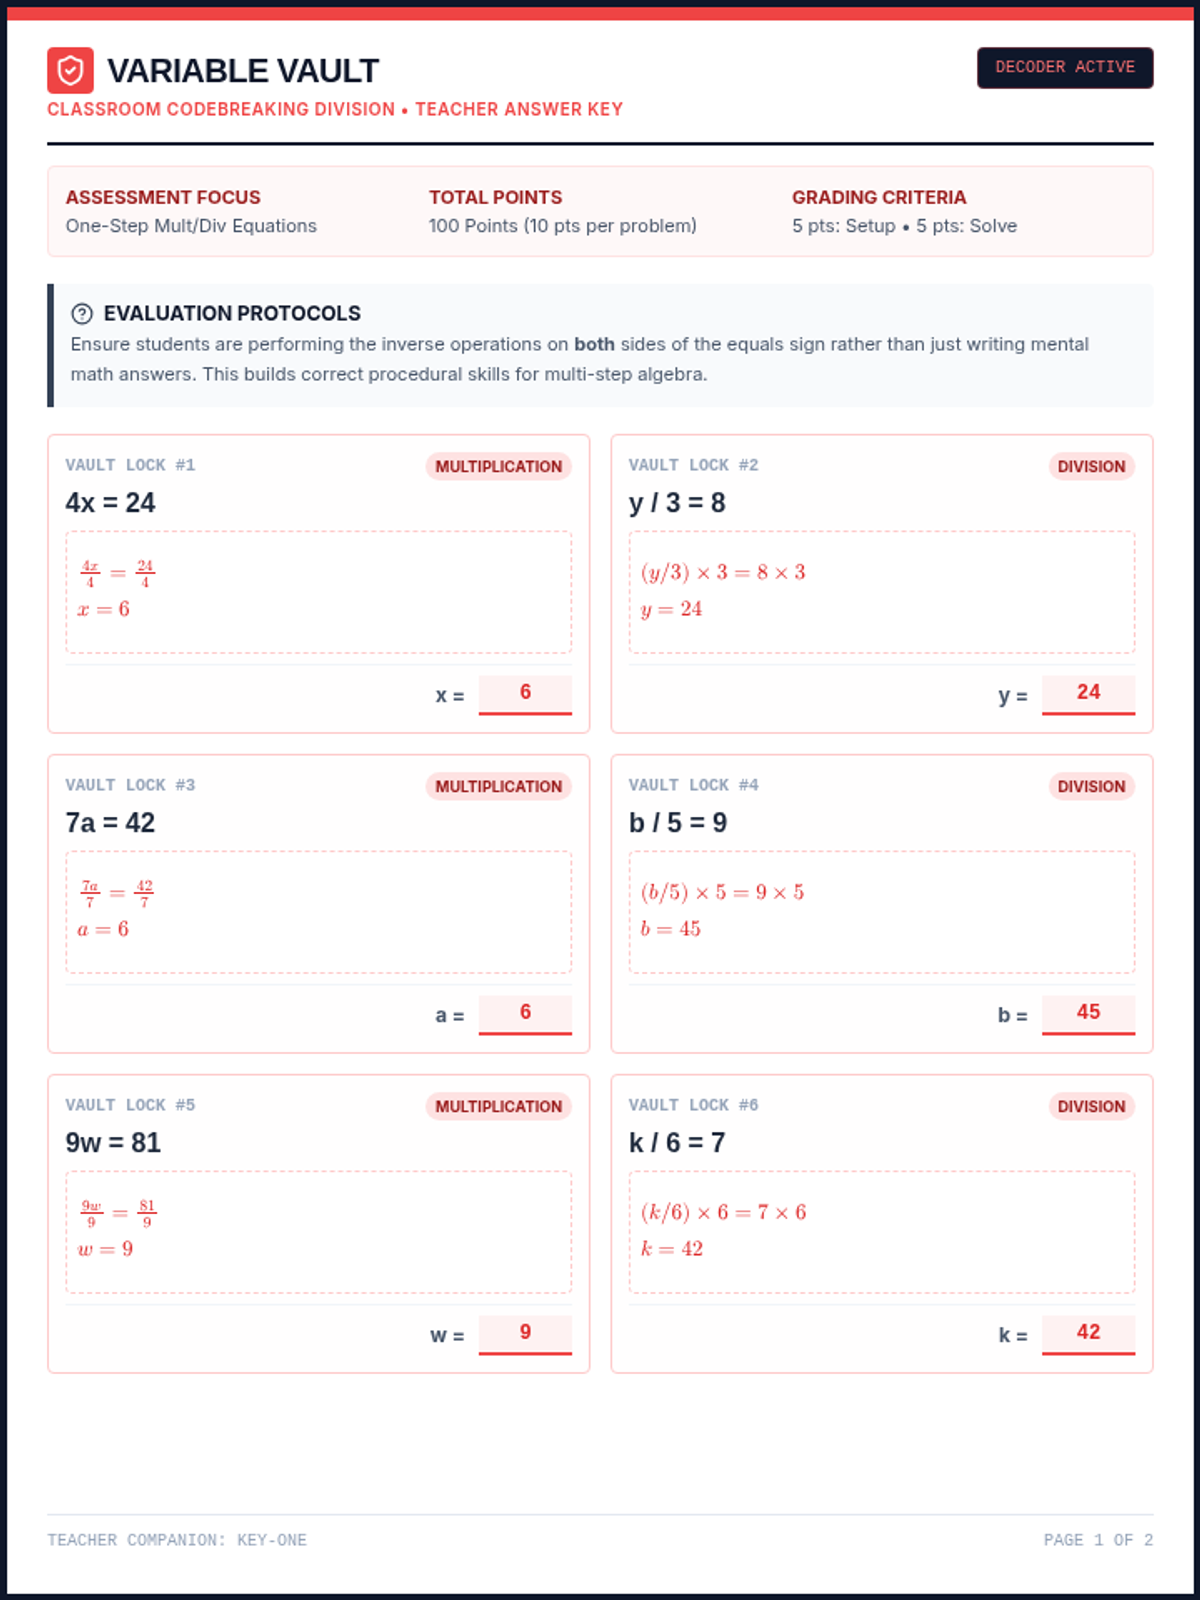
An assessment package for solving one-step equations involving whole number multiplication and division. Includes a student assessment worksheet and a teacher answer key with detailed step-by-step solutions.
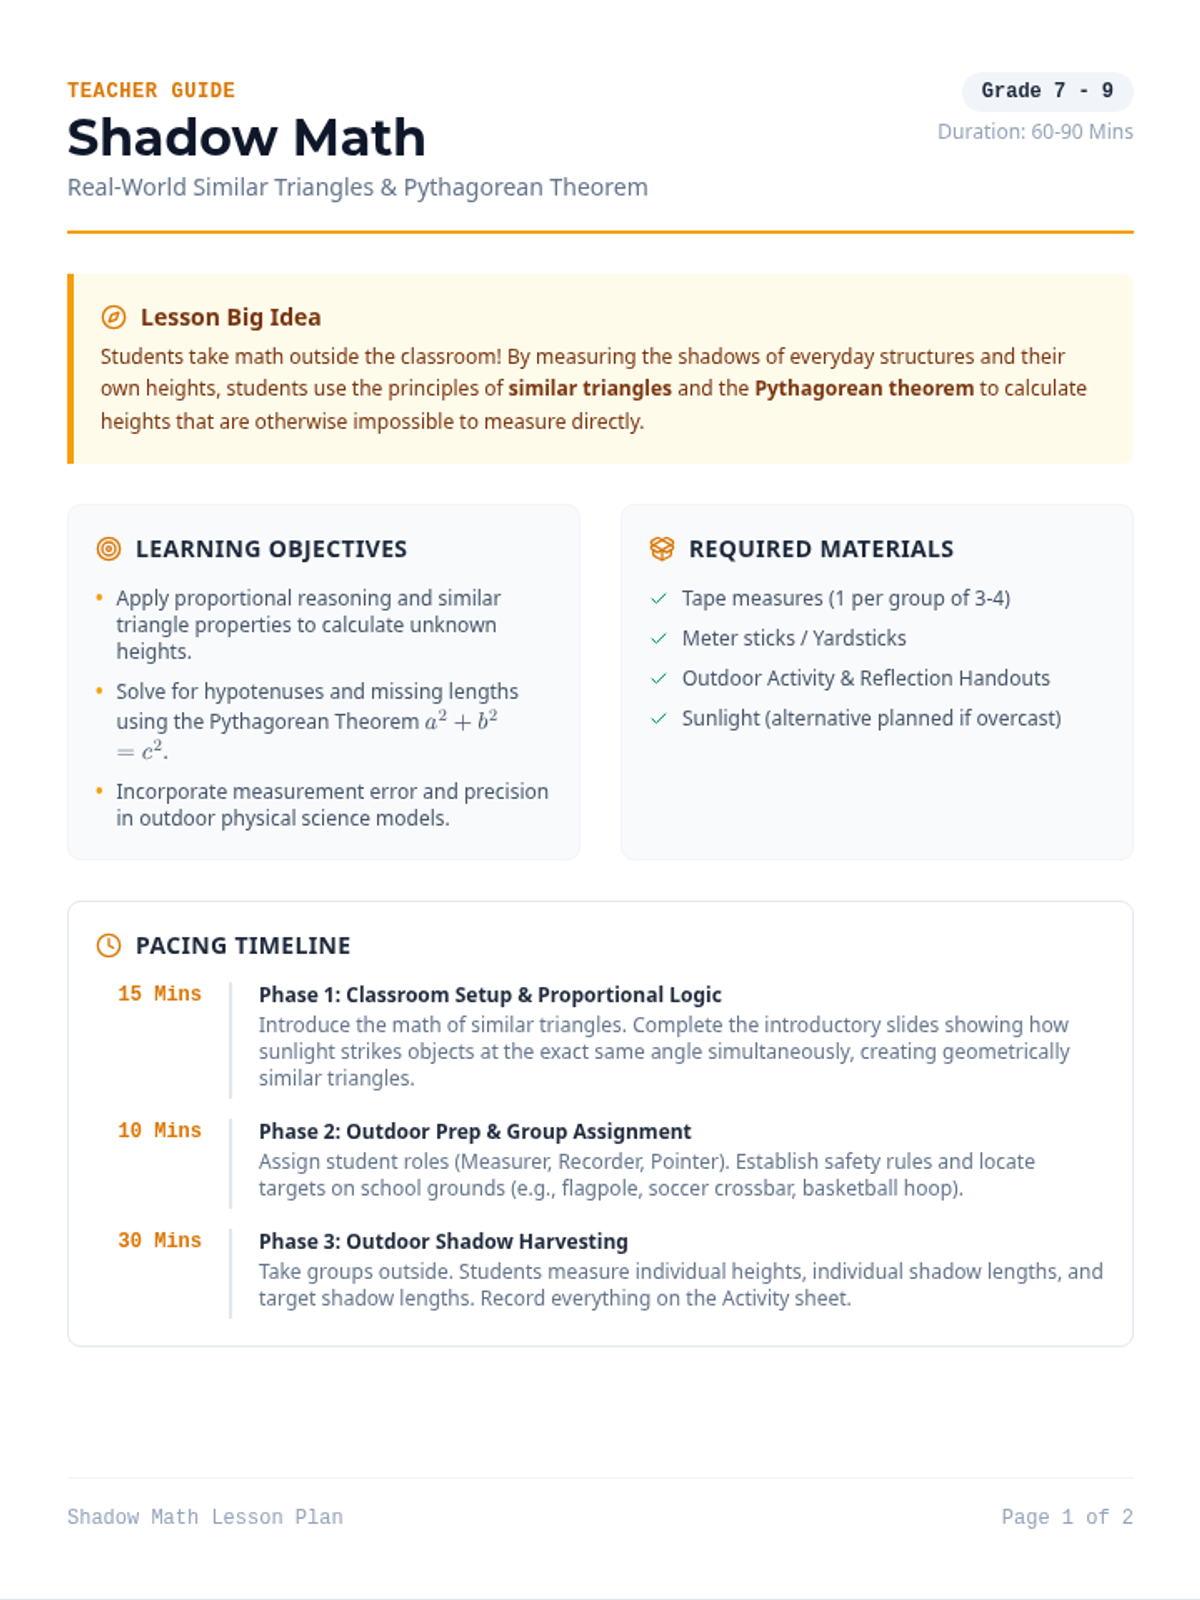
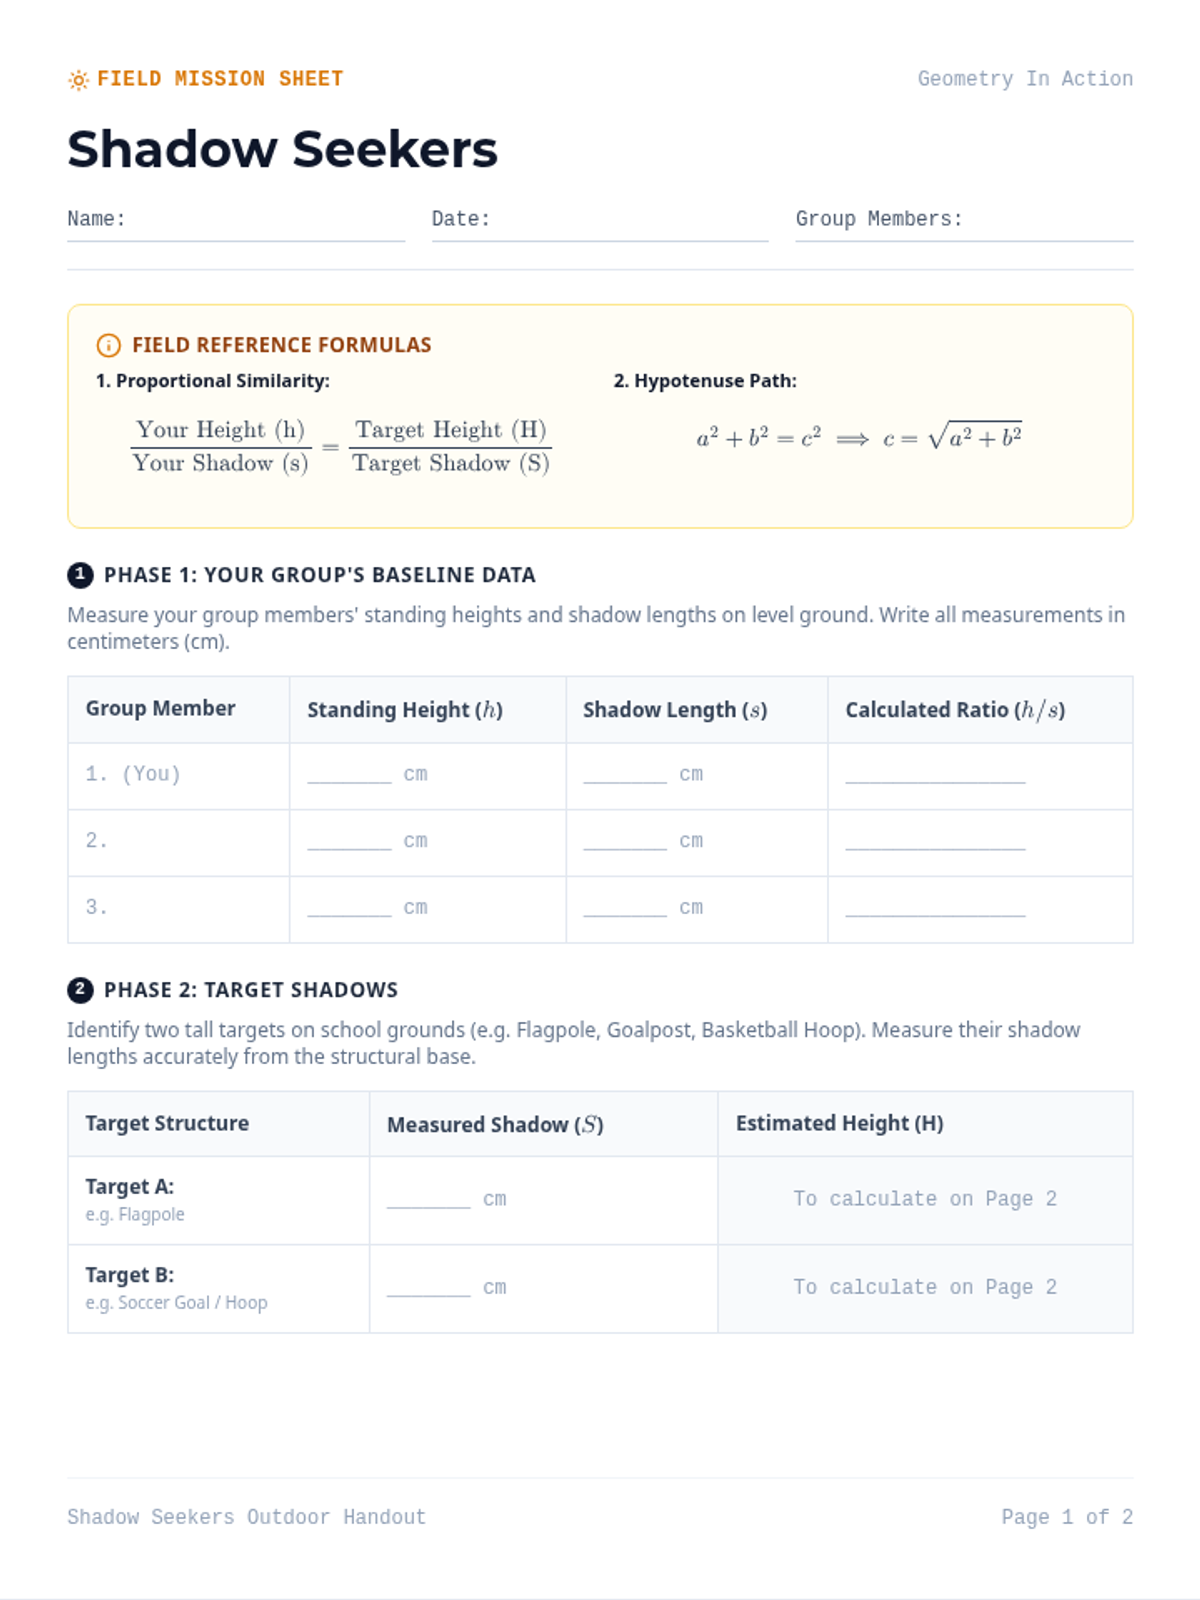
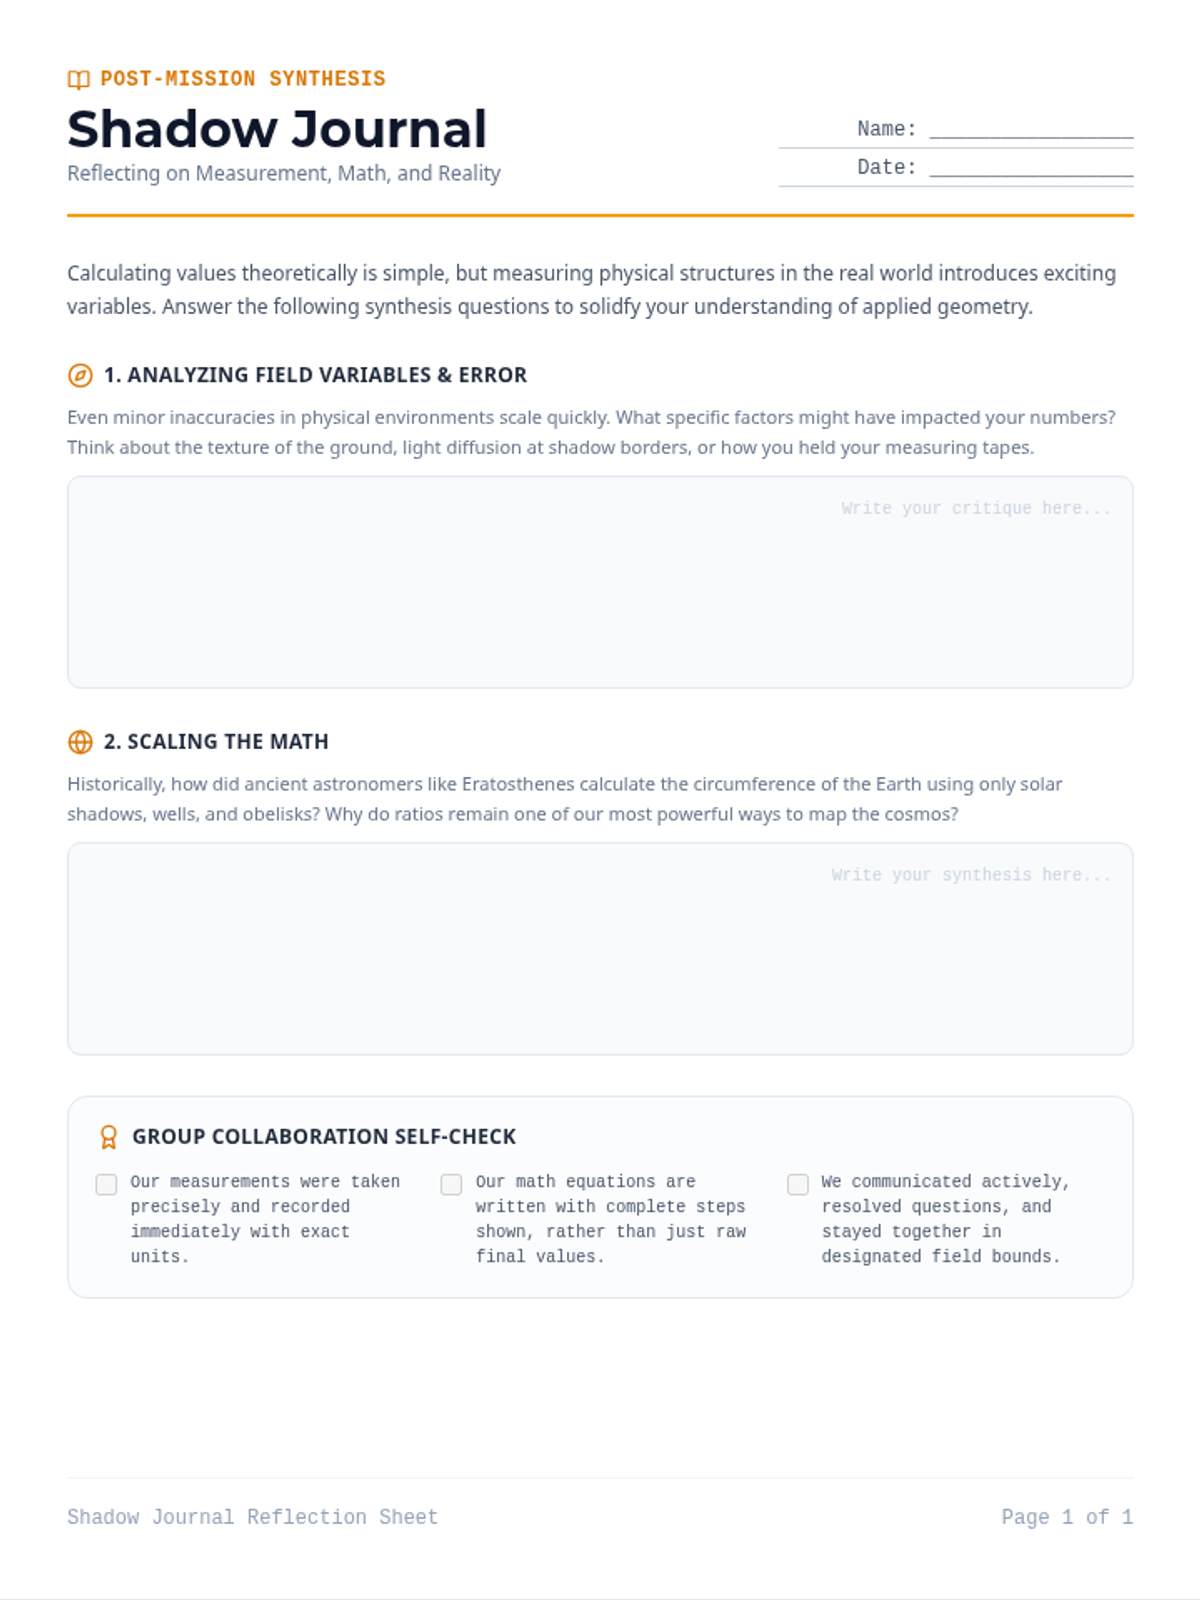
A hands-on geometry lesson where students head outdoors to measure shadows and use the Pythagorean theorem and geometric ratios to calculate the height of school structures. Includes a lesson plan, slide deck, outdoor activity guide, and reflection journal.
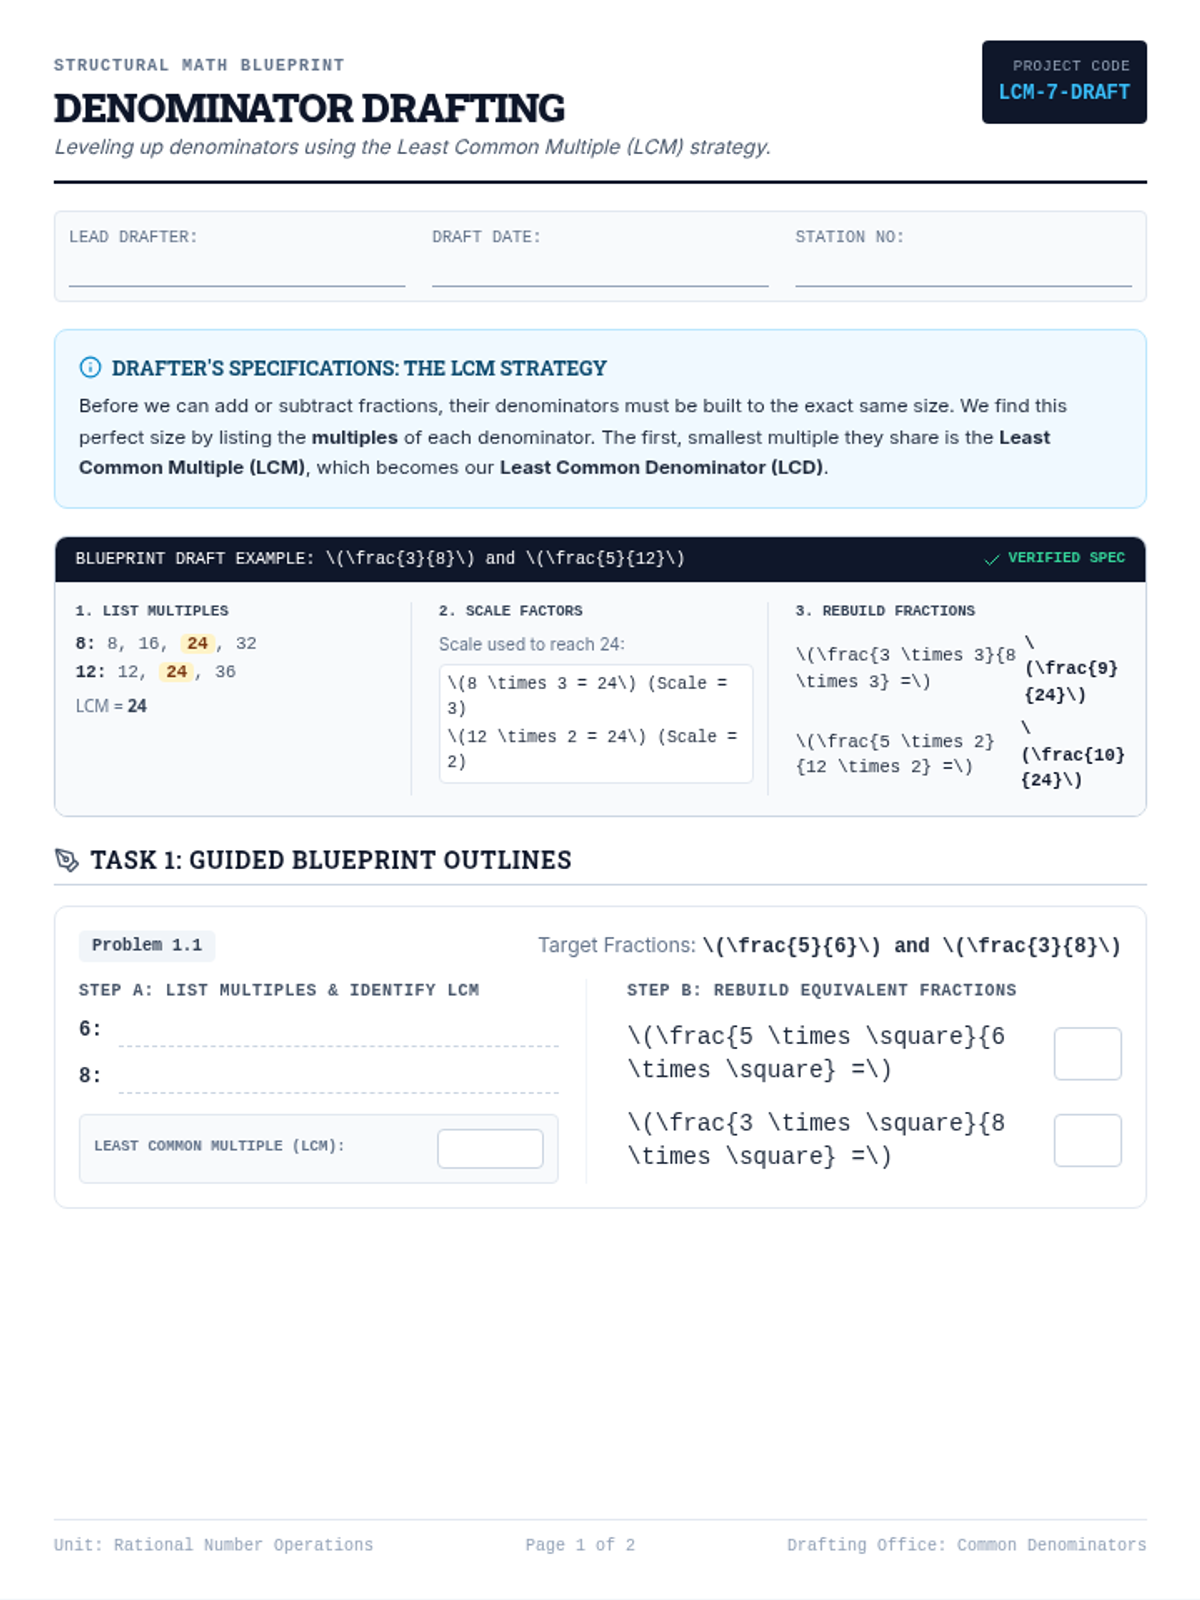
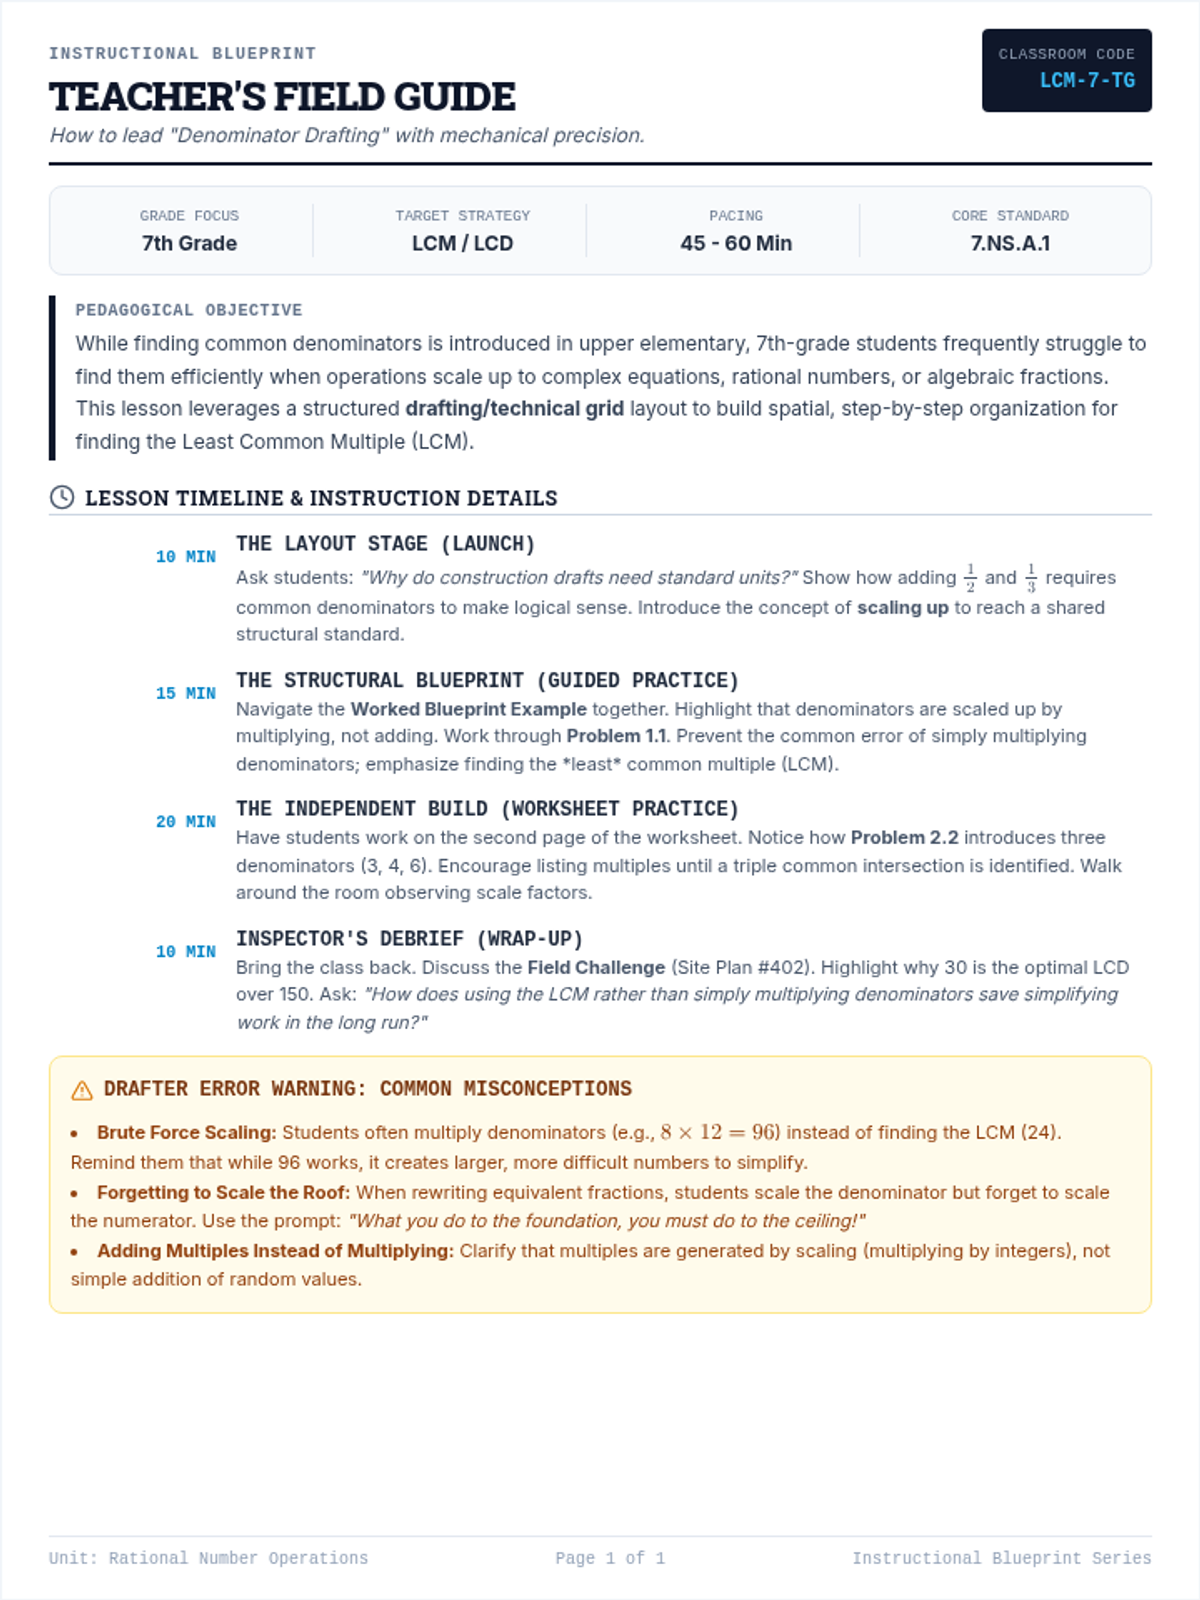
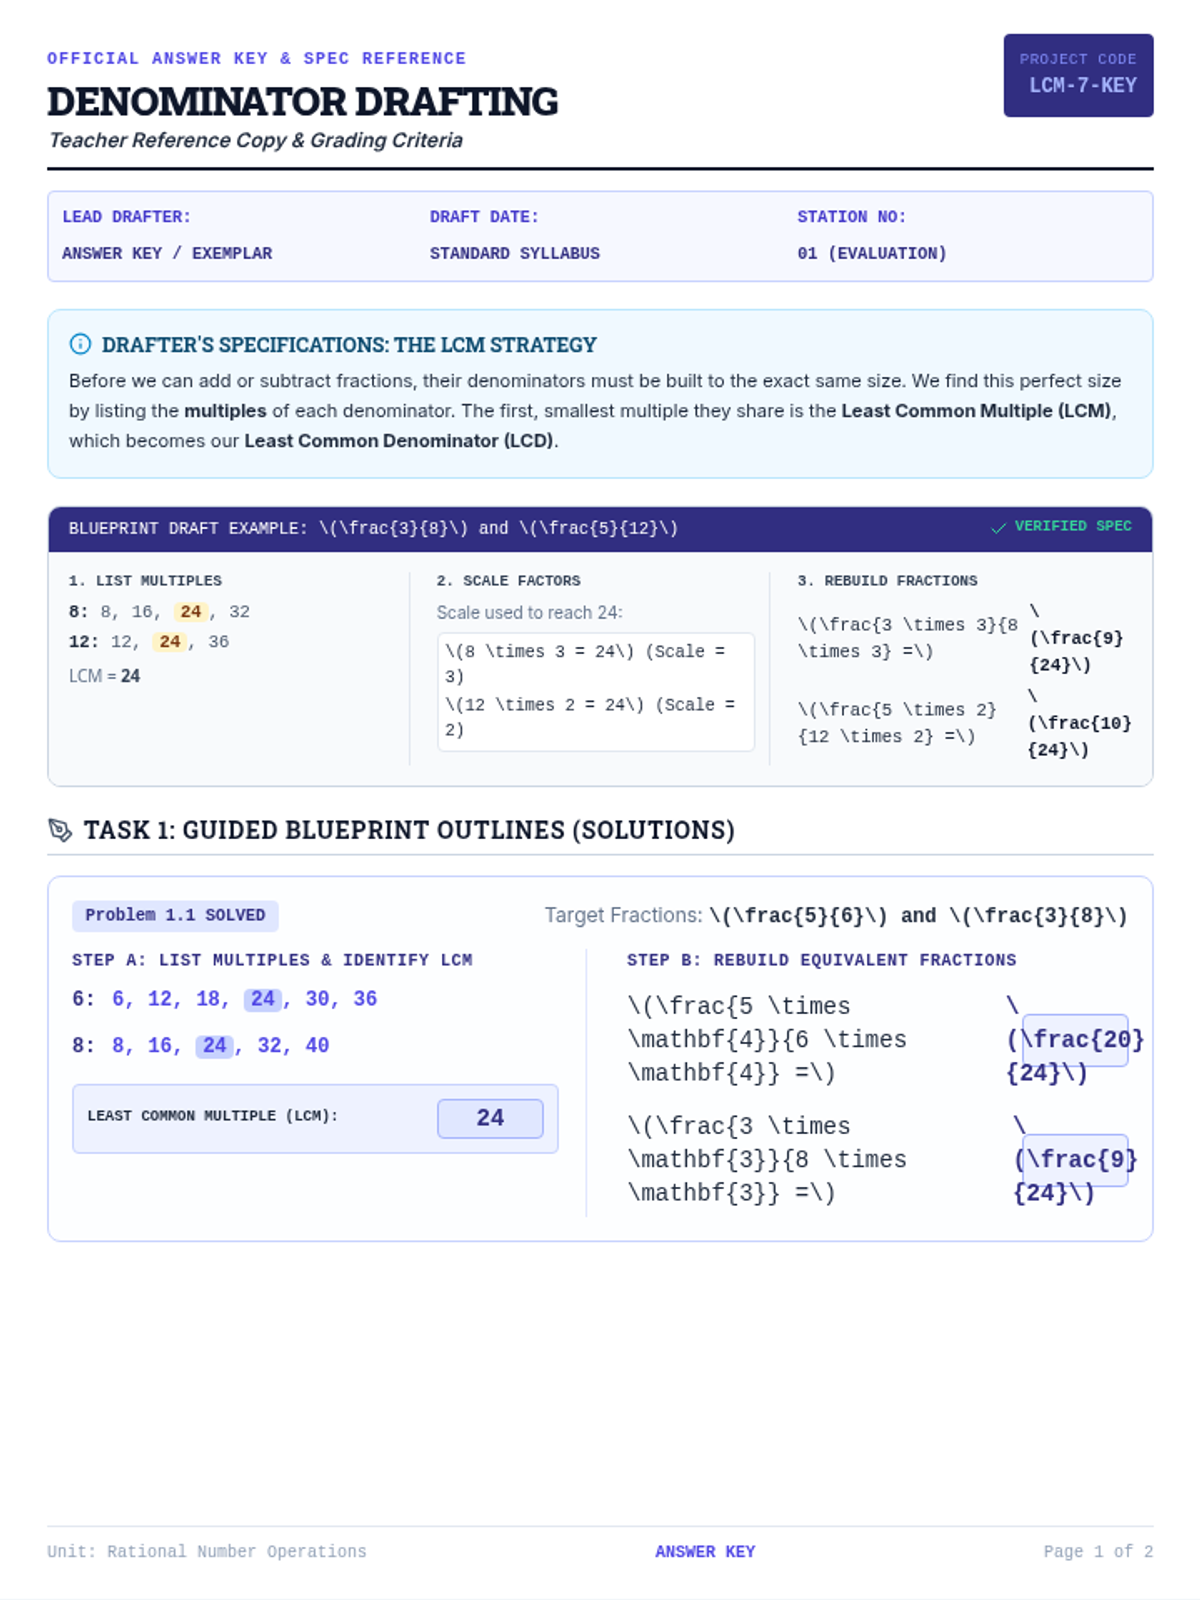
A scaffolded lesson for 7th-grade students to master finding common denominators using the Least Common Multiple (LCM) strategy, structured around a technical blueprint drafting theme.
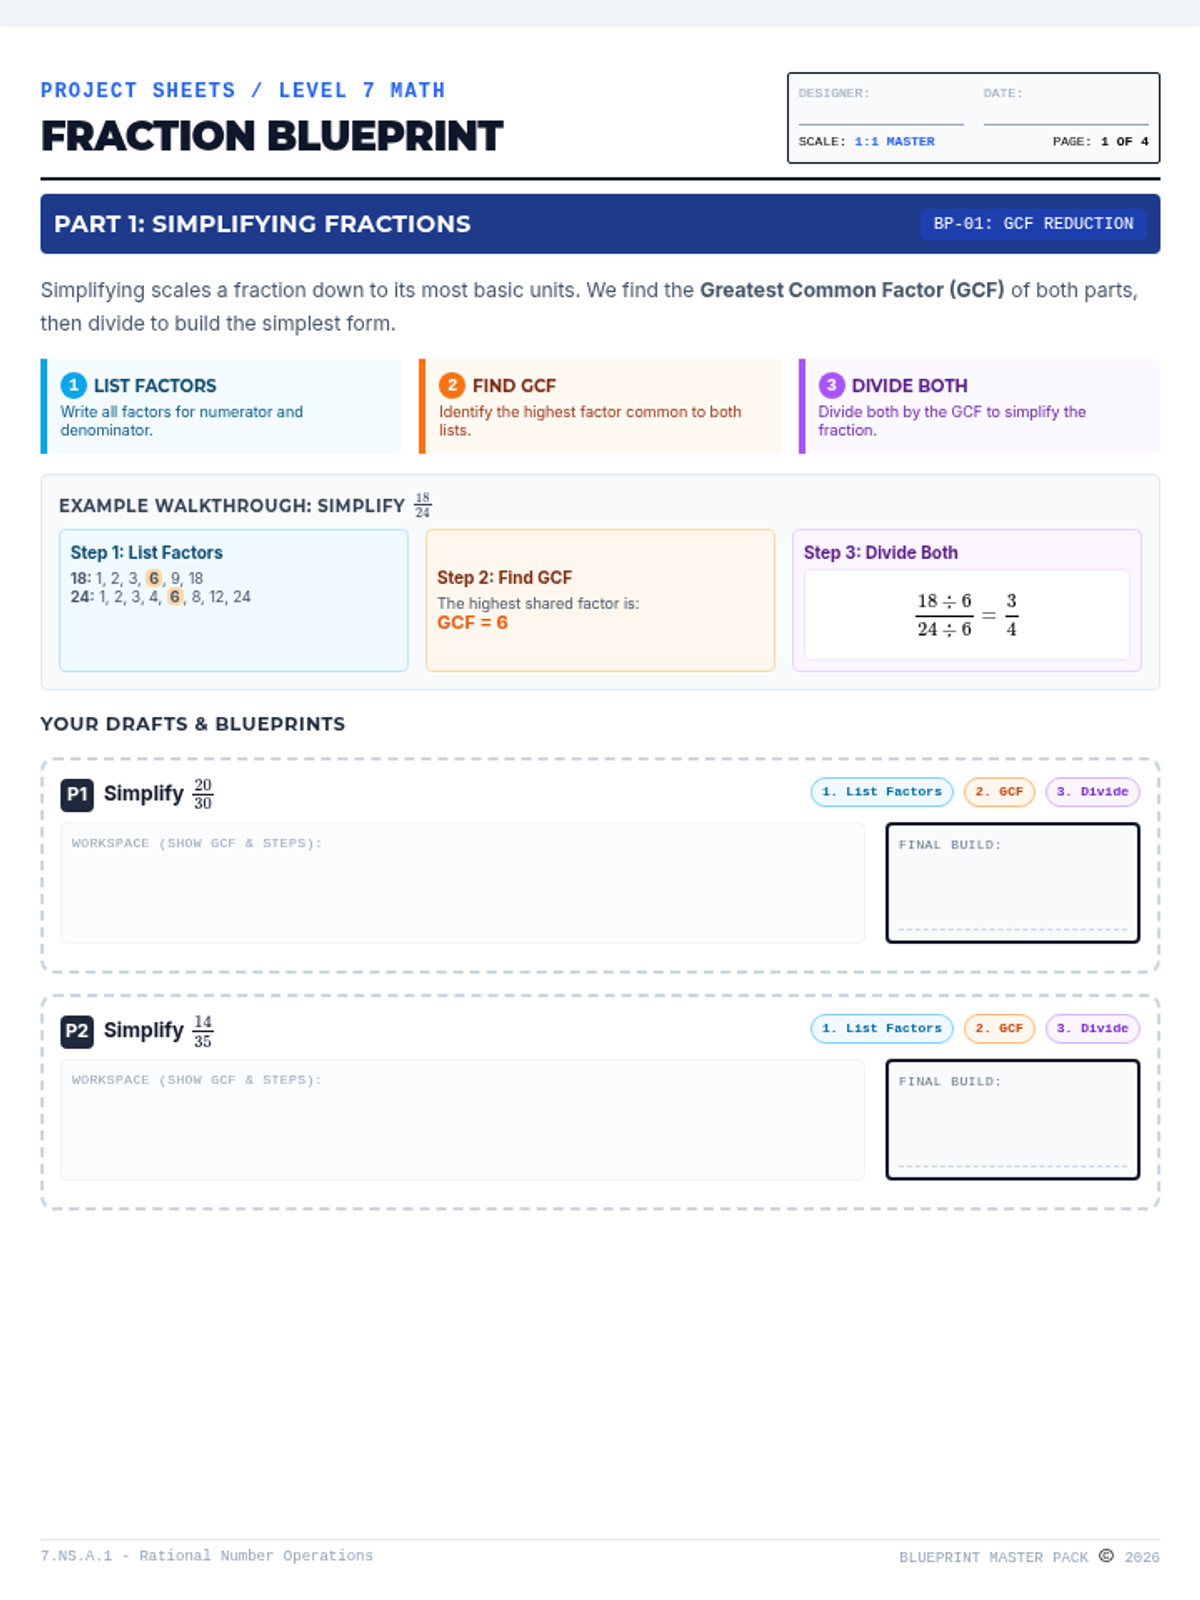
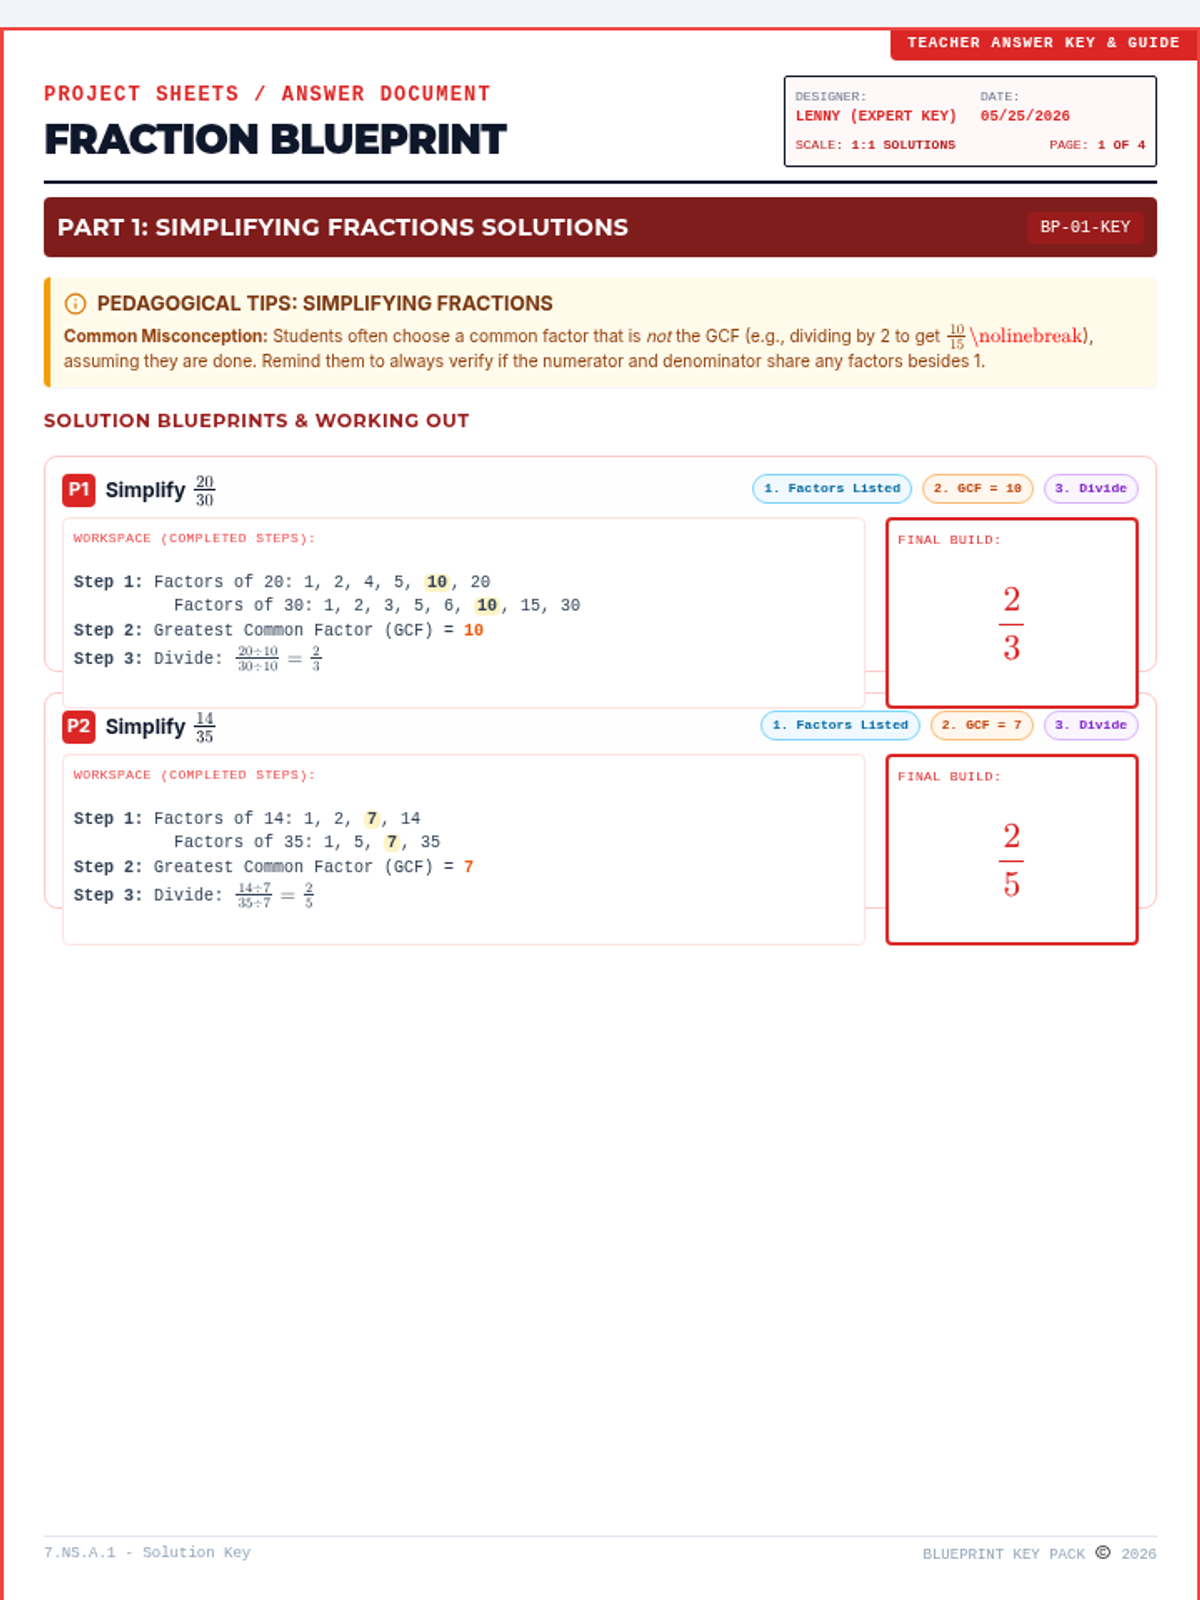
A structured, 7th-grade lesson on fraction operations (simplifying, finding common denominators, adding, subtracting, multiplying, and dividing) with color-coded step-by-step guides to support learners.
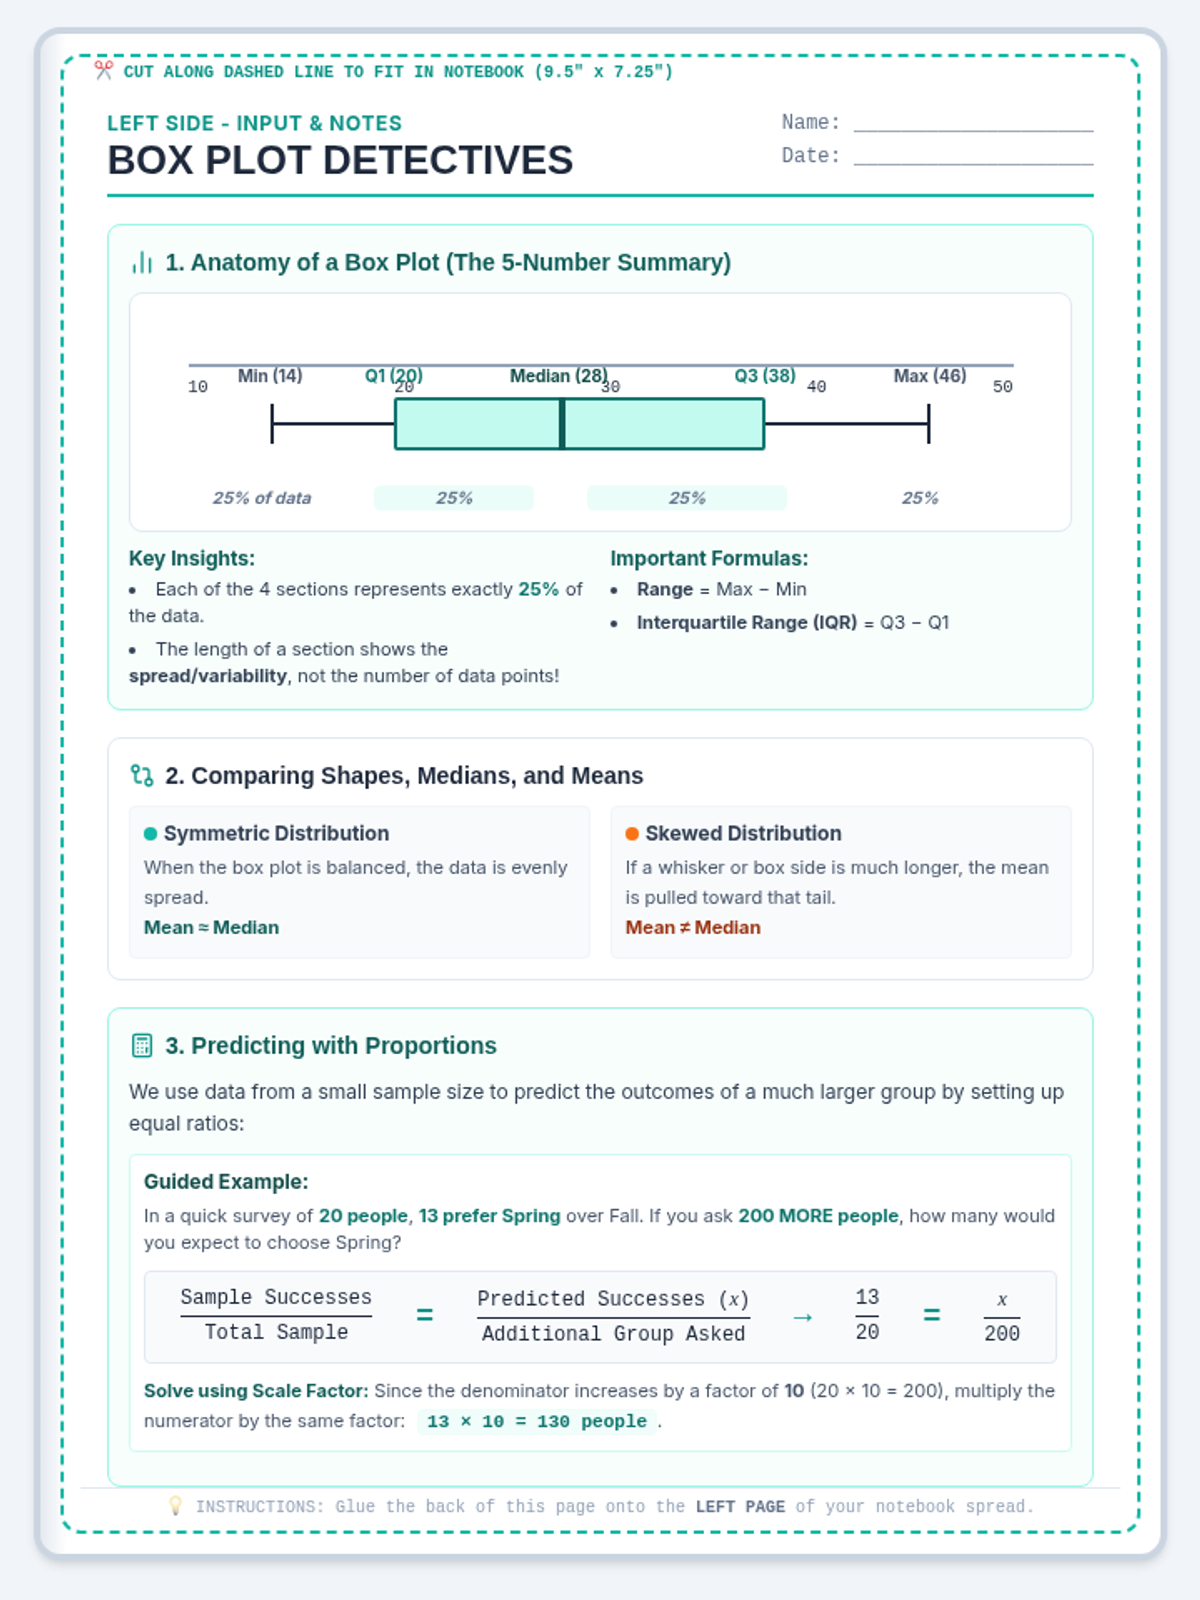
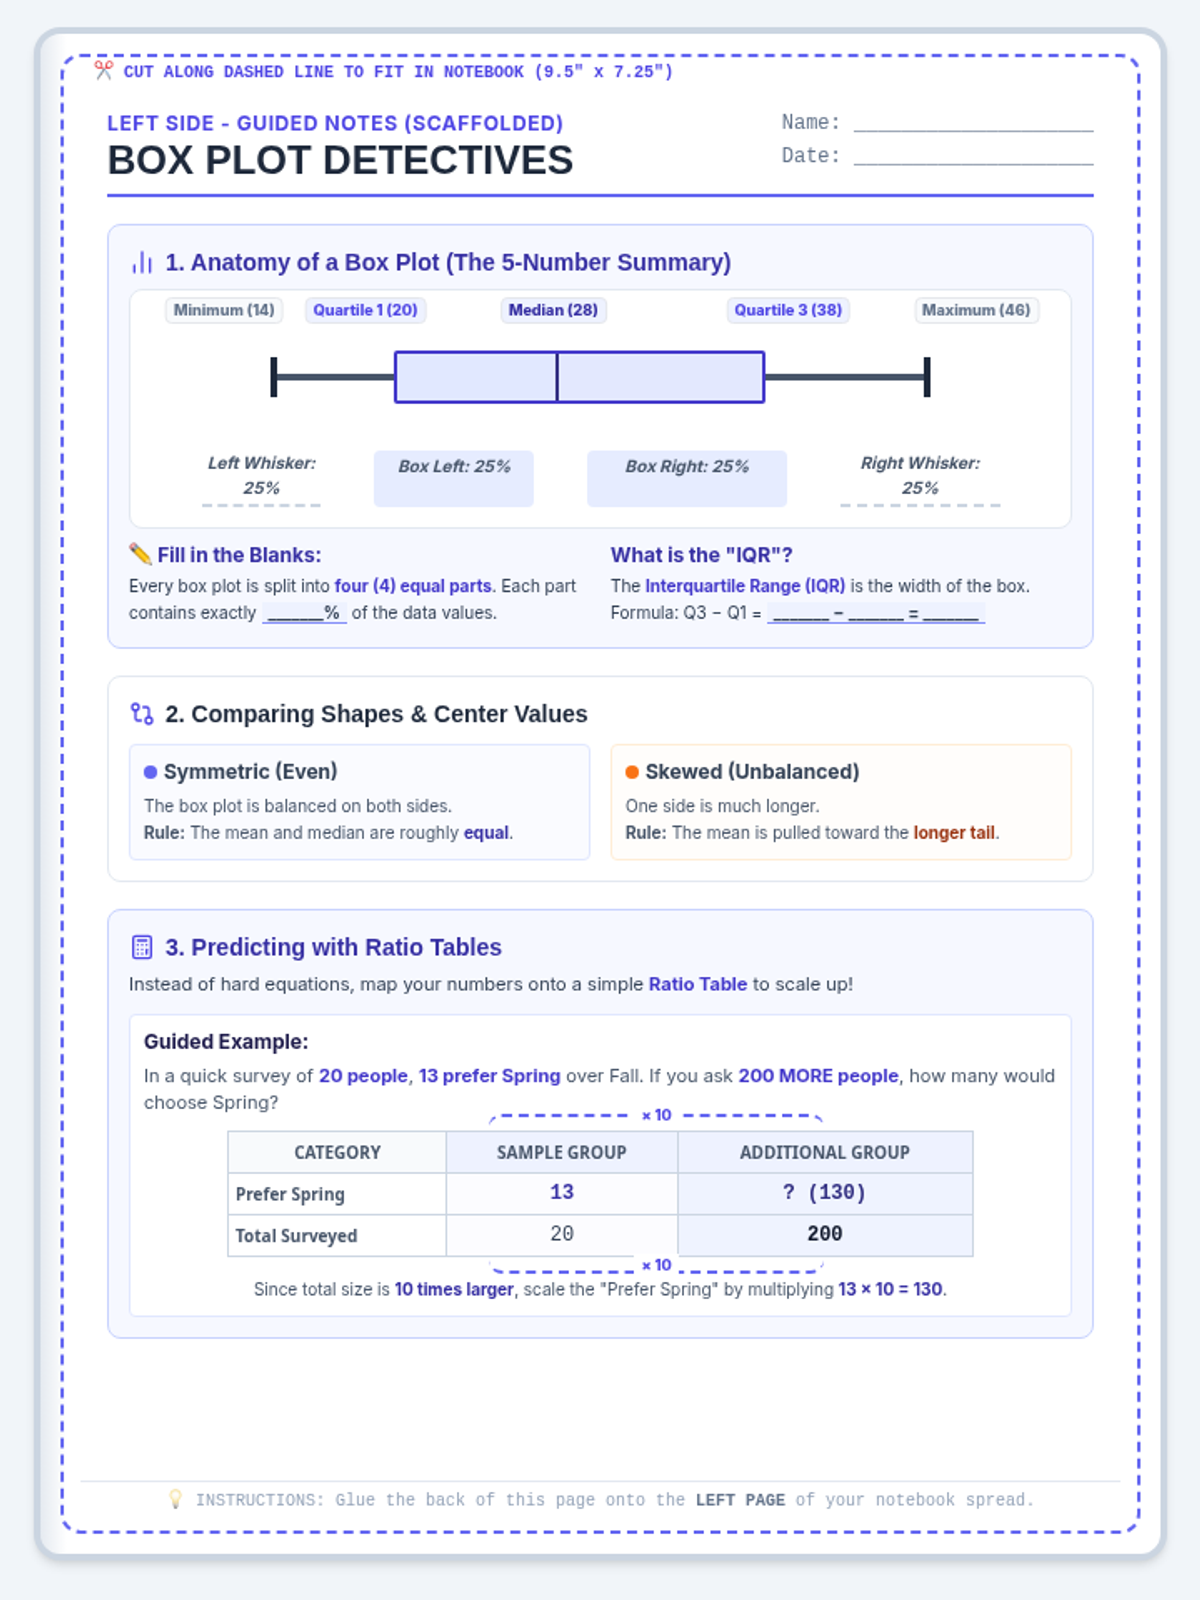
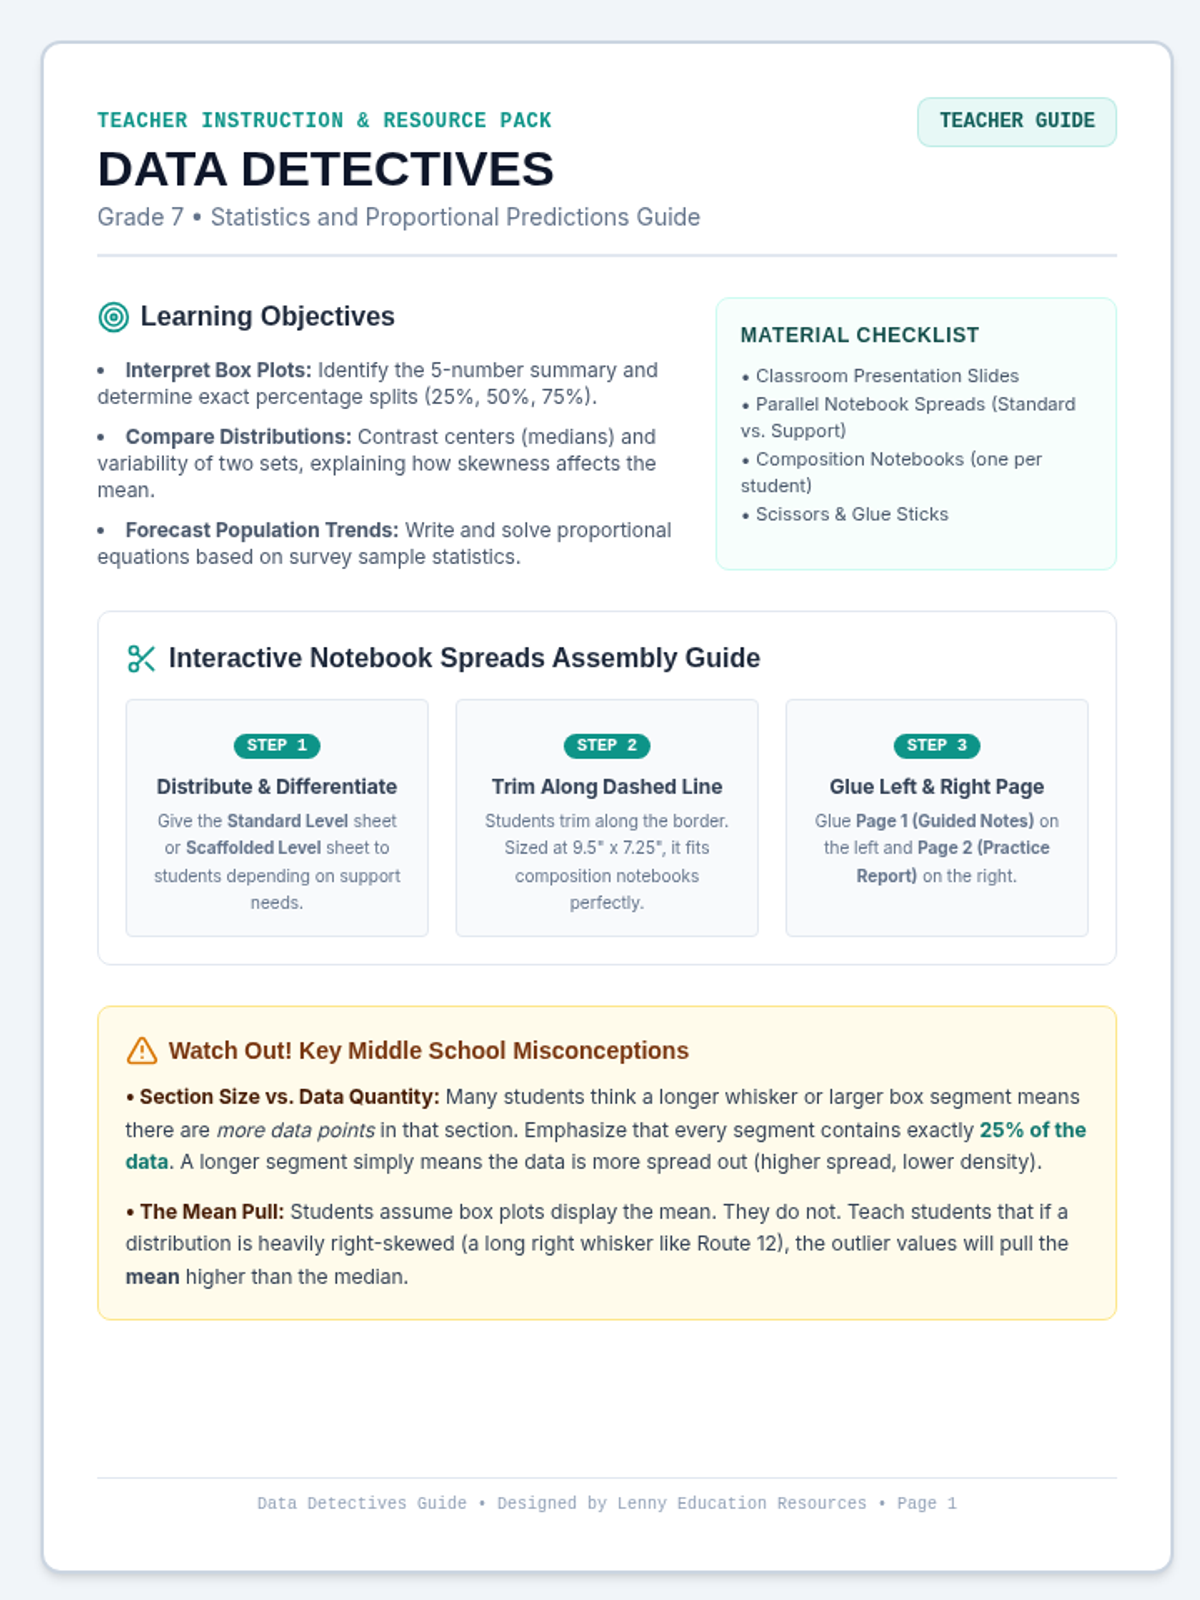
A middle school statistics lesson focused on comparing box plots, understanding quartiles, and making proportional predictions using sample data. Includes parallel standard and scaffolded interactive notebook spreads.
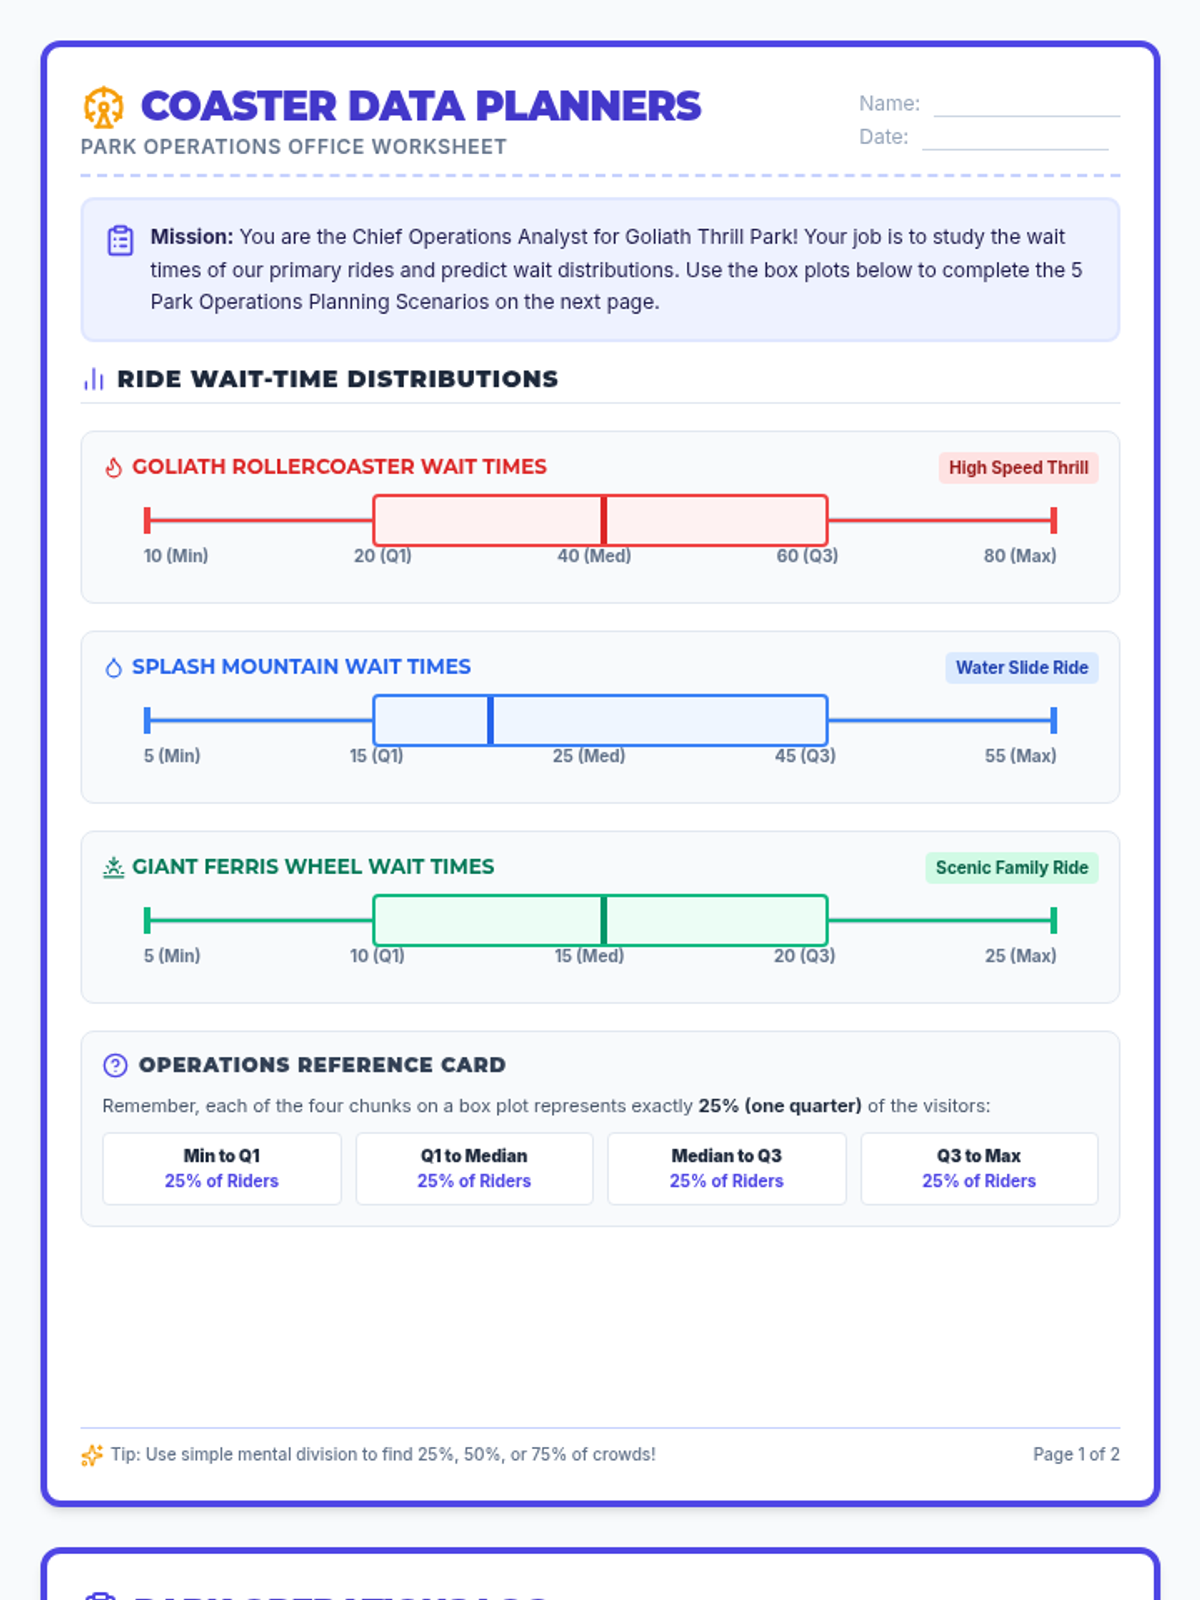
An engaging amusement park themed math lesson where 7th-grade students act as park planners. Reading ride wait-time box plots, students solve realistic visitor volume predictions with simple percentage calculations.
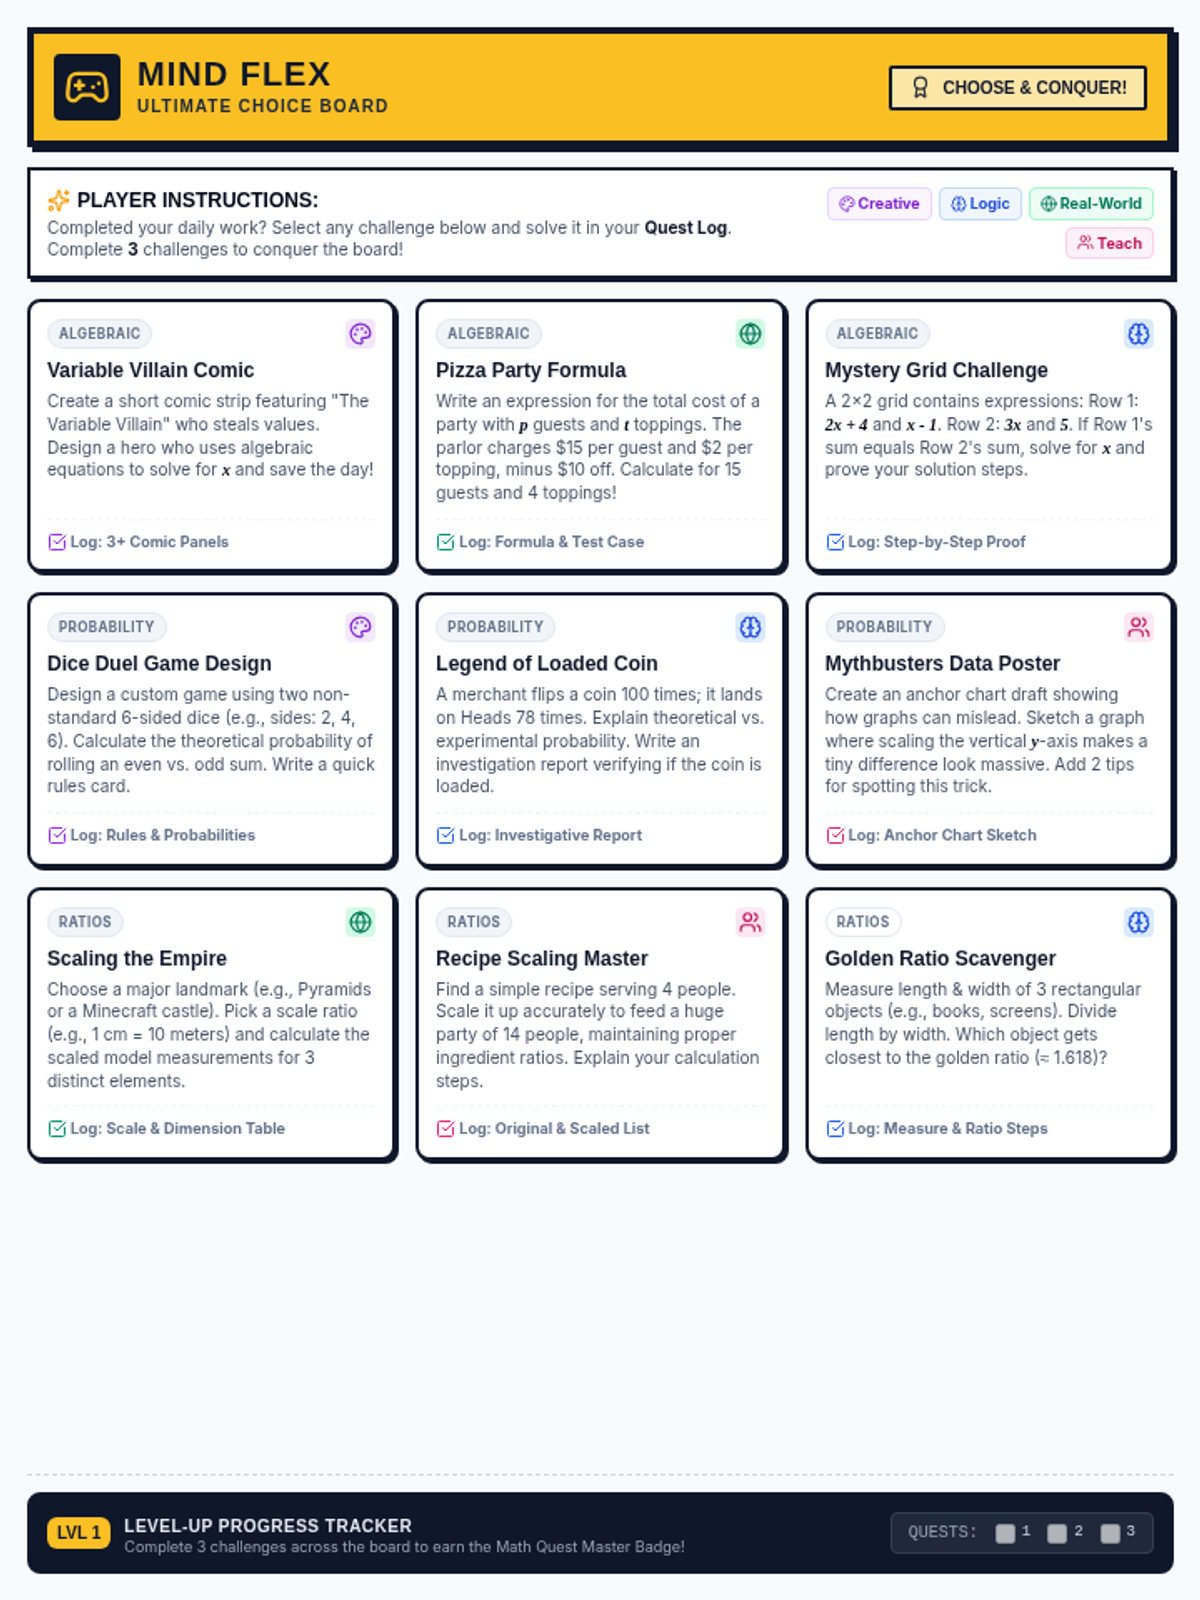
A collection of high-interest, independent math challenges for early finishers, covering Algebraic Expressions, Probability & Statistics, and Ratios & Proportions. Features creative projects, real-world applications, logic puzzles, and peer-teaching activities.
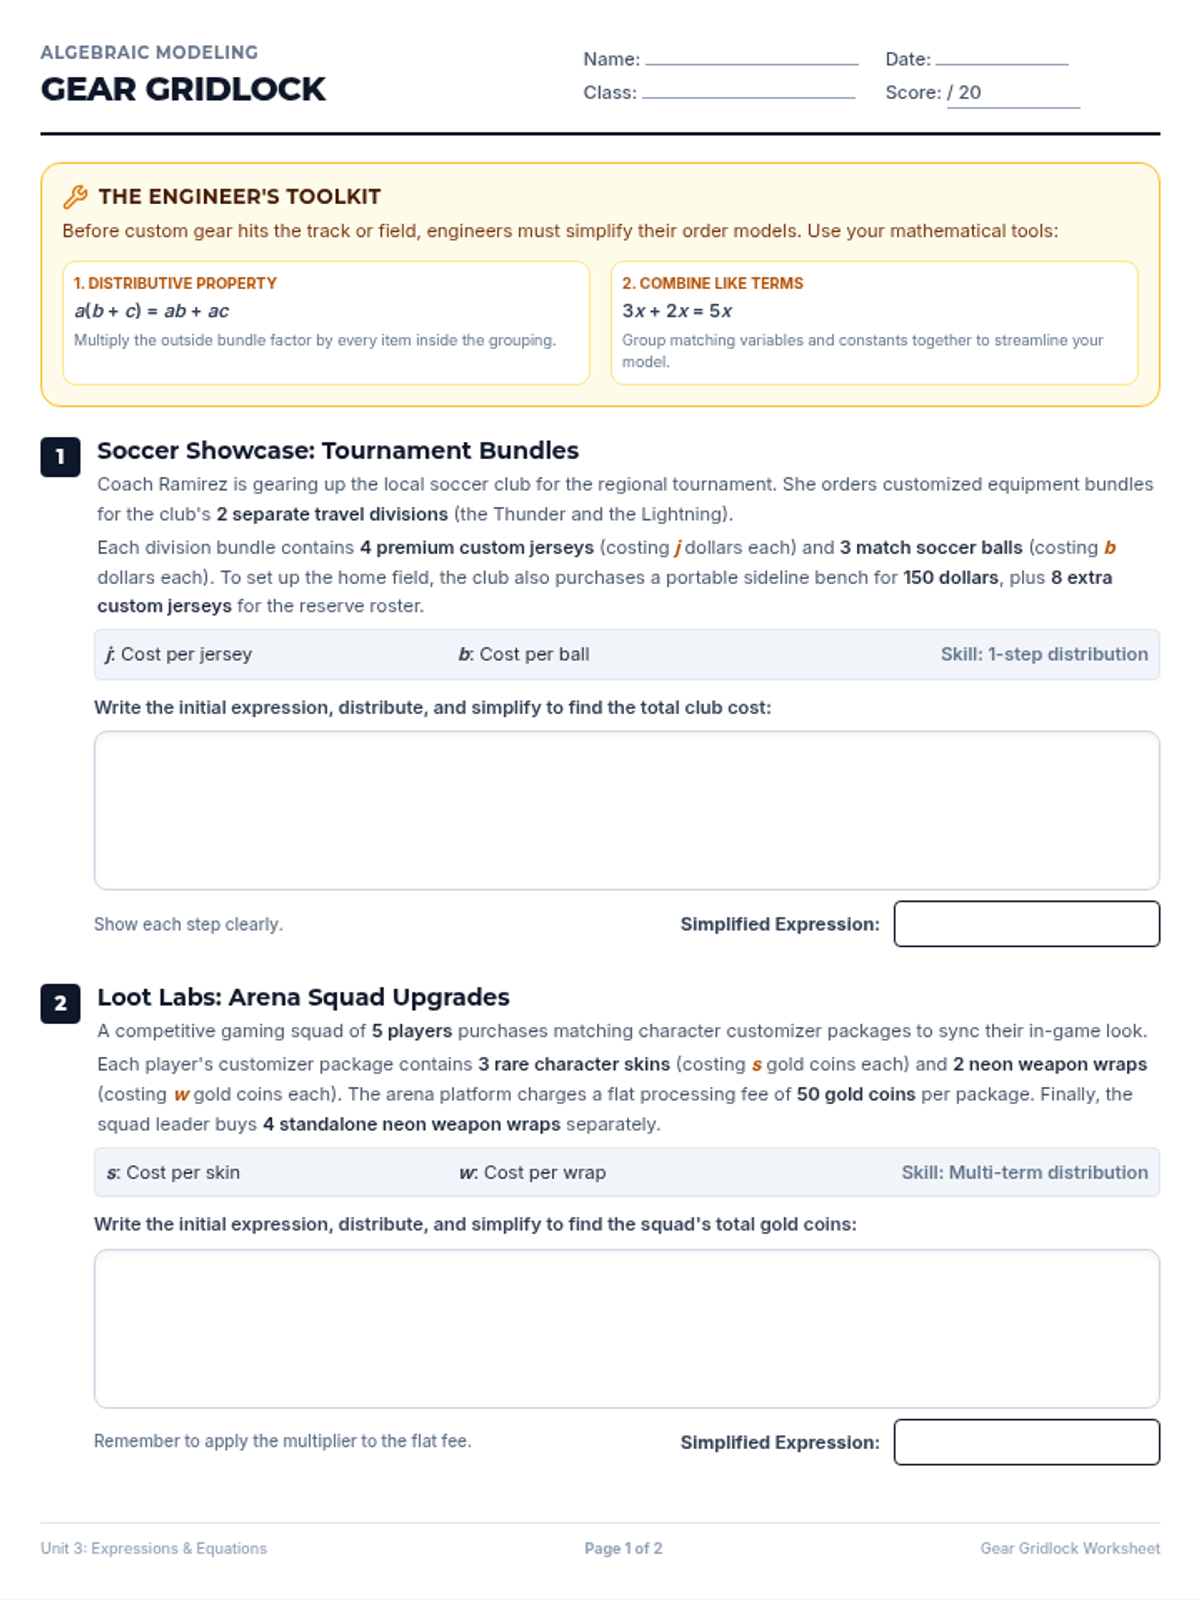
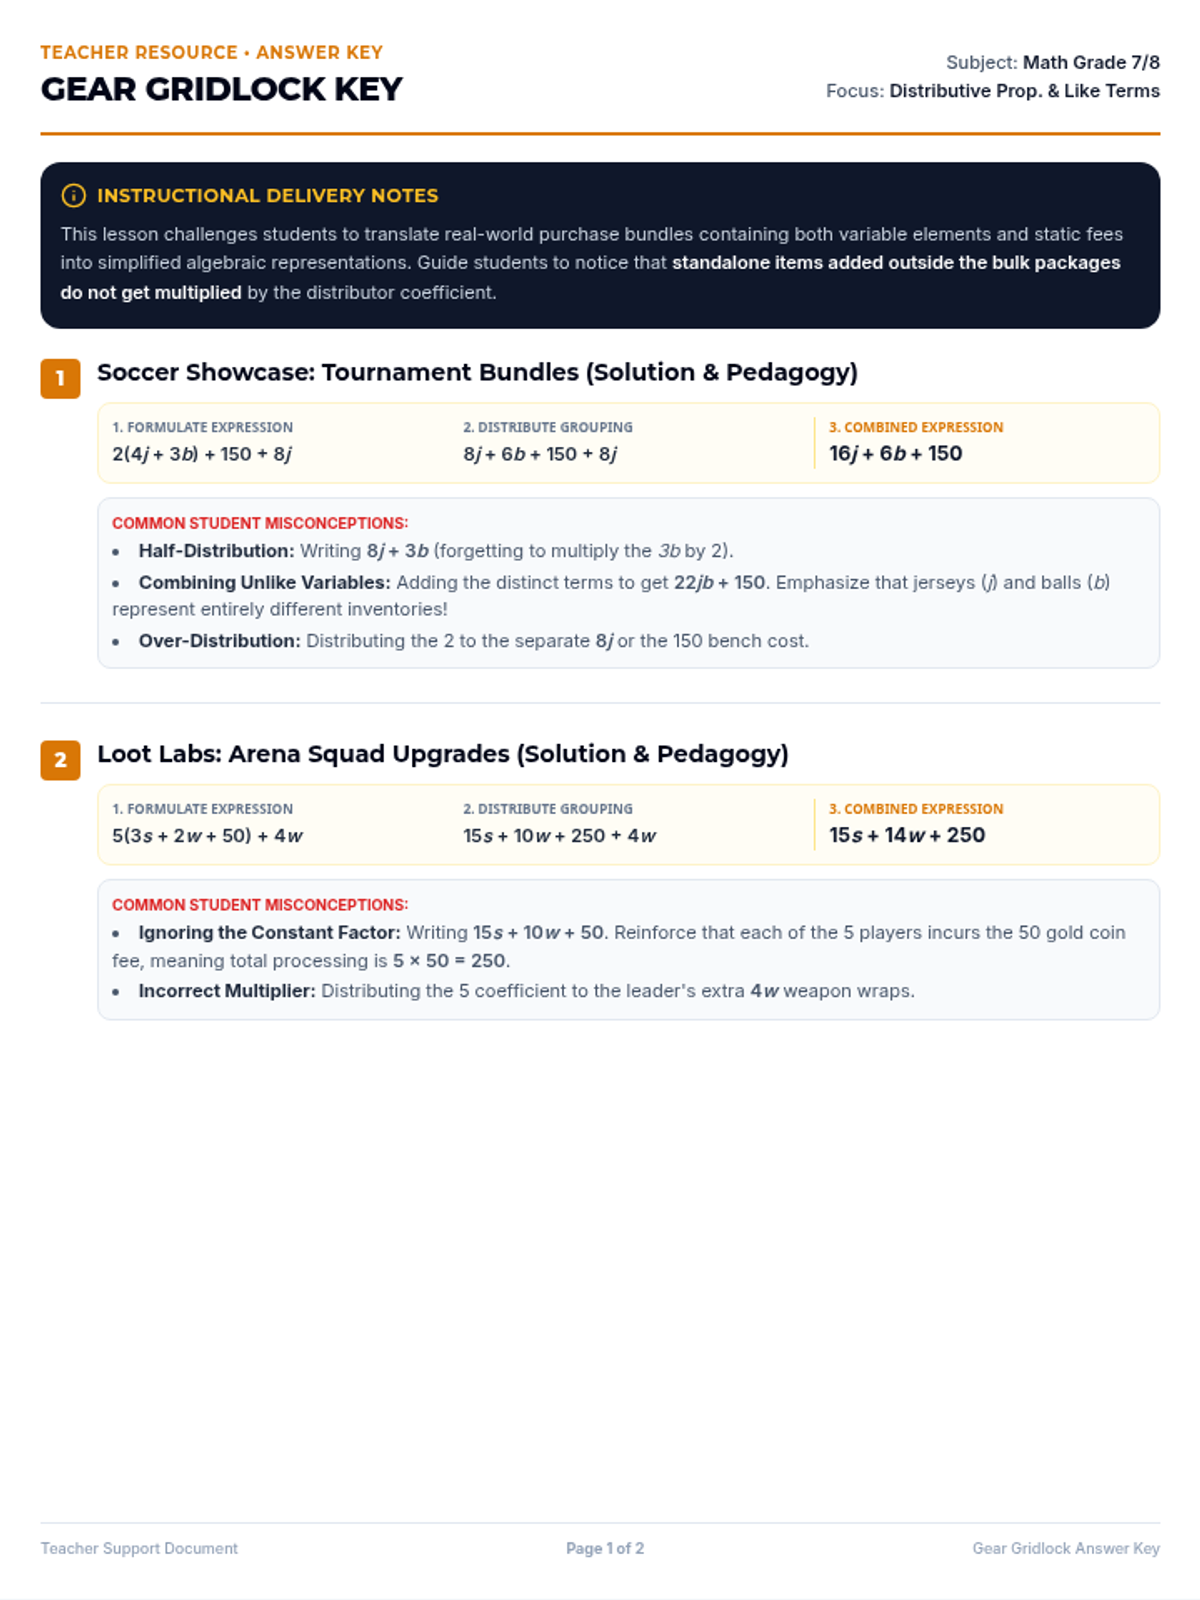
A middle school algebraic modeling lesson. Students use the distributive property and combine like terms to simplify expressions inspired by real-world gears, soccer bundles, customized sneakers, gaming loot packages, and dirt bike maintenance packs.
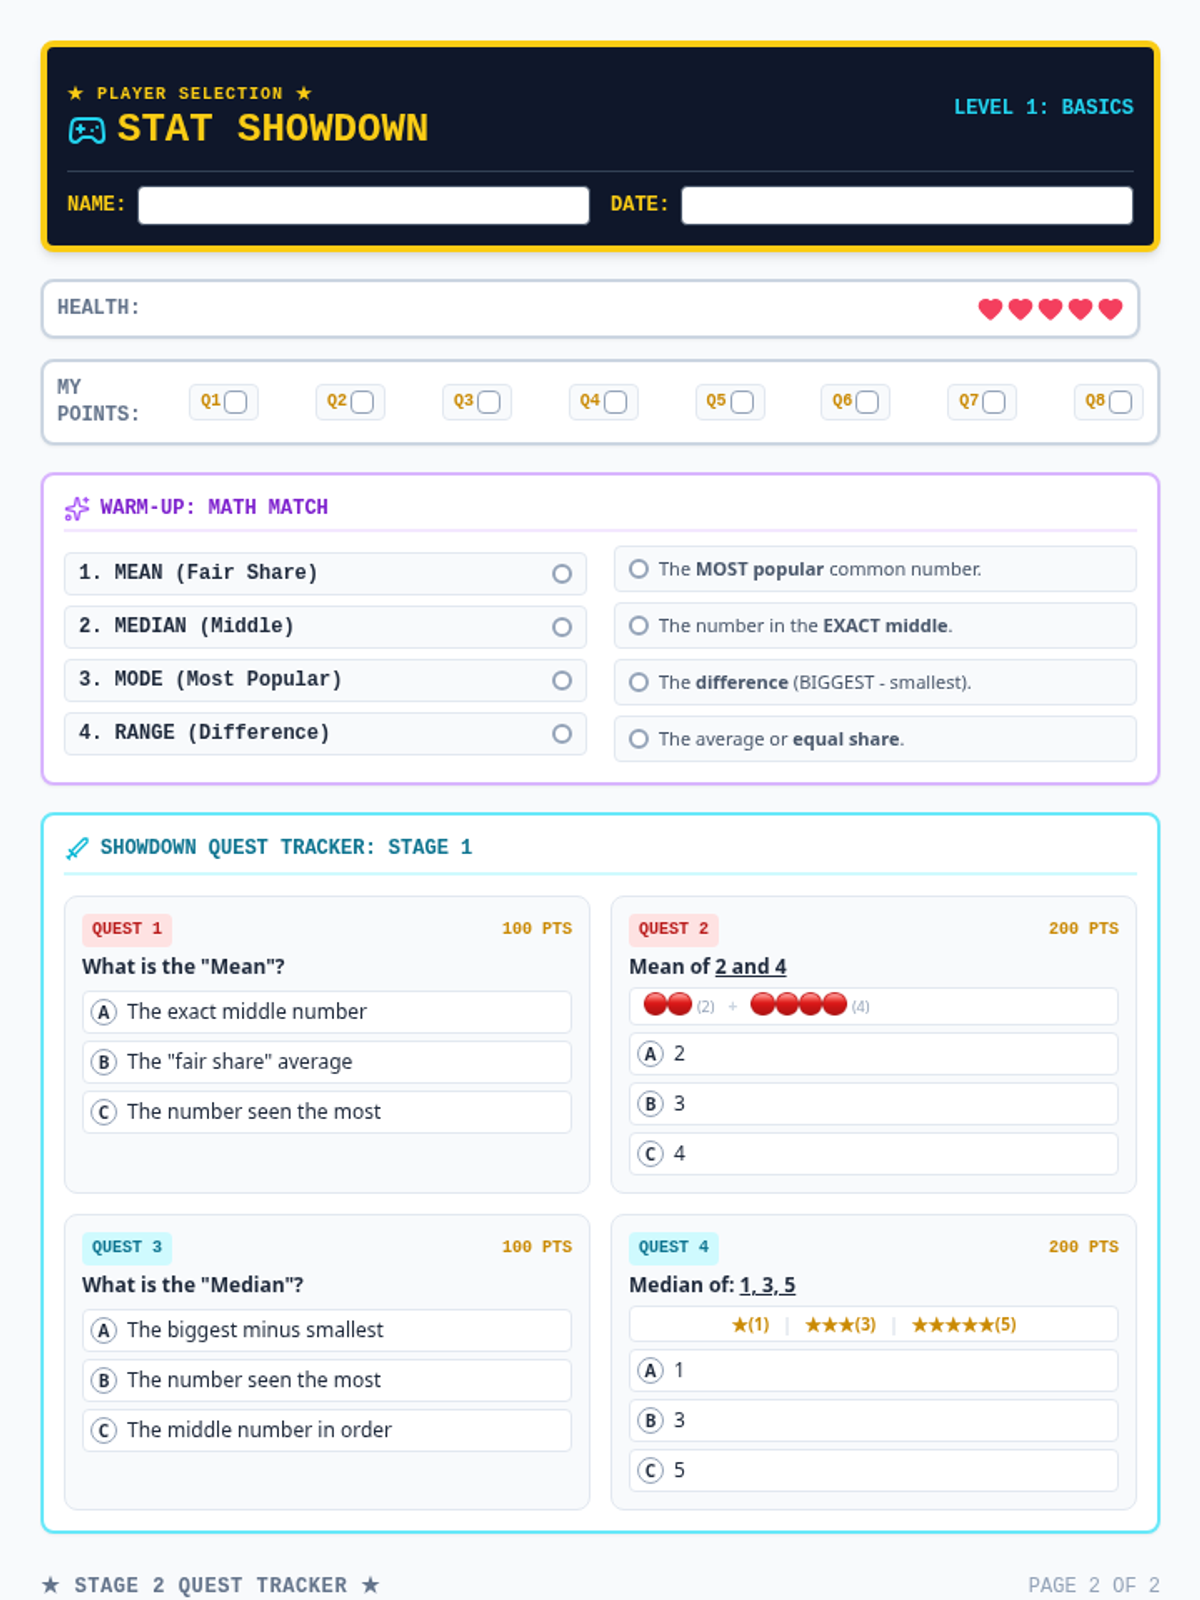
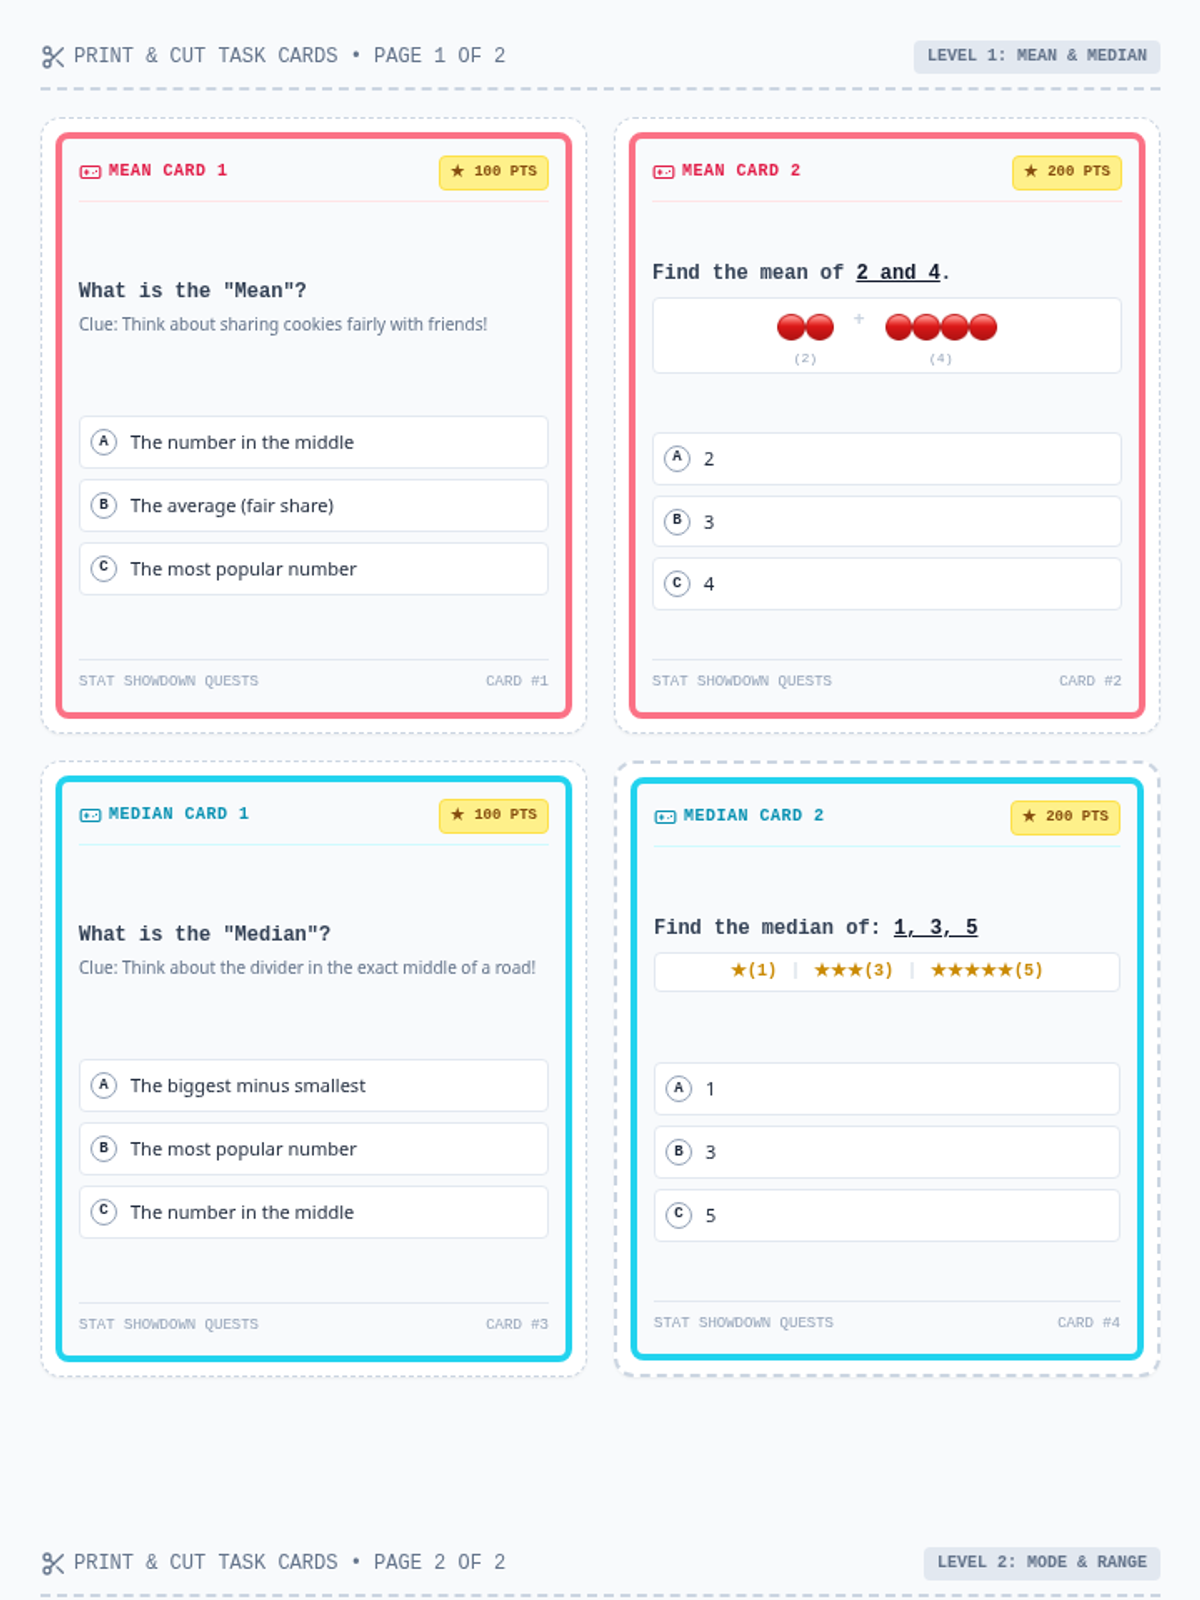
A retro-arcade themed lesson on mean, median, mode, and range modified for IEP students. Features simplified definition-focused questions, single-digit numbers with visual counters, and multiple-choice options.
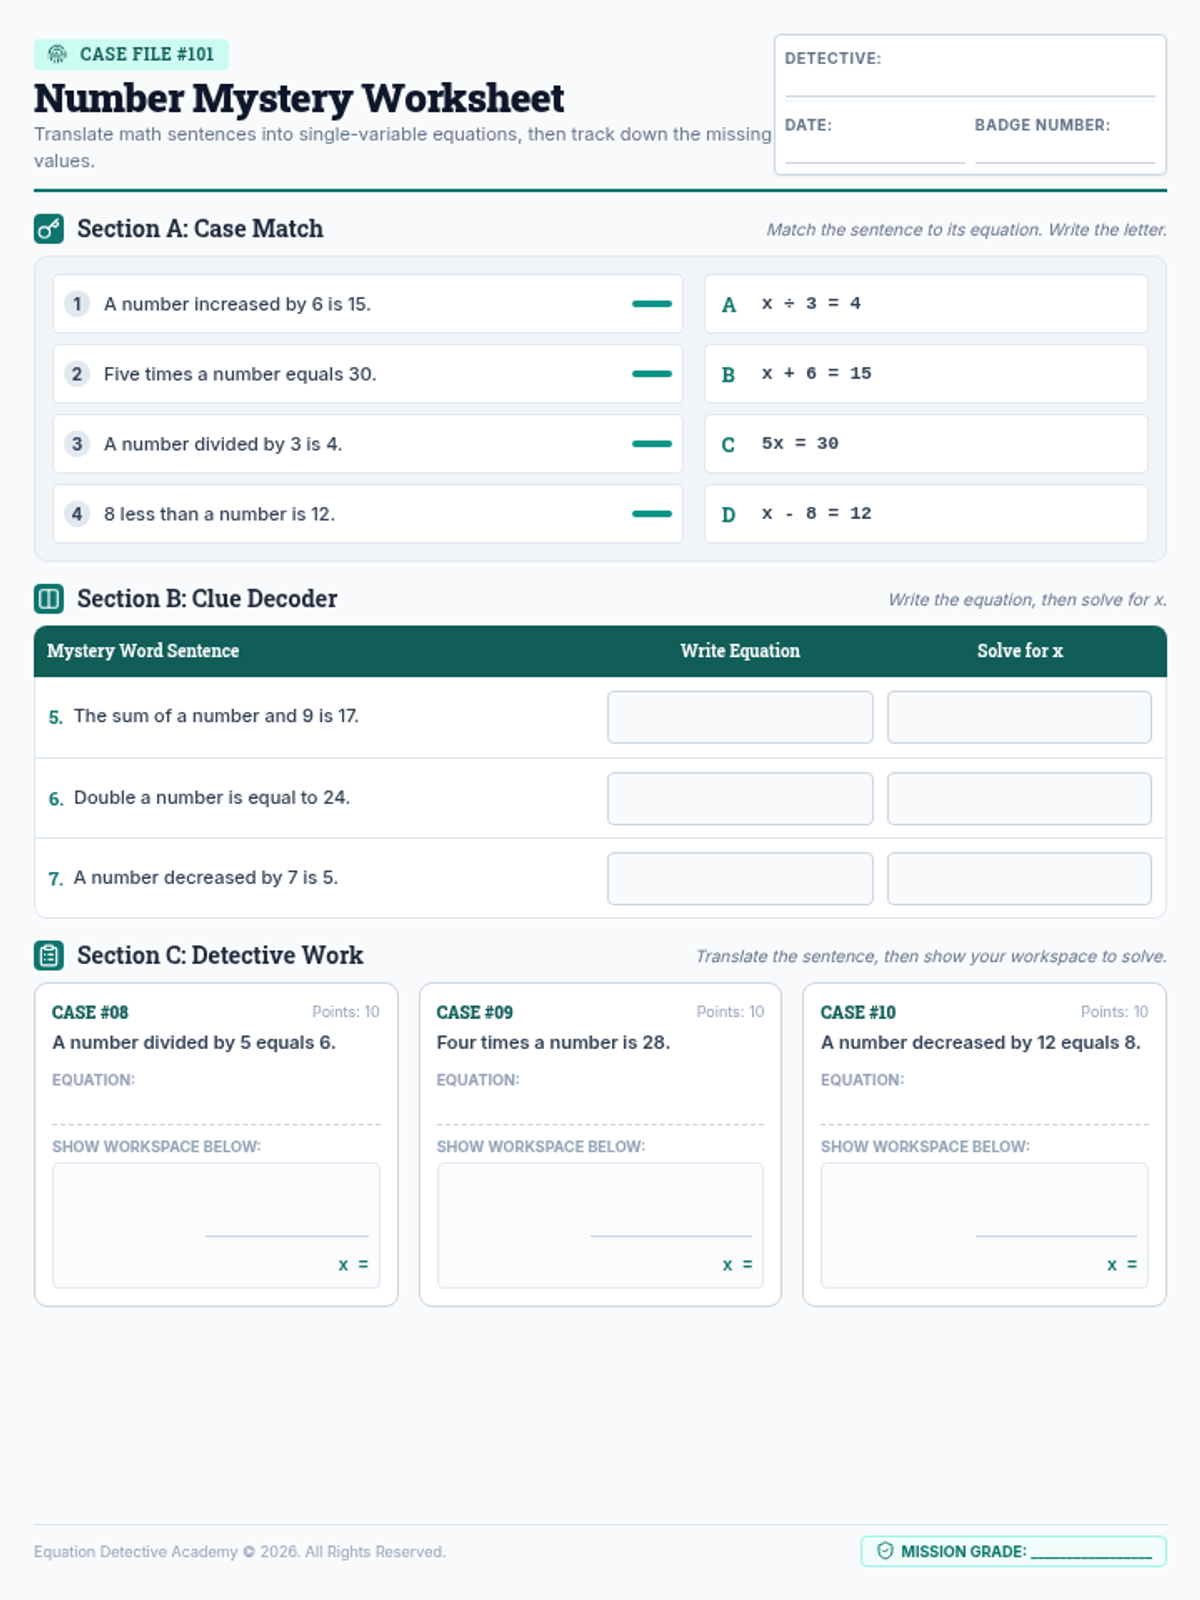
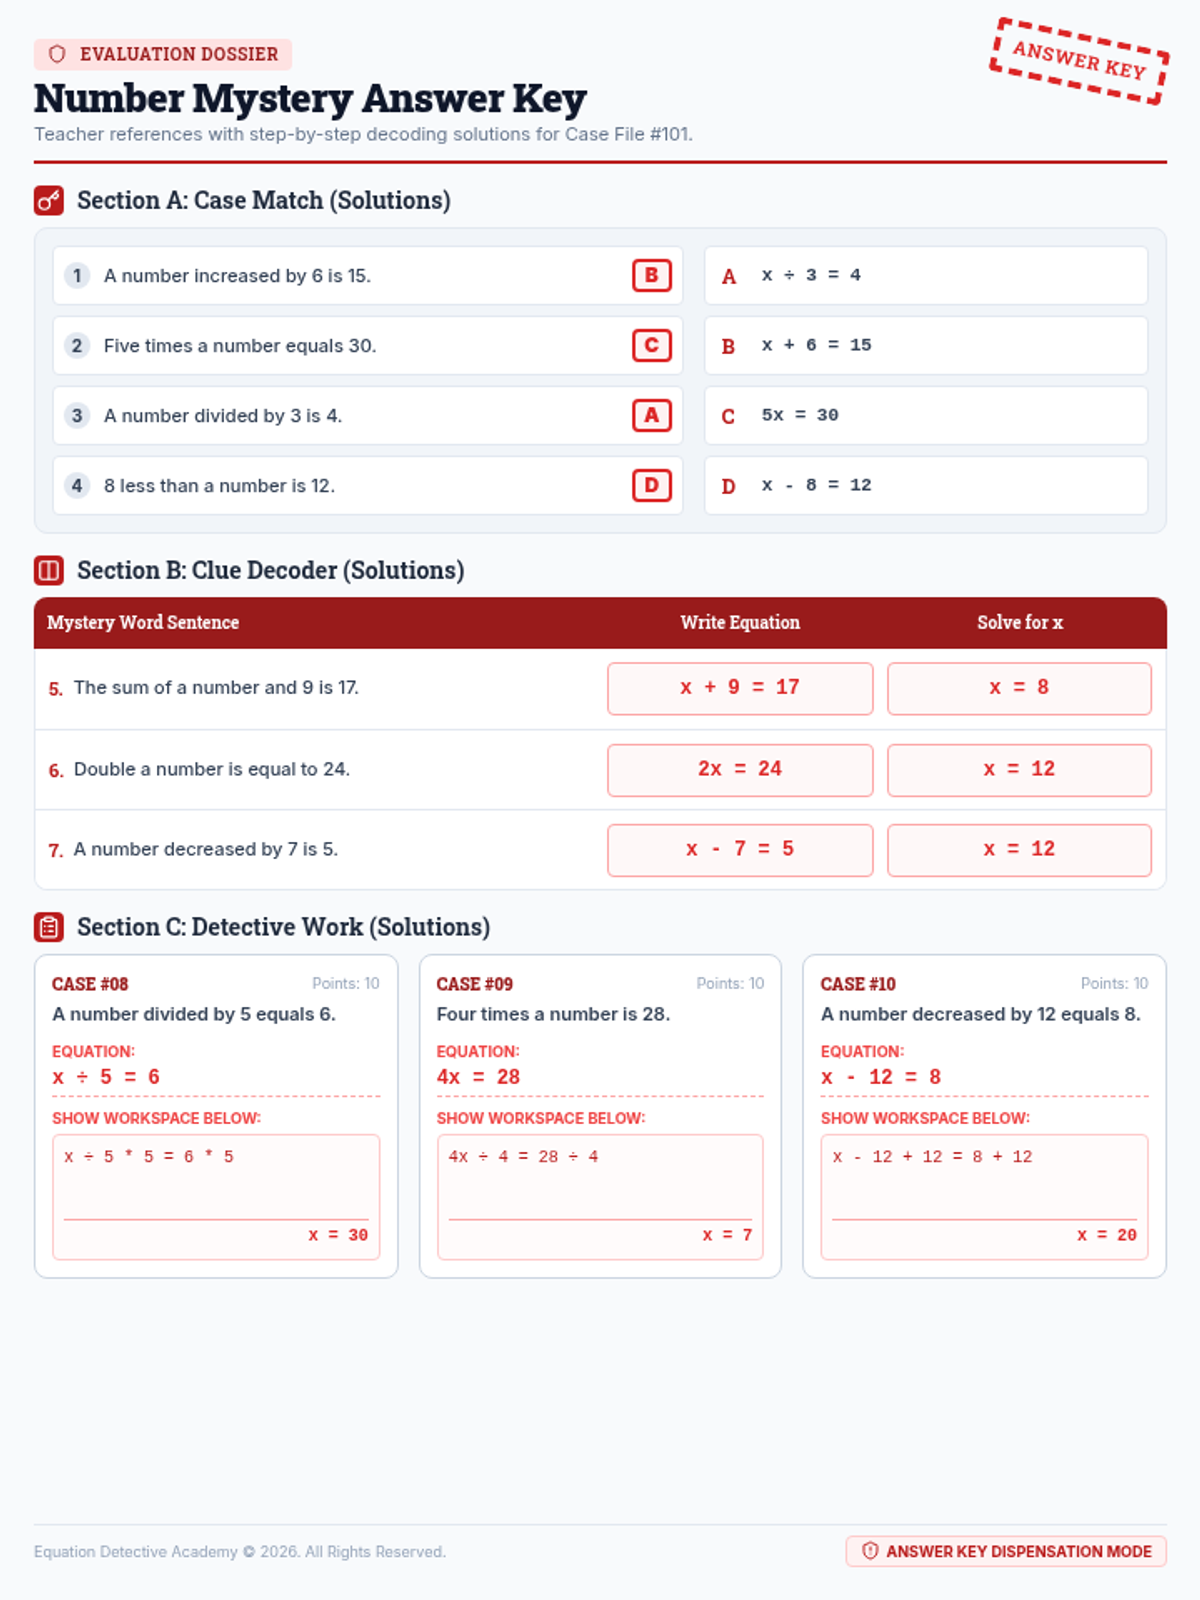
A beginner-friendly algebra lesson focused on translating word sentences into single-variable equations and solving them. Students learn to decode mathematical language and apply inverse operations using only positive whole numbers.
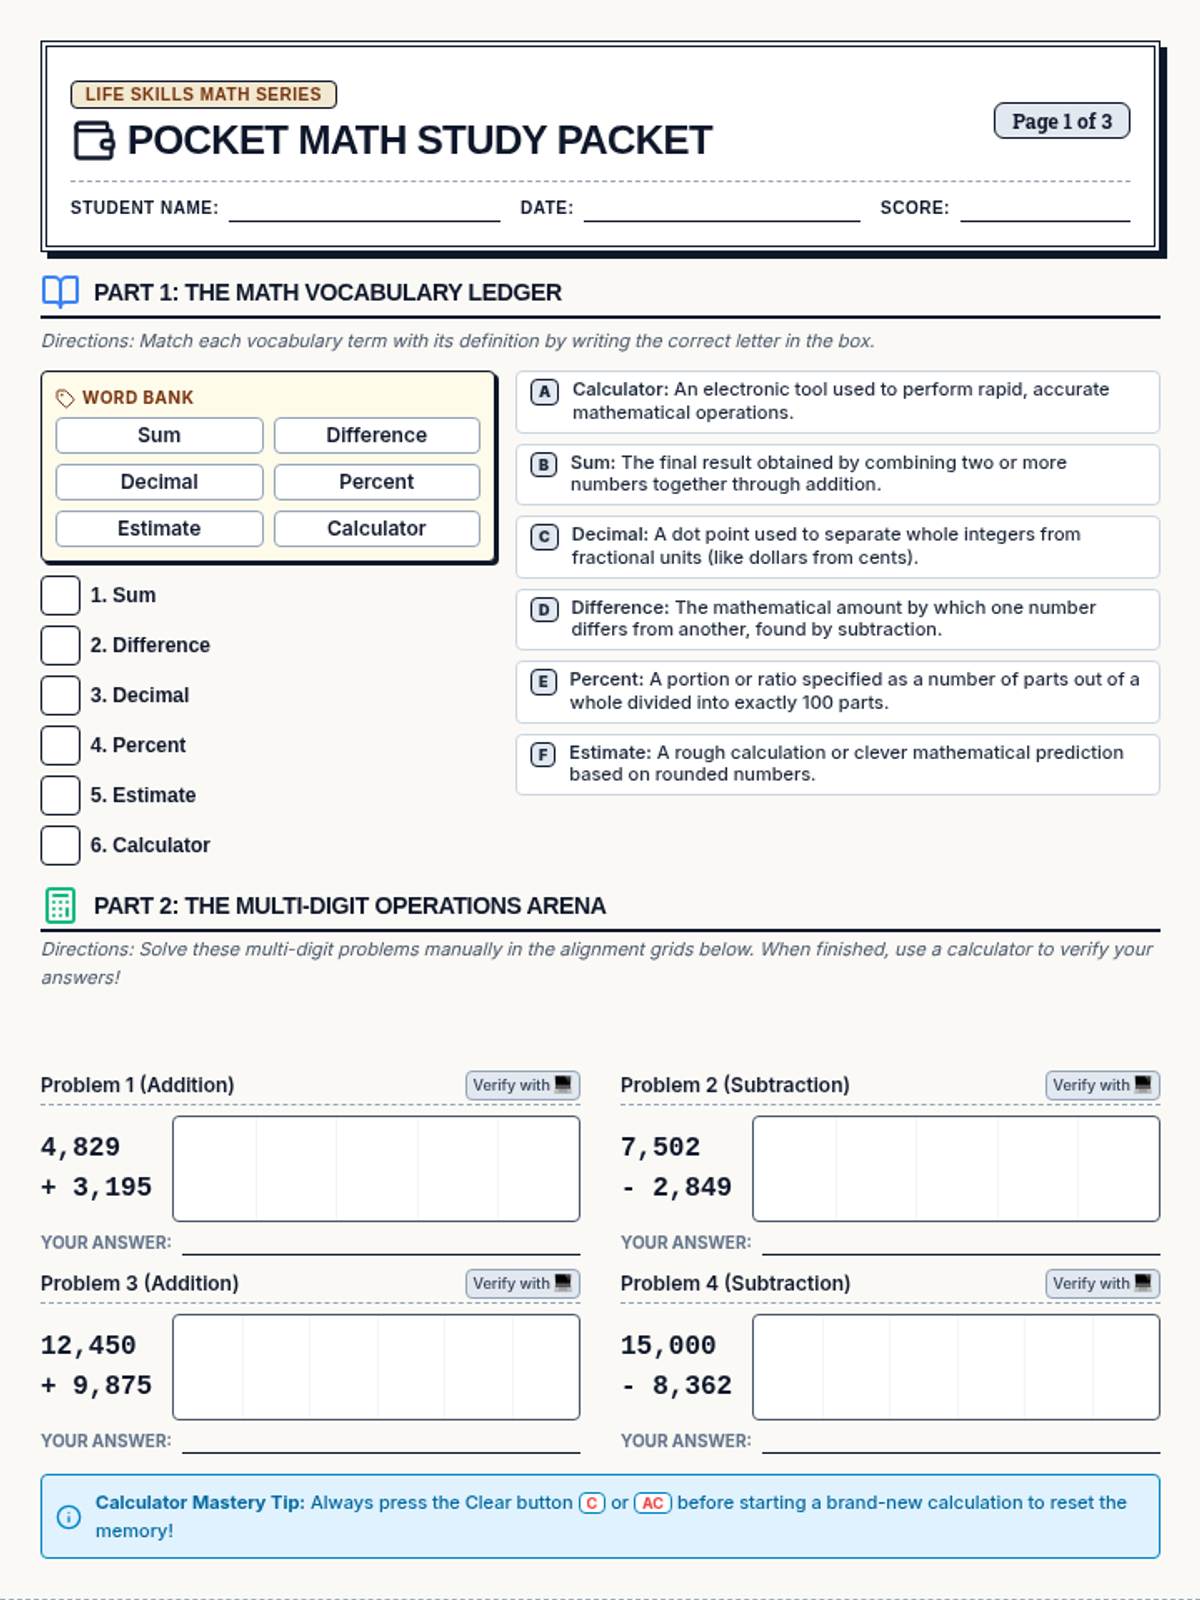
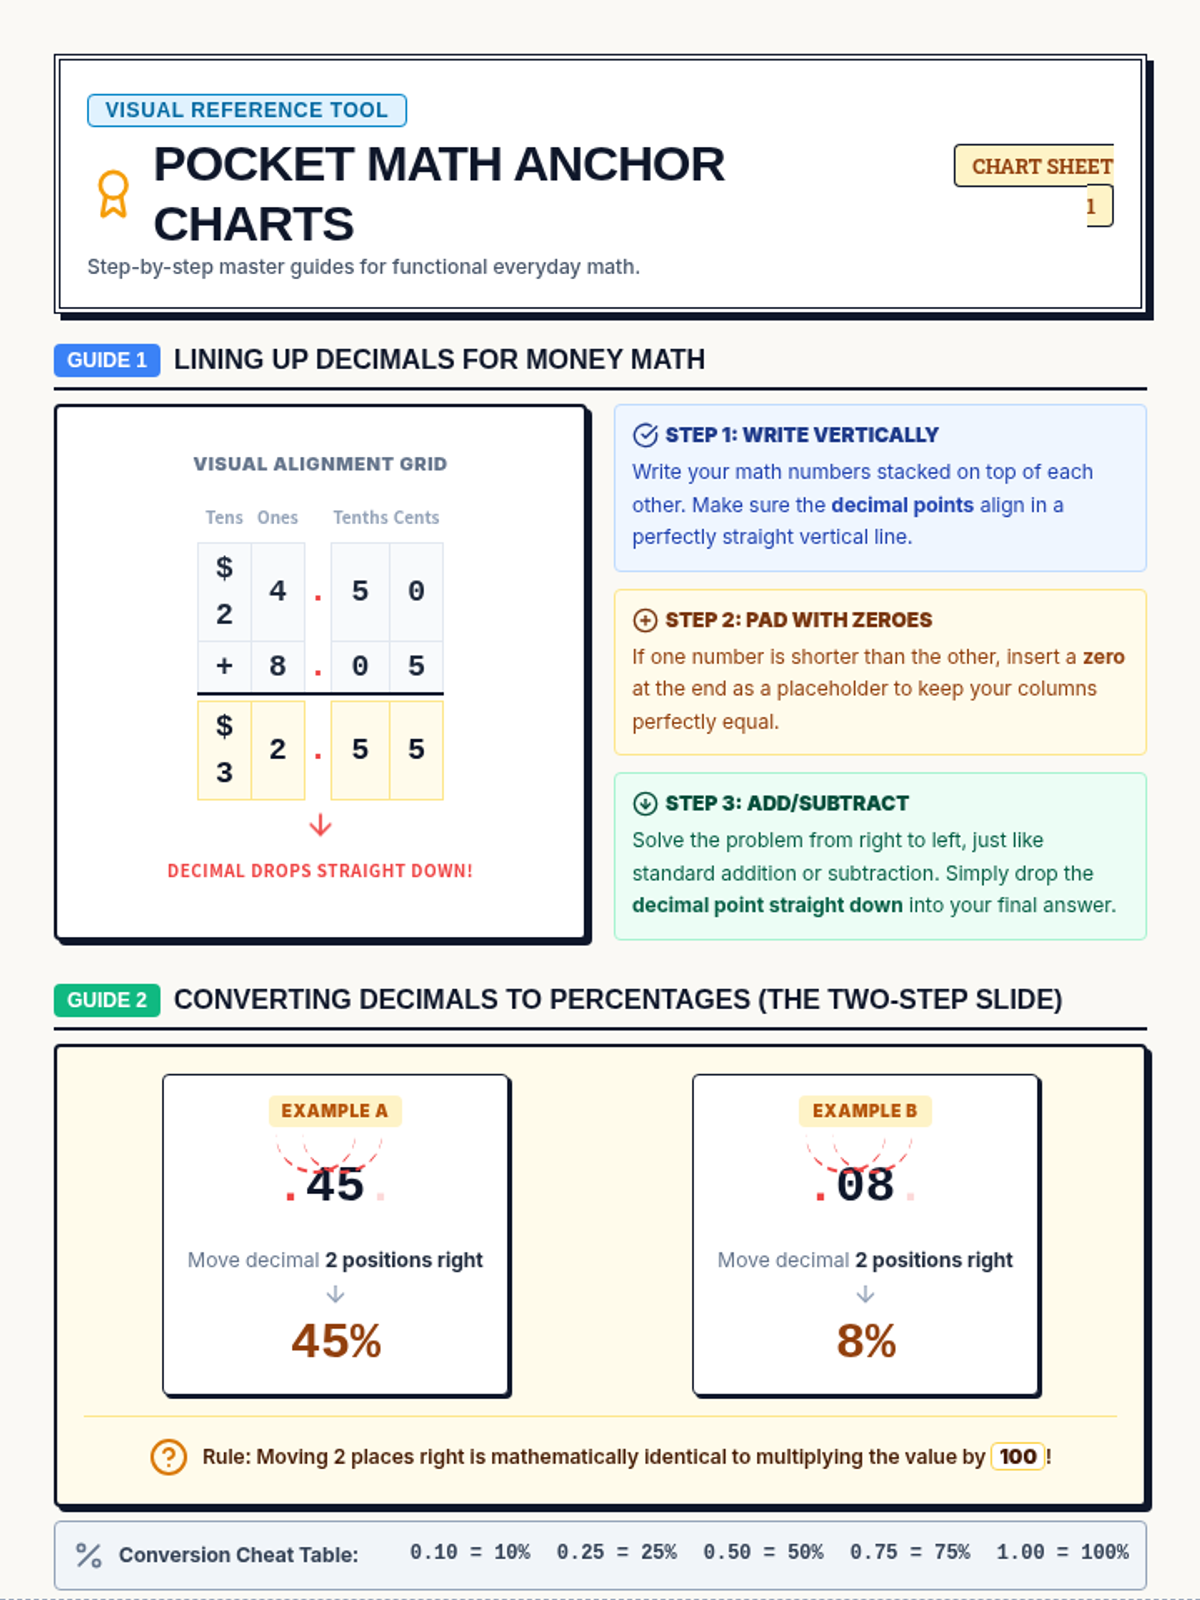
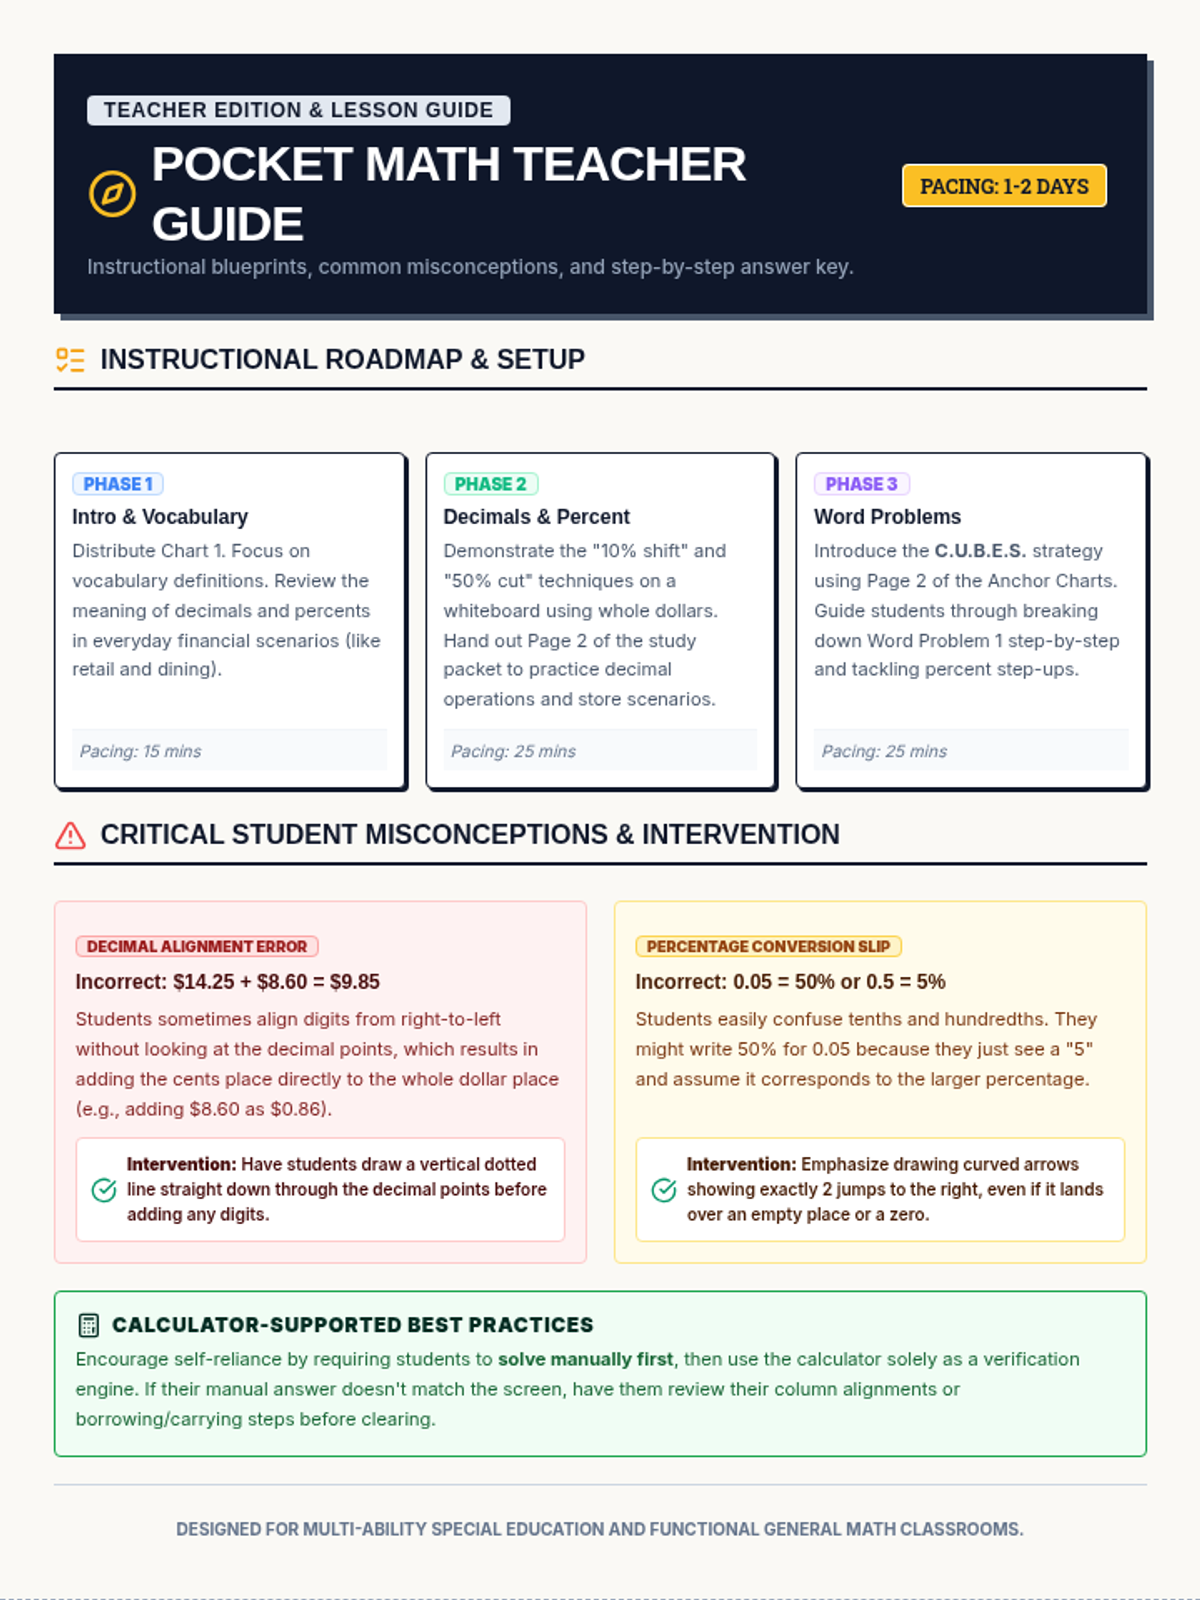
A structured math lesson focused on functional real-world math skills, covering decimals, money, multi-digit operations, percentages (10% and 50%), and word problem solving. Includes a 3-page study packet, a visual anchor chart reference sheet, and a complete teacher guide.
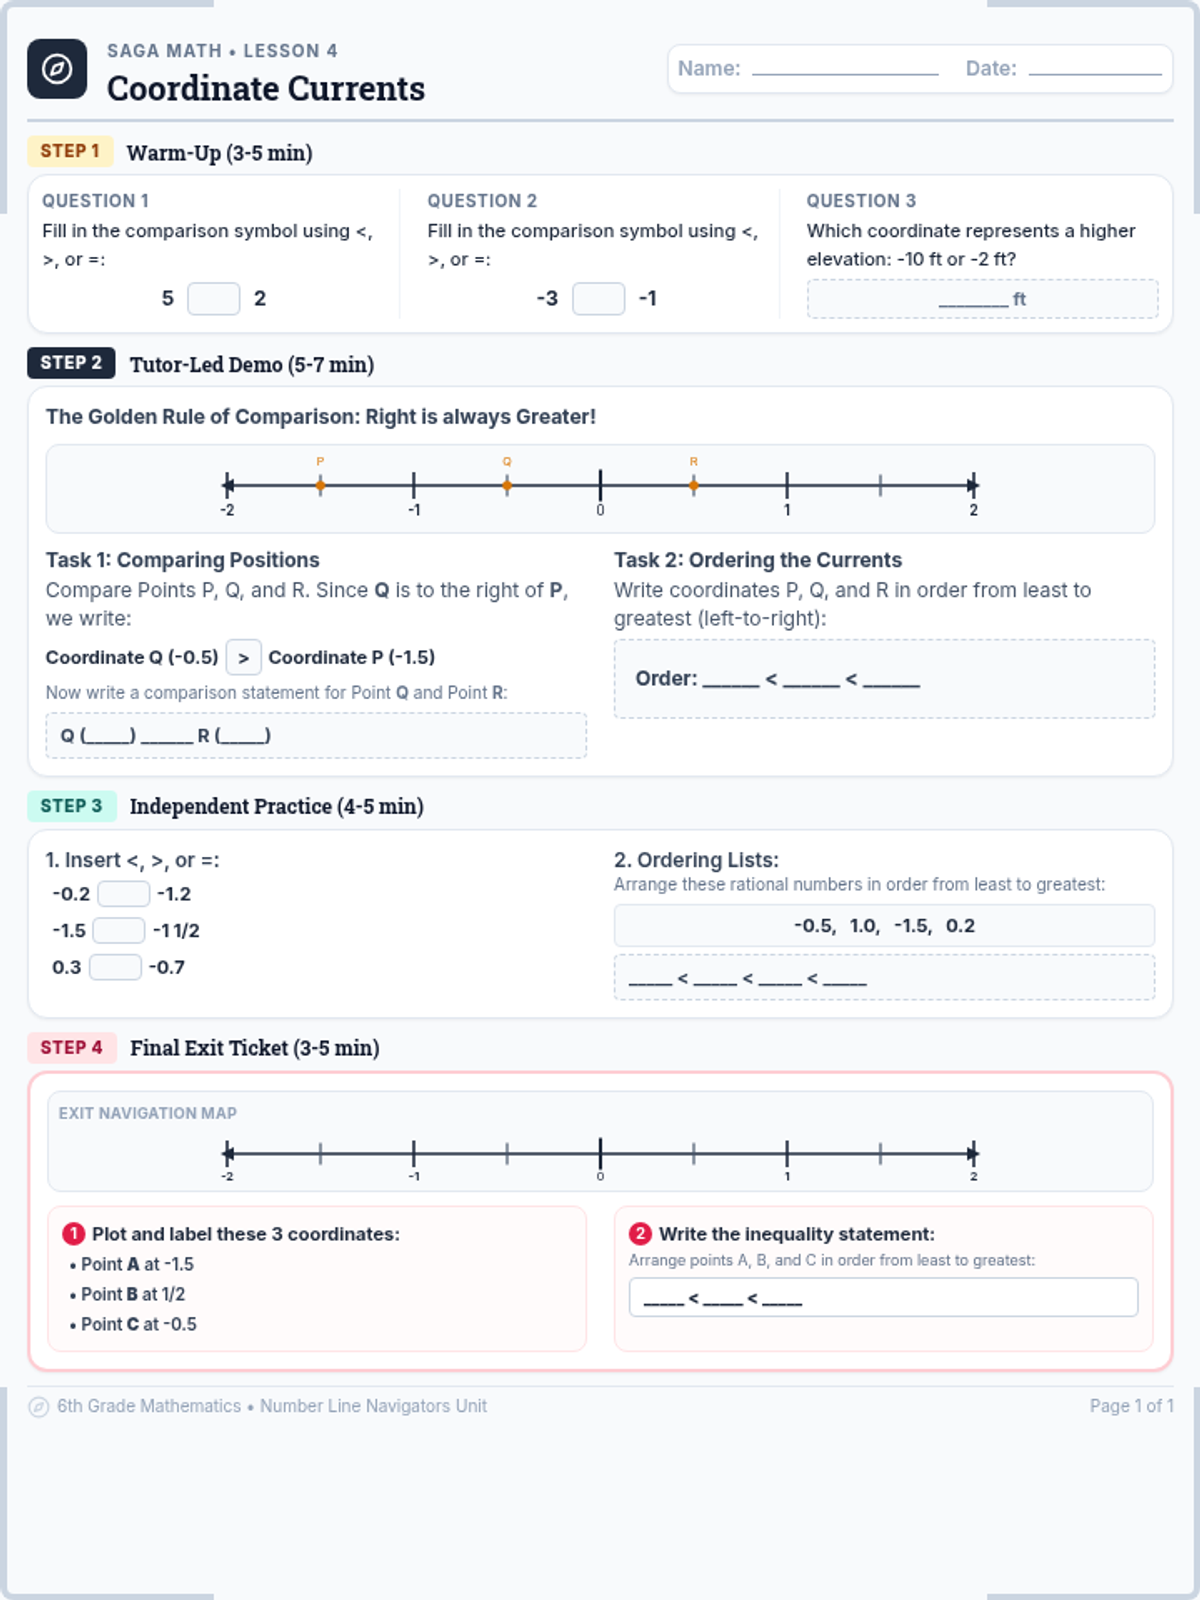
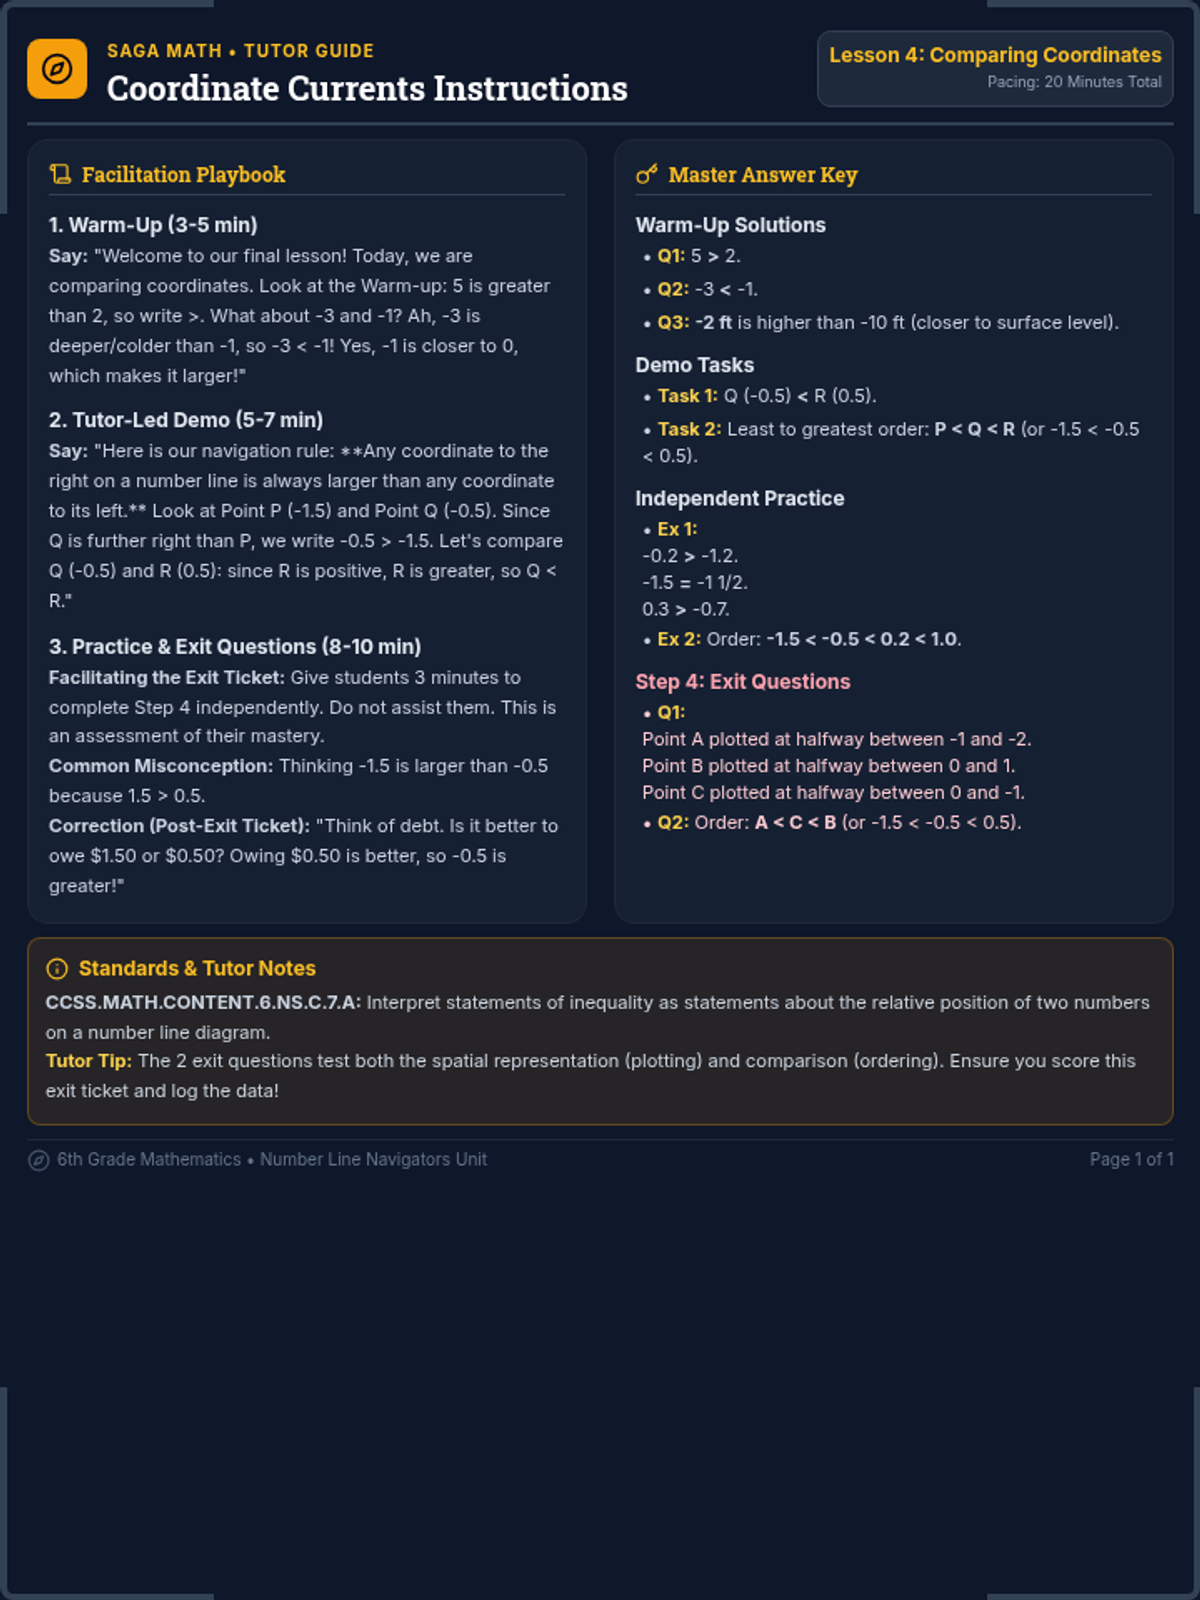
Compare and order integers, fractions, and decimals on a number line using inequality symbols, concluding with two comprehensive exit questions.
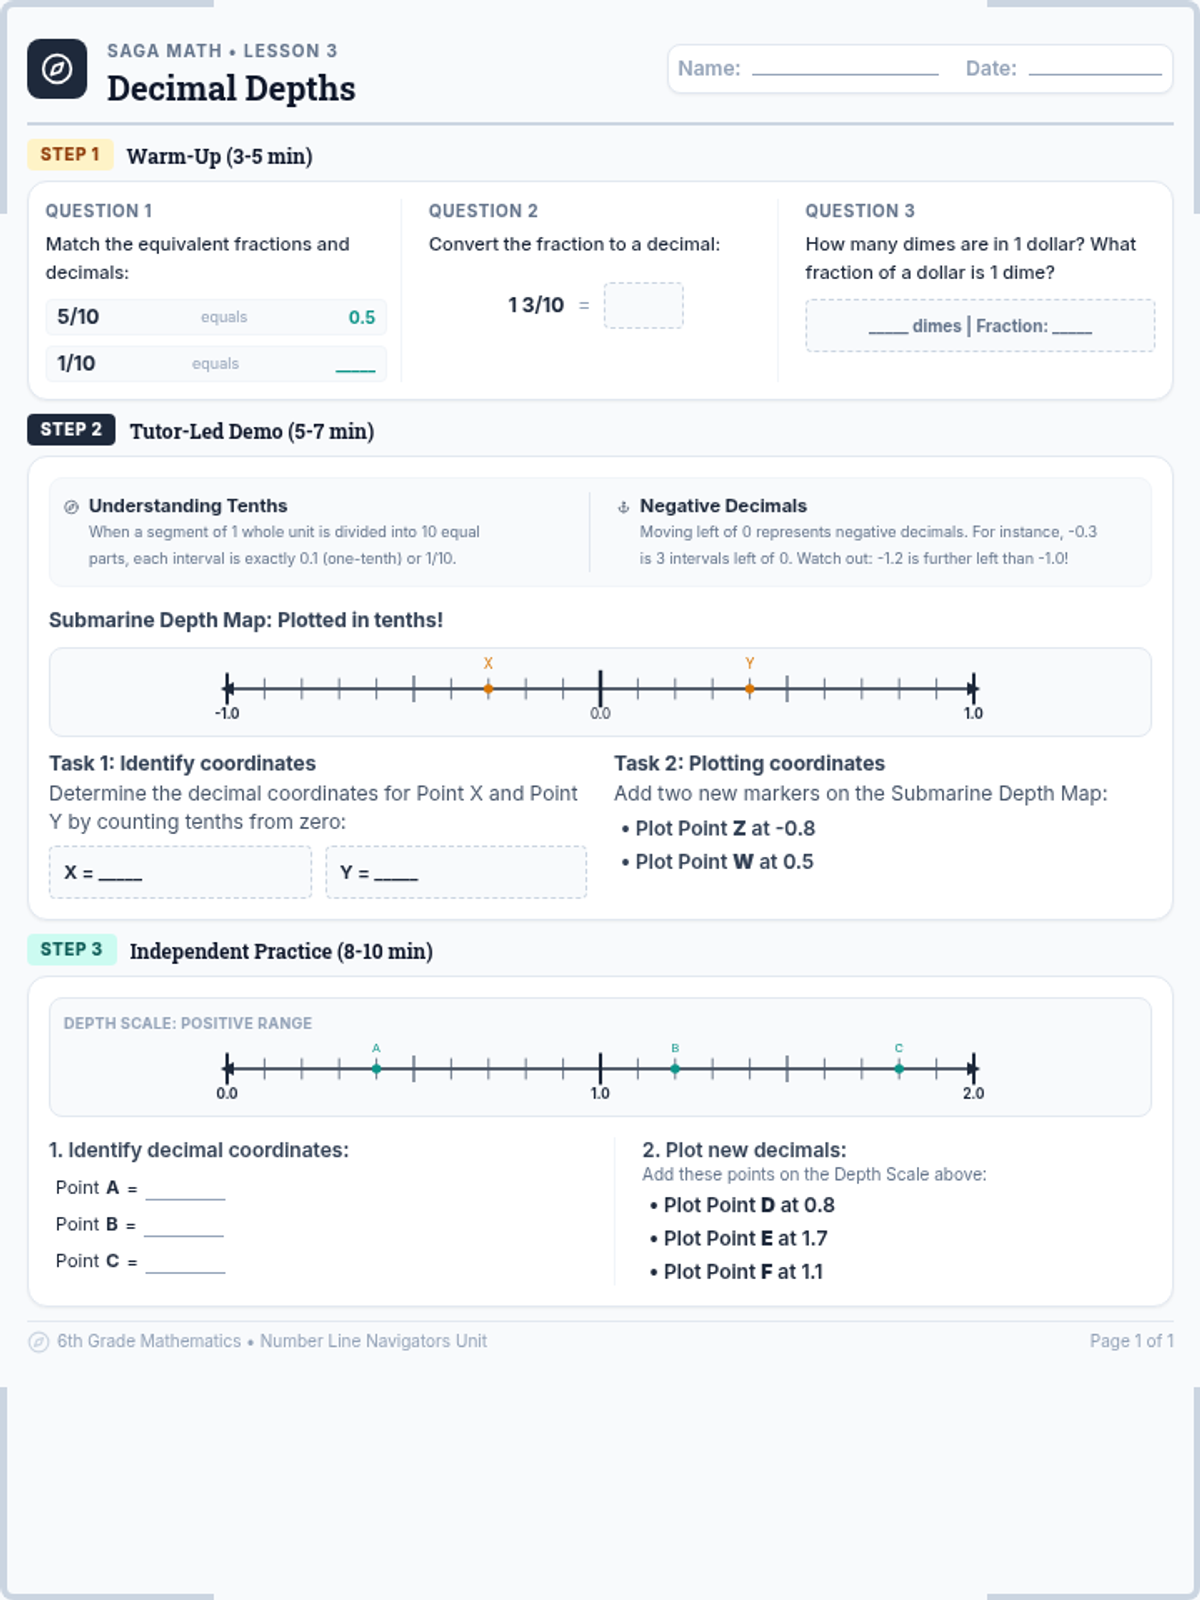
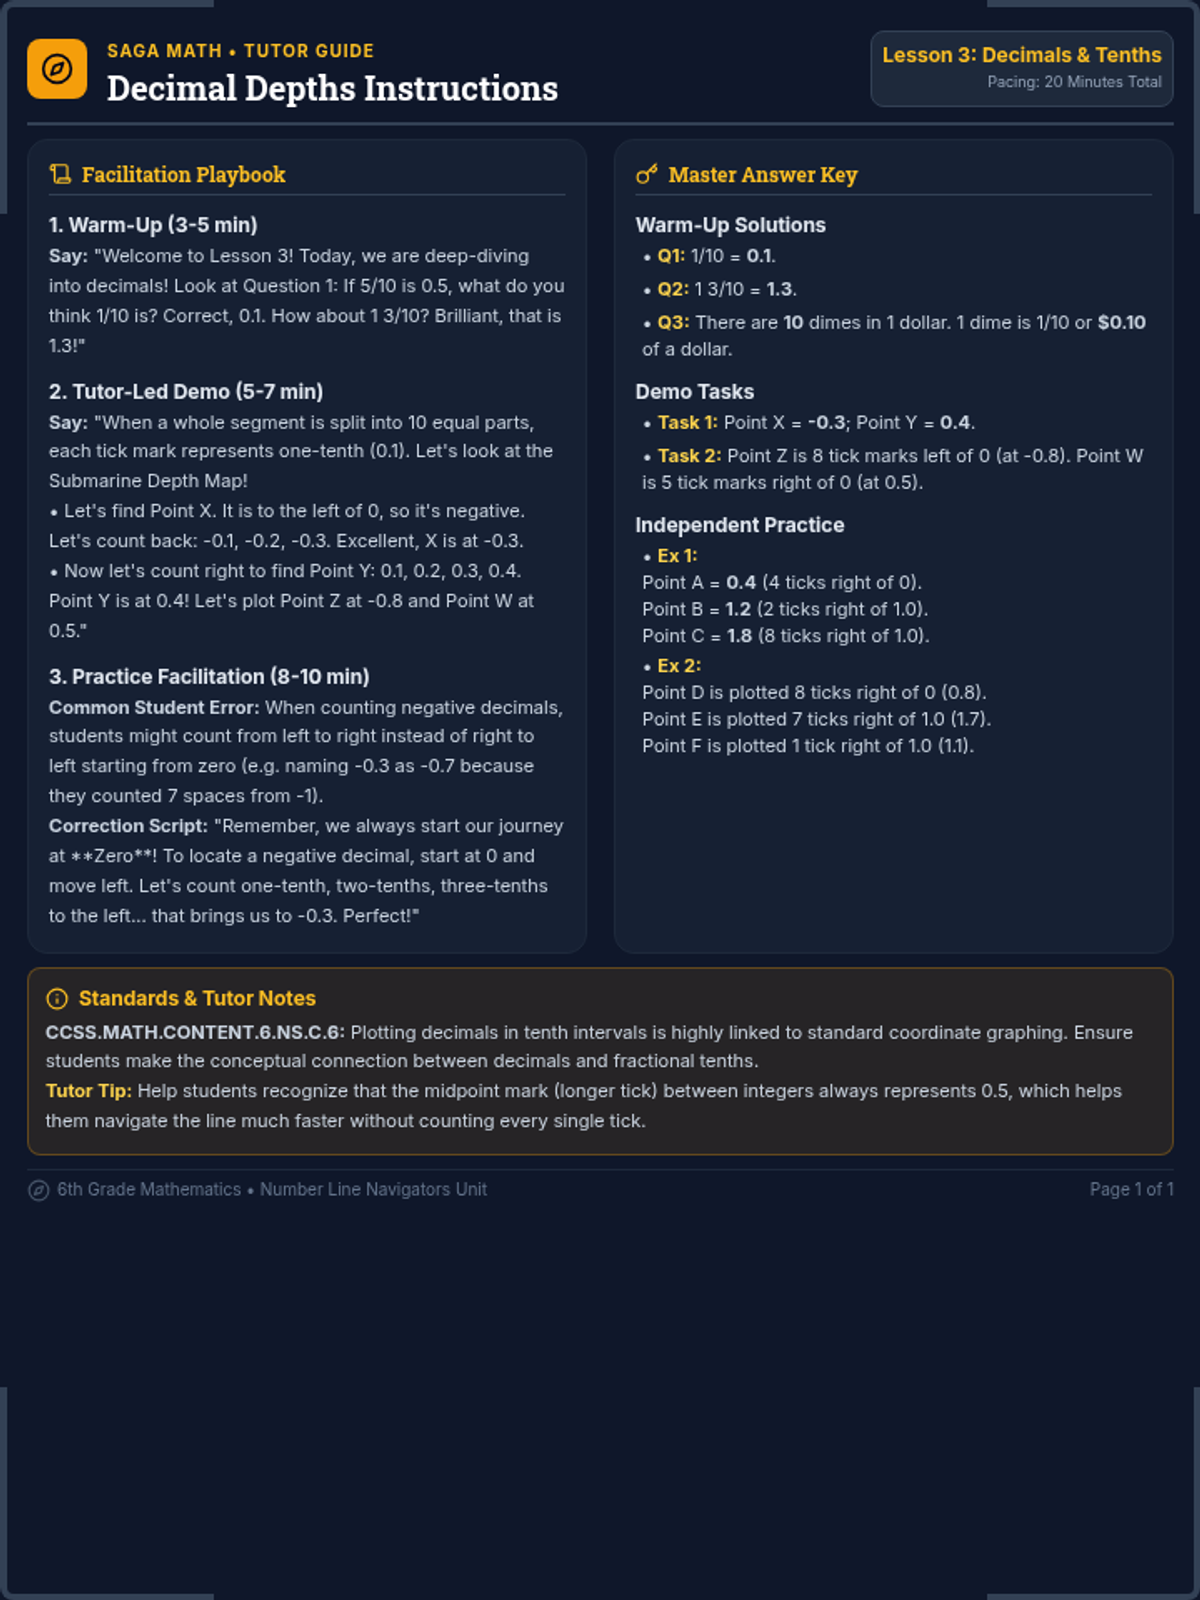
Navigate number lines partitioned into tenths to locate and represent positive and negative decimals.
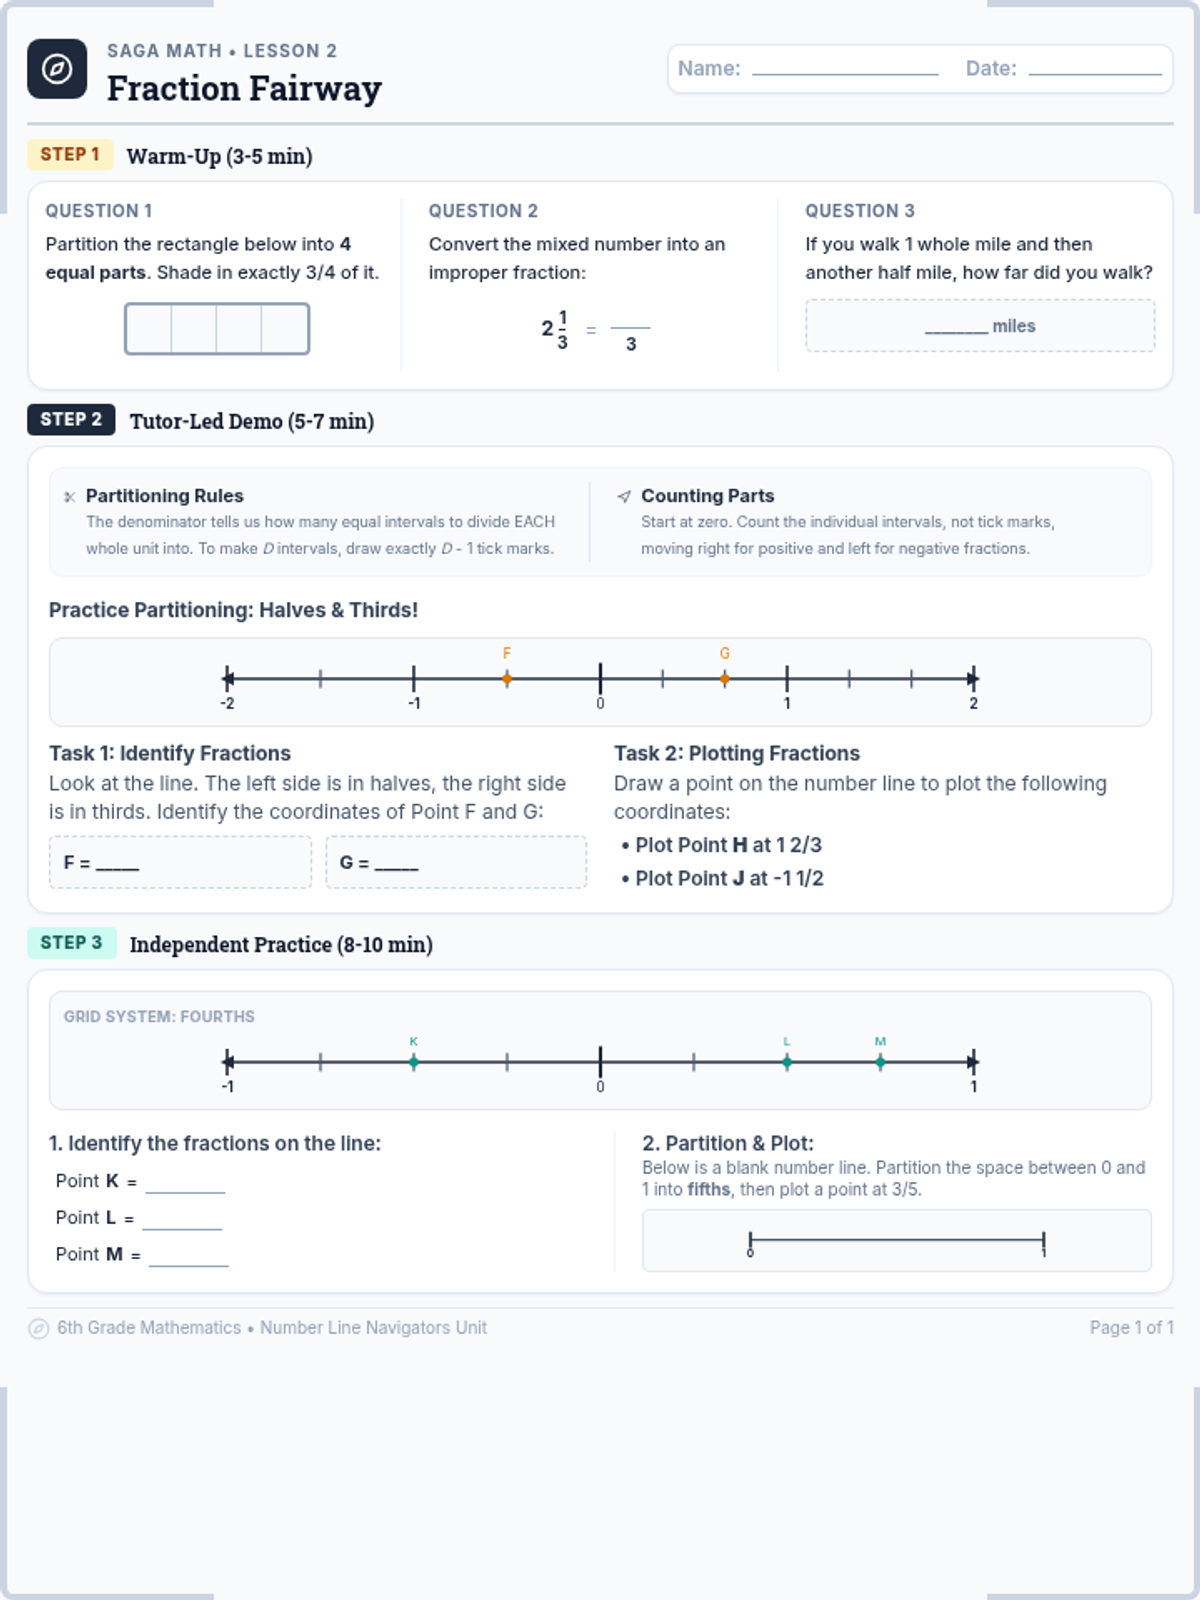
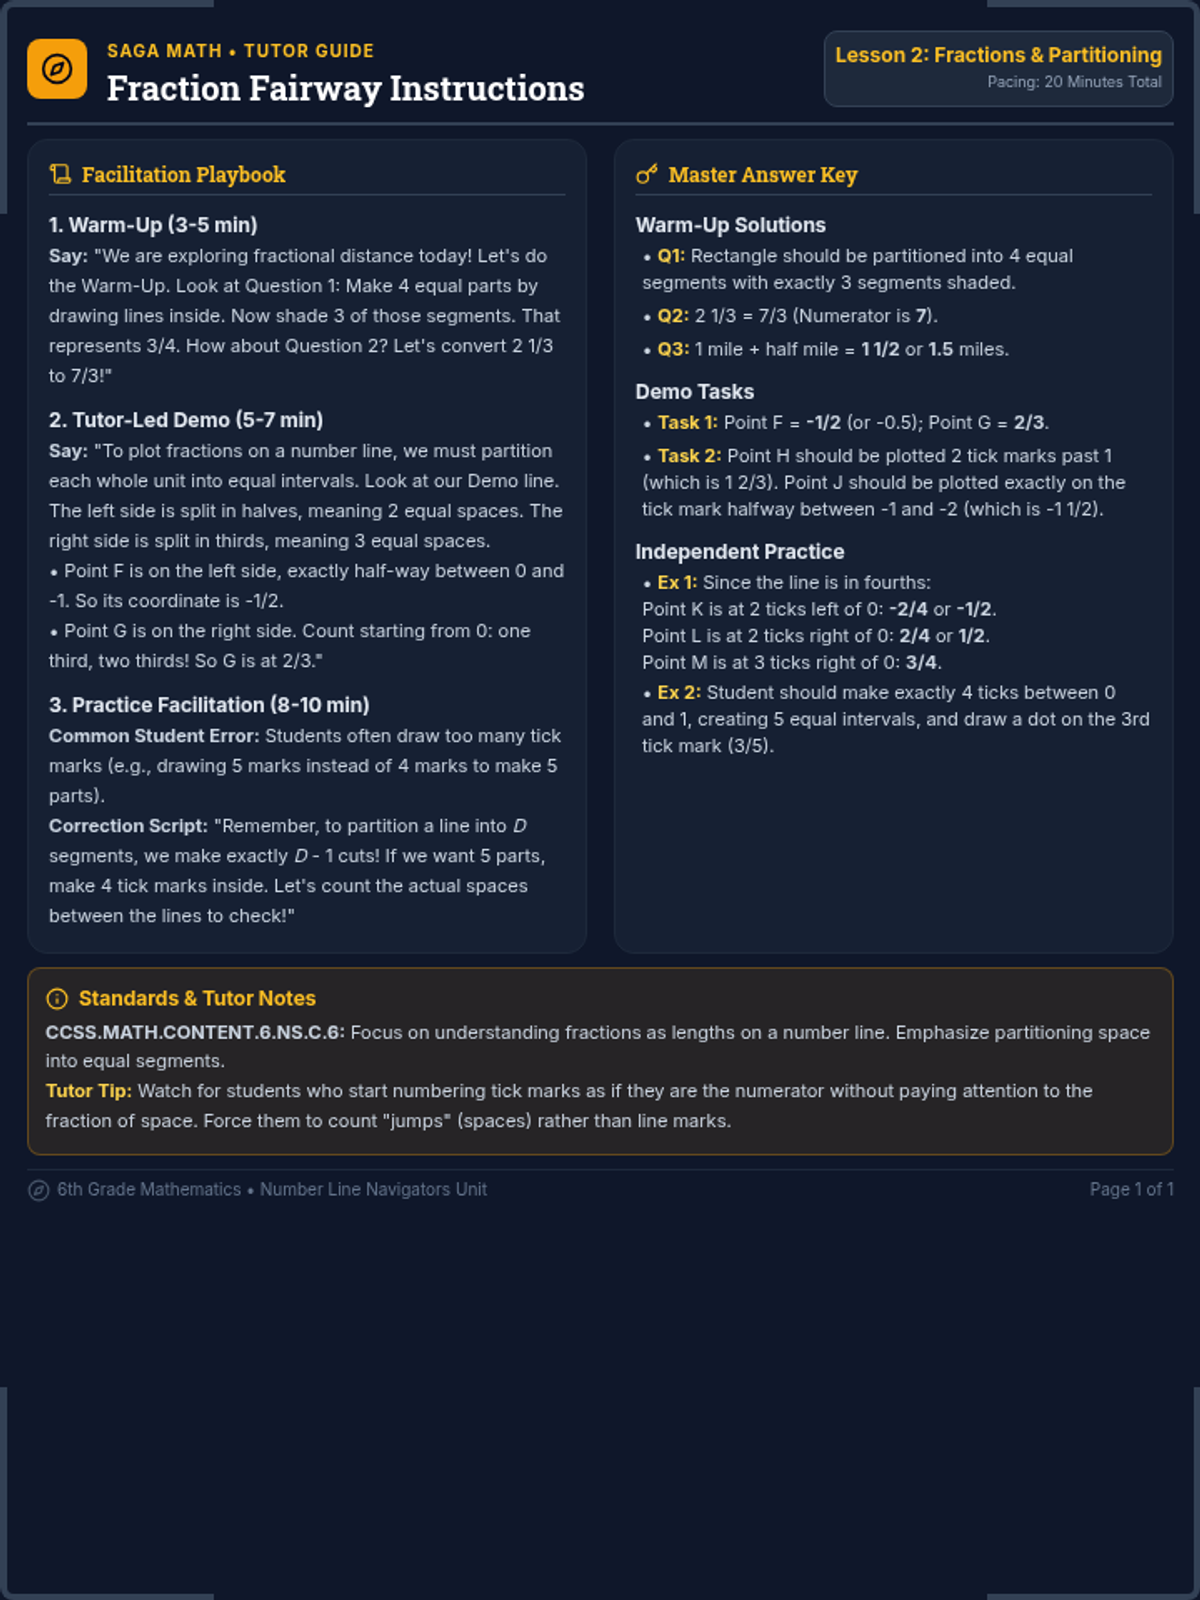
Master partitioning a number line into equal intervals to accurately locate, label, and plot positive and negative fractions and mixed numbers.
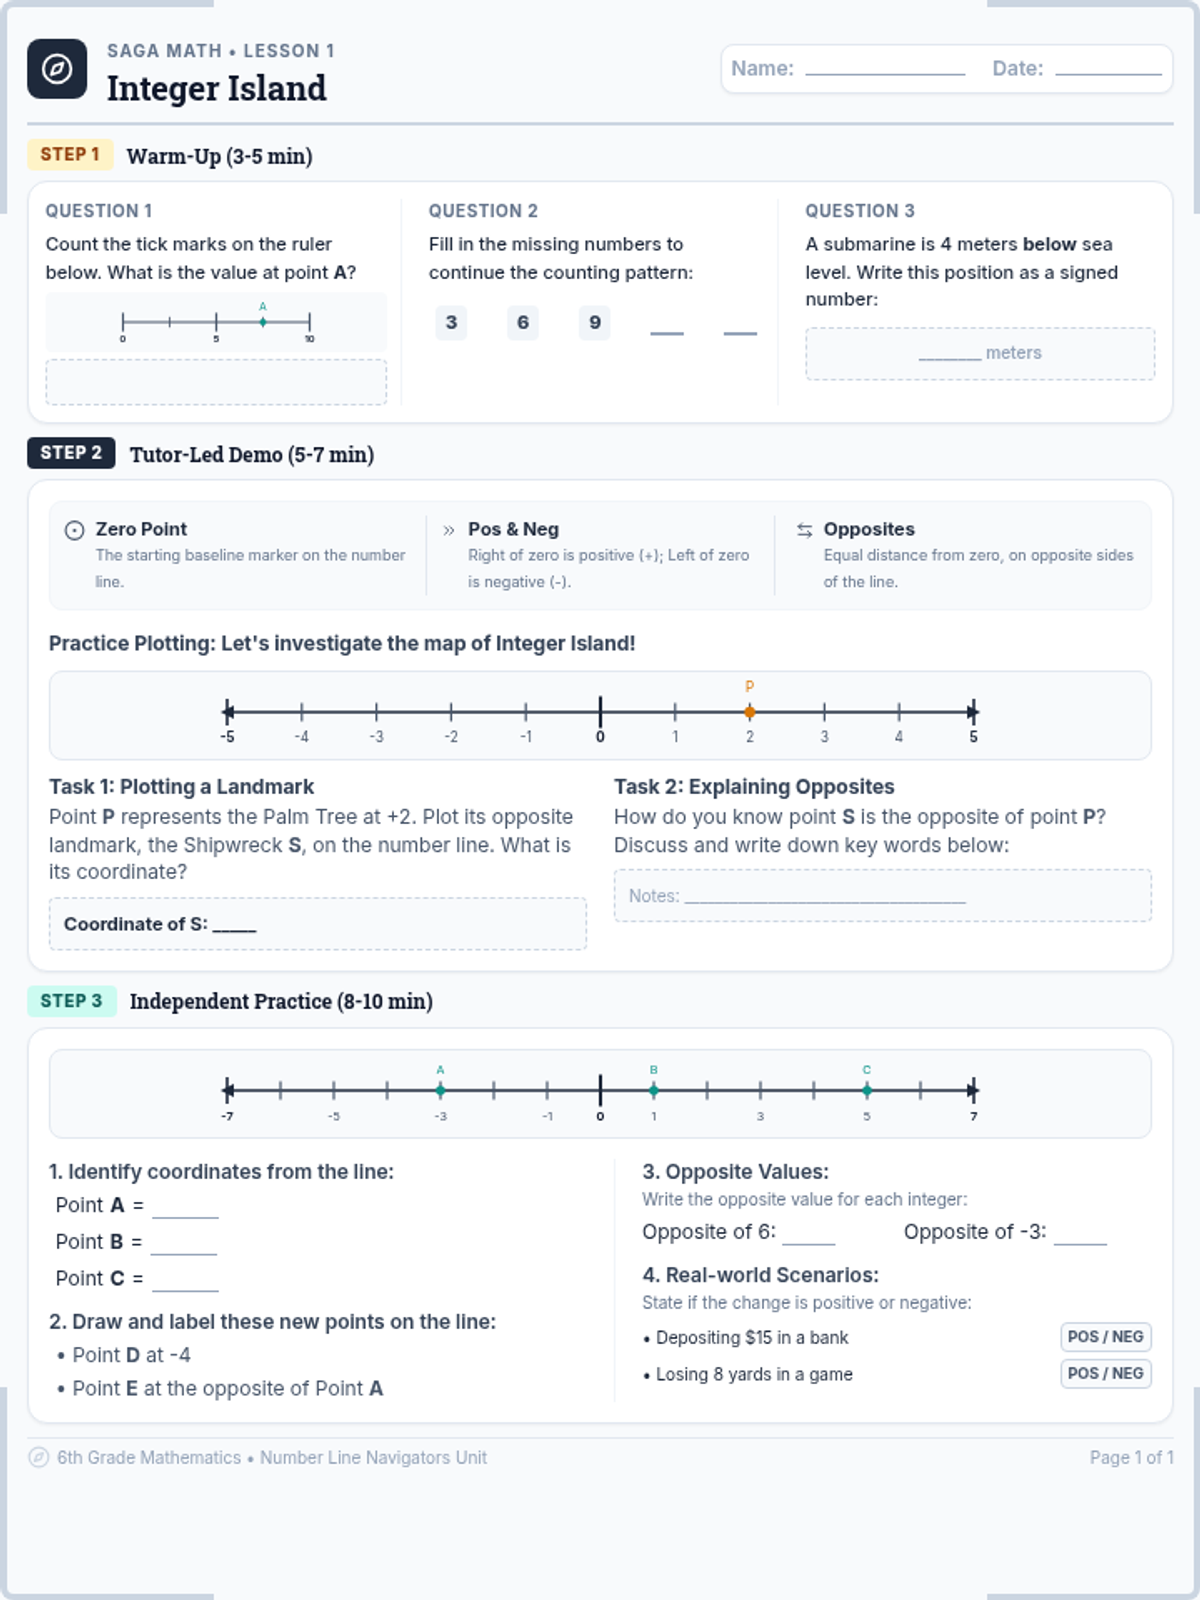
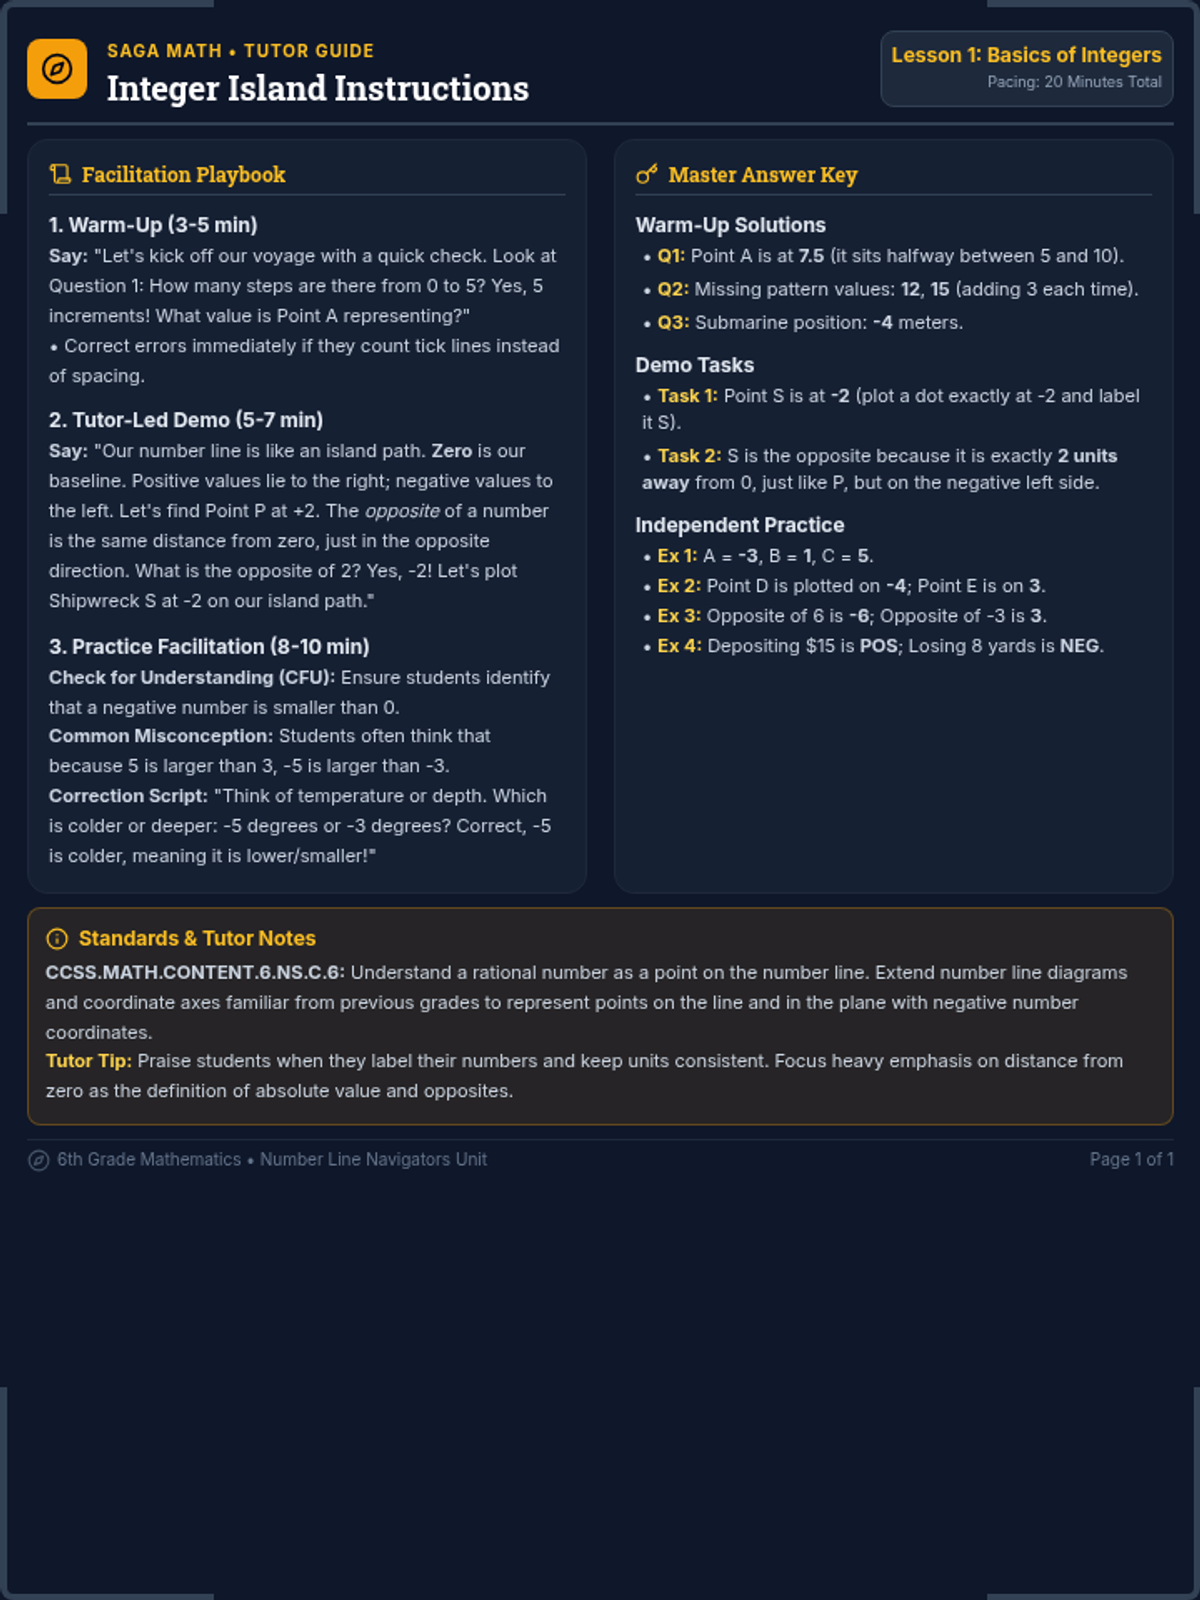
Learn the structure of a number line, identify integers, find opposites, and explore the meaning of zero as a starting reference point.
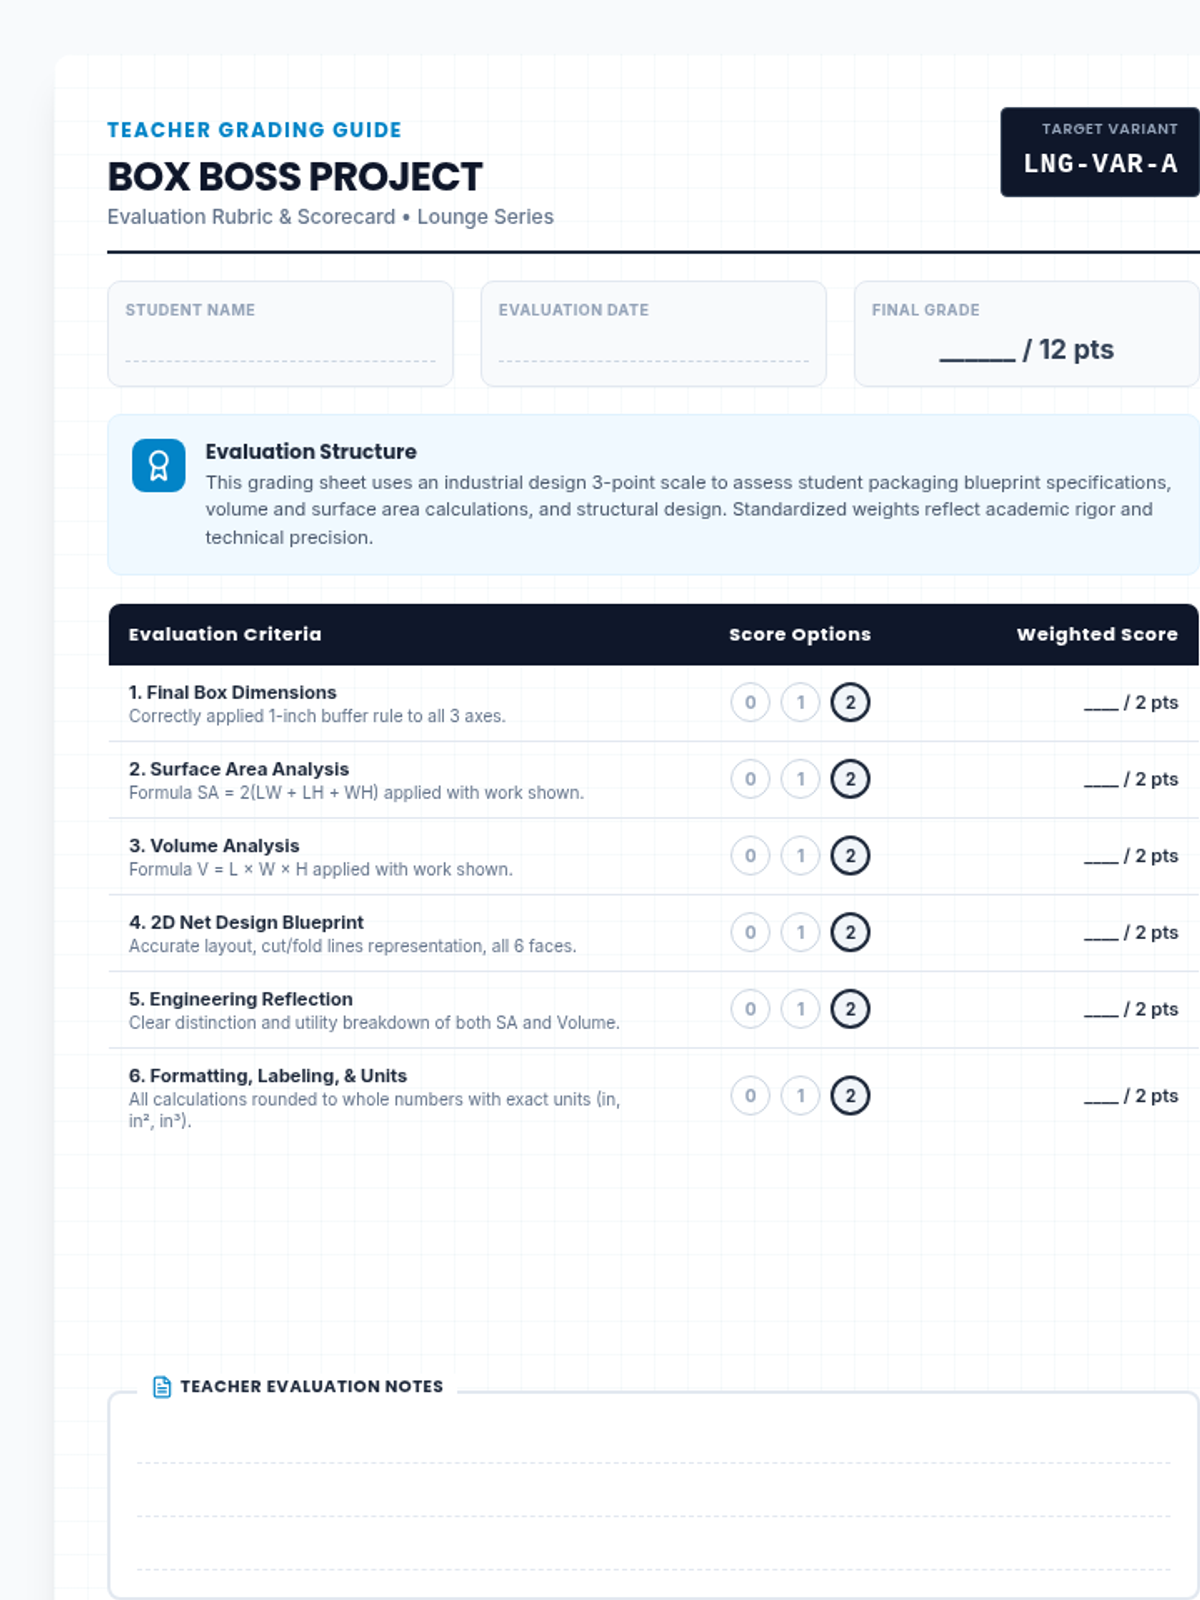
An applied geometry and packaging design project where students calculate surface area, volume, and sketch blueprints for product packaging.
Simplifying expressions and solving one-step equations using the visual metaphor of a balance scale to maintain equality.
Introducing probability through the lens of 'likelihood' and basic outcomes using visual spinners and frequency charts.
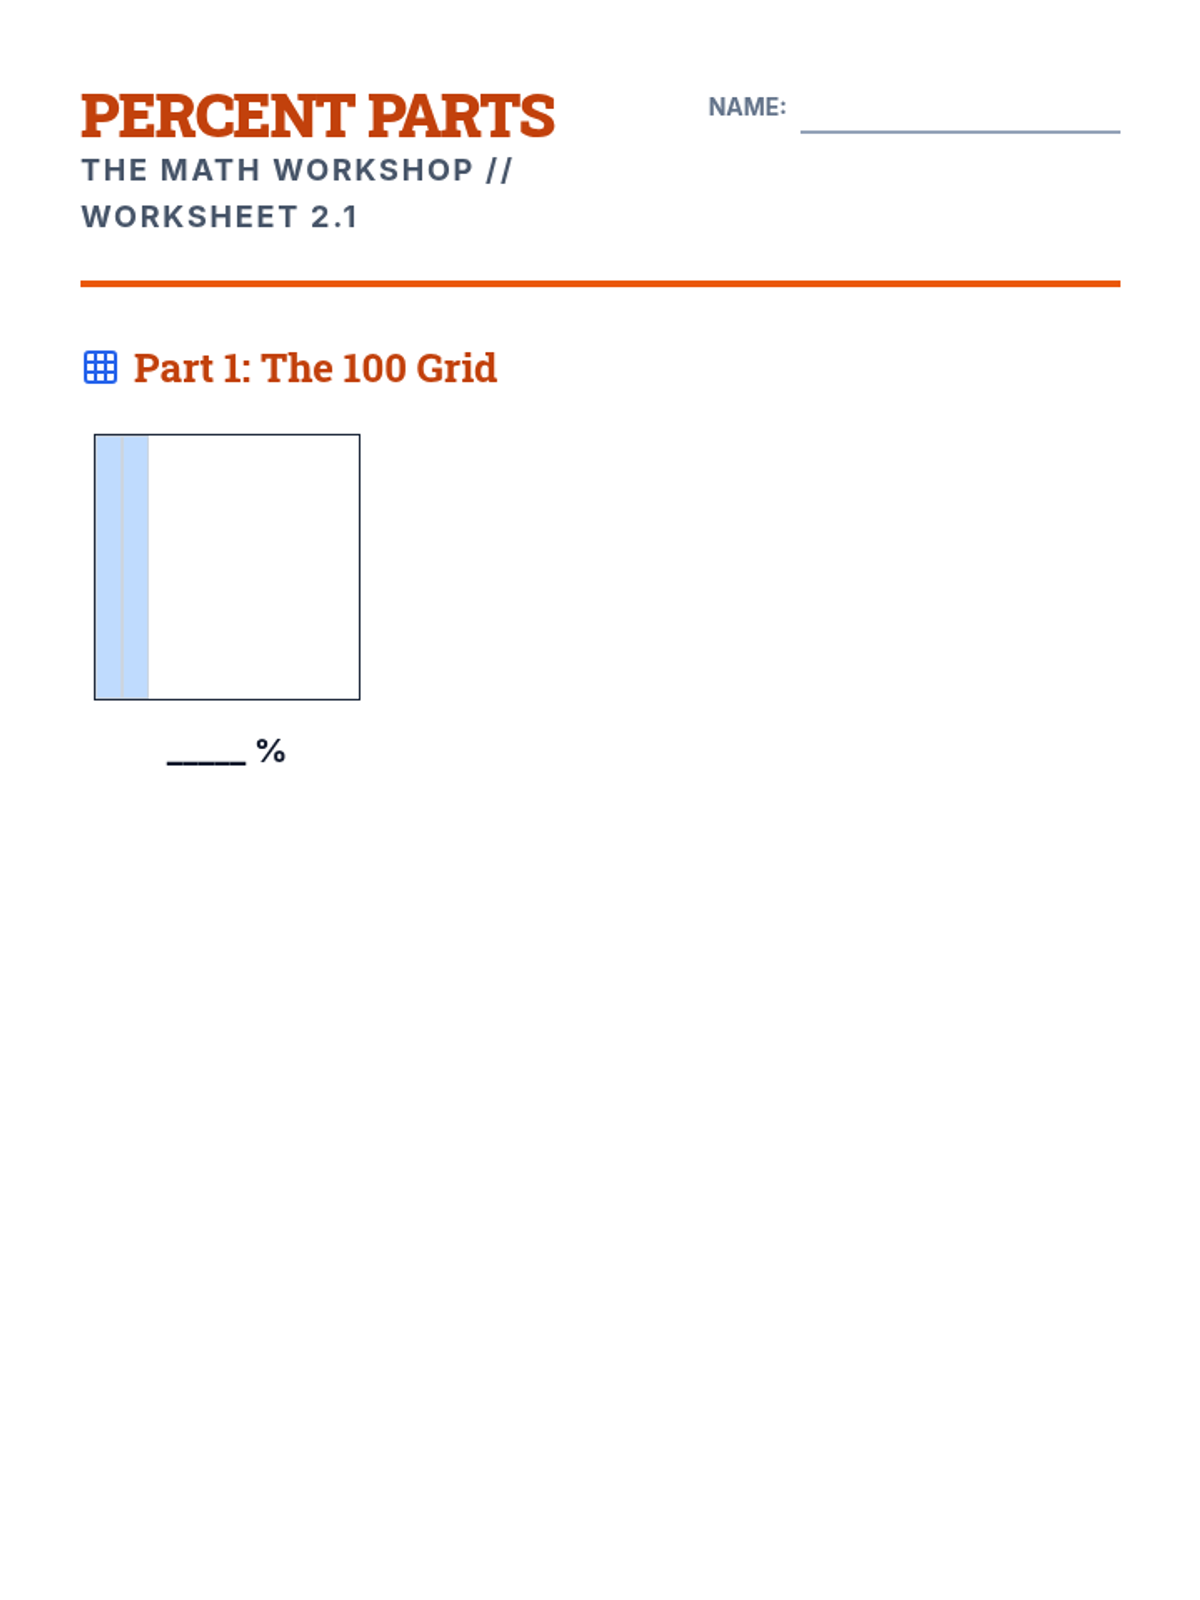
Understanding percents as parts of a hundred using 10x10 grids and double number lines to visualize simple percent calculations.
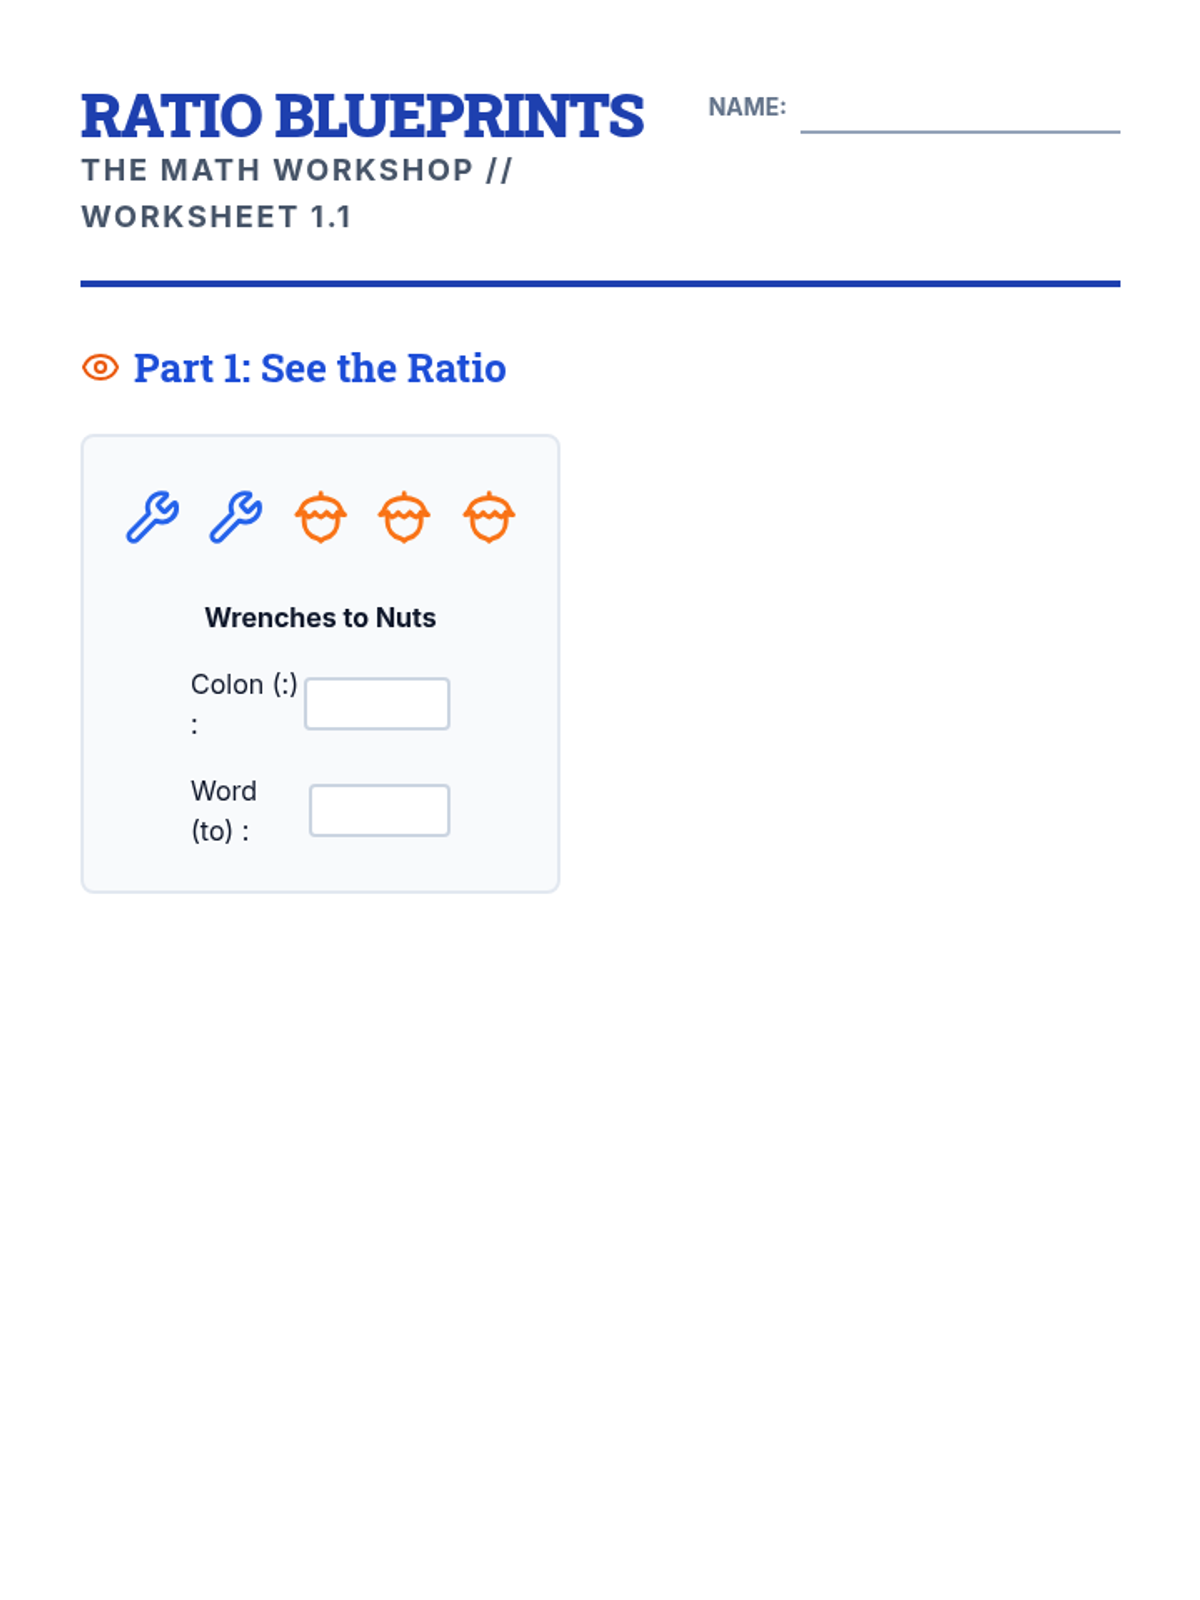
Foundational concepts of ratios and proportions using visual bar models and ratio tables to help students see the relationship between quantities.
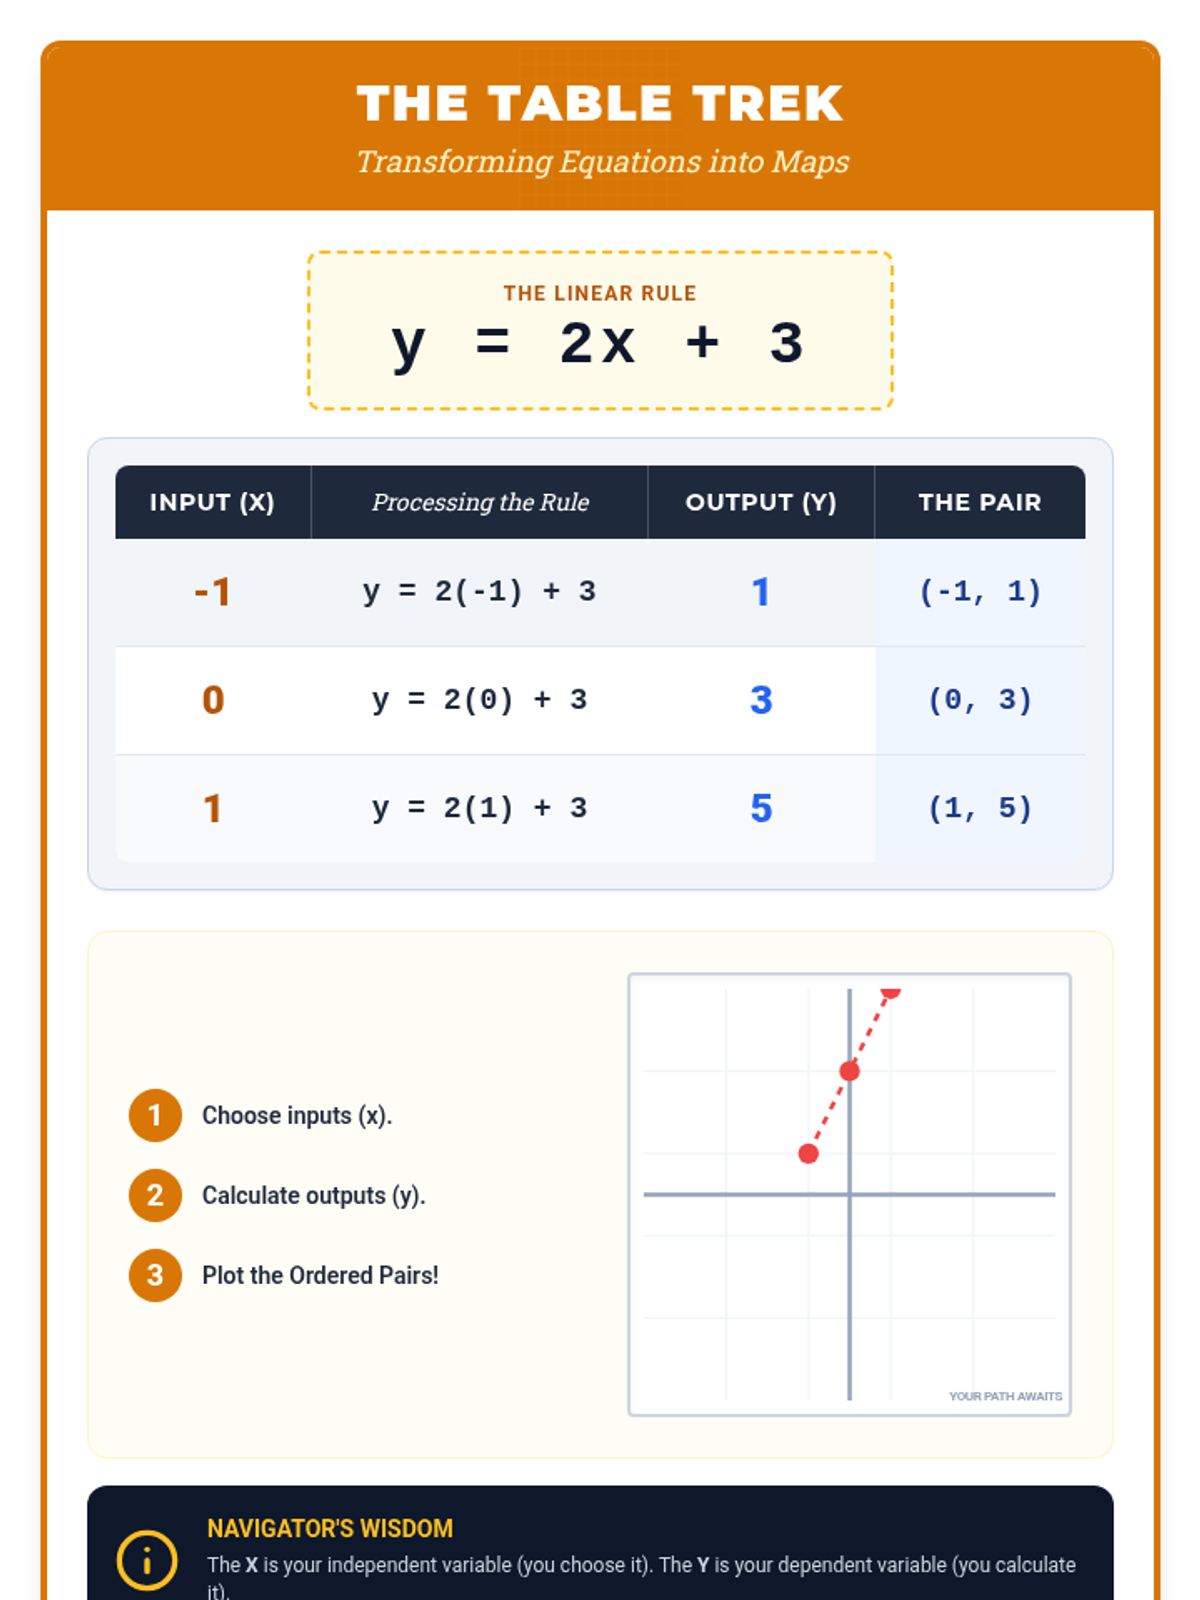
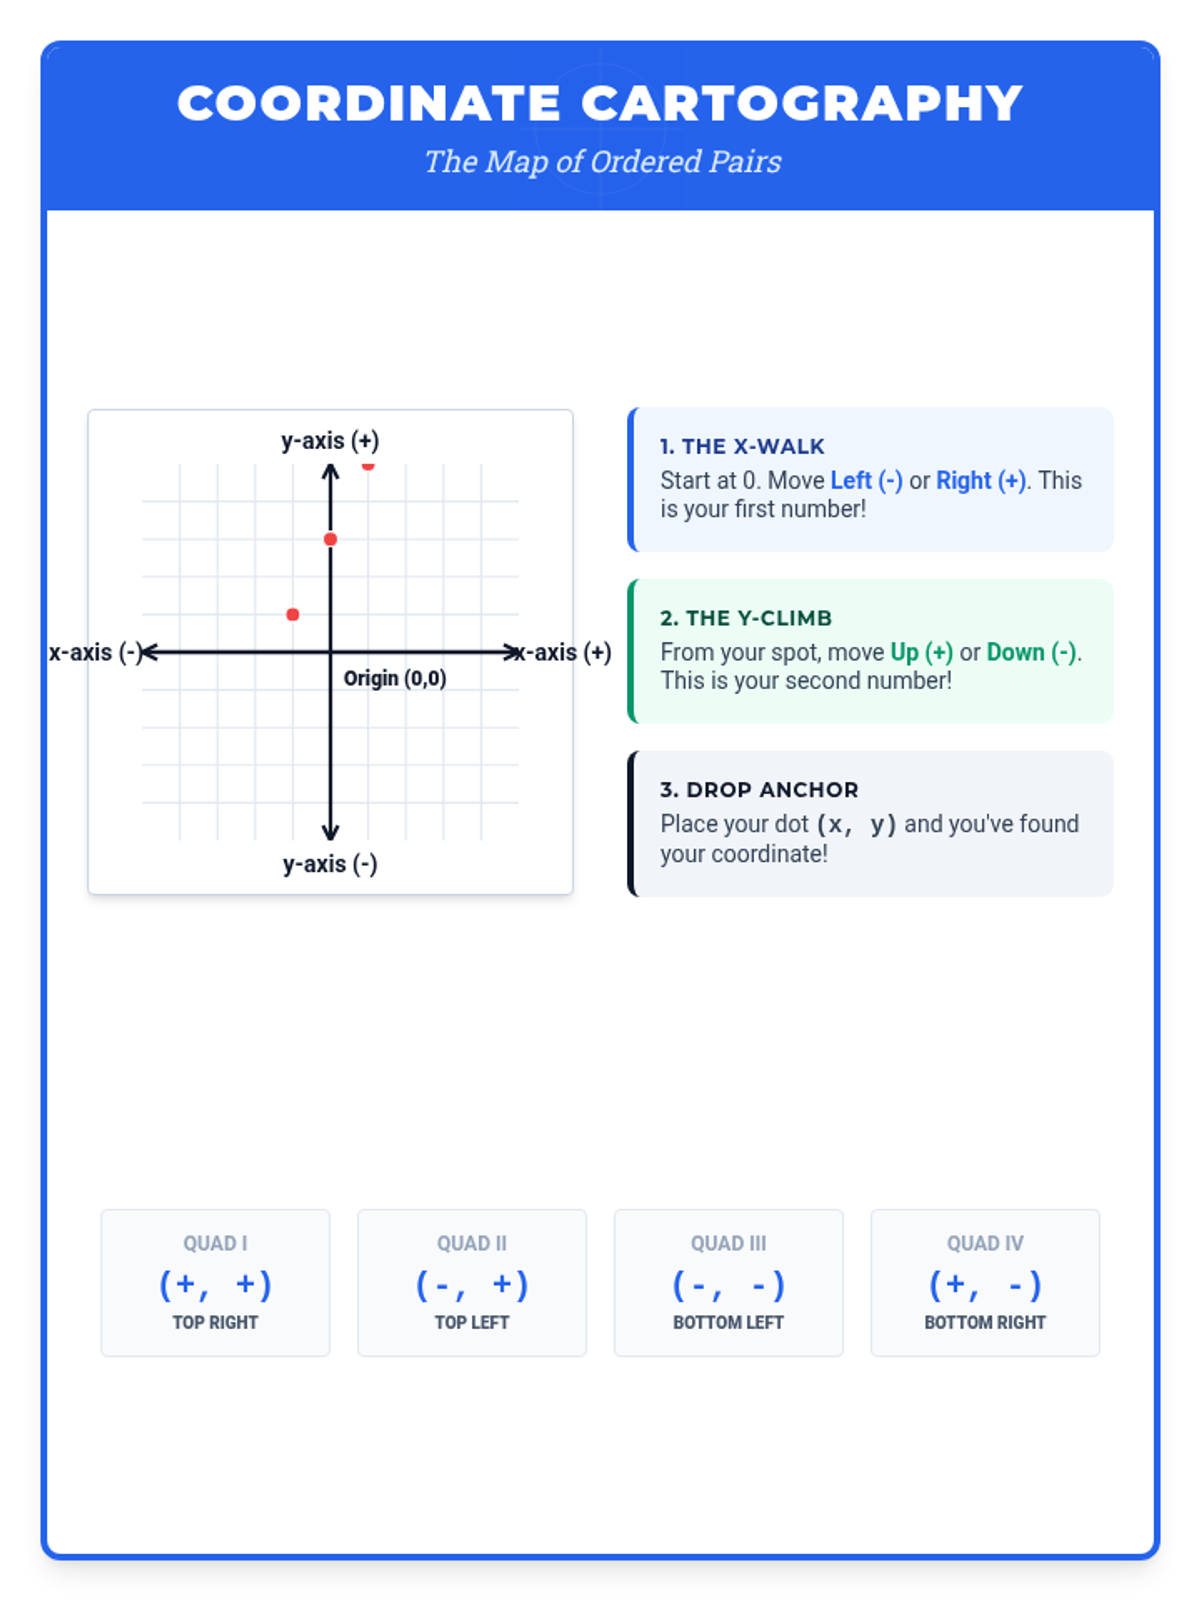
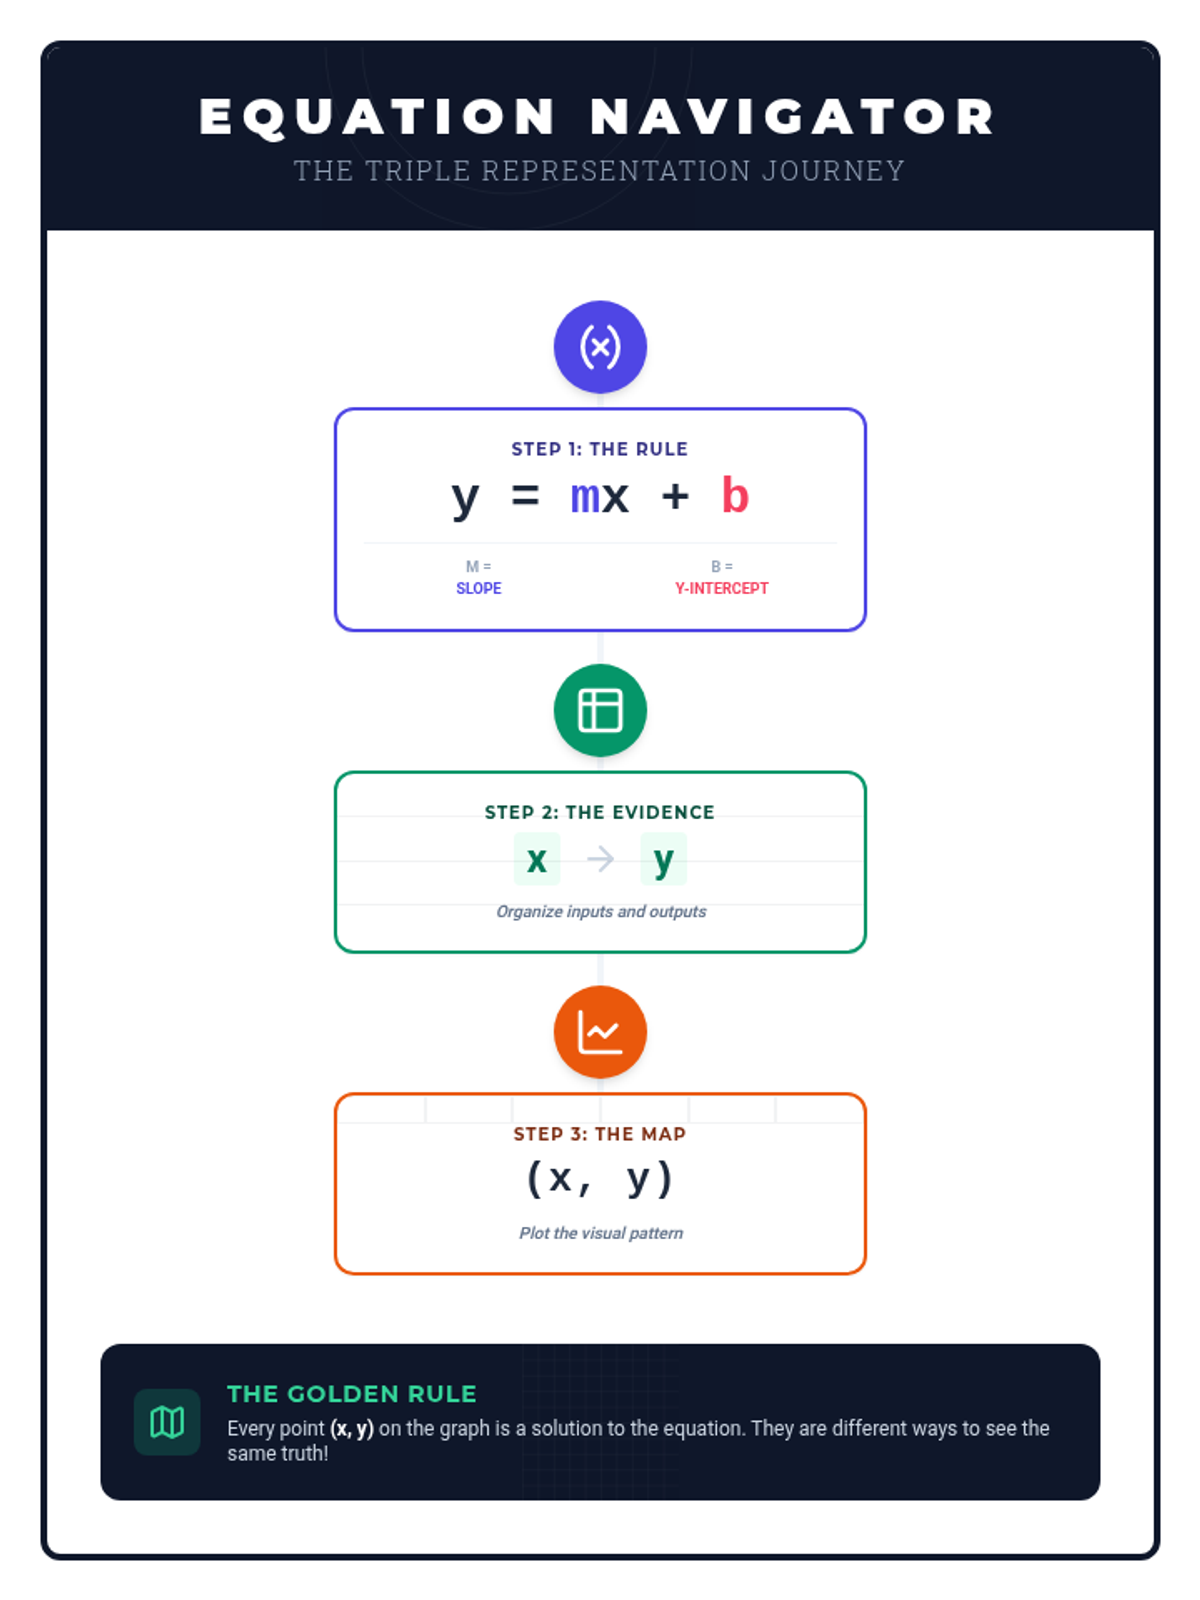
A visual exploration of linear equations, teaching students how to transform equations into input/output tables and plot them as ordered pairs on a coordinate plane.
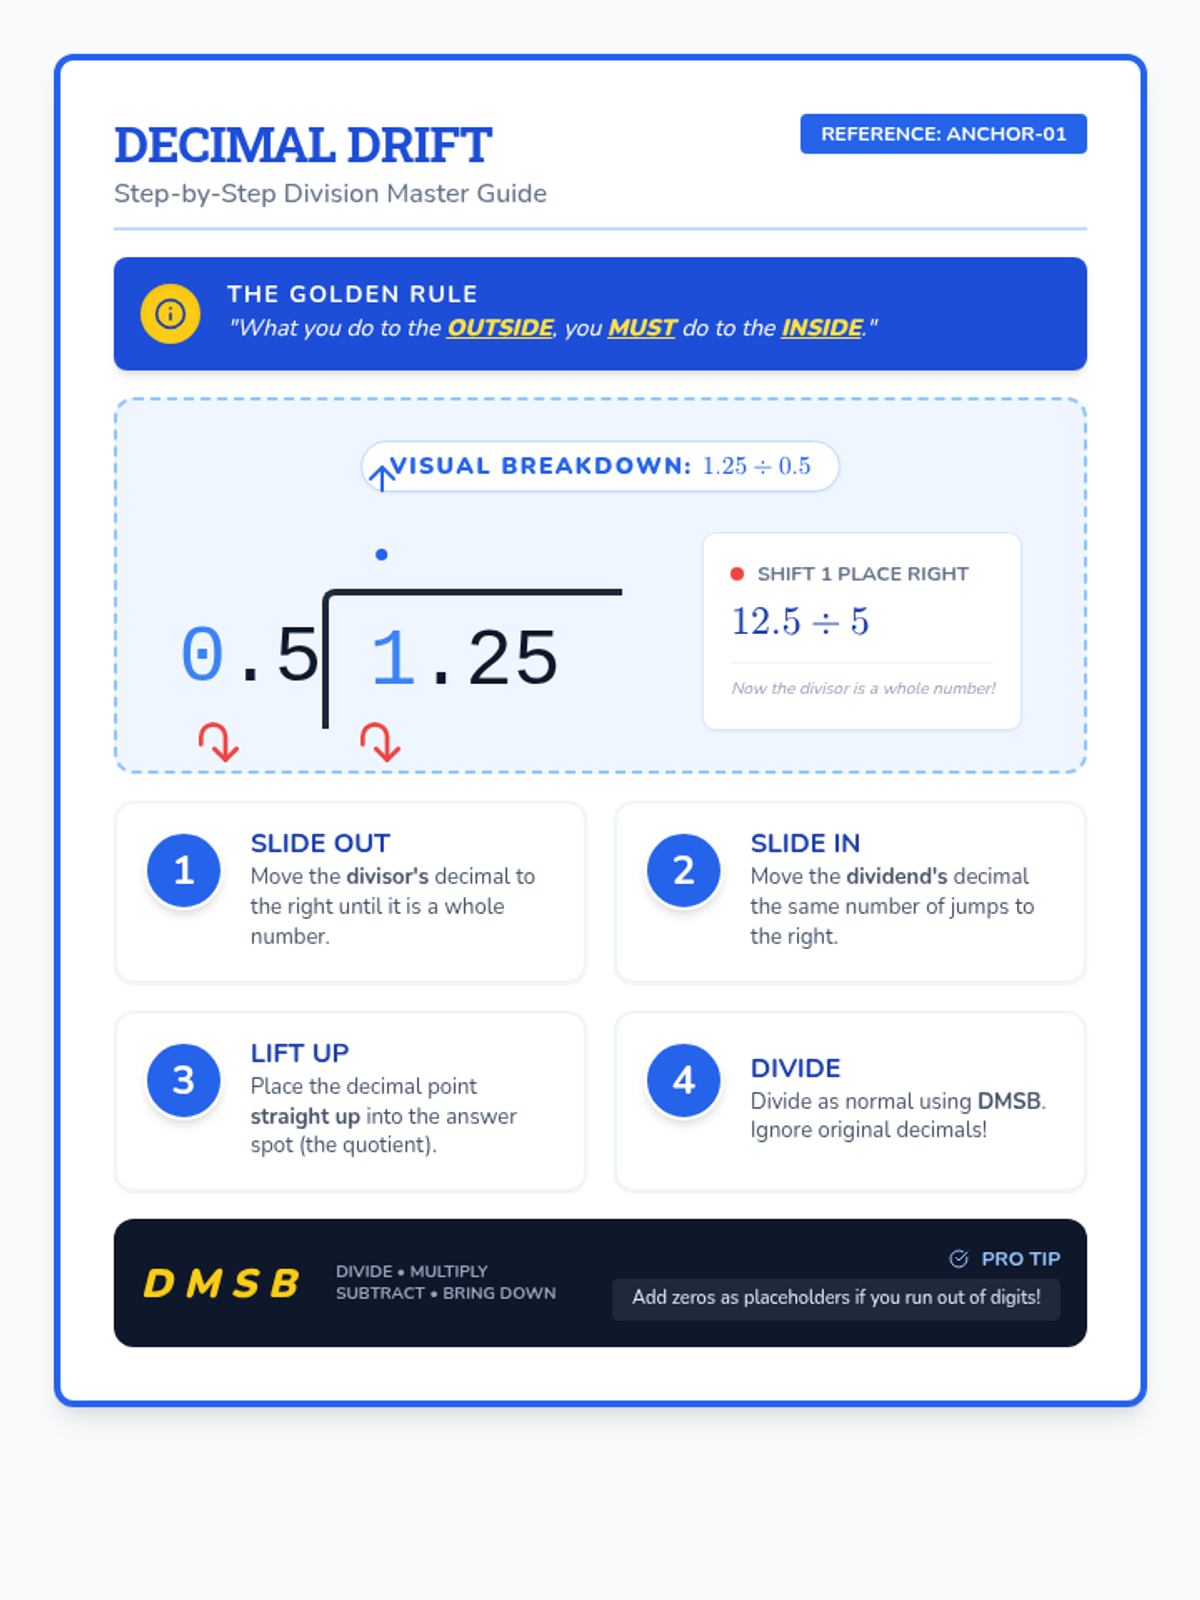
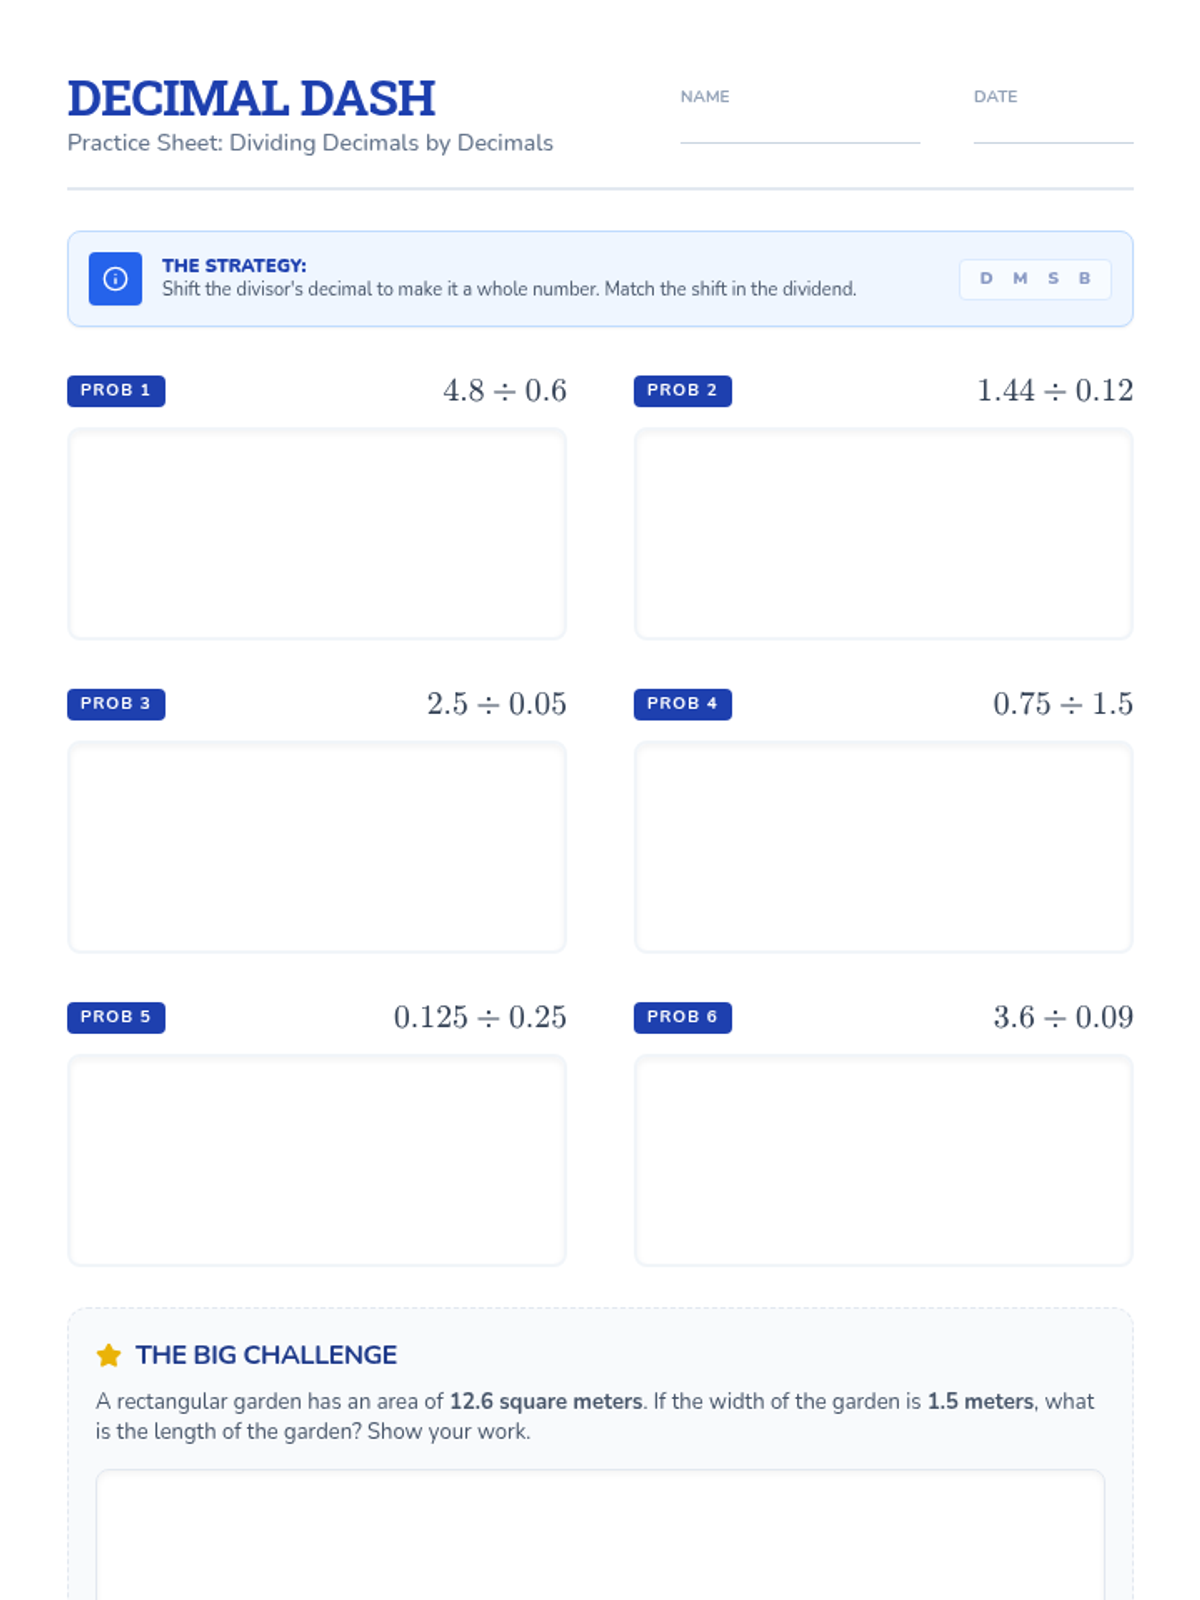
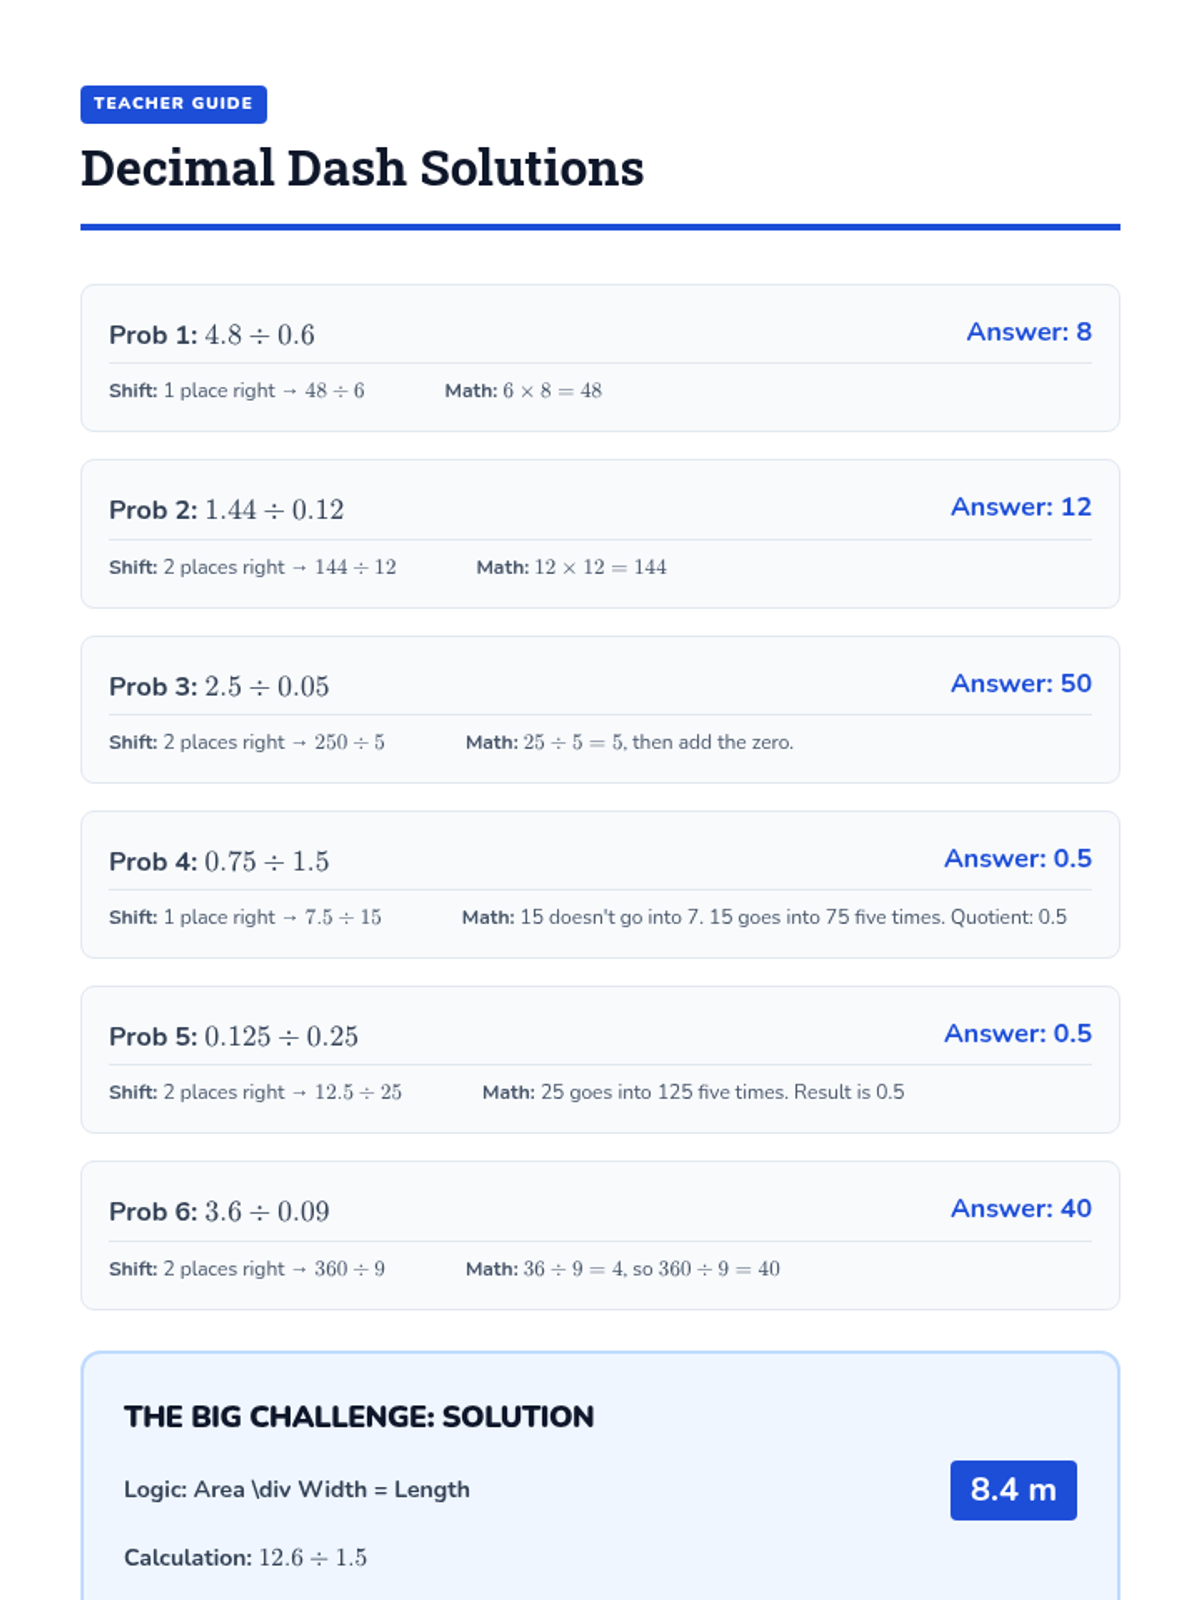
A comprehensive lesson on dividing decimals by decimals, featuring a visual anchor chart and practice materials to master the "shift and divide" method.
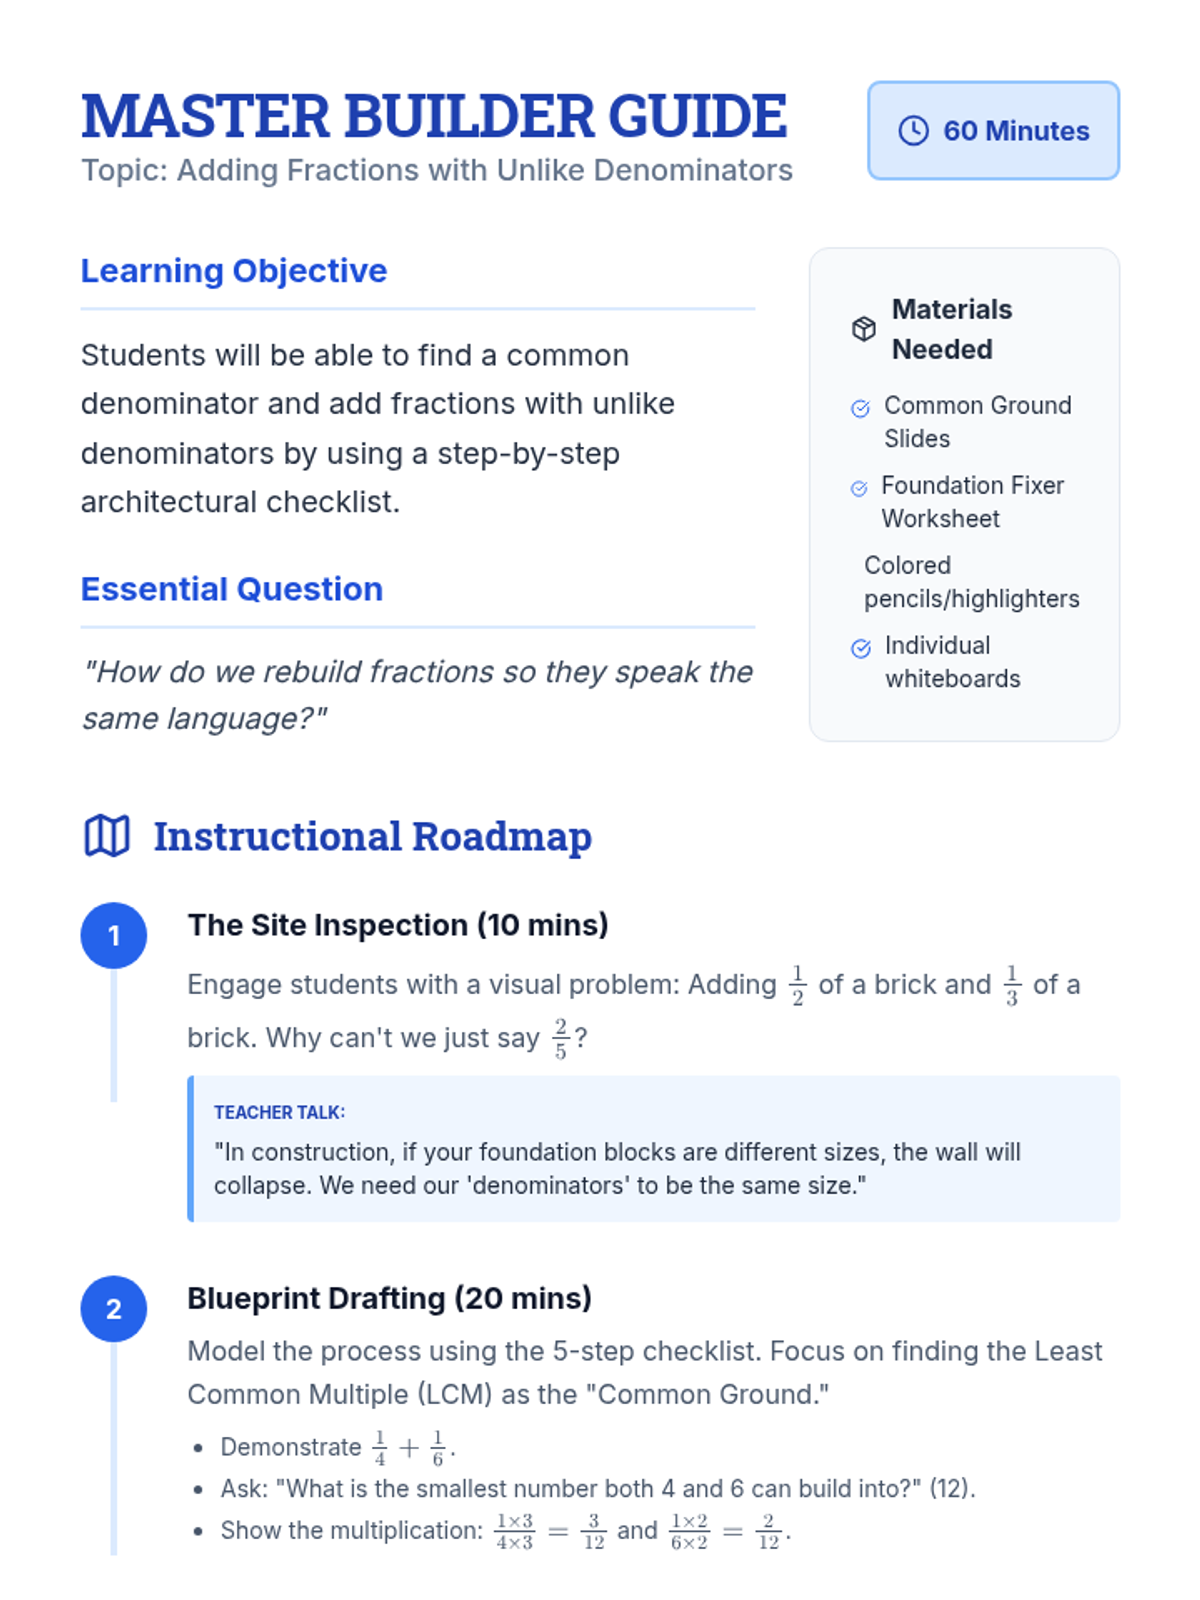
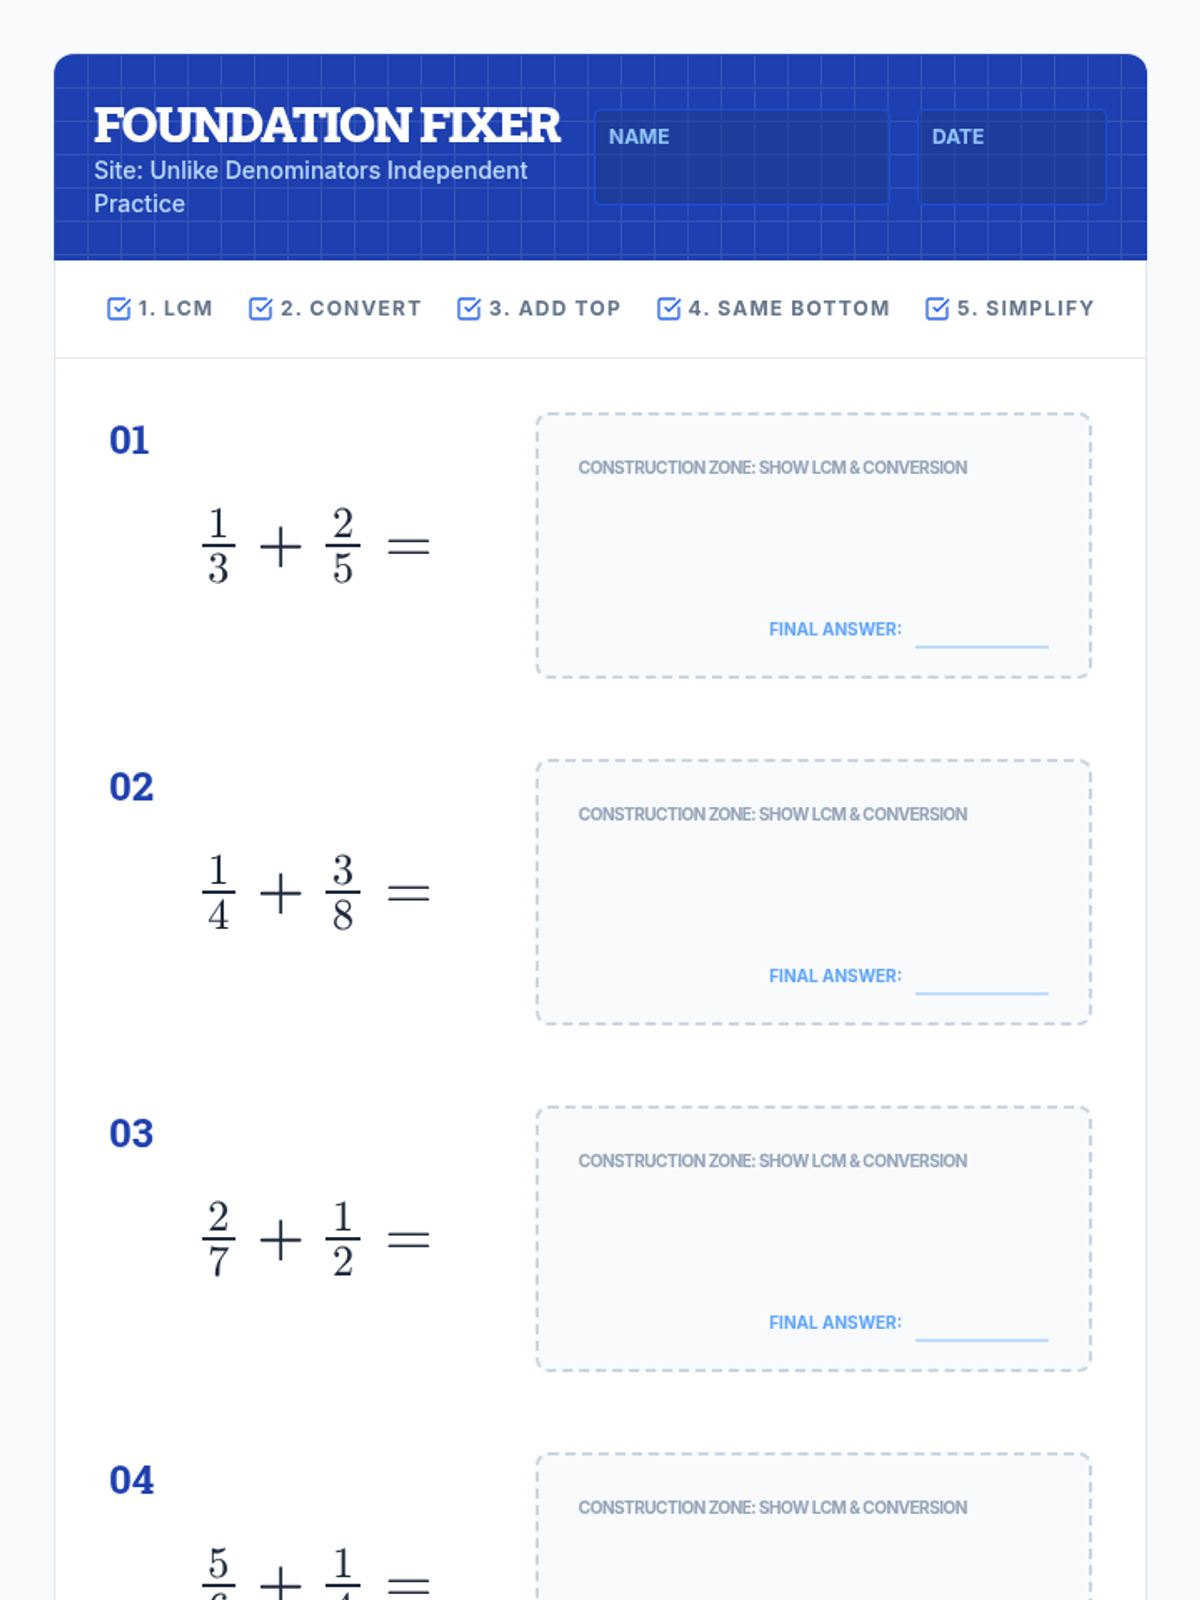
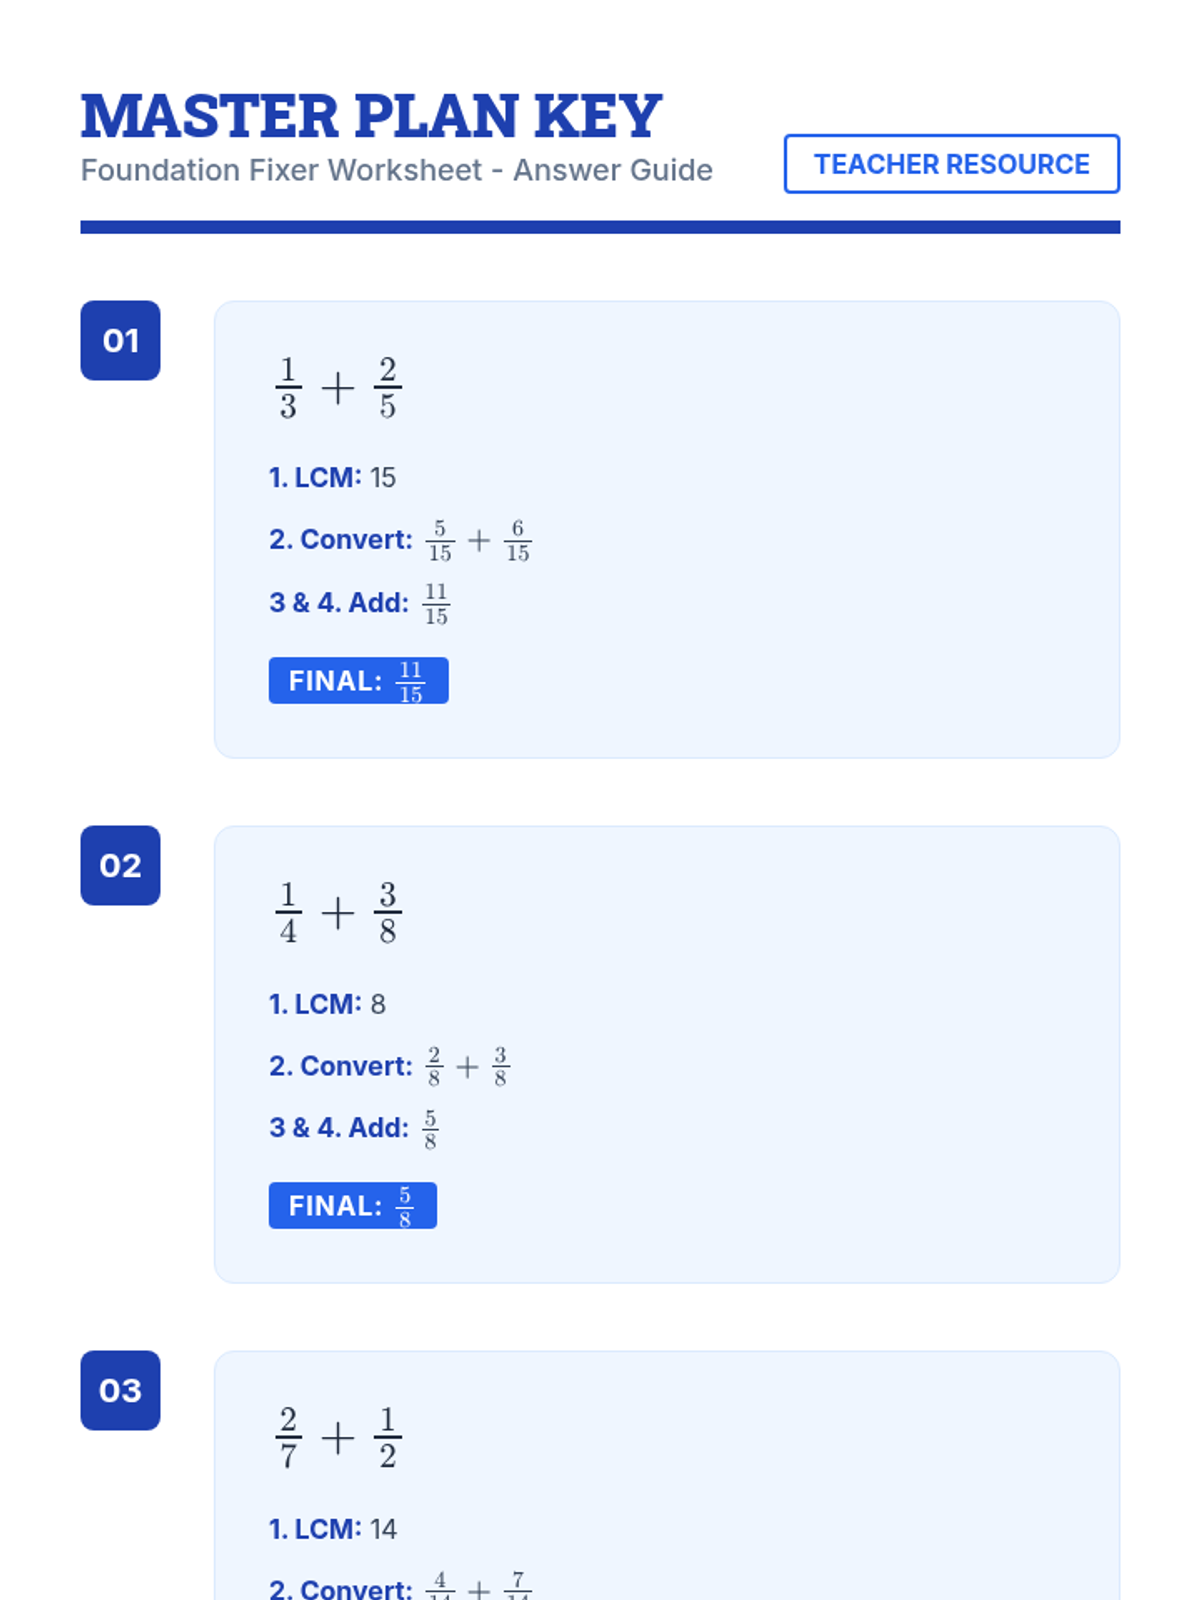
A construction-themed lesson focused on finding common denominators to add fractions with unlike denominators, featuring step-by-step checklists and architectural visual aids.
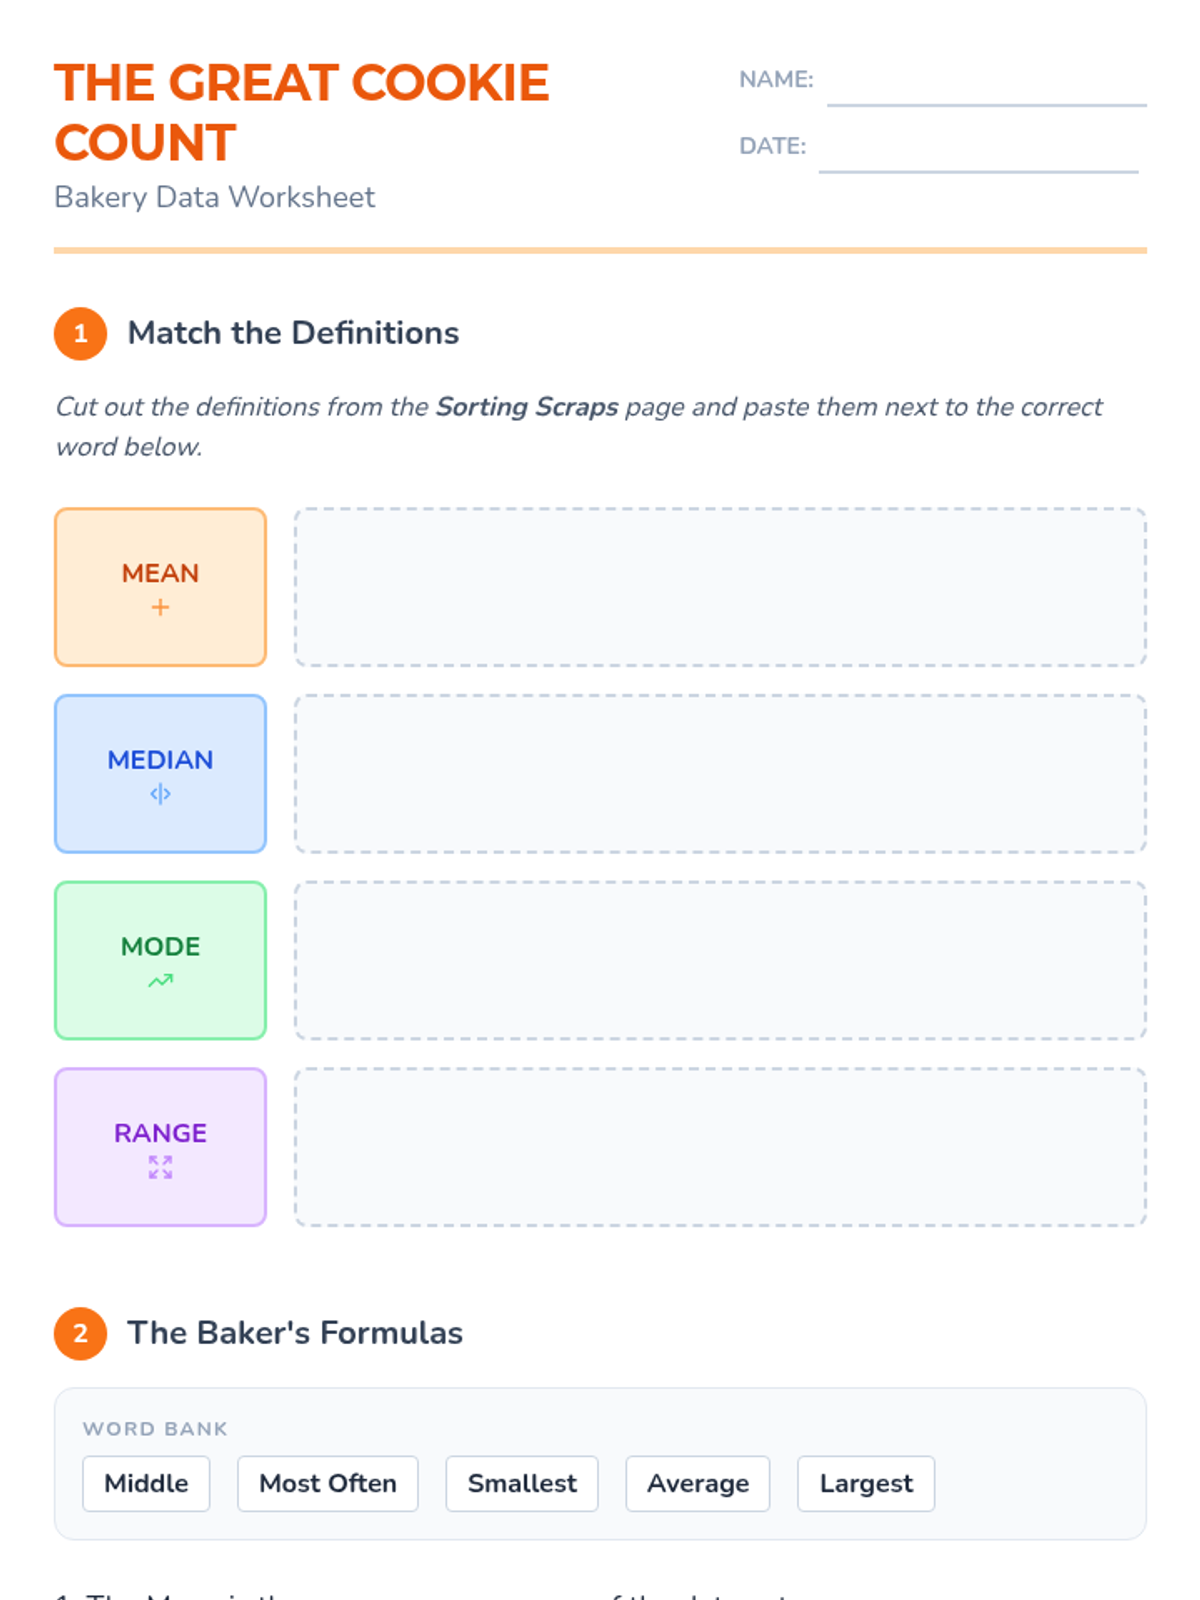
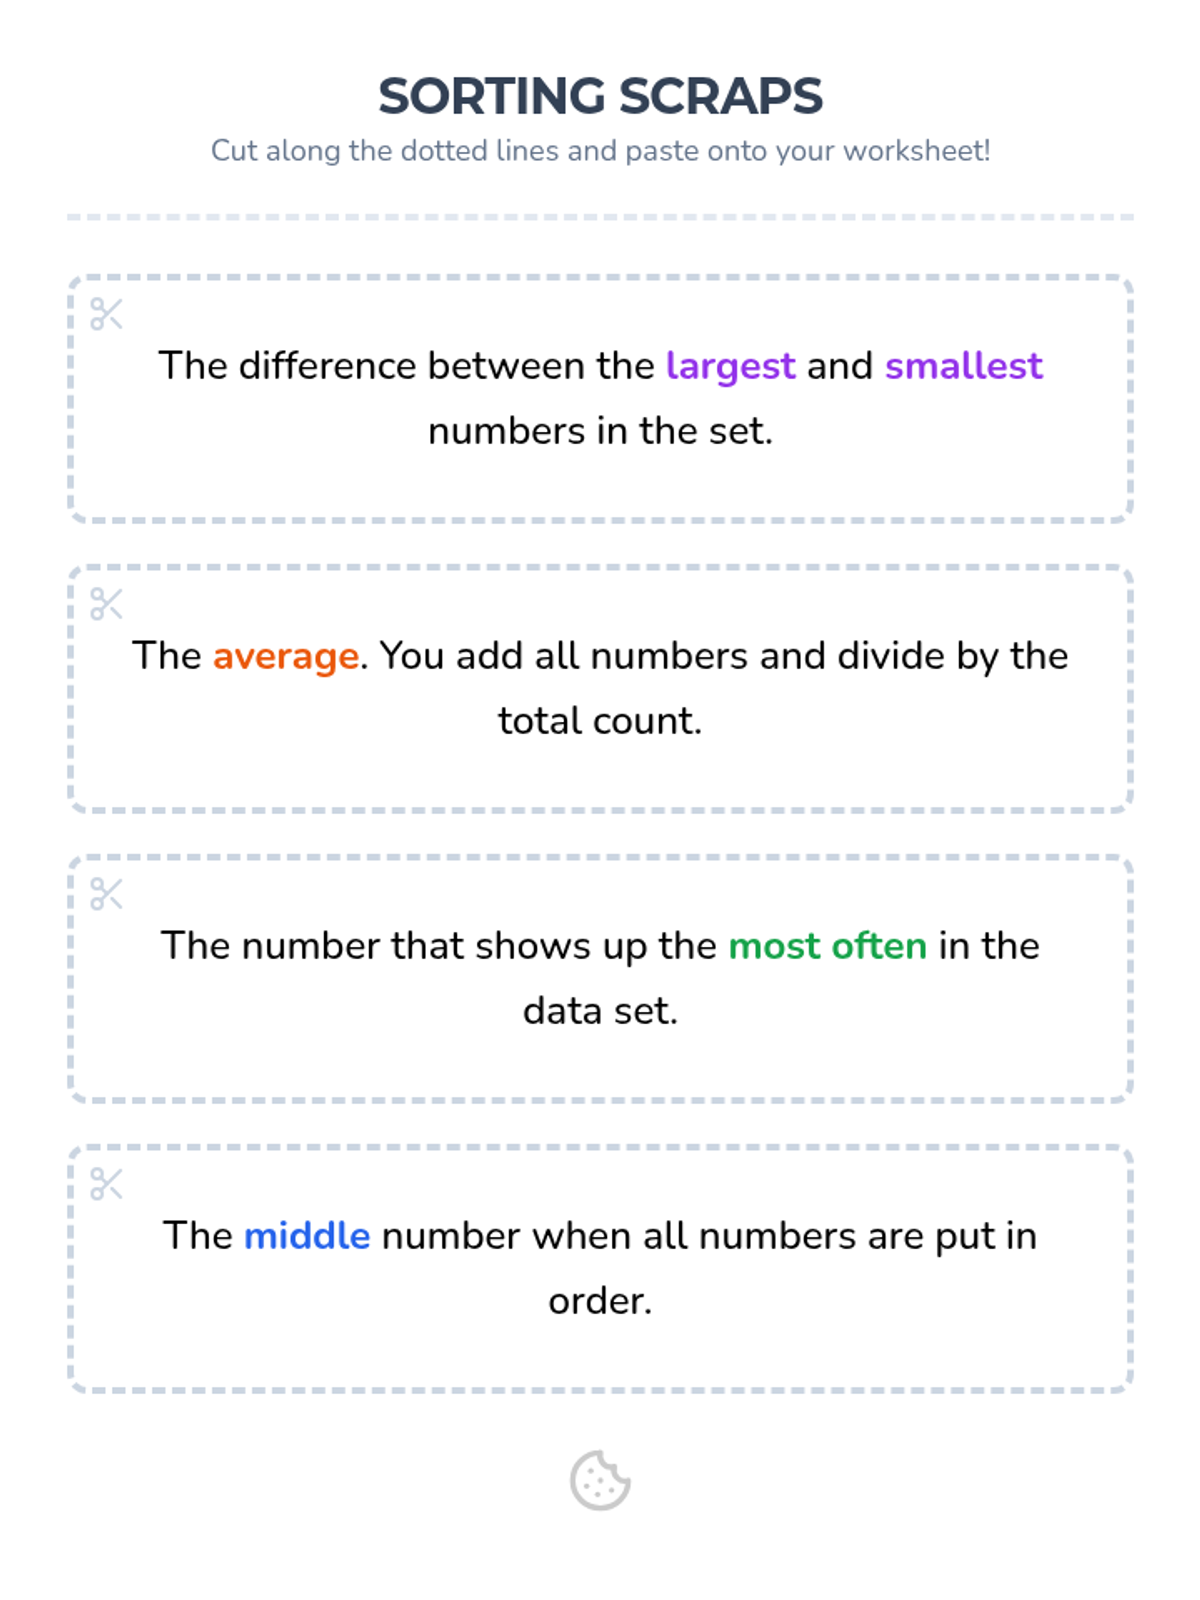
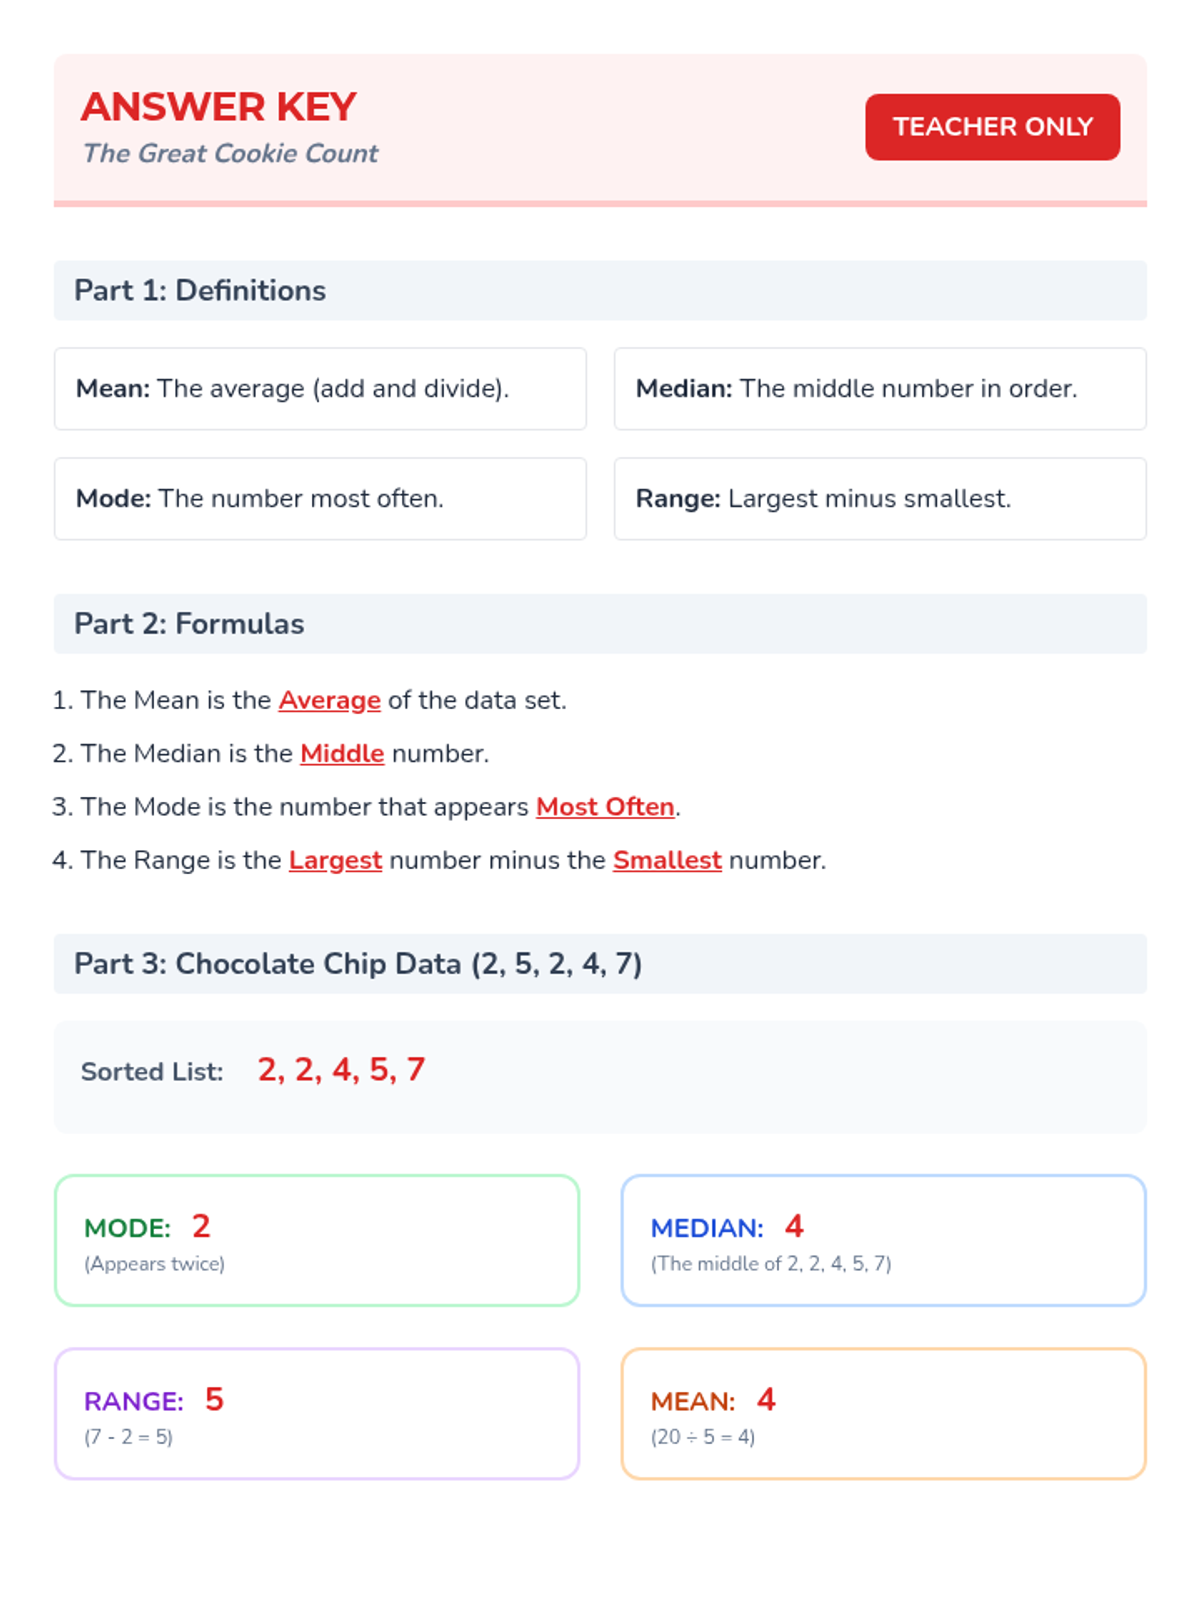
An introductory lesson on Mean, Median, Mode, and Range using a relatable bakery theme. Includes visual aids and hands-on sorting for students with IEP accommodations.
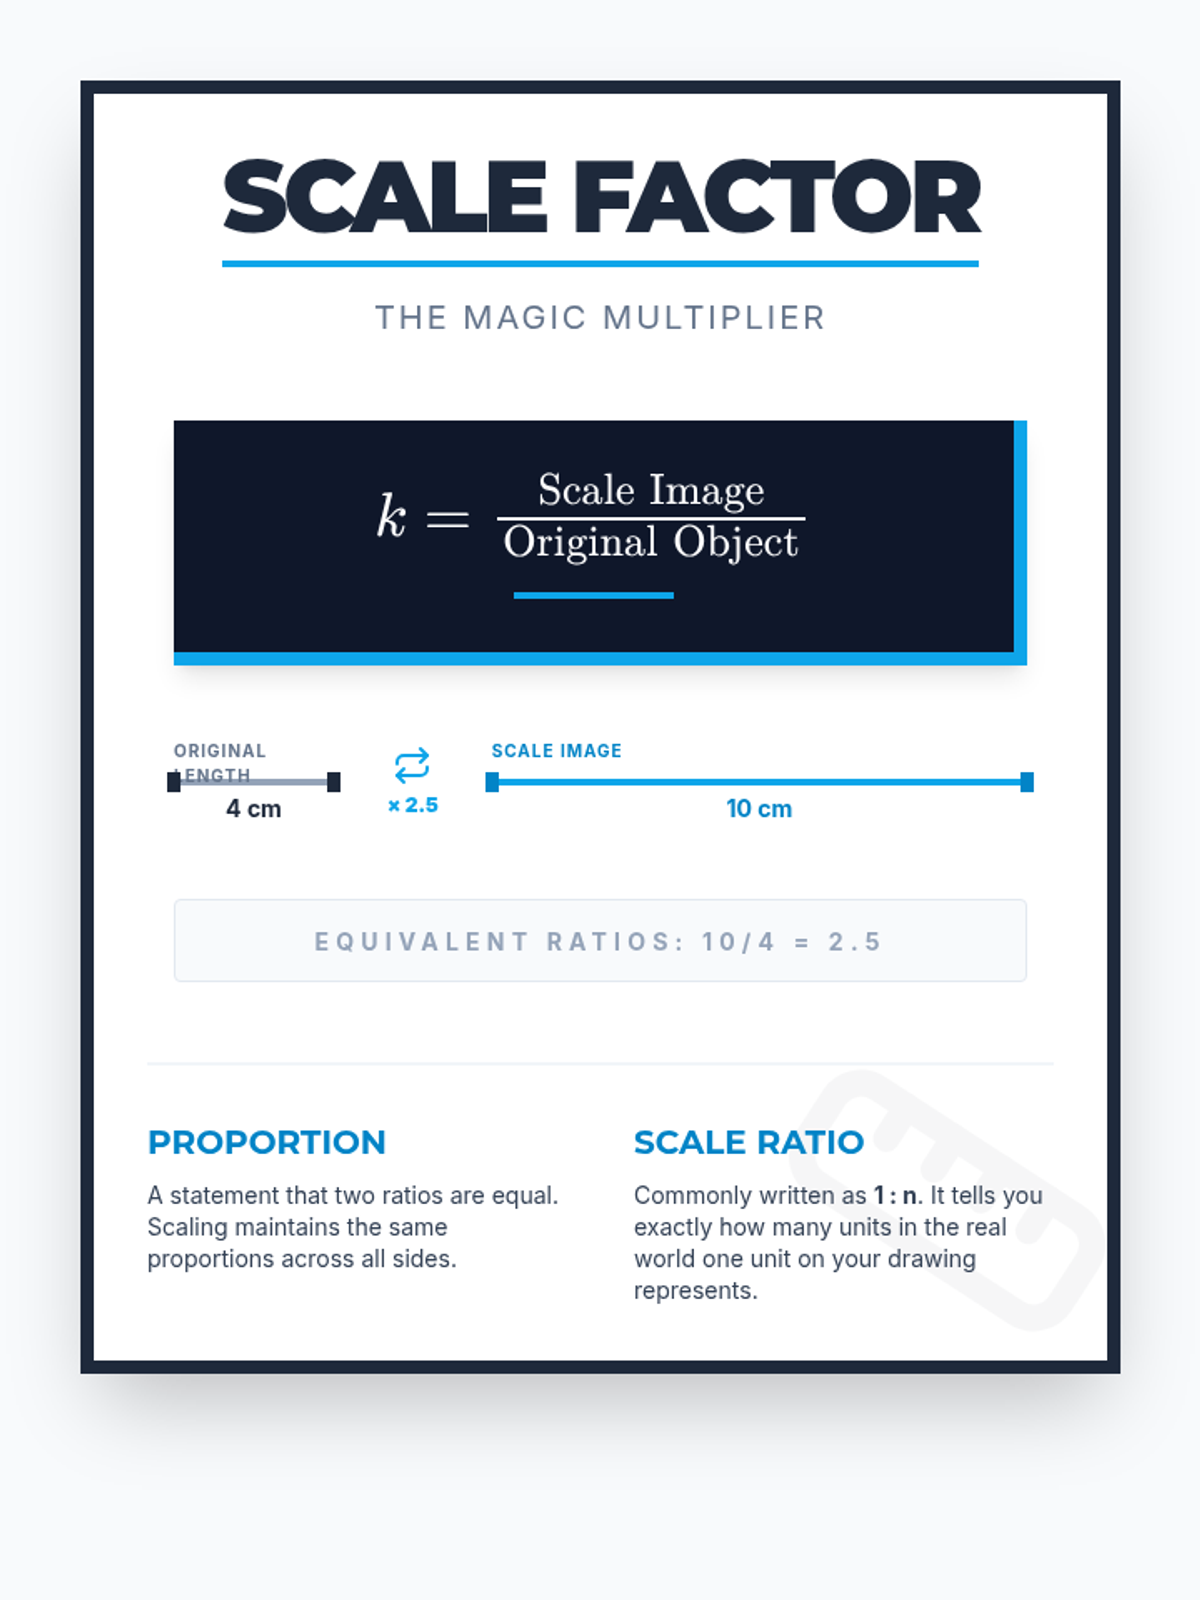
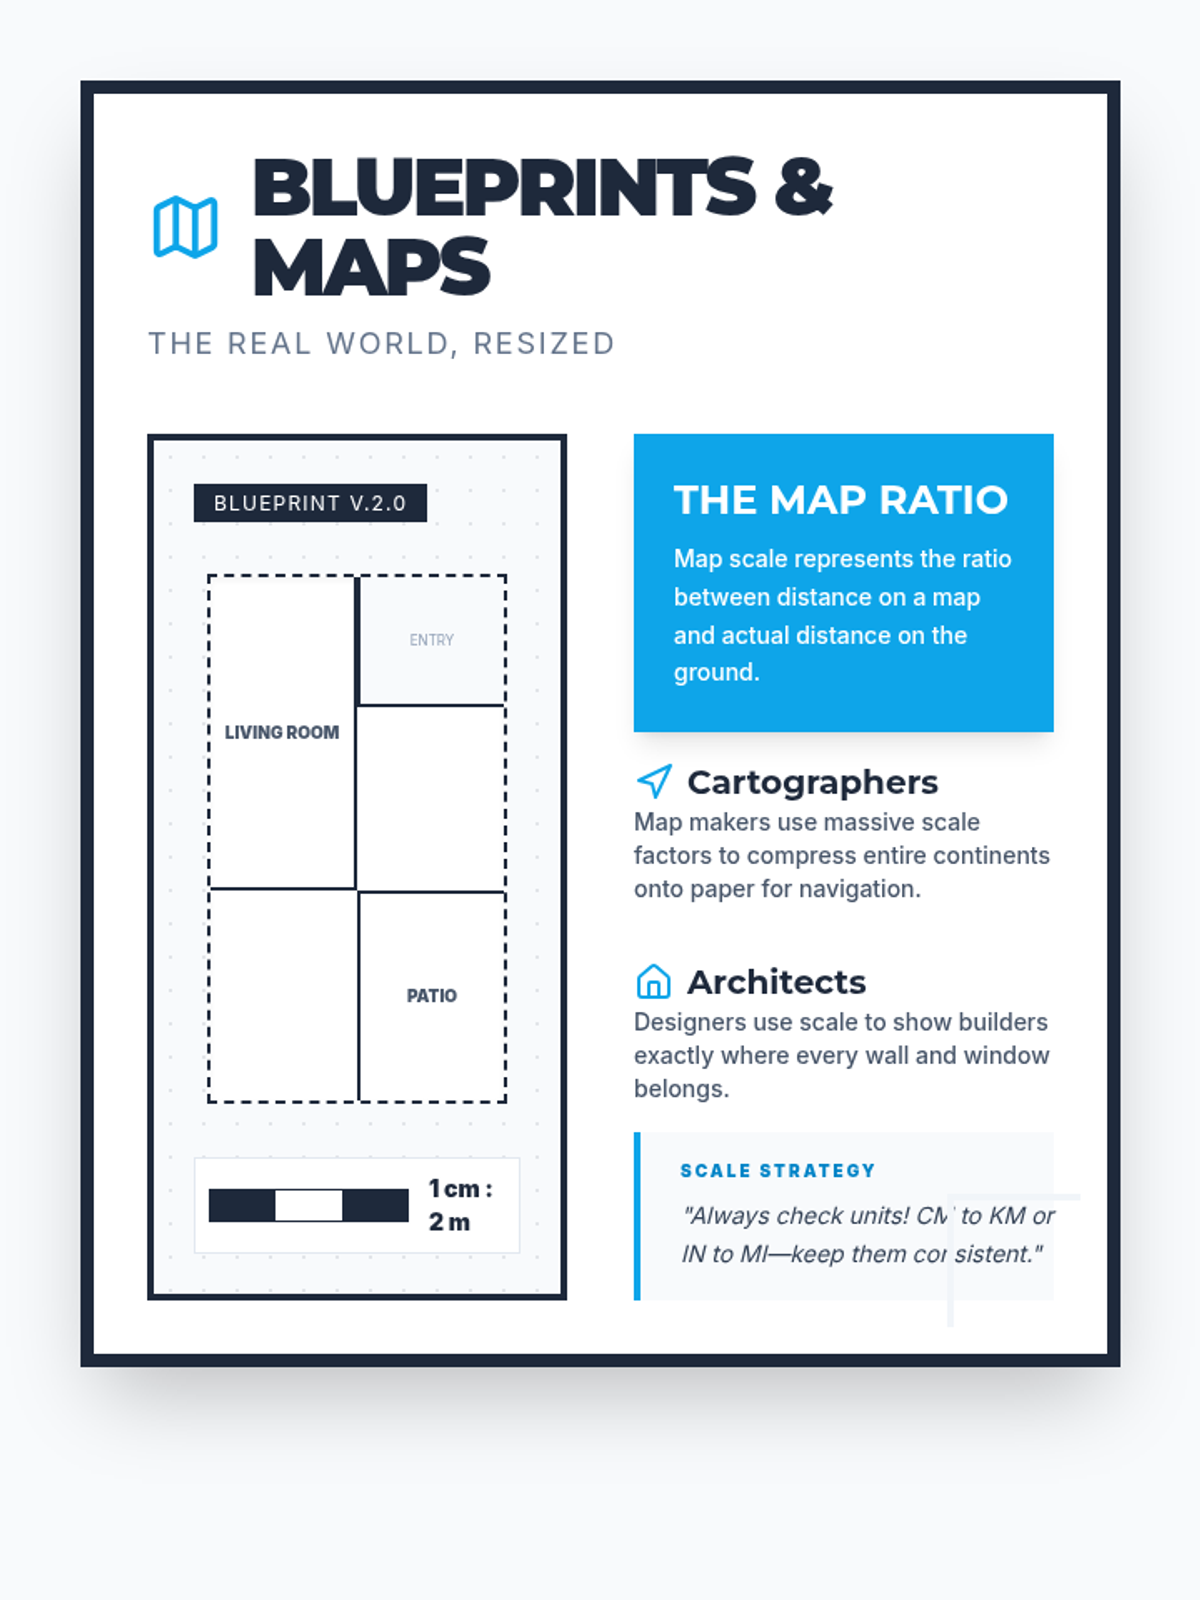
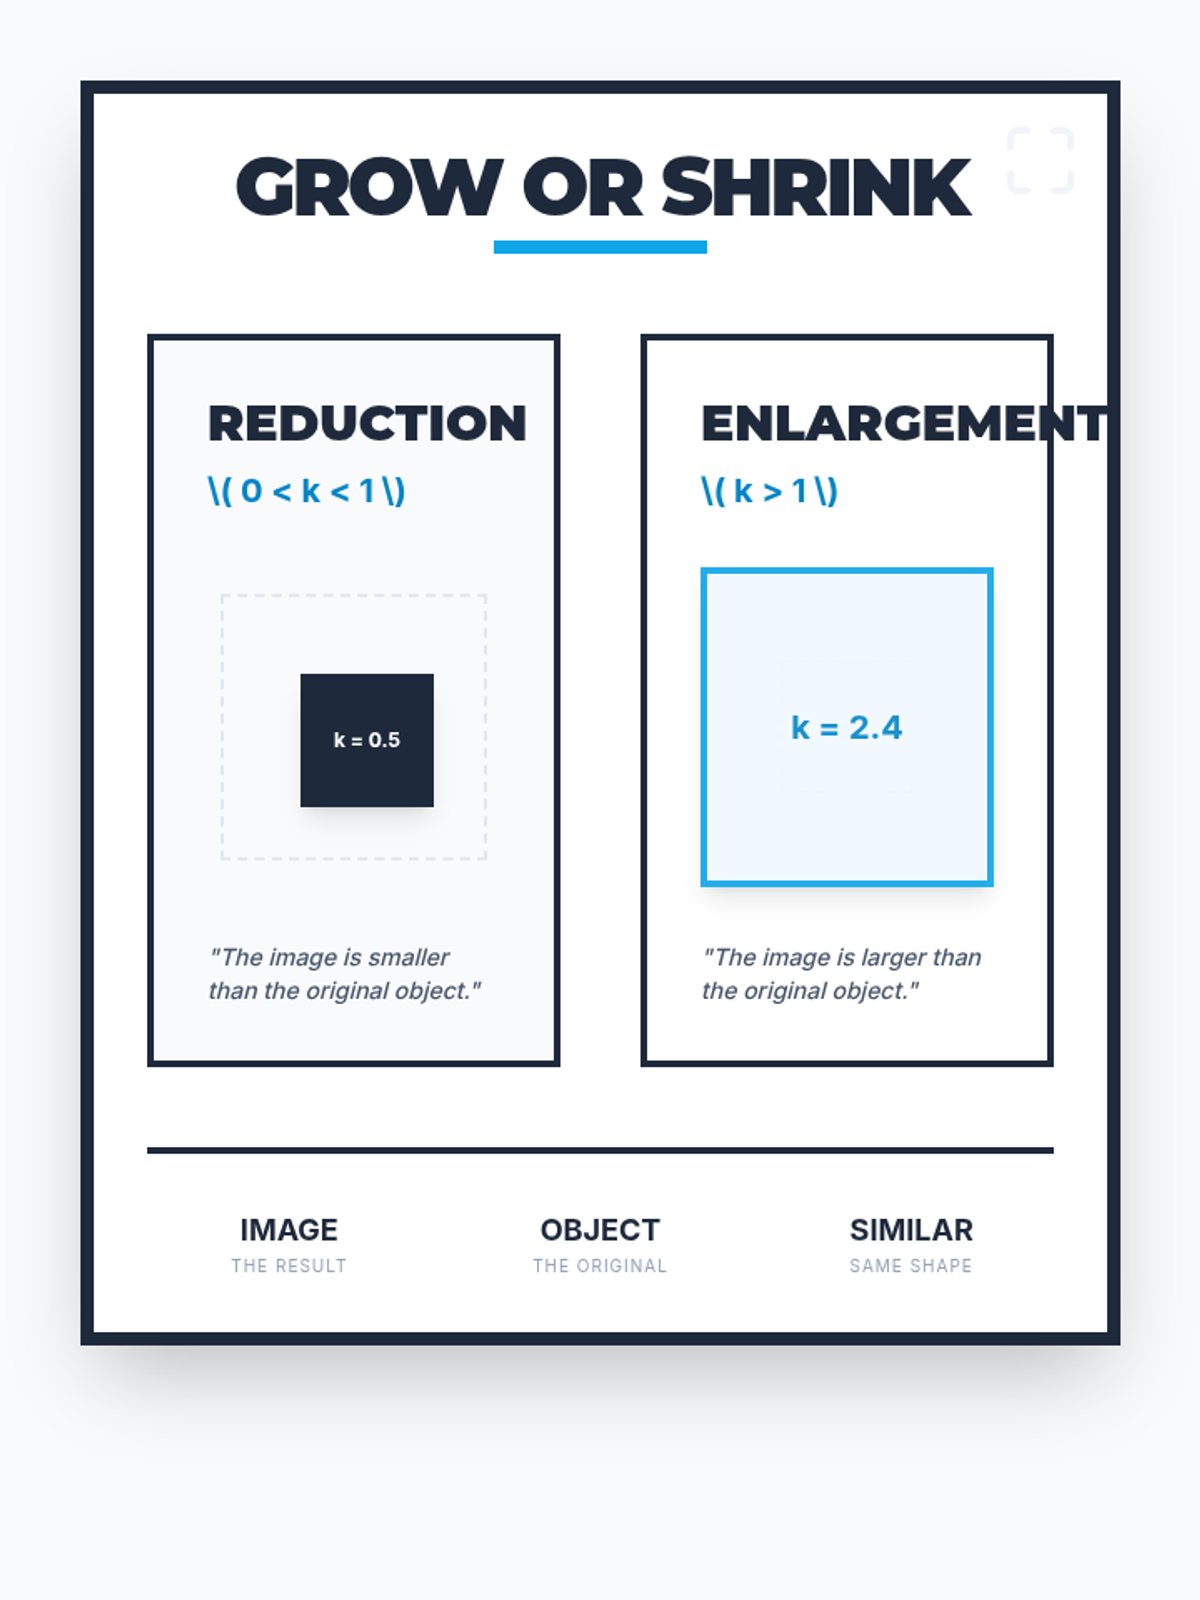
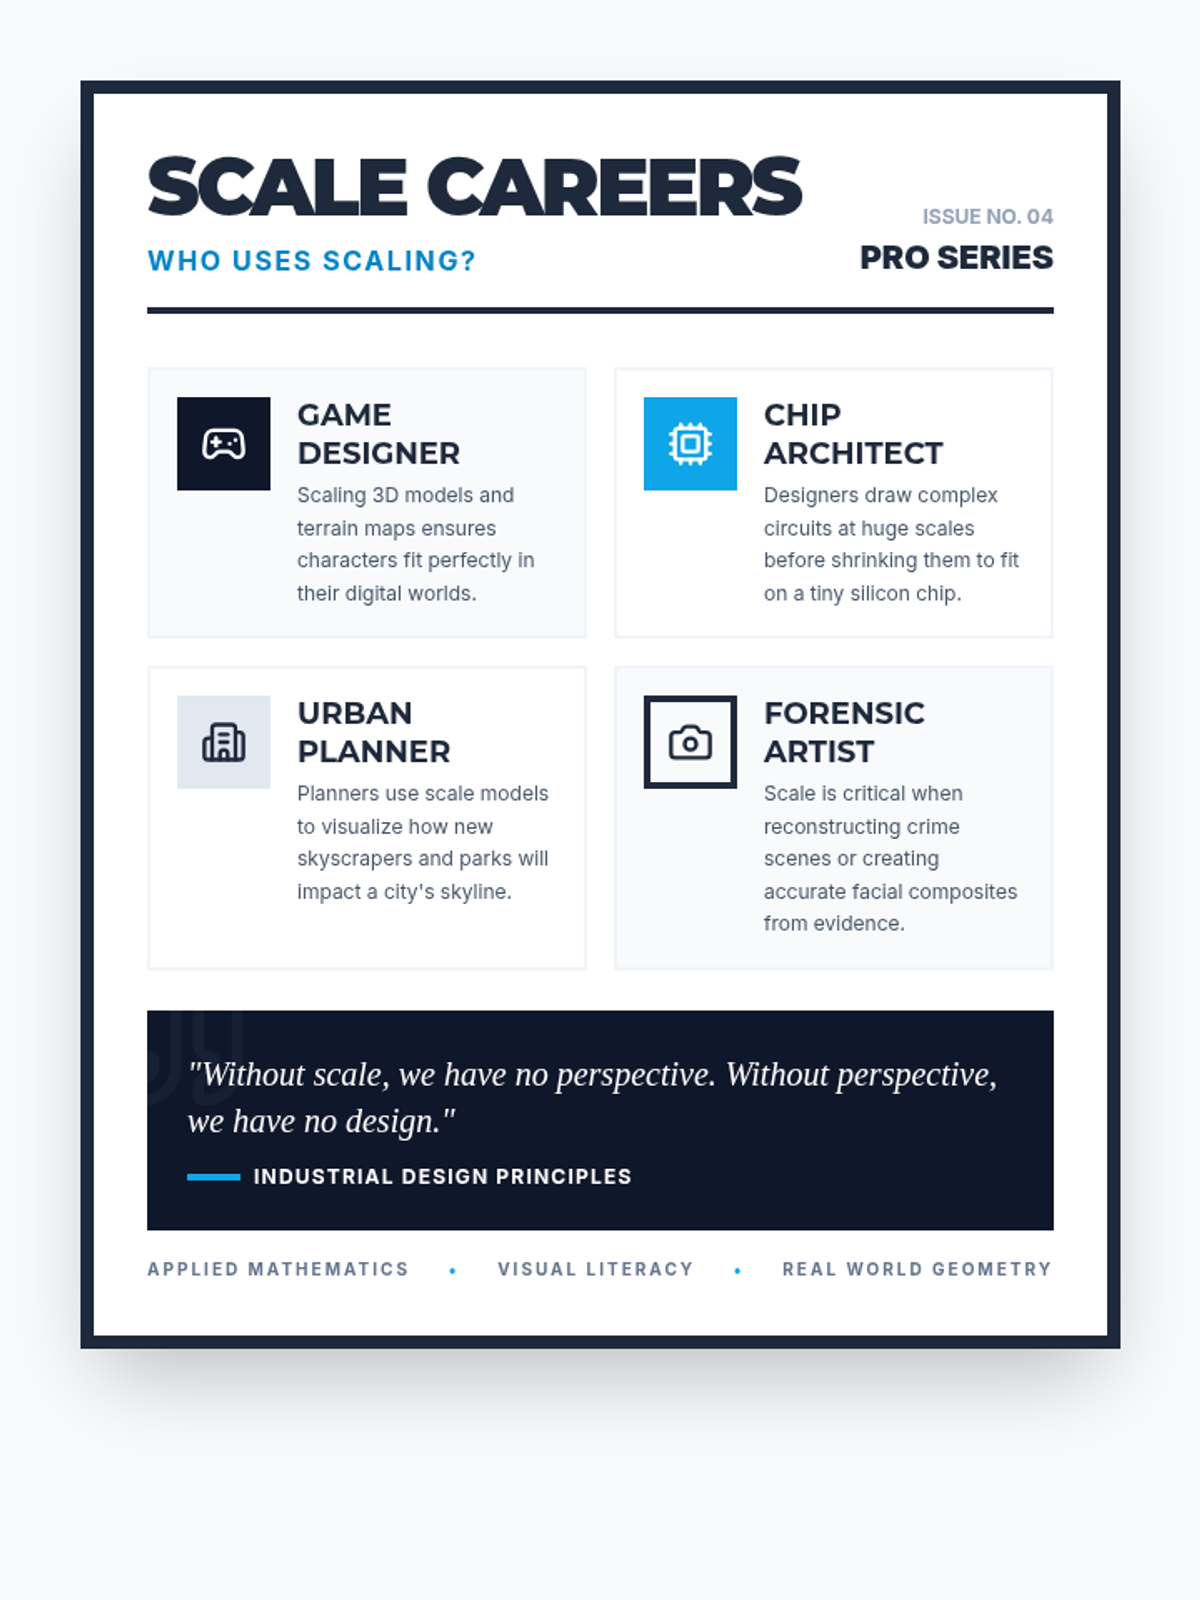
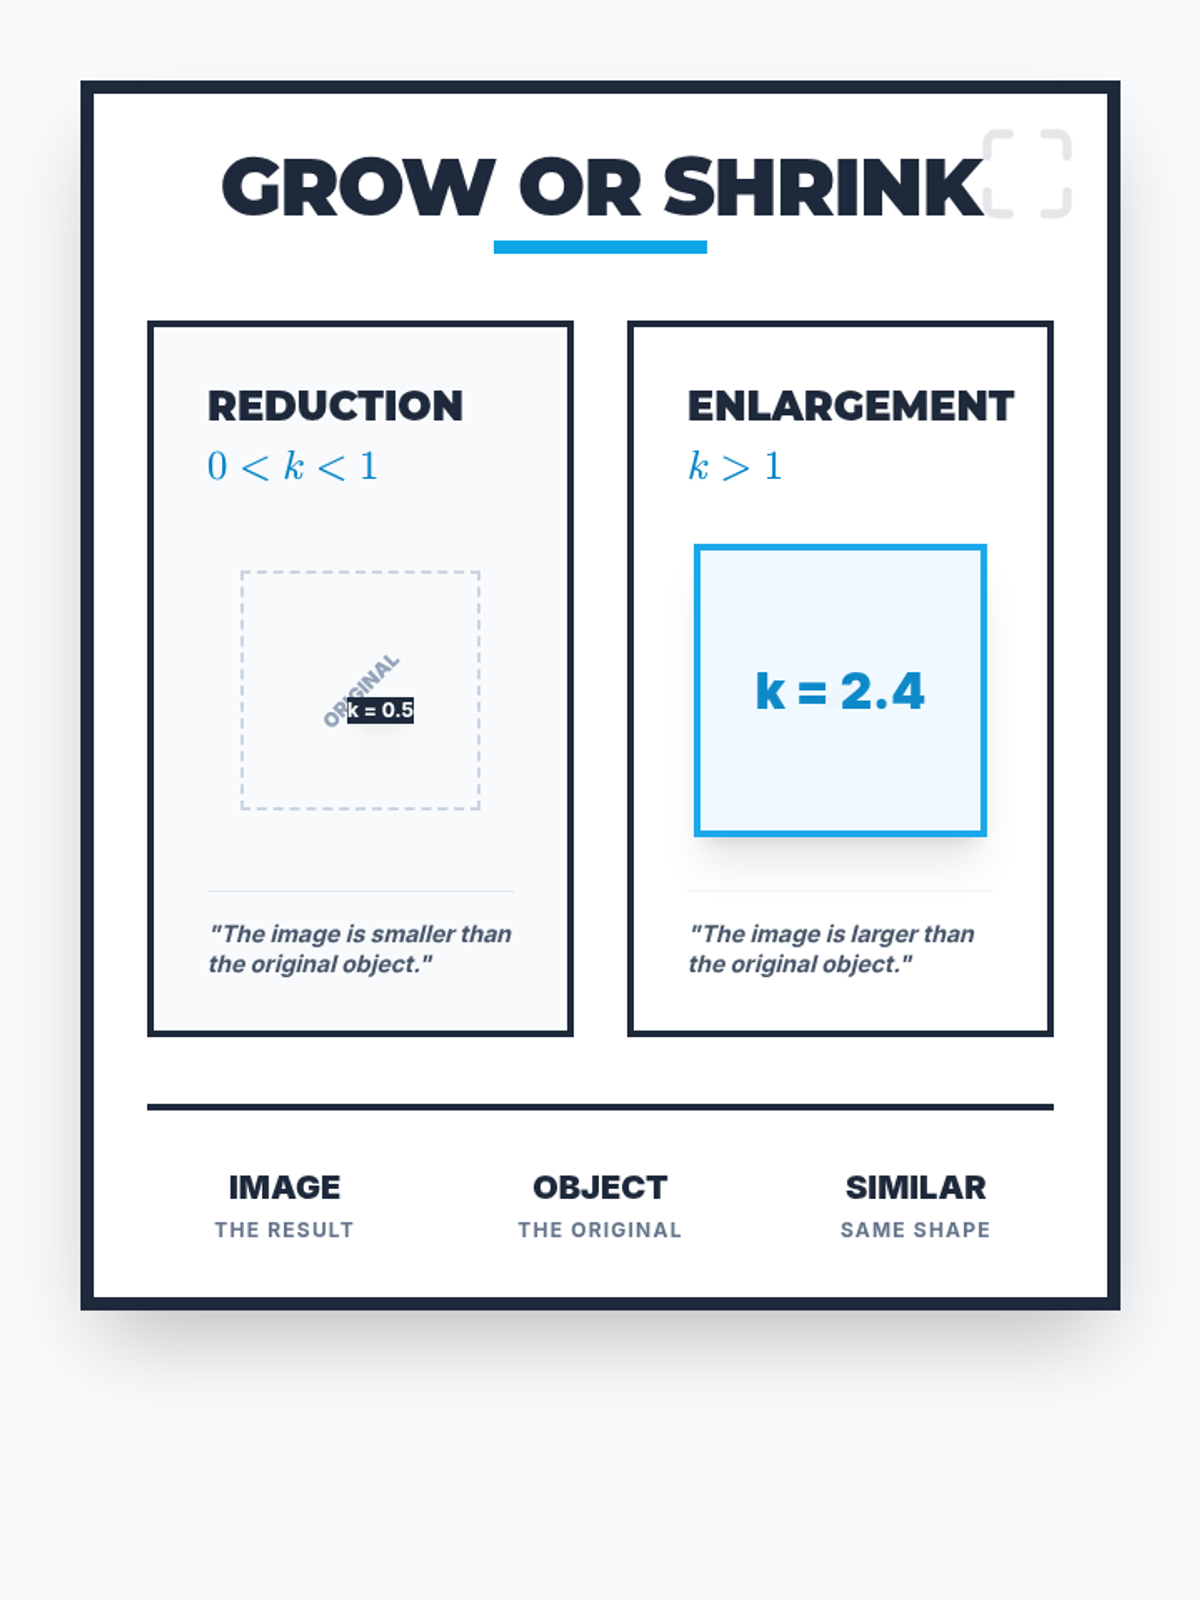
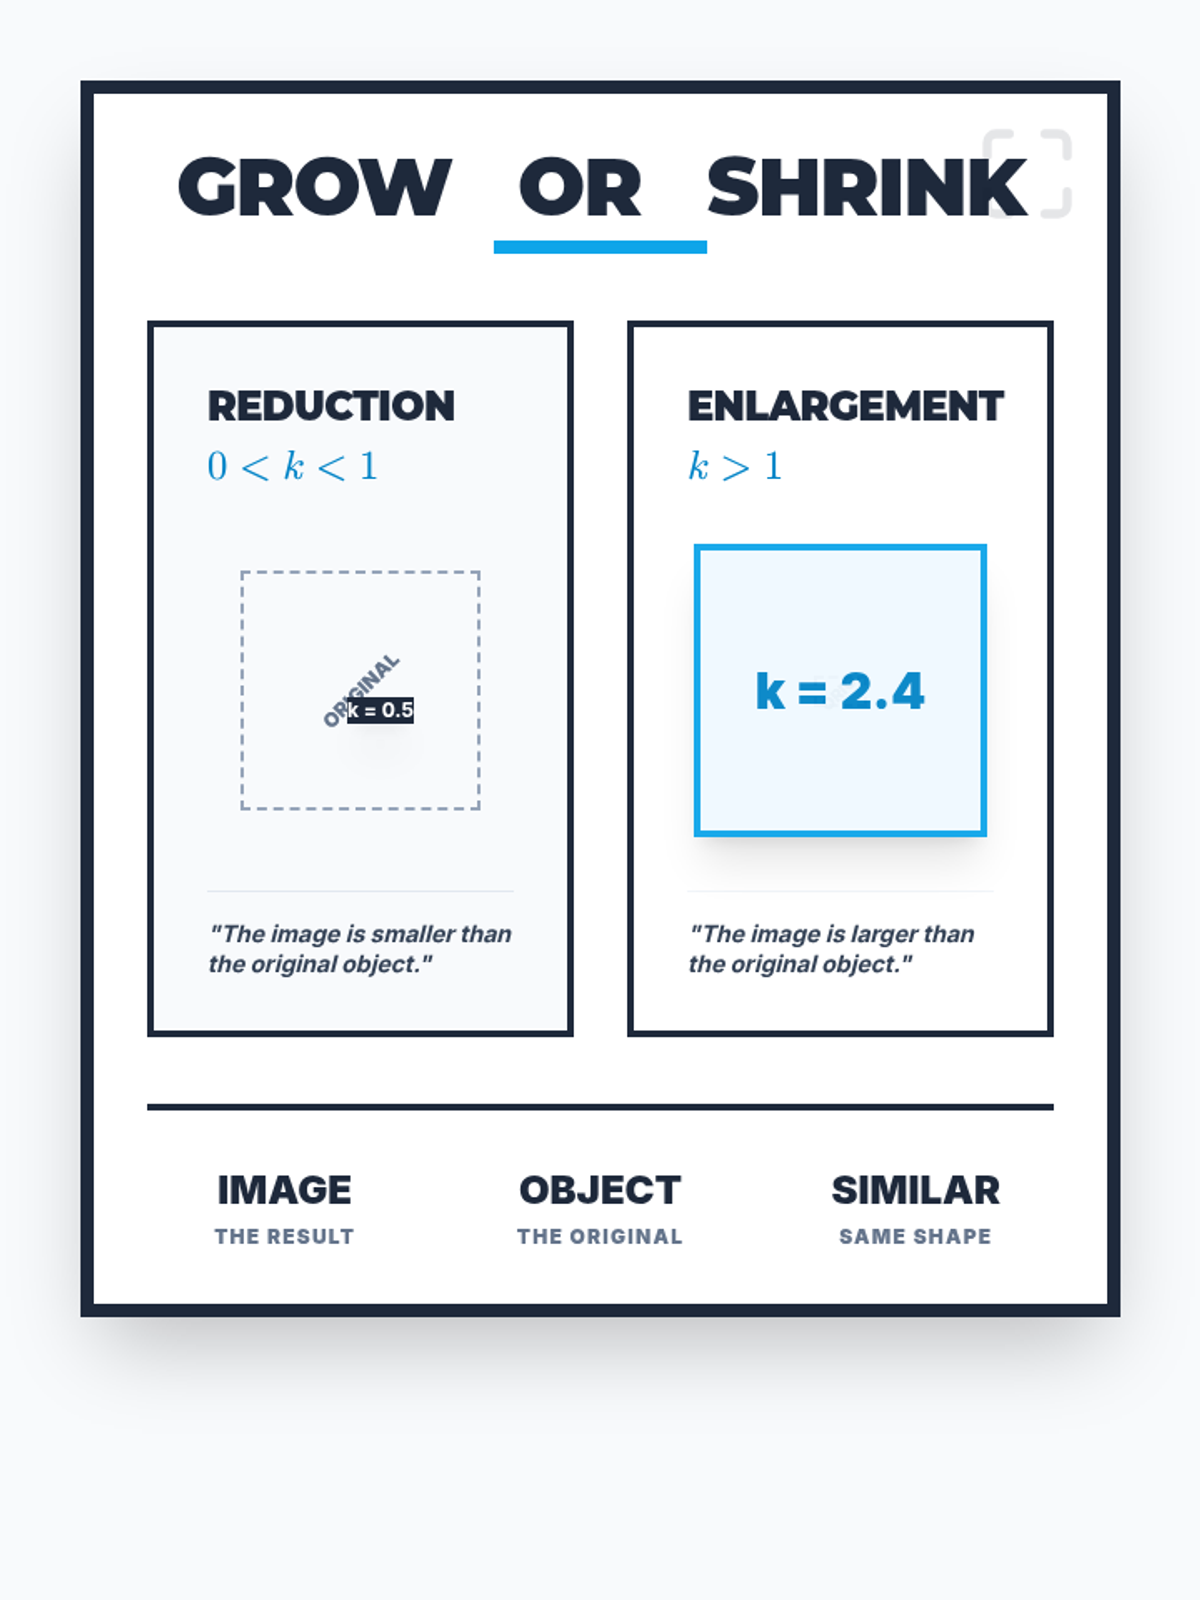
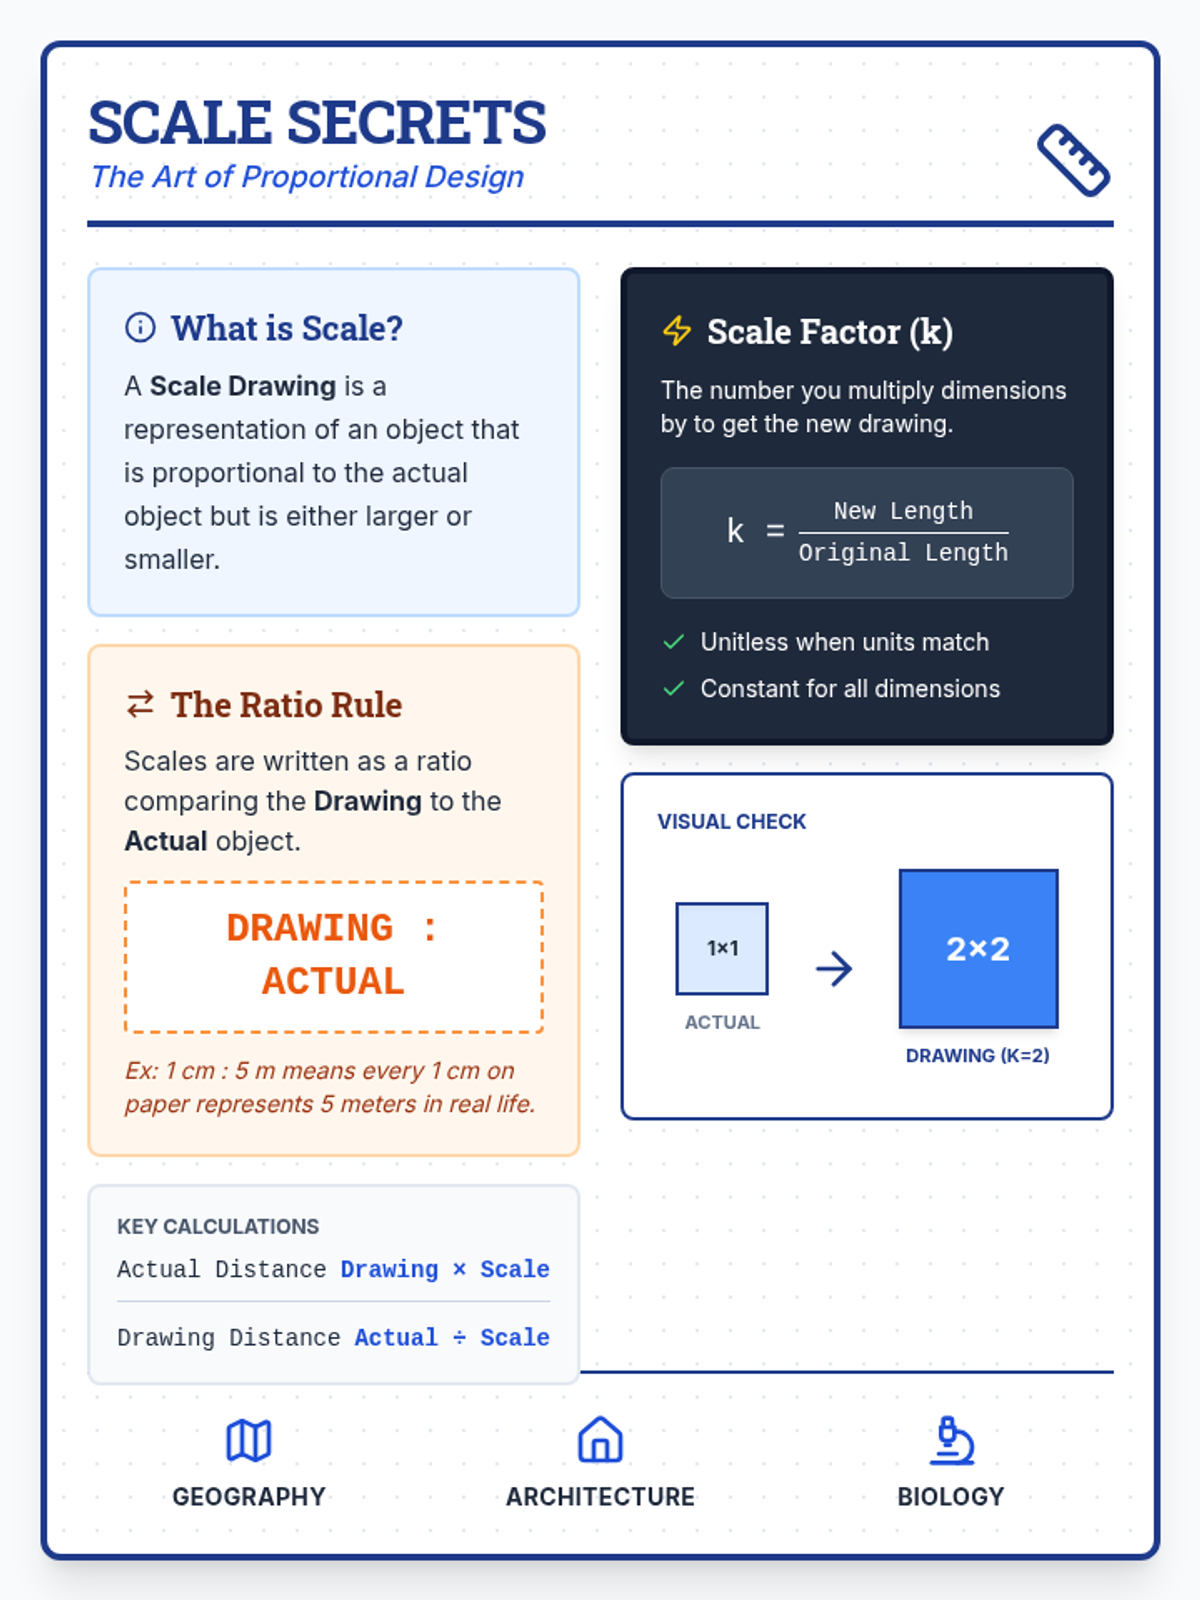
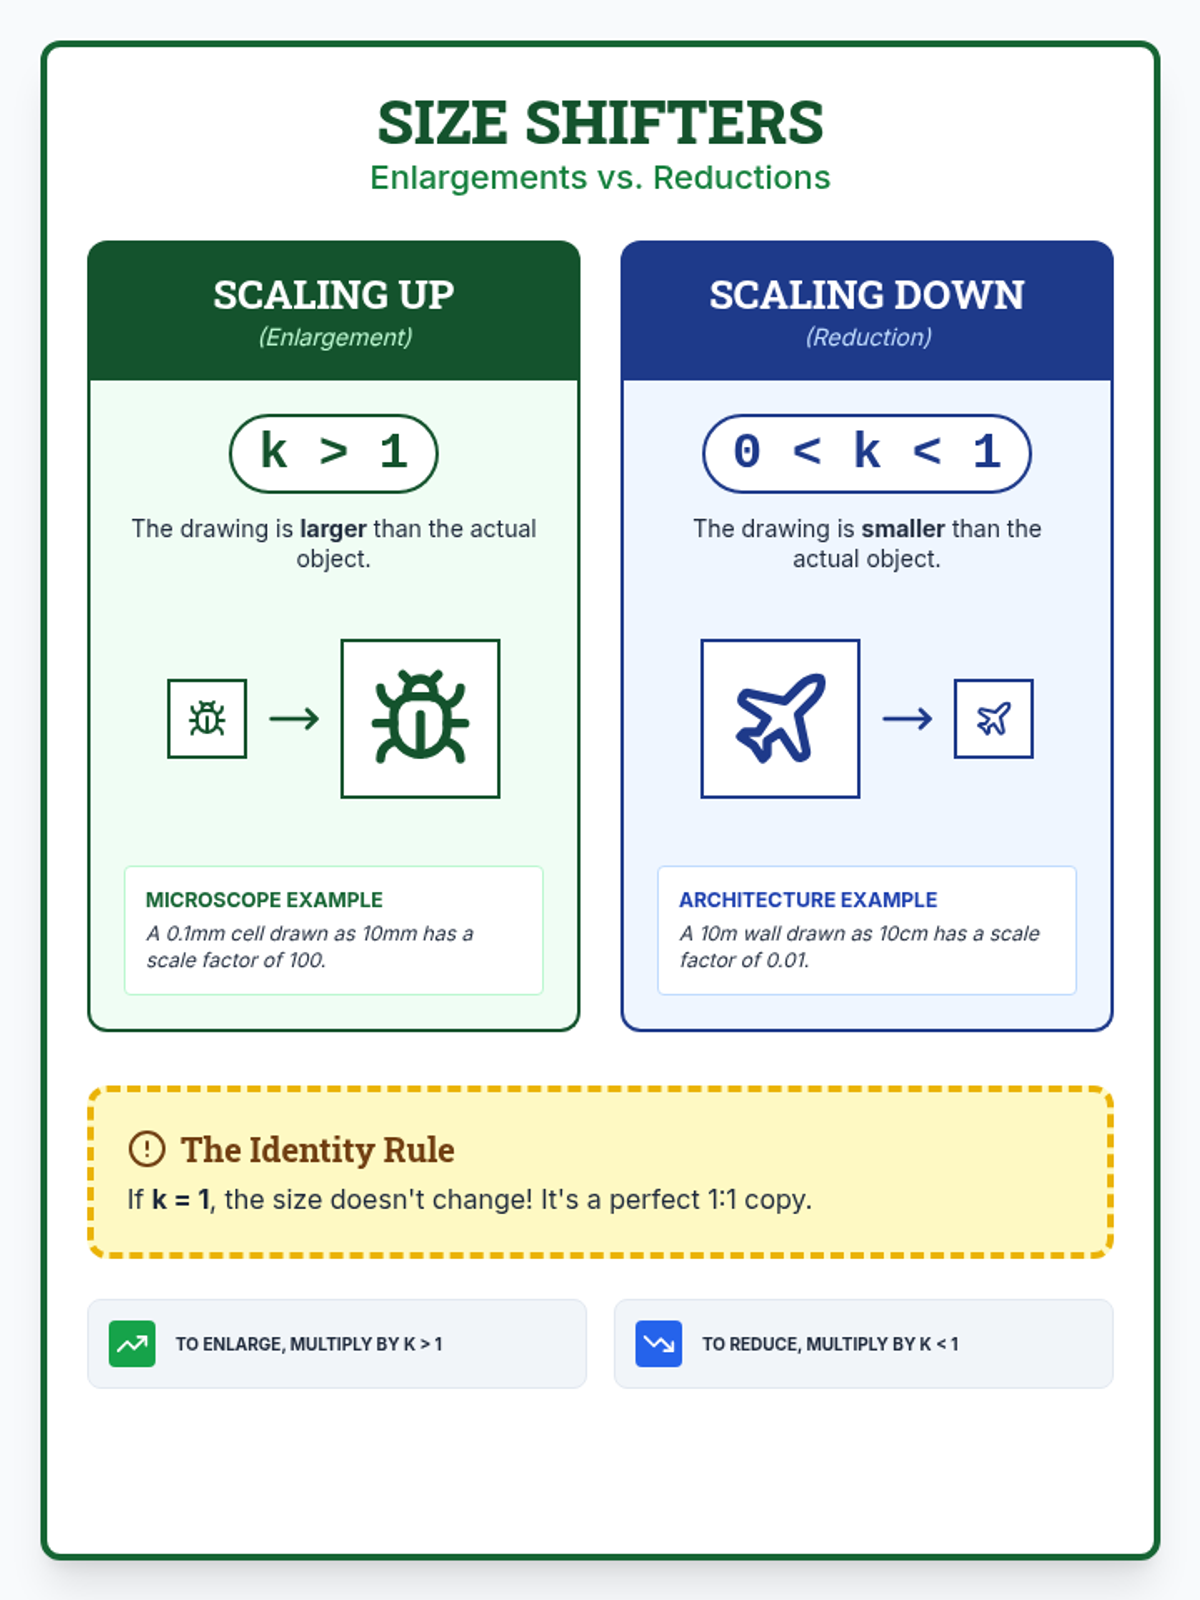
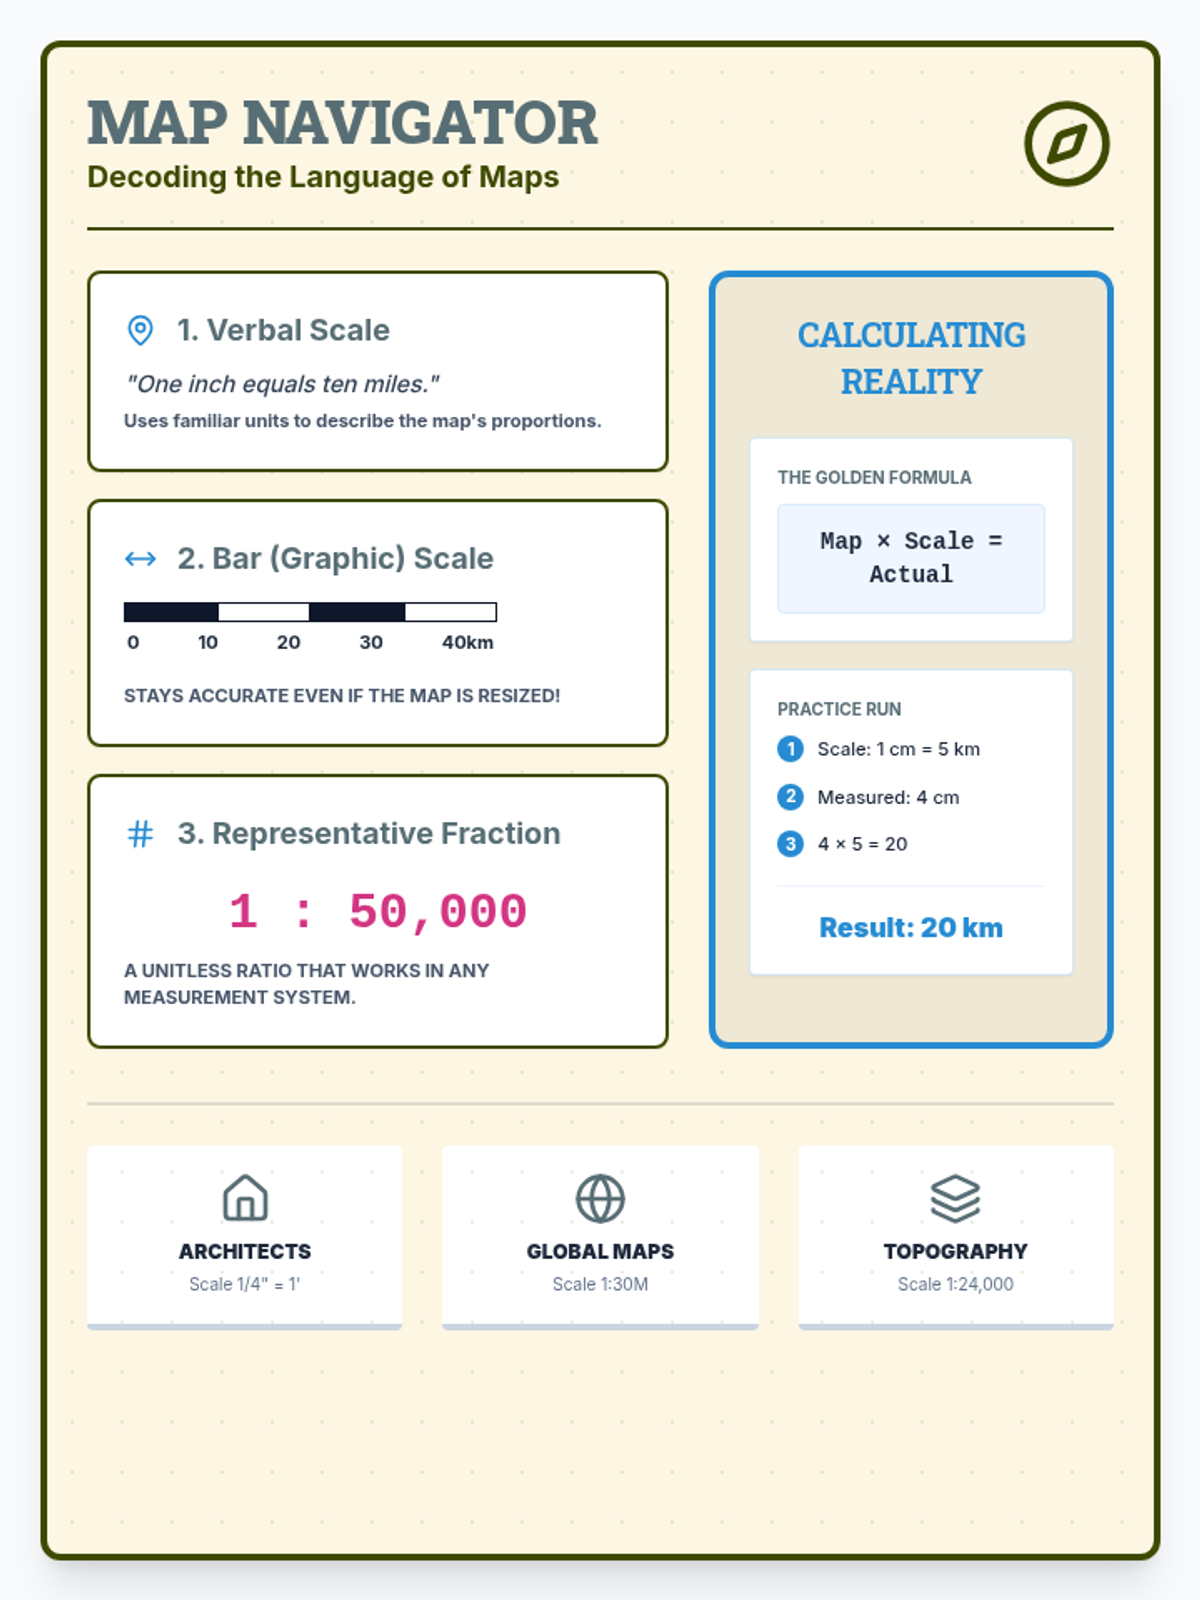
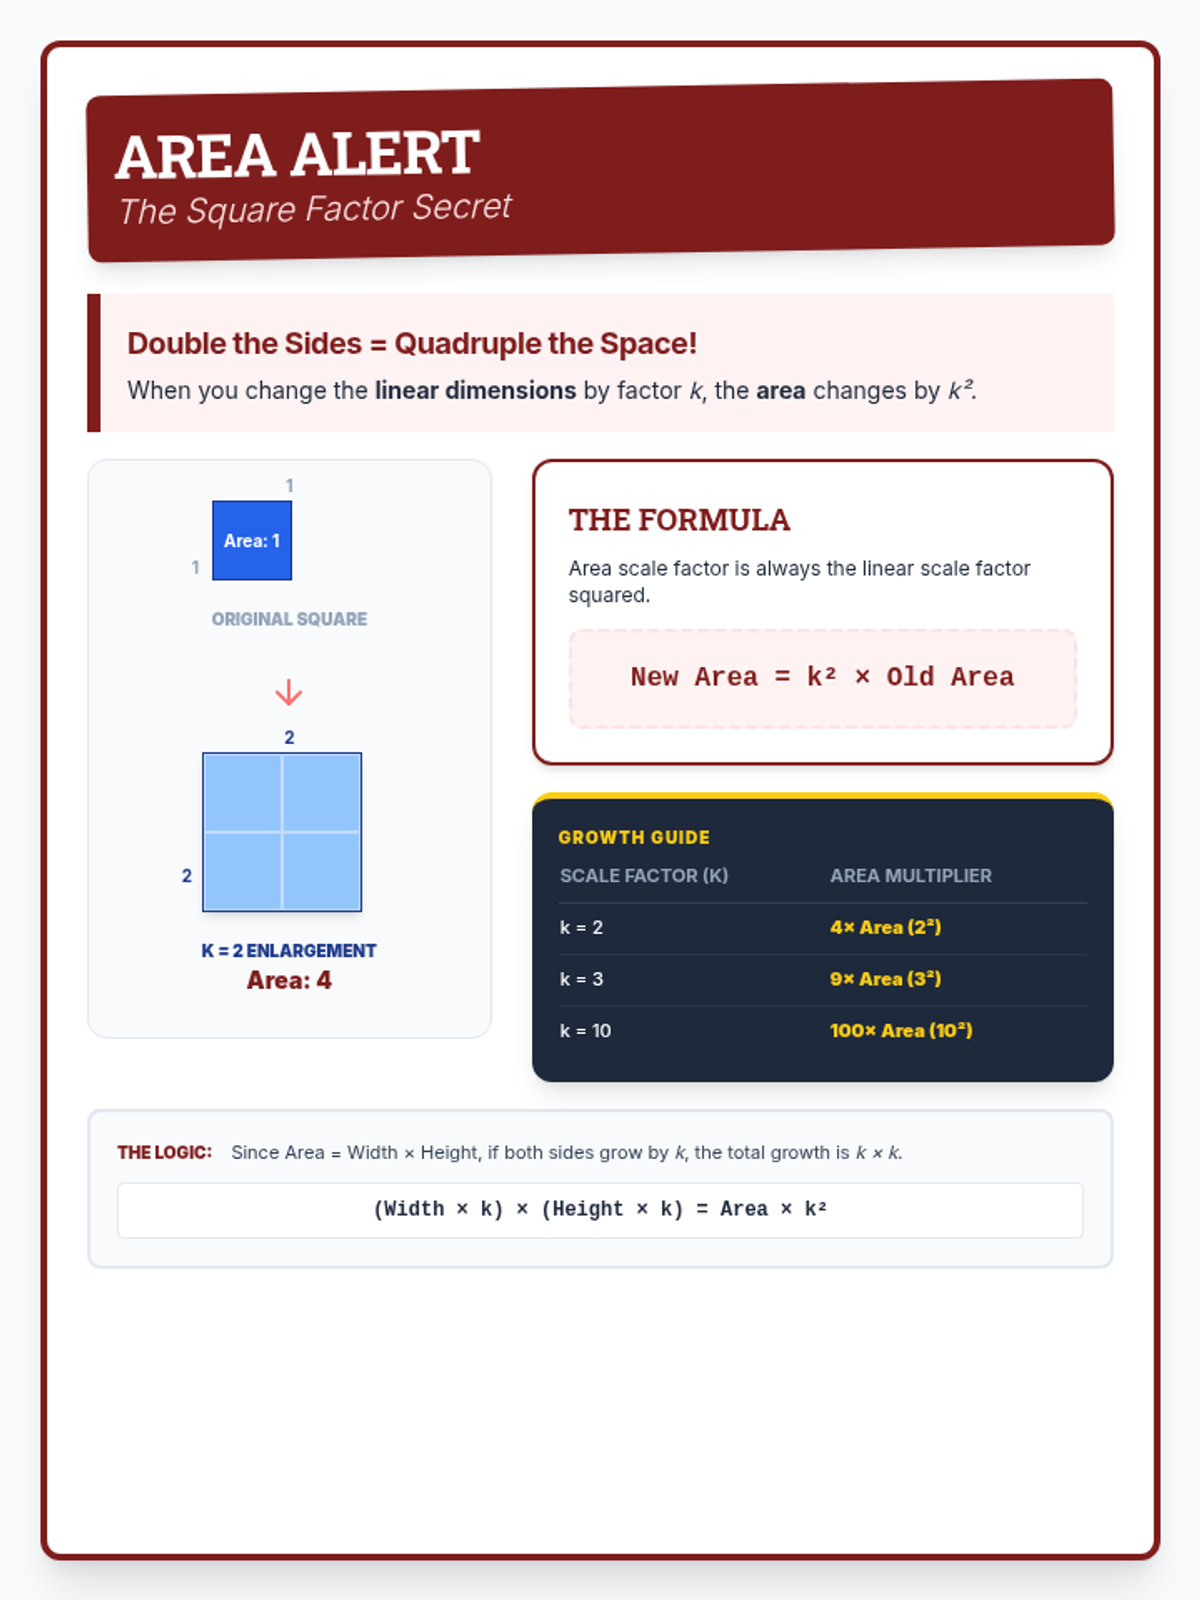
A collection of minimalist, modern math art posters for a classroom word wall, focusing on scale factor, proportions, real-world applications, and career connections.
A collection of visual posters and anchor charts designed to teach the fundamental concepts of scale drawings, including scale factors, map reading, and the relationship between scale and area.