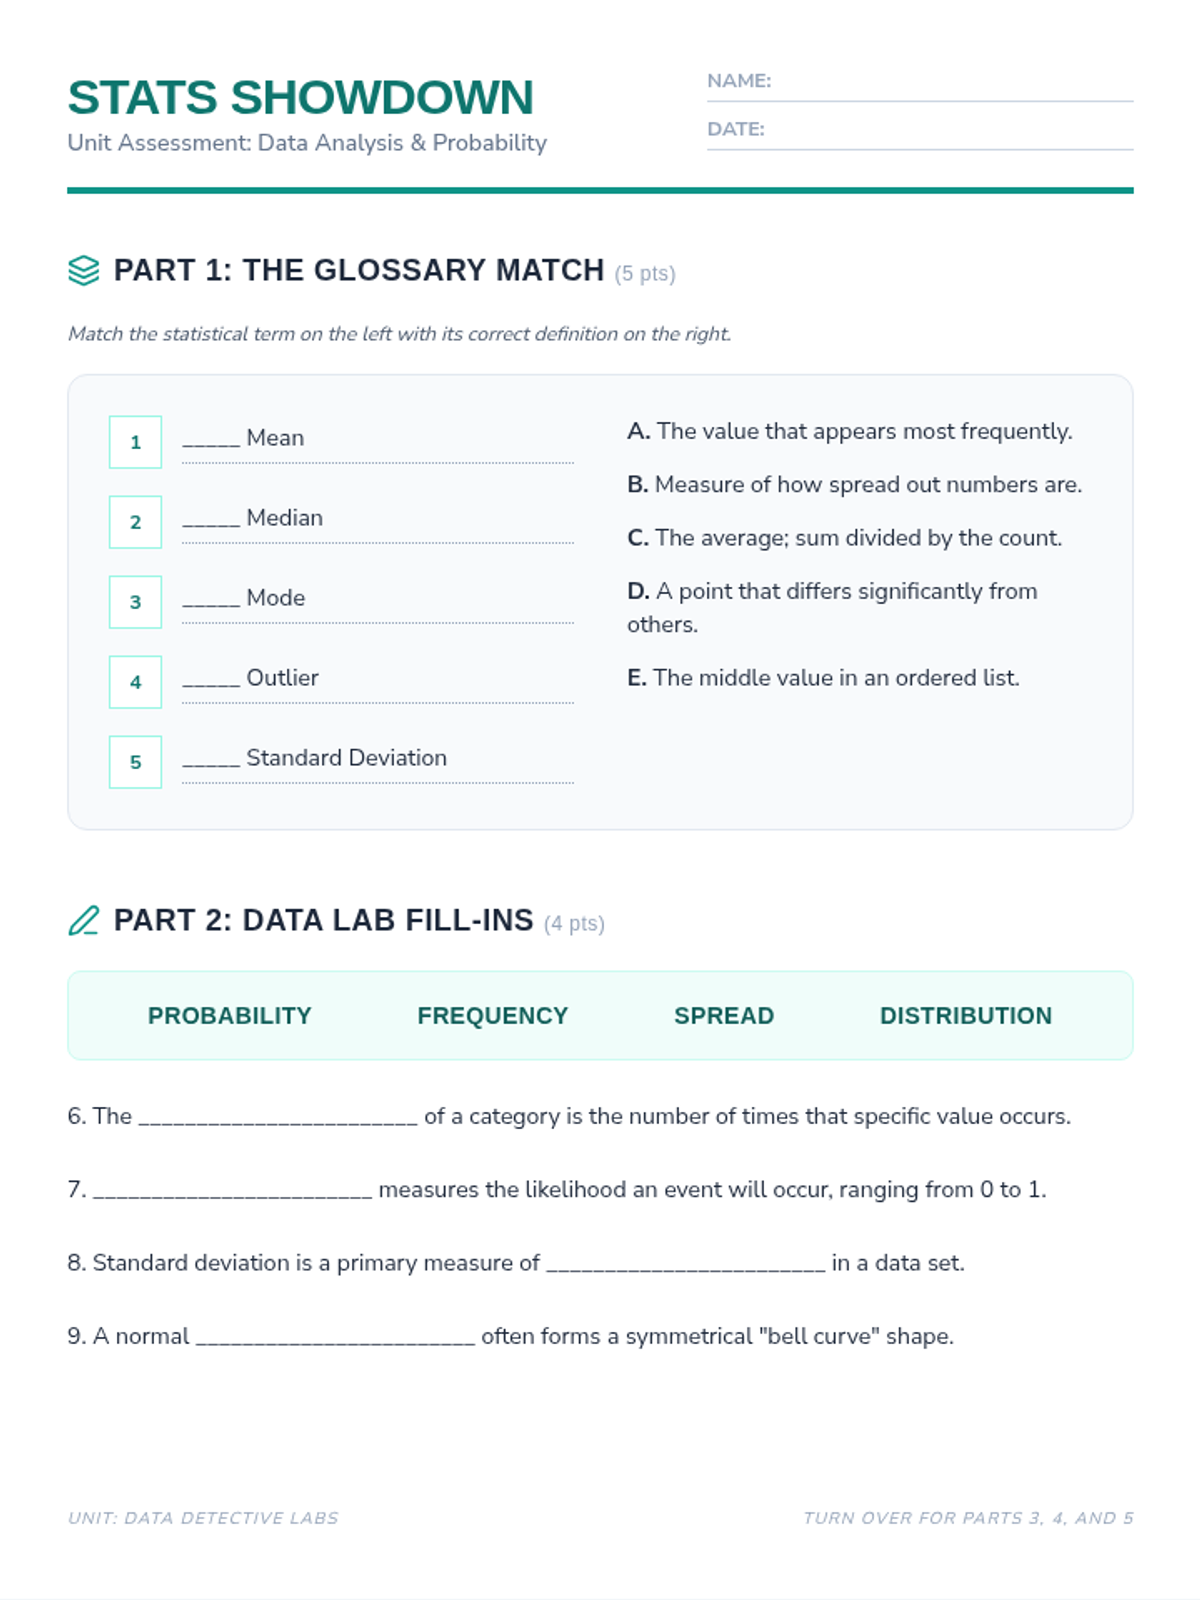
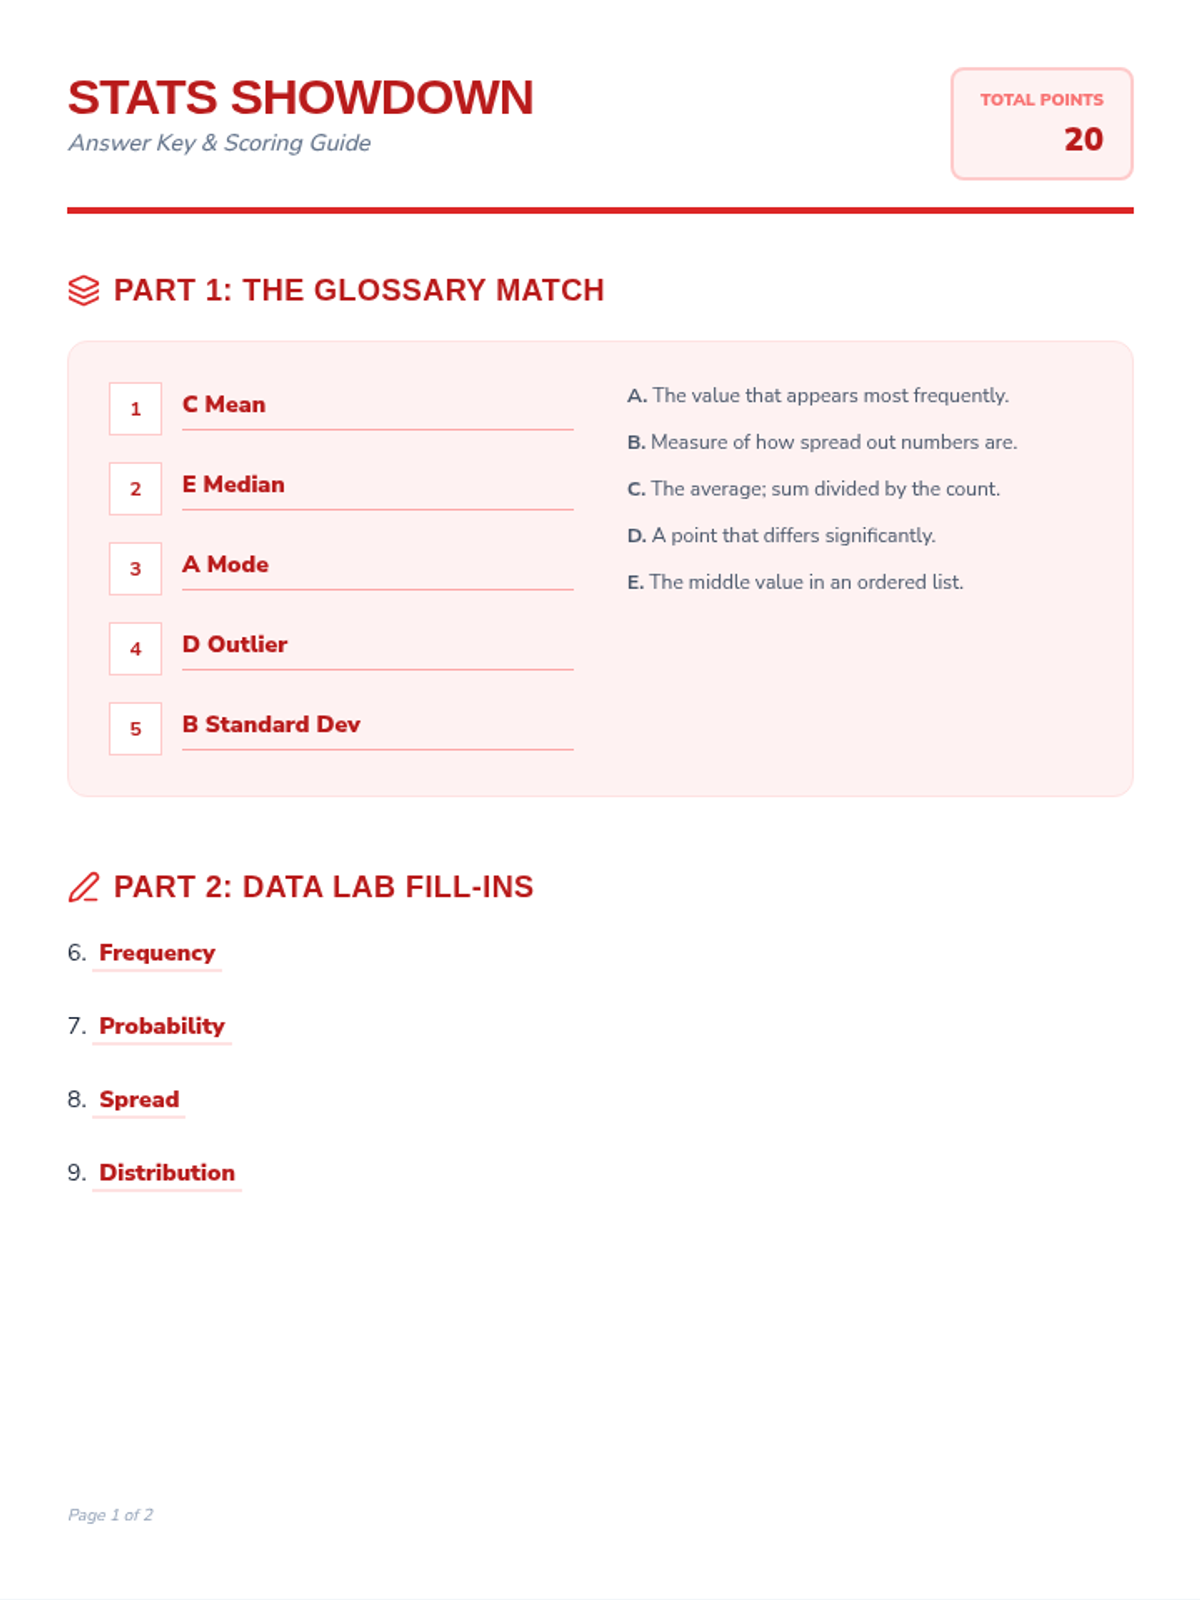
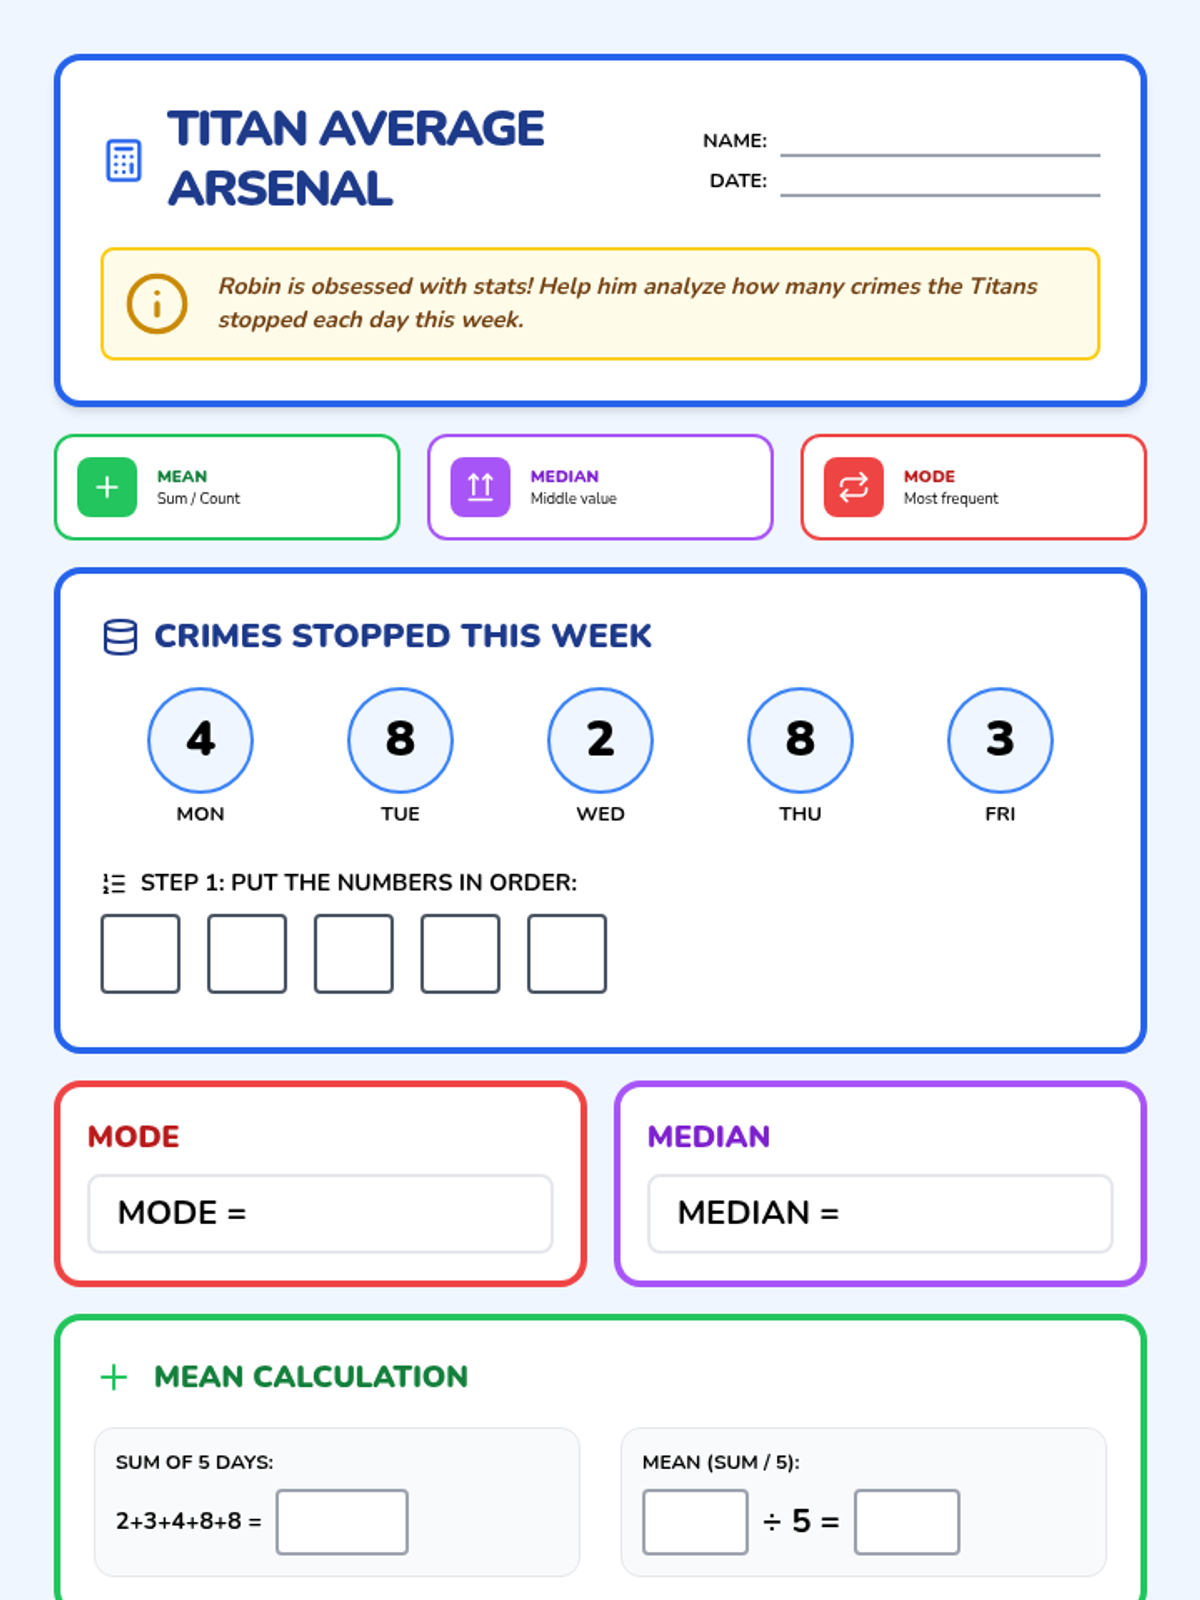
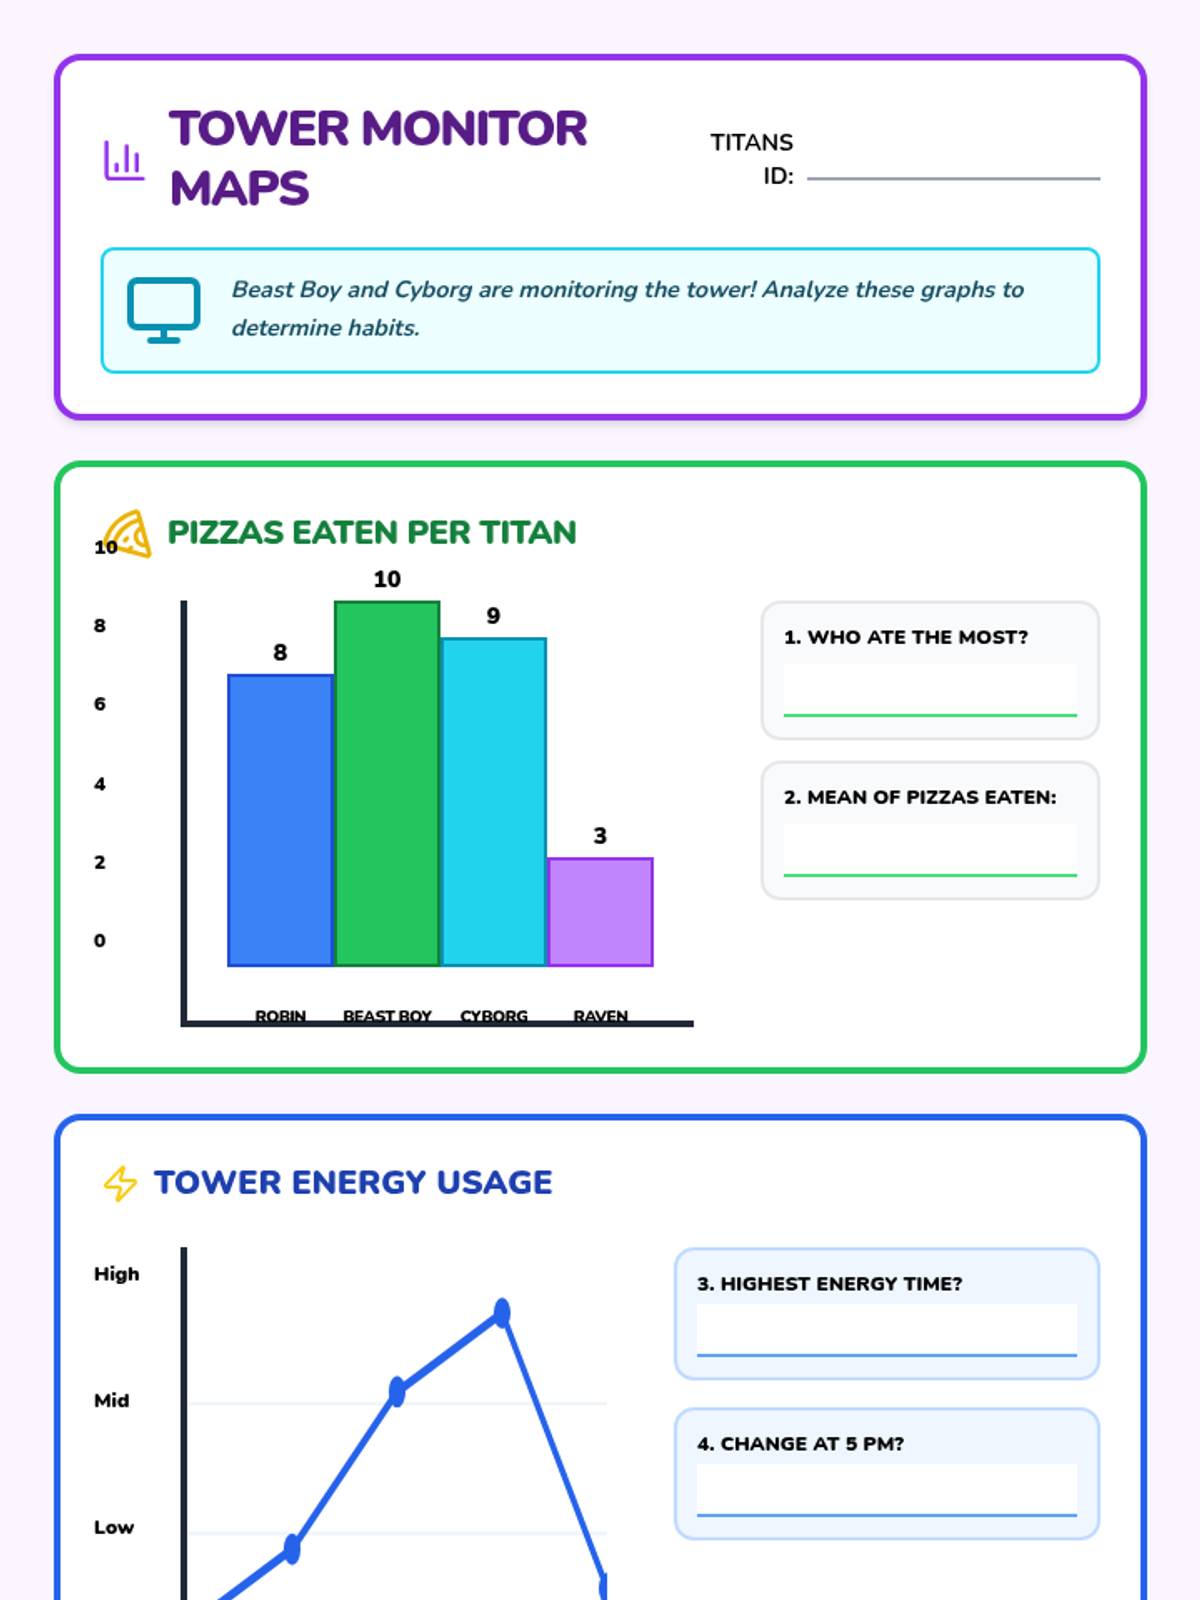
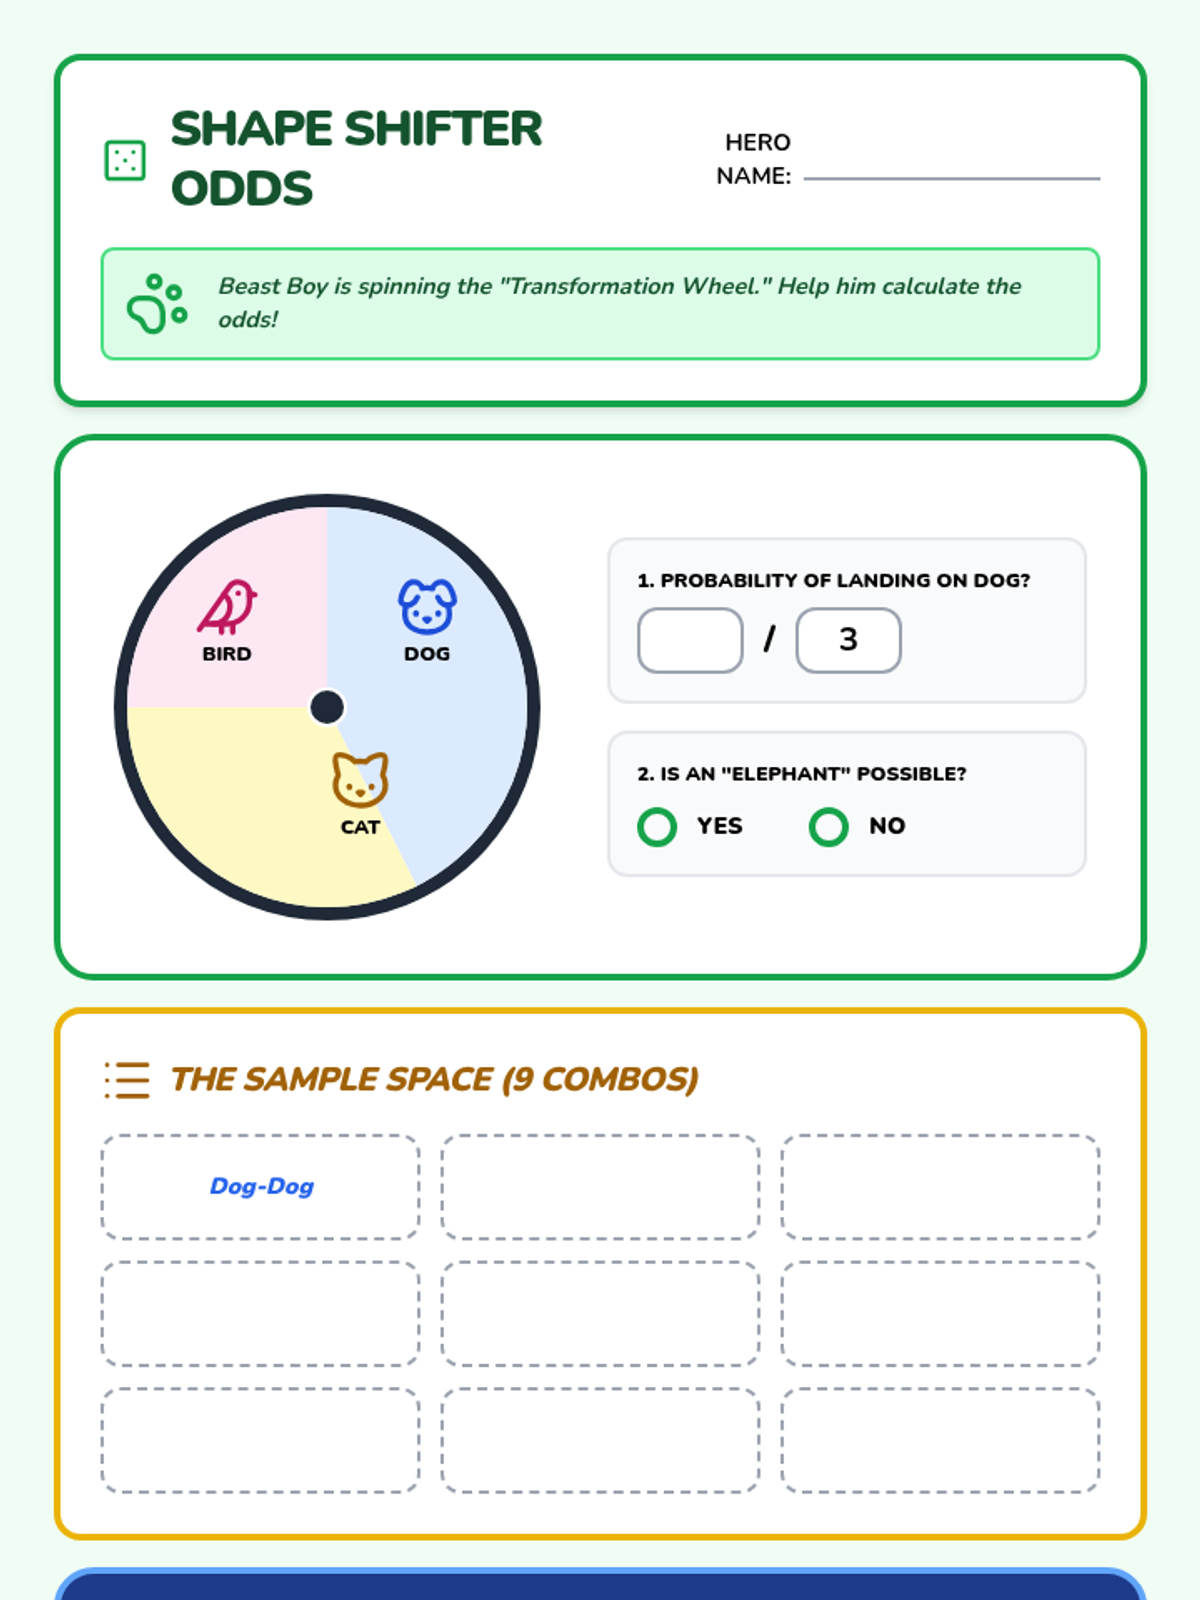
A comprehensive statistics workbook themed after Teen Titans Go!, covering mean, median, mode, graphing, and probability with 9th-grade rigor and visual supports.
Teaches students how to apply percentages to calculate markup, selling price, and profit margin for their Shark Tank pitches.
Focuses on identifying and calculating the total cost of materials used in a product, including unit rate calculations for recyclable materials.
A statistics assessment themed around Cartoon Network characters, focusing on data interpretation, central tendency, and probability with high visual support for autistic students.
A comprehensive assessment covering measures of central tendency, probability, frequency tables, standard deviation, and outliers. This lesson evaluates student mastery of key statistical concepts through various question formats.
A high-engagement lesson on sine, cosine, and tangent ratios through the lens of construction and architecture. Students apply trigonometric concepts to real-world structural challenges like roof pitches and ADA ramp compliance.
A mastery-focused lesson where students choose how to demonstrate their understanding of 7th-grade geometry standards. It includes five distinct paths ranging from creative design projects to formal assessments.
A statistics packet themed around Teen Titans Go, covering central tendency, graphing, probability, and data collection with high visual support.
A comprehensive lesson teaching students how to plot polygons on the coordinate plane and use absolute value to calculate horizontal and vertical side lengths.
A lesson focused on identifying angle relationships and calculating missing values using geometric properties and algebraic equations.
A comprehensive lesson on plotting and connecting coordinates in all four quadrants to create geometric shapes. Students will learn to navigate the coordinate plane, identify polygons, and calculate side lengths.
A comprehensive practice session for 7th-grade students to master the area and perimeter of various polygons, featuring a reference sheet and graduated practice problems including irregular shapes.
A comprehensive lesson on probability outcomes, theoretical/experimental calculations, compound events, and sampling methods.
A comprehensive lesson on data analysis covering scatter plots, lines of fit, two-way tables, and selecting appropriate data displays based on Chapter 9 of Big Ideas Math 8.
A comprehensive lesson on probability and statistics, covering outcomes, experimental and theoretical probability, sample spaces, compound events, and population comparisons.
A fast-paced math game using a standard deck of cards where students practice addition, subtraction, and multiplication to claim numbers on a hundreds chart. Includes three levels of difficulty from basic operations to multi-step expressions.
A comprehensive guide to the fundamental vocabulary and concepts of 7th-grade geometry, focusing on visual representations and clear definitions.
A 60-minute lesson where students act as lead researchers in a data laboratory. They will master constructing and interpreting dot plots, histograms, and box plots to analyze scientific findings.
An introductory lesson on place value and rounding, featuring a guided graphic organizer and a matching card game to support multilingual learners in navigating complex numbers.
A lesson focused on adding and subtracting fractions with unlike denominators, featuring a bakery-themed practice worksheet and answer key.
A 2-day intensive review lesson covering the full 6th-grade math curriculum. Day 1 focuses on conceptual review and formulas via slides, while Day 2 provides a 45-question shuffled workbook for student practice.