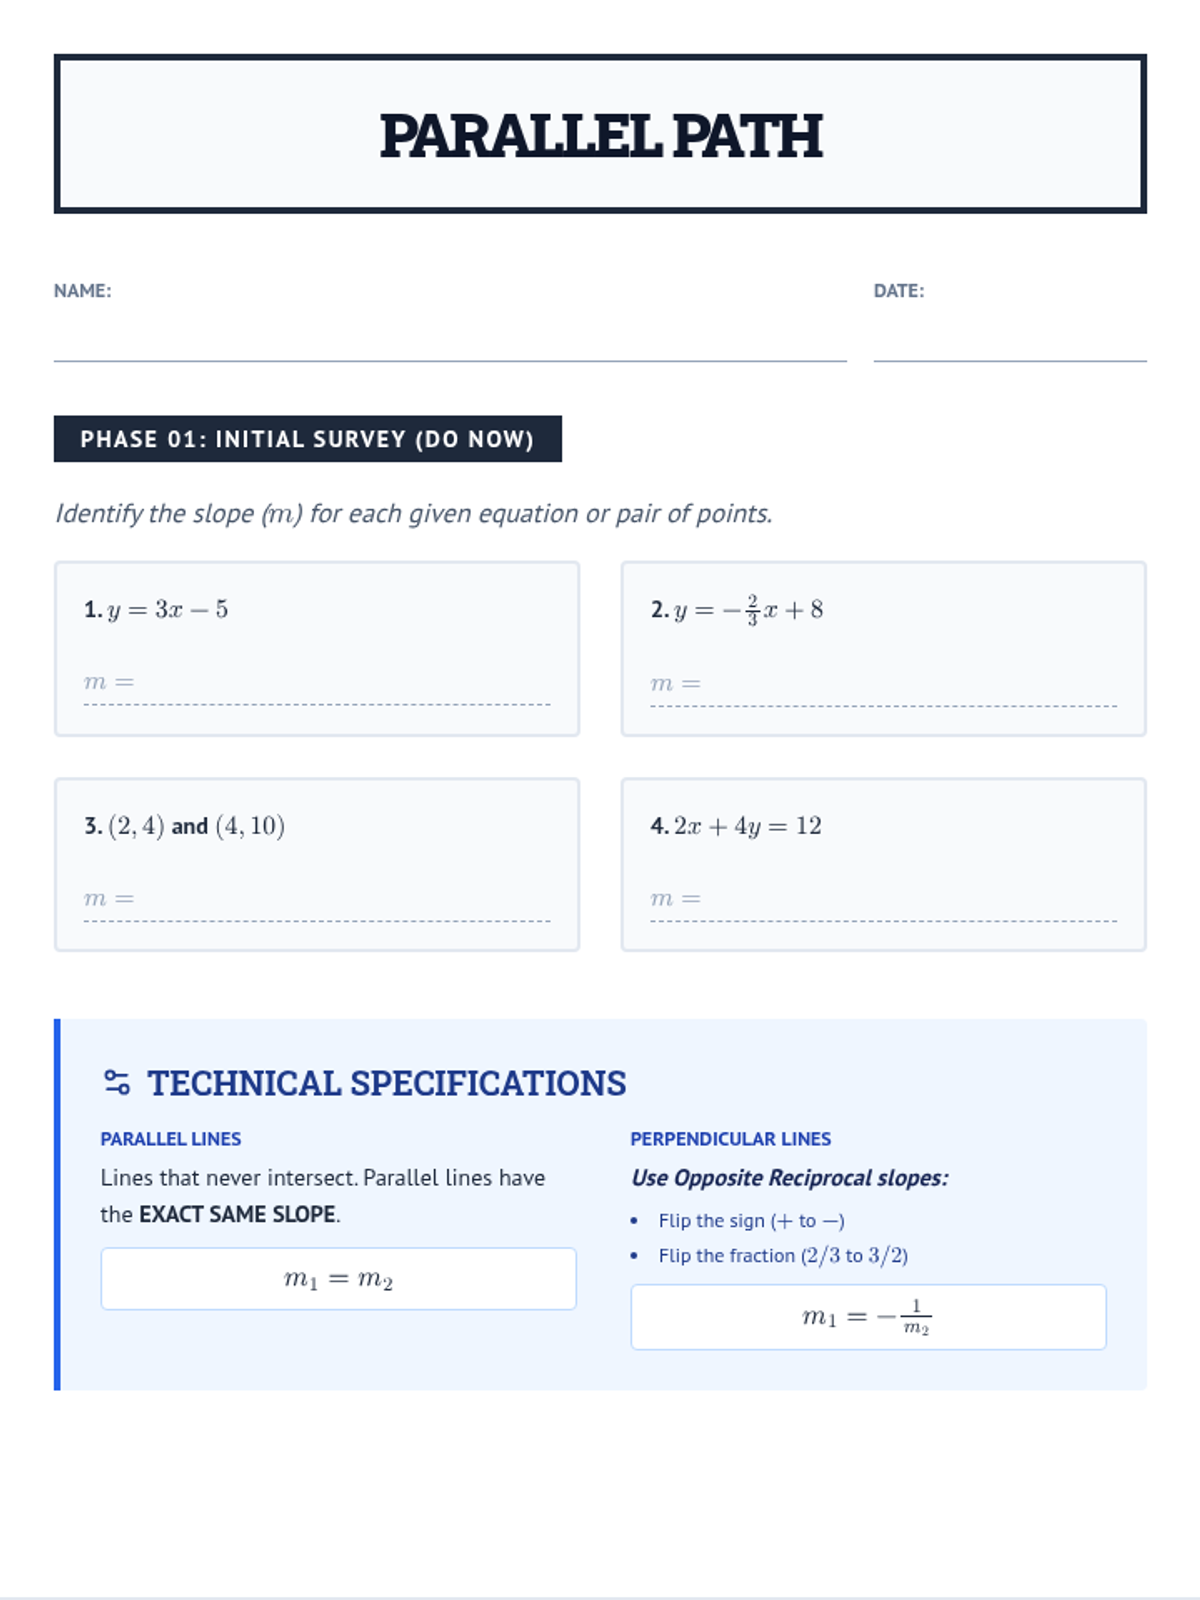
A gamified application of classification logic where students use their flowcharts to identify 'secret shapes.' They must 'debug' their logic if they reach incorrect conclusions during gameplay.
A creative geometry project where students design a brand logo using specific circle properties, including tangents, secants, chords, and inscribed angles. Students must demonstrate both artistic design and geometric precision through calculations.
Students explore geometric similarity through art and tessellations, applying ratios and proportional parts to create scaled masterpieces.
Students learn to apply Sine, Cosine, and Tangent to real-world measurements and abstract artistic design, culminating in a dual-phase project.
A creative geometry project where students apply circle theorems to design a celestial map or star chart, combining art with rigorous mathematical proofs of angles and segments.
A lesson focused on calculating and interpreting z-scores within the context of normal distributions, featuring real-world data from ecology to education.
A comprehensive project where students apply linear functions to model real-life savings goals for a startup business. Students will calculate startup costs, determine savings rates, and project their business launch date using algebraic models.
A hands-on project where students apply right triangle trigonometry to design a piece of modern architecture or geometric art, culminating in a detailed calculation poster.
A hands-on geometry project where students apply similarity criteria (AA, SSS, SAS) to measure unreachable heights using shadow casting and mirror reflections. Students will perform outdoor measurements, calculate scale factors, and provide formal geometric proofs for their methods.
A project-based lesson where students design an infographic poster demonstrating their mastery of triangle similarity criteria and real-world proportional reasoning.
A creative art-based project where students apply circle geometry concepts—arc length, sector area, and inscribed angles—to design and calculate a geometric masterpiece.
A real-world project exploring linear functions through cell phone plans and career earnings. Students analyze slope as a rate of change and the y-intercept as a starting value.
A project-based lesson where students apply concepts of similarity, scale factor, and proportions to create a scale drawing or 3D model of a real-world object. Students move from mathematical practice to creative application.
Students apply their knowledge of slope to design a roller coaster. They calculate the steepness of various drops and climbs, representing their findings through a technical blueprint and a visual infographic.
A comprehensive unit review and summative assessment covering three key methods for solving quadratic equations: graphing, factoring, and the quadratic formula. Students practice identifying key features of parabolas, algebraic manipulation for factoring, and the step-by-step application of the quadratic formula.
A comprehensive guide to analyzing and graphing rational functions, covering all key features from asymptotes to holes.
An advanced look at slope as a rate of change, including calculation from coordinates and understanding special cases like zero and undefined slopes.
Advanced applications of central tendency and spread, including algebraic problem-solving, weighted means, and the mathematical impact of outliers for high school students.
A comprehensive assessment covering Level 1, Level 2, and Level 3 data analysis, designed to evaluate mastery of mean, median, mode, and range in both numerical and narrative contexts.
Students interpret and solve word problems involving mean, median, mode, and range, focusing on extracting data from narrative contexts and real-world scenarios.
A foundational lesson designed for SIFE students to understand fractions greater than one using visual models and fraction strips. Focuses on bridging concrete models to number lines with minimal text reliance.
A collection of extra practice cases for mean, median, mode, and range, ranging from single-digit warmups to double-digit challenges, themed as unsolved detective files.
Students apply their knowledge of mean, median, mode, and range to data sets featuring two-digit numbers, focusing on multi-digit addition and division.
Students learn to calculate mean, median, mode, and range using single-digit data sets through structured, step-by-step guided practice and visual aids.
Review of symmetry concepts followed by a final challenge activity and a short assessment.
Identifying symmetry in everyday objects and nature, such as butterflies, leaves, and common household items.
Exploring symmetry in geometric shapes like squares, circles, and triangles, focusing on matching halves.
Introduction to the concept of symmetry and the 'line of symmetry' using mirror images and simple shapes.
A lesson focused on the geometric and algebraic relationships of parallel and perpendicular lines, teaching students how to identify slopes and write new equations using a technical blueprint aesthetic.
Une évaluation complète sur les équations et inéquations du premier degré pour les élèves de seconde professionnelle, incluant les exercices de base et des problèmes contextualisés.
Leçon focalisée sur les bases des statistiques à une variable : du recueil de données brutes à leur analyse graphique, avec un focus sur l'utilisation de LibreOffice Calc.
Une leçon complète sur les statistiques à une variable, couvrant la collecte de données, l'organisation en tableaux et la représentation graphique à travers divers exercices pratiques et activités d'introduction.